UNITED STATES
SECURITIES AND EXCHANGE COMMISSION
Washington, D.C. 20549
FORM N-CSR
CERTIFIED SHAREHOLDER REPORT OF REGISTERED MANAGEMENT
INVESTMENT COMPANIES
Investment Company Act file number | 811-524 |
| |
| The Dreyfus/Laurel Funds Trust | |
| (Exact name of Registrant as specified in charter) | |
| | |
| c/o The Dreyfus Corporation 200 Park Avenue New York, New York 10166 | |
| (Address of principal executive offices) (Zip code) | |
| | |
| Michael A. Rosenberg, Esq. 200 Park Avenue New York, New York 10166 | |
| (Name and address of agent for service) | |
|
Registrant's telephone number, including area code: | (212) 922-6000 |
| |
Date of fiscal year end: | 12/31 | |
Date of reporting period: | 6/30/2011 | |
| | | | | | | |
The following N-CSR relates only to the series of the Registrant listed below, and does not affect the other series of the Registrant, which have different fiscal year ends and, therefore, different N-CSR reporting requirements. Separate N-CSR Forms will be filed for those series, as appropriate.
Dreyfus Core Value Fund
Dreyfus High Yield Fund
FORM N-CSR
Item 1. Reports to Stockholders.
SEMIANNUAL REPORT June 30, 2011

Save time. Save paper. View your next shareholder report online as soon as it’s available. Log into www.dreyfus.com and sign up for Dreyfus eCommunications. It’s simple and only takes a few minutes.
The views expressed in this report reflect those of the portfolio manager only through the end of the period covered and do not necessarily represent the views of Dreyfus or any other person in the Dreyfus organization. Any such views are subject to change at any time based upon market or other conditions and Dreyfus disclaims any responsibility to update such views.These views may not be relied on as investment advice and, because investment decisions for a Dreyfus fund are based on numerous factors, may not be relied on as an indication of trading intent on behalf of any Dreyfus fund.
Not FDIC-Insured • Not Bank-Guaranteed • May Lose Value
| | Contents |
| | THE FUND |
| 2 | A Letter from the Chairman and CEO |
| 3 | Discussion of Fund Performance |
| 6 | Understanding Your Fund’s Expenses |
| 6 | Comparing Your Fund’s Expenses With Those of Other Funds |
| 7 | Statement of Investments |
| 11 | Statement of Assets and Liabilities |
| 12 | Statement of Operations |
| 13 | Statement of Changes in Net Assets |
| 16 | Financial Highlights |
| 21 | Notes to Financial Statements |
| 32 | Information About the Renewal of the Fund’s Investment Management Agreement |
| | FOR MORE INFORMATION |
| | Back Cover |
Dreyfus
Core Value Fund
The Fund

A LETTER FROM THE CHAIRMAN AND CEO
Dear Shareholder:
We are pleased to present this semiannual report for Dreyfus CoreValue Fund, covering the six-month period from January 1, 2011, through June 30, 2011. For information about how the fund performed during the reporting period, as well as general market perspectives, we provide a Discussion of Fund Performance on the pages that follow.
Although 2011 began on an optimistic note amid encouraging economic data, by midyear investors returned to a more cautious outlook. The U.S. and global economies continued to grow over the reporting period, but at a relatively sluggish pace. First, manufacturing activity proved unsustainably strong in late 2010 and early 2011, leading to a subsequent slowdown in new orders. Second, turmoil in the Middle East drove oil prices higher and produced an inflationary drag on real incomes.Third, natural and nuclear disasters in Japan added to upward pressure on energy prices, and these unexpected events disrupted the global supply chain, especially in the automotive sector. Finally, in the United States, disappointing labor and housing markets weighed on investor sentiment. As a result, U.S. stocks generally produced only modest gains over the first half of the year.
We expect economic conditions to improve over the second half of 2011. Inflationary pressures appear to be peaking in most countries, including the United States, and we have already seen energy prices retreat from their highs. In addition, a successful resolution to the current debate regarding government spending and borrowing, without major fiscal tightening over the near term, should help avoid a serious disruption to the domestic economy. To assess how these and other developments may affect your investments, we encourage you, as always, to speak with your financial advisor.
Thank you for your continued confidence and support.

Jonathan R. Baum
Chairman and Chief Executive Officer
The Dreyfus Corporation
July 15, 2011
2

DISCUSSION OF FUND PERFORMANCE
For the period of January 1, 2011, through June 30, 2011, as provided by Brian Ferguson, Portfolio Manager
Fund and Market Performance Overview
For the six-month period ended June 30, 2011, Dreyfus Core Value Fund produced a total return of 5.38% for its Class A shares, Class B shares returned 5.02%, Class C shares returned 5.02%, Class I shares returned 5.55% and Institutional shares returned 5.43%.1 In comparison, the fund’s benchmark, the Russell 1000Value Index (the “Index”), produced a total return of 5.92% for the same period.2
Stocks generally rallied early in the year as an economic recovery appeared to gain traction, but renewed macroeconomic concerns later caused the market to give back some of its previous gains. The fund produced returns that were lower than its benchmark, due to lagging returns from the consumer discretionary and energy sectors.
The Fund’s Investment Approach
The fund seeks long-term capital growth as a primary objective, with current income as a secondary objective.To pursue its goals, the fund normally invests 80% of its net assets in equity securities. The fund focuses on the stocks of large-cap value companies.These are companies with market capitalizations of $1 billion and above, whose stocks appear underpriced according to certain financial measurements of their intrinsic worth or business prospects, such as price-to-earnings ratios. When choosing stocks, we use a “bottom-up” stock selection approach, focusing on individual companies, rather than a “top-down” approach that forecasts market trends. We also focus on a company’s relative value, financial strength, business momentum and likely catalysts that could ignite the stock price.
Shifting Sentiment Sparked Heightened Market Volatility
Investors had become more optimistic by the start of 2011 due to gains in employment, consumer spending and corporate earnings, sending stock prices broadly higher. However, the market rally was interrupted in February when a wave of political unrest in North Africa and the
DISCUSSION OF FUND PERFORMANCE (continued)
Middle East led to sharply rising crude oil prices, and again in March when catastrophic natural and nuclear disasters in Japan threatened one of the world’s largest domestic economies and disrupted the industrial supply chain for numerous industries, including U.S. automobile manufacturers. Nonetheless, investors proved resilient, and the U.S. stock market rebounded relatively quickly from these unexpected shocks.
However, investor sentiment began to deteriorate in earnest in late April and May when Greece again appeared headed for default on its sovereign debt, U.S. economic data proved more disappointing than expected and a contentious debate regarding U.S. government spending and borrowing intensified. Stocks suffered bouts of heightened volatility when newly risk-averse investors shifted their focus from economically sensitive industry groups and relatively speculative companies to those that historically have held up well under uncertain economic conditions. Nonetheless, value-oriented stocks produced slightly lower returns, on average, than growth-oriented stocks over the first half of the year.
Stock Selections Produced Mixed Results
In this choppy market environment, our security selection strategy proved especially successful in the information technology sector, where video game maker Electronic Arts achieved better-than-expected financial results at the start of a new product cycle centered on digital downloads of gaming software. In the corporate technology market, enterprise systems management specialist BMC Software and data warehousing provider Teradata benefited from the growing trend toward “cloud computing,” in which businesses manage applications and data over the Internet. Consulting services provider Accenture also advanced as more businesses sought help in building corporate data centers for cloud computing.
In the financials sector, bond rating agency Moody’s benefited as corporate bond issuance increased and litigation concerns waned in the wake of the 2008 financial crisis. Investment manager Franklin Resources gained value due to positive asset inflows to the company’s mutual funds, which helped boost profit margins.
4
Disappointments over the first half of 2011 included the consumer discretionary sector, where cruise line Carnival suffered shortfalls stemming from higher fuel costs and the need to reroute itineraries in the Mediterranean to avoid political unrest in Northern Africa. Retailer Staples was hurt by sluggish demand for office supplies and intensifying competitive pressures throughout its industry. Apparel seller Guess? encountered lower same-store sales and weaker store traffic during the first quarter of the year. In the energy sector, coal supplier Alpha Natural Resources declined in value due to higher input prices.
Finding Opportunities Among Quality Companies
Despite headwinds including a persistently sluggish U.S. labor market and weak housing markets, we believe the economic recovery is likely to persist. Profits in some industries have returned to pre-recession levels, energy prices have begun to moderate and rebuilding in Japan could boost economic activity.
In this slow-growth environment, we expect investors to remain selective, favoring attractively valued companies with the ability to grow in a sluggish economy and avoiding those with more expensive valuations and weaker underlying business fundamentals. Our bottom-up security selection process has identified a number of opportunities in the consumer discretionary sector, where valuations of media companies appear especially attractive. Fewer stocks in the financials sector have satisfied our value-oriented investment criteria, and we believe we have found more attractive opportunities in other market sectors.
July 15, 2011
| |
| | Equity funds are subject generally to market, market sector, market liquidity, issuer and investment |
| | style risks, among other factors, to varying degrees, all of which are more fully described in the |
| | fund’s prospectus. |
| 1 | Total return includes reinvestment of dividends and any capital gains paid, and does not take into |
| | consideration the maximum initial sales charges in the case of Class A shares or the applicable |
| | contingent deferred sales charges imposed on redemptions in the case of Class B and Class C |
| | shares. Had these charges been reflected, returns would have been lower. Past performance is no |
| | guarantee of future results. Share price and investment return fluctuate such that upon redemption, |
| | fund shares may be worth more or less than their original cost. |
| 2 | SOURCE: LIPPER INC. — Reflects the reinvestment of dividends and, where applicable, capital |
| | gain distributions.The Russell 1000 Value Index is an unmanaged index which measures the |
| | performance of those Russell 1000 companies with lower price-to-book ratios and lower forecasted |
| | growth values. Investors cannot invest directly in any index. |
UNDERSTANDING YOUR FUND’S EXPENSES (Unaudited)
As a mutual fund investor, you pay ongoing expenses, such as management fees and other expenses. Using the information below, you can estimate how these expenses affect your investment and compare them with the expenses of other funds.You also may pay one-time transaction expenses, including sales charges (loads) and redemption fees, which are not shown in this section and would have resulted in higher total expenses. For more information, see your fund’s prospectus or talk to your financial adviser.
Review your fund’s expenses
The table below shows the expenses you would have paid on a $1,000 investment in Dreyfus CoreValue Fund from January 1, 2011 to June 30, 2011. It also shows how much a $1,000 investment would be worth at the close of the period, assuming actual returns and expenses.
Expenses and Value of a $1,000 Investment
assuming actual returns for the six months ended June 30, 2011
| | | | | |
| | Class A | Class B | Class C | Class I | Institutional |
| Expenses paid per $1,000† | $ 6.26 | $ 9.91 | $ 10.01 | $ 4.99 | $ 5.76 |
| Ending value (after expenses) | $1,053.80 | $1,050.20 | $1,050.20 | $1,055.50 | $1,054.30 |
COMPARING YOUR FUND’S EXPENSES
WITH THOSE OF OTHER FUNDS (Unaudited)
Using the SEC’s method to compare expenses
The Securities and Exchange Commission (SEC) has established guidelines to help investors assess fund expenses. Per these guidelines, the table below shows your fund’s expenses based on a $1,000 investment, assuming a hypothetical 5% annualized return. You can use this information to compare the ongoing expenses (but not transaction expenses or total cost) of investing in the fund with those of other funds.All mutual fund shareholder reports will provide this information to help you make this comparison. Please note that you cannot use this information to estimate your actual ending account balance and expenses paid during the period.
Expenses and Value of a $1,000 Investment
assuming a hypothetical 5% annualized return for the six months ended June 30, 2011
| | | | | |
| | Class A | Class B | Class C | Class I | Institutional |
| Expenses paid per $1,000† | $ 6.16 | $ 9.74 | $ 9.84 | $ 4.91 | $ 5.66 |
| Ending value (after expenses) | $1,018.70 | $1,015.12 | $1,015.03 | $1,019.93 | $1,019.19 |
|
| † Expenses are equal to the fund’s annualized expense ratio of 1.23% for Class A, 1.95% for Class B, 1.97% for |
| Class C, .98% for Class I and 1.13% for Institutional Shares, multiplied by the average account value over the |
| period, multiplied by 181/365 (to reflect the one-half year period). |
6
|
| STATEMENT OF INVESTMENTS |
| June 30, 2011 (Unaudited) |
| | |
| Common Stocks—99.8% | Shares | Value ($) |
| Consumer Discretionary—15.3% | | |
| Carnival | 136,890 | 5,151,171 |
| CBS, Cl. B | 67,650 | 1,927,348 |
| General Motors | 54,524 a | 1,655,349 |
| Guess? | 71,470 | 3,006,028 |
| Home Depot | 101,150 | 3,663,653 |
| Johnson Controls | 157,600 | 6,565,616 |
| Newell Rubbermaid | 150,990 | 2,382,622 |
| News, Cl. A | 159,710 | 2,826,867 |
| NVR | 2,490 a,b | 1,806,445 |
| Omnicom Group | 223,360 | 10,757,018 |
| Staples | 109,230 | 1,725,834 |
| Time Warner | 154,636 | 5,624,111 |
| Toll Brothers | 73,070 a,b | 1,515,472 |
| Viacom, Cl. B | 58,800 | 2,998,800 |
| Walt Disney | 129,480 | 5,054,899 |
| | | 56,661,233 |
| Consumer Staples—7.2% | | |
| ConAgra Foods | 69,350 | 1,789,923 |
| CVS Caremark | 120,660 | 4,534,403 |
| Dr. Pepper Snapple Group | 109,170 | 4,577,498 |
| Energizer Holdings | 67,990 b | 4,919,756 |
| PepsiCo | 129,850 | 9,145,335 |
| Walgreen | 41,640 | 1,768,034 |
| | | 26,734,949 |
| Energy—15.2% | | |
| Alpha Natural Resources | 83,800 b | 3,807,872 |
| Anadarko Petroleum | 107,150 | 8,224,834 |
| EOG Resources | 17,900 | 1,871,445 |
| Exxon Mobil | 81,050 | 6,595,849 |
| Occidental Petroleum | 164,670 | 17,132,267 |
| QEP Resources | 69,300 a | 2,898,819 |
| Schlumberger | 181,800 | 15,707,520 |
| | | 56,238,606 |
| Exchange Traded Funds—.2% | | |
| iShares Russell 1000 Value Index Fund | 13,270 a | 906,076 |
STATEMENT OF INVESTMENTS (Unaudited) (continued)
| | |
| Common Stocks (continued) | Shares | Value ($) |
| Financial—20.5% | | |
| American Express | 38,780 | 2,004,926 |
| Ameriprise Financial | 85,720 | 4,944,330 |
| AON | 75,380 | 3,866,994 |
| Bank of America | 276,466 | 3,030,067 |
| Capital One Financial | 53,730 | 2,776,229 |
| Citigroup | 127,002 | 5,288,363 |
| Comerica | 145,950 a | 5,045,491 |
| Franklin Resources | 14,810 | 1,944,405 |
| Genworth Financial, Cl. A | 215,940 b | 2,219,863 |
| JPMorgan Chase & Co. | 259,960 | 10,642,762 |
| Marsh & McLennan | 115,460 | 3,601,197 |
| MetLife | 141,860 | 6,223,398 |
| Moody’s | 51,740 a | 1,984,229 |
| PNC Financial Services Group | 60,570 | 3,610,578 |
| Prudential Financial | 60,240 | 3,830,662 |
| SunTrust Banks | 142,230 | 3,669,534 |
| TD Ameritrade Holding | 132,750 a | 2,589,952 |
| Wells Fargo & Co. | 301,790 | 8,468,227 |
| | | 75,741,207 |
| Health Care��16.1% | | |
| Amgen | 66,630 b | 3,887,861 |
| Baxter International | 42,500 | 2,536,825 |
| CIGNA | 69,560 | 3,577,471 |
| HCA Holdings | 59,170 | 1,952,610 |
| Johnson & Johnson | 107,780 | 7,169,526 |
| McKesson | 53,110 | 4,442,652 |
| Medtronic | 46,660 | 1,797,810 |
| Merck & Co. | 189,180 | 6,676,162 |
| Mylan | 36,970 a,b | 912,050 |
| Pfizer | 682,250 | 14,054,350 |
| Thermo Fisher Scientific | 31,150 b | 2,005,749 |
| UnitedHealth Group | 97,934 | 5,051,436 |
| Universal Health Services, Cl. B | 34,650 | 1,785,515 |
| Watson Pharmaceuticals | 27,770 b | 1,908,632 |
| Zimmer Holdings | 27,740 b | 1,753,168 |
| | | 59,511,817 |
8
| | |
| Common Stocks (continued) | Shares | Value ($) |
| Industrial—10.6% | | |
| Caterpillar | 40,780 | 4,341,439 |
| Cooper Industries | 28,190 | 1,682,097 |
| Dover | 84,690 | 5,741,982 |
| Eaton | 55,870 | 2,874,512 |
| General Electric | 556,440 | 10,494,458 |
| Honeywell International | 30,120 | 1,794,851 |
| Hubbell, Cl. B | 26,220 | 1,702,989 |
| Owens Corning | 90,530 b | 3,381,296 |
| Pitney Bowes | 157,590 a | 3,622,994 |
| Stanley Black & Decker | 24,500 | 1,765,225 |
| Thomas & Betts | 31,880 b | 1,716,738 |
| | | 39,118,581 |
| Information Technology—9.0% | | |
| Accenture, Cl. A | 65,570 | 3,961,739 |
| AOL | 147,088 a,b | 2,921,168 |
| BMC Software | 81,300 b | 4,447,110 |
| Cisco Systems | 96,940 | 1,513,233 |
| Corning | 78,610 | 1,426,772 |
| eBay | 55,160 b | 1,780,013 |
| Electronic Arts | 186,000 b | 4,389,600 |
| Oracle | 106,580 | 3,507,548 |
| QUALCOMM | 134,480 | 7,637,119 |
| Teradata | 31,290 b | 1,883,658 |
| | | 33,467,960 |
| Materials—4.2% | | |
| Air Products & Chemicals | 19,410 | 1,855,208 |
| Celanese, Ser. A | 79,030 | 4,213,089 |
| Cliffs Natural Resources | 20,790 | 1,922,036 |
| Dow Chemical | 130,560 | 4,700,160 |
| Freeport-McMoRan | | |
| Copper & Gold | 55,030 | 2,911,087 |
| | | 15,601,580 |
| Telecommunications—.5% | | |
| Sprint Nextel | 351,420 b | 1,894,154 |
| Utilities—1.0% | | |
| NextEra Energy | 32,270 | 1,854,234 |
STATEMENT OF INVESTMENTS (Unaudited) (continued)
| | |
| Common Stocks (continued) | Shares | Value ($) |
| Utilities (continued) | | |
| PPL | 66,730 | 1,857,096 |
| | | 3,711,330 |
| Total Common Stocks | | |
| (cost $334,956,996) | | 369,587,493 |
| |
| Other Investment—.5% | | |
| Registered Investment Company; | | |
| Dreyfus Institutional Preferred | | |
| Plus Money Market Fund | | |
| (cost $1,821,000) | 1,821,000 c | 1,821,000 |
| |
| Investment of Cash Collateral | | |
| for Securities Loaned—5.3% | | |
| Registered Investment Company; | | |
| Dreyfus Institutional Cash Advantage Fund | | |
| (cost $19,680,475) | 19,680,475 c | 19,680,475 |
| Total Investments (cost $356,458,471) | 105.6% | 391,088,968 |
| Liabilities, Less Cash and Receivables | (5.6%) | (20,668,366) |
| Net Assets | 100.0% | 370,420,602 |
ADR—American Depository Receipts
|
| a Security, or portion thereof, on loan.At June 30, 2011, the value of the fund’s securities on loan was $19,363,696 |
| and the value of the collateral held by the fund was $19,680,475. |
| b Non-income producing security. |
| c Investment in affiliated money market mutual fund. |
| | | |
| Portfolio Summary (Unaudited)† | | |
| |
| | Value (%) | | Value (%) |
| Financial | 20.5 | Money Market Investments | 5.8 |
| Health Care | 16.1 | Materials | 4.2 |
| Consumer Discretionary | 15.3 | Utilities | 1.0 |
| Energy | 15.2 | Telecommunications | .5 |
| Industrial | 10.6 | Exchange Traded Funds | .2 |
| Information Technology | 9.0 | | |
| Consumer Staples | 7.2 | | 105.6 |
| |
| † Based on net assets. | | | |
| See notes to financial statements. | | | |
10
|
| STATEMENT OF ASSETS AND LIABILITIES |
| June 30, 2011 (Unaudited) |
| | | | | |
| | | | | Cost | Value |
| Assets ($): | | | | | |
| Investments in securities—See Statement of Investments (including | | |
| securities on loan, valued at $19,363,696)—Note 1(b): | | | |
| Unaffiliated issuers | | | 334,956,996 | 369,587,493 |
| Affiliated issuers | | | 21,501,475 | 21,501,475 |
| Receivable for investment securities sold | | | | 893,166 |
| Dividends and interest receivable | | | | 635,813 |
| Receivable for shares of Beneficial Interest subscribed | | | 825 |
| | | | | | 392,618,772 |
| Liabilities ($): | | | | | |
| Due to The Dreyfus Corporation and affiliates—Note 3(b) | | | 344,807 |
| Cash overdraft due to Custodian | | | | 193,050 |
| Liability for securities on loan—Note 1(b) | | | | 19,680,475 |
| Payable for investment securities purchased | | | | 1,786,664 |
| Payable for shares of Beneficial Interest redeemed | | | 193,048 |
| Interest payable—Note 2 | | | | | 126 |
| | | | | | 22,198,170 |
| Net Assets ($) | | | | | 370,420,602 |
| Composition of Net Assets ($): | | | | |
| Paid-in capital | | | | | 377,123,007 |
| Accumulated distributions in excess of investment income—net | | (9,151) |
| Accumulated net realized gain (loss) on investments | | | (41,323,751) |
| Accumulated net unrealized appreciation | | | | |
| (depreciation) on investments | | | | 34,630,497 |
| Net Assets ($) | | | | | 370,420,602 |
| |
| |
| Net Asset Value Per Share | | | | |
| | Class A | Class B | Class C | Class I | Institutional |
| Net Assets ($) | 333,902,180 | 633,656 | 7,788,741 | 876,948 | 27,219,077 |
| Shares Outstanding | 12,993,228 | 25,229 | 310,328 | 34,126 | 1,059,598 |
| Net Asset Value | | | | | |
| Per Share ($) | 25.70 | 25.12 | 25.10 | 25.70 | 25.69 |
| |
| See notes to financial statements. | | | | | |
|
| STATEMENT OF OPERATIONS |
| Six Months Ended June 30, 2011 (Unaudited) |
| |
| Investment Income ($): | |
| Income: | |
| Cash dividends (net of $3,082 foreign taxes withheld at source): | |
| Unaffiliated issuers | 2,946,963 |
| Affiliated issuers | 886 |
| Income from securities lending—Note 1(b) | 11,908 |
| Total Income | 2,959,757 |
| Expenses: | |
| Management fee—Note 3(a) | 1,673,754 |
| Distribution and service fees—Note 3(b) | 482,415 |
| Trustees’ fees—Note 3(a) | 11,916 |
| Loan commitment fees—Note 2 | 2,773 |
| Interest expense—Note 2 | 561 |
| Miscellaneous | 165,000 |
| Total Expenses | 2,336,419 |
| Less—Trustees’ fees reimbursed by the Manager—Note 3(a) | (11,916) |
| Net Expenses | 2,324,503 |
| Investment Income—Net | 635,254 |
| Realized and Unrealized Gain (Loss) on Investments—Note 4 ($): | |
| Net realized gain (loss) on investments | 38,273,715 |
| Net unrealized appreciation (depreciation) on investments | (18,974,859) |
| Net Realized and Unrealized Gain (Loss) on Investments | 19,298,856 |
| Net Increase in Net Assets Resulting from Operations | 19,934,110 |
| |
| See notes to financial statements. | |
12
STATEMENT OF CHANGES IN NET ASSETS
| | |
| | Six Months Ended | |
| | June 30, 2011 | Year Ended |
| | (Unaudited) | December 31, 2010 |
| Operations ($): | | |
| Investment income—net | 635,254 | 3,296,900 |
| Net realized gain (loss) on investments | 38,273,715 | 14,013,031 |
| Net unrealized appreciation | | |
| (depreciation) on investments | (18,974,859) | 26,247,495 |
| Net Increase (Decrease) in Net Assets | | |
| Resulting from Operations | 19,934,110 | 43,557,426 |
| Dividends to Shareholders from ($): | | |
| Investment income—net: | | |
| Class A Shares | (580,131) | (3,001,921) |
| Class B Shares | — | (2,812) |
| Class C Shares | — | (16,307) |
| Class I Shares | (2,767) | (11,722) |
| Institutional Shares | (61,507) | (273,177) |
| Total Dividends | (644,405) | (3,305,939) |
| Beneficial Interest Transactions ($): | | |
| Net proceeds from shares sold: | | |
| Class A Shares | 3,119,131 | 7,132,668 |
| Class B Shares | 145 | 27,062 |
| Class C Shares | 200,968 | 725,284 |
| Class I Shares | 3,063 | 161,562 |
| Institutional Shares | 721,788 | 1,456,964 |
STATEMENT OF CHANGES IN NET ASSETS (continued)
| | |
| | Six Months Ended | |
| | June 30, 2011 | Year Ended |
| | (Unaudited) | December 31, 2010 |
| Beneficial Interest Transactions ($) (continued): | | |
| Dividends reinvested: | | |
| Class A Shares | 505,650 | 2,602,555 |
| Class B Shares | — | 2,618 |
| Class C Shares | — | 14,302 |
| Class I Shares | 2,059 | 8,118 |
| Institutional Shares | 57,702 | 261,784 |
| Cost of shares redeemed: | | |
| Class A Shares | (22,360,153) | (35,931,256) |
| Class B Shares | (527,297) | (1,574,562) |
| Class C Shares | (600,527) | (1,606,770) |
| Class I Shares | (133,712) | (367,913) |
| Institutional Shares | (2,448,938) | (2,970,535) |
| Increase (Decrease) in Net Assets | | |
| from Beneficial Interest Transactions | (21,460,121) | (30,058,119) |
| Total Increase (Decrease) in Net Assets | (2,170,416) | 10,193,368 |
| Net Assets ($): | | |
| Beginning of Period | 372,591,018 | 362,397,650 |
| End of Period | 370,420,602 | 372,591,018 |
| Undistributed (distributions in excess of) | | |
| investment income—net | (9,151) | — |
14
| | |
| | Six Months Ended | |
| | June 30, 2011 | Year Ended |
| | (Unaudited) | December 31, 2010 |
| Capital Share Transactions: | | |
| Class Aa | | |
| Shares sold | 122,295 | 321,577 |
| Shares issued for dividends reinvested | 19,589 | 117,211 |
| Shares redeemed | (873,460) | (1,612,026) |
| Net Increase (Decrease) in Shares Outstanding | (731,576) | (1,173,238) |
| Class Ba | | |
| Shares sold | 1 | 1,263 |
| Shares issued for dividends reinvested | — | 124 |
| Shares redeemed | (20,979) | (72,348) |
| Net Increase (Decrease) in Shares Outstanding | (20,978) | (70,961) |
| Class C | | |
| Shares sold | 8,013 | 32,442 |
| Shares issued for dividends reinvested | — | 672 |
| Shares redeemed | (24,057) | (74,366) |
| Net Increase (Decrease) in Shares Outstanding | (16,044) | (41,252) |
| Class I | | |
| Shares sold | 121 | 7,181 |
| Shares issued for dividends reinvested | 80 | 365 |
| Shares redeemed | (5,147) | (16,429) |
| Net Increase (Decrease) in Shares Outstanding | (4,946) | (8,883) |
| Institutional Shares | | |
| Shares sold | 28,230 | 64,865 |
| Shares issued for dividends reinvested | 2,236 | 11,800 |
| Shares redeemed | (97,315) | (133,726) |
| Net Increase (Decrease) in Shares Outstanding | (66,849) | (57,061) |
|
| a During the period ended June 30, 2011, 11,571 Class B shares representing $290,149 were automatically |
| converted to 11,323 Class A shares and during the period ended December 31, 2010, 40,652 Class B shares |
| representing $882,759 were automatically converted to 39,799 Class A shares. |
See notes to financial statements.
FINANCIAL HIGHLIGHTS
The following tables describe the performance for each share class for the fiscal periods indicated.All information (except portfolio turnover rate) reflects financial results for a single fund share.Total return shows how much your investment in the fund would have increased (or decreased) during each period, assuming you had reinvested all dividends and distributions.These figures have been derived from the fund’s financial statements.
| | | | | | |
| Six Months Ended | | | | | |
| June 30, 2011 | | Year Ended December 31, | |
| Class A Shares | (Unaudited) | 2010 | 2009 | 2008 | 2007 | 2006 |
| Per Share Data ($): | | | | | | |
| Net asset value, | | | | | | |
| beginning of period | 24.42 | 21.83 | 18.75 | 29.87 | 32.00 | 31.38 |
| Investment Operations: | | | | | | |
| Investment income—neta | .04 | .21 | .25 | .38 | .45 | .38 |
| Net realized and unrealized | | | | | | |
| gain (loss) on investments | 1.28 | 2.59 | 3.08 | (11.10) | .42 | 5.94 |
| Total from Investment Operations | 1.32 | 2.80 | 3.33 | (10.72) | .87 | 6.32 |
| Distributions: | | | | | | |
| Dividends from | | | | | | |
| investment income—net | (.04) | (.21) | (.25) | (.40) | (.46) | (.37) |
| Dividends from net realized | | | | | | |
| gain on investments | — | — | — | (.00)b | (2.54) | (5.33) |
| Total Distributions | (.04) | (.21) | (.25) | (.40) | (3.00) | (5.70) |
| Net asset value, end of period | 25.70 | 24.42 | 21.83 | 18.75 | 29.87 | 32.00 |
| Total Return (%)c | 5.38d | 12.99 | 18.07 | (36.10) | 2.75 | 21.00 |
| Ratios/Supplemental Data (%): | | | | | | |
| Ratio of total expenses | | | | | | |
| to average net assets | 1.23e | 1.15 | 1.17 | 1.16 | 1.16 | 1.15 |
| Ratio of net expenses | | | | | | |
| to average net assets | 1.23e | 1.15 | 1.16 | 1.15 | 1.15 | 1.15 |
| Ratio of net investment income | | | | | | |
| to average net assets | .35e | .94 | 1.33 | 1.53 | 1.38 | 1.17 |
| Portfolio Turnover Rate | 49.47d | 55.41 | 64.35 | 53.58 | 45.19 | 44.73 |
| Net Assets, end of period | | | | | | |
| ($ x 1,000) | 333,902 | 335,228 | 325,170 | 301,524 | 522,906 | 548,601 |
| |
| a | Based on average shares outstanding at each month end. |
| b | Amount represents less than $.01 per share. |
| c | Exclusive of sales charge. |
| d | Not annuailzed. |
| e | Annualized. |
See notes to financial statements.
16
| | | | | | |
| Six Months Ended | | | | | |
| June 30, 2011 | | Year Ended December 31, | |
| Class B Shares | (Unaudited) | 2010 | 2009 | 2008 | 2007 | 2006 |
| Per Share Data ($): | | | | | | |
| Net asset value, | | | | | | |
| beginning of period | 23.92 | 21.38 | 18.36 | 29.26 | 31.40 | 30.87 |
| Investment Operations: | | | | | | |
| Investment income (loss)—neta | (.05) | .03 | .13 | .17 | .22 | .13 |
| Net realized and unrealized | | | | | | |
| gain (loss) on investments | 1.25 | 2.56 | 3.00 | (10.85) | .39 | 5.85 |
| Total from Investment Operations | 1.20 | 2.59 | 3.13 | (10.68) | .61 | 5.98 |
| Distributions: | | | | | | |
| Dividends from | | | | | | |
| investment income—net | — | (.05) | (.11) | (.22) | (.21) | (.12) |
| Dividends from net realized | | | | | | |
| gain on investments | — | — | — | (.00)b | (2.54) | (5.33) |
| Total Distributions | — | (.05) | (.11) | (.22) | (2.75) | (5.45) |
| Net asset value, end of period | 25.12 | 23.92 | 21.38 | 18.36 | 29.26 | 31.40 |
| Total Return (%)c | 5.02d | 12.13 | 17.21 | (36.62) | 2.01 | 20.12 |
| Ratios/Supplemental Data (%): | | | | | | |
| Ratio of total expenses | | | | | | |
| to average net assets | 1.96e | 1.91 | 1.91 | 1.90 | 1.91 | 1.90 |
| Ratio of net expenses | | | | | | |
| to average net assets | 1.95e | 1.90 | 1.90 | 1.90 | 1.90 | 1.90 |
| Ratio of net investment income | | | | | | |
| (loss) to average net assets | (.43)e | .13 | .74 | .69 | .70 | .42 |
| Portfolio Turnover Rate | 49.47d | 55.41 | 64.35 | 53.58 | 45.19 | 44.73 |
| Net Assets, end of period | | | | | | |
| ($ x 1,000) | 634 | 1,105 | 2,505 | 5,665 | 26,646 | 55,112 |
| |
| a | Based on average shares outstanding at each month end. |
| b | Amount represents less than $.01 per share. |
| c | Exclusive of sales charge. |
| d | Not annuailzed. |
| e | Annualized. |
See notes to financial statements.
FINANCIAL HIGHLIGHTS (continued)
| | | | | | |
| Six Months Ended | | | | | |
| June 30, 2011 | | Year Ended December 31, | |
| Class C Shares | (Unaudited) | 2010 | 2009 | 2008 | 2007 | 2006 |
| Per Share Data ($): | | | | | | |
| Net asset value, | | | | | | |
| beginning of period | 23.90 | 21.36 | 18.35 | 29.24 | 31.38 | 30.85 |
| Investment Operations: | | | | | | |
| Investment income (loss)—neta | (.05) | .04 | .11 | .19 | .21 | .14 |
| Net realized and unrealized | | | | | | |
| gain (loss) on investments | 1.25 | 2.55 | 3.01 | (10.86) | .40 | 5.84 |
| Total from Investment Operations | 1.20 | 2.59 | 3.12 | (10.67) | .61 | 5.98 |
| Distributions: | | | | | | |
| Dividends from | | | | | | |
| investment income—net | — | (.05) | (.11) | (.22) | (.21) | (.12) |
| Dividends from net realized | | | | | | |
| gain on investments | — | — | — | (.00)b | (2.54) | (5.33) |
| Total Distributions | — | (.05) | (.11) | (.22) | (2.75) | (5.45) |
| Net asset value, end of period | 25.10 | 23.90 | 21.36 | 18.35 | 29.24 | 31.38 |
| Total Return (%)c | 5.02d | 12.14 | 17.16 | (36.59) | 2.00 | 20.07 |
| Ratios/Supplemental Data (%): | | | | | | |
| Ratio of total expenses | | | | | | |
| to average net assets | 1.98e | 1.91 | 1.92 | 1.90 | 1.91 | 1.90 |
| Ratio of net expenses | | | | | | |
| to average net assets | 1.97e | 1.90 | 1.91 | 1.90 | 1.90 | 1.90 |
| Ratio of net investment income | | | | | | |
| (loss) to average net assets | (.39)e | .19 | .60 | .76 | .65 | .42 |
| Portfolio Turnover Rate | 49.47d | 55.41 | 64.35 | 53.58 | 45.19 | 44.73 |
| Net Assets, end of period | | | | | | |
| ($ x 1,000) | 7,789 | 7,801 | 7,853 | 8,391 | 16,572 | 20,919 |
| |
| a | Based on average shares outstanding at each month end. |
| b | Amount represents less than $.01 per share. |
| c | Exclusive of sales charge. |
| d | Not annuailzed. |
| e | Annualized. |
See notes to financial statements.
18
| | | | | | |
| Six Months Ended | | | | | |
| June 30, 2011 | | Year Ended December 31, | |
| Class I Shares | (Unaudited) | 2010 | 2009 | 2008 | 2007a | 2006 |
| Per Share Data ($): | | | | | | |
| Net asset value, | | | | | | |
| beginning of period | 24.42 | 21.83 | 18.74 | 29.85 | 31.98 | 31.36 |
| Investment Operations: | | | | | | |
| Investment income—netb | .07 | .27 | .30 | .45 | .57 | .46 |
| Net realized and unrealized | | | | | | |
| gain (loss) on investments | 1.29 | 2.59 | 3.09 | (11.10) | .39 | 5.95 |
| Total from Investment Operations | 1.36 | 2.86 | 3.39 | (10.65) | .96 | 6.41 |
| Distributions: | | | | | | |
| Dividends from | | | | | | |
| investment income—net | (.08) | (.27) | (.30) | (.46) | (.55) | (.46) |
| Dividends from net realized | | | | | | |
| gain on investments | — | — | — | (.00)c | (2.54) | (5.33) |
| Total Distributions | (.08) | (.27) | (.30) | (.46) | (3.09) | (5.79) |
| Net asset value, end of period | 25.70 | 24.42 | 21.83 | 18.74 | 29.85 | 31.98 |
| Total Return (%) | 5.55d | 13.23 | 18.43 | (35.93) | 3.04 | 21.26 |
| Ratios/Supplemental Data (%): | | | | | | |
| Ratio of total expenses | | | | | | |
| to average net assets | .99e | .90 | .92 | .90 | .91 | .90 |
| Ratio of net expenses | | | | | | |
| to average net assets | .98e | .90 | .91 | .90 | .90 | .90 |
| Ratio of net investment income | | | | | | |
| to average net assets | .58e | 1.19 | 1.57 | 1.74 | 1.63 | 1.42 |
| Portfolio Turnover Rate | 49.47d | 55.41 | 64.35 | 53.58 | 45.19 | 44.73 |
| Net Assets, end of period | | | | | | |
| ($ x 1,000) | 877 | 954 | 1,047 | 747 | 1,395 | 6,012 |
| |
| a | Effective June 1, 2007, Class R shares were redesignated as Class I shares. |
| b | Based on average shares outstanding at each month end. |
| c | Amount represents less than $.01 per share. |
| d | Not annuailzed. |
| e | Annualized. |
See notes to financial statements.
FINANCIAL HIGHLIGHTS (continued)
| | | | | | |
| Six Months Ended | | | | | |
| June 30, 2011 | | Year Ended December 31, | |
| Institutional Shares | (Unaudited) | 2010 | 2009 | 2008 | 2007 | 2006 |
| Per Share Data ($): | | | | | | |
| Net asset value, | | | | | | |
| beginning of period | 24.42 | 21.82 | 18.74 | 29.85 | 31.98 | 31.36 |
| Investment Operations: | | | | | | |
| Investment income—neta | .06 | .23 | .27 | .41 | .48 | .42 |
| Net realized and unrealized | | | | | | |
| gain (loss) on investments | 1.27 | 2.61 | 3.08 | (11.09) | .43 | 5.94 |
| Total from Investment Operations | 1.33 | 2.84 | 3.35 | (10.68) | .91 | 6.36 |
| Distributions: | | | | | | |
| Dividends from | | | | | | |
| investment income—net | (.06) | (.24) | (.27) | (.43) | (.50) | (.41) |
| Dividends from net realized | | | | | | |
| gain on investments | — | — | — | (.00)b | (2.54) | (5.33) |
| Total Distributions | (.06) | (.24) | (.27) | (.43) | (3.04) | (5.74) |
| Net asset value, end of period | 25.69 | 24.42 | 21.82 | 18.74 | 29.85 | 31.98 |
| Total Return (%) | 5.43c | 13.11 | 18.20 | (36.05) | 2.89 | 21.11 |
| Ratios/Supplemental Data (%): | | | | | | |
| Ratio of total expenses | | | | | | |
| to average net assets | 1.13d | 1.05 | 1.06 | 1.06 | 1.06 | 1.05 |
| Ratio of net expenses | | | | | | |
| to average net assets | 1.13d | 1.05 | 1.06 | 1.05 | 1.05 | 1.05 |
| Ratio of net investment income | | | | | | |
| to average net assets | .45d | 1.04 | 1.43 | 1.63 | 1.49 | 1.28 |
| Portfolio Turnover Rate | 49.47c | 55.41 | 64.35 | 53.58 | 45.19 | 44.73 |
| Net Assets, end of period | | | | | | |
| ($ x 1,000) | 27,219 | 27,503 | 25,822 | 23,816 | 40,679 | 44,506 |
| |
| a | Based on average shares outstanding at each month end. |
| b | Amount represents less than $.01 per share. |
| c | Not annuailzed. |
| d | Annualized. |
See notes to financial statements.
20
NOTES TO FINANCIAL STATEMENTS (Unaudited)
NOTE 1—Significant Accounting Policies:
Dreyfus CoreValue Fund (the “fund”) is a separate diversified series of The Dreyfus/Laurel FundsTrust (the “Trust”) which is registered under the Investment Company Act of 1940, as amended (the “Act”), as an open-end management investment company and operates as a series company offering six series, including the fund. The fund’s investment objective is to seek long-term capital growth. The Dreyfus Corporation (the “Manager” or “Dreyfus”), a wholly-owned subsidiary of The Bank of New York Mellon Corporation (“BNY Mellon”), serves as the fund’s investment adviser. Effective May 2, 2011, the fund will be closed to any investments for new accounts.
MBSC Securities Corporation (the “Distributor”), a wholly-owned subsidiary of the Manager, is the distributor of the fund’s shares. The fund is authorized to issue an unlimited number of shares of Beneficial Interest in each of the following classes of shares: Class A, Class B, Class C, Class I and Institutional shares. Class A, Class B and Class C shares are sold primarily to retail investors through financial intermediaries and bear a distribution fee and/or service fee. Class A shares are subject to a front-end sales charge, while Class B and Class C shares are subject to a contingent deferred sales charge (“CDSC”). Class B shares automatically convert to Class A shares after six years.The fund no longer offers Class B shares, except in connection with dividend reinvestment and permitted exchanges of Class B shares. Class I shares are sold primarily to bank trust departments and other financial service providers including The Bank of NewYork Mellon, a subsidiary of BNY Mellon and an affiliate of Dreyfus, acting on behalf of customers having a qualified trust or investment account or relationship at such institution, and bear no distribution or service fees. Class I and Institutional shares are offered without a front-end sales charge or CDSC. Institutional shares are offered only to those customers of certain financial planners and investment advisers who held shares of a predecessor class of the fund as of April 4, 1994, and bear a distribution fee. Each class of shares
NOTES TO FINANCIAL STATEMENTS (Unaudited) (continued)
has identical rights and privileges, except with respect to the distribution and service fees and voting rights on matters affecting a single class. Income, expenses (other than expenses attributable to a specific class), and realized and unrealized gains or losses on investments are allocated to each class of shares based on its relative net assets.
The Financial Accounting Standards Board (“FASB”) Accounting Standards Codification (“ASC”) is the exclusive reference of authoritative U.S. generally accepted accounting principles (“GAAP”) recognized by the FASB to be applied by nongovernmental entities. Rules and interpretive releases of the Securities and Exchange Commission (“SEC”) under authority of federal laws are also sources of authoritative GAAP for SEC registrants. The fund’s financial statements are prepared in accordance with GAAP, which may require the use of management estimates and assumptions.Actual results could differ from those estimates.
(a) Portfolio valuation: Investments in securities are valued at the last sales price on the securities exchange or national securities market on which such securities are primarily traded. Securities listed on the National Market System, for which market quotations are available are valued at the official closing price or, if there is no official closing price that day, at the last sales price. Securities not listed on an exchange or the national securities market, or securities for which there were no transactions, are valued at the average of the most recent bid and asked prices. Bid price is used when no asked price is available. Registered investment companies that are not traded on an exchange are valued at their net asset value. When market quotations or official closing prices are not readily available, or are determined not to reflect accurately fair value, such as when the value of a security has been significantly affected by events after the close of the exchange or market on which the security is principally traded (for example, a foreign exchange or market), but before the fund calculates its net asset value, the fund may value these investments at fair value as determined in accordance with the procedures approved by the Board of Trustees. Fair valuing of securities may be determined with the assistance of a
22
pricing service using calculations based on indices of domestic securities and other appropriate indicators, such as prices of relevant ADRs and futures contracts. For other securities that are fair valued by the Board of Trustees, certain factors may be considered such as: fundamental analytical data, the nature and duration of restrictions on disposition, an evaluation of the forces that influence the market in which the securities are purchased and sold, and public trading in similar securities of the issuer or comparable issuers.
The fair value of a financial instrument is the amount that would be received to sell an asset or paid to transfer a liability in an orderly transaction between market participants at the measurement date (i.e. the exit price). GAAP establishes a fair value hierarchy that prioritizes the inputs of valuation techniques used to measure fair value.This hierarchy gives the highest priority to unadjusted quoted prices in active markets for identical assets or liabilities (Level 1 measurements) and the lowest priority to unobservable inputs (Level 3 measurements).
Additionally, GAAP provides guidance on determining whether the volume and activity in a market has decreased significantly and whether such a decrease in activity results in transactions that are not orderly. GAAP requires enhanced disclosures around valuation inputs and techniques used during annual and interim periods.
Various inputs are used in determining the value of the fund’s investments relating to fair value measurements.These inputs are summarized in the three broad levels listed below:
Level 1—unadjusted quoted prices in active markets for identical investments.
Level 2—other significant observable inputs (including quoted prices for similar investments, interest rates, prepayment speeds, credit risk, etc.).
Level 3—significant unobservable inputs (including the fund’s own assumptions in determining the fair value of investments).
NOTES TO FINANCIAL STATEMENTS (Unaudited) (continued)
The inputs or methodology used for valuing securities are not necessarily an indication of the risk associated with investing in those securities.
The following is a summary of the inputs used as of June 30, 2011 in valuing the fund’s investments:
| | | | |
| | | Level 2—Other | Level 3— | |
| | Level 1— | Significant | Significant | |
| | Unadjusted | Observable | Unobservable | |
| | Quoted Prices | Inputs | Inputs | Total |
| Assets ($) | | | | |
| Investments in Securities: | | | |
| Equity Securities— | | | | |
| Domestic† | 368,681,417 | — | — | 368,681,417 |
| Mutual Funds/ | | | | |
| Exchange | | | | |
| Traded Funds | 22,407,551 | — | — | 22,407,551 |
| |
| † See Statement of Investments for additional detailed categorizations. | |
In January 2010, FASB issued Accounting Standards Update (“ASU”) No. 2010-06 “Improving Disclosures about FairValue Measurements”. The portions of ASU No. 2010-06 which require reporting entities to prepare new disclosures surrounding amounts and reasons for significant transfers in and out of Level 1 and Level 2 fair value measurements as well as inputs and valuation techniques used to measure fair value for both recurring and nonrecurring fair value measurements that fall in either Level 2 or Level 3 have been adopted by the fund. No significant transfers between Level 1 or Level 2 fair value measurements occurred at June 30, 2011.
In May 2011, FASB issued ASU No. 2011-04 “Amendments to Achieve Common Fair Value Measurement and Disclosure Requirements in GAAP and International Financial Reporting Standards (“IFRS”)”. ASU No. 2011-04 includes common requirements for measurement of and disclosure about fair value between GAAP and IFRS. ASU No. 2011-04 will require reporting entities to disclose the following information for fair value measurements categorized within Level 3 of the fair value hierarchy: quantitative information about the unobservable
24
inputs used in the fair value measurement, the valuation processes used by the reporting entity and a narrative description of the sensitivity of the fair value measurement to changes in unobservable inputs and the interrelationships between those unobservable inputs. In addition,ASU No. 2011-04 will require reporting entities to make disclosures about amounts and reasons for all transfers in and out of Level 1 and Level 2 fair value measurements. The new and revised disclosures are effective for interim and annual reporting periods beginning after December 15, 2011. At this time, management is evaluating the implications of ASU No. 2011-04 and its impact on the financial statements.
(b) Securities transactions and investment income: Securities transactions are recorded on a trade date basis. Realized gains and losses from securities transactions are recorded on the identified cost basis. Dividend income is recognized on the ex-dividend date and interest income, including, where applicable, accretion of discount and amortization of premium on investments, is recognized on the accrual basis.
Pursuant to a securities lending agreement withThe Bank of NewYork Mellon, the fund may lend securities to qualified institutions. It is the fund’s policy that, at origination, all loans are secured by collateral of at least 102% of the value of U.S. securities loaned and 105% of the value of foreign securities loaned. Collateral equivalent to at least 100% of the market value of securities on loan is maintained at all times. Collateral is either in the form of cash, which can be invested in certain money market mutual funds managed by the Manager, U.S. Government and Agency securities or letters of credit.The fund is entitled to receive all income on securities loaned, in addition to income earned as a result of the lending transaction.Although each security loaned is fully collateralized, the fund bears the risk of delay in recovery of, or loss of rights in, the securities loaned should a borrower fail to return the securities in a timely manner. During the period ended June 30, 2011,The Bank of New York Mellon earned $5,103 from lending portfolio securities, pursuant to the securities lending agreement.
NOTES TO FINANCIAL STATEMENTS (Unaudited) (continued)
(c) Affiliated issuers: Investments in other investment companies advised by Dreyfus are defined as “affiliated” in the Act.
The fund may invest in shares of certain affiliated investment companies also advised or managed by Dreyfus. Investments in affiliated investment companies for the period ended June 30, 2011 were as follows:
| | | | | |
| Affiliated | | | | | |
| Investment | Value | | | Value | Net |
| Company | 12/31/2010 ($) | Purchases ($) | Sales ($) | 6/30/2011 ($) | Assets (%) |
| Dreyfus | | | | | |
| Institutional | | | | | |
| Preferred | | | | | |
| Plus Money | | | | | |
| Market Fund | 151,000 | 32,695,000 | 31,025,000 | 1,821,000 | .5 |
| Dreyfus | | | | | |
| Institutional | | | | | |
| Cash | | | | | |
| Advantage | | | | | |
| Fund | 5,059,040 | 129,008,789 | 114,387,354 | 19,680,475 | 5.3 |
| Total | 5,210,040 | 161,703,789 | 145,412,354 | 21,501,475 | 5.8 |
(d) Dividends to shareholders: Dividends are recorded on the ex-dividend date. Dividends from investment income-net are declared and paid on a quarterly basis. Dividends from net realized capital gains, if any, are normally declared and paid annually, but the fund may make distributions on a more frequent basis to comply with the distribution requirements of the Internal Revenue Code of 1986, as amended (the “Code”).To the extent that net realized capital gains can be offset by capital loss carryovers, it is the policy of the fund not to distribute such gains. Income and capital gain distributions are determined in accordance with income tax regulations, which may differ from GAAP.
(e) Federal income taxes: It is the policy of the fund to continue to qualify as a regulated investment company, if such qualification is in the best interests of its shareholders, by complying with the applicable provisions of the Code, and to make distributions of taxable income sufficient to relieve it from substantially all federal income and excise taxes.
As of and during the period ended June 30, 2011, the fund did not have any liabilities for any uncertain tax positions.The fund recognizes interest and penalties, if any, related to uncertain tax positions as
26
income tax expense in the Statement of Operations. During the period, the fund did not incur any interest or penalties.
Each of the tax years in the three-year period ended December 31, 2010 remains subject to examination by the Internal Revenue Service and state taxing authorities.
The fund has an unused capital loss carryover of $76,739,713 available for federal income tax purposes to be applied against future net securities profits, if any, realized subsequent to December 31, 2010. If not applied, $26,538,711 of the carryover expires in fiscal 2016 and $50,201,002 expires in fiscal 2017.
Under the recently enacted Regulated Investment Company Modernization Act of 2010, the fund is permitted to carry forward capital losses incurred in taxable years beginning after December 22, 2010 (“post-enactment losses”) for an unlimited period. However, any post-enactment losses are required to be utilized before the utilization of losses incurred prior to the effective date of the Act.As a result of this ordering rule, capital loss carry forwards related to taxable years beginning prior to the effective date of the Act may be more likely to expire unused.
The tax character of distributions paid to shareholders during the fiscal year ended December 31, 2010 was as follows: ordinary income $3,305,939. The tax character of current year distributions will be determined at the end of the current fiscal year.
NOTE 2—Bank Lines of Credit:
The fund participates with other Dreyfus-managed funds in a $225 million unsecured credit facility led by Citibank, N.A. and a $300 million unsecured credit facility provided by The Bank of New York Mellon (each, a “Facility”), each to be utilized primarily for temporary or emergency purposes, including the financing of redemptions. In connection therewith, the fund has agreed to pay its pro rata portion of commitment fees for each Facility. Interest is charged to the fund based on rates determined pursuant to the terms of the respective Facility at the time of borrowing.
NOTES TO FINANCIAL STATEMENTS (Unaudited) (continued)
The average amount of borrowings outstanding under the Facilities during the period ended June 30, 2011 was approximately $80,000 with a related weighted average annualized interest rate of 1.41%.
NOTE 3—Investment Management Fee and Other Transactions With Affiliates:
(a) Pursuant to an investment management agreement with the Manager, the Manager provides or arranges for one or more third parties and/or affiliates to provide investment advisory, administrative, custody, fund accounting and transfer agency services to the fund.The Manager also directs the investments of the fund in accordance with its investment objective, policies and limitations. For these services, the fund is contractually obligated to pay the Manager a fee, calculated daily and paid monthly, at the annual rate of .90% of the value of the fund’s average daily net assets. Out of its fee, the Manager pays all of the expenses of the fund except brokerage fees, taxes, interest, commitment fees, Rule 12b-1 distribution fees and expenses, service fees and expenses of non-interested Trustees (including counsel fees) and extraordinary expenses. In addition, the Manager is required to reduce its fee in an amount equal to the fund’s allocable portion of fees and expenses of the non-interested Trustees (including counsel fees). Each Trustee who is not an “interested person” of the Trust (as defined in the Act) received $60,000 per annum, plus $7,000 per joint Board meeting of theTrust,The Dreyfus/Laurel Funds, Inc.,The Dreyfus/LaurelTax-Free Municipal Funds, Dreyfus Investment Funds and Dreyfus Funds, Inc. (collectively, the “Board Group Open-End Funds”) attended, $2,500 for separate in-person committee meetings attended which are not held in conjunction with a regularly scheduled Board meeting and $2,000 for Board meetings and separate committee meetings attended that are conducted by telephone.The Board Group Open-end Funds also reimburse each Trustee who is not an “interested person” of the Trust (as defined in the Act) for travel and out-of-pocket expenses. With respect to Board meetings, the Chairman of the Board receives
28
an additional 25% of such compensation (with the exception of reimbursable amounts).The Chair of each of the Board’s committees, unless the Chair also serves as Chair of the Board, receives $1,350 per applicable committee meeting. In the event that there is an in-person joint committee meeting or a joint telephone meeting of the Board Group Open-end Funds and Dreyfus High Yield Strategies Fund, the $2,500 or $2,000 fee, as applicable, is allocated between the Board Group Open-end Funds and Dreyfus High Yield Strategies Funds. The Trust’s portion of these fees and expenses are charged and allocated to each series based on net assets. Amounts required to be paid by the Trust directly to the non-interested Trustees, that would be applied to offset a portion of the management fee payable by certain other series of the Trust to the Manager, are in fact paid directly by the Manager to the non-interested Trustees.
During the period ended June 30, 2011, the Distributor retained $1,862 from commissions earned on sales of the fund’s Class A shares and $1,396 and $116 from CDSCs on redemptions on the fund’s Class B and Class C shares, respectively.
(b) Under separate Distribution Plans (the “Plans”) adopted pursuant to Rule 12b-1 under the Act, Class A shares and Institutional shares may pay annually up to .25% and .15%, respectively, of the value of their average daily net assets to compensate the Distributor for shareholder servicing activities and expenses primarily intended to result in the sale of Class A and Institutional shares. Class B and Class C shares pay the Distributor for distributing their shares at an aggregate annual rate of .75% of the value of the average daily net assets of Class B and Class C shares. Class B and Class C shares are also subject to a Service Plan adopted pursuant to Rule 12b-1 (the “Service Plan”), under which Class B and Class C shares pay the Distributor for providing certain services to the holders of their shares a fee at the annual rate of .25% of the value of the average daily net assets of Class B and Class C shares.
NOTES TO FINANCIAL STATEMENTS (Unaudited) (continued)
During the period ended June 30, 2011, Class A, Class B, Class C and Institutional shares were charged $418,181, $3,154, $29,388 and $20,845, respectively, pursuant to their respective Plans. During the period ended June 30, 2011, Class B and Class C shares were charged $1,051 and $9,796, respectively, pursuant to the Service Plan.
Under its terms, the Plans and Service Plan shall remain in effect from year to year, provided such continuance is approved annually by a vote of majority of those Trustees who are not “interested persons” of the Trust and who have no direct or indirect financial interest in the operation of or in any agreement related to the Plans or Service Plan.
The components of “Due to The Dreyfus Corporation and affiliates” in the Statement of Assets and Liabilities consist of: management fees $267,763, Rule 12b-1 distribution plan fees $75,351 and shareholder services plan fees $1,693.
NOTE 4—Securities Transactions:
The aggregate amount of purchases and sales of investment securities, excluding short-term securities, during the period ended June 30, 2011, amounted to $187,967,340 and $209,462,138, respectively.
At June 30, 2011, accumulated net unrealized appreciation on investments was $34,630,497, consisting of $49,734,966 gross unrealized appreciation and $15,104,469 gross unrealized depreciation.
At June 30, 2011, the cost of investments for federal income tax purposes was substantially the same as the cost for financial reporting purposes (see the Statement of Investments).
30
NOTE 5—Plan of Reorganization:
On April 12, 2011, the Board of Trustees approved the merger of the fund into Dreyfus Strategic Value Fund, a series of Advantage Funds, Inc.The merger was approved by shareholders of the fund at a meeting held on August 11, 2011. The merger is anticipated to occur on or about November 16, 2011. On the date of the merger, which is a tax-free reorganization, the fund would exchange all of its assets at net asset value, subject to liabilities, for an equivalent value of corresponding Class A, B, C or I shares of Dreyfus Strategic Value Fund. Institutional shares of the fund will receive Class I shares of Dreyfus Strategic Value Fund.Those shares then will be distributed pro rata to shareholders of the fund so that each shareholder receives a number of shares of Dreyfus Strategic Value Fund equal to the aggregate net asset value of the shareholder’s fund shares.
|
| INFORMATION ABOUT THE RENEWAL OF THE FUND’S |
| INVESTMENT MANAGEMENT AGREEMENT (Unaudited) |
At a meeting of the fund’s Board of Trustees held on February 15-16, 2011, the Board considered the renewal of the fund’s Investment Management Agreement pursuant to which Dreyfus provides the fund with investment advisory and administrative services (the“Agreement”). The Board members, none of whom are “interested persons” (as defined in the Investment Company Act of 1940, as amended) of the fund, were assisted in their review by independent legal counsel and met with counsel in executive session separate from representatives of Dreyfus. In considering the renewal of the Agreement, the Board considered all factors that it believed to be relevant, including those discussed below.The Board did not identify any one factor as dispositive, and each Board member may have attributed different weights to the factors considered.
Analysis of Nature, Extent, and Quality of Services Provided to the Fund.The Board members considered information previously provided to them in presentations from representatives of Dreyfus regarding the nature, extent, and quality of the services provided to funds in the Dreyfus fund complex, and representatives of Dreyfus confirmed that there had been no material changes in this information. Dreyfus provided the number of open accounts in the fund, the fund’s asset size and the allocation of fund assets among distribution channels. Dreyfus also had previously provided information regarding the diverse intermediary relationships and distribution channels of funds in the Dreyfus fund complex and Dreyfus’ corresponding need for broad, deep, and diverse resources to be able to provide ongoing shareholder services to each distribution channel, including the distribution channel(s) for the fund.
The Board members also considered research support available to, and portfolio management capabilities of, the fund’s portfolio management personnel and that Dreyfus also provides oversight of day-to-day fund operations, including fund accounting and administration and assistance in meeting legal and regulatory requirements.The Board members also considered Dreyfus’ extensive administrative, accounting, and compliance infrastructures.The Board also considered portfolio management’s brokerage policies and practices (including policies and practices regarding soft dollars) and the standards applied in seeking best execution.
32
Comparative Analysis of the Fund’s Performance and Management Fee and Expense Ratio. The Board members reviewed reports prepared by Lipper, Inc. (“Lipper”), an independent provider of investment company data, which included information comparing (1) the fund’s performance with the performance of a group of comparable funds (the “Performance Group”) and with a broader group of funds (the “Performance Universe”), all for various periods ended December 31, 2010, and (2) the fund’s actual and contractual management fees and total expenses with those of a group of comparable funds (the “Expense Group”) and with a broader group of funds (the “Expense Universe”), the information for which was derived in part from fund financial statements available to Lipper as of June 30, 2010. Dreyfus previously had furnished the Board with a description of the methodology Lipper used to select the Performance Group and Performance Universe and the Expense Group and Expense Universe.
Dreyfus representatives stated that the usefulness of performance comparisons may be affected by a number of factors, including different investment limitations that may be applicable to the fund and comparison funds.The Board members discussed the results of the comparisons and noted that the fund’s total return performance was below the Performance Group and Performance Universe medians for the various periods, except for the 1-year period when the fund’s performance was at the Performance Group median and above the Performance Universe median and the 5-year period when the fund’s performance was above the Performance Universe median. Dreyfus also provided a comparison of the fund’s calendar year total returns to the returns of the fund’s benchmark index.
The Board members also reviewed the range of actual and contractual management fees and total expenses of the Expense Group and Expense Universe funds and discussed the results of the comparisons.Taking into consideration the fund’s “unitary” fee structure, they noted that the fund’s contractual management fee was above the Expense Group
|
| INFORMATION ABOUT THE RENEWAL OF THE FUND’S INVESTMENT |
| MANAGEMENT AGREEMENT (Unaudited) (continued) |
median, the fund’s actual management fee was above the Expense Group and Expense Universe medians and the fund’s total expenses were below the Expense Group and Expense Universe medians.
Representatives of Dreyfus reviewed with the Board members the management or investment advisory fees (1) paid by funds advised or administered by Dreyfus that are in the same Lipper category as the fund and (2) paid to Dreyfus or the Dreyfus-affiliated primary employer of the fund’s primary portfolio manager for advising any separate accounts and/or other types of client portfolios that are considered to have similar investment strategies and policies as the fund (the “Similar Clients”), and explained the nature of the Similar Clients. They discussed differences in fees paid and the relationship of the fees paid in light of any differences in the services provided and other relevant factors, noting the fund’s “unitary” fee structure. The Board members considered the relevance of the fee information provided for the Similar Clients to evaluate the appropriateness and reasonableness of the fund’s management fee.
Analysis of Profitability and Economies of Scale. Dreyfus’ representatives reviewed the expenses allocated and profit received by Dreyfus and the resulting profitability percentage for managing the fund, and the method used to determine the expenses and profit. The Board concluded that the profitability results were not unreasonable, given the services rendered and service levels provided by Dreyfus.The Board previously had been provided with information prepared by an independent consulting firm regarding Dreyfus’ approach to allocating costs to, and determining the profitability of, individual funds and the entire Dreyfus fund complex. The consulting firm also had analyzed where any economies of scale might emerge in connection with the management of a fund.
The Board’s counsel stated that the Board members should consider the profitability analysis (1) as part of their evaluation of whether the fees under the Agreement bear a reasonable relationship to the mix of services
34
provided by Dreyfus, including the nature, extent and quality of such services, and (2) in light of the relevant circumstances for the fund and the extent to which economies of scale would be realized if the fund grows and whether fee levels reflect these economies of scale for the benefit of fund shareholders. Dreyfus representatives noted that, as a result of shared and allocated costs among funds in the Dreyfus funds complex, the extent of economies of scale could depend substantially on the level of assets in the complex as a whole, so that increases and decreases in complex-wide assets can affect potential economies of scale in a manner that is disproportionate to, or even in the opposite direction from, changes in the fund’s asset level.The Board members also considered potential benefits to Dreyfus from acting as investment adviser and noted the soft dollar arrangements in effect for trading the fund’s investments.
At the conclusion of these discussions, the Board agreed that it had been furnished with sufficient information to make an informed business decision with respect to the renewal of the Agreement. Based on the discussions and considerations as described above, the Board concluded and determined as follows.
The Board concluded that the nature, extent and quality of the services provided by Dreyfus are adequate and appropriate.
The Board generally was satisfied with the fund’s performance, in light of the considerations described above.
The Board concluded that the fee paid to Dreyfus was reasonable in light of the considerations described above.
The Board determined that the economies of scale which may accrue to Dreyfus and its affiliates in connection with the management of the fund had been adequately considered by Dreyfus in connection with the fee rate charged to the fund pursuant to the Agreement and that, to the extent in the future it were determined that material economies of scale had not been shared with the fund, the Board would seek to have those economies of scale shared with the fund.
|
| INFORMATION ABOUT THE RENEWAL OF THE FUND’S INVESTMENT |
| MANAGEMENT AGREEMENT (Unaudited) (continued) |
The Board members considered these conclusions and determinations, along with information received on a routine and regular basis throughout the year. In addition, it should be noted that the Board’s consideration of the contractual fee arrangements for this fund had the benefit of a number of years of reviews of prior or similar agreements during which lengthy discussions took place between the Board members and Dreyfus representatives. Certain aspects of the arrangements may receive greater scrutiny in some years than in others, and the Board members’ conclusions may be based, in part, on their consideration of the same or similar arrangements in prior years. The Board members determined that renewal of the Agreement was in the best interests of the fund and its shareholders.
36
For More Information

Telephone Call your financial representative or 1-800-DREYFUS
Mail The Dreyfus Family of Funds, 144 Glenn Curtiss Boulevard, Uniondale, NY 11556-0144
The fund files its complete schedule of portfolio holdings with the Securities and Exchange Commission (“SEC”) for the first and third quarters of each fiscal year on Form N-Q. The fund’s Forms N-Q are available on the SEC’s website at http://www.sec.gov and may be reviewed and copied at the SEC’s Public Reference Room in Washington, DC. Information on the operation of the Public Reference Room may be obtained by calling 1-800-SEC-0330.
A description of the policies and procedures that the fund uses to determine how to vote proxies relating to portfolio securities, and information regarding how the fund voted these proxies for the most recent 12-month period ended June 30 is available at http://www.dreyfus.com and on the SEC’s website at http://www.sec.gov. The description of the policies and procedures is also available without charge, upon request, by calling 1-800-DREYFUS.

SEMIANNUAL REPORT June 30, 2011

Save time. Save paper. View your next shareholder report online as soon as it’s available. Log into www.dreyfus.com and sign up for Dreyfus eCommunications. It’s simple and only takes a few minutes.
The views expressed in this report reflect those of the portfolio manager only through the end of the period covered and do not necessarily represent the views of Dreyfus or any other person in the Dreyfus organization. Any such views are subject to change at any time based upon market or other conditions and Dreyfus disclaims any responsibility to update such views.These views may not be relied on as investment advice and, because investment decisions for a Dreyfus fund are based on numerous factors, may not be relied on as an indication of trading intent on behalf of any Dreyfus fund.
Not FDIC-Insured • Not Bank-Guaranteed • May Lose Value
| | Contents |
| | THE FUND |
| 2 | A Letter from the Chairman and CEO |
| 3 | Discussion of Fund Performance |
| 6 | Understanding Your Fund’s Expenses |
| 6 | Comparing Your Fund’s Expenses With Those of Other Funds |
| 7 | Statement of Investments |
| 20 | Statement of Assets and Liabilities |
| 21 | Statement of Operations |
| 22 | Statement of Changes in Net Assets |
| 24 | Financial Highlights |
| 28 | Notes to Financial Statements |
| 43 | Information About the Renewal of the Fund’s Investment Management Agreement |
| | FOR MORE INFORMATION |
| | Back Cover |
Dreyfus
High Yield Fund
The Fund

A LETTER FROM THE CHAIRMAN AND CEO
Dear Shareholder:
We are pleased to present this semiannual report for Dreyfus HighYield Fund, covering the six-month period from January 1, 2011, through June 30, 2011. For information about how the fund performed during the reporting period, as well as general market perspectives, we provide a Discussion of Fund Performance on the pages that follow.
Although 2011 began on an optimistic note amid encouraging economic data, by midyear investors returned to a more cautious outlook. The U.S. and global economies continued to grow over the reporting period, but at a relatively sluggish pace. First, manufacturing activity proved unsustainably strong in late 2010 and early 2011, leading to a subsequent slowdown in new orders. Second, turmoil in the Middle East drove oil prices higher and produced an inflationary drag on real incomes.Third, natural and nuclear disasters in Japan added to upward pressure on energy prices, and these unexpected events disrupted the global supply chain, especially in the automotive sector. Finally, in the United States, disappointing labor and housing markets weighed on investor sentiment. U.S. government securities rallied as investors grew more defensive, and most bond market sectors produced positive total returns over the first half of the year.
We expect economic conditions to improve over the second half of 2011. Inflationary pressures appear to be peaking in most countries, including the United States, and we have already seen energy prices retreat from their highs. In addition, a successful resolution to the current debate regarding government spending and borrowing, without major fiscal tightening over the near term, should help avoid a serious disruption to the domestic economy. To assess how these and other developments may affect your investments, we encourage you, as always, to speak with your financial advisor.
Thank you for your continued confidence and support.
Jonathan R. Baum
Chairman and Chief Executive Officer
The Dreyfus Corporation
July 15, 2011
2

DISCUSSION OF FUND PERFORMANCE
For the period of January 1, 2011, through June 30, 2011, as provided by Chris Barris, Portfolio Manager
Fund and Market Performance Overview
For the six-month period ended June 30, 2011, Dreyfus High Yield Fund’s Class A shares produced a total return of 4.19%, Class B shares returned 3.94%, Class C shares returned 3.81% and Class I shares returned 4.48%.1 In comparison, the BofA Merrill Lynch U.S. High Yield Master II Constrained Index (the “Index”), the fund’s benchmark, achieved a total return of 4.93% over the same period.2
Improving economic conditions generally drove high yield bond prices higher early in the reporting period, but renewed economic concerns later caused the market to give back some of its previous gains.The fund’s returns were lower than its benchmark, primarily due to shortfalls in the financials sector and lack of exposure to some of the benchmark’s stronger-performing utilities.
The Fund’s Investment Approach
The fund seeks to maximize total return, consisting of capital appreciation and current income.
At least 80% of the fund’s assets are invested in fixed-income securities that are rated below investment grade (“high yield” or “junk” bonds) or are the unrated equivalent as determined by Dreyfus. Individual issues are selected based on careful credit analysis.We thoroughly analyze the business, management and financial strength of each of the companies whose bonds we buy, then project each issuer’s ability to repay its debt.
Shifting Economic Sentiment Sparked Market Volatility
Investors’ outlooks had improved dramatically by the start of 2011, mainly due to gains in employment, consumer spending and corporate earnings.These developments supported prices of high yield bonds as investors continued to favor riskier assets. Investors’ economic optimism was shaken in February, when political unrest in the Middle East led to sharply rising energy prices, and again in March when devastating natural and nuclear disasters in Japan threatened one of the world’s
DISCUSSION OF FUND PERFORMANCE (continued)
largest economies. Nonetheless, investors proved resilient, and the more economically sensitive sectors of the bond market bounced back from these unexpected shocks.
In late April, economic sentiment began to deteriorate in earnest when Greece appeared headed for default on its sovereign debt, U.S. economic data proved more disappointing than expected and a contentious debate regarding U.S. government spending and borrowing intensified. High yield bonds suffered bouts of heightened volatility, erasing earlier gains as newly risk-averse investors shifted their focus from riskier market sectors to traditionally defensive investments. Still, the benchmark ended the reporting period in positive territory and with higher returns than most indices of U.S. government securities or investment-grade corporate bonds.
Security Selections Produced Mixed Results
In this choppy market environment, we adopted a relatively cautious posture to avoid potential declines stemming from the sovereign debt crisis in Europe and troubled U.S. housing markets. However, the fund’s underweighted exposure to the financials and building products sectors prevented it from participating more fully in these areas’ rebounds from previously depressed levels. A higher-quality bias in the utilities sector also dampened the fund’s participation in relative strength among some of the benchmark’s more speculative electricity producers.
We took a more constructive view of other industry groups, particularly those in service-oriented businesses. Overweighted exposure to the media industry buoyed the fund’s relative performance, as did strong security selections such as Clear Channel Communications and Gray Television. The fund also benefited from its investments in the automotive sector, which continued to return to profitability and recover from previously depressed bond prices. Bonds from the technology and metals-and-mining industries—both areas of emphasis during the reporting period—also fared relatively well.
Selectivity More Important in an Uncertain Economy
Although we expect the global economic recovery to persist, a number of headwinds remain. On one hand, corporate earnings have continued to grow, and industrial demand from the emerging markets has remained
4
strong. In the high yield market, liquidity has been ample and the new issuance supply has remained robust. On the other hand, U.S. unemployment remains high, housing markets are still troubled and the sovereign debt crisis in Europe may spread if it cannot be contained successfully.
Therefore, we have adopted a somewhat more selective investment posture.To manage risks, we have increased the number of holdings in the fund’s portfolio, enhancing diversification and reducing the fund’s sensitivity to weakness in any individual holding. We have maintained underweighted exposure to the Financial Sector due to ongoing pressures in the Euro banking industry stemming from sovereign debt exposure.
We have continued to favor individual bond issuers with strong earnings, healthy balance sheets, ample asset protection and positive cash flows. In our judgment, these strategies position the fund well for an environment in which investors appear likely to reward healthy companies and punish those with poor underlying business fundamentals.
July 15, 2011
| |
| | Bond funds are subject generally to interest rate, credit, liquidity and market risks, to varying |
| | degrees, all of which are more fully described in the fund’s prospectus. Generally, all other factors |
| | being equal, bond prices are inversely related to interest-rate changes, and rate increases can cause |
| | price declines. |
| | High yield bonds are subject to increased credit risk and are considered speculative in terms of the |
| | issuer’s perceived ability to continue making interest payments on a timely basis and to repay |
| | principal upon maturity. |
| 1 | Total return includes reinvestment of dividends and any capital gains paid, and does not take into |
| | consideration the maximum initial sales charge in the case of Class A shares, or the applicable |
| | contingent deferred sales charges imposed on redemptions in the case of Class B and Class C |
| | shares. Had these charges been reflected, returns would have been lower. Past performance is no |
| | guarantee of future results. Share price, yield and investment return fluctuate such that upon |
| | redemption, fund shares may be worth more or less than their original cost. |
| 2 | SOURCE: Bloomberg — Reflects reinvestment of dividends and, where applicable, capital gain |
| | distributions.The BofA Merrill Lynch U.S. HighYield Master II Constrained Index is an |
| | unmanaged performance benchmark composed of U.S. dollar-denominated domestic andYankee |
| | bonds rated below investment grade with at least $100 million par amount outstanding and at |
| | least one year remaining to maturity. Bonds are capitalization-weighted.Total allocations to an |
| | issuer are capped at 2%.The index does not reflect fees and expenses to which the fund is subject. |
UNDERSTANDING YOUR FUND’S EXPENSES (Unaudited)
As a mutual fund investor, you pay ongoing expenses, such as management fees and other expenses. Using the information below, you can estimate how these expenses affect your investment and compare them with the expenses of other funds.You also may pay one-time transaction expenses, including sales charges (loads) and redemption fees, which are not shown in this section and would have resulted in higher total expenses. For more information, see your fund’s prospectus or talk to your financial adviser.
Review your fund’s expenses
The table below shows the expenses you would have paid on a $1,000 investment in Dreyfus High Yield Fund from January 1, 2011 to June 30, 2011. It also shows how much a $1,000 investment would be worth at the close of the period, assuming actual returns and expenses.
Expenses and Value of a $1,000 Investment
assuming actual returns for the six months ended June 30, 2011
| | | | |
| | Class A | Class B | Class C | Class I |
| Expenses paid per $1,000† | $ 4.81 | $ 7.33 | $ 8.59 | $ 3.55 |
| Ending value (after expenses) | $1,041.90 | $1,039.40 | $1,038.10 | $1,044.80 |
COMPARING YOUR FUND’S EXPENSES
WITH THOSE OF OTHER FUNDS (Unaudited)
Using the SEC’s method to compare expenses
The Securities and Exchange Commission (SEC) has established guidelines to help investors assess fund expenses. Per these guidelines, the table below shows your fund’s expenses based on a $1,000 investment, assuming a hypothetical 5% annualized return. You can use this information to compare the ongoing expenses (but not transaction expenses or total cost) of investing in the fund with those of other funds.All mutual fund shareholder reports will provide this information to help you make this comparison. Please note that you cannot use this information to estimate your actual ending account balance and expenses paid during the period.
Expenses and Value of a $1,000 Investment
assuming a hypothetical 5% annualized return for the six months ended June 30, 2011
| | | | |
| | Class A | Class B | Class C | Class I |
| Expenses paid per $1,000† | $ 4.76 | $ 7.25 | $ 8.50 | $ 3.51 |
| Ending value (after expenses) | $1,020.08 | $1,017.60 | $1,016.36 | $1,021.32 |
|
| † Expenses are equal to the fund’s annualized expense ratio of .95% for Class A, 1.45% for Class B, 1.70% for |
| Class C and .70% for Class I, multiplied by the average account value over the period, multiplied by 181/365 (to |
| reflect the one-half year period). |
6
|
| STATEMENT OF INVESTMENTS |
| June 30, 2011 (Unaudited) |
| | | | | |
| | Coupon | Maturity | Principal | | |
| Bonds and Notes—94.1% | Rate (%) | Date | Amount ($) | | Value ($) |
| Aerospace—1.3% | | | | | |
| Alion Science and Technology, | | | | | |
| Sr. Scd. Notes | 12.00 | 11/1/14 | 14,070 | a | 14,527 |
| Ducommun, | | | | | |
| Sr. Notes | 9.75 | 7/15/18 | 885,000 | b | 913,762 |
| Dyncorp International, | | | | | |
| Sr. Unscd. Notes | 10.38 | 7/1/17 | 5,135,000 | a,b | 5,289,050 |
| Kratos Defense and Security | | | | | |
| Solutions, Sr. Scd. Notes | 10.00 | 6/1/17 | 2,670,000 | b | 2,830,200 |
| Transdigm, | | | | | |
| Gtd. Notes | 7.75 | 12/15/18 | 4,245,000 | b | 4,478,475 |
| | | | | | 13,526,014 |
| Automotive—5.0% | | | | | |
| Chrysler Group, | | | | | |
| Sr. Scd. Notes | 8.25 | 6/15/21 | 3,550,000 | a,b | 3,496,750 |
| Ford Motor Credit, | | | | | |
| Sr. Unscd. Notes | 8.13 | 1/15/20 | 5,600,000 | | 6,508,112 |
| Ford Motor, | | | | | |
| Sr. Unscd. Notes | 7.45 | 7/16/31 | 10,215,000 | a | 11,631,177 |
| Goodyear Tire & Rubber, | | | | | |
| Gtd. Notes | 8.25 | 8/15/20 | 6,820,000 | a | 7,399,700 |
| Lear, | | | | | |
| Gtd. Notes | 8.13 | 3/15/20 | 2,265,000 | a | 2,451,863 |
| Pinafore, | | | | | |
| Scd. Notes | 9.00 | 10/1/18 | 9,925,000 | b | 10,743,813 |
| Pittsburgh Glass Works, | | | | | |
| Sr. Scd. Notes | 8.50 | 4/15/16 | 5,230,000 | a,b | 5,399,975 |
| UCI International, | | | | | |
| Gtd. Notes | 8.63 | 2/15/19 | 3,585,000 | | 3,710,474 |
| | | | | | 51,341,864 |
| Building Products—2.3% | | | | | |
| Building Materials Corp of | | | | | |
| America, Sr. Notes | 6.75 | 5/1/21 | 4,745,000 | b | 4,780,588 |
| Cemex SAB de CV, | | | | | |
| Sr. Scd. Notes | 9.00 | 1/11/18 | 5,250,000 | a,b | 5,368,125 |
| Headwaters, | | | | | |
| Scd. Notes | 7.63 | 4/1/19 | 1,760,000 | a | 1,610,400 |
| Ply Gem Industries, | | | | | |
| Sr. Scd. Notes | 8.25 | 2/15/18 | 2,085,000 | a,b | 1,985,963 |
STATEMENT OF INVESTMENTS (Unaudited) (continued)
| | | | | |
| | Coupon | Maturity | Principal | | |
| Bonds and Notes (continued) | Rate (%) | Date | Amount ($) | | Value ($) |
| Building Products (continued) | | | | | |
| Shea Homes Funding, | | | | | |
| Sr. Scd. Notes | 8.63 | 5/15/19 | 5,700,000 | b | 5,628,750 |
| Standard Pacific, | | | | | |
| Scd. Notes | 8.38 | 5/15/18 | 4,970,000 | a | 4,951,362 |
| | | | | | 24,325,188 |
| Cable/Satellite TV—3.0% | | | | | |
| AMC Networks, | | | | | |
| Sr. Notes | 7.75 | 7/15/21 | 1,390,000 | a,b | 1,456,024 |
| CCH II Capital, | | | | | |
| Gtd. Notes | 13.50 | 11/30/16 | 5,654,136 | | 6,686,016 |
| Cequel Communications Holdings I, | | | | | |
| Sr. Unscd. Notes | 8.63 | 11/15/17 | 2,860,000 | b | 2,988,700 |
| Dish DBS, | | | | | |
| Gtd. Notes | 7.13 | 2/1/16 | 5,040,000 | a | 5,342,400 |
| Insight Communications, | | | | | |
| Sr. Notes | 9.38 | 7/15/18 | 4,700,000 | b | 5,181,750 |
| Kabel BW Erste Beteiligungs, | | | | | |
| Sr. Scd. Notes | 7.50 | 3/15/19 | 5,500,000 | b | 5,637,500 |
| Ono Finance II, | | | | | |
| Gtd. Notes | 10.88 | 7/15/19 | 3,640,000 | a,b | 3,894,800 |
| | | | | | 31,187,190 |
| Capital Goods—2.7% | | | | | |
| Griffon, | | | | | |
| Gtd. Notes | 7.13 | 4/1/18 | 5,380,000 | b | 5,427,075 |
| Mueller Water Products, | | | | | |
| Gtd. Notes | 7.38 | 6/1/17 | 3,225,000 | a | 3,047,625 |
| Mueller Water Products, | | | | | |
| Gtd. Notes | 8.75 | 9/1/20 | 2,575,000 | | 2,800,313 |
| RBS Global & Rexnord, | | | | | |
| Gtd. Notes | 8.50 | 5/1/18 | 5,395,000 | a | 5,725,443 |
| Wireco WorldGroup, | | | | | |
| Sr. Unscd. Notes | 9.75 | 5/15/17 | 10,855,000 | b,c | 11,506,300 |
| | | | | | 28,506,756 |
| Chemicals—3.7% | | | | | |
| Hexion U.S. Finance/Nova Scotia, | | | | | |
| Scd. Notes | 9.00 | 11/15/20 | 3,215,000 | a | 3,311,450 |
| Huntsman International, | | | | | |
| Gtd. Notes | 8.63 | 3/15/20 | 4,500,000 | a | 4,927,500 |
8
| | | | | |
| | Coupon | Maturity | Principal | | |
| Bonds and Notes (continued) | Rate (%) | Date | Amount ($) | | Value ($) |
| Chemicals (continued) | | | | | |
| Huntsman International, | | | | | |
| Gtd. Notes | 8.63 | 3/15/21 | 3,455,000 | a | 3,774,587 |
| Ineos Group Holdings, | | | | | |
| Gtd. Notes | 8.50 | 2/15/16 | 8,625,000 | a,b | 8,560,313 |
| Momentive Performance Materials, | | | | | |
| Scd. Notes | 9.00 | 1/15/21 | 3,645,000 | | 3,736,125 |
| OXEA Finance, | | | | | |
| Sr. Scd. Notes | 9.50 | 7/15/17 | 4,650,000 | b | 4,876,687 |
| Polyone, | | | | | |
| Sr. Unscd. Notes | 7.38 | 9/15/20 | 4,600,000 | a | 4,830,000 |
| TPC Group, | | | | | |
| Sr. Scd. Notes | 8.25 | 10/1/17 | 3,045,000 | b | 3,166,800 |
| Vertellus Specialties, | | | | | |
| Sr. Scd. Notes | 9.38 | 10/1/15 | 1,610,000 | a,b | 1,670,375 |
| | | | | | 38,853,837 |
| Consumer Products—.6% | | | | | |
| Reddy Ice, | | | | | |
| Sr. Scd. Notes | 11.25 | 3/15/15 | 3,375,000 | | 3,467,812 |
| Visant, | | | | | |
| Gtd. Notes | 10.00 | 10/1/17 | 2,370,000 | a | 2,464,800 |
| | | | | | 5,932,612 |
| Containers—2.7% | | | | | |
| AEP Industries, | | | | | |
| Sr. Notes | 8.25 | 4/15/19 | 3,020,000 | b | 3,042,650 |
| ARD Finance, | | | | | |
| Sr. Scd. Notes | 11.13 | 6/1/18 | 4,350,000 | b | 4,469,625 |
| BWAY Holding, | | | | | |
| Gtd. Notes | 10.00 | 6/15/18 | 2,380,000 | | 2,609,075 |
| BWAY Parent Company, | | | | | |
| Sr. Unscd. Notes | 10.13 | 11/1/15 | 6,773,624 | b | 6,807,492 |
| Plastipak Holdings, | | | | | |
| Sr. Notes | 10.63 | 8/15/19 | 2,435,000 | b | 2,751,550 |
| Reynolds Group Issuer, | | | | | |
| Gtd. Notes | 8.75 | 5/15/18 | 7,955,000 | a,b,c | 7,855,563 |
| | | | | | 27,535,955 |
| Energy—11.4% | | | | | |
| American Petroleum Tankers, | | | | | |
| Sr. Scd. Notes | 10.25 | 5/1/15 | 4,287,000 | | 4,501,350 |
STATEMENT OF INVESTMENTS (Unaudited) (continued)
| | | | | |
| | Coupon | Maturity | Principal | | |
| Bonds and Notes (continued) | Rate (%) | Date | Amount ($) | | Value ($) |
| Energy (continued) | | | | | |
| Aquilex Holdings, | | | | | |
| Gtd. Notes | 11.13 | 12/15/16 | 3,700,000 | | 3,616,750 |
| Brigham Exploration, | | | | | |
| Gtd. Notes | 6.88 | 6/1/19 | 5,735,000 | a,b | 5,720,663 |
| Chesapeake Energy, | | | | | |
| Gtd. Notes | 6.63 | 8/15/20 | 10,040,000 | | 10,617,300 |
| Chesapeake Energy, | | | | | |
| Gtd. Notes | 9.50 | 2/15/15 | 4,360,000 | | 5,079,400 |
| Continental Resources, | | | | | |
| Gtd. Notes | 7.13 | 4/1/21 | 3,160,000 | | 3,349,600 |
| Dresser-Rand Group, | | | | | |
| Gtd. Notes | 6.50 | 5/1/21 | 3,565,000 | b | 3,689,775 |
| El Paso, | | | | | |
| Sr. Unscd. Bonds | 6.50 | 9/15/20 | 3,524,000 | | 3,870,511 |
| El Paso, | | | | | |
| Sr. Unscd. Notes | 7.75 | 1/15/32 | 7,481,000 | | 8,739,842 |
| El Paso, | | | | | |
| Sr. Unscd. Notes | 7.80 | 8/1/31 | 3,255,000 | | 3,815,038 |
| Ferrellgas Partners, | | | | | |
| Sr. Unscd. Notes | 8.63 | 6/15/20 | 2,308,000 | | 2,446,480 |
| Ferrellgas, | | | | | |
| Sr. Unscd. Notes | 6.50 | 5/1/21 | 6,630,000 | b | 6,298,500 |
| Ferrellgas, | | | | | |
| Sr. Unscd. Notes | 9.13 | 10/1/17 | 2,500,000 | | 2,696,875 |
| Inergy Finance, | | | | | |
| Gtd. Notes | 7.00 | 10/1/18 | 5,700,000 | | 5,785,500 |
| McJunkin Red Man, | | | | | |
| Sr. Scd. Notes | 9.50 | 12/15/16 | 7,185,000 | a,b | 7,346,662 |
| MEG Energy, | | | | | |
| Gtd. Notes | 6.50 | 3/15/21 | 6,315,000 | b | 6,370,256 |
| Oasis Petroleum, | | | | | |
| Sr. Unscd. Notes | 7.25 | 2/1/19 | 5,680,000 | b | 5,651,600 |
| Offshore Group Investment, | | | | | |
| Sr. Scd. Notes | 11.50 | 8/1/15 | 1,865,000 | b | 2,037,513 |
| Offshore Group Investments, | | | | | |
| Sr. Scd. Notes | 11.50 | 8/1/15 | 4,301,000 | | 4,698,843 |
| Precision Drilling, | | | | | |
| Gtd. Notes | 6.63 | 11/15/20 | 5,170,000 | a | 5,247,550 |
10
| | | | | |
| | Coupon | Maturity | Principal | | |
| Bonds and Notes (continued) | Rate (%) | Date | Amount ($) | | Value ($) |
| Energy (continued) | | | | | |
| Targa Resources Partners, | | | | | |
| Gtd. Notes | 6.88 | 2/1/21 | 5,300,000 | b | 5,260,250 |
| Trinidad Drilling, | | | | | |
| Sr. Unscd. Notes | 7.88 | 1/15/19 | 5,025,000 | b | 5,226,000 |
| Unit, | | | | | |
| Gtd. Notes | 6.63 | 5/15/21 | 5,600,000 | | 5,607,000 |
| | | | | | 117,673,258 |
| Finance—6.1% | | | | | |
| Ally Financial, | | | | | |
| Gtd. Notes | 7.50 | 9/15/20 | 2,500,000 | a | 2,625,000 |
| Ally Financial, | | | | | |
| Gtd. Notes | 8.00 | 11/1/31 | 9,760,000 | a | 10,614,000 |
| HUB International Holdings, | | | | | |
| Sr. Sub. Notes | 10.25 | 6/15/15 | 10,376,000 | b | 10,609,460 |
| Icahn Enterprises Finance, | | | | | |
| Gtd. Notes | 8.00 | 1/15/18 | 2,500,000 | a | 2,550,000 |
| International Lease Finance, | | | | | |
| Sr. Unscd. Notes | 8.25 | 12/15/20 | 10,700,000 | a | 11,582,750 |
| International Lease Finance, | | | | | |
| Sr. Unscd. Notes | 8.63 | 9/15/15 | 2,400,000 | a,c | 2,610,000 |
| International Lease Finance, | | | | | |
| Sr. Unscd. Notes | 8.88 | 9/1/17 | 2,350,000 | a | 2,596,750 |
| Nuveen Investments, | | | | | |
| Gtd. Notes | 10.50 | 11/15/15 | 3,000,000 | a | 3,082,500 |
| Royal Bank of Scotland Group, | | | | | |
| Sub. Notes | 4.70 | 7/3/18 | 4,762,000 | | 4,125,621 |
| SLM, | | | | | |
| Sr. Unscd. Notes | 8.00 | 3/25/20 | 985,000 | | 1,059,369 |
| Springleaf Finance, | | | | | |
| Sr. Unscd. Notes | 6.90 | 12/15/17 | 7,290,000 | a | 6,725,025 |
| USI Holdings, | | | | | |
| Sr. Sub. Notes | 9.75 | 5/15/15 | 4,475,000 | b | 4,508,563 |
| | | | | | 62,689,038 |
| Food, Beverage & | | | | | |
| Tobacco—1.3% | | | | | |
| Dean Foods, | | | | | |
| Gtd. Notes | 7.00 | 6/1/16 | 4,844,000 | a | 4,819,780 |
STATEMENT OF INVESTMENTS (Unaudited) (continued)
| | | | | |
| | Coupon | Maturity | Principal | | |
| Bonds and Notes (continued) | Rate (%) | Date | Amount ($) | | Value ($) |
| Food, Beverage & | | | | | |
| Tobacco (continued) | | | | | |
| Del Monte Foods, | | | | | |
| Gtd. Notes | 7.63 | 2/15/19 | 2,275,000 | b | 2,309,125 |
| Michael Foods, | | | | | |
| Gtd. Notes | 9.75 | 7/15/18 | 5,955,000 | b | 6,401,625 |
| | | | | | 13,530,530 |
| Gaming—3.0% | | | | | |
| Caesars Entertainment Operating, | | | | | |
| Scd. Notes | 10.00 | 12/15/18 | 12,095,000 | a | 10,976,213 |
| MGM Resorts International, | | | | | |
| Gtd. Notes | 10.00 | 11/1/16 | 7,565,000 | a,b | 8,037,812 |
| MGM Resorts International, | | | | | |
| Sr. Unscd. Notes | 11.38 | 3/1/18 | 3,815,000 | a | 4,301,413 |
| Penn National Gaming, | | | | | |
| Sr. Sub. Notes | 8.75 | 8/15/19 | 6,640,000 | a | 7,254,200 |
| | | | | | 30,569,638 |
| Health Care—5.9% | | | | | |
| Accellent, | | | | | |
| Gtd. Notes | 10.00 | 11/1/17 | 4,470,000 | | 4,402,950 |
| Alere, | | | | | |
| Gtd. Notes | 9.00 | 5/15/16 | 5,240,000 | | 5,482,350 |
| American Renal Associates Holdings, | | | | | |
| Sr. Unscd. Notes | 9.75 | 3/1/16 | 2,470,000 | a,b | 2,562,625 |
| Biomet, | | | | | |
| Gtd. Notes | 11.63 | 10/15/17 | 13,650,000 | a | 15,185,625 |
| CDRT Merger Sub, | | | | | |
| Gtd. Notes | 8.13 | 6/1/19 | 4,070,000 | a,b | 4,080,175 |
| Community Health Systems, | | | | | |
| Gtd. Notes | 8.88 | 7/15/15 | 890,000 | | 918,925 |
| DJO Finance, | | | | | |
| Gtd. Notes | 7.75 | 4/15/18 | 6,145,000 | b | 6,145,000 |
| HCA Holdings, | | | | | |
| Sr. Unscd. Notes | 7.75 | 5/15/21 | 11,200,000 | a,b | 11,676,000 |
| HCA, | | | | | |
| Sr. Scd. Notes | 7.25 | 9/15/20 | 2,870,000 | a | 3,096,012 |
| Iasis Healthcare, | | | | | |
| Sr. Notes | 8.38 | 5/15/19 | 2,835,000 | b | 2,806,650 |
12
| | | | | |
| | Coupon | Maturity | Principal | | |
| Bonds and Notes (continued) | Rate (%) | Date | Amount ($) | | Value ($) |
| Health Care (continued) | | | | | |
| Radiation Therapy Services, | | | | | |
| Gtd. Notes | 9.88 | 4/15/17 | 2,210,000 | a | 2,218,288 |
| STHI Holding, | | | | | |
| Scd. Notes | 8.00 | 3/15/18 | 2,175,000 | b | 2,218,500 |
| | | | | | 60,793,100 |
| Leisure—1.1% | | | | | |
| AMC Entertaiment Holdings, | | | | | |
| Sr. Sub. Notes | 9.75 | 12/1/20 | 4,165,000 | a,b | 4,279,538 |
| Cinemark USA, | | | | | |
| Sr. Sub. Notes | 7.38 | 6/15/21 | 4,200,000 | b | 4,200,000 |
| Palace Entertainment Holdings, | | | | | |
| Sr. Scd. Notes | 8.88 | 4/15/17 | 3,020,000 | b | 3,042,650 |
| | | | | | 11,522,188 |
| Media—6.0% | | | | | |
| Allbritton Communications, | | | | | |
| Sr. Unscd. Notes | 8.00 | 5/15/18 | 4,880,000 | | 4,989,800 |
| Clear Channel Communications, | | | | | |
| Sr. Unscd. Notes | 5.50 | 9/15/14 | 12,191,000 | a | 10,728,080 |
| Clear Channel Communications, | | | | | |
| Gtd. Notes | 9.00 | 3/1/21 | 5,085,000 | b | 4,894,313 |
| Clear Channel Communications, | | | | | |
| Gtd. Notes | 10.75 | 8/1/16 | 5,975,000 | a | 5,422,313 |
| Cumulus Media, | | | | | |
| Gtd. Notes | 7.75 | 5/1/19 | 5,630,000 | a,b | 5,461,100 |
| Gray Television, | | | | | |
| Scd. Notes | 10.50 | 6/29/15 | 8,020,000 | a | 8,380,900 |
| LBI Media, | | | | | |
| Gtd. Notes | 8.50 | 8/1/17 | 5,562,000 | a,b | 4,393,980 |
| LBI Media, | | | | | |
| Sr. Scd. Notes | 9.25 | 4/15/19 | 3,525,000 | b | 3,507,375 |
| Quebecor Media, | | | | | |
| Sr. Unscd. Notes | 7.75 | 3/15/16 | 4,875,000 | | 5,063,905 |
| Salem Communications, | | | | | |
| Scd. Notes | 9.63 | 12/15/16 | 4,482,000 | a | 4,745,317 |
| Sinclair Television Group, | | | | | |
| Scd. Notes | 9.25 | 11/1/17 | 3,885,000 | b | 4,283,213 |
| | | | | | 61,870,296 |
STATEMENT OF INVESTMENTS (Unaudited) (continued)
| | | | | |
| | Coupon | Maturity | Principal | | |
| Bonds and Notes (continued) | Rate (%) | Date | Amount ($) | | Value ($) |
| Metals Mining—5.2% | | | | | |
| American Rock Salt, | | | | | |
| Scd. Notes | 8.25 | 5/1/18 | 7,685,000 | b | 7,752,244 |
| Calcipar, | | | | | |
| Sr. Scd. Notes | 6.88 | 5/1/18 | 3,415,000 | b | 3,440,613 |
| Consol Energy, | | | | | |
| Gtd. Notes | 8.25 | 4/1/20 | 2,500,000 | | 2,737,500 |
| JMC Steel Group, | | | | | |
| Sr. Notes | 8.25 | 3/15/18 | 6,795,000 | b | 6,930,900 |
| Murray Energy, | | | | | |
| Scd. Notes | 10.25 | 10/15/15 | 6,580,000 | b | 6,941,900 |
| Severstal Columbus, | | | | | |
| Sr. Scd. Notes | 10.25 | 2/15/18 | 15,200,000 | a | 16,872,000 |
| Tube City IMS, | | | | | |
| Gtd. Notes | 9.75 | 2/1/15 | 9,120,000 | | 9,462,000 |
| | | | | | 54,137,157 |
| Paper—1.1% | | | | | |
| Clearwater Paper, | | | | | |
| Gtd. Notes | 7.13 | 11/1/18 | 5,465,000 | | 5,628,950 |
| Verso Paper Holdings, | | | | | |
| Gtd. Notes, Ser. B | 11.38 | 8/1/16 | 2,550,000 | a | 2,377,875 |
| Xerium Technologies, | | | | | |
| Gtd. Notes | 8.88 | 6/15/18 | 3,815,000 | b | 3,815,000 |
| | | | | | 11,821,825 |
| Printing & Publishing—.6% | | | | | |
| Cenveo, | | | | | |
| Scd. Notes | 8.88 | 2/1/18 | 5,965,000 | a | 5,815,875 |
| Retail—1.9% | | | | | |
| Affinity Group, | | | | | |
| Scd. Notes | 11.50 | 12/1/16 | 7,000,000 | a,b | 7,385,000 |
| Hillman Group, | | | | | |
| Gtd. Notes | 10.88 | 6/1/18 | 1,455,000 | a,b | 1,576,856 |
| Hillman Group, | | | | | |
| Gtd. Notes | 10.88 | 6/1/18 | 4,700,000 | | 5,093,625 |
| J. Crew Group, | | | | | |
| Sr. Notes | 8.13 | 3/1/19 | 4,600,000 | a,b | 4,450,500 |
| Neiman Marcus Group, | | | | | |
| Gtd. Notes | 10.38 | 10/15/15 | 1,160,000 | a | 1,223,800 |
| | | | | | 19,729,781 |
14
| | | | | |
| | Coupon | Maturity | Principal | | |
| Bonds and Notes (continued) | Rate (%) | Date | Amount ($) | | Value ($) |
| Retail-Food & Drug—1.0% | | | | | |
| Rite Aid, | | | | | |
| Gtd. Notes | 8.63 | 3/1/15 | 1,300,000 | a | 1,222,000 |
| Rite Aid, | | | | | |
| Gtd. Notes | 9.50 | 6/15/17 | 6,160,000 | a | 5,651,800 |
| Rite Aid, | | | | | |
| Scd. Notes | 10.38 | 7/15/16 | 2,780,000 | a | 2,967,650 |
| | | | | | 9,841,450 |
| Services—7.9% | | | | | |
| Aramark Holdings, | | | | | |
| Sr. Notes | 8.63 | 5/1/16 | 5,645,000 | a,b | 5,772,012 |
| Brickman Group Holdings, | | | | | |
| Sr. Notes | 9.13 | 11/1/18 | 9,143,000 | b | 9,257,288 |
| Cardtronics, | | | | | |
| Gtd. Notes | 8.25 | 9/1/18 | 6,030,000 | | 6,459,638 |
| Casella Waste Systems, | | | | | |
| Gtd. Notes | 7.75 | 2/15/19 | 6,900,000 | b | 6,951,750 |
| FTI Consulting, | | | | | |
| Gtd. Notes | 6.75 | 10/1/20 | 4,705,000 | | 4,775,575 |
| Garda World Security, | | | | | |
| Sr. Unscd. Notes | 9.75 | 3/15/17 | 4,485,000 | b | 4,765,313 |
| Geo Group, | | | | | |
| Gtd. Notes | 6.63 | 2/15/21 | 3,000,000 | a,b | 2,992,500 |
| Hapag-Lloyd, | | | | | |
| Gtd. Notes | 9.75 | 10/15/17 | 2,600,000 | a,b | 2,626,000 |
| Interactive Data, | | | | | |
| Gtd. Notes | 10.25 | 8/1/18 | 3,995,000 | b | 4,354,550 |
| Marquette Transportation Finance, | | | | | |
| Scd. Notes | 10.88 | 1/15/17 | 6,565,000 | | 6,647,063 |
| Mobile Mini, | | | | | |
| Gtd. Notes | 7.88 | 12/1/20 | 7,115,000 | a | 7,364,025 |
| Navios Maritime Acquisition, | | | | | |
| Sr. Scd. Notes | 8.63 | 11/1/17 | 4,700,000 | a | 4,653,000 |
| Navios Maritime Holdings, | | | | | |
| Sr. Scd. Notes | 8.88 | 11/1/17 | 2,005,000 | | 2,075,175 |
| Navios South American Logistics, | | | | | |
| Gtd. Notes | 9.25 | 4/15/19 | 4,105,000 | a,b | 4,156,313 |
| Ultrapetrol Bahamas, | | | | | |
| First Mortgage Notes | 9.00 | 11/24/14 | 4,262,000 | | 4,293,965 |
STATEMENT OF INVESTMENTS (Unaudited) (continued)
| | | | | |
| | Coupon | Maturity | Principal | | |
| Bonds and Notes (continued) | Rate (%) | Date | Amount ($) | | Value ($) |
| Services (continued) | | | | | |
| United Rentals North America, | | | | | |
| Gtd. Notes | 9.25 | 12/15/19 | 430,000 | | 468,700 |
| WCA Waste, | | | | | |
| Gtd. Notes | 7.50 | 6/15/19 | 4,680,000 | b | 4,697,550 |
| | | | | | 82,310,417 |
| Technology—7.1% | | | | | |
| CDW/CDW Finance, | | | | | |
| Gtd. Notes | 8.50 | 4/1/19 | 5,555,000 | b | 5,471,675 |
| CDW Finance, | | | | | |
| Sr. Scd. Notes | 8.00 | 12/15/18 | 4,890,000 | a,b | 5,195,625 |
| Ceridian, | | | | | |
| Gtd. Notes | 11.25 | 11/15/15 | 15,638,000 | a,c | 15,716,190 |
| Ceridian, | | | | | |
| Gtd. Notes | 12.25 | 11/15/15 | 14,091,490 | a | 14,373,320 |
| CommScope, | | | | | |
| Gtd. Notes | 8.25 | 1/15/19 | 8,025,000 | b | 8,305,875 |
| CPI International Acquisition, | | | | | |
| Sr. Notes | 8.00 | 2/15/18 | 3,410,000 | b | 3,239,500 |
| Eagle Parent, | | | | | |
| Sr. Notes | 8.63 | 5/1/19 | 6,890,000 | a,b | 6,674,687 |
| First Data, | | | | | |
| Scd. Notes | 8.25 | 1/15/21 | 3,199,000 | a,b | 3,151,015 |
| First Data, | | | | | |
| Gtd. Notes | 9.88 | 9/24/15 | 3,323,000 | | 3,427,773 |
| First Data, | | | | | |
| Gtd. Notes | 12.63 | 1/15/21 | 3,199,000 | b | 3,438,925 |
| Goodman Networks, | | | | | |
| Sr. Scd. Notes | 12.13 | 7/1/18 | 2,725,000 | b | 2,718,188 |
| Sungard Data Systems, | | | | | |
| Gtd. Notes | 10.63 | 5/15/15 | 1,960,000 | | 2,131,500 |
| | | | | | 73,844,273 |
| Telecommunications—9.9% | | | | | |
| Cincinnati Bell, | | | | | |
| Gtd. Notes | 8.38 | 10/15/20 | 5,485,000 | a | 5,485,000 |
| Digicel Group, | | | | | |
| Sr. Unscd. Notes | 8.88 | 1/15/15 | 13,135,000 | a,b | 13,496,212 |
16
| | | | | |
| | Coupon | Maturity | Principal | | |
| Bonds and Notes (continued) | Rate (%) | Date | Amount ($) | | Value ($) |
| Telecommunications (continued) | | | | | |
| Digicel Group, | | | | | |
| Sr. Unscd. Notes | 9.13 | 1/15/15 | 3,542,457 | b | 3,639,875 |
| Digicel Group, | | | | | |
| Sr. Unscd. Notes | 10.50 | 4/15/18 | 1,408,000 | b | 1,584,000 |
| Digicel, | | | | | |
| Sr. Unscd. Notes | 8.25 | 9/1/17 | 2,955,000 | b | 3,080,588 |
| Digicel, | | | | | |
| Sr. Unscd. Notes | 12.00 | 4/1/14 | 1,700,000 | b | 1,976,250 |
| EH Holding, | | | | | |
| Sr. Unscd. Notes | 7.63 | 6/15/21 | 1,720,000 | b | 1,763,000 |
| Intelsat Luxembourg, | | | | | |
| Gtd. Notes | 11.25 | 2/4/17 | 12,985,000 | | 13,975,106 |
| Sprint Capital, | | | | | |
| Gtd. Notes | 6.88 | 11/15/28 | 4,485,000 | | 4,271,963 |
| Sprint Capital, | | | | | |
| Gtd. Notes | 6.90 | 5/1/19 | 5,320,000 | a | 5,506,200 |
| Telesat Canada, | | | | | |
| Gtd. Notes | 11.00 | 11/1/15 | 2,565,000 | | 2,818,293 |
| Telesat Canada, | | | | | |
| Gtd. Notes | 12.50 | 11/1/17 | 2,360,000 | | 2,843,800 |
| West, | | | | | |
| Gtd. Notes | 7.88 | 1/15/19 | 3,250,000 | b | 3,160,625 |
| West, | | | | | |
| Gtd. Notes | 8.63 | 10/1/18 | 6,645,000 | b | 6,744,675 |
| Wind Acquisition Finance, | | | | | |
| Scd. Notes | 11.75 | 7/15/17 | 7,605,000 | b | 8,650,688 |
| Wind Acquisition Holdings Finance, | | | | | |
| Sr. Scd. Notes | 12.25 | 7/15/17 | 19,944,346 | b | 23,085,581 |
| | | | | | 102,081,856 |
| Utilities—3.3% | | | | | |
| AES, | | | | | |
| Sr. Notes | 7.38 | 7/1/21 | 2,835,000 | b | 2,881,069 |
| AES, | | | | | |
| Sr. Unscd. Notes | 9.75 | 4/15/16 | 3,765,000 | | 4,292,100 |
| Calpine, | | | | | |
| Sr. Scd. Notes | 7.50 | 2/15/21 | 2,650,000 | b | 2,716,250 |
STATEMENT OF INVESTMENTS (Unaudited) (continued)
| | | | | |
| | Coupon | Maturity | Principal | | |
| Bonds and Notes (continued) | Rate (%) | Date | Amount ($) | | Value ($) |
| Utilities (continued) | | | | | |
| Calpine, | | | | | |
| Sr. Scd. Notes | 7.88 | 1/15/23 | 5,045,000 | a,b | 5,202,655 |
| Dynegy Holdings, | | | | | |
| Sr. Unscd. Notes | 8.38 | 5/1/16 | 1,892,000 | a | 1,523,060 |
| GenOn Energy, | | | | | |
| Sr. Unscd. Notes | 9.50 | 10/15/18 | 7,570,000 | a | 7,910,650 |
| North American Energy Alliance, | | | | | |
| Scd. Notes | 10.88 | 6/1/16 | 2,935,000 | b | 3,243,175 |
| NRG Energy, | | | | | |
| Gtd. Notes | 7.63 | 5/15/19 | 6,875,000 | a,b | 6,857,812 |
| | | | | | 34,626,771 |
| Total Bonds and Notes | | | | | |
| (cost $942,154,800) | | | | | 974,066,869 |
| |
| Preferred Stocks—.9% | | | Shares | | Value ($) |
| Special Purpose Entity | | | | | |
| GMAC Capital Trust I, | | | | | |
| Ser. 2, Cum., 8.13% | | | | | |
| (cost $8,727,459) | | | 342,552 c | 8,769,331 |
| | | | Principal | | |
| Short-Term Investments—.1% | | | Amount ($) | | Value ($) |
| U.S. Treasury Bills; | | | | | |
| 0.09%, 11/17/11 | | | | | |
| (cost $828,726) | | | 829,000 | | 828,856 |
| |
| Other Investment—3.0% | | | Shares | | Value ($) |
| Registered Investment Company; | | | | | |
| Dreyfus Institutional Preferred | | | | | |
| Plus Money Market Fund | | | | | |
| (cost $31,485,000) | | | 31,485,000 d | 31,485,000 |
18
| | |
| Investment of Cash Collateral | | |
| for Securities Loaned—24.0% | Shares | Value ($) |
| Registered Investment Company; | | |
| Dreyfus Institutional Cash Advantage Fund | | |
| (cost $248,820,375) | 248,820,375 d | 248,820,375 |
| Total Investments (cost $1,232,016,360) | 122.1% | 1,263,970,431 |
| Liabilities, Less Cash and Receivables | (22.1%) | (228,901,433) |
| Net Assets | 100.0% | 1,035,068,998 |
|
| a Security, or portion thereof, on loan.At June 30, 2011, the value of the fund’s securities on loan was $239,018,444 |
| and the value of the collateral held by the fund was $248,914,029, consisting of cash collateral of $248,820,375 |
| and U.S. Government Agency securities valued at $93,654. |
| b Securities exempt from registration under Rule 144A of the Securities Act of 1933.These securities may be resold in |
| transactions exempt from registration, normally to qualified institutional buyers.At June 30, 2011, these securities |
| were valued at 487,371,812 or 47.1% of net assets. |
| c Variable rate security—interest rate subject to periodic change. |
| d Investment in affiliated money market mutual fund. |
| | | |
| Portfolio Summary (Unaudited)† | | |
| |
| | Value (%) | | Value (%) |
| Corporate Bonds | 94.1 | Preferred Stocks | .9 |
| Short-Term/ | | | |
| Money Market Investments | 27.1 | | 122.1 |
| |
| † Based on net assets. | | | |
| See notes to financial statements. | | | |
|
| STATEMENT OF ASSETS AND LIABILITIES |
| June 30, 2011 (Unaudited) |
| | | | |
| | | | Cost | Value |
| Assets ($): | | | | |
| Investments in securities—See Statement of Investments (including | | |
| securities on loan, valued at $239,018,444)—Note 1(c): | | |
| Unaffiliated issuers | | | 951,710,985 | 983,665,056 |
| Affiliated issuers | | | 280,305,375 | 280,305,375 |
| Cash denominated in foreign currencies | | 49 | 50 |
| Dividends and interest receivable | | | | 21,319,340 |
| Receivable for investment securities sold | | | 8,329,444 |
| Receivable for shares of Beneficial Interest subscribed | | 1,337,108 |
| Unrealized appreciation on swap contracts—Note 4 | | | 321,036 |
| Receivable from broker for swap transactions—Note 4 | | | 156,053 |
| | | | | 1,295,433,462 |
| Liabilities ($): | | | | |
| Due to The Dreyfus Corporation and affiliates—Note 3(b) | | 816,074 |
| Cash overdraft due to Custodian | | | | 3,154,505 |
| Liability for securities on loan—Note 1(c) | | | 248,820,375 |
| Payable for shares of Beneficial Interest redeemed | | | 3,550,999 |
| Payable for investment securities purchased | | | 2,779,539 |
| Swaps premium received—Note 4 | | | | 999,148 |
| Unrealized depreciation on swap contracts—Note 4 | | | 243,144 |
| Interest payable—Note 2 | | | | 680 |
| | | | | 260,364,464 |
| Net Assets ($) | | | | 1,035,068,998 |
| Composition of Net Assets ($): | | | | |
| Paid-in capital | | | | 1,150,434,157 |
| Accumulated distributions in excess of investment income—net | | (506,151) |
| Accumulated net realized gain (loss) on investments | | | (146,890,973) |
| Accumulated net unrealized appreciation (depreciation) on | | |
| investments, swap transactions and foreign currency transactions | | 32,031,965 |
| Net Assets ($) | | | | 1,035,068,998 |
| |
| |
| Net Asset Value Per Share | | | | |
| | Class A | Class B | Class C | Class I |
| Net Assets ($) | 356,596,010 | 5,446,048 | 129,954,736 | 543,072,204 |
| Shares Outstanding | 53,695,343 | 819,774 | 19,561,706 | 81,708,295 |
| Net Asset Value Per Share ($) | 6.64 | 6.64 | 6.64 | 6.65 |
| |
| See notes to financial statements. | | | | |
20
|
| STATEMENT OF OPERATIONS |
| Six Months Ended June 30, 2011 (Unaudited) |
| |
| Investment Income ($): | |
| Income: | |
| Interest | 46,294,746 |
| Income from securities lending—Note 1(c) | 254,076 |
| Dividends: | |
| Affiliated issuers | 17,476 |
| Total Income | 46,566,298 |
| Expenses: | |
| Management fee—Note 3(a) | 3,840,280 |
| Distribution and service fees—Note 3(b) | 1,154,583 |
| Trustees’ fees—Note 3(a) | 33,256 |
| Loan commitment fees—Note 2 | 11,345 |
| Interest expense—Note 2 | 680 |
| Total Expenses | 5,040,144 |
| Less—Trustees’ fees reimbursed by the Manager—Note 3(a) | (33,256) |
| Net Expenses | 5,006,888 |
| Investment Income—Net | 41,559,410 |
| Realized and Unrealized Gain (Loss) on Investments—Note 4 ($): | |
| Net realized gain (loss) on investments | 28,391,101 |
| Net realized gain (loss) on swap transactions | (676,503) |
| Net Realized Gain (Loss) | 27,714,598 |
| Net unrealized appreciation (depreciation) on | |
| investments and foreign currency transactions | (23,956,042) |
| Net unrealized appreciation (depreciation) on swap transactions | 77,892 |
| Net Unrealized Appreciation (Depreciation) | (23,878,150) |
| Net Realized and Unrealized Gain (Loss) on Investments | 3,836,448 |
| Net Increase in Net Assets Resulting from Operations | 45,395,858 |
| |
| See notes to financial statements. | |
STATEMENT OF CHANGES IN NET ASSETS
| | |
| | Six Months Ended | |
| | June 30, 2011 | Year Ended |
| | (Unaudited) | December 31, 2010 |
| Operations ($): | | |
| Investment income—net | 41,559,410 | 84,344,513 |
| Net realized gain (loss) on investments | 27,714,598 | 28,751,469 |
| Net unrealized appreciation | | |
| (depreciation) on investments | (23,878,150) | (3,163,302) |
| Net Increase (Decrease) in Net Assets | | |
| Resulting from Operations | 45,395,858 | 109,932,680 |
| Dividends to Shareholders from ($): | | |
| Investment income—net: | | |
| Class A Shares | (14,629,851) | (33,286,941) |
| Class B Shares | (277,213) | (1,356,850) |
| Class C Shares | (4,531,103) | (11,069,517) |
| Class I Shares | (23,023,115) | (44,108,787) |
| Total Dividends | (42,461,282) | (89,822,095) |
| Beneficial Interest Transactions ($): | | |
| Net proceeds from shares sold: | | |
| Class A Shares | 79,437,119 | 97,928,061 |
| Class B Shares | 96,471 | 352,891 |
| Class C Shares | 10,778,267 | 21,583,100 |
| Class I Shares | 103,466,919 | 258,158,429 |
| Dividends reinvested: | | |
| Class A Shares | 11,972,705 | 26,924,576 |
| Class B Shares | 205,504 | 992,798 |
| Class C Shares | 2,627,369 | 6,714,116 |
| Class I Shares | 9,807,500 | 15,399,278 |
| Cost of shares redeemed: | | |
| Class A Shares | (82,508,566) | (145,973,940) |
| Class B Shares | (4,977,786) | (13,948,913) |
| Class C Shares | (12,102,972) | (28,327,493) |
| Class I Shares | (115,336,270) | (140,494,086) |
| Increase (Decrease) in Net Assets from | | |
| Beneficial Interest Transactions | 3,466,260 | 99,308,817 |
| Total Increase (Decrease) in Net Assets | 6,400,836 | 119,419,402 |
| Net Assets ($): | | |
| Beginning of Period | 1,028,668,162 | 909,248,760 |
| End of Period | 1,035,068,998 | 1,028,668,162 |
| Undistributed (distributions in excess of) | | |
| investment income—net | (506,151) | 395,721 |
22
| | |
| | Six Months Ended | |
| | June 30, 2011 | Year Ended |
| | (Unaudited) | December 31, 2010 |
| Capital Share Transactions: | | |
| Class Aa | | |
| Shares sold | 11,788,254 | 15,151,222 |
| Shares issued for dividends reinvested | 1,771,162 | 4,168,352 |
| Shares redeemed | (12,255,410) | (22,612,119) |
| Net Increase (Decrease) in Shares Outstanding | 1,304,006 | (3,292,545) |
| Class Ba | | |
| Shares sold | 14,267 | 54,620 |
| Shares issued for dividends reinvested | 30,398 | 153,881 |
| Shares redeemed | (736,211) | (2,156,919) |
| Net Increase (Decrease) in Shares Outstanding | (691,546) | (1,948,418) |
| Class C | | |
| Shares sold | 1,597,879 | 3,327,504 |
| Shares issued for dividends reinvested | 388,800 | 1,039,667 |
| Shares redeemed | (1,793,461) | (4,389,798) |
| Net Increase (Decrease) in Shares Outstanding | 193,218 | (22,627) |
| Class I | | |
| Shares sold | 15,298,352 | 39,786,259 |
| Shares issued for dividends reinvested | 1,450,266 | 2,377,328 |
| Shares redeemed | (17,195,682) | (21,699,672) |
| Net Increase (Decrease) in Shares Outstanding | (447,064) | 20,463,915 |
|
| a During the period ended June 30, 2011, 254,067 Class B shares representing $1,721,480 were automatically |
| converted to 254,119 Class A shares and during the period ended December 31, 2010, 656,573 Class B shares |
| representing $4,251,782 were automatically converted to 656,762 Class A shares. |
See notes to financial statements.
FINANCIAL HIGHLIGHTS
The following tables describe the performance for each share class for the fiscal periods indicated.All information (except portfolio turnover rate) reflects financial results for a single fund share.Total return shows how much your investment in the fund would have increased (or decreased) during each period, assuming you had reinvested all dividends and distributions.These figures have been derived from the fund’s financial statements.
| | | | | | |
| Six Months Ended | | | | | |
| June 30, 2011 | | Year Ended December 31, | |
| Class A Shares | (Unaudited) | 2010 | 2009 | 2008 | 2007 | 2006 |
| Per Share Data ($): | | | | | | |
| Net asset value, | | | | | | |
| beginning of period | 6.62 | 6.48 | 5.06 | 6.92 | 7.33 | 7.24 |
| Investment Operations: | | | | | | |
| Investment income—neta | .26 | .59 | .54 | .50 | .49 | .49 |
| Net realized and unrealized | | | | | | |
| gain (loss) on investments | .02 | .17 | 1.43 | (1.82) | (.37) | .14 |
| Total from Investment Operations | .28 | .76 | 1.97 | (1.32) | .12 | .63 |
| Distributions: | | | | | | |
| Dividends from | | | | | | |
| investment income—net | (.26) | (.62) | (.55) | (.54) | (.53) | (.54) |
| Net asset value, end of period | 6.64 | 6.62 | 6.48 | 5.06 | 6.92 | 7.33 |
| Total Return (%)b | 4.19c | 12.50 | 40.43 | (20.17) | 2.03 | 8.66 |
| Ratios/Supplemental Data (%): | | | | | | |
| Ratio of total expenses | | | | | | |
| to average net assets | .96d | .96 | .96 | .96 | .96 | .95 |
| Ratio of net expenses | | | | | | |
| to average net assets | .95d | .95 | .95 | .95 | .95 | .95 |
| Ratio of net investment income | | | | | | |
| to average net assets | 7.54d | 9.05 | 8.86 | 7.89 | 6.78 | 6.76 |
| Portfolio Turnover Rate | 47.27c | 70.07 | 77.94 | 48.85 | 50.65 | 29.98 |
| Net Assets, end of period | | | | | | |
| ($ x 1,000) | 356,596 | 346,594 | 360,921 | 119,560 | 169,453 | 202,098 |
| |
| a | Based on average shares outstanding at each month end. |
| b | Exclusive of sales charge. |
| c | Not annualized. |
| d | Annualized. |
See notes to financial statements.
24
| | | | | | |
| Six Months Ended | | | | | |
| June 30, 2011 | | Year Ended December 31, | |
| Class B Shares | (Unaudited) | 2010 | 2009 | 2008 | 2007 | 2006 |
| Per Share Data ($): | | | | | | |
| Net asset value, | | | | | | |
| beginning of period | 6.62 | 6.48 | 5.06 | 6.93 | 7.34 | 7.24 |
| Investment Operations: | | | | | | |
| Investment income—neta | .23 | .53 | .49 | .46 | .45 | .45 |
| Net realized and unrealized | | | | | | |
| gain (loss) on investments | .03 | .20 | 1.45 | (1.82) | (.37) | .16 |
| Total from Investment Operations | .26 | .73 | 1.94 | (1.36) | .08 | .61 |
| Distributions: | | | | | | |
| Dividends from | | | | | | |
| investment income—net | (.24) | (.59) | (.52) | (.51) | (.49) | (.51) |
| Net asset value, end of period | 6.64 | 6.62 | 6.48 | 5.06 | 6.93 | 7.34 |
| Total Return (%)b | 3.94c | 11.94 | 39.78 | (20.69) | 1.53 | 8.12 |
| Ratios/Supplemental Data (%): | | | | | | |
| Ratio of total expenses | | | | | | |
| to average net assets | 1.46d | 1.46 | 1.46 | 1.46 | 1.46 | 1.45 |
| Ratio of net expenses | | | | | | |
| to average net assets | 1.45d | 1.45 | 1.45 | 1.45 | 1.45 | 1.45 |
| Ratio of net investment income | | | | | | |
| to average net assets | 7.09d | 8.48 | 8.35 | 7.31 | 6.24 | 6.25 |
| Portfolio Turnover Rate | 47.27c | 70.07 | 77.94 | 48.85 | 50.65 | 29.98 |
| Net Assets, end of period | | | | | | |
| ($ x 1,000) | 5,446 | 10,002 | 22,434 | 17,568 | 39,892 | 67,834 |
| |
| a | Based on average shares outstanding at each month end. |
| b | Exclusive of sales charge. |
| c | Not annualized. |
| d | Annualized. |
See notes to financial statements.
FINANCIAL HIGHLIGHTS (continued)
| | | | | | |
| Six Months Ended | | | | | |
| June 30, 2011 | | Year Ended December 31, | |
| Class C Shares | (Unaudited) | 2010 | 2009 | 2008 | 2007 | 2006 |
| Per Share Data ($): | | | | | | |
| Net asset value, | | | | | | |
| beginning of period | 6.62 | 6.48 | 5.06 | 6.93 | 7.34 | 7.24 |
| Investment Operations: | | | | | | |
| Investment income—neta | .23 | .54 | .50 | .45 | .43 | .43 |
| Net realized and unrealized | | | | | | |
| gain (loss) on investments | .02 | .18 | 1.42 | (1.83) | (.36) | .16 |
| Total from Investment Operations | .25 | .72 | 1.92 | (1.38) | .07 | .59 |
| Distributions: | | | | | | |
| Dividends from | | | | | | |
| investment income—net | (.23) | (.58) | (.50) | (.49) | (.48) | (.49) |
| Net asset value, end of period | 6.64 | 6.62 | 6.48 | 5.06 | 6.93 | 7.34 |
| Total Return (%)b | 3.81c | 11.66 | 39.41 | (20.89) | 1.28 | 7.85 |
| Ratios/Supplemental Data (%): | | | | | | |
| Ratio of total expenses | | | | | | |
| to average net assets | 1.71d | 1.71 | 1.71 | 1.71 | 1.71 | 1.70 |
| Ratio of net expenses | | | | | | |
| to average net assets | 1.70d | 1.70 | 1.70 | 1.70 | 1.70 | 1.70 |
| Ratio of net investment income | | | | | | |
| to average net assets | 6.80d | 8.31 | 8.15 | 7.12 | 6.02 | 6.01 |
| Portfolio Turnover Rate | 47.27c | 70.07 | 77.94 | 48.85 | 50.65 | 29.98 |
| Net Assets, end of period | | | | | | |
| ($ x 1,000) | 129,955 | 128,173 | 125,724 | 34,374 | 53,294 | 65,728 |
| |
| a | Based on average shares outstanding at each month end. |
| b | Exclusive of sales charge. |
| c | Not annualized. |
| d | Annualized. |
See notes to financial statements.
26
| | | | | | |
| Six Months Ended | | | | | |
| June 30, 2011 | | Year Ended December 31, | |
| Class I Shares | (Unaudited) | 2010 | 2009 | 2008 | 2007a | 2006 |
| Per Share Data ($): | | | | | | |
| Net asset value, | | | | | | |
| beginning of period | 6.62 | 6.49 | 5.06 | 6.92 | 7.33 | 7.24 |
| Investment Operations: | | | | | | |
| Investment income—netb | .26 | .60 | .54 | .51 | .52 | .51 |
| Net realized and unrealized | | | | | | |
| gain (loss) on investments | .04 | .17 | 1.45 | (1.82) | (.38) | .14 |
| Total from Investment Operations | .30 | .77 | 1.99 | (1.31) | .14 | .65 |
| Distributions: | | | | | | |
| Dividends from | | | | | | |
| investment income—net | (.27) | (.64) | (.56) | (.55) | (.55) | (.56) |
| Net asset value, end of period | 6.65 | 6.62 | 6.49 | 5.06 | 6.92 | 7.33 |
| Total Return (%) | 4.48c | 12.59 | 40.99 | (20.06) | 2.29 | 8.92 |
| Ratios/Supplemental Data (%): | | | | | | |
| Ratio of total expenses | | | | | | |
| to average net assets | .71d | .71 | .71 | .72 | .71 | .70 |
| Ratio of net expenses | | | | | | |
| to average net assets | .70d | .70 | .70 | .69 | .70 | .70 |
| Ratio of net investment income | | | | | | |
| to average net assets | 7.78d | 9.26 | 9.20 | 9.43 | 7.01 | 7.01 |
| Portfolio Turnover Rate | 47.27c | 70.07 | 77.94 | 48.85 | 50.65 | 29.98 |
| Net Assets, end of period | | | | | | |
| ($ x 1,000) | 543,072 | 543,899 | 400,170 | 183,546 | 17,368 | 18,059 |
| |
| a | Effective June 1, 2007, Class R shares were redesignated as Class I shares. |
| b | Based on average shares outstanding at each month end. |
| c | Not annualized. |
| d | Annualized. |
See notes to financial statements.
NOTES TO FINANCIAL STATEMENTS (Unaudited)
NOTE 1—Significant Accounting Policies:
Dreyfus HighYield Fund (the “fund”) is a separate diversified series of The Dreyfus/Laurel Funds Trust (the “Trust”), which is registered under the Investment Company Act of 1940, as amended (the “Act”), as an open-end management investment company and operates as a series company currently offering six series, including the fund. The fund’s investment objective seeks to maximize total return, consisting of capital appreciation and current income.The Dreyfus Corporation (the “Manager” or “Dreyfus”), a wholly-owned subsidiary ofThe Bank of New York Mellon Corporation (“BNY Mellon”), serves as the fund’s investment adviser.
MBSC Securities Corporation (the “Distributor”), a wholly-owned subsidiary of the Manager, is the distributor of the fund’s shares. The fund is authorized to issue an unlimited number of shares of Beneficial Interest in each of the following classes of shares: Class A, Class B, Class C and Class I. Class A, Class B and Class C shares are sold primarily to retail investors through financial intermediaries and bear a distribution fee and/or shareholder services fee. Class A shares are sold with a front-end sales charge, while Class B and Class C shares are subject to a contingent deferred sales charge (“CDSC”). Class B shares automatically convert to Class A shares after six years.The fund no longer offers Class B shares, except in connection with dividend reinvestment and permitted exchanges of Class B shares. Class I shares are sold primarily to bank trust departments and other financial service providers (including The Bank of New York Mellon, a subsidiary of BNY Mellon and an affiliate of Dreyfus), acting on behalf of customers having a qualified trust or investment account or relationship at such institution, and bear no distribution or services fees. Class I shares are offered without a front-end sales charge or CDSC. Other differences between the classes include the services offered to and the expenses borne by each class, the allocation of certain transfer agency costs and certain voting rights.
28
Income, expenses (other than expenses attributable to a specific class), and realized and unrealized gains or losses on investments are allocated to each class of shares based on its relative net assets.
TheTrust accounts separately for the assets, liabilities and operations of each series. Expenses directly attributable to each series are charged to that series’ operations; expenses which are applicable to all series are allocated among them on a pro rata basis.
The Financial Accounting Standards Board (“FASB”) Accounting Standards Codification (“ASC”) is the exclusive reference of authoritative U.S. generally accepted accounting principles (“GAAP”) recognized by the FASB to be applied by nongovernmental entities. Rules and interpretive releases of the Securities and Exchange Commission (“SEC”) under authority of federal laws are also sources of authoritative GAAP for SEC registrants. The fund’s financial statements are prepared in accordance with GAAP, which may require the use of management estimates and assumptions.Actual results could differ from those estimates.
(a) Portfolio valuation: Investments in securities excluding short-term investments (other than U.S.Treasury Bills) and swaps are valued each business day by an independent pricing service (the “Service”) approved by the Board of Trustees. Investments for which quoted bid prices are readily available and are representative of the bid side of the market in the judgment of the Service are valued at the mean between the quoted bid prices (as obtained by the Service from dealers in such securities) and asked prices (as calculated by the Service based upon its evaluation of the market for such securities). Other investments (which constitute a majority of the portfolio securities) are valued as determined by the Service, based on methods which include consideration of: yields or prices of securities of comparable quality, coupon, maturity and type; indications as to values from dealers; and general market conditions. Restricted securities, as well as securities or other assets for
NOTES TO FINANCIAL STATEMENTS (Unaudited) (continued)
which recent market quotations are not readily available and are not valued by a pricing service approved by the Board of Trustees, or are determined by the fund not to reflect accurately fair value, are valued at fair value as determined in good faith under the direction of the Board of Trustees. The factors that may be considered when fair valuing a security include fundamental analytical data, the nature and duration of restrictions on disposition, an evaluation of the forces that influence the market in which the securities are purchased and sold and public trading in similar securities of the issuer or comparable issuers. Short-term investments, excluding U.S.Treasury Bills, are carried at amortized cost, which approximates market value. Registered investment companies that are not traded on an exchange are valued at their net asset value. Investments in swap transactions are valued each business day by a pricing service approved by the Board of Trustees. Swaps are valued by the service by using a swap pricing model which incorporates among other factors, default probabilities, recovery rates, credit curves of the underlying issuer and swap spreads on interest rates. Investments denominated in foreign currencies are translated to U.S. dollars at the prevailing rates of exchange.
The fair value of a financial instrument is the amount that would be received to sell an asset or paid to transfer a liability in an orderly transaction between market participants at the measurement date (i.e. the exit price). GAAP establishes a fair value hierarchy that prioritizes the inputs of valuation techniques used to measure fair value.This hierarchy gives the highest priority to unadjusted quoted prices in active markets for identical assets or liabilities (Level 1 measurements) and the lowest priority to unobservable inputs (Level 3 measurements).
Additionally, GAAP provides guidance on determining whether the volume and activity in a market has decreased significantly and whether such a decrease in activity results in transactions that are not orderly. GAAP requires enhanced disclosures around valuation inputs and techniques used during annual and interim periods.
30
Various inputs are used in determining the value of the fund’s investments relating to fair value measurements.These inputs are summarized in the three broad levels listed below:
Level 1—unadjusted quoted prices in active markets for identical investments.
Level 2—other significant observable inputs (including quoted prices for similar investments, interest rates, prepayment speeds, credit risk, etc.).
Level 3—significant unobservable inputs (including the fund’s own assumptions in determining the fair value of investments).
The inputs or methodology used for valuing securities are not necessarily an indication of the risk associated with investing in those securities.
The following is a summary of the inputs used as of June 30, 2011 in valuing the fund’s investments:
| | | | |
| | | Level 2—Other | Level 3— | |
| | Level 1— | Significant | Significant | |
| | Unadjusted | Observable | Unobservable | |
| | Quoted Prices | Inputs | Inputs | Total |
| Assets ($) | | | | |
| Investments in Securities: | | | |
| Corporate Bonds† | — | 974,066,869 | — | 974,066,869 |
| Equity Securities— | | | | |
| Domestic† | — | 8,769,331 | — | 8,769,331 |
| Mutual Funds | 280,305,375 | — | — | 280,305,375 |
| U.S. Treasury | — | 828,856 | — | 828,856 |
| Swaps†† | — | 321,036 | — | 321,036 |
| Liabilities ($) | | | | |
| Investments in | | | | |
| Securities: | | | | |
| Swaps†† | — | (243,144) | — | (243,144) |
| |
| † | See Statement of Investments for additional detailed categorizations. |
| †† | Amount shown represents unrealized appreciation (depreciation) at period end. |
NOTES TO FINANCIAL STATEMENTS (Unaudited) (continued)
In January 2010, FASB issued Accounting Standards Update (“ASU”) No. 2010-06 “Improving Disclosures about FairValue Measurements”. The portions of ASU No. 2010-06 which require reporting entities to prepare new disclosures surrounding amounts and reasons for significant transfers in and out of Level 1 and Level 2 fair value measurements as well as inputs and valuation techniques used to measure fair value for both recurring and nonrecurring fair value measurements that fall in either Level 2 or Level 3 have been adopted by the fund. No significant transfers between Level 1 or Level 2 fair value measurements occurred at June 30, 2011.
In May 2011, FASB issued ASU No. 2011-04 “Amendments to Achieve Common Fair Value Measurement and Disclosure Requirements in GAAP and International Financial Reporting Standards (“IFRS”)”. ASU No. 2011-04 includes common requirements for measurement of and disclosure about fair value between GAAP and IFRS. ASU No. 2011-04 will require reporting entities to disclose the following information for fair value measurements categorized within Level 3 of the fair value hierarchy: quantitative information about the unobservable inputs used in the fair value measurement, the valuation processes used by the reporting entity and a narrative description of the sensitivity of the fair value measurement to changes in unobservable inputs and the interrelationships between those unobservable inputs. In addition,ASU No. 2011-04 will require reporting entities to make disclosures about amounts and reasons for all transfers in and out of Level 1 and Level 2 fair value measurements. The new and revised disclosures are effective for interim and annual reporting periods beginning after December 15, 2011. At this time, management is evaluating the implications of ASU No. 2011-04 and its impact on the financial statements.
(b) Foreign currency transactions: The fund does not isolate that portion of the results of operations resulting from changes in foreign exchange rates on investments from the fluctuations arising from changes in the market prices of securities held. Such fluctuations are included with the net realized and unrealized gain or loss on investments.
32
Net realized foreign exchange gains or losses arise from sales of foreign currencies, currency gains or losses realized on securities transactions between trade and settlement date, and the difference between the amounts of dividends, interest and foreign withholding taxes recorded on the fund’s books and the U.S. dollar equivalent of the amounts actually received or paid. Net unrealized foreign exchange gains and losses arise from changes in the value of assets and liabilities other than investments resulting from changes in exchange rates. Foreign currency gains and losses on investments are included with net realized and unrealized gain or loss on investments.
(c) Securities transactions and investment income: Securities transactions are recorded on a trade date basis. Realized gains and losses from securities transactions are recorded on the identified cost basis. Dividend income is recognized on the ex-dividend date and interest income, including, where applicable, accretion of discount and amortization of premium on investments, is recognized on the accrual basis.
Pursuant to a securities lending agreement withThe Bank of NewYork Mellon, the fund may lend securities to qualified institutions. It is the fund’s policy that, at origination, all loans are secured by collateral of at least 102% of the value of U.S. securities loaned and 105% of the value of foreign securities loaned. Collateral equivalent to at least 100% of the market value of securities on loan is maintained at all times. Collateral is either in the form of cash, which can be invested in certain money market mutual funds managed by the Manager, U.S. Government and Agency securities or letters of credit.The fund is entitled to receive all income on securities loaned, in addition to income earned as a result of the lending transaction.Although each security loaned is fully collateralized, the fund bears the risk of delay in recovery of, or loss of rights in, the securities loaned should a borrower fail to return the securities in a timely manner. During the period ended June 30, 2011,The Bank of New York Mellon earned $136,810 from lending portfolio securities, pursuant to the securities lending agreement.
NOTES TO FINANCIAL STATEMENTS (Unaudited) (continued)
(d) Affiliated issuers: Investments in other investment companies advised by Dreyfus are defined as “affiliated” in the Act.
The fund may invest in shares of certain affiliated investment companies also advised or managed by Dreyfus. Investments in affiliated investment companies for the period ended June 30, 2011 were as follows:
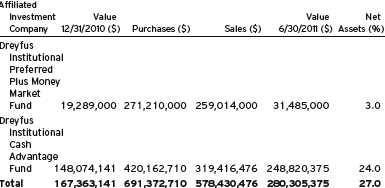
(e) Concentration of Risk: The fund invests primarily in debt securities. Failure of an issuer of the debt securities to make timely interest or principal payments, or a decline or the perception of a decline in the credit quality of a debt security, can cause the debt security’s price to fall, potentially lowering the fund’s share price. High yield (junk) bonds involve greater credit risk, including the risk of default, than investment grade bonds, and are considered predominantly speculative with respect to the issuer’s continuing ability to make principal and interest payments. In addition, the value of debt securities may decline due to general market conditions that are not specifically related to a particular company, such as real or perceived adverse economic conditions, changes in outlook for corporate earnings, changes in interest or currency rates or adverse investor sentiment. They may also decline because of factors that affect a particular industry.
(f) Dividends to shareholders: It is the policy of the fund to declare dividends daily from investment income-net. Such dividends are paid monthly. Dividends from net realized capital gains, if any, are normally declared and paid annually, but the fund may make distributions on a
34
more frequent basis to comply with the distribution requirements of the Internal Revenue Code of 1986, as amended (the “Code”).To the extent that net realized capital gains can be offset by capital loss carryovers, it is the policy of the fund not to distribute such gains. Income and capital gain distributions are determined in accordance with income tax regulations, which may differ from GAAP.
(g) Federal income taxes: It is the policy of the fund to continue to qualify as a regulated investment company, if such qualification is in the best interests of its shareholders, by complying with the applicable provisions of the Code, and to make distributions of taxable income sufficient to relieve it from substantially all federal income and excise taxes.
As of and during the period ended June 30, 2011, the fund did not have any liabilities for any uncertain tax positions.The fund recognizes interest and penalties, if any, related to uncertain tax positions as income tax expense in the Statement of Operations. During the period, the fund did not incur any interest or penalties.
Each of the tax years in the three-year period ended December 31, 2010 remains subject to examination by the Internal Revenue Service and state taxing authorities.
The fund has an unused capital loss carryover of $171,103,666 available for federal income tax purposes to be applied against future net securities profits, if any, realized subsequent December 31, 2010. If not applied, $72,493,638 of the carryover expires in fiscal 2011, $1,917,623 expires in fiscal 2012, $11,766,162 expires in fiscal 2013, $2,406,483 expires in fiscal 2014, $16,497,195 expires in fiscal 2015, $42,229,566 expires in fiscal 2016 and $23,792,999 expires in fiscal 2017. Based on certain provisions in the Code, various limitations regarding the future utilization of these carry forwards, brought forward as a result of the fund’s merger with the following funds apply: High Yield Total Fund, BNY Hamilton High Yield Fund and Dreyfus High Income Fund. It is possible that the fund will not be able to utilize most of its capital loss carryover prior to its expiration date.
NOTES TO FINANCIAL STATEMENTS (Unaudited) (continued)
Under the recently enacted Regulated Investment Company Modernization Act of 2010, the fund is permitted to carry forward capital losses incurred in taxable years beginning after December 22, 2010 (“post-enactment losses”) for an unlimited period. However, any post-enactment losses are required to be utilized before the utilization of losses incurred prior to the effective date of the Act.As a result of this ordering rule, capital loss carry forwards related to taxable years beginning prior to the effective date of the Act may be more likely to expire unused.
The tax character of distributions paid to shareholders during the fiscal year ended December 31, 2010 was as follows: ordinary income $89,822,095.The tax character of the current year distributions will be determined at the end of the current fiscal year.
NOTE 2—Bank Lines of Credit:
The fund participates with other Dreyfus-managed funds in a $225 million unsecured credit facility led by Citibank, N.A. and a $300 million unsecured credit facility provided by The Bank of New York Mellon (each, a “Facility”), each to be utilized primarily for temporary or emergency purposes, including the financing of redemptions. In connection therewith, the fund has agreed to pay its pro rata portion of commitment fees for each Facility. Interest is charged to the fund based on rates determined pursuant to the terms of the respective Facility at the time of borrowing.
The average amount of borrowings outstanding under the Facilities during the period ended June 30, 2011, was approximately $101,100 with a related weighted average annualized interest rate of 1.36%.
NOTE 3—Investment Management Fee and Other Transactions With Affiliates:
(a) Pursuant to an investment management agreement with the Manager, the Manager provides or arranges for one or more third parties and/or affiliates to provide investment advisory, administrative,
36
custody, fund accounting and transfer agency services to the fund.The Manager also directs the investments of the fund in accordance with its investment objective, policies and limitations. For these services, the fund is contractually obligated to pay the Manager a fee, calculated daily and paid monthly, at the annual rate of .70% of the value of the fund’s average daily net assets. Out of its fee, the Manager pays all of the expenses of the fund except brokerage fees, taxes, interest, commitment fees, Rule 12b-1 distribution fees and expenses, shareholder service fees, fees and expenses of non-interested Trustees (including counsel fees) and extraordinary expenses. In addition, the Manager is required to reduce its fee in an amount equal to the fund’s allocable portion of fees and expenses of the non-interested Trustees (including counsel fees). Each Trustee who is not an “interested person” of the Trust (as defined in the Act) receives $60,000 per annum, plus $7,000 per joint Board meeting of the Trust, The Dreyfus/Laurel Funds, Inc., The Dreyfus/Laurel Tax-Free Municipal Funds, Dreyfus Investment Funds and Dreyfus Funds, Inc. (collectively, the “Board Group Open-End Funds”) attended, $2,500 for separate in-person committee meetings attended which are not held in conjunction with a regularly scheduled Board meeting and $2,000 for Board meetings and separate committee meetings attended that are conducted by telephone. The Board Group Open-End Funds also reimburse eachTrustee who is not an “interested person” of theTrust (as defined in the Act) for travel and out-of-pocket expenses.With respect to Board meetings, the Chairman of the Board receives an additional 25% of such compensation (with the exception of reimbursable amounts).The Chair of each of the Board’s committees, unless the Chair also serves as Chair of the Board, receives $1,350 per applicable committee meeting. In the event that there is an in-person joint committee meeting or a joint telephone meeting of the Board Group Open-End Funds and Dreyfus HighYield Strategies Fund, the $2,500 or $2,000 fee, as applicable, is allocated between the Board Group Open-End Funds and Dreyfus HighYield Strategies Fund.TheTrust’s portion of these fees
NOTES TO FINANCIAL STATEMENTS (Unaudited) (continued)
and expenses are charged and allocated to each series based on net assets. Amounts required to be paid by the Trust directly to the non-interested Trustees, that would be applied to offset a portion of the management fee payable to the Manager, are in fact paid directly by the Manager to the non-interested Trustees.
During the period ended June 30, 2011, the Distributor retained $26,485 from commissions earned on sales of the fund’s Class A shares and $4,135 and $3,407 from CDSCs on redemptions of the fund’s Class B and Class C shares, respectively.
(b) Under separate Distribution Plans (the “Plans”) adopted pursuant to Rule 12b-1 under the Act, Class A shares pay annually up to .25% of the value of the average daily net assets to compensate the Distributor for shareholder servicing activities and expenses primarily intended to result in the sale of Class A shares. Class B and Class C shares pay the Distributor for distributing their shares at an aggregate annual rate of .50% and .75% of the value of the average daily net assets of Class B and Class C shares, respectively. Class B and Class C shares are also subject to a Service Plan adopted pursuant to Rule 12b-1 (the “Service Plan”), under which Class B and Class C shares pay the Distributor for providing certain services to the holders of their shares a fee at the annual rate of .25% of the value of the average daily net assets of Class B and Class C shares. During the period ended June 30, 2011, Class A, Class B and Class C shares were charged $474,935, $19,097 and $488,252, respectively, pursuant to their respective Plans. During the period ended June 30, 2011, Class B and Class C shares were charged $9,548 and $162,751, respectively, pursuant to the Service Plan.
Under its terms, the Plans and Service Plan shall remain in effect from year to year, provided such continuance is approved annually by a vote of a majority of those Trustees who are not “interested persons” of the Trust and who have no direct or indirect financial interest in the operation of or in any agreement related to the Plans or Service Plan.
38
The components of “Due to The Dreyfus Corporation and affiliates” in the Statement of Assets and Liabilities consist of: management fees $628,698, Rule 12b-1 distribution plan fees $159,421 and service plan fees $27,955.
NOTE 4—Securities Transactions:
The aggregate amount of purchases and sales (including paydowns) of investment securities, excluding short-term securities and swap transactions, during the period ended June 30, 2011, amounted to $499,596,667 and $506,102,206, respectively.
Swaps: The fund enters into swap agreements to exchange the interest rate on, or return generated by, one nominal instrument for the return generated by another nominal instrument.The fund enters into these agreements to hedge certain market or interest rate risks, to manage the interest rate sensitivity (sometimes called duration) of fixed income securities, to provide a substitute for purchasing or selling particular securities or to increase potential returns.
The fund accrues for the interim payments on swap contracts on a daily basis, with the net amount recorded within unrealized appreciation (depreciation) on swap contracts in the Statement of Assets and Liabilities. Once the interim payments are settled in cash, the net amount is recorded as realized gain (loss) on swaps, in addition to realized gain (loss) recorded upon the termination of swap contracts in the Statement of Operations. Upfront payments made and/or received by the fund, are recorded as an asset and/or liability in the Statement of Assets and Liabilities and are recorded as a realized gain or loss ratably over the contract’s term/event with the exception of forward starting interest rate swaps which are recorded as realized gains or losses on the termination date. Fluctuations in the value of swap contracts are recorded for financial statement purposes as unrealized appreciation or depreciation on swap transactions.
NOTES TO FINANCIAL STATEMENTS (Unaudited) (continued)
Credit Default Swaps: Credit default swaps involve commitments to pay a fixed interest rate in exchange for payment if a credit event affecting a third party (the referenced company, obligation or index) occurs. Credit events may include a failure to pay interest or principal, bankruptcy, or restructuring.The fund enters into these agreements to manage its exposure to the market or certain sectors of the market, to reduce its risk exposure to defaults of corporate and sovereign issuers, or to create exposure to corporate or sovereign issuers to which it is not otherwise exposed. For those credit default swaps in which the fund is paying a fixed rate, the fund is buying credit protection on the instrument. In the event of a credit event, the fund would receive the full notional amount for the reference obligation. For those credit default swaps in which the fund is receiving a fixed rate, the fund is selling credit protection on the underlying instrument.The maximum payouts for these contracts are limited to the notional amount of each swap. Credit default swaps may involve greater risks than if the fund had invested in the reference obligation directly and are subject to general market risk, liquidity risk, counterparty risk and credit risk.
The maximum potential amount of future payments (undiscounted) that a fund as a seller of protection could be required to make under a credit default swap agreement would be an amount equal to the notional amount of the agreement which may exceed the amount of unrealized appreciation or depreciation reflected in the Statement of Assets and Liabilities. Notional amounts of all credit default swap agreements are disclosed in the following chart, which summarizes open credit default swaps on index issues entered into by the fund. These potential amounts would be partially offset by any recovery values of the respective referenced obligations, underlying securities comprising the referenced index, upfront payments received upon entering into the agreement, or net amounts received from the settlement of buy protection credit default swap agreements entered into by the fund for the
40
same referenced entity or entities.The following summarizes open credit default swaps entered into by the fund at June 30, 2011:
| | | | | | |
| | | (Pay) | | | | |
| | | Receive | Implied | | Upfront | Unrealized |
| Reference | Notional | Fixed | Credit | Market | Premiums | Appreciation |
| Obligation | Amount ($)2 Rate (%) Spread (%)3 | Value ($) | Received ($) (Depreciation) ($) |
| |
| Purchase Contracts:1 | | | | | |
| Dow Jones | | | | | | |
| CDX.NA.HY.16 | | | | | | |
| Index | | | | | | |
| 6/20/2016† | 31,800,000a | (5.00) | 4.62 | (551,713) | (872,749) | 321,036 |
| Dow Jones | | | | | | |
| CDX.NA.HY.16 | | | | | | |
| Index | | | | | | |
| 6/20/2016† | 10,650,000b | (5.00) | 4.62 | (184,771) | (46,568) | (138,203) |
| Dow Jones | | | | | | |
| CDX.NA.HY.16 | | | | | | |
| Index | | | | | | |
| 6/20/2016† | 10,650,000b | (5.00) | 4.62 | (184,772) | (79,831) | (104,941) |
| Gross Unrealized | | | | | |
| Appreciation | | | | | | 321,036 |
| Gross Unrealized | | | | | |
| Depreciation | | | | | | (243,144) |
| |
| † Expiration Date | | | | | |
| Counterparty: | | | | | | |
| |
| a | Deutsche Bank |
| b | JP Morgan |
| 1 | If the fund is a buyer of protection and a credit event occurs, as defined under the terms of the |
| | swap agreement, the fund will either (i) receive from the seller of protection an amount equal to the |
| | notional amount of the swap and deliver the reference obligation or (ii) receive a net settlement |
| | amount in the form of cash or securities equal to the notional amount of the swap less the recovery |
| | value of the reference obligation. |
| 2 | The maximum potential amount the fund could be required to pay as a seller of credit protection |
| | or receive as a buyer of credit protection if a credit event occurs as defined under the terms of the |
| | swap agreement. |
| 3 | Implied credit spreads, represented in absolute terms, utilized in determining the market value as of |
| | the period end serve as an indicator of the current status of the payment/performance risk and |
| | represent the likelihood of risk of default for the credit derivative.The credit spread of a particular |
| | referenced entity reflects the cost of buying/selling protection and may include upfront payments |
| | required to be made to enter into the agreement.Wider credit spreads represent a deterioration of |
| | the referenced entity's credit soundness and a greater likelihood of risk of default or other credit |
| | event occurring as defined under the terms of the agreement.A credit spread identified as |
| | Defaulted indicates a credit event has occurred for the referenced entity. |
NOTES TO FINANCIAL STATEMENTS (Unaudited) (continued)
GAAP requires disclosure for (i) the nature and terms of the credit derivative, reasons for entering into the credit derivative, the events or circumstances that would require the seller to perform under the credit derivative, and the current status of the payment/performance risk of the credit derivative, (ii) the maximum potential amount of future payments (undiscounted) the seller could be required to make under the credit derivative, (iii) the fair value of the credit derivative, and (iv) the nature of any recourse provisions and assets held either as collateral or by third parties. All required disclosures have been made and are incorporated within the current period as part of the Notes to the Statement of Investments and disclosures within this Note.
The following summarizes the average notional value of swap contracts outstanding during the period ended June 30, 2011:
| |
| | Average Notional Value ($) |
| Credit default swap contracts | 44,250,000 |
At June 30, 2011, accumulated net unrealized appreciation on investments was $31,954,071, consisting of $38,342,775 gross unrealized appreciation and $6,388,704 gross unrealized depreciation.
At June 30, 2011, the cost of investments for federal income tax purposes was substantially the same as the cost for financial reporting purposes (see the Statement of Investments).
42
|
| INFORMATION ABOUT THE RENEWAL OF THE FUND’S |
| INVESTMENT MANAGEMENT AGREEMENT (Unaudited) |
At a meeting of the fund’s Board of Trustees held on February 15-16, 2011, the Board considered the renewal of the fund’s Investment Management Agreement pursuant to which Dreyfus provides the fund with investment advisory and administrative services (the“Agreement”). The Board members, none of whom are “interested persons” (as defined in the Investment Company Act of 1940, as amended) of the fund, were assisted in their review by independent legal counsel and met with counsel in executive session separate from representatives of Dreyfus. In considering the renewal of the Agreement, the Board considered all factors that it believed to be relevant, including those discussed below.The Board did not identify any one factor as dispositive, and each Board member may have attributed different weights to the factors considered.
Analysis of Nature, Extent, and Quality of Services Provided to the Fund.The Board members considered information previously provided to them in presentations from representatives of Dreyfus regarding the nature, extent, and quality of the services provided to funds in the Dreyfus fund complex, and representatives of Dreyfus confirmed that there had been no material changes in this information. Dreyfus provided the number of open accounts in the fund, the fund’s asset size and the allocation of fund assets among distribution channels. Dreyfus also had previously provided information regarding the diverse intermediary relationships and distribution channels of funds in the Dreyfus fund complex and Dreyfus’ corresponding need for broad, deep, and diverse resources to be able to provide ongoing shareholder services to each distribution channel, including the distribution channel(s) for the fund.
The Board members also considered research support available to, and portfolio management capabilities of, the fund’s portfolio management personnel and that Dreyfus also provides oversight of day-to-day fund operations, including fund accounting and administration and assistance in meeting legal and regulatory requirements.The Board members also considered Dreyfus’ extensive administrative, accounting, and compliance infrastructures.
|
| INFORMATION ABOUT THE RENEWAL OF THE FUND’S INVESTMENT |
| MANAGEMENT AGREEMENT (Unaudited) (continued) |
Comparative Analysis of the Fund’s Performance and Management Fee and Expense Ratio. The Board members reviewed reports prepared by Lipper, Inc. (“Lipper”), an independent provider of investment company data, which included information comparing (1) the fund’s performance with the performance of a group of comparable funds (the “Performance Group”) and with a broader group of funds (the “Performance Universe”), all for various periods ended December 31, 2010, and (2) the fund’s actual and contractual management fees and total expenses with those of a group of comparable funds (the “Expense Group”) and with a broader group of funds (the “Expense Universe”), the information for which was derived in part from fund financial statements available to Lipper as of June 30, 2010. Dreyfus previously had furnished the Board with a description of the methodology Lipper used to select the Performance Group and Performance Universe and the Expense Group and Expense Universe.
Dreyfus representatives stated that the usefulness of performance comparisons may be affected by a number of factors, including different investment limitations that may be applicable to the fund and comparison funds.They also noted that performance generally should be considered over longer periods of time, although it is possible that long-term performance can be adversely affected by even one period of significant underperformance so that a single investment decision or theme has the ability to affect disproportionately long term perfor-mance.The Board members discussed the results of the comparisons and noted that the fund’s total return performance was below the Performance Group median, except for the 4-year period ended December 31, 2010, and variously above and below the Performance Universe median for the various periods.
The Board also noted that the fund’s yield performance was variously above, at or below the Performance Group median for the 10 one-year periods ended December 31st and above the Performance Universe median for all ten one-year periods ended December 31st. Dreyfus also provided a comparison of the fund’s calendar year total returns to the returns of the fund’s benchmark index.
44
The Board members also reviewed the range of actual and contractual management fees and total expenses of the Expense Group and Expense Universe funds and discussed the results of the comparisons.Taking into consideration the fund’s “unitary” fee structure, they noted that the fund’s contractual management fee was above the Expense Group median, the fund’s actual management fee was above the Expense Group and Expense Universe medians and the fund’s total expenses were below the Expense Group and Expense Universe medians.
Representatives of Dreyfus reviewed with the Board members the management or investment advisory fees (1) paid by funds advised or administered by Dreyfus that are in the same Lipper category as the fund and (2) paid to Dreyfus or the Dreyfus-affiliated primary employer of the fund’s primary portfolio manager for advising any separate accounts and/or other types of client portfolios that are considered to have similar investment strategies and policies as the fund (the “Similar Clients”), and explained the nature of the Similar Clients. They discussed differences in fees paid and the relationship of the fees paid in light of any differences in the services provided and other relevant factors, noting the fund’s “unitary” fee structure. The Board members considered the relevance of the fee information provided for the Similar Clients to evaluate the appropriateness and reasonableness of the fund’s management fee.
Analysis of Profitability and Economies of Scale. Dreyfus’ representatives reviewed the expenses allocated and profit received by Dreyfus and the resulting profitability percentage for managing the fund, and the method used to determine the expenses and profit. The Board concluded that the profitability results were not unreasonable, given the services rendered and service levels provided by Dreyfus.The Board previously had been provided with information prepared by an independent consulting firm regarding Dreyfus’ approach to allocating costs to, and determining the profitability of, individual funds and the entire Dreyfus fund complex. The consulting firm also had analyzed where any economies of scale might emerge in connection with the management of a fund.
|
| INFORMATION ABOUT THE RENEWAL OF THE FUND’S INVESTMENT |
| MANAGEMENT AGREEMENT (Unaudited) (continued) |
The Board’s counsel stated that the Board members should consider the profitability analysis (1) as part of their evaluation of whether the fees under the Agreement bear a reasonable relationship to the mix of services provided by Dreyfus, including the nature, extent and quality of such services, and (2) in light of the relevant circumstances for the fund and the extent to which economies of scale would be realized if the fund grows and whether fee levels reflect these economies of scale for the benefit of fund shareholders. Dreyfus representatives noted that, as a result of shared and allocated costs among funds in the Dreyfus funds complex, the extent of economies of scale could depend substantially on the level of assets in the complex as a whole, so that increases and decreases in complex-wide assets can affect potential economies of scale in a manner that is disproportionate to, or even in the opposite direction from, changes in the fund’s asset level. The Board members also considered potential benefits to Dreyfus from acting as investment adviser and noted that there were no soft dollar arrangements in effect for trading the fund’s investments.
At the conclusion of these discussions, the Board agreed that it had been furnished with sufficient information to make an informed business decision with respect to the renewal of the Agreement. Based on the discussions and considerations as described above, the Board concluded and determined as follows.
The Board concluded that the nature, extent and quality of the services provided by Dreyfus are adequate and appropriate.
The Board generally was satisfied with the fund’s yield performance, but was somewhat concerned with the fund’s relative total return performance and agreed to closely monitor the performance.
The Board concluded that the fee paid to Dreyfus was reasonable in light of the considerations described above.
46
The Board determined that the economies of scale which may accrue to Dreyfus and its affiliates in connection with the management of the fund had been adequately considered by Dreyfus in connection with the fee rate charged to the fund pursuant to the Agreement and that, to the extent in the future it were determined that material economies of scale had not been shared with the fund, the Board would seek to have those economies of scale shared with the fund.
The Board members considered these conclusions and determinations, along with information received on a routine and regular basis throughout the year. In addition, it should be noted that the Board’s consideration of the contractual fee arrangements for this fund had the benefit of a number of years of reviews of prior or similar agreements during which lengthy discussions took place between the Board members and Dreyfus representatives. Certain aspects of the arrangements may receive greater scrutiny in some years than in others, and the Board members’ conclusions may be based, in part, on their consideration of the same or similar arrangements in prior years. The Board members determined that renewal of the Agreement was in the best interests of the fund and its shareholders.
For More Information
Telephone Call your financial representative or 1-800-DREYFUS
Mail The Dreyfus Family of Funds, 144 Glenn Curtiss Boulevard, Uniondale, NY 11556-0144
The fund files its complete schedule of portfolio holdings with the Securities and Exchange Commission (“SEC”) for the first and third quarters of each fiscal year on Form N-Q. The fund’s Forms N-Q are available on the SEC’s website at http://www.sec.gov and may be reviewed and copied at the SEC’s Public Reference Room in Washington, DC. Information on the operation of the Public Reference Room may be obtained by calling 1-800-SEC-0330.
A description of the policies and procedures that the fund uses to determine how to vote proxies relating to portfolio securities, and information regarding how the fund voted these proxies for the most recent 12-month period ended June 30 is available at http://www.dreyfus.com and on the SEC’s website at http://www.sec.gov. The description of the policies and procedures is also available without charge, upon request, by calling 1-800-DREYFUS.

Item 2. Code of Ethics.
Not applicable.
Item 3. Audit Committee Financial Expert.
Not applicable.
Item 4. Principal Accountant Fees and Services.
Not applicable.
Item 5. Audit Committee of Listed Registrants.
Not applicable.
Item 6. Investments.
(a) Not applicable.
Item 7. Disclosure of Proxy Voting Policies and Procedures for Closed-End Management Investment Companies.
Not applicable.
Item 8. Portfolio Managers of Closed-End Management Investment Companies.
Not applicable.
Item 9. Purchases of Equity Securities by Closed-End Management Investment Companies and Affiliated Purchasers.
Not applicable. [CLOSED END FUNDS ONLY]
Item 10. Submission of Matters to a Vote of Security Holders.
There have been no material changes to the procedures applicable to Item 10.
Item 11. Controls and Procedures.
(a) The Registrant's principal executive and principal financial officers have concluded, based on their evaluation of the Registrant's disclosure controls and procedures as of a date within 90 days of the filing date of this report, that the Registrant's disclosure controls and procedures are reasonably designed to ensure that information required to be disclosed by the Registrant on Form N-CSR is recorded, processed, summarized and reported within the required time periods and that information required to be disclosed by the Registrant in the reports that it files or submits on Form N-CSR is accumulated and communicated to the Registrant's management, including its principal executive and principal financial officers, as appropriate to allow timely decisions regarding required disclosure.
(b) There were no changes to the Registrant's internal control over financial reporting that occurred during the second fiscal quarter of the period covered by this report that have materially affected, or are reasonably likely to materially affect, the Registrant's internal control over financial reporting.
Item 12. Exhibits.
(a)(1) Not applicable.
(a)(2) Certifications of principal executive and principal financial officers as required by Rule 30a-2(a) under the Investment Company Act of 1940.
(a)(3) Not applicable.
(b) Certification of principal executive and principal financial officers as required by Rule 30a-2(b) under the Investment Company Act of 1940.
SIGNATURES
Pursuant to the requirements of the Securities Exchange Act of 1934 and the Investment Company Act of 1940, the Registrant has duly caused this Report to be signed on its behalf by the undersigned, thereunto duly authorized.
The Dreyfus/Laurel Funds Trust
By: /s/ Bradley J. Skapyak |
Bradley J. Skapyak, President |
Date: | August 19, 2011 |
|
Pursuant to the requirements of the Securities Exchange Act of 1934 and the Investment Company Act of 1940, this Report has been signed below by the following persons on behalf of the Registrant and in the capacities and on the dates indicated. |
|
By: /s/ Bradley J. Skapyak |
Bradley J. Skapyak, President |
Date: | August 19, 2011 |
|
By: /s/ James Windels |
James Windels, Treasurer |
Date: | August 19, 2011 |
|
EXHIBIT INDEX
(a)(2) Certifications of principal executive and principal financial officers as required by Rule 30a-2(a) under the Investment Company Act of 1940. (EX-99.CERT)
(b) Certification of principal executive and principal financial officers as required by Rule 30a-2(b) under the Investment Company Act of 1940. (EX-99.906CERT)