UNITED STATES
SECURITIES AND EXCHANGE COMMISSION
Washington, D.C. 20549
FORM N-CSR
CERTIFIED SHAREHOLDER REPORT OF REGISTERED MANAGEMENT
INVESTMENT COMPANIES
Investment Company Act file number | 811- 00524 |
| |
| The Dreyfus/Laurel Funds Trust | |
| (Exact name of Registrant as specified in charter) | |
| | |
| c/o The Dreyfus Corporation 200 Park Avenue New York, New York 10166 | |
| (Address of principal executive offices) (Zip code) | |
| | |
| John Pak, Esq. 200 Park Avenue New York, New York 10166 | |
| (Name and address of agent for service) | |
|
Registrant's telephone number, including area code: | (212) 922-6000 |
| |
Date of fiscal year end: | 5/31 | |
Date of reporting period: | 5/31/2015 | |
| | | | | | | |
The following N-CSR relates only to Dreyfus Equity Income Fund and Dreyfus Emerging Markets Debt Local Currency Fund and does not affect the other series of the Registrant, which have different fiscal year ends and, therefore, different N-CSR reporting requirements. Separate N-CSR Forms will be filed for those series, as appropriate.
FORM N-CSR
Item 1. Reports to Stockholders.
|
| Dreyfus |
| Equity Income Fund |
ANNUAL REPORT May 31, 2015

Save time. Save paper. View your next shareholder report online as soon as it’s available. Log into www.dreyfus.com and sign up for Dreyfus eCommunications. It’s simple and only takes a few minutes.
The views expressed in this report reflect those of the portfolio manager only through the end of the period covered and do not necessarily represent the views of Dreyfus or any other person in the Dreyfus organization. Any such views are subject to change at any time based upon market or other conditions and Dreyfus disclaims any responsibility to update such views.These views may not be relied on as investment advice and, because investment decisions for a Dreyfus fund are based on numerous factors, may not be relied on as an indication of trading intent on behalf of any Dreyfus fund.
|
| Not FDIC-Insured • Not Bank-Guaranteed • May Lose Value |
| | Contents |
| | THE FUND |
| 2 | A Letter from the President |
| 3 | Discussion of Fund Performance |
| 6 | Fund Performance |
| 8 | Understanding Your Fund’s Expenses |
| 8 | Comparing Your Fund’s Expenses With Those of Other Funds |
| 9 | Statement of Investments |
| 15 | Statement of Assets and Liabilities |
| 16 | Statement of Operations |
| 17 | Statement of Changes in Net Assets |
| 19 | Financial Highlights |
| 23 | Notes to Financial Statements |
| 34 | Report of Independent Registered Public Accounting Firm |
| 35 | Important Tax Information |
| 36 | Information About the Renewal of the Fund’s Management Agreement |
| 41 | Board Members Information |
| 43 | Officers of the Fund |
| | FOR MORE INFORMATION |
| | Back Cover |
Dreyfus
Equity Income Fund
The Fund
A LETTER FROM THE PRESIDENT
Dear Shareholder:
We are pleased to present this annual report for Dreyfus Equity Income Fund, covering the 12-month period from June 1, 2014, through May 31, 2015. For information about how the fund performed during the reporting period, as well as general market perspectives, we provide a Discussion of Fund Performance on the pages that follow.
The U.S. stock market encountered bouts of heightened volatility on its way to setting a series of new record highs during the reporting period. Stock prices were driven broadly higher over the second half of 2014 as U.S. corporate fundamentals benefited from a sustained economic recovery, which was fueled by strengthening labor markets, intensifying manufacturing activity, and greater consumer and business confidence. Gains moderated over the first five months of 2015, when investors worried that persistent economic weakness in overseas markets and a strengthening U.S. dollar might derail growth in the United States.
We remain optimistic regarding the long-term outlook for the U.S. economy. We believe the domestic economic recovery has resumed after a winter soft patch, energy prices have begun to rebound, foreign currencies recently have strengthened, and aggressively accommodative monetary policies from the world’s major central banks seem likely to address global economic weakness.While stocks stand to benefit from these conditions, valuations appear to have risen toward fair levels. Moreover, we believe expectations of domestic rate hikes and recently mixed corporate financial reports may have created uncertainty as to the pace of future gains. As always, we urge you to discuss these observations with your financial advisor, who can help you assess their implications for your investment portfolio.
Thank you for your continued confidence and support.

J. Charles Cardona
President
The Dreyfus Corporation
June 15, 2015
2
DISCUSSION OF FUND PERFORMANCE
For the reporting period of June 1, 2014, through May 31, 2015, as provided by C.Wesley Boggs, William S. Cazalet, CAIA, Ronald P. Gala, CFA, and Peter D. Goslin, CFA, Portfolio Managers
Fund and Market Performance Overview
For the 12-month period ended May 31, 2015, Dreyfus Equity Income Fund’s Class A shares produced a total return of 8.41%, Class C shares returned 7.59%, Class I shares returned 8.61%, and Class Y shares returned 8.50%.1 In comparison, the fund’s benchmark, the Standard & Poor’s 500® Composite Stock Price Index (the “S&P 500 Index”), provided a total return of 11.79% for the same period.2
Stocks advanced strongly in a recovering U.S. economy over the reporting period’s first half before posting more modest gains during the second half.The fund lagged its benchmark when dividend-paying stocks generally underperformed their more growth-oriented counterparts.The fund’s relative results also were hurt by security selection shortfalls in the consumer discretionary and financials sectors.
The Fund’s Investment Approach
The fund seeks total return consisting of capital appreciation and income.To pursue its goal, the fund invests primarily in equity securities, with a particular focus on dividend-paying stocks. When selecting securities, we use a computer model to identify and rank stocks within an industry or sector. Next, we generally select what we believe to be the most attractive of the higher ranked securities.We manage risk by diversifying the fund’s investments across companies and industries, seeking to limit the potential adverse impact of a decline in any one stock or industry.
Stocks Digested Gains in 2015 after Strong 2014 Rally
The U.S. economy rebounded strongly over the first half of the reporting period, supported by a strengthening labor market, low interest rates, increased manufacturing activity, and improved confidence among consumers and businesses. The sustained U.S. economic recovery stood in stark contrast to other developed nations, which remained mired in persistent economic weakness and deflationary pressures, including plummeting energy commodity prices during the fall of 2014.
The Fund 3
DISCUSSION OF FUND PERFORMANCE (continued)
The domestic economic expansion proved more uneven over the reporting period’s second half in the face of severe winter weather and a labor slowdown in West Coast ports. Economic weakness in international markets further weighed on economic activity when massive quantitative easing programs and lower interest rates in Europe and Japan caused the U.S. dollar to appreciate sharply against most foreign currencies, hampering revenues for American exporters. Meanwhile, sharply lower oil prices generated challenges for energy producers, while consumers and certain industries benefited from lower fuel prices.
Consequently, equity markets achieved most of the reporting period’s gains during 2014. In contrast, the S&P 500 Index repeatedly vacillated between gains and losses in early 2015 before stronger economic data supported moderately higher stock prices in the spring.The benchmark’s information technology and health care sectors fared particularly well over the reporting period, while energy and telecommunications stocks ranked among the weaker industry groups.
Growth Factors Proved More Predictive than Valuations
Investors favored companies exhibiting high levels of earnings momentum over the reporting period, while more value-oriented stocks and those with high dividend yields mostly lagged market averages. Consequently, the dividend payers on which the fund focuses generally did not participate fully in the S&P 500 Index’s gains. In addition, some of the fund’s more value-oriented holdings did not demonstrate the growth characteristics preferred by investors at the time. Office equipment producer Pitney Bowes announced quarterly earnings that fell short of analysts’ expectations, and mortgage real estate investment trust Annaly Capital Management suffered when analysts reduced future earnings estimates in anticipation of rising short-term interest rates. In the energy sector, exploration-and-production company ConocoPhillips and offshore drilling contractor Seadrill were hurt when major oil-and-gas producers cut their budgets as commodity prices plunged.
The fund achieved better relative performance in the health care sector, where biopharmaceutical developer Bristol-Myers Squibb reported positive news surrounding a new cancer drug under development. At the same time, tobacco producer Altria Group, publisher R. R. Donnelley & Sons, and semiconductor manufacturer Intel
4
reported stronger-than-expected earnings, enabling their valuations to rise from relatively low levels. Chemicals maker LyondellBasell Industries benefited from lower input costs when oil prices declined.
Focusing on Quality, Value, Growth, and Dividends
Although we employ a quantitative process that does not directly consider macroeconomic factors, it is worth noting that the U.S. economy had gotten back on track after a winter soft patch, and international markets may be poised for recovery amid the aggressively accommodative monetary policies adopted by major central banks.
As of the end of the reporting period, our models have continued to identify opportunities meeting our criteria for attractive valuations, improving growth fundamentals, and high dividends.We have found an ample number of such stocks in the utilities, consumer staples, industrials, and telecommunications services sectors. In contrast, the fund held underweighted exposure to companies in the financials, health care, information technology, and consumer discretionary sectors. In our judgment, this investment posture positons the fund well for current market conditions.
June 15, 2015
Please note, the position in any security highlighted with italicized typeface was sold during the reporting period. Equity funds are subject generally to market, market sector, market liquidity, issuer, and investment style risks, among other factors, to varying degrees, all of which are more fully described in the fund’s prospectus.
|
| 1 Total return includes reinvestment of dividends and any capital gains paid, and does not take into consideration the |
| maximum initial sales charge in the case of Class A shares, or the applicable contingent deferred sales charge imposed |
| on redemptions in the case of Class C shares. Had these charges been reflected, returns would have been lower. Past |
| performance is no guarantee of future results. Share price and investment return fluctuate such that upon redemption, |
| fund shares may be worth more or less than their original cost. Return figures provided reflect the absorption of certain |
| fund expenses by The Dreyfus Corporation pursuant to an undertaking in effect through October 1, 2015, at which |
| time it may be extended, terminated, or modified. Had these expenses not been absorbed, the fund’s Class A, C, and |
| I returns would have been lower. |
| 2 SOURCE: LIPPER INC. — Reflects reinvestment of dividends and, where applicable, capital gain distributions. |
| The Standard & Poor’s 500 Composite Stock Price Index is a widely accepted, unmanaged index of U.S. stock |
| market performance. Investors cannot invest directly in any index. |
The Fund 5
FUND PERFORMANCE
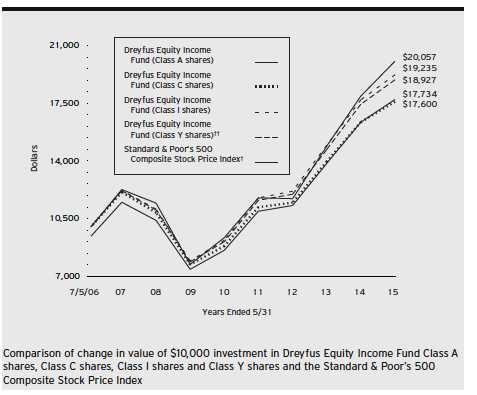
| |
| † | Source: Lipper Inc. |
| †† | The total return figures presented for ClassY shares of the fund reflect the performance of the fund’s Class A shares |
| | for the period prior to 7/1/13 (the inception date for ClassY shares), adjusted to reflect the applicable sales load for |
| | Class A shares. |
Past performance is not predictive of future performance.
The above graph compares a $10,000 investment made in each of the Class A, Class C, Class I and Class Y shares of Dreyfus Equity Income Fund on 7/5/06 (inception date) to a $10,000 investment made in the Standard & Poor’s 500 Composite Stock Price Index (the “Index”) on that date. All dividends and capital gain distributions are reinvested. The fund’s performance shown in the line graph above takes into account the maximum initial sales charge on Class A shares and all other applicable fees and expenses on all classes.The fund primarily seeks total return by investing in stocks, focusing on dividend-paying stocks and other instruments that provide income.The Index is a widely accepted, unmanaged index of U.S. stock market performance.These factors can contribute to the Index potentially outperforming the fund. Unlike a mutual fund, the Index is not subject to charges, fees and other expenses. Investors cannot invest directly in any index. Further information relating to fund performance, including expense reimbursements, if applicable, is contained in the Financial Highlights section of the prospectus and elsewhere in this report.
6
| | | | | | | |
| Average Annual Total Returns as of 5/31/15 | | | | | | |
| | Inception | | | | | From | |
| | Date | 1 Year | | 5 Years | | Inception | |
| Class A shares | | | | | | | |
| with maximum sales charge (5.75%) | 7/5/06 | 2.18 | % | 14.30 | % | 6.65 | % |
| without sales charge | 7/5/06 | 8.41 | % | 15.65 | % | 7.36 | % |
| Class C shares | | | | | | | |
| with applicable redemption charge † | 7/5/06 | 6.59 | % | 14.80 | % | 6.56 | % |
| without redemption | 7/5/06 | 7.59 | % | 14.80 | % | 6.56 | % |
| Class I shares | 7/5/06 | 8.61 | % | 15.95 | % | 7.63 | % |
| Class Y shares | 7/1/13 | 8.50 | % | 15.79 | %†† | 7.43 | %†† |
| Standard & Poor’s 500 | | | | | | | |
| Composite Stock Price Index | 6/30/06 | 11.79 | % | 16.53 | % | 8.12 | %††† |
Past performance is not predictive of future performance.The fund’s performance shown in the graph and table does not reflect the deduction of taxes that a shareholder would pay on fund distributions or the redemption of fund shares. In addition to the performance of Class A shares shown with and without a maximum sales charge, the fund’s performance shown in the table takes into account all other applicable fees and expenses on all classes.
| |
| † | The maximum contingent deferred sales charge for Class C shares is 1% for shares redeemed within one year of the |
| | date of purchase. |
| †† | The total return performance figures presented for ClassY shares of the fund reflect the performance of the fund’s |
| | Class A shares for the period prior to 7/1/13 (the inception date for ClassY shares), adjusted to reflect the |
| | applicable sales load for Class A shares. |
| ††† | For comparative purposes, the value of the Index as of 6/30/06 is used as the beginning value on 7/5/06. |
The Fund 7
UNDERSTANDING YOUR FUND’S EXPENSES (Unaudited)
As a mutual fund investor, you pay ongoing expenses, such as management fees and other expenses. Using the information below, you can estimate how these expenses affect your investment and compare them with the expenses of other funds.You also may pay one-time transaction expenses, including sales charges (loads) and redemption fees, which are not shown in this section and would have resulted in higher total expenses. For more information, see your fund’s prospectus or talk to your financial adviser.
Review your fund’s expenses
The table below shows the expenses you would have paid on a $1,000 investment in Dreyfus Equity Income Fund from December 1, 2014 to May 31, 2015. It also shows how much a $1,000 investment would be worth at the close of the period, assuming actual returns and expenses.
Expenses and Value of a $1,000 Investment
assuming actual returns for the six months ended May 31, 2015
| | | | | | | | |
| | | Class A | | Class C | | Class I | | Class Y |
| Expenses paid per $1,000† | $ | 5.50 | $ | 9.22 | $ | 4.25 | $ | 4.20 |
| Ending value (after expenses) | $ | 1,003.90 | $ | 1,000.00 | $ | 1,005.10 | $ | 1,005.70 |
COMPARING YOUR FUND’S EXPENSES
WITH THOSE OF OTHER FUNDS (Unaudited)
Using the SEC’s method to compare expenses
The Securities and Exchange Commission (SEC) has established guidelines to help investors assess fund expenses. Per these guidelines, the table below shows your fund’s expenses based on a $1,000 investment, assuming a hypothetical 5% annualized return. You can use this information to compare the ongoing expenses (but not transaction expenses or total cost) of investing in the fund with those of other funds. All mutual fund shareholder reports will provide this information to help you make this comparison. Please note that you cannot use this information to estimate your actual ending account balance and expenses paid during the period.
Expenses and Value of a $1,000 Investment
assuming a hypothetical 5% annualized return for the six months ended May 31, 2015
| | | | | | | | |
| | | Class A | | Class C | | Class I | | Class Y |
| Expenses paid per $1,000† | $ | 5.54 | $ | 9.30 | $ | 4.28 | $ | 4.23 |
| Ending value (after expenses) | $ | 1,019.45 | $ | 1,015.71 | $ | 1,020.69 | $ | 1,020.74 |
|
| † Expenses are equal to the fund’s annualized expense ratio of 1.10% for Class A, 1.85% for Class C, .85% for |
| Class I and .84% for ClassY, multiplied by the average account value over the period, multiplied by 182/365 (to |
| reflect the one-half year period). |
8
|
| STATEMENT OF INVESTMENTS |
| May 31, 2015 |
| | | |
| Common Stocks—99.3% | Shares | | Value ($) |
| Banks—3.4% | | | |
| JPMorgan Chase & Co. | 42,805 | | 2,815,713 |
| New York Community Bancorp | 156,050 | | 2,768,327 |
| People’s United Financial | 61,160 | | 951,650 |
| Wells Fargo & Co. | 48,200 | | 2,697,272 |
| | | | 9,232,962 |
| Capital Goods—7.1% | | | |
| Caterpillar | 52,050 | | 4,440,906 |
| General Dynamics | 2,960 | | 414,874 |
| General Electric | 237,750 | | 6,483,442 |
| Lockheed Martin | 26,310 | | 4,951,542 |
| Northrop Grumman | 9,050 | | 1,440,579 |
| Raytheon | 16,370 | | 1,690,366 |
| | | | 19,421,709 |
| Commercial & Professional Services—5.6% | | | |
| Cintas | 10,500 | | 903,945 |
| Pitney Bowes | 256,115 | | 5,596,113 |
| R.R. Donnelley & Sons | 451,000 | a | 8,650,180 |
| | | | 15,150,238 |
| Consumer Durables & Apparel—1.5% | | | |
| Garmin | 66,800 | | 3,038,064 |
| Leggett & Platt | 8,600 | | 406,608 |
| Mattel | 20,570 | | 530,912 |
| | | | 3,975,584 |
| Consumer Services—4.4% | | | |
| Carnival | 32,150 | | 1,489,509 |
| Darden Restaurants | 66,100 | | 4,332,194 |
| H&R Block | 77,440 | | 2,457,171 |
| Las Vegas Sands | 61,600 | | 3,131,128 |
| Starwood Hotels & ResortsWorldwide | 8,050 | b | 666,218 |
| | | | 12,076,220 |
| Diversified Financials—1.5% | | | |
| American Express | 2,120 | | 169,006 |
| Ares Capital | 45,650 | | 764,637 |
| Artisan Partners Asset Management Cl. A | 25,900 | | 1,142,449 |
| Invesco | 33,500 | | 1,334,305 |
| Navient | 32,800 | | 632,056 |
| | | | 4,042,453 |
The Fund 9
STATEMENT OF INVESTMENTS (continued)
| | | |
| Common Stocks (continued) | Shares | | Value ($) |
| Energy—7.3% | | | |
| Chevron | 30,560 | | 3,147,680 |
| ConocoPhillips | 7,015 | | 446,715 |
| Exxon Mobil | 62,310 | | 5,308,812 |
| HollyFrontier | 33,700 | | 1,403,605 |
| Kinder Morgan | 17,250 | | 715,703 |
| Noble | 64,300 | a | 1,077,025 |
| ONEOK | 93,400 | | 3,915,328 |
| Phillips 66 | 6,450 | | 510,324 |
| Schlumberger | 4,250 | | 385,772 |
| Spectra Energy | 58,800 | | 2,067,996 |
| Valero Energy | 14,150 | | 838,246 |
| | | | 19,817,206 |
| Food & Staples Retailing—3.8% | | | |
| CVS Health | 22,270 | | 2,280,003 |
| Wal-Mart Stores | 109,540 | | 8,135,536 |
| | | | 10,415,539 |
| Food, Beverage & Tobacco—6.5% | | | |
| Altria Group | 179,870 | | 9,209,344 |
| Coca-Cola | 15,800 | | 647,168 |
| ConAgra Foods | 9,330 | | 360,231 |
| Dr. Pepper Snapple Group | 10,460 | | 801,654 |
| Philip Morris International | 79,490 | | 6,603,234 |
| | | | 17,621,631 |
| Health Care Equipment & Services—.3% | | | |
| Abbott Laboratories | 7,880 | | 382,968 |
| Anthem | 1,900 | | 318,915 |
| | | | 701,883 |
| Household & Personal Products—2.0% | | | |
| Clorox | 30,100 | | 3,240,566 |
| Procter & Gamble | 28,600 | | 2,241,954 |
| | | | 5,482,520 |
10
| | | |
| Common Stocks (continued) | Shares | | Value ($) |
| Insurance—.9% | | | |
| MetLife | 38,300 | | 2,001,558 |
| Old Republic International | 16,000 | | 247,360 |
| Prudential Financial | 4,005 | | 338,863 |
| | | | 2,587,781 |
| Materials—3.5% | | | |
| Dow Chemical | 45,000 | | 2,343,150 |
| International Paper | 28,000 | | 1,451,240 |
| LyondellBasell Industries, Cl. A | 55,900 | | 5,651,490 |
| | | | 9,445,880 |
| Media—1.2% | | | |
| Cablevision Systems (NY Group), Cl. A | 71,500 | a | 1,752,465 |
| Gannett | 16,000 | | 572,640 |
| Regal Entertainment Group, Cl. A | 35,500 | a | 744,080 |
| Viacom, Cl. B | 3,540 | | 236,755 |
| | | | 3,305,940 |
| Pharmaceuticals, Biotech & | | | |
| Life Sciences—13.2% | | | |
| AbbVie | 133,230 | | 8,871,786 |
| Bristol-Myers Squibb | 28,460 | | 1,838,516 |
| Eli Lilly & Co. | 19,970 | | 1,575,633 |
| Johnson & Johnson | 42,650 | | 4,270,971 |
| Merck & Co. | 154,910 | | 9,432,470 |
| Pfizer | 283,457 | | 9,850,131 |
| | | | 35,839,507 |
| Real Estate—7.7% | | | |
| Annaly Capital Management | 537,710 | b | 5,613,692 |
| Chimera Investment | 56,920 | b | 821,356 |
| Communications Sales & Leasing | 55,820 | | 1,454,111 |
| Corrections Corporation of America | 37,350 | b | 1,313,226 |
| Equity Commonwealth | 18,760 | b,c | 483,070 |
| HCP | 25,050 | b | 969,936 |
The Fund 11
STATEMENT OF INVESTMENTS (continued)
| | | |
| Common Stocks (continued) | Shares | | Value ($) |
| Real Estate (continued) | | | |
| Hospitality Properties Trust | 26,340 | b | 795,205 |
| Host Hotels & Resorts | 89,800 | b | 1,788,816 |
| Kimco Realty | 29,200 | b | 699,632 |
| MFA Financial | 704,400 | b | 5,592,936 |
| Starwood Property Trust | 56,700 | b | 1,354,563 |
| | | | 20,886,543 |
| Retailing—1.5% | | | |
| Best Buy | 13,200 | | 458,040 |
| Foot Locker | 17,400 | | 1,099,680 |
| Genuine Parts | 3,270 | | 295,837 |
| Home Depot | 21,090 | | 2,349,848 |
| | | | 4,203,405 |
| Semiconductors & Semiconductor | | | |
| Equipment—3.6% | | | |
| Intel | 215,595 | | 7,429,404 |
| Maxim Integrated Products | 9,755 | | 342,108 |
| Microchip Technology | 18,450 | a | 906,448 |
| Texas Instruments | 22,400 | | 1,252,608 |
| | | | 9,930,568 |
| Software & Services—5.7% | | | |
| CA | 154,550 | | 4,706,048 |
| International Business Machines | 1,190 | | 201,883 |
| Leidos Holdings | 18,550 | | 788,375 |
| Microsoft | 104,085 | | 4,877,423 |
| Oracle | 42,790 | | 1,860,937 |
| Western Union | 136,200 | | 2,989,590 |
| | | | 15,424,256 |
| Technology Hardware & Equipment—7.1% | | | |
| Apple | 82,420 | | 10,737,678 |
| Cisco Systems | 41,500 | | 1,216,365 |
| Hewlett-Packard | 27,850 | | 930,190 |
| Lexmark International, Cl. A | 15,350 | | 705,793 |
12
| | | |
| Common Stocks (continued) | Shares | | Value ($) |
| Technology Hardware & Equipment (continued) | | | |
| Seagate Technology | 100,850 | | 5,611,294 |
| | | | 19,201,320 |
| Telecommunication Services—4.7% | | | |
| AT&T | 179,560 | | 6,202,002 |
| CenturyLink | 20,800 | | 691,392 |
| Verizon Communications | 110,070 | | 5,441,861 |
| Windstream Holdings | 46,516 | a | 378,408 |
| | | | 12,713,663 |
| Transportation—.2% | | | |
| Union Pacific | 2,300 | | 232,093 |
| United Parcel Service, Cl. B | 4,020 | | 398,864 |
| | | | 630,957 |
| Utilities—6.6% | | | |
| AGL Resources | 44,500 | | 2,241,465 |
| Ameren | 9,860 | | 396,668 |
| American Electric Power | 78,760 | | 4,433,400 |
| CMS Energy | 8,150 | | 278,241 |
| Consolidated Edison | 9,140 | | 565,218 |
| Duke Energy | 2,400 | | 181,752 |
| Entergy | 66,400 | | 5,077,608 |
| PG&E | 79,200 | | 4,234,824 |
| Public Service Enterprise Group | 7,460 | | 318,020 |
| Wisconsin Energy | 7,700 | | 371,756 |
| | | | 18,098,952 |
| Total Common Stocks | | | |
| (cost $229,802,117) | | | 270,206,717 |
| |
| Other Investment—.4% | | | |
| Registered Investment Company; | | | |
| Dreyfus Institutional Preferred | | | |
| Plus Money Market Fund | | | |
| (cost $999,635) | 999,635 | d | 999,635 |
The Fund 13
STATEMENT OF INVESTMENTS (continued)
| | | | |
| Investment of Cash Collateral | | | | |
| for Securities Loaned—2.0% | Shares | | Value ($) | |
| Registered Investment Company; | | | | |
| Dreyfus Institutional Cash | | | | |
| Advantage Fund | | | | |
| (cost $5,420,383) | 5,420,383 | d | 5,420,383 | |
| |
| Total Investments (cost $236,222,135) | 101.7 | % | 276,626,735 | |
| Liabilities, Less Cash and Receivables | (1.7 | %) | (4,705,491 | ) |
| Net Assets | 100.0 | % | 271,921,244 | |
|
| a Security, or portion thereof, on loan.At May 31, 2015, the value of the fund’s securities on loan was $5,164,773 |
| and the value of the collateral held by the fund was $5,420,383. |
| b Investment in real estate investment trust. |
| c Non-income producing security. |
| d Investment in affiliated money market mutual fund. |
| | | |
| Portfolio Summary (Unaudited)† | | |
| |
| | Value (%) | | Value (%) |
| Pharmaceuticals, | | Semiconductors & | |
| Biotech & Life Sciences | 13.2 | Semiconductor Equipment | 3.6 |
| Real Estate | 7.7 | Materials | 3.5 |
| Energy | 7.3 | Banks | 3.4 |
| Capital Goods | 7.1 | Money Market Investments | 2.4 |
| Technology Hardware | | Household & Personal Products | 2.0 |
| & Equipment | 7.1 | Consumer Durables & Apparel | 1.5 |
| Utilities | 6.6 | Diversified Financials | 1.5 |
| Food, Beverage & Tobacco | 6.5 | Retailing | 1.5 |
| Software & Services | 5.7 | Media | 1.2 |
| Commercial & Professional Services | 5.6 | Insurance | .9 |
| Telecommunication Services | 4.7 | Health Care Equipment & Services | .3 |
| Consumer Services | 4.4 | Transportation | .2 |
| Food & Staples Retailing | 3.8 | | 101.7 |
|
| † Based on net assets. |
| See notes to financial statements. |
14
|
| STATEMENT OF ASSETS AND LIABILITIES |
| May 31, 2015 |
| | | | |
| | | | Cost | Value |
| Assets ($): | | | | |
| Investments in securities—See Statement of Investments (including | | |
| securities on loan, valued at $5,164,773)—Note 1(b): | | | |
| Unaffiliated issuers | | | 229,802,117 | 270,206,717 |
| Affiliated issuers | | | 6,420,018 | 6,420,018 |
| Cash | | | | 69,486 |
| Dividends receivable | | | | 931,820 |
| Receivable for shares of Beneficial Interest subscribed | | | 197,974 |
| Prepaid expenses | | | | 26,861 |
| | | | | 277,852,876 |
| Liabilities ($): | | | | |
| Due to The Dreyfus Corporation and affiliates—Note 3(c) | | 246,884 |
| Liability for securities on loan—Note 1(b) | | | 5,420,383 |
| Payable for shares of Beneficial Interest redeemed | | | 134,339 |
| Accrued expenses | | | | 130,026 |
| | | | | 5,931,632 |
| Net Assets ($) | | | | 271,921,244 |
| Composition of Net Assets ($): | | | | |
| Paid-in capital | | | | 226,001,246 |
| Accumulated undistributed investment income—net | | | 843,799 |
| Accumulated net realized gain (loss) on investments | | | 4,671,599 |
| Accumulated net unrealized appreciation | | | |
| (depreciation) on investments | | | | 40,404,600 |
| Net Assets ($) | | | | 271,921,244 |
| |
| |
| Net Asset Value Per Share | | | | |
| | Class A | Class C | Class I | Class Y |
| Net Assets ($) | 220,644,222 | 18,136,677 | 29,526,655 | 3,613,690 |
| Shares Outstanding | 12,248,463 | 1,019,621 | 1,633,178 | 200,261 |
| Net Asset Value Per Share ($) | 18.01 | 17.79 | 18.08 | 18.04 |
| |
| See notes to financial statements. | | | | |
The Fund 15
|
| STATEMENT OF OPERATIONS |
| Year Ended May 31, 2015 |
| | |
| Investment Income ($): | | |
| Income: | | |
| Cash dividends: | | |
| Unaffiliated issuers | 9,401,278 | |
| Affiliated issuers | 1,373 | |
| Income from securities lending—Note 1(b) | 20,347 | |
| Total Income | 9,422,998 | |
| Expenses: | | |
| Management fee—Note 3(a) | 1,863,781 | |
| Shareholder servicing costs—Note 3(c) | 799,200 | |
| Distribution fees—Note 3(b) | 122,514 | |
| Registration fees | 71,510 | |
| Professional fees | 52,328 | |
| Custodian fees—Note 3(c) | 39,926 | |
| Prospectus and shareholders’ reports | 23,758 | |
| Trustees’ fees and expenses—Note 3(d) | 17,152 | |
| Loan commitment fees—Note 2 | 2,780 | |
| Interest expense—Note 2 | 1,589 | |
| Miscellaneous | 21,842 | |
| Total Expenses | 3,016,380 | |
| Less—reduction in expenses due to undertaking—Note 3(a) | (236,430 | ) |
| Less—reduction in fees due to earnings credits—Note 3(c) | (119 | ) |
| Net Expenses | 2,779,831 | |
| Investment Income—Net | 6,643,167 | |
| Realized and Unrealized Gain (Loss) on Investments—Note 4 ($): | | |
| Net realized gain (loss) on investments | 10,198,717 | |
| Net unrealized appreciation (depreciation) on investments | 2,425,658 | |
| Net Realized and Unrealized Gain (Loss) on Investments | 12,624,375 | |
| Net Increase in Net Assets Resulting from Operations | 19,267,542 | |
| |
| See notes to financial statements. | | |
16
STATEMENT OF CHANGES IN NET ASSETS
| | | | |
| | | | Year Ended May 31, | |
| | 2015 | | 2014 | a |
| |
| Operations ($): | | | | |
| Investment income—net | 6,643,167 | | 4,921,015 | |
| Net realized gain (loss) on investments | 10,198,717 | | 2,580,031 | |
| Net unrealized appreciation | | | | |
| (depreciation) on investments | 2,425,658 | | 23,329,460 | |
| Net Increase (Decrease) in Net Assets | | | | |
| Resulting from Operations | 19,267,542 | | 30,830,506 | |
| Dividends to Shareholders from ($): | | | | |
| Investment income—net: | | | | |
| Class A | (5,205,986 | ) | (3,653,732 | ) |
| Class C | (320,413 | ) | (213,737 | ) |
| Class I | (812,444 | ) | (596,738 | ) |
| Class Y | (127,764 | ) | (2,773 | ) |
| Net realized gain on investments: | | | | |
| Class A | (5,297,051 | ) | (1,612,000 | ) |
| Class C | (436,299 | ) | (134,342 | ) |
| Class I | (798,710 | ) | (258,858 | ) |
| Class Y | (39,878 | ) | (11 | ) |
| Total Dividends | (13,038,545 | ) | (6,472,191 | ) |
| Beneficial Interest Transactions ($): | | | | |
| Net proceeds from shares sold: | | | | |
| Class A | 66,848,852 | | 75,642,920 | |
| Class C | 5,094,522 | | 7,248,135 | |
| Class I | 20,773,077 | | 20,002,874 | |
| Class Y | 16,470,992 | | 790,059 | |
| Dividends reinvested: | | | | |
| Class A | 9,722,164 | | 4,870,057 | |
| Class C | 509,820 | | 222,361 | |
| Class I | 1,120,910 | | 380,324 | |
| Class Y | 75,322 | | 2,750 | |
| Cost of shares redeemed: | | | | |
| Class A | (39,981,118 | ) | (28,829,405 | ) |
| Class C | (2,934,945 | ) | (1,701,630 | ) |
| Class I | (23,005,131 | ) | (5,459,733 | ) |
| Class Y | (13,547,384 | ) | — | |
| Increase (Decrease) in Net Assets from | | | | |
| Beneficial Interest Transactions | 41,147,081 | | 73,168,712 | |
| Total Increase (Decrease) in Net Assets | 47,376,078 | | 97,527,027 | |
| Net Assets ($): | | | | |
| Beginning of Period | 224,545,166 | | 127,018,139 | |
| End of Period | 271,921,244 | | 224,545,166 | |
| Undistributed investment income—net | 843,799 | | 676,339 | |
The Fund 17
STATEMENT OF CHANGES IN NET ASSETS (continued)
| | | | |
| | | | Year Ended May 31, | |
| | 2015 | | 2014 | a |
| Capital Share Transactions: | | | | |
| Class A | | | | |
| Shares sold | 3,736,726 | | 4,687,802 | |
| Shares issued for dividends reinvested | 556,057 | | 301,656 | |
| Shares redeemed | (2,230,495 | ) | (1,768,228 | ) |
| Net Increase (Decrease) in Shares Outstanding | 2,062,288 | | 3,221,230 | |
| Class C | | | | |
| Shares sold | 287,020 | | 454,602 | |
| Shares issued for dividends reinvested | 29,564 | | 13,898 | |
| Shares redeemed | (165,899 | ) | (105,212 | ) |
| Net Increase (Decrease) in Shares Outstanding | 150,685 | | 363,288 | |
| Class Ib | | | | |
| Shares sold | 1,155,979 | | 1,242,479 | |
| Shares issued for dividends reinvested | 63,919 | | 23,517 | |
| Shares redeemed | (1,282,041 | ) | (338,257 | ) |
| Net Increase (Decrease) in Shares Outstanding | (62,143 | ) | 927,739 | |
| Class Yb | | | | |
| Shares sold | 915,777 | | 46,645 | |
| Shares issued for dividends reinvested | 4,303 | | 159 | |
| Shares redeemed | (766,623 | ) | — | |
| Net Increase (Decrease) in Shares Outstanding | 153,457 | | 46,804 | |
|
| a Effective July 1, 2013, the fund commenced offering ClassY shares. |
| b During the period ended May 31, 2015, 690,049 Class I shares representing $12,400,178 were exchanged for |
| 690,433 ClassY shares. |
See notes to financial statements.
18
FINANCIAL HIGHLIGHTS
The following tables describe the performance for each share class for the fiscal periods indicated. All information (except portfolio turnover rate) reflects financial results for a single fund share.Total return shows how much your investment in the fund would have increased (or decreased) during each period, assuming you had reinvested all dividends and distributions.These figures have been derived from the fund’s financial statements.
| | | | | | | | | | |
| | | | Year Ended May 31, | | | |
| Class A Shares | 2015 | | 2014 | | 2013 | | 2012 | | 2011 | |
| Per Share Data ($): | | | | | | | | | | |
| Net asset value, beginning of period | 17.55 | | 15.42 | | 13.16 | | 13.23 | | 10.52 | |
| Investment Operations: | | | | | | | | | | |
| Investment income—net a | .48 | | .45 | | .50 | | .39 | | .23 | |
| Net realized and unrealized | | | | | | | | | | |
| gain (loss) on investments | .94 | | 2.28 | | 2.40 | | .01 | | 2.66 | |
| Total from Investment Operations | 1.42 | | 2.73 | | 2.90 | | .40 | | 2.89 | |
| Distributions: | | | | | | | | | | |
| Dividends from investment income—net | (.48 | ) | (.42 | ) | (.49 | ) | (.36 | ) | (.18 | ) |
| Dividends from net realized | | | | | | | | | | |
| gain on investments | (.48 | ) | (.18 | ) | (.15 | ) | (.11 | ) | — | |
| Total Distributions | (.96 | ) | (.60 | ) | (.64 | ) | (.47 | ) | (.18 | ) |
| Net asset value, end of period | 18.01 | | 17.55 | | 15.42 | | 13.16 | | 13.23 | |
| Total Return (%)b | 8.41 | | 18.11 | | 22.65 | | 3.18 | | 27.70 | |
| Ratios/Supplemental Data (%): | | | | | | | | | | |
| Ratio of total expenses | | | | | | | | | | |
| to average net assets | 1.21 | | 1.21 | | 1.30 | | 1.80 | | 5.40 | |
| Ratio of net expenses | | | | | | | | | | |
| to average net assets | 1.10 | | 1.10 | | 1.15 | | 1.19 | | 1.50 | |
| Ratio of net investment income | | | | | | | | | | |
| to average net assets | 2.69 | | 2.75 | | 3.48 | | 2.99 | | 1.85 | |
| Portfolio Turnover Rate | 42.17 | | 20.36 | | 53.66 | | 66.38 | | 121.84 | |
| Net Assets, end of period ($ x 1,000) | 220,644 | | 178,781 | | 107,425 | | 51,754 | | 2,312 | |
| |
| a | Based on average shares outstanding. |
| b | Exclusive of sales charge. |
See notes to financial statements.
The Fund 19
FINANCIAL HIGHLIGHTS (continued)
| | | | | | | | | | |
| | | | Year Ended May 31, | | | |
| Class C Shares | 2015 | | 2014 | | 2013 | | 2012 | | 2011 | |
| Per Share Data ($): | | | | | | | | | | |
| Net asset value, beginning of period | 17.35 | | 15.26 | | 13.03 | | 13.10 | | 10.43 | |
| Investment Operations: | | | | | | | | | | |
| Investment income—neta | .34 | | .33 | | .39 | | .30 | | .13 | |
| Net realized and unrealized | | | | | | | | | | |
| gain (loss) on investments | .93 | | 2.25 | | 2.37 | | .01 | | 2.65 | |
| Total from Investment Operations | 1.27 | | 2.58 | | 2.76 | | .31 | | 2.78 | |
| Distributions: | | | | | | | | | | |
| Dividends from investment income—net | (.35 | ) | (.31 | ) | (.38 | ) | (.27 | ) | (.11 | ) |
| Dividends from net realized | | | | | | | | | | |
| gain on investments | (.48 | ) | (.18 | ) | (.15 | ) | (.11 | ) | — | |
| Total Distributions | (.83 | ) | (.49 | ) | (.53 | ) | (.38 | ) | (.11 | ) |
| Net asset value, end of period | 17.79 | | 17.35 | | 15.26 | | 13.03 | | 13.10 | |
| Total Return (%)b | 7.59 | | 17.18 | | 21.74 | | 2.47 | | 26.79 | |
| Ratios/Supplemental Data (%): | | | | | | | | | | |
| Ratio of total expenses | | | | | | | | | | |
| to average net assets | 1.92 | | 2.00 | | 2.11 | | 2.96 | | 6.19 | |
| Ratio of net expenses | | | | | | | | | | |
| to average net assets | 1.85 | | 1.85 | | 1.90 | | 2.00 | | 2.25 | |
| Ratio of net investment income | | | | | | | | | | |
| to average net assets | 1.94 | | 2.00 | | 2.76 | | 2.30 | | 1.09 | |
| Portfolio Turnover Rate | 42.17 | | 20.36 | | 53.66 | | 66.38 | | 121.84 | |
| Net Assets, end of period ($ x 1,000) | 18,137 | | 15,077 | | 7,715 | | 4,148 | | 913 | |
| |
| a | Based on average shares outstanding. |
| b | Exclusive of sales charge. |
See notes to financial statements.
20
| | | | | | | | | | |
| | | | Year Ended May 31, | | | |
| Class I Shares | 2015 | | 2014 | | 2013 | | 2012 | | 2011 | |
| Per Share Data ($): | | | | | | | | | | |
| Net asset value, beginning of period | 17.61 | | 15.47 | | 13.20 | | 13.26 | | 10.54 | |
| Investment Operations: | | | | | | | | | | |
| Investment income—neta | .52 | | .50 | | .55 | | .42 | | .25 | |
| Net realized and unrealized | | | | | | | | | | |
| gain (loss) on investments | .95 | | 2.28 | | 2.39 | | .02 | | 2.67 | |
| Total from Investment Operations | 1.47 | | 2.78 | | 2.94 | | .44 | | 2.92 | |
| Distributions: | | | | | | | | | | |
| Dividends from investment income—net | (.52 | ) | (.46 | ) | (.52 | ) | (.39 | ) | (.20 | ) |
| Dividends from net realized | | | | | | | | | | |
| gain on investments | (.48 | ) | (.18 | ) | (.15 | ) | (.11 | ) | — | |
| Total Distributions | (1.00 | ) | (.64 | ) | (.67 | ) | (.50 | ) | (.20 | ) |
| Net asset value, end of period | 18.08 | | 17.61 | | 15.47 | | 13.20 | | 13.26 | |
| Total Return (%) | 8.61 | | 18.47 | | 22.96 | | 3.47 | | 28.04 | |
| Ratios/Supplemental Data (%): | | | | | | | | | | |
| Ratio of total expenses | | | | | | | | | | |
| to average net assets | .92 | | .96 | | 1.12 | | 1.60 | | 5.25 | |
| Ratio of net expenses | | | | | | | | | | |
| to average net assets | .85 | | .85 | | .90 | | .93 | | 1.25 | |
| Ratio of net investment income | | | | | | | | | | |
| to average net assets | 2.93 | | 2.99 | | 3.74 | | 3.31 | | 2.07 | |
| Portfolio Turnover Rate | 42.17 | | 20.36 | | 53.66 | | 66.38 | | 121.84 | |
| Net Assets, end of period ($ x 1,000) | 29,527 | | 29,862 | | 11,878 | | 3,208 | | 72 | |
| a Based on average shares outstanding. | | | | | | | | | | |
| See notes to financial statements. | | | | | | | | | | |
The Fund 21
FINANCIAL HIGHLIGHTS (continued)
| | | | |
| | Year Ended May 31, | |
| Class Y Shares | 2015 | | 2014 | a |
| Per Share Data ($): | | | | |
| Net asset value, beginning of period | 17.61 | | 15.26 | |
| Investment Operations: | | | | |
| Investment income—netb | .55 | | .38 | |
| Net realized and unrealized | | | | |
| gain (loss) on investments | .88 | | 2.51 | |
| Total from Investment Operations | 1.43 | | 2.89 | |
| Distributions: | | | | |
| Dividends from investment income—net | (.52 | ) | (.36 | ) |
| Dividends from net realized gain on investments | (.48 | ) | (.18 | ) |
| Total Distributions | (1.00 | ) | (.54 | ) |
| Net asset value, end of period | 18.04 | | 17.61 | |
| Total Return (%) | 8.50 | | 19.27 | c |
| Ratios/Supplemental Data (%): | | | | |
| Ratio of total expenses to average net assets | .84 | | .97 | d |
| Ratio of net expenses to average net assets | .84 | | .85 | d |
| Ratio of net investment income | | | | |
| to average net assets | 3.21 | | 2.75 | d |
| Portfolio Turnover Rate | 42.17 | | 20.36 | |
| Net Assets, end of period ($ x 1,000) | 3,614 | | 824 | |
| |
| a | From July 1, 2013 (commencement of initial offering) to May 31, 2014. |
| b | Based on average shares outstanding. |
| c | Not annualized. |
| d | Annualized. |
See notes to financial statements.
22
NOTES TO FINANCIAL STATEMENTS
NOTE 1—Significant Accounting Policies:
Dreyfus Equity Income Fund (the “fund”) is a separate diversified series of The Dreyfus/Laurel Funds Trust (the “Trust”), which is registered under the Investment Company Act of 1940, as amended (the “Act”), as an open-end management investment company and operates as a series company currently offering five series, including the fund.The fund’s investment objective is to seek total return (consisting of capital appreciation and income).The Dreyfus Corporation (the “Manager” or “Dreyfus”), a wholly-owned subsidiary of The Bank of New York Mellon Corporation (“BNY Mellon”), serves as the fund’s investment adviser.
MBSC Securities Corporation (the “Distributor”), a wholly-owned subsidiary of Dreyfus, is the distributor of the fund’s shares. The fund is authorized to issue an unlimited number of $.001 par value shares of Beneficial Interest in each of the following classes of shares: Class A, Class C, Class I and Class Y. Class A and Class C shares are sold primarily to retail investors through financial intermediaries and bear Distribution and/or Shareholder Services Plan fees. Class A shares generally are subject to a sales charge imposed at the time of purchase. Class C shares are subject to a contingent deferred sales charge (“CDSC”) imposed on Class C shares redeemed within one year of purchase. Class I shares are sold primarily to bank trust departments and other financial service providers (including The Bank of NewYork Mellon, a subsidiary of BNY Mellon and an affiliate of Dreyfus, and its affiliates), acting on behalf of customers having a qualified trust or an investment account or relationship at such institution, and bear no Distribution or Shareholder Services Plan fees. Class Y shares are sold at net asset value per share generally to institutional investors and bear no Distribution or Shareholder Services Plan fees. Class I and Class Y shares are offered without a front-end sales charge or CDSC. Other differences between the classes include the services offered to and the expenses borne by each class, the allocation of certain transfer agency
The Fund 23
NOTES TO FINANCIAL STATEMENTS (continued)
costs, and certain voting rights. Income, expenses (other than expenses attributable to a specific class), and realized and unrealized gains or losses on investments are allocated to each class of shares based on its relative net assets.
The Trust accounts separately for the assets, liabilities and operations of each series. Expenses directly attributable to each series are charged to that series’ operations; expenses which are applicable to all series are allocated among them on a pro rata basis.
The Financial Accounting Standards Board (“FASB”) Accounting Standards Codification (“ASC”) is the exclusive reference of authoritative U.S. generally accepted accounting principles (“GAAP”) recognized by the FASB to be applied by nongovernmental entities. Rules and interpretive releases of the Securities and Exchange Commission (“SEC”) under authority of federal laws are also sources of authoritative GAAP for SEC registrants. The fund’s financial statements are prepared in accordance with GAAP, which may require the use of management estimates and assumptions. Actual results could differ from those estimates.
(a) Portfolio valuation: The fair value of a financial instrument is the amount that would be received to sell an asset or paid to transfer a liability in an orderly transaction between market participants at the measurement date (i.e., the exit price). GAAP establishes a fair value hierarchy that prioritizes the inputs of valuation techniques used to measure fair value. This hierarchy gives the highest priority to unadjusted quoted prices in active markets for identical assets or liabilities (Level 1 measurements) and the lowest priority to unobservable inputs (Level 3 measurements).
Additionally, GAAP provides guidance on determining whether the volume and activity in a market has decreased significantly and whether such a decrease in activity results in transactions that are not
24
orderly. GAAP requires enhanced disclosures around valuation inputs and techniques used during annual and interim periods.
Various inputs are used in determining the value of the fund’s investments relating to fair value measurements.These inputs are summarized in the three broad levels listed below:
Level 1—unadjusted quoted prices in active markets for identical investments.
Level 2—other significant observable inputs (including quoted prices for similar investments, interest rates, prepayment speeds, credit risk, etc.).
Level 3—significant unobservable inputs (including the fund’s own assumptions in determining the fair value of investments).
The inputs or methodology used for valuing securities are not necessarily an indication of the risk associated with investing in those securities.
Changes in valuation techniques may result in transfers in or out of an assigned level within the disclosure hierarchy. Valuation techniques used to value the fund’s investments are as follows:
Investments in securities are valued at the last sales price on the securities exchange or national securities market on which such securities are primarily traded. Securities listed on the National Market System for which market quotations are available are valued at the official closing price or, if there is no official closing price that day, at the last sales price. For open short positions, asked prices are used for valuation purposes. Bid price is used when no asked price is available. Registered investment companies that are not traded on an exchange are valued at their net asset value.All of the preceding securities are generally categorized within Level 1 of the fair value hierarchy.
The Fund 25
NOTES TO FINANCIAL STATEMENTS (continued)
Securities not listed on an exchange or the national securities market, or securities for which there were no transactions, are valued at the average of the most recent bid and asked prices. These securities are generally categorized within Level 2 of the fair value hierarchy.
Fair valuing of securities may be determined with the assistance of a pricing service using calculations based on indices of domestic securities and other appropriate indicators, such as prices of relevant American Depository Receipts and financial futures. Utilizing these techniques may result in transfers between Level 1 and Level 2 of the fair value hierarchy.
When market quotations or official closing prices are not readily available, or are determined not to reflect accurately fair value, such as when the value of a security has been significantly affected by events after the close of the exchange or market on which the security is principally traded (for example, a foreign exchange or market), but before the fund calculates its net asset value, the fund may value these investments at fair value as determined in accordance with the procedures approved by the Trust’s Board of Trustees (the “Board”). Certain factors may be considered when fair valuing investments such as: fundamental analytical data, the nature and duration of restrictions on disposition, an evaluation of the forces that influence the market in which the securities are purchased and sold, and public trading in similar securities of the issuer or comparable issuers. These securities are either categorized within Level 2 or 3 of the fair value hierarchy depending on the relevant inputs used.
For restricted securities where observable inputs are limited, assumptions about market activity and risk are used and are generally categorized within Level 3 of the fair value hierarchy.
26
The following is a summary of the inputs used as of May 31, 2015 in valuing the fund’s investments:
| | | | |
| | | Level 2—Other | Level 3— | |
| | Level 1— | Significant | Significant | |
| | Unadjusted | Observable | Unobservable | |
| | Quoted Prices | Inputs | Inputs | Total |
| Assets ($) | | | | |
| Investments in Securities: | | | |
| Equity Securities— | | | | |
| Domestic | | | | |
| Common Stocks† | 269,129,692 | — | — | 269,129,692 |
| Equity Securities— | | | | |
| Foreign | | | | |
| Common Stocks† | 1,077,025 | — | — | 1,077,025 |
| Mutual Funds | 6,420,018 | — | — | 6,420,018 |
| |
| † See Statement of Investments for additional detailed categorizations. | |
At May 31, 2015, there were no transfers between Level 1 and Level 2 of the fair value hierarchy.
(b) Securities transactions and investment income: Securities transactions are recorded on a trade date basis. Realized gains and losses from securities transactions are recorded on the identified cost basis. Dividend income is recognized on the ex-dividend date and interest income, including, where applicable, accretion of discount and amortization of premium on investments, is recognized on the accrual basis.
Pursuant to a securities lending agreement with The Bank of New York Mellon, the fund may lend securities to qualified institutions. It is the fund’s policy that, at origination, all loans are secured by collateral of at least 102% of the value of U.S. securities loaned and 105% of the value of foreign securities loaned. Collateral equivalent to at least 100% of the market value of securities on loan is maintained at all
The Fund 27
NOTES TO FINANCIAL STATEMENTS (continued)
times. Collateral is either in the form of cash, which can be invested in certain money market mutual funds managed by Dreyfus or U.S. Government and Agency securities.The fund is entitled to receive all dividends, interest and distributions on securities loaned, in addition to income earned as a result of the lending transaction. Should a borrower fail to return the securities in a timely manner, The Bank of New York Mellon is required to replace the securities for the benefit of the fund or credit the fund with the market value of the unreturned securities and is subrogated to the fund’s rights against the borrower and the collateral. During the period ended May 31, 2015, The Bank of New York Mellon earned $6,498 from lending portfolio securities, pursuant to the securities lending agreement.
(c) Affiliated issuers: Investments in other investment companies advised by Dreyfus are defined as “affiliated” under the Act. Investments in affiliated investment companies during the period ended May 31, 2015 were as follows:
| | | | | |
| Affiliated | | | | | |
| Investment | Value | | | Value | Net |
| Company | 5/31/2014 ($) | Purchases ($) | Sales ($) | 5/31/2015 ($) | Assets (%) |
| Dreyfus | | | | | |
| Institutional | | | | | |
| Preferred | | | | | |
| Plus Money | | | | | |
| Market Fund | 1,247,730 | 56,259,405 | 56,507,500 | 999,635 | .4 |
| Dreyfus | | | | | |
| Institutional | | | | | |
| Cash | | | | | |
| Advantage | | | | | |
| Fund | — | 44,710,998 | 39,290,615 | 5,420,383 | 2.0 |
| Total | 1,247,730 | 100,970,403 | 95,798,115 | 6,420,018 | 2.4 |
(d) Dividends to shareholders: Dividends are recorded on the ex-dividend date. Dividends from investment income-net are declared and paid monthly. Dividends from net realized capital gains, if any, are normally declared and paid annually, but the fund may make distribu-
28
tions on a more frequent basis to comply with the distribution requirements of the Internal Revenue Code of 1986, as amended (the “Code”). To the extent that net realized capital gains can be offset by capital loss carryovers, it is the policy of the fund not to distribute such gains. Income and capital gain distributions are determined in accordance with income tax regulations, which may differ from GAAP.
(e) Federal income taxes: It is the policy of the fund to continue to qualify as a regulated investment company, if such qualification is in the best interests of its shareholders, by complying with the applicable provisions of the Code, and to make distributions of taxable income sufficient to relieve it from substantially all federal income and excise taxes.
As of and during the period ended May 31, 2015, the fund did not have any liabilities for any uncertain tax positions.The fund recognizes interest and penalties, if any, related to uncertain tax positions as income tax expense in the Statement of Operations. During the period ended May 31, 2015, the fund did not incur any interest or penalties.
Each tax year in the four-year period ended May 31, 2015 remains subject to examination by the Internal Revenue Service and state taxing authorities.
At May 31, 2015, the components of accumulated earnings on a tax basis were as follows: undistributed ordinary income $617,000, undistributed capital gains $6,842,718 and unrealized appreciation $39,003,680. In addition, the fund had $543,400 of capital losses realized after October 31, 2014, which were deferred for tax purposes to the first day of the following fiscal year.
The tax character of distributions paid to shareholders during the fiscal periods ended May 31, 2015 and May 31, 2014 were as follows: ordinary income $9,263,783 and $6,118,854, and long-term capital gains $3,774,762 and $353,337, respectively.
The Fund 29
NOTES TO FINANCIAL STATEMENTS (continued)
During the period ended May 31, 2015, as a result of permanent book to tax differences, primarily due to the tax treatment for real estate investment trusts and dividend reclassification, the fund decreased accumulated undistributed investment income-net by $9,100 and increased accumulated net realized gain (loss) on investments by the same amount. Net assets and net asset value per share were not affected by this reclassification.
NOTE 2—Bank Lines of Credit:
The fund participates with other Dreyfus-managed funds in a $430 million unsecured credit facility led by Citibank, N.A. and a $300 million unsecured credit facility provided by The Bank of New York Mellon (each, a “Facility”), each to be utilized primarily for temporary or emergency purposes, including the financing of redemptions. Prior to October 8, 2014, the unsecured credit facility with Citibank, N.A. was $265 million. In connection therewith, the fund has agreed to pay its pro rata portion of commitment fees for each Facility. Interest is charged to the fund based on rates determined pursuant to the terms of the respective Facility at the time of borrowing.
The average amount of borrowings outstanding under the Facilities during the period ended May 31, 2015, was approximately $146,000, with a related weighted average annualized interest rate of 1.09%.
NOTE 3—Management Fee and Other Transactions with Affiliates:
(a) Pursuant to a management agreement with Dreyfus, the management fee is computed at the annual rate of .75% of the value of the fund’s average daily net assets and is payable monthly. Dreyfus has contractually agreed, from June 1, 2014 through October 1, 2015, to waive receipt of its fees and/or assume the expenses of the fund so that direct annual fund operating expenses (excluding Rule 12b-1 Distribution Plan fees, Shareholder Services Plan fees, taxes, interest expense, bro-
30
kerage commissions, commitment fees on borrowings and extraordinary expenses) do not exceed .85% of the value of the fund’s average daily net assets. The reduction in expenses, pursuant to the undertaking, amounted to $236,430 during the period ended May 31, 2015.
During the period ended May 31, 2015, the Distributor retained $39,898 from commissions earned on sales of the fund’s Class A shares and $1,429 from CDSC’s on redemptions of the fund’s Class C shares.
(b) Under the Distribution Plan adopted pursuant to Rule 12b-1 under the Act, Class C shares pay the Distributor for distributing its shares at an annual rate of .75% of the value of its average daily net assets. During the period ended May 31, 2015, Class C shares were charged $122,514, pursuant to the Distribution Plan.
(c) Under the Shareholder Services Plan, Class A and Class C shares pay the Distributor at an annual rate of .25% of the value of their average daily net assets for the provision of certain services. The services provided may include personal services relating to shareholder accounts, such as answering shareholder inquiries regarding the fund and providing reports and other information, and services related to the maintenance of shareholder accounts.The Distributor may make payments to Service Agents (securities dealers, financial institutions or other industry professionals) with respect to these services.The Distributor determines the amounts to be paid to Service Agents. During the period ended May 31, 2015, Class A and Class C shares were charged $500,331 and $40,838, respectively, pursuant to the Shareholder Services Plan.
Under its terms, the Distribution Plan and Shareholder Services Plan shall remain in effect from year to year, provided such continuance is approved annually by a vote of a majority of those Trustees who are not “interested persons” of the Trust and who have no direct or indirect financial interest in the operation of or in any agreement related to the Distribution Plan or Shareholder Services Plan.
The Fund 31
NOTES TO FINANCIAL STATEMENTS (continued)
The fund has arrangements with the transfer agent and the custodian whereby the fund may receive earnings credits when positive cash balances are maintained, which are used to offset transfer agency and custody fees. For financial reporting purposes, the fund includes net earnings credits as an expense offset in the Statement of Operations.
The fund compensates Dreyfus Transfer, Inc., a wholly-owned subsidiary of Dreyfus, under a transfer agency agreement for providing transfer agency and cash management services for the fund. The majority of transfer agency fees are comprised of amounts paid on a per account basis, while cash management fees are related to fund subscriptions and redemptions. During the period ended May 31, 2015, the fund was charged $40,787 for transfer agency services and $2,589 for cash management services. These fees are included in Shareholder servicing costs in the Statement of Operations. Cash management fees were partially offset by earnings credits of $119.
The fund compensates The Bank of New York Mellon under a custody agreement for providing custodial services for the fund. These fees are determined based on net assets, geographic region and transaction activity. During the period ended May 31, 2015, the fund was charged $39,926 pursuant to the custody agreement.
During the period ended May 31, 2015, the fund was charged $10,891 for services performed by the Chief Compliance Officer and his staff.
The components of “Due to The Dreyfus Corporation and affiliates” in the Statement of Assets and Liabilities consist of: management fees $173,571, Distribution Plan fees $11,546, Shareholder Services Plan fees $50,815, custodian fees $20,839, Chief Compliance Officer fees $2,113 and transfer agency fees $12,462, which are offset against an expense reimbursement currently in effect in the amount $24,462.
(d) Each Board member also serves as a Board member of other funds within the Dreyfus complex. Annual retainer fees and attendance fees are allocated to each fund based on net assets.
32
NOTE 4—Securities Transactions:
The aggregate amount of purchases and sales of investment securities, excluding short-term securities, during the period ended May 31, 2015, amounted to $138,449,564 and $104,181,481, respectively.
At May 31, 2015, the cost of investments for federal income tax purposes was $237,623,055; accordingly, accumulated net unrealized appreciation on investments was $39,003,680, consisting of $46,478,614 gross unrealized appreciation and $7,474,934 gross unrealized depreciation.
The Fund 33
|
| REPORT OF INDEPENDENT REGISTERED |
| PUBLIC ACCOUNTING FIRM |
The Board of Trustees and Shareholders of The Dreyfus/Laurel Funds Trust
We have audited the accompanying statement of assets and liabilities of Dreyfus Equity Income Fund (the “Fund”), a series of The Dreyfus/Laurel Funds Trust, including the statement of investments as of May 31, 2015, and the related statement of operations for the year then ended, the statements of changes in net assets for each of the years in the two-year period then ended and the financial highlights for each of the years or periods in the five-year period then ended.These financial statements and financial highlights are the responsibility of the Fund’s management. Our responsibility is to express an opinion on these financial statements and financial highlights based on our audits.
We conducted our audits in accordance with the standards of the Public Company Accounting Oversight Board (United States).Those standards require that we plan and perform the audit to obtain reasonable assurance about whether the financial statements and financial highlights are free of material misstatement. An audit includes examining, on a test basis, evidence supporting the amounts and disclosures in the financial statements. Our procedures included confirmation of securities owned as of May 31, 2015, by correspondence with the custodian and brokers or by other appropriate auditing procedures. An audit also includes assessing the accounting principles used and significant estimates made by management, as well as evaluating the overall financial statement presentation.We believe that our audits provide a reasonable basis for our opinion.
In our opinion, the financial statements and financial highlights referred to above present fairly, in all material respects, the financial position of Dreyfus Equity Income Fund as of May 31, 2015, and the results of its operations for the year then ended, the changes in its net assets for each of the years in the two-year period then ended and the financial highlights for each of the years or periods in the five-year period then ended, in conformity with U.S. generally accepted accounting principles.

New York, New York
July 29, 2015
34
IMPORTANT TAX INFORMATION (Unaudited)
For federal tax purposes, the fund reports the maximum amount allowable but not less than 99.58% of ordinary income dividends paid during the fiscal year ended May 31, 2015 as eligible for the corporate dividends received deduction provided under Section 243 of the Internal Revenue Code in accordance with Section 854(b)(1)(A) of the Internal Revenue Code. Also, the fund reports the maximum amount allowable but not less than $8,418,874 as ordinary income dividends paid during the fiscal year ended May 31, 2015 as qualified dividend income in accordance with Section 854(b)(1)(B) of the Internal Revenue Code. Shareholders will receive notification in early 2016 of the percentage applicable to the preparation of their 2015 income tax returns. Also, the fund reports the maximum amount allowable but not less than $.2784 per share as a capital gain dividend paid on December 16, 2014 in accordance with Section 852(b)(3)(C) of the Internal Revenue Code. Also, the fund reports the maximum amount allowable but not less than $.2063 as a short-term capital gain dividend paid on December 16, 2014 in accordance with Sections 871(k)(2) and 881(e) of the Internal Revenue Code.
The Fund 35
INFORMATION ABOUT THE RENEWAL OF THE
FUND’S MANAGEMENT AGREEMENT (Unaudited)
At a meeting of the fund’s Board of Trustees held on February 25-26, 2015, the Board considered the renewal of the fund’s Management Agreement pursuant to which Dreyfus provides the fund with investment advisory and administrative services (the “Agreement”).The Board members, none of whom are “interested persons” (as defined in the Investment Company Act of 1940, as amended) of the fund, were assisted in their review by independent legal counsel and met with counsel in executive session separate from Dreyfus representatives. In considering the renewal of the Agreement, the Board considered all factors that it believed to be relevant, including those discussed below. The Board did not identify any one factor as dispositive, and each Board member may have attributed different weights to the factors considered.
Analysis of Nature, Extent, and Quality of Services Provided to the Fund. The Board considered information provided to them at the meeting and in previous presentations from Dreyfus representatives regarding the nature, extent, and quality of the services provided to funds in the Dreyfus fund complex. Dreyfus provided the number of open accounts in the fund, the fund’s asset size and the allocation of fund assets among distribution channels. Dreyfus also had previously provided information regarding the diverse intermediary relationships and distribution channels of funds in the Dreyfus fund complex (such as retail direct or intermediary, in which intermediaries typically are paid by the fund and/or Dreyfus) and Dreyfus’ corresponding need for broad, deep, and diverse resources to be able to provide ongoing shareholder services to each intermediary or distribution channel, as applicable to the fund.
The Board also considered research support available to, and portfolio management capabilities of, the fund’s portfolio management personnel and that Dreyfus also provides oversight of day-to-day fund operations, including fund accounting and administration and assistance in meeting legal and regulatory requirements.The Board also considered Dreyfus’ extensive administrative, accounting and compliance infra-structures.The Board also considered portfolio management’s brokerage policies and practices (including policies and practices regarding soft dollars) and the standards applied in seeking best execution.
36
Comparative Analysis of the Fund’s Performance and Management Fee and Expense Ratio. The Board reviewed reports prepared by Lipper, Inc. (“Lipper”), an independent provider of investment company data, which included information comparing (1) the fund’s performance with the performance of a group of comparable funds (the “Performance Group”) and with a broader group of funds (the “Performance Universe”), all for various periods ended December 31, 2014, and (2) the fund’s actual and contractual management fees and total expenses with those of a group of comparable funds (the “Expense Group”) and with a broader group of funds (the “Expense Universe”), the information for which was derived in part from fund financial statements available to Lipper as of the date of its analysis. Dreyfus previously had furnished the Board with a description of the methodology Lipper used to select the Performance Group and Performance Universe and the Expense Group and Expense Universe.
Dreyfus representatives stated that the usefulness of performance comparisons may be affected by a number of factors, including different investment limitations that may be applicable to the fund and comparison funds. The Board discussed the results of the comparisons and noted that the fund’s total return performance was above the Performance Group and Performance Universe medians for all periods. Dreyfus also provided a comparison of the fund’s calendar year total returns to the returns of the fund’s benchmark index.
The Board also reviewed the range of actual and contractual management fees and total expenses of the Expense Group and Expense Universe funds and discussed the results of the comparisons. The Board noted that the fund’s contractual management fee was at the Expense Group median, the fund’s actual management fee was slightly above the Expense Group and Expense Universe medians and the fund’s total expenses were below the Expense Group and Expense Universe medians.
Dreyfus representatives noted that Dreyfus has contractually agreed to waive receipt of its fees and/or assume the expenses of the fund, until
The Fund 37
INFORMATION ABOUT THE RENEWAL OF THE FUND’S
MANAGEMENT AGREEMENT (Unaudited) (continued)
October 1, 2015, so that annual direct fund operating expenses (excluding Rule 12b-1 fees, shareholder services fees, taxes, interest, brokerage commissions, commitment fees on borrowings, acquired fund fees and extraordinary expenses) do not exceed .85% of the fund’s average daily net assets.
Dreyfus representatives reviewed with the Board the management or investment advisory fees (1) paid by funds advised or administered by Dreyfus that are in the same Lipper category as the fund and (2) paid to Dreyfus or the Dreyfus-affiliated primary employer of the fund’s primary portfolio manager(s) for advising any separate accounts and/or other types of client portfolios that are considered to have similar investment strategies and policies as the fund (the “Similar Clients”), and explained the nature of the Similar Clients. They discussed differences in fees paid and the relationship of the fees paid in light of any differences in the services provided and other relevant factors. The Board considered the relevance of the fee information provided for the Similar Clients to evaluate the appropriateness and reasonableness of the fund’s management fee.
Analysis of Profitability and Economies of Scale. Dreyfus representatives reviewed the expenses allocated and profit received by Dreyfus and its affiliates and the resulting profitability percentage for managing the fund and the aggregate profitability percentage to Dreyfus and its affiliates for managing the funds in the Dreyfus fund complex, and the method used to determine the expenses and profit. The Board concluded that the profitability results were not unreasonable, given the services rendered and service levels provided by Dreyfus. The Board also noted the expense limitation arrangement and its effect on the profitability of Dreyfus and its affiliates.The Board also had been provided with information prepared by an independent consulting firm regarding Dreyfus’ approach to allocating costs to, and determining the
38
profitability of, individual funds and the entire Dreyfus fund complex. The consulting firm also had analyzed where any economies of scale might emerge in connection with the management of a fund.
The Board considered, on the advice of its counsel, the profitability analysis (1) as part of its evaluation of whether the fees under the Agreement bear a reasonable relationship to the mix of services provided by Dreyfus, including the nature, extent and quality of such services, and (2) in light of the relevant circumstances for the fund and the extent to which economies of scale would be realized if the fund grows and whether fee levels reflect these economies of scale for the benefit of fund shareholders. Dreyfus representatives also noted that, as a result of shared and allocated costs among funds in the Dreyfus fund complex, the extent of economies of scale could depend substantially on the level of assets in the complex as a whole, so that increases and decreases in complex-wide assets can affect potential economies of scale in a manner that is disproportionate to, or even in the opposite direction from, changes in the fund’s asset level.The Board also considered potential benefits to Dreyfus from acting as investment adviser and noted the soft dollar arrangements in effect for trading the fund’s investments.
At the conclusion of these discussions, the Board agreed that it had been furnished with sufficient information to make an informed business decision with respect to the renewal of the Agreement. Based on the discussions and considerations as described above, the Board concluded and determined as follows.
The Board concluded that the nature, extent and quality of the services provided by Dreyfus are adequate and appropriate.
The Board was satisfied with the fund’s performance.
The Board concluded that the fee paid to Dreyfus was reasonable in light of the considerations described above.
The Fund 39
INFORMATION ABOUT THE RENEWAL OF THE FUND’S
MANAGEMENT AGREEMENT (Unaudited) (continued)
The Board determined that the economies of scale which may accrue to Dreyfus and its affiliates in connection with the management of the fund had been adequately considered by Dreyfus in connection with the fee rate charged to the fund pursuant to the Agreement and that, to the extent in the future it were determined that material economies of scale had not been shared with the fund, the Board would seek to have those economies of scale shared with the fund.
In evaluating the Agreement, the Board considered these conclusions and determinations and also relied on its previous knowledge, gained through meetings and other interactions with Dreyfus and its affiliates, of the fund and the services provided to the fund by Dreyfus. The Board also relied on information received on a routine and regular basis throughout the year relating to the operations of the fund and the investment management and other services provided under the Agreement, including information on the investment performance of the fund in comparison to similar mutual funds and benchmark performance indices; general market outlook as applicable to the fund; and compliance reports. In addition, the Board’s consideration of the contractual fee arrangements for this fund had the benefit of a number of years of reviews of prior or similar agreements during which lengthy discussions took place between the Board and Dreyfus representatives. Certain aspects of the arrangements may receive greater scrutiny in some years than in others, and the Board’s conclusions may be based, in part, on their consideration of the same or similar arrangements in prior years.The Board determined to renew the Agreement.
40
|
| BOARD MEMBERS INFORMATION (Unaudited) |
| INDEPENDENT BOARD MEMBERS |
|
| Joseph S. DiMartino (71) |
| Chairman of the Board (1999) |
| Principal Occupation During Past 5Years: |
| • Corporate Director and Trustee (1995-present) |
| Other Public Company Board Memberships During Past 5Years: |
| • CBIZ (formerly, Century Business Services, Inc.), a provider of outsourcing functions for small |
| and medium size companies, Director (1997-present) |
| • The Newark Group, a provider of a national market of paper recovery facilities, paperboard |
| mills and paperboard converting plants, Director (2000-2010) |
| No. of Portfolios for which Board Member Serves: 147 |
| ——————— |
| Francine J. Bovich (63) |
| Board Member (2012) |
| Principal Occupation During Past 5Years: |
| • Trustee,The Bradley Trusts, private trust funds (2011-present) |
| • Managing Director, Morgan Stanley Investment Management (1993-2010) |
| Other Public Company Board Membership During Past 5Years: |
| • Annaly Capital Management, Inc., Board Member (May 2014-present) |
| No. of Portfolios for which Board Member Serves: 84 |
| ——————— |
| Kenneth A. Himmel (69) |
| Board Member (1994) |
| Principal Occupation During Past 5Years: |
| • Managing Partner, Gulf Related, an international real estate development company (2010-present) |
| • President and CEO, Related Urban Development, a real estate development company |
| (1996-present) |
| • President and CEO, Himmel & Company, a real estate development company (1980-present) |
| • CEO,American Food Management, a restaurant company (1983-present) |
| No. of Portfolios for which Board Member Serves: 32 |
| ——————— |
| Stephen J. Lockwood (68) |
| Board Member (1994) |
| Principal Occupation During Past 5Years: |
| • Chairman of the Board, Stephen J. Lockwood and Company LLC, a real estate investment |
| company (2000-present) |
| No. of Portfolios for which Board Member Serves: 32 |
The Fund 41
|
| BOARD MEMBERS INFORMATION (Unaudited) (continued) |
| INDEPENDENT BOARD MEMBERS (continued) |
|
| Roslyn M. Watson (65) |
| Board Member (1994) |
| Principal Occupation During Past 5Years: |
| • Principal,Watson Ventures, Inc., a real estate investment company (1993-present) |
| No. of Portfolios for which Board Member Serves: 70 |
| ——————— |
| Benaree Pratt Wiley (69) |
| Board Member (1994) |
| Principal Occupation During Past 5Years: |
| • Principal,The Wiley Group, a firm specializing in strategy and business development (2005- |
| present) |
| Other Public Company Board Membership During Past 5Years: |
| • CBIZ (formerly, Century Business Services, Inc.), a provider of outsourcing functions for small |
| and medium size companies, Director (2008-present) |
| No. of Portfolios for which Board Member Serves: 70 |
| ——————— |
Once elected all Board Members serve for an indefinite term, but achieve Emeritus status upon reaching age 80.The address of the Board Members and Officers is c/o The Dreyfus Corporation, 200 Park Avenue, New York, New York 10166. Additional information about the Board Members is available in the fund’s Statement of Additional Information which can be obtained from Dreyfus free of charge by calling this toll free number: 1-800-DREYFUS.
J.Tomlinson Fort, Emeritus Board Member
James M. Fitzgibbons, Emeritus Board Member
42
OFFICERS OF THE FUND (Unaudited)
BRADLEY J. SKAPYAK, President since January 2010.
Chief Operating Officer and a director of the Manager since June 2009, Chairman of Dreyfus Transfer, Inc., an affiliate of the Manager and the transfer agent of the funds, since May 2011 and Executive Vice President of the Distributor since June 2007. From April 2003 to June 2009, Mr. Skapyak was the head of the Investment Accounting and Support Department of the Manager. He is an officer of 69 investment companies (comprised of 147 portfolios) managed by the Manager. He is 56 years old and has been an employee of the Manager since February 1988.
JOHN PAK, Chief Legal Officer since March 2013.
Deputy General Counsel, Investment Management, of BNY Mellon since August 2014; Chief Legal Officer of the Manager since August 2012; from March 2005 to July 2012, Managing Director of Deutsche Bank, Deputy Global Head of Deutsche Asset Management Legal and Regional Head of Deutsche Asset Management Americas Legal. He is an officer of 70 investment companies (comprised of 172 portfolios) managed by the Manager. He is 46 years old and has been an employee of the Manager since August 2012.
JANETTE E. FARRAGHER, Vice President and Secretary since December 2011.
Assistant General Counsel of BNY Mellon, and an officer of 70 investment companies (comprised of 172 portfolios) managed by the Manager. She is 52 years old and has been an employee of the Manager since February 1984.
KIESHA ASTWOOD, Vice President and Assistant Secretary since January 2010.
Counsel of BNY Mellon, and an officer of 70 investment companies (comprised of 172 portfolios) managed by the Manager. She is 42 years old and has been an employee of the Manager since July 1995.
JAMES BITETTO, Vice President and Assistant Secretary since August 2005.
Managing Counsel of BNY Mellon and Secretary of the Manager, and an officer of 70 investment companies (comprised of 172 portfolios) managed by the Manager. He is 48 years old and has been an employee of the Manager since December 1996.
JONI LACKS CHARATAN, Vice President and Assistant Secretary since August 2005.
Managing Counsel of BNY Mellon, and an officer of 70 investment companies (comprised of 172 portfolios) managed by the Manager. She is 59 years old and has been an employee of the Manager since October 1988.
JOSEPH M. CHIOFFI, Vice President and Assistant Secretary since August 2005.
Managing Counsel of BNY Mellon, and an officer of 70 investment companies (comprised of 172 portfolios) managed by the Manager. He is 53 years old and has been an employee of the Manager since June 2000.
JOHN B. HAMMALIAN, Vice President and Assistant Secretary since August 2005.
Senior Managing Counsel of BNY Mellon, and an officer of 70 investment companies (comprised of 172 portfolios) managed by the Manager. He is 51 years old and has been an employee of the Manager since February 1991.
MAUREEN E. KANE, Vice President and Assistant Secretary since April 2015.
Managing Counsel of BNY Mellon since July 2014; from October 2004 until July 2014, General Counsel, and from May 2009 until July 2014, Chief Compliance Officer of Century Capital Management. She is an officer of 70 investment companies (comprised of 172 portfolios) managed by the Manager. She is 53 years old and has been an employee of the Manager since July 2014.
The Fund 43
OFFICERS OF THE FUND (Unaudited) (continued)
SARAH S. KELLEHER, Vice President and Assistant Secretary since April 2014.
Senior Counsel of BNY Mellon, and an officer of 70 investment companies (comprised of 172 portfolios) managed by the Manager; from August 2005 to March 2013, Associate General Counsel of Third Avenue Management. She is 39 years old and has been an employee of the Manager since March 2013.
JEFF PRUSNOFSKY, Vice President and Assistant Secretary since August 2005.
Senior Managing Counsel of BNY Mellon, and an officer of 70 investment companies (comprised of 172 portfolios) managed by the Manager. He is 50 years old and has been an employee of the Manager since October 1990.
JAMES WINDELS, Treasurer since November 2001.
Director – Mutual Fund Accounting of the Manager, and an officer of 70 investment companies (comprised of 172 portfolios) managed by the Manager. He is 56 years old and has been an employee of the Manager since April 1985.
RICHARD CASSARO, Assistant Treasurer since January 2008.
Senior Accounting Manager – Money Market and Municipal Bond Funds of the Manager, and an officer of 70 investment companies (comprised of 172 portfolios) managed by the Manager. He is 56 years old and has been an employee of the Manager since September 1982.
GAVIN C. REILLY, Assistant Treasurer since December 2005.
Tax Manager of the Investment Accounting and Support Department of the Manager, and an officer of 70 investment companies (comprised of 172 portfolios) managed by the Manager. He is 46 years old and has been an employee of the Manager since April 1991.
ROBERT S. ROBOL, Assistant Treasurer since August 2002.
Senior Accounting Manager – Fixed Income Funds of the Manager, and an officer of 70 investment companies (comprised of 172 portfolios) managed by the Manager. He is 51 years old and has been an employee of the Manager since October 1988.
ROBERT SALVIOLO, Assistant Treasurer since July 2007.
Senior Accounting Manager – Equity Funds of the Manager, and an officer of 70 investment companies (comprised of 172 portfolios) managed by the Manager. He is 48 years old and has been an employee of the Manager since June 1989.
ROBERT SVAGNA, Assistant Treasurer since December 2002.
Senior Accounting Manager – Equity Funds of the Manager, and an officer of 70 investment companies (comprised of 172 portfolios) managed by the Manager. He is 48 years old and has been an employee of the Manager since November 1990.
JOSEPH W. CONNOLLY, Chief Compliance Officer since October 2004.
Chief Compliance Officer of the Manager and The Dreyfus Family of Funds (70 investment companies, comprised of 172 portfolios). He is 58 years old and has served in various capacities with the Manager since 1980, including manager of the firm’s Fund Accounting Department from 1997 through October 2001.
.
44
For More Information
Telephone Call your financial representative or 1-800-DREYFUS
Mail The Dreyfus Family of Funds, 144 Glenn Curtiss Boulevard, Uniondale, NY 11556-0144
The fund files its complete schedule of portfolio holdings with the Securities and Exchange Commission (“SEC”) for the first and third quarters of each fiscal year on Form N-Q. The fund’s Forms N-Q are available on the SEC’s website at http://www.sec.gov and may be reviewed and copied at the SEC’s Public Reference Room in Washington, DC. Information on the operation of the Public Reference Room may be obtained by calling 1-800-SEC-0330.
A description of the policies and procedures that the fund uses to determine how to vote proxies relating to portfolio securities, and information regarding how the fund voted these proxies for the most recent 12-month period ended June 30 is available at http://www.dreyfus.com and on the SEC’s website at http://www.sec.gov. The description of the policies and procedures is also available without charge, upon request, by calling 1-800-DREYFUS.

|
| Dreyfus |
| Emerging Markets Debt |
| Local Currency Fund |
ANNUAL REPORT May 31, 2015

Save time. Save paper. View your next shareholder report online as soon as it’s available. Log into www.dreyfus.com and sign up for Dreyfus eCommunications. It’s simple and only takes a few minutes.
The views expressed in this report reflect those of the portfolio manager only through the end of the period covered and do not necessarily represent the views of Dreyfus or any other person in the Dreyfus organization. Any such views are subject to change at any time based upon market or other conditions and Dreyfus disclaims any responsibility to update such views.These views may not be relied on as investment advice and, because investment decisions for a Dreyfus fund are based on numerous factors, may not be relied on as an indication of trading intent on behalf of any Dreyfus fund.
|
| Not FDIC-Insured • Not Bank-Guaranteed • May Lose Value |
| | Contents |
| | THE FUND |
| 2 | A Letter from the President |
| 3 | Discussion of Fund Performance |
| 6 | Fund Performance |
| 8 | Understanding Your Fund’s Expenses |
| 8 | Comparing Your Fund’s Expenses With Those of Other Funds |
| 9 | Statement of Investments |
| 14 | Statement of Options Written |
| 15 | Statement of Assets and Liabilities |
| 16 | Statement of Operations |
| 17 | Statement of Changes in Net Assets |
| 19 | Financial Highlights |
| 23 | Notes to Financial Statements |
| 44 | Report of Independent Registered Public Accounting Firm |
| 45 | Information About the Renewal of the Fund’s Management Agreement |
| 50 | Board Members Information |
| 52 | Officers of the Fund |
| | FOR MORE INFORMATION |
| | Back Cover |
Dreyfus
Emerging Markets Debt
Local Currency Fund
The Fund
A LETTER FROM THE PRESIDENT
Dear Shareholder:
We are pleased to present this annual report for Dreyfus Emerging Markets Debt Local Currency Fund, covering the 12-month period from June 1, 2014, through May 31, 2015. For information about how the fund performed during the reporting period, as well as general market perspectives, we provide a Discussion of Fund Performance on the pages that follow.
U.S. bonds produced modestly positive total returns over the first half of the reporting period despite a sustained domestic economic recovery. Developments in overseas markets — including low oil prices and ongoing economic concerns in Europe, Japan, and China — sparked a flight to quality among global investors, who turned away from foreign sovereign bonds in favor of U.S. Treasury securities. In addition, aggressively accommodative monetary policies in Europe and Japan made yields of U.S. Treasury securities relatively attractive. Consequently, intensifying demand put downward pressure on U.S. bond yields over much of the first half of the reporting period. This trend showed signs of reversing amid heightened market volatility in early 2015, when investors began to anticipate higher short-term interest rates and greater inflationary pressures in the United States.
We remain optimistic regarding the long-term outlook for the U.S. economy as labor markets continue to strengthen and foreign currency exchange rates become less volatile.We believe U.S. monetary policy is likely to become less accommodative under these conditions, suggesting that selectivity may become a more important determinant of success in fixed-income markets. As always, we urge you to discuss these observations with your financial advisor, who can help you assess their implications for your investment portfolio.
Thank you for your continued confidence and support.

J. Charles Cardona
President
The Dreyfus Corporation
June 15, 2015
2
DISCUSSION OF FUND PERFORMANCE
For the period of June 1, 2014, through May 31, 2015, as provided by Alexander Kozhemiakin, Javier Murcio and Federico Garcia Zamora, Primary Portfolio Managers
Fund and Market Performance Overview
For the 12-month period ended May 31, 2015, Dreyfus Emerging Markets Debt Local Currency Fund’s Class A shares produced a total return of –16.28%, Class C shares returned –16.88%, Class I shares returned –16.04%, and ClassY shares returned –15.94%.1 In comparison, the fund’s benchmark, JPMorgan Government Bond Index-Emerging Markets Global Diversified, produced a –13.49% total returns for the same period.2 The fund’s former benchmark, the JPMorgan Government Bond Index – Emerging Markets Diversified (the “Index”), produced a –14.29% total return.3
Bonds in the emerging markets proved volatile over the reporting period amid economic uncertainty, and returns were further impaired for U.S. residents by a strengthening U.S. dollar against most other currencies.The fund underperformed the index, primarily due to weakness among holdings in Russia and Brazil.
Please note that effective May 1, 2015, Federico Garcia Zamora became a co-primary portfolio manager of the fund.
The Fund’s Investment Approach
The fund seeks to maximize total return.To pursue its goal, the fund normally invests at least 80% of its assets in emerging market bonds and other debt instruments denominated in the local currency of issue, and in derivative instruments that provide investment exposure to such securities.
When choosing investments, we employ in-depth fundamental country analysis supported by the discipline of quantitative valuation models.A “top down” analysis of macroeconomics and financial and political variables guides country and currency allocations.We also consider technical market factors and the global risk environment. We seek to identify shifts in country fundamentals and consider the risk-adjusted attractiveness of currency and duration returns for each emerging market country.
Adverse Currency Movements Dampened Market Results
Although many emerging economies showed signs of growth during the reporting period, their progress proved uneven in the face of shifting macroeconomic developments. Government and central bank stimulus measures supported the economy
The Fund 3
DISCUSSION OF FUND PERFORMANCE (continued)
of China while India benefited from the beginning of structural reforms. In contrast, plunging oil prices took a toll on economies leveraged to energy and natural resource exports, such as Russia, while Brazil suffered from both structural impediments to growth and tighter monetary policy to bring down inflation. Conversely, lower oil prices provided a tailwind in markets that import energy commodities.
Although economic uncertainty and deflation fears sparked broad-based bond market declines during much of 2014, fixed-income market performance improved in the first half of 2015 in local currency terms. Bonds of oil-importing nations recouped some of their previous losses when investors recognized the benefits of lower fuel costs and more aggressively accommodative monetary policies, and Russian bonds recovered after being punished more severely than warranted by underlying market fundamentals. However, the U.S. dollar appreciated sharply against most other currencies over much of the reporting period, producing significant losses for U.S. residents.
Fund Strategies Produced Mixed Results
The fund’s relative performance was hurt by its holdings in Russia which, despite sound underlying credit fundamentals, struggled with falling oil prices and economic sanctions imposed over the conflict with Ukraine. Overweighted exposure to the Russian ruble more than offset better results from the fund’s Russian bond positions, which benefited from our focus on quasi-sovereign securities over their government-issued counterparts. An overweighted position in Brazilian bonds and the country’s currency, the real, also proved counterproductive. Although currency valuations have dropped to attractive levels, bond yields are attractively high, and the Brazilian government appears to be taking steps to improve its fiscal position, investor sentiment in Brazil remains negative, hurt by government scandals and low commodity prices. The fund’s relative performance also was hindered by underweighted exposure to Turkey and Hungary, where bonds rallied as oil prices declined.
On a more positive note, underweight positions in the Hungarian forint and the Romanian leu helped support the fund’s relative results. Favorable timing in a shift from an overweight to an underweight position in Nigerian bonds and its currency, the naira, further supported performance compared to the benchmark.A relatively heavy position in Polish bonds fared well when robust demand drove yields lower.
The fund employed currency forward contracts to hedge bond positions in countries where currencies appeared unattractive.We also sold out-of-money options on certain currencies to enhance income returns during the reporting period.
4
Differentiated Prospects across Emerging Markets
We currently expect currency exchange rates to rebound over the months ahead as the global economy improves. Moreover, after nearly three years of synchronized economic trends, we recently have seen more differentiated prospects across various emerging markets.With selectivity likely to be a more critical determinant of investment results, we have favored bond markets where yields appear likely to fall in response to monetary easing, such as Poland and certain Latin American countries. We also generally have retained underweighted exposure to emerging-markets currencies, particularly the Hungarian forint, Romanian leu, Korean yuan, Malaysian ringgit, and Thai baht. In contrast, we have identified more attractively valued currencies in Chile, Mexico, Poland, India, and South Africa.
June 15, 2015
Bond funds are subject generally to interest rate, credit, liquidity, and market risks, to varying degrees, all of which are more fully described in the fund’s prospectus. Generally, all other factors being equal, bond prices are inversely related to interest-rate changes, and rate increases can cause price declines.
Foreign bonds are subject to special risks including exposure to currency fluctuations, changing political and economic conditions, and potentially less liquidity. Investments in foreign currencies are subject to the risk that those currencies will decline in value relative to the U.S. dollar. Foreign currencies are also subject to risks caused by inflation, interest rates, budget deficits, and low savings rate, political factors, and government control.The fixed income securities of issuers located in emerging markets can be more volatile and less liquid than those of issuers in more mature economies, and emerging markets generally have less diverse and less mature economic structures and less stable political systems than those of developed countries.The securities of issuers located or doing substantial business in emerging markets are often subject to rapid and large changes in price.
The fund may use derivative instruments, such as options, futures, and options on futures, forward contracts, swaps (including credit default swaps on corporate bonds and asset-backed securities), options on swaps, and other credit derivatives. A small investment in derivatives could have a potentially large impact on the fund’s performance.
|
| 1 Total return includes reinvestment of dividends and any capital gains paid, and does not take into consideration the |
| maximum initial sales charge in the case of Class A shares, or the applicable contingent deferred sales charge imposed |
| on redemptions in the case of Class C shares. Had these charges been reflected, returns would have been lower. Past |
| performance is no guarantee of future results. Share price and investment return fluctuate such that upon redemption, |
| fund shares may be worth more or less than their original cost. |
| 2 SOURCE: FACTSET — JP Morgan Global Bond Index Emerging Markets Global Diversified Index is a |
| comprehensive global local emerging markets index that consists of regularly traded, liquid fixed-rate, domestic currency |
| government bonds and includes countries with debt markets that are readily accessible to foreign investors.The index is |
| market capitalization weighted, with a cap of 10% to any one country. Investors cannot invest directly in any index. |
| 3 SOURCE: FACTSET — The JPMorgan Government Bond Index – Emerging Markets Diversified is a |
| comprehensive global local emerging markets index that consists of regularly traded, liquid fixed-rate, domestic currency |
| government bonds and is restricted to countries with debt markets that lack impediments for foreign investments |
| including regulatory or tax restrictions.The index is market capitalization weighted, with a cap of 10% to any one |
| country.The Index does not include fund fees and expenses to which the fund is subject. Investors cannot invest |
| directly in any index. |
The Fund 5
FUND PERFORMANCE

| |
| † | Source: FactSet |
| †† | The total return figures presented for ClassY shares of the fund reflect the performance of the fund’s Class A shares |
| | for the period prior to 7/1/13 (the inception date for ClassY shares), not reflecting the applicable sales charges for |
| | Class A shares. |
Past performance is not predictive of future performance.
The above graph compares a $10,000 investment made in each of the Class A, Class C, Class I and ClassY shares of Dreyfus Emerging Markets Debt Local Currency Fund on 9/12/08 (inception date) to a $10,000 investment made in the JPMorgan Government Bond Index-Emerging Markets Diversified and JPMorgan Government Bond Index-Emerging Markets Global Diversified (the “Indexes”) on that date. All dividends and capital gain distributions are reinvested.
The fund’s performance shown in the line graph above takes into account the maximum initial sales charge on Class A shares and all other applicable fees and expenses on all classes.The Indexes are comprehensive global local emerging markets indexes, and consist of regularly traded, liquid fixed-rate, domestic currency government bonds. Unlike a mutual fund, the Indexes are not subject to charges, fees and other expenses. Investors cannot invest directly in any index. Further information relating to fund performance, including expense reimbursements, if applicable, is contained in the Financial Highlights section of the prospectus and elsewhere in this report.
6
| | | | | | | |
| Average Annual Total Returns as of 5/31/15 | | | | | | |
| |
| | Inception | | | | | From | |
| | Date | 1 Year | | 5 Years | | Inception | |
| Class A shares | | | | | | | |
| with maximum sales charge (4.5%) | 9/12/08 | -20.06 | % | -0.63 | % | 1.15 | % |
| without sales charge | 9/12/08 | -16.28 | % | 0.29 | % | 1.85 | % |
| Class C shares | | | | | | | |
| with applicable redemption charge † | 9/12/08 | -17.71 | % | -0.47 | % | 1.08 | % |
| without redemption | 9/12/08 | -16.88 | % | -0.47 | % | 1.08 | % |
| Class I shares | 9/12/08 | -16.04 | % | 0.55 | % | 2.13 | % |
| Class Y shares | 7/1/13 | -15.94 | % | 0.47 | %†† | 1.99 | %†† |
| JPMorgan Government Bond Index— | | | | | | | |
| Emerging Markets Diversified | 8/31/08 | -14.29 | % | 2.18 | % | 3.01 | %††† |
| JPMorgan Government Bond Index— | | | | | | | |
| Emerging Markets Global Diversified | 8/31/08 | -13.49 | % | 1.39 | % | 2.76 | %††† |
Past performance is not predictive of future performance.The fund’s performance shown in the graph and table does not reflect the deduction of taxes that a shareholder would pay on fund distributions or the redemption of fund shares. In addition to the performance of Class A shares shown with and without a maximum sales charge, the fund’s performance shown in the table takes into account all other applicable fees and expenses on all classes.
| |
| † | The maximum contingent deferred sales charge for Class C shares is 1% for shares redeemed within one year of the |
| | date of purchase. |
| †† | The total return performance figures presented for ClassY shares of the fund reflect the performance of the fund’s |
| | Class A shares for the period prior to 7/1/13 (the inception date for ClassY shares), not reflecting the applicable |
| | sales charges for Class A shares. |
| ††† | For comparative purposes, the value of the Indexes as of 8/31/08 is used as the beginning value on 9/12/08. |
| | Effective May 1, 2015, the JPMorgan Government Bond Index-Emerging Markets Global Diversified (GBI-EM |
| | Global Diversified) is the benchmark. |
The Fund 7
UNDERSTANDING YOUR FUND’S EXPENSES (Unaudited)
As a mutual fund investor, you pay ongoing expenses, such as management fees and other expenses. Using the information below, you can estimate how these expenses affect your investment and compare them with the expenses of other funds.You also may pay one-time transaction expenses, including sales charges (loads) and redemption fees, which are not shown in this section and would have resulted in higher total expenses. For more information, see your fund’s prospectus or talk to your financial adviser.
Review your fund’s expenses
The table below shows the expenses you would have paid on a $1,000 investment in Dreyfus Emerging Markets Debt Local Currency Fund from December 1, 2014 to May 31, 2015. It also shows how much a $1,000 investment would be worth at the close of the period, assuming actual returns and expenses.
Expenses and Value of a $1,000 Investment
assuming actual returns for the six months ended May 31, 2015
| | | | | | | | |
| | | Class A | | Class C | | Class I | | Class Y |
| Expenses paid per $1,000† | $ | 5.82 | $ | 9.41 | $ | 4.41 | $ | 4.08 |
| Ending value (after expenses) | $ | 899.10 | $ | 895.80 | $ | 900.30 | $ | 901.20 |
COMPARING YOUR FUND’S EXPENSES
WITH THOSE OF OTHER FUNDS (Unaudited)
Using the SEC’s method to compare expenses
The Securities and Exchange Commission (SEC) has established guidelines to help investors assess fund expenses. Per these guidelines, the table below shows your fund’s expenses based on a $1,000 investment, assuming a hypothetical 5% annualized return. You can use this information to compare the ongoing expenses (but not transaction expenses or total cost) of investing in the fund with those of other funds. All mutual fund shareholder reports will provide this information to help you make this comparison. Please note that you cannot use this information to estimate your actual ending account balance and expenses paid during the period.
Expenses and Value of a $1,000 Investment
assuming a hypothetical 5% annualized return for the six months ended May 31, 2015
| | | | | | | | |
| | | Class A | | Class C | | Class I | | Class Y |
| Expenses paid per $1,000† | $ | 6.19 | $ | 10.00 | $ | 4.68 | $ | 4.33 |
| Ending value (after expenses) | $ | 1,018.80 | $ | 1,015.01 | $ | 1,020.29 | $ | 1,020.64 |
|
| † Expenses are equal to the fund’s annualized expense ratio of 1.23% for Class A, 1.99% for Class C, .93% for |
| Class I and .86% for ClassY, multiplied by the average account value over the period, multiplied by 182/365 (to |
| reflect the one-half year period). |
8
|
| STATEMENT OF INVESTMENTS |
| May 31, 2015 |
| | | | | | |
| | | Coupon | Maturity | Principal | |
| Bonds and Notes—86.5% | | Rate (%) | Date | Amount ($)a | Value ($) |
| Foreign/Governmental | | | | | | |
| AHML Finance, | | | | | | |
| Unscd. Notes | RUB | 7.75 | 2/13/18 | 2,121,500,000 | | 36,047,478 |
| Brazilian Government, | | | | | | |
| Sr. Notes, Ser. F | BRL | 10.00 | 1/1/17 | 181,960,000 | | 57,033,436 |
| Brazilian Government, | | | | | | |
| Notes, Ser. F | BRL | 10.00 | 1/1/23 | 207,070,000 | | 60,960,711 |
| Brazilian Government, | | | | | | |
| Notes, Ser. F | BRL | 10.00 | 1/1/25 | 77,090,000 | | 22,320,607 |
| Chilean Government, | | | | | | |
| Sr. Unscd. Notes | CLP | 5.50 | 8/5/20 | 3,870,000,000 | | 6,672,036 |
| Colombian Government, | | | | | | |
| Bonds, Ser. B | COP | 6.00 | 4/28/28 | 4,259,500,000 | | 1,489,300 |
| Colombian Government, | | | | | | |
| Bonds, Ser. B | COP | 7.00 | 5/4/22 | 46,878,500,000 | | 19,084,235 |
| Colombian Government, | | | | | | |
| Bonds, Ser. B | COP | 7.75 | 9/18/30 | 37,446,100,000 | | 15,056,912 |
| Colombian Government, | | | | | | |
| Bonds, Ser. B | COP | 10.00 | 7/24/24 | 27,199,600,000 | | 12,990,437 |
| Empresas Publicas | | | | | | |
| de Medellin, Sr. | | | | | | |
| Unscd. Notes | COP | 7.63 | 9/10/24 | 7,775,000,000 | b | 3,025,830 |
| Empresas Publicas | | | | | | |
| de Medellin, Sr. | | | | | | |
| Unscd. Notes | COP | 7.63 | 9/10/24 | 27,850,000,000 | | 10,866,011 |
| Empresas Publicas | | | | | | |
| de Medellin, Sr. | | | | | | |
| Unscd. Notes | COP | 8.38 | 2/1/21 | 10,000,000,000 | | 4,201,106 |
| Eskom Holdings, | | | | | | |
| Sr. Scd. Bonds | ZAR | 0.00 | 12/31/18 | 373,600,000 | c | 21,076,150 |
| Findeter, | | | | | | |
| Sr. Unscd. Notes | COP | 7.88 | 8/12/24 | 19,500,000,000 | b | 7,723,726 |
| Hungarian Government, | | | | | | |
| Bonds, Ser. 20/B | HUF | 3.50 | 6/24/20 | 1,150,000,000 | | 4,243,717 |
| Hungarian Government, | | | | | | |
| Bonds, Ser. 25/B | HUF | 5.50 | 6/24/25 | 1,600,000,000 | | 6,658,617 |
| Hungarian Government, | | | | | | |
| Bonds, Ser. 23/A | HUF | 6.00 | 11/24/23 | 1,268,790,000 | | 5,373,730 |
The Fund 9
STATEMENT OF INVESTMENTS (continued)
| | | | | |
| | | Coupon | Maturity | Principal | |
| Bonds and Notes (continued) | Rate (%) | Date | Amount ($)a | Value ($) |
| Foreign/Governmental | | | | | |
| (continued) | | | | | |
| Indonesian Government, | | | | | |
| Sr. Unscd. Bonds, | | | | | |
| Ser. FR58 | IDR | 8.25 | 6/15/32 | 128,500,000,000 | 9,593,287 |
| Indonesian Government, | | | | | |
| Sr. Unscd. Bonds, | | | | | |
| Ser. FR70 | IDR | 8.38 | 3/15/24 | 497,000,000,000 | 38,193,908 |
| Indonesian Government, | | | | | |
| Sr. Unscd. Bonds, | | | | | |
| Ser. FR68 | IDR | 8.38 | 3/15/34 | 129,800,000,000 | 9,861,728 |
| Indonesian Government, | | | | | |
| Sr. Unscd. Bonds, | | | | | |
| Ser. FR71 | IDR | 9.00 | 3/15/29 | 241,000,000,000 | 19,296,055 |
| Malaysian Government, | | | | | |
| Sr. Unscd. Bonds, | | | | | |
| Ser. 0512 | MYR | 3.31 | 10/31/17 | 47,000,000 | 12,818,500 |
| Malaysian Government, | | | | | |
| Sr. Unscd. Bonds, | | | | | |
| Ser. 0511 | MYR | 3.58 | 9/28/18 | 9,700,000 | 2,647,698 |
| Malaysian Government, | | | | | |
| Sr. Unscd. Bonds, | | | | | |
| Ser. 0413 | MYR | 3.84 | 4/15/33 | 42,090,000 | 10,842,193 |
| Malaysian Government, | | | | | |
| Sr. Unscd. Bonds, | | | | | |
| Ser. 0114 | MYR | 4.18 | 7/15/24 | 46,250,000 | 12,817,142 |
| Malaysian Government, | | | | | |
| Sr. Unscd. Bonds, | | | | | |
| Ser. 1/06 | MYR | 4.26 | 9/15/16 | 17,040,000 | 4,716,059 |
| Mexican Government, | | | | | |
| Bonds, Ser. S | MXN | 4.00 | 11/15/40 | 9,340,000 | 3,483,107 |
| Mexican Government, | | | | | |
| Bonds, Ser. M | MXN | 5.00 | 6/15/17 | 260,000,000 | 17,252,064 |
| Mexican Government, | | | | | |
| Bonds, Ser. M | MXN | 6.25 | 6/16/16 | 168,800,000 | 11,303,951 |
10
| | | | | | |
| | | Coupon | Maturity | Principal | |
| Bonds and Notes (continued) | Rate (%) | Date | Amount ($)a | Value ($) |
| Foreign/Governmental | | | | | | |
| (continued) | | | | | | |
| Mexican Government, | | | | | | |
| Bonds, Ser. M 20 | MXN | 10.00 | 12/5/24 | 188,660,000 | | 15,802,249 |
| Petroleos Mexicanos, | | | | | | |
| Gtd. Notes | MXN | 7.19 | 9/12/24 | 179,270,000 | | 11,339,055 |
| Petroleos Mexicanos, | | | | | | |
| Gtd. Notes | MXN | 7.19 | 9/12/24 | 544,800,000 | b | 34,459,293 |
| Petroleos Mexicanos, | | | | | | |
| Gtd. Notes | MXN | 7.65 | 11/24/21 | 118,000,000 | | 7,904,036 |
| Petroleos Mexicanos, | | | | | | |
| Gtd. Notes | MXN | 7.65 | 11/24/21 | 493,035,000 | b | 33,025,139 |
| Philippine Government, | | | | | | |
| Sr. Unscd. Notes | PHP | 4.95 | 1/15/21 | 1,061,000,000 | | 25,334,733 |
| Philippine Government, | | | | | | |
| Sr. Unscd. Bonds | PHP | 6.25 | 1/14/36 | 80,000,000 | | 2,085,128 |
| Polish Government, | | | | | | |
| Bonds, Ser. 0725 | PLN | 3.25 | 7/25/25 | 47,510,000 | | 13,070,401 |
| Polish Government, | | | | | | |
| Bonds, Ser. 1023 | PLN | 4.00 | 10/25/23 | 89,740,000 | | 26,074,484 |
| Polish Government, | | | | | | |
| Bonds, Ser. 0922 | PLN | 5.75 | 9/23/22 | 29,110,000 | | 9,318,459 |
| Romanian Government, | | | | | | |
| Bonds, Ser. 5Y | RON | 5.90 | 7/26/17 | 28,960,000 | | 7,808,788 |
| RusHydro, | | | | | | |
| Sr. Unscd. Notes | RUB | 7.88 | 10/28/15 | 738,900,000 | | 13,845,647 |
| Russian Agricultural Bank, | | | | | | |
| Sr. Unscd. Notes | RUB | 7.88 | 2/7/18 | 938,300,000 | | 16,102,543 |
| Russian Agricultural Bank, | | | | | | |
| Sr. Unscd. Notes | RUB | 8.63 | 2/17/17 | 515,900,000 | | 9,254,292 |
| Russian Agricultural Bank, | | | | | | |
| Sr. Unscd. Notes | RUB | 8.70 | 3/17/16 | 520,400,000 | | 9,709,431 |
| South African Government, | | | | | | |
| Bonds, Ser. R213 | ZAR | 7.00 | 2/28/31 | 32,900,000 | | 2,331,714 |
The Fund 11
STATEMENT OF INVESTMENTS (continued)
| | | | | | | |
| | | Coupon | Maturity | Principal | | | |
| Bonds and Notes (continued) | Rate (%) | Date | Amount ($)a | | Value ($) |
| Foreign/Governmental | | | | | | | |
| (continued) | | | | | | | |
| South African Government, | | | | | | | |
| Bonds, Ser. R207 | ZAR | 7.25 | 1/15/20 | 289,575,000 | | | 23,473,082 |
| South African Government, | | | | | | | |
| Bonds, Ser. R186 | ZAR | 10.50 | 12/21/26 | 839,970,000 | | | 81,481,188 |
| Thai Government, | | | | | | | |
| Sr. Unscd. Bonds, Ser. ILB | THB | 1.20 | 7/14/21 | 324,000,000 | d | | 9,881,791 |
| Thai Government, | | | | | | | |
| Unscd. Bonds, Ser. ILB | THB | 1.25 | 3/12/28 | 559,500,000 | d | | 15,382,173 |
| Transnet, | | | | | | | |
| Sr. Unscd. Notes | ZAR | 9.50 | 5/13/21 | 153,620,000 | b | | 12,508,556 |
| Turkish Government, | | | | | | | |
| Bonds | TRY | 7.10 | 3/8/23 | 43,500,000 | | | 14,614,641 |
| Turkish Government, | | | | | | | |
| Bonds | TRY | 8.80 | 9/27/23 | 63,340,000 | | | 23,516,532 |
| Turkish Government, | | | | | | | |
| Bonds | TRY | 10.40 | 3/20/24 | 22,300,000 | | | 9,079,307 |
| Turkish Government, | | | | | | | |
| Bonds | TRY | 10.50 | 1/15/20 | 58,997,282 | | | 23,455,322 |
| Total Bonds and Notes | | | | | | | |
| (cost $1,145,008,318) | | | | | | | 898,507,715 |
| |
Short-Term Investments—.9% | | | | | | |
| U.S. Treasury Bills: | | | | | | | |
| 0.04%, 10/29/15 | | | | 4,880,000 | e | 4,879,288 |
| 0.05%, 8/13/15 | | | | 4,645,000 | e | 4,645,000 |
| Total Short-Term Investments | | | | | | |
| (cost $9,523,679) | | | | | | | 9,524,288 |
12
| | | |
| Other Investment—4.1% | Shares | | Value ($) |
| Registered Investment Company; | | | |
| Dreyfus Institutional Preferred | | | |
| Plus Money Market Fund | | | |
| (cost $42,460,399) | 42,460,399 | f | 42,460,399 |
| Total Investments (cost $1,196,992,396) | 91.5 | % | 950,492,402 |
| Cash and Receivables (Net) | 8.5 | % | 88,098,322 |
| Net Assets | 100.0 | % | 1,038,590,724 |
|
| a Principal amount stated in U.S. Dollars unless otherwise noted. |
| BRL—Brazilian Real |
| CLP—Chilean Peso |
| COP—Colombian Peso |
| HUF—Hungarian Forint |
| IDR—Indonesian Rupiah |
| MXN—Mexican New Peso |
| MYR—Malaysian Ringgit |
| PHP—Philippine Peso |
| PLN—Polish Zloty |
| RON—Romanian Leu |
| RUB—Russian Ruble |
| THB—Thai Baht |
| TRY—Turkish Lira |
| ZAR—South African Rand |
| b Securities exempt from registration pursuant to Rule 144A under the Securities Act of 1933.These securities may be |
| resold in transactions exempt from registration, normally to qualified institutional buyers.At May 31, 2015, these |
| securities were valued at $90,742,544 or 8.7% of net assets. |
| c Security issued with a zero coupon. Income is recognized through the accretion of discount. |
| d Principal amount for accrual purposes is periodically adjusted based on changes in the Thai Consumer Price Index. |
| e A portion of the investment is held as collateral at broker for open forward foreign currency exchange contracts. |
| f Investment in affiliated money market mutual fund. |
| | | |
| Portfolio Summary (Unaudited)† | | |
| |
| Value (%) | | Value (%) |
| South Africa | 13.6 | Poland | 4.7 |
| Brazil | 13.5 | Malaysia | 4.2 |
| Mexico | 13.0 | Philippines | 2.6 |
| Russia | 8.2 | Thailand | 2.4 |
| Indonesia | 7.4 | Hungary | 1.6 |
| Colombia | 7.2 | Romania | .7 |
| Turkey | 6.8 | Chile | .6 |
| Short-Term/Money Market Investments | 5.0 | | 91.5 |
|
| † Based on net assets. |
| See notes to financial statements. |
The Fund 13
|
| STATEMENT OF OPTIONS WRITTEN |
| May 31, 2015 |
| | | |
| | Face Amount | | |
| | Covered by | | |
| | Contracts ($) | Value ($) | |
| Call Options | | | |
| Brazilian Real, | | | |
| June 2015 @ BRL 3.50 | 16,500,000 | (2,604 | ) |
| Brazilian Real, | | | |
| August 2015 @ BRL 3.40 | 10,400,000 | (235,289 | ) |
| Colombian Peso, | | | |
| August 2015 @ COP 2,650 | 10,500,000 | (206,099 | ) |
| Hungarian Forint, | | | |
| July 2015 @ HUF 295 | 10,600,000 | (71,498 | ) |
| Malaysian Ringgit, | | | |
| July 2015 @ MYR 3.77 | 10,800,000 | (65,844 | ) |
| South African Rand, | | | |
| July 2015 @ ZAR 13 | 10,900,000 | (63,142 | ) |
| South Korean Won, | | | |
| August 2015 @ KRW 1,120 | 10,500,000 | (162,734 | ) |
| Turkish Lira, | | | |
| August 2015 @ TRY 2.90 | 7,900,000 | (64,831 | ) |
| Put Options: | | | |
| Brazilian Real, | | | |
| June 2015 @ BRL 3.10 | 16,500,000 | (56,504 | ) |
| Brazilian Real, | | | |
| August 2015 @ BRL 2.80 | 10,600,000 | (6,404 | ) |
| Brazilian Real, | | | |
| August 2015 @ BRL 2.97 | 10,500,000 | (34,306 | ) |
| Mexican New Peso, | | | |
| August 2015 @ MXN 14.70 | 10,600,000 | (37,471 | ) |
| Polish Zloty, | | | |
| June 2015 @ PLN 3.60 | 11,100,000 | (28,974 | ) |
| Polish Zloty, | | | |
| July 2015 @ PLN 3.65 | 10,700,000 | (82,756 | ) |
| (premiums received $2,069,919) | | (1,118,456 | ) |
|
| BRL—Brazilian Real |
| COP—Colombian Peso |
| HUF—Hungarian Forint |
| KRW—South Korean Won |
| MXN—Mexican New Peso |
| MYR—Malaysian Ringgit |
| PLN—Polish Zloty |
| TRY—Turkish Lira |
| ZAR—South African Rand |
| See notes to financial statements. |
14
|
| STATEMENT OF ASSETS AND LIABILITIES |
| May 31, 2015 |
| | | | | |
| | | | Cost | Value | |
| Assets ($): | | | | | |
| Investments in securities—See Statement of Investments: | | | |
| Unaffiliated issuers | | | 1,154,531,997 | 908,032,003 | |
| Affiliated issuers | | | 42,460,399 | 42,460,399 | |
| Cash denominated in foreign currencies | | 3,494,300 | 3,467,098 | |
| Receivable for investment securities sold | | | 65,072,590 | |
| Dividends and interest receivable | | | | 21,067,550 | |
| Unrealized appreciation on forward foreign | | | | |
| currency exchange contracts—Note 4 | | | 7,521,365 | |
| Unrealized appreciation on swap agreements—Note 4 | | | 1,150,834 | |
| Receivable for shares of Beneficial Interest subscribed | | | 573,494 | |
| Receivable from broker for swap transactions—Note 4 | | | 105,717 | |
| Prepaid expenses | | | | 30,003 | |
| | | | | 1,049,481,053 | |
| Liabilities ($): | | | | | |
| Due to The Dreyfus Corporation and affiliates—Note 3(c) | | 1,129,114 | |
| Cash overdraft due to Custodian | | | | 4,441,512 | |
| Unrealized depreciation on forward foreign currency exchange contracts—Note 4 | 2,897,929 | |
| Outstanding options written, at value (premiums received | | | |
| $2,069,919)—See Statement of Options Written—Note 4 | | 1,118,456 | |
| Payable for shares of Beneficial Interest redeemed | | | 743,253 | |
| Payable for investment securities purchased | | | 333,642 | |
| Payable to broker for swap transactions—Note 4 | | | 51,457 | |
| Accrued expenses | | | | 174,966 | |
| | | | | 10,890,329 | |
| Net Assets ($) | | | 1,038,590,724 | |
| Composition of Net Assets ($): | | | | | |
| Paid-in capital | | | | 1,513,406,430 | |
| Accumulated investment (loss)—net | | | | (94,734,568 | ) |
| Accumulated net realized gain (loss) on investments | | | (139,948,408 | ) |
| Accumulated net unrealized appreciation (depreciation) on investments, | | |
| options transactions, swap transactions and foreign currency transactions | (240,132,730 | ) |
| Net Assets ($) | | | 1,038,590,724 | |
| |
| |
| |
| Net Asset Value Per Share | | | | | |
| | Class A | Class C | Class I | Class Y | |
| Net Assets ($) | 18,157,580 | 6,294,932 | 916,136,372 | 98,001,840 | |
| Shares Outstanding | 1,526,484 | 541,164 | 76,625,941 | 8,193,762 | |
| Net Asset Value Per Share ($) | 11.90 | 11.63 | 11.96 | 11.96 | |
See notes to financial statements.
The Fund 15
|
| STATEMENT OF OPERATIONS |
| Year Ended May 31, 2015 |
| | |
| Investment Income ($): | | |
| Income: | | |
| Interest (net of $101,306 foreign taxes withheld at source) | 95,465,749 | |
| Dividends; | | |
| Affiliated issuers | 51,515 | |
| Total Income | 95,517,264 | |
| Expenses: | | |
| Management fee—Note 3(a) | 10,663,716 | |
| Custodian fees—Note 3(c) | 1,220,823 | |
| Shareholder servicing costs—Note 3(c) | 1,185,090 | |
| Professional fees | 119,567 | |
| Distribution fees—Note 3(b) | 75,007 | |
| Registration fees | 73,836 | |
| Trustees’ fees and expenses—Note 3(d) | 65,856 | |
| Prospectus and shareholders’ reports | 63,966 | |
| Loan commitment fees—Note 2 | 12,872 | |
| Interest expense—Note 2 | 1,267 | |
| Miscellaneous | 56,854 | |
| Total Expenses | 13,538,854 | |
| Less—reduction in fees due to earnings credits—Note 3(c) | (2,201 | ) |
| Net Expenses | 13,536,653 | |
| Investment Income—Net | 81,980,611 | |
| Realized and Unrealized Gain (Loss) on Investments—Note 4 ($): | | |
| Net realized gain (loss) on investments and foreign currency transactions | (200,280,169 | ) |
| Net realized gain (loss) on options transactions | 1,030,524 | |
| Net realized gain (loss) on swap transactions | 3,886,775 | |
| Net realized gain (loss) on forward foreign currency exchange contracts | (13,857,403 | ) |
| Net Realized Gain (Loss) | (209,220,273 | ) |
| Net unrealized appreciation (depreciation) on | | |
| investments and foreign currency transactions | (129,178,577 | ) |
| Net unrealized appreciation (depreciation) on options transactions | 951,463 | |
| Net unrealized appreciation (depreciation) on swap transactions | (2,012,968 | ) |
| Net unrealized appreciation (depreciation) on | | |
| forward foreign currency exchange contracts | 2,822,820 | |
| Net Unrealized Appreciation (Depreciation) | (127,417,262 | ) |
| Net Realized and Unrealized Gain (Loss) on Investments | (336,637,535 | ) |
| Net (Decrease) in Net Assets Resulting from Operations | (254,656,924 | ) |
| |
| See notes to financial statements. | | |
16
STATEMENT OF CHANGES IN NET ASSETS
| | | | |
| | | | Year Ended May 31, | |
| | 2015 | | 2014 | a |
| Operations ($): | | | | |
| Investment income—net | 81,980,611 | | 139,281,482 | |
| Net realized gain (loss) on investments | (209,220,273 | ) | (204,458,707 | ) |
| Net unrealized appreciation | | | | |
| (depreciation) on investments | (127,417,262 | ) | 7,212,581 | |
| Net Increase (Decrease) in Net Assets | | | | |
| Resulting from Operations | (254,656,924 | ) | (57,964,644 | ) |
| Dividends to Shareholders from ($): | | | | |
| Investment income—net: | | | | |
| Class A | (311,737 | ) | (1,078,242 | ) |
| Class C | (73,872 | ) | (269,125 | ) |
| Class I | (15,955,910 | ) | (61,750,376 | ) |
| Class Y | (1,443,662 | ) | (470,790 | ) |
| Net realized gain on investments: | | | | |
| Class A | — | | (295,012 | ) |
| Class C | — | | (92,917 | ) |
| Class I | — | | (10,955,231 | ) |
| Class Y | — | | (359,606 | ) |
| Total Dividends | (17,785,181 | ) | (75,271,299 | ) |
| Beneficial Interest Transactions ($): | | | | |
| Net proceeds from shares sold: | | | | |
| Class A | 5,972,030 | | 11,554,307 | |
| Class C | 278,121 | | 1,481,031 | |
| Class I | 365,909,948 | | 1,063,012,099 | |
| Class Y | 69,437,978 | | 77,640,776 | |
| Dividends reinvested: | | | | |
| Class A | 275,350 | | 1,111,156 | |
| Class C | 33,759 | | 133,875 | |
| Class I | 3,987,421 | | 24,752,594 | |
| Class Y | 1,175,537 | | 830,384 | |
| Cost of shares redeemed: | | | | |
| Class A | (30,675,198 | ) | (51,923,825 | ) |
| Class C | (6,741,236 | ) | (12,589,492 | ) |
| Class I | (903,040,586 | ) | (3,234,905,480 | ) |
| Class Y | (31,047,271 | ) | — | |
| Increase (Decrease) in Net Assets from | | | | |
| Beneficial Interest Transactions | (524,434,147 | ) | (2,118,902,575 | ) |
| Total Increase (Decrease) in Net Assets | (796,876,252 | ) | (2,252,138,518 | ) |
| Net Assets ($): | | | | |
| Beginning of Period | 1,835,466,976 | | 4,087,605,494 | |
| End of Period | 1,038,590,724 | | 1,835,466,976 | |
| Undistributed investment income (loss)—net | (94,734,568 | ) | 1,281,549 | |
The Fund 17
STATEMENT OF CHANGES IN NET ASSETS (continued)
| | | | |
| | | | Year Ended May 31, | |
| | 2015 | | 2014 | a |
| Capital Share Transactions: | | | | |
| Class A | | | | |
| Shares sold | 439,518 | | 832,740 | |
| Shares issued for dividends reinvested | 21,293 | | 79,828 | |
| Shares redeemed | (2,253,824 | ) | (3,722,841 | ) |
| Net Increase (Decrease) in Shares Outstanding | (1,793,013 | ) | (2,810,273 | ) |
| Class C | | | | |
| Shares sold | 21,361 | | 106,680 | |
| Shares issued for dividends reinvested | 2,643 | | 9,765 | |
| Shares redeemed | (521,500 | ) | (921,629 | ) |
| Net Increase (Decrease) in Shares Outstanding | (497,496 | ) | (805,184 | ) |
| Class Ib | | | | |
| Shares sold | 27,610,965 | | 76,055,045 | |
| Shares issued for dividends reinvested | 306,578 | | 1,775,174 | |
| Shares redeemed | (68,762,627 | ) | (232,320,128 | ) |
| Net Increase (Decrease) in Shares Outstanding | (40,845,084 | ) | (154,489,909 | ) |
| Class Yb | | | | |
| Shares sold | 4,980,797 | | 5,406,461 | |
| Shares issued for dividends reinvested | 91,290 | | 59,288 | |
| Shares redeemed | (2,344,074 | ) | — | |
| Net Increase (Decrease) in Shares Outstanding | 2,728,013 | | 5,465,749 | |
|
| a Effective July 1, 2013, the fund commenced offering ClassY shares. |
| b During the period ended May 31, 2015, 3,487,947 Class I shares representing $50,928,635 were exchanged for |
| 3,485,560 ClassY shares. |
See notes to financial statements.
18
FINANCIAL HIGHLIGHTS
The following tables describe the performance for each share class for the fiscal periods indicated. All information (except portfolio turnover rate) reflects financial results for a single fund share.Total return shows how much your investment in the fund would have increased (or decreased) during each period, assuming you had reinvested all dividends and distributions.These figures have been derived from the fund’s financial statements.
| | | | | | | | | | |
| | | | Year Ended May 31, | | | |
| Class A Shares | 2015 | | 2014 | | 2013 | | 2012 | | 2011 | |
| Per Share Data ($): | | | | | | | | | | |
| Net asset value, beginning of period | 14.38 | | 14.57 | | 13.32 | | 15.22 | | 13.39 | |
| Investment Operations: | | | | | | | | | | |
| Investment income—neta | .75 | | .64 | | .61 | | .67 | | .65 | |
| Net realized and unrealized | | | | | | | | | | |
| gain (loss) on investments | (3.08 | ) | (.55 | ) | .98 | | (1.87 | ) | 1.61 | |
| Total from Investment Operations | (2.33 | ) | .09 | | 1.59 | | (1.20 | ) | 2.26 | |
| Distributions: | | | | | | | | | | |
| Dividends from investment income—net | (.15 | ) | (.21 | ) | (.34 | ) | (.59 | ) | (.36 | ) |
| Dividends from net realized | | | | | | | | | | |
| gain on investments | — | | (.07 | ) | — | | (.11 | ) | (.07 | ) |
| Total Distributions | (.15 | ) | (.28 | ) | (.34 | ) | (.70 | ) | (.43 | ) |
| Net asset value, end of period | 11.90 | | 14.38 | | 14.57 | | 13.32 | | 15.22 | |
| Total Return (%)b | (16.28 | ) | .62 | | 11.83 | | (8.12 | ) | 17.21 | |
| Ratios/Supplemental Data (%): | | | | | | | | | | |
| Ratio of total expenses | | | | | | | | | | |
| to average net assets | 1.25 | | 1.25 | | 1.24 | | 1.22 | | 1.27 | |
| Ratio of net expenses | | | | | | | | | | |
| to average net assets | 1.25 | | 1.25 | | 1.24 | | 1.22 | | 1.27 | |
| Ratio of net investment income | | | | | | | | | | |
| to average net assets | 5.68 | | 4.59 | | 4.09 | | 4.64 | | 4.48 | |
| Portfolio Turnover Rate | 61.03 | | 61.76 | | 58.82 | | 112.87 | | 97.99 | |
| Net Assets, end of period ($ x 1,000) | 18,158 | | 47,720 | | 89,327 | | 78,351 | | 79,957 | |
| |
| a | Based on average shares outstanding. |
| b | Exclusive of sales charge. |
See notes to financial statements.
The Fund 19
FINANCIAL HIGHLIGHTS (continued)
| | | | | | | | | | |
| | | | Year Ended May 31, | | | |
| Class C Shares | 2015 | | 2014 | | 2013 | | 2012 | | 2011 | |
| Per Share Data ($): | | | | | | | | | | |
| Net asset value, beginning of period | 14.11 | | 14.35 | | 13.14 | | 15.06 | | 13.29 | |
| Investment Operations: | | | | | | | | | | |
| Investment income—neta | .63 | | .56 | | .48 | | .55 | | .53 | |
| Net realized and unrealized | | | | | | | | | | |
| gain (loss) on investments | (3.01 | ) | (.57 | ) | .97 | | (1.85 | ) | 1.60 | |
| Total from Investment Operations | (2.38 | ) | (.01 | ) | 1.45 | | (1.30 | ) | 2.13 | |
| Distributions: | | | | | | | | | | |
| Dividends from investment income—net | (.10 | ) | (.16 | ) | (.24 | ) | (.51 | ) | (.29 | ) |
| Dividends from net realized | | | | | | | | | | |
| gain on investments | — | | (.07 | ) | — | | (.11 | ) | (.07 | ) |
| Total Distributions | (.10 | ) | (.23 | ) | (.24 | ) | (.62 | ) | (.36 | ) |
| Net asset value, end of period | 11.63 | | 14.11 | | 14.35 | | 13.14 | | 15.06 | |
| Total Return (%)b | (16.88 | ) | (.12 | ) | 10.98 | | (8.83 | ) | 16.28 | |
| Ratios/Supplemental Data (%): | | | | | | | | | | |
| Ratio of total expenses | | | | | | | | | | |
| to average net assets | 2.00 | | 1.99 | | 2.00 | | 1.96 | | 1.99 | |
| Ratio of net expenses | | | | | | | | | | |
| to average net assets | 2.00 | | 1.99 | | 2.00 | | 1.96 | | 1.99 | |
| Ratio of net investment income | | | | | | | | | | |
| to average net assets | 4.83 | | 4.04 | | 3.25 | | 3.84 | | 3.65 | |
| Portfolio Turnover Rate | 61.03 | | 61.76 | | 58.82 | | 112.87 | | 97.99 | |
| Net Assets, end of period ($ x 1,000) | 6,295 | | 14,651 | | 26,463 | | 24,306 | | 14,953 | |
| |
| a | Based on average shares outstanding. |
| b | Exclusive of sales charge. |
See notes to financial statements.
20
| | | | | | | | | | |
| | | | | | Year Ended May 31, | | | |
| Class I Shares | 2015 | | 2014 | | 2013 | | 2012 | | 2011 | |
| Per Share Data ($): | | | | | | | | | | |
| Net asset value, beginning of period | 14.42 | | 14.60 | | 13.34 | | 15.25 | | 13.42 | |
| Investment Operations: | | | | | | | | | | |
| Investment income—neta | .77 | | .69 | | .65 | | .70 | | .69 | |
| Net realized and unrealized | | | | | | | | | | |
| gain (loss) on investments | (3.06 | ) | (.56 | ) | .99 | | (1.88 | ) | 1.62 | |
| Total from Investment Operations | (2.29 | ) | .13 | | 1.64 | | (1.18 | ) | 2.31 | |
| Distributions: | | | | | | | | | | |
| Dividends from investment income—net | (.17 | ) | (.24 | ) | (.38 | ) | (.62 | ) | (.41 | ) |
| Dividends from net realized | | | | | | | | | | |
| gain on investments | — | | (.07 | ) | — | | (.11 | ) | (.07 | ) |
| Total Distributions | (.17 | ) | (.31 | ) | (.38 | ) | (.73 | ) | (.48 | ) |
| Net asset value, end of period | 11.96 | | 14.42 | | 14.60 | | 13.34 | | 15.25 | |
| Total Return (%) | (16.04 | ) | .94 | | 12.18 | | (7.94 | ) | 17.45 | |
| Ratios/Supplemental Data (%): | | | | | | | | | | |
| Ratio of total expenses | | | | | | | | | | |
| to average net assets | .94 | | 1.00 | | .94 | | .93 | | .97 | |
| Ratio of net expenses | | | | | | | | | | |
| to average net assets | .94 | | 1.00 | | .94 | | .93 | | .97 | |
| Ratio of net investment income | | | | | | | | | | |
| to average net assets | 5.80 | | 4.96 | | 4.35 | | 4.88 | | 4.73 | |
| Portfolio Turnover Rate | 61.03 | | 61.76 | | 58.82 | | 112.87 | | 97.99 | |
| Net Assets, end of period ($ x 1,000) | 916,136 | | 1,694,214 | | 3,971,815 | | 2,783,546 | | 2,304,400 | |
|
| a Based on average shares outstanding. |
| See notes to financial statements. |

FINANCIAL HIGHLIGHTS (continued)
| | | | |
| | | | Year Ended May 31, | |
| Class Y Shares | 2015 | | 2014 | a |
| Per Share Data ($): | | | | |
| Net asset value, beginning of period | 14.43 | | 13.89 | |
| Investment Operations: | | | | |
| Investment income—netb | .73 | | .63 | |
| Net realized and unrealized | | | | |
| gain (loss) on investments | (3.02 | ) | .07 | |
| Total from Investment Operations | (2.29 | ) | .70 | |
| Distributions: | | | | |
| Dividends from investment income—net | (.18 | ) | (.09 | ) |
| Dividends from net realized gain on investments | — | | (.07 | ) |
| Total Distributions | (.18 | ) | (.16 | ) |
| Net asset value, end of period | 11.96 | | 14.43 | |
| Total Return (%) | (15.94 | ) | 5.04 | c |
| Ratios/Supplemental Data (%): | | | | |
| Ratio of total expenses to average net assets | .88 | | .92 | d |
| Ratio of net expenses to average net assets | .88 | | .92 | d |
| Ratio of net investment income | | | | |
| to average net assets | 5.50 | | 5.39 | d |
| Portfolio Turnover Rate | 61.03 | | 61.76 | |
| Net Assets, end of period ($ x 1,000) | 98,002 | | 78,882 | |
| |
| a | From July 1, 2013 (commencement of initial offering) to May 31, 2014. |
| b | Based on average shares outstanding. |
| c | Not annualized. |
| d | Annualized. |
See notes to financial statements.
22
NOTES TO FINANCIAL STATEMENTS
NOTE 1—Significant Accounting Policies:
Dreyfus Emerging Markets Debt Local Currency Fund (the “fund”) is a separate non-diversified series of The Dreyfus/Laurel Funds Trust (the “Trust”), which is registered under the Investment Company Act of 1940, as amended (the “Act”), as an open-end management investment company and operates as a series company offering five series, including the fund. The fund’s investment objective is to seek to maximize total return. The Dreyfus Corporation (the “Manager” or “Dreyfus”), a wholly-owned subsidiary of The Bank of New York Mellon Corporation (“BNY Mellon”), serves as the fund’s investment adviser.
MBSC Securities Corporation (the “Distributor”), a wholly-owned subsidiary of Dreyfus, is the distributor of the fund’s shares. The fund is authorized to issue an unlimited number of $.001 par value shares of Beneficial Interest in each of the following classes of shares: Class A, Class C, Class I and Class Y. Class A and Class C shares are sold primarily to retail investors through financial intermediaries and bear Distribution and/or Shareholder Services Plan fees. Class A shares generally are subject to a sales charge imposed at the time of purchase. Class C shares are subject to a contingent deferred sales charge (“CDSC”) imposed on Class C shares redeemed within one year of purchase. Class I shares are sold primarily to bank trust departments and other financial service providers (including The Bank of New York Mellon, a subsidiary of BNY Mellon and an affiliate of Dreyfus, and its affiliates), acting on behalf of customers having a qualified trust or investment account or relationship at such institution, and bear no Distribution or Shareholder Services Plan fees. Class Y shares are sold at net asset value per share generally to institutional investors, and bear no Distribution or Shareholder Services Plan fees. Class I and Class Y shares are offered without a front-end sales charge or CDSC. Other differences between the classes include the services offered to and the expenses borne by each class, the allocation of certain transfer agency
The Fund 23
NOTES TO FINANCIAL STATEMENTS (continued)
costs, and certain voting rights. Income, expenses (other than expenses attributable to a specific class), and realized and unrealized gains or losses on investments are allocated to each class of shares based on its relative net assets.
The Trust accounts separately for the assets, liabilities and operations of each series. Expenses directly attributable to each series are charged to that series’ operations; expenses which are applicable to all series are allocated among them on a pro rata basis.
The Financial Accounting Standards Board (“FASB”) Accounting Standards Codification (“ASC”) is the exclusive reference of authoritative U.S. generally accepted accounting principles (“GAAP”) recognized by the FASB to be applied by nongovernmental entities. Rules and interpretive releases of the Securities and Exchange Commission (“SEC”) under authority of federal laws are also sources of authoritative GAAP for SEC registrants. The funds’ financial statements are prepared in accordance with GAAP, which may require the use of management estimates and assumptions. Actual results could differ from those estimates.
(a) Portfolio valuation: The fair value of a financial instrument is the amount that would be received to sell an asset or paid to transfer a liability in an orderly transaction between market participants at the measurement date (i.e., the exit price). GAAP establishes a fair value hierarchy that prioritizes the inputs of valuation techniques used to measure fair value. This hierarchy gives the highest priority to unadjusted quoted prices in active markets for identical assets or liabilities (Level 1 measurements) and the lowest priority to unobservable inputs (Level 3 measurements).
Additionally, GAAP provides guidance on determining whether the volume and activity in a market has decreased significantly and whether such a decrease in activity results in transactions that are not orderly. GAAP requires enhanced disclosures around valuation inputs and techniques used during annual and interim periods.
24
Various inputs are used in determining the value of the fund’s investments relating to fair value measurements. These inputs are summarized in the three broad levels listed below:
Level 1—unadjusted quoted prices in active markets for identical investments.
Level 2—other significant observable inputs (including quoted prices for similar investments, interest rates, prepayment speeds, credit risk, etc.).
Level 3—significant unobservable inputs (including the fund’s own assumptions in determining the fair value of investments).
The inputs or methodology used for valuing securities are not necessarily an indication of the risk associated with investing in those securities.
Changes in valuation techniques may result in transfers in or out of an assigned level within the disclosure hierarchy. Valuation techniques used to value the fund’s investments are as follows:
Registered investment companies that are not traded on an exchange are valued at their net asset value and are generally categorized within Level 1 of the fair value hierarchy.
Investments in securities, excluding short-term investments (other than U.S. Treasury Bills), options and forward foreign currency exchange contracts (“forward contracts”) are valued each business day by an independent pricing service (the “Service”) approved by the Trust’s Board of Trustees (the “Board”). Investments for which quoted bid prices are readily available and are representative of the bid side of the market in the judgment of the Service are valued at the mean between the quoted bid prices (as obtained by the Service from dealers in such securities) and asked prices (as calculated by the Service based upon its evaluation of the market for such securities). Other investments (which constitute a majority of the portfolio securities) are valued as determined by the Service, based on methods which include
The Fund 25
NOTES TO FINANCIAL STATEMENTS (continued)
consideration of the following: yields or prices of securities of comparable quality, coupon, maturity and type; indications as to values from dealers; and general market conditions. These securities are generally categorized within Level 2 of the fair value hierarchy.
U.S. Treasury Bills are valued at the mean price between quoted bid prices and asked prices by the Service. These securities are generally categorized within Level 2 of the fair value hierarchy.
The Service’s procedures are reviewed by Dreyfus under the general supervision of the Board.
When market quotations or official closing prices are not readily available, or are determined not to reflect accurately fair value, such as when the value of a security has been significantly affected by events after the close of the exchange or market on which the security is principally traded (for example, a foreign exchange or market), but before the fund calculates its net asset value, the fund may value these investments at fair value as determined in accordance with the procedures approved by the Board. Certain factors may be considered when fair valuing investments such as: fundamental analytical data, the nature and duration of restrictions on disposition, an evaluation of the forces that influence the market in which the securities are purchased and sold, and public trading in similar securities of the issuer or comparable issuers. These securities are either categorized within Level 2 or 3 of the fair value hierarchy depending on the relevant inputs used.
For restricted securities where observable inputs are limited, assumptions about market activity and risk are used and are generally categorized within Level 3 of the fair value hierarchy.
Investments denominated in foreign currencies are translated to U.S. dollars at the prevailing rates of exchange.
Options, which are traded on an exchange, are valued at the last sales price on the securities exchange on which such securities are primarily traded or at the last sales price on the national securities market on each business day and are generally categorized within Level 1 of the fair value hierarchy. Options traded over-the-counter (“OTC”) are
26
valued at the mean between the bid and asked price and are generally categorized within Level 2 of the fair value hierarchy. Investments in swap transactions are valued each business day by the Service. Swaps are valued by the Service by using a swap pricing model which incorporates among other factors, default probabilities, recovery rates, credit curves of the underlying issuer and swap spreads on interest rates and are generally categorized within Level 2 of the fair value hierarchy. Forward foreign currency exchange contracts (“forward contracts”) are valued at the forward rate and are generally categorized within Level 2 of the fair value hierarchy.
The following is a summary of the inputs used as of May 31, 2015 in valuing the fund’s investments:
| | | | | | | |
| | | | Level 2—Other | | Level 3— | | |
| | | Level 1— | Significant | | Significant | | |
| | | Unadjusted | Observable | | Unobservable | | |
| | Quoted Prices | Inputs | | Inputs | Total | |
| Assets ($) | | | | | | | |
| Investments in Securities: | | | | | |
| Foreign Government | — | 898,507,715 | | — | 898,507,715 | |
| Mutual Funds | 42,460,399 | — | | — | 42,460,399 | |
| U.S. Treasury | | — | 9,524,288 | | — | 9,524,288 | |
| Other Financial | | | | | | | |
| Instruments: | | | | | | | |
| Forward Foreign | | | | | | |
| Currency Exchange | | | | | | |
| Contracts† | | — | 7,521,365 | | — | 7,521,365 | |
| Swaps† | | — | 1,150,834 | | — | 1,150,834 | |
| Liabilities ($) | | | | | | | |
| Other Financial | | | | | | | |
| Instruments: | | | | | | | |
| Forward Foreign | | | | | | |
| Currency Exchange | | | | | | |
| Contracts† | | — | (2,897,929 | ) | — | (2,897,929 | ) |
| Options Written | — | (1,118,456 | ) | — | (1,118,456 | ) |
| † Amount shown represents unrealized appreciation (depreciation) at period end. | | |
At May 31, 2015, there were no transfers between Level 1 and Level 2 of the fair value hierarchy.
The Fund 27
NOTES TO FINANCIAL STATEMENTS (continued)
(b) Foreign currency transactions: The fund does not isolate that portion of the results of operations resulting from changes in foreign exchange rates on investments from the fluctuations arising from changes in the market prices of securities held. Such fluctuations are included with the net realized and unrealized gain or loss on investments.
Net realized foreign exchange gains or losses arise from sales of foreign currencies, currency gains or losses realized on securities transactions between trade and settlement date, and the difference between the amounts of dividends, interest and foreign withholding taxes recorded on the fund’s books and the U.S. dollar equivalent of the amounts actually received or paid. Net unrealized foreign exchange gains and losses arise from changes in the value of assets and liabilities other than investments resulting from changes in exchange rates. Foreign currency gains and losses on foreign currency transactions are also included with net realized and unrealized gain or loss on investments.
(c) Securities transactions and investment income: Securities transactions are recorded on a trade date basis. Realized gains and losses from securities transactions are recorded on the identified cost basis. Dividend income is recognized on the ex-dividend date and interest income, including, where applicable, accretion of discount and amortization of premium on investments, is recognized on the accrual basis.
(d) Affiliated issuers: Investments in other investment companies advised by Dreyfus are defined as “affiliated” under the Act. Investments in affiliated investment companies during the period ended May 31, 2015 were as follows:
| | | | | |
| Affiliated | | | | | |
| Investment | Value | | | Value | Net |
| Company | 5/31/2014 ($) | Purchases ($) | Sales ($) | 5/31/2015 ($) | Assets (%) |
| Dreyfus | | | | | |
| Institutional | | | | | |
| Preferred | | | | | |
| Plus Money | | | | | |
| Market | | | | | |
| Fund | 73,519,715 | 936,626,709 | 967,686,025 | 42,460,399 | 4.1 |
28
(e) Risk: The fund invests primarily in debt securities. Failure of an issuer of the debt securities to make timely interest or principal payments, or a decline or the perception of a decline in the credit quality of a debt security, can cause the debt security’s price to fall, potentially lowering the fund’s share price. In addition, the value of debt securities may decline due to general market conditions that are not specifically related to a particular issuer, such as real or perceived adverse economic conditions, changes in outlook for corporate earnings, changes in interest or currency rates or adverse investor sentiment. They may also decline because of factors that affect a particular industry or country.
Investing in foreign markets may involve special risks and considerations not typically associated with investing in the U.S. These risks include revaluation of currencies, high rates of inflation, repatriation restrictions on income and capital, and adverse political and economic developments. Moreover, securities issued in these markets may be less liquid, subject to government ownership controls and delayed settlements, and their prices may be more volatile than those of comparable securities in the U.S.
(f) Dividends to shareholders: Dividends are recorded on the ex-dividend date. Dividends from investment income-net are normally declared and paid quarterly. Dividends from net realized capital gains, if any, are normally declared and paid annually, but the fund may make distributions on a more frequent basis to comply with the distribution requirements of the Internal Revenue Code of 1986, as amended (the “Code”). To the extent that net realized capital gains can be offset by capital loss carryovers, it is the policy of the fund not to distribute such gains. Income and capital gain distributions are determined in accordance with income tax regulations, which may differ from GAAP.
(g) Federal income taxes: It is the policy of the fund to continue to qualify as a regulated investment company, if such qualification is in the best interests of its shareholders, by complying with the applicable pro-
The Fund 29
NOTES TO FINANCIAL STATEMENTS (continued)
visions of the Code, and to make distributions of taxable income sufficient to relieve it from substantially all federal income and excise taxes.
As of and during the period ended May 31, 2015, the fund did not have any liabilities for any uncertain tax positions.The fund recognizes interest and penalties, if any, related to uncertain tax positions as income tax expense in the Statement of Operations. During the period ended May 31, 2015, the fund did not incur any interest or penalties.
Each tax year in the four-year period ended May 31, 2015 remains subject to examination by the Internal Revenue Service and state taxing authorities.
At May 31, 2015, the components of accumulated earnings on a tax basis were as follows: accumulated capital losses $138,271,226 and unrealized depreciation $252,281,687. In addition, the fund deferred for tax purposes late year ordinary losses of $84,262,793 to the first day of the following fiscal year.
Under the Regulated Investment Company Modernization Act of 2010, the fund is permitted to carry forward capital losses for an unlimited period. Furthermore, capital loss carryovers retain their character as either short-term or long-term capital losses.
The accumulated capital loss carryover is available for federal income tax purposes to be applied against future net realized capital gains, if any, realized subsequent to May 31, 2015.The fund has $91,242,587 of short-term capital losses and $47,028,639 of long-term capital losses which can be carried forward for an unlimited period.
The tax character of distributions paid to shareholders during the fiscal periods ended May 31, 2015 and May 31, 2014 were as follows: ordinary income $17,785,181 and $63,579,433, and long-term capital gains $0 and $11,691,866, respectively.
During the period ended May 31, 2015, as a result of permanent book to tax differences, primarily due to the tax treatment for foreign currency gains and losses and swap periodic payments, the fund decreased accumulated undistributed investment income-net by $160,211,547
30
and increased accumulated net realized gain (loss) on investments by the same amount. Net assets and net asset value per share were not affected by this reclassification.
NOTE 2—Bank Lines of Credit:
The fund participates with other Dreyfus-managed funds in a $430 million unsecured credit facility led by Citibank, N.A. and a $300 million unsecured credit facility provided by The Bank of New York Mellon (each, a “Facility”), each to be utilized primarily for temporary or emergency purposes, including the financing of redemptions. Prior to October 8, 2014, the unsecured credit facility with Citibank, N.A. was $265 million. In connection therewith, the fund has agreed to pay its pro rata portion of commitment fees for each Facility. Interest is charged to the fund based on rates determined pursuant to the terms of the respective Facility at the time of borrowing.
The average amount of borrowings outstanding under the Facilities during the period ended May 31, 2015 was approximately $114,800 with a related weighted average annualized interest rate of 1.10%.
NOTE 3—Management Fee and Other Transactions with Affiliates:
(a) Pursuant to a management agreement with Dreyfus, the management fee is computed at the annual rate of .75% of the value of the fund’s average daily net assets and is payable monthly.
During the period ended May 31, 2015, the Distributor retained $542 from commissions earned on sales of the fund’s Class A shares and $65 from CDSCs on redemptions of the fund’s Class C shares.
(b) Under the Distribution Plan adopted pursuant to Rule 12b-1 under the Act, Class C shares pay the Distributor for distributing its shares at an annual rate of .75% of the value of its average daily net assets. During the period ended May 31, 2015, Class C shares were charged $75,007 pursuant to the Distribution Plan.
The Fund 31
NOTES TO FINANCIAL STATEMENTS (continued)
(c) Under the Shareholder Services Plan, Class A and Class C shares pay the Distributor at an annual rate of .25% of the value of their average daily net assets for the provision of certain services. The services provided may include personal services relating to shareholder accounts, such as answering shareholder inquiries regarding the fund and providing reports and other information, and services related to the maintenance of shareholder accounts. The Distributor may make payments to Service Agents (securities dealers, financial institutions or other industry professionals) with respect to these services. The Distributor determines the amounts to be paid to Service Agents. During the period ended May 31, 2015, Class A and Class C shares were charged $73,793 and $25,002, respectively, pursuant to the Shareholder Services Plan.
Under its terms, the Distribution Plan and Shareholder Services Plan shall remain in effect from year to year, provided such continuance is approved annually by a vote of a majority of those Trustees who are not “interested persons” of the Trust and who have no direct or indirect financial interest in the operation of or in any agreement related to the Distribution Plan or Shareholder Services Plan.
The fund has arrangements with the transfer agent and the custodian whereby the fund may receive earnings credits when positive cash balances are maintained, which are used to offset transfer agency and custody fees. For financial reporting purposes, the fund includes net earnings credits as an expense offset in the Statement of Operations.
The fund compensates Dreyfus Transfer, Inc., a wholly-owned subsidiary of Dreyfus, under a transfer agency agreement for providing transfer agency and cash management services for the fund. The majority of transfer agency fees are comprised of amounts paid on a per account basis, while cash management fees are related to fund subscriptions and redemptions. During the period ended May 31, 2015, the fund was charged $809,902 for transfer agency services and
32
$48,314 for cash management services. These fees are included in Shareholder servicing costs in the Statement of Operations. Cash management fees were partially offset by earnings credits of $2,201.
The fund compensates The Bank of New York Mellon under a custody agreement for providing custodial services for the fund. These fees are determined based on net assets, geographic region and transaction activity. During the period ended May 31, 2015, the fund was charged $1,220,823 pursuant to the custody agreement.
During the period ended May 31, 2015, the fund was charged $10,891 for services performed by the Chief Compliance Officer and his staff.
The components of “Due to The Dreyfus Corporation and affiliates” in the Statement of Assets and Liabilities consist of: management fees $670,853, Distribution Plan fees $4,132, Shareholder Services Plan fees $5,434, custodian fees $346,050, Chief Compliance Officer fees $2,113 and transfer agency fees $100,532.
(d) Each Board member also serves as a Board member of other funds within the Dreyfus complex. Annual retainer fees and attendance fees are allocated to each fund based on net assets.
(e) A 2% redemption fee is charged and retained by the fund on certain shares redeemed within sixty days following the date of issuance, subject to certain exceptions, including redemptions made through use of the fund’s exchange privilege. During the period ended May 31, 2015, redemption fees charged and retained by the fund amounted to $116,292.
NOTE 4—Securities Transactions:
The aggregate amount of purchases and sales of investment securities, excluding short-term securities, options transactions, forward contracts and swap transactions, during the period ended May 31, 2015, amounted to $801,836,694 and $1,283,242,641, respectively.
The Fund 33
NOTES TO FINANCIAL STATEMENTS (continued)
Derivatives: A derivative is a financial instrument whose performance is derived from the performance of another asset.The fund enters into International Swaps and Derivatives Association, Inc. Master Agreements or similar agreements (collectively, “Master Agreements”) with its OTC derivative contract counterparties in order to, among other things, reduce its credit risk to counterparties. Master Agreements include provisions for general obligations, representations, collateral and events of default or termination. Under a Master Agreement, the fund may offset with the counterparty certain derivative financial instrument’s payables and/or receivables with collateral held and/or posted and create one single net payment in the event of default or termination.
Each type of derivative instrument that was held by the fund during the period ended May 31, 2015 is discussed below.
Options Transactions: The fund purchases and writes (sells) put and call options to hedge against changes in foreign currencies or as a substitute for an investment. The fund is subject to market risk and currency risk in the course of pursuing its investment objectives through its investments in options contracts. A call option gives the purchaser of the option the right (but not the obligation) to buy, and obligates the writer to sell, the underlying financial instrument at the exercise price at any time during the option period, or at a specified date. Conversely, a put option gives the purchaser of the option the right (but not the obligation) to sell, and obligates the writer to buy the underlying financial instrument at the exercise price at any time during the option period, or at a specified date.
As a writer of call options, the fund receives a premium at the outset and then bears the market risk of unfavorable changes in the price of the financial instrument underlying the option. Generally, the fund realizes a gain, to the extent of the premium, if the price of the underlying financial instrument decreases between the date the option is written and the date on which the option is terminated. Generally, the fund incurs a loss if the price of the financial instrument increases between those dates.
34
As a writer of put options, the fund receives a premium at the outset and then bears the market risk of unfavorable changes in the price of the financial instrument underlying the option. Generally, the fund realizes a gain, to the extent of the premium, if the price of the underlying financial instrument increases between the date the option is written and the date on which the option is terminated. Generally, the fund incurs a loss if the price of the financial instrument decreases between those dates.
As a writer of an option, the fund has no control over whether the underlying financial instrument may be sold (call) or purchased (put) and as a result bears the market risk of an unfavorable change in the price of the financial instrument underlying the written option.There is a risk of loss from a change in value of such options which may exceed the related premiums received.This risk is mitigated by Master Agreements between the fund and the counterparty and the posting of collateral, if any, by the counterparty to the fund to cover the fund’s exposure to the counterparty.The Statement of Operations reflects any unrealized gains or losses which occurred during the period as well as any realized gains or losses which occurred upon the expiration or closing of the option transaction.
The following summarizes the fund’s call/put options written during the period ended May 31, 2015:
| | | | |
| | Face Amount | | Options Terminated |
| | Covered by | Premiums | | Net Realized |
| Options Written: | Contracts ($) | Received ($) | Cost ($) | Gain ($) |
| Contracts outstanding | | | | |
| May 31, 2014 | — | — | | |
| Contracts written | 317,840,000 | 4,117,866 | | |
| Contracts terminated: | | | | |
| Contracts closed | 69,700,000 | 1,274,513 | 243,174 | 1,031,339 |
| Contracts expired | 90,040,000 | 773,434 | — | 773,434 |
| Total contracts | | | | |
| terminated | 159,740,000 | 2,047,947 | 243,174 | 1,804,773 |
| Contracts outstanding | | | | |
| May 31, 2015 | 158,100,000 | 2,069,919 | | |
The Fund 35
NOTES TO FINANCIAL STATEMENTS (continued)
Forward Foreign Currency Exchange Contracts: The fund enters into forward contracts in order to hedge its exposure to changes in foreign currency exchange rates on its foreign portfolio holdings, to settle foreign currency transactions or as a part of its investment strategy. When executing forward contracts, the fund is obligated to buy or sell a foreign currency at a specified rate on a certain date in the future. With respect to sales of forward contracts, the fund incurs a loss if the value of the contract increases between the date the forward contract is opened and the date the forward contract is closed.The fund realizes a gain if the value of the contract decreases between those dates. With respect to purchases of forward contracts, the fund incurs a loss if the value of the contract decreases between the date the forward contract is opened and the date the forward contract is closed.The fund realizes a gain if the value of the contract increases between those dates. Any realized or unrealized gains or losses which occurred during the period are reflected in the Statement of Operations. The fund is exposed to foreign currency risk as a result of changes in value of underlying financial instruments.The fund is also exposed to credit risk associated with counterparty nonperformance on these forward contracts, which is generally limited to the unrealized gain on each open contract.This risk is mitigated by Master Agreements between the fund and the counter-party and the posting of collateral, if any, by the counterparty to the fund to cover the fund’s exposure to the counterparty. The following summarizes open forward contracts at May 31, 2015:
| | | | | | |
| | | Foreign | | | Unrealized | |
| Forward Foreign Currency | Currency | | | Appreciation | |
| Exchange Contracts | | Amounts | Cost ($) | Value ($) (Depreciation) ($) | |
| Purchases: | | | | | | |
| Brazilian Real, | | | | | | |
| Expiring: | | | | | | |
| 6/2/2015 a | | 24,135,000 | 7,939,145 | 7,565,797 | (373,348 | ) |
| 6/2/2015 b | | 26,990,000 | 8,522,772 | 8,460,777 | (61,995 | ) |
| Chilean Peso, | | | | | | |
| Expiring | | | | | | |
| 7/31/2015 c | 2,990,110,000 | 4,918,753 | 4,807,637 | (111,116 | ) |
| Colombian Peso, | | | | | | |
| Expiring: | | | | | | |
| 7/16/2015 a | 8,000,000,000 | 3,124,390 | 3,145,198 | 20,808 | |
| 7/16/2015 c | 46,980,140,000 | 18,636,250 | 18,470,231 | (166,019 | ) |
| 7/16/2015 d | 10,400,000,000 | 4,151,697 | 4,088,757 | (62,940 | ) |
36
| | | | | | |
| | | Foreign | | | Unrealized | |
| Forward Foreign Currency | Currency | | | Appreciation | |
| Exchange Contracts | Amounts | Cost ($) | Value ($) | (Depreciation) ($) | |
| Purchases (continued): | | | | | |
| Hungarian Forint, | | | | | | |
| Expiring | | | | | | |
| 7/31/2015 e | 1,905,430,000 | 6,878,809 | 6,760,326 | (118,483 | ) |
| Indian Rupee, | | | | | | |
| Expiring | | | | | | |
| 7/31/2015 c | 2,713,100,000 | 42,126,919 | 41,934,350 | (192,569 | ) |
| Indonesian Rupiah, | | | | | | |
| Expiring | | | | | | |
| 7/31/2015 b | | 193,770,540,000 | 14,407,803 | 14,478,045 | 70,242 | |
| Malaysian Ringgit, | | | | | | |
| Expiring | | | | | | |
| 7/31/2015 c | 156,680,000 | 43,172,049 | 42,505,860 | (666,189 | ) |
| Mexican New Peso, | | | | | | |
| Expiring | | | | | | |
| 7/31/2015 c | | 66,830,000 | 4,353,119 | 4,319,520 | (33,599 | ) |
| Polish Zloty, | | | | | | |
| Expiring | | | | | | |
| 7/31/2015 f | 227,405,000 | 60,233,531 | 60,644,115 | 410,584 | |
| South African Rand, | | | | | | |
| Expiring | | | | | | |
| 7/29/2015 b | | 90,775,000 | 7,593,536 | 7,395,626 | (197,910 | ) |
| Thai Baht, | | | | | | |
| Expiring: | | | | | | |
| 7/31/2015 c | 258,340,000 | 7,679,548 | 7,663,766 | (15,782 | ) |
| 7/31/2015 f | 691,825,000 | 20,620,715 | 20,523,283 | (97,432 | ) |
| Turkish Lira, | | | | | | |
| Expiring | | | | | | |
| 7/31/2015 a | | 26,795,000 | 10,143,054 | 9,878,021 | (265,033 | ) |
| Sales: | | | Proceeds ($) | | | |
| Brazilian Real, | | | | | | |
| Expiring: | | | | | | |
| 6/2/2015 c | | 51,125,000 | 16,796,439 | 16,026,574 | 769,865 | |
| 8/4/2015 a | | 39,775,000 | 12,812,736 | 12,187,038 | 625,698 | |
| Colombian Peso, | | | | | | |
| Expiring: | | | | | | |
| 7/16/2015 g | 92,814,570,000 | 37,220,368 | 36,490,026 | 730,342 | |
| 7/16/2015 h | 5,300,000,000 | 2,116,613 | 2,083,694 | 32,919 | |
| Mexican New Peso, | | | | | | |
| Expiring | | | | | | |
| 6/2/2015 c | | 31,919,759 | 2,081,869 | 2,072,860 | 9,009 | |
| Peruvian New Sol, | | | | | | |
| Expiring: | | | | | | |
| 6/11/2015 g | | 6,445,000 | 2,075,684 | 2,037,886 | 37,798 | |
| 8/6/2015 c | 100,735,000 | 31,647,817 | 31,543,267 | 104,550 | |
| Philippine Peso, | | | | | | |
| Expiring | | | | | | |
| 7/31/2015 c | 601,475,000 | 13,433,278 | 13,440,557 | (7,279 | ) |
The Fund 37
NOTES TO FINANCIAL STATEMENTS (continued)
| | | | | | | |
| | | | Foreign | | | Unrealized | |
| Forward Foreign Currency | Currency | | | Appreciation | |
| Exchange Contracts | | | Amounts | Proceeds ($) | Value ($) (Depreciation) ($) | |
| Sales (continued): | | | | | | | |
| Polish Zloty, | | | | | | | |
| Expiring | | | | | | | |
| 6/1/2015 f | | 181,800,780 | 48,047,143 | 48,574,118 | (526,975 | ) |
| Romanian Leu, | | | | | | | |
| Expiring | | | | | | | |
| 7/31/2015 c | | | 56,540,000 | 14,155,880 | 13,964,424 | 191,456 | |
| Russian Ruble, | | | | | | | |
| Expiring | | | | | | | |
| 7/31/2015 b | | 1,472,785,000 | 28,974,720 | 27,444,077 | 1,530,643 | |
| Singapore Dollar, | | | | | | | |
| Expiring | | | | | | | |
| 6/30/2015 c | | | 21,130,000 | 15,880,651 | 15,662,796 | 217,855 | |
| South African Rand, | | | | | | | |
| Expiring: | | | | | | | |
| 6/3/2015 c | | | 25,311,980 | 2,082,931 | 2,084,191 | (1,260 | ) |
| 7/31/2015 c | | 1,222,735,000 | 102,104,749 | 99,584,716 | 2,520,033 | |
| South Korean Won, | | | | | | | |
| Expiring | | | | | | | |
| 7/31/2015 i | | 22,890,825,000 | 20,865,799 | 20,616,236 | 249,563 | |
| Gross Unrealized | | | | | | | |
| Appreciation | | | | | | 7,521,365 | |
| Gross Unrealized | | | | | | | |
| Depreciation | | | | | | (2,897,929 | ) |
Counterparties:
| |
| a | Goldman Sachs International |
| b | Morgan Stanley Capital Services |
| c | JP Morgan Chase Bank |
| d | Deutsche Bank |
| e | Royal Bank of Scotland |
| f | Barclays Bank |
| g | Citigroup |
| h | HSBC |
| i | Credit Suisse |
Swap Transactions: The fund enters into swap agreements to exchange the interest rate on, or return generated by, one nominal instrument for the return generated by another nominal instrument. Swap agreements are privately negotiated in the OTC market or cen-
38
trally cleared.The fund enters into these agreements to hedge certain market or interest rate risks, to manage the interest rate sensitivity (sometimes called duration) of fixed income securities, to provide a substitute for purchasing or selling particular securities or to increase potential returns.
For OTC swaps, the fund accrues for the interim payments on a daily basis, with the net amount recorded within unrealized appreciation (depreciation) on swap agreements in the Statement of Assets and Liabilities. Once the interim payments are settled in cash, the net amount is recorded as a realized gain (loss) on swaps, in addition to realized gain (loss) recorded upon the termination of swap transactions in the Statement of Operations. Upfront payments made and/or received by the fund, are recorded as an asset and/or liability in the Statement of Assets and Liabilities and are recorded as a realized gain or loss ratably over the agreement’s term/event with the exception of forward starting interest rate swaps which are recorded as realized gains or losses on the termination date.
Fluctuations in the value of swap agreements are recorded for financial statement purposes as unrealized appreciation or depreciation on swap transactions.
Interest Rate Swaps: Interest rate swaps involve the exchange of commitments to pay and receive interest based on a notional principal amount. The fund may elect to pay a fixed rate and receive a floating rate, or receive a fixed rate and pay a floating rate on a notional principal amount. The net interest received or paid on interest rate swap agreements is included within realized gain (loss) on swap transactions in the Statement of Operations. Interest rate swap agreements are subject to general market risk, liquidity risk, counterparty risk and interest rate risk.
The Fund 39
NOTES TO FINANCIAL STATEMENTS (continued)
For OTC swaps, the fund’s maximum risk of loss from counterparty risk is the discounted value of the cash flows to be received from the counterparty over the agreement’s remaining life, to the extent that the amount is positive. This risk is mitigated by Master Agreements between the fund and the counterparty and the posting of collateral, if any, by the counterparty to the fund to cover the fund’s exposure to the counterparty. The following summarizes open interest rate swaps entered into by the fund at May 31, 2015:
OTC—Interest Rate Swaps
| | | | | |
| Notional | Currency/ | | Receive | | Unrealized |
| Amount ($) | Floating Rate | Counterparty | Fixed Rate (%) | Expiration | Appreciation ($) |
| |
| 303,250,000 | MXN—28 | J.P. Morgan | 6.84 | 1/25/2024 | 1,038,318 |
| | Day Libor | Chase Bank | | | |
| 120,100,000 | PLN—1 | Citigroup | 2.72 | 6/1/2025 | 112,516 |
| | Year Libor | | | | |
| |
| Unrealized Gross Appreciation | | | | 1,150,834 |
The following tables show the fund’s exposure to different types of market risk as it relates to the Statement of Assets and Liabilities and the Statement of Operations, respectively.
Fair value of derivative instruments as of May 31, 2015 is shown below:
| | | | |
| | Derivative | | Derivative | |
| | Assets ($) | | Liabilities ($) | |
| Foreign exchange risk1 | 7,521,365 | Foreign exchange risk1,2 | (4,016,385 | ) |
| Interest rate risk3 | 1,150,834 | | — | |
| Gross fair value of | | | | |
| derivatives contracts | 8,672,199 | | (4,016,385 | ) |
Statement of Assets and Liabilities location:
| |
| 1 | Unrealized appreciation (depreciation) on forward foreign currency exchange contracts. |
| 2 | Outstanding options written, at value. |
| 3 | Unrealized appreciation on swap agreements. |
40
The effect of derivative instruments in the Statement of Operations during the period ended May 31, 2015 is shown below:
Amount of realized gain (loss) on derivatives recognized in income ($)
| | | | | | |
| | Options | Forward | | Swap | | |
| Underlying risk | Transactions4 | Contracts5 | | Transactions6 | Total | |
| Interest rate | — | — | | 3,886,775 | 3,886,775 | |
| Foreign exchange | 1,030,524 | (13,857,403 | ) | — | (12,826,879 | ) |
| Total | 1,030,524 | (13,857,403 | ) | 3,886,775 | (8,940,104 | ) |
Change in unrealized appreciation (depreciation) on derivatives recognized in income ($)
| | | | | | |
| | Options | Forward | Swap | | | |
| Underlying risk | Transactions7 | Contracts8 | Transactions9 | | Total | |
| Interest rate | — | — | (2,012,968 | ) | (2,012,968 | ) |
| Foreign exchange | 951,463 | 2,822,820 | — | | 3,774,283 | |
| Total | 951,463 | 2,822,820 | (2,012,968 | ) | 1,761,315 | |
Statement of Operations location:
| |
| 4 | Net realized gain (loss) on options transactions. |
| 5 | Net realized gain (loss) on forward foreign currency exchange contracts. |
| 6 | Net realized gain (loss) on swap transactions. |
| 7 | Net unrealized appreciation (depreciation) on options transactions. |
| 8 | Net unrealized appreciation (depreciation) on forward foreign currency exchange contracts. |
| 9 | Net unrealized appreciation (depreciation) on swap transactions. |
The provisions of ASC Topic 210 “Disclosures about Offsetting Assets and Liabilities” require disclosure on the offsetting of financial assets and liabilities.These disclosures are required for certain investments, including derivative financial instruments subject to Master Agreements which are eligible for offsetting in the Statement of Assets and Liabilities and require the fund to disclose both gross and net information with respect to such investments. For financial reporting purposes, the fund does not offset derivative assets and derivative liabilities that are subject to Master Agreements in the Statement of Assets and Liabilities.
The Fund 41
NOTES TO FINANCIAL STATEMENTS (continued)
At May 31, 2015, derivative assets and liabilities (by type) on a gross basis are as follows:
| | | | |
| Derivative Financial Instruments: | Assets ($) | | Liabilities ($) | |
| Options | — | | (1,118,456 | ) |
| Forward contracts | 7,521,365 | | (2,897,929 | ) |
| Swaps | 1,150,834 | | — | |
| Total gross amount | | | | |
| of derivative assets | | | | |
| and liabilities in | | | | |
| the Statement of | | | | |
| Assets and Liabilities | 8,672,199 | | (4,016,385 | ) |
| Derivatives | | | | |
| not subject to | | | | |
| Master Agreements | (249,563 | ) | — | |
| Total gross amount of | | | | |
| assets and liabilities | | | | |
| subject to Master | | | | |
| Agreements | 8,422,636 | | (4,016,385 | ) |
The following tables present derivative assets and liabilities net of amounts available for offsetting under Master Agreements and net of related collateral received or pledged, if any, as of May 31, 2015:
| | | | | | |
| | | Financial | | | | |
| | | Instruments | | | | |
| | | and | | | | |
| | | Derivatives | | | | |
| | Gross Amount of | Available | | Collateral | | Net Amount |
| Counterparties | Assets ($)1 | for Offset ($) | | Received ($)2 | | of Assets ($) |
| Barclays Bank | 410,584 | (410,584 | ) | — | | — |
| Citigroup | 880,656 | — | | (880,656 | ) | — |
| Goldman Sachs | | | | | | |
| International | 646,506 | (646,506 | ) | — | | — |
| HSBC | 32,920 | — | | — | | 32,920 |
| JP Morgan | | | | | | |
| Chase Bank | 4,851,084 | (1,787,554 | ) | — | | 3,063,530 |
| Morgan Stanley | | | | | | |
| Capital Services | 1,600,886 | (266,309 | ) | — | | 1,334,577 |
| Total | 8,422,636 | (3,110,953 | ) | (880,656 | ) | 4,431,027 |
42
| | | | | | |
| | | | Financial | | | |
| | | | Instruments | | | |
| | | | and | | | |
| | | | Derivatives | | | |
| | Gross Amount of | | Available | Collateral | Net Amount of | |
| Counterparties | Liabilities ($)1 | | for Offset ($) | Pledged ($)2 | Liabilities ($) | |
| Barclays Bank | (624,407 | ) | 410,584 | 213,823 | — | |
| Deutsche Bank | (515,408 | ) | — | 515,408 | — | |
| Goldman Sachs | | | | | | |
| International | (704,225 | ) | 646,506 | — | (57,719 | ) |
| JP Morgan Chase Bank | (1,787,554 | ) | 1,787,554 | — | — | |
| Morgan Stanley | | | | | | |
| Capital Services | (266,309 | ) | 266,309 | — | — | |
| Royal Bank of Scotland | (118,482 | ) | — | — | (118,482 | ) |
| Total | (4,016,385 | ) | 3,110,953 | 729,231 | (176,201 | ) |
| |
| 1 | Absent a default event or early termination, OTC derivative assets and liabilities are presented at |
| | gross amounts and are not offset in the Statement of Assets and Liabilities. |
| 2 | In some instances, the actual collateral received and/or pledged may be more than the amount |
| | shown due to overcollateralization. |
The following summarizes the average market value of derivatives outstanding during the period ended May 31, 2015:
| |
| | Average Market Value ($) |
| Foreign currency options contracts | 437,094 |
| Forward contracts | 610,369,710 |
The following summarizes the average notional value of swap agreements outstanding during the period ended May 31, 2015:
| |
| | Average Notional Value ($) |
| Interest rate swap agreements | 27,933,000 |
At May 31, 2015, the cost of investments for federal income tax purposes was $1,204,788,865; accordingly, accumulated net unrealized depreciation on investments was $254,296,463, consisting of $784,250 gross unrealized appreciation and $255,080,713 gross unrealized depreciation.
The Fund 43
|
| REPORT OF INDEPENDENT REGISTERED |
| PUBLIC ACCOUNTING FIRM |
The Board of Trustees and Shareholders of The Dreyfus/Laurel Funds Trust
We have audited the accompanying statement of assets and liabilities of Dreyfus Emerging Markets Debt Local Currency Fund (the “Fund”), a series of The Dreyfus/Laurel Funds Trust, including the statements of investments and options written, as of May 31, 2015, and the related statement of operations for the year then ended, the statements of changes in net assets for each of the years in the two-year period then ended, and the financial highlights for each of the years or periods in the five-year period then ended. These financial statements and financial highlights are the responsibility of the Fund’s management. Our responsibility is to express an opinion on these financial statements and financial highlights based on our audits.
We conducted our audits in accordance with the standards of the Public Company Accounting Oversight Board (United States).Those standards require that we plan and perform the audit to obtain reasonable assurance about whether the financial statements and financial highlights are free of material misstatement. An audit includes examining, on a test basis, evidence supporting the amounts and disclosures in the financial statements. Our procedures included confirmation of securities owned as of May 31, 2015, by correspondence with the custodian and brokers or by other appropriate auditing procedures. An audit also includes assessing the accounting principles used and significant estimates made by management, as well as evaluating the overall financial statement presentation.We believe that our audits provide a reasonable basis for our opinion.
In our opinion, the financial statements and financial highlights referred to above present fairly, in all material respects, the financial position of Dreyfus Emerging Markets Debt Local Currency Fund as of May 31, 2015, and the results of its operations for the year then ended, the changes in its net assets for each of the years in the two-year period then ended and the financial highlights for each of the years or periods in the five-year period then ended, in conformity with U.S. generally accepted accounting principles.

New York, New York
July 29, 2015
44
|
| INFORMATION ABOUT THE RENEWAL OF THE |
| FUND’S MANAGEMENT AGREEMENT (Unaudited) |
At a meeting of the fund’s Board of Trustees held on February 25-26, 2015, the Board considered the renewal of the fund’s Management Agreement pursuant to which Dreyfus provides the fund with investment advisory and administrative services (the “Agreement”).The Board members, none of whom are “interested persons” (as defined in the Investment Company Act of 1940, as amended) of the fund, were assisted in their review by independent legal counsel and met with counsel in executive session separate from Dreyfus representatives. In considering the renewal of the Agreement, the Board considered all factors that it believed to be relevant, including those discussed below. The Board did not identify any one factor as dispositive, and each Board member may have attributed different weights to the factors considered.
Analysis of Nature, Extent, and Quality of Services Provided to the Fund. The Board considered information provided to them at the meeting and in previous presentations from Dreyfus representatives regarding the nature, extent, and quality of the services provided to funds in the Dreyfus fund complex. Dreyfus provided the number of open accounts in the fund, the fund’s asset size and the allocation of fund assets among distribution channels. Dreyfus also had previously provided information regarding the diverse intermediary relationships and distribution channels of funds in the Dreyfus fund complex (such as retail direct or intermediary, in which intermediaries typically are paid by the fund and/or Dreyfus) and Dreyfus’ corresponding need for broad, deep, and diverse resources to be able to provide ongoing shareholder services to each intermediary or distribution channel, as applicable to the fund.
The Board also considered research support available to, and portfolio management capabilities of, the fund’s portfolio management personnel and that Dreyfus also provides oversight of day-to-day fund operations, including fund accounting and administration and assistance in meeting legal and regulatory requirements. The Board also considered Dreyfus’ extensive administrative, accounting and compliance infrastructures.
The Fund 45
| |
| INFORMATION ABOUT THE RENEWAL | OF THE FUND’S |
| MANAGEMENT AGREEMENT (Unaudited) (continued) |
Comparative Analysis of the Fund’s Performance and Management Fee and Expense Ratio. The Board reviewed reports prepared by Lipper, Inc. (“Lipper”), an independent provider of investment company data, which included information comparing (1) the fund’s performance with the performance of a group of comparable funds (the “Performance Group”) and with a broader group of funds (the “Performance Universe”), all for various periods ended December 31, 2014, and (2) the fund’s actual and contractual management fees and total expenses with those of a group of comparable funds (the “Expense Group”) and with a broader group of funds (the “Expense Universe”), the information for which was derived in part from fund financial statements available to Lipper as of the date of its analysis. Dreyfus previously had furnished the Board with a description of the methodology Lipper used to select the Performance Group and Performance Universe and the Expense Group and Expense Universe.
Dreyfus representatives stated that the usefulness of performance comparisons may be affected by a number of factors, including different investment limitations that may be applicable to the fund and comparison funds.The Board discussed with representatives of Dreyfus and its affiliates the results of the comparisons and noted that the fund’s total return performance was below the Performance Group and Performance Universe medians for all periods (ranking lowest in the Performance Group in most periods). The Board also noted that the fund’s yield performance was below the Performance Group and Performance medians for all six one-year periods ended December 31st. Dreyfus also provided a comparison of the fund’s calendar year total returns to the returns of the fund’s benchmark index.
The Board discussed with representatives of Dreyfus and its affiliates the investment strategy employed in the management of the fund’s assets and how that strategy affected the fund’s relative performance. Representatives of Dreyfus and its affiliates discussed and expressed continued confidence in the investment approach notwithstanding the relative underperformance.
46
The Board also reviewed the range of actual and contractual management fees and total expenses of the Expense Group and Expense Universe funds and discussed the results of the comparisons. The Board noted that the fund’s contractual management fee was below the Expense Group median, the fund’s actual management fee was above the Expense Group and the Expense Universe medians and the fund’s total expenses were below the Expense Group median and at the Expense Universe median.
Dreyfus representatives reviewed with the Board the management or investment advisory fees (1) paid by funds advised or administered by Dreyfus that are in the same Lipper category as the fund and (2) paid to Dreyfus or the Dreyfus-affiliated primary employer of the fund’s primary portfolio manager(s) for advising any separate accounts and/or other types of client portfolios that are considered to have similar investment strategies and policies as the fund (the “Similar Clients”), and explained the nature of the Similar Clients.They discussed differences in fees paid and the relationship of the fees paid in light of any differences in the services provided and other relevant factors.The Board considered the relevance of the fee information provided for the Similar Clients to evaluate the appropriateness and reasonableness of the fund’s management fee.
Analysis of Profitability and Economies of Scale. Dreyfus representatives reviewed the expenses allocated and profit received by Dreyfus and its affiliates and the resulting profitability percentage for managing the fund and the aggregate profitability percentage to Dreyfus and its affiliates for managing the funds in the Dreyfus fund complex, and the method used to determine the expenses and profit. The Board concluded that the profitability results were not unreasonable, given the services rendered and service levels provided by Dreyfus. The Board also had been provided with information prepared by an independent consulting firm regarding Dreyfus’ approach to allocating costs to, and determining the profitability of, individual funds and the entire Dreyfus fund complex. The consulting firm also had analyzed where any economies of scale might emerge in connection with the management of a fund.
The Fund 47
| |
| INFORMATION ABOUT THE RENEWAL OF THE FUND’S |
| MANAGEMENT AGREEMENT (Unaudited) (continued) |
The Board considered, on the advice of its counsel, the profitability analysis (1) as part of its evaluation of whether the fees under the Agreement bear a reasonable relationship to the mix of services provided by Dreyfus, including the nature, extent and quality of such services, and (2) in light of the relevant circumstances for the fund and the extent to which economies of scale would be realized if the fund grows and whether fee levels reflect these economies of scale for the benefit of fund shareholders. Dreyfus representatives noted that a discussion of economies of scale is predicated on a fund having achieved a substantial size with increasing assets and that, if a fund’s assets had been stable or decreasing, the possibility that Dreyfus may have realized any economies of scale would be less. Dreyfus representatives also noted that, as a result of shared and allocated costs among funds in the Dreyfus fund complex, the extent of economies of scale could depend substantially on the level of assets in the complex as a whole, so that increases and decreases in complex-wide assets can affect potential economies of scale in a manner that is disproportionate to, or even in the opposite direction from, changes in the fund’s asset level. The Board also considered potential benefits to Dreyfus from acting as investment adviser and noted that there were no soft dollar arrangements in effect for trading the fund’s investments.
At the conclusion of these discussions, the Board agreed that it had been furnished with sufficient information to make an informed business decision with respect to the renewal of the Agreement. Based on the discussions and considerations as described above, the Board concluded and determined as follows.
The Board concluded that the nature, extent and quality of the ser- vices provided by Dreyfus are adequate and appropriate.
The Board was concerned about the fund’s performance and agreed to closely monitor performance.
The Board concluded that the fee paid to Dreyfus was reasonable in light of the considerations described above.
48
The Board determined that the economies of scale which may accrue to Dreyfus and its affiliates in connection with the management of the fund had been adequately considered by Dreyfus in connection with the fee rate charged to the fund pursuant to the Agreement and that, to the extent in the future it were determined that material economies of scale had not been shared with the fund, the Board would seek to have those economies of scale shared with the fund.
In evaluating the Agreement, the Board considered these conclusions and determinations and also relied on its previous knowledge, gained through meetings and other interactions with Dreyfus and its affiliates, of the fund and the services provided to the fund by Dreyfus. The Board also relied on information received on a routine and regular basis throughout the year relating to the operations of the fund and the investment management and other services provided under the Agreement, including information on the investment performance of the fund in comparison to similar mutual funds and benchmark performance indices; general market outlook as applicable to the fund; and compliance reports. In addition, the Board’s consideration of the contractual fee arrangements for this fund had the benefit of a number of years of reviews of prior or similar agreements during which lengthy discussions took place between the Board and Dreyfus representatives. Certain aspects of the arrangements may receive greater scrutiny in some years than in others, and the Board’s conclusions may be based, in part, on their consideration of the same or similar arrangements in prior years.The Board determined to renew the Agreement.
The Fund 49
|
| BOARD MEMBERS INFORMATION (Unaudited) |
| INDEPENDENT BOARD MEMBERS |
|
| Joseph S. DiMartino (71) |
| Chairman of the Board (1999) |
| Principal Occupation During Past 5Years: |
| • Corporate Director and Trustee (1995-present) |
| Other Public Company Board Memberships During Past 5Years: |
| • CBIZ (formerly, Century Business Services, Inc.), a provider of outsourcing functions for small |
| and medium size companies, Director (1997-present) |
| • The Newark Group, a provider of a national market of paper recovery facilities, paperboard |
| mills and paperboard converting plants, Director (2000-2010) |
| No. of Portfolios for which Board Member Serves: 147 |
| ——————— |
| Francine J. Bovich (63) |
| Board Member (2012) |
| Principal Occupation During Past 5Years: |
| • Trustee,The Bradley Trusts, private trust funds (2011-present) |
| • Managing Director, Morgan Stanley Investment Management (1993-2010) |
| Other Public Company Board Membership During Past 5Years: |
| • Annaly Capital Management, Inc., Board Member (May 2014-present) |
| No. of Portfolios for which Board Member Serves: 84 |
| ——————— |
| Kenneth A. Himmel (69) |
| Board Member (1994) |
| Principal Occupation During Past 5Years: |
| • Managing Partner, Gulf Related, an international real estate development company (2010-present) |
| • President and CEO, Related Urban Development, a real estate development company |
| (1996-present) |
| • President and CEO, Himmel & Company, a real estate development company (1980-present) |
| • CEO,American Food Management, a restaurant company (1983-present) |
| No. of Portfolios for which Board Member Serves: 32 |
| ——————— |
| Stephen J. Lockwood (68) |
| Board Member (1994) |
| Principal Occupation During Past 5Years: |
| • Chairman of the Board, Stephen J. Lockwood and Company LLC, a real estate investment |
| company (2000-present) |
| No. of Portfolios for which Board Member Serves: 32 |
50
|
| Roslyn M. Watson (65) |
| Board Member (1994) |
| Principal Occupation During Past 5Years: |
| • Principal,Watson Ventures, Inc., a real estate investment company (1993-present) |
| No. of Portfolios for which Board Member Serves: 70 |
| ——————— |
| Benaree Pratt Wiley (69) |
| Board Member (1994) |
| Principal Occupation During Past 5Years: |
| • Principal,The Wiley Group, a firm specializing in strategy and business development |
| (2005-present) |
| Other Public Company Board Membership During Past 5Years: |
| • CBIZ (formerly, Century Business Services, Inc.), a provider of outsourcing functions for small |
| and medium size companies, Director (2008-present) |
| No. of Portfolios for which Board Member Serves: 70 |
| ——————— |
Once elected all Board Members serve for an indefinite term, but achieve Emeritus status upon reaching age 80.The address of the Board Members and Officers is c/o The Dreyfus Corporation, 200 Park Avenue, New York, New York 10166. Additional information about the Board Members is available in the fund’s Statement of Additional Information which can be obtained from Dreyfus free of charge by calling this toll free number: 1-800-DREYFUS.
J.Tomlinson Fort, Emeritus Board Member
James M. Fitzgibbons, Emeritus Board Member
The Fund 51
OFFICERS OF THE FUND (Unaudited)
BRADLEY J. SKAPYAK, President since January 2010.
Chief Operating Officer and a director of the Manager since June 2009, Chairman of Dreyfus Transfer, Inc., an affiliate of the Manager and the transfer agent of the funds, since May 2011 and Executive Vice President of the Distributor since June 2007. From April 2003 to June 2009, Mr. Skapyak was the head of the Investment Accounting and Support Department of the Manager. He is an officer of 69 investment companies (comprised of 147 portfolios) managed by the Manager. He is 56 years old and has been an employee of the Manager since February 1988.
JOHN PAK, Chief Legal Officer since March 2013.
Deputy General Counsel, Investment Management, of BNY Mellon since August 2014; Chief Legal Officer of the Manager since August 2012; from March 2005 to July 2012, Managing Director of Deutsche Bank, Deputy Global Head of Deutsche Asset Management Legal and Regional Head of Deutsche Asset Management Americas Legal. He is an officer of 70 investment companies (comprised of 172 portfolios) managed by the Manager. He is 46 years old and has been an employee of the Manager since August 2012.
JANETTE E. FARRAGHER, Vice President and Secretary since December 2011.
Assistant General Counsel of BNY Mellon, and an officer of 70 investment companies (comprised of 172 portfolios) managed by the Manager. She is 52 years old and has been an employee of the Manager since February 1984.
KIESHA ASTWOOD, Vice President and Assistant Secretary since January 2010.
Counsel of BNY Mellon, and an officer of 70 investment companies (comprised of 172 portfolios) managed by the Manager. She is 42 years old and has been an employee of the Manager since July 1995.
JAMES BITETTO, Vice President and Assistant Secretary since August 2005.
Managing Counsel of BNY Mellon and Secretary of the Manager, and an officer of 70 investment companies (comprised of 172 portfolios) managed by the Manager. He is 48 years old and has been an employee of the Manager since December 1996.
JONI LACKS CHARATAN, Vice President and Assistant Secretary since August 2005.
Managing Counsel of BNY Mellon, and an officer of 70 investment companies (comprised of 172 portfolios) managed by the Manager. She is 59 years old and has been an employee of the Manager since October 1988.
JOSEPH M. CHIOFFI, Vice President and Assistant Secretary since August 2005.
Managing Counsel of BNY Mellon, and an officer of 70 investment companies (comprised of 172 portfolios) managed by the Manager. He is 53 years old and has been an employee of the Manager since June 2000.
JOHN B. HAMMALIAN, Vice President and Assistant Secretary since August 2005.
Senior Managing Counsel of BNY Mellon, and an officer of 70 investment companies (comprised of 172 portfolios) managed by the Manager. He is 51 years old and has been an employee of the Manager since February 1991.
MAUREEN E. KANE, Vice President and Assistant Secretary since April 2015.
Managing Counsel of BNY Mellon since July 2014; from October 2004 until July 2014, General Counsel, and from May 2009 until July 2014, Chief Compliance Officer of Century Capital Management. She is an officer of 70 investment companies (comprised of 172 portfolios) managed by the Manager. She is 53 years old and has been an employee of the Manager since July 2014.
52
SARAH S. KELLEHER, Vice President and Assistant Secretary since April 2014.
Senior Counsel of BNY Mellon, and an officer of 70 investment companies (comprised of 172 portfolios) managed by the Manager; from August 2005 to March 2013, Associate General Counsel of Third Avenue Management. She is 39 years old and has been an employee of the Manager since March 2013.
JEFF PRUSNOFSKY, Vice President and Assistant Secretary since August 2005.
Senior Managing Counsel of BNY Mellon, and an officer of 70 investment companies (comprised of 172 portfolios) managed by the Manager. He is 50 years old and has been an employee of the Manager since October 1990.
JAMES WINDELS, Treasurer since November 2001.
Director – Mutual Fund Accounting of the Manager, and an officer of 70 investment companies (comprised of 172 portfolios) managed by the Manager. He is 56 years old and has been an employee of the Manager since April 1985.
RICHARD CASSARO, Assistant Treasurer since January 2008.
Senior Accounting Manager – Money Market and Municipal Bond Funds of the Manager, and an officer of 70 investment companies (comprised of 172 portfolios) managed by the Manager. He is 56 years old and has been an employee of the Manager since September 1982.
GAVIN C. REILLY, Assistant Treasurer since December 2005.
Tax Manager of the Investment Accounting and Support Department of the Manager, and an officer of 70 investment companies (comprised of 172 portfolios) managed by the Manager. He is 46 years old and has been an employee of the Manager since April 1991.
ROBERT S. ROBOL, Assistant Treasurer since December 2002.
Senior Accounting Manager – Fixed Income Funds of the Manager, and an officer of 70 investment companies (comprised of 172 portfolios) managed by the Manager. He is 51 years old and has been an employee of the Manager since October 1988.
ROBERT SALVIOLO, Assistant Treasurer since July 2007.
Senior Accounting Manager – Equity Funds of the Manager, and an officer of 70 investment companies (comprised of 172 portfolios) managed by the Manager. He is 48 years old and has been an employee of the Manager since June 1989.
ROBERT SVAGNA, Assistant Treasurer since December 2002.
Senior Accounting Manager – Equity Funds of the Manager, and an officer of 70 investment companies (comprised of 172 portfolios) managed by the Manager. He is 48 years old and has been an employee of the Manager since November 1990.
JOSEPH W. CONNOLLY, Chief Compliance Officer since October 2004.
Chief Compliance Officer of the Manager and The Dreyfus Family of Funds (70 investment companies, comprised of 172 portfolios). He is 58 years old and has served in various capacities with the Manager since 1980, including manager of the firm’s Fund Accounting Department from 1997 through October 2001.
The Fund 53
For More Information
Telephone Call your financial representative or 1-800-DREYFUS
Mail The Dreyfus Family of Funds, 144 Glenn Curtiss Boulevard, Uniondale, NY 11556-0144
The fund files its complete schedule of portfolio holdings with the Securities and Exchange Commission (“SEC”) for the first and third quarters of each fiscal year on Form N-Q. The fund’s Forms N-Q are available on the SEC’s website at http://www.sec.gov and may be reviewed and copied at the SEC’s Public Reference Room in Washington, DC. Information on the operation of the Public Reference Room may be obtained by calling 1-800-SEC-0330.
A description of the policies and procedures that the fund uses to determine how to vote proxies relating to portfolio securities, and information regarding how the fund voted these proxies for the most recent 12-month period ended June 30 is available at http://www.dreyfus.com and on the SEC’s website at http://www.sec.gov. The description of the policies and procedures is also available without charge, upon request, by calling 1-800-DREYFUS.

Item 2. Code of Ethics.
The Registrant has adopted a code of ethics that applies to the Registrant's principal executive officer, principal financial officer, principal accounting officer or controller, or persons performing similar functions. There have been no amendments to, or waivers in connection with, the Code of Ethics during the period covered by this Report.
Item 3. Audit Committee Financial Expert.
The Registrant's Board has determined that Joseph S. DiMartino, a member of the Audit Committee of the Board, is an audit committee financial expert as defined by the Securities and Exchange Commission (the "SEC"). Mr. DiMartino is "independent" as defined by the SEC for purposes of audit committee financial expert determinations.
Item 4. Principal Accountant Fees and Services.
(a) Audit Fees. The aggregate fees billed for each of the last two fiscal years (the "Reporting Periods") for professional services rendered by the Registrant's principal accountant (the "Auditor") for the audit of the Registrant's annual financial statements or services that are normally provided by the Auditor in connection with the statutory and regulatory filings or engagements for the Reporting Periods, were $76,420 in 2014 and $78,300 in 2015.
(b) Audit-Related Fees. The aggregate fees billed in the Reporting Periods for assurance and related services by the Auditor that are reasonably related to the performance of the audit of the Registrant's financial statements and are not reported under paragraph (a) of this Item 4 were $9,880 in 2014 and $10,200 in 2015. These services consisted of one or more of the following: (i) agreed upon procedures related to compliance with Internal Revenue Code section 817(h), (ii) security counts required by Rule 17f-2 under the Investment Company Act of 1940, as amended, (iii) advisory services as to the accounting or disclosure treatment of Registrant transactions or events and (iv) advisory services to the accounting or disclosure treatment of the actual or potential impact to the Registrant of final or proposed rules, standards or interpretations by the Securities and Exchange Commission, the Financial Accounting Standards Boards or other regulatory or standard-setting bodies.
The aggregate fees billed in the Reporting Periods for non-audit assurance and related services by the Auditor to the Registrant's investment adviser (not including any sub-investment adviser whose role is primarily portfolio management and is subcontracted with or overseen by another investment adviser), and any entity controlling, controlled by or under common control with the investment adviser that provides ongoing services to the Registrant ("Service Affiliates"), that were reasonably related to the performance of the annual audit of the Service Affiliate, which required pre-approval by the Audit Committee were $0 in 2014 and $0 in 2015.
(c) Tax Fees. The aggregate fees billed in the Reporting Periods for professional services rendered by the Auditor for tax compliance, tax advice, and tax planning ("Tax Services") were $4,920 in 2014 and $5,000 in 2015. These services consisted of the review or preparation of U.S. federal, state, local and excise tax returns. The aggregate fees billed in the Reporting Periods for Tax Services by the Auditor to Service Affiliates, which required pre-approval by the Audit Committee were $0 in 2014 and $0 in 2015.
(d) All Other Fees. The aggregate fees billed in the Reporting Periods for products and services provided by the Auditor, other than the services reported in paragraphs (a) through (c) of this Item, were $0 in 2014 and $0 in 2015.
The aggregate fees billed in the Reporting Periods for Non-Audit Services by the Auditor to Service Affiliates, other than the services reported in paragraphs (b) through (c) of this Item, which required pre-approval by the Audit Committee, were $0 in 2014 and $0 in 2015.
(e)(1) Audit Committee Pre-Approval Policies and Procedures. The Registrant's Audit Committee has established policies and procedures (the "Policy") for pre-approval (within specified fee limits) of the Auditor's engagements for non-audit services to the Registrant and Service Affiliates without specific case-by-case consideration. The pre-approved services in the Policy can include pre-approved audit services, pre-approved audit-related services, pre-approved tax services and pre-approved all other services. Pre-approval considerations include whether the proposed services are compatible with maintaining the Auditor's independence. Pre-approvals pursuant to the Policy are considered annually.
(e)(2) Note: None of the services described in paragraphs (b) through (d) of this Item 4 were approved by the Audit Committee pursuant to paragraph (c)(7)(i)(C) of Rule 2-01 of Regulation S-X.
(f) None of the hours expended on the principal accountant's engagement to audit the registrant's financial statements for the most recent fiscal year were attributed to work performed by persons other than the principal account's full-time, permanent employees.
Non-Audit Fees. The aggregate non-audit fees billed by the Auditor for services rendered to the Registrant, and rendered to Service Affiliates, for the Reporting Periods were $13,493,316 in 2014 and $16,321,620 in 2015.
Auditor Independence. The Registrant's Audit Committee has considered whether the provision of non-audit services that were rendered to Service Affiliates, which were not pre-approved (not requiring pre-approval), is compatible with maintaining the Auditor's independence.
Item 5. Audit Committee of Listed Registrants.
Not applicable.
Item 6. Investments.
(a) Not applicable.
Item 7. Disclosure of Proxy Voting Policies and Procedures for Closed-End Management Investment Companies.
Not applicable.
Item 8. Portfolio Managers of Closed-End Management Investment Companies.
Not applicable.
Item 9. Purchases of Equity Securities by Closed-End Management Investment Companies and Affiliated Purchasers.
Not applicable.
Item 10. Submission of Matters to a Vote of Security Holders.
There have been no material changes to the procedures applicable to Item 10.
Item 11. Controls and Procedures.
(a) The Registrant's principal executive and principal financial officers have concluded, based on their evaluation of the Registrant's disclosure controls and procedures as of a date within 90 days of the filing date of this report, that the Registrant's disclosure controls and procedures are reasonably designed to ensure that information required to be disclosed by the Registrant on Form N-CSR is recorded, processed, summarized and reported within the required time periods and that information required to be disclosed by the Registrant in the reports that it files or submits on Form N-CSR is accumulated and communicated to the Registrant's management, including its principal executive and principal financial officers, as appropriate to allow timely decisions regarding required disclosure.
(b) There were no changes to the Registrant's internal control over financial reporting that occurred during the second fiscal quarter of the period covered by this report that have materially affected, or are reasonably likely to materially affect, the Registrant's internal control over financial reporting.
Item 12. Exhibits.
(a)(1) Code of ethics referred to in Item 2.
(a)(2) Certifications of principal executive and principal financial officers as required by Rule 30a-2(a) under the Investment Company Act of 1940.
(a)(3) Not applicable.
(b) Certification of principal executive and principal financial officers as required by Rule 30a-2(b) under the Investment Company Act of 1940.
SIGNATURES
Pursuant to the requirements of the Securities Exchange Act of 1934 and the Investment Company Act of 1940, the Registrant has duly caused this Report to be signed on its behalf by the undersigned, thereunto duly authorized.
The Dreyfus/Laurel Funds Trust
By: /s/ Bradley J. Skapyak
Bradley J. Skapyak
President
Date: July 20, 2015
Pursuant to the requirements of the Securities Exchange Act of 1934 and the Investment Company Act of 1940, this Report has been signed below by the following persons on behalf of the Registrant and in the capacities and on the dates indicated.
By: /s/ Bradley J. Skapyak
Bradley J. Skapyak
President
Date: July 20, 2015
By: /s/ James Windels
James Windels
Treasurer
Date: July 20, 2015
EXHIBIT INDEX
(a)(1) Code of ethics referred to in Item 2.
(a)(2) Certifications of principal executive and principal financial officers as required by Rule 30a-2(a) under the Investment Company Act of 1940. (EX-99.CERT)
(b) Certification of principal executive and principal financial officers as required by Rule 30a-2(b) under the Investment Company Act of 1940. (EX-99.906CERT)