UNITED STATES
SECURITIES AND EXCHANGE COMMISSION
Washington, D.C. 20549
FORM N-CSR
CERTIFIED SHAREHOLDER REPORT OF REGISTERED MANAGEMENT
INVESTMENT COMPANIES
Investment Company Act file number | 811- 00524 |
| |
| The Dreyfus/Laurel Funds Trust | |
| (Exact name of Registrant as specified in charter) | |
| | |
| c/o The Dreyfus Corporation 200 Park Avenue New York, New York 10166 | |
| (Address of principal executive offices) (Zip code) | |
| | |
| John Pak, Esq. 200 Park Avenue New York, New York 10166 | |
| (Name and address of agent for service) | |
|
Registrant's telephone number, including area code: | (212) 922-6000 |
| |
Date of fiscal year end: | 10/31 | |
Date of reporting period: | 10/31/14 | |
| | | | | | | |
The following N-CSR relates only to the series of the Registrant listed below, and does not affect the other series of the Registrant, which have different fiscal year ends and, therefore, different N-CSR reporting requirements. Separate N-CSR Forms will be filed for those series, as appropriate.
Dreyfus Global Equity Income Fund
Dreyfus International Bond Fund
FORM N-CSR
Item 1. Reports to Stockholders.
|
| Dreyfus |
| Global Equity |
| Income Fund |
ANNUAL REPORT October 31, 2014

Save time. Save paper. View your next shareholder report online as soon as it’s available. Log into www.dreyfus.com and sign up for Dreyfus eCommunications. It’s simple and only takes a few minutes.
The views expressed in this report reflect those of the portfolio manager only through the end of the period covered and do not necessarily represent the views of Dreyfus or any other person in the Dreyfus organization. Any such views are subject to change at any time based upon market or other conditions and Dreyfus disclaims any responsibility to update such views.These views may not be relied on as investment advice and, because investment decisions for a Dreyfus fund are based on numerous factors, may not be relied on as an indication of trading intent on behalf of any Dreyfus fund.
|
| Not FDIC-Insured • Not Bank-Guaranteed • May Lose Value |
| | Contents |
| | THE FUND |
| 2 | A Letter from the President |
| 3 | Discussion of Fund Performance |
| 6 | Fund Performance |
| 8 | Understanding Your Fund’s Expenses |
| 8 | Comparing Your Fund’s Expenses With Those of Other Funds |
| 9 | Statement of Investments |
| 12 | Statement of Assets and Liabilities |
| 13 | Statement of Operations |
| 14 | Statement of Changes in Net Assets |
| 16 | Financial Highlights |
| 20 | Notes to Financial Statements |
| 34 | Report of Independent Registered Public Accounting Firm |
| 35 | Important Tax Information |
| 36 | Board Members Information |
| 38 | Officers of the Fund |
| | FOR MORE INFORMATION |
| | Back Cover |
Dreyfus
Global Equity
Income Fund
The Fund
A LETTER FROM THE PRESIDENT
Dear Shareholder:
We are pleased to present this annual report for Dreyfus Global Equity Income Fund, covering the 12-month period from November 1, 2013, through October 31, 2014. For information about how the fund performed during the reporting period, as well as general market perspectives, we provide a Discussion of Fund Performance on the pages that follow.
For the 12-month reporting period overall, international stock markets generally lost a modest degree of value due to renewed concerns regarding geopolitical tensions and persistently sluggish growth in Europe and the emerging markets. Results were especially weak in January 2014 and over the last four months of the reporting period, offsetting gains at other times when investors responded more positively to aggressively accommodative monetary policies throughout much of the world. A strengthening U.S. dollar against most other major currencies also helped dampen returns for U.S. investors.
Some forces appear likely to support international stock prices over the foreseeable future: Low inflation has enabled the European Central Bank to reduce short-term interest rates further, China’s economic slowdown appears increasingly unlikely to devolve into a more severe financial crisis, and India’s stock market has surged after the election of a more business-friendly government.Yet, some countries are faring better economically than others and monetary policies have begun to diverge, affecting currency exchange rates and capital flows. Consequently, selectivity and a long-term perspective seem poised to become more important determinants of investment success.As always, we urge you to talk regularly with your financial advisor to assess the potential impact of these and other developments on your investments.
Thank you for your continued confidence and support.

J. Charles Cardona
President
The Dreyfus Corporation
November 17, 2014
2
DISCUSSION OF FUND PERFORMANCE
For the period of November 1, 2013, through October 31, 2014, as provided by James Harries, Portfolio Manager of Newton Capital Management Limited, Sub-Investment Adviser
Fund and Market Performance Overview
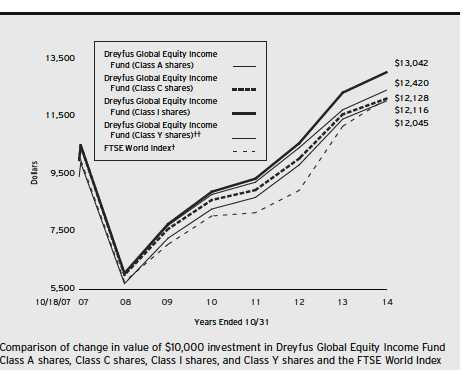
For the 12-month period ended October 31, 2014, Dreyfus Global Equity Income Fund’s Class A shares produced a total return of 5.48%, Class C shares returned 4.71%, Class I shares returned 5.71%, and ClassY shares returned 5.78%.1 In comparison, the fund’s benchmark, the FTSE World Index (the “Index”), produced a total return of 8.44% for the same period.2
Despite bouts of heightened volatility, global equity markets generally advanced during the reporting period amid signs of improving economic conditions in the United States, while other parts of the developed world encountered renewed economic concerns.The fund produced lower returns than its benchmark, mainly due to our focus on traditionally defensive stocks at a time when more economically sensitive stocks fared better.
The Fund’s Investment Approach
The fund seeks to generate total return, consisting of capital appreciation and income. To pursue this goal, the fund normally invests at least 80% of its assets in equity securities, aiming to focus on dividend-paying stocks of companies located in emerging as well as developed capital markets, incorporating investments in countries such as the United States, Canada, Australia, Hong Kong, and Europe.The fund may invest in the securities of companies of any market capitalization, and it may invest up to 30% of its assets in emerging markets.The fund’s portfolio managers will always purchase stocks that, at the time of initial purchase, have a yield premium of 25% over that of the FTSE World Index on a 12-month prospective basis.
We combine “top-down” analysis of current economic trends and investment themes with “bottom-up” stock selection based on fundamental research. Within markets and sectors deemed to be favorable, we seek attractively priced stocks of companies that we believe have sustainable, long-term competitive advantages.
The Fund 3
DISCUSSION OF FUND PERFORMANCE (continued)
Global Markets Advanced despite Headwinds
Global equity markets were driven higher over the reporting period, on average, mainly due to aggressively stimulative monetary policies throughout the world. Although the Federal Reserve Board ended its quantitative easing program at the end of October 2014, it indicated that it would keep short-term U.S. interest rates near historical lows for some time to come. The European Central Bank reduced short-term interest rates and enacted additional asset purchases. Japan intensified its already aggressive quantitative easing program. China added stimulus when its economic slowdown appeared to be gathering momentum.
Investors in the United States responded particularly positively to strengthening labor markets, intensifying manufacturing activity, and rising corporate earnings, resulting in double-digit gains for some major market indices. European stock markets climbed during the first eight months of the reporting period as economic growth appeared to improve, but stocks came under pressure over the summer due to disappointing GDP growth rates, deflation fears, and worries about geopolitical instability. European markets gave up their earlier gains, producing modest declines for the reporting period overall. In Asia, the Japanese stock market struggled with stalling economic growth and the fading benefits of aggressively stimulative monetary and fiscal policies, while Hong Kong and Australian stocks were hampered by slowing economic growth in China.
Defensive Investment Posture Dampened Relative Results
Because we regard the markets’ recent liquidity-driven gains as unsustainable over the longer term, we maintained a relatively defensive investment posture over the reporting period.We invested mainly in stocks that are more bond-like in their qualities, rather than the economically sensitive stocks that led global market performance.
The fund’s holdings in the United States, Switzerland, Germany, and South Korea provided positive results compared to the fund’s benchmark, but positions in Denmark, France, Norway, and the United Kingdom generally hurt relative performance. From an industry group perspective, overweighted exposure to the consumer goods sector and underweighted positions in mining companies and the financials sector bolstered relative results. On the other hand, the telecommunications services and health care sectors underperformed market averages, mainly due to disappointing results from pharmaceutical developers GlaxoSmithKline and Sanofi.
4
Among individual holdings, Reynolds American, Microsoft, Sysco, Merck & Co., and Lockheed Martin ranked among the fund’s stronger holdings over the reporting period. Conversely, Mattel, Balfour Beatty, GlaxoSmithKline, and Tesco weighed on the fund’s relative performance.
Maintaining Investment Discipline
Ongoing economic struggles in Europe and Japan, together with the end of quantitative easing in the United States, could spark heightened uncertainty and volatility in global financial markets. In our view, changing global conditions are likely to produce greater differentiation in the performance of individual markets, industry groups, and securities. We think it is important to retain investment discipline in this more challenging environment and to focus on companies that are allocating shareholder capital correctly. We have identified an ample number of companies meeting our criteria in the consumer goods, telecommunications, utilities, and health care sectors. We have maintained relatively light exposure to the financials, basic materials, technology, and industrials sectors.
November 17, 2014
Equity funds are subject generally to market, market sector, market liquidity, issuer, and investment style risks, among other factors, to varying degrees, all of which are more fully described in the fund’s prospectus.
The fund’s performance will be influenced by political, social, and economic factors affecting investments in foreign companies. Special risks associated with investments in foreign companies include exposure to currency fluctuations, less liquidity, less developed or less efficient trading markets, lack of comprehensive company information, political instability, and differing auditing and legal standards.These risks generally are greater with emerging market countries than with more economically and politically established foreign countries.
|
| 1 Total return includes reinvestment of dividends and any capital gains paid, and does not take into consideration the |
| maximum initial sales charge in the case of Class A shares, or the applicable contingent deferred sales charge imposed |
| on redemptions in the case of Class C shares. Had these charges been reflected, returns would have been lower. Past |
| performance is no guarantee of future results. Share price and investment return fluctuate such that upon redemption, |
| fund shares may be worth more or less than their original cost. Return figures provided reflect an undertaking for the |
| absorption of certain fund expenses by The Dreyfus Corporation through May 1, 2015, at which time it may be |
| extended, terminated, or modified. Had these expenses not been absorbed, the fund’s returns would have been lower. |
| 2 SOURCE: LIPPER INC. – Reflects reinvestment of dividends and, where applicable, capital gain distributions. |
| The FTSE World Index is an unmanaged, free-floating, market-capitalization weighted index that is designed to |
| measure the performance of 90% of the world’s investable stocks issued by large and midcap companies in developed |
| and advanced emerging markets. Investors cannot invest directly in any index. |
The Fund 5
FUND PERFORMANCE
| |
| † | Source: Lipper Inc. |
| †† | The total return figures presented for ClassY shares of the fund reflect the performance of the fund’s Class A shares |
| | for the period prior to 7/1/13 (the inception date for ClassY shares), not reflecting the applicable sales charges for |
| | Class A shares. |
Past performance is not predictive of future performance.
The above graph compares a $10,000 investment made in each of the Class A, Class C, Class I and Class Y shares of Dreyfus Global Equity Income Fund on 10/18/07 (inception date) to a $10,000 investment made in the FTSE World Index (the “Index”) on that date. All dividends and capital gain distributions are reinvested.
The fund’s performance shown in the line graph above takes into account the maximum initial sales charge on Class A shares and all other applicable fees and expenses on all classes.The Index is a widely accepted, unmanaged, free-float market capitalization-weighted index that is designed to measure the performance of 90% of the world’s investable stocks issued by large and mid-cap companies in developed and advanced emerging markets. Unlike a mutual fund, the Index is not subject to charges, fees and other expenses. Investors cannot invest directly in any index. Further information relating to fund performance, including expense reimbursements, if applicable, is contained in the Financial Highlights section of the prospectus and elsewhere in this report.
6
| | | | | | | |
| Average Annual Total Returns as of 10/31/14 | | | | | | |
| | Inception | | | | | From | |
| | Date | 1 Year | | 5 Years | | Inception | |
| Class A shares | | | | | | | |
| with maximum sales charge (5.75%) | 10/18/07 | –0.57 | % | 9.28 | % | 2.68 | % |
| without sales charge | 10/18/07 | 5.48 | % | 10.58 | % | 3.54 | % |
| Class C shares | | | | | | | |
| with applicable redemption charge † | 10/18/07 | 3.71 | % | 9.79 | % | 2.78 | % |
| without redemption | 10/18/07 | 4.71 | % | 9.79 | % | 2.78 | % |
| Class I shares | 10/18/07 | 5.71 | % | 10.90 | % | 3.84 | % |
| Class Y shares | 7/1/13 | 5.78 | % | 9.96 | %†† | 3.13 | %†† |
| FTSE World Index | 10/31/07 | 8.44 | % | 11.38 | % | 2.78 | %††† |
Past performance is not predictive of future performance.The fund’s performance shown in the graph and table does not reflect the deduction of taxes that a shareholder would pay on fund distributions or the redemption of fund shares. In addition to the performance of Class A shares shown with and without a maximum sales charge, the fund’s performance shown in the table takes into account all other applicable fees and expenses on all classes.
| |
| † | The maximum contingent deferred sales charge for Class C shares is 1% for shares redeemed within one year of |
| | the date of purchase. |
| †† | The total return performance figures presented for ClassY shares of the fund reflect the performance of the fund’s |
| | Class A shares for the period prior to 7/1/13 (the inception date for ClassY shares), not reflecting the applicable |
| | sales charges for Class A shares. |
| ††† | For comparative purposes, the value of the Index as of 10/31/07 is used as the beginning value on 10/18/07. |
The Fund 7
UNDERSTANDING YOUR FUND’S EXPENSES (Unaudited)
As a mutual fund investor, you pay ongoing expenses, such as management fees and other expenses. Using the information below, you can estimate how these expenses affect your investment and compare them with the expenses of other funds.You also may pay one-time transaction expenses, including sales charges (loads) and redemption fees, which are not shown in this section and would have resulted in higher total expenses. For more information, see your fund’s prospectus or talk to your financial adviser.
Review your fund’s expenses
The table below shows the expenses you would have paid on a $1,000 investment in Dreyfus Global Equity Income Fund from May 1, 2014 to October 31, 2014. It also shows how much a $1,000 investment would be worth at the close of the period, assuming actual returns and expenses.
Expenses and Value of a $1,000 Investment
assuming actual returns for the six months ended October 31, 2014
| | | | | | | | |
| | | Class A | | Class C | | Class I | | Class Y |
| Expenses paid per $1,000† | $ | 6.46 | $ | 10.10 | $ | 5.16 | $ | 4.76 |
| Ending value (after expenses) | $ | 987.10 | $ | 983.60 | $ | 988.90 | $ | 989.20 |
COMPARING YOUR FUND’S EXPENSES
WITH THOSE OF OTHER FUNDS (Unaudited)
Using the SEC’s method to compare expenses
The Securities and Exchange Commission (SEC) has established guidelines to help investors assess fund expenses. Per these guidelines, the table below shows your fund’s expenses based on a $1,000 investment, assuming a hypothetical 5% annualized return. You can use this information to compare the ongoing expenses (but not transaction expenses or total cost) of investing in the fund with those of other funds. All mutual fund shareholder reports will provide this information to help you make this comparison. Please note that you cannot use this information to estimate your actual ending account balance and expenses paid during the period.
Expenses and Value of a $1,000 Investment
assuming a hypothetical 5% annualized return for the six months ended October 31, 2014
| | | | | | | | |
| | | Class A | | Class C | | Class I | | Class Y |
| Expenses paid per $1,000† | $ | 6.56 | $ | 10.26 | $ | 5.24 | $ | 4.84 |
| Ending value (after expenses) | $ | 1,018.70 | $ | 1,015.02 | $ | 1,020.01 | $ | 1,020.42 |
|
| † Expenses are equal to the fund’s annualized expense ratio of 1.29% for Class A, 2.02% for Class C, 1.03% for |
| Class I and .95% for ClassY, multiplied by the average account value over the period, multiplied by 184/365 (to |
| reflect the one-half year period). |
8
|
| STATEMENT OF INVESTMENTS |
| October 31, 2014 |
| | |
| Common Stocks—99.1% | Shares | Value ($) |
| Australia—1.1% | | |
| Dexus Property Group | 2,981,611 | 3,188,319 |
| Brazil—1.1% | | |
| CCR | 443,694 | 3,303,666 |
| Canada—.8% | | |
| Husky Energy | 97,091 | 2,344,036 |
| Denmark—1.9% | | |
| TDC | 733,527 | 5,599,653 |
| France—4.5% | | |
| Sanofi | 59,711 | 5,530,881 |
| Suez Environnement | 142,493 | 2,401,712 |
| Total | 91,630 | 5,467,891 |
| | | 13,400,484 |
| Germany—3.1% | | |
| Deutsche Post | 163,825 | 5,146,146 |
| Deutsche Telekom | 263,873 | 3,977,615 |
| | | 9,123,761 |
| Hong Kong—1.2% | | |
| Link REIT | 602,500 | 3,541,869 |
| Ireland—1.0% | | |
| CRH | 131,074 | 2,910,417 |
| Luxembourg—1.0% | | |
| SES | 83,067 | 2,868,717 |
| Netherlands—6.2% | | |
| Reed Elsevier | 297,940 | 6,865,137 |
| Royal Dutch Shell, Cl. A | 156,430 | 5,606,961 |
| Wolters Kluwer | 223,243 | 5,962,898 |
| | | 18,434,996 |
| Norway—3.7% | | |
| Orkla | 825,076 | 6,309,139 |
| Statoil | 212,145 | 4,848,702 |
| | | 11,157,841 |
| Singapore—.9% | | |
| Singapore Technologies Engineering | 926,000 | 2,707,299 |
| South Africa—1.0% | | |
| MTN Group | 139,223 | 3,081,873 |
The Fund 9
STATEMENT OF INVESTMENTS (continued)
| | | |
| Common Stocks (continued) | Shares | | Value ($) |
| South Korea—.8% | | | |
| Macquarie Korea Infrastructure Fund | 374,670 | | 2,500,030 |
| Sweden—1.8% | | | |
| TeliaSonera | 789,358 | | 5,471,998 |
| Switzerland—9.8% | | | |
| Credit Suisse Group | 96,182 | a | 2,561,984 |
| Nestle | 44,906 | | 3,287,601 |
| Novartis | 95,817 | | 8,886,453 |
| Roche Holding | 28,313 | | 8,362,426 |
| Zurich Insurance Group | 20,538 | a | 6,215,725 |
| | | | 29,314,189 |
| Thailand—1.0% | | | |
| Bangkok Bank | 466,700 | | 2,897,629 |
| United Kingdom—12.7% | | | |
| BAE Systems | 416,128 | | 3,057,564 |
| Balfour Beatty | 780,179 | | 1,924,269 |
| Centrica | 1,845,000 | | 8,937,603 |
| GlaxoSmithKline | 388,917 | | 8,816,290 |
| SSE | 256,193 | | 6,557,096 |
| Tesco | 734,648 | | 2,043,125 |
| Vodafone Group | 1,949,508 | | 6,477,862 |
| | | | 37,813,809 |
| United States—45.5% | | | |
| Annaly Capital Management | 313,142 | b | 3,572,950 |
| CA | 220,399 | | 6,404,795 |
| Cisco Systems | 126,218 | | 3,088,554 |
| Clorox | 66,993 | | 6,665,804 |
| ConocoPhillips | 50,863 | | 3,669,765 |
| Kraft Foods Group | 53,337 | | 3,005,540 |
| Las Vegas Sands | 49,230 | | 3,065,060 |
| Lockheed Martin | 19,408 | | 3,698,583 |
| Mattel | 169,056 | | 5,252,570 |
| Merck & Co. | 106,316 | | 6,159,949 |
| Microsoft | 344,718 | | 16,184,510 |
| Northeast Utilities | 138,665 | | 6,843,118 |
| Paychex | 142,767 | | 6,701,483 |
| PDL BioPharma | 86,863 | | 740,941 |
| Pfizer | 179,935 | | 5,389,053 |
10
| | | |
| Common Stocks (continued) | Shares | | Value ($) |
| United States (continued) | | | |
| Philip Morris International | 151,924 | | 13,522,755 |
| Procter & Gamble | 75,716 | | 6,607,735 |
| Reynolds American | 280,118 | | 17,622,223 |
| Sysco | 257,541 | | 9,925,630 |
| Two Harbors Investment | 300,696 | | 3,046,051 |
| Verizon Communications | 91,266 | | 4,586,117 |
| | | | 135,753,186 |
| Total Common Stocks | | | |
| (cost $258,688,592) | | | 295,413,772 |
| |
| Other Investment—.5% | | | |
| Registered Investment Company; | | | |
| Dreyfus Institutional Preferred Plus Money Market Fund | | | |
| (cost $1,404,031) | 1,404,031 | c | 1,404,031 |
| Total Investments (cost $260,092,623) | 99.6 | % | 296,817,803 |
| Cash and Receivables (Net) | .4 | % | 1,269,451 |
| Net Assets | 100.0 | % | 298,087,254 |
REIT—Real Estate Investment Trust
| |
| a | Non-income producing security. |
| b | Investment in real estate investment trust. |
| c | Investment in affiliated money market mutual fund. |
| | | |
| Portfolio Summary (Unaudited)† | | |
| |
| | Value (%) | | Value (%) |
| Consumer Goods | 20.9 | Financial | 8.4 |
| Health Care | 14.7 | Utilities | 8.3 |
| Industrial | 10.7 | Oil & Gas | 7.4 |
| Consumer Services | 10.3 | Money Market Investment | .5 |
| Telecommunications | 9.8 | | |
| Technology | 8.6 | | 99.6 |
| |
| † Based on net assets. | | | |
| See notes to financial statements. | | | |
The Fund 11
|
| STATEMENT OF ASSETS AND LIABILITIES |
| October 31, 2014 |
| | | | | |
| | | | Cost | Value | |
| Assets ($): | | | | | |
| Investments in securities—See Statement of Investments: | | | |
| Unaffiliated issuers | | | 258,688,592 | 295,413,772 | |
| Affiliated issuers | | | 1,404,031 | 1,404,031 | |
| Cash denominated in foreign currencies | | | 943 | 932 | |
| Unrealized appreciation on forward foreign | | | | |
| currency exchange contracts—Note 4 | | | | 1,321,121 | |
| Dividends receivable | | | | 902,376 | |
| Receivable for shares of Beneficial Interest subscribed | | | 265,127 | |
| Prepaid expenses | | | | 32,390 | |
| | | | | 299,339,749 | |
| Liabilities ($): | | | | | |
| Due to The Dreyfus Corporation and affiliates—Note 3(c) | | | 325,514 | |
| Cash overdraft due to Custodian | | | | 102,804 | |
| Unrealized depreciation on forward foreign | | | | |
| currency exchange contracts—Note 4 | | | | 559,550 | |
| Payable for shares of Beneficial Interest redeemed | | | 180,657 | |
| Interest payable—Note 2 | | | | 320 | |
| Accrued expenses | | | | 83,650 | |
| | | | | 1,252,495 | |
| Net Assets ($) | | | | 298,087,254 | |
| Composition of Net Assets ($): | | | | | |
| Paid-in capital | | | | 259,380,103 | |
| Accumulated investment (loss)—net | | | | (103,541 | ) |
| Accumulated net realized gain (loss) on investments | | | 1,353,786 | |
| Accumulated net unrealized appreciation (depreciation) | | | | |
| on investments and foreign currency transactions | | | 37,456,906 | |
| Net Assets ($) | | | | 298,087,254 | |
| |
| |
| Net Asset Value Per Share | | | | | |
| | Class A | Class C | Class I | Class Y | |
| Net Assets ($) | 97,152,578 | 51,409,242 | 121,131,447 | 28,393,987 | |
| Shares Outstanding | 7,734,679 | 4,028,870 | 9,969,508 | 2,338,120 | |
| Net Asset Value Per Share ($) | 12.56 | 12.76 | 12.15 | 12.14 | |
| |
| See notes to financial statements. | | | | | |
12
| | |
| STATEMENT OF OPERATIONS | | |
| Year Ended October 31, 2014 | | |
| |
| |
| |
| |
| Investment Income ($): | | |
| Income: | | |
| Cash dividends (net of $722,588 foreign taxes withheld at source): | | |
| Unaffiliated issuers | 14,921,588 | |
| Affiliated issuers | 3,186 | |
| Interest | 5,207 | |
| Total Income | 14,929,981 | |
| Expenses: | | |
| Management fee—Note 3(a) | 2,674,691 | |
| Shareholder servicing costs—Note 3(c) | 657,682 | |
| Distribution fees—Note 3(b) | 404,239 | |
| Custodian fees—Note 3(c) | 91,041 | |
| Registration fees | 86,747 | |
| Professional fees | 64,200 | |
| Prospectus and shareholders’ reports | 34,815 | |
| Trustees’ fees and expenses—Note 3(d) | 25,842 | |
| Interest expense—Note 2 | 4,848 | |
| Loan commitment fees—Note 2 | 3,185 | |
| Miscellaneous | 29,255 | |
| Total Expenses | 4,076,545 | |
| Less—reduction in fees due to earnings credits—Note 3(c) | (22 | ) |
| Net Expenses | 4,076,523 | |
| Investment Income—Net | 10,853,458 | |
| Realized and Unrealized Gain (Loss) on Investments—Note 4 ($): | | |
| Net realized gain (loss) on investments and foreign currency transactions | 4,744,471 | |
| Net realized gain (loss) on forward foreign currency exchange contracts | (120,252 | ) |
| Net Realized Gain (Loss) | 4,624,219 | |
| Net unrealized appreciation (depreciation) on | | |
| investments and foreign currency transactions | 163,989 | |
| Net unrealized appreciation (depreciation) on | | |
| forward foreign currency exchange contracts | 1,013,946 | |
| Net Unrealized Appreciation (Depreciation) | 1,177,935 | |
| Net Realized and Unrealized Gain (Loss) on Investments | 5,802,154 | |
| Net Increase in Net Assets Resulting from Operations | 16,655,612 | |
| See notes to financial statements. | | |
The Fund 13
STATEMENT OF CHANGES IN NET ASSETS
| | | | |
| | Year Ended October 31, | |
| | 2014 | | 2013 | a |
| Operations ($): | | | | |
| Investment income—net | 10,853,458 | | 7,062,430 | |
| Net realized gain (loss) on investments | 4,624,219 | | (3,080,351 | ) |
| Net unrealized appreciation | | | | |
| (depreciation) on investments | 1,177,935 | | 32,797,583 | |
| Net Increase (Decrease) in Net Assets | | | | |
| Resulting from Operations | 16,655,612 | | 36,779,662 | |
| Dividends to Shareholders from ($): | | | | |
| Investment income—net: | | | | |
| Class A | (3,796,363 | ) | (2,825,262 | ) |
| Class C | (1,381,586 | ) | (877,634 | ) |
| Class I | (4,279,832 | ) | (3,993,249 | ) |
| Class Y | (1,106,274 | ) | (259,556 | ) |
| Net realized gain on investments: | | | | |
| Class A | — | | (299,454 | ) |
| Class C | — | | (121,659 | ) |
| Class I | — | | (490,122 | ) |
| Total Dividends | (10,564,055 | ) | (8,866,936 | ) |
| Beneficial Interest Transactions ($): | | | | |
| Net proceeds from shares sold: | | | | |
| Class A | 28,835,993 | | 84,358,887 | |
| Class C | 11,199,951 | | 31,020,931 | |
| Class I | 81,334,072 | | 95,212,234 | |
| Class Y | 84,489 | | 33,915,206 | |
| Dividends reinvested: | | | | |
| Class A | 3,364,545 | | 2,688,852 | |
| Class C | 676,967 | | 412,796 | |
| Class I | 2,926,826 | | 3,160,915 | |
| Class Y | 1,105,845 | | 259,547 | |
| Cost of shares redeemed: | | | | |
| Class A | (51,987,456 | ) | (33,968,406 | ) |
| Class C | (13,166,168 | ) | (4,956,263 | ) |
| Class I | (74,989,349 | ) | (71,680,582 | ) |
| Class Y | (8,035,879 | ) | — | |
| Increase (Decrease) in Net Assets from | | | | |
| Beneficial Interest Transactions | (18,650,164 | ) | 140,424,117 | |
| Total Increase (Decrease) in Net Assets | (12,558,607 | ) | 168,336,843 | |
| Net Assets ($): | | | | |
| Beginning of Period | 310,645,861 | | 142,309,018 | |
| End of Period | 298,087,254 | | 310,645,861 | |
| Undistributed investment (loss)—net | (103,541 | ) | (304,063 | ) |
14
| | | | |
| | Year Ended October 31, | |
| | 2014 | | 2013 | a |
| Capital Share Transactions: | | | | |
| Class Ab | | | | |
| Shares sold | 2,290,211 | | 7,319,390 | |
| Shares issued for dividends reinvested | 264,800 | | 234,602 | |
| Shares redeemed | (4,098,591 | ) | (2,916,427 | ) |
| Net Increase (Decrease) in Shares Outstanding | (1,543,580 | ) | 4,637,565 | |
| Class Cb | | | | |
| Shares sold | 878,643 | | 2,653,644 | |
| Shares issued for dividends reinvested | 52,300 | | 35,410 | |
| Shares redeemed | (1,022,959 | ) | (417,411 | ) |
| Net Increase (Decrease) in Shares Outstanding | (92,016 | ) | 2,271,643 | |
| Class Ic | | | | |
| Shares sold | 6,648,699 | | 8,572,459 | |
| Shares issued for dividends reinvested | 238,519 | | 286,473 | |
| Shares redeemed | (6,160,513 | ) | (6,247,149 | ) |
| Net Increase (Decrease) in Shares Outstanding | 726,705 | | 2,611,783 | |
| Class Yc | | | | |
| Shares sold | 6,690 | | 2,883,951 | |
| Shares issued for dividends reinvested | 90,206 | | 22,472 | |
| Shares redeemed | (665,199 | ) | — | |
| Net Increase (Decrease) in Shares Outstanding | (568,303 | ) | 2,906,423 | |
|
| a Effective July 1, 2013, the fund commenced offering ClassY shares. |
| b During the period ended October 31, 2013, 245 Class C shares representing $3,028 were exchanged for 249 |
| Class A shares. |
| c During the period ended October 31, 2014, 6,684 Class I shares representing $84,489 were exchanged for 6,690 |
| ClassY shares. |
See notes to financial statements.
The Fund 15
FINANCIAL HIGHLIGHTS
The following tables describe the performance for each share class for the fiscal periods indicated. All information (except portfolio turnover rate) reflects financial results for a single fund share.Total return shows how much your investment in the fund would have increased (or decreased) during each period, assuming you had reinvested all dividends and distributions.These figures have been derived from the fund’s financial statements.
| | | | | | | | | | |
| | | | Year Ended October 31, | | | |
| Class A Shares | 2014 | | 2013 | | 2012 | | 2011 | | 2010 | |
| Per Share Data ($): | | | | | | | | | | |
| Net asset value, beginning of period | 12.31 | | 10.99 | | 10.17 | | 9.97 | | 9.03 | |
| Investment Operations: | | | | | | | | | | |
| Investment income—neta | .44 | | .33 | | .28 | | .35 | | .31 | |
| Net realized and unrealized | | | | | | | | | | |
| gain (loss) on investments | .24 | | 1.42 | | .99 | | .13 | | .92 | |
| Total from Investment Operations | .68 | | 1.75 | | 1.27 | | .48 | | 1.23 | |
| Distributions: | | | | | | | | | | |
| Dividends from investment income—net | (.43 | ) | (.37 | ) | (.45 | ) | (.28 | ) | (.29 | ) |
| Dividends from net realized | | | | | | | | | | |
| gain on investments | — | | (.06 | ) | — | | — | | — | |
| Total Distributions | (.43 | ) | (.43 | ) | (.45 | ) | (.28 | ) | (.29 | ) |
| Net asset value, end of period | 12.56 | | 12.31 | | 10.99 | | 10.17 | | 9.97 | |
| Total Return (%)b | 5.48 | | 16.22 | | 12.98 | | 4.86 | | 13.86 | |
| Ratios/Supplemental Data (%): | | | | | | | | | | |
| Ratio of total expenses | | | | | | | | | | |
| to average net assets | 1.30 | | 1.34 | | 1.55 | | 2.14 | | 3.13 | |
| Ratio of net expenses | | | | | | | | | | |
| to average net assets | 1.30 | | 1.34 | | 1.50 | | 1.50 | | 1.50 | |
| Ratio of net investment income | | | | | | | | | | |
| to average net assets | 3.49 | | 2.83 | | 2.76 | | 3.35 | | 3.36 | |
| Portfolio Turnover Rate | 33.28 | | 25.57 | | 21.89 | | 54.88 | | 56.17 | |
| Net Assets, end of period ($ x 1,000) | 97,153 | | 114,247 | | 51,003 | | 5,710 | | 5,406 | |
| |
| a | Based on average shares outstanding. |
| b | Exclusive of sales charge. |
See notes to financial statements.
16
| | | | | | | | | | |
| | | | Year Ended October 31, | | | |
| Class C Shares | 2014 | | 2013 | | 2012 | | 2011 | | 2010 | |
| Per Share Data ($): | | | | | | | | | | |
| Net asset value, beginning of period | 12.50 | | 11.13 | | 10.22 | | 10.02 | | 9.01 | |
| Investment Operations: | | | | | | | | | | |
| Investment income—neta | .35 | | .25 | | .22 | | .30 | | .21 | |
| Net realized and unrealized | | | | | | | | | | |
| gain (loss) on investments | .24 | | 1.44 | | .98 | | .10 | | .97 | |
| Total from Investment Operations | .59 | | 1.69 | | 1.20 | | .40 | | 1.18 | |
| Distributions: | | | | | | | | | | |
| Dividends from investment income—net | (.33 | ) | (.26 | ) | (.29 | ) | (.20 | ) | (.17 | ) |
| Dividends from net realized | | | | | | | | | | |
| gain on investments | — | | (.06 | ) | — | | — | | — | |
| Total Distributions | (.33 | ) | (.32 | ) | (.29 | ) | (.20 | ) | (.17 | ) |
| Net asset value, end of period | 12.76 | | 12.50 | | 11.13 | | 10.22 | | 10.02 | |
| Total Return (%)b | 4.71 | | 15.31 | | 12.19 | | 4.01 | | 13.24 | |
| Ratios/Supplemental Data (%): | | | | | | | | | | |
| Ratio of total expenses | | | | | | | | | | |
| to average net assets | 2.04 | | 2.07 | | 2.29 | | 2.86 | | 3.92 | |
| Ratio of net expenses | | | | | | | | | | |
| to average net assets | 2.04 | | 2.07 | | 2.25 | | 2.25 | | 2.25 | |
| Ratio of net investment income | | | | | | | | | | |
| to average net assets | 2.71 | | 2.10 | | 2.14 | | 2.83 | | 2.31 | |
| Portfolio Turnover Rate | 33.28 | | 25.57 | | 21.89 | | 54.88 | | 56.17 | |
| Net Assets, end of period ($ x 1,000) | 51,409 | | 51,523 | | 20,591 | | 2,658 | | 1,564 | |
| |
| a | Based on average shares outstanding. |
| b | Exclusive of sales charge. |
See notes to financial statements.
The Fund 17
FINANCIAL HIGHLIGHTS (continued)
| | | | | | | | | | |
| | | | Year Ended October 31, | | | |
| Class I Shares | 2014 | | 2013 | | 2012 | | 2011 | | 2010 | |
| Per Share Data ($): | | | | | | | | | | |
| Net asset value, beginning of period | 11.93 | | 10.66 | | 9.91 | | 9.74 | | 8.83 | |
| Investment Operations: | | | | | | | | | | |
| Investment income—neta | .45 | | .36 | | .35 | | .37 | | .35 | |
| Net realized and unrealized | | | | | | | | | | |
| gain (loss) on investments | .23 | | 1.37 | | .90 | | .12 | | .89 | |
| Total from Investment Operations | .68 | | 1.73 | | 1.25 | | .49 | | 1.24 | |
| Distributions: | | | | | | | | | | |
| Dividends from investment income—net | (.46 | ) | (.40 | ) | (.50 | ) | (.32 | ) | (.33 | ) |
| Dividends from net realized | | | | | | | | | | |
| gain on investments | — | | (.06 | ) | — | | — | | — | |
| Total Distributions | (.46 | ) | (.46 | ) | (.50 | ) | (.32 | ) | (.33 | ) |
| Net asset value, end of period | 12.15 | | 11.93 | | 10.66 | | 9.91 | | 9.74 | |
| Total Return (%) | 5.71 | | 16.63 | | 13.16 | | 5.11 | | 14.39 | |
| Ratios/Supplemental Data (%): | | | | | | | | | | |
| Ratio of total expenses | | | | | | | | | | |
| to average net assets | 1.04 | | 1.06 | | 1.28 | | 1.86 | | 2.82 | |
| Ratio of net expenses | | | | | | | | | | |
| to average net assets | 1.04 | | 1.06 | | 1.25 | | 1.25 | | 1.25 | |
| Ratio of net investment income | | | | | | | | | | |
| to average net assets | 3.66 | | 3.13 | | 3.47 | | 3.68 | | 3.85 | |
| Portfolio Turnover Rate | 33.28 | | 25.57 | | 21.89 | | 54.88 | | 56.17 | |
| Net Assets, end of period ($ x 1,000) | 121,131 | | 110,233 | | 70,715 | | 8,202 | | 6,094 | |
| |
| a Based on average shares outstanding. | | | | | | | | | | |
| See notes to financial statements. | | | | | | | | | | |
18
| | | | |
| | Year Ended October 31, | |
| Class Y Shares | 2014 | | 2013 | a |
| Per Share Data ($): | | | | |
| Net asset value, beginning of period | 11.92 | | 11.06 | |
| Investment Operations: | | | | |
| Investment income—netb | .46 | | .06 | |
| Net realized and unrealized | | | | |
| gain (loss) on investments | .23 | | .89 | |
| Total from Investment Operations | .69 | | .95 | |
| Distributions: | | | | |
| Dividends from investment income—net | (.47 | ) | (.09 | ) |
| Net asset value, end of period | 12.14 | | 11.92 | |
| Total Return (%) | 5.78 | | 8.62 | c |
| Ratios/Supplemental Data (%): | | | | |
| Ratio of total expenses to average net assets | .96 | | 1.08 | d |
| Ratio of net expenses to average net assets | .96 | | 1.08 | d |
| Ratio of net investment income to average net assets | 3.80 | | 2.26 | d |
| Portfolio Turnover Rate | 33.28 | | 25.57 | |
| Net Assets, end of period ($ x 1,000) | 28,394 | | 34,643 | |
| |
| a | From July 1, 2013 (commencement of initial offering) to October 31, 2013. |
| b | Based on average shares outstanding. |
| c | Not annualized. |
| d | Annualized. |
See notes to financial statements.
The Fund 19
NOTES TO FINANCIAL STATEMENTS
NOTE 1—Significant Accounting Policies:
Dreyfus Global Equity Income Fund (the “fund”) is a separate diversified series of The Dreyfus/Laurel Funds Trust (the “Trust”), which is registered under the Investment Company Act of 1940, as amended (the “Act”), as an open-end management investment company and operates as a series company currently offering five series, including the fund.The fund’s investment objective is to seek total return (consisting of capital appreciation and income).The Dreyfus Corporation (the “Manager” or “Dreyfus”), a wholly-owned subsidiary of The Bank of New York Mellon Corporation (“BNY Mellon”), serves as the fund’s investment adviser. Newton Capital Management Limited (“Newton”), an affiliate of BNY Mellon, serves as the fund’s sub-investment adviser.
MBSC Securities Corporation (the “Distributor”), a wholly-owned subsidiary of Dreyfus, is the distributor of the fund’s shares. The fund is authorized to issue an unlimited number of $.001 par value shares of Beneficial Interest in each of the following classes of shares: Class A, Class C, Class I and Class Y. Class A and Class C shares are sold primarily to retail investors through financial intermediaries and bear Distribution and/or Shareholder Services Plan fees. Class A shares generally are subject to a sales charge imposed at the time of purchase. Class C shares are subject to a contingent deferred sales charge (“CDSC”) imposed on Class C shares redeemed within one year of purchase. Class I shares are sold primarily to bank trust departments and other financial service providers (including The Bank of NewYork Mellon, a subsidiary of BNY Mellon and an affiliate of Dreyfus, and its affiliates), acting on behalf of customers having a qualified trust or an investment account or relationship at such institution, and bear no Distribution or Shareholder Services Plan fees. Class Y shares are sold at net asset value per share generally to institutional investors and bear no Distribution or Shareholder Services Plan fees. Class I and Class Y shares are offered without a front-end sales charge or CDSC. Other differences between the classes include the services offered to and the expenses borne by each class, the allocation of certain transfer agency
20
costs, and certain voting rights. Income, expenses (other than expenses attributable to a specific class), and realized and unrealized gains or losses on investments are allocated to each class of shares based on its relative net assets.
The Trust accounts separately for the assets, liabilities and operations of each series. Expenses directly attributable to each series are charged to that series’ operations; expenses which are applicable to all series are allocated among them on a pro rata basis.
The Financial Accounting Standards Board (“FASB”) Accounting Standards Codification (“ASC”) is the exclusive reference of authoritative U.S. generally accepted accounting principles (“GAAP”) recognized by the FASB to be applied by nongovernmental entities. Rules and interpretive releases of the Securities and Exchange Commission (“SEC”) under authority of federal laws are also sources of authoritative GAAP for SEC registrants. The fund’s financial statements are prepared in accordance with GAAP, which may require the use of management estimates and assumptions. Actual results could differ from those estimates.
(a) Portfolio valuation: The fair value of a financial instrument is the amount that would be received to sell an asset or paid to transfer a liability in an orderly transaction between market participants at the measurement date (i.e., the exit price). GAAP establishes a fair value hierarchy that prioritizes the inputs of valuation techniques used to measure fair value. This hierarchy gives the highest priority to unadjusted quoted prices in active markets for identical assets or liabilities (Level 1 measurements) and the lowest priority to unobservable inputs (Level 3 measurements).
Additionally, GAAP provides guidance on determining whether the volume and activity in a market has decreased significantly and whether such a decrease in activity results in transactions that are not orderly. GAAP requires enhanced disclosures around valuation inputs and techniques used during annual and interim periods.
The Fund 21
NOTES TO FINANCIAL STATEMENTS (continued)
Various inputs are used in determining the value of the fund’s investments relating to fair value measurements.These inputs are summarized in the three broad levels listed below:
Level 1—unadjusted quoted prices in active markets for identical investments.
Level 2—other significant observable inputs (including quoted prices for similar investments, interest rates, prepayment speeds, credit risk, etc.).
Level 3—significant unobservable inputs (including the fund’s own assumptions in determining the fair value of investments).
The inputs or methodology used for valuing securities are not necessarily an indication of the risk associated with investing in those securities.
Changes in valuation techniques may result in transfers in or out of an assigned level within the disclosure hierarchy. Valuation techniques used to value the fund’s investments are as follows:
Investments in securities are valued at the last sales price on the securities exchange or national securities market on which such securities are primarily traded. Securities listed on the National Market System for which market quotations are available are valued at the official closing price or, if there is no official closing price that day, at the last sales price. Securities not listed on an exchange or the national securities market, or securities for which there were no transactions, are valued at the average of the most recent bid and asked prices, except for open short positions, where the asked price is used for valuation purposes. Bid price is used when no asked price is available. Registered investment companies that are not traded on an exchange are valued at their net asset value.All of the preceding securities are generally categorized within Level 1 of the fair value hierarchy.
Fair valuing of securities may be determined with the assistance of a pricing service using calculations based on indices of domestic securi-
22
ties and other appropriate indicators, such as prices of relevant American Depository Receipts and financial futures. Utilizing these techniques may result in transfers between Level 1 and Level 2 of the fair value hierarchy.
When market quotations or official closing prices are not readily available, or are determined not to reflect accurately fair value, such as when the value of a security has been significantly affected by events after the close of the exchange or market on which the security is principally traded (for example, a foreign exchange or market), but before the fund calculates its net asset value, the fund may value these investments at fair value as determined in accordance with the procedures approved by the Trust’s Board of Trustees (the “Board”). Certain factors may be considered when fair valuing investments such as: fundamental analytical data, the nature and duration of restrictions on disposition, an evaluation of the forces that influence the market in which the securities are purchased and sold, and public trading in similar securities of the issuer or comparable issuers.These securities are either categorized within Level 2 or 3 of the fair value hierarchy depending on the relevant inputs used.
For restricted securities where observable inputs are limited, assumptions about market activity and risk are used and are generally categorized within Level 3 of the fair value hierarchy.
Investments denominated in foreign currencies are translated to U.S. dollars at the prevailing rates of exchange.
Forward foreign currency exchange contracts (“forward contracts”) are valued at the forward rate and are generally categorized within Level 2 of the fair value hierarchy.
The Fund 23
NOTES TO FINANCIAL STATEMENTS (continued)
The following is a summary of the inputs used as of October 31, 2014 in valuing the fund’s investments:
| | | | | | |
| | | Level 2—Other | | Level 3— | | |
| | Level 1— | Significant | | Significant | | |
| | Unadjusted | Observable | | Unobservable | | |
| | Quoted Prices | Inputs | | Inputs | Total | |
| Assets ($) | | | | | | |
| Investments in Securities: | | | | | |
| Equity Securities— | | | | | | |
| Domestic | | | | | | |
| Common Stocks† | 135,753,186 | — | | — | 135,753,186 | |
| Equity Securities— | | | | | | |
| Foreign | | | | | | |
| Common Stocks† | — | 159,660,586 | †† | — | 159,660,586 | |
| Mutual Funds | 1,404,031 | — | | — | 1,404,031 | |
| Other Financial | | | | | | |
| Instruments: | | | | | | |
| Forward Foreign | | | | | | |
| Currency Exchange | | | | | | |
| Contracts††† | — | 1,321,121 | | — | 1,321,121 | |
| Liabilities ($) | | | | | | |
| Other Financial | | | | | | |
| Instruments: | | | | | | |
| Forward Foreign | | | | | | |
| Currency Exchange | | | | | | |
| Contracts††† | — | (559,550 | ) | — | (559,550 | ) |
| |
| † | See Statement of Investments for additional detailed categorizations. |
| †† | Securities classified within Level 2 at period end as the values were determined pursuant to the |
| | fund’s fair valuation procedures. |
| ††† | Amount shown represents unrealized appreciation (depreciation) at period end. |
At October 31, 2013, no exchange traded foreign equity securities were classified within Level 2 of the fair value hierarchy.
(b) Foreign currency transactions: The fund does not isolate that portion of the results of operations resulting from changes in foreign exchange rates on investments from the fluctuations arising from changes in market prices of securities held. Such fluctuations are included with the net realized and unrealized gain or loss on investments.
24
Net realized foreign exchange gains or losses arise from sales of foreign currencies, currency gains or losses realized on securities transactions between trade and settlement date, and the difference between the amounts of dividends, interest and foreign withholding taxes recorded on the fund’s books and the U.S. dollar equivalent of the amounts actually received or paid. Net unrealized foreign exchange gains and losses arise from changes in the value of assets and liabilities other than investments resulting from changes in exchange rates. Foreign currency gains and losses on foreign currency transactions are also included with net realized and unrealized gain or loss on investments.
(c) Securities transactions and investment income: Securities transactions are recorded on a trade date basis. Realized gains and losses from securities transactions are recorded on the identified cost basis. Dividend income is recognized on the ex-dividend date and interest income, including, where applicable, accretion of discount and amortization of premium on investments, is recognized on the accrual basis.
(d) Affiliated issuers: Investments in other investment companies advised by Dreyfus are defined as “affiliated” under the Act. Investments in affiliated investment companies during the period ended October 31, 2014 were as follows:
| | | | | | | |
| Affiliated | | | | | | | |
| Investment | Value | | | | Value | | Net |
| Company | 10/31/2013 | ($) | Purchases ($) | Sales ($) | 10/31/2014 | ($) | Assets (%) |
| Dreyfus | | | | | | | |
| Institutional | | | | | | | |
| Preferred | | | | | | | |
| Plus Money | | | | | | | |
| Market | | | | | | | |
| Fund | 10,414,410 | | 85,014,775 | 94,025,154 | 1,404,031 | | .5 |
(e) Risk: Investing in foreign markets may involve special risks and considerations not typically associated with investing in the U.S.These risks include revaluation of currencies, high rates of inflation, repatriation restrictions on income and capital, and adverse political and economic
The Fund 25
NOTES TO FINANCIAL STATEMENTS (continued)
developments. Moreover, securities issued in these markets may be less liquid, subject to government ownership controls and delayed settlements, and their prices may be more volatile than those of comparable securities in the U.S.
(f) Dividends to shareholders: Dividends are recorded on the ex-dividend date. Dividends from investment income-net are normally declared and paid quarterly. Dividends from net realized capital gains, if any, are normally declared and paid annually, but the fund may make distributions on a more frequent basis to comply with the distribution requirements of the Internal Revenue Code of 1986, as amended (the “Code”).To the extent that net realized capital gains can be offset by capital loss carryovers, it is the policy of the fund not to distribute such gains. Income and capital gain distributions are determined in accordance with income tax regulations, which may differ from GAAP.
(g) Federal income taxes: It is the policy of the fund to continue to qualify as a regulated investment company, if such qualification is in the best interests of its shareholders, by complying with the applicable provisions of the Code, and to make distributions of taxable income sufficient to relieve it from substantially all federal income and excise taxes.
As of and during the period ended October 31, 2014, the fund did not have any liabilities for any uncertain tax positions.The fund recognizes interest and penalties, if any, related to uncertain tax positions as income tax expense in the Statement of Operations. During the period ended October 31, 2014, the fund did not incur any interest or penalties.
Each tax year in the four-year period ended October 31, 2014 remains subject to examination by the Internal Revenue Service and state taxing authorities.
At October 31, 2014, the components of accumulated earnings on tax basis were as follows: undistributed ordinary income $1,151,095, undistributed capital gains $2,784,257 and unrealized appreciation $34,771,799.
The tax character of distributions paid to shareholders during the fiscal periods ended October 31, 2014 and October 31, 2013 were as fol-
26
lows: ordinary income $10,564,055 and $8,226,563, and long-term capital gains $0 and $640,373, respectively.
During the period ended October 31, 2014 as a result of permanent book to tax differences, primarily due to the tax treatment for foreign currency gains and losses, passive foreign investment companies, real estate investment trusts and amortization of premiums, the fund decreased accumulated undistributed investment income-net by $88,881 and increased accumulated net realized gain (loss) on investments by the same amount. Net assets and net asset value per share were not affected by this reclassification.
NOTE 2—Bank Lines of Credit:
The fund participates with other Dreyfus-managed funds in a $430 million unsecured credit facility led by Citibank, N.A. and a $300 million unsecured credit facility provided by The Bank of New York Mellon (each, a “Facility”), each to be utilized primarily for temporary or emergency purposes, including the financing of redemptions. Prior to October 8, 2014, the unsecured credit facility with Citibank, N.A. was $265 million. In connection therewith, the fund has agreed to pay its pro rata portion of commitment fees for each Facility. Interest is charged to the fund based on rates determined pursuant to the terms of the respective Facility at the time of borrowing.
The average amount of borrowings outstanding under the Facilities during the period ended October 31, 2014 was approximately $444,700 with a related weighted average annualized interest rate of 1.09%.
NOTE 3—Management Fee, Sub-Investment Advisory Fee and Other Transactions with Affiliates:
(a) Pursuant to a management agreement with Dreyfus and the Trust, the Trust has agreed to pay Dreyfus a management fee computed at the annual rate of .85% of the value of the fund’s average daily net assets and is payable monthly.
The Fund 27
NOTES TO FINANCIAL STATEMENTS (continued)
The Manager had contractually agreed, from November 1, 2013 through April 30, 2014, to waive receipt of its fees and/or assume the direct expenses of the fund, so that the expenses of none of the classes (excluding Rule 12b-1 Distribution Plan fees, Shareholder Services Plan fees, taxes, interest expense, brokerage commissions, commitment fees on borrowings and extraordinary expenses) exceeded 1.10% of the value of the fund’s average daily net assets. The Manager has also contractually agreed, from May 1, 2014 through May 1, 2015, to waive receipt of its fees and/or assume the direct expenses of the fund, so that the expenses of Class A, C, I and Y shares (excluding certain expenses as described above) do not exceed 1.05%, 1.05%, 1.05% and .95% of the value of the respective class’ average daily net assets. During the period ended October 31, 2014, there was no reduction in expenses.
Pursuant to a Sub-Investment Advisory Agreement between Dreyfus and Newton, Dreyfus pays Newton an annual fee of .41% of the value of the fund’s average daily net assets.
During the period ended October 31, 2014, the Distributor retained $60,912 from commissions earned on sales of the fund’s Class A shares and $18,319 from CDSCs on redemptions of the fund’s Class C shares.
(b) Under the Distribution Plan adopted pursuant to Rule 12b-1 under the Act, Class C shares pay the Distributor for distributing its shares at an annual rate of .75% of the value of its average daily net assets. During the period ended October 31, 2014, Class C shares were charged $404,239 pursuant to the Distribution Plan.
(c) Under the Shareholder Services Plan, Class A and Class C shares pay the Distributor at an annual rate of .25% of the value of their average daily net assets for the provision of certain services. The services provided may include personal services relating to shareholder accounts, such as answering shareholder inquiries regarding the fund and providing reports and other information, and services related to the maintenance of shareholder accounts.The Distributor may make payments to Service Agents (securities dealers, financial institutions or other industry professionals) with respect to these services.The Distributor determines
28
the amounts to be paid to Service Agents. During the period ended October 31, 2014, Class A and Class C shares were charged $283,540 and $134,746, respectively, pursuant to the Shareholder Services Plan.
Under its terms, the Distribution Plan and Shareholder Services Plan shall remain in effect from year to year, provided such continuance is approved annually by a vote of a majority of those Trustees who are not “interested persons” of the Trust and who have no direct or indirect financial interest in the operation of or in any agreement related to the Distribution Plan or Shareholder Services Plan.
The fund has arrangements with the transfer agent and the custodian whereby the fund may receive earnings credits when positive cash balances are maintained, which are used to offset transfer agency and custody fees. For financial reporting purposes, the fund includes net earnings credits as an expense offset in the Statement of Operations.
The fund compensates Dreyfus Transfer, Inc., a wholly-owned subsidiary of Dreyfus, under a transfer agency agreement for providing transfer agency and cash management services for the fund. The majority of transfer agency fees are comprised of amounts paid on a per account basis, while cash management fees are related to fund subscriptions and redemptions. During the period ended October 31, 2014, the fund was charged $7,503 for transfer agency services and $316 for cash management services.These fees are included in Shareholder servicing costs in the Statement of Operations. Cash management fees were partially offset by earnings credits of $22.
The fund compensates The Bank of NewYork Mellon under a custody agreement for providing custodial services for the fund.These fees are determined based on net assets, geographic region and transaction activity. During the period ended October 31, 2014, the fund was charged $91,041 pursuant to the custody agreement.
During the period ended October 31, 2014, the fund was charged $8,015 for services performed by the Chief Compliance Officer and his staff.
The Fund 29
NOTES TO FINANCIAL STATEMENTS (continued)
The components of “Due to The Dreyfus Corporation and affiliates” in the Statement of Assets and Liabilities consist of: management fees $212,986 Distribution Plan fees $32,139, Shareholder Services Plan fees $31,195, custodian fees $40,913, Chief Compliance Officer fees $617 and transfer agency fees $7,664.
(d) Each Board member also serves as a Board member of other funds within the Dreyfus complex. Annual retainer fees and attendance fees are allocated to each fund based on net assets.
NOTE 4—Securities Transactions:
The aggregate amount of purchases and sales of investment securities, excluding short-term securities and forward contracts, during the period ended October 31, 2014, amounted to $103,077,755 and $107,505,650, respectively.
Derivatives: A derivative is a financial instrument whose performance is derived from the performance of another asset. Each type of derivative instrument that was held by the fund during the period ended October 31, 2014 is discussed below.
Master Netting Arrangements: The fund enters into International Swaps and Derivatives Association, Inc. Master Agreements or similar agreements (collectively,“Master Agreements”) with its over-the counter (“OTC”) derivative contract counterparties in order to, among other things, reduce its credit risk to counterparties. Master Agreements include provisions for general obligations, representations, collateral and events of default or termination. Under a Master Agreement, the fund may offset with the counterparty certain derivative financial instrument’s payables and/or receivables with collateral held and/or posted and create one single net payment in the event of default or termination.
Forward Foreign Currency Exchange Contracts: The fund enters into forward contracts in order to hedge its exposure to changes in foreign currency exchange rates on its foreign portfolio holdings, to settle foreign currency transactions or as a part of its investment strategy.When executing forward contracts, the fund is obligated to buy or sell a foreign currency at a specified rate on a certain date in the future.With respect
30
to sales of forward contracts, the fund incurs a loss if the value of the contract increases between the date the forward contract is opened and the date the forward contract is closed. The fund realizes a gain if the value of the contract decreases between those dates.With respect to purchases of forward contracts, the fund incurs a loss if the value of the contract decreases between the date the forward contract is opened and the date the forward contract is closed.The fund realizes a gain if the value of the contract increases between those dates.Any realized or unrealized gains or losses which occurred during the period are reflected in the Statement of Operations. The fund is exposed to foreign currency risk as a result of changes in value of underlying financial instruments. The fund is also exposed to credit risk associated with counterparty nonper-formance on these forward contracts, which is generally limited to the unrealized gain on each open contract.This risk is mitigated by Master Agreements between the fund and the counterparty. The following summarizes open forward contracts at October 31, 2014:
| | | | |
| | Foreign | | | Unrealized |
| Forward Foreign Currency | Currency | | | Appreciation |
| Exchange Contracts | Amounts | Cost ($) | Value ($) | (Depreciation) ($) |
| Purchases: | | | | |
| Japanese Yen, | | | | |
| Expiring | | | | |
| 11/14/2014 a | 625,189,108 | 6,126,002 | 5,566,452 | (559,550) |
| Sales: | | Proceeds ($) | | |
| Brazilian Real, | | | | |
| Expiring | | | | |
| 12/15/2014 b | 6,419,000 | 2,790,870 | 2,556,378 | 234,492 |
| British Pound, | | | | |
| Expiring | | | | |
| 11/14/2014 a | 3,634,000 | 6,126,002 | 5,812,601 | 313,401 |
| Euro, | | | | |
| Expiring | | | | |
| 11/14/2014 a | 9,478,000 | 12,651,767 | 11,878,539 | 773,228 |
| Gross Unrealized | | | | |
| Appreciation | | | | 1,321,121 |
| Gross Unrealized | | | | |
| Depreciation | | | | (559,550) |
Counterparties:
| |
| a | JP Morgan Chase Bank |
| b | Citigroup |
The Fund 31
NOTES TO FINANCIAL STATEMENTS (continued)
The provisions of ASC Topic 210 “Disclosures about Offsetting Assets and Liabilities” require disclosure on the offsetting of financial assets and liabilities. These disclosures are required for certain investments, including derivative financial instruments subject to Master Agreements which are eligible for offsetting in the Statement of Assets and Liabilities and require the fund to disclose both gross and net information with respect to such investments. For financial reporting purposes, the fund does not offset derivative assets and derivative liabilities that are subject to Master Agreements in the Statement of Assets and Liabilities.
At October 31, 2014, derivative assets and liabilities (by type) on a gross basis are as follows:
| | | |
| Derivative Financial Instruments: | Assets ($) | Liabilities ($) | |
| Forward contracts | 1,321,121 | (559,550 | ) |
| Total gross amount of derivative assets | | | |
| and liabilities in the Statement of | | | |
| Assets and Liabilities | 1,321,121 | (559,550 | ) |
| Derivatives not subject to | | | |
| Master Agreements | — | — | |
| Total gross amount of assets and | | | |
| liabilities subject to Master Agreements | 1,321,121 | (559,550 | ) |
The following tables present derivative assets and liabilities net of amounts available for offsetting under Master Agreements and net of related collateral received or pledged, if any, as of October 31, 2014:
| | | | | |
| | | Financial | | | |
| | | Instruments | | | |
| | | and | | | |
| | | Derivatives | | | |
| | Gross Amount of | Available | | Collateral | Net Amount of |
| Counterparties | Assets ($)1 | for Offset ($) | | Received ($) | Assets ($) |
| Citigroup | 234,492 | — | | — | 234,492 |
| JP Morgan Chase Bank | 1,086,629 | (559,550 | ) | — | 527,079 |
| Total | 1,321,121 | (559,550 | ) | — | 761,571 |
32
| | | | | |
| | | | Financial | | |
| | | | Instruments | | |
| | | | and | | |
| | | | Derivatives | | |
| | Gross Amount of | | Available | Collateral | Net Amount of |
| Counterparty | Liabilities ($)1 | | for Offset ($) | Pledged ($) | Liabilities ($) |
| JP Morgan Chase Bank | (559,550 | ) | 559,550 | — | — |
| Total | (559,550 | ) | 559,550 | — | — |
| |
| 1 | Absent a default event or early termination, OTC derivative assets and liabilities are presented at |
| | gross amounts and are not offset in the Statement of Assets and Liabilities. |
The following summarizes the average market value of derivatives outstanding during the period ended October 31, 2014:
| |
| | Average Market Value ($) |
| Forward contracts | 21,701,866 |
At October 31, 2014, the cost of investments for federal income tax purposes was $262,016,159, accordingly, accumulated net unrealized appreciation on investments was $34,801,644, consisting of $47,910,505 gross unrealized appreciation and $13,108,861 gross unrealized depreciation.
The Fund 33
REPORT OF INDEPENDENT REGISTERED
PUBLIC ACCOUNTING FIRM
The Board of Trustees and Shareholders of
The Dreyfus/Laurel Funds Trust
We have audited the accompanying statement of assets and liabilities of Dreyfus Global Equity Income Fund (the “Fund”), a series of The Dreyfus/Laurel Funds Trust, including the statement of investments, as of October 31, 2014, and the related statement of operations for the year then ended, the statements of changes in net assets for each of the years in the two-year periods then ended, and the financial highlights for each of the years or periods in the five-year period then ended. These financial statements and financial highlights are the responsibility of the Fund’s management. Our responsibility is to express an opinion on these financial statements and financial highlights based on our audits.
We conducted our audits in accordance with the standards of the Public Company Accounting Oversight Board (United States).Those standards require that we plan and perform the audit to obtain reasonable assurance about whether the financial statements and financial highlights are free of material misstatement. An audit includes examining, on a test basis, evidence supporting the amounts and disclosures in the financial statements. Our procedures included confirmation of securities owned as of October 31, 2014, by correspondence with the custodian and brokers or by other appropriate auditing procedures. An audit also includes assessing the accounting principles used and significant estimates made by management, as well as evaluating the overall financial statement presentation.We believe that our audits provide a reasonable basis for our opinion.
In our opinion, the financial statements and financial highlights referred to above present fairly, in all material respects, the financial position of Dreyfus Global Equity Income Fund as of October 31, 2014, the results of its operations for the year then ended, the changes in its net assets for each of the years in the two-year period then ended, and the financial highlights for each of the years or periods in the five-year period then ended, in conformity with U.S. generally accepted accounting principles.

New York, New York
December 30, 2014
34
IMPORTANT TAX INFORMATION (Unaudited)
For federal tax purposes, the fund elects to provide each shareholder with their portion of the fund’s income sourced from foreign countries and taxes paid from foreign countries.The fund reports the maximum amount allowable but not less than $10,553,465 as income sourced from foreign countries for the fiscal year ended October 31, 2014 in accordance with Section 853(c)(2) of the Internal Revenue Code and also the fund reports the maximum amount allowable but not less than $694,146 as taxes paid from foreign countries for the fiscal year ended October 31, 2014 in accordance with Section 853(a) of the Internal Revenue Code. Where required by federal tax law rules, shareholders will receive notification of their proportionate share of foreign sourced income and foreign taxes paid for the 2014 calendar year with Form 1099-DIV which will be mailed in early 2015. Also, the fund designates the maximum amount allowable, but not less than $10,564,055 as ordinary income dividends paid during the fiscal year ended October 31, 2014 as qualified dividend income in accordance with Section 854(b)(1)(B) of the Internal Revenue Code.
The Fund 35
|
| BOARD MEMBERS INFORMATION (Unaudited) |
| INDEPENDENT BOARD MEMBERS |
|
| Joseph S. DiMartino (71) |
| Chairman of the Board (1999) |
| Principal Occupation During Past 5Years: |
| • Corporate Director and Trustee (1995-present) |
| Other Public Company Board Memberships During Past 5Years: |
| • CBIZ (formerly, Century Business Services, Inc.), a provider of outsourcing functions for small |
| and medium size companies, Director (1997-present) |
| • The Newark Group, a provider of a national market of paper recovery facilities, paperboard |
| mills and paperboard converting plants, Director (2000-2010) |
| • Sunair Services Corporation, a provider of certain outdoor-related services to homes and |
| businesses, Director (2005-2009) |
| No. of Portfolios for which Board Member Serves: 144 |
| ——————— |
| Francine J. Bovich (63) |
| Board Member (2012) |
| Principal Occupation During Past 5Years: |
| • Trustee,The Bradley Trusts, private trust funds (2011-present) |
| • Managing Director, Morgan Stanley Investment Management (1993-2010) |
| Other Public Company Board Membership During Past 5Years: |
| • Annaly Capital Management, Inc., Board Member (May 2014-present) |
| No. of Portfolios for which Board Member Serves: 45 |
| ——————— |
| Kenneth A. Himmel (68) |
| Board Member (1994) |
| Principal Occupation During Past 5Years: |
| • President and CEO, Related Urban Development, a real estate development company (1996-present) |
| • President and CEO, Himmel & Company, a real estate development company (1980-present) |
| • CEO,American Food Management, a restaurant company (1983-present) |
| No. of Portfolios for which Board Member Serves: 31 |
36
|
| Stephen J. Lockwood (67) |
| Board Member (1994) |
| Principal Occupation During Past 5Years: |
| • Chairman of the Board, Stephen J. Lockwood and Company LLC, a real estate investment |
| company (2000-present) |
| No. of Portfolios for which Board Member Serves: 31 |
| ——————— |
| Roslyn M. Watson (65) |
| Board Member (1994) |
| Principal Occupation During Past 5Years: |
| • Principal,Watson Ventures, Inc., a real estate investment company (1993-present) |
| No. of Portfolios for which Board Member Serves: 69 |
| ——————— |
| Benaree Pratt Wiley (68) |
| Board Member (1998) |
| Principal Occupation During Past 5Years: |
| • Principal,TheWiley Group, a firm specializing in strategy and business development (2005-present) |
| Other Public Company Board Membership During Past 5Years: |
| • CBIZ (formerly, Century Business Services, Inc.), a provider of outsourcing functions for small |
| and medium size companies, Director (2008-present) |
| No. of Portfolios for which Board Member Serves: 69 |
| ——————— |
| Once elected all Board Members serve for an indefinite term, but achieve Emeritus status upon reaching age 80.The |
| address of the Board Members and Officers is c/o The Dreyfus Corporation, 200 Park Avenue, NewYork, NewYork |
| 10166.Additional information about the Board Members is available in the fund’s Statement of Additional Information |
| which can be obtained from Dreyfus free of charge by calling this toll free number: 1-800-DREYFUS. |
| James M. Fitzgibbons, Emeritus Board Member |
| J.Tomlinson Fort, Emeritus Board Member |
The Fund 37
OFFICERS OF THE FUND (Unaudited)
BRADLEY J. SKAPYAK, President since January 2010.
Chief Operating Officer and a director of the Manager since June 2009, Chairman of Dreyfus Transfer, Inc., an affiliate of the Manager and the transfer agent of the funds, since May 2011 and Executive Vice President of the Distributor since June 2007. From April 2003 to June 2009, Mr. Skapyak was the head of the Investment Accounting and Support Department of the Manager. He is an officer of 69 investment companies (comprised of 144 portfolios) managed by the Manager. He is 55 years old and has been an employee of the Manager since February 1988.
JOHN PAK, Chief Legal Officer since March 2013.
Deputy General Counsel, Investment Management, of BNY Mellon since August 2014; Chief Legal Officer of the Manager since August 2012; from March 2005 to July 2012, Managing Director of Deutsche Bank, Deputy Global Head of Deutsche Asset Management Legal and Regional Head of Deutsche Asset Management Americas Legal. He is an officer of 70 investment companies (comprised of 169 portfolios) managed by the Manager. He is 46 years old and has been an employee of the Manager since August 2012.
JANETTE E. FARRAGHER, Vice President and Secretary since December 2011.
Assistant General Counsel of BNY Mellon, and an officer of 70 investment companies (comprised of 169 portfolios) managed by the Manager. She is 51 years old and has been an employee of the Manager since February 1984.
KIESHA ASTWOOD, Vice President and Assistant Secretary since January 2010.
Counsel of BNY Mellon, and an officer of 70 investment companies (comprised of 169 portfolios) managed by the Manager. She is 41 years old and has been an employee of the Manager since July 1995.
JAMES BITETTO, Vice President and Assistant Secretary since August 2005.
Managing Counsel of BNY Mellon and Secretary of the Manager, and an officer of 70 investment companies (comprised of 169 portfolios) managed by the Manager. He is 48 years old and has been an employee of the Manager since December 1996.
JONI LACKS CHARATAN, Vice President and Assistant Secretary since August 2005.
Managing Counsel of BNY Mellon, and an officer of 70 investment companies (comprised of 169 portfolios) managed by the Manager. She is 58 years old and has been an employee of the Manager since October 1988.
JOSEPH M. CHIOFFI, Vice President and Assistant Secretary since August 2005.
Managing Counsel of BNY Mellon, and an officer of 70 investment companies (comprised of 169 portfolios) managed by the Manager. He is 52 years old and has been an employee of the Manager since June 2000.
JOHN B. HAMMALIAN, Vice President and Assistant Secretary since August 2005.
Senior Managing Counsel of BNY Mellon, and an officer of 70 investment companies (comprised of 169 portfolios) managed by the Manager. He is 51 years old and has been an employee of the Manager since February 1991.
SARAH S. KELLEHER, Vice President and Assistant Secretary since April 2014.
Senior Counsel of BNY Mellon, and an officer of 70 investment companies (comprised of 169 portfolios) managed by the Manager; from August 2005 to March 2013, Associate General Counsel of Third Avenue Management. She is 38 years old and has been an employee of the Manager since March 2013.
38
JEFF PRUSNOFSKY, Vice President and Assistant Secretary since August 2005.
Senior Managing Counsel of BNY Mellon, and an officer of 70 investment companies (comprised of 169 portfolios) managed by the Manager. He is 49 years old and has been an employee of the Manager since October 1990.
JAMES WINDELS, Treasurer since November 2001.
Director – Mutual Fund Accounting of the Manager, and an officer of 70 investment companies (comprised of 169 portfolios) managed by the Manager. He is 56 years old and has been an employee of the Manager since April 1985.
RICHARD CASSARO, Assistant Treasurer since January 2008.
Senior Accounting Manager – Money Market and Municipal Bond Funds of the Manager, and an officer of 70 investment companies (comprised of 169 portfolios) managed by the Manager. He is 55 years old and has been an employee of the Manager since September 1982.
GAVIN C. REILLY, Assistant Treasurer since December 2005.
Tax Manager of the Investment Accounting and Support Department of the Manager, and an officer of 70 investment companies (comprised of 169 portfolios) managed by the Manager. He is 46 years old and has been an employee of the Manager since April 1991.
ROBERT S. ROBOL, Assistant Treasurer since August 2005.
Senior Accounting Manager – Fixed Income Funds of the Manager, and an officer of 70 investment companies (comprised of 169 portfolios) managed by the Manager. He is 50 years old and has been an employee of the Manager since October 1988.
ROBERT SALVIOLO, Assistant Treasurer since July 2007.
Senior Accounting Manager – Equity Funds of the Manager, and an officer of 70 investment companies (comprised of 169 portfolios) managed by the Manager. He is 47 years old and has been an employee of the Manager since June 1989.
ROBERT SVAGNA, Assistant Treasurer since December 2002.
Senior Accounting Manager – Equity Funds of the Manager, and an officer of 70 investment companies (comprised of 169 portfolios) managed by the Manager. He is 47 years old and has been an employee of the Manager since November 1990.
JOSEPH W. CONNOLLY, Chief Compliance Officer since October 2004.
Chief Compliance Officer of the Manager and The Dreyfus Family of Funds (70 investment companies, comprised of 169 portfolios). He is 57 years old and has served in various capacities with the Manager since 1980, including manager of the firm’s Fund Accounting Department from 1997 through October 2001.
MATTHEW D. CONNOLLY, Anti-Money Laundering Compliance Officer since April 2012.
Anti-Money Laundering Compliance Officer of the Distributor since October 2011; from March 2010 to September 2011, Global Head, KYC Reviews and Director of UBS Investment Bank; until March 2010, AML Compliance Officer and Senior Vice President of Citi Global Wealth Management. He is an officer of 65 investment companies (comprised of 164 portfolios) managed by the Manager. He is 42 years old and has been an employee of the Distributor since October 2011.
The Fund 39
For More Information
Telephone Call your financial representative or 1-800-DREYFUS
Mail The Dreyfus Family of Funds, 144 Glenn Curtiss Boulevard, Uniondale, NY 11556-0144
The fund files its complete schedule of portfolio holdings with the Securities and Exchange Commission (“SEC”) for the first and third quarters of each fiscal year on Form N-Q. The fund’s Forms N-Q are available on the SEC’s website at http://www.sec.gov and may be reviewed and copied at the SEC’s Public Reference Room in Washington, DC. Information on the operation of the Public Reference Room may be obtained by calling 1-800-SEC-0330.
Dreyfus
International
Bond Fund
ANNUAL REPORT October 31, 2014

Save time. Save paper. View your next shareholder report online as soon as it’s available. Log into www.dreyfus.com and sign up for Dreyfus eCommunications. It’s simple and only takes a few minutes.
The views expressed in this report reflect those of the portfolio manager only through the end of the period covered and do not necessarily represent the views of Dreyfus or any other person in the Dreyfus organization. Any such views are subject to change at any time based upon market or other conditions and Dreyfus disclaims any responsibility to update such views.These views may not be relied on as investment advice and, because investment decisions for a Dreyfus fund are based on numerous factors, may not be relied on as an indication of trading intent on behalf of any Dreyfus fund.
|
| Not FDIC-Insured • Not Bank-Guaranteed • May Lose Value |
| | Contents |
| | THE FUND |
| 2 | A Letter from the President |
| 3 | Discussion of Fund Performance |
| 6 | Fund Performance |
| 8 | Understanding Your Fund’s Expenses |
| 8 | Comparing Your Fund’s Expenses With Those of Other Funds |
| 9 | Statement of Investments |
| 23 | Statement of Financial Futures |
| 24 | Statement of Assets and Liabilities |
| 25 | Statement of Operations |
| 26 | Statement of Changes in Net Assets |
| 28 | Financial Highlights |
| 32 | Notes to Financial Statements |
| 57 | Report of Independent Registered Public Accounting Firm |
| 58 | Important Tax Information |
| 59 | Board Members Information |
| 61 | Officers of the Fund |
| | FOR MORE INFORMATION |
| | Back Cover |
Dreyfus
International Bond Fund
The Fund
A LETTER FROM THE PRESIDENT
Dear Shareholder:
We are pleased to present this annual report for Dreyfus International Bond Fund, covering the 12-month period from November 1, 2013, through October 31, 2014. For information about how the fund performed during the reporting period, as well as general market perspectives, we provide a Discussion of Fund Performance on the pages that follow.
Municipal bonds generally gained ground for the reporting period overall despite bouts of heightened volatility during the final months of 2013, when a more moderately accommodative monetary policy and accelerating economic growth caused long-term interest rates to rise. Long-term interest rates moderated early in 2014 due to geopolitical and economic concerns, driving prices of long-term securities higher, and favorable supply-and-demand dynamics helped keep yields low when economic growth resumed. Meanwhile, improving economic fundamentals enabled many states and municipalities to shore up their fiscal conditions.
While we remain cautiously optimistic regarding the municipal bond market’s prospects, we believe that selectivity is likely to become more important to investment success. Long-term rates could rise if, as we anticipate, the economy continues to accelerate and inflationary pressures rise. On the other hand, intensifying geopolitical turmoil and other factors could dampen the potentially adverse effects of a stronger domestic economic recovery, and rising investor demand for tax-advantaged investments may continue to support municipal bond prices.As always, we encourage you to discuss our observations with your financial adviser to assess their potential impact on your investments.
Thank you for your continued confidence and support.

J. Charles Cardona
President
The Dreyfus Corporation
November 17, 2014
2
DISCUSSION OF FUND PERFORMANCE
For the period of November 1, 2013, through October 31, 2014, as provided by David Leduc, CFA, and Brendan Murphy, CFA, Portfolio Managers
Fund and Market Performance Overview
For the 12-month period ended October 31, 2014, Dreyfus International Bond Fund’s Class A shares produced a total return of 2.77%, Class C shares returned 2.09%, Class I shares returned 3.08%, and ClassY shares returned 3.13%.1 In comparison, the fund’s benchmark, the Barclays Global Aggregate ex-U.S. (Unhedged) Bond Index (the “Index”), produced a total return of –2.53% for the same period.2
A strengthening U.S. dollar eroded returns from bonds denominated in foreign currencies over the reporting period. The fund outperformed its benchmark, mainly due to our currency hedging and security selection strategies.
The Fund’s Investment Approach
The fund seeks to maximize total return through capital appreciation and income.To pursue its goal, the fund normally invests at least 80% of its net assets in fixed-income securities, and at least 65% of its assets in non-U.S. dollar-denominated fixed-income securities of foreign governments and companies located in various countries, including emerging markets.
Generally, the fund seeks to maintain investment-grade average credit quality. We focus on identifying undervalued government bond markets, currencies, sectors, and securities. We look for fixed-income securities with the most potential for added value, such as those involving the potential for credit upgrades, unique structural characteristics, or innovative features. We use fundamental economic research and quantitative analysis to allocate assets among countries and currencies.We then focus on sectors and individual securities that appear to be relatively undervalued.
Currency Movements Dampened Market Averages
By the end of 2013, evidence of accelerating domestic and global economic recoveries and the Federal Reserve Board’s decision to gradually reduce its quantitative easing program drove yields of 10-year U.S.Treasury securities above 3% for the first time in two years. However, renewed global economic and geopolitical concerns soon caused
The Fund 3
DISCUSSION OF FUND PERFORMANCE (continued)
bond yields to moderate in the United States and other developed markets. In Europe, concerns regarding potential deflationary pressures in a struggling regional economy prompted monetary policymakers to reduce short-term interest rates and implement other stimulative measures, which drove sovereign bond yields lower. Meanwhile, waning banking crises in some of Europe’s peripheral countries sparked rallies among their sovereign bonds. Japan’s bond market encountered heightened volatility as the stimulative effects of an aggressively accommodative monetary policy battled for dominance with the dampening impact of higher taxes.
These developments caused the U.S. dollar to strengthen against the euro, the yen, and most other major currencies. As a result, the value of unhedged, foreign currency-denominated investments lost value for U.S. residents, and the fund’s benchmark posted a mild loss for the reporting period overall.
Currency and Security Selection Strategies Buoyed Fund Results
We are pleased that the fund produced positive absolute returns in an otherwise challenging reporting period. The fund’s results compared to its benchmark were bolstered by our currency hedging strategy, which included overweighted exposure to the strengthening U.S. dollar and relatively light positions in the euro, Japanese yen, Australian dollar, and New Zealand dollar. Our security selection strategy also fared relatively well.We maintained overweighted positions in the rallying sovereign bonds of peripheral European countries, such as Portugal and Italy. The fund also benefited from an allocation to investment-grade and high yield corporate-backed bonds, where bonds from financial institutions helped boost relative performance.
On the other hand, a small allocation to Treasury Inflation Protected Securities (“TIPS”) in the United States weighed on relative results when inflation remained subdued despite accelerating U.S. economic growth. In addition, a relatively short average duration prevented the fund from participating more fully in the benefits of falling sovereign bond yields, but its impact was partly mitigated by a yield-curve focus designed to benefit from narrowing yield differences along the market’s maturity range.
At times during the reporting period, we employed currency forward contracts, swaps, and options to hedge currency exposures; interest-rate futures and swaps to establish the fund’s duration positioning; and index-oriented derivatives to manage the fund’s high yield exposure.
4
Strategies for an Improving Economic Environment
Although the U.S. economy has gained momentum, overseas economies have continued to struggle, and central banks have indicated that they are prepared to reduce short-term interest rates further. However, we believe that bonds in some developed markets have reached richer valuations than currently are warranted by economic fundamentals. In our judgment, these securities could be vulnerable to price declines if economic activity improves, inflation accelerates, or interest rates rise in their markets.
Therefore, we believe that investors will continue to favor higher yielding market sectors. We have maintained ample exposure to corporate securities and sovereign bonds from the emerging markets. We also have maintained positions in sovereign bonds from Australia, New Zealand, and some European countries, which appear to be less vulnerable to declines than bonds in Japan and the United States. In our judgment, these are prudent strategies for today’s changing market environment.
November 17, 2014
Bond funds are subject generally to interest rate, credit, liquidity, and market risks, to varying degrees, all of which are more fully described in the fund’s prospectus. Generally, all other factors being equal, bond prices are inversely related to interest-rate changes, and rate increases can cause price declines.
High yield bonds are subject to increased credit risk and are considered speculative in terms of the issuer’s perceived ability to continue making interest payments on a timely basis and to repay principal upon maturity.
Foreign bonds are subject to special risks including exposure to currency fluctuations, changing political and economic conditions, and potentially less liquidity.These risks are generally greater with emerging market countries than with more economically and politically established foreign countries.
The use of derivatives involves risks different from, or possibly greater than, the risks associated with investing directly in the underlying assets. Derivatives can be highly volatile, illiquid, and difficult to value, and there is the risk that changes in the value of a derivate held by the fund will not correlate with the underlying instruments or the fund’s other instruments.
Investments in foreign currencies are subject to the risk that those currencies will decline in value relative to the U.S. dollar, or, in the case of hedged positions, that the U.S. dollar will decline relative to the currency being hedged. Currency rates in foreign countries may fluctuate significantly over short periods of time. A decline in the value of foreign currencies relative to the U.S. dollar will reduce the value of securities held by the fund and denominated in those currencies.The use of leverage may magnify the fund’s gains or losses. For derivatives with a leveraging component, adverse changes in the value or level of the underlying asset can result in a loss that is much greater than the original investment in the derivative.
|
| 1 Total return includes reinvestment of dividends and any capital gains paid and does not take into consideration the |
| maximum initial sales charge in the case of Class A shares or the applicable contingent deferred sales charge imposed |
| on redemptions in the case of Class C shares. Had these charges been reflected, returns would have been lower. Class |
| I and ClassY shares are not subject to any initial or deferred sales charge. Past performance is no guarantee of future |
| results. Share price and investment return fluctuate such that upon redemption, fund shares may be worth more or less |
| than their original cost. |
| 2 SOURCE: LIPPER — Reflects reinvestment of dividends and, where applicable, capital gain distributions.The |
| Barclays Global Aggregate ex-U.S. (Unhedged) Bond Index provides a broad-based measure of the global |
| investment-grade fixed income markets. Investors cannot invest directly in any index. |
The Fund 5
FUND PERFORMANCE
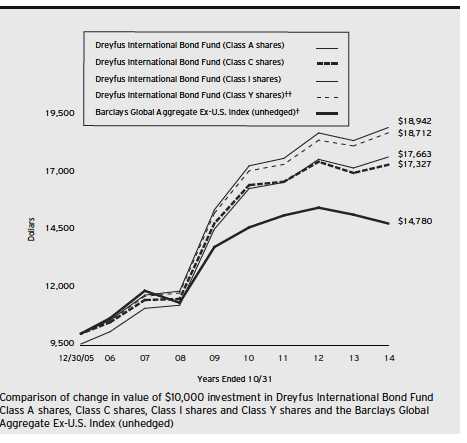
| |
| † | Source: Lipper Inc. |
| †† | The total return figures presented for ClassY shares of the fund reflect the performance of the fund’s Class A shares |
| | for the period prior to 7/1/13 (the inception date for ClassY shares), not reflecting the applicable sales charges for |
| | Class A shares. |
Past performance is not predictive of future performance.
The above graph compares a $10,000 investment made in each of the Class A, Class C, Class I and ClassY shares of Dreyfus International Bond Fund on 12/30/05 (inception date) to a $10,000 investment made in the Barclays Global Aggregate Ex-U.S. Index (unhedged) (the “Index”) on that date. All dividends and capital gain distributions are reinvested. The fund invests 80% of its assets primarily in fixed-income securities.The fund’s performance shown in the line graph above takes into account the maximum initial sales charge on Class A shares and all other applicable fees and expenses on all classes.The Index is designed to measure the performance of global investment-grade, fixed-rate debt markets, excluding the United States, hedged into U.S. dollars. Unlike a mutual fund, the Index is not subject to charges, fees and other expenses. Investors cannot invest directly in any index. Further information relating to fund performance, including expense reimbursements, if applicable, is contained in the Financial Highlights section of the prospectus and elsewhere in this report.
6
| | | | | | | |
| Average Annual Total Returns as of 10/31/14 | | | | | | |
| |
| | Inception | | | | | From | |
| | Date | 1 Year | | 5 Years | | Inception | |
| Class A shares | | | | | | | |
| with maximum sales charge (4.5%) | 12/30/05 | –1.87 | % | 3.02 | % | 6.65 | % |
| without sales charge | 12/30/05 | 2.77 | % | 3.98 | % | 7.21 | % |
| Class C shares | | | | | | | |
| with applicable redemption charge † | 12/30/05 | 1.09 | % | 3.23 | % | 6.42 | % |
| without redemption | 12/30/05 | 2.09 | % | 3.23 | % | 6.42 | % |
| Class I shares | 12/30/05 | 3.08 | % | 4.27 | % | 7.49 | % |
| Class Y shares | 7/1/13 | 3.13 | % | 4.22 | %†† | 7.35 | %†† |
| Barclays Global Aggregate | | | | | | | |
| Ex-U.S. Index (unhedged) | 12/31/05 | –2.53 | % | 1.45 | % | 4.52 | %††† |
Past performance is not predictive of future performance.The fund’s performance shown in the graph and table does not reflect the deduction of taxes that a shareholder would pay on the fund distributions or the redemption of fund shares. In addition to the performance of Class A shares shown with and without a maximum sales charge, the fund’s performance shown in the table takes into account all other applicable fees and expenses on all classes.
| |
| † | The maximum contingent deferred sales charge for Class C shares is 1% for shares redeemed within one year of |
| | the date of purchase. |
| †† | The total return performance figures presented for ClassY shares of the fund reflect the performance of the fund’s |
| | Class A shares for the period prior to 7/1/13 (the inception date for ClassY shares), not reflecting the applicable |
| | sales charges for Class A shares. |
| ††† | For comparative purposes, the value of the Index as of 12/31/05 is used as the beginning value on 12/30/05. |
The Fund 7
UNDERSTANDING YOUR FUND’S EXPENSES (Unaudited)
As a mutual fund investor, you pay ongoing expenses, such as management fees and other expenses. Using the information below, you can estimate how these expenses affect your investment and compare them with the expenses of other funds.You also may pay one-time transaction expenses, including sales charges (loads) and redemption fees, which are not shown in this section and would have resulted in higher total expenses. For more information, see your fund’s prospectus or talk to your financial adviser.
Review your fund’s expenses
The table below shows the expenses you would have paid on a $1,000 investment in Dreyfus International Bond Fund from May 1, 2014 to October 31, 2014. It also shows how much a $1,000 investment would be worth at the close of the period, assuming actual returns and expenses.
Expenses and Value of a $1,000 Investment
assuming actual returns for the six months ended October 31, 2014
| | | | | | | | |
| | | Class A | | Class C | | Class I | | Class Y |
| Expenses paid per $1,000† | $ | 5.48 | $ | 8.79 | $ | 3.77 | $ | 3.37 |
| Ending value (after expenses) | $ | 995.50 | $ | 992.50 | $ | 996.80 | $ | 997.50 |
COMPARING YOUR FUND’S EXPENSES
WITH THOSE OF OTHER FUNDS (Unaudited)
Using the SEC’s method to compare expenses
The Securities and Exchange Commission (SEC) has established guidelines to help investors assess fund expenses. Per these guidelines, the table below shows your fund’s expenses based on a $1,000 investment, assuming a hypothetical 5% annualized return. You can use this information to compare the ongoing expenses (but not transaction expenses or total cost) of investing in the fund with those of other funds. All mutual fund shareholder reports will provide this information to help you make this comparison. Please note that you cannot use this information to estimate your actual ending account balance and expenses paid during the period.
Expenses and Value of a $1,000 Investment
assuming a hypothetical 5% annualized return for the six months ended October 31, 2014
| | | | | | | | |
| | | Class A | | Class C | | Class I | | Class Y |
| Expenses paid per $1,000† | $ | 5.55 | $ | 8.89 | $ | 3.82 | $ | 3.41 |
| Ending value (after expenses) | $ | 1,019.71 | $ | 1,016.38 | $ | 1,021.42 | $ | 1,021.83 |
|
| † Expenses are equal to the fund’s annualized expense ratio of 1.09% for Class A, 1.75% for Class C, .75% for |
| Class I and .67% for ClassY, multiplied by the average account value over the period, multiplied by 184/365 (to |
| reflect the one-half year period). |
8
|
| STATEMENT OF INVESTMENTS |
| October 31, 2014 |
| | | | | | |
| | | Coupon | Maturity | Principal | | |
| Bonds and Notes—97.8% | | Rate (%) | Date | Amount ($)a | Value ($) |
| Australia—3.6% | | | | | | |
| Australian Government, | | | | | | |
| Sr. Unscd. Bonds, Ser. 137 | AUD | 2.75 | 4/21/24 | 49,200,000 | | 41,429,079 |
| Australian Government, | | | | | | |
| Sr. Unscd. Bonds, Ser. 133 | AUD | 5.50 | 4/21/23 | 19,525,000 | | 20,104,860 |
| | | | | | | 61,533,939 |
| Brazil—.6% | | | | | | |
| Banco Nacional de | | | | | | |
| Desenvolvimento | | | | | | |
| Economico e Social, | | | | | | |
| Sr. Unscd. Notes | | 3.38 | 9/26/16 | 7,275,000 | b | 7,447,781 |
| Odebrecht Finance, | | | | | | |
| Gtd. Notes | BRL | 8.25 | 4/25/18 | 6,525,000 | b | 2,363,367 |
| | | | | | | 9,811,148 |
| Canada—1.5% | | | | | | |
| Canadian Capital Auto | | | | | | |
| Receivables Asset Trust, | | | | | | |
| Ser. 2012-1A, Cl. A3 | CAD | 2.38 | 4/17/17 | 8,535,507 | b | 7,621,862 |
| CIT Canada Equipment | | | | | | |
| Receivables Trust, | | | | | | |
| Ser. 2012-1A, Cl. A2 | CAD | 2.11 | 12/20/16 | 2,395,042 | b | 2,133,171 |
| CNH Capital Canada | | | | | | |
| Receivables Trust, | | | | | | |
| Ser. 2014-1A, Cl. A2 | CAD | 1.80 | 10/15/20 | 13,575,000 | b | 12,081,334 |
| CNH Capital Canada | | | | | | |
| Receivables Trust, | | | | | | |
| Ser. 2011-1A, Cl. A2 | CAD | 2.34 | 7/17/17 | 3,175,153 | b | 2,830,466 |
| Ford Auto Securitization Trust, | | | | | | |
| Ser. 2012-R1, Cl. A2 | CAD | 2.02 | 3/15/16 | 1,250,660 | | 1,110,853 |
| Ford Auto Securitization Trust, | | | | | | |
| Ser. 2010-R3A, Cl. A3 | CAD | 2.71 | 9/15/15 | 188,961 | b | 167,851 |
| | | | | | | 25,945,537 |
| China—.2% | | | | | | |
| Azure Orbit II | | | | | | |
| International Finance, | | | | | | |
| Gtd. Notes | | 3.38 | 4/25/19 | 3,175,000 | | 3,202,448 |
| Colombia—.2% | | | | | | |
| Ecopetrol, | | | | | | |
| Sr. Unscd. Notes | | 5.88 | 5/28/45 | 2,575,000 | | 2,658,688 |
The Fund 9
STATEMENT OF INVESTMENTS (continued)
| | | | | | |
| | | Coupon | Maturity | Principal | | |
| Bonds and Notes (continued) | Rate (%) | Date | Amount ($)a | Value ($) |
| France—4.4% | | | | | | |
| AXA, | | | | | | |
| Jr. Sub. Notes | EUR | 5.78 | 7/29/49 | 7,715,000 | c | 10,248,123 |
| Electricite de France, | | | | | | |
| Sub. Notes | EUR | 5.38 | 1/29/49 | 3,100,000 | c | 4,406,321 |
| French Government, | | | | | | |
| Bonds | EUR | 2.25 | 5/25/24 | 18,250,000 | | 25,275,743 |
| French Government, | | | | | | |
| Bonds | EUR | 3.75 | 10/25/19 | 13,125,000 | | 19,289,353 |
| French Government, | | | | | | |
| Bonds | EUR | 4.50 | 4/25/41 | 3,000,000 | | 5,518,637 |
| GDF Suez, | | | | | | |
| Sub. Notes, Ser. NC5 | EUR | 3.00 | 6/29/49 | 4,000,000 | c | 5,120,646 |
| Veolia Environnement, | | | | | | |
| Jr. Sub. Notes | EUR | 4.45 | 1/29/49 | 3,100,000 | c | 4,019,911 |
| | | | | | | 73,878,734 |
| Germany—4.8% | | | | | | |
| Allianz, | | | | | | |
| Sub. Notes | EUR | 5.63 | 10/17/42 | 7,700,000 | c | 11,516,411 |
| Deutsche Annington Finance, | | | | | | |
| Gtd. Notes | | 3.20 | 10/2/17 | 3,460,000 | b | 3,562,004 |
| Deutsche Annington Finance, | | | | | | |
| Gtd. Notes | EUR | 3.63 | 10/8/21 | 1,575,000 | | 2,250,421 |
| German Government, | | | | | | |
| Bonds | EUR | 1.75 | 4/15/20 | 38,500,000 | d | 59,652,445 |
| KFW, | | | | | | |
| Gov’t Gtd. Notes | JPY | 2.05 | 2/16/26 | 3,000,000 | | 31,426 |
| Unitymedia Hessen, | | | | | | |
| Sr. Scd. Notes | EUR | 7.50 | 3/15/19 | 2,920,000 | b | 3,869,744 |
| | | | | | | 80,882,451 |
| Hungary—.1% | | | | | | |
| Hungarian Development Bank, | | | | | | |
| Gov’t Gtd. Notes | | 6.25 | 10/21/20 | 2,100,000 | b | 2,325,750 |
| Iceland—1.6% | | | | | | |
| Icelandic Government, | | | | | | |
| Unscd. Notes | | 4.88 | 6/16/16 | 1,450,000 | b | 1,524,278 |
| Icelandic Government, | | | | | | |
| Unscd. Notes | | 4.88 | 6/16/16 | 24,575,000 | e | 25,833,953 |
| | | | | | | 27,358,231 |
10
| | | | | | |
| | | Coupon | Maturity | Principal | | |
| Bonds and Notes (continued) | Rate (%) | Date | Amount ($)a | Value ($) |
| India—.6% | | | | | | |
| ONGC Videsh, | | | | | | |
| Gtd. Notes | EUR | 2.75 | 7/15/21 | 2,000,000 | e | 2,534,568 |
| State Bank India/London, | | | | | | |
| Sr. Unscd. Notes | | 3.62 | 4/17/19 | 8,025,000 | b | 8,201,582 |
| | | | | | | 10,736,150 |
| Ireland—2.9% | | | | | | |
| Bank of Ireland, | | | | | | |
| Gov’t Gtd. Notes | EUR | 4.00 | 1/28/15 | 16,125,000 | | 20,396,360 |
| Irish Government, | | | | | | |
| Unscd. Bonds | EUR | 3.40 | 3/18/24 | 19,680,000 | | 28,239,181 |
| | | | | | | 48,635,541 |
| Italy—11.6% | | | | | | |
| Enel, | | | | | | |
| Sub. Bonds | | 8.75 | 9/24/73 | 3,800,000 | b,c | 4,455,500 |
| Enel, | | | | | | |
| Sr. Unscd. Bonds | EUR | 4.88 | 2/20/18 | 6,700,000 | | 9,523,590 |
| Intesa Sanpaolo, | | | | | | |
| Sr. Unscd. Notes | | 3.88 | 1/16/18 | 7,850,000 | | 8,205,676 |
| Intesa Sanpaolo, | | | | | | |
| Sr. Unscd. Notes | EUR | 3.00 | 1/28/19 | 3,800,000 | | 5,155,036 |
| Italian Government, | | | | | | |
| Treasury Bonds | EUR | 1.50 | 8/1/19 | 26,900,000 | | 34,201,183 |
| Italian Government, | | | | | | |
| Treasury Bonds | EUR | 2.75 | 11/15/16 | 17,375,000 | | 22,677,054 |
| Italian Government, | | | | | | |
| Treasury Bonds | EUR | 3.50 | 6/1/18 | 26,150,000 | | 35,687,332 |
| Italian Government, | | | | | | |
| Treasury Bonds | EUR | 4.50 | 5/1/23 | 8,920,000 | | 13,230,717 |
| Italian Government, | | | | | | |
| Treasury Bonds | EUR | 4.75 | 9/1/21 | 30,075,000 | | 44,978,706 |
| Telecom Italia, | | | | | | |
| Sr. Unscd. Notes | GBP | 6.38 | 6/24/19 | 5,300,000 | | 9,190,708 |
| Wind Acquisition Finance, | | | | | | |
| Gtd. Notes | | 7.38 | 4/23/21 | 1,500,000 | b | 1,470,000 |
| Wind Acquisition Finance, | | | | | | |
| Sr. Scd. Notes | | 6.50 | 4/30/20 | 4,375,000 | b | 4,566,406 |
| Wind Acquisition Finance, | | | | | | |
| Sr. Scd. Notes | EUR | 4.00 | 7/15/20 | 1,200,000 | b | 1,486,861 |
The Fund 11
STATEMENT OF INVESTMENTS (continued)
| | | | | | |
| | | Coupon | Maturity | Principal | | |
| Bonds and Notes (continued) | Rate (%) | Date | Amount ($)a | Value ($) |
| Italy (continued) | | | | | | |
| Wind Acquisition Finance, | | | | | | |
| Scd. Notes | EUR | 7.00 | 4/23/21 | 775,000 | b | 964,392 |
| | | | | | | 195,793,161 |
| Japan—5.2% | | | | | | |
| Development Bank of Japan, | | | | | | |
| Gov’t Gtd. Notes | JPY | 1.05 | 6/20/23 | 34,000,000 | | 318,756 |
| Development Bank of Japan, | | | | | | |
| Gov’t Gtd. Bonds | JPY | 1.70 | 9/20/22 | 24,000,000 | | 236,368 |
| Japanese Government, | | | | | | |
| Sr. Unscd. Bonds, Ser. 148 | JPY | 1.50 | 3/20/34 | 9,300,400,000 | | 86,447,808 |
| | | | | | | 87,002,932 |
| Kazakhstan—1.1% | | | | | | |
| KazAgro National | | | | | | |
| Management Holding, | | | | | | |
| Sr. Unscd. Notes | EUR | 3.26 | 5/22/19 | 5,750,000 | | 7,217,637 |
| Kazakhstan Government, | | | | | | |
| Sr. Unscd. Bonds | | 3.88 | 10/14/24 | 8,650,000 | b | 8,514,844 |
| Kazakhstan Government, | | | | | | |
| Sr. Unscd. Notes | | 4.88 | 10/14/44 | 2,800,000 | b | 2,709,000 |
| | | | | | | 18,441,481 |
| Kenya—.2% | | | | | | |
| Kenyan Government, | | | | | | |
| Notes | | 5.88 | 6/24/19 | 2,675,000 | b | 2,778,656 |
| Lithuania—.9% | | | | | | |
| Lithuanian Government, | | | | | | |
| Sr. Unscd. Notes | EUR | 2.13 | 10/29/26 | 7,337,000 | | 9,102,407 |
| Lithuanian Government, | | | | | | |
| Sr. Unscd. Notes | EUR | 3.38 | 1/22/24 | 3,700,000 | e | 5,251,414 |
| | | | | | | 14,353,821 |
| Luxembourg—.3% | | | | | | |
| Intelsat Jackson Holdings, | | | | | | |
| Gtd. Bonds | | 5.50 | 8/1/23 | 5,275,000 | | 5,307,969 |
| Mexico—4.7% | | | | | | |
| Alfa, | | | | | | |
| Sr. Unscd. Notes | | 6.88 | 3/25/44 | 2,350,000 | b,e | 2,649,625 |
| Grupo Bimbo, | | | | | | |
| Gtd. Notes | | 3.88 | 6/27/24 | 3,475,000 | b | 3,467,355 |
| Grupo Bimbo, | | | | | | |
| Gtd. Notes | | 4.88 | 6/27/44 | 1,775,000 | b | 1,754,092 |
12
| | | | | | |
| | | Coupon | Maturity | Principal | | |
| Bonds and Notes (continued) | Rate (%) | Date | Amount ($)a | Value ($) |
| Mexico (continued) | | | | | | |
| Mexican Government, | | | | | | |
| Bonds, Ser. M | MXN | 8.00 | 12/7/23 | 56,325,000 | | 4,808,040 |
| Mexican Government, | | | | | | |
| Bonds, Ser. M 20 | MXN | 10.00 | 12/5/24 | 622,700,000 | | 60,563,688 |
| Petroleos Mexicanos, | | | | | | |
| Gtd. Notes | | 4.25 | 1/15/25 | 4,425,000 | b | 4,490,490 |
| Petroleos Mexicanos, | | | | | | |
| Gtd. Notes | EUR | 3.75 | 4/16/26 | 850,000 | | 1,173,025 |
| | | | | | | 78,906,315 |
| Morocco—1.2% | | | | | | |
| Moroccan Government, | | | | | | |
| Sr. Unscd. Bonds | EUR | 3.50 | 6/19/24 | 13,005,000 | | 16,712,775 |
| Moroccan Government, | | | | | | |
| Sr. Unscd. Notes | EUR | 4.50 | 10/5/20 | 1,958,000 | | 2,711,300 |
| | | | | | | 19,424,075 |
| Netherlands—3.4% | | | | | | |
| ELM, | | | | | | |
| Jr. Sub. Notes | EUR | 5.25 | 5/29/49 | 8,100,000 | c | 10,659,845 |
| Netherlands Government, | | | | | | |
| Bonds | EUR | 1.25 | 1/15/19 | 25,650,000 | b | 33,675,947 |
| Rabobank Nederland, | | | | | | |
| Sub. Notes | EUR | 2.50 | 5/26/26 | 6,625,000 | c | 8,386,807 |
| UPCB Finance VI, | | | | | | |
| Sr. Scd. Notes | | 6.88 | 1/15/22 | 3,675,000 | b | 4,033,313 |
| | | | | | | 56,755,912 |
| New Zealand—3.4% | | | | | | |
| New Zealand Government, | | | | | | |
| Sr. Unscd. Bonds, Ser. 319 | NZD | 5.00 | 3/15/19 | 11,925,000 | | 9,754,030 |
| New Zealand Government, | | | | | | |
| Sr. Unscd. Bonds, Ser. 420 | NZD | 3.00 | 4/15/20 | 45,250,000 | | 33,809,020 |
| New Zealand Government, | | | | | | |
| Sr. Unscd. Bonds, Ser. 1217 | NZD | 6.00 | 12/15/17 | 17,350,000 | | 14,437,217 |
| | | | | | | 58,000,267 |
| Norway—.2% | | | | | | |
| Norwegian Government, | | | | | | |
| Bonds, Ser. 474 | NOK | 3.75 | 5/25/21 | 18,275,000 | | 3,057,310 |
| Poland—2.3% | | | | | | |
| Polish Government, | | | | | | |
| Bonds, Ser. 1019 | PLN | 5.50 | 10/25/19 | 112,200,000 | | 38,781,146 |
TheFund 13
STATEMENT OF INVESTMENTS (continued)
| | | | | | |
| | | Coupon | Maturity | Principal | | |
| Bonds and Notes (continued) | Rate (%) | Date | Amount ($)a | Value ($) |
| Portugal—1.7% | | | | | | |
| Portuguese Government, | | | | | | |
| Sr. Unscd. Bonds | EUR | 5.65 | 2/15/24 | 19,630,000 | b | 29,371,079 |
| Romania—1.1% | | | | | | |
| Romanian Government, | | | | | | |
| Unscd. Notes | EUR | 2.88 | 10/28/24 | 15,350,000 | | 19,303,155 |
| Singapore—.6% | | | | | | |
| ABJA Investment, | | | | | | |
| Gtd. Bonds | | 5.95 | 7/31/24 | 9,300,000 | | 9,466,237 |
| Spain—4.9% | | | | | | |
| BBVA Sub Capital, | | | | | | |
| Gtd. Notes | EUR | 3.50 | 4/11/24 | 2,500,000 | c | 3,244,496 |
| Gestamp Funding, | | | | | | |
| Sr. Scd. Notes | | 5.63 | 5/31/20 | 2,700,000 | b | 2,713,500 |
| Iberdrola International, | | | | | | |
| Gtd. Notes | EUR | 4.50 | 9/21/17 | 1,200,000 | | 1,672,690 |
| Iberdrola International, | | | | | | |
| Gtd. Notes | EUR | 5.75 | 2/27/49 | 4,500,000 | c | 6,146,694 |
| Repsol International Finance, | | | | | | |
| Gtd. Notes | EUR | 2.63 | 5/28/20 | 5,300,000 | | 7,154,087 |
| Spanish Government, | | | | | | |
| Sr. Unscd. Bonds | EUR | 4.30 | 10/31/19 | 21,500,000 | | 31,271,576 |
| Spanish Government, | | | | | | |
| Sr. Unscd. Bonds | EUR | 4.40 | 10/31/23 | 11,450,000 | b | 17,313,320 |
| Spanish Government, | | | | | | |
| Bonds | EUR | 5.40 | 1/31/23 | 6,200,000 | b | 9,941,102 |
| Telefonica Emisiones, | | | | | | |
| Gtd. Notes | EUR | 3.96 | 3/26/21 | 2,600,000 | | 3,786,745 |
| | | | | | | 83,244,210 |
| Supranational—1.3% | | | | | | |
| Asian Development Bank, | | | | | | |
| Sr. Unscd. Notes | CNY | 2.85 | 10/21/20 | 29,000,000 | | 4,632,458 |
| Eurasian Development Bank, | | | | | | |
| Sr. Unscd. Notes | | 5.00 | 9/26/20 | 3,650,000 | b | 3,699,421 |
| European Investment Bank, | | | | | | |
| Sr. Unscd. Bonds | JPY | 1.40 | 6/20/17 | 38,600,000 | | 357,201 |
| International Bank for | | | | | | |
| Reconstruction & | | | | | | |
| Development, | | | | | | |
| Sr. Unscd. Notes | AUD | 3.50 | 1/24/18 | 14,300,000 | | 12,771,958 |
| | | | | | | 21,461,038 |
14
| | | | | | |
| | | Coupon | Maturity | Principal | | |
| Bonds and Notes (continued) | Rate (%) | Date | Amount ($)a | Value ($) |
| Sweden—1.1% | | | | | | |
| Swedish Government, | | | | | | |
| Bonds, Ser. 1047 | SEK | 5.00 | 12/1/20 | 108,750,000 | | 18,589,289 |
| United Arab Emirates—.5% | | | | | | |
| Emirates Telecommunications, | | | | | | |
| Sr. Unscd. Notes | EUR | 1.75 | 6/18/21 | 6,125,000 | | 7,835,278 |
| United Kingdom—8.2% | | | | | | |
| Bank of Scotland, | | | | | | |
| Sub. Bonds | GBP | 9.38 | 5/15/21 | 3,820,000 | | 7,916,869 |
| Barclays, | | | | | | |
| Sub. Notes | | 4.38 | 9/11/24 | 8,600,000 | | 8,355,932 |
| E-Carat, | | | | | | |
| Ser. 2012-1, Cl. A | GBP | 1.30 | 6/18/20 | 853,721 | | 1,370,080 |
| Ensco, | | | | | | |
| Sr. Unscd. Notes | | 4.50 | 10/1/24 | 2,125,000 | | 2,156,344 |
| Ensco, | | | | | | |
| Sr. Unscd. Notes | | 5.75 | 10/1/44 | 3,700,000 | e | 3,859,581 |
| Gracechurch Card Funding, | | | | | | |
| Ser. 2012-1A, Cl. A2 | EUR | 0.81 | 2/15/17 | 4,785,000 | b,c | 6,008,104 |
| HSBC Holdings, | | | | | | |
| Sub. Notes | EUR | 3.38 | 1/10/24 | 6,175,000 | c | 8,276,221 |
| Lloyds Bank, | | | | | | |
| Sr. Unscd. Notes | GBP | 2.75 | 12/9/18 | 5,325,000 | | 8,755,175 |
| Lloyds Bank, | | | | | | |
| Sub. Notes | EUR | 6.50 | 3/24/20 | 3,250,000 | | 4,999,878 |
| Royal Bank of | | | | | | |
| Scotland Group, | | | | | | |
| Sub. Notes | | 6.00 | 12/19/23 | 7,850,000 | | 8,463,658 |
| United Kingdom Gilt, | | | | | | |
| Bonds | GBP | 4.25 | 12/7/40 | 34,290,000 | | 68,020,769 |
| Virgin Media | | | | | | |
| Secured Finance, | | | | | | |
| Sr. Scd. Notes | GBP | 6.00 | 4/15/21 | 6,425,000 | b | 10,792,956 |
| | | | | | | 138,975,567 |
| United States—23.4% | | | | | | |
| Ally Financial, | | | | | | |
| Gtd. Notes | | 3.50 | 1/27/19 | 7,340,000 | e | 7,413,400 |
| BAE Systems Holdings, | | | | | | |
| Gtd. Bonds | | 3.80 | 10/7/24 | 3,925,000 | b | 3,958,912 |
| Bank of America, | | | | | | |
| Sub. Notes | | 4.25 | 10/22/26 | 7,685,000 | | 7,645,737 |
The Fund 15
STATEMENT OF INVESTMENTS (continued)
| | | | | |
| | Coupon | Maturity | Principal | | |
| Bonds and Notes (continued) | Rate (%) | Date | Amount ($)a | Value ($) |
| United States (continued) | | | | | |
| Barclays Commercial | | | | | |
| Mortgage Securities Trust, | | | | | |
| Ser. 2013-TYSN, Cl. A2 | 3.76 | 9/5/32 | 5,090,000 | b | 5,378,221 |
| Bear Stearns Alt-A Trust, | | | | | |
| Ser. 2004-2, Cl. 2A1 | 2.62 | 3/25/34 | 2,222,961 | c | 2,234,005 |
| Bear Stearns Commercial | | | | | |
| Mortgage Securities Trust, | | | | | |
| Ser. 2005-PW10, Cl. AJ | 5.59 | 12/11/40 | 2,150,000 | c | 2,123,128 |
| Bear Stearns Commercial | | | | | |
| Mortgage Securities Trust, | | | | | |
| Ser. 2007-PW17, Cl. AJ | 5.89 | 6/11/50 | 5,125,000 | c | 5,207,295 |
| Bear Stearns Commercial | | | | | |
| Mortgage Securities Trust, | | | | | |
| Ser. 2007-PW18, Cl. AJ | 6.35 | 6/11/50 | 3,300,000 | c | 3,217,614 |
| California Resources, | | | | | |
| Gtd. Notes | 6.00 | 11/15/24 | 2,250,000 | b | 2,300,625 |
| Calpine, | | | | | |
| Sr. Unscd. Notes | 5.38 | 1/15/23 | 6,840,000 | | 6,916,950 |
| Capital Auto Receivables Asset Trust, | | | | | |
| Ser. 2013-1, Cl. D | 2.19 | 9/20/21 | 1,950,000 | | 1,953,530 |
| Capital Auto Receivables Asset Trust, | | | | | |
| Ser. 2014-3, Cl. D | 3.14 | 2/20/20 | 3,875,000 | | 3,897,281 |
| Capital Auto Receivables Asset Trust, | | | | | |
| Ser. 2014-1, Cl. D | 3.39 | 7/22/19 | 3,375,000 | | 3,444,797 |
| Capital Auto Receivables Asset Trust, | | | | | |
| Ser. 2013-3, Cl. D | 3.69 | 2/20/19 | 2,900,000 | | 2,991,050 |
| CCOH Safari, | | | | | |
| Gtd. Bonds | 5.50 | 12/1/22 | 2,450,000 | | 2,471,437 |
| CCOH Safari, | | | | | |
| Gtd. Bonds | 5.75 | 12/1/24 | 6,350,000 | | 6,401,594 |
| Cimarex Energy, | | | | | |
| Gtd. Notes | 5.88 | 5/1/22 | 3,125,000 | | 3,375,000 |
| Citigroup Commercial Mortgage Trust, | | | | | |
| Ser. 2013-375X, Cl. E | 3.63 | 5/10/35 | 4,595,000 | c | 4,111,362 |
| Citigroup Commercial Mortgage Trust, | | | | | |
| Ser. 2013-375P, Cl. E | 3.63 | 5/10/35 | 4,670,000 | b,c | 4,178,468 |
| Colony American Homes, | | | | | |
| Ser. 2014-1A, Cl. C | 2.10 | 5/17/31 | 2,925,000 | b,c | 2,870,343 |
| Colony American Homes, | | | | | |
| Ser. 2014-1A, Cl. D | 2.40 | 5/17/31 | 2,075,000 | b,c | 2,009,694 |
16
| | | | | |
| | Coupon | Maturity | Principal | | |
| Bonds and Notes (continued) | Rate (%) | Date | Amount ($)a | Value ($) |
| United States (continued) | | | | | |
| Commercial Mortgage Trust, | | | | | |
| Ser. 2013-CR6, Cl. B | 3.40 | 3/10/46 | 2,440,000 | b | 2,396,744 |
| Commercial Mortgage Trust, | | | | | |
| Ser. 2013-WWP, Cl. B | 3.73 | 3/10/31 | 5,200,000 | b | 5,339,422 |
| Commercial Mortgage Trust, | | | | | |
| Ser. 2013-CR6, Cl. C | 3.78 | 3/10/46 | 1,700,000 | b,c | 1,671,931 |
| Commercial Mortgage Trust, | | | | | |
| Ser. 2014-UBS2, Cl. AM | 4.20 | 3/10/47 | 1,325,000 | | 1,391,955 |
| Commercial Mortgage Trust, | | | | | |
| Ser. 2014-UBS2, Cl. B | 4.70 | 3/10/47 | 925,000 | | 987,883 |
| Commercial Mortgage Trust, | | | | | |
| Ser. 2013-LC13, Cl. B | 5.01 | 8/10/46 | 3,775,000 | b,c | 4,144,002 |
| Commercial Mortgage Trust, | | | | | |
| Ser. 2013-LC13, Cl. C | 5.22 | 8/10/46 | 1,240,000 | b,c | 1,342,631 |
| Commercial Mortgage Trust, | | | | | |
| Ser. 2013-CR11, Cl. C | 5.34 | 10/10/46 | 3,100,000 | b,c | 3,367,217 |
| Constellation Brands, | | | | | |
| Gtd. Notes | 4.75 | 11/15/24 | 2,095,000 | | 2,147,375 |
| Countrywide Alternative Loan Trust, | | | | | |
| Ser. 2004-18CB, Cl. 4A1 | 5.50 | 9/25/34 | 4,347,196 | | 4,402,264 |
| Credit Suisse Mortgage Trust, | | | | | |
| Ser. 2014-USA, Cl. E | 4.37 | 9/15/37 | 9,470,000 | b | 8,582,102 |
| Dynegy Finance I/II, | | | | | |
| Sr. Scd. Notes | 7.38 | 11/1/22 | 2,695,000 | b | 2,853,331 |
| Dynegy Finance I/II, | | | | | |
| Sr. Scd. Notes | 6.75 | 11/1/19 | 1,985,000 | b | 2,056,956 |
| Dynegy Finance I/II, | | | | | |
| Sr. Scd. Notes | 7.63 | 11/1/24 | 675,000 | b | 716,344 |
| Extended Stay America Trust, | | | | | |
| Ser. 2013-ESH7, Cl. D7 | 5.52 | 12/5/31 | 3,117,000 | b,c | 3,235,977 |
| Federal Home Loan Mortgage | | | | | |
| Corporation Structured Agency | | | | | |
| Credit Risk Debt Notes, | | | | | |
| Ser. 2014-DN3, Cl. M2 | 2.55 | 8/25/24 | 8,600,000 | c,f | 8,580,727 |
| Federal Home Loan Mortgage | | | | | |
| Corporation Structured Agency | | | | | |
| Credit Risk Debt Notes, | | | | | |
| Ser. 2014-HQ2, Cl. M1 | 1.60 | 9/25/24 | 7,811,387 | c,f | 7,789,070 |
| Freeport-McMoRan, | | | | | |
| Gtd. Notes | 3.88 | 3/15/23 | 3,970,000 | e | 3,930,725 |
The Fund 17
STATEMENT OF INVESTMENTS (continued)
| | | | | | |
| | | Coupon | Maturity | Principal | | |
| Bonds and Notes (continued) | Rate (%) | Date | Amount ($)a | Value ($) |
| United States (continued) | | | | | | |
| Freeport-McMoRan, | | | | | | |
| Gtd. Notes | | 5.45 | 3/15/43 | 4,145,000 | | 4,255,846 |
| Fresenius Medical Care II, | | | | | | |
| Gtd. Notes | | 4.13 | 10/15/20 | 3,575,000 | b | 3,604,047 |
| Frontier Communications, | | | | | | |
| Sr. Unscd. Notes | | 8.75 | 4/15/22 | 3,495,000 | | 4,054,200 |
| Genworth Holdings, | | | | | | |
| Gtd. Notes | | 4.90 | 8/15/23 | 7,205,000 | | 7,515,211 |
| Hilton USA Trust, | | | | | | |
| Ser. 2013-HLT, Cl. DFX | | 4.41 | 11/5/30 | 3,515,000 | b | 3,617,322 |
| INEOS Group Holdings, | | | | | | |
| Gtd. Notes | | 5.88 | 2/15/19 | 5,440,000 | | 5,446,800 |
| JP Morgan Chase Bank, | | | | | | |
| Sub. Notes | EUR | 4.38 | 11/30/21 | 6,350,000 | c | 8,397,662 |
| JP Morgan Chase Commercial | | | | | | |
| Mortgage Securities Trust, | | | | | | |
| Ser. 2013-LC11, Cl. B | | 3.50 | 4/15/46 | 7,270,000 | | 7,244,424 |
| JP Morgan Chase Commercial | | | | | | |
| Mortgage Securities Trust, | | | | | | |
| Ser. 2006-LDP9, Cl. AM | | 5.37 | 5/15/47 | 4,995,000 | | 5,200,784 |
| JP Morgan Chase Commercial | | | | | | |
| Mortgage Securities Trust, | | | | | | |
| Ser. 2006-CB17, Cl. AM | | 5.46 | 12/12/43 | 6,360,000 | | 6,639,175 |
| JP Morgan Chase Commercial | | | | | | |
| Mortgage Securities Trust, | | | | | | |
| Ser. 2007-LDPX, Cl. AM | | 5.46 | 1/15/49 | 6,615,000 | c | 6,958,170 |
| JPMBB Commercial | | | | | | |
| Mortgage Securities Trust, | | | | | | |
| Ser. 2014-C24, Cl. B | | 4.12 | 11/15/47 | 2,975,000 | c | 3,054,859 |
| JPMBB Commercial | | | | | | |
| Mortgage Securities Trust, | | | | | | |
| Ser. 2014-C19, Cl. B | | 4.39 | 4/15/47 | 4,700,000 | c | 4,941,961 |
| JPMorgan Chase & Co., | | | | | | |
| Sub. Notes | | 3.88 | 9/10/24 | 9,525,000 | | 9,474,546 |
| KeyCorp Student Loan Trust, | | | | | | |
| Ser. 1999-B, Cl. CTFS | | 0.95 | 11/25/36 | 2,850,000 | c | 2,623,040 |
| Long Beach Mortgage Loan Trust, | | | | | |
| Ser. 2004-1, Cl. M2 | | 0.98 | 2/25/34 | 1,156,032 | c | 1,118,231 |
| Marathon Petroleum, | | | | | | |
| Sr. Unscd. Notes | | 4.75 | 9/15/44 | 4,125,000 | | 4,166,927 |
18
| | | | | | |
| | | Coupon | Maturity | Principal | | |
| Bonds and Notes (continued) | Rate (%) | Date | Amount ($)a | Value ($) |
| United States (continued) | | | | | | |
| Merrill Lynch Mortgage Trust, | | | | | |
| Ser. 2006-C1, Cl. AJ | | 5.86 | 5/12/39 | 6,735,000 | c | 6,786,698 |
| MGM Resorts International, | | | | | | |
| Gtd. Notes | | 7.75 | 3/15/22 | 4,070,000 | e | 4,700,850 |
| ML-CFC Commercial Mortgage Trust, | | | | | |
| Ser. 2006-4, Cl. AJ | | 5.24 | 12/12/49 | 4,550,000 | | 4,589,023 |
| ML-CFC Commercial Mortgage Trust, | | | | | |
| Ser. 2007-9, Cl. AJ | | 6.19 | 9/12/49 | 5,375,000 | c | 5,308,294 |
| Mondelez International, | | | | | | |
| Sr. Unscd. Notes | EUR | 1.13 | 1/26/17 | 6,475,000 | | 8,213,446 |
| Morgan Stanley Bank of | | | | | | |
| America Merrill Lynch Trust, | | | | | |
| Ser. 2013-C8, Cl. B | | 3.67 | 12/15/48 | 2,195,000 | c | 2,209,946 |
| Morgan Stanley Bank of | | | | | | |
| America Merrill Lynch Trust, | | | | | |
| Ser. 2013-C7, Cl. B | | 3.77 | 2/15/46 | 2,355,000 | | 2,385,118 |
| Morgan Stanley Bank of | | | | | | |
| America Merrill Lynch Trust, | | | | | |
| Ser. 2013-C8, Cl. C | | 4.17 | 12/15/48 | 1,885,000 | c | 1,919,463 |
| Morgan Stanley | | | | | | |
| Mortgage Loan Trust, | | | | | | |
| Ser. 2005-1, Cl. 4A1 | | 0.45 | 3/25/35 | 1,457,016 | c | 1,328,407 |
| Morgan Stanley, | | | | | | |
| Sub. Notes | | 4.35 | 9/8/26 | 4,965,000 | | 4,985,347 |
| Popular ABS Mortgage | | | | | | |
| Pass-Through Trust, | | | | | | |
| Ser. 2006-D, Cl. A2 | | 0.31 | 11/25/46 | 1,657,009 | c | 1,602,229 |
| Santander Drive Auto | | | | | | |
| Receivables Trust, | | | | | | |
| Ser. 2014-4, Cl. D | | 3.10 | 11/16/20 | 7,470,000 | | 7,527,792 |
| Springleaf Funding Trust, | | | | | | |
| Ser. 2013-AA, Cl. A | | 2.58 | 9/15/21 | 9,500,000 | b | 9,571,402 |
| Structured Asset Securities Corp. | | | | | |
| Mortgage Pass-through | | | | | | |
| Certificates, Ser. 2004-11XS, | | | | | |
| Cl. 1A5A | | 6.25 | 6/25/34 | 4,285,000 | c | 4,426,321 |
| T-Mobile USA, | | | | | | |
| Gtd. Notes | | 6.00 | 3/1/23 | 3,825,000 | | 3,949,313 |
| T-Mobile USA, | | | | | | |
| Gtd. Notes | | 6.38 | 3/1/25 | 2,415,000 | | 2,487,450 |
The Fund 19
STATEMENT OF INVESTMENTS (continued)
| | | | | |
| | Coupon | Maturity | Principal | | |
| Bonds and Notes (continued) | Rate (%) | Date | Amount ($)a | Value ($) |
| United States (continued) | | | | | |
| Tenet Healthcare, | | | | | |
| Sr. Scd. Notes | 6.00 | 10/1/20 | 6,850,000 | | 7,380,875 |
| Transocean, | | | | | |
| Gtd. Notes | 3.80 | 10/15/22 | 1,490,000 | e | 1,343,877 |
| Transocean, | | | | | |
| Gtd. Notes | 6.38 | 12/15/21 | 6,335,000 | e | 6,666,688 |
| UBS-Barclays Commercial | | | | | |
| Mortgage Trust, | | | | | |
| Ser. 2013-C5, Cl. B | 3.65 | 3/10/46 | 2,215,000 | b,c | 2,209,314 |
| UBS-Barclays Commercial | | | | | |
| Mortgage Trust, | | | | | |
| Ser. 2013-C5, Cl. C | 4.50 | 3/10/46 | 1,700,000 | b,c | 1,712,996 |
| United Rentals North America, | | | | | |
| Gtd. Notes | 5.75 | 11/15/24 | 3,755,000 | | 3,947,444 |
| United Rentals North America, | | | | | |
| Gtd. Notes | 6.13 | 6/15/23 | 4,270,000 | | 4,616,938 |
| Verizon Communications, | | | | | |
| Sr. Unscd. Notes | 4.40 | 11/1/34 | 18,600,000 | | 18,223,071 |
| Wachovia Bank Commercial | | | | | |
| Mortgage Trust, | | | | | |
| Ser. 2006-C29, Cl. AJ | 5.37 | 11/15/48 | 4,940,000 | c | 4,925,155 |
| Wachovia Bank Commercial | | | | | |
| Mortgage Trust, | | | | | |
| Ser. 2007-C32, Cl. AJ | 5.72 | 6/15/49 | 5,205,000 | c | 5,339,255 |
| Wells Fargo Mortgage Backed | | | | | |
| Securities Trust, | | | | | |
| Ser. 2005-AR4, Cl. 2A1 | 2.61 | 4/25/35 | 3,724,702 | c | 3,746,115 |
| Westlake Automobile | | | | | |
| Receivables Trust, | | | | | |
| Ser. 2014-2A, Cl. D | 2.86 | 7/15/21 | 5,675,000 | b | 5,687,110 |
| WFRBS Commercial | | | | | |
| Mortgage Trust, | | | | | |
| Ser. 2013-C11, Cl. B | 3.71 | 3/15/45 | 1,780,000 | c | 1,798,294 |
| WFRBS Commercial | | | | | |
| Mortgage Trust, | | | | | |
| Ser. 2013-C11, Cl. C | 4.13 | 3/15/45 | 1,855,000 | c | 1,893,478 |
| WFRBS Commercial | | | | | |
| Mortgage Trust, | | | | | |
| Ser. 2014-C20, Cl. B | 4.38 | 5/15/47 | 6,280,000 | | 6,575,543 |
20
| | | | | | |
| | | Coupon | Maturity | Principal | | |
| | Bonds and Notes (continued) | Rate (%) | Date | Amount ($)a | | Value ($) |
| | United States (continued) | | | | | |
| | ZFS Finance (USA) Trust V, | | | | | |
| | Jr. Sub. Cap. Secs | 6.50 | 5/9/67 | 7,785,000 | b,c | 8,407,800 |
| | | | | | | 393,815,356 |
| | Total Bonds and Notes | | | | | |
| | (cost $1,666,286,005) | | | | | 1,647,632,871 |
| | | | | Face Amount | | |
| | | | | Covered by | | |
| | Options Purchased—.8% | | | Contracts ($) | | Value ($) |
| | Put Options: | | | | | |
| | Euro, | | | | | |
| | January 2015 @ EUR 1.26 | | | 170,000,000 | | 2,680,961 |
| | Euro, | | | | | |
| | January 2015 @ EUR 1.26 | | | 173,300,000 | | 2,968,771 |
| | Euro, | | | | | |
| | January 2015 @ EUR 1.26 | | | 172,500,000 | | 3,048,318 |
| | Euro, | | | | | |
| | January 2015 @ EUR 1.26 | | | 170,000,000 | | 3,275,827 |
| | South African Rand, | | | | | |
| | February 2015 @ ZAR 11.1 | | | 172,000,000 | | 450,846 |
| | South African Rand, | | | | | |
| | January 2015 @ ZAR 10.93 | | | 34,500,000 | | 1,146,337 |
| | Total Options Purchased | | | | | |
| | (cost $12,380,390) | | | | | 13,571,060 |
| | | | | Principal | | |
| Short-Term Investments—.9% | | | Amount ($) | | Value ($) |
| | U.S. Treasury Bills: | | | | | |
| | 0.02%, 2/19/15 | | | 6,250,000 | g | 6,249,719 |
| | 0.04%, 11/13/14 | | | 8,635,000 | g | 8,634,991 |
| | Total Short-Term Investments | | | | | |
| | (cost $14,884,588) | | | | | 14,884,710 |
| |
| | Other Investment—1.4% | | | Shares | | Value ($) |
| | Registered Investment Company; | | | | | |
| | Dreyfus Institutional Preferred | | | | | |
| | Plus Money Market Fund | | | | | |
| | (cost $23,017,186) | | | 23,017,186 | h | 23,017,186 |
The Fund 21
STATEMENT OF INVESTMENTS (continued)
| | | | |
| Investment of Cash Collateral | | | | |
| for Securities Loaned—1.4% | Shares | | Value ($) | |
| Registered Investment Company; | | | | |
| Dreyfus Institutional Cash Advantage Fund | | | | |
| (cost $24,485,250) | 24,485,250 | h | 24,485,250 | |
| Total Investments (cost $1,741,053,419) | 102.3 | % | 1,723,591,077 | |
| Liabilities, Less Cash and Receivables | (2.3 | %) | (38,778,941 | ) |
| Net Assets | 100.0 | % | 1,684,812,136 | |
EUR—Euro
ZAR—South African Rand
|
| a Principal amount stated in U.S. Dollars unless otherwise noted. |
| AUD—Australian Dollar |
| BRL—Brazilian Real |
| CAD—Canadian Dollar |
| CNY—ChineseYuan Renminbi |
| EUR—Euro |
| GBP—British Pound |
| JPY—JapaneseYen |
| MXN—Mexican New Peso |
| NOK—Norwegian Krone |
| NZD—New Zealand Dollar |
| PLN—Polish Zloty |
| SEK—Swedish Krona |
| b Securities exempt from registration pursuant to Rule 144A under the Securities Act of 1933.These securities may be |
| resold in transactions exempt from registration, normally to qualified institutional buyers.At October 31, 2014, these |
| securities were valued at $302,198,064 or 17.9% of net assets. |
| c Variable rate security—interest rate subject to periodic change. |
| d Principal amount for accrual purposes is periodically adjusted based on changes in the German Consumer Price Index. |
| e Security, or portion thereof, on loan.At October 31, 2014, the value of the fund’s securities on loan was |
| $34,195,810 and the value of the collateral held by the fund was $35,476,661, consisting of cash collateral of |
| $24,485,250 and U.S. Government and Agency securities valued at $10,991,411. |
| f The Federal Housing Finance Agency (“FHFA”) placed the Federal Home Loan Mortgage Corporation and Federal |
| National Mortgage Association into conservatorship with FHFA as the conservator.As such, the FHFA oversees the |
| continuing affairs of these companies. |
| g Held by or on behalf of a counterparty for open financial futures contracts. |
| h Investment in affiliated money market mutual fund. |
| | | |
| Portfolio Summary (Unaudited)† | | |
| |
| | Value (%) | | Value (%) |
| Non-U.S. Government | 59.1 | Cash & Equivalents | 2.8 |
| Securitized | 15.0 | U.S. Government | .9 |
| Corporate-Investment Grade | 13.9 | Options Purchased | .8 |
| Corporate-High Yield | 9.8 | | 102.3 |
| |
| † Based on net assets. | | | |
| See notes to financial statements. | | | |
22
|
| STATEMENT OF FINANCIAL FUTURES |
| October 31, 2014 |
| | | | | |
| | | | | Unrealized | |
| | | Market Value | | Appreciation | |
| | | Covered by | | (Depreciation) | |
| | Contracts | Contracts ($) | Expiration | at 10/31/2014 | ($) |
| Financial Futures Long | | | | | |
| Canadian 10 Year Bonds | 530 | 64,438,933 | December 2014 | 257,010 | |
| Euro-Bobl | 374 | 60,014,160 | December 2014 | 73,346 | |
| Euro-Buxl | 517 | 94,149,600 | December 2014 | 2,379,268 | |
| Euro-Schatz | 136 | 18,912,417 | December 2014 | 4,133 | |
| Japanese 10 Year Bond | 105 | 136,974,405 | December 2014 | 385,552 | |
| Long Gilt | 228 | 41,980,420 | December 2014 | 1,055,750 | |
| Financial Futures Short | | | | | |
| Euro 10 Year Bonds | 161 | 30,447,136 | December 2014 | (71,857 | ) |
| U.S. Treasury 2 Year Notes | 532 | 116,807,250 | December 2014 | (349,286 | ) |
| U.S. Treasury 5 Year Notes | 1,002 | 119,666,981 | December 2014 | 102,147 | |
| U.S. Treasury 10 Year Notes | 829 | 104,751,922 | December 2014 | 710,283 | |
| U.S. Treasury Long Bonds | 351 | 49,523,906 | December 2014 | (322,073 | ) |
| Gross Unrealized Appreciation | | | | 4,967,489 | |
| Gross Unrealized Depreciation | | | | (743,216 | ) |
See notes to financial statements.
The Fund 23
|
| STATEMENT OF ASSETS AND LIABILITIES |
| October 31, 2014 |
| | | | | |
| | | | Cost | Value | |
| |
| Assets ($): | | | | | |
| Investments in securities—See Statement of Investments (including | | | |
| securities on loan, valued at $34,195,810)—Note 1(c): | | | |
| Unaffiliated issuers | | 1,693,550,983 1,676,088,641 | |
| Affiliated issuers | | | 47,502,436 | 47,502,436 | |
| Cash | | | | 4,204,185 | |
| Cash denominated in foreign currencies | | 9,436,752 | 9,228,877 | |
| Dividends, interest and securities lending income receivable | | 17,155,023 | |
| Receivable for investment securities sold | | | 12,257,225 | |
| Unrealized appreciation on forward foreign | | | | |
| currency exchange contracts—Note 4 | | | 6,530,229 | |
| Swap collateral | | | | 5,663,831 | |
| Unrealized appreciation on swap contracts—Note 4 | | | 4,538,194 | |
| Receivable for shares of Beneficial Interest subscribed | | | 4,322,169 | |
| Swap premium paid—Note 4 | | | | 999,082 | |
| Receivable for futures variation margin—Note 4 | | | 183,831 | |
| Prepaid expenses | | | | 36,914 | |
| | | | 1,788,710,637 | |
| Liabilities ($): | | | | | |
| Due to The Dreyfus Corporation and affiliates—Note 3(c) | | 1,255,341 | |
| Payable for investment securities purchased | | | 63,126,757 | |
| Liability for securities on loan—Note 1(c) | | | 24,485,250 | |
| Unrealized depreciation on forward foreign | | | | |
| currency exchange contracts—Note 4 | | | 10,317,087 | |
| Unrealized depreciation on swap contracts—Note 4 | | | 1,845,988 | |
| Payable for shares of Beneficial Interest redeemed | | | 1,665,352 | |
| Payable for swap variation margin—Note 4 | | | 752,863 | |
| Accrued expenses | | | | 449,863 | |
| | | | | 103,898,501 | |
| Net Assets ($) | | | 1,684,812,136 | |
| Composition of Net Assets ($): | | | | | |
| Paid-in capital | | | 1,671,820,856 | |
| Accumulated undistributed investment income—net | | | 44,473,188 | |
| Accumulated net realized gain (loss) on investments | | | (7,916,913 | ) |
| Accumulated net unrealized appreciation (depreciation) on investments, options | | |
| transactions, swap transactions and foreign currency transactions [including | | |
| $4,224,273 net unrealized appreciation on financial futures and ($8,262,999) | | |
| net unrealized (depreciation) on centrally cleared swap transactions] | (23,564,995 | ) |
| Net Assets ($) | | | 1,684,812,136 | |
| |
| |
| |
| Net Asset Value Per Share | | | | | |
| | Class A | Class C | Class I | Class Y | |
| |
| Net Assets ($) | 319,588,239 | 104,680,673 | 1,230,265,681 30,277,543 | |
| Shares Outstanding | 19,080,423 | 6,388,654 | 72,962,975 | 1,795,534 | |
| Net Asset Value Per Share ($) | 16.75 | 16.39 | 16.86 | 16.86 | |
| |
| See notes to financial statements. | | | | | |
24
| | |
| STATEMENT OF OPERATIONS | | |
| Year Ended October 31, 2014 | | |
| |
| |
| |
| |
| Investment Income ($): | | |
| Income: | | |
| Interest | 52,750,389 | |
| Income from securities lending—Note 1(c) | 80,546 | |
| Dividends; | | |
| Affiliated issuers | 23,259 | |
| Total Income | 52,854,194 | |
| Expenses: | | |
| Management fee—Note 3(a) | 9,344,282 | |
| Shareholder servicing costs—Note 3(c) | 3,116,030 | |
| Distribution fees—Note 3(b) | 913,248 | |
| Custodian fees—Note 3(c) | 278,704 | |
| Prospectus and shareholders’ reports | 205,916 | |
| Registration fees | 148,212 | |
| Trustees’ fees and expenses—Note 3(d) | 115,711 | |
| Professional fees | 109,602 | |
| Loan commitment fees—Note 2 | 14,240 | |
| Interest expense—Note 2 | 118 | |
| Miscellaneous | 77,603 | |
| Total Expenses | 14,323,666 | |
| Less—reduction in fees due to earnings credits—Note 3(c) | (1,108 | ) |
| Net Expenses | 14,322,558 | |
| Investment Income—Net | 38,531,636 | |
| Realized and Unrealized Gain (Loss) on Investments—Note 4 ($): | | |
| Net realized gain (loss) on investments and foreign currency transactions | 41,232,937 | |
| Net realized gain (loss) on options transactions | 10,635,785 | |
| Net realized gain (loss) on financial futures | 7,779,021 | |
| Net realized gain (loss) on swap transactions | 3,096,902 | |
| Net realized gain (loss) on forward foreign currency exchange contracts | 3,317,235 | |
| Net Realized Gain (Loss) | 66,061,880 | |
| Net unrealized appreciation (depreciation) on | | |
| investments and foreign currency transactions | (66,534,975 | ) |
| Net unrealized appreciation (depreciation) on options transactions | 11,173,376 | |
| Net unrealized appreciation (depreciation) on financial futures | 433,016 | |
| Net unrealized appreciation (depreciation) on swap transactions | (13,907,179 | ) |
| Net unrealized appreciation (depreciation) on | | |
| forward foreign currency exchange contracts | 593,343 | |
| Net Unrealized Appreciation (Depreciation) | (68,242,419 | ) |
| Net Realized and Unrealized Gain (Loss) on Investments | (2,180,539 | ) |
| Net Increase in Net Assets Resulting from Operations | 36,351,097 | |
| |
| See notes to financial statements. | | |
The Fund 25
STATEMENT OF CHANGES IN NET ASSETS
| | | | |
| | Year Ended October 31, | |
| | 2014 | | 2013 | a |
| Operations ($): | | | | |
| Investment income—net | 38,531,636 | | 43,378,406 | |
| Net realized gain (loss) on investments | 66,061,880 | | (55,222,228 | ) |
| Net unrealized appreciation | | | | |
| (depreciation) on investments | (68,242,419 | ) | (30,602,453 | ) |
| Net Increase (Decrease) in Net Assets | | | | |
| Resulting from Operations | 36,351,097 | | (42,446,275 | ) |
| Dividends to Shareholders from ($): | | | | |
| Investment income—net: | | | | |
| Class A | (6,472,384 | ) | (14,913,171 | ) |
| Class C | (901,100 | ) | (3,059,078 | ) |
| Class I | (17,440,206 | ) | (23,157,448 | ) |
| Class Y | (268,120 | ) | (5 | ) |
| Net realized gain on investments: | | | | |
| Class A | — | | (8,813,225 | ) |
| Class C | — | | (2,590,934 | ) |
| Class I | — | | (11,832,504 | ) |
| Total Dividends | (25,081,810 | ) | (64,366,365 | ) |
| Beneficial Interest Transactions ($): | | | | |
| Net proceeds from shares sold: | | | | |
| Class A | 103,430,720 | | 273,141,211 | |
| Class C | 6,846,201 | | 39,730,240 | |
| Class I | 885,799,995 | | 507,109,163 | |
| Class Y | 37,270,359 | | 1,000 | |
| Dividends reinvested: | | | | |
| Class A | 6,099,748 | | 22,363,097 | |
| Class C | 661,956 | | 4,155,441 | |
| Class I | 11,765,168 | | 25,556,121 | |
| Class Y | 248,147 | | — | |
| Cost of shares redeemed: | | | | |
| Class A | (350,268,879 | ) | (385,947,046 | ) |
| Class C | (56,738,530 | ) | (78,749,042 | ) |
| Class I | (544,877,550 | ) | (537,269,652 | ) |
| Class Y | (6,991,608 | ) | — | |
| Increase (Decrease) in Net Assets from | | | | |
| Beneficial Interest Transactions | 93,245,727 | | (129,909,467 | ) |
| Total Increase (Decrease) in Net Assets | 104,515,014 | | (236,722,107 | ) |
| Net Assets ($): | | | | |
| Beginning of Period | 1,580,297,122 | | 1,817,019,229 | |
| End of Period | 1,684,812,136 | | 1,580,297,122 | |
| Undistributed investment income—net | 44,473,188 | | 3,602,275 | |
26
| | | | |
| | Year Ended October 31, | |
| | 2014 | | 2013 | a |
| Capital Share Transactions: | | | | |
| Class Ab�� | | | | |
| Shares sold | 6,216,086 | | 16,129,452 | |
| Shares issued for dividends reinvested | 367,916 | | 1,305,814 | |
| Shares redeemed | (20,939,026 | ) | (23,104,778 | ) |
| Net Increase (Decrease) in Shares Outstanding | (14,355,024 | ) | (5,669,512 | ) |
| Class Cb | | | | |
| Shares sold | 419,553 | | 2,379,836 | |
| Shares issued for dividends reinvested | 40,845 | | 246,968 | |
| Shares redeemed | (3,493,198 | ) | (4,826,517 | ) |
| Net Increase (Decrease) in Shares Outstanding | (3,032,800 | ) | (2,199,713 | ) |
| Class Ic | | | | |
| Shares sold | 52,212,688 | | 29,823,847 | |
| Shares issued for dividends reinvested | 702,962 | | 1,486,616 | |
| Shares redeemed | (32,530,513 | ) | (31,910,610 | ) |
| Net Increase (Decrease) in Shares Outstanding | 20,385,137 | | (600,147 | ) |
| Class Yc | | | | |
| Shares sold | 2,195,057 | | 61.24 | |
| Shares issued for dividends reinvested | 14,577 | | — | |
| Shares redeemed | (414,161 | ) | — | |
| Net Increase (Decrease) in Shares Outstanding | 1,795,473 | | 61.24 | |
|
| a Effective July 1, 2013, the fund commenced offering ClassY shares. |
| b During the period ended October 31, 2013, 45,481 Class C shares representing $744,979 were exchanged for |
| 44,556 Class A shares. |
| c During the period ended October 31, 2014, 868,678 Class I shares representing $14,876,502 were exchanged for |
| 868,678 ClassY shares. |
See notes to financial statements.
The Fund 27
FINANCIAL HIGHLIGHTS
The following tables describe the performance for each share class for the fiscal periods indicated. All information (except portfolio turnover rate) reflects financial results for a single fund share.Total return shows how much your investment in the fund would have increased (or decreased) during each period, assuming you had reinvested all dividends and distributions.These figures have been derived from the fund’s financial statements.
| | | | | | | | | | |
| | | | Year Ended October 31, | | | |
| Class A Shares | 2014 | | 2013 | | 2012 | | 2011 | | 2010 | |
| Per Share Data ($): | | | | | | | | | | |
| Net asset value, beginning of period | 16.53 | | 17.48 | | 16.85 | | 17.62 | | 16.25 | |
| Investment Operations: | | | | | | | | | | |
| Investment income—neta | .39 | | .39 | | .34 | | .40 | | .50 | |
| Net realized and unrealized | | | | | | | | | | |
| gain (loss) on investments | .06 | | (.75 | ) | .65 | | (.17 | ) | 1.42 | |
| Total from Investment Operations | .45 | | (.36 | ) | .99 | | .23 | | 1.92 | |
| Distributions: | | | | | | | | | | |
| Dividends from investment income—net | (.23 | ) | (.37 | ) | (.19 | ) | (.43 | ) | (.35 | ) |
| Dividends from net realized | | | | | | | | | | |
| gain on investments | — | | (.22 | ) | (.17 | ) | (.57 | ) | (.20 | ) |
| Total Distributions | (.23 | ) | (.59 | ) | (.36 | ) | (1.00 | ) | (.55 | ) |
| Net asset value, end of period | 16.75 | | 16.53 | | 17.48 | | 16.85 | | 17.62 | |
| Total Return (%)b | 2.77 | | (2.14 | ) | 6.04 | | 1.65 | | 12.11 | |
| Ratios/Supplemental Data (%): | | | | | | | | | | |
| Ratio of total expenses | | | | | | | | | | |
| to average net assets | 1.08 | | 1.07 | | 1.02 | | 1.01 | | 1.09 | |
| Ratio of net expenses | | | | | | | | | | |
| to average net assets | 1.08 | | 1.07 | | 1.02 | | 1.01 | | 1.09 | |
| Ratio of net investment income | | | | | | | | | | |
| to average net assets | 2.31 | | 2.28 | | 2.02 | | 2.38 | | 3.06 | |
| Portfolio Turnover Rate | 209.53 | | 169.41 | | 192.50 | | 213.45 | | 153.71 | |
| Net Assets, end of period ($ x 1,000) | 319,588 | | 552,695 | | 683,387 | | 612,236 | | 374,363 | |
| |
| a | Based on average shares outstanding. |
| b | Exclusive of sales charge. |
See notes to financial statements.
28
| | | | | | | | | | |
| | | | Year Ended October 31, | | | |
| Class C Shares | 2014 | | 2013 | | 2012 | | 2011 | | 2010 | |
| Per Share Data ($): | | | | | | | | | | |
| Net asset value, beginning of period | 16.17 | | 17.11 | | 16.54 | | 17.32 | | 16.05 | |
| Investment Operations: | | | | | | | | | | |
| Investment income—neta | .27 | | .26 | | .21 | | .27 | | .37 | |
| Net realized and unrealized | | | | | | | | | | |
| gain (loss) on investments | .07 | | (.72 | ) | .64 | | (.16 | ) | 1.39 | |
| Total from Investment Operations | .34 | | (.46 | ) | .85 | | .11 | | 1.76 | |
| Distributions: | | | | | | | | | | |
| Dividends from investment income—net | (.12 | ) | (.26 | ) | (.11 | ) | (.32 | ) | (.29 | ) |
| Dividends from net realized | | | | | | | | | | |
| gain on investments | — | | (.22 | ) | (.17 | ) | (.57 | ) | (.20 | ) |
| Total Distributions | (.12 | ) | (.48 | ) | (.28 | ) | (.89 | ) | (.49 | ) |
| Net asset value, end of period | 16.39 | | 16.17 | | 17.11 | | 16.54 | | 17.32 | |
| Total Return (%)b | 2.09 | | (2.78 | ) | 5.23 | | .89 | | 11.26 | |
| Ratios/Supplemental Data (%): | | | | | | | | | | |
| Ratio of total expenses | | | | | | | | | | |
| to average net assets | 1.76 | | 1.75 | | 1.76 | | 1.75 | | 1.84 | |
| Ratio of net expenses | | | | | | | | | | |
| to average net assets | 1.76 | | 1.75 | | 1.76 | | 1.75 | | 1.84 | |
| Ratio of net investment income | | | | | | | | | | |
| to average net assets | 1.63 | | 1.60 | | 1.31 | | 1.63 | | 2.31 | |
| Portfolio Turnover Rate | 209.53 | | 169.41 | | 192.50 | | 213.45 | | 153.71 | |
| Net Assets, end of period ($ x 1,000) | 104,681 | | 152,333 | | 198,824 | | 157,340 | | 103,906 | |
| |
| a | Based on average shares outstanding. |
| b | Exclusive of sales charge. |
See notes to financial statements.
The Fund 29
FINANCIAL HIGHLIGHTS (continued)
| | | | | | | | | | |
| | | | Year Ended October 31, | | | |
| Class I Shares | 2014 | | 2013 | | 2012 | | 2011 | | 2010 | |
| Per Share Data ($): | | | | | | | | | | |
| Net asset value, beginning of period | 16.65 | | 17.58 | | 16.94 | | 17.70 | | 16.31 | |
| Investment Operations: | | | | | | | | | | |
| Investment income—neta | .44 | | .44 | | .39 | | .44 | | .54 | |
| Net realized and unrealized | | | | | | | | | | |
| gain (loss) on investments | .07 | | (.74 | ) | .64 | | (.16 | ) | 1.42 | |
| Total from Investment Operations | .51 | | (.30 | ) | 1.03 | | .28 | | 1.96 | |
| Distributions: | | | | | | | | | | |
| Dividends from investment income—net | (.30 | ) | (.41 | ) | (.22 | ) | (.47 | ) | (.37 | ) |
| Dividends from net realized | | | | | | | | | | |
| gain on investments | — | | (.22 | ) | (.17 | ) | (.57 | ) | (.20 | ) |
| Total Distributions | (.30 | ) | (.63 | ) | (.39 | ) | (1.04 | ) | (.57 | ) |
| Net asset value, end of period | 16.86 | | 16.65 | | 17.58 | | 16.94 | | 17.70 | |
| Total Return (%) | 3.08 | | (1.78 | ) | 6.27 | | 1.87 | | 12.44 | |
| Ratios/Supplemental Data (%): | | | | | | | | | | |
| Ratio of total expenses | | | | | | | | | | |
| to average net assets | .75 | | .74 | | .80 | | .75 | | .82 | |
| Ratio of net expenses | | | | | | | | | | |
| to average net assets | .75 | | .74 | | .80 | | .75 | | .82 | |
| Ratio of net investment income | | | | | | | | | | |
| to average net assets | 2.65 | | 2.60 | | 2.29 | | 2.64 | | 3.30 | |
| Portfolio Turnover Rate | 209.53 | | 169.41 | | 192.50 | | 213.45 | | 153.71 | |
| Net Assets, end of period ($ x 1,000) | 1,230,266 | | 875,269 | | 934,809 | | 468,316 | | 328,703 | |
| |
| a Based on average shares outstanding. | | | | | | | | | | |
| See notes to financial statements. | | | | | | | | | | |
30
| | | | |
| | Year Ended October 31, | |
| Class Y Shares | 2014 | | 2013 | a |
| Per Share Data ($): | | | | |
| Net asset value, beginning of period | 16.65 | | 16.33 | |
| Investment Operations: | | | | |
| Investment income—netb | .47 | | .14 | |
| Net realized and unrealized | | | | |
| gain (loss) on investments | .05 | | .26 | |
| Total from Investment Operations | .52 | | .40 | |
| Distributions: | | | | |
| Dividends from investment income—net | (.31 | ) | (.08 | ) |
| Net asset value, end of period | 16.86 | | 16.65 | |
| Total Return (%) | 3.13 | | 2.43 | c |
| Ratios/Supplemental Data (%): | | | | |
| Ratio of total expenses to average net assets | .68 | | .74 | d |
| Ratio of net expenses to average net assets | .68 | | .74 | d |
| Ratio of net investment income | | | | |
| to average net assets | 2.71 | | 2.63 | d |
| Portfolio Turnover Rate | 209.53 | | 169.41 | |
| Net Assets, end of period ($ x 1,000) | 30,278 | | 1 | |
| |
| a | From July 1, 2013 (commencement of initial offering) to October 31, 2013. |
| b | Based on average shares outstanding. |
| c | Not annualized. |
| d | Annualized. |
See notes to financial statements.
The Fund 31
NOTES TO FINANCIAL STATEMENTS
NOTE 1—Significant Accounting Policies:
Dreyfus International Bond Fund (the “fund”) is a separate non-diversified series of The Dreyfus/Laurel Funds Trust (the “Trust”), which is registered under the Investment Company Act of 1940, as amended (the “Act”), as an open-end management investment company and operates as a series company currently offering five series, including the fund. The fund’s investment objective seeks to maximize total return through capital appreciation and income. The Dreyfus Corporation (the “Manager” or “Dreyfus”), a wholly-owned subsidiary of The Bank of New York Mellon Corporation (“BNY Mellon”), serves as the fund’s investment adviser.
MBSC Securities Corporation (the “Distributor”), a wholly-owned subsidiary of the Manager, is the distributor of the fund’s shares. The fund is authorized to issue an unlimited number of $.001 par value shares of Beneficial Interest in each of the following classes of shares: Class A, Class C, Class I and ClassY. Class A and Class C shares are sold primarily to retail investors through financial intermediaries and bear Distribution and/or Shareholder Services Plan fees. Class A shares generally are subject to a sales charge imposed at the time of purchase. Class C shares are subject to a contingent deferred sales charge (“CDSC”) imposed on Class C shares redeemed within one year of purchase. Class I shares are sold primarily to bank trust departments and other financial service providers (including The Bank of NewYork Mellon, a subsidiary of BNY Mellon and an affiliate of Dreyfus, and its affiliates), acting on behalf of customers having a qualified trust or an investment account or relationship at such institution, and bear no Distribution or Shareholder Services Plan fees. Class Y shares are sold at net asset value per share generally to institutional investors and bear no Distribution or Shareholder Services Plan fees. Class I and Class Y shares are offered without a front-end sales charge or CDSC. Other differences between the classes include the services offered to and the expenses borne by each class, the allocation of certain transfer agency
32
costs, and certain voting rights. Income, expenses (other than expenses attributable to a specific class), and realized and unrealized gains or losses on investments are allocated to each class of shares based on its relative net assets.
The Trust accounts separately for the assets, liabilities and operations of each series. Expenses directly attributable to each series are charged to that series’ operations; expenses which are applicable to all series are allocated among them on a pro rata basis.
The Financial Accounting Standards Board (“FASB”) Accounting Standards Codification (“ASC”) is the exclusive reference of authoritative U.S. generally accepted accounting principles (“GAAP”) recognized by the FASB to be applied by nongovernmental entities. Rules and interpretive releases of the Securities and Exchange Commission (“SEC”) under authority of federal laws are also sources of authoritative GAAP for SEC registrants. The fund’s financial statements are prepared in accordance with GAAP, which may require the use of management estimates and assumptions. Actual results could differ from those estimates.
(a) Portfolio valuation: The fair value of a financial instrument is the amount that would be received to sell an asset or paid to transfer a liability in an orderly transaction between market participants at the measurement date (i.e., the exit price). GAAP establishes a fair value hierarchy that prioritizes the inputs of valuation techniques used to measure fair value. This hierarchy gives the highest priority to unadjusted quoted prices in active markets for identical assets or liabilities (Level 1 measurements) and the lowest priority to unobservable inputs (Level 3 measurements).
Additionally, GAAP provides guidance on determining whether the volume and activity in a market has decreased significantly and whether such a decrease in activity results in transactions that are not orderly. GAAP requires enhanced disclosures around valuation inputs and techniques used during annual and interim periods.
The Fund 33
NOTES TO FINANCIAL STATEMENTS (continued)
Various inputs are used in determining the value of the fund’s investments relating to fair value measurements.These inputs are summarized in the three broad levels listed below:
Level 1—unadjusted quoted prices in active markets for identical investments.
Level 2—other significant observable inputs (including quoted prices for similar investments, interest rates, prepayment speeds, credit risk, etc.).
Level 3—significant unobservable inputs (including the fund’s own assumptions in determining the fair value of investments).
The inputs or methodology used for valuing securities are not necessarily an indication of the risk associated with investing in those securities.
Changes in valuation techniques may result in transfers in or out of an assigned level within the disclosure hierarchy. Valuation techniques used to value the fund’s investments are as follows:
Registered investment companies that are not traded on an exchange are valued at their net asset value and are generally categorized within Level 1 of the fair value hierarchy.
Investments in securities, excluding short-term investments (other than U.S.Treasury Bills), financial futures, options and forward foreign currency exchange contracts (“forward contracts”) are valued each business day by an independent pricing service (the “Service”) approved by the Trust’s Board of Trustees (the “Board”). Investments for which quoted bid prices are readily available and are representative of the bid side of the market in the judgment of the Service are valued at the mean between the quoted bid prices (as obtained by the Service from dealers in such securities) and asked prices (as calculated by the Service based upon its evaluation of the market for such securities). Other investments (which constitute a majority of the portfolio securities) are valued as determined by the Service, based on methods which include consideration of the following: yields or prices of securities of comparable quality, coupon, maturity and type; indications as
34
to values from dealers; and general market conditions.These securities are generally categorized within Level 2 of the fair value hierarchy.
U.S. Treasury Bills are valued at the mean price between quoted bid prices and asked prices by the Service. These securities are generally categorized within Level 2 of the fair value hierarchy.
The Service’s procedures are reviewed by Dreyfus under the general supervision of the Board.
When market quotations or official closing prices are not readily available, or are determined not to reflect accurately fair value, such as when the value of a security has been significantly affected by events after the close of the exchange or market on which the security is principally traded (for example, a foreign exchange or market), but before the fund calculates its net asset value, the fund may value these investments at fair value as determined in accordance with the procedures approved by the Board. Certain factors may be considered when fair valuing investments such as: fundamental analytical data, the nature and duration of restrictions on disposition, an evaluation of the forces that influence the market in which the securities are purchased and sold, and public trading in similar securities of the issuer or comparable issuers. These securities are either categorized within Level 2 or 3 of the fair value hierarchy depending on the relevant inputs used.
For restricted securities where observable inputs are limited, assumptions about market activity and risk are used and are generally categorized within Level 3 of the fair value hierarchy.
Investments denominated in foreign currencies are translated to U.S. dollars at the prevailing rates of exchange.
Financial futures and options, which are traded on an exchange, are valued at the last sales price on the securities exchange on which such securities are primarily traded or at the last sales price on the national securities market on each business day and are generally categorized within Level 1 of the fair value hierarchy. Options traded over-the-
The Fund 35
NOTES TO FINANCIAL STATEMENTS (continued)
counter (“OTC”) are valued at the mean between the bid and asked price and are generally categorized within Level 2 of the fair value hierarchy. Investments in swap transactions are valued each business day by the Service. Swaps are valued by the Service by using a swap pricing model which incorporates among other factors, default probabilities, recovery rates, credit curves of the underlying issuer and swap spreads on interest rates and are generally categorized within Level 2 of the fair value hierarchy. Forward contracts are valued at the forward rate and are generally categorized within Level 2 of the fair value hierarchy.
The following is a summary of the inputs used as of October 31, 2014 in valuing the fund’s investments:
| | | | |
| | | Level 2—Other | Level 3— | |
| | Level 1— | Significant | Significant | |
| | Unadjusted | Observable | Unobservable | |
| | Quoted Prices | Inputs | Inputs | Total |
| Assets ($) | | | | |
| Investments in Securities: | | | |
| Asset-Backed | — | 78,620,220 | — | 78,620,220 |
| Commercial | | | | |
| Mortgage-Backed | — | 141,985,224 | — | 141,985,224 |
| Corporate Bonds† | — | 442,592,146 | — | 442,592,146 |
| Foreign Government | — | 951,928,372 | — | 951,928,372 |
| Mutual Funds | 47,502,436 | - | — | 47,502,436 |
| Residential | | | | |
| Mortgage-Backed | — | 32,506,909 | — | 32,506,909 |
| U.S. Treasury | — | 14,884,710 | — | 14,884,710 |
| Other Financial | | | | |
| Instruments: | | | | |
| Financial Futures†† | 4,967,489 | - | — | 4,967,489 |
| Forward Foreign | | | | |
| Currency Exchange | | | | |
| Contracts†† | — | 6,530,229 | — | 6,530,229 |
| Options Purchased | — | 13,571,060 | — | 13,571,060 |
| Swaps†† | — | 4,538,194 | — | 4,538,194 |
36
| | | | | | | |
| | | | Level 2—Other | | Level 3— | | |
| | Level 1— | | Significant | | Significant | | |
| | Unadjusted | | Observable | | Unobservable | | |
| | Quoted Prices | | Inputs | | Inputs | Total | |
| Liabilities ($) | | | | | | | |
| Other Financial | | | | | | | |
| Instruments: | | | | | | | |
| Financial Futures†† | (743,216 | ) | — | | — | (743,216 | ) |
| Forward Foreign | | | | | | | |
| Currency Exchange | | | | | | | |
| Contracts†† | — | | (10,317,087 | ) | — | (10,317,087 | ) |
| Swaps†† | — | | (10,108,987 | ) | — | (10,108,987 | ) |
| |
| † | See Statement of Investments for additional detailed categorizations. |
| †† | Amount shown represents unrealized appreciation (depreciation) at period end. |
At October 31, 2014, there were no transfers between Level 1 and Level 2 of the fair value hierarchy.
(b) Foreign currency transactions: The fund does not isolate that portion of the results of operations resulting from changes in foreign exchange rates on investments from the fluctuations arising from changes in the market prices of securities held. Such fluctuations are included with the net realized and unrealized gain or loss on investments.
Net realized foreign exchange gains or losses arise from sales of foreign currencies, currency gains or losses realized on securities transactions between trade and settlement date, and the difference between the amounts of dividends, interest and foreign withholding taxes recorded on the fund’s books and the U.S. dollar equivalent of the amounts actually received or paid. Net unrealized foreign exchange gains and losses arise from changes in the value of assets and liabilities other than investments resulting from changes in exchange rates. Foreign currency gains and losses on foreign currency transactions are also included with net realized and unrealized gain or loss on investments.
The Fund 37
NOTES TO FINANCIAL STATEMENTS (continued)
(c) Securities transactions and investment income: Securities transactions are recorded on a trade date basis. Realized gains and losses from securities transactions are recorded on the identified cost basis. Dividend income is recognized on the ex-dividend date and interest income, including, where applicable, accretion of discount and amortization of premium on investments, is recognized on the accrual basis.
Pursuant to a securities lending agreement with The Bank of New York Mellon, the fund may lend securities to qualified institutions. It is the fund’s policy that, at origination, all loans are secured by collateral of at least 102% of the value of U.S. securities loaned and 105% of the value of foreign securities loaned. Collateral equivalent to at least 100% of the market value of securities on loan is maintained at all times. Collateral is either in the form of cash, which can be invested in certain money market mutual funds managed by the Manager or U.S. Government and Agency securities.The fund is entitled to receive all dividends, interest and distributions on securities loaned, in addition to income earned as a result of the lending transaction. Should a borrower fail to return the securities in a timely manner, The Bank of New York Mellon is required to replace the securities for the benefit of the fund or credit the fund with the market value of the unreturned securities and is subrogated to the fund’s rights against the borrower and the collateral. During the period ended October 31, 2014, The Bank of New York Mellon earned $18,832 from lending portfolio securities, pursuant to the securities lending agreement.
(d) Affiliated issuers: Investments in other investment companies advised by Dreyfus are defined as “affiliated” under the Act. Investments in affiliated investment companies during the period ended October 31, 2014 were as follows:
| | | | | |
| Affiliated | | | | | |
| Investment | Value | | | Value | Net |
| Company | 10/31/2013 ($) | Purchases ($) | Sales ($) | 10/31/2014 ($) | Assets (%) |
| Dreyfus | | | | | |
| Institutional | | | | | |
| Preferred Plus | | | | |
| Money Market | | | | |
| Fund | 11,433,504 | 1,364,799,910 | 1,353,216,228 | 23,017,186 | 1.4 |
38
| | | | | |
| Affiliated | | | | | |
| Investment | Value | | | Value | Net |
| Company | 10/31/2013 ($) | Purchases ($) | Sales ($) | 10/31/2014 ($) | Assets (%) |
| Dreyfus | | | | | |
| Institutional | | | | | |
| Cash | | | | | |
| Advantage | | | | | |
| Fund | 63,405,800 | 195,952,507 | 234,873,057 | 24,485,250 | 1.4 |
| Total | 74,839,304 | 1,560,752,417 | 1,588,089,285 | 47,502,436 | 2.8 |
(e) Risk: The fund invests primarily in debt securities. Failure of an issuer of the debt securities to make timely interest or principal payments, or a decline or the perception of a decline in the credit quality of a debt security, can cause the debt security’s price to fall, potentially lowering the fund’s share price. In addition, the value of debt securities may decline due to general market conditions that are not specifically related to a particular issuer, such as real or perceived adverse economic conditions, changes in outlook for corporate earnings, changes in interest or currency rates or adverse investor sentiment. They may also decline because of factors that affect a particular industry or country.
Investing in foreign markets may involve special risks and considerations not typically associated with investing in the U.S. These risks include revaluation of currencies, high rates of inflation, repatriation restrictions on income and capital, and adverse political and economic developments. Moreover, securities issued in these markets may be less liquid, subject to government ownership controls and delayed settlements, and their prices may be more volatile than those of comparable securities in the U.S.
(f) Dividends to shareholders: Dividends are recorded on ex-dividend date. Dividends from investment income-net are normally declared and paid quarterly. Dividends from net realized capital gains, if any, are normally declared and paid annually, but the fund may make distributions on a more frequent basis to comply with the distribution requirements of the Internal Revenue Code of 1986, as amended (the “Code”). To the extent that net realized capital gains can be offset by capital loss carryovers, it is the policy of the fund not to distribute such
The Fund 39
NOTES TO FINANCIAL STATEMENTS (continued)
gains. Income and capital gain distributions are determined in accordance with income tax regulations, which may differ from GAAP.
On October 31, 2014, the Board declared a cash dividend of $.072, $.044, $.089 and $.093 per share from undistributed investment income-net for Class A, Class C, Class I and ClassY shares, respectively, payable on November 3, 2014 (ex-dividend date), to shareholders of record as of the close of business on October 31, 2014.
(g) Federal income taxes: It is the policy of the fund to continue to qualify as a regulated investment company, if such qualification is in the best interests of its shareholders, by complying with the applicable provisions of the Code, and to make distributions of taxable income sufficient to relieve it from substantially all federal income and excise taxes.
As of and during the period ended October 31, 2014, the fund did not have any liabilities for any uncertain tax positions.The fund recognizes interest and penalties, if any, related to uncertain tax positions as income tax expense in the Statement of Operations. During the period October 31, 2014, the fund did not incur any interest or penalties.
Each tax year in the four-year period ended October 31, 2014 remains subject to examination by the Internal Revenue Service and state taxing authorities.
At October 31, 2014, the components of accumulated earnings on a tax basis were as follows: undistributed ordinary income $48,153,123, accumulated capital losses $12,646,240 and unrealized depreciation $22,515,603.
Under the Regulated Investment Company Modernization Act of 2010 (the “2010 Act”), the fund is permitted to carry forward capital losses incurred in taxable years beginning after December 22, 2010 (“post-enactment losses”) for an unlimited period. Furthermore, post-enactment capital loss carryovers retain their character as either short-term or long-term capital losses rather than short-term as they were under previous statute.
40
The accumulated capital loss carryover is available for federal income tax purposes to be applied against future net realized capital gains, if any, realized subsequent to October 31, 2014.The fund has $5,686,206 of post-enactment short-term capital losses and $6,960,034 of post-enactment long-term capital losses which can be carried forward for an unlimited period.
The tax character of distributions paid to shareholders during the fiscal periods ended October 31, 2014 and October 31, 2013 were as follows: ordinary income $25,081,810 and $64,366,365, respectively.
During the period ended October 31, 2014, as a result of permanent book to tax differences, primarily due to the tax treatment for paydown gains and losses, foreign currency transactions, swap periodic payments and consent fees, the fund increased accumulated undistributed investment income-net by $27,421,087 and decreased accumulated net realized gain (loss) on investments by the same amount. Net assets and net asset value per share were not affected by this reclassification.
NOTE 2—Bank Lines of Credit:
The fund participates with other Dreyfus-managed funds in a $430 million unsecured credit facility led by Citibank, N.A. and a $300 million unsecured credit facility provided by The Bank of New York Mellon (each, a “Facility”), each to be utilized primarily for temporary or emergency purposes, including the financing of redemptions. Prior to October 8, 2014, the unsecured credit facility with Citibank, N.A. was $265 million. In connection therewith, the fund has agreed to pay its pro rata portion of commitment fees for each Facility. Interest is charged to the fund based on rates determined pursuant to the terms of the respective Facility at the time of borrowing.
The average amount of borrowings outstanding under the Facilities during the period ended October 31, 2014 was approximately $14,250 with a related weighted average annualized interest rate of .83%.
The Fund 41
NOTES TO FINANCIAL STATEMENTS (continued)
NOTE 3—Management Fee and Other Transactions with Affiliates:
(a) Pursuant to a management agreement with the Manager and the Trust, the Trust has agreed to pay the Manager a management fee computed at the annual rate of .60% of the value of the fund’s average daily net assets and is payable monthly.
During the period ended October 31, 2014, the Distributor retained $2,583 from commissions earned on sales of the fund’s Class A shares and $11,154 from CDSCs on redemptions of the fund’s Class C shares.
(b) Under the Distribution Plan adopted pursuant to Rule 12b-1 under the Act, Class C shares pay the Distributor for distributing its shares at an annual rate of .75% of the value of its average daily net assets. During the period ended October 31, 2014, Class C shares were charged $913,248 pursuant to the Distribution Plan.
(c) Under the Shareholder Services Plan, Class A and Class C shares pay the Distributor at an annual rate of .25% of the value of their average daily net assets for the provision of certain services.These services provided may include personal services relating to shareholder accounts, such as answering shareholder inquiries regarding the fund and providing reports and other information, and services related to the maintenance of shareholder accounts.The Distributor may make payments to Service Agents (securities dealers, financial institutions or other industry professionals) with respect to these services.The Distributor determines the amounts to be paid to Service Agents. During the period ended October 31, 2014, Class A and Class C shares were charged $1,102,504 and $304,416, respectively, pursuant to the Shareholder Services Plan.
Under its terms, the Distribution Plan and Shareholder Services Plan shall remain in effect from year to year, provided such continuance is approved annually by a vote of a majority of those Trustees who are not “interested persons” of the Trust and who have no direct or indirect financial interest in the operation of or in any agreement related to the Distribution Plan or Shareholder Services Plan.
42
The fund has arrangements with the transfer agent and the custodian whereby the fund may receive earnings credits when positive cash balances are maintained, which are used to offset transfer agency and custody fees. For financial reporting purposes, the fund includes net earnings credits as an expense offset in the Statement of Operations.
The fund compensates Dreyfus Transfer, Inc., a wholly-owned subsidiary of the Manager, under a transfer agency agreement for providing transfer agency and cash management services for the fund. The majority of transfer agency fees are comprised of amounts paid on a per account basis, while cash management fees are related to fund subscriptions and redemptions. During the period ended October 31, 2014, the fund was charged $268,543 for transfer agency services and $20,138 for cash management services. These fees are included in Shareholder servicing costs in the Statement of Operations. Cash management fees were partially offset by earnings credits of $1,108.
The fund compensates The Bank of New York Mellon under a custody agreement for providing custodial services for the fund. These fees are determined based on net assets, geographic region and transaction activity. During the period ended October 31, 2014, the fund was charged $278,704 pursuant to the custody agreement.
During the period ended October 31, 2014, the fund was charged $8,015 for services performed by the Chief Compliance Officer and his staff.
The components of “Due to The Dreyfus Corporation and affiliates” in the Statement of Assets and Liabilities consist of: management fees $858,444, Distribution Plan fees $67,536, Shareholder Services Plan fees $91,508, custodian fees $174,870, Chief Compliance Officer fees $617 and transfer agency fees $62,366.
(d) Each Board member also serves as a Board member of other funds within the Dreyfus complex. Annual retainer fees and attendance fees are allocated to each fund based on net assets.
The Fund 43
NOTES TO FINANCIAL STATEMENTS (continued)
NOTE 4—Securities Transactions:
The aggregate amount of purchases and sales (including paydowns) of investment securities, excluding short-term securities, forward contracts, financial futures, options transactions and swap transactions, during the period ended October 31, 2014, amounted to $3,286,117,154 and $3,136,962,079, respectively.
Derivatives: A derivative is a financial instrument whose performance is derived from the performance of another asset. Each type of derivative instrument that was held by the fund during the period ended October 31, 2014 is discussed below.
Master Netting Arrangements: The fund enters into International Swaps and Derivatives Association, Inc. Master Agreements or similar agreements (collectively, “Master Agreements”) with its OTC derivative contract counterparties in order to, among other things, reduce its credit risk to counterparties. Master Agreements include provisions for general obligations, representations, collateral and events of default or termination. Under a Master Agreement, the fund may offset with the counterparty certain derivative financial instrument’s payables and/or receivables with collateral held and/or posted and create one single net payment in the event of default or termination.
Financial Futures: In the normal course of pursuing its investment objective, the fund is exposed to market risk, including interest rate risk, as a result of changes in value of underlying financial instruments.The fund invests in financial futures in order to manage its exposure to or protect against changes in the market. A financial futures contract represents a commitment for the future purchase or a sale of an asset at a specified date. Upon entering into such contracts, these investments require initial margin deposits with a counterparty, which consist of cash or cash equivalents.The amount of these deposits is determined by the exchange or Board of Trade on which the contract is traded and is subject to change. Accordingly, variation margin payments are received or made to reflect daily unrealized gains or losses which are recorded in the Statement of Operations.When the contracts are closed, the fund
44
recognizes a realized gain or loss which is reflected in the Statement of Operations.There is minimal counterparty credit risk to the fund with financial futures since they are exchange traded, and the exchange guarantees the financial futures against default. Financial futures open at October 31, 2014 are set forth in the Statement of Financial Futures.
Options Transactions: The fund purchases and writes (sells) put and call options to hedge against changes in interest rates and foreign currencies, or as a substitute for an investment. The fund is subject to market risk, interest rate risk and currency risk in the course of pursuing its investment objectives through its investments in options contracts. A call option gives the purchaser of the option the right (but not the obligation) to buy, and obligates the writer to sell, the underlying financial instruments at the exercise price at any time during the option period, or at a specified date. Conversely, a put option gives the purchaser of the option the right (but not the obligation) to sell, and obligates the writer to buy the underlying financial instrument at the exercise price at any time during the option period, or at a specified date.
As a writer of call options, the fund receives a premium at the outset and then bears the market risk of unfavorable changes in the price of the financial instrument underlying the option. Generally, the fund realizes a gain, to the extent of the premium, if the price of the underlying financial instrument decreases between the date the option is written and the date on which the option is terminated. Generally, the fund incurs a loss if the price of the financial instrument increases between those dates.
As a writer of put options, the fund receives a premium at the outset and then bears the market risk of unfavorable changes in the price of the financial instrument underlying the option. Generally, the fund realizes a gain, to the extent of the premium, if the price of the underlying financial instrument increases between the date the option is written and the date on which the option is terminated. Generally, the fund incurs a loss if the price of the financial instrument decreases between those dates.
The Fund 45
NOTES TO FINANCIAL STATEMENTS (continued)
As a writer of an option, the fund has no control over whether the underlying financial instrument may be sold (call) or purchased (put) and as a result bears the market risk of an unfavorable change in the price of the financial instrument underlying the written option.There is a risk of loss from a change in value of such options which may exceed the related premiums received.This risk is mitigated by Master Agreements between the fund and the counterparty.The Statement of Operations reflects any unrealized gains or losses which occurred during the period as well as any realized gains or losses which occurred upon the expiration or closing of the option transaction. At October 31, 2014, there were no options written outstanding.
| | | | |
| | Face Amount | | Options Terminated |
| | Covered by | Premiums | | Net Realized |
| Options Written: | Contracts ($) | Received ($) | Cost ($) | Gain ($) |
| Contracts outstanding | | | | |
| October 31, 2013 | — | — | | |
| Contracts written | 116,850,000 | 1,881,309 | | |
| Contracts terminated: | | | | |
| Contracts closed | 116,850,000 | 1,881,309 | — | 1,881,309 |
| Contracts Outstanding | | | | |
| October 31, 2014 | — | — | | |
Forward Foreign Currency Exchange Contracts: The fund enters into forward contracts in order to hedge its exposure to changes in foreign currency exchange rates on its foreign portfolio holdings, to settle foreign currency transactions or as a part of its investment strat-egy.When executing forward contracts, the fund is obligated to buy or sell a foreign currency at a specified rate on a certain date in the future. With respect to sales of forward contracts, the fund incurs a loss if the value of the contract increases between the date the forward contract is opened and the date the forward contract is closed.The fund realizes a gain if the value of the contract decreases between those dates.With respect to purchases of forward contracts, the fund incurs a loss if the value of the contract decreases between the date the forward contract is opened and the date the forward contract is closed.The fund realizes a gain if the value of the contract increases between those dates. Any realized or unrealized gains or losses which occurred during the period are reflected in the Statement of Operations. The fund is
46
exposed to foreign currency risk as a result of changes in value of underlying financial instruments. The fund is also exposed to credit risk associated with counterparty nonperformance on these forward contracts, which is generally limited to the unrealized gain on each open contract. This risk is mitigated by Master Agreements between the fund and the counterparty. The following summarizes open forward contracts at October 31, 2014:
| | | | | | |
| | | Foreign | | | Unrealized | |
| Forward Foreign Currency Currency | | | Appreciation | |
| Exchange Contracts | | Amounts | Cost ($) | Value ($) (Depreciation) ($) | |
| Purchases: | | | | | | |
| British Pound, | | | | | | |
| Expiring | | | | | | |
| 11/28/2014 a | | 42,095,000 | 68,009,734 | 67,323,947 | (685,787 | ) |
| Canadian Dollar, | | | | | | |
| Expiring | | | | | | |
| 11/28/2014 b | | 58,255,000 | 52,256,441 | 51,652,547 | (603,894 | ) |
| Euro, | | | | | | |
| Expiring: | | | | | | |
| 11/03/2014 c | | 669,812 | 844,500 | 839,374 | (5,126 | ) |
| 11/28/2014 c | | 430,000 | 548,349 | 538,949 | (9,400 | ) |
| 11/28/2014 d | | 29,780,000 | 37,991,239 | 37,325,373 | (665,866 | ) |
| 12/22/2014 b | | 61,000,000 | 80,471,200 | 76,468,382 | (4,002,818 | ) |
| Indian Rupee, | | | | | | |
| Expiring: | | | | | | |
| 11/28/2014 d | | 4,135,260,000 | 67,199,025 | 66,952,217 | (246,808 | ) |
| 1/30/2015 e | | 1,042,000,000 | 16,747,476 | 16,639,844 | (107,632 | ) |
| Japanese Yen, | | | | | | |
| Expiring | | | | | | |
| 11/28/2014 b | | 8,157,175,000 | 75,595,894 | 72,636,413 | (2,959,481 | ) |
| Malaysian Ringgit, | | | | | | |
| Expiring | | | | | | |
| 11/28/2014 d | | 73,945,000 | 22,507,495 | 22,433,009 | (74,486 | ) |
| New Zealand Dollar, | | | | | | |
| Expiring | | | | | | |
| 11/05/2014 d | | 43,476,817 | 33,903,222 | 33,890,275 | (12,947 | ) |
| Norwegian Krone, | | | | | | |
| Expiring | | | | | | |
| 11/28/2014 b | | 472,020,000 | 70,599,552 | 69,913,830 | (685,722 | ) |
| Philippines Peso, | | | | | | |
| Expiring | | | | | | |
| 11/28/2014 c | | 730,000,000 | 16,278,292 | 16,251,758 | (26,534 | ) |
| Singapore Dollar, | | | | | | |
| Expiring | | | | | | |
| 11/28/2014 c | | 5,250,000 | 4,124,570 | 4,085,928 | (38,642 | ) |
The Fund 47
NOTES TO FINANCIAL STATEMENTS (continued)
| | | | | | |
| | | Foreign | | | Unrealized | |
| Forward Foreign Currency Currency | | | Appreciation | |
| Exchange Contracts | | Amounts | Cost ($) | Value ($) (Depreciation) ($) | |
| Purchases (continued): | | | | |
| Swedish Krona, | | | | | | |
| Expiring | | | | | | |
| 11/28/2014 b | | 89,835,000 | 12,224,861 | 12,166,617 | (58,244 | ) |
| Sales: | | | Proceeds ($) | | | |
| Australian Dollar, | | | | | | |
| Expiring | | | | | | |
| 11/28/2014 b | | 108,810,000 | 96,573,227 | 95,567,448 | 1,005,779 | |
| Brazilian Real, | | | | | | |
| Expiring | | | | | | |
| 12/02/2014 d | | 6,220,000 | 2,457,818 | 2,485,813 | (27,995 | ) |
| Euro, | | | | | | |
| Expiring: | | | | | | |
| 11/28/2014 b | | 2,300,000 | 2,907,030 | 2,882,752 | 24,278 | |
| 11/28/2014 f | | 151,725,000 | 193,617,790 | 190,167,635 | 3,450,155 | |
| Mexcian New Peso, | | | | | | |
| Expiring | | | | | | |
| 11/28/2014 e | | 775,970,000 | 57,460,106 | 57,523,694 | (63,588 | ) |
| New Zealand Dollar, | | | | | | |
| Expiring | | | | | | |
| 11/28/2014 d | | 93,135,000 | 73,057,746 | 72,402,464 | 655,282 | |
| Polish Zloty, | | | | | | |
| Expiring | | | | | | |
| 11/28/2014 c | | 135,430,000 | 40,640,989 | 40,144,836 | 496,153 | |
| South Korean Won, | | | | | | |
| Expiring: | | | | | | |
| 11/28/2014 c | | 9,827,820,000 | 9,143,221 | 9,185,338 | (42,117 | ) |
| 11/28/2014 d | | 4,782,020,000 | 4,535,867 | 4,469,401 | 66,466 | |
| Swedish Krona, | | | | | | |
| Expiring: | | | | | | |
| 11/28/2014 a | | 154,590,000 | 21,162,662 | 20,936,576 | 226,086 | |
| 11/28/2014 d | | 91,680,000 | 12,557,528 | 12,416,491 | 141,037 | |
| Swiss Franc, | | | | | | |
| Expiring | | | | | | |
| 11/28/2014 b | | 26,550,000 | 28,064,207 | 27,599,214 | 464,993 | |
| Gross Unrealized | | | | | | |
| Appreciation | | | | | 6,530,229 | |
| Gross Unrealized | | | | | | |
| Depreciation | | | | | (10,317,087 | ) |
Counterparties:
| |
| a | Credit Suisse |
| b | Goldman Sachs International |
| c | Barclays Bank |
| d | Citigroup |
| e | JP Morgan Chase Bank |
| f | Deutsche Bank |
48
Swap Transactions: The fund enters into swap agreements to exchange the interest rate on, or return generated by, one nominal instrument for the return generated by another nominal instrument. Swap agreements are privately negotiated in the OTC market or centrally cleared. The fund enters into these agreements to hedge certain market or interest rate risks, to manage the interest rate sensitivity (sometimes called duration) of fixed income securities, to provide a substitute for purchasing or selling particular securities or to increase potential returns.
For OTC swaps, the fund accrues for the interim payments on a daily basis, with the net amount recorded within unrealized appreciation (depreciation) on swap agreements in the Statement of Assets and Liabilities. Once the interim payments are settled in cash, the net amount is recorded as a realized gain (loss) on swaps, in addition to realized gain (loss) recorded upon the termination of swap transactions in the Statement of Operations. Upfront payments made and/or received by the fund, are recorded as an asset and/or liability in the Statement of Assets and Liabilities and are recorded as a realized gain or loss ratably over the agreement’s term/event with the exception of forward starting interest rate swaps which are recorded as realized gains or losses on the termination date.
Upon entering into centrally cleared swap agreements, an initial margin deposit is required with a counterparty, which consists of cash or cash equivalents. The amount of these deposits is determined by the exchange on which the agreement is traded and is subject to change. The change in valuation of centrally cleared swaps is recorded as a receivable or payable for variation margin in the Statement of Assets and Liabilities. Payments received from (paid to) the counterparty, including upon termination, are recorded as realized gain (loss) in the Statement of Operations.
Fluctuations in the value of swap agreements are recorded for financial statement purposes as unrealized appreciation or depreciation on swap transactions.
The Fund 49
NOTES TO FINANCIAL STATEMENTS (continued)
Interest Rate Swaps: Interest rate swaps involve the exchange of commitments to pay and receive interest based on a notional principal amount.The fund may elect to pay a fixed rate and receive a floating rate, or receive a fixed rate and pay a floating rate on a notional principal amount. The net interest received or paid on interest rate swap agreements is included within realized gain (loss) on swap transactions in the Statement of Operations. Interest rate swap agreements are subject to general market risk, liquidity risk, counterparty risk and interest rate risk.
For OTC swaps, the fund’s maximum risk of loss from counterparty risk is the discounted value of the cash flows to be received from the counterparty over the agreement’s remaining life, to the extent that the amount is positive. This risk is mitigated by Master Agreements between the fund and the counterparty and the posting of collateral by the counterparty to the fund to cover the fund’s exposure to the coun-terparty.There is minimal counterparty risk to the fund with centrally cleared swaps since they are exchange traded and the exchange guarantees these swap against default.The following summarizes open interest rate swaps entered into by the fund at October 31, 2014:
| | | | | | | |
| OTC—Interest Rate Swaps | | | | | | |
| | | | | | | Unrealized | |
| Notional | Currency/ | | (Pay) Receive | | | Appreciation | |
| Amount ($) | Floating Rate | Counterparties | Fixed Rate (%) | | Expiration | (Depreciation) ($) | |
| |
| 42,200,000 | EUR—6 Month | J.P. Morgan | | | | | |
| | Libor | Chase Bank | 1.91 | | 11/4/2016 | 2,670,690 | |
| 366,600,000 | MXN—28 Day | J.P. Morgan | | | | | |
| | Libor | Chase Bank | 6.74 | | 1/2/2024 | 1,432,516 | |
| 29,400,000 | USD—3 Month | Citigroup | (0.84 | ) | 11/8/2017 | 160,365 | |
| | Libor | | | | | | |
| 41,100,324 | BRL—1 Year | Goldman | | | | | |
| | Libor | Sachs | | | | | |
| | | International | 11.99 | | 1/2/2017 | (54,295 | ) |
| 946,400,000 | MXN—28 Day | J.P. Morgan | | | | | |
| | Libor | Chase Bank | (4.74 | ) | 1/10/2017 | (1,097,340 | ) |
| 86,400,000 | USD—3 Month | J.P. Morgan | | | | | |
| | Libor | Chase Bank | (2.32 | ) | 6/4/2023 | (694,353 | ) |
| Unrealized Gross | | | | | | | |
| Appreciation | | | | | | 4,263,571 | |
| Unrealized Gross | | | | | | | |
| Depreciation | | | | | | (1,845,988 | ) |
50
| | | | | | |
| Centrally Cleared Interest Rate Swaps | | | |
| |
| Notional | | Currency/ (Pay) Receive | Clearing | Unrealized | |
| Amount ($) | | Floating Rate | Fixed Rate (%) Expiration | House | (Depreciation) ($) | |
| |
| | | USD— | | Chicago | | |
| | | 3 Month | | Mercantile | | |
| 158,500,000 | a | Libor | (1.83) 1/10/2019 | Exchange | (2,763,766 | ) |
| | | USD— | | Chicago | | |
| | | 3 Month | | Mercantile | | |
| 137,700,000 | b | Libor | (2.48) 1/10/2021 | Exchange | (4,956,016 | ) |
| | | USD— | | Chicago | | |
| | | 3 Month | | Mercantile | | |
| 174,170,000 | c | Libor | (0.66) 7/21/2016 | Exchange | (543,217 | ) |
| Unrealized Gross | | | | |
| Depreciation | | | (8,262,999 | ) |
Counterparties:
| |
| a | Citigroup |
| b | Deutsche Bank |
| c | Goldman Sach International |
Credit Default Swaps: Credit default swaps involve commitments to pay a fixed interest rate in exchange for payment if a credit event affecting a third party (the referenced obligation or index) occurs. Credit events may include a failure to pay interest or principal, bankruptcy, or restructuring. The fund enters into these agreements to manage its exposure to the market or certain sectors of the market, to reduce its risk exposure to defaults of corporate and sovereign issuers, or to create exposure to corporate or sovereign issuers to which it is not otherwise exposed. For those credit default swaps in which the fund is paying a fixed rate, the fund is buying credit protection on the instrument. In the event of a credit event, the fund would receive the full notional amount for the reference obligation. For those credit default swaps in which the fund is receiving a fixed rate, the fund is selling credit protection on the underlying instrument.The maximum payouts for these agreements are limited to the notional amount of each swap. Credit default swaps may involve greater risks than if the fund had invested in the reference obligation directly and are subject to general market risk, liquidity risk, counterparty risk and credit risk. This risk is mitigated by Master Agreements between the fund and the
The Fund 51
NOTES TO FINANCIAL STATEMENTS (continued)
counterparty and the posting of collateral, if any, by the counterparty to the fund to cover the fund’s exposure to the counterparty.
The maximum potential amount of future payments (undiscounted) that a fund as a seller of protection could be required to make under a credit default swap agreement would be an amount equal to the notional amount of the agreement which may exceed the amount of unrealized appreciation or depreciation reflected in the Statement of Assets and Liabilities. Notional amounts of all credit default swap agreements are disclosed in the following chart, which summarizes open credit default swaps on index issues entered into by the fund. These potential amounts would be partially offset by any recovery values of the respective referenced obligations, underlying securities comprising the referenced index, upfront payments received upon entering into the agreement, or net amounts received from the settlement of buy protection credit default swap agreements entered into by the fund for the same referenced entity or entities. The following summarizes open credit default swaps entered into by the fund at October 31, 2014:
| | | | | | |
| OTC—Credit Default Swaps | | | | | |
| |
| | | (Pay) | | | Upfront | |
| | | Receive | Implied | | Premiums | |
| Reference | Notional | Fixed | Credit | Market | Received | Unrealized |
| Obligation ($) | Amount ($)2 | Rate (%) | Spread (%)3 | Value ($) | (Paid) ($) | Appreciation ($ |
| Purchase Contracts:1 | | | | | |
| Dow Jones | | | | | | |
| CDX.NA.HY.22 | | | | | | |
| Index | | | | | | |
| 12/20/2019† | 16,860,000a | 5.00 | 342.87 | 1,273,705 | (999,082) | 274,623 |
| |
| † | Expiration Date |
| Counterparties: |
| a | JP Morgan Chase Bank |
| 1 | If the fund is a buyer of protection and a credit event occurs, as defined under the terms of the |
| | swap agreement, the fund will either (i) receive from the seller of protection an amount equal to the |
| | notional amount of the swap and deliver the reference obligation or (ii) receive a net settlement |
| | amount in the form of cash or securities equal to the notional amount of the swap less the recovery |
| | value of the reference obligation. |
| 2 | The maximum potential amount the fund could be required to pay as a seller of credit protection |
| | or receive as a buyer of credit protection if a credit event occurs as defined under the terms of the |
| | swap agreement. |
| 3 | Implied credit spreads, represented in absolute terms, utilized in determining the market value as of |
| | the period end serve as an indicator of the current status of the payment/performance risk and |
| | represent the likelihood of risk of default for the credit derivative.The credit spread of a particular |
| | referenced entity reflects the cost of buying/selling protection and may include upfront payments |
| | required to be made to enter into the agreement.Wider credit spreads represent a deterioration of the |
| | referenced entity's credit soundness and a greater likelihood of risk of default or other credit event |
| | occurring as defined under the terms of the agreement.A credit spread identified as “Defaulted” |
| | indicates a credit event has occurred for the referenced entity. Credit spreads are unaudited. |
52
GAAP requires disclosure for (i) the nature and terms of the credit derivative, reasons for entering into the credit derivative, the events or circumstances that would require the seller to perform under the credit derivative, and the current status of the payment/performance risk of the credit derivative, (ii) the maximum potential amount of future payments (undiscounted) the seller could be required to make under the credit derivative, (iii) the fair value of the credit derivative, and (iv) the nature of any recourse provisions and assets held either as collateral or by third parties. All required disclosures have been made and are incorporated within the current period as part of the Notes to the Statement of Investments and disclosures within this Note.
The following tables show the fund’s exposure to different types of market risk as it relates to the Statement of Assets and Liabilities and the Statement of Operations, respectively.
Fair value of derivative instruments as of October 31, 2014 is shown below:
| | | | |
| | Derivative | | Derivative | |
| | Assets ($) | | Liabilities ($) | |
| Interest rate risk1,2 | 9,231,060 | Interest rate risk1,2 | (10,852,203 | ) |
| Foreign exchange risk3,4 | 20,101,289 | Foreign exchange risk5 | (10,317,087 | ) |
| Credit risk2 | 274,623 | Credit risk | — | |
| Gross fair value of | | | | |
| derivatives contracts | 29,606,972 | | (21,169,290 | ) |
Statement of Assets and Liabilities location:
| |
| 1 | Includes cumulative appreciation (depreciation) on financial futures as reported in the Statement of |
| | Financial Futures, but only the unpaid variation margin is reported in the Statement of Assets |
| | and Liabilities. |
| 2 | Includes cumulative appreciation (depreciation) on swap agreements as reported in the swap |
| | tables in Note 4. Unrealized appreciation (depreciation) on OTC swap agreements and only |
| | unpaid variation margin on cleared swap agreements, are reported in the Statement of Assets |
| | and Liabilities. |
| 3 | Options purchased are included in Investments in securities—Unaffiliated issuers, at value. |
| 4 | Unrealized appreciation on forward foreign currency exchange contracts. |
| 5 | Unrealized depreciation on forward foreign currency exchange contracts. |
The Fund 53
NOTES TO FINANCIAL STATEMENTS (continued)
The effect of derivative instruments in the Statement of Operations during the period ended October 31, 2014 is shown below:
Amount of realized gain (loss) on derivatives recognized in income ($)
| | | | | | | | |
| | Financial | Options | | Forward | Swap | | | |
| Underlying risk | Futures6 | Transactions7 | | Contracts8 | Transactions9 | | Total | |
| Interest rate | 7,779,021 | (1,383,885 | ) | — | 4,505,603 | | 10,900,739 | |
| Foreign | | | | | | | | |
| exchange | — | 12,019,670 | | 3,317,235 | — | | 15,336,905 | |
| Credit | — | — | | — | (1,408,701 | ) | (1,408,701 | ) |
| Total | 7,779,021 | 10,635,785 | | 3,317,235 | 3,096,902 | | 24,828,943 | |
Change in unrealized appreciation (depreciation) on derivatives recognized in income ($)
| | | | | | | |
| | Financial | Options | Forward | Swap | | | |
| Underlying risk | Futures10 | Transactions11 | Contracts12 | Transactions13 | | Total | |
| Interest rate | 433,016 | 394,557 | — | (14,593,051) | | (13,765,478) | |
| Foreign | | | | | | | |
| exchange | — | 10,778,819 | 593,343 | — | | 11,372,162 | |
| Credit | — | — | — | 685,872 | | 685,872 | |
| Total | 433,016 | 11,173,376 | 593,343 | (13,907,179 | ) | (1,707,444 | ) |
Statement of Operations location:
| |
| 6 | Net realized gain (loss) on financial futures. |
| 7 | Net realized gain (loss) on options transactions. |
| 8 | Net realized gain (loss) on forward foreign currency exchange contracts. |
| 9 | Net realized gain (loss) on swap transactions. |
| 10 Net unrealized appreciation (depreciation) on financial futures. |
| 11 Net unrealized appreciation (depreciation) on options transactions. |
| 12 Net unrealized appreciation (depreciation) on forward foreign currency exchange contracts. |
| 13 Net unrealized appreciation (depreciation) on swap transactions. |
The provisions of ASC Topic 210 “Disclosures about Offsetting Assets and Liabilities” require disclosure on the offsetting of financial assets and liabilities. These disclosures are required for certain investments, including derivative financial instruments subject to Master Agreements which are eligible for offsetting in the Statement of Assets and Liabilities and require the fund to disclose both gross and net information with respect to such investments. For financial reporting
54
purposes, the fund does not offset derivative assets and derivative liabilities that are subject to Master Agreements in the Statement of Assets and Liabilities.
At October 31, 2014, derivative assets and liabilities (by type) on a gross basis are as follows:
| | | | |
| Derivative Financial Instruments: | Assets ($) | | Liabilities ($) | |
| Financial futures | 4,967,489 | | (743,216 | ) |
| Options | 13,571,060 | | — | |
| Forward contracts | 6,530,229 | | (10,317,087 | ) |
| Swaps | 4,538,194 | | (10,108,987 | ) |
| Total gross amount of derivative | | | | |
| assets and liabilities in the | | | | |
| Statement of Assets and Liabilities | 29,606,972 | | (21,169,290 | ) |
| Derivatives not subject | | | | |
| to Master Agreements | (5,193,575 | ) | 9,692,002 | |
| Total gross amount of assets and | | | | |
| liabilities subject to | | | | |
| Master Agreements | 24,413,397 | | (11,477,288 | ) |
The following tables present derivative assets and liabilities net of amounts available for offsetting under Master Agreements and net of related collateral received or pledged, if any, as of October 31, 2014:†
| | | | | | |
| | | Financial | | | | |
| | | Instruments | | | | |
| | | and | | | | |
| | | Derivatives | | | | |
| | Gross Amount of | Available | | Collateral | | Net Amount of |
| Counterparties | Assets ($)1 | for Offset ($) | | Received ($)2 | | Assets ($) |
| Barclays Bank | 1,642,490 | (121,819 | ) | (1,520,671 | ) | — |
| Citigroup | 3,704,111 | (1,028,102 | ) | (1,299,000 | ) | 1,377,009 |
| Deutsche Bank | 6,725,982 | — | | (900,000 | ) | 5,825,982 |
| Goldman Sachs | | | | | | |
| International | 4,994,214 | (4,994,214 | ) | — | | — |
| JP Morgan Chase Bank | 4,377,829 | (1,962,913 | ) | (522,000 | ) | 1,892,916 |
| Morgan Stanley | 2,968,771 | — | | (2,700,000 | ) | 268,771 |
| Total | 24,413,397 | (8,107,048 | ) | (6,941,671 | ) | 9,364,678 |
The Fund 55
NOTES TO FINANCIAL STATEMENTS (continued)
| | | | | | |
| | | | Financial | | | |
| | | | Instruments | | | |
| | | | and | | | |
| | | | Derivatives | | | |
| | Gross Amount of | | Available | Collateral | Net Amount of | |
| Counterparties | Liabilities ($)1 | | for Offset ($) | Pledged ($)2 | Liabilities ($) | |
| Barclays Bank | (121,819 | ) | 121,819 | — | — | |
| Citigroup | (1,028,102 | ) | 1,028,102 | — | — | |
| Goldman Sachs | | | | | | |
| International | (8,364,454 | ) | 4,994,214 | 470,000 | (2,900,240 | ) |
| JP Morgan Chase Bank | (1,962,913 | ) | 1,962,913 | — | — | |
| Total | (11,477,288 | ) | 8,107,048 | 470,000 | (2,900,240 | ) |
| |
| 1 | Absent a default event or early termination, OTC derivative assets and liabilities are presented at |
| | gross amounts and are not offset in the Statement of Assets and Liabilities. |
| 2 | In some instances, the actual collateral received and/or pledge may be more than the amount |
| | shown due to over collateralization. |
| † | See Statement of Investments for detailed information regarding collateral held for open financial |
| | futures contracts. |
The following summarizes the average market value of derivatives outstanding during the period ended October 31, 2014:
| |
| | Average Market Value ($) |
| Interest rate financial futures | 384,861,865 |
| Interest rate options contracts | 287,672 |
| Foreign currency options contracts | 4,939,764 |
| Forward contracts | 1,029,095,362 |
The following summarizes the average notional value of swap agreements outstanding during the period ended October 31, 2014:
| |
| | Average Notional Value ($) |
| Interest rate swap agreements | 947,509,334 |
| Credit default swap agreements | 46,250,769 |
At October 31, 2014, the cost of investments for federal income tax purposes was $1,741,369,604; accordingly, accumulated net unrealized depreciation on investments was $17,778,527, consisting of $23,270,860 gross unrealized appreciation and $41,049,387 gross unrealized depreciation.
56
|
| REPORT OF INDEPENDENT REGISTERED |
| PUBLIC ACCOUNTING FIRM |
The Board of Trustees and Shareholders of The Dreyfus/Laurel Funds Trust
We have audited the accompanying statement of assets and liabilities of Dreyfus International Bond Fund (the “Fund”), a series of The Dreyfus/Laurel Funds Trust, including the statements of investments and financial futures, as of October 31, 2014, the related statement of operations for the year then ended, the statements of changes in net assets for each of the years in the two-year period then ended, and the financial highlights for each of the years or period in the five-year period then ended.These financial statements and financial highlights are the responsibility of the Fund’s management. Our responsibility is to express an opinion on these financial statements and financial highlights based on our audits.
We conducted our audits in accordance with the standards of the Public Company Accounting Oversight Board (United States).Those standards require that we plan and perform the audit to obtain reasonable assurance about whether the financial statements and financial highlights are free of material misstatement. An audit includes examining, on a test basis, evidence supporting the amounts and disclosures in the financial statements. Our procedures included confirmation of securities owned as of October 31, 2014, by correspondence with the custodian and brokers or by other appropriate auditing procedures. An audit also includes assessing the accounting principles used and significant estimates made by management, as well as evaluating the overall financial statement presentation.We believe that our audits provide a reasonable basis for our opinion.
In our opinion, the financial statements and financial highlights referred to above present fairly, in all material respects, the financial position of Dreyfus International Bond Fund as of October 31, 2014, the results of its operations for the year then ended, the changes in its net assets for each of the years in the two-year period then ended, and the financial highlights for each of the years or period in the five-year period then ended, in conformity with U.S. generally accepted accounting principles.

New York, New York
December 30, 2014
The Fund 57
IMPORTANT TAX INFORMATION (Unaudited)
For federal tax purposes, the fund designates the maximum amount allowable but not less than 24.75% as interest-related dividends in accordance with Sections 871(k)(1) and 881(e) of the Internal Revenue Code.
58
|
| BOARD MEMBERS INFORMATION (Unaudited) |
| INDEPENDENT BOARD MEMBERS |
|
| Joseph S. DiMartino (71) |
| Chairman of the Board (1999) |
| Principal Occupation During Past 5Years: |
| • Corporate Director and Trustee (1995-present) |
| Other Public Company Board Memberships During Past 5Years: |
| • CBIZ (formerly, Century Business Services, Inc.), a provider of outsourcing functions for small |
| and medium size companies, Director (1997-present) |
| • The Newark Group, a provider of a national market of paper recovery facilities, paperboard |
| mills and paperboard converting plants, Director (2000-2010) |
| • Sunair Services Corporation, a provider of certain outdoor-related services to homes and |
| businesses, Director (2005-2009) |
| No. of Portfolios for which Board Member Serves: 144 |
| ——————— |
| Francine J. Bovich (63) |
| Board Member (2012) |
| Principal Occupation During Past 5Years: |
| • Trustee,The Bradley Trusts, private trust funds (2011-present) |
| • Managing Director, Morgan Stanley Investment Management (1993-2010) |
| Other Public Company Board Membership During Past 5Years: |
| • Annaly Capital Management, Inc., Board Member (May 2014-present) |
| No. of Portfolios for which Board Member Serves: 45 |
| ——————— |
| Kenneth A. Himmel (68) |
| Board Member (1988) |
| Principal Occupation During Past 5Years: |
| • President and CEO, Related Urban Development, a real estate development company (1996-present) |
| • President and CEO, Himmel & Company, a real estate development company (1980-present) |
| • CEO,American Food Management, a restaurant company (1983-present) |
| No. of Portfolios for which Board Member Serves: 31 |
The Fund 59
|
| BOARD MEMBERS INFORMATION (Unaudited) (continued) |
| INDEPENDENT BOARD MEMBERS (continued) |
|
| Stephen J. Lockwood (67) |
| Board Member (1993) |
| Principal Occupation During Past 5Years: |
| • Chairman of the Board, Stephen J. Lockwood and Company LLC, a real estate investment |
| company (2000-present) |
| No. of Portfolios for which Board Member Serves: 31 |
| ——————— |
| Roslyn M. Watson (65) |
| Board Member (1992) |
| Principal Occupation During Past 5Years: |
| • Principal,Watson Ventures, Inc., a real estate investment company (1993-present) |
| No. of Portfolios for which Board Member Serves: 69 |
| ——————— |
| Benaree Pratt Wiley (68) |
| Board Member (1998) |
| Principal Occupation During Past 5Years: |
| • Principal,TheWiley Group, a firm specializing in strategy and business development (2005-present) |
| Other Public Company Board Membership During Past 5Years: |
| • CBIZ (formerly, Century Business Services, Inc.), a provider of outsourcing functions for small |
| and medium size companies, Director (2008-present) |
| No. of Portfolios for which Board Member Serves: 69 |
| ——————— |
| Once elected all Board Members serve for an indefinite term, but achieve Emeritus status upon reaching age 80.The |
| address of the Board Members and Officers is c/o The Dreyfus Corporation, 200 Park Avenue, NewYork, NewYork |
| 10166.Additional information about the Board Members is available in the fund’s Statement of Additional Information |
| which can be obtained from Dreyfus free of charge by calling this toll free number: 1-800-DREYFUS. |
| James M. Fitzgibbons, Emeritus Board Member |
| J.Tomlinson Fort, Emeritus Board Member |
60
OFFICERS OF THE FUND (Unaudited)
BRADLEY J. SKAPYAK, President since January 2010.
Chief Operating Officer and a director of the Manager since June 2009, Chairman of Dreyfus Transfer, Inc., an affiliate of the Manager and the transfer agent of the funds, since May 2011 and Executive Vice President of the Distributor since June 2007. From April 2003 to June 2009, Mr. Skapyak was the head of the Investment Accounting and Support Department of the Manager. He is an officer of 69 investment companies (comprised of 144 portfolios) managed by the Manager. He is 55 years old and has been an employee of the Manager since February 1988.
JOHN PAK, Chief Legal Officer since March 2013.
Deputy General Counsel, Investment Management, of BNY Mellon since August 2014; Chief Legal Officer of the Manager since August 2012; from March 2005 to July 2012, Managing Director of Deutsche Bank, Deputy Global Head of Deutsche Asset Management Legal and Regional Head of Deutsche Asset Management Americas Legal. He is an officer of 70 investment companies (comprised of 169 portfolios) managed by the Manager. He is 46 years old and has been an employee of the Manager since August 2012.
JANETTE E. FARRAGHER, Vice President and Secretary since December 2011.
Assistant General Counsel of BNY Mellon, and an officer of 70 investment companies (comprised of 169 portfolios) managed by the Manager. She is 51 years old and has been an employee of the Manager since February 1984.
KIESHA ASTWOOD, Vice President and Assistant Secretary since January 2010.
Counsel of BNY Mellon, and an officer of 70 investment companies (comprised of 169 portfolios) managed by the Manager. She is 41 years old and has been an employee of the Manager since July 1995.
JAMES BITETTO, Vice President and Assistant Secretary since August 2005.
Managing Counsel of BNY Mellon and Secretary of the Manager, and an officer of 70 investment companies (comprised of 169 portfolios) managed by the Manager. He is 48 years old and has been an employee of the Manager since December 1996.
JONI LACKS CHARATAN, Vice President and Assistant Secretary since August 2005.
Managing Counsel of BNY Mellon, and an officer of 70 investment companies (comprised of 169 portfolios) managed by the Manager. She is 58 years old and has been an employee of the Manager since October 1988.
JOSEPH M. CHIOFFI, Vice President and Assistant Secretary since August 2005.
Managing Counsel of BNY Mellon, and an officer of 70 investment companies (comprised of 169 portfolios) managed by the Manager. He is 52 years old and has been an employee of the Manager since June 2000.
JOHN B. HAMMALIAN, Vice President and Assistant Secretary since August 2005.
Senior Managing Counsel of BNY Mellon, and an officer of 70 investment companies (comprised of 169 portfolios) managed by the Manager. He is 51 years old and has been an employee of the Manager since February 1991.
SARAH S. KELLEHER, Vice President and Assistant Secretary since April 2014.
Senior Counsel of BNY Mellon, and an officer of 70 investment companies (comprised of 169 portfolios) managed by the Manager; from August 2005 to March 2013, Associate General Counsel of Third Avenue Management. She is 38 years old and has been an employee of the Manager since March 2013.
The Fund 61
OFFICERS OF THE FUND (Unaudited) (continued)
JEFF PRUSNOFSKY, Vice President and Assistant Secretary since August 2005.
Senior Managing Counsel of BNY Mellon, and an officer of 70 investment companies (comprised of 169 portfolios) managed by the Manager. He is 49 years old and has been an employee of the Manager since October 1990.
JAMES WINDELS, Treasurer since November 2001.
Director – Mutual Fund Accounting of the Manager, and an officer of 70 investment companies (comprised of 169 portfolios) managed by the Manager. He is 56 years old and has been an employee of the Manager since April 1985.
RICHARD CASSARO, Assistant Treasurer since January 2008.
Senior Accounting Manager – Money Market and Municipal Bond Funds of the Manager, and an officer of 70 investment companies (comprised of 169 portfolios) managed by the Manager. He is 55 years old and has been an employee of the Manager since September 1982.
GAVIN C. REILLY, Assistant Treasurer since December 2005.
Tax Manager of the Investment Accounting and Support Department of the Manager, and an officer of 70 investment companies (comprised of 169 portfolios) managed by the Manager. He is 46 years old and has been an employee of the Manager since April 1991.
ROBERT S. ROBOL, Assistant Treasurer since December 2002.
Senior Accounting Manager – Fixed Income Funds of the Manager, and an officer of 70 investment companies (comprised of 169 portfolios) managed by the Manager. He is 50 years old and has been an employee of the Manager since October 1988.
ROBERT SALVIOLO, Assistant Treasurer since July 2007.
Senior Accounting Manager – Equity Funds of the Manager, and an officer of 70 investment companies (comprised of 169 portfolios) managed by the Manager. He is 47 years old and has been an employee of the Manager since June 1989.
ROBERT SVAGNA, Assistant Treasurer since December 2002.
Senior Accounting Manager – Equity Funds of the Manager, and an officer of 70 investment companies (comprised of 169 portfolios) managed by the Manager. He is 47 years old and has been an employee of the Manager since November 1990.
JOSEPH W. CONNOLLY, Chief Compliance Officer since October 2004.
Chief Compliance Officer of the Manager and The Dreyfus Family of Funds (70 investment companies, comprised of 169 portfolios). He is 57 years old and has served in various capacities with the Manager since 1980, including manager of the firm’s Fund Accounting Department from 1997 through October 2001.
MATTHEW D. CONNOLLY, Anti-Money Laundering Compliance Officer since April 2012.
Anti-Money Laundering Compliance Officer of the Distributor since October 2011; from March 2010 to September 2011, Global Head, KYC Reviews and Director of UBS Investment Bank; until March 2010, AML Compliance Officer and Senior Vice President of Citi Global Wealth Management. He is an officer of 65 investment companies (comprised of 164 portfolios) managed by the Manager. He is 42 years old and has been an employee of the Distributor since October 2011.
62
For More Information
Telephone Call your financial representative or 1-800-DREYFUS
Mail The Dreyfus Family of Funds, 144 Glenn Curtiss Boulevard, Uniondale, NY 11556-0144
The fund files its complete schedule of portfolio holdings with the Securities and Exchange Commission (“SEC”) for the first and third quarters of each fiscal year on Form N-Q. The fund’s Forms N-Q are available on the SEC’s website at http://www.sec.gov and may be reviewed and copied at the SEC’s Public Reference Room in Washington, DC. Information on the operation of the Public Reference Room may be obtained by calling 1-800-SEC-0330.
A description of the policies and procedures that the fund uses to determine how to vote proxies relating to portfolio securities, and information regarding how the fund voted these proxies for the most recent 12-month period ended June 30 is available at http://www.dreyfus.com and on the SEC’s website at http://www.sec.gov. The description of the policies and procedures is also available without charge, upon request, by calling 1-800-DREYFUS.

Item 2. Code of Ethics.
The Registrant has adopted a code of ethics that applies to the Registrant's principal executive officer, principal financial officer, principal accounting officer or controller, or persons performing similar functions. There have been no amendments to, or waivers in connection with, the Code of Ethics during the period covered by this Report.
Item 3. Audit Committee Financial Expert.
The Registrant's Board has determined that Joseph S. DiMartino a member of the Audit Committee of the Board, is an audit committee financial expert as defined by the Securities and Exchange Commission (the "SEC"). Mr. DiMartino is "independent" as defined by the SEC for purposes of audit committee financial expert determinations.
Item 4. Principal Accountant Fees and Services.
(a) Audit Fees. The aggregate fees billed for each of the last two fiscal years (the "Reporting Periods") for professional services rendered by the Registrant's principal accountant (the "Auditor") for the audit of the Registrant's annual financial statements or services that are normally provided by the Auditor in connection with the statutory and regulatory filings or engagements for the Reporting Periods, were $71,240 in 2013 and $72,620 in 2014.
(b) Audit-Related Fees. The aggregate fees billed in the Reporting Periods for assurance and related services by the Auditor that are reasonably related to the performance of the audit of the Registrant's financial statements and are not reported under paragraph (a) of this Item 4 were $8,980 in 2013 and $9,330 in 2014. These services consisted of one or more of the following: (i) agreed upon procedures related to compliance with Internal Revenue Code section 817(h), (ii) security counts required by Rule 17f-2 under the Investment Company Act of 1940, as amended, (iii) advisory services as to the accounting or disclosure treatment of Registrant transactions or events and (iv) advisory services to the accounting or disclosure treatment of the actual or potential impact to the Registrant of final or proposed rules, standards or interpretations by the Securities and Exchange Commission, the Financial Accounting Standards Boards or other regulatory or standard-setting bodies.
The aggregate fees billed in the Reporting Periods for non-audit assurance and related services by the Auditor to the Registrant's investment adviser (not including any sub-investment adviser whose role is primarily portfolio management and is subcontracted with or overseen by another investment adviser), and any entity controlling, controlled by or under common control with the investment adviser that provides ongoing services to the Registrant ("Service Affiliates"), that were reasonably related to the performance of the annual audit of the Service Affiliate, which required pre-approval by the Audit Committee were $0 in 2013 and $0 in 2014.
(c) Tax Fees. The aggregate fees billed in the Reporting Periods for professional services rendered by the Auditor for tax compliance, tax advice, and tax planning ("Tax Services") were $4,720 in 2013 and $4,820 in 2014. These services consisted of the review or preparation of U.S. federal, state, local and excise tax returns. The aggregate fees billed in the Reporting Periods for Tax Services by the Auditor to Service Affiliates, which required pre-approval by the Audit Committee were $0 in 2013 and $0 in 2014.
(d) All Other Fees. The aggregate fees billed in the Reporting Periods for products and services provided by the Auditor, other than the services reported in paragraphs (a) through (c) of this Item, were $0 in 2013 and $0 in 2014.
The aggregate fees billed in the Reporting Periods for Non-Audit Services by the Auditor to Service Affiliates, other than the services reported in paragraphs (b) through (c) of this Item, which required pre-approval by the Audit Committee, were $0 in 2013 and $0 in 2014.
(e)(1) Audit Committee Pre-Approval Policies and Procedures. The Registrant's Audit Committee has established policies and procedures (the "Policy") for pre-approval (within specified fee limits) of the Auditor's engagements for non-audit services to the Registrant and Service Affiliates without specific case-by-case consideration. The pre-approved services in the Policy can include pre-approved audit services, pre-approved audit-related services, pre-approved tax services and pre-approved all other services. Pre-approval considerations include whether the proposed services are compatible with maintaining the Auditor's independence. Pre-approvals pursuant to the Policy are considered annually.
(e)(2) Note: None of the services described in paragraphs (b) through (d) of this Item 4 were approved by the Audit Committee pursuant to paragraph (c)(7)(i)(C) of Rule 2-01 of Regulation S-X.
(f) None of the hours expended on the principal accountant's engagement to audit the registrant's financial statements for the most recent fiscal year were attributed to work performed by persons other than the principal account's full-time, permanent employees.
Non-Audit Fees. The aggregate non-audit fees billed by the Auditor for services rendered to the Registrant, and rendered to Service Affiliates, for the Reporting Periods were $13,945,381 in 2013 and $15,598,229 in 2014.
Auditor Independence. The Registrant's Audit Committee has considered whether the provision of non-audit services that were rendered to Service Affiliates, which were not pre-approved (not requiring pre-approval), is compatible with maintaining the Auditor's independence.
Item 5. Audit Committee of Listed Registrants.
Not applicable.
Item 6. Investments.
(a) Not applicable.
Item 7. Disclosure of Proxy Voting Policies and Procedures for Closed-End Management Investment Companies.
Not applicable.
Item 8. Portfolio Managers of Closed-End Management Investment Companies.
Not applicable.
Item 9. Purchases of Equity Securities by Closed-End Management Investment Companies and Affiliated Purchasers.
Not applicable.
Item 10. Submission of Matters to a Vote of Security Holders.
There have been no material changes to the procedures applicable to Item 10.
Item 11. Controls and Procedures.
(a) The Registrant's principal executive and principal financial officers have concluded, based on their evaluation of the Registrant's disclosure controls and procedures as of a date within 90 days of the filing date of this report, that the Registrant's disclosure controls and procedures are reasonably designed to ensure that information required to be disclosed by the Registrant on Form N-CSR is recorded, processed, summarized and reported within the required time periods and that information required to be disclosed by the Registrant in the reports that it files or submits on Form N-CSR is accumulated and communicated to the Registrant's management, including its principal executive and principal financial officers, as appropriate to allow timely decisions regarding required disclosure.
(b) There were no changes to the Registrant's internal control over financial reporting that occurred during the second fiscal quarter of the period covered by this report that have materially affected, or are reasonably likely to materially affect, the Registrant's internal control over financial reporting.
Item 12. Exhibits.
(a)(1) Code of ethics referred to in Item 2.
(a)(2) Certifications of principal executive and principal financial officers as required by Rule 30a-2(a) under the Investment Company Act of 1940.
(a)(3) Not applicable.
(b) Certification of principal executive and principal financial officers as required by Rule 30a-2(b) under the Investment Company Act of 1940.
SIGNATURES
Pursuant to the requirements of the Securities Exchange Act of 1934 and the Investment Company Act of 1940, the Registrant has duly caused this Report to be signed on its behalf by the undersigned, thereunto duly authorized.
The Dreyfus/Laurel Funds Trust
By: /s/Bradley J. Skapyak
Bradley J. Skapyak,
President
Date: December 18, 2014
Pursuant to the requirements of the Securities Exchange Act of 1934 and the Investment Company Act of 1940, this Report has been signed below by the following persons on behalf of the Registrant and in the capacities and on the dates indicated.
By: /s/Bradley J. Skapyak
Bradley J. Skapyak,
President
Date: December 18, 2014
By: /s/James Windels
James Windels,
Treasurer
Date: December 18, 2014
EXHIBIT INDEX
(a)(1) Code of ethics referred to in Item 2.
(a)(2) Certifications of principal executive and principal financial officers as required by Rule 30a-2(a) under the Investment Company Act of 1940. (EX-99.CERT)
(b) Certification of principal executive and principal financial officers as required by Rule 30a-2(b) under the Investment Company Act of 1940. (EX-99.906CERT)