UNITED STATES
SECURITIES AND EXCHANGE COMMISSION
Washington, D.C. 20549
FORM N-CSR
CERTIFIED SHAREHOLDER REPORT OF REGISTERED MANAGEMENT
INVESTMENT COMPANIES
Investment Company Act file number | 811- 00524 |
| |
| The Dreyfus/Laurel Funds Trust | |
| (Exact name of Registrant as specified in charter) | |
| | |
| c/o The Dreyfus Corporation 200 Park Avenue New York, New York 10166 | |
| (Address of principal executive offices) (Zip code) | |
| | |
| John Pak, Esq. 200 Park Avenue New York, New York 10166 | |
| (Name and address of agent for service) | |
|
Registrant's telephone number, including area code: | (212) 922-6000 |
| |
Date of fiscal year end: | 12/31 | |
Date of reporting period: | 12/31/13 | |
| | | | | | | |
The following N-CSR relates only to Dreyfus High Yield Fund and does not affect the other series of the Registrant, which have different fiscal year ends and, therefore, different N-CSR reporting requirements. Separate N-CSR Forms will be filed for these series, as appropriate.
FORM N-CSR
Item 1. Reports to Stockholders.
[Insert report here]
The views expressed in this report reflect those of the portfolio manager only through the end of the period covered and do not necessarily represent the views of Dreyfus or any other person in the Dreyfus organization. Any such views are subject to change at any time based upon market or other conditions and Dreyfus disclaims any responsibility to update such views.These views may not be relied on as investment advice and, because investment decisions for a Dreyfus fund are based on numerous factors, may not be relied on as an indication of trading intent on behalf of any Dreyfus fund.
| |
| Contents |
| |
| | THE FUND |
| 2 | A Letter from the President |
| 3 | Discussion of Fund Performance |
| 6 | Fund Performance |
| 8 | Understanding Your Fund’s Expenses |
| 8 | Comparing Your Fund’s Expenses |
| With Those of Other Funds |
| 9 | Statement of Investments |
| 30 | Statement of Assets and Liabilities |
| 31 | Statement of Operations |
| 32 | Statement of Changes in Net Assets |
| 34 | Financial Highlights |
| 37 | Notes to Financial Statements |
| 52 | Report of Independent Registered |
| | Public Accounting Firm |
| 53 | Important Tax Information |
| 54 | Board Members Information |
| 56 | Officers of the Fund |
| |
| FOR MORE INFORMATION |
|
| | Back Cover |
Dreyfus
High Yield Fund
The Fund
A LETTER FROM THE PRESIDENT
Dear Shareholder:
We are pleased to present this annual report for Dreyfus HighYield Fund, covering the 12-month period from January 1, 2013, through December 31, 2013. For information about how the fund performed during the reporting period, as well as general market perspectives, we provide a Discussion of Fund Performance on the pages that follow.
The year 2013 proved to be challenging for the U.S. bond market. Accelerating economic growth and anticipation of a more moderately accommodative monetary policy took their toll on bond prices even as stocks climbed to new record highs.As a result, intermediate- and long-term U.S. government securities value over the past year, pushing the yield on 10-year U.S.Treasury securities above 3% for the first time in more than two years. Corporate-backed bonds generally fared better, as they tended to respond more to their issuers’ underlying credit quality than to changing interest rates.
We remain somewhat cautious regarding the U.S. bond market’s prospects in 2014. We expect the domestic economy to continue to strengthen over the next year, particularly if U.S. fiscal policy is less restrictive and short-term interest rates remain near historical lows, which could push long-term interest rates higher. However, our fixed-income investment teams have continued to identify pockets of perceived opportunity in the bond market, which suggests that a highly selective approach could produce more favorable results for income-oriented investors in the months ahead. As always, we urge you to speak with your financial adviser to identify the investment strategies that are right for you.
Thank you for your continued confidence and support.

J. Charles Cardona
President
The Dreyfus Corporation
January 15, 2014
2
DISCUSSION OF FUND PERFORMANCE
For the period of January 1, 2013, through December 31, 2013, as provided by Chris Barris and Kevin Cronk, Portfolio Managers
Fund and Market Performance Overview
For the 12-month period ended December 31, 2013, Dreyfus High Yield Fund’s Class A shares produced a total return of 7.49%, Class C shares returned 6.69%, and Class I shares returned 7.92%.1 In comparison, the BofA Merrill Lynch U.S. High Yield Master II Constrained Index (the “Index”), the fund’s benchmark, achieved a total return of 7.41% over the same period.2
Although high yield bonds encountered heightened volatility during 2013 when investors reacted to rising long-term interest rates in anticipation of a more moderately accommodative monetary policy from the Federal Reserve Board (the “Fed”), they fared better than most other segments of the U.S. bond market.
The Fund’s Investment Approach
The fund seeks to maximize total return, consisting of capital appreciation and current income.
At least 80% of the fund’s assets are invested in fixed-income securities that are rated below investment grade (“high yield” or “junk” bonds) or are the unrated equivalent as determined by Dreyfus. Individual issues are selected based on careful credit analysis. We thoroughly analyze the business, management, and financial strength of each of the companies whose bonds we buy, then project each issuer’s ability to repay its debt.
High Yield Bonds Held Up Well As Interest Rates Climbed
Long-term interest rates began to move higher during the first quarter of 2013 when fixed-income investors responded nervously to stronger U.S. economic growth, including sustained improvements in employment and housing market trends. The sectors of the bond market that are more interest rate-sensitive, such as U.S. government securities, suffered price declines, while corporate-backed securities held up relatively well as issuers’ underlying business fundamentals improved.
The Fund 3
DISCUSSION OF FUND PERFORMANCE (continued)
The market’s worries about rising interest rates intensified in late May, when relatively hawkish remarks by Fed Chairman Ben Bernanke were interpreted as a signal that the central bank would back away from its ongoing quantitative easing program sooner than expected. Consequently, prices in most bond market sectors, including lower rated corporate-backed bonds, fell sharply in June.The market generally stabilized over the summer, and bonds rallied in September and October when the Fed refrained from tapering its quantitative easing program and a U.S. government shutdown dampened economic expectations. However, additional evidence of accelerating economic growth sparked renewed bond market volatility in November and December.The Fed implemented a modest reduction of its bond purchasing program in mid-December, which helped drive the yield of 10-year U.S. Treasury securities above 3% for the first time in more than two years.
High yield bonds proved relatively insensitive to rising interest rates, as underlying credit conditions remained strong in the recovering economy. Prices of high yield securities generally ended the year close to where they began, and their high levels of current income enabled the asset class to produce substantially better 2013 returns than other fixed-income market sectors.
Several Strategies Supported Relative Performance
The fund outperformed market averages due to the success of our interest rate, sector allocation, and security selection strategies. From a sector allocation perspective, the fund benefited from underweighted exposure to the utilities sector, where low commodity prices and bankruptcy concerns weighed on bond prices. Instead, we favored the better performing telecommunications sector, and we maintained a position in European high yield securities that advanced along with economic sentiment when the region’s recession ended.
Our security selection strategy proved especially effective in the telecommunications sector, where certain wireless carriers contributed positively to relative performance. We also picked a number of individual winners in the energy, metals-and-mining, and financials industry groups. Our interest rate strategies further buoyed relative results, as a relatively short average duration over much of the year helped to cushion the impact of heightened market volatility stemming from rising interest rates.
4
Disappointments were relatively modest in 2013. Overweighted exposure to the cable television and packaging industries detracted mildly from relative performance, but any adverse impact on overall fund results was more than offset by successful security selections in both areas.
A Generally Constructive Outlook
We currently expect the U.S. economic recovery to persist in 2014, potentially driving long-term interest rates higher. Nonetheless, we have continued to identify attractive opportunities among high yield bonds, which we expect to continue to benefit from improving credit conditions, low default rates, and narrowing yield differences relative to U.S. Treasury securities. Therefore, as of year-end, we have maintained a generally constructive investment posture, with a focus on bonds with credit ratings toward the lower end of the below-investment-grade range. However, in light of the likelihood of additional increases in long-term interest rates, we have maintained the fund’s average duration in a position that is modestly shorter than that of the benchmark.
January 15, 2014
Bond funds are subject generally to interest rate, credit, liquidity and market risks, to varying degrees, all of which are
more fully described in the fund’s prospectus. Generally, all other factors being equal, bond prices are inversely related
to interest-rate changes, and rate increases can cause price declines.
High yield bonds are subject to increased credit risk and are considered speculative in terms of the issuer’s perceived
ability to continue making interest payments on a timely basis and to repay principal upon maturity.
1 Total return includes reinvestment of dividends and any capital gains paid, and does not take into consideration the
maximum initial sales charge in the case of Class A shares, or the applicable contingent deferred sales charges imposed
on redemptions in the case of Class C shares. Had these charges been reflected, returns would have been lower. Past
performance is no guarantee of future results. Share price, yield and investment return fluctuate such that upon
redemption, fund shares may be worth more or less than their original cost.
2 SOURCE: LIPPER INC. — Reflects reinvestment of dividends and, where applicable, capital gain distributions.
The BofA Merrill Lynch U.S. HighYield Master II Constrained Index is an unmanaged performance benchmark
composed of U.S. dollar-denominated domestic andYankee bonds rated below investment grade with at least $100
million par amount outstanding and at least one year remaining to maturity. Bonds are capitalization-weighted.Total
allocations to an issuer are capped at 2%.The index does not reflect fees and expenses to which the fund is subject.
The Fund 5
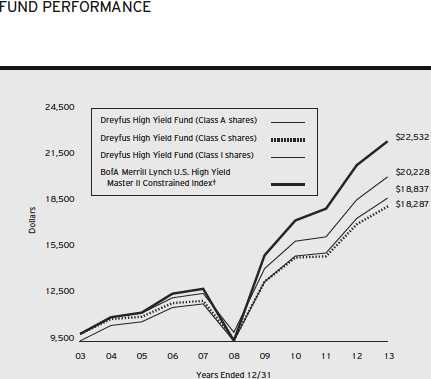
Comparison of change in value of $10,000 investment in Dreyfus High Yield Fund Class A shares, Class C shares and Class I shares and the BofA Merrill Lynch U.S. High Yield Master II Constrained Index
† Source: Lipper Inc.
Past performance is not predictive of future performance.
The above graph compares a $10,000 investment made in each of the Class A, Class C and Class I shares of Dreyfus HighYield Fund on 12/31/03 to a $10,000 investment made in the BofA Merrill Lynch U.S. HighYield Master II Constrained Index (the “Index”) on that date. All dividends and capital gain distributions are reinvested.
The fund’s performance shown in the line graph above takes into account the maximum initial sales charge on Class A shares and all other applicable fees and expenses on all classes.The Index is an unmanaged performance benchmark composed of U.S. dollar-denominated domestic andYankee bonds rated below investment grade with at least $100 million par amount outstanding and at least one year remaining to maturity. Bonds are capitalization-weighted.Total allocations to an issuer are capped at 2%. Unlike a mutual fund, the Index is not subject to charges, fees and other expenses. Investors cannot invest directly in any index. Further information relating to fund performance, including expense reimbursements, if applicable, is contained in the Financial Highlights section of the prospectus and elsewhere in this report.
6
| | | | | | |
| Average Annual Total Returns as of 12/31/13 | | | | | | |
| | 1 | Year | 5 Years | | 10 Years | |
| Class A shares | | | | | | |
| with maximum sales charge (4.5%) | 2.72 | % | 13.51 | % | 6.54 | % |
| without sales charge | 7.49 | % | 14.57 | % | 7.03 | % |
| Class C shares | | | | | | |
| with applicable redemption charge † | 5.69 | % | 13.72 | % | 6.22 | % |
| without redemption | 6.69 | % | 13.72 | % | 6.22 | % |
| Class I shares | 7.92 | % | 14.89 | % | 7.30 | % |
| BofA Merrill Lynch U.S. High Yield | | | | | | |
| Master II Constrained Index | 7.41 | % | 18.70 | % | 8.46 | % |
Past performance is not predictive of future performance.The fund’s performance shown in the graph and table does not
reflect the deduction of taxes that a shareholder would pay on fund distributions or the redemption of fund shares.
† The maximum contingent deferred sales charge for Class C shares is 1% for shares redeemed within one year of the
date of purchase.
The Fund 7
UNDERSTANDING YOUR FUND’S EXPENSES (Unaudited)
As a mutual fund investor, you pay ongoing expenses, such as management fees and other expenses. Using the information below, you can estimate how these expenses affect your investment and compare them with the expenses of other funds.You also may pay one-time transaction expenses, including sales charges (loads) and redemption fees, which are not shown in this section and would have resulted in higher total expenses. For more information, see your fund’s prospectus or talk to your financial adviser.
Review your fund’s expenses
The table below shows the expenses you would have paid on a $1,000 investment in Dreyfus High Yield Fund from July 1, 2013 to December 31, 2013. It also shows how much a $1,000 investment would be worth at the close of the period, assuming actual returns and expenses.
Expenses and Value of a $1,000 Investment assuming actual returns for the six months ended December 31, 2013
| | | | | | |
| | | Class A | | Class C | | Class I |
| Expenses paid per $1,000† | $ | 4.94 | $ | 8.83 | $ | 3.65 |
| Ending value (after expenses) | $ | 1,064.90 | $ | 1,060.90 | $ | 1,067.90 |
COMPARING YOUR FUND’S EXPENSES WITH THOSE OF OTHER FUNDS (Unaudited)
Using the SEC’s method to compare expenses
The Securities and Exchange Commission (SEC) has established guidelines to help investors assess fund expenses. Per these guidelines, the table below shows your fund’s expenses based on a $1,000 investment, assuming a hypothetical 5% annualized return. You can use this information to compare the ongoing expenses (but not transaction expenses or total cost) of investing in the fund with those of other funds.All mutual fund shareholder reports will provide this information to help you make this comparison. Please note that you cannot use this information to estimate your actual ending account balance and expenses paid during the period.
Expenses and Value of a $1,000 Investment
assuming a hypothetical 5% annualized return for the six months ended December 31, 2013
| | | | | | |
| | | Class A | | Class C | | Class I |
| Expenses paid per $1,000† | $ | 4.84 | $ | 8.64 | $ | 3.57 |
| Ending value (after expenses) | $ | 1,020.42 | $ | 1,016.64 | $ | 1,021.68 |
† Expenses are equal to the fund’s annualized expense ratio of .95% for Class A, 1.70% for Class C and .70%
for Class I, multiplied by the average account value over the period, multiplied by 184/365 (to reflect the one-half
year period).
8
STATEMENT OF INVESTMENTS
December 31, 2013
| | | | | | |
| | | Coupon | Maturity | Principal | | |
| Bonds and Notes—95.0% | | Rate (%) | Date | Amount ($)a | Value ($) |
| Aerospace & Defense—1.2% | | | | | | |
| B/E Aerospace, | | | | | | |
| Sr. Unscd. Notes | | 6.88 | 10/1/20 | 2,900,000 | | 3,197,250 |
| Bombardier, | | | | | | |
| Sr. Unscd. Notes | | 7.75 | 3/15/20 | 3,125,000 | b | 3,562,500 |
| CPI International, | | | | | | |
| Gtd. Notes | | 8.00 | 2/15/18 | 3,410,000 | | 3,580,500 |
| Kratos Defense & Security | | | | | | |
| Solutions, Sr. Scd. Notes | | 10.00 | 6/1/17 | 2,280,000 | | 2,470,950 |
| TransDigm, | | | | | | |
| Gtd. Notes | | 5.50 | 10/15/20 | 1,675,000 | | 1,645,687 |
| TransDigm, | | | | | | |
| Gtd. Notes | | 7.75 | 12/15/18 | 4,245,000 | | 4,573,987 |
| | | | | | | 19,030,874 |
| Automotive—2.9% | | | | | | |
| Chrysler Group, | | | | | | |
| Scd. Notes | | 8.00 | 6/15/19 | 1,250,000 | | 1,387,500 |
| Chrysler Group, | | | | | | |
| Scd. Notes | | 8.25 | 6/15/21 | 6,565,000 | c | 7,500,512 |
| General Motor Financial, | | | | | | |
| Gtd. Notes | | 3.25 | 5/15/18 | 585,000 | b | 586,462 |
| Gestamp Funding Luxembourg, | | | | | | |
| Sr. Scd. Notes | | 5.63 | 5/31/20 | 7,595,000 | b | 7,765,887 |
| Goodyear Tire & Rubber, | | | | | | |
| Gtd. Notes | | 6.50 | 3/1/21 | 2,400,000 | | 2,556,000 |
| Goodyear Tire & Rubber, | | | | | | |
| Gtd. Notes | | 8.25 | 8/15/20 | 4,025,000 | c | 4,518,062 |
| Jaguar Land Rover Automotive, | | | | | | |
| Gtd. Notes | | 5.63 | 2/1/23 | 1,800,000 | b,c | 1,809,000 |
| Schaeffler Finance, | | | | | | |
| Sr. Scd. Notes | | 8.50 | 2/15/19 | 5,503,000 | b | 6,218,390 |
| Schaeffler Holding Finance, | | | | | | |
| Sr. Scd. Notes | EUR | 6.88 | 8/15/18 | 2,730,000 | | 4,032,656 |
| Schaeffler Holding Finance, | | | | | | |
| Sr. Scd. Notes | | 6.88 | 8/15/18 | 4,125,000 | b | 4,393,125 |
| Titan International, | | | | | | |
| Sr. Scd. Notes | | 6.88 | 10/1/20 | 2,190,000 | b | 2,294,025 |
| UCI International, | | | | | | |
| Gtd. Notes | | 8.63 | 2/15/19 | 2,235,000 | | 2,246,175 |
| | | | | | | 45,307,794 |
The Fund 9
STATEMENT OF INVESTMENTS (continued)
| | | | | | |
| | | Coupon | Maturity | Principal | | |
| Bonds and Notes (continued) | Rate (%) | Date | Amount ($)a | Value ($) |
| Banking—4.8% | | | | | | |
| Ally Financial, | | | | | | |
| Gtd. Notes | | 4.75 | 9/10/18 | 10,890,000 | | 11,434,500 |
| Ally Financial, | | | | | | |
| Gtd. Notes | | 7.50 | 9/15/20 | 5,080,000 | | 5,937,250 |
| Ally Financial, | | | | | | |
| Gtd. Notes | | 8.00 | 11/1/31 | 1,190,000 | | 1,429,487 |
| Bank of America, | | | | | | |
| Jr. Sub. Cap. Secs., Ser. K | | 8.00 | 7/29/49 | 4,195,000 | d | 4,669,966 |
| Barclays Bank, | | | | | | |
| Jr. Sub. Notes | EUR | 4.75 | 3/29/49 | 7,600,000 | d | 8,949,473 |
| Barclays Bank, | | | | | | |
| Jr. Sub. Notes | EUR | 4.88 | 12/29/49 | 2,530,000 | d | 3,158,584 |
| Citigroup, | | | | | | |
| Jr. Sub. Notes | | 5.95 | 7/29/49 | 8,255,000 | d | 7,649,083 |
| HBOS Capital Funding, | | | | | | |
| Bank Gtd. Bonds | | 6.07 | 6/29/49 | 6,131,000 | b,d | 6,138,664 |
| LBG Capital No. 1, | | | | | | |
| Bank Gtd. Bonds | | 7.88 | 11/1/20 | 3,410,000 | b | 3,703,983 |
| Lloyds Banking Group, | | | | | | |
| Jr. Sub. Bonds | | 6.27 | 11/29/49 | 3,229,000 | b,d | 3,148,275 |
| RBS Capital Trust III, | | | | | | |
| Bank Gtd. Notes | | 5.51 | 9/29/49 | 9,380,000 | c,d | 9,192,400 |
| Royal Bank of Scotland Group, | | | | | | |
| Sub. Notes | | 6.13 | 12/15/22 | 3,660,000 | | 3,753,359 |
| Royal Bank of Scotland, | | | | | | |
| Sub. Notes | | 9.50 | 3/16/22 | 5,860,000 | d | 6,876,927 |
| | | | | | | 76,041,951 |
| Building Materials—1.9% | | | | | | |
| Allegion US Holding, | | | | | | |
| Gtd. Notes | | 5.75 | 10/1/21 | 1,185,000 | b | 1,238,325 |
| American Builders & Contractors | | | | | | |
| Supply, Sr. Unscd. Notes | | 5.63 | 4/15/21 | 3,490,000 | b | 3,516,175 |
| Building Materials Corp. of | | | | | | |
| America, Sr. Notes | | 6.75 | 5/1/21 | 3,130,000 | b | 3,396,050 |
| Cemex SAB de CV, | | | | | | |
| Sr. Scd. Notes | | 9.50 | 6/15/18 | 3,160,000 | b | 3,602,400 |
| Gibraltar Industries, | | | | | | |
| Gtd. Notes | | 6.25 | 2/1/21 | 3,240,000 | | 3,345,300 |
| Nortek, | | | | | | |
| Gtd. Notes | | 8.50 | 4/15/21 | 5,200,000 | | 5,785,000 |
10
| | | | | | |
| | | Coupon | Maturity | Principal | | |
| Bonds and Notes (continued) | Rate (%) | Date | Amount ($)a | Value ($) |
| Building Materials (continued) | | | | | |
| Ply Gem Industries, | | | | | | |
| Sr. Scd. Notes | | 8.25 | 2/15/18 | 1,969,000 | c | 2,106,830 |
| Roofing Supply Group, | | | | | | |
| Gtd. Notes | | 10.00 | 6/1/20 | 3,665,000 | b | 4,141,450 |
| RSI Home Products, | | | | | | |
| Scd. Notes | | 6.88 | 3/1/18 | 2,304,000 | b | 2,424,960 |
| | | | | | | 29,556,490 |
| Chemicals—3.9% | | | | | | |
| Hexion U.S. Finance, | | | | | | |
| Sr. Scd. Notes | | 8.88 | 2/1/18 | 4,060,000 | c | 4,237,625 |
| Hexion U.S. Finance, | | | | | | |
| Scd. Notes | | 9.00 | 11/15/20 | 4,110,000 | c | 4,120,275 |
| Hexion U.S. Finance, | | | | | | |
| Sr. Scd. Notes | | 6.63 | 4/15/20 | 3,350,000 | | 3,450,500 |
| Huntsman International, | | | | | | |
| Gtd. Notes | | 8.63 | 3/15/20 | 4,500,000 | | 5,000,625 |
| Ineos Finance, | | | | | | |
| Sr. Scd. Notes | | 8.38 | 2/15/19 | 3,240,000 | b | 3,616,650 |
| INEOS Group Holdings, | | | | | | |
| Gtd. Notes | EUR | 6.50 | 8/15/18 | 8,790,000 | c | 12,424,990 |
| Pinnacle Operating, | | | | | | |
| Scd. Notes | | 9.00 | 11/15/20 | 3,420,000 | b | 3,638,025 |
| PolyOne, | | | | | | |
| Sr. Unscd. Notes | | 7.38 | 9/15/20 | 2,515,000 | | 2,788,506 |
| Rentech Nitrogen Partners, | | | | | | |
| Scd. Notes | | 6.50 | 4/15/21 | 7,005,000 | b | 6,794,850 |
| TPC Group, | | | | | | |
| Sr. Scd. Notes | | 8.75 | 12/15/20 | 4,005,000 | b | 4,275,337 |
| US Coatings Acquisition/Axalta | | | | | |
| Coating Systems | | | | | | |
| Dutch Holding B, | | | | | | |
| Gtd. Notes | | 7.38 | 5/1/21 | 10,620,000 | b,c | 11,376,675 |
| | | | | | | 61,724,058 |
| Construction Machinery—2.4% | | | | | |
| Ahern Rentals, | | | | | | |
| Scd. Notes | | 9.50 | 6/15/18 | 5,250,000 | b,c | 5,709,375 |
| Ashtead Capital, | | | | | | |
| Scd. Notes | | 6.50 | 7/15/22 | 8,912,000 | b | 9,546,980 |
| H&E Equipment Services, | | | | | | |
| Gtd. Notes | | 7.00 | 9/1/22 | 8,305,000 | | 9,093,975 |
The Fund 11
STATEMENT OF INVESTMENTS (continued)
| | | | | |
| | Coupon | Maturity | Principal | | |
| Bonds and Notes (continued) | Rate (%) | Date | Amount ($)a | Value ($) |
| Construction Machinery (continued) | | | | | |
| Manitowoc, | | | | | |
| Gtd. Notes | 8.50 | 11/1/20 | 4,430,000 | | 5,050,200 |
| United Rentals North America, | | | | | |
| Gtd. Notes | 7.38 | 5/15/20 | 5,170,000 | | 5,758,087 |
| United Rentals North America, | | | | | |
| Gtd. Notes | 7.63 | 4/15/22 | 1,995,000 | | 2,226,919 |
| | | | | | 37,385,536 |
| Consumer Cyclical Services—1.4% | | | | | |
| Live Nation Entertainment, | | | | | |
| Gtd. Notes | 7.00 | 9/1/20 | 1,385,000 | b | 1,509,650 |
| Mobile Mini, | | | | | |
| Gtd. Notes | 7.88 | 12/1/20 | 5,800,000 | | 6,452,500 |
| Reliance Intermediate Holdings, | | | | | |
| Sr. Scd. Notes | 9.50 | 12/15/19 | 5,580,000 | b | 6,138,000 |
| ServiceMaster, | | | | | |
| Gtd. Notes | 8.00 | 2/15/20 | 1,180,000 | | 1,209,500 |
| West, | | | | | |
| Gtd. Notes | 8.63 | 10/1/18 | 6,345,000 | | 6,931,912 |
| | | | | | 22,241,562 |
| Consumer Products—.4% | | | | | |
| ACCO Brands, | | | | | |
| Gtd. Notes | 6.75 | 4/30/20 | 2,455,000 | c | 2,436,587 |
| Libbey Glass, | | | | | |
| Sr. Scd. Notes | 6.88 | 5/15/20 | 3,258,000 | | 3,534,930 |
| | | | | | 5,971,517 |
| Distributors���.3% | | | | | |
| Ferrellgas, | | | | | |
| Sr. Unscd. Notes | 6.75 | 1/15/22 | 4,486,000 | b | 4,575,720 |
| Diversified Manufacturing—1.7% | | | | | |
| Accudyne Industries, | | | | | |
| Gtd. Notes | 7.75 | 12/15/20 | 3,385,000 | b,c | 3,605,025 |
| Dynacast International, | | | | | |
| Scd. Notes | 9.25 | 7/15/19 | 5,875,000 | | 6,506,562 |
| Gardner Denver, | | | | | |
| Sr. Unscd. Notes | 6.88 | 8/15/21 | 3,045,000 | b,c | 3,052,613 |
| Griffon, | | | | | |
| Gtd. Notes | 7.13 | 4/1/18 | 6,080,000 | | 6,475,200 |
| Rexel, | | | | | |
| Sr. Unscd. Notes | 6.13 | 12/15/19 | 4,515,000 | b | 4,740,750 |
12
| | | | | | |
| | | Coupon | Maturity | Principal | | |
| Bonds and Notes (continued) | Rate (%) | Date | Amount ($)a | Value ($) |
| Diversified Manufacturing | | | | | | |
| (continued) | | | | | | |
| Wesco Distribution, | | | | | | |
| Gtd. Notes | | 5.38 | 12/15/21 | 2,225,000 | b | 2,230,562 |
| | | | | | | 26,610,712 |
| Electric—2.8% | | | | | | |
| AES, | | | | | | |
| Sr. Unscd. Notes | | 7.38 | 7/1/21 | 5,735,000 | | 6,494,888 |
| AES, | | | | | | |
| Sr. Unscd. Notes | | 9.75 | 4/15/16 | 3,765,000 | | 4,452,112 |
| Calpine, | | | | | | |
| Sr. Scd. Notes | | 6.00 | 1/15/22 | 4,544,000 | b | 4,680,320 |
| Calpine, | | | | | | |
| Sr. Scd. Notes | | 7.50 | 2/15/21 | 2,244,000 | b | 2,459,985 |
| Calpine, | | | | | | |
| Sr. Scd. Notes | | 7.88 | 1/15/23 | 4,215,000 | b | 4,625,962 |
| GenOn Energy, | | | | | | |
| Sr. Unscd. Notes | | 9.50 | 10/15/18 | 9,482,000 | | 10,785,775 |
| NRG Energy, | | | | | | |
| Gtd. Notes | | 6.63 | 3/15/23 | 1,605,000 | | 1,625,063 |
| NRG Energy, | | | | | | |
| Gtd. Notes | | 7.63 | 5/15/19 | 5,575,000 | | 5,923,437 |
| Techem Energy, | | | | | | |
| Gtd. Notes | EUR | 7.88 | 10/1/20 | 1,975,000 | | 3,059,090 |
| | | | | | | 44,106,632 |
| Energy—9.7% | | | | | | |
| Antero Resources Finance, | | | | | | |
| Gtd. Notes | | 5.38 | 11/1/21 | 1,095,000 | b | 1,106,634 |
| Antero Resources Finance, | | | | | | |
| Gtd. Notes | | 7.25 | 8/1/19 | 2,681,000 | | 2,895,480 |
| Aurora USA Oil & Gas, | | | | | | |
| Gtd. Notes | | 9.88 | 2/15/17 | 6,285,000 | b | 6,772,087 |
| Bonanza Creek Energy, | | | | | | |
| Gtd. Notes | | 6.75 | 4/15/21 | 7,345,000 | | 7,730,612 |
| Bristow Group, | | | | | | |
| Gtd. Notes | | 6.25 | 10/15/22 | 3,297,000 | | 3,493,007 |
| Carrizo Oil & Gas, | | | | | | |
| Gtd. Notes | | 7.50 | 9/15/20 | 6,395,000 | | 7,034,500 |
| Chesapeake Energy, | | | | | | |
| Gtd. Notes | | 6.63 | 8/15/20 | 4,635,000 | | 5,202,787 |
The Fund 13
STATEMENT OF INVESTMENTS (continued)
| | | | | |
| | Coupon | Maturity | Principal | | |
| Bonds and Notes (continued) | Rate (%) | Date | Amount ($)a | Value ($) |
| Energy (continued) | | | | | |
| Dresser-Rand Group, | | | | | |
| Gtd. Notes | 6.50 | 5/1/21 | 3,565,000 | | 3,814,550 |
| Edgen Murray, | | | | | |
| Sr. Scd. Notes | 8.75 | 11/1/20 | 5,645,000 | b | 6,491,750 |
| Forum Energy Technologies, | | | | | |
| Gtd. Notes | 6.25 | 10/1/21 | 5,395,000 | b | 5,691,725 |
| Halcon Resources, | | | | | |
| Gtd. Notes | 8.88 | 5/15/21 | 3,185,000 | | 3,232,775 |
| Halcon Resources, | | | | | |
| Gtd. Notes | 9.75 | 7/15/20 | 2,705,000 | b | 2,830,106 |
| Halcon Resources, | | | | | |
| Gtd. Notes | 9.75 | 7/15/20 | 4,595,000 | | 4,813,262 |
| Hercules Offshore, | | | | | |
| Gtd. Notes | 7.50 | 10/1/21 | 610,000 | b | 649,650 |
| Hercules Offshore, | | | | | |
| Gtd. Notes | 8.75 | 7/15/21 | 6,970,000 | b | 7,806,400 |
| Kodiak Oil & Gas, | | | | | |
| Gtd. Notes | 5.50 | 1/15/21 | 1,455,000 | c | 1,458,637 |
| Kodiak Oil & Gas, | | | | | |
| Gtd. Notes | 8.13 | 12/1/19 | 5,130,000 | | 5,719,950 |
| MEG Energy, | | | | | |
| Gtd. Notes | 6.50 | 3/15/21 | 4,715,000 | b | 4,986,112 |
| Newfield Exploration, | | | | | |
| Sr. Sub. Notes | 6.88 | 2/1/20 | 5,385,000 | | 5,795,606 |
| Northern Oil and Gas, | | | | | |
| Gtd. Notes | 8.00 | 6/1/20 | 7,535,000 | | 7,930,587 |
| Oasis Petroleum, | | | | | |
| Gtd. Notes | 6.88 | 3/15/22 | 5,050,000 | b | 5,378,250 |
| Oasis Petroleum, | | | | | |
| Gtd. Notes | 7.25 | 2/1/19 | 3,650,000 | | 3,942,000 |
| Offshore Group Investment, | | | | | |
| Sr. Scd. Notes | 7.50 | 11/1/19 | 10,340,000 | c | 11,296,450 |
| Precision Drilling, | | | | | |
| Gtd. Notes | 6.50 | 12/15/21 | 745,000 | | 797,150 |
| Precision Drilling, | | | | | |
| Gtd. Notes | 6.63 | 11/15/20 | 5,170,000 | | 5,544,825 |
| Range Resources, | | | | | |
| Gtd. Notes | 5.00 | 8/15/22 | 3,170,000 | | 3,130,375 |
| Range Resources, | | | | | |
| Gtd. Notes | 5.00 | 3/15/23 | 3,475,000 | | 3,414,187 |
14
| | | | | | |
| | | Coupon | Maturity | Principal | | |
| Bonds and Notes (continued) | Rate (%) | Date | Amount ($)a | Value ($) |
| Energy (continued) | | | | | | |
| Rex Energy, | | | | | | |
| Gtd. Notes | | 8.88 | 12/1/20 | 7,030,000 | | 7,733,000 |
| Unit, | | | | | | |
| Gtd. Notes | | 6.63 | 5/15/21 | 10,100,000 | | 10,706,000 |
| Welltec, | | | | | | |
| Sr. Scd. Notes | | 8.00 | 2/1/19 | 5,885,000 | b | 6,267,525 |
| | | | | | | 153,665,979 |
| Entertainment—.3% | | | | | | |
| AMC Entertaiment, | | | | | | |
| Gtd. Notes | | 9.75 | 12/1/20 | 4,685,000 | | 5,381,894 |
| Environmental—1.0% | | | | | | |
| Abengoa Finance, | | | | | | |
| Gtd. Notes | EUR | 8.88 | 2/5/18 | 6,980,000 | c | 10,447,434 |
| ADS Waste Holdings, | | | | | | |
| Gtd. Notes | | 8.25 | 10/1/20 | 4,410,000 | | 4,806,900 |
| | | | | | | 15,254,334 |
| Finance Companies—5.2% | | | | | | |
| American Capital, | | | | | | |
| Sr. Unscd. Notes | | 6.50 | 9/15/18 | 6,765,000 | b | 7,086,337 |
| CIT Group, | | | | | | |
| Sr. Unscd. Notes | | 5.50 | 2/15/19 | 7,850,000 | b | 8,458,375 |
| FTI Consulting, | | | | | | |
| Gtd. Notes | | 6.75 | 10/1/20 | 4,705,000 | | 5,104,925 |
| Icahn Enterprises Finance, | | | | | | |
| Gtd. Notes | | 6.00 | 8/1/20 | 6,515,000 | b | 6,743,025 |
| Icahn Enterprises Finance, | | | | | | |
| Gtd. Notes | | 8.00 | 1/15/18 | 610,000 | | 635,925 |
| International Lease Finance, | | | | | | |
| Sr. Unscd. Notes | | 8.25 | 12/15/20 | 7,840,000 | c | 9,192,400 |
| International Lease Finance, | | | | | | |
| Sr. Unscd. Notes | | 8.63 | 1/15/22 | 2,395,000 | | 2,842,271 |
| International Lease Finance, | | | | | | |
| Sr. Unscd. Notes | | 8.88 | 9/1/17 | 4,675,000 | | 5,586,625 |
| Ladder Capital Finance Holdings, | | | | | |
| Sr. Unscd. Notes | | 7.38 | 10/1/17 | 8,155,000 | | 8,603,525 |
| Nuveen Investments, | | | | | | |
| Sr. Unscd. Notes | | 9.13 | 10/15/17 | 7,880,000 | b | 7,919,400 |
| Provident Funding Associates, | | | | | | |
| Gtd. Notes | | 6.75 | 6/15/21 | 4,300,000 | b | 4,300,000 |
The Fund 15
STATEMENT OF INVESTMENTS (continued)
| | | | | | |
| | | Coupon | Maturity | Principal | | |
| Bonds and Notes (continued) | Rate (%) | Date | Amount ($)a | Value ($) |
| Finance Companies (continued) | | | | | |
| SLM, | | | | | | |
| Sr. Unscd. Notes | | 8.00 | 3/25/20 | 1,850,000 | | 2,102,063 |
| SLM, | | | | | | |
| Sr. Unscd. Notes | | 8.45 | 6/15/18 | 5,970,000 | | 6,977,437 |
| Springleaf Finance, | | | | | | |
| Sr. Unscd. Notes | | 6.00 | 6/1/20 | 5,770,000 | | 5,798,850 |
| | | | | | | 81,351,158 |
| Food & Beverages—1.3% | | | | | | |
| Bakkavor Finance 2, | | | | | | |
| Sr. Scd. Notes | GBP | 8.75 | 6/15/20 | 2,250,000 | | 4,079,941 |
| Del Monte, | | | | | | |
| Gtd. Notes | | 7.63 | 2/15/19 | 7,430,000 | | 7,736,488 |
| Post Holdings, | | | | | | |
| Gtd. Notes | | 7.38 | 2/15/22 | 2,225,000 | b | 2,391,875 |
| Post Holdings, | | | | | | |
| Gtd. Notes | | 7.38 | 2/15/22 | 5,525,000 | c | 5,939,375 |
| | | | | | | 20,147,679 |
| Gaming—2.2% | | | | | | |
| MGM Resorts International, | | | | | | |
| Gtd. Notes | | 7.75 | 3/15/22 | 6,190,000 | | 6,948,275 |
| MGM Resorts International, | | | | | | |
| Gtd. Notes | | 11.38 | 3/1/18 | 7,545,000 | | 9,619,875 |
| Peninsula Gaming, | | | | | | |
| Gtd. Notes | | 8.38 | 2/15/18 | 4,515,000 | b,c | 4,943,925 |
| Penn National Gaming, | | | | | | |
| Sr. Unscd. Notes | | 5.88 | 11/1/21 | 5,495,000 | b | 5,440,050 |
| Pinnacle Entertainment, | | | | | | |
| Gtd. Notes | | 7.50 | 4/15/21 | 5,230,000 | | 5,700,700 |
| Pinnacle Entertainment, | | | | | | |
| Gtd. Notes | | 8.75 | 5/15/20 | 2,580,000 | | 2,857,350 |
| | | | | | | 35,510,175 |
| Health Care—7.0% | | | | | | |
| Biomet, | | | | | | |
| Gtd. Notes | | 6.50 | 8/1/20 | 7,170,000 | | 7,564,350 |
| Biomet, | | | | | | |
| Gtd. Notes | | 6.50 | 10/1/20 | 8,135,000 | | 8,419,725 |
| CHS/Community Health Systems, | | | | | |
| Gtd. Notes | | 7.13 | 7/15/20 | 2,860,000 | | 2,970,825 |
16
| | | | | |
| | Coupon | Maturity | Principal | | |
| Bonds and Notes (continued) | Rate (%) | Date | Amount ($)a | Value ($) |
| Health Care (continued) | | | | | |
| ConvaTec Finance International, | | | | | |
| Sr. Unscd. Notes | 8.25 | 1/15/19 | 6,075,000 | b,c | 6,234,469 |
| DaVita HealthCare Partners, | | | | | |
| Gtd. Notes | 5.75 | 8/15/22 | 685,000 | | 696,988 |
| DaVita HealthCare Partners, | | | | | |
| Gtd. Notes | 6.63 | 11/1/20 | 3,800,000 | | 4,094,500 |
| Envision Healthcare, | | | | | |
| Gtd. Notes | 8.13 | 6/1/19 | 2,253,000 | | 2,452,954 |
| HCA Holdings, | | | | | |
| Sr. Unscd. Notes | 6.25 | 2/15/21 | 2,150,000 | | 2,254,812 |
| HCA Holdings, | | | | | |
| Sr. Unscd. Notes | 7.75 | 5/15/21 | 7,595,000 | | 8,316,525 |
| HCA, | | | | | |
| Sr. Scd. Notes | 4.75 | 5/1/23 | 3,370,000 | | 3,176,225 |
| HCA, | | | | | |
| Sr. Scd. Notes | 7.25 | 9/15/20 | 8,310,000 | | 9,078,675 |
| HCA, | | | | | |
| Gtd. Notes | 7.50 | 2/15/22 | 4,300,000 | | 4,730,000 |
| Health Management Associates, | | | | | |
| Gtd. Notes | 7.38 | 1/15/20 | 2,430,000 | | 2,730,713 |
| Healthcare Technology | | | | | |
| Intermediate, Sr. Unscd. Notes | 7.38 | 9/1/18 | 3,195,000 | b | 3,338,775 |
| HealthSouth, | | | | | |
| Gtd. Notes | 7.75 | 9/15/22 | 2,140,000 | | 2,354,000 |
| IASIS Healthcare, | | | | | |
| Gtd. Notes | 8.38 | 5/15/19 | 2,740,000 | | 2,918,100 |
| IMS Health, | | | | | |
| Sr. Unscd. Notes | 6.00 | 11/1/20 | 2,140,000 | b | 2,279,100 |
| Lifepoint Hospitals, | | | | | |
| Gtd. Notes | 5.50 | 12/1/21 | 3,845,000 | b | 3,869,031 |
| Physio-Control International, | | | | | |
| Sr. Scd. Notes | 9.88 | 1/15/19 | 6,739,000 | b | 7,581,375 |
| STHI Holding, | | | | | |
| Scd. Notes | 8.00 | 3/15/18 | 2,175,000 | b | 2,338,125 |
| Tenet Healthcare, | | | | | |
| Sr. Scd. Notes | 6.00 | 10/1/20 | 5,190,000 | b | 5,426,794 |
| Tenet Healthcare, | | | | | |
| Sr. Scd. Notes | 6.25 | 11/1/18 | 2,430,000 | | 2,700,338 |
The Fund 17
STATEMENT OF INVESTMENTS (continued)
| | | | | | |
| | | Coupon | Maturity | Principal | | |
| Bonds and Notes (continued) | Rate (%) | Date | Amount ($)a | Value ($) |
| Health Care (continued) | | | | | | |
| Tenet Healthcare, | | | | | | |
| Sr. Unscd. Notes | | 8.13 | 4/1/22 | 9,310,000 | | 10,054,800 |
| United Surgical Partners | | | | | | |
| International, Gtd. Notes | | 9.00 | 4/1/20 | 4,185,000 | | 4,708,125 |
| | | | | | | 110,289,324 |
| Home Construction—2.6% | | | | | | |
| Ashton Woods USA/Finance, | | | | | | |
| Unscd. Notes | | 6.88 | 2/15/21 | 3,368,000 | b | 3,334,320 |
| Brookfield Residential Properties, | | | | | | |
| Gtd. Notes | | 6.13 | 7/1/22 | 1,055,000 | b | 1,065,550 |
| Brookfield Residential Properties, | | | | | | |
| Gtd. Notes | | 6.50 | 12/15/20 | 5,435,000 | b | 5,665,988 |
| Shea Homes Funding, | | | | | | |
| Sr. Scd. Notes | | 8.63 | 5/15/19 | 5,615,000 | | 6,246,687 |
| Standard Pacific, | | | | | | |
| Gtd. Notes | | 8.38 | 5/15/18 | 4,970,000 | | 5,864,600 |
| Taylor Morrison Communities, | | | | | | |
| Gtd. Notes | | 5.25 | 4/15/21 | 835,000 | b | 814,125 |
| Taylor Morrison Communities, | | | | | | |
| Gtd. Notes | | 7.75 | 4/15/20 | 6,911,000 | b | 7,636,655 |
| Weekley Homes, | | | | | | |
| Sr. Unscd. Notes | | 6.00 | 2/1/23 | 5,492,000 | b | 5,327,240 |
| William Lyon Homes, | | | | | | |
| Gtd. Notes | | 8.50 | 11/15/20 | 1,560,000 | b | 1,696,500 |
| William Lyon Homes, | | | | | | |
| Gtd. Notes | | 8.50 | 11/15/20 | 3,730,000 | | 4,056,375 |
| | | | | | | 41,708,040 |
| Industrial Services—2.8% | | | | | | |
| Abengoa, | | | | | | |
| Sr. Unscd. Notes | EUR | 6.25 | 1/17/19 | 1,200,000 | | 1,694,098 |
| Algeco Scotsman | | | | | | |
| Global Finance, | | | | | | |
| Sr. Scd. Notes | | 8.50 | 10/15/18 | 2,175,000 | b | 2,365,313 |
| Algeco Scotsman | | | | | | |
| Global Finance, | | | | | | |
| Sr. Scd. Notes | EUR | 9.00 | 10/15/18 | 2,125,000 | | 3,179,168 |
| Algeco Scotsman | | | | | | |
| Global Finance, | | | | | | |
| Gtd. Notes | | 10.75 | 10/15/19 | 4,940,000 | b | 5,236,400 |
18
| | | | | | |
| | | Coupon | Maturity | Principal | | |
| Bonds and Notes (continued) | Rate (%) | Date | Amount ($)a | Value ($) |
| Industrial Services (continued) | | | | | |
| CBRE Services, | | | | | | |
| Gtd. Notes | | 5.00 | 3/15/23 | 2,225,000 | | 2,149,906 |
| Deutsche Raststatten | | | | | | |
| Gruppe IV, | | | | | | |
| Scd. Bonds | EUR | 6.75 | 12/30/20 | 4,215,000 | | 6,077,799 |
| Hillman Group, | | | | | | |
| Gtd. Notes | | 10.88 | 6/1/18 | 3,165,000 | | 3,434,025 |
| Interline Brands, | | | | | | |
| Sr. Unscd. Notes | | 10.00 | 11/15/18 | 4,355,000 | | 4,779,613 |
| Mueller Water Products, | | | | | | |
| Gtd. Notes | | 7.38 | 6/1/17 | 3,225,000 | | 3,321,750 |
| Mueller Water Products, | | | | | | |
| Gtd. Notes | | 8.75 | 9/1/20 | 1,808,236 | | 2,034,265 |
| StoneMor Partners, | | | | | | |
| Gtd. Notes | | 7.88 | 6/1/21 | 2,645,000 | b | 2,764,025 |
| WireCo WorldGroup, | | | | | | |
| Gtd. Notes | | 9.50 | 5/15/17 | 2,755,000 | | 2,868,644 |
| Zachry Holdings, | | | | | | |
| Sr. Notes | | 7.50 | 2/1/20 | 4,655,000 | b | 4,887,750 |
| | | | | | | 44,792,756 |
| Insurance—.9% | | | | | | |
| Hockey Merger Sub 2, | | | | | | |
| Sr. Unscd. Notes | | 7.88 | 10/1/21 | 5,315,000 | b | 5,487,738 |
| Onex USI Acquisition, | | | | | | |
| Sr. Unscd. Notes | | 7.75 | 1/15/21 | 7,865,000 | b | 8,081,288 |
| | | | | | | 13,569,026 |
| Lodging—.3% | | | | | | |
| Hilton Worldwide Finance, | | | | | | |
| Gtd. Notes | | 5.63 | 10/15/21 | 5,160,000 | b | 5,363,175 |
| Media Cable—4.8% | | | | | | |
| Cablevision Systems, | | | | | | |
| Sr. Unscd. Notes | | 8.00 | 4/15/20 | 2,545,000 | | 2,856,763 |
| Cablevision Systems, | | | | | | |
| Sr. Unscd. Notes | | 8.63 | 9/15/17 | 2,435,000 | | 2,842,863 |
| CCO Holdings, | | | | | | |
| Gtd. Notes | | 6.63 | 1/31/22 | 4,960,000 | | 5,133,600 |
| Cequel Communications Holdings I, | | | | | |
| Sr. Unscd. Notes | | 6.38 | 9/15/20 | 7,540,000 | b | 7,766,200 |
TheFund 19
STATEMENT OF INVESTMENTS (continued)
| | | | | | |
| | | Coupon | Maturity | Principal | | |
| Bonds and Notes (continued) | Rate (%) | Date | Amount ($)a | Value ($) |
| Media Cable (continued) | | | | | | |
| Dish DBS, | | | | | | |
| Gtd. Notes | | 5.13 | 5/1/20 | 4,660,000 | | 4,683,300 |
| Dish DBS, | | | | | | |
| Gtd. Notes | | 6.75 | 6/1/21 | 5,225,000 | | 5,564,625 |
| DISH DBS, | | | | | | |
| Gtd. Notes | | 7.13 | 2/1/16 | 5,040,000 | | 5,594,400 |
| Nara Cable Funding, | | | | | | |
| Sr. Scd. Notes | | 8.88 | 12/1/18 | 4,320,000 | b | 4,665,600 |
| Ono Finance II, | | | | | | |
| Gtd. Notes | | 10.88 | 7/15/19 | 3,465,000 | b | 3,811,500 |
| RCN Telecom Services, | | | | | | |
| Sr. Unscd. Notes | | 8.50 | 8/15/20 | 4,310,000 | b | 4,374,650 |
| Unitymedia Hessen & Co., | | | | | | |
| Sr. Scd. Notes | | 7.50 | 3/15/19 | 4,235,000 | b | 4,626,738 |
| UPCB Finance V, | | | | | | |
| Sr. Scd. Notes | | 7.25 | 11/15/21 | 3,790,000 | b | 4,131,100 |
| Videotron, | | | | | | |
| Gtd. Notes | | 5.00 | 7/15/22 | 7,032,000 | | 6,908,940 |
| Virgin Media, | | | | | | |
| Sr. Scd. Notes | | 5.38 | 4/15/21 | 1,375,000 | b | 1,381,875 |
| Virgin Media, | | | | | | |
| Sr. Scd. Notes | GBP | 6.00 | 4/15/21 | 1,300,000 | | 2,222,710 |
| Virgin Media, | | | | | | |
| Gtd. Notes | | 6.38 | 4/15/23 | 8,850,000 | b | 9,049,125 |
| | | | | | | 75,613,989 |
| Media Non-Cable—5.5% | | | | | | |
| AMC Networks, | | | | | | |
| Gtd. Notes | | 7.75 | 7/15/21 | 1,220,000 | | 1,378,600 |
| Cable Communications Systems, | | | | | | |
| Sr. Scd. Bonds | EUR | 7.50 | 11/1/20 | 2,295,000 | b | 3,251,960 |
| Clear Channel Communications, | | | | | | |
| Sr. Scd. Notes | | 9.00 | 12/15/19 | 5,525,000 | | 5,663,125 |
| Clear Channel Communications, | | | | | | |
| Sr. Scd. Notes | | 9.00 | 3/1/21 | 2,285,000 | | 2,319,275 |
| Clear Channel | | | | | | |
| Worldwide Holdings, | | | | | | |
| Gtd. Notes | | 6.50 | 11/15/22 | 1,220,000 | | 1,242,875 |
| Clear Channel | | | | | | |
| Worldwide Holdings, | | | | | | |
| Gtd. Notes, Ser. B | | 6.50 | 11/15/22 | 2,500,000 | | 2,565,625 |
20
| | | | | |
| | Coupon | Maturity | Principal | | |
| Bonds and Notes (continued) | Rate (%) | Date | Amount ($)a | Value ($) |
| Media Non-Cable (continued) | | | | | |
| Clear Channel Worldwide Holdings, | | | | | |
| Gtd. Notes, Ser. A | 7.63 | 3/15/20 | 625,000 | | 653,125 |
| Clear Channel Worldwide Holdings, | | | | | |
| Gtd. Notes, Ser. B | 7.63 | 3/15/20 | 7,655,000 | | 8,085,594 |
| Cumulus Media Holdings, | | | | | |
| Gtd. Notes | 7.75 | 5/1/19 | 5,025,000 | | 5,326,500 |
| Gray Television, | | | | | |
| Gtd. Notes | 7.50 | 10/1/20 | 8,815,000 | c | 9,410,013 |
| Hughes Satellite Systems, | | | | | |
| Gtd. Notes | 7.63 | 6/15/21 | 7,195,000 | | 8,058,400 |
| Intelsat Jackson Holdings, | | | | | |
| Gtd. Notes | 5.50 | 8/1/23 | 3,220,000 | b | 3,075,100 |
| Intelsat Jackson Holdings, | | | | | |
| Gtd. Notes | 7.25 | 10/15/20 | 7,040,000 | | 7,735,200 |
| Intelsat Luxembourg, | | | | | |
| Gtd. Notes | 7.75 | 6/1/21 | 10,250,000 | b | 11,031,563 |
| LIN Television, | | | | | |
| Gtd. Notes | 6.38 | 1/15/21 | 2,185,000 | | 2,283,325 |
| Nexstar Broadcasting, | | | | | |
| Gtd. Notes | 6.88 | 11/15/20 | 5,800,000 | | 6,235,000 |
| Sinclair Television Group, | | | | | |
| Sr. Unscd. Notes | 6.13 | 10/1/22 | 3,270,000 | | 3,319,050 |
| Sinclair Television Group, | | | | | |
| Gtd. Notes | 6.38 | 11/1/21 | 2,105,000 | b | 2,189,200 |
| Townsquare Radio, | | | | | |
| Gtd. Notes | 9.00 | 4/1/19 | 2,200,000 | b | 2,392,500 |
| | | | | | 86,216,030 |
| Metals & Mining—3.7% | | | | | |
| Alpha Natural Resources, | | | | | |
| Gtd. Notes | 6.25 | 6/1/21 | 1,775,000 | c | 1,526,500 |
| Alpha Natural Resources, | | | | | |
| Gtd. Notes | 9.75 | 4/15/18 | 780,000 | c | 830,700 |
| ArcelorMittal, | | | | | |
| Sr. Unscd. Notes | 5.00 | 2/25/17 | 1,330,000 | d | 1,433,075 |
| ArcelorMittal, | | | | | |
| Sr. Unscd. Bonds | 10.35 | 6/1/19 | 6,817,000 | d | 8,657,590 |
| Calcipar, | | | | | |
| Sr. Scd. Notes | 6.88 | 5/1/18 | 5,540,000 | b | 5,900,100 |
| FMG Resources (August 2006), | | | | | |
| Gtd. Notes | 6.88 | 4/1/22 | 12,405,000 | b,c | 13,583,475 |
The Fund 21
STATEMENT OF INVESTMENTS (continued)
| | | | | | |
| | | Coupon | Maturity | Principal | | |
| Bonds and Notes (continued) | Rate (%) | Date | Amount ($)a | Value ($) |
| Metals & Mining (continued) | | | | | | |
| Global Brass & Copper, | | | | | | |
| Sr. Scd. Notes | | 9.50 | 6/1/19 | 2,745,000 | | 3,143,025 |
| Murray Energy, | | | | | | |
| Sr. Scd. Notes | | 8.63 | 6/15/21 | 4,800,000 | b | 4,992,000 |
| Peabody Energy, | | | | | | |
| Gtd. Notes | | 6.50 | 9/15/20 | 3,400,000 | | 3,595,500 |
| Rain CII Carbon, | | | | | | |
| Scd. Notes | | 8.25 | 1/15/21 | 8,190,000 | b | 8,394,750 |
| Ryerson, | | | | | | |
| Sr. Scd. Notes | | 9.00 | 10/15/17 | 4,225,000 | | 4,483,781 |
| Steel Dynamics, | | | | | | |
| Gtd. Notes | | 5.25 | 4/15/23 | 1,235,000 | | 1,241,175 |
| Steel Dynamics, | | | | | | |
| Gtd. Notes | | 6.38 | 8/15/22 | 765,000 | | 830,025 |
| | | | | | | 58,611,696 |
| Packaging—3.9% | | | | | | |
| AEP Industries, | | | | | | |
| Sr. Unscd. Notes | | 8.25 | 4/15/19 | 3,020,000 | | 3,261,600 |
| Albea Beauty Holdings, | | | | | | |
| Sr. Scd. Notes | | 8.38 | 11/1/19 | 5,465,000 | b | 5,710,925 |
| ARD Finance, | | | | | | |
| Sr. Scd. Notes | | 11.13 | 6/1/18 | 5,723,836 | b | 6,153,124 |
| Ardagh Packaging Finance, | | | | | | |
| Gtd. Notes | | 9.13 | 10/15/20 | 1,900,000 | b | 2,090,000 |
| Ardagh Packaging Finance, | | | | | | |
| Gtd. Notes | EUR | 9.25 | 10/15/20 | 2,000,000 | c | 3,002,476 |
| Ardagh Packaging Finance, | | | | | | |
| Sr. Unscd. Notes | | 7.00 | 11/15/20 | 1,250,000 | b | 1,268,750 |
| Ardagh Packaging Finance, | | | | | | |
| Gtd. Notes | | 9.13 | 10/15/20 | 2,080,000 | b,c | 2,277,600 |
| Beverage | | | | | | |
| Packaging Holdings II, | | | | | | |
| Gtd. Notes | | 5.63 | 12/15/16 | 1,075,000 | b | 1,099,187 |
| BOE Intermediate Holding, | | | | | | |
| Sr. Unscd. Notes | | 9.00 | 11/1/17 | 3,105,135 | b | 3,252,629 |
| BOE Merger, | | | | | | |
| Sr. Unscd. Notes | | 9.50 | 11/1/17 | 4,075,000 | b | 4,350,063 |
22
| | | | | |
| | Coupon | Maturity | Principal | | |
| Bonds and Notes (continued) | Rate (%) | Date | Amount ($)a | Value ($) |
| Packaging (continued) | | | | | |
| BWAY Holding, | | | | | |
| Gtd. Notes | 10.00 | 6/15/18 | 2,380,000 | | 2,588,250 |
| Consolidated Container, | | | | | |
| Gtd. Notes | 10.13 | 7/15/20 | 3,475,000 | b | 3,718,250 |
| Reynolds Group, | | | | | |
| Sr. Scd. Notes | 7.88 | 8/15/19 | 6,205,000 | | 6,887,550 |
| Reynolds Group, | | | | | |
| Gtd. Notes | 8.50 | 5/15/18 | 8,850,000 | d | 9,381,000 |
| Reynolds Group, | | | | | |
| Gtd. Notes | 9.88 | 8/15/19 | 3,510,000 | | 3,922,425 |
| Sealed Air, | | | | | |
| Gtd. Notes | 8.13 | 9/15/19 | 2,970,000 | b | 3,348,675 |
| | | | | | 62,312,504 |
| Paper—.3% | | | | | |
| Ainsworth Lumber, | | | | | |
| Sr. Scd. Notes | 7.50 | 12/15/17 | 1,427,000 | b | 1,541,160 |
| Sappi Papier Holding, | | | | | |
| Sr. Scd. Notes | 7.75 | 7/15/17 | 2,195,000 | b,c | 2,414,500 |
| Sappi Papier Holding, | | | | | |
| Sr. Scd. Notes | 8.38 | 6/15/19 | 895,000 | b | 985,619 |
| | | | | | 4,941,279 |
| Pharmaceuticals—1.3% | | | | | |
| Capsugel, | | | | | |
| Sr. Unscd. Notes | 7.00 | 5/15/19 | 5,019,000 | b | 5,122,517 |
| Salix Pharmaceuticals, | | | | | |
| Gtd. Notes | 6.00 | 1/15/21 | 1,505,000 | b | 1,546,387 |
| Valeant Pharmaceuticals International, | | | | | |
| Gtd. Notes | 5.63 | 12/1/21 | 385,000 | b | 387,888 |
| Valeant Pharmaceuticals | | | | | |
| International, Gtd. Notes | 6.38 | 10/15/20 | 4,485,000 | b | 4,748,494 |
| Valeant | | | | | |
| Pharmaceuticals International, | | | | | |
| Gtd. Notes | 6.75 | 8/15/21 | 1,440,000 | b | 1,533,600 |
| Valeant Pharmaceuticals | | | | | |
| International, Sr. Unscd. Notes | 6.75 | 8/15/18 | 6,935,000 | b | 7,654,506 |
| | | | | | 20,993,392 |
The Fund 23
STATEMENT OF INVESTMENTS (continued)
| | | | | | |
| | | Coupon | Maturity | Principal | | |
| Bonds and Notes (continued) | Rate (%) | Date | Amount ($)a | Value ($) |
| Pipelines—.9% | | | | | | |
| Crestwood Midstream Partners, | | | | | |
| Gtd. Notes | | 6.13 | 3/1/22 | 6,015,000 | b | 6,195,450 |
| Genesis Energy, | | | | | | |
| Gtd. Notes | | 5.75 | 2/15/21 | 3,540,000 | | 3,597,525 |
| Targa Resources Partners, | | | | | | |
| Gtd. Notes | | 6.88 | 2/1/21 | 3,940,000 | | 4,255,200 |
| | | | | | | 14,048,175 |
| Retailers—1.2% | | | | | | |
| J.Crew Group, | | | | | | |
| Gtd. Notes | | 8.13 | 3/1/19 | 4,395,000 | | 4,636,725 |
| Neiman Marcus Group, | | | | | | |
| Gtd. Notes | | 8.00 | 10/15/21 | 2,780,000 | b | 2,919,000 |
| Neiman Marcus Group, | | | | | | |
| Gtd. Notes | | 8.75 | 10/15/21 | 1,650,000 | b | 1,736,625 |
| New Look Bondco I, | | | | | | |
| Sr. Scd. Notes | GBP | 8.75 | 5/14/18 | 1,350,000 | | 2,371,353 |
| Rite Aid, | | | | | | |
| Gtd. Notes | | 6.75 | 6/15/21 | 6,240,000 | c | 6,575,400 |
| | | | | | | 18,239,103 |
| Technology—6.5% | | | | | | |
| ACI Worldwide, | | | | | | |
| Gtd. Notes | | 6.38 | 8/15/20 | 555,000 | b | 581,363 |
| Alcatel-Lucent USA, | | | | | | |
| Gtd. Notes | | 6.75 | 11/15/20 | 5,370,000 | b | 5,591,513 |
| Amkor Technology, | | | | | | |
| Sr. Unscd. Notes | | 6.38 | 10/1/22 | 3,155,000 | | 3,257,538 |
| Audatex North America, | | | | | | |
| Gtd. Notes | | 6.00 | 6/15/21 | 1,170,000 | b | 1,231,425 |
| Audatex North America, | | | | | | |
| Gtd. Notes | | 6.13 | 11/1/23 | 1,040,000 | b | 1,076,400 |
| BMC Software Finance, | | | | | | |
| Sr. Unscd. Notes | | 8.13 | 7/15/21 | 7,350,000 | b | 7,607,250 |
| Cardtronics, | | | | | | |
| Gtd. Notes | | 8.25 | 9/1/18 | 6,030,000 | | 6,512,400 |
| CDW Finance, | | | | | | |
| Sr. Scd. Notes | | 8.00 | 12/15/18 | 3,178,000 | d | 3,479,910 |
24
| | | | | | |
| | | Coupon | Maturity | Principal | | |
| Bonds and Notes (continued) | Rate (%) | Date | Amount ($)a | Value ($) |
| Technology (continued) | | | | | | |
| CDW Finance, | | | | | | |
| Gtd. Notes | | 8.50 | 4/1/19 | 1,714,000 | | 1,902,540 |
| Ceridian HCM Holding, | | | | | | |
| Sr. Unscd. Notes | | 11.00 | 3/15/21 | 1,345,000 | b | 1,556,838 |
| Ceridian, | | | | | | |
| Sr. Scd. Notes | | 8.88 | 7/15/19 | 2,050,000 | b | 2,367,750 |
| CommScope Holdings, | | | | | | |
| Sr. Unscd. Notes | | 6.63 | 6/1/20 | 3,685,000 | b | 3,850,825 |
| CommScope, | | | | | | |
| Gtd. Notes | | 8.25 | 1/15/19 | 4,835,000 | b | 5,324,544 |
| Denali Borrower, | | | | | | |
| Sr. Scd. Notes | | 5.63 | 10/15/20 | 3,780,000 | b,c | 3,756,375 |
| Eagle Midco, | | | | | | |
| Sr. Unscd. Notes | | 9.00 | 6/15/18 | 1,590,000 | b | 1,665,525 |
| Epicor Software, | | | | | | |
| Gtd. Notes | | 8.63 | 5/1/19 | 4,410,000 | | 4,806,900 |
| First Data, | | | | | | |
| Sr. Scd. Notes | | 6.75 | 11/1/20 | 680,000 | b | 710,600 |
| First Data, | | | | | | |
| Sr. Scd. Notes | | 7.38 | 6/15/19 | 4,745,000 | b | 5,077,150 |
| First Data, | | | | | | |
| Scd. Notes | | 8.25 | 1/15/21 | 1,979,000 | b,c | 2,115,056 |
| First Data, | | | | | | |
| Scd. Notes | | 8.75 | 1/15/22 | 3,000,000 | b | 3,217,500 |
| First Data, | | | | | | |
| Gtd. Notes | | 10.63 | 6/15/21 | 2,070,000 | b | 2,253,713 |
| First Data, | | | | | | |
| Gtd. Notes | | 11.25 | 1/15/21 | 2,035,000 | b | 2,256,306 |
| First Data, | | | | | | |
| Gtd. Notes | | 11.75 | 8/15/21 | 9,925,000 | b | 10,520,500 |
| Infor US, | | | | | | |
| Gtd. Notes | | 9.38 | 4/1/19 | 2,905,000 | | 3,282,650 |
| Infor US, | | | | | | |
| Gtd. Notes | EUR | 10.00 | 4/1/19 | 2,540,000 | | 3,931,077 |
| Interactive Data, | | | | | | |
| Gtd. Notes | | 10.25 | 8/1/18 | 3,995,000 | | 4,398,096 |
The Fund 25
STATEMENT OF INVESTMENTS (continued)
| | | | | | |
| | | Coupon | Maturity | Principal | | |
| Bonds and Notes (continued) | Rate (%) | Date | Amount ($)a | Value ($) |
| Technology (continued) | | | | | | |
| NCR, | | | | | | |
| Sr. Unscd. Notes | | 5.88 | 12/15/21 | 775,000 | b | 793,406 |
| NCR, | | | | | | |
| Sr. Unscd. Notes | | 6.38 | 12/15/23 | 975,000 | b | 1,000,594 |
| Sophia Holding, | | | | | | |
| Gtd. Notes | | 9.63 | 12/1/18 | 2,435,000 | b | 2,520,225 |
| Sophia, | | | | | | |
| Gtd. Notes | | 9.75 | 1/15/19 | 1,690,000 | b | 1,880,125 |
| TransUnion Holding, | | | | | | |
| Sr. Unscd. Notes | | 9.63 | 6/15/18 | 2,960,000 | | 3,196,800 |
| | | | | | | 101,722,894 |
| Transportation Services—1.5% | | | | | |
| AA Bond, | | | | | | |
| Scd. Notes | GBP | 9.50 | 7/31/43 | 2,560,000 | | 4,673,776 |
| Marquette | | | | | | |
| Transportation Finance, | | | | | | |
| Scd. Notes | | 10.88 | 1/15/17 | 6,565,000 | | 6,958,900 |
| Navios Maritime Acquisition, | | | | | | |
| Sr. Scd. Notes | | 8.13 | 11/15/21 | 6,265,000 | b | 6,421,625 |
| Navios South American Logistics, | | | | | |
| Gtd. Notes | | 9.25 | 4/15/19 | 4,540,000 | | 4,920,225 |
| | | | | | | 22,974,526 |
| Wireless Communications—5.5% | | | | | |
| Digicel Group, | | | | | | |
| Sr. Unscd. Notes | | 8.25 | 9/30/20 | 11,575,000 | b | 12,052,469 |
| Digicel Group, | | | | | | |
| Sr. Unscd. Notes | | 10.50 | 4/15/18 | 1,408,000 | b | 1,513,600 |
| Digicel, | | | | | | |
| Sr. Unscd. Notes | | 6.00 | 4/15/21 | 2,125,000 | b | 2,055,938 |
| Eileme 2, | | | | | | |
| Sr. Scd. Notes | | 11.63 | 1/31/20 | 6,085,000 | b | 7,355,116 |
| Sprint Capital, | | | | | | |
| Gtd. Notes | | 6.88 | 11/15/28 | 2,000,000 | | 1,895,000 |
| Sprint Communications, | | | | | | |
| Gtd. Notes | | 7.00 | 3/1/20 | 3,870,000 | b | 4,334,400 |
| Sprint Communications, | | | | | | |
| Sr. Unscd. Notes | | 7.00 | 8/15/20 | 5,055,000 | c | 5,497,313 |
26
| | | | | | |
| | | Coupon | Maturity | Principal | | |
| Bonds and Notes (continued) | Rate (%) | Date | Amount ($)a | Value ($) |
| Wireless Communications | | | | | | |
| (continued) | | | | | | |
| Sprint Communications, | | | | | | |
| Gtd. Notes | | 9.00 | 11/15/18 | 5,185,000 | b | 6,260,888 |
| Sprint Communications, | | | | | | |
| Sr. Unscd. Notes | | 11.50 | 11/15/21 | 2,525,000 | | 3,320,375 |
| Sprint, | | | | | | |
| Gtd. Notes | | 7.13 | 6/15/24 | 3,415,000 | b | 3,474,763 |
| Sprint, | | | | | | |
| Gtd. Notes | | 7.25 | 9/15/21 | 3,995,000 | b | 4,304,613 |
| Sprint, | | | | | | |
| Gtd. Notes | | 7.88 | 9/15/23 | 4,125,000 | b | 4,444,688 |
| T-Mobile USA, | | | | | | |
| Gtd. Notes | | 6.13 | 1/15/22 | 545,000 | | 555,900 |
| T-Mobile USA, | | | | | | |
| Gtd. Notes | | 6.50 | 1/15/24 | 745,000 | | 756,175 |
| T-Mobile USA, | | | | | | |
| Gtd. Notes | | 6.63 | 4/28/21 | 10,485,000 | | 11,074,781 |
| T-Mobile USA, | | | | | | |
| Gtd. Notes | | 6.84 | 4/28/23 | 4,080,000 | c | 4,248,300 |
| T-Mobile, | | | | | | |
| Gtd. Notes | | 6.73 | 4/28/22 | 3,735,000 | | 3,907,744 |
| Wind Acquisition Finance, | | | | | | |
| Sr. Scd. Notes | | 6.50 | 4/30/20 | 1,600,000 | b | 1,712,000 |
| Wind Acquisition Finance, | | | | | | |
| Sr. Scd. Notes | | 7.25 | 2/15/18 | 4,000,000 | b | 4,230,000 |
| Wind Acquisition Finance, | | | | | | |
| Scd. Notes | EUR | 11.75 | 7/15/17 | 715,000 | | 1,047,683 |
| Wind Acquisition Finance, | | | | | | |
| Scd. Notes | | 11.75 | 7/15/17 | 2,745,000 | b | 2,923,425 |
| | | | | | | 86,965,171 |
| Wireline Communications—2.9% | | | | | |
| CenturyLink, | | | | | | |
| Sr. Unscd. Notes, Ser. V | | 5.63 | 4/1/20 | 13,310,000 | | 13,609,475 |
| Centurylink, | | | | | | |
| Sr. Unscd. Notes, Ser. W | | 6.75 | 12/1/23 | 1,195,000 | | 1,215,913 |
| Cincinnati Bell, | | | | | | |
| Gtd. Notes | | 8.38 | 10/15/20 | 4,185,000 | | 4,561,650 |
The Fund 27
STATEMENT OF INVESTMENTS (continued)
| | | | | | | |
| | | Coupon | Maturity | Principal | | | |
| | Bonds and Notes (continued) | Rate (%) | Date | Amount ($)a | | Value ($) |
| | Wireline Communications (continued) | | | | | | |
| | Level 3 Financing, | | | | | | |
| | Gtd. Notes | 6.13 | 1/15/21 | 900,000 | b | | 911,250 |
| | Level 3 Financing, | | | | | | |
| | Gtd. Notes | 8.13 | 7/1/19 | 1,870,000 | | | 2,061,675 |
| | Level 3 Financing, | | | | | | |
| | Gtd. Notes | 8.63 | 7/15/20 | 8,100,000 | | | 9,112,500 |
| | Sable International Finance, | | | | | | |
| | Sr. Scd. Notes | 8.75 | 2/1/20 | 4,990,000 | b | | 5,638,700 |
| | tw telecom holdings, | | | | | | |
| | Gtd. Notes | 5.38 | 10/1/22 | 4,150,000 | b | | 4,087,750 |
| | Windstream, | | | | | | |
| | Gtd. Notes | 7.75 | 10/15/20 | 4,045,000 | c | | 4,312,981 |
| | | | | | | | 45,511,894 |
| | Total Bonds and Notes | | | | | | |
| | (cost $1,423,140,746) | | | | | | 1,497,737,039 |
| |
| | Preferred Stocks—.3% | | | Shares | | | Value ($) |
| | Finance Companies | | | | | | |
| | GMAC Capital Trust I, | | | | | | |
| | Ser. 2, 8.13% | | | | | | |
| (cost $4,475,208) | | | 172,552 | d | | 4,614,040 |
| | | | | Principal | | | |
| Short-Term Investments—.1% | | | Amount ($) | | | Value ($) |
| | U.S. Treasury Bills: | | | | | | |
| 0.01%, 1/2/14 | | | 680,000 | e | | 680,000 |
| | 0.04%, 6/12/14 | | | 680,000 | | | 679,852 |
| | Total Short-Term Investments | | | | | | |
| | (cost $1,359,877) | | | | | | 1,359,852 |
| |
| | Other Investment—3.2% | | | Shares | | | Value ($) |
| | Registered Investment Company; | | | | | | |
| | Dreyfus Institutional Preferred | | | | | | |
| | Plus Money Market Fund | | | | | | |
| | (cost $50,198,663) | | | 50,198,663 | f | 50,198,663 |
28
| | | | |
| Investment of Cash Collateral | | | | |
| for Securities Loaned—4.8% | Shares | | Value ($) | |
| Registered Investment Company; | | | | |
| Dreyfus Institutional Cash Advantage Fund | | | | |
| (cost $74,905,922) | 74,905,922 | f | 74,905,922 | |
| Total Investments (cost $1,554,080,416) | 103.4 | % | 1,628,815,516 | |
| Liabilities, Less Cash and Receivables | (3.4 | %) | (52,803,609 | ) |
| Net Assets | 100.0 | % | 1,576,011,907 | |
a Principal amount stated in U.S. Dollars unless otherwise noted.
EUR—Euro
GBP—British Pound
b Securities exempt from registration pursuant to Rule 144A under the Securities Act of 1933.These securities may be
resold in transactions exempt from registration, normally to qualified institutional buyers. At December 31, 2013,
these securities were valued at $629,921,705 or 40.0% of net assets.
c Security, or portion thereof, on loan. At December 31, 2013, the value of the fund’s securities on loan was
$109,565,088 and the value of the collateral held by the fund was $114,766,190, consisting of cash collateral of
$74,905,922 and U.S. Government and Agency securities valued at $39,860,268.
d Variable rate security—interest rate subject to periodic change.
e Held by a broker as collateral for open forward foreign currency exchange contracts.
f Investment in affiliated money market mutual fund.
| | | |
| Portfolio Summary (Unaudited)† | | |
| |
| | Value (%) | | Value (%) |
| Corporate Bonds | 95.0 | Preferred Stocks | .3 |
| Short-Term/ | | | |
| Money Market Investments | 8.1 | | 103.4 |
| |
| † Based on net assets. | | | |
| See notes to financial statements. | | | |
The Fund 29
STATEMENT OF ASSETS AND LIABILITIES
December 31, 2013
| | | | |
| | | Cost | Value | |
| Assets ($): | | | | |
| Investments in securities—See Statement of Investments (including | | | |
| securities on loan, valued at $109,565,088)—Note 1(c): | | | |
| Unaffiliated issuers | | 1,428,975,831 | 1,503,710,931 | |
| Affiliated issuers | | 125,104,585 | 125,104,585 | |
| Cash denominated in foreign currencies | | 2,803,403 | 2,818,854 | |
| Dividends, interest and securities lending income receivable | | 28,545,931 | |
| Receivable for investment securities sold | | | 2,335,199 | |
| Receivable for shares of Beneficial Interest subscribed | | 1,347,451 | |
| | | | 1,663,862,951 | |
| Liabilities ($): | | | | |
| Due to The Dreyfus Corporation and affiliates—Note 3(b) | | 1,078,699 | |
| Cash overdraft due to Custodian | | | 4,988,930 | |
| Liability for securities on loan—Note 1(c) | | | 74,905,922 | |
| Payable for investment securities purchased | | | 3,394,169 | |
| Payable for shares of Beneficial Interest redeemed | | 2,061,766 | |
| Unrealized depreciation on forward foreign | | | | |
| currency exchange contracts—Note 4 | | | 1,404,739 | |
| Accured expenses | | | 16,819 | |
| | | | 87,851,044 | |
| Net Assets ($) | | | 1,576,011,907 | |
| Composition of Net Assets ($): | | | | |
| Paid-in capital | | | 1,588,195,551 | |
| Accumulated undistributed investment income—net | | 1,707,127 | |
| Accumulated net realized gain (loss) on investments | | (87,284,168 | ) |
| Accumulated net unrealized appreciation (depreciation) | | | |
| on investments and foreign currency transactions | | 73,393,397 | |
| Net Assets ($) | | | 1,576,011,907 | |
| |
| |
| Net Asset Value Per Share | | | | |
| | Class A | Class C | Class I | |
| Net Assets ($) | 319,981,105 | 105,686,141 | 1,150,344,661 | |
| Shares Outstanding | 47,456,512 | 15,669,269 | 170,471,950 | |
| Net Asset Value Per Share ($) | 6.74 | 6.74 | 6.75 | |
| |
| See notes to financial statements. | | | | |
30
STATEMENT OF OPERATIONS
Year Ended December 31, 2013
| | |
| Investment Income ($): | | |
| Income: | | |
| Interest | 97,081,653 | |
| Income from securities lending—Note 1(c) | 567,247 | |
| Dividends: | | |
| Unaffiliated issuers | 350,496 | |
| Affiliated issuers | 41,562 | |
| Total Income | 98,040,958 | |
| Expenses: | | |
| Management fee—Note 3(a) | 10,191,848 | |
| Distribution/Service Plan fees—Note 3(b) | 1,928,150 | |
| Trustees’ fees—Notes 3(a,c) | 104,627 | |
| Loan commitment fees—Note 2 | 12,797 | |
| Total Expenses | 12,237,422 | |
| Less—Trustees’ fees reimbursed by the Manager—Note 3(a) | (104,627 | ) |
| Net Expenses | 12,132,795 | |
| Investment Income—Net | 85,908,163 | |
| Realized and Unrealized Gain (Loss) on Investments—Note 4 ($): | | |
| Net realized gain (loss) on investments and foreign currency transactions | 28,858,919 | |
| Net realized gain (loss) on forward foreign currency exchange contracts | (1,749,693 | ) |
| Net Realized Gain (Loss) | 27,109,226 | |
| Net unrealized appreciation (depreciation) on | | |
| investments and foreign currency transactions | (3,804,652 | ) |
| Net unrealized appreciation (depreciation) on | | |
| forward foreign currency exchange transactions | (1,195,301 | ) |
| Net Unrealized Appreciation (Depreciation) | (4,999,953 | ) |
| Net Realized and Unrealized Gain (Loss) on Investments | 22,109,273 | |
| Net Increase in Net Assets Resulting from Operations | 108,017,436 | |
| |
| See notes to financial statements. | | |
The Fund 31
STATEMENT OF CHANGES IN NET ASSETS
| | | | |
| | Year Ended December 31, | |
| | 2013 | | 2012 | a |
| Operations ($): | | | | |
| Investment income—net | 85,908,163 | | 79,572,107 | |
| Net realized gain (loss) on investments | 27,109,226 | | (3,050,539 | ) |
| Net unrealized appreciation | | | | |
| (depreciation) on investments | (4,999,953 | ) | 90,822,488 | |
| Net Increase (Decrease) in Net Assets | | | | |
| Resulting from Operations | 108,017,436 | | 167,344,056 | |
| Dividends to Shareholders from ($): | | | | |
| Investment income—net: | | | | |
| Class A | (19,921,327 | ) | (23,836,494 | ) |
| Class B | — | | (29,726 | ) |
| Class C | (6,119,236 | ) | (7,267,383 | ) |
| Class I | (65,650,917 | ) | (51,923,666 | ) |
| Total Dividends | (91,691,480 | ) | (83,057,269 | ) |
| Beneficial Interest Transactions ($): | | | | |
| Net proceeds from shares sold: | | | | |
| Class A | 115,865,295 | | 153,542,445 | |
| Class B | — | | 652 | |
| Class C | 7,459,587 | | 14,868,027 | |
| Class I | 509,057,464 | | 463,622,267 | |
| Dividends reinvested: | | | | |
| Class A | 16,644,149 | | 19,235,313 | |
| Class B | — | | 19,736 | |
| Class C | 3,646,392 | | 4,359,511 | |
| Class I | 24,974,920 | | 18,949,417 | |
| Cost of shares redeemed: | | | | |
| Class A | (176,615,181 | ) | (176,535,171 | ) |
| Class B | — | | (2,713,460 | ) |
| Class C | (30,451,410 | ) | (22,916,809 | ) |
| Class I | (301,952,485 | ) | (202,560,483 | ) |
| Increase (Decrease) in Net Assets from | | | | |
| Beneficial Interest Transactions | 168,628,731 | | 269,871,445 | |
| Total Increase (Decrease) in Net Assets | 184,954,687 | | 354,158,232 | |
| Net Assets ($): | | | | |
| Beginning of Period | 1,391,057,220 | | 1,036,898,988 | |
| End of Period | 1,576,011,907 | | 1,391,057,220 | |
| Undistributed investment income—net | 1,707,127 | | 838,286 | |
32
| | | | |
| | Year Ended December 31, | |
| | 2013 | | 2012 | a |
| Capital Share Transactions: | | | | |
| Class Ab,c | | | | |
| Shares sold | 17,322,009 | | 23,971,040 | |
| Shares issued for dividends reinvested | 2,484,259 | | 2,969,777 | |
| Shares redeemed | (26,368,580 | ) | (27,476,194 | ) |
| Net Increase (Decrease) in Shares Outstanding | (6,562,312 | ) | (535,377 | ) |
| Class Bc | | | | |
| Shares sold | — | | 102 | |
| Shares issued for dividends reinvested | — | | 3,078 | |
| Shares redeemed | — | | (422,169 | ) |
| Net Increase (Decrease) in Shares Outstanding | — | | (418,989 | ) |
| Class Cb | | | | |
| Shares sold | 1,110,797 | | 2,306,667 | |
| Shares issued for dividends reinvested | 544,461 | | 672,978 | |
| Shares redeemed | (4,534,845 | ) | (3,538,459 | ) |
| Net Increase (Decrease) in Shares Outstanding | (2,879,587 | ) | (558,814 | ) |
| Class I | | | | |
| Shares sold | 76,084,584 | | 71,783,224 | |
| Shares issued for dividends reinvested | 3,727,746 | | 2,919,459 | |
| Shares redeemed | (45,318,990 | ) | (31,519,231 | ) |
| Net Increase (Decrease) in Shares Outstanding | 34,493,340 | | 43,183,452 | |
a Effective as of the close of business on March 13, 2012, the fund no longer offers Class B shares.
b During the period ended December 31, 2013, 565,705 Class C shares representing $3,877,652 were exchanged
for 566,908 Class A shares.
c During the period ended December 31, 2012, 159,411 Class B shares representing $1,025,594 were automatically
converted to 159,411 Class A shares.
See notes to financial statements.
The Fund 33
FINANCIAL HIGHLIGHTS
The following tables describe the performance for each share class for the fiscal periods indicated. All information (except portfolio turnover rate) reflects financial results for a single fund share.Total return shows how much your investment in the fund would have increased (or decreased) during each period, assuming you had reinvested all dividends and distributions.These figures have been derived from the fund’s financial statements.
| | | | | | | | | | |
| | | | Year Ended December 31, | | | |
| Class A | 2013 | | 2012 | | 2011 | | 2010 | | 2009 | |
| Per Share Data ($): | | | | | | | | | | |
| Net asset value, beginning of period | 6.67 | | 6.21 | | 6.62 | | 6.48 | | 5.06 | |
| Investment Operations: | | | | | | | | | | |
| Investment income—neta | .38 | | .41 | | .49 | | .59 | | .54 | |
| Net realized and unrealized | | | | | | | | | | |
| gain (loss) on investments | .10 | | .48 | | (.40 | ) | .17 | | 1.43 | |
| Total from Investment Operations | .48 | | .89 | | .09 | | .76 | | 1.97 | |
| Distributions: | | | | | | | | | | |
| Dividends from investment income—net | (.41 | ) | (.43 | ) | (.50 | ) | (.62 | ) | (.55 | ) |
| Net asset value, end of period | 6.74 | | 6.67 | | 6.21 | | 6.62 | | 6.48 | |
| Total Return (%)b | 7.49 | | 14.74 | | 1.33 | | 12.50 | | 40.43 | |
| Ratios/Supplemental Data (%): | | | | | | | | | | |
| Ratio of total expenses | | | | | | | | | | |
| to average net assets | .96 | | .96 | | .96 | | .96 | | .96 | |
| Ratio of net expenses | | | | | | | | | | |
| to average net assets | .95 | | .95 | | .95 | | .95 | | .95 | |
| Ratio of net investment income | | | | | | | | | | |
| to average net assets | 5.79 | | 6.35 | | 7.50 | | 9.05 | | 8.86 | |
| Portfolio Turnover Rate | 46.05 | | 51.72 | | 75.87 | | 70.07 | | 77.94 | |
| Net Assets, end of period ($ x 1,000) | 319,981 | | 360,128 | | 338,800 | | 346,594 | | 360,921 | |
a Based on average shares outstanding at each month end.
b Exclusive of sales charge.
See notes to financial statements.
34
| | | | | | | | | | |
| | | | Year Ended December 31, | | | |
| Class C | 2013 | | 2012 | | 2011 | | 2010 | | 2009 | |
| Per Share Data ($): | | | | | | | | | | |
| Net asset value, beginning of period | 6.67 | | 6.21 | | 6.62 | | 6.48 | | 5.06 | |
| Investment Operations: | | | | | | | | | | |
| Investment income—neta | .34 | | .36 | | .44 | | .54 | | .50 | |
| Net realized and unrealized | | | | | | | | | | |
| gain (loss) on investments | .09 | | .48 | | (.40 | ) | .18 | | 1.42 | |
| Total from Investment Operations | .43 | | .84 | | .04 | | .72 | | 1.92 | |
| Distributions: | | | | | | | | | | |
| Dividends from investment income—net | (.36 | ) | (.38 | ) | (.45 | ) | (.58 | ) | (.50 | ) |
| Net asset value, end of period | 6.74 | | 6.67 | | 6.21 | | 6.62 | | 6.48 | |
| Total Return (%)b | 6.69 | | 13.89 | | .58 | | 11.66 | | 39.41 | |
| Ratios/Supplemental Data (%): | | | | | | | | | | |
| Ratio of total expenses | | | | | | | | | | |
| to average net assets | 1.71 | | 1.71 | | 1.71 | | 1.71 | | 1.71 | |
| Ratio of net expenses | | | | | | | | | | |
| to average net assets | 1.70 | | 1.70 | | 1.70 | | 1.70 | | 1.70 | |
| Ratio of net investment income | | | | | | | | | | |
| to average net assets | 5.05 | | 5.60 | | 6.76 | | 8.31 | | 8.15 | |
| Portfolio Turnover Rate | 46.05 | | 51.72 | | 75.87 | | 70.07 | | 77.94 | |
| Net Assets, end of period ($ x 1,000) | 105,686 | | 123,693 | | 118,706 | | 128,173 | | 125,724 | |
a Based on average shares outstanding at each month end.
b Exclusive of sales charge.
See notes to financial statements.
The Fund 35
FINANCIAL HIGHLIGHTS (continued)
| | | | | | | | | | |
| | | | Year Ended December 31, | | | |
| Class I | 2013 | | 2012 | | 2011 | | 2010 | | 2009 | |
| Per Share Data ($): | | | | | | | | | | |
| Net asset value, beginning of period | 6.67 | | 6.22 | | 6.62 | | 6.49 | | 5.06 | |
| Investment Operations: | | | | | | | | | | |
| Investment income—neta | .40 | | .43 | | .50 | | .60 | | .54 | |
| Net realized and unrealized | | | | | | | | | | |
| gain (loss) on investments | .11 | | .47 | | (.38 | ) | .17 | | 1.45 | |
| Total from Investment Operations | .51 | | .90 | | .12 | | .17 | | 1.99 | |
| Distributions: | | | | | | | | | | |
| Dividends from investment income—net | (.43 | ) | (.45 | ) | (.52 | ) | (.64 | ) | (.56 | ) |
| Net asset value, end of period | 6.75 | | 6.67 | | 6.22 | | 6.62 | | 6.49 | |
| Total Return (%) | 7.92 | | 14.84 | | 1.74 | | 12.59 | | 40.99 | |
| Ratios/Supplemental Data (%): | | | | | | | | | | |
| Ratio of total expenses | | | | | | | | | | |
| to average net assets | .71 | | .71 | | .71 | | .71 | | .71 | |
| Ratio of net expenses | | | | | | | | | | |
| to average net assets | .70 | | .70 | | .70 | | .70 | | .70 | |
| Ratio of net investment income | | | | | | | | | | |
| to average net assets | 6.03 | | 6.57 | | 7.73 | | 9.26 | | 9.20 | |
| Portfolio Turnover Rate | 46.05 | | 51.72 | | 75.87 | | 70.07 | | 77.94 | |
| Net Assets, end of period ($ x 1,000) | 1,150,345 | | 907,236 | | 576,790 | | 543,899 | | 400,170 | |
| |
| a Based on average shares outstanding at each month end. | | | | | | | | | |
| See notes to financial statements. | | | | | | | | | | |
36
NOTES TO FINANCIAL STATEMENTS
NOTE 1—Significant Accounting Policies:
Dreyfus HighYield Fund (the “fund”) is a separate diversified series of The Dreyfus/Laurel Funds Trust (the “Trust”), which is registered under the Investment Company Act of 1940, as amended (the “Act”), as an open-end management investment company and operates as a series company currently offering five series, including the fund.The fund’s investment objective seeks to maximize total return, consisting of capital appreciation and current income.The Dreyfus Corporation (the “Manager” or “Dreyfus”), a wholly-owned subsidiary of The Bank of New York Mellon Corporation (“BNY Mellon”), serves as the fund’s investment adviser.
MBSC Securities Corporation (the “Distributor”), a wholly-owned subsidiary of the Manager, is the distributor of the fund’s shares. The fund is authorized to issue an unlimited number of $.001 par value shares of Beneficial Interest in each of the following classes of shares: Class A, Class C and Class I. Class A and Class C shares are sold primarily to retail investors through financial intermediaries and bear a Distribution and/or Services Plan fees. Class A shares generally are subject to a sales charge imposed at the time of purchase. Class C shares are subject to a contingent deferred sales charge (“CDSC”) imposed on Class C shares redeemed within one year of purchase. Class I shares are sold primarily to bank trust departments and other financial service providers (including The Bank of New York Mellon, a subsidiary of BNY Mellon and an affiliate of Dreyfus, and its affiliates), acting on behalf of customers having a qualified trust or an investment account or relationship at such institution, and bear no Distribution or Services Plan fees. Class I shares are offered without a front-end sales charge or CDSC. Other differences between the classes include the services offered to and the expenses borne by each class, the allocation of cer-
The Fund 37
NOTES TO FINANCIAL STATEMENTS (continued)
tain transfer agency costs, and certain voting rights. Income, expenses (other than expenses attributable to a specific class), and realized and unrealized gains or losses on investments are allocated to each class of shares based on its relative net assets.
The Trust accounts separately for the assets, liabilities and operations of each series. Expenses directly attributable to each series are charged to that series’ operations; expenses which are applicable to all series are allocated among them on a pro rata basis.
The Financial Accounting Standards Board (“FASB”) Accounting Standards Codification is the exclusive reference of authoritative U.S. generally accepted accounting principles (“GAAP”) recognized by the FASB to be applied by nongovernmental entities. Rules and interpretive releases of the Securities and Exchange Commission (“SEC”) under authority of federal laws are also sources of authoritative GAAP for SEC registrants. The fund’s financial statements are prepared in accordance with GAAP, which may require the use of management estimates and assumptions.Actual results could differ from those estimates.
(a) Portfolio valuation: The fair value of a financial instrument is the amount that would be received to sell an asset or paid to transfer a liability in an orderly transaction between market participants at the measurement date (i.e., the exit price). GAAP establishes a fair value hierarchy that prioritizes the inputs of valuation techniques used to measure fair value. This hierarchy gives the highest priority to unadjusted quoted prices in active markets for identical assets or liabilities (Level 1 measurements) and the lowest priority to unobservable inputs (Level 3 measurements).
Additionally, GAAP provides guidance on determining whether the volume and activity in a market has decreased significantly and whether such a decrease in activity results in transactions that are not orderly. GAAP requires enhanced disclosures around valuation inputs and techniques used during annual and interim periods.
38
Various inputs are used in determining the value of the fund’s investments relating to fair value measurements.These inputs are summarized in the three broad levels listed below:
Level 1—unadjusted quoted prices in active markets for identical investments.
Level 2—other significant observable inputs (including quoted prices for similar investments, interest rates, prepayment speeds, credit risk, etc.).
Level 3—significant unobservable inputs (including the fund’s own assumptions in determining the fair value of investments).
The inputs or methodology used for valuing securities are not necessarily an indication of the risk associated with investing in those securities.
Changes in valuation techniques may result in transfers in or out of an assigned level within the disclosure hierarchy. Valuation techniques used to value the fund’s investments are as follows:
Registered investment companies that are not traded on an exchange are valued at their net asset value and are categorized within Level 1 of the fair value hierarchy.
Investments in securities, excluding short-term investments (other than U.S. Treasury Bills) and forward foreign currency exchange contracts (“forward contracts”) are valued each business day by an independent pricing service (the “Service”) approved by the Trust’s Board of Trustees (the “Board”). Investments for which quoted bid prices are readily available and are representative of the bid side of the market in the judgment of the Service are valued at the mean between the quoted bid prices (as obtained by the Service from dealers in such securities) and asked prices (as calculated by the Service based upon its evaluation of the market for such securities). Other investments (which constitute a majority of the portfolio securities) are valued as determined by the Service, based on methods which include consideration of the follow-
The Fund 39
NOTES TO FINANCIAL STATEMENTS (continued)
ing: yields or prices of securities of comparable quality, coupon, maturity and type; indications as to values from dealers; and general market conditions.These securities are generally categorized within Level 2 of the fair value hierarchy.
U.S. Treasury Bills are valued at the mean price between quoted bid prices and asked prices by the Service. These securities are generally categorized within Level 2 of the fair value hierarchy.
The Service’s procedures are reviewed by Dreyfus under the general supervision of the Board.
When market quotations or official closing prices are not readily available, or are determined not to reflect accurately fair value, such as when the value of a security has been significantly affected by events after the close of the exchange or market on which the security is principally traded (for example, a foreign exchange or market), but before the fund calculates its net asset value, the fund may value these investments at fair value as determined in accordance with the procedures approved by the Board. Certain factors may be considered when fair valuing investments such as: fundamental analytical data, the nature and duration of restrictions on disposition, an evaluation of the forces that influence the market in which the securities are purchased and sold, and public trading in similar securities of the issuer or comparable issuers.These securities are either categorized within Level 2 or 3 of the fair value hierarchy depending on the relevant inputs used.
For restricted securities where observable inputs are limited, assumptions about market activity and risk are used and are categorized within Level 3 of the fair value hierarchy.
Investments denominated in foreign currencies are translated to U.S. dollars at the prevailing rates of exchange.
Forward contracts are valued at the forward rate and are generally categorized within Level 2 of the fair value hierarchy.
40
The following is a summary of the inputs used as of December 31, 2013 in valuing the fund’s investments:
| | | | | | |
| | | Level 2—Other | | Level 3— | | |
| | Level 1— | Significant | | Significant | | |
| | Unadjusted | Observable | | Unobservable | | |
| | Quoted Prices | Inputs | | Inputs | Total | |
| Assets ($) | | | | | | |
| Investments in Securities: | | | | | |
| Corporate Bonds† | — | 1,497,737,039 | | — | 1,497,737,039 | |
| Mutual Funds | 125,104,585 | — | | — | 125,104,585 | |
| Preferred Stocks† | — | 4,614,040 | | — | 4,614,040 | |
| U.S. Treasury | — | 1,359,852 | | — | 1,359,852 | |
| Liabilities ($) | | | | | | |
| Other Financial | | | | | | |
| Instruments: | | | | | | |
| Forward Foreign | | | | | | |
| Currency Exchange | | | | | |
| Contracts†† | — | (1,404,739 | ) | — | (1,404,739 | ) |
† See Statement of Investments for additional detailed categorizations.
Amount shown represents unrealized (depreciation) at period end.
At December 31, 2013, there were no transfers between Level 1 and Level 2 of the fair value hierarchy.
(b) Foreign currency transactions: The fund does not isolate that portion of the results of operations resulting from changes in foreign exchange rates on investments from the fluctuations arising from changes in the market prices of securities held. Such fluctuations are included with the net realized and unrealized gain or loss on investments.
Net realized foreign exchange gains or losses arise from sales of foreign currencies, currency gains or losses realized on securities transactions between trade and settlement date, and the difference between the amounts of dividends, interest and foreign withholding taxes recorded on the fund’s books and the U.S. dollar equivalent of the amounts actually received or paid. Net unrealized foreign exchange gains and losses
The Fund 41
NOTES TO FINANCIAL STATEMENTS (continued)
arise from changes in the value of assets and liabilities other than investments resulting from changes in exchange rates. Foreign currency gains and losses on foreign currency transactions are also included with net realized and unrealized gain or loss on investments.
(c) Securities transactions and investment income: Securities transactions are recorded on a trade date basis. Realized gains and losses from securities transactions are recorded on the identified cost basis. Dividend income is recognized on the ex-dividend date and interest income, including, where applicable, accretion of discount and amortization of premium on investments, is recognized on the accrual basis.
Pursuant to a securities lending agreement withThe Bank of NewYork Mellon, the fund may lend securities to qualified institutions. It is the fund’s policy that, at origination, all loans are secured by collateral of at least 102% of the value of U.S. securities loaned and 105% of the value of foreign securities loaned. Collateral equivalent to at least 100% of the market value of securities on loan is maintained at all times. Collateral is either in the form of cash, which can be invested in certain money market mutual funds managed by the Manager or U.S. Government and Agency securities. The fund is entitled to receive all dividends, interest and distributions on securities loaned, in addition to income earned as a result of the lending transaction. Should a borrower fail to return the securities in a timely manner,The Bank of NewYork Mellon is required to replace the securities for the benefit of the fund or credit the fund with the market value of the unreturned securities and is subrogated to the fund’s rights against the borrower and the collateral. During the period ended December 31, 2013,The Bank of New York Mellon earned $127,256 from lending portfolio securities, pursuant to the securities lending agreement.
(d) Affiliated issuers: Investments in other investment companies advised by Dreyfus are defined as “affiliated” under the Act. Investments
42
in affiliated investment companies during the period ended December 31, 2013 were as follows:
| | | | | |
| Affiliated | | | | | |
| Investment | Value($) | | | Value | Net |
| Company | 12/31/2012 | Purchases($) | Sales ($) | 12/31/2013($) | Assets (%) |
| Dreyfus | | | | | |
| Institutional | | | | |
| Preferred | | | | | |
| Plus Money | | | | |
| Market | | | | | |
| Fund | 31,716,999 | 601,795,243 | 583,313,579 | 50,198,663 | 3.2 |
| Dreyfus | | | | | |
| Institutional | | | | |
| Cash | | | | | |
| Advantage | | | | |
| Fund | 96,805,579 | 356,007,385 | 377,907,042 | 74,905,922 | 4.8 |
| Total | 128,522,578 | 957,802,628 | 961,220,621 | 125,104,585 | 8.0 |
(e) Risk: The fund invests primarily in debt securities. Failure of an issuer of the debt securities to make timely interest or principal payments, or a decline or the perception of a decline in the credit quality of a debt security, can cause the debt security’s price to fall, potentially lowering the fund’s share price. High yield (“junk”) bonds involve greater credit risk, including the risk of default, than investment grade bonds, and are considered predominantly speculative with respect to the issuer’s continuing ability to make principal and interest payments. In addition, the value of debt securities may decline due to general market conditions that are not specifically related to a particular issuer, such as real or perceived adverse economic conditions, changes in outlook for corporate earnings, changes in interest or currency rates or adverse investor sentiment.They may also decline because of factors that affect a particular industry.
(f) Dividends to shareholders: Dividends are recorded on the ex-dividend date. Dividends from investment income-net are normally declared daily and paid monthly. Dividends from net realized capital gains, if any, are normally declared and paid annually, but the fund may
The Fund 43
NOTES TO FINANCIAL STATEMENTS (continued)
make distributions on a more frequent basis to comply with the distribution requirements of the Internal Revenue Code of 1986, as amended (the “Code”).To the extent that net realized capital gains can be offset by capital loss carryovers, it is the policy of the fund not to distribute such gains. Income and capital gain distributions are determined in accordance with income tax regulations, which may differ from GAAP.
(g) Federal income taxes: It is the policy of the fund to continue to qualify as a regulated investment company, if such qualification is in the best interests of its shareholders, by complying with the applicable provisions of the Code, and to make distributions of taxable income sufficient to relieve it from substantially all federal income and excise taxes.
As of and during the period ended December 31, 2013, the fund did not have any liabilities for any uncertain tax positions.The fund recognizes interest and penalties, if any, related to uncertain tax positions as income tax expense in the Statement of Operations. During the period ended December 31, 2013, the fund did not incur any interest or penalties.
Each tax year in the four-year period ended December 31, 2013 remains subject to examination by the Internal Revenue Service and state taxing authorities.
At December 31, 2013, the components of accumulated earnings on a tax basis were as follows: undistributed ordinary income $1,707,127, accumulated capital losses $81,246,122 and unrealized appreciation $68,100,188. In addition, the fund had $744,837 of capital losses realized after October 31, 2013, which were deferred for tax purposes to the first day of the following fiscal year.
Under the Regulated Investment Company Modernization Act of 2010 (the “2010 Act”), the fund is permitted to carry forward capital losses incurred in taxable years beginning after December 22, 2010
44
(“post-enactment losses”) for an unlimited period. Furthermore, post-enactment capital loss carryovers retain their character as either short-term or long-term capital losses rather than short-term as they were under previous statute.The 2010 Act requires post-enactment losses to be utilized before the utilization of losses incurred in taxable years prior to the effective date of the 2010 Act (“pre-enactment losses”).As a result of this ordering rule, pre-enactment losses may be more likely to expire unused.
The accumulated capital loss carryover is available for federal income tax purposes to be applied against future net realized capital gains, if any, realized subsequent to December 31, 2013. If not applied, $15,223,557 of the carryover expires in fiscal year 2015, $42,229,566 expires in fiscal year 2016 and $23,792,999 expires in fiscal year 2017. Based on certain provisions in the Code, various limitations regarding the future utilization of these carry forwards, brought forward as a result of the fund’s merger with the following funds apply: BNY Hamilton High Yield Fund and Dreyfus High Income Fund.
The tax character of distributions paid to shareholders during the fiscal periods ended December 31, 2013 and December 31, 2012 were follows: ordinary income $91,691,480 and $83,057,269, respectively.
During the period ended December 31, 2013, as a result of permanent book to tax differences, primarily due to the tax treatment for consent fees, amortization of premiums and foreign currency transactions, the fund increased accumulated undistributed investment income-net by $6,652,158 and decreased accumulated net realized gain (loss) on investments by the same amount. Net assets and net asset value per share were not affected by this reclassification.
The Fund 45
NOTES TO FINANCIAL STATEMENTS (continued)
NOTE 2—Bank Lines of Credit:
The fund participates with other Dreyfus-managed funds in a $265 million unsecured credit facility led by Citibank, N.A. and a $300 million unsecured credit facility provided by The Bank of New York Mellon (each, a “Facility”), each to be utilized primarily for temporary or emergency purposes, including the financing of redemptions. Prior to October 9, 2013, the unsecured credit facility with Citibank, N.A. was $210 million. In connection therewith, the fund has agreed to pay its pro rata portion of commitment fees for each Facility. Interest is charged to the fund based on rates determined pursuant to the terms of the respective Facility at the time of borrowing. During the period ended December 31, 2013, the fund did not borrow under the Facilities.
NOTE 3—Investment Management Fee and Other Transactions With Affiliates:
(a) Pursuant to management agreement with the Manager, the management fee provides or arranges for one or more third parties and/or affiliates to provide investment advisory, administrative, custody, fund accounting and transfer agency services to the fund.The Manager also directs the investments of the fund in accordance with its investment objective, policies and limitations. For these services, the fund is contractually obligated to pay the Manager a fee, calculated daily and paid monthly, at the annual rate of .70% of the value of the fund’s average daily net assets. Out of its fee, the Manager pays all of the expenses of the fund (excluding brokerage commissions, taxes, interest expense, commitment fees on borrowings, Rule 12b-1 Distribution Plan fees, Services Plan fees, fees and expenses of non-interested Trustees (including counsel fees) and extraordinary expenses). In addition, the Manager is required to reduce its fee in an amount equal to the fund’s allocable portion of fees and expenses of the non-interested Trustees (including counsel fees). During the period ended December 31, 2013, Trustees’ fees reimbursed by the Manager amounted to $104,627.
46
During the period ended December 31, 2013, the Distributor retained $11,053 from commissions earned on sales of the fund’s Class A shares and $4,694 from CDSCs on redemptions of the fund’s Class C shares.
(b) Under the Distribution Plans adopted pursuant to Rule 12b-1 (the “Distribution Plans”) under the Act, Class A shares pay annually up to .25% of the value of its average daily net assets to compensate the Distributor for shareholder servicing activities and expenses primarily intended to result in the sale of Class A shares. Class C shares pay the Distributor for distributing its shares at an aggregate annual rate of .75% of the value of the average daily net assets of Class C shares. Class C shares are also subject to a service plan adopted pursuant to Rule 12b-1 (the “Service Plan”), under which Class C shares pay the Distributor for providing certain services to the holders of their shares, a fee at the annual rate of .25% of the value of the average daily net assets of Class C shares. During the period ended December 31, 2013, Class A and Class C shares were charged $805,199 and $842,213, respectively, pursuant to their Distribution Plans. During the period ended December 31, 2013, Class C shares were charged $280,738, pursuant to the Service Plan.
Under its terms, the Distribution Plans and Service Plan shall remain in effect from year to year, provided such continuance is approved annually by a vote of a majority of those Trustees who are not “interested persons” of the Trust and who have no direct or indirect financial interest in the operation of or in any agreement related to the Distribution Plans or Service Plan.
The components of “Due to The Dreyfus Corporation and affiliates” in the Statement of Assets and Liabilities consist of: management fees $929,707, Distribution Plans fees $135,118 and Service Plan fees $22,433 which are offset against an expense reimbursement currently in effect in the amount of $8,559.
The Fund 47
NOTES TO FINANCIAL STATEMENTS (continued)
(c) Each Board member also serves as a Board member of other funds within the Dreyfus complex. Annual retainer fees and attendance fees are allocated to each fund based on net assets.
NOTE 4—Securities Transactions:
The aggregate amount of purchases and sales of investment securities, excluding short-term securities and forward contracts, during the period ended December 31, 2013, amounted to $788,161,182 and $642,554,194, respectively.
Derivatives: A derivative is a financial instrument whose performance is derived from the performance of another asset. Each type of derivative instrument that was held by the fund during the period ended December 31, 2013 is discussed below.
Forward Foreign Currency Exchange Contracts: The fund enters into forward contracts in order to hedge its exposure to changes in foreign currency exchange rates on its foreign portfolio holdings, to settle foreign currency transactions or as a part of its investment strategy. When executing forward contracts, the fund is obligated to buy or sell a foreign currency at a specified rate on a certain date in the future.With respect to sales of forward contracts, the fund incurs a loss if the value of the contract increases between the date the forward contract is opened and the date the forward contract is closed.The fund realizes a gain if the value of the contract decreases between those dates.With respect to purchases of forward contracts, the fund incurs a loss if the value of the contract decreases between the date the forward contract is opened and the date the forward contract is closed.The fund realizes a gain if the value of the contract increases between those dates.Any realized or unrealized gains or losses which occurred during the period are reflected in the Statement of Operations.The fund is exposed to foreign currency risk as a result of changes in value of underlying financial instruments.The
48
fund is also exposed to credit risk associated with counterparty nonper-formance on these forward contracts, which is generally limited to the unrealized gain on each open contract.The following summarizes open forward contracts at December 31, 2013:
| | | | | | |
| | | Foreign | | | | |
| Forward Foreign Currency | | Currency | | | Unrealized | |
| Exchange Contracts | | Amounts | Proceeds ($) | Value ($) (Depreciation) ($) | |
| Sales: | | | | | | |
| British Pound, | | | | | | |
| Expiring | | | | | | |
| 1/31/2014 | a | 7,860,000 | 12,689,632 | 13,013,152 | (323,520 | ) |
| Euro, | | | | | | |
| Expiring: | | | | | | |
| 1/31/2014 | a | 15,105,000 | 20,440,887 | 20,779,739 | (338,852 | ) |
| 1/31/2014 | b | 12,060,000 | 16,363,047 | 16,590,775 | (227,728 | ) |
| 1/31/2014 | c | 12,650,000 | 17,124,428 | 17,402,429 | (278,001 | ) |
| 1/31/2014 | d | 8,210,000 | 11,057,745 | 11,294,383 | (236,638 | ) |
| | | | | | (1,404,739 | ) |
Counterparties:
a Goldman Sachs International
b Barclays Bank
c Commonwealth Bank of Australia
d Morgan Stanley Capital Services
In December 2011, with clarification in January 2013, FASB issued guidance that expands disclosure requirements with respect to the offsetting of certain assets and liabilities.The fund adopted these disclosure provisions during the current reporting period.These disclosures are required for certain investments, including derivative financial instruments subject to master netting arrangements (“MNA”) or similar agreements which are eligible for offsetting in the Statement of Assets and Liabilities and require the fund to disclose both gross and net information with respect to such investments. For financial reporting purposes, the fund does not offset derivative assets and derivative liabilities that are subject to MNA in the Statement of Assets and Liabilities.
The Fund 49
NOTES TO FINANCIAL STATEMENTS (continued)
At December 31, 2013, derivative assets and liabilities (by type) on a gross basis are as follows:
| | | |
| Derivative Financial Instruments: | Assets ($) | Liabilities ($) | |
| Forward contracts | — | (1,404,739 | ) |
| Total gross amount of derivative assets | | | |
| and liabilities in the Statement of | | | |
| Assets and Liabilities | — | (1,404,739 | ) |
| Derivatives not subject to | | | |
| MNA or similar agreements | — | — | |
| Total gross amount of assets and | | | |
| liabilities subject to MNA or | | | |
| similar agreements | — | (1,404,739 | ) |
The following table presents derivative assets and liabilities net of amounts available for offsetting under MNA and net of related collateral received or pledged, if any, as of December 31, 2013:
Gross Amounts Not Offset in the Statement of Assets and Liabilities and Subject to MNA †
| | | | | | | |
| | Gross Amount of | | Financial | | | | |
| Liabilities Presented | | Instruments | | | | |
| | in the Statement | | and | | | | |
| | of Assets and | | Derivatives | Securities | Cash | | |
| | Liabilities by the | | Available | Collateral | Collateral | Net Amounts of | |
| Counterparty | Counterparty ($)1 | | for Offset ($) | Pledged ($)2 | Pledged ($)2 | Liabilities ($) | |
| Barclays Bank | (227,728 | ) | — | — | — | (227,728 | ) |
| Commonwealth | | | | | | | |
| Bank of | | | | | | | |
| Australia | (278,001 | ) | — | — | — | (278,001 | ) |
| Goldman Sachs | | | | | | | |
| International | (662,372 | ) | — | — | — | (662,372 | ) |
| Morgan Stanley | | | | | | | |
| Capital Services | (236,638 | ) | — | — | — | (236,638 | ) |
| Total | (1,404,739 | ) | — | — | — | (1,404,739 | ) |
1 Absent a default event or early termination, over-the-counter derivative liabilities are presented at
gross amounts and are not offset in the Statement of Assets and Liabilities.
2 In some instances, the actual collateral received and/or pledged may be more than the amount
shown due to overcollateralization.
50
The following summarizes the average market value of derivatives outstanding during the period ended December 31, 2013:
| |
| | Average Market Value ($) |
| Forward contracts | 55,944,527 |
At December 31, 2013, the cost of investments for federal income tax purposes was $1,560,778,364; accordingly, accumulated net unrealized appreciation on investments was $68,037,152, consisting of $77,690,448 gross unrealized appreciation and $9,653,296 gross unrealized depreciation.
The Fund 51
REPORT OF INDEPENDENT REGISTERED
PUBLIC ACCOUNTING FIRM
The Board of Trustees and Shareholders The Dreyfus/Laurel Funds Trust
We have audited the accompanying statement of assets and liabilities of Dreyfus High Yield Fund (the “Fund”), a series of The Dreyfus/Laurel Funds Trust, including the statement of investments as of December 31, 2013, and the related statement of operations for the year then ended, the statements of changes in net assets for each of the years in the two-year period then ended, and the financial highlights for each of the years in the five-year period then ended.These financial statements and financial highlights are the responsibility of the Fund’s management. Our responsibility is to express an opinion on these financial statements and financial highlights based on our audits.
We conducted our audits in accordance with the standards of the Public Company Accounting Oversight Board (United States).Those standards require that we plan and perform the audit to obtain reasonable assurance about whether the financial statements and financial highlights are free of material misstatement. An audit includes examining, on a test basis, evidence supporting the amounts and disclosures in the financial statements. Our procedures included confirmation of securities owned as of December 31, 2013, by correspondence with the custodian and brokers or by other appropriate auditing procedures. An audit also includes assessing the accounting principles used and significant estimates made by management, as well as evaluating the overall financial statement presentation.We believe that our audits provide a reasonable basis for our opinion.
In our opinion, the financial statements and financial highlights referred to above present fairly, in all material respects, the financial position of Dreyfus HighYield Fund as of December 31, 2013, the results of its operations for the year then ended, the changes in its net assets for each of the years in the two-year period then ended, and the financial highlights for each of the years in the five-year period then ended, in conformity with U.S. generally accepted accounting principles.

New York, New York
February 21, 2014
52
IMPORTANT TAX INFORMATION (Unaudited)
For federal tax purposes, the fund designates the maximum amount allowable but not less than 75.19% as interest-related dividends in accordance with Sections 871(k)(1) and 881(e) of the Internal Revenue Code.
The Fund 53
BOARD MEMBERS INFORMATION (Unaudited)
INDEPENDENT BOARD MEMBERS

54

Once elected all Board Members serve for an indefinite term, but achieve Emeritus status upon reaching age 80.The address of the Board Members and Officers is c/o The Dreyfus Corporation, 200 Park Avenue, NewYork, NewYork 10166. Additional information about the Board Members is available in the fund’s Statement of Additional Information which can be obtained from Dreyfus free of charge by calling this toll free number: 1-800-DREYFUS.
The Fund 55
OFFICERS OF THE FUND (Unaudited)
56
The Fund 57
Item 2. Code of Ethics.
The Registrant has adopted a code of ethics that applies to the Registrant's principal executive officer, principal financial officer, principal accounting officer or controller, or persons performing similar functions. There have been no amendments to, or waivers in connection with, the Code of Ethics during the period covered by this Report.
Item 3. Audit Committee Financial Expert.
The Registrant's Board has determined that Joseph S. DiMartino, a member of the Audit Committee of the Board, is an audit committee financial expert as defined by the Securities and Exchange Commission (the "SEC"). Mr. DiMartino is "independent" as defined by the SEC for purposes of audit committee financial expert determinations.
Item 4. Principal Accountant Fees and Services.
(a) Audit Fees. The aggregate fees billed for each of the last two fiscal years (the "Reporting Periods") for professional services rendered by the Registrant's principal accountant (the "Auditor") for the audit of the Registrant's annual financial statements or services that are normally provided by the Auditor in connection with the statutory and regulatory filings or engagements for the Reporting Periods, were $53,580 in 2012 and $54,950 in 2013.
(b) Audit-Related Fees. The aggregate fees billed in the Reporting Periods for assurance and related services by the Auditor that are reasonably related to the performance of the audit of the Registrant's financial statements and are not reported under paragraph (a) of this Item 4 were $4,410 in 2012 and $4,210 in 2013. These services consisted of one or more of the following: (i) agreed upon procedures related to compliance with Internal Revenue Code section 817(h), (ii) security counts required by Rule 17f-2 under the Investment Company Act of 1940, as amended, (iii) advisory services as to the accounting or disclosure treatment of Registrant transactions or events and (iv) advisory services to the accounting or disclosure treatment of the actual or potential impact to the Registrant of final or proposed rules, standards or interpretations by the Securities and Exchange Commission, the Financial Accounting Standards Boards or other regulatory or standard-setting bodies.
The aggregate fees billed in the Reporting Periods for non-audit assurance and related services by the Auditor to the Registrant's investment adviser (not including any sub-investment adviser whose role is primarily portfolio management and is subcontracted with or overseen by another investment adviser), and any entity controlling, controlled by or under common control with the investment adviser that provides ongoing services to the Registrant ("Service Affiliates"), that were reasonably related to the performance of the annual audit of the Service Affiliate, which required pre-approval by the Audit Committee were $0 in 2012 and $0 in 2013.
(c) Tax Fees. The aggregate fees billed in the Reporting Periods for professional services rendered by the Auditor for tax compliance, tax advice, and tax planning ("Tax Services") were $2,300 in 2012 and $2,350 in 2013. These services consisted of the review or preparation of U.S. federal, state, local and excise tax returns. The aggregate fees billed in the Reporting Periods for Tax Services by the Auditor to Service Affiliates, which required pre-approval by the Audit Committee were $0 in 2012 and $0 in 2013.
(d) All Other Fees. The aggregate fees billed in the Reporting Periods for products and services provided by the Auditor, other than the services reported in paragraphs (a) through (c) of this Item, were $0 in 2012 and $0 in 2013.
The aggregate fees billed in the Reporting Periods for Non-Audit Services by the Auditor to Service Affiliates, other than the services reported in paragraphs (b) through (c) of this Item, which required pre-approval by the Audit Committee, were $0 in 2012 and $0 in 2013.
(e)(1) Audit Committee Pre-Approval Policies and Procedures. The Registrant's Audit Committee has established policies and procedures (the "Policy") for pre-approval (within specified fee limits) of the Auditor's engagements for non-audit services to the Registrant and Service Affiliates without specific case-by-case consideration. The pre-approved services in the Policy can include pre-approved audit services, pre-approved audit-related services, pre-approved tax services and pre-approved all other services. Pre-approval considerations include whether the proposed services are compatible with maintaining the Auditor's independence. Pre-approvals pursuant to the Policy are considered annually.
(e)(2) Note: None of the services described in paragraphs (b) through (d) of this Item 4 were approved by the Audit Committee pursuant to paragraph (c)(7)(i)(C) of Rule 2-01 of Regulation S-X.
(f) None of the hours expended on the principal accountant's engagement to audit the registrant's financial statements for the most recent fiscal year were attributed to work performed by persons other than the principal account's full-time, permanent employees.
Non-Audit Fees. The aggregate non-audit fees billed by the Auditor for services rendered to the Registrant, and rendered to Service Affiliates, for the Reporting Periods were $12,372,510 in 2012 and $13,916,529 in 2013.
Auditor Independence. The Registrant's Audit Committee has considered whether the provision of non-audit services that were rendered to Service Affiliates, which were not pre-approved (not requiring pre-approval), is compatible with maintaining the Auditor's independence.
Item 5. Audit Committee of Listed Registrants.
Not applicable.
Item 6. Investments.
(a) Not applicable.
Item 7. Disclosure of Proxy Voting Policies and Procedures for Closed-End Management Investment Companies.
Not applicable.
Item 8. Portfolio Managers of Closed-End Management Investment Companies.
Not applicable.
Item 9. Purchases of Equity Securities by Closed-End Management Investment Companies and Affiliated Purchasers.
Not applicable.
Item 10. Submission of Matters to a Vote of Security Holders.
There have been no material changes to the procedures applicable to Item 10.
Item 11. Controls and Procedures.
(a) The Registrant's principal executive and principal financial officers have concluded, based on their evaluation of the Registrant's disclosure controls and procedures as of a date within 90 days of the filing date of this report, that the Registrant's disclosure controls and procedures are reasonably designed to ensure that information required to be disclosed by the Registrant on Form N-CSR is recorded, processed, summarized and reported within the required time periods and that information required to be disclosed by the Registrant in the reports that it files or submits on Form N-CSR is accumulated and communicated to the Registrant's management, including its principal executive and principal financial officers, as appropriate to allow timely decisions regarding required disclosure.
(b) There were no changes to the Registrant's internal control over financial reporting that occurred during the second fiscal quarter of the period covered by this report that have materially affected, or are reasonably likely to materially affect, the Registrant's internal control over financial reporting.
Item 12. Exhibits.
(a)(1) Code of ethics referred to in Item 2.
(a)(2) Certifications of principal executive and principal financial officers as required by Rule 30a-2(a) under the Investment Company Act of 1940.
(a)(3) Not applicable.
(b) Certification of principal executive and principal financial officers as required by Rule 30a-2(b) under the Investment Company Act of 1940.
SIGNATURES
Pursuant to the requirements of the Securities Exchange Act of 1934 and the Investment Company Act of 1940, the Registrant has duly caused this Report to be signed on its behalf by the undersigned, thereunto duly authorized.
The Dreyfus/Laurel Funds Trust
By: /s/ Bradley J. Skapyak |
Bradley J. Skapyak President |
Date: | February 21, 2014 |
|
Pursuant to the requirements of the Securities Exchange Act of 1934 and the Investment Company Act of 1940, this Report has been signed below by the following persons on behalf of the Registrant and in the capacities and on the dates indicated. |
|
By: /s/ Bradley J. Skapyak |
Bradley J. Skapyak President |
Date: | February 21, 2014 |
|
By: /s/ James Windels |
James Windels Treasurer |
Date: | February 21, 2014 |
|
EXHIBIT INDEX
(a)(1) Code of ethics referred to in Item 2.
(a)(2) Certifications of principal executive and principal financial officers as required by Rule 30a-2(a) under the Investment Company Act of 1940. (EX-99.CERT)
(b) Certification of principal executive and principal financial officers as required by Rule 30a-2(b) under the Investment Company Act of 1940. (EX-99.906CERT)
Exhibit (a)(1)
[INSERT CODE OF ETHICS]
Exhibit A
Persons Covered by the Code of Ethics
Bradley J. Skapyak | President | (Principal Executive Officer) |
| | |
James Windels | Treasurer | (Principal Financial and Accounting Officer) |
Revised as of January 1, 2010