UNITED STATES
SECURITIES AND EXCHANGE COMMISSION
Washington, D.C. 20549
FORM N-CSR
CERTIFIED SHAREHOLDER REPORT OF REGISTERED MANAGEMENT
INVESTMENT COMPANIES
Investment Company Act file number | 811- 524 |
| |
| Dreyfus/Laurel Funds Trust | |
| (Exact name of Registrant as specified in charter) | |
| | |
| c/o The Dreyfus Corporation 200 Park Avenue New York, New York 10166 | |
| (Address of principal executive offices) (Zip code) | |
| | |
| John Pak, Esq. 200 Park Avenue New York, New York 10166 | |
| (Name and address of agent for service) | |
|
Registrant's telephone number, including area code: | (212) 922-6000 |
| |
Date of fiscal year end: | 5/31 | |
Date of reporting period: | 5/31/2013 | |
| | | | | | | |
The following N-CSR relates only to Dreyfus Equity Income Fund and Dreyfus Emerging Markets Debt Local Currency Fund and does not affect the other series of the Registrant, which have different fiscal year ends and, therefore, different N-CSR reporting requirements. Separate N-CSR Forms will be filed for these series, as appropriate.
FORM N-CSR
Item 1. Reports to Stockholders.
Dreyfus
Emerging Markets Debt
Local Currency Fund
ANNUAL REPORT May 31, 2013

Save time. Save paper. View your next shareholder report online as soon as it’s available. Log into www.dreyfus.com and sign up for Dreyfus eCommunications. It’s simple and only takes a few minutes.
The views expressed in this report reflect those of the portfolio manager only through the end of the period covered and do not necessarily represent the views of Dreyfus or any other person in the Dreyfus organization. Any such views are subject to change at any time based upon market or other conditions and Dreyfus disclaims any responsibility to update such views.These views may not be relied on as investment advice and, because investment decisions for a Dreyfus fund are based on numerous factors, may not be relied on as an indication of trading intent on behalf of any Dreyfus fund.
Not FDIC-Insured • Not Bank-Guaranteed • May Lose Value
| |
| Contents |
| |
| | THE FUND |
| 2 | A Letter from the President |
| 3 | Discussion of Fund Performance |
| 6 | Fund Performance |
| 8 | Understanding Your Fund’s Expenses |
| 8 | Comparing Your Fund’s Expenses |
| With Those of Other Funds |
| 9 | Statement of Investments |
| 15 | Statement of Assets and Liabilities |
| 16 | Statement of Operations |
| 17 | Statement of Changes in Net Assets |
| 19 | Financial Highlights |
| 22 | Notes to Financial Statements |
| 40 | Report of Independent Registered |
| | Public Accounting Firm |
| 41 | Information About the Renewal of |
| | the Fund’s Management Agreement |
| 46 | Board Members Information |
| 48 | Officers of the Fund |
| |
| FOR MORE INFORMATION |
|
| | Back Cover |
Dreyfus
Emerging Markets Debt
Local Currency Fund
The Fund
A LETTER FROM THE PRESIDENT
Dear Shareholder:
We are pleased to present this annual report for Dreyfus Emerging Markets Debt Local Currency Fund, covering the 12-month period from June 1, 2012, through May 31, 2013. For information about how the fund performed during the reporting period, as well as general market perspectives, we provide a Discussion of Fund Performance on the pages that follow.
The U.S. economic recovery gained traction over the reporting period, but remained slower than historical norms. On one hand, the expansion has been fueled by gradually falling unemployment, recovering housing markets, rapid growth in domestic oil and gas production, and, perhaps most significant, the aggressively stimulative monetary policy of the Federal Reserve Board (the “Fed”). On the other hand, several factors have weighed on the nation’s economic growth rate, including relatively sluggish demand for exports to Europe and the emerging markets, higher tax rates for some Americans, and more restrictive fiscal policies stemming from sequestration. However, despite a deceleration in economic activity that took place during the first half of this year, emerging market economies are still expected to grow, on average, at faster rates than developed economies for the foreseeable future.
In our analysis, real GDP growth seems poised to accelerate modestly over the remainder of 2013. In fact, we expect the relatively mild economic expansion to remain intact domestically and globally over the next several years. The moderate pace of the recovery implies that the risks of consumer price inflation are limited, making it unlikely that the Fed will adopt expansion-threatening, restrictive policies anytime soon. As always, we encourage you to discuss our observations with your financial advisor.
Thank you for your continued confidence and support.
Sincerely,
J. Charles Cardona
President
The Dreyfus Corporation
June 17, 2013
2
DISCUSSION OF FUND PERFORMANCE
For the period of June 1, 2012 through May 31, 2013, as provided by Alexander Kozhemiakin and Javier Murcio, Primary Portfolio Managers
Fund and Market Performance Overview
For the 12-month period ended May 31, 2013, Dreyfus Emerging Markets Debt Local Currency Fund’s Class A shares produced a total return of 11.83%, Class C shares returned 10.98%, and Class I shares returned 12.18%.1 In comparison, the fund’s benchmark, the JPMorgan Government Bond Index – Emerging Markets Diversified (the “Index”), produced a 13.56% total return for the same period.2
Despite heightened volatility over the second half of the reporting period, emerging market currencies and bonds generally posted strong results overall.The fund produced lower returns than its benchmark, mainly due to underweighted exposure to bonds in Indonesia, Colombia and Russia (which were not fully investable at the time) over the reporting period’s first half, and weakness in the Peruvian currency, which we were overweighted during the second half.
The Fund’s Investment Approach
The fund seeks to maximize total return.To pursue its goal, the fund normally invests at least 80% of its assets in emerging market bonds and other debt instruments denominated in the local currency of issue, and in derivative instruments that provide investment exposure to such securities.
When choosing investments, we employ in-depth fundamental country analysis supported by the discipline of quantitative valuation models.A “top down” analysis of macroeconomics and financial and political variables guides country and currency allocations.We also consider technical market factors and the global risk environment. We seek to identify shifts in country fundamentals and consider the risk-adjusted attractiveness of currency and duration returns for each emerging market country.
2012 Rallies Partly Offset by Market Weakness in 2013
At the start of the reporting period, investor confidence in riskier markets was undermined by a number of global macroeconomic worries. Some of these concerns soon moderated, however, when the head of the European Central Bank stated a firm
The Fund 3
DISCUSSION OF FUND PERFORMANCE (continued)
commitment to supporting the euro and central banks throughout the world adopted aggressively accommodative monetary policies. In anticipation of greater stability in the regions’ key export markets, emerging market currencies and bonds generally rallied during the fall of 2012 and into the first quarter of 2013, accounting for the bulk of the Index’s gains for the reporting period.
The first five months of 2013 saw dramatically different results as investors’ perception changed regarding liquidity conditions in the emerging markets. Remarks by Federal Reserve Board (the “Fed”) Chairman Ben Bernanke were widely interpreted as a signal that the Fed would begin to back away from its quantitative easing program earlier than expected. Meanwhile investors anticipated that newly stimulative monetary and fiscal policies in Japan would spark increased capital flows to the emerging markets, a development that failed to materialize. These factors led to worries that investment capital might instead flow to Europe or Japan, sparking heightened volatility in the emerging markets toward the reporting period’s end.
Currency Strategies Weighed on Relative Results
Although the fund participated to a significant degree in the emerging markets’ gains, its relative performance over the final months of 2012 was undercut by relatively heavy exposure to the Peruvian nuevo sol and Russian ruble, and underweighted positions in the Polish zloty and Hungarian forint. Results in 2013 were hindered by modestly overweighted exposure to the South African rand and local currency-denominated bonds in Peru.
The fund achieved better results through overweighted exposure to the Mexican peso, which buoyed relative performance throughout the reporting period when investors responded positively to solid economic fundamentals and an attractive valuation. Sovereign bonds in South Africa and inflation-linked bonds in Brazil and Turkey fared well early in the reporting period. During the reporting period’s second half, an underweighted position in the Peruvian nuevo sol helped cushion the currency’s weakness, and the fund further benefited from investments in short-term bonds in Nigeria.
Fundamentals Strong Despite Recent Volatility
In our analysis, recent concerns regarding changing U.S. monetary policy generally have been overblown. Although short-term interest rates eventually will rise, we
4
believe that the Fed’s accommodative stance will remain in place for some time to come. Indeed, recent market volatility has produced what we believe to be opportunities to invest in emerging markets currencies and debt instruments at attractive valuations. Moreover, economic and market fundamentals remain sound in most regions where the fund invests.
However, over the near term, emerging market bonds and currencies are likely to continue to respond primarily to changes in investor sentiment. Therefore, we have adopted a more cautious investment posture, focusing on attractively valued markets with sound fiscal policies, subdued inflationary pressures, and the potential for declining bond yields.We recently have found opportunities meeting these criteria in Mexico, Peru, Russia, and to a lesser degree, in Brazil and Nigeria. Conversely, we have identified fewer opportunities in Asia, the Middle East, South Africa, Poland, and Hungary.
June 17, 2013
Bond funds are subject generally to interest rate, credit, liquidity and market risks, to varying degrees, all of which are
more fully described in the fund’s prospectus. Generally, all other factors being equal, bond prices are inversely related
to interest-rate changes, and rate increases can cause price declines.
Foreign bonds are subject to special risks including exposure to currency fluctuations, changing political and economic
conditions, and potentially less liquidity. Investments in foreign currencies are subject to the risk that those currencies
will decline in value relative to the U.S. dollar. Foreign currencies are also subject to risks caused by inflation, interest
rates, budget deficits and low savings rate, political factors and government control.The fixed income securities of issuers
located in emerging markets can be more volatile and less liquid than those of issuers in more mature economies and
emerging markets generally have less diverse and less mature economic structures and less stable political systems than
those of developed countries.The securities of issuers located or doing substantial business in emerging markets are
often subject to rapid and large changes in price.
The fund may use derivative instruments, such as options, futures and options on futures, forward contracts, swaps
(including credit default swaps on corporate bonds and asset-backed securities), options on swaps and other credit
derivatives.A small investment in derivatives could have a potentially large impact on the fund’s performance.
1 Total return includes reinvestment of dividends and any capital gains paid, and does not take into consideration the
maximum initial sales charge in the case of Class A shares, or the applicable contingent deferred sales charge imposed
on redemptions in the case of Class C shares. Had these charges been reflected, returns would have been lower. Past
performance is no guarantee of future results. Share price and investment return fluctuate such that upon redemption,
fund shares may be worth more or less than their original cost.
2 SOURCE: FACTSET — The JPMorgan Government Bond Index – Emerging Markets Diversified is a
comprehensive global local emerging markets index, and consists of regularly traded, liquid fixed-rate, domestic currency
government bonds.The Index does not include fund fees and expenses to which the fund is subject. Investors cannot
invest directly in any index.
The Fund 5
FUND PERFORMANCE
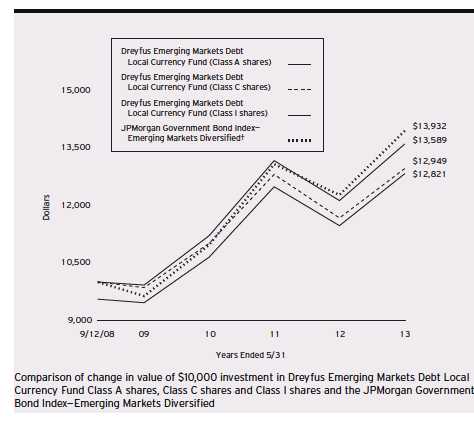
† Source: FactSet
Past performance is not predictive of future performance.
The above graph compares a $10,000 investment made in each of the Class A, Class C and Class I shares of Dreyfus Emerging Markets Debt Local Currency Fund on 9/12/08 (inception date) to a $10,000 investment made in the JPMorgan Government Bond Index-Emerging Markets Diversified (the “Index”) on that date.All dividends and capital gain distributions are reinvested.
The fund’s performance shown in the line graph above takes into account the maximum initial sales charge on Class A shares and all other applicable fees and expenses on all classes.The Index is a comprehensive global local emerging markets index, and consists of regularly traded, liquid fixed-rate, domestic currency government bonds. Unlike a mutual fund, the Index is not subject to charges, fees and other expenses. Investors cannot invest directly in any index. Further information relating to fund performance, including expense reimbursements, if applicable, is contained in the Financial Highlights section of the prospectus and elsewhere in this report.
6
| | | | | |
| Average Annual Total Returns as of 5/31/13 | | | | | |
| |
| | Inception | | | From | |
| | Date | 1 | Year | Inception | |
| Class A shares | | | | | |
| with maximum sales charge (4.5%) | 9/12/08 | 6.78 | % | 5.41 | % |
| without sales charge | 9/12/08 | 11.83 | % | 6.44 | % |
| Class C shares | | | | | |
| with applicable redemption charge † | 9/12/08 | 9.98 | % | 5.63 | % |
| without redemption | 9/12/08 | 10.98 | % | 5.63 | % |
| Class I shares | 9/12/08 | 12.18 | % | 6.71 | % |
| JPMorgan Government Bond Index— | | | | | |
| Emerging Markets Diversified | 8/31/08 | 13.56 | % | 7.23 | %†† |
Past performance is not predictive of future performance.The fund’s performance shown in the graph and table does not
reflect the deduction of taxes that a shareholder would pay on fund distributions or the redemption of fund shares.
† The maximum contingent deferred sales charge for Class C shares is 1% for shares redeemed within one year of the
date of purchase.
For comparative purposes, the value of the Index as of 8/31/08 is used as the beginning value on 9/12/08.
The Fund 7
UNDERSTANDING YOUR FUND’S EXPENSES (Unaudited)
As a mutual fund investor, you pay ongoing expenses, such as management fees and other expenses. Using the information below, you can estimate how these expenses affect your investment and compare them with the expenses of other funds.You also may pay one-time transaction expenses, including sales charges (loads) and redemption fees, which are not shown in this section and would have resulted in higher total expenses. For more information, see your fund’s prospectus or talk to your financial adviser.
Review your fund’s expenses
The table below shows the expenses you would have paid on a $1,000 investment in Dreyfus Emerging Markets Debt Local Currency Fund from December 1, 2012 to May 31, 2013. It also shows how much a $1,000 investment would be worth at the close of the period, assuming actual returns and expenses.
Expenses and Value of a $1,000 Investment
assuming actual returns for the six months ended May 31, 2013
| | | | | | |
| | | Class A | | Class C | | Class I |
| Expenses paid per $1,000† | $ | 6.08 | $ | 9.87 | $ | 4.70 |
| Ending value (after expenses) | $ | 983.80 | $ | 980.00 | $ | 985.10 |
COMPARING YOUR FUND’S EXPENSES WITH THOSE OF OTHER FUNDS (Unaudited)
Using the SEC’s method to compare expenses
The Securities and Exchange Commission (SEC) has established guidelines to help investors assess fund expenses. Per these guidelines, the table below shows your fund’s expenses based on a $1,000 investment, assuming a hypothetical 5% annualized return. You can use this information to compare the ongoing expenses (but not transaction expenses or total cost) of investing in the fund with those of other funds.All mutual fund shareholder reports will provide this information to help you make this comparison. Please note that you cannot use this information to estimate your actual ending account balance and expenses paid during the period.
Expenses and Value of a $1,000 Investment
assuming a hypothetical 5% annualized return for the six months ended May 31, 2013
| | | | | | |
| | | Class A | | Class C | | Class I |
| Expenses paid per $1,000† | $ | 6.19 | $ | 10.05 | $ | 4.78 |
| Ending value (after expenses) | $ | 1,018.80 | $ | 1,014.96 | $ | 1,020.19 |
† Expenses are equal to the fund’s annualized expense ratio of 1.23% for Class A, 2.00% for Class C and .95%
for Class I, multiplied by the average account value over the period, multiplied by 182/365 (to reflect the one-half
year period).
8
STATEMENT OF INVESTMENTS
May 31, 2013
| | | | | | |
| | | Coupon | Maturity | Principal | | |
| Bonds and Notes—86.2% | | Rate (%) | Date | Amount ($)a | Value ($) |
| Foreign/Governmental | | | | | | |
| AHML Finance, | | | | | | |
| Unscd. Notes | RUB | 7.75 | 2/13/18 | 332,200,000 | b | 10,570,225 |
| AHML Finance, | | | | | | |
| Unscd. Notes | RUB | 7.75 | 2/13/18 | 1,501,500,000 | | 47,776,015 |
| Bank of Thailand, | | | | | | |
| Treasury Bills, Ser. 363 | THB | 0.00 | 8/1/13 | 3,868,000,000 | c | 127,262,119 |
| Brazil Notas do | | | | | | |
| Tesouro Nacional, | | | | | | |
| Notes, Ser. B | BRL | 6.00 | 8/15/22 | 50,710,000 | d | 60,518,732 |
| Brazil Notas do | | | | | | |
| Tesouro Nacional, | | | | | | |
| Notes, Ser. B | BRL | 6.00 | 5/15/45 | 2,750,000 | d | 3,443,116 |
| Brazil Nota do | | | | | | |
| Tesouro Nacional | | | | | | |
| Notes, Ser. B | BRL | 6.00 | 8/15/50 | 9,500,000 | d | 12,041,310 |
| Colombian Government, | | | | | | |
| Sr. Unscd. Bonds | COP | 4.38 | 3/21/23 | 38,613,000,000 | | 19,529,421 |
| Colombian Government, | | | | | | |
| Sr. Unscd. Bonds | COP | 9.85 | 6/28/27 | 66,202,000,000 | | 50,033,524 |
| Colombian Government, | | | | | | |
| Bonds, Ser. B | COP | 11.00 | 7/24/20 | 115,330,500,000 | | 79,208,610 |
| Eskom Holdings, | | | | | | |
| Sr. Scd. Bonds | ZAR | 0.00 | 12/31/18 | 373,600,000 | c | 24,316,424 |
| Hungarian Government, | | | | | | |
| Bonds, Ser. 23/A | HUF | 6.00 | 11/24/23 | 23,301,620,000 | | 105,797,304 |
| Hungarian Government, | | | | | | |
| Bonds, Ser. 19/A | HUF | 6.50 | 6/24/19 | 7,541,440,000 | | 35,443,972 |
| Hungarian Government, | | | | | | |
| Bonds, Ser. 22/A | HUF | 7.00 | 6/24/22 | 3,410,220,000 | | 16,495,281 |
| Hungarian Government, | | | | | | |
| Bonds, Ser. 20/A | HUF | 7.50 | 11/12/20 | 6,072,330,000 | | 30,283,572 |
| Malaysian Government, | | | | | | |
| Sr. Unscd. Bonds, | | | | | | |
| Ser. 0312 | MYR | 3.20 | 10/15/15 | 25,800,000 | | 8,369,465 |
| Malaysian Government, | | | | | | |
| Sr. Unscd. Bonds, | | | | | | |
| Ser. 0213 | MYR | 3.26 | 3/1/18 | 22,225,000 | | 7,158,128 |
| Malaysian Government, | | | | | | |
| Sr. Unscd. Bonds, | | | | | | |
| Ser. 0512 | MYR | 3.31 | 10/31/17 | 47,000,000 | | 15,186,460 |
The Fund 9
STATEMENT OF INVESTMENTS (continued)
| | | | | | |
| | | Coupon | Maturity | Principal | | |
| Bonds and Notes (continued) | Rate (%) | Date | Amount ($)a | Value ($) |
| Foreign/Governmental | | | | | | |
| (continued) | | | | | | |
| Malaysian Government, | | | | | | |
| Sr. Unscd. Bonds, | | | | | | |
| Ser. 0112 | MYR | 3.42 | 8/15/22 | 88,910,000 | | 28,689,183 |
| Malaysian Government, | | | | | | |
| Sr. Unscd. Bonds, | | | | | | |
| Ser. 0211 | MYR | 3.43 | 8/15/14 | 491,375,000 | | 159,460,305 |
| Malaysian Government, | | | | | | |
| Sr. Unscd. Bonds, | | | | | | |
| Ser. 0313 | MYR | 3.48 | 3/15/23 | 224,205,000 | | 72,804,551 |
| Malaysian Government, | | | | | | |
| Sr. Unscd. Bonds, | | | | | | |
| Ser. 0110 | MYR | 3.84 | 8/12/15 | 96,170,000 | | 31,595,119 |
| Malaysian Government, | | | | | | |
| Sr. Unscd. Bonds, | | | | | | |
| Ser. 0212 | MYR | 3.89 | 3/15/27 | 56,000,000 | | 18,855,556 |
| Malaysian Government, | | | | | | |
| Sr. Unscd. Bonds, | | | | | | |
| Ser. 1/06 | MYR | 4.26 | 9/15/16 | 320,760,000 | | 106,597,273 |
| Malaysian Government, | | | | | | |
| Sr. Unscd. Bonds, | | | | | | |
| Ser. 2/04 | MYR | 5.09 | 4/30/14 | 196,440,000 | | 64,645,621 |
| Mexican Government, | | | | | | |
| Bonds | MXN | 4.00 | 11/15/40 | 51,547,000 | | 24,151,683 |
| Mexican Government, | | | | | | |
| Bonds, Ser. M | MXN | 7.75 | 5/29/31 | 451,945,000 | | 41,395,732 |
| Mexican Government, | | | | | | |
| Bonds, Ser. M | MXN | 7.75 | 11/13/42 | 545,000,000 | | 49,627,937 |
| Mexican Government, | | | | | | |
| Bonds, Ser. M 30 | MXN | 8.50 | 11/18/38 | 144,940,000 | | 14,304,361 |
| Mexican Government, | | | | | | |
| Bonds, Ser. M 30 | MXN | 10.00 | 11/20/36 | 532,990,000 | | 59,745,308 |
| Nigerian Government, | | | | | | |
| Treasury Bills, Ser. 364d | NGN | 0.00 | 10/24/13 | 1,195,000,000 | c | 7,197,345 |
| Nigerian Government, | | | | | | |
| Treasury Bills, Ser. 364d | NGN | 0.00 | 11/7/13 | 1,044,000,000 | c | 7,843,315 |
| Nigerian Government, | | | | | | |
| Treasury Bills, Ser. 364D | NGN | 0.00 | 11/21/13 | 1,206,480,000 | c | 7,200,672 |
| Nigerian Government, | | | | | | |
| Bonds, Ser. 5YR | NGN | 15.10 | 4/27/17 | 4,017,560,000 | | 27,785,161 |
10
| | | | | | |
| | | Coupon | Maturity | Principal | | |
| Bonds and Notes (continued) | Rate (%) | Date | Amount ($)a | | Value ($) |
| Foreign/Governmental | | | | | | |
| (continued) | | | | | | |
| Nigerian Government, | | | | | | |
| Bonds, Ser. 7 | NGN | 16.00 | 6/29/19 | 7,825,155,000 | | 56,898,077 |
| Nigerian Government, | | | | | | |
| Bonds, Ser. 10YR | NGN | 16.39 | 1/27/22 | 10,550,405,000 | | 83,102,779 |
| Peruvian Government, | | | | | | |
| Bonds | PEN | 6.85 | 2/12/42 | 32,345,000 | | 13,351,818 |
| Peruvian Government, | | | | | | |
| Sr. Unscd. Bonds | PEN | 6.90 | 8/12/37 | 147,120,000 | | 60,842,847 |
| Peruvian Government, | | | | | | |
| Gtd. Bonds | PEN | 6.95 | 8/12/31 | 233,300,000 | | 96,976,607 |
| Peruvian Government, | | | | | | |
| Bonds | PEN | 7.84 | 8/12/20 | 55,425,000 | | 24,058,915 |
| Peruvian Government, | | | | | | |
| Bonds | PEN | 8.20 | 8/12/26 | 200,185,000 | | 94,598,084 |
| Petroleos Mexicanos, | | | | | | |
| Gtd. Notes | MXN | 7.65 | 11/24/21 | 875,700,000 | b | 76,116,838 |
| Philippine Government, | | | | | | |
| Sr. Unscd. Bonds | PHP | 4.95 | 1/15/21 | 3,563,000,000 | | 92,299,148 |
| Philippine Government, | | | | | | |
| Sr. Unscd. Bonds | PHP | 6.25 | 1/14/36 | 538,000,000 | | 15,973,267 |
| Polish Government, | | | | | | |
| Bonds, Ser. 1023 | PLN | 4.00 | 10/25/23 | 61,800,000 | | 19,479,721 |
| Polish Government, | | | | | | |
| Bonds, Ser. 0416 | PLN | 5.00 | 4/25/16 | 152,500,000 | | 49,213,591 |
| Polish Government, | | | | | | |
| Bonds, Ser. 1017 | PLN | 5.25 | 10/25/17 | 79,000,000 | | 26,190,674 |
| Polish Government, | | | | | | |
| Bonds, Ser. 1020 | PLN | 5.25 | 10/25/20 | 63,565,000 | | 21,716,000 |
| Polish Government, | | | | | | |
| Bonds, Ser. 0415 | PLN | 5.50 | 4/25/15 | 21,000,000 | | 6,714,279 |
| Polish Government, | | | | | | |
| Bonds, Ser. 0922 | PLN | 5.75 | 9/23/22 | 112,270,000 | | 40,104,011 |
| Polish Government, | | | | | | |
| Bonds, Ser. 1015 | PLN | 6.25 | 10/24/15 | 97,720,000 | | 32,092,894 |
| Romanian Government, | | | | | | |
| Bonds, Ser. 5Y | RON | 5.90 | 7/26/17 | 175,080,000 | | 53,988,119 |
| RusHydro, | | | | | | |
| Sr. Unscd. Notes | RUB | 7.88 | 10/28/15 | 1,098,900,000 | | 34,466,724 |
The Fund 11
STATEMENT OF INVESTMENTS (continued)
| | | | | | |
| | | Coupon | Maturity | Principal | | |
| Bonds and Notes (continued) | Rate (%) | Date | Amount ($)a | | Value ($) |
| Foreign/Governmental | | | | | | |
| (continued) | | | | | | |
| Russian Agricultural Bank, | | | | | | |
| Sr. Unscd. Notes | RUB | 7.88 | 2/7/18 | 938,300,000 | | 29,404,274 |
| Russian Agricultural Bank, | | | | | | |
| Sr. Unscd. Notes | RUB | 8.63 | 2/17/17 | 690,700,000 | | 22,226,044 |
| Russian Agricultural Bank, | | | | | | |
| Sr. Unscd. Notes | RUB | 8.70 | 3/17/16 | 1,456,800,000 | | 47,346,029 |
| Russian Government, | | | | | | |
| Bonds, Ser. 5075 | RUB | 6.88 | 7/15/15 | 786,265,000 | | 25,067,303 |
| Russian Government, | | | | | | |
| Bonds, Ser. 5079 | RUB | 7.00 | 6/3/15 | 1,907,380,000 | | 60,810,123 |
| Russian Government, | | | | | | |
| Bonds, Ser. 6212 | RUB | 7.05 | 1/19/28 | 602,575,000 | | 18,220,247 |
| Russian Government, | | | | | | |
| Bonds, Ser. 6204 | RUB | 7.50 | 3/15/18 | 395,735,000 | | 12,920,265 |
| Russian Government, | | | | | | |
| Bonds, Ser. 6208 | RUB | 7.50 | 2/27/19 | 965,500,000 | | 31,429,416 |
| Russian Government, | | | | | | |
| Bonds, Ser. 6205 | RUB | 7.60 | 4/14/21 | 1,381,075,000 | | 44,657,891 |
| Russian Government, | | | | | | |
| Bonds, Ser. 6209 | RUB | 7.60 | 7/20/22 | 948,500,000 | | 30,744,580 |
| Russian Government, | | | | | | |
| Bonds, Ser. 6207 | RUB | 8.15 | 2/3/27 | 2,039,610,000 | | 68,027,987 |
| South African Government, | | | | | | |
| Bonds, Ser. R212 | ZAR | 2.75 | 1/31/22 | 126,250,000 | e | 17,266,850 |
| South African Government, | | | | | | |
| Sr. Unscd. Bonds, | | | | | | |
| Ser. R209 | ZAR | 6.25 | 3/31/36 | 441,045,000 | | 34,223,807 |
| South African Government, | | | | | | |
| Bonds, Ser. R214 | ZAR | 6.50 | 2/28/41 | 250,000,000 | | 19,502,457 |
| South African Government, | | | | | | |
| Sr. Unscd. Bonds, | | | | | | |
| Ser. R208 | ZAR | 6.75 | 3/31/21 | 48,850,000 | | 4,823,673 |
| South African Government, | | | | | | |
| Bonds, Ser. R213 | ZAR | 7.00 | 2/28/31 | 326,635,000 | | 28,981,712 |
| South African Government, | | | | | | |
| Bonds, Ser. R207 | ZAR | 7.25 | 1/15/20 | 473,455,000 | | 48,348,456 |
12
| | | | | | |
| | | Coupon | Maturity | Principal | | |
| Bonds and Notes (continued) | Rate (%) | Date | Amount ($)a | | Value ($) |
| Foreign/Governmental | | | | | | |
| (continued) | | | | | | |
| South African Government, | | | | | | |
| Bonds, Ser. R204 | ZAR | 8.00 | 12/21/18 | 392,435,000 | | 41,672,186 |
| South African Government, | | | | | | |
| Bonds, Ser. R203 | ZAR | 8.25 | 9/15/17 | 758,660,000 | | 80,784,798 |
| South African Government, | | | | | | |
| Bonds, Ser. R201 | ZAR | 8.75 | 12/21/14 | 450,000 | | 46,910 |
| South African Government, | | | | | | |
| Bonds, Ser. 2048 | ZAR | 8.75 | 2/28/48 | 142,800,000 | | 14,396,801 |
| South African Government, | | | | | | |
| Bonds, Ser. R186 | ZAR | 10.50 | 12/21/26 | 560,370,000 | | 69,207,710 |
| Turkish Government, | | | | | | |
| Bonds | TRY | 4.00 | 4/29/15 | 98,835,000 | f | 69,855,258 |
| Turkish Government, | | | | | | |
| Bonds | TRY | 8.00 | 1/29/14 | 125,500,000 | | 68,329,640 |
| Turkish Government, | | | | | | |
| Bonds | TRY | 8.00 | 6/4/14 | 175,255,000 | | 95,606,399 |
| Turkish Government, | | | | | | |
| Bonds | TRY | 9.00 | 1/27/16 | 81,540,000 | | 46,267,690 |
| Turkish Government, | | | | | | |
| Bonds, Ser. 2YR | TRY | 10.00 | 12/4/13 | 205,000,000 | | 111,942,590 |
| Turkish Government, | | | | | | |
| Bonds | TRY | 10.00 | 6/17/15 | 57,500,000 | | 32,826,435 |
| Turkish Government, | | | | | | |
| Bonds | TRY | 11.00 | 8/6/14 | 113,660,000 | | 64,129,127 |
| Turkish Government, | | | | | | |
| Bonds | TRY | 16.00 | 8/28/13 | 5,500,000 | | 3,022,430 |
| Uruguayan Government, | | | | | | |
| Sr. Unscd. Bonds | UYU | 5.00 | 9/14/18 | 84,250,000 | | 8,101,832 |
| Total Bonds and Notes | | | | | | |
| (cost $3,629,597,429) | | | | | | 3,523,708,113 |
| |
| Short-Term Investments—.2% | | | | | |
| U.S. Treasury Bills; | | | | | | |
| 0.08%, 7/25/13 | | | | | | |
| (cost $8,768,886) | | | | 8,770,000 | g | 8,769,719 |
The Fund 13
STATEMENT OF INVESTMENTS (continued)
| | | | |
| Other Investment—6.7% | Shares | | | Value ($) |
| Registered Investment Company; | | | | |
| Dreyfus Institutional Preferred Plus Money Market Fund | | | | |
| (cost $272,304,675) | 272,304,675 | | h | 272,304,675 |
| |
| Total Investments (cost $3,910,670,990) | 93.1 | % | | 3,804,782,507 |
| Cash and Receivables (Net) | 6.9 | % | | 282,822,987 |
| Net Assets | 100.0 | % | | 4,087,605,494 |
a Principal amount stated in U.S. Dollars unless otherwise noted.
BRL—Brazilian Real
COP—Colombian Peso
HUF—Hungarian Forint
MXN—Mexican New Peso
MYR—Malaysian Ringgit
NGN— Nigerian Naira
PEN—Peruvian New Sol
PHP—Philippine Peso
PLN—Polish Zloty
RON—Romanian Leu
RUB—Russian Ruble
THB—Thai Baht
TRY—Turkish Lira
UYU—Uruguayan New Peso
ZAR—South African Rand
b Securities exempt from registration pursuant to Rule 144A under the Securities Act of 1933.These securities may be
resold in transactions exempt from registration, normally to qualified institutional buyers.At May 31, 2013, these
securities were valued at $86,687,063 or 2.1% of net assets.
c Security issued with a zero coupon. Income is recognized through the accretion of discount.
d Principal amount for accrual purposes is periodically adjusted based on changes in the Brazilian Consumer Price Index.
e Principal amount for accrual purposes is periodically adjusted based on changes in the South African Consumer
Price Index.
f Principal amount for accrual purposes is periodically adjusted based on changes in the Turkish Consumer Price Index.
g Held by a broker as collateral for open forward foreign currency exchange contracts and swap agreements.
h Investment in affiliated money market mutual fund.
| | | |
| Portfolio Summary (Unaudited)† | | |
| |
| | Value (%) | | Value (%) |
| Malaysia | 12.5 | Poland | 4.8 |
| Turkey | 12.0 | Hungary | 4.6 |
| Russia | 11.8 | Colombia | 3.6 |
| South Africa | 9.4 | Thailand | 3.1 |
| Peru | 7.1 | Philippines | 2.6 |
| Short-Term/ | | Brazil | 1.9 |
| Money Market Investments | 6.9 | Romania | 1.3 |
| Mexico | 6.5 | Uruguay | .2 |
| Nigeria | 4.8 | | 93.1 |
| |
| † Based on net assets. | | | |
| See notes to financial statements. | | | |
14
STATEMENT OF ASSETS AND LIABILITIES
May 31, 2013
| | | | |
| | | Cost | Value | |
| Assets ($): | | | | |
| Investments in securities—See Statement of Investments: | | | |
| Unaffiliated issuers | | 3,638,366,315 | 3,532,477,832 | |
| Affiliated issuers | | 272,304,675 | 272,304,675 | |
| Cash | | | 14,910,940 | |
| Cash denominated in foreign currencies | | 21,084,002 | 20,728,008 | |
| Receivable for investment securities sold | | | 228,048,093 | |
| Dividends and interest receivable | | | 84,648,186 | |
| Unrealized appreciation on forward foreign | | | | |
| currency exchange contracts—Note 4 | | | 19,984,711 | |
| Receivable for shares of Beneficial Interest subscribed | | 6,872,711 | |
| Prepaid expenses | | | 57,862 | |
| | | | 4,180,033,018 | |
| Liabilities ($): | | | | |
| Due to The Dreyfus Corporation and affiliates—Note 3(c) | | 3,964,322 | |
| Payable for investment securities purchased | | | 56,956,487 | |
| Unrealized depreciation on forward foreign | | | | |
| currency exchange contracts—Note 4 | | | 26,748,687 | |
| Payable for shares of Beneficial Interest redeemed | | | 2,796,477 | |
| Unrealized depreciation on swap agreements—Note 4 | | 1,569,920 | |
| Accrued expenses | | | 391,631 | |
| | | | 92,427,524 | |
| Net Assets ($) | | | 4,087,605,494 | |
| Composition of Net Assets ($): | | | | |
| Paid-in capital | | | 4,156,743,152 | |
| Accumulated distributions in excess of investment income—net | | (11,956,582 | ) |
| Accumulated net realized gain (loss) on investments | | | 62,746,973 | |
| Accumulated net unrealized appreciation (depreciation) on | | | |
| investments, swap transactions and foreign currency transactions | (119,928,049 | ) |
| Net Assets ($) | | | 4,087,605,494 | |
| |
| |
| Net Asset Value Per Share | | | | |
| | Class A | Class C | Class I | |
| Net Assets ($) | 89,326,723 | 26,463,306 | 3,971,815,465 | |
| Shares Outstanding | 6,129,770 | 1,843,844 | 271,960,934 | |
| Net Asset Value Per Share ($) | 14.57 | 14.35 | 14.60 | |
| |
| See notes to financial statements. | | | | |
The Fund 15
| | |
| STATEMENT OF OPERATIONS | | |
| Year Ended May 31, 2013 | | |
| |
| |
| |
| |
| Investment Income ($): | | |
| Income: | | |
| Interest (net of $565,265 foreign taxes withheld at source) | 175,881,426 | |
| Dividends; | | |
| Affiliated issuers | 272,519 | |
| Total Income | 176,153,945 | |
| Expenses: | | |
| Management fee—Note 3(a) | 24,962,435 | |
| Custodian fees—Note 3(c) | 3,468,332 | |
| Shareholder servicing costs—Note 3(c) | 2,175,490 | |
| Prospectus and shareholders’ reports | 329,898 | |
| Trustees’ fees and expenses—Note 3(d) | 229,663 | |
| Registration fees | 212,642 | |
| Professional fees | 198,327 | |
| Distribution fees—Note 3(b) | 192,913 | |
| Loan commitment fees—Note 2 | 26,119 | |
| Miscellaneous | 73,067 | |
| Total Expenses | 31,868,886 | |
| Less—reduction in fees due to earnings credits—Note 3(c) | (10,290 | ) |
| Net Expenses | 31,858,596 | |
| Investment Income—Net | 144,295,349 | |
| Realized and Unrealized Gain (Loss) on Investments—Note 4 ($): | | |
| Net realized gain (loss) on investments and foreign currency transactions | 44,160,457 | |
| Net realized gain (loss) on swap transactions | 7,517,341 | |
| Net realized gain (loss) on forward foreign currency exchange contracts | 49,095,266 | |
| Net Realized Gain (Loss) | 100,773,064 | |
| Net unrealized appreciation (depreciation) on | | |
| investments and foreign currency transactions | 28,221,267 | |
| Net unrealized appreciation (depreciation) on swap transactions | (3,585,137 | ) |
| Net unrealized appreciation (depreciation) on | | |
| forward foreign currency exchange contracts | 8,010,384 | |
| Net Unrealized Appreciation (Depreciation) | 32,646,514 | |
| Net Realized and Unrealized Gain (Loss) on Investments | 133,419,578 | |
| Net Increase in Net Assets Resulting from Operations | 277,714,927 | |
| |
| See notes to financial statements. | | |
16
STATEMENT OF CHANGES IN NET ASSETS
| | | | |
| | | | Year Ended May 31, | |
| | 2013 | | 2012 | |
| Operations ($): | | | | |
| Investment income—net | 144,295,349 | | 136,363,717 | |
| Net realized gain (loss) on investments | 100,773,064 | | (149,593,927 | ) |
| Net unrealized appreciation | | | | |
| (depreciation) on investments | 32,646,514 | | (238,773,501 | ) |
| Net Increase (Decrease) in Net Assets | | | | |
| Resulting from Operations | 277,714,927 | | (252,003,711 | ) |
| Dividends to Shareholders from ($): | | | | |
| Investment income—net: | | | | |
| Class A Shares | (1,936,327 | ) | (3,566,478 | ) |
| Class C Shares | (422,203 | ) | (712,889 | ) |
| Class I Shares | (82,908,789 | ) | (109,784,543 | ) |
| Net realized gain on investments: | | | | |
| Class A Shares | — | | (654,477 | ) |
| Class C Shares | — | | (183,442 | ) |
| Class I Shares | — | | (21,938,188 | ) |
| Total Dividends | (85,267,319 | ) | (136,840,017 | ) |
| Beneficial Interest Transactions ($): | | | | |
| Net proceeds from shares sold: | | | | |
| Class A Shares | 44,956,693 | | 73,341,024 | |
| Class C Shares | 10,135,628 | | 19,101,101 | |
| Class I Shares | 1,932,479,050 | | 1,692,413,545 | |
| Dividends reinvested: | | | | |
| Class A Shares | 1,554,917 | | 3,896,784 | |
| Class C Shares | 176,981 | | 532,710 | |
| Class I Shares | 18,880,289 | | 25,343,170 | |
| Cost of shares redeemed: | | | | |
| Class A Shares | (41,981,442 | ) | (65,351,990 | ) |
| Class C Shares | (10,173,846 | ) | (6,990,192 | ) |
| Class I Shares | (947,073,528 | ) | (866,548,694 | ) |
| Increase (Decrease) in Net Assets from | | | | |
| Beneficial Interest Transactions | 1,008,954,742 | | 875,737,458 | |
| Total Increase (Decrease) in Net Assets | 1,201,402,350 | | 486,893,730 | |
| Net Assets ($): | | | | |
| Beginning of Period | 2,886,203,144 | | 2,399,309,414 | |
| End of Period | 4,087,605,494 | | 2,886,203,144 | |
| Distributions in excess of | | | | |
| investment income—net | (11,956,582 | ) | (41,472,485 | ) |
The Fund 17
STATEMENT OF CHANGES IN NET ASSETS (continued)
| | | | |
| | | | Year Ended May 31, | |
| | 2013 | | 2012 | |
| Capital Share Transactions: | | | | |
| Class Aa | | | | |
| Shares sold | 2,981,461 | | 5,063,302 | |
| Shares issued for dividends reinvested | 102,433 | | 273,024 | |
| Shares redeemed | (2,838,012 | ) | (4,705,776 | ) |
| Net Increase (Decrease) in Shares Outstanding | 245,882 | | 630,550 | |
| Class Ca | | | | |
| Shares sold | 679,141 | | 1,332,234 | |
| Shares issued for dividends reinvested | 11,805 | | 37,930 | |
| Shares redeemed | (697,358 | ) | (512,575 | ) |
| Net Increase (Decrease) in Shares Outstanding | (6,412 | ) | 857,589 | |
| Class I | | | | |
| Shares sold | 127,248,526 | | 118,078,816 | |
| Shares issued for dividends reinvested | 1,241,984 | | 1,798,107 | |
| Shares redeemed | (65,179,355 | ) | (62,330,908 | ) |
| Net Increase (Decrease) in Shares Outstanding | 63,311,155 | | 57,546,015 | |
a During the period ended May 31, 2013, 7,260 Class C shares representing $110,715 were exchanged for 7,152
Class A shares.
See notes to financial statements.
18
FINANCIAL HIGHLIGHTS
The following tables describe the performance for each share class for the fiscal periods indicated.All information (except portfolio turnover rate) reflects financial results for a single fund share.Total return shows how much your investment in the fund would have increased (or decreased) during each period, assuming you had reinvested all dividends and distributions.These figures have been derived from the fund’s financial statements.
| | | | | | | | | | |
| | | | Year Ended May 31, | | | |
| Class A Shares | 2013 | | 2012 | | 2011 | | 2010 | | 2009 | a |
| Per Share Data ($): | | | | | | | | | | |
| Net asset value, beginning of period | 13.32 | | 15.22 | | 13.39 | | 12.11 | | 12.50 | |
| Investment Operations: | | | | | | | | | | |
| Investment income—netb | .61 | | .67 | | .65 | | .55 | | .45 | |
| Net realized and unrealized | | | | | | | | | | |
| gain (loss) on investments | .98 | | (1.87 | ) | 1.61 | | .96 | | (.59 | ) |
| Total from Investment Operations | 1.59 | | (1.20 | ) | 2.26 | | 1.51 | | (.14 | ) |
| Distributions: | | | | | | | | | | |
| Dividends from investment income—net | (.34 | ) | (.59 | ) | (.36 | ) | (.18 | ) | (.25 | ) |
| Dividends from net realized | | | | | | | | | | |
| gain on investments | — | | (.11 | ) | (.07 | ) | (.05 | ) | — | |
| Total Distributions | (.34 | ) | (.70 | ) | (.43 | ) | (.23 | ) | (.25 | ) |
| Net asset value, end of period | 14.57 | | 13.32 | | 15.22 | | 13.39 | | 12.11 | |
| Total Return (%)c | 11.83 | | (8.12 | ) | 17.21 | | 12.56 | | (.95 | )d |
| Ratios/Supplemental Data (%): | | | | | | | | | | |
| Ratio of total expenses | | | | | | | | | | |
| to average net assets | 1.24 | | 1.22 | | 1.27 | | 1.50 | | 3.08 | e |
| Ratio of net expenses | | | | | | | | | | |
| to average net assets | 1.24 | | 1.22 | | 1.27 | | 1.32 | | 1.35 | e |
| Ratio of net investment income | | | | | | | | | | |
| to average net assets | 4.09 | | 4.64 | | 4.48 | | 4.22 | | 5.67 | e |
| Portfolio Turnover Rate | 58.82 | | 112.87 | | 97.99 | | 74.25 | | 108.46 | d |
| Net Assets, end of period ($ x 1,000) | 89,327 | | 78,351 | | 79,957 | | 38,428 | | 17,469 | |
a From September 12, 2008 (commencement of operations) to May 31, 2009.
b Based on average shares outstanding at each month end.
c Exclusive of sales charge.
d Not annualized.
e Annualized.
See notes to financial statements.
The Fund 19
FINANCIAL HIGHLIGHTS (continued)
| | | | | | | | | | |
| | | | Year Ended May 31, | | | |
| Class C Shares | 2013 | | 2012 | | 2011 | | 2010 | | 2009 | a |
| Per Share Data ($): | | | | | | | | | | |
| Net asset value, beginning of period | 13.14 | | 15.06 | | 13.29 | | 12.07 | | 12.50 | |
| Investment Operations: | | | | | | | | | | |
| Investment income—netb | .48 | | .55 | | .53 | | .46 | | .39 | |
| Net realized and unrealized | | | | | | | | | | |
| gain (loss) on investments | .97 | | (1.85 | ) | 1.60 | | .95 | | (.59 | ) |
| Total from Investment Operations | 1.45 | | (1.30 | ) | 2.13 | | 1.41 | | (.20 | ) |
| Distributions: | | | | | | | | | | |
| Dividends from investment income—net | (.24 | ) | (.51 | ) | (.29 | ) | (.14 | ) | (.23 | ) |
| Dividends from net realized | | | | | | | | | | |
| gain on investments | — | | (.11 | ) | (.07 | ) | (.05 | ) | — | |
| Total Distributions | (.24 | ) | (.62 | ) | (.36 | ) | (.19 | ) | (.23 | ) |
| Net asset value, end of period | 14.35 | | 13.14 | | 15.06 | | 13.29 | | 12.07 | |
| Total Return (%)c | 10.98 | | (8.83 | ) | 16.28 | | 11.73 | | (1.49 | )d |
| Ratios/Supplemental Data (%): | | | | | | | | | | |
| Ratio of total expenses | | | | | | | | | | |
| to average net assets | 2.00 | | 1.96 | | 1.99 | | 2.27 | | 3.84 | e |
| Ratio of net expenses | | | | | | | | | | |
| to average net assets | 2.00 | | 1.96 | | 1.99 | | 2.09 | | 2.10 | e |
| Ratio of net investment income | | | | | | | | | | |
| to average net assets | 3.25 | | 3.84 | | 3.65 | | 3.53 | | 4.92 | e |
| Portfolio Turnover Rate | 58.82 | | 112.87 | | 97.99 | | 74.25 | | 108.46 | d |
| Net Assets, end of period ($ x 1,000) | 26,463 | | 24,306 | | 14,953 | | 1,888 | | 966 | |
a From September 12, 2008 (commencement of operations) to May 31, 2009.
b Based on average shares outstanding at each month end.
c Exclusive of sales charge.
d Not annualized.
e Annualized.
See notes to financial statements.
20
| | | | | | | | | | |
| | | | | | Year Ended May 31, | | | |
| Class I Shares | 2013 | | 2012 | | 2011 | | 2010 | | 2009 | a |
| Per Share Data ($): | | | | | | | | | | |
| Net asset value, beginning of period | 13.34 | | 15.25 | | 13.42 | | 12.12 | | 12.50 | |
| Investment Operations: | | | | | | | | | | |
| Investment income—netb | .65 | | .70 | | .69 | | .41 | | .47 | |
| Net realized and unrealized | | | | | | | | | | |
| gain (loss) on investments | .99 | | (1.88 | ) | 1.62 | | 1.14 | | (.59 | ) |
| Total from Investment Operations | 1.64 | | (1.18 | ) | 2.31 | | 1.55 | | (.12 | ) |
| Distributions: | | | | | | | | | | |
| Dividends from | | | | | | | | | | |
| investment income—net | (.38 | ) | (.62 | ) | (.41 | ) | (.20 | ) | (.26 | ) |
| Dividends from net realized | | | | | | | | | | |
| gain on investments | — | | (.11 | ) | (.07 | ) | (.05 | ) | — | |
| Total Distributions | (.38 | ) | (.73 | ) | (.48 | ) | (.25 | ) | (.26 | ) |
| Net asset value, end of period | 14.60 | | 13.34 | | 15.25 | | 13.42 | | 12.12 | |
| Total Return (%) | 12.18 | | (7.94 | ) | 17.45 | | 12.94 | | (.79 | )c |
| Ratios/Supplemental Data (%): | | | | | | | | | | |
| Ratio of total expenses | | | | | | | | | | |
| to average net assets | .94 | | .93 | | .97 | | 1.02 | | 2.84 | d |
| Ratio of net expenses | | | | | | | | | | |
| to average net assets | .94 | | .93 | | .97 | | 1.01 | | 1.10 | d |
| Ratio of net investment income | | | | | | | | | | |
| to average net assets | 4.35 | | 4.88 | | 4.73 | | 3.60 | | 5.92 | d |
| Portfolio Turnover Rate | 58.82 | | 112.87 | | 97.99 | | 74.25 | | 108.46 | c |
| Net Assets, end of period | | | | | | | | | | |
| ($ x 1,000) | 3,971,815 | | 2,783,546 | | 2,304,400 | | 561,401 | | 970 | |
a From September 12, 2008 (commencement of operations) to May 31, 2009.
b Based on average shares outstanding at each month end.
c Not annualized.
d Annualized.
See notes to financial statements.
The Fund 21
NOTES TO FINANCIAL STATEMENTS
NOTE 1—Significant Accounting Policies:
Dreyfus Emerging Markets Debt Local Currency Fund (the “fund”) is a separate non-diversified series of The Dreyfus/Laurel Funds Trust (the “Trust”), which is registered under the Investment Company Act of 1940, as amended (the “Act”), as an open-end management investment company and operates as a series company offering five series, including the fund.The fund’s investment objective seeks to maximize total return.The Dreyfus Corporation (the “Manager” or “Dreyfus”), a wholly-owned subsidiary of The Bank of New York Mellon Corporation (“BNY Mellon”), serves as the fund’s investment adviser.
MBSC Securities Corporation (the “Distributor”), a wholly-owned subsidiary of the Manager, is the distributor of the fund’s shares. The fund is authorized to issue an unlimited number of $.001 par value shares of Beneficial Interest in each of the following classes of shares: Class A, Class C and Class I. Class A and Class C shares are sold primarily to retail investors through financial intermediaries and bear a Distribution and/or Shareholder Services Plan fees. Class A shares generally are subject to a sales charge imposed at the time of purchase. Class C shares are subject to a contingent deferred sales charge (“CDSC”) imposed on Class C shares redeemed within one year of purchase. Class I shares are sold primarily to bank trust departments and other financial service providers (including The Bank of New York Mellon, a subsidiary of BNY Mellon and an affiliate of Dreyfus, and its affiliates), acting on behalf of customers having a qualified trust or investment account or relationship at such institution, and bear no Distribution or Shareholder Services Plan fees. Class I shares are offered without a front-end sales charge or CDSC. Other differences between the classes include the services offered to and the expenses borne by each class, the allocation of certain transfer agency costs and certain voting rights. Income, expenses (other than expenses attributable to a specific class), and realized and unrealized gains or losses on investments are allocated to each class of shares based on its relative net assets.
22
The sales charge may be reduced or waived for certain purchases of Class A shares. Effective April 1, 2013, pursuant to new/modified front-end sales charge waivers, Class A shares of the fund may be purchased at net asset value without payment of a sales charge by (a) investors who participate in a self-directed investment brokerage account program offered by financial intermediaries that have entered into an agreement with the fund’s Distributor (financial intermediaries offering self-directed investment brokerage accounts may or may not charge their customers a transaction fee) and (b) investors who purchase Class A shares directly through the fund’s Distributor, and either (i) have, or whose spouse or minor children have, beneficially owned shares and continuously maintained an open account with the Distributor in a Dreyfus-managed fund since on or before February 28, 2006, or (ii) such purchase is for a self-directed investment account that may or may not be subject to a transaction fee.
On April 24-25, 2013, the Trust’s Board of Trustees (the “Board”) authorized the fund to offer Class Y shares, as a new class of shares, to certain investors, including certain institutional investors. Effective July 1, 2013, ClassY shares will be offered at net asset value and will not be subject to certain fees, including Distribution Plan and Shareholder Services Plan fees.
The Trust accounts separately for the assets, liabilities and operations of each series. Expenses directly attributable to each series are charged to that series’ operations; expenses which are applicable to all series are allocated among them on a pro rata basis.
The Financial Accounting Standards Board (“FASB”) Accounting Standards Codification is the exclusive reference of authoritative U.S. generally accepted accounting principles (“GAAP”) recognized by the FASB to be applied by nongovernmental entities. Rules and interpretive releases of the Securities and Exchange Commission (“SEC”) under authority of federal laws are also sources of authoritative GAAP for SEC
The Fund 23
NOTES TO FINANCIAL STATEMENTS (continued)
registrants. The fund’s financial statements are prepared in accordance with GAAP, which may require the use of management estimates and assumptions.Actual results could differ from those estimates.
(a) Portfolio valuation: The fair value of a financial instrument is the amount that would be received to sell an asset or paid to transfer a liability in an orderly transaction between market participants at the measurement date (i.e., the exit price). GAAP establishes a fair value hierarchy that prioritizes the inputs of valuation techniques used to measure fair value.This hierarchy gives the highest priority to unadjusted quoted prices in active markets for identical assets or liabilities (Level 1 measurements) and the lowest priority to unobservable inputs (Level 3 measurements).
Additionally, GAAP provides guidance on determining whether the volume and activity in a market has decreased significantly and whether such a decrease in activity results in transactions that are not orderly. GAAP requires enhanced disclosures around valuation inputs and techniques used during annual and interim periods.
Various inputs are used in determining the value of the fund’s investments relating to fair value measurements.These inputs are summarized in the three broad levels listed below:
Level 1—unadjusted quoted prices in active markets for identical investments.
Level 2—other significant observable inputs (including quoted prices for similar investments, interest rates, prepayment speeds, credit risk, etc.).
Level 3—significant unobservable inputs (including the fund’s own assumptions in determining the fair value of investments).
The inputs or methodology used for valuing securities are not necessarily an indication of the risk associated with investing in those securities.
Changes in valuation techniques may result in transfers in or out of an assigned level within the disclosure hierarchy. Valuation techniques used to value the fund’s investments are as follows:
24
Registered investment companies that are not traded on an exchange are valued at their net asset value and are categorized within Level 1 of the fair value hierarchy.
Investments in securities, excluding short-term investments (other than U.S. Treasury Bills) and forward foreign currency exchange contracts (“forward contracts”) are valued each business day by an independent pricing service (the “Service”) approved by the Board. Investments for which quoted bid prices are readily available and are representative of the bid side of the market in the judgment of the Service are valued at the mean between the quoted bid prices (as obtained by the Service from dealers in such securities) and asked prices (as calculated by the Service based upon its evaluation of the market for such securities). Other investments (which constitute a majority of the portfolio securities) are valued as determined by the Service, based on methods which include consideration of the following: yields or prices of securities of comparable quality, coupon, maturity and type; indications as to values from dealers; and general market conditions.These securities are generally categorized within Level 2 of the fair value hierarchy.
U.S. Treasury Bills are valued at the mean price between quoted bid prices and asked prices by the Service. These securities are generally categorized within Level 2 of the fair value hierarchy.
The Service’s procedures are reviewed by Dreyfus under the general supervision of the Board.
When market quotations or official closing prices are not readily available, or are determined not to reflect accurately fair value, such as when the value of a security has been significantly affected by events after the close of the exchange or market on which the security is principally traded (for example, a foreign exchange or market), but before the fund calculates its net asset value, the fund may value these investments at fair value as determined in accordance with the procedures approved by the Board. Certain factors may be considered when fair valuing investments such as: fundamental analytical data, the nature
The Fund 25
NOTES TO FINANCIAL STATEMENTS (continued)
and duration of restrictions on disposition, an evaluation of the forces that influence the market in which the securities are purchased and sold, and public trading in similar securities of the issuer or comparable issuers.These securities are either categorized within Level 2 or 3 of the fair value hierarchy depending on the relevant inputs used.
For restricted securities where observable inputs are limited, assumptions about market activity and risk are used and are categorized within Level 3 of the fair value hierarchy.
Investments denominated in foreign currencies are translated to U.S. dollars at the prevailing rates of exchange.
Investments in swap transactions are valued each business day by the Service. Swaps are valued by the Service by using a swap pricing model which incorporates among other factors, default probabilities, recovery rates, credit curves of the underlying issuer and swap spreads on interest rates. These securities are generally categorized within Level 2 of the fair value hierarchy. Forward contracts are valued at the forward rate.These securities are generally categorized within Level 2 of the fair value hierarchy.
The following is a summary of the inputs used as of May 31, 2013 in valuing the fund’s investments:
| | | | |
| | | Level 2—Other | Level 3— | |
| | Level 1— | Significant | Significant | |
| | Unadjusted | Observable | Unobservable | |
| | Quoted Prices | Inputs | Inputs | Total |
| Assets ($) | | | | |
| Investments in Securities: | | | |
| Foreign | | | | |
| Government | — | 3,523,708,113 | — | 3,523,708,113 |
| Mutual Funds | 272,304,675 | — | — | 272,304,675 |
| U.S. Treasury | — | 8,769,719 | — | 8,769,719 |
| Other Financial | | | | |
| Instruments: | | | | |
| Forward Foreign | | | | |
| Currency Exchange | | | |
| Contracts† | — | 19,984,711 | — | 19,984,711 |
26
| | | | | | |
| | | Level 2—Other | | Level 3— | | |
| | Level 1— | Significant | | Significant | | |
| | Unadjusted | Observable | | Unobservable | | |
| | Quoted Prices | Inputs | | Inputs | Total | |
| Liabilities ($) | | | | | | |
| Other Financial | | | | | | |
| Instruments: | | | | | | |
| Forward Foreign | | | | | | |
| Currency Exchange | | | | | |
| Contracts† | — | (26,748,687 | ) | — | (26,748,687 | ) |
| Swaps† | — | (1,569,920 | ) | — | (1,569,920 | ) |
| |
| † Amount shown represents unrealized appreciation (depreciation) at period end. | | |
At May 31, 2013, there were no transfers between Level 1 and Level 2 of the fair value hierarchy.
(b) Foreign currency transactions: The fund does not isolate that portion of the results of operations resulting from changes in foreign exchange rates on investments from the fluctuations arising from changes in the market prices of securities held. Such fluctuations are included with the net realized and unrealized gain or loss on investments.
Net realized foreign exchange gains or losses arise from sales of foreign currencies, currency gains or losses realized on securities transactions between trade and settlement date, and the difference between the amounts of dividends, interest and foreign withholding taxes recorded on the fund’s books and the U.S. dollar equivalent of the amounts actually received or paid. Net unrealized foreign exchange gains and losses arise from changes in the value of assets and liabilities other than investments resulting from changes in exchange rates. Foreign currency gains and losses on foreign currency transactions are also included with net realized and unrealized gain or loss on investments.
(c) Securities transactions and investment income: Securities transactions are recorded on a trade date basis. Realized gains and losses from securities transactions are recorded on the identified cost basis. Dividend income is recognized on the ex-dividend date and interest
The Fund 27
NOTES TO FINANCIAL STATEMENTS (continued)
income, including, where applicable, accretion of discount and amortization of premium on investments, is recognized on the accrual basis.
(d) Affiliated issuers: Investments in other investment companies advised by Dreyfus are defined as “affiliated” under the Act. Investments in affiliated investment companies during the period ended May 31, 2013 were as follows:
| | | | | | |
| Affiliated | | | | | | |
| Investment | Value | | | | Value | Net |
| Company | 5/31/2012 | ($) | Purchases ($) | Sales | ($) 5/31/2013 ($) | Assets (%) |
| Dreyfus | | | | | | |
| Institutional | | | | | |
| Preferred | | | | | | |
| Plus Money | | | | | |
| Market | | | | | | |
| Fund | 298,418,584 | | 2,318,058,636 | | 2,344,172,545 272,304,675 | 6.7 |
(e) Risk: The fund invests primarily in debt securities. Failure of an issuer of the debt securities to make timely interest or principal payments, or a decline or the perception of a decline in the credit quality of a debt security, can cause the debt security’s price to fall, potentially lowering the fund’s share price. In addition, the value of debt securities may decline due to general market conditions that are not specifically related to a particular issuer, such as real or perceived adverse economic conditions, changes in outlook for corporate earnings, changes in interest or currency rates or adverse investor sentiment.They may also decline because of factors that affect a particular industry or country.
Investing in foreign markets may involve special risks and considerations not typically associated with investing in the U.S. These risks include revaluation of currencies, high rates of inflation, repatriation restrictions on income and capital, and adverse political and economic developments. Moreover, securities issued in these markets may be less liquid, subject to government ownership controls and delayed settlements, and their prices may be more volatile than those of comparable securities in the U.S.
(f) Dividends to shareholders: Dividends are recorded on the ex-dividend date. Dividends from investment income-net are normally
28
declared and paid quarterly. Dividends from net realized capital gains, if any, are normally declared and paid annually, but the fund may make distributions on a more frequent basis to comply with the distribution requirements of the Internal Revenue Code of 1986, as amended (the “Code”).To the extent that net realized capital gains can be offset by capital loss carryovers, it is the policy of the fund not to distribute such gains. Income and capital gain distributions are determined in accordance with income tax regulations, which may differ from GAAP.
(g) Federal income taxes: It is the policy of the fund to continue to qualify as a regulated investment company, if such qualification is in the best interests of its shareholders, by complying with the applicable provisions of the Code, and to make distributions of taxable income sufficient to relieve it from substantially all federal income and excise taxes.
As of and during the period ended May 31, 2013, the fund did not have any liabilities for any uncertain tax positions.The fund recognizes interest and penalties, if any, related to uncertain tax positions as income tax expense in the Statement of Operations. During the period, the fund did not incur any interest or penalties.
Each tax year in the four-year period ended May 31, 2013 remains subject to examination by the Internal Revenue Service and state taxing authorities.
At May 31, 2013, the components of accumulated earnings on a tax basis were as follows: undistributed ordinary income $44,707,187, undistributed capital gains $11,691,864 and unrealized depreciation $125,536,709.
The tax character of distributions paid to shareholders during the fiscal periods ended May 31, 2013 and May 31, 2012 were as follows: ordinary income $85,267,319 and $123,728,177, and long-term capital gains $0 and $13,111,840, respectively.
The Fund 29
NOTES TO FINANCIAL STATEMENTS (continued)
During the period ended May 31, 2013, as a result of permanent book to tax differences, primarily due to the tax treatment for foreign currency gains and losses and swap periodic payments, the fund decreased accumulated undistributed investment income-net by $29,512,127 and increased accumulated net realized gain (loss) on investments by the same amount. Net assets and net asset value per share were not affected by this reclassification.
(h) New Accounting Pronouncement: In January 2013, FASB issued Accounting Standards Update No. 2013-01 (“ASU 2013-01”), “Clarifying the Scope of Disclosures about Offsetting Assets and Liabilities”, which replaced Accounting Standards Update No. 2011-11 (“ASU 2011-11”), “Disclosures about Offsetting Assets and Liabilities”. ASU 2013-01 is effective for fiscal years beginning on or after January 1, 2013, and interim periods within those annual periods.ASU 2011-11 was intended to enhance disclosure requirements on the offsetting of financial assets and liabilities.ASU 2013-01 limits the scope of the new balance sheet offsetting disclosures to derivatives, repurchase agreements, and securities lending transactions to the extent that they are (1) offset in the financial statements or (2) subject to an enforceable master netting arrangement or similar agreement. Management is currently evaluating the application of ASU 2013-01 and its impact on the fund’s financial statements.
NOTE 2—Bank Lines of Credit:
The fund participates with other Dreyfus-managed funds in a $210 million unsecured credit facility led by Citibank, N.A. and a $300 million unsecured credit facility provided by The Bank of New York Mellon (each, a “Facility”), each to be utilized primarily for temporary or emergency purposes, including the financing of redemptions. Prior to October 10, 2012, the unsecured credit facility with Citibank, N.A. was $225 million. In connection therewith, the fund has agreed to pay its pro rata portion of commitment fees for each Facility. Interest is
30
charged to the fund based on rates determined pursuant to the terms of the respective Facility at the time of borrowing. During the period ended May 31, 2013, the fund did not borrow under the Facilities.
NOTE 3—Management Fee and Other Transactions With Affiliates:
(a) Pursuant to a management agreement between the Manager and the fund, the fund has agreed to pay the Manager a management fee computed at the annual rate of .75% of the value of the fund’s average daily net assets and is payable monthly.The Manager had contractually agreed, from June 1, 2012 through October 1, 2012, to waive receipt of its fees and/or assume the expenses of the fund, so that the expenses of none of the classes (excluding Rule 12b-1 Distribution Plan fees, Shareholder Services Plan fees, taxes, interest expense, brokerage commissions, commitment fees on borrowings and extraordinary expenses) exceeded 1.10% of the value of the fund’s average daily net assets. During the period ended May 31, 2013, there was no reduction in expenses pursuant to the undertaking.
During the period ended May 31, 2013, the Distributor retained $9,069 from commissions earned on sales of the fund’s Class A shares and $11,724 from CDSCs on redemptions of the fund’s Class C shares.
(b) Under the Distribution Plan adopted pursuant to Rule 12b-1 under the Act, Class C shares pay the Distributor for distributing its shares at an annual rate of .75% of the value of its average daily net assets. During the period ended May 31, 2013, Class C shares were charged $192,913 pursuant to the Distribution Plan.
(c) Under the Shareholder Services Plan, Class A and Class C shares pay the Distributor at an annual rate of .25% of the value of their average daily net assets for the provision of certain services.The services provided may include personal services relating to shareholder accounts, such as
The Fund 31
NOTES TO FINANCIAL STATEMENTS (continued)
answering shareholder inquiries regarding the fund and providing reports and other information, and services related to the maintenance of shareholder accounts.The Distributor may make payments to Service Agents (securities dealers, financial institutions or other industry professionals) with respect to these services. The Distributor determines the amounts to be paid to Service Agents. During the period ended May 31, 2013, Class A and Class C shares were charged $212,737 and $64,305, respectively, pursuant to the Shareholder Services Plan.
Under its terms, the Distribution Plan and Shareholder Services Plan shall remain in effect from year to year, provided such continuance is approved annually by a vote of a majority of those Trustees who are not “interested persons” of the Trust and who have no direct or indirect financial interest in the operation of or in any agreement related to the Distribution Plan or Shareholder Services Plan.
The fund has arrangements with the transfer agent and the custodian whereby the fund may receive earnings credits when positive cash balances are maintained, which are used to offset transfer agency and custody fees. For financial reporting purposes, the fund includes net earnings credits as an expense offset in the Statement of Operations.
The fund compensates DreyfusTransfer, Inc., a wholly-owned subsidiary of the Manager, under a transfer agency agreement for providing transfer agency services for the fund and cash management services related to fund subscriptions and redemptions. During the period ended May 31, 2013, the fund was charged $1,344,514 for transfer agency services and $68,600 for cash management services. Cash management fees were partially offset by earnings credits of $9,945. These fees are included in Shareholder servicing costs in the Statement of Operations.
The fund compensates The Bank of New York Mellon under a custody agreement for providing custodial services for the fund. During the period ended May 31, 2013, the fund was charged $3,468,332 pursuant to the custody agreement.
32
The fund compensates The Bank of New York Mellon under a cash management agreement for performing certain cash management services related to fund subscriptions and redemptions. During the period ended May 31, 2013, the fund was charged $42,606 pursuant to the cash management agreement, which is included in Shareholder servicing costs in the Statement of Operations.These fees were partially offset by earnings credits of $345.
During the period ended May 31, 2013, the fund was charged $8,527 for services performed by the Chief Compliance Officer and his staff.
The components of “Due to The Dreyfus Corporation and affiliates” in the Statement of Assets and Liabilities consist of: management fees $2,702,013, Distribution Plan fees $17,897, Shareholder Services Plan fees $26,113, custodian fees $984,155, Chief Compliance Officer fees $3,830 and transfer agency fees $230,314.
(d) Each Board member also serves as a Board member of other funds within the Dreyfus complex. Annual retainer fees and attendance fees are allocated to each fund based on net assets.
(e) A 2% redemption fee is charged and retained by the fund on certain shares redeemed within sixty days following the date of issuance, subject to exceptions, including redemptions made through use of the fund’s exchange privilege. During the period ended May 31, 2013, redemption fees charged and retained by the fund amounted to $198,397.
NOTE 4—Securities Transactions:
The aggregate amount of purchases and sales of investment securities, excluding short-term securities, forward contracts and swap transactions, during the period ended May 31, 2013, amounted to $2,900,763,579 and $1,736,423,523, respectively.
Derivatives: A derivative is a financial instrument whose performance is derived from the performance of another asset. Each type of deriv-
The Fund 33
NOTES TO FINANCIAL STATEMENTS (continued)
ative instrument that was held by the fund during the period ended May 31, 2013 is discussed below.
The following tables show the fund’s exposure to different types of market risk as it relates to the Statement of Assets and Liabilities and the Statement of Operations, respectively.
Fair value of derivative instruments as of May 31, 2013 is shown below:
| | | | | |
| | | Derivative | | Derivative | |
| | | Assets ($) | | Liabilities ($) | |
| Interest rate risk | — | Interest rate risk1 | (1,569,920 | ) |
| Foreign exchange risk2 | 19,984,711 | Foreign exchange risk3 | (26,748,687 | ) |
| Gross fair value of | | | | |
| | derivatives contracts | 19,984,711 | | (28,318,607 | ) |
| |
| Statement of Assets and Liabilities location: | | | |
| 1 | Unrealized depreciation on swap agreements. | | | |
| 2 | Unrealized appreciation on forward foreign currency exchange contracts. | | |
| 3 | Unrealized depreciation on forward foreign currency exchange contracts. | | |
The effect of derivative instruments in the Statement of Operations during the period ended May 31, 2013 is shown below:
| | | |
| | Amount of realized gain (loss) on derivatives recognized in income ($) |
| | Forward | Swap | |
| Underlying risk | Contracts4 | Transactions5 | Total |
| Interest rate | — | 7,517,341 | 7,517,341 |
| Foreign exchange | 49,095,266 | — | 49,095,266 |
| Total | 49,095,266 | 7,517,341 | 56,612,607 |
Change in unrealized appreciation (depreciation) on derivatives recognized in income ($)
| | | | | |
| | Forward | Swap | | | |
| Underlying risk | Contracts6 | Transactions7 | | Total | |
| Interest rate | — | (3,585,137 | ) | (3,585,137 | ) |
| Foreign exchange | 8,010,384 | — | | 8,010,384 | |
| Total | 8,010,384 | (3,585,137 | ) | 4,425,247 | |
Statement of Operations location:
4 Net realized gain (loss) on forward foreign currency exchange contracts.
5 Net realized gain (loss) on swap transactions.
6 Net unrealized appreciation (depreciation) on forward foreign currency exchange contracts.
7 Net unrealized appreciation (depreciation) on swap transactions.
34
Forward Foreign Currency Exchange Contracts: The fund enters into forward contracts in order to hedge its exposure to changes in foreign currency exchange rates on its foreign portfolio holdings, to settle foreign currency transactions or as a part of its investment strategy. When executing forward contracts, the fund is obligated to buy or sell a foreign currency at a specified rate on a certain date in the future. With respect to sales of forward contracts, the fund incurs a loss if the value of the contract increases between the date the forward contract is opened and the date the forward contract is closed.The fund realizes a gain if the value of the contract decreases between those dates.With respect to purchases of forward contracts, the fund incurs a loss if the value of the contract decreases between the date the forward contract is opened and the date the forward contract is closed.The fund realizes a gain if the value of the contract increases between those dates. Any realized or unrealized gains or losses which occurred during the period are reflected in the Statement of Operations. The fund is exposed to foreign currency risk as a result of changes in value of underlying financial instruments.The fund is also exposed to credit risk associated with counterparty nonperformance on these forward contracts, which is typically limited to the unrealized gain on each open contract.The following summarizes open forward contracts at May 31, 2013:
| | | | | | | |
| | | | Foreign | | | Unrealized | |
| Forward Foreign Currency | Currency | | | Appreciation | |
| Exchange Contracts | Amounts | Cost ($) | Value ($) (Depreciation) ($) | |
| Purchases: | | | | | | | |
| Brazilian Real, | | | | | | | |
| Expiring: | | | | | | | |
| 6/4/2013 | a | 11,660,000 | 5,799,552 | 5,439,882 | (359,670 | ) |
| 6/4/2013 | b | 77,640,000 | 38,569,430 | 36,222,341 | (2,347,089 | ) |
| 7/2/2013 | c | 343,110,000 | 166,586,556 | 159,106,261 | (7,480,295 | ) |
| Chilean Peso, | | | | | | | |
| Expiring | | | | | | | |
| 6/28/2013 | d | 12,693,175,000 | 26,034,612 | 25,209,102 | (825,510 | ) |
| Euro, | | | | | | | |
| Expiring: | | | | | | | |
| 6/28/2013 | d | | 8,840,000 | 11,412,148 | 11,491,569 | 79,421 | |
| 6/28/2013 | e | 45,125,000 | 58,223,434 | 58,660,304 | 436,870 | |
The Fund 35
NOTES TO FINANCIAL STATEMENTS (continued)
| | | | | | | |
| | | | Foreign | | | Unrealized | |
| Forward Foreign Currency | Currency | | | Appreciation | |
| Exchange Contracts | Amounts | Cost ($) | Value ($) (Depreciation) ($) | |
| Purchases (continued): | | | | | |
| Hungarian Forint, | | | | | | | |
| Expiring: | | | | | | | |
| 6/28/2013 | b | 18,550,000,000 | 82,415,141 | 81,030,909 | (1,384,232 | ) |
| 6/28/2013 | f | 18,892,675,000 | 83,755,930 | 82,527,796 | (1,228,134 | ) |
| 6/28/2013 | g | 12,533,630,000 | 55,664,202 | 54,749,942 | (914,260 | ) |
| Indian Rupee, | | | | | | | |
| Expiring | | | | | | | |
| 6/28/2013 | e | 2,506,180,000 | 44,819,643 | 44,125,800 | (693,843 | ) |
| Malaysian Ringgit, | | | | | |
| Expiring | | | | | | | |
| 6/28/2013 | f | 281,865,000 | 91,577,049 | 90,766,352 | (810,697 | ) |
| Mexican New Peso, | | | | | |
| Expiring: | | | | | | | |
| 6/4/2013 | d | 15,737,379 | 1,228,392 | 1,231,575 | 3,183 | |
| 6/28/2013 | b | 1,030,160,000 | 83,427,276 | 80,395,025 | (3,032,251 | ) |
| 6/28/2013 | f | 1,594,860,000 | 126,811,985 | 124,464,946 | (2,347,039 | ) |
| Nigerian Naira, | | | | | | | |
| Expiring: | | | | | | | |
| 6/24/2013 | a | 5,480,000,000 | 33,946,918 | 34,342,927 | 396,009 | |
| 7/5/2013 | a | 4,000,000,000 | 24,852,439 | 24,962,046 | 109,607 | |
| 7/19/2013 | a | 6,800,000,000 | 42,500,000 | 42,220,960 | (279,040 | ) |
| 8/9/2013 | f | 5,820,910,000 | 36,036,405 | 35,866,438 | (169,967 | ) |
| Polish Zloty, | | | | | | | |
| Expiring: | | | | | | | |
| 6/28/2013 | a | 56,730,000 | 17,444,909 | 17,211,408 | (233,501 | ) |
| 6/28/2013 | b | 299,940,000 | 92,299,962 | 90,999,293 | (1,300,669 | ) |
| 6/28/2013 | e | 187,050,000 | 57,549,621 | 56,749,409 | (800,212 | ) |
| 6/28/2013 | f | 84,965,000 | 25,931,135 | 25,777,672 | (153,463 | ) |
| 6/28/2013 | h | 148,710,000 | 45,824,603 | 45,117,373 | (707,230 | ) |
| Russian Ruble, | | | | | | | |
| Expiring | | | | | | | |
| 9/12/2013 | f | 1,902,000,000 | 56,636,135 | 58,503,126 | 1,866,991 | |
| South African Rand, | | | | | |
| Expiring: | | | | | | | |
| 6/4/2013 | e | 203,976,175 | 20,219,283 | 20,272,032 | 52,749 | |
| 6/28/2013 | e | 202,515,000 | 21,098,609 | 20,043,556 | (1,055,053 | ) |
| Sales: | | | | Proceeds ($) | | | |
| Brazilian Real, | | | | | | | |
| Expiring | | | | | | | |
| 6/4/2013 | c | 89,300,000 | 43,550,354 | 41,662,223 | 1,888,131 | |
| Colombian Peso, | | | | | | | |
| Expiring | | | | | | | |
| 6/28/2013 | c | 35,717,990,000 | 19,298,676 | 18,712,786 | 585,890 | |
| Czech Koruna, | | | | | | | |
| Expiring | | | | | | | |
| 6/28/2013 | e | 658,000,000 | 32,627,560 | 33,247,608 | (620,048 | ) |
36
| | | | | | |
| | | Foreign | | | Unrealized | |
| Forward Foreign Currency Currency | | | Appreciation | |
| Exchange Contracts | | Amounts | Proceeds ($) | Value ($) (Depreciation) ($) | |
| Sales (continued): | | | | | | |
| Hungarian Forint, | | | | | | |
| Expiring: | | | | | | |
| 6/3/2013 | f | 3,582,267,000 | 15,897,164 | 15,696,228 | 200,936 | |
| 6/4/2013 | f | 2,919,670,000 | 12,809,278 | 12,792,962 | 16,316 | |
| Malaysian Ringgit, | | | | | | |
| Expiring: | | | | | | |
| 6/3/2013 | f | 278,861,862 | 90,704,483 | 89,984,467 | 720,016 | |
| 6/28/2013 | a | 588,905,000 | 194,432,522 | 189,639,573 | 4,792,949 | |
| Peruvian New Sol, | | | | | | |
| Expiring | | | | | | |
| 6/27/2013 | a | 125,450,000 | 46,772,964 | 45,576,950 | 1,196,014 | |
| Philippines Peso, | | | | | | |
| Expiring | | | | | | |
| 6/28/2013 | i | 651,960,000 | 15,797,432 | 15,410,438 | 386,994 | |
| Polish Zloty, | | | | | | |
| Expiring | | | | | | |
| 6/4/2013 | f | 54,696,525 | 16,623,654 | 16,630,138 | (6,484 | ) |
| Russian Ruble, | | | | | | |
| Expiring: | | | | | | |
| 6/28/2013 | b | 1,322,140,000 | 41,916,809 | 41,201,703 | 715,106 | |
| 6/28/2013 | d | 1,427,480,000 | 45,132,285 | 44,484,402 | 647,883 | |
| 6/28/2013 | e | 1,602,390,000 | 50,724,596 | 49,935,103 | 789,493 | |
| Thai Baht, | | | | | | |
| Expiring | | | | | | |
| 6/28/2013 | f | 5,090,075,000 | 170,379,080 | 167,862,949 | 2,516,131 | |
| Turkish Lira, | | | | | | |
| Expiring: | | | | | | |
| 6/4/2013 | f | 78,011,458 | 41,683,921 | 41,661,660 | 22,261 | |
| 6/28/2013 | f | 182,590,000 | 98,731,986 | 97,148,043 | 1,583,943 | |
| 6/28/2013 | h | 121,075,000 | 65,396,457 | 64,418,639 | 977,818 | |
| Gross Unrealized | | | | | | |
| Appreciation | | | | | 19,984,711 | |
| Gross Unrealized | | | | | | |
| Depreciation | | | | | (26,748,687 | ) |
Counterparties:
a Citigroup
b Goldman Sachs
c Morgan Stanley
d Barclays Bank
e Deutsche Bank
f JPMorgan Chase & Co.
g Royal Bank of Scotland
h Credit Suisse First Boston
i UBS
The Fund 37
NOTES TO FINANCIAL STATEMENTS (continued)
Swap Transactions: The fund enters into swap agreements to exchange the interest rate on, or return generated by, one nominal instrument for the return generated by another nominal instrument.The fund enters into these agreements to hedge certain market or interest rate risks, to manage the interest rate sensitivity (sometimes called duration) of fixed income securities, to provide a substitute for purchasing or selling particular securities or to increase potential returns.
The fund accrues for the interim payments on swap agreements on a daily basis, with the net amount recorded within unrealized appreciation (depreciation) on swap agreements in the Statement of Assets and Liabilities. Once the interim payments are settled in cash, the net amount is recorded as a realized gain (loss) on swaps, in addition to realized gain (loss) recorded upon the termination of swap agreements in the Statement of Operations. Upfront payments made and/or received by the fund, are recorded as an asset and/or liability in the Statement of Assets and Liabilities and are recorded as a realized gain or loss ratably over the agreement’s term/event with the exception of forward starting interest rate swaps which are recorded as realized gains or losses on the termination date. Fluctuations in the value of swap agreements are recorded for financial statement purposes as unrealized appreciation or depreciation on swap transactions.
Interest Rate Swaps: Interest rate swaps involve the exchange of commitments to pay and receive interest based on a notional principal amount. The fund may elect to pay a fixed rate and receive a floating rate, or receive a fixed rate and pay a floating rate on a notional principal amount.The net interest received or paid on interest rate swap agreements is included within realized gain (loss) on swap agreements in the Statement of Operations. Interest rate swap agreements are subject to general market risk, liquidity risk, counterparty risk and interest rate risk.
38
The fund’s maximum risk of loss from counterparty risk is the discounted value of the cash flows to be received from the counterparty over the agreement’s remaining life, to the extent that the amount is positive.This risk is mitigated by having a master netting arrangement between the fund and the counterparty and by the posting of collateral by the counterparty to the fund to cover the fund’s exposure to the counterparty. The following summarizes open interest rate swaps entered into by the fund at May 31, 2013:
| | | | | |
| Notional | Reference | | (Pay) Receive | Unrealized | |
| Amount ($) | Entity/Currency | Counterparty | Fixed Rate (%) | Expiration (Depreciation) ($) | |
| |
| 396,200,000 | BRL—1 Year LIBOR | Barclays | 8.06 | 1/2/2015 | (1,569,920) |
The following summarizes the average market value of derivatives outstanding during the period ended May 31, 2013:
| |
| | Average Market Value ($) |
| Forward contracts | 1,684,984,028 |
The following summarizes the average notional value of swap agreements outstanding during the period ended May 31, 2013:
| |
| | Average Notional Value ($) |
| Interest rate swap agreements | 123,317,521 |
At May 31, 2013, the cost of investments for federal income tax purposes was $3,921,235,655; accordingly, accumulated net unrealized depreciation on investments was $116,453,148, consisting of $69,215,100 gross unrealized appreciation and $185,668,248 gross unrealized depreciation.
The Fund 39
REPORT OF INDEPENDENT REGISTERED
PUBLIC ACCOUNTING FIRM
The Board of Trustees and Shareholders The Dreyfus/Laurel Funds Trust
We have audited the accompanying statement of assets and liabilities of Dreyfus Emerging Markets Debt Local Currency Fund (the “Fund”), a series of The Dreyfus/Laurel Funds Trust, including the statement of investments, as of May 31, 2013, and the related statement of operations for the year then ended, the statements of changes in net assets for each of the years in the two-year period then ended, and the financial highlights for each of the years in the four-year period then ended and for the period from September 12, 2008 (commencement of operations) to May 31, 2009.These financial statements and financial highlights are the responsibility of the Fund’s management. Our responsibility is to express an opinion on these financial statements and financial highlights based on our audit.
We conducted our audit in accordance with the standards of the Public Company Accounting Oversight Board (United States).Those standards require that we plan and perform the audit to obtain reasonable assurance about whether the financial statements and financial highlights are free of material misstatement.An audit includes examining, on a test basis, evidence supporting the amounts and disclosures in the financial statements. Our procedures included confirmation of securities owned as of May 31, 2013, by correspondence with the custodian and brokers or by other appropriate auditing procedures where replies from brokers were not received. An audit also includes assessing the accounting principles used and significant estimates made by management, as well as evaluating the overall financial statement presentation.We believe that our audit provides a reasonable basis for our opinion.
In our opinion, the financial statements and financial highlights referred to above present fairly, in all material respects, the financial position of Dreyfus Emerging Markets Debt Local Currency Fund as of May 31, 2013, and the results of its operations for the year then ended, the changes in its net assets for each of the years in the two-year period then ended and the financial highlights for each of the years in the four-year period then ended and for the period from September 12, 2008 (commencement of operations) to May 31, 2009, in conformity with U.S. generally accepted accounting principles.

New York, New York
July 26, 2013
40
INFORMATION ABOUT THE RENEWAL OF THE
FUND’S MANAGEMENT AGREEMENT (Unaudited)
At a meeting of the fund’s Board of Trustees held on February 13-14, 2013, the Board considered the renewal of the fund’s Management Agreement pursuant to which Dreyfus provides the fund with investment advisory and administrative services (the “Agreement”). The Board members, none of whom are “interested persons” (as defined in the Investment Company Act of 1940, as amended) of the fund, were assisted in their review by independent legal counsel and met with counsel in executive session separate from Dreyfus representatives. In considering the renewal of the Agreement, the Board considered all factors that it believed to be relevant, including those discussed below. The Board did not identify any one factor as dispositive, and each Board member may have attributed different weights to the factors considered.
Analysis of Nature, Extent, and Quality of Services Provided to the Fund. The Board considered information provided to them at the meeting and in previous presentations from Dreyfus representatives regarding the nature, extent, and quality of the services provided to funds in the Dreyfus fund complex. Dreyfus provided the number of open accounts in the fund, the fund’s asset size and the allocation of fund assets among distribution channels. Dreyfus also had previously provided information regarding the diverse intermediary relationships and distribution channels of funds in the Dreyfus fund complex (such as retail direct or intermediary, in which intermediaries typically are paid by the fund and/or Dreyfus) and Dreyfus’ corresponding need for broad, deep, and diverse resources to be able to provide ongoing shareholder services to each intermediary or distribution channel, as applicable to the fund.
The Board also considered research support available to, and portfolio management capabilities of, the fund’s portfolio management personnel and that Dreyfus also provides oversight of day-to-day fund operations, including fund accounting and administration and assistance in meeting legal and regulatory requirements.The Board also considered Dreyfus’ extensive administrative, accounting, and compliance infrastructures.
The Fund 41
INFORMATION ABOUT THE RENEWAL OF THE FUND’S
MANAGEMENT AGREEMENT (Unaudited) (continued)
Comparative Analysis of the Fund’s Performance and Management Fee and Expense Ratio. The Board reviewed reports prepared by Lipper, Inc. (“Lipper”), an independent provider of investment company data, which included information comparing (1) the fund’s performance with the performance of a group of comparable funds (the “Performance Group”) and with a broader group of funds (the “Performance Universe”), all for various periods ended December 31, 2012, and (2) the fund’s actual and contractual management fees and total expenses with those of a group of comparable funds (the “Expense Group”) and with a broader group of funds (the “Expense Universe”), the information for which was derived in part from fund financial statements available to Lipper as of the date of its analysis. Dreyfus previously had furnished the Board with a description of the methodology Lipper used to select the Performance Group and Performance Universe and the Expense Group and Expense Universe.
Dreyfus representatives stated that the usefulness of performance comparisons may be affected by a number of factors, including different investment limitations that may be applicable to the fund and comparison funds.The Board discussed the results of the comparisons and noted that the fund’s total return performance was variously above and below the Performance Group and Performance Universe medians for the various periods, with the one- and two-year periods above the Performance Group and Performance Universe medians.The Board also noted that the fund’s yield performance was below the Performance Group and Performance Universe medians for all of the four one-year periods ended December 31st. Dreyfus also provided a comparison of the fund’s calendar year total returns to the returns of the fund’s benchmark index.
The Board also reviewed the range of actual and contractual management fees and total expenses of the Expense Group and Expense Universe funds and discussed the results of the comparisons.The Board noted that the fund’s contractual management fee was above the Expense Group median, the fund’s actual management fee was above the Expense Group and Expense Universe medians and the fund’s total expenses were below the Expense Group and Expense Universe medians.
42
Dreyfus representatives reviewed with the Board the management or investment advisory fees (1) paid by funds advised or administered by Dreyfus that are in the same Lipper category as the fund and (2) paid to Dreyfus or the Dreyfus-affiliated primary employer of the fund’s primary portfolio manager(s) for advising any separate accounts and/or other types of client portfolios that are considered to have similar investment strategies and policies as the fund (the “Similar Clients”), and explained the nature of the Similar Clients.They discussed differences in fees paid and the relationship of the fees paid in light of any differences in the services provided and other relevant factors. The Board considered the relevance of the fee information provided for the Similar Clients to evaluate the appropriateness and reasonableness of the fund’s management fee.
Analysis of Profitability and Economies of Scale. Dreyfus representatives reviewed the expenses allocated and profit received by Dreyfus and the resulting profitability percentage for managing the fund and the aggregate profitability percentage to Dreyfus of managing the funds in the Dreyfus fund complex, and the method used to determine the expenses and profit.The Board concluded that the profitability results were not unreasonable, given the services rendered and service levels provided by Dreyfus.The Board also had been provided with information prepared by an independent consulting firm regarding Dreyfus’ approach to allocating costs to, and determining the profitability of, individual funds and the entire Dreyfus fund complex.The consulting firm also had analyzed where any economies of scale might emerge in connection with the management of a fund.
The Board’s counsel stated that the Board should consider the profitability analysis (1) as part of the evaluation of whether the fees under the Agreement bear a reasonable relationship to the mix of services provided by Dreyfus, including the nature, extent and quality of such services, and (2) in light of the relevant circumstances for the fund and the extent to which economies of scale would be realized if the fund grows and whether fee levels reflect these economies of scale for the
The Fund 43
INFORMATION ABOUT THE RENEWAL OF THE FUND’S
MANAGEMENT AGREEMENT (Unaudited) (continued)
benefit of fund shareholders. Dreyfus representatives also noted that, as a result of shared and allocated costs among funds in the Dreyfus fund complex, the extent of economies of scale could depend substantially on the level of assets in the complex as a whole, so that increases and decreases in complex-wide assets can affect potential economies of scale in a manner that is disproportionate to, or even in the opposite direction from, changes in the fund’s asset level.The Board also considered potential benefits to Dreyfus from acting as investment adviser and noted that there were no soft dollar arrangements in effect for trading the fund’s investments.
At the conclusion of these discussions, the Board agreed that it had been furnished with sufficient information to make an informed business decision with respect to the renewal of the Agreement. Based on the discussions and considerations as described above, the Board concluded and determined as follows.
The Board concluded that the nature, extent and quality of the services provided by Dreyfus are adequate and appropriate.
The Board generally was satisfied with the fund’s improved relative performance.
The Board concluded that the fee paid to Dreyfus was reasonable in light of the considerations described above.
The Board determined that the economies of scale which may accrue to Dreyfus and its affiliates in connection with the management of the fund had been adequately considered by Dreyfus in connection with the fee rate charged to the fund pursuant to the Agreement and that, to the extent in the future it were determined that material economies of scale had not been shared with the fund, the Board would seek to have those economies of scale shared with the fund.
44
In evaluating the Agreement, the Board considered these conclusions and determinations and also relied on its previous knowledge, gained through meetings and other interactions with Dreyfus and its affiliates, of the fund and the services provided to the fund by Dreyfus.The Board also relied on information received on a routine and regular basis throughout the year relating to the operations of the fund and the investment management and other services provided under the Agreement, including information on the investment performance of the fund in comparison to similar mutual funds and benchmark performance indices; general market outlook as applicable to the fund; and compliance reports. In addition, it should be noted that the Board’s consideration of the contractual fee arrangements for this fund had the benefit of a number of years of reviews of prior or similar agreements during which lengthy discussions took place between the Board and Dreyfus representatives. Certain aspects of the arrangements may receive greater scrutiny in some years than in others, and the Board’s conclusions may be based, in part, on their consideration of the same or similar arrangements in prior years. The Board determined that renewal of the Agreement was in the best interests of the fund and its shareholders.
The Fund 45
BOARD MEMBERS INFORMATION (Unaudited)

46

Once elected all Board Members serve for an indefinite term, but achieve Emeritus status upon reaching age 80.The address of the Board Members and Officers is c/o The Dreyfus Corporation, 200 Park Avenue, NewYork, NewYork 10166.Additional information about the Board Members is available in the fund’s Statement of Additional Information which can be obtained from Dreyfus free of charge by calling this toll free number: 1-800-DREYFUS.
J.Tomlinson Fort, Emeritus Board Member
The Fund 47
OFFICERS OF THE FUND (Unaudited)
48
The Fund 49
For More Information
Telephone Call your financial representative or 1-800-DREYFUS
Mail The Dreyfus Family of Funds, 144 Glenn Curtiss Boulevard, Uniondale, NY 11556-0144
The fund files its complete schedule of portfolio holdings with the Securities and Exchange Commission (“SEC”) for the first and third quarters of each fiscal year on Form N-Q. The fund’s Forms N-Q are available on the SEC’s website at http://www.sec.gov and may be reviewed and copied at the SEC’s Public Reference Room in Washington, DC. Information on the operation of the Public Reference Room may be obtained by calling 1-800-SEC-0330.
A description of the policies and procedures that the fund uses to determine how to vote proxies relating to portfolio securities, and information regarding how the fund voted these proxies for the most recent 12-month period ended June 30 is available at http://www.dreyfus.com and on the SEC’s website at http://www.sec.gov. The description of the policies and procedures is also available without charge, upon request, by calling 1-800-DREYFUS.

|
| © 2013 MBSC Securities Corporation |
Dreyfus
Equity Income Fund
ANNUAL REPORT May 31, 2013

Save time. Save paper. View your next shareholder report online as soon as it’s available. Log into www.dreyfus.com and sign up for Dreyfus eCommunications. It’s simple and only takes a few minutes.
The views expressed in this report reflect those of the portfolio manager only through the end of the period covered and do not necessarily represent the views of Dreyfus or any other person in the Dreyfus organization. Any such views are subject to change at any time based upon market or other conditions and Dreyfus disclaims any responsibility to update such views.These views may not be relied on as investment advice and, because investment decisions for a Dreyfus fund are based on numerous factors, may not be relied on as an indication of trading intent on behalf of any Dreyfus fund.
Not FDIC-Insured • Not Bank-Guaranteed • May Lose Value
| |
| Contents |
| |
| | THE FUND |
| 2 | A Letter from the President |
| 3 | Discussion of Fund Performance |
| 6 | Fund Performance |
| 8 | Understanding Your Fund’s Expenses |
| 8 | Comparing Your Fund’s Expenses |
| With Those of Other Funds |
| 9 | Statement of Investments |
| 15 | Statement of Assets and Liabilities |
| 16 | Statement of Operations |
| 17 | Statement of Changes in Net Assets |
| 19 | Financial Highlights |
| 22 | Notes to Financial Statements |
| 32 | Report of Independent Registered |
| | Public Accounting Firm |
| 33 | Important Tax Information |
| 34 | Information About the Renewal of |
| | the Fund’s Management Agreement |
| 39 | Board Members Information |
| 41 | Officers of the Fund |
| |
| FOR MORE INFORMATION |
|
| | Back Cover |
Dreyfus
Equity Income Fund
The Fund
A LETTER FROM THE PRESIDENT
Dear Shareholder:
We are pleased to present this annual report for Dreyfus Equity Income Fund, covering the 12-month period from June 1, 2012, through May 31, 2013. For information about how the fund performed during the reporting period, as well as general market perspectives, we provide a Discussion of Fund Performance on the pages that follow.
The U.S. economic recovery gained traction over the reporting period, but remained slower than historical norms. On one hand, the expansion has been fueled by gradually falling unemployment, recovering housing markets, rapid growth in domestic oil and gas production, and, perhaps most significant, the aggressively stimulative monetary policy of the Federal Reserve Board (the “Fed”). On the other hand, several factors have weighed on the nation’s economic growth rate, including relatively sluggish demand for exports to Europe and the emerging markets, higher tax rates for some Americans, and more restrictive fiscal policies stemming from sequestration. Investors appear to have adopted a more optimistic outlook, as several major stock market indices reached new record highs by the reporting period’s end.
In our analysis, real GDP growth seems poised to accelerate modestly over the remainder of 2013. In fact, we expect the relatively mild economic expansion to remain intact domestically and globally over the next several years. The moderate pace of the recovery implies that the risks of consumer price inflation are limited, making it unlikely that the Fed will adopt expansion-threatening, restrictive policies anytime soon. As always, we encourage you to discuss our observations with your financial advisor.
Thank you for your continued confidence and support.
Sincerely,

J. Charles Cardona
President
The Dreyfus Corporation
June 17, 2013
2
DISCUSSION OF FUND PERFORMANCE
For the period of June 1, 2012, through May 31, 2013, as provided by Warren Chiang, C. Wesley Boggs, and Ronald Gala, Portfolio Managers
Fund and Market Performance Overview
For the 12-month period ended May 31, 2013, Dreyfus Equity Income Fund’s Class A shares produced a total return of 22.65%, Class C shares returned 21.74%, and Class I shares returned 22.96%.1 In comparison, the fund’s benchmark, the Standard & Poor’s 500 Composite Stock Price Index (“S&P 500 Index”), provided a total return of 27.25% for the same period.2
Despite occasional bouts of market volatility, stocks rallied over the reporting period when investors responded positively to improved economic trends.The fund produced lower returns than its benchmark, as dividend-paying stocks generally lagged their more economically sensitive counterparts.
The Fund’s Investment Approach
The fund seeks total return consisting of capital appreciation and income.To pursue its goal, the fund invests primarily in equity securities, with a particular focus on dividend-paying stocks and other investments and investment techniques that provide income.When selecting securities, we use a computer model to identify and rank stocks within an industry or sector. Next, based on fundamental analysis, we generally select what we believe to be the most attractive of the higher ranked securities.We manage risk by diversifying the fund’s investments across companies and industries, seeking to limit the potential adverse impact of a decline in any one stock or industry.
Recovering Economy Fueled Market Gains
Although the reporting period began in the midst of pronounced macroeconomic concerns, a sustained market rally began just weeks later. By the end of July 2012, investor sentiment began to respond positively to improved U.S. employment and housing market trends, a stated commitment to the euro by the European Central Bank, and expectations that new economic policies in China would boost global
The Fund 3
DISCUSSION OF FUND PERFORMANCE (continued)
growth. In the fall, investors also were encouraged by the launch of a new, open-ended round of quantitative easing by the Federal Reserve Board and the implementation of an aggressively accommodative monetary policy by a new government in Japan.
Investor optimism faltered briefly toward year-end 2012 in the midst of uncertainty surrounding automatic U.S. tax hikes and spending cuts scheduled for the start of 2013, but last-minute legislation to address the increases helped alleviate investors’ worries. Continued corporate earnings strength and encouraging economic data lent further support to stock prices over the first five months of 2013, as the U.S. unemployment rate continued to decline and housing prices rebounded. In this environment, value-oriented stocks generally produced higher returns than more growth-oriented stocks, and small-cap companies achieved more robust gains than large-cap companies, on average.
Dividend-Paying Stocks Lagged Broader Market Averages
While the fund participated substantially in the U.S. stock market’s gains over the reporting period, its relative results were constrained over the final months of 2012, when large, well-established companies with robust dividend yields fell out of favor among investors. Instead, investors preferred smaller, faster-growing companies with greater exposure to the recovering global and domestic economies. Results from dividend-paying stocks improved over the opening months of 2013, but it was not enough to fully offset their previously lagging performance.
The fund’s relative results also were undermined by certain holdings in the information technology sector where, despite a relatively attractive valuation, semiconductor maker Intel was hurt by its exposure to struggling personal computer makers. In the financials sector, real estate investment trusts (“REITs”) trailed market averages despite recovering property markets and generous dividend yields. Moreover, mortgage-related REIT Annaly Capital Management, which invests in mortgage notes rather than underlying properties, lost value when its portfolio of mortgage-backed securities fared relatively poorly.
The fund achieved better results through the quality, valuation, and behavioral factors considered by its quantitative models. For example, in the consumer discretionary sector, tax preparation services provider H&R Block benefited from rising consumer demand stemming from recent changes to the U.S. tax code.
4
In an effort to participate more fully in market rallies led by more growth-oriented companies, we adjusted the fund’s dividend yield target during the reporting period from 5% to 4%.
Finding Opportunities Across Market Sectors
Although our disciplined investment process evaluates the strengths and weaknesses of individual companies, and does not directly consider broader economic and market trends, it is worth noting that recent economic data has remained positive. Moreover, many companies have shored up their balance sheets with large cash balances that can be used more productively through higher dividends, share buyback programs, capital investments, and mergers-and-acquisitions activity.
We have continued to find dividend-paying companies meeting our investment criteria across a variety of industry groups. However, income-oriented investors have turned to dividend-paying stocks as an alternative to bonds in a low interest rate environment, and we believe we are prepared should rising interest rates lead to selling pressure over the months ahead.
June 17, 2013
Equity funds are subject generally to market, market sector, market liquidity, issuer and investment style risks, among
other factors, to varying degrees, all of which are more fully described in the fund’s prospectus.
1 Total return includes reinvestment of dividends and any capital gains paid, and does not take into consideration the
maximum initial sales charge in the case of Class A shares, or the applicable contingent deferred sales charge imposed
on redemptions in the case of Class C shares. Had these charges been reflected, returns would have been lower. Past
performance is no guarantee of future results. Share price and investment return fluctuate such that upon redemption,
fund shares may be worth more or less than their original cost. Return figures provided reflect the absorption of certain
fund expenses by The Dreyfus Corporation pursuant to an undertaking in effect through July 1, 2014, at which time
it may be extended, terminated or modified. Had these expenses not been absorbed, the fund’s returns would have
been lower.
2 SOURCE: LIPPER INC. — Reflects reinvestment of dividends and, where applicable, capital gain distributions.
The Standard & Poor’s 500 Composite Stock Price Index is a widely accepted, unmanaged index of U.S. stock
market performance. Investors cannot invest directly in any index.
The Fund 5
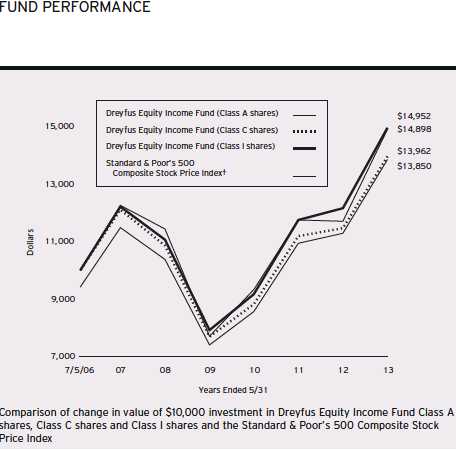
† Source: Lipper Inc.
Past performance is not predictive of future performance.
The above graph compares a $10,000 investment made in each of the Class A, Class C and Class I shares of Dreyfus Equity Income Fund on 7/5/06 (inception date) to a $10,000 investment made in the Standard & Poor’s 500 Composite Stock Price Index (the “Index”) on that date.All dividends and capital gain distributions are reinvested. The fund’s performance shown in the line graph above takes into account the maximum initial sales charge on Class A shares and all other applicable fees and expenses on all classes.The fund primarily seeks total return by investing in stocks, focusing on dividend-paying stocks and other instruments that provide income.The Index is a widely accepted, unmanaged index of U.S. stock market performance.These factors can contribute to the Index potentially outperforming the fund. Unlike a mutual fund, the Index is not subject to charges, fees and other expenses. Investors cannot invest directly in any index. Further information relating to fund performance, including expense reimbursements, if applicable, is contained in the Financial Highlights section of the prospectus and elsewhere in this report.
6
| | | | | | | |
| Average Annual Total Returns as of 5/31/13 | | | | | | |
| | Inception | | | | | From | |
| | Date | 1 | Year | 5 Years | | Inception | |
| Class A shares | | | | | | | |
| with maximum sales charge (5.75%) | 7/5/06 | 15.62 | % | 4.68 | % | 4.83 | % |
| without sales charge | 7/5/06 | 22.65 | % | 5.92 | % | 5.73 | % |
| Class C shares | | | | | | | |
| with applicable redemption charge † | 7/5/06 | 20.74 | % | 5.15 | % | 4.96 | % |
| without redemption | 7/5/06 | 21.74 | % | 5.15 | % | 4.96 | % |
| Class I shares | 7/5/06 | 22.96 | % | 6.20 | % | 6.00 | % |
| Standard & Poor’s 500 | | | | | | | |
| Composite Stock Price Index | 6/30/06 | 27.25 | % | 5.43 | % | 5.93 | %†† |
Past performance is not predictive of future performance.The fund’s performance shown in the graph and table does not
reflect the deduction of taxes that a shareholder would pay on fund distributions or the redemption of fund shares.
† The maximum contingent deferred sales charge for Class C shares is 1% for shares redeemed within one year of the
date of purchase.
For comparative purposes, the value of the Index as of 6/30/06 is used as the beginning value on 7/5/06.
The Fund 7
UNDERSTANDING YOUR FUND’S EXPENSES (Unaudited)
As a mutual fund investor, you pay ongoing expenses, such as management fees and other expenses. Using the information below, you can estimate how these expenses affect your investment and compare them with the expenses of other funds.You also may pay one-time transaction expenses, including sales charges (loads) and redemption fees, which are not shown in this section and would have resulted in higher total expenses. For more information, see your fund’s prospectus or talk to your financial adviser.
Review your fund’s expenses
The table below shows the expenses you would have paid on a $1,000 investment in Dreyfus Equity Income Fund from December 1, 2012 to May 31, 2013. It also shows how much a $1,000 investment would be worth at the close of the period, assuming actual returns and expenses.
Expenses and Value of a $1,000 Investment
assuming actual returns for the six months ended May 31, 2013
| | | | | | |
| | | Class A | | Class C | | Class I |
| Expenses paid per $1,000† | $ | 6.17 | $ | 10.17 | $ | 4.83 |
| Ending value (after expenses) | $ | 1,151.90 | $ | 1,147.60 | $ | 1,153.40 |
COMPARING YOUR FUND’S EXPENSES WITH THOSE OF OTHER FUNDS (Unaudited)
Using the SEC’s method to compare expenses
The Securities and Exchange Commission (SEC) has established guidelines to help investors assess fund expenses. Per these guidelines, the table below shows your fund’s expenses based on a $1,000 investment, assuming a hypothetical 5% annualized return. You can use this information to compare the ongoing expenses (but not transaction expenses or total cost) of investing in the fund with those of other funds.All mutual fund shareholder reports will provide this information to help you make this comparison. Please note that you cannot use this information to estimate your actual ending account balance and expenses paid during the period.
Expenses and Value of a $1,000 Investment
assuming a hypothetical 5% annualized return for the six months ended May 31, 2013
| | | | | | |
| | | Class A | | Class C | | Class I |
| Expenses paid per $1,000† | $ | 5.79 | $ | 9.55 | $ | 4.53 |
| Ending value (after expenses) | $ | 1,019.20 | $ | 1,015.46 | $ | 1,020.44 |
† Expenses are equal to the fund’s annualized expense ratio of 1.15% for Class A, 1.90% for Class C and .90%
for Class I, multiplied by the average account value over the period, multiplied by 182/365 (to reflect the one-half
year period).
8
STATEMENT OF INVESTMENTS
May 31, 2013
| | | |
| Common Stocks—99.4% | Shares | | Value ($) |
| Automobiles & Components—.2% | | | |
| Thor Industries | 7,250 | | 309,647 |
| Banks—2.1% | | | |
| New York Community Bancorp | 94,500 | | 1,236,060 |
| People’s United Financial | 15,160 | | 208,602 |
| Wells Fargo & Co. | 29,400 | | 1,192,170 |
| | | | 2,636,832 |
| Capital Goods—5.5% | | | |
| General Dynamics | 2,660 | | 205,086 |
| General Electric | 177,400 | | 4,136,968 |
| Lockheed Martin | 1,910 | | 202,135 |
| Northrop Grumman | 21,300 | | 1,754,907 |
| Raytheon | 10,120 | | 674,397 |
| | | | 6,973,493 |
| Commercial & Professional Services—5.5% | | | |
| Pitney Bowes | 287,115 | a | 4,214,848 |
| R.R. Donnelley & Sons | 209,000 | a | 2,773,430 |
| | | | 6,988,278 |
| Consumer Durables & Apparel—1.3% | | | |
| Garmin | 21,900 | | 764,967 |
| Hasbro | 6,610 | a | 294,013 |
| Mattel | 12,220 | | 546,845 |
| | | | 1,605,825 |
| Consumer Services—3.0% | | | |
| H&R Block | 101,490 | | 2,970,612 |
| Marriott International, Cl. A | 3,300 | | 138,633 |
| Starwood Hotels & Resorts Worldwide | 10,050 | b | 686,415 |
| | | | 3,795,660 |
| Diversified Financials—5.1% | | | |
| American Express | 6,570 | | 497,415 |
| Ares Capital | 149,100 | | 2,558,556 |
| JPMorgan Chase & Co. | 31,655 | | 1,728,046 |
The Fund 9
STATEMENT OF INVESTMENTS (continued)
| | | |
| Common Stocks (continued) | Shares | | Value ($) |
| Diversified Financials (continued) | | | |
| McGraw-Hill | 4,890 | | 266,749 |
| SLM | 63,300 | | 1,502,742 |
| | | | 6,553,508 |
| Energy—7.7% | | | |
| Chevron | 18,510 | | 2,272,102 |
| ConocoPhillips | 33,315 | | 2,043,542 |
| Exxon Mobil | 46,810 | | 4,234,901 |
| Kosmos Energy | 16,450 | c | 169,764 |
| Phillips 66 | 4,800 | | 319,536 |
| Schlumberger | 6,850 | | 500,255 |
| Valero Energy | 5,400 | | 219,402 |
| | | | 9,759,502 |
| Food & Staples Retailing—5.4% | | | |
| CVS Caremark | 27,770 | | 1,598,997 |
| Wal-Mart Stores | 56,790 | | 4,250,164 |
| Walgreen | 21,440 | | 1,023,974 |
| | | | 6,873,135 |
| Food, Beverage & Tobacco—6.5% | | | |
| Altria Group | 130,420 | | 4,708,162 |
| Campbell Soup | 5,200 | | 222,612 |
| ConAgra Foods | 9,730 | | 327,804 |
| Dr. Pepper Snapple Group | 4,510 | | 207,370 |
| Philip Morris International | 30,390 | | 2,762,755 |
| | | | 8,228,703 |
| Health Care Equipment & | | | |
| Services—2.0% | | | |
| Abbott Laboratories | 17,980 | | 659,327 |
| HCA Holdings | 17,550 | | 685,503 |
| Humana | 2,120 | | 171,254 |
| Medtronic | 14,650 | | 747,296 |
| Thoratec | 8,650 | c | 269,620 |
| | | | 2,533,000 |
10
| | | | |
| Common Stocks (continued) | Shares | | | Value ($) |
| Household & Personal Products—.6% | | | | |
| Procter & Gamble | 9,750 | | | 748,410 |
| Insurance—2.0% | | | | |
| Aflac | 12,800 | | | 712,832 |
| American International Group | 3,300 | c | | 146,718 |
| MetLife | 23,150 | | | 1,023,462 |
| Old Republic International | 30,700 | | | 417,827 |
| Prudential Financial | 3,505 | | | 241,740 |
| | | | | 2,542,579 |
| Materials—3.3% | | | | |
| Freeport-McMoRan Copper & Gold | 11,540 | | | 358,317 |
| Southern Copper | 123,556 | | | 3,848,769 |
| | | | | 4,207,086 |
| Media—1.3% | | | | |
| Gannett | 30,250 | | | 650,375 |
| Regal Entertainment Group, Cl. A | 40,300 | a | 713,310 |
| Sirius XM Radio | 36,900 | | | 128,412 |
| Viacom, Cl. B | 2,690 | | | 177,244 |
| | | | | 1,669,341 |
| Pharmaceuticals, Biotech & | | | | |
| Life Sciences—10.9% | | | | |
| AbbVie | 4,630 | | | 197,655 |
| Bristol-Myers Squibb | 90,160 | | | 4,148,262 |
| Eli Lilly & Co. | 66,270 | | | 3,522,913 |
| Johnson & Johnson | 2,800 | | | 235,704 |
| Merck & Co. | 33,910 | | | 1,583,597 |
| Pfizer | 154,507 | | | 4,207,226 |
| | | | | 13,895,357 |
| Real Estate—5.8% | | | | |
| Annaly Capital Management | 328,660 | b | | 4,463,203 |
| CBL & Associates Properties | 22,950 | b | 527,621 |
| Chimera Investment | 42,300 | b | | 129,015 |
| CommonWealth | 9,310 | b | 190,296 |
The Fund 11
STATEMENT OF INVESTMENTS (continued)
| | | |
| Common Stocks (continued) | Shares | | Value ($) |
| Real Estate (continued) | | | |
| Hatteras Financial | 23,350 | b | 602,897 |
| HCP | 2,500 | b | 118,450 |
| Hospitality Properties Trust | 15,040 | b | 438,867 |
| MFA Financial | 109,700 | b | 963,166 |
| | | | 7,433,515 |
| Retailing—2.1% | | | |
| American Eagle Outfitters | 12,550 | | 248,365 |
| CST Brands | 1,211 | a,c | 36,802 |
| Foot Locker | 8,850 | | 303,732 |
| Genuine Parts | 2,770 | | 215,340 |
| Home Depot | 21,240 | | 1,670,738 |
| The TJX Companies | 2,700 | | 136,647 |
| | | | 2,611,624 |
| Semiconductors & Semiconductor | | | |
| Equipment—3.4% | | | |
| Intel | 157,245 | | 3,817,909 |
| Maxim Integrated Products | 17,105 | | 504,426 |
| | | | 4,322,335 |
| Software & Services—6.5% | | | |
| Activision Blizzard | 17,700 | | 255,411 |
| CA | 66,700 | | 1,821,577 |
| International Business Machines | 2,240 | | 465,965 |
| Microsoft | 139,885 | | 4,879,189 |
| Oracle | 25,140 | | 848,726 |
| | | | 8,270,868 |
| Technology Hardware & Equipment—4.4% | | | |
| Apple | 4,910 | | 2,207,929 |
| Cisco Systems | 19,000 | | 457,520 |
| Seagate Technology | 67,700 | | 2,916,516 |
| | | | 5,581,965 |
12
| | | |
| Common Stocks (continued) | Shares | | Value ($) |
| Telecommunication Services—6.0% | | | |
| AT&T | 109,960 | | 3,847,500 |
| Verizon Communications | 64,970 | | 3,149,746 |
| Windstream | 76,350 | a | 613,091 |
| | | | 7,610,337 |
| Transportation—1.8% | | | |
| Union Pacific | 1,200 | | 185,544 |
| United Parcel Service, Cl. B | 24,420 | | 2,097,678 |
| | | | 2,283,222 |
| Utilities—7.0% | | | |
| Ameren | 23,910 | | 813,896 |
| American Electric Power | 90,910 | | 4,165,496 |
| Consolidated Edison | 4,840 | | 276,219 |
| Duke Energy | 1,700 | | 113,781 |
| Edison International | 5,200 | | 238,888 |
| NV Energy | 18,050 | | 423,092 |
| Pepco Holdings | 15,590 | a | 323,804 |
| Pinnacle West Capital | 17,450 | | 985,576 |
| Public Service Enterprise Group | 6,560 | | 216,742 |
| Southern | 10,350 | | 454,365 |
| Wisconsin Energy | 21,650 | | 883,537 |
| | | | 8,895,396 |
| Total Common Stocks | | | |
| (cost $111,680,136) | | | 126,329,618 |
| |
| Other Investment—.4% | | | |
| Registered | | | |
| Investment Company; | | | |
| Dreyfus Institutional Preferred | | | |
| Plus Money Market Fund | | | |
| (cost $450,401) | 450,401 | d | 450,401 |
The Fund 13
STATEMENT OF INVESTMENTS (continued)
| | | | |
| Investment of Cash Collateral | | | | |
| for Securities Loaned—6.4% | Shares | | Value ($) | |
| Registered Investment Company; | | | | |
| Dreyfus Institutional Cash Advantage Fund | | | | |
| (cost $8,079,227) | 8,079,227 | d | 8,079,227 | |
| Total Investments (cost $120,209,764) | 106.2 | % | 134,859,246 | |
| Liabilities, Less Cash and Receivables | (6.2 | %) | (7,841,107 | ) |
| Net Assets | 100.0 | % | 127,018,139 | |
a Security, or portion thereof, on loan.At May 31, 2013, the value of the fund’s securities on loan was $7,748,772
and the value of the collateral held by the fund was $8,079,227.
b Investment in real estate investment trust.
c Non-income producing security.
d Investment in affiliated money market mutual fund.
| | | |
| Portfolio Summary (Unaudited)† | | |
| |
| | Value (%) | | Value (%) |
| Pharmaceuticals, | | Semiconductors & | |
| Biotech & Life Sciences | 10.9 | Semiconductor Equipment | 3.4 |
| Energy | 7.7 | Materials | 3.3 |
| Utilities | 7.0 | Consumer Services | 3.0 |
| Money Market Investments | 6.8 | Banks | 2.1 |
| Food, Beverage & Tobacco | 6.5 | Retailing | 2.1 |
| Software & Services | 6.5 | Insurance | 2.0 |
| Telecommunication Services | 6.0 | Health Care Equipment & Services | 2.0 |
| Real Estate | 5.8 | Transportation | 1.8 |
| Capital Goods | 5.5 | Media | 1.3 |
| Commercial & Professional Services | 5.5 | Consumer Durables & Apparel | 1.3 |
| Food & Staples Retailing | 5.4 | Household & Personal Products | .6 |
| Diversified Financials | 5.1 | Automobiles & Components | .2 |
| Technology Hardware & Equipment | 4.4 | | 106.2 |
| |
| † Based on net assets. | | | |
| See notes to financial statements. | | | |
14
STATEMENT OF ASSETS AND LIABILITIES
May 31, 2013
| | | |
| | | Cost | Value |
| Assets ($): | | | |
| Investments in securities—See Statement of Investments (including | | |
| securities on loan, valued at $7,748,772)—Note 1(b): | | |
| Unaffiliated issuers | | 111,680,136 | 126,329,618 |
| Affiliated issuers | | 8,529,628 | 8,529,628 |
| Cash | | | 161,645 |
| Dividends and securities lending income receivable | | | 482,704 |
| Receivable for shares of Beneficial Interest subscribed | | 133,867 |
| Prepaid expenses | | | 42,754 |
| | | | 135,680,216 |
| Liabilities ($): | | | |
| Due to The Dreyfus Corporation and affiliates—Note 3(c) | | 124,954 |
| Liability for securities on loan—Note 1(b) | | | 8,079,227 |
| Payable for investment securities purchased | | | 379,327 |
| Payable for shares of Beneficial Interest redeemed | | | 16,233 |
| Accrued expenses | | | 62,336 |
| | | | 8,662,077 |
| Net Assets ($) | | | 127,018,139 |
| Composition of Net Assets ($): | | | |
| Paid-in capital | | | 111,685,453 |
| Accumulated undistributed investment income—net | | | 362,531 |
| Accumulated net realized gain (loss) on investments | | 320,673 |
| Accumulated net unrealized appreciation | | | |
| (depreciation) on investments | | | 14,649,482 |
| Net Assets ($) | | | 127,018,139 |
| |
| |
| Net Asset Value Per Share | | | |
| | Class A | Class C | Class I |
| Net Assets ($) | 107,425,362 | 7,714,991 | 11,877,786 |
| Shares Outstanding | 6,964,945 | 505,648 | 767,582 |
| Net Asset Value Per Share ($) | 15.42 | 15.26 | 15.47 |
| |
| See notes to financial statements. | | | |
The Fund 15
| | |
| STATEMENT OF OPERATIONS | | |
| Year Ended May 31, 2013 | | |
| |
| |
| |
| |
| Investment Income ($): | | |
| Income: | | |
| Cash dividends: | | |
| Unaffiliated issuers | 4,102,023 | |
| Affiliated issuers | 713 | |
| Income from securities lending—Note 1(b) | 85,856 | |
| Total Income | 4,188,592 | |
| Expenses: | | |
| Management fee—Note 3(a) | 677,424 | |
| Shareholder servicing costs—Note 3(c) | 274,346 | |
| Registration fees | 65,223 | |
| Custodian fees—Note 3(c) | 62,403 | |
| Distribution fees—Note 3(b) | 45,057 | |
| Professional fees | 44,995 | |
| Prospectus and shareholders’ reports | 17,078 | |
| Trustees’ fees and expenses—Note 3(d) | 7,478 | |
| Loan commitment fees—Note 2 | 957 | |
| Interest expense—Note 2 | 434 | |
| Miscellaneous | 16,800 | |
| Total Expenses | 1,212,195 | |
| Less—reduction in expenses due to undertaking—Note 3(a) | (144,904 | ) |
| Less—reduction in fees due to earnings credits—Note 3(c) | (155 | ) |
| Net Expenses | 1,067,136 | |
| Investment Income—Net | 3,121,456 | |
| Realized and Unrealized Gain (Loss) on Investments—Note 4 ($): | | |
| Net realized gain (loss) on investments | 829,348 | |
| Net unrealized appreciation (depreciation) on investments | 13,817,460 | |
| Net Realized and Unrealized Gain (Loss) on Investments | 14,646,808 | |
| Net Increase in Net Assets Resulting from Operations | 17,768,264 | |
| |
| See notes to financial statements. | | |
16
STATEMENT OF CHANGES IN NET ASSETS
| | | | |
| | | | Year Ended May 31, | |
| | 2013 | | 2012 | |
| Operations ($): | | | | |
| Investment income—net | 3,121,456 | | 793,754 | |
| Net realized gain (loss) on investments | 829,348 | | 399,856 | |
| Net unrealized appreciation | | | | |
| (depreciation) on investments | 13,817,460 | | 636,225 | |
| Net Increase (Decrease) in Net Assets | | | | |
| Resulting from Operations | 17,768,264 | | 1,829,835 | |
| Dividends to Shareholders from ($): | | | | |
| Investment income—net: | | | | |
| Class A Shares | (2,527,413 | ) | (508,071 | ) |
| Class C Shares | (158,274 | ) | (37,078 | ) |
| Class I Shares | (221,283 | ) | (31,601 | ) |
| Net realized gain on investments: | | | | |
| Class A Shares | (811,125 | ) | (227,036 | ) |
| Class C Shares | (65,432 | ) | (13,908 | ) |
| Class I Shares | (44,405 | ) | (6,810 | ) |
| Total Dividends | (3,827,932 | ) | (824,504 | ) |
| Beneficial Interest Transactions ($): | | | | |
| Net proceeds from shares sold: | | | | |
| Class A Shares | 59,328,002 | | 55,138,094 | |
| Class C Shares | 4,032,308 | | 3,914,501 | |
| Class I Shares | 14,737,847 | | 4,041,781 | |
| Dividends reinvested: | | | | |
| Class A Shares | 3,132,117 | | 680,085 | |
| Class C Shares | 137,589 | | 32,683 | |
| Class I Shares | 164,383 | | 19,829 | |
| Cost of shares redeemed: | | | | |
| Class A Shares | (18,929,946 | ) | (7,352,475 | ) |
| Class C Shares | (1,551,671 | ) | (740,925 | ) |
| Class I Shares | (7,082,265 | ) | (927,086 | ) |
| Increase (Decrease) in Net Assets from | | | | |
| Beneficial Interest Transactions | 53,968,364 | | 54,806,487 | |
| Total Increase (Decrease) in Net Assets | 67,908,696 | | 55,811,818 | |
| Net Assets ($): | | | | |
| Beginning of Period | 59,109,443 | | 3,297,625 | |
| End of Period | 127,018,139 | | 59,109,443 | |
| Undistributed investment income—net | 362,531 | | 219,315 | |
The Fund 17
STATEMENT OF CHANGES IN NET ASSETS (continued)
| | | | |
| | | | Year Ended May 31, | |
| | 2013 | | 2012 | |
| Capital Share Transactions: | | | | |
| Class Aa | | | | |
| Shares sold | 4,130,568 | | 4,259,332 | |
| Shares issued for dividends reinvested | 224,896 | | 52,382 | |
| Shares redeemed | (1,323,224 | ) | (553,800 | ) |
| Net Increase (Decrease) in Shares Outstanding | 3,032,240 | | 3,757,914 | |
| Class Ca | | | | |
| Shares sold | 285,139 | | 303,986 | |
| Shares issued for dividends reinvested | 10,023 | | 2,561 | |
| Shares redeemed | (107,907 | ) | (57,847 | ) |
| Net Increase (Decrease) in Shares Outstanding | 187,255 | | 248,700 | |
| Class I | | | | |
| Shares sold | 1,026,488 | | 306,304 | |
| Shares issued for dividends reinvested | 11,641 | | 1,532 | |
| Shares redeemed | (513,658 | ) | (70,156 | ) |
| Net Increase (Decrease) in Shares Outstanding | 524,471 | | 237,680 | |
a During the period ended May 31, 2013, 24,234 Class C shares representing $378,294 were exchanged for
23,988 Class A shares.
See notes to financial statements.
18
FINANCIAL HIGHLIGHTS
The following tables describe the performance for each share class for the fiscal periods indicated.All information (except portfolio turnover rate) reflects financial results for a single fund share.Total return shows how much your investment in the fund would have increased (or decreased) during each period, assuming you had reinvested all dividends and distributions.These figures have been derived from the fund’s financial statements.
| | | | | | | | | | |
| | | | Year Ended May 31, | | | |
| Class A Shares | 2013 | | 2012 | | 2011 | | 2010 | | 2009 | |
| Per Share Data ($): | | | | | | | | | | |
| Net asset value, beginning of period | 13.16 | | 13.23 | | 10.52 | | 9.24 | | 13.17 | |
| Investment Operations: | | | | | | | | | | |
| Investment income—neta | .50 | | .39 | | .23 | | .16 | | .19 | |
| Net realized and unrealized | | | | | | | | | | |
| gain (loss) on investments | 2.40 | | .01 | | 2.66 | | 1.27 | | (3.93 | ) |
| Total from Investment Operations | 2.90 | | .40 | | 2.89 | | 1.43 | | (3.74 | ) |
| Distributions: | | | | | | | | | | |
| Dividends from investment income—net | (.49 | ) | (.36 | ) | (.18 | ) | (.15 | ) | (.19 | ) |
| Dividends from net realized | | | | | | | | | | |
| gain on investments | (.15 | ) | (.11 | ) | — | | — | | — | |
| Total Distributions | (.64 | ) | (.47 | ) | (.18 | ) | (.15 | ) | (.19 | ) |
| Net asset value, end of period | 15.42 | | 13.16 | | 13.23 | | 10.52 | | 9.24 | |
| Total Return (%)b | 22.65 | | 3.18 | | 27.70 | | 15.55 | | (28.60 | ) |
| Ratios/Supplemental Data (%): | | | | | | | | | | |
| Ratio of total expenses | | | | | | | | | | |
| to average net assets | 1.30 | | 1.80 | | 5.40 | | 9.40 | | 11.74 | |
| Ratio of net expenses | | | | | | | | | | |
| to average net assets | 1.15 | | 1.19 | | 1.50 | | 1.50 | | 1.50 | |
| Ratio of net investment income | | | | | | | | | | |
| to average net assets | 3.48 | | 2.99 | | 1.85 | | 1.49 | | 1.95 | |
| Portfolio Turnover Rate | 53.66 | | 66.38 | | 121.84 | | 76.05 | | 29.06 | |
| Net Assets, end of period ($ x 1,000) | 107,425 | | 51,754 | | 2,312 | | 1,236 | | 957 | |
a Based on average shares outstanding at each month end.
b Exclusive of sales charge.
See notes to financial statements.
The Fund 19
FINANCIAL HIGHLIGHTS (continued)
| | | | | | | | | | |
| | | | Year Ended May 31, | | | |
| Class C Shares | 2013 | | 2012 | | 2011 | | 2010 | | 2009 | |
| Per Share Data ($): | | | | | | | | | | |
| Net asset value, beginning of period | 13.03 | | 13.10 | | 10.43 | | 9.18 | | 13.12 | |
| Investment Operations: | | | | | | | | | | |
| Investment income—neta | .39 | | .30 | | .13 | | .09 | | .11 | |
| Net realized and unrealized | | | | | | | | | | |
| gain (loss) on investments | 2.37 | | .01 | | 2.65 | | 1.26 | | (3.92 | ) |
| Total from Investment Operations | 2.76 | | .31 | | 2.78 | | 1.35 | | (3.81 | ) |
| Distributions: | | | | | | | | | | |
| Dividends from investment income—net | (.38 | ) | (.27 | ) | (.11 | ) | (.10 | ) | (.13 | ) |
| Dividends from net realized | | | | | | | | | | |
| gain on investments | (.15 | ) | (.11 | ) | — | | — | | — | |
| Total Distributions | (.53 | ) | (.38 | ) | (.11 | ) | (.10 | ) | (.13 | ) |
| Net asset value, end of period | 15.26 | | 13.03 | | 13.10 | | 10.43 | | 9.18 | |
| Total Return (%)b | 21.74 | | 2.47 | | 26.79 | | 14.57 | | (29.07 | ) |
| Ratios/Supplemental Data (%): | | | | | | | | | | |
| Ratio of total expenses | | | | | | | | | | |
| to average net assets | 2.11 | | 2.96 | | 6.19 | | 10.13 | | 13.47 | |
| Ratio of net expenses | | | | | | | | | | |
| to average net assets | 1.90 | | 2.00 | | 2.25 | | 2.25 | | 2.25 | |
| Ratio of net investment income | | | | | | | | | | |
| to average net assets | 2.76 | | 2.30 | | 1.09 | | .78 | | 1.21 | |
| Portfolio Turnover Rate | 53.66 | | 66.38 | | 121.84 | | 76.05 | | 29.06 | |
| Net Assets, end of period ($ x 1,000) | 7,715 | | 4,148 | | 913 | | 286 | | 129 | |
a Based on average shares outstanding at each month end.
b Exclusive of sales charge.
See notes to financial statements.
20
| | | | | | | | | | |
| | | | Year Ended May 31, | | | |
| Class I Shares | 2013 | | 2012 | | 2011 | | 2010 | | 2009 | |
| Per Share Data ($): | | | | | | | | | | |
| Net asset value, beginning of period | 13.20 | | 13.26 | | 10.54 | | 9.25 | | 13.19 | |
| Investment Operations: | | | | | | | | | | |
| Investment income—neta | .55 | | .42 | | .25 | | .18 | | .22 | |
| Net realized and unrealized | | | | | | | | | | |
| gain (loss) on investments | 2.39 | | .02 | | 2.67 | | 1.28 | | (3.95 | ) |
| Total from Investment Operations | 2.94 | | .44 | | 2.92 | | 1.46 | | (3.73 | ) |
| Distributions: | | | | | | | | | | |
| Dividends from investment income—net | (.52 | ) | (.39 | ) | (.20 | ) | (.17 | ) | (.21 | ) |
| Dividends from net realized | | | | | | | | | | |
| gain on investments | (.15 | ) | (.11 | ) | — | | — | | — | |
| Total Distributions | (.67 | ) | (.50 | ) | (.20 | ) | (.17 | ) | (.21 | ) |
| Net asset value, end of period | 15.47 | | 13.20 | | 13.26 | | 10.54 | | 9.25 | |
| Total Return (%) | 22.96 | | 3.47 | | 28.04 | | 15.73 | | (28.35 | ) |
| Ratios/Supplemental Data (%): | | | | | | | | | | |
| Ratio of total expenses | | | | | | | | | | |
| to average net assets | 1.12 | | 1.60 | | 5.25 | | 9.28 | | 11.55 | |
| Ratio of net expenses | | | | | | | | | | |
| to average net assets | .90 | | .93 | | 1.25 | | 1.25 | | 1.25 | |
| Ratio of net investment income | | | | | | | | | | |
| to average net assets | 3.74 | | 3.31 | | 2.07 | | 1.72 | | 2.19 | |
| Portfolio Turnover Rate | 53.66 | | 66.38 | | 121.84 | | 76.05 | | 29.06 | |
| Net Assets, end of period ($ x 1,000) | 11,878 | | 3,208 | | 72 | | 81 | | 53 | |
| a Based on average shares outstanding at each month end. | | | | | | | | | |
| See notes to financial statements. | | | | | | | | | | |
The Fund 21
NOTES TO FINANCIAL STATEMENTS
NOTE 1—Significant Accounting Policies:
Dreyfus Equity Income Fund (the “fund”) is a separate diversified series of The Dreyfus/Laurel Funds Trust (the “Trust”), which is registered under the Investment Company Act of 1940, as amended (the “Act”), as an open-end management investment company and operates as a series company currently offering five series, including the fund.The fund’s investment objective is to seek total return (consisting of capital appreciation and income).The Dreyfus Corporation (the “Manager” or “Dreyfus”), a wholly-owned subsidiary of The Bank of NewYork Mellon Corporation (“BNY Mellon”), serves as the fund’s investment adviser.
MBSC Securities Corporation (the “Distributor”), a wholly-owned subsidiary of the Manager, is the distributor of the fund’s shares. The fund is authorized to issue an unlimited number of $.001 par value shares of Beneficial Interest in each of the following classes of shares: Class A, Class C and Class I. Class A and Class C shares are sold primarily to retail investors through financial intermediaries and bear a Distribution and/or Shareholder Services Plan fee. Class A shares generally are subject to a sales charge imposed at the time of purchase. Class C shares are subject to a contingent deferred sales charge (“CDSC”) imposed on Class C shares redeemed within one year of purchase. Class I shares are sold primarily to bank trust departments and other financial service providers (includingThe Bank of NewYork Mellon, a subsidiary of BNY Mellon and an affiliate of Dreyfus, and its affiliates), acting on behalf of customers having a qualified trust or an investment account or relationship at such institution, and bear no Distribution or Shareholder Services Plan fees. Class I shares are offered without a front-end sales charge or CDSC. Other differences between the classes include the services offered to and the expenses borne by each class, the allocation of certain transfer agency costs and certain voting rights. Income, expenses (other than expenses attributable to a specific class), and realized and unrealized gains or losses on investments are allocated to each class of shares based on its relative net assets.
22
The sales charge may be reduced or waived for certain purchases of Class A shares. Effective April 1, 2013, pursuant to new/modified front-end sales charge waivers, Class A shares of the fund may be purchased at net asset value without payment of a sales charge by (a) investors who participate in a self-directed investment brokerage account program offered by financial intermediaries that have entered into an agreement with the fund’s Distributor (financial intermediaries offering self-directed investment brokerage accounts may or may not charge their customers a transaction fee) and (b) investors who purchase Class A shares directly through the fund’s Distributor, and either (i) have, or whose spouse or minor children have, beneficially owned shares and continuously maintained an open account with the Distributor in a Dreyfus-managed fund since on or before February 28, 2006, or (ii) such purchase is for a self-directed investment account that may or may not be subject to a transaction fee.
On April 24-25, 2013, the Trust’s Board of Trustees (the “Board”) authorized the fund to offer Class Y shares, as a new class of shares, to certain investors, including certain institutional investors. Effective on or about July 1, 2013, Class Y shares will be offered at net asset value and will not be subject to certain fees, including Distribution Plan and Shareholder Services Plan fees.
The Trust accounts separately for the assets, liabilities and operations of each series. Expenses directly attributable to each series are charged to that series’ operations; expenses which are applicable to all series are allocated among them on a pro rata basis.
The Financial Accounting Standards Board (“FASB”) Accounting Standards Codification is the exclusive reference of authoritative U.S. generally accepted accounting principles (“GAAP”) recognized by the FASB to be applied by nongovernmental entities. Rules and interpretive releases of the Securities and Exchange Commission (“SEC”) under authority of federal laws are also sources of authoritative GAAP for SEC
The Fund 23
NOTES TO FINANCIAL STATEMENTS (continued)
registrants. The fund’s financial statements are prepared in accordance with GAAP, which may require the use of management estimates and assumptions.Actual results could differ from those estimates.
(a) Portfolio valuation: The fair value of a financial instrument is the amount that would be received to sell an asset or paid to transfer a liability in an orderly transaction between market participants at the measurement date (i.e., the exit price). GAAP establishes a fair value hierarchy that prioritizes the inputs of valuation techniques used to measure fair value.This hierarchy gives the highest priority to unadjusted quoted prices in active markets for identical assets or liabilities (Level 1 measurements) and the lowest priority to unobservable inputs (Level 3 measurements).
Additionally, GAAP provides guidance on determining whether the volume and activity in a market has decreased significantly and whether such a decrease in activity results in transactions that are not orderly. GAAP requires enhanced disclosures around valuation inputs and techniques used during annual and interim periods.
Various inputs are used in determining the value of the fund’s investments relating to fair value measurements.These inputs are summarized in the three broad levels listed below:
Level 1—unadjusted quoted prices in active markets for identical investments.
Level 2—other significant observable inputs (including quoted prices for similar investments, interest rates, prepayment speeds, credit risk, etc.).
Level 3—significant unobservable inputs (including the fund’s own assumptions in determining the fair value of investments).
The inputs or methodology used for valuing securities are not necessarily an indication of the risk associated with investing in those securities.
Changes in valuation techniques may result in transfers in or out of an assigned level within the disclosure hierarchy. Valuation techniques used to value the fund’s investments are as follows:
24
Investments in securities are valued at the last sales price on the securities exchange or national securities market on which such securities are primarily traded. Securities listed on the National Market System for which market quotations are available are valued at the official closing price or, if there is no official closing price that day, at the last sales price. Securities not listed on an exchange or the national securities market, or securities for which there were no transactions, are valued at the average of the most recent bid and asked prices, except for open short positions, where the asked price is used for valuation purposes. Bid price is used when no asked price is available. Registered investment companies that are not traded on an exchange are valued at their net asset value. All of the preceding securities are categorized within Level 1 of the fair value hierarchy.
Fair valuing of securities may be determined with the assistance of a pricing service using calculations based on indices of domestic securities and other appropriate indicators, such as prices of relevant American Depository Receipts and financial futures. Utilizing these techniques may result in transfers between Level 1 and Level 2 of the fair value hierarchy.
When market quotations or official closing prices are not readily available, or are determined not to reflect accurately fair value, such as when the value of a security has been significantly affected by events after the close of the exchange or market on which the security is principally traded (for example, a foreign exchange or market), but before the fund calculates its net asset value, the fund may value these investments at fair value as determined in accordance with the procedures approved by the Board. Certain factors may be considered when fair valuing investments such as: fundamental analytical data, the nature and duration of restrictions on disposition, an evaluation of the forces that influence the market in which the securities are purchased and sold, and public trading in similar securities of the issuer or comparable issuers.These securities are either categorized within Level 2 or 3 of the fair value hierarchy depending on the relevant inputs used.
The Fund 25
NOTES TO FINANCIAL STATEMENTS (continued)
For restricted securities where observable inputs are limited, assumptions about market activity and risk are used and are categorized within Level 3 of the fair value hierarchy.
The following is a summary of the inputs used as of May 31, 2013 in valuing the fund’s investments:
| | | | |
| | | Level 2—Other | Level 3— | |
| | Level 1— | Significant | Significant | |
| | Unadjusted | Observable | Unobservable | |
| | Quoted Prices | Inputs | Inputs | Total |
| Assets ($) | | | | |
| Investments in Securities: | | | |
| Equity Securities— | | | | |
| Domestic | | | | |
| Common Stocks† | 126,329,618 | — | — | 126,329,618 |
| Mutual Funds | 8,529,628 | — | — | 8,529,628 |
| |
| † See Statement of Investments for additional detailed categorizations. | |
At May 31, 2013, there were no transfers between Level 1 and Level 2 of the fair value hierarchy.
(b) Securities transactions and investment income: Securities transactions are recorded on a trade date basis. Realized gains and losses from securities transactions are recorded on the identified cost basis. Dividend income is recognized on the ex-dividend date and interest income, including, where applicable, accretion of discount and amortization of premium on investments, is recognized on the accrual basis.
Pursuant to a securities lending agreement withThe Bank of NewYork Mellon, the fund may lend securities to qualified institutions. It is the fund’s policy that, at origination, all loans are secured by collateral of at least 102% of the value of U.S. securities loaned and 105% of the value of foreign securities loaned. Collateral equivalent to at least 100% of the market value of securities on loan is maintained at all times. Collateral is either in the form of cash, which can be invested in certain money market mutual funds managed by the Manager, U.S. Government and Agency securities or letters of credit.The fund is entitled to receive all income on securities loaned, in addition to income earned as a result of the lending transaction.Although each security loaned is fully collater-
26
alized, the fund bears the risk of delay in recovery of, or loss of rights in, the securities loaned should a borrower fail to return the securities in a timely manner. During the period ended May 31, 2013,The Bank of NewYork Mellon earned $36,795 from lending portfolio securities, pursuant to the securities lending agreement.
(c) Affiliated issuers: Investments in other investment companies advised by Dreyfus are defined as “affiliated” under the Act. Investments in affiliated investment companies during the period ended May 31, 2013 were as follows:
| | | | | | | |
| Affiliated | | | | | | | |
| Investment | Value | | | | Value | Net | |
| Company | 5/31/2012 | ($) | Purchases ($) | Sales ($) | 5/31/2013 | ($) Assets (%) |
| Dreyfus | | | | | | | |
| Institutional | | | | | | | |
| Preferred | | | | | | | |
| Plus Money | | | | | | | |
| Market Fund | 354,849 | | 32,231,925 | 32,136,373 | 450,401 | .4 | |
| Dreyfus | | | | | | | |
| Institutional | | | | | | | |
| Cash Advantage | | | | | | |
| Fund | — | | 51,556,496 | 43,477,269 | 8,079,227 | 6.4 | |
| Total | 354,849 | | 83,788,421 | 75,613,642 | 8,529,628 | 6.8 | |
(d) Dividends to shareholders: Dividends are recorded on the ex-dividend date. Dividends from investment income-net are declared and paid monthly. Dividends from net realized capital gains, if any, are normally declared and paid annually, but the fund may make distributions on a more frequent basis to comply with the distribution requirements of the Internal Revenue Code of 1986, as amended (the “Code”).To the extent that net realized capital gains can be offset by capital loss carryovers, it is the policy of the fund not to distribute such gains. Income and capital gain distributions are determined in accordance with income tax regulations, which may differ from GAAP.
(e) Federal income taxes: It is the policy of the fund to continue to qualify as a regulated investment company, if such qualification is in the best interests of its shareholders, by complying with the applicable provisions of the Code, and to make distributions of taxable income sufficient to relieve it from substantially all federal income and excise taxes.
The Fund 27
NOTES TO FINANCIAL STATEMENTS (continued)
As of and during the period ended May 31, 2013, the fund did not have any liabilities for any uncertain tax positions.The fund recognizes interest and penalties, if any, related to uncertain tax positions as income tax expense in the Statement of Operations. During the period, the fund did not incur any interest or penalties.
Each tax year in the four-year period ended May 31, 2013 remains subject to examination by the Internal Revenue Service and state taxing authorities.
At May 31, 2013, the components of accumulated earnings on a tax basis were as follows: undistributed ordinary income $1,451,292, undistributed capital gains $133,050 and unrealized appreciation $13,748,344.
The tax character of distributions paid to shareholders during the fiscal periods ended May 31, 2013 and May 31, 2012 were as follows: ordinary income $3,810,727 and $739,412, and long-term capital gains $17,205 and $85,092, respectively.
During the period ended May 31, 2013, as a result of permanent book to tax differences, primarily due to the tax treatment for real estate investment trusts, the fund decreased accumulated undistributed investment income-net by $71,270 and increased accumulated net realized gain (loss) on investments by the same amount. Net assets and net asset value per share were not affected by this reclassification.
NOTE 2—Bank Lines of Credit:
The fund participates with other Dreyfus-managed funds in a $210 million unsecured credit facility led by Citibank, N.A. and a $300 million unsecured credit facility provided by The Bank of New York Mellon (each, a “Facility”), each to be utilized primarily for temporary or emergency purposes, including the financing of redemptions. Prior to October 10, 2012, the unsecured credit facility with Citibank, N.A. was $225 million. In connection therewith, the fund has agreed to pay its pro rata portion of commitment fees for each Facility. Interest is charged to the fund based on rates determined pursuant to the terms of the respective Facility at the time of borrowing.
28
The average amount of borrowings outstanding under the Facilities during the period ended May 31, 2013, was approximately $37,800 with a related weighted average annualized interest rate of 1.15%.
NOTE 3—Management Fee and Other Transactions With Affiliates:
(a) Pursuant to a management agreement with the Manager, the management fee is computed at the annual rate of .75% of the value of the fund’s average daily net assets and is payable monthly.The Manager had contractually agreed, from June 1, 2012 through June 30, 2013, to waive receipt of its fees and/or assume the expenses of the fund so that annual direct fund operating expenses (excluding Rule 12b-1 Distribution Plan fees, Shareholder Services Plan fees, taxes, interest expense, brokerage commissions, commitment fees on borrowings and extraordinary expenses) did not exceed .90% of the value of the fund’s average daily net assets. Thereafter, the Manager has contractually agreed, from July 1, 2013 through July 1, 2014, to waive receipt of its fees and/or assume the expenses of the fund so that annual direct fund operating expenses (exclusive of certain expenses as described above) do not exceed .85% of the value of the fund’s average daily net assets. The reduction in expenses, pursuant to the undertaking, amounted to $144,904 during the period ended May 31, 2013.
During the period ended May 31, 2013, the Distributor retained $41,160 from commissions earned on sales of the fund’s Class A shares and $436 from CDSC’s on redemptions of the fund’s Class C shares.
(b) Under the Distribution Plan adopted pursuant to Rule 12b-1 under the Act, Class C shares pay the Distributor for distributing its shares at an annual rate of .75% of the value of its average daily net assets. During the period ended May 31, 2013, Class C shares were charged $45,057, pursuant to the Distribution Plan.
(c) Under the Shareholder Services Plan, Class A and Class C shares pay the Distributor at an annual rate of .25% of the value of their average daily net assets for the provision of certain services.The services provided
The Fund 29
NOTES TO FINANCIAL STATEMENTS (continued)
may include personal services relating to shareholder accounts, such as answering shareholder inquiries regarding the fund and providing reports and other information, and services related to the maintenance of shareholder accounts.The Distributor may make payments to Service Agents (securities dealers, financial institutions or other industry professionals) with respect to these services. The Distributor determines the amounts to be paid to Service Agents. During the period ended May 31, 2013, Class A and Class C shares were charged $192,769 and $15,019, respectively, pursuant to the Shareholder Services Plan.
Under its terms, the Distribution Plan and Shareholder Services Plan shall remain in effect from year to year, provided such continuance is approved annually by a vote of a majority of thoseTrustees who are not “interested persons” of the Trust and who have no direct or indirect financial interest in the operation of or in any agreement related to the Distribution Plan or Shareholder Services Plan.
The fund has arrangements with the transfer agent and the custodian whereby the fund may receive earnings credits when positive cash balances are maintained, which are used to offset transfer agency and custody fees. For financial reporting purposes, the fund includes net earnings credits as an expense offset in the Statement of Operations.
The fund compensates Dreyfus Transfer, Inc., a wholly-owned subsidiary of the Manager, under a transfer agency agreement for providing transfer agency services for the fund and cash management services related to fund subscriptions and redemptions. During the period ended May 31, 2013, the fund was charged $21,687 for transfer agency services and $1,022 for cash management services. Cash management fees were partially offset by earnings credits of $150. These fees are included in Shareholder servicing costs in the Statement of Operations.
The fund compensatesThe Bank of NewYork Mellon under a custody agreement for providing custodial services for the fund. During the period ended May 31, 2013, the fund was charged $62,403 pursuant to the custody agreement.
30
The fund compensates The Bank of New York Mellon under a cash management agreement for performing certain cash management services related to fund subscriptions and redemptions. During the period ended May 31, 2013, the fund was charged $632 pursuant to the cash management agreement, which is included in Shareholder servicing costs in the Statement of Operations. These fees were partially offset by earnings credits of $5.
During the period ended May 31, 2013, the fund was charged $8,527 for services performed by the Chief Compliance Officer and his staff.
The components of “Due to The Dreyfus Corporation and affiliates” in the Statement of Assets and Liabilities consist of: management fees $80,184, Distribution Plan fees $4,979, Shareholder Services Plan fees $24,274, custodian fees $12,000, Chief Compliance Officer fees $3,830 and transfer agency fees $4,362, which are offset against an expense reimbursement currently in effect in the amount of $4,675.
(d) Each Board member also serves as a Board member of other funds within the Dreyfus complex. Annual retainer fees and attendance fees are allocated to each fund based on net assets.
NOTE 4—Securities Transactions:
The aggregate amount of purchases and sales of investment securities, excluding short-term securities, during the period ended May 31, 2013, amounted to $101,066,039 and $48,166,241, respectively.
At May 31, 2013, the cost of investments for federal income tax purposes was $121,110,902; accordingly, accumulated net unrealized appreciation on investments was $13,748,344, consisting of $15,948,760 gross unrealized appreciation and $2,200,416 gross unrealized depreciation.
The Fund 31
REPORT OF INDEPENDENT REGISTERED
PUBLIC ACCOUNTING FIRM
The Board of Trustees and Shareholders The Dreyfus/Laurel Funds Trust
We have audited the accompanying statement of assets and liabilities of Dreyfus Equity Income Fund (the “Fund”), a series of The Dreyfus/Laurel Funds Trust, including the statement of investments as of May 31, 2013, and the related statement of operations for the year then ended, the statements of changes in net assets for each of the years in the two-year period then ended and the financial highlights for each of the years in the five-year period then ended.These financial statements and financial highlights are the responsibility of the Fund’s management. Our responsibility is to express an opinion on these financial statements and financial highlights based on our audits.
We conducted our audits in accordance with the standards of the Public Company Accounting Oversight Board (United States).Those standards require that we plan and perform the audit to obtain reasonable assurance about whether the financial statements and financial highlights are free of material misstatement.An audit includes examining, on a test basis, evidence supporting the amounts and disclosures in the financial statements. Our procedures included confirmation of securities owned as of May 31, 2013, by correspondence with the custodian and brokers or by other appropriate auditing procedures where replies from brokers were not received. An audit also includes assessing the accounting principles used and significant estimates made by management, as well as evaluating the overall financial statement presentation.We believe that our audits provide a reasonable basis for our opinion.
In our opinion, the financial statements and financial highlights referred to above present fairly, in all material respects, the financial position of Dreyfus Equity Income Fund as of May 31, 2013, and the results of its operations for the year then ended, the changes in its net assets for each of the years in the two-year period then ended and the financial highlights for each of the years in the five-year period then ended, in conformity with U.S. generally accepted accounting principles.

New York, New York
July 26, 2013
32
IMPORTANT TAX INFORMATION (Unaudited)
For federal tax purposes the fund reports the maximum amount allowable but not less than 75.42% of ordinary income dividends paid during the fiscal year ended May 31, 2013 as eligible for the corporate dividends received deduction provided under Section 243 of the Internal Revenue Code in accordance with Section 854(b)(1)(A) of the Internal Revenue Code. Also, the fund reports the maximum amount allowable but not less than $3,173,740 as ordinary income dividends paid during the fiscal year ended May 31, 2013 as qualified dividend income in accordance with Section 854(b)(1)(B) of the Internal Revenue Code. Shareholders will receive notification in early 2014 of the percentage applicable to the preparation of their 2013 income tax returns. Also, the fund reports the maximum amount allowable but not less than $.0028 per share as a capital gain dividend paid on December 18, 2012 in accordance with Section 852(b)(3)(C) of the Internal Revenue Code. Also, the fund reports the maximum amount allowable but not less than $.1477 as a short-term capital gain dividend paid on December 18, 2012 in accordance with Sections 871(k)(2) and 881(e) of the Internal Revenue Code.
The Fund 33
INFORMATION ABOUT THE RENEWAL OF THE
FUND’S MANAGEMENT AGREEMENT (Unaudited)
At a meeting of the fund’s Board of Trustees held on February 13-14, 2013, the Board considered the renewal of the fund’s Management Agreement pursuant to which Dreyfus provides the fund with investment advisory and administrative services (the “Agreement”). The Board members, none of whom are “interested persons” (as defined in the Investment Company Act of 1940, as amended) of the fund, were assisted in their review by independent legal counsel and met with counsel in executive session separate from Dreyfus representatives. In considering the renewal of the Agreement, the Board considered all factors that it believed to be relevant, including those discussed below. The Board did not identify any one factor as dispositive, and each Board member may have attributed different weights to the factors considered.
Analysis of Nature, Extent, and Quality of Services Provided to the Fund.The Board considered information provided to them at the meeting and in previous presentations from Dreyfus representatives regarding the nature, extent, and quality of the services provided to funds in the Dreyfus fund complex. Dreyfus provided the number of open accounts in the fund, the fund’s asset size and the allocation of fund assets among distribution channels. Dreyfus also had previously provided information regarding the diverse intermediary relationships and distribution channels of funds in the Dreyfus fund complex (such as retail direct or intermediary, in which intermediaries typically are paid by the fund and/or Dreyfus) and Dreyfus’ corresponding need for broad, deep, and diverse resources to be able to provide ongoing shareholder services to each intermediary or distribution channel, as applicable to the fund.
The Board also considered research support available to, and portfolio management capabilities of, the fund’s portfolio management personnel and that Dreyfus also provides oversight of day-to-day fund operations, including fund accounting and administration and assistance in meeting legal and regulatory requirements.The Board also considered Dreyfus’ extensive administrative, accounting, and compliance infrastructures. The Board also considered portfolio management’s brokerage policies and practices (including policies and practices regarding soft dollars) and the standards applied in seeking best execution.
34
Comparative Analysis of the Fund’s Performance and Management Fee and Expense Ratio.The Board reviewed reports prepared by Lipper, Inc. (“Lipper”), an independent provider of investment company data, which included information comparing (1) the fund’s performance with the performance of a group of comparable funds (the “Performance Group”) and with a broader group of funds (the “Performance Universe”), all for various periods ended December 31, 2012, and (2) the fund’s actual and contractual management fees and total expenses with those of a group of comparable funds (the “Expense Group”) and with a broader group of funds (the “Expense Universe”), the information for which was derived in part from fund financial statements available to Lipper as of the date of its analysis. Dreyfus previously had furnished the Board with a description of the methodology Lipper used to select the Performance Group and Performance Universe and the Expense Group and Expense Universe.
Dreyfus representatives stated that the usefulness of performance comparisons may be affected by a number of factors, including different investment limitations that may be applicable to the fund and comparison funds.They also noted that performance generally should be considered over longer periods of time, although it is possible that long-term performance can be adversely affected by even one period of significant underperformance so that a single investment decision or theme has the ability to affect disproportionately long-term performance. The Board discussed the results of the comparisons and noted that the fund’s total return performance was above the Performance Group and Performance Universe medians for the various periods, except for the one-year period when the fund’s performance was below the Performance Group and Performance Universe medians. Dreyfus also provided a comparison of the fund’s calendar year total returns to the returns of the fund’s benchmark index.
The Board also reviewed the range of actual and contractual management fees and total expenses of the Expense Group and Expense Universe funds and discussed the results of the comparisons.The Board
The Fund 35
INFORMATION ABOUT THE RENEWAL OF THE FUND’S
MANAGEMENT AGREEMENT (Unaudited) (continued)
noted that the fund’s contractual management fee was at the Expense Group median, the fund’s actual management fee was below the Expense Group and Expense Universe medians and the fund’s total expenses were below the Expense Group median and above the Expense Universe median.
Dreyfus representatives noted that Dreyfus has contractually agreed to waive receipt of its fees and/or assume the expenses of the fund, until June 30, 2013, so that annual direct fund operating expenses (excluding Rule 12b-1 fees, shareholder services fees, taxes, interest, brokerage commissions, commitment fees on borrowings and extraordinary expenses) do not exceed 0.90% of the value of the fund’s average daily net assets.
Dreyfus representatives reviewed with the Board the management or investment advisory fees (1) paid by funds advised or administered by Dreyfus that are in the same Lipper category as the fund and (2) paid to Dreyfus or the Dreyfus-affiliated primary employer of the fund’s primary portfolio manager(s) for advising any separate accounts and/or other types of client portfolios that are considered to have similar investment strategies and policies as the fund (the “Similar Clients”), and explained the nature of the Similar Clients.They discussed differences in fees paid and the relationship of the fees paid in light of any differences in the services provided and other relevant factors. The Board considered the relevance of the fee information provided for the Similar Clients to evaluate the appropriateness and reasonableness of the fund’s management fee.
Analysis of Profitability and Economies of Scale. Dreyfus representatives reviewed the expenses allocated and profit received by Dreyfus and the resulting profitability percentage for managing the fund and the aggregate profitability percentage to Dreyfus of managing the funds in the Dreyfus fund complex, and the method used to determine the expenses and profit.The Board concluded that the profitability results were not unreasonable, given the services rendered and service levels provided by Dreyfus.The Board also noted the expense limitation arrangement and its effect on Dreyfus’ profitability. The Board also had been provided
36
with information prepared by an independent consulting firm regarding Dreyfus’ approach to allocating costs to, and determining the profitability of, individual funds and the entire Dreyfus fund complex.The consulting firm also had analyzed where any economies of scale might emerge in connection with the management of a fund.
The Board’s counsel stated that the Board should consider the profitability analysis (1) as part of the evaluation of whether the fees under the Agreement bear a reasonable relationship to the mix of services provided by Dreyfus, including the nature, extent and quality of such services, and (2) in light of the relevant circumstances for the fund and the extent to which economies of scale would be realized if the fund grows and whether fee levels reflect these economies of scale for the benefit of fund shareholders. Dreyfus representatives also noted that, as a result of shared and allocated costs among funds in the Dreyfus fund complex, the extent of economies of scale could depend substantially on the level of assets in the complex as a whole, so that increases and decreases in complex-wide assets can affect potential economies of scale in a manner that is disproportionate to, or even in the opposite direction from, changes in the fund’s asset level.The Board also considered potential benefits to Dreyfus from acting as investment adviser and noted the soft dollar arrangements in effect for trading the fund’s investments.
At the conclusion of these discussions, the Board agreed that it had been furnished with sufficient information to make an informed business decision with respect to the renewal of the Agreement. Based on the discussions and considerations as described above, the Board concluded and determined as follows.
The Board concluded that the nature, extent and quality of the services provided by Dreyfus are adequate and appropriate.
The Board generally was satisfied with the fund’s performance.
The Board concluded that the fee paid to Dreyfus was reasonable in light of the considerations described above.
The Fund 37
INFORMATION ABOUT THE RENEWAL OF THE FUND’S
MANAGEMENT AGREEMENT (Unaudited) (continued)
The Board determined that the economies of scale which may accrue to Dreyfus and its affiliates in connection with the management of the fund had been adequately considered by Dreyfus in connection with the fee rate charged to the fund pursuant to the Agreement and that, to the extent in the future it were determined that material economies of scale had not been shared with the fund, the Board would seek to have those economies of scale shared with the fund.
In evaluating the Agreement, the Board considered these conclusions and determinations and also relied on its previous knowledge, gained through meetings and other interactions with Dreyfus and its affiliates, of the fund and the services provided to the fund by Dreyfus.The Board also relied on information received on a routine and regular basis throughout the year relating to the operations of the fund and the investment management and other services provided under the Agreement, including information on the investment performance of the fund in comparison to similar mutual funds and benchmark performance indices; general market outlook as applicable to the fund; and compliance reports. In addition, it should be noted that the Board’s consideration of the contractual fee arrangements for this fund had the benefit of a number of years of reviews of prior or similar agreements during which lengthy discussions took place between the Board and Dreyfus representatives. Certain aspects of the arrangements may receive greater scrutiny in some years than in others, and the Board’s conclusions may be based, in part, on their consideration of the same or similar arrangements in prior years. The Board determined that renewal of the Agreement was in the best interests of the fund and its shareholders.
38
BOARD MEMBERS INFORMATION (Unaudited)
The Fund 39
BOARD MEMBERS INFORMATION (Unaudited) (continued)
Once elected all Board Members serve for an indefinite term, but achieve Emeritus status upon reaching age 80.The address of the Board Members and Officers is c/o The Dreyfus Corporation, 200 Park Avenue, NewYork, NewYork 10166.Additional information about the Board Members is available in the fund’s Statement of Additional Information which can be obtained from Dreyfus free of charge by calling this toll free number: 1-800-DREYFUS.
J.Tomlinson Fort, Emeritus Board Member
40
OFFICERS OF THE FUND (Unaudited)
The Fund 41
OFFICERS OF THE FUND (Unaudited) (continued)
42
For More Information
Telephone Call your financial representative or 1-800-DREYFUS
Mail The Dreyfus Family of Funds, 144 Glenn Curtiss Boulevard, Uniondale, NY 11556-0144
The fund files its complete schedule of portfolio holdings with the Securities and Exchange Commission (“SEC”) for the first and third quarters of each fiscal year on Form N-Q. The fund’s Forms N-Q are available on the SEC’s website at http://www.sec.gov and may be reviewed and copied at the SEC’s Public Reference Room in Washington, DC. Information on the operation of the Public Reference Room may be obtained by calling 1-800-SEC-0330.
A description of the policies and procedures that the fund uses to determine how to vote proxies relating to portfolio securities, and information regarding how the fund voted these proxies for the 12-month period ended June 30 is available at http://www.dreyfus.com and on the SEC’s website at http://www.sec.gov. The description of the policies and procedures is also available without charge, upon request, by calling 1-800-DREYFUS.

|
| © 2013 MBSC Securities Corporation |
Item 2. Code of Ethics.
The Registrant has adopted a code of ethics that applies to the Registrant's principal executive officer, principal financial officer, principal accounting officer or controller, or persons performing similar functions. There have been no amendments to, or waivers in connection with, the Code of Ethics during the period covered by this Report.
Item 3. Audit Committee Financial Expert.
The Registrant's Board has determined that Joseph S. DiMartino, a member of the Audit Committee of the Board, is an audit committee financial expert as defined by the Securities and Exchange Commission (the "SEC"). Joseph S. DiMartino is "independent" as defined by the SEC for purposes of audit committee financial expert determinations.
Item 4. Principal Accountant Fees and Services.
(a) Audit Fees. The aggregate fees billed for each of the last two fiscal years (the "Reporting Periods") for professional services rendered by the Registrant's principal accountant (the "Auditor") for the audit of the Registrant's annual financial statements or services that are normally provided by the Auditor in connection with the statutory and regulatory filings or engagements for the Reporting Periods, were $73,410 in 2012 and $75,020 in 2013.
(b) Audit-Related Fees. The aggregate fees billed in the Reporting Periods for assurance and related services by the Auditor that are reasonably related to the performance of the audit of the Registrant's financial statements and are not reported under paragraph (a) of this Item 4 were $9,590 in 2012 and $9,640 in 2013. These services consisted of one or more of the following: (i) agreed upon procedures related to compliance with Internal Revenue Code section 817(h), (ii) security counts required by Rule 17f-2 under the Investment Company Act of 1940, as amended, (iii) advisory services as to the accounting or disclosure treatment of Registrant transactions or events and (iv) advisory services to the accounting or disclosure treatment of the actual or potential impact to the Registrant of final or proposed rules, standards or interpretations by the Securities and Exchange Commission, the Financial Accounting Standards Boards or other regulatory or standard-setting bodies.
The aggregate fees billed in the Reporting Periods for non-audit assurance and related services by the Auditor to the Registrant's investment adviser (not including any sub-investment adviser whose role is primarily portfolio management and is subcontracted with or overseen by another investment adviser), and any entity controlling, controlled by or under common control with the investment adviser that provides ongoing services to the Registrant ("Service Affiliates"), that were reasonably related to the performance of the annual audit of the Service Affiliate, which required pre-approval by the Audit Committee were $0 in 2012 and $0 in 2013.
(c) Tax Fees. The aggregate fees billed in the Reporting Periods for professional services rendered by the Auditor for tax compliance, tax advice, and tax planning ("Tax Services") were $4,720 in 2012 and $4,820 in 2013. These services consisted of: (i) review or preparation of U.S. federal, state, local and excise tax returns. The aggregate fees billed in the Reporting Periods for Tax Services by the Auditor to Service Affiliates, which required pre-approval by the Audit Committee were $0 in 2012 and $0 in 2013.
(d) All Other Fees. The aggregate fees billed in the Reporting Periods for products and services provided by the Auditor, other than the services reported in paragraphs (a) through (c) of this Item, were $0 in 2012 and $0 in 2013.
The aggregate fees billed in the Reporting Periods for Non-Audit Services by the Auditor to Service Affiliates, other than the services reported in paragraphs (b) through (c) of this Item, which required pre-approval by the Audit Committee, were $0 in 2012 and $0 in 2013.
(e)(1) Audit Committee Pre-Approval Policies and Procedures. The Registrant's Audit Committee has established policies and procedures (the "Policy") for pre-approval (within specified fee limits) of the Auditor's engagements for non-audit services to the Registrant and Service Affiliates without specific case-by-case consideration. The pre-approved services in the Policy can include pre-approved audit services, pre-approved audit-related services, pre-approved tax services and pre-approved all other services. Pre-approval considerations include whether the proposed services are compatible with maintaining the Auditor's independence. Pre-approvals pursuant to the Policy are considered annually.
(e)(2) Note: None of the services described in paragraphs (b) through (d) of this Item 4 were approved by the Audit Committee pursuant to paragraph (c)(7)(i)(C) of Rule 2-01 of Regulation S-X.
(f) None of the hours expended on the principal accountant's engagement to audit the registrant's financial statements for the most recent fiscal year were attributed to work performed by persons other than the principal account's full-time, permanent employees.
Non-Audit Fees. The aggregate non-audit fees billed by the Auditor for services rendered to the Registrant, and rendered to Service Affiliates, for the Reporting Periods were $12,757,704 in 2012 and $14,859,489 in 2013.
Auditor Independence. The Registrant's Audit Committee has considered whether the provision of non-audit services that were rendered to Service Affiliates, which were not pre-approved (not requiring pre-approval), is compatible with maintaining the Auditor's independence.
Item 5. Audit Committee of Listed Registrants.
Not applicable. [CLOSED-END FUNDS ONLY]
Item 6. Investments.
(a) Not applicable.
Item 7. Disclosure of Proxy Voting Policies and Procedures for Closed-End Management Investment Companies.
Not applicable. [CLOSED-END FUNDS ONLY]
Item 8. Portfolio Managers of Closed-End Management Investment Companies.
Not applicable. [CLOSED-END FUNDS ONLY, beginning with reports for periods ended on and after December 31, 2005]
Item 9. Purchases of Equity Securities by Closed-End Management Investment Companies and Affiliated Purchasers.
Not applicable. [CLOSED-END FUNDS ONLY]
Item 10. Submission of Matters to a Vote of Security Holders.
There have been no material changes to the procedures applicable to Item 10.
Item 11. Controls and Procedures.
(a) The Registrant's principal executive and principal financial officers have concluded, based on their evaluation of the Registrant's disclosure controls and procedures as of a date within 90 days of the filing date of this report, that the Registrant's disclosure controls and procedures are reasonably designed to ensure that information required to be disclosed by the Registrant on Form N-CSR is recorded, processed, summarized and reported within the required time periods and that information required to be disclosed by the Registrant in the reports that it files or submits on Form N-CSR is accumulated and communicated to the Registrant's management, including its principal executive and principal financial officers, as appropriate to allow timely decisions regarding required disclosure.
(b) There were no changes to the Registrant's internal control over financial reporting that occurred during the second fiscal quarter of the period covered by this report that have materially affected, or are reasonably likely to materially affect, the Registrant's internal control over financial reporting.
Item 12. Exhibits.
(a)(1) Code of ethics referred to in Item 2.
(a)(2) Certifications of principal executive and principal financial officers as required by Rule 30a-2(a) under the Investment Company Act of 1940.
(a)(3) Not applicable.
(b) Certification of principal executive and principal financial officers as required by Rule 30a-2(b) under the Investment Company Act of 1940.
SIGNATURES
Pursuant to the requirements of the Securities Exchange Act of 1934 and the Investment Company Act of 1940, the Registrant has duly caused this Report to be signed on its behalf by the undersigned, thereunto duly authorized.
Dreyfus/Laurel Funds Trust
By: /s/ Bradley J. Skapyak |
Bradley J. Skapyak, President |
Date: | July 24, 2013 |
|
Pursuant to the requirements of the Securities Exchange Act of 1934 and the Investment Company Act of 1940, this Report has been signed below by the following persons on behalf of the Registrant and in the capacities and on the dates indicated. |
|
By: /s/ Bradley J. Skapyak |
Bradley J. Skapyak, President |
Date: | July 24, 2013 |
|
By: /s/ James Windels |
James Windels, Treasurer |
Date: | July 24, 2013 |
|
EXHIBIT INDEX
(a)(1) Code of ethics referred to in Item 2.
(a)(2) Certifications of principal executive and principal financial officers as required by Rule 30a-2(a) under the Investment Company Act of 1940. (EX-99.CERT)
(b) Certification of principal executive and principal financial officers as required by Rule 30a-2(b) under the Investment Company Act of 1940. (EX-99.906CERT)
Exhibit (a)(1)
[INSERT CODE OF ETHICS]
Exhibit A
Persons Covered by the Code of Ethics
Bradley J. Skapyak | President | (Principal Executive Officer) |
| | |
James Windels | Treasurer | (Principal Financial and Accounting Officer) |
Revised as of January 1, 2010