UNITED STATES
SECURITIES AND EXCHANGE COMMISSION
Washington, D.C. 20549
FORM N-CSR
CERTIFIED SHAREHOLDER REPORT OF REGISTERED MANAGEMENT
INVESTMENT COMPANIES
Investment Company Act file number | 811- 524 |
| |
| The Dreyfus/Laurel Funds Trust | |
| (Exact name of Registrant as specified in charter) | |
| | |
| c/o The Dreyfus Corporation 200 Park Avenue New York, New York 10166 | |
| (Address of principal executive offices) (Zip code) | |
| | |
| Janette E. Farragher, Esq. 200 Park Avenue New York, New York 10166 | |
| (Name and address of agent for service) | |
|
Registrant's telephone number, including area code: | (212) 922-6000 |
| |
Date of fiscal year end: | 12/31 | |
Date of reporting period: | 12/31/12 | |
| | | | | | | |
The following N-CSR relates only to Dreyfus High Yield Fund and does not affect the other series of the Registrant, which have different fiscal year ends and, therefore, different N-CSR reporting requirements. Separate N-CSR Forms will be filed for these series, as appropriate.
FORM N-CSR
Item 1. Reports to Stockholders.
Dreyfus
High Yield Fund
ANNUAL REPORT December 31, 2012

Save time. Save paper. View your next shareholder report online as soon as it’s available. Log into www.dreyfus.com and sign up for Dreyfus eCommunications. It’s simple and only takes a few minutes.
The views expressed in this report reflect those of the portfolio manager only through the end of the period covered and do not necessarily represent the views of Dreyfus or any other person in the Dreyfus organization. Any such views are subject to change at any time based upon market or other conditions and Dreyfus disclaims any responsibility to update such views.These views may not be relied on as investment advice and, because investment decisions for a Dreyfus fund are based on numerous factors, may not be relied on as an indication of trading intent on behalf of any Dreyfus fund.
|
| Not FDIC-Insured • Not Bank-Guaranteed • May Lose Value |
| | Contents |
| | THE FUND |
| 2 | A Letter from the President |
| 3 | Discussion of Fund Performance |
| 6 | Fund Performance |
| 8 | Understanding Your Fund’s Expenses |
| 8 | Comparing Your Fund’s Expenses With Those of Other Funds |
| 9 | Statement of Investments |
| 29 | Statement of Assets and Liabilities |
| 30 | Statement of Operations |
| 31 | Statement of Changes in Net Assets |
| 33 | Financial Highlights |
| 36 | Notes to Financial Statements |
| 50 | Report of Independent Registered Public Accounting Firm |
| 51 | Important Tax Information |
| 52 | Board Members Information |
| 54 | Officers of the Fund |
| | FOR MORE INFORMATION |
| | Back Cover |
Dreyfus
High Yield Fund
The Fund
A LETTER FROM THE PRESIDENT
Dear Shareholder:
We are pleased to present this annual report for Dreyfus HighYield Fund, covering the 12-month period from January 1, 2012, through December 31, 2012. For information about how the fund performed during the reporting period, as well as general market perspectives, we provide a Discussion of Fund Performance on the pages that follow.
The search for higher yields amid historically low interest rates proved to be a major force in the performance of U.S. and global bond markets in 2012, even as the Federal Reserve Board and other central banks pumped liquidity into their financial systems. More specifically, low rates on U.S.Treasury securities drove investors to riskier market sectors, helping to support prices among corporate-backed securities, asset-backed securities, commercial mortgage-backed securities, and emerging-markets bonds. In addition, higher yielding bond market sectors were buoyed by gradually recovering U.S. and global economies as domestic employment trends improved, Europe avoided a collapse of its common currency, and China engineered an economic soft landing.
We currently expect the U.S. and global economies to be modestly stronger in 2013, especially during the second half of the year.The U.S. economy seems likely to benefit from greater certainty regarding U.S. tax and fiscal policies, the resumption of postponed spending by businesses, and a continued housing recovery.We encourage you to discuss the implications of our economic analysis with your financial advisor, who can help you align your investments with the year’s challenges and opportunities.
Thank you for your continued confidence and support.
Sincerely,
J. Charles Cardona
President
The Dreyfus Corporation
January 15, 2013
2
DISCUSSION OF FUND PERFORMANCE
For the period of January 1, 2012, through December 31, 2012, as provided by Chris Barris and Kevin Cronk, Portfolio Managers
Fund and Market Performance Overview
For the 12-month period ended December 31, 2012, Dreyfus High Yield Fund’s Class A shares produced a total return of 14.74%, Class C shares returned 13.89% and Class I shares returned 14.84%.1 In comparison, the BofA Merrill Lynch U.S. High Yield Master II Constrained Index (the “Index”), the fund’s benchmark, achieved a total return of 15.55% over the same period.2
High yield bonds fared well over the reporting period, mainly due to improving economic fundamentals, strong corporate earnings and low default rates. Favorable supply-and-demand dynamics and low default rates also supported bond prices.The fund produced lower returns than its benchmark, mainly due to the dampening effects of cash holdings during markets rallies and, to a lesser extent, underweighted exposure to the financials sector.
The Fund’s Investment Approach
The fund seeks to maximize total return, consisting of capital appreciation and current income.
At least 80% of the fund’s assets are invested in fixed-income securities that are rated below investment grade (“high yield” or “junk” bonds) or are the unrated equivalent as determined by Dreyfus. Individual issues are selected based on careful credit analysis. We thoroughly analyze the business, management and financial strength of each of the companies whose bonds we buy, then project each issuer’s ability to repay its debt.
Economic Developments Supported High Yield Bonds
The year 2012 began in the midst of market rallies driven by positive macroeconomic developments in the United States, Europe, and China. Most notably, employment gains helped bolster the U.S. economy, and a quantitative easing program appeared to forestall a more severe banking crisis in Europe.These developments supported a sustained rally among high yield bonds as investors turned toward riskier market sectors expected to benefit from better economic conditions.
DISCUSSION OF FUND PERFORMANCE (continued)
The global recovery seemed to falter in the spring, when U.S. employment gains moderated, proposed austerity programs in Europe encountered resistance, and China’s economy remained sluggish. These headwinds erased some of the gains previously posted by high yield bonds, and yields of sovereign debt securities from fiscally healthy nations plunged in a renewed flight to quality. Fortunately, more encouraging economic data over the summer and fall—and the announcement of new policy initiatives by several central banks—cheered investors. Improved economic sentiment, strong corporate earnings and lower-than-average default rates enabled the high yield bond market to end the year with double-digit returns, on average.
In addition, the high yield market benefited from robust demand from investors seeking competitively high levels of current income in a low interest-rate environment. Robust levels of investor demand readily absorbed an all-time high supply of securities amid improved access to capital markets and greater refinancing activity among corporate issuers.
Cash Proved to Be a Drag on Fund Performance
Although the fund participated substantially in the market’s gains in 2012, it held a larger-than-usual cash position in the wake of the spring downturn, when we became more worried about the potential impact of a resurgent European debt crisis on investor sentiment and business conditions for high yield issuers.Although we reduced the fund’s cash balance when macroeconomic concerns eased, it nonetheless prevented the fund from participating fully in the summer rally. In addition, the fund held relatively light exposure to the financials sector, which had been severely punished over the past several years, and the fund did not benefit as much as the benchmark from the sector’s rebound in 2012.
The fund achieved better results from our credit selection strategy, which proved to be especially successful in the energy, industrials and information technology sectors. In-depth analyses of individual issuers found a relatively large number of opportunities among bonds rated B, which occupy the middle of the high yield credit-quality spectrum and fared particularly well in 2012.The fund held underweighted exposure to BB-rated bonds, and we gradually reduced its weighting in CCC-rated bonds from an overweighted position to one that was roughly in line with market averages.
4
Focusing on Relative Values Among Individual Issuers
As of year-end, business fundamentals for high yield issuers generally remained strong, and default rates stayed low after several years of deleveraging activity.These factors should help support the high yield bond market in 2013 as the U.S. and global economies continue to strengthen.
However, we are cognizant of several potential headwinds that could derail the market’s advance. Most notably, we are watchful for signs that issuers are growing more aggressive by increasing leverage in the recovering economy, a development that could spark heightened market volatility. In addition, valuations in the high yield market have become richer after 2012’s rallies. In our judgment, these potential concerns call for an emphasis on credit selection strategies in which the strengths and weaknesses of individual companies drive portfolio construction.
January 15, 2013
Bond funds are subject generally to interest rate, credit, liquidity and market risks, to varying degrees, all of which are more fully described in the fund’s prospectus. Generally, all other factors being equal, bond prices are inversely related to interest-rate changes, and rate increases can cause price declines.
High yield bonds are subject to increased credit risk and are considered speculative in terms of the issuer’s perceived ability to continue making interest payments on a timely basis and to repay principal upon maturity.
|
| 1 Total return includes reinvestment of dividends and any capital gains paid, and does not take into consideration the |
| maximum initial sales charge in the case of Class A shares, or the applicable contingent deferred sales charges imposed |
| on redemptions in the case of Class C shares. Had these charges been reflected, returns would have been lower. Past |
| performance is no guarantee of future results. Share price, yield and investment return fluctuate such that upon |
| redemption, fund shares may be worth more or less than their original cost. |
| 2 SOURCE: LIPPER INC. — Reflects reinvestment of dividends and, where applicable, capital gain distributions. |
| The BofA Merrill Lynch U.S. HighYield Master II Constrained Index is an unmanaged performance benchmark |
| composed of U.S. dollar-denominated domestic andYankee bonds rated below investment grade with at least $100 |
| million par amount outstanding and at least one year remaining to maturity. Bonds are capitalization-weighted.Total |
| allocations to an issuer are capped at 2%.The index does not reflect fees and expenses to which the fund is subject. |
FUND PERFORMANCE

† Source: Lipper Inc.
Past performance is not predictive of future performance.
The above graph compares a $10,000 investment made in each of the Class A, Class C and Class I shares of Dreyfus HighYield Fund on 12/31/02 to a $10,000 investment made in the BofA Merrill Lynch U.S. HighYield Master II Constrained Index (the “Index”) on that date.All dividends and capital gain distributions are reinvested.
The fund’s performance shown in the line graph above takes into account the maximum initial sales charge on Class A shares and all other applicable fees and expenses on all classes.The Index is an unmanaged performance benchmark composed of U.S. dollar-denominated domestic andYankee bonds rated below investment grade with at least $100 million par amount outstanding and at least one year remaining to maturity. Bonds are capitalization-weighted.Total allocations to an issuer are capped at 2%. Unlike a mutual fund, the Index is not subject to charges, fees and other expenses. Investors cannot invest directly in any index. Further information relating to fund performance, including expense reimbursements, if applicable, is contained in the Financial Highlights section of the prospectus and elsewhere in this report.
6
| | | | | | |
| Average Annual Total Returns as of 12/31/12 | | | | | | |
| | 1 Year | | 5 Years | | 10 Years | |
| Class A shares | | | | | | |
| with maximum sales charge (4.5%) | 9.62 | % | 6.95 | % | 8.56 | % |
| without sales charge | 14.74 | % | 7.95 | % | 9.07 | % |
| Class C shares | | | | | | |
| with applicable redemption charge † | 12.89 | % | 7.12 | % | 8.27 | % |
| without redemption | 13.89 | % | 7.12 | % | 8.27 | % |
| Class I shares | 14.84 | % | 8.20 | % | 9.33 | % |
| BofA Merrill Lynch U.S. High Yield | | | | | | |
| Master II Constrained Index | 15.55 | % | 10.14 | % | 10.38 | % |
Past performance is not predictive of future performance.The fund’s performance shown in the graph and table does not reflect the deduction of taxes that a shareholder would pay on fund distributions or the redemption of fund shares
|
| † The maximum contingent deferred sales charge for Class C shares is 1% for shares redeemed within one year of the |
| date of purchase. |
UNDERSTANDING YOUR FUND’S EXPENSES (Unaudited)
As a mutual fund investor, you pay ongoing expenses, such as management fees and other expenses. Using the information below, you can estimate how these expenses affect your investment and compare them with the expenses of other funds.You also may pay one-time transaction expenses, including sales charges (loads) and redemption fees, which are not shown in this section and would have resulted in higher total expenses. For more information, see your fund’s prospectus or talk to your financial adviser.
Review your fund’s expenses
The table below shows the expenses you would have paid on a $1,000 investment in Dreyfus High Yield Fund from July 1, 2012 to December 31, 2012. It also shows how much a $1,000 investment would be worth at the close of the period, assuming actual returns and expenses.
Expenses and Value of a $1,000 Investment
assuming actual returns for the six months ended December 31, 2012
| | | | | | |
| | | Class A | | Class C | | Class I |
| Expenses paid per $1,000† | | $4.96 | | $8.85 | | $3.66 |
| Ending value (after expenses) | | $1,076.20 | | $1,072.10 | | $1,077.50 |
COMPARING YOUR FUND’S EXPENSES
WITH THOSE OF OTHER FUNDS (Unaudited)
Using the SEC’s method to compare expenses
The Securities and Exchange Commission (SEC) has established guidelines to help investors assess fund expenses. Per these guidelines, the table below shows your fund’s expenses based on a $1,000 investment, assuming a hypothetical 5% annualized return. You can use this information to compare the ongoing expenses (but not transaction expenses or total cost) of investing in the fund with those of other funds.All mutual fund shareholder reports will provide this information to help you make this comparison. Please note that you cannot use this information to estimate your actual ending account balance and expenses paid during the period.
Expenses and Value of a $1,000 Investment
assuming a hypothetical 5% annualized return for the six months ended December 31, 2012
| | | | | | |
| | | Class A | | Class C | | Class I |
| Expenses paid per $1,000† | | $4.82 | | $8.62 | | $3.56 |
| Ending value (after expenses) | | $1,020.36 | | $1,016.59 | | $1,021.62 |
|
| † Expenses are equal to the fund’s annualized expense ratio of .95% for Class A, 1.70% for Class C and .70% |
| for Class I, multiplied by the average account value over the period, multiplied by 184/366 (to reflect the one-half |
| year period). |
8
STATEMENT OF INVESTMENTS
December 31, 2012
| | | | | |
| | Coupon | Maturity | Principal | | |
| Bonds and Notes—95.7% | Rate (%) | Date | Amount ($)a | Value ($) |
| Aerospace & Defense—1.5% | | | | | |
| B/E Aerospace, | | | | | |
| Sr. Unscd. Notes | 6.88 | 10/1/20 | 2,900,000 | | 3,240,750 |
| Bombardier, | | | | | |
| Sr. Unscd. Notes | 7.75 | 3/15/20 | 4,450,000 | b | 5,073,000 |
| CPI International, | | | | | |
| Gtd. Notes | 8.00 | 2/15/18 | 3,410,000 | | 3,346,062 |
| Kratos Defense & Security | | | | | |
| Solutions, Sr. Scd. Notes | 10.00 | 6/1/17 | 2,280,000 | | 2,513,700 |
| TransDigm, | | | | | |
| Gtd. Notes | 5.50 | 10/15/20 | 1,675,000 | b,c | 1,750,375 |
| TransDigm, | | | | | |
| Gtd. Notes | 7.75 | 12/15/18 | 4,245,000 | | 4,717,256 |
| | | | | | 20,641,143 |
| Automotive—3.1% | | | | | |
| Chrysler Group, | | | | | |
| Scd. Notes | 8.00 | 6/15/19 | 5,950,000 | c | 6,515,250 |
| Chrysler Group, | | | | | |
| Scd. Notes | 8.25 | 6/15/21 | 8,810,000 | c | 9,735,050 |
| Ford Motor, | | | | | |
| Sr. Unscd. Notes | 7.45 | 7/16/31 | 5,215,000 | c | 6,649,125 |
| Goodyear Tire & Rubber, | | | | | |
| Gtd. Notes | 8.25 | 8/15/20 | 4,025,000 | c | 4,437,563 |
| Lear, | | | | | |
| Gtd. Notes | 7.88 | 3/15/18 | 2,119,000 | | 2,315,007 |
| Lear, | | | | | |
| Gtd. Notes | 8.13 | 3/15/20 | 1,694,000 | | 1,918,455 |
| Schaeffler Finance, | | | | | |
| Sr. Scd. Notes | 7.75 | 2/15/17 | 1,110,000 | b | 1,237,650 |
| Schaeffler Finance, | | | | | |
| Sr. Scd. Notes | 8.50 | 2/15/19 | 1,000,000 | | 1,125,000 |
| Schaeffler Finance, | | | | | |
| Sr. Scd. Notes | 8.50 | 2/15/19 | 5,503,000 | b,c | 6,245,905 |
| UCI International, | | | | | |
| Gtd. Notes | 8.63 | 2/15/19 | 3,075,000 | | 3,063,469 |
| | | | | | 43,242,474 |
STATEMENT OF INVESTMENTS (continued)
| | | | | | |
| | | Coupon | Maturity | Principal | | |
| Bonds and Notes (continued) | Rate (%) | Date | Amount ($)a | Value ($) |
| Banking—3.2% | | | | | | |
| Bank of America, | | | | | | |
| Jr. Sub. Cap. Secs., Ser. K | | 8.00 | 12/29/49 | 4,195,000 | d | 4,644,876 |
| Barclays Bank, | | | | | | |
| Jr. Sub. Notes | EUR | 4.75 | 3/15/49 | 3,800,000 | d | 3,854,522 |
| BNP Paribas, | | | | | | |
| Jr. Sub. Notes | | 5.19 | 6/29/49 | 3,435,000 | b,c,d | 3,331,950 |
| Citigroup, | | | | | | |
| Jr. Sub. Notes | | 5.95 | 12/29/49 | 2,640,000 | d | 2,676,300 |
| HBOS Capital Funding, | | | | | | |
| Bank Gtd. Bonds | | 6.07 | 6/29/49 | 6,131,000 | b,d | 5,395,280 |
| Lloyds TSB Bank | | | | | | |
| Sub. Notes | EUR | 11.88 | 12/16/21 | 2,220,000 | d | 3,692,157 |
| Lloyds TSB Bank, | | | | | | |
| Sub. Notes | GBP | 10.75 | 12/16/21 | 2,610,000 | d | 5,071,903 |
| RBS Capital Trust III, | | | | | | |
| Bank Gtd. Notes | | 5.51 | 9/29/49 | 9,380,000 | c,d | 7,457,100 |
| Royal Bank of Scotland, | | | | | | |
| Sub. Notes | | 9.50 | 3/16/22 | 5,860,000 | d | 6,911,161 |
| Royal Bank Scotland Group, | | | | | | |
| Sub. Notes | | 6.13 | 12/15/22 | 1,805,000 | | 1,912,275 |
| | | | | | | 44,947,524 |
| Building Materials—1.3% | | | | | | |
| Building Materials Corp. of | | | | | | |
| America, Sr. Notes | | 6.75 | 5/1/21 | 3,130,000 | b | 3,466,475 |
| Cemex SAB de CV, | | | | | | |
| Sr. Scd. Notes | | 9.50 | 6/15/18 | 2,060,000 | b,c | 2,312,350 |
| Nortek, | | | | | | |
| Gtd. Notes | | 8.50 | 4/15/21 | 760,000 | | 847,400 |
| Nortek, | | | | | | |
| Gtd. Notes | | 8.50 | 4/15/21 | 4,440,000 | b | 4,939,500 |
| Ply Gem Industries, | | | | | | |
| Sr. Scd. Notes | | 8.25 | 2/15/18 | 2,085,000 | | 2,262,225 |
| Roofing Supply Group, | | | | | | |
| Gtd. Notes | | 10.00 | 6/1/20 | 3,665,000 | b | 4,123,125 |
| | | | | | | 17,951,075 |
| Chemicals—2.4% | | | | | | |
| Hexion U.S. Finance/Nova Scotia, | | | | | | |
| Scd. Notes | | 9.00 | 11/15/20 | 3,865,000 | | 3,546,137 |
10
| | | | | |
| | Coupon | Maturity | Principal | | |
| Bonds and Notes (continued) | Rate (%) | Date | Amount ($)a | Value ($) |
| Chemicals (continued) | | | | | |
| Huntsman International, | | | | | |
| Gtd. Notes | 8.63 | 3/15/20 | 4,500,000 | | 5,118,750 |
| Ineos Finance, | | | | | |
| Sr. Scd. Notes | 7.50 | 5/1/20 | 1,225,000 | b | 1,289,313 |
| Ineos Finance, | | | | | |
| Sr. Scd. Bonds | 8.38 | 2/15/19 | 3,240,000 | b | 3,503,250 |
| INEOS Group Holdings, | | | | | |
| Scd. Notes | 8.50 | 2/15/16 | 5,625,000 | b,c | 5,625,000 |
| OXEA Finance, | | | | | |
| Sr. Scd. Notes | 9.50 | 7/15/17 | 4,185,000 | b | 4,603,500 |
| PolyOne, | | | | | |
| Sr. Unscd. Notes | 7.38 | 9/15/20 | 5,115,000 | | 5,613,713 |
| Sawgrass Merger, | | | | | |
| Scd. Notes | 8.75 | 12/15/20 | 4,005,000 | b | 4,055,063 |
| | | | | | 33,354,726 |
| Construction Machinery—1.9% | | | | | |
| Ashtead Capital, | | | | | |
| Scd. Notes | 6.50 | 7/15/22 | 5,190,000 | b | 5,657,100 |
| H&E Equipment Services, | | | | | |
| Gtd. Notes | 7.00 | 9/1/22 | 5,225,000 | b | 5,590,750 |
| Manitowoc, | | | | | |
| Gtd. Notes | 8.50 | 11/1/20 | 4,430,000 | c | 4,994,825 |
| Manitowoc, | | | | | |
| Gtd. Notes | 9.50 | 2/15/18 | 1,240,000 | c | 1,385,700 |
| United Rentals North America, | | | | | |
| Gtd. Notes | 7.38 | 5/15/20 | 5,170,000 | b | 5,699,925 |
| United Rentals North America, | | | | | |
| Gtd. Notes | 9.25 | 12/15/19 | 2,715,000 | | 3,108,675 |
| | | | | | 26,436,975 |
| Consumer Cyclical Services—3.6% | | | | | |
| Brickman Group Holdings, | | | | | |
| Sr. Notes | 9.13 | 11/1/18 | 6,863,000 | b | 7,223,308 |
| Garda World Security, | | | | | |
| Sr. Unscd. Notes | 9.75 | 3/15/17 | 4,485,000 | b | 4,742,887 |
| Goodman Networks, | | | | | |
| Sr. Scd. Notes | 13.13 | 7/1/18 | 2,725,000 | b,d | 2,997,500 |
| Mobile Mini, | | | | | |
| Gtd. Notes | 7.88 | 12/1/20 | 5,800,000 | | 6,394,500 |
STATEMENT OF INVESTMENTS (continued)
| | | | | |
| | Coupon | Maturity | Principal | | |
| Bonds and Notes (continued) | Rate (%) | Date | Amount ($)a | Value ($) |
| Consumer Cyclical | | | | | |
| Services (continued) | | | | | |
| QVC, | | | | | |
| Sr. Scd. Notes | 7.38 | 10/15/20 | 2,435,000 | b | 2,710,985 |
| QVC, | | | | | |
| Sr. Scd. Notes | 7.50 | 10/1/19 | 4,450,000 | b | 4,911,790 |
| Reliance Intermediate Holdings, | | | | | |
| Sr. Scd. Notes | 9.50 | 12/15/19 | 5,580,000 | b | 6,361,200 |
| ServiceMaster, | | | | | |
| Gtd. Notes | 8.00 | 2/15/20 | 1,135,000 | | 1,188,912 |
| West, | | | | | |
| Gtd. Notes | 7.88 | 1/15/19 | 3,250,000 | | 3,380,000 |
| West, | | | | | |
| Gtd. Notes | 8.63 | 10/1/18 | 9,615,000 | | 10,119,788 |
| | | | | | 50,030,870 |
| Consumer Products—1.2% | | | | | |
| Albea Beauty Holdings, | | | | | |
| Sr. Scd. Notes | 8.38 | 11/1/19 | 5,465,000 | b | 5,792,900 |
| Good Sam Enterprises, | | | | | |
| Sr. Scd. Notes | 11.50 | 12/1/16 | 4,695,000 | | 5,047,125 |
| Libbey Glass, | | | | | |
| Sr. Scd. Notes | 6.88 | 5/15/20 | 3,620,000 | | 3,909,600 |
| Mead Products/ACCO Brands, | | | | | |
| Gtd. Notes | 6.75 | 4/30/20 | 2,455,000 | b,c | 2,590,025 |
| | | | | | 17,339,650 |
| Distributors—.6% | | | | | |
| Ferrellgas, | | | | | |
| Sr. Unscd. Notes | 9.13 | 10/1/17 | 2,500,000 | | 2,718,750 |
| Suburban Propane Partners, | | | | | |
| Sr. Unscd. Notes | 7.50 | 10/1/18 | 4,812,000 | | 5,208,990 |
| | | | | | 7,927,740 |
| Diversified Manufacturing—1.7% | | | | | |
| Dynacast International, | | | | | |
| Scd. Notes | 9.25 | 7/15/19 | 5,875,000 | | 6,315,625 |
| Griffon, | | | | | |
| Gtd. Notes | 7.13 | 4/1/18 | 6,080,000 | | 6,475,200 |
| RBS Global/Rexnord, | | | | | |
| Gtd. Notes | 8.50 | 5/1/18 | 4,145,000 | | 4,512,869 |
12
| | | | | | |
| | | Coupon | Maturity | Principal | | |
| Bonds and Notes (continued) | Rate (%) | Date | Amount ($)a | Value ($) |
| Diversified Manufacturing | | | | | | |
| (continued) | | | | | | |
| Silver II Borrower/ | | | | | | |
| Silver II US Holdings, | | | | | | |
| Sr. Unscd. Notes | | 7.75 | 12/15/20 | 3,790,000 | b | 3,941,600 |
| Tomkins, | | | | | | |
| Scd. Notes | | 9.00 | 10/1/18 | 1,599,000 | d | 1,798,875 |
| | | | | | | 23,044,169 |
| Electric—3.0% | | | | | | |
| AES, | | | | | | |
| Sr. Unscd. Notes | | 7.38 | 7/1/21 | 5,735,000 | | 6,394,525 |
| AES, | | | | | | |
| Sr. Unscd. Notes | | 9.75 | 4/15/16 | 3,765,000 | | 4,518,000 |
| Calpine, | | | | | | |
| Sr. Scd. Notes | | 7.50 | 2/15/21 | 5,166,000 | b | 5,734,260 |
| Calpine, | | | | | | |
| Sr. Scd. Notes | | 7.88 | 1/15/23 | 4,747,000 | b | 5,387,845 |
| GenOn Energy, | | | | | | |
| Sr. Unscd. Notes | | 9.50 | 10/15/18 | 6,675,000 | | 7,909,875 |
| NRG Energy, | | | | | | |
| Gtd. Notes | | 6.63 | 3/15/23 | 1,605,000 | b | 1,725,375 |
| NRG Energy, | | | | | | |
| Gtd. Notes | | 7.63 | 5/15/19 | 5,575,000 | | 5,993,125 |
| Techem Energy | | | | | | |
| Metering Service & Co., | | | | | | |
| Gtd. Notes | EUR | 7.88 | 10/1/20 | 2,430,000 | b | 3,528,247 |
| | | | | | | 41,191,252 |
| Energy—9.7% | | | | | | |
| Antero Resources Finance, | | | | | | |
| Gtd. Notes | | 7.25 | 8/1/19 | 4,125,000 | | 4,516,875 |
| Aurora USA Oil & Gas, | | | | | | |
| Gtd. Notes | | 9.88 | 2/15/17 | 6,330,000 | b | 6,804,750 |
| Berry Petroleum, | | | | | | |
| Sr. Unscd. Notes | | 6.38 | 9/15/22 | 2,790,000 | | 2,915,550 |
| Bristow Group, | | | | | | |
| Gtd. Notes | | 6.25 | 10/15/22 | 6,292,000 | | 6,756,035 |
| Chesapeake Energy, | | | | | | |
| Gtd. Notes | | 6.63 | 8/15/20 | 3,800,000 | c | 4,094,500 |
STATEMENT OF INVESTMENTS (continued)
| | | | | |
| | Coupon | Maturity | Principal | | |
| Bonds and Notes (continued) | Rate (%) | Date | Amount ($)a | Value ($) |
| Energy (continued) | | | | | |
| Chesapeake Energy, | | | | | |
| Gtd. Notes | 9.50 | 2/15/15 | 5,925,000 | | 6,724,875 |
| Continental Resources, | | | | | |
| Gtd. Notes | 5.00 | 9/15/22 | 2,625,000 | | 2,841,563 |
| Continental Resources, | | | | | |
| Gtd. Notes | 7.13 | 4/1/21 | 3,160,000 | | 3,586,600 |
| Dresser-Rand Group, | | | | | |
| Gtd. Notes | 6.50 | 5/1/21 | 3,565,000 | | 3,796,725 |
| Drill Rigs Holdings, | | | | | |
| Sr. Scd. Notes | 6.50 | 10/1/17 | 2,030,000 | b | 2,030,000 |
| Edgen Murray, | | | | | |
| Sr. Scd. Notes | 8.75 | 11/1/20 | 5,645,000 | b | 5,729,675 |
| EP Energy Finance, | | | | | |
| Sr. Scd. Notes | 6.88 | 5/1/19 | 3,670,000 | | 4,000,300 |
| EP Energy/Everest | | | | | |
| Acquisition Finance, | | | | | |
| Gtd. Notes | 7.75 | 9/1/22 | 1,625,000 | | 1,730,625 |
| EP Energy/Everest | | | | | |
| Acquisition Finance, | | | | | |
| Sr. Unscd. Notes | 9.38 | 5/1/20 | 3,065,000 | | 3,471,113 |
| Halcon Resources, | | | | | |
| Gtd. Notes | 8.88 | 5/15/21 | 880,000 | b | 937,200 |
| Halcon Resources, | | | | | |
| Gtd. Notes | 9.75 | 7/15/20 | 2,565,000 | b | 2,783,025 |
| Kodiak Oil & Gas, | | | | | |
| Gtd. Notes | 8.13 | 12/1/19 | 5,130,000 | | 5,681,475 |
| MEG Energy, | | | | | |
| Gtd. Notes | 6.50 | 3/15/21 | 8,460,000 | b | 8,946,450 |
| Northern Oil and Gas, | | | | | |
| Gtd. Notes | 8.00 | 6/1/20 | 5,635,000 | | 5,775,875 |
| Oasis Petroleum, | | | | | |
| Gtd. Notes | 6.50 | 11/1/21 | 1,165,000 | | 1,243,637 |
| Oasis Petroleum, | | | | | |
| Gtd. Notes | 6.88 | 1/15/23 | 2,330,000 | | 2,510,575 |
| Oasis Petroleum, | | | | | |
| Gtd. Notes | 7.25 | 2/1/19 | 5,680,000 | | 6,134,400 |
| Offshore Group Investment, | | | | | |
| Sr. Scd. Notes | 7.50 | 11/1/19 | 5,955,000 | b,c | 6,044,325 |
| Offshore Group Investment, | | | | | |
| Sr. Scd. Notes | 11.50 | 8/1/15 | 5,031,000 | | 5,496,367 |
14
| | | | | |
| | Coupon | Maturity | Principal | | |
| Bonds and Notes (continued) | Rate (%) | Date | Amount ($)a | Value ($) |
| Energy (continued) | | | | | |
| Precision Drilling, | | | | | |
| Gtd. Notes | 6.50 | 12/15/21 | 745,000 | | 797,150 |
| Precision Drilling, | | | | | |
| Gtd. Notes | 6.63 | 11/15/20 | 5,170,000 | | 5,583,600 |
| Range Resources, | | | | | |
| Gtd. Notes | 5.00 | 8/15/22 | 3,170,000 | | 3,328,500 |
| Trinidad Drilling, | | | | | |
| Sr. Unscd. Notes | 7.88 | 1/15/19 | 5,025,000 | b | 5,364,187 |
| Unit, | | | | | |
| Gtd. Notes | 6.63 | 5/15/21 | 8,750,000 | | 9,023,437 |
| Welltec, | | | | | |
| Sr. Scd. Notes | 8.00 | 2/1/19 | 5,885,000 | b | 6,267,525 |
| | | | | | 134,916,914 |
| Entertainment—.7% | | | | | |
| AMC Entertaiment, | | | | | |
| Gtd. Notes | 9.75 | 12/1/20 | 4,685,000 | | 5,434,600 |
| Cinemark USA, | | | | | |
| Gtd. Notes | 7.38 | 6/15/21 | 4,200,000 | | 4,662,000 |
| | | | | | 10,096,600 |
| Environmental—.9% | | | | | |
| ADS Waste Holdings, | | | | | |
| Sr. Unscd. Notes | 8.25 | 10/1/20 | 4,410,000 | b | 4,652,550 |
| Casella Waste Systems, | | | | | |
| Gtd. Notes | 7.75 | 2/15/19 | 1,080,000 | b | 1,031,400 |
| Casella Waste Systems, | | | | | |
| Gtd. Notes | 7.75 | 2/15/19 | 6,900,000 | | 6,589,500 |
| | | | | | 12,273,450 |
| Finance Companies—6.2% | | | | | |
| Ally Financial, | | | | | |
| Gtd. Notes | 7.50 | 9/15/20 | 5,080,000 | | 6,153,150 |
| Ally Financial, | | | | | |
| Gtd. Notes | 8.00 | 11/1/31 | 6,835,000 | | 8,688,994 |
| Ally Financial, | | | | | |
| Gtd. Notes | 8.30 | 2/12/15 | 4,600,000 | | 5,134,750 |
| CIT Group, | | | | | |
| Sr. Unscd. Notes | 5.50 | 2/15/19 | 16,435,000 | b | 17,996,325 |
| FTI Consulting, | | | | | |
| Gtd. Notes | 6.75 | 10/1/20 | 4,705,000 | | 5,046,112 |
STATEMENT OF INVESTMENTS (continued)
| | | | | |
| | Coupon | Maturity | Principal | | |
| Bonds and Notes (continued) | Rate (%) | Date | Amount ($)a | Value ($) |
| Finance Companies (continued) | | | | | |
| HSBC Finance Capital Trust IX, | | | | | |
| Gtd. Notes | 5.91 | 11/30/35 | 2,825,000 | d | 2,832,062 |
| Icahn Enterprises Finance, | | | | | |
| Gtd. Notes | 8.00 | 1/15/18 | 4,065,000 | | 4,385,119 |
| International Lease Finance, | | | | | |
| Sr. Unscd. Notes | 8.25 | 12/15/20 | 7,840,000 | | 9,368,800 |
| International Lease Finance, | | | | | |
| Sr. Unscd. Notes | 8.63 | 9/15/15 | 3,531,000 | d | 3,981,203 |
| International Lease Finance, | | | | | |
| Sr. Unscd. Notes | 8.63 | 1/15/22 | 2,545,000 | c | 3,155,800 |
| International Lease Finance, | | | | | |
| Sr. Unscd. Notes | 8.88 | 9/1/17 | 2,350,000 | | 2,773,188 |
| Ladder Capital Finance Holdings, | | | | | |
| Sr. Unscd. Notes | 7.38 | 10/1/17 | 5,355,000 | b | 5,529,038 |
| Nuveen Investments, | | | | | |
| Sr. Unscd. Notes | 9.13 | 10/15/17 | 6,735,000 | b | 6,650,813 |
| SLM, | | | | | |
| Sr. Unscd. Notes | 8.45 | 6/15/18 | 4,300,000 | | 5,052,500 |
| | | | | | 86,747,854 |
| Food & Beverages—1.7% | | | | | |
| Constellation Brands, | | | | | |
| Gtd. Notes | 6.00 | 5/1/22 | 2,590,000 | | 2,978,500 |
| Dean Foods, | | | | | |
| Gtd. Notes | 7.00 | 6/1/16 | 3,669,000 | c | 4,045,072 |
| Del Monte Foods, | | | | | |
| Gtd. Notes | 7.63 | 2/15/19 | 7,430,000 | c | 7,782,925 |
| Michael Foods Group, | | | | | |
| Gtd. Notes | 9.75 | 7/15/18 | 2,410,000 | | 2,675,100 |
| Post Holdings, | | | | | |
| Gtd. Notes | 7.38 | 2/15/22 | 5,525,000 | b | 6,080,953 |
| | | | | | 23,562,550 |
| Gaming—3.4% | | | | | |
| Ameristar Casinos, | | | | | |
| Gtd. Notes | 7.50 | 4/15/21 | 5,230,000 | | 5,694,162 |
| Boyd Acquisition, | | | | | |
| Gtd. Notes | 8.38 | 2/15/18 | 2,515,000 | b | 2,628,175 |
| Boyd Gaming, | | | | | |
| Gtd. Notes | 9.00 | 7/1/20 | 2,910,000 | b | 2,880,900 |
16
| | | | | | |
| | | Coupon | Maturity | Principal | | |
| Bonds and Notes (continued) | Rate (%) | Date | Amount ($)a | Value ($) |
| Gaming (continued) | | | | | | |
| Caesars Entertainment Operating, | | | | | |
| Scd. Notes | | 10.00 | 12/15/18 | 1,840,000 | | 1,228,200 |
| Caesars Entertainment Operating, | | | | | |
| Sr. Scd. Notes | | 11.25 | 6/1/17 | 3,605,000 | | 3,879,881 |
| Great Canadian Gaming, | | | | | | |
| Gtd. Notes | CAD | 6.63 | 7/25/22 | 5,330,000 | b | 5,579,433 |
| MGM Resorts International, | | | | | | |
| Gtd. Notes | | 10.00 | 11/1/16 | 3,870,000 | | 4,498,875 |
| MGM Resorts International, | | | | | | |
| Gtd. Notes | | 11.38 | 3/1/18 | 7,305,000 | | 8,875,575 |
| Penn National Gaming, | | | | | | |
| Sr. Sub. Notes | | 8.75 | 8/15/19 | 3,215,000 | | 3,681,175 |
| Pinnacle Entertainment, | | | | | | |
| Gtd. Notes | | 8.75 | 5/15/20 | 2,580,000 | | 2,799,300 |
| ROC Finance, | | | | | | |
| Scd. Notes | | 12.13 | 9/1/18 | 2,550,000 | b | 2,958,000 |
| Wynn Las Vegas, | | | | | | |
| First Mortgage Notes | | 7.75 | 8/15/20 | 2,860,000 | | 3,274,700 |
| | | | | | | 47,978,376 |
| Health Care—8.0% | | | | | | |
| Accellent, | | | | | | |
| Gtd. Notes | | 10.00 | 11/1/17 | 3,015,000 | | 2,494,912 |
| American Renal Holdings, | | | | | | |
| Sr. Scd. Notes | | 8.38 | 5/15/18 | 2,455,000 | | 2,596,162 |
| Biomet, | | | | | | |
| Gtd. Notes | | 6.50 | 8/1/20 | 1,840,000 | b | 1,961,900 |
| Biomet, | | | | | | |
| Gtd. Notes | | 6.50 | 10/1/20 | 10,330,000 | b | 10,317,087 |
| CDRT Holding, | | | | | | |
| Sr. Notes | | 9.25 | 10/1/17 | 4,395,000 | b | 4,504,875 |
| CHS/Community Health System, | | | | | |
| Sr. Scd. Notes | | 5.13 | 8/15/18 | 3,380,000 | | 3,532,100 |
| CHS/Community Health Systems, | | | | | |
| Gtd. Notes | | 7.13 | 7/15/20 | 3,120,000 | | 3,334,500 |
| CHS/Community Health Systems, | | | | | |
| Gtd. Notes | | 8.00 | 11/15/19 | 3,425,000 | | 3,724,688 |
| DaVita HealthCare Partners, | | | | | | |
| Gtd. Notes | | 5.75 | 8/15/22 | 685,000 | | 725,244 |
STATEMENT OF INVESTMENTS (continued)
| | | | | |
| | Coupon | Maturity | Principal | | |
| Bonds and Notes (continued) | Rate (%) | Date | Amount ($)a | Value ($) |
| Health Care (continued) | | | | | |
| DaVita HealthCare Partners, | | | | | |
| Gtd. Notes | 6.63 | 11/1/20 | 3,800,000 | | 4,151,500 |
| Emergency Medical Services, | | | | | |
| Gtd. Notes | 8.13 | 6/1/19 | 3,465,000 | | 3,822,328 |
| Fresenius Medical Care US Finance II, | | | | | |
| Gtd. Notes | 5.63 | 7/31/19 | 1,275,000 | b | 1,375,406 |
| Fresenius Medical Care US Finance, | | | | | |
| Gtd. Notes | 6.50 | 9/15/18 | 3,610,000 | b | 4,052,225 |
| HCA Holdings, | | | | | |
| Sr. Unscd. Notes | 6.25 | 2/15/21 | 2,150,000 | | 2,209,125 |
| HCA Holdings, | | | | | |
| Sr. Unscd. Notes | 7.75 | 5/15/21 | 7,595,000 | c | 8,278,550 |
| HCA, | | | | | |
| Sr. Scd. Notes | 4.75 | 5/1/23 | 3,370,000 | | 3,437,400 |
| HCA, | | | | | |
| Sr. Scd. Notes | 7.25 | 9/15/20 | 8,310,000 | | 9,244,875 |
| Health Management Associates, | | | | | |
| Sr. Scd. Notes | 6.13 | 4/15/16 | 1,120,000 | | 1,215,200 |
| Health Management Associates, | | | | | |
| Gtd. Notes | 7.38 | 1/15/20 | 1,315,000 | | 1,426,775 |
| HealthSouth, | | | | | |
| Gtd. Notes | 7.75 | 9/15/22 | 2,378,000 | | 2,618,773 |
| IASIS Healthcare, | | | | | |
| Gtd. Notes | 8.38 | 5/15/19 | 3,845,000 | | 3,652,750 |
| IMS Health, | | | | | |
| Sr. Unscd. Notes | 6.00 | 11/1/20 | 2,140,000 | b | 2,247,000 |
| Physio-Control International, | | | | | |
| Sr. Scd. Notes | 9.88 | 1/15/19 | 7,095,000 | b | 7,822,238 |
| STHI Holding, | | | | | |
| Scd. Notes | 8.00 | 3/15/18 | 2,175,000 | b | 2,365,313 |
| Tenet Healthcare, | | | | | |
| Sr. Scd. Notes | 6.25 | 11/1/18 | 6,410,000 | | 7,067,025 |
| Tenet Healthcare, | | | | | |
| Sr. Scd. Notes | 8.88 | 7/1/19 | 460,000 | | 517,500 |
| United Surgical Partners | | | | | |
| International, Gtd. Notes | 9.00 | 4/1/20 | 4,185,000 | | 4,666,275 |
| VPI Escrow, | | | | | |
| Gtd. Notes | 6.38 | 10/15/20 | 2,295,000 | b | 2,472,863 |
18
| | | | | |
| | Coupon | Maturity | Principal | | |
| Bonds and Notes (continued) | Rate (%) | Date | Amount ($)a | Value ($) |
| Health Care (continued) | | | | | |
| VWR Funding, | | | | | |
| Gtd. Notes | 7.25 | 9/15/17 | 5,270,000 | b,c | 5,559,850 |
| | | | | | 111,394,439 |
| Home Construction—2.0% | | | | | |
| Brookfield Residential, | | | | | |
| Gtd. Notes | 6.50 | 12/15/20 | 4,380,000 | b | 4,511,400 |
| Shea Homes Funding, | | | | | |
| Sr. Scd. Notes | 8.63 | 5/15/19 | 5,615,000 | | 6,232,650 |
| Standard Pacific, | | | | | |
| Gtd. Notes | 8.38 | 5/15/18 | 4,970,000 | | 5,790,050 |
| Taylor Morrison Communities, | | | | | |
| Gtd. Notes | 7.75 | 4/15/20 | 7,385,000 | b | 7,865,025 |
| William Lyon Homes, | | | | | |
| Gtd. Notes | 8.50 | 11/15/20 | 3,290,000 | b,c | 3,438,050 |
| | | | | | 27,837,175 |
| Industrial Services—2.5% | | | | | |
| Algeco Scotsman | | | | | |
| Global Finance, | | | | | |
| Sr. Scd. Notes | 8.50 | 10/15/18 | 2,590,000 | b | 2,693,600 |
| Algeco Scotsman Global Finance, | | | | | |
| Gtd. Notes | 10.75 | 10/15/19 | 3,440,000 | b | 3,405,600 |
| Hillman Group, | | | | | |
| Gtd. Notes | 10.88 | 6/1/18 | 3,800,000 | | 4,104,000 |
| Interline Brands, | | | | | |
| Sr. Unscd. Notes | 10.00 | 11/15/18 | 4,355,000 | b | 4,746,950 |
| Mueller Water Products, | | | | | |
| Gtd. Notes | 7.38 | 6/1/17 | 3,225,000 | | 3,345,937 |
| Mueller Water Products, | | | | | |
| Gtd. Notes | 8.75 | 9/1/20 | 2,034,000 | | 2,328,930 |
| Rexel, | | | | | |
| Gtd. Notes | 6.13 | 12/15/19 | 6,030,000 | b | 6,361,650 |
| WireCo WorldGroup, | | | | | |
| Gtd. Notes | 9.50 | 5/15/17 | 8,000,000 | | 8,520,000 |
| | | | | | 35,506,667 |
| Insurance—1.3% | | | | | |
| A-S Co-Issuer Subsidiary, | | | | | |
| Sr. Unscd. Notes | 7.88 | 12/15/20 | 665,000 | b | 668,325 |
STATEMENT OF INVESTMENTS (continued)
| | | | | | |
| | | Coupon | Maturity | Principal | | |
| Bonds and Notes (continued) | Rate (%) | Date | Amount ($)a | Value ($) |
| Insurance (continued) | | | | | | |
| Hub International, | | | | | | |
| Gtd. Notes | | 8.13 | 10/15/18 | 7,405,000 | b | 7,627,150 |
| Onex USI Acquisition, | | | | | | |
| Sr. Unscd. Notes | | 7.75 | 1/15/21 | 7,865,000 | b | 7,786,350 |
| ZFS Finance (USA) Trust V, | | | | | | |
| Jr. Sub. Cap. Secs | | 6.50 | 5/9/67 | 2,000,000 | b,d | 2,142,500 |
| | | | | | | 18,224,325 |
| Lodging—.4% | | | | | | |
| Host Hotels & Resorts, | | | | | | |
| Sr. Unscd. Notes | | 6.00 | 10/1/21 | 2,590,000 | | 2,984,975 |
| Royal Caribbean Cruises, | | | | | | |
| Sr. Unscd. Notes | | 5.25 | 11/15/22 | 2,755,000 | | 2,927,187 |
| | | | | | | 5,912,162 |
| Media Cable—4.1% | | | | | | |
| Cablevision Systems, | | | | | | |
| Sr. Unscd. Notes | | 8.63 | 9/15/17 | 2,435,000 | | 2,851,994 |
| CCO Holdings, | | | | | | |
| Gtd. Notes | | 6.63 | 1/31/22 | 1,835,000 | | 2,013,912 |
| CCO Holdings, | | | | | | |
| Gtd. Notes | | 7.38 | 6/1/20 | 2,525,000 | | 2,815,375 |
| Cequel Communications Holdings I, | | | | | |
| Sr. Unscd. Notes | | 6.38 | 9/15/20 | 7,540,000 | b | 7,888,725 |
| Dish DBS, | | | | | | |
| Sr. Unscd. Notes | | 5.00 | 3/15/23 | 6,975,000 | b | 7,009,875 |
| DISH DBS, | | | | | | |
| Gtd. Notes | | 7.13 | 2/1/16 | 5,040,000 | | 5,670,000 |
| Nara Cable Funding, | | | | | | |
| Sr. Scd. Notes | | 8.88 | 12/1/18 | 4,320,000 | b | 4,417,200 |
| Ono Finance II, | | | | | | |
| Gtd. Notes | | 10.88 | 7/15/19 | 3,465,000 | b | 3,326,400 |
| Unitymedia Hessen & Co., | | | | | | |
| Sr. Scd. Notes | | 7.50 | 3/15/19 | 6,600,000 | b | 7,293,000 |
| Unitymedia, | | | | | | |
| Gtd. Notes | EUR | 9.63 | 12/1/19 | 3,375,000 | | 5,009,487 |
| UPCB Finance V, | | | | | | |
| Sr. Scd. Notes | | 7.25 | 11/15/21 | 3,790,000 | b | 4,187,950 |
| Videotron, | | | | | | |
| Gtd. Notes | | 5.00 | 7/15/22 | 4,750,000 | | 5,005,312 |
| | | | | | | 57,489,230 |
20
| | | | | |
| | Coupon | Maturity | Principal | | |
| Bonds and Notes (continued) | Rate (%) | Date | Amount ($)a | Value ($) |
| Media Non-Cable—5.9% | | | | | |
| Allbritton Communications, | | | | | |
| Sr. Unscd. Notes | 8.00 | 5/15/18 | 5,505,000 | | 6,000,450 |
| AMC Networks, | | | | | |
| Gtd. Notes | 7.75 | 7/15/21 | 3,195,000 | | 3,674,250 |
| Cenveo, | | | | | |
| Scd. Notes | 8.88 | 2/1/18 | 845,000 | | 806,975 |
| Clear Channel Communications, | | | | | |
| Sr. Scd. Notes | 9.00 | 12/15/19 | 2,495,000 | b | 2,295,400 |
| Clear Channel Communications, | | | | | |
| Gtd. Notes | 10.75 | 8/1/16 | 2,225,000 | c | 1,691,000 |
| Clear Channel | | | | | |
| Worldwide Holdings, | | | | | |
| Gtd. Notes, Ser. A | 7.63 | 3/15/20 | 625,000 | | 626,562 |
| Clear Channel Worldwide Holdings, | | | | | |
| Gtd. Notes, Ser. B | 7.63 | 3/15/20 | 5,055,000 | | 5,118,188 |
| Clear Channel Worldwide, | | | | | |
| Gtd. Notes | 6.50 | 11/15/22 | 1,220,000 | b | 1,259,650 |
| Clear Channel Worldwide, | | | | | |
| Gtd. Notes | 6.50 | 11/15/22 | 2,500,000 | b | 2,606,250 |
| Cumulus Media Holdings, | | | | | |
| Gtd. Notes | 7.75 | 5/1/19 | 5,025,000 | c | 4,962,188 |
| Gray Television, | | | | | |
| Gtd. Notes | 7.50 | 10/1/20 | 4,410,000 | b,c | 4,531,275 |
| Hughes Satellite Systems, | | | | | |
| Gtd. Notes | 7.63 | 6/15/21 | 7,195,000 | | 8,220,288 |
| Intelsat Jackson Holdings, | | | | | |
| Gtd. Notes | 7.25 | 10/15/20 | 8,835,000 | b | 9,630,150 |
| Intelsat Luxembourg, | | | | | |
| Gtd. Notes | 11.25 | 2/4/17 | 9,650,000 | | 10,241,063 |
| LIN Television, | | | | | |
| Gtd. Notes | 6.38 | 1/15/21 | 2,185,000 | b | 2,305,175 |
| Nexstar Broadcasting, | | | | | |
| Gtd. Notes | 6.88 | 11/15/20 | 3,975,000 | b | 4,099,219 |
| Nexstar/Mission Broadcasting, | | | | | |
| Scd. Notes | 8.88 | 4/15/17 | 523,000 | | 576,608 |
| Salem Communications, | | | | | |
| Scd. Notes | 9.63 | 12/15/16 | 4,780,000 | | 5,317,750 |
| Sinclair Television Group, | | | | | |
| Sr. Unscd. Notes | 6.13 | 10/1/22 | 3,270,000 | b,c | 3,486,638 |
STATEMENT OF INVESTMENTS (continued)
| | | | | |
| | Coupon | Maturity | Principal | | |
| Bonds and Notes (continued) | Rate (%) | Date | Amount ($)a | Value ($) |
| Media Non-Cable (continued) | | | | | |
| Sinclair Television Group, | | | | | |
| Scd. Notes | 9.25 | 11/1/17 | 3,885,000 | b | 4,292,925 |
| | | | | | 81,742,004 |
| Metals & Mining—5.0% | | | | | |
| Alpha Natural Resources, | | | | | |
| Gtd. Notes | 9.75 | 4/15/18 | 3,440,000 | c | 3,732,400 |
| American Gilsonite, | | | | | |
| Sr. Scd. Notes | 11.50 | 9/1/17 | 4,615,000 | b | 4,776,525 |
| American Rock Salt, | | | | | |
| Scd. Notes | 8.25 | 5/1/18 | 580,000 | b | 527,800 |
| ArcelorMittal, | | | | | |
| Sr. Unscd. Notes | 5.00 | 2/25/17 | 3,230,000 | d | 3,263,369 |
| ArcelorMittal, | | | | | |
| Sr. Unscd. Notes | 5.75 | 8/5/20 | 1,850,000 | c,d | 1,856,542 |
| ArcelorMittal, | | | | | |
| Sr. Unscd. Notes | 6.00 | 3/1/21 | 465,000 | c,d | 464,407 |
| ArcelorMittal, | | | | | |
| Sr. Unscd. Notes | 6.75 | 2/25/22 | 1,505,000 | c,d | 1,582,217 |
| Arcelormittal, | | | | | |
| Sr. Unscd. Notes | 7.25 | 3/1/41 | 1,165,000 | d | 1,083,624 |
| ArcelorMittal, | | | | | |
| Sr. Unscd. Bonds | 10.35 | 6/1/19 | 8,717,000 | d | 10,467,574 |
| Calcipar, | | | | | |
| Sr. Scd. Notes | 6.88 | 5/1/18 | 5,540,000 | b | 5,678,500 |
| FMG Resources August 2006, | | | | | |
| Gtd. Notes | 6.88 | 4/1/22 | 3,050,000 | b,c | 3,130,062 |
| FMG Resources August 2006, | | | | | |
| Gtd. Notes | 8.25 | 11/1/19 | 5,905,000 | b,c | 6,318,350 |
| Global Brass & Copper, | | | | | |
| Sr. Scd. Notes | 9.50 | 6/1/19 | 2,745,000 | b | 2,992,050 |
| JMC Steel Group, | | | | | |
| Sr. Notes | 8.25 | 3/15/18 | 6,035,000 | b | 6,336,750 |
| Murray Energy, | | | | | |
| Scd. Notes | 10.25 | 10/15/15 | 605,000 | b | 589,875 |
| Rain CII Carbon, | | | | | |
| Gtd. Notes | 8.25 | 1/15/21 | 5,885,000 | b | 6,046,837 |
| Severstal Columbus, | | | | | |
| Sr. Scd. Notes | 10.25 | 2/15/18 | 9,750,000 | c | 10,310,625 |
| | | | | | 69,157,507 |
22
| | | | | | |
| | | Coupon | Maturity | Principal | | |
| Bonds and Notes (continued) | Rate (%) | Date | Amount ($)a | Value ($) |
| Packaging—4.7% | | | | | | |
| AEP Industries, | | | | | | |
| Sr. Unscd. Notes | | 8.25 | 4/15/19 | 3,020,000 | | 3,246,500 |
| ARD Finance, | | | | | | |
| Sr. Scd. Notes | | 11.13 | 6/1/18 | 5,136,507 | b | 5,470,380 |
| Ardagh Packaging Finance, | | | | | | |
| Sr. Scd. Notes | | 7.38 | 10/15/17 | 5,450,000 | b | 5,954,125 |
| Ardagh Packaging Finance, | | | | | | |
| Gtd. Notes | | 9.13 | 10/15/20 | 2,080,000 | b | 2,267,200 |
| Ardagh Packaging Finance, | | | | | | |
| Gtd. Notes | EUR | 9.25 | 10/15/20 | 2,000,000 | c | 2,888,068 |
| Beverage Packaging | | | | | | |
| Holdings Luxembourg II, | | | | | | |
| Scd. Notes | EUR | 8.00 | 12/15/16 | 950,000 | | 1,277,534 |
| BOE Merger, | | | | | | |
| Sr. Unscd. Notes | | 9.50 | 11/1/17 | 4,075,000 | b | 4,095,375 |
| BWAY Holding, | | | | | | |
| Gtd. Notes | | 10.00 | 6/15/18 | 2,380,000 | | 2,653,700 |
| Consolidated Container, | | | | | | |
| Gtd. Notes | | 10.13 | 7/15/20 | 4,410,000 | b | 4,740,750 |
| Plastipak Holdings, | | | | | | |
| Sr. Notes | | 10.63 | 8/15/19 | 3,240,000 | b | 3,717,900 |
| Reynolds Group, | | | | | | |
| Sr. Scd. Notes | | 7.88 | 8/15/19 | 6,205,000 | | 6,934,088 |
| Reynolds Group, | | | | | | |
| Gtd. Notes | | 8.50 | 5/15/18 | 8,850,000 | d | 9,115,500 |
| Reynolds Group, | | | | | | |
| Gtd. Notes | | 9.88 | 8/15/19 | 3,510,000 | | 3,773,250 |
| Sealed Air, | | | | | | |
| Gtd. Notes | | 8.13 | 9/15/19 | 6,870,000 | b | 7,763,100 |
| Sealed Air, | | | | | | |
| Gtd. Notes | | 8.38 | 9/15/21 | 1,095,000 | b | 1,256,512 |
| | | | | | | 65,153,982 |
| Paper—.7% | | | | | | |
| Ainsworth Lumber, | | | | | | |
| Sr. Scd. Notes | | 7.50 | 12/15/17 | 1,585,000 | b,c | 1,666,231 |
| Sappi Papier Holding, | | | | | | |
| Sr. Scd. Notes | | 7.75 | 7/15/17 | 2,195,000 | b,c | 2,400,781 |
| Sappi Papier Holding, | | | | | | |
| Sr. Scd. Notes | | 8.38 | 6/15/19 | 895,000 | b | 981,144 |
STATEMENT OF INVESTMENTS (continued)
| | | | | |
| | Coupon | Maturity | Principal | | |
| Bonds and Notes (continued) | Rate (%) | Date | Amount ($)a | Value ($) |
| Paper (continued) | | | | | |
| Smurfit Kappa Acquisitions, | | | | | |
| Sr. Scd. Notes | 4.88 | 9/15/18 | 4,119,000 | b | 4,221,975 |
| | | | | | 9,270,131 |
| Pipelines—1.0% | | | | | |
| El Paso, | | | | | |
| Gtd. Notes | 6.50 | 9/15/20 | 3,524,000 | | 3,996,685 |
| El Paso, | | | | | |
| Gtd. Notes | 7.80 | 8/1/31 | 1,665,000 | | 1,949,635 |
| Inergy Midstream, | | | | | |
| Gtd. Notes | 6.00 | 12/15/20 | 1,320,000 | b | 1,366,200 |
| MarkWest Energy Partners, | | | | | |
| Gtd. Notes | 6.25 | 6/15/22 | 1,700,000 | | 1,861,500 |
| Targa Resources Partners, | | | | | |
| Gtd. Notes | 6.88 | 2/1/21 | 3,940,000 | | 4,334,000 |
| | | | | | 13,508,020 |
| Retailers—1.1% | | | | | |
| CDR DB Sub, | | | | | |
| Sr. Unscd. Notes | 7.75 | 10/15/20 | 1,130,000 | b | 1,132,825 |
| J Crew Group, | | | | | |
| Gtd. Notes | 8.13 | 3/1/19 | 4,395,000 | c | 4,669,687 |
| Rite Aid, | | | | | |
| Gtd. Notes | 9.50 | 6/15/17 | 9,229,000 | c | 9,678,914 |
| | | | | | 15,481,426 |
| Technology—5.3% | | | | | |
| Cardtronics, | | | | | |
| Gtd. Notes | 8.25 | 9/1/18 | 6,030,000 | | 6,723,450 |
| CDW Finance, | | | | | |
| Sr. Scd. Notes | 8.00 | 12/15/18 | 4,890,000 | d | 5,434,012 |
| CDW Finance, | | | | | |
| Gtd. Notes | 8.50 | 4/1/19 | 1,714,000 | | 1,863,975 |
| Ceridian, | | | | | |
| Sr. Scd. Notes | 8.88 | 7/15/19 | 2,050,000 | b | 2,234,500 |
| Ceridian, | | | | | |
| Gtd. Notes | 11.25 | 11/15/15 | 485,000 | d | 487,425 |
| Ceridian, | | | | | |
| Gtd. Notes | 12.25 | 11/15/15 | 4,196,490 | | 4,227,964 |
| CommScope, | | | | | |
| Gtd. Notes | 8.25 | 1/15/19 | 7,415,000 | b | 8,156,500 |
24
| | | | | | |
| | | Coupon | Maturity | Principal | | |
| Bonds and Notes (continued) | Rate (%) | Date | Amount ($)a | Value ($) |
| Technology (continued) | | | | | | |
| Epicor Software, | | | | | | |
| Gtd. Notes | | 8.63 | 5/1/19 | 4,410,000 | | 4,652,550 |
| Equinix, | | | | | | |
| Sr. Unscd. Notes | | 7.00 | 7/15/21 | 200,000 | | 222,750 |
| Fidelity National Information | | | | | | |
| Services, Gtd. Notes | | 5.00 | 3/15/22 | 4,265,000 | | 4,595,537 |
| First Data, | | | | | | |
| Sr. Scd. Notes | | 6.75 | 11/1/20 | 680,000 | b | 690,200 |
| First Data, | | | | | | |
| Sr. Scd. Notes | | 7.38 | 6/15/19 | 2,795,000 | b | 2,906,800 |
| First Data, | | | | | | |
| Scd. Notes | | 8.25 | 1/15/21 | 4,479,000 | b | 4,501,395 |
| First Data, | | | | | | |
| Scd. Notes | | 8.75 | 1/15/22 | 3,000,000 | b | 3,082,500 |
| First Data, | | | | | | |
| Gtd. Notes | | 9.88 | 9/24/15 | 258,000 | | 263,805 |
| First Data, | | | | | | |
| Gtd. Notes | | 9.88 | 9/24/15 | 1,670,000 | c | 1,711,750 |
| First Data, | | | | | | |
| Gtd. Notes | | 10.55 | 9/24/15 | 2,585,000 | | 2,659,319 |
| Infor US, | | | | | | |
| Gtd. Notes | | 9.38 | 4/1/19 | 2,905,000 | | 3,275,387 |
| Infor US, | | | | | | |
| Gtd. Notes | EUR | 10.00 | 4/1/19 | 2,540,000 | b | 3,788,543 |
| Interactive Data, | | | | | | |
| Gtd. Notes | | 10.25 | 8/1/18 | 3,995,000 | | 4,499,369 |
| Sophia, | | | | | | |
| Gtd. Notes | | 9.75 | 1/15/19 | 1,690,000 | b | 1,829,425 |
| SunGard Data Systems, | | | | | | |
| Gtd. Notes | | 7.38 | 11/15/18 | 3,010,000 | | 3,239,513 |
| TransUnion Holding, | | | | | | |
| Sr. Unscd. Notes | | 9.63 | 6/15/18 | 2,960,000 | | 3,145,000 |
| | | | | | | 74,191,669 |
| Transportation Services—1.3% | | | | | |
| American Petroleum Tankers Parent, | | | | | |
| Sr. Scd. Notes | | 10.25 | 5/1/15 | 4,287,000 | | 4,501,350 |
| Marquette Transportation Finance, | | | | | |
| Scd. Notes | | 10.88 | 1/15/17 | 6,565,000 | | 6,860,425 |
STATEMENT OF INVESTMENTS (continued)
| | | | | |
| | Coupon | Maturity | Principal | | |
| Bonds and Notes (continued) | Rate (%) | Date | Amount ($)a | Value ($) |
| Transportation | | | | | |
| Services (continued) | | | | | |
| Navios | | | | | |
| Maritime Acquisition, | | | | | |
| Sr. Scd. Notes | 8.63 | 11/1/17 | 1,440,000 | c | 1,357,200 |
| Navios Maritime Holdings, | | | | | |
| Sr. Scd. Notes | 8.88 | 11/1/17 | 2,005,000 | c | 2,010,012 |
| Navios South | | | | | |
| American Logistics, | | | | | |
| Gtd. Notes | 9.25 | 4/15/19 | 3,015,000 | c | 2,973,544 |
| | | | | | 17,702,531 |
| Wireless | | | | | |
| Communications—3.7% | | | | | |
| Digicel Group, | | | | | |
| Sr. Unscd. Notes | 8.25 | 9/30/20 | 5,575,000 | b | 6,160,375 |
| Digicel Group, | | | | | |
| Sr. Unscd. Notes | 10.50 | 4/15/18 | 1,408,000 | b | 1,562,880 |
| Digicel, | | | | | |
| Sr. Unscd. Notes | 8.25 | 9/1/17 | 2,955,000 | b | 3,191,400 |
| Eileme 2 AB, | | | | | |
| Sr. Scd. Notes | 11.63 | 1/31/20 | 6,085,000 | b | 7,149,875 |
| Sprint Capital, | | | | | |
| Gtd. Notes | 6.88 | 11/15/28 | 2,000,000 | | 2,090,000 |
| Sprint Capital, | | | | | |
| Gtd. Notes | 8.75 | 3/15/32 | 3,180,000 | | 3,903,450 |
| Sprint Nextel, | | | | | |
| Sr. Unscd. Notes | 6.00 | 11/15/22 | 3,395,000 | | 3,505,337 |
| Sprint Nextel, | | | | | |
| Gtd. Notes | 7.00 | 3/1/20 | 3,870,000 | b | 4,508,550 |
| Sprint Nextel, | | | | | |
| Sr. Unscd. Notes | 7.00 | 8/15/20 | 1,655,000 | | 1,816,362 |
| Sprint Nextel, | | | | | |
| Gtd. Notes | 9.00 | 11/15/18 | 5,185,000 | b | 6,416,437 |
| Sprint Nextel, | | | | | |
| Sr. Unscd. Notes | 11.50 | 11/15/21 | 2,525,000 | | 3,443,469 |
| Wind Acquisition Finance, | | | | | |
| Sr. Scd. Notes | 7.25 | 2/15/18 | 3,215,000 | b | 3,271,263 |
| Wind Acquisition Finance, | | | | | |
| Scd. Notes | 11.75 | 7/15/17 | 1,995,000 | b | 2,099,737 |
26
| | | | | | | |
| | | Coupon | Maturity | Principal | | | |
| Bonds and Notes (continued) | Rate (%) | Date | Amount ($)a | | Value ($) |
| Wireless | | | | | | | |
| Communications (continued) | | | | | | |
| Wind Acquisition Finance, | | | | | | | |
| Scd. Notes | EUR | 11.75 | 7/15/17 | 2,165,000 | c | | 3,007,738 |
| | | | | | | | 52,126,873 |
| Wireline Communications—2.6% | | | | | | |
| Cincinnati Bell, | | | | | | | |
| Gtd. Notes | | 8.38 | 10/15/20 | 7,520,000 | | | 8,178,000 |
| Level 3 Financing, | | | | | | | |
| Gtd. Notes | | 8.13 | 7/1/19 | 1,225,000 | | | 1,341,375 |
| Level 3 Financing, | | | | | | | |
| Gtd. Notes | | 8.63 | 7/15/20 | 8,100,000 | | | 9,021,375 |
| Sable International Finance, | | | | | | | |
| Sr. Scd. Notes | | 8.75 | 2/1/20 | 4,990,000 | b,c | | 5,738,500 |
| Windstream, | | | | | | | |
| Gtd. Notes | | 7.75 | 10/15/20 | 10,045,000 | | | 10,898,825 |
| Zayo Group, | | | | | | | |
| Sr. Scd. Notes | | 8.13 | 1/1/20 | 575,000 | | | 642,563 |
| | | | | | | | 35,820,638 |
| Total Bonds and Notes | | | | | | | |
| (cost $1,253,738,436) | | | | | | | 1,332,202,121 |
| |
| Preferred Stocks—.3% | | | | Shares | | | Value ($) |
| Finance Companies | | | | | | | |
| GMAC Capital Trust I, | | | | | | | |
| Ser. 2, Cum. $2.03 | | | | | | | |
| (cost $4,475,208) | | | | 172,552 | d | 4,598,511 |
| | | | | Principal | | | |
| Short-Term Investments—.0% | | | Amount ($) | | | Value ($) |
| U.S. Treasury Bills; | | | | | | | |
| 0.13%, 2/7/13 | | | | | | | |
| (cost $59,992) | | | | 60,000 | | | 59,998 |
| |
| Other Investment—2.3% | | | | Shares | | | Value ($) |
| Registered Investment Company; | | | | | | |
| Dreyfus Institutional Preferred Plus Money Market Fund | | | | |
| (cost $31,716,999) | | | | 31,716,999 | e | 31,716,999 |
STATEMENT OF INVESTMENTS (continued)
| | | | |
| Investment of Cash Collateral | | | | |
| for Securities Loaned—7.0% | Shares | | Value ($) | |
| Registered Investment Company; | | | | |
| Dreyfus Institutional Cash Advantage Fund | | | | |
| (cost $96,805,579) | 96,805,579 | e | 96,805,579 | |
| Total Investments (cost $1,386,796,214) | 105.3 | % | 1,465,383,208 | |
| Liabilities, Less Cash and Receivables | (5.3 | %) | (74,325,988 | ) |
| Net Assets | 100.0 | % | 1,391,057,220 | |
|
| a Principal amount stated in U.S. Dollars unless otherwise noted. |
| CAD—Canadian Dollar |
| EUR—Euro |
| GBP—British Pound |
| b Securities exempt from registration pursuant to Rule 144A under the Securities Act of 1933.These securities may be |
| resold in transactions exempt from registration, normally to qualified institutional buyers.At December 31, 2012, |
| these securities were valued at $545,717,473 or 39.2% of net assets. |
| c Security, or portion thereof, on loan.At December 31, 2012, the value of the fund’s securities on loan was |
| $93,045,274 and the value of the collateral held by the fund was $96,805,579. |
| d Variable rate security—interest rate subject to periodic change. |
| e Investment in affiliated money market mutual fund. |
| | | |
| Portfolio Summary (Unaudited)† | | |
| |
| | Value (%) | | Value (%) |
| Corporate Bonds | 95.7 | Preferred Stocks | .3 |
| Short-Term/ | | | |
| Money Market Investments | 9.3 | | 105.3 |
| |
| † Based on net assets. | | | |
| See notes to financial statements. | | | |
28
STATEMENT OF ASSETS AND LIABILITIES
December 31, 2012
| | | | |
| | | Cost | Value | |
| Assets ($): | | | | |
| Investments in securities—See Statement of Investments (including | | | |
| securities on loan, valued at $93,045,274)—Note 1(c): | | | |
| Unaffiliated issuers | | 1,258,273,636 | 1,336,860,630 | |
| Affiliated issuers | | 128,522,578 | 128,522,578 | |
| Cash denominated in foreign currencies | | 1,520,040 | 1,526,208 | |
| Dividends, interest and securities lending income receivable | | 25,460,635 | |
| Receivable for shares of Beneficial Interest subscribed | | 2,677,084 | |
| Unrealized appreciation on forward foreign | | | | |
| currency exchange contracts—Note 4 | | | 66,067 | |
| | | | 1,495,113,202 | |
| Liabilities ($): | | | | |
| Due to The Dreyfus Corporation and affiliates—Note 3(b) | | 983,008 | |
| Cash overdraft due to Custodian | | | 2,435,002 | |
| Liability for securities on loan—Note 1(c) | | | 96,805,579 | |
| Payable for shares of Beneficial Interest redeemed | | | 3,545,519 | |
| Unrealized depreciation on forward foreign | | | | |
| currency exchange contracts—Note 4 | | | 275,505 | |
| Payable for investment securities purchased | | | 3,762 | |
| Accured expenses | | | 7,607 | |
| | | | 104,055,982 | |
| Net Assets ($) | | | 1,391,057,220 | |
| Composition of Net Assets ($): | | | | |
| Paid-in capital | | | 1,419,566,820 | |
| Accumulated undistributed investment income—net | | | 838,286 | |
| Accumulated net realized gain (loss) on investments | | (107,741,236 | ) |
| Accumulated net unrealized appreciation (depreciation) | | | |
| on investments and foreign currency transactions | | 78,393,350 | |
| Net Assets ($) | | | 1,391,057,220 | |
| |
| |
| Net Asset Value Per Share | | | | |
| | Class A | Class C | Class I | |
| Net Assets ($) | 360,127,833 | 123,693,183 | 907,236,204 | |
| Shares Outstanding | 54,018,824 | 18,548,856 | 135,978,610 | |
| Net Asset Value Per Share ($) | 6.67 | 6.67 | 6.67 | |
| |
| See notes to financial statements. | | | | |
STATEMENT OF OPERATIONS
Year Ended December 31, 2012
| | |
| Investment Income ($): | | |
| Income: | | |
| Interest | 89,299,734 | |
| Income from securities lending—Note 1(c) | 585,069 | |
| Dividends: | | |
| Unaffiliated issuers | 450,600 | |
| Affiliated issuers | 72,304 | |
| Total Income | 90,407,707 | |
| Expenses: | | |
| Management fee—Note 3(a) | 8,689,831 | |
| Distribution/Service Plan fees—Note 3(b) | 2,135,651 | |
| Trustees’ fees—Notes 3(a,d) | 94,509 | |
| Loan commitment fees—Note 2 | 10,118 | |
| Total Expenses | 10,930,109 | |
| Less—Trustees’ fees reimbursed by the Manager—Note 3(a) | (94,509 | ) |
| Net Expenses | 10,835,600 | |
| Investment Income—Net | 79,572,107 | |
| Realized and Unrealized Gain (Loss) on Investments—Note 4 ($): | | |
| Net realized gain (loss) on investments and foreign currency transactions | (2,957,159 | ) |
| Net realized gain (loss) on forward foreign currency exchange contracts | (93,380 | ) |
| Net Realized Gain (Loss) | (3,050,539 | ) |
| Net unrealized appreciation (depreciation) on | | |
| investments and foreign currency transactions | 91,107,814 | |
| Net unrealized appreciation (depreciation) on | | |
| forward foreign currency exchange transactions | (285,326 | ) |
| Net Unrealized Appreciation (Depreciation) | 90,822,488 | |
| Net Realized and Unrealized Gain (Loss) on Investments | 87,771,949 | |
| Net Increase in Net Assets Resulting from Operations | 167,344,056 | |
| |
| See notes to financial statements. | | |
30
STATEMENT OF CHANGES IN NET ASSETS
| | | | |
| | Year Ended December 31, | |
| | 2012 | a | 2011 | |
| Operations ($): | | | | |
| Investment income—net | 79,572,107 | | 78,174,534 | |
| Net realized gain (loss) on investments | (3,050,539 | ) | 7,818,566 | |
| Net unrealized appreciation | | | | |
| (depreciation) on investments | 90,822,488 | | (68,339,253 | ) |
| Net Increase (Decrease) in Net Assets | | | | |
| Resulting from Operations | 167,344,056 | | 17,653,847 | |
| Dividends to Shareholders from ($): | | | | |
| Investment income—net: | | | | |
| Class A Shares | (23,836,494 | ) | (27,635,290 | ) |
| Class B Shares | (29,726 | ) | (409,291 | ) |
| Class C Shares | (7,267,383 | ) | (8,787,269 | ) |
| Class I Shares | (51,923,666 | ) | (43,654,301 | ) |
| Total Dividends | (83,057,269 | ) | (80,486,151 | ) |
| Beneficial Interest Transactions ($): | | | | |
| Net proceeds from shares sold: | | | | |
| Class A Shares | 153,542,445 | | 136,806,926 | |
| Class B Shares | 652 | | 135,638 | |
| Class C Shares | 14,868,027 | | 19,892,056 | |
| Class I Shares | 463,622,267 | | 303,522,777 | |
| Dividends reinvested: | | | | |
| Class A Shares | 19,235,313 | | 22,549,790 | |
| Class B Shares | 19,736 | | 307,000 | |
| Class C Shares | 4,359,511 | | 5,112,982 | |
| Class I Shares | 18,949,417 | | 17,568,875 | |
| Cost of shares redeemed: | | | | |
| Class A Shares | (176,535,171 | ) | (145,107,966 | ) |
| Class B Shares | (2,713,460 | ) | (7,643,267 | ) |
| Class C Shares | (22,916,809 | ) | (26,533,193 | ) |
| Class I Shares | (202,560,483 | ) | (255,548,488 | ) |
| Increase (Decrease) in Net Assets from | | | | |
| Beneficial Interest Transactions | 269,871,445 | | 71,063,130 | |
| Total Increase (Decrease) in Net Assets | 354,158,232 | | 8,230,826 | |
| Net Assets ($): | | | | |
| Beginning of Period | 1,036,898,988 | | 1,028,668,162 | |
| End of Period | 1,391,057,220 | | 1,036,898,988 | |
| Undistributed investment income—net | 838,286 | | 493,825 | |
STATEMENT OF CHANGES IN NET ASSETS (continued)
| | | | |
| | Year Ended December 31, | |
| | 2012 | a | 2011 | |
| Capital Share Transactions: | | | | |
| Class Ab | | | | |
| Shares sold | 23,971,040 | | 21,019,936 | |
| Shares issued for dividends reinvested | 2,969,777 | | 3,465,683 | |
| Shares redeemed | (27,476,194 | ) | (22,322,755 | ) |
| Net Increase (Decrease) in Shares Outstanding | (535,377 | ) | 2,162,864 | |
| Class Bb | | | | |
| Shares sold | 102 | | 20,551 | |
| Shares issued for dividends reinvested | 3,078 | | 46,596 | |
| Shares redeemed | (422,169 | ) | (1,159,478 | ) |
| Net Increase (Decrease) in Shares Outstanding | (418,989 | ) | (1,092,331 | ) |
| Class C | | | | |
| Shares sold | 2,306,667 | | 3,065,892 | |
| Shares issued for dividends reinvested | 672,978 | | 786,919 | |
| Shares redeemed | (3,538,459 | ) | (4,113,629 | ) |
| Net Increase (Decrease) in Shares Outstanding | (558,814 | ) | (260,818 | ) |
| Class I | | | | |
| Shares sold | 71,783,224 | | 47,556,680 | |
| Shares issued for dividends reinvested | 2,919,459 | | 2,691,602 | |
| Shares redeemed | (31,519,231 | ) | (39,608,483 | ) |
| Net Increase (Decrease) in Shares Outstanding | 43,183,452 | | 10,639,799 | |
|
| a Effective as of the close of business on March 13, 2012, the fund no longer offers Class B shares. |
| b During the period ended December 31, 2012, 159,411 Class B shares representing $1,025,594 were automatically |
| converted to 159,411 Class A shares and during the period ended December 31, 2011, 367,643 Class B shares |
| representing $2,440,186 were automatically converted to 361,726 Class A shares. |
See notes to financial statements.
32
FINANCIAL HIGHLIGHTS
The following tables describe the performance for each share class for the fiscal periods indicated.All information (except portfolio turnover rate) reflects financial results for a single fund share.Total return shows how much your investment in the fund would have increased (or decreased) during each period, assuming you had reinvested all dividends and distributions.These figures have been derived from the fund’s financial statements.
| | | | | | | | | | |
| | | | Year Ended December 31, | | | |
| Class A Shares | 2012 | | 2011 | | 2010 | | 2009 | | 2008 | |
| Per Share Data ($): | | | | | | | | | | |
| Net asset value, beginning of period | 6.21 | | 6.62 | | 6.48 | | 5.06 | | 6.92 | |
| Investment Operations: | | | | | | | | | | |
| Investment income—neta | .41 | | .49 | | .59 | | .54 | | .50 | |
| Net realized and unrealized | | | | | | | | | | |
| gain (loss) on investments | .48 | | (.40 | ) | .17 | | 1.43 | | (1.82 | ) |
| Total from Investment Operations | .89 | | .09 | | .76 | | 1.97 | | (1.32 | ) |
| Distributions: | | | | | | | | | | |
| Dividends from investment income—net | (.43 | ) | (.50 | ) | (.62 | ) | (.55 | ) | (.54 | ) |
| Net asset value, end of period | 6.67 | | 6.21 | | 6.62 | | 6.48 | | 5.06 | |
| Total Return (%)b | 14.74 | | 1.33 | | 12.50 | | 40.43 | | (20.17 | ) |
| Ratios/Supplemental Data (%): | | | | | | | | | | |
| Ratio of total expenses | | | | | | | | | | |
| to average net assets | .96 | | .96 | | .96 | | .96 | | .96 | |
| Ratio of net expenses | | | | | | | | | | |
| to average net assets | .95 | | .95 | | .95 | | .95 | | .95 | |
| Ratio of net investment income | | | | | | | | | | |
| to average net assets | 6.35 | | 7.50 | | 9.05 | | 8.86 | | 7.89 | |
| Portfolio Turnover Rate | 51.72 | | 75.87 | | 70.07 | | 77.94 | | 48.85 | |
| Net Assets, end of period ($ x 1,000) | 360,128 | | 338,800 | | 346,594 | | 360,921 | | 119,560 | |
| |
| a | Based on average shares outstanding at each month end. |
| b | Exclusive of sales charge. |
See notes to financial statements.
FINANCIAL HIGHLIGHTS (continued)
| | | | | | | | | | |
| | | | Year Ended December 31, | | | |
| Class C Shares | 2012 | | 2011 | | 2010 | | 2009 | | 2008 | |
| Per Share Data ($): | | | | | | | | | | |
| Net asset value, beginning of period | 6.21 | | 6.62 | | 6.48 | | 5.06 | | 6.93 | |
| Investment Operations: | | | | | | | | | | |
| Investment income—neta | .36 | | .44 | | .54 | | .50 | | .45 | |
| Net realized and unrealized | | | | | | | | | | |
| gain (loss) on investments | .48 | | (.40 | ) | .18 | | 1.42 | | (1.83 | ) |
| Total from Investment Operations | .84 | | .04 | | .72 | | 1.92 | | (1.38 | ) |
| Distributions: | | | | | | | | | | |
| Dividends from investment income—net | (.38 | ) | (.45 | ) | (.58 | ) | (.50 | ) | (.49 | ) |
| Net asset value, end of period | 6.67 | | 6.21 | | 6.62 | | 6.48 | | 5.06 | |
| Total Return (%)b | 13.89 | | .58 | | 11.66 | | 39.41 | | (20.89 | ) |
| Ratios/Supplemental Data (%): | | | | | | | | | | |
| Ratio of total expenses | | | | | | | | | | |
| to average net assets | 1.71 | | 1.71 | | 1.71 | | 1.71 | | 1.71 | |
| Ratio of net expenses | | | | | | | | | | |
| to average net assets | 1.70 | | 1.70 | | 1.70 | | 1.70 | | 1.70 | |
| Ratio of net investment income | | | | | | | | | | |
| to average net assets | 5.60 | | 6.76 | | 8.31 | | 8.15 | | 7.12 | |
| Portfolio Turnover Rate | 51.72 | | 75.87 | | 70.07 | | 77.94 | | 48.85 | |
| Net Assets, end of period ($ x 1,000) | 123,693 | | 118,706 | | 128,173 | | 125,724 | | 34,374 | |
| |
| a | Based on average shares outstanding at each month end. |
| b | Exclusive of sales charge. |
See notes to financial statements.
34
| | | | | | | | | | |
| | | | Year Ended December 31, | | | |
| Class I Shares | 2012 | | 2011 | | 2010 | | 2009 | | 2008 | |
| Per Share Data ($): | | | | | | | | | | |
| Net asset value, beginning of period | 6.22 | | 6.62 | | 6.49 | | 5.06 | | 6.92 | |
| Investment Operations: | | | | | | | | | | |
| Investment income—neta | .43 | | .50 | | .60 | | .54 | | .51 | |
| Net realized and unrealized | | | | | | | | | | |
| gain (loss) on investments | .47 | | (.38 | ) | .17 | | 1.45 | | (1.82 | ) |
| Total from Investment Operations | .90 | | .12 | | .17 | | 1.99 | | (1.31 | ) |
| Distributions: | | | | | | | | | | |
| Dividends from investment income—net | (.45 | ) | (.52 | ) | (.64 | ) | (.56 | ) | (.55 | ) |
| Net asset value, end of period | 6.67 | | 6.22 | | 6.62 | | 6.49 | | 5.06 | |
| Total Return (%) | 14.84 | | 1.74 | | 12.59 | | 40.99 | | (20.06 | ) |
| Ratios/Supplemental Data (%): | | | | | | | | | | |
| Ratio of total expenses | | | | | | | | | | |
| to average net assets | .71 | | .71 | | .71 | | .71 | | .72 | |
| Ratio of net expenses | | | | | | | | | | |
| to average net assets | .70 | | .70 | | .70 | | .70 | | .69 | |
| Ratio of net investment income | | | | | | | | | | |
| to average net assets | 6.57 | | 7.73 | | 9.26 | | 9.20 | | 9.43 | |
| Portfolio Turnover Rate | 51.72 | | 75.87 | | 70.07 | | 77.94 | | 48.85 | |
| Net Assets, end of period ($ x 1,000) | 907,236 | | 576,790 | | 543,899 | | 400,170 | | 183,546 | |
|
| a Based on average shares outstanding at each month end. |
| See notes to financial statements. |
NOTES TO FINANCIAL STATEMENTS
NOTE 1-Significant Accounting Policies:
Dreyfus HighYield Fund (the “fund”) is a separate diversified series of The Dreyfus/Laurel Funds Trust (the “Trust”), which is registered under the Investment Company Act of 1940, as amended (the “Act”), as an open-end management investment company and operates as a series company currently offering five series, including the fund.The fund’s investment objective seeks to maximize total return, consisting of capital appreciation and current income.The Dreyfus Corporation (the “Manager” or “Dreyfus”), a wholly-owned subsidiary of The Bank of New York Mellon Corporation (“BNY Mellon”), serves as the fund’s investment adviser.
MBSC Securities Corporation (the “Distributor”), a wholly-owned subsidiary of the Manager, is the distributor of the fund’s shares. The fund is authorized to issue an unlimited number of $.001 par value of Beneficial Interest in each of the following classes of shares: Class A, Class C and Class I. Class A and Class C shares are sold primarily to retail investors through financial intermediaries and bear a distribution fee and/or shareholder services fee. Class A shares are subject to a sales charge imposed at the time of purchase. Class C shares are subject to a contingent deferred sales charge (“CDSC”) imposed on Class C shares redeemed within one year of purchase. Class I shares are sold primarily to bank trust departments and other financial service providers (including The Bank of New York Mellon, a subsidiary of BNY Mellon and an affiliate of Dreyfus, and its affiliates), acting on behalf of customers having a qualified trust or investment account or relationship at such institution, and bear no Distribution Plans or Service Plan fees. Class I shares are offered without a front-end sales charge or CDSC. Class B shares were subject to a CDSC imposed on Class B share redemptions made within six years of purchase and automatically converted to Class A shares after six years. The fund no longer offers Class B shares. Effective March 13, 2012, all outstanding Class B shares were automatically converted to Class A shares. Other differences between the classes include the services offered to and the expenses borne by each class, the
36
allocation of certain transfer agency costs and certain voting rights. Income, expenses (other than expenses attributable to a specific class), and realized and unrealized gains or losses on investments are allocated to each class of shares based on its relative net assets.
The Trust accounts separately for the assets, liabilities and operations of each series. Expenses directly attributable to each series are charged to that series’ operations; expenses which are applicable to all series are allocated among them on a pro rata basis.
The Financial Accounting Standards Board (“FASB”) Accounting Standards Codification is the exclusive reference of authoritative U.S. generally accepted accounting principles (“GAAP”) recognized by the FASB to be applied by nongovernmental entities. Rules and interpretive releases of the Securities and Exchange Commission (“SEC”) under authority of federal laws are also sources of authoritative GAAP for SEC registrants. The fund’s financial statements are prepared in accordance with GAAP, which may require the use of management estimates and assumptions.Actual results could differ from those estimates.
(a) Portfolio valuation: The fair value of a financial instrument is the amount that would be received to sell an asset or paid to transfer a liability in an orderly transaction between market participants at the measurement date (i.e., the exit price). GAAP establishes a fair value hierarchy that prioritizes the inputs of valuation techniques used to measure fair value.This hierarchy gives the highest priority to unadjusted quoted prices in active markets for identical assets or liabilities (Level 1 measurements) and the lowest priority to unobservable inputs (Level 3 measurements).
Additionally, GAAP provides guidance on determining whether the volume and activity in a market has decreased significantly and whether such a decrease in activity results in transactions that are not orderly. GAAP requires enhanced disclosures around valuation inputs and techniques used during annual and interim periods.
NOTES TO FINANCIAL STATEMENTS (continued)
Various inputs are used in determining the value of the fund’s investments relating to fair value measurements.These inputs are summarized in the three broad levels listed below:
Level 1—unadjusted quoted prices in active markets for identical investments.
Level 2—other significant observable inputs (including quoted prices for similar investments, interest rates, prepayment speeds, credit risk, etc.).
Level 3—significant unobservable inputs (including the fund’s own assumptions in determining the fair value of investments).
The inputs or methodology used for valuing securities are not necessarily an indication of the risk associated with investing in those securities.
Changes in valuation techniques may result in transfers in or out of an assigned level within the disclosure hierarchy. Valuation techniques used to value the fund’s investments are as follows:
Registered investment companies that are not traded on an exchange are valued at their net asset value and are categorized within Level 1 of the fair value hierarchy.
Investments in securities, excluding short-term investments (other than U.S. Treasury Bills) and forward foreign currency exchange contracts (“forward contracts”) are valued each business day by an independent pricing service (the “Service”) approved by the Trust’s Board of Trustees (the “Board”). Investments for which quoted bid prices are readily available and are representative of the bid side of the market in the judgment of the Service are valued at the mean between the quoted bid prices (as obtained by the Service from dealers in such securities) and asked prices (as calculated by the Service based upon its evaluation of the market for such securities). Other investments (which constitute a majority of the portfolio securities) are valued as determined by the Service, based on methods which include consideration of the following: yields or prices of securities of comparable quality, coupon,
38
maturity and type; indications as to values from dealers; and general market conditions. These securities are generally categorized within Level 2 of the fair value hierarchy.
U.S. Treasury Bills are valued at the mean price between quoted bid prices and asked prices by the Service. These securities are generally categorized within Level 2 of the fair value hierarchy.
The Service’s procedures are reviewed by Dreyfus under the general supervision of the Board.
When market quotations or official closing prices are not readily available, or are determined not to reflect accurately fair value, such as when the value of a security has been significantly affected by events after the close of the exchange or market on which the security is principally traded (for example, a foreign exchange or market), but before the fund calculates its net asset value, the fund may value these investments at fair value as determined in accordance with the procedures approved by the Board. Certain factors may be considered when fair valuing investments such as: fundamental analytical data, the nature and duration of restrictions on disposition, an evaluation of the forces that influence the market in which the securities are purchased and sold, and public trading in similar securities of the issuer or comparable issuers. These securities are either categorized within Level 2 or 3 depending on the relevant inputs used.
For restricted securities where observable inputs are limited, assumptions about market activity and risk are used and are categorized within Level 3 of the fair value hierarchy.
Investments denominated in foreign currencies are translated to U.S. dollars at the prevailing rates of exchange.
Forward contracts are valued at the forward rate. These securities are generally categorized within Level 2 of the fair value hierarchy.
NOTES TO FINANCIAL STATEMENTS (continued)
The following is a summary of the inputs used as of December 31, 2012 in valuing the fund’s investments:
| | | | | | |
| | | Level 2—Other | | Level 3— | | |
| | Level 1— | Significant | | Significant | | |
| | Unadjusted | Observable | | Unobservable | | |
| | Quoted Prices | Inputs | | Inputs | Total | |
| Assets ($) | | | | | | |
| Investments in Securities: | | | | | |
| Corporate Bonds† | — | 1,332,202,121 | | — | 1,332,202,121 | |
| Mutual Funds | 128,522,578 | — | | — | 128,522,578 | |
| Preferred Stocks† | — | 4,598,511 | | — | 4,598,511 | |
| U.S. Treasury | — | 59,998 | | — | 59,998 | |
| Forward Foreign | | | | | | |
| Currency Exchange | | | | | |
| Contracts†† | — | 66,067 | | — | 66,067 | |
| Liabilities ($) | | | | | | |
| Other Financial | | | | | | |
| Instruments: | | | | | | |
| Forward Foreign | | | | | | |
| Currency Exchange | | | | | |
| Contracts†† | — | (275,505 | ) | — | (275,505 | ) |
| |
| † | See Statement of Investments for additional detailed categorizations. |
| †† | Amount shown represents unrealized appreciation (depreciation) at period end. |
At December 31, 2012, there were no transfers between Level 1 and Level 2 of the fair value hierarchy.
(b) Foreign currency transactions: The fund does not isolate that portion of the results of operations resulting from changes in foreign exchange rates on investments from the fluctuations arising from changes in the market prices of securities held. Such fluctuations are included with the net realized and unrealized gain or loss on investments.
Net realized foreign exchange gains or losses arise from sales of foreign currencies, currency gains or losses realized on securities transactions between trade and settlement date, and the difference between the amounts of dividends, interest and foreign withholding taxes recorded
40
on the fund’s books and the U.S. dollar equivalent of the amounts actually received or paid. Net unrealized foreign exchange gains and losses arise from changes in the value of assets and liabilities other than investments resulting from changes in exchange rates. Foreign currency gains and losses on investments are also included with net realized and unrealized gain or loss on investments.
(c) Securities transactions and investment income: Securities transactions are recorded on a trade date basis. Realized gains and losses from securities transactions are recorded on the identified cost basis. Dividend income is recognized on the ex-dividend date and interest income, including, where applicable, accretion of discount and amortization of premium on investments, is recognized on the accrual basis.
Pursuant to a securities lending agreement with The Bank of New York Mellon, the fund may lend securities to qualified institutions. It is the fund’s policy that, at origination, all loans are secured by collateral of at least 102% of the value of U.S. securities loaned and 105% of the value of foreign securities loaned. Collateral equivalent to at least 100% of the market value of securities on loan is maintained at all times. Collateral is either in the form of cash, which can be invested in certain money market mutual funds managed by the Manager, U.S. Government and Agency securities or letters of credit. The fund is entitled to receive all income on securities loaned, in addition to income earned as a result of the lending transaction. Although each security loaned is fully collateralized, the fund bears the risk of delay in recovery of, or loss of rights in, the securities loaned should a borrower fail to return the securities in a timely manner. During the period ended December 31, 2012, The Bank of New York Mellon earned $315,037 from lending portfolio securities, pursuant to the securities lending agreement.
NOTES TO FINANCIAL STATEMENTS (continued)
(d) Affiliated issuers: Investments in other investment companies advised by Dreyfus are defined as “affiliated” in the Act. Investments in affiliated investment companies for the period ended December 31, 2012 were as follows:
| | | | | |
| Affiliated | | | | | |
| Investment | Value | | | Value | Net |
| Company | 12/31/2011 ($) | Purchases ($) | Sales ($) | 12/31/2012 ($) | Assets (%) |
| Dreyfus | | | | | |
| Institutional | | | | |
| Preferred | | | | | |
| Plus Money | | | | |
| Market | | | | | |
| Fund | 42,531,755 | 529,046,109 | 539,860,865 | 31,716,999 | 2.3 |
| Dreyfus | | | | | |
| Institutional | | | | |
| Cash | | | | | |
| Advantage | | | | |
| Fund | 95,781,799 | 355,285,011 | 354,261,231 | 96,805,579 | 7.0 |
| Total | 138,313,554 | 884,331,120 | 894,122,096 | 128,522,578 | 9.3 |
(e) Risk: The fund invests primarily in debt securities. Failure of an issuer of the debt securities to make timely interest or principal payments, or a decline or the perception of a decline in the credit quality of a debt security, can cause the debt security’s price to fall, potentially lowering the fund’s share price. High yield (junk) bonds involve greater credit risk, including the risk of default, than investment grade bonds, and are considered predominantly speculative with respect to the issuer’s continuing ability to make principal and interest payments. In addition, the value of debt securities may decline due to general market conditions that are not specifically related to a particular issuer, such as real or perceived adverse economic conditions, changes in outlook for corporate earnings, changes in interest or currency rates or adverse investor sentiment. They may also decline because of factors that affect a particular industry.
(f) Dividends to shareholders: It is the policy of the fund to declare dividends daily from investment income-net. Such dividends are paid monthly. Dividends from net realized capital gains, if any, are normally declared and paid annually, but the fund may make distributions on a
42
more frequent basis to comply with the distribution requirements of the Internal Revenue Code of 1986, as amended (the “Code”).To the extent that net realized capital gains can be offset by capital loss carryovers, it is the policy of the fund not to distribute such gains. Income and capital gain distributions are determined in accordance with income tax regulations, which may differ from GAAP.
(g) Federal income taxes: It is the policy of the fund to continue to qualify as a regulated investment company, if such qualification is in the best interests of its shareholders, by complying with the applicable provisions of the Code, and to make distributions of taxable income sufficient to relieve it from substantially all federal income and excise taxes.
As of and during the period ended December 31, 2012, the fund did not have any liabilities for any uncertain tax positions.The fund recognizes interest and penalties, if any, related to uncertain tax positions as income tax expense in the Statement of Operations. During the period, the fund did not incur any interest or penalties.
Each of the tax years in the four-year period ended December 31, 2012 remains subject to examination by the Internal Revenue Service and state taxing authorities.
At December 31, 2012, the components of accumulated earnings on a tax basis were as follows: undistributed ordinary income $838,286, accumulated capital losses $103,297,264 and unrealized appreciation $73,949,378.
Under the Regulated Investment Company Modernization Act of 2010 (the “2010 Act”), the fund is permitted to carry forward capital losses incurred in taxable years beginning after December 22, 2010 (“post-enactment losses”) for an unlimited period. Furthermore, post-enactment capital loss carryovers retain their character as either short-term or long-term capital losses rather than short-term as they were under previous statute.The 2010 Act requires post-enactment losses to be utilized before the utilization of losses incurred in taxable years
NOTES TO FINANCIAL STATEMENTS (continued)
prior to the effective date of the 2010 Act (“pre-enactment losses”).As a result of this ordering rule, pre-enactment losses may be more likely to expire unused.
The accumulated capital loss carryover is available for federal income tax purposes to be applied against future net realized capital gains, if any, realized subsequent to December 31, 2012. If not applied, $11,766,163 of the carryover expires in fiscal year 2013, $2,406,483 expires in fiscal year 2014, $16,497,195 expires in fiscal year 2015, $42,229,566 expires in fiscal year 2016 and $23,792,999 expires in fiscal year 2017. Based on certain provisions in the Code, various limitations regarding the future utilization of these carry forwards, brought forward as a result of the fund’s merger with the following funds apply: BNY Hamilton High Yield Fund and Dreyfus High Income Fund. It is possible that the fund will not be able to utilize most of its capital loss carryover prior to its expiration date.The fund has $6,176,020 of post-enactment short-term capital losses and $428,838 of post-enactment long-term capital losses which can be carried forward for an unlimited period.
The tax character of distributions paid to shareholders during the fiscal periods ended December 31, 2012 and December 31, 2011 were as follows: ordinary income $83,057,269 and $80,486,151, respectively.
During the period ended December 31, 2012, as a result of permanent book to tax differences, primarily due to the tax treatment for consent fees, amortization of premiums, foreign currency transactions and capital loss carryover expiration, the fund increased accumulated undistributed investment income-net by $3,829,623, decreased accumulated net realized gain (loss) on investments by $1,912,000 and decreased paid-in capital by $1,917,623. Net assets and net asset value per share were not affected by this reclassification.
(h) New Accounting Pronouncement: In December 2011, FASB issued Accounting Standards Update No. 2011-11 “Disclosures about Offsetting Assets and Liabilities” (“ASU 2011-11”). These disclosure requirements are intended to help investors and other financial statement users to better assess the effect or potential effect of offsetting arrange-
44
ments on a company’s financial position.They also improve transparency in the reporting of how companies mitigate credit risk, including disclosure of related collateral pledged or received. In addition,ASU 2011-11 facilitates comparison between those entities that prepare their financial statements on the basis of GAAP and those entities that prepare their financial statements on the basis of International Financial Reporting Standards (“IFRS”). ASU 2011-11 requires entities to: disclose both gross and net information about both instruments and transactions eligible for offset in the financial statements; and disclose instruments and transactions subject to an agreement similar to a master netting agreement. ASU 2011-11 is effective for fiscal years beginning on or after January 1, 2013, and interim periods within those annual periods.At this time, management is evaluating the implications of ASU 2011-11 and its impact on the fund’s financial statement disclosures.
NOTE 2—Bank Lines of Credit:
The fund participates with other Dreyfus-managed funds in a $210 million unsecured credit facility led by Citibank, N.A. and a $300 million unsecured credit facility provided by The Bank of New York Mellon, (each, a “Facility”), each to be utilized primarily for temporary or emergency purposes, including the financing of redemptions. Prior to October 10, 2012, the unsecured credit facility with Citibank, N.A. was $225 million. In connection therewith, the fund has agreed to pay its pro rata portion of commitment fees for each Facility. Interest is charged to the fund based on rates determined pursuant to the terms of the respective Facility at the time of borrowing. During the period ended December 31, 2012, the fund did not borrow under the Facilities.
NOTE 3—Investment Management Fee and Other Transactions With Affiliates:
(a) Pursuant to management agreement with the Manager, the Manager provides or arranges for one or more third parties and/or affiliates to provide investment advisory, administrative, custody, fund accounting and transfer agency services to the fund.The Manager also directs the
NOTES TO FINANCIAL STATEMENTS (continued)
investments of the fund in accordance with its investment objective, policies and limitations. For these services, the fund is contractually obligated to pay the Manager a fee, calculated daily and paid monthly, at the annual rate of .70% of the value of the fund’s average daily net assets. Out of its fee, the Manager pays all of the expenses of the fund except brokerage commissions, taxes, interest expense, commitment fees on borrowings, Rule 12b-1 Distribution Plan fees, Shareholder Services Plan fees, fees and expenses of non-interested Trustees (including counsel fees) and extraordinary expenses. In addition, the Manager is required to reduce its fee in an amount equal to the fund’s allocable portion of fees and expenses of the non-interestedTrustees (including counsel fees). During the period ended December 31, 2012,Trustees’ fees reimbursed by the Manager amounted to $94,509.
During the period ended December 31, 2012, the Distributor retained $75,789 from commissions earned on sales of the fund’s Class A shares and $6,990 from CDSCs on redemptions of the fund’s Class C shares.
(b) Under the Distribution Plans adopted pursuant to Rule 12b-1 (the “Distribution Plans”) under the Act, Class A shares pay annually up to .25% of the value of the average daily net assets to compensate the Distributor for shareholder servicing activities and expenses primarily intended to result in the sale of Class A shares. Class B shares paid and Class C shares pay the Distributor for distributing their shares at an aggregate annual rate of .50% and .75% of the value of the average daily net assets of Class B and Class C shares, respectively. Class B and Class C shares are also subject to a Service Plan adopted pursuant to Rule 12b-1, under which Class B shares paid and Class C shares pay the Distributor for providing certain services to the holders of their shares a fee at the annual rate of .25% of the value of the average daily net assets of Class B and Class C shares. During the period ended December 31, 2012, Class A, Class B and Class C shares were charged $898,157, $2,273 and $925,563, respectively, pursuant to their Distribution Plans. During the period ended December 31, 2012, Class B and Class C shares were charged $1,137 and $308,521, respectively, pursuant to the Service Plan.
46
Under its terms, the Distribution Plans and Service Plan shall remain in effect from year to year, provided such continuance is approved annually by a vote of a majority of those Trustees who are not “interested persons” of theTrust and who have no direct or indirect financial interest in the operation of or in any agreement related to the Plans or Service Plan.
The components of “Due to The Dreyfus Corporation and affiliates” in the Statement of Assets and Liabilities consist of: management fees $802,409, Distribution Plans fees $154,287 and Service Plan fees $26,312.
(c) Each Board member also serves as a Board member of other funds within the Dreyfus complex. Annual retainer fees and attendance fees are allocated to each fund based on net assets.
NOTE 4—Securities Transactions:
The aggregate amount of purchases and sales (including paydowns) of investment securities, excluding short-term securities and forward contracts, during the period ended December 31, 2012, amounted to $873,934,846 and $599,789,068, respectively.
Derivatives: A derivative is a financial instrument whose performance is derived from the performance of another asset. Each type of derivative instrument that was held by the fund during the period ended December 31, 2012 is discussed below.
Forward Foreign Currency Exchange Contracts: The fund enters into forward contracts in order to hedge its exposure to changes in foreign currency exchange rates on its foreign portfolio holdings, to settle foreign currency transactions or as a part of its investment strategy. When executing forward contracts, the fund is obligated to buy or sell a foreign currency at a specified rate on a certain date in the future. With respect to sales of forward contracts, the fund incurs a loss if the value of the contract increases between the date the forward contract
NOTES TO FINANCIAL STATEMENTS (continued)
is opened and the date the forward contract is closed.The fund realizes a gain if the value of the contract decreases between those dates.With respect to purchases of forward contracts, the fund incurs a loss if the value of the contract decreases between the date the forward contract is opened and the date the forward contract is closed.The fund realizes a gain if the value of the contract increases between those dates. Any realized or unrealized gains or losses which occurred during the period are reflected in the Statement of Operations. The fund is exposed to foreign currency risk as a result of changes in value of underlying financial instruments.The fund is also exposed to credit risk associated with counterparty nonperformance on these forward contracts, which is typically limited to the unrealized gain on each open contract.The following summarizes open forward contracts at December 31, 2012:
| | | | | | |
| | | Foreign | | | Unrealized | |
| Forward Foreign Currency | | Currency | | | Appreciation | |
| Exchange Contracts | | Amounts | Proceeds ($) | Value ($) (Depreciation) ($) | |
| Sales: | | | | | | |
| British Pound, | | | | | | |
| Expiring | | | | | | |
| 1/29/2013 a | 2,870,000 | 4,639,010 | 4,661,756 | (22,746 | ) |
| Canadian Dollar, | | | | | | |
| Expiring | | | | | | |
| 1/29/2013 b | 5,410,000 | 5,501,462 | 5,435,395 | 66,067 | |
| Euro, | | | | | | |
| Expiring: | | | | | | |
| 1/29/2013 a | 2,760,000 | 3,614,358 | 3,644,012 | (29,654 | ) |
| 1/29/2013 b | 1,460,000 | 1,912,556 | 1,927,629 | (15,073 | ) |
| 1/29/2013 c | 3,950,000 | 5,152,775 | 5,215,162 | (62,387 | ) |
| 1/29/2013 d | 3,180,000 | 4,163,828 | 4,198,535 | (34,707 | ) |
| 1/29/2013 e | 4,230,000 | 5,534,963 | 5,584,844 | (49,881 | ) |
| 1/29/2013 f | 4,000,000 | 5,220,120 | 5,281,177 | (61,057 | ) |
| Gross Unrealized | | | | | | |
| Appreciation | | | | | 66,067 | |
| Gross Unrealized | | | | | | |
| Depreciation | | | | | (275,505 | ) |
Counterparties:
| |
| a | Goldman Sachs |
| b | Credit Suisse First Boston |
| c | Commonwealth Bank of Australia |
| d | Deutsche Bank |
| e | Morgan Stanley |
| f | UBS |
48
The following summarizes the average market value of derivatives outstanding during the period ended December 31, 2012:
| |
| | Average Market Value ($) |
| Forward contracts | 28,769,019 |
At December 31, 2012, the cost of investments for federal income tax purposes was $1,391,449,623; accordingly, accumulated net unrealized appreciation on investments was $73,933,585, consisting of $80,978,663 gross unrealized appreciation and $7,045,078 gross unrealized depreciation.
REPORT OF INDEPENDENT REGISTERED
PUBLIC ACCOUNTING FIRM
The Board of Trustees and Shareholders The Dreyfus/Laurel Funds Trust
We have audited the accompanying statement of assets and liabilities of Dreyfus HighYield Fund (the “Fund”), a series of The Dreyfus/Laurel Funds Trust, including the statement of investments as of December 31, 2012, and the related statement of operations for the year then ended, the statement of changes in net assets for each of the years in the two-year period then ended, and the financial highlights for each of the years in the five-year period then ended.These financial statements and financial highlights are the responsibility of the Fund’s management. Our responsibility is to express an opinion on these financial statements and financial highlights based on our audits.
We conducted our audits in accordance with the standards of the Public Company Accounting Oversight Board (United States).Those standards require that we plan and perform the audit to obtain reasonable assurance about whether the financial statements and financial highlights are free of material misstatement. An audit includes examining, on a test basis, evidence supporting the amounts and disclosures in the financial statements. Our procedures included confirmation of securities owned as of December 31, 2012, by correspondence with the custodian and brokers or by other appropriate auditing procedures where replies from brokers were not received.An audit also includes assessing the accounting principles used and significant estimates made by management, as well as evaluating the overall financial statement presentation.We believe that our audits provide a reasonable basis for our opinion.
In our opinion, the financial statements and financial highlights referred to above present fairly, in all material respects, the financial position of Dreyfus High Yield Fund as of December 31, 2012, and the results of its operations for the year then ended, the changes in its net assets for each of the years in the two-year period then ended, and the financial highlights for each of the years in the five-year period then ended, in conformity with U.S. generally accepted accounting principles.

New York, New York
February 28, 2013
50
IMPORTANT TAX INFORMATION (Unaudited)
For federal tax purposes, the fund designates the maximum amount allowable but not less than 79.41% as interest-related dividends in accordance with Sections 871(k)(1) and 881(e) of the Internal Revenue Code.
BOARD MEMBERS INFORMATION (Unaudited)
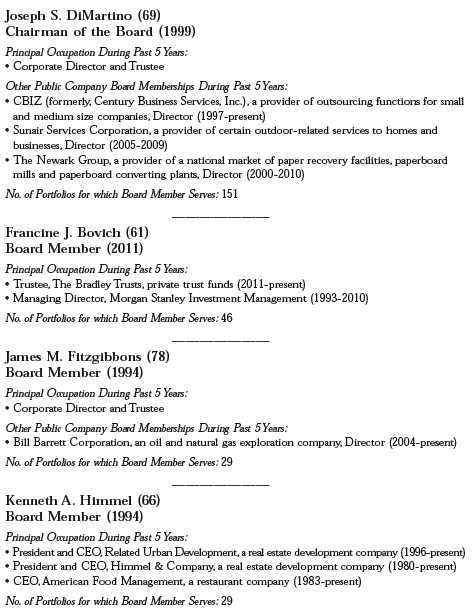
52
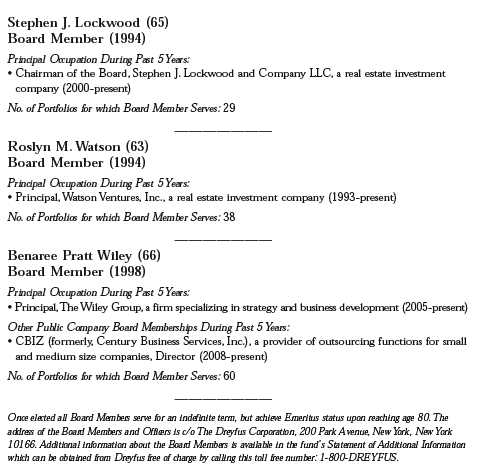
OFFICERS OF THE FUND (Unaudited)
BRADLEY J. SKAPYAK, President since January 2010.
Chief Operating Officer and a director of the Manager since June 2009; from April 2003 to June 2009, Mr. Skapyak was the head of the Investment Accounting and Support Department of the Manager. He is an officer of 69 investment companies (comprised of 150 portfolios) managed by the Manager. He is 54 years old and has been an employee of the Manager since February 1988.
JANETTE E. FARRAGHER, Vice President and Secretary since December 2011.
Assistant General Counsel of BNY Mellon, and an officer of 70 investment companies (comprised of 177 portfolios) managed by the Manager. She is 50 years old and has been an employee of the Manager since February 1984.
KIESHA ASTWOOD, Vice President and Assistant Secretary since January 2010.
Counsel of BNY Mellon, and an officer of 70 investment companies (comprised of 177 portfolios) managed by the Manager. She is 39 years old and has been an employee of the Manager since July 1995.
JAMES BITETTO, Vice President and Assistant Secretary since August 2005.
Senior Counsel of BNY Mellon and Secretary of the Manager, and an officer of 70 investment companies (comprised of 177 portfolios) managed by the Manager. He is 46 years old and has been an employee of the Manager since December 1996.
JONI LACKS CHARATAN, Vice President and Assistant Secretary since August 2005.
Senior Counsel of BNY Mellon, and an officer of 70 investment companies (comprised of 177 portfolios) managed by the Manager. She is 57 years old and has been an employee of the Manager since October 1988.
JOSEPH M. CHIOFFI, Vice President and Assistant Secretary since August 2005.
Senior Counsel of BNY Mellon, and an officer of 70 investment companies (comprised of 177 portfolios) managed by the Manager. He is 51 years old and has been an employee of the Manager since June 2000.
JOHN B. HAMMALIAN, Vice President and Assistant Secretary since August 2005.
Senior Managing Counsel of BNY Mellon, and an officer of 70 investment companies (comprised of 177 portfolios) managed by the Manager. He is 49 years old and has been an employee of the Manager since February 1991.
ROBERT R. MULLERY, Vice President and Assistant Secretary since August 2005.
Managing Counsel of BNY Mellon, and an officer of 70 investment companies (comprised of 177 portfolios) managed by the Manager. He is 60 years old and has been an employee of the Manager since May 1986.
JEFF PRUSNOFSKY, Vice President and Assistant Secretary since August 2005.
Senior Managing Counsel of BNY Mellon, and an officer of 70 investment companies (comprised of 177 portfolios) managed by the Manager. He is 47 years old and has been an employee of the Manager since October 1990.
JAMES WINDELS, Treasurer since November 2001.
Director – Mutual Fund Accounting of the Manager, and an officer of 70 investment companies (comprised of 177 portfolios) managed by the Manager. He is 54 years old and has been an employee of the Manager since April 1985.
54
RICHARD CASSARO, Assistant Treasurer since January 2008.
Senior Accounting Manager – Money Market and Municipal Bond Funds of the Manager, and an officer of 70 investment companies (comprised of 177 portfolios) managed by the Manager. He is 53 years old and has been an employee of the Manager since September 1982.
GAVIN C. REILLY, Assistant Treasurer since December 2005.
Tax Manager of the Investment Accounting and Support Department of the Manager, and an officer of 70 investment companies (comprised of 177 portfolios) managed by the Manager. He is 44 years old and has been an employee of the Manager since April 1991.
ROBERT S. ROBOL, Assistant Treasurer since December 2002.
Senior Accounting Manager – Fixed Income Funds of the Manager, and an officer of 70 investment companies (comprised of 177 portfolios) managed by the Manager. He is 48 years old and has been an employee of the Manager since October 1988.
ROBERT SALVIOLO, Assistant Treasurer since July 2007.
Senior Accounting Manager – Equity Funds of the Manager, and an officer of 70 investment companies (comprised of 177 portfolios) managed by the Manager. He is 45 years old and has been an employee of the Manager since June 1989.
ROBERT SVAGNA, Assistant Treasurer since December 2002.
Senior Accounting Manager – Equity Funds of the Manager, and an officer of 70 investment companies (comprised of 177 portfolios) managed by the Manager. He is 45 years old and has been an employee of the Manager since November 1990.
JOSEPH W. CONNOLLY, Chief Compliance Officer since October 2004.
Chief Compliance Officer of the Manager and The Dreyfus Family of Funds (70 investment companies, comprised of 177 portfolios). He is 55 years old and has served in various capacities with the Manager since 1980, including manager of the firm’s Fund Accounting Department from 1997 through October 2001.
MATTHEW D. CONNOLLY, Anti-Money Laundering Compliance Officer since April 2012.
Anti-Money Laundering Compliance Officer of the Distributor since October 2011; from March 2010 to September 2011, Global Head, KYC Reviews and Director, UBS Investment Bank; until March 2010,AML Compliance Officer and Senior Vice President, Citi Global Wealth Management. He is an officer of 66 investment companies (comprised of 173 portfolios) managed by the Manager. He is 40 years old and has been an employee of the Distributor since October 2011.
For More Information
Telephone Call your financial representative or 1-800-DREYFUS
Mail The Dreyfus Family of Funds, 144 Glenn Curtiss Boulevard, Uniondale, NY 11556-0144
The fund files its complete schedule of portfolio holdings with the Securities and Exchange Commission (“SEC”) for the first and third quarters of each fiscal year on Form N-Q. The fund’s Forms N-Q are available on the SEC’s website at http://www.sec.gov and may be reviewed and copied at the SEC’s Public Reference Room in Washington, DC. Information on the operation of the Public Reference Room may be obtained by calling 1-800-SEC-0330.
A description of the policies and procedures that the fund uses to determine how to vote proxies relating to portfolio securities, and information regarding how the fund voted these proxies for the most recent 12-month period ended June 30 is available at http://www.dreyfus.com and on the SEC’s website at http://www.sec.gov. The description of the policies and procedures is also available without charge, upon request, by calling 1-800-DREYFUS.

Item 2. Code of Ethics.
The Registrant has adopted a code of ethics that applies to the Registrant's principal executive officer, principal financial officer, principal accounting officer or controller, or persons performing similar functions. There have been no amendments to, or waivers in connection with, the Code of Ethics during the period covered by this Report.
Item 3. Audit Committee Financial Expert.
The Registrant's Board has determined that Joseph S. DiMartino, a member of the Audit Committee of the Board, is an audit committee financial expert as defined by the Securities and Exchange Commission (the "SEC"). Mr. DiMartino is "independent" as defined by the SEC for purposes of audit committee financial expert determinations.
Item 4. Principal Accountant Fees and Services.
(a) Audit Fees. The aggregate fees billed for each of the last two fiscal years (the "Reporting Periods") for professional services rendered by the Registrant's principal accountant (the "Auditor") for the audit of the Registrant's annual financial statements or services that are normally provided by the Auditor in connection with the statutory and regulatory filings or engagements for the Reporting Periods, were $52,020 in 2011 and $53,580 in 2012.
(b) Audit-Related Fees. The aggregate fees billed in the Reporting Periods for assurance and related services by the Auditor that are reasonably related to the performance of the audit of the Registrant's financial statements and are not reported under paragraph (a) of this Item 4 were $4,280 in 2011 and $4,410 in 2012. These services consisted of one or more of the following: (i) agreed upon procedures related to compliance with Internal Revenue Code section 817(h), (ii) security counts required by Rule 17f-2 under the Investment Company Act of 1940, as amended, (iii) advisory services as to the accounting or disclosure treatment of Registrant transactions or events and (iv) advisory services to the accounting or disclosure treatment of the actual or potential impact to the Registrant of final or proposed rules, standards or interpretations by the Securities and Exchange Commission, the Financial Accounting Standards Boards or other regulatory or standard-setting bodies.
The aggregate fees billed in the Reporting Periods for non-audit assurance and related services by the Auditor to the Registrant's investment adviser (not including any sub-investment adviser whose role is primarily portfolio management and is subcontracted with or overseen by another investment adviser), and any entity controlling, controlled by or under common control with the investment adviser that provides ongoing services to the Registrant ("Service Affiliates"), that were reasonably related to the performance of the annual audit of the Service Affiliate, which required pre-approval by the Audit Committee were $0 in 2011 and $0 in 2012.
(c) Tax Fees. The aggregate fees billed in the Reporting Periods for professional services rendered by the Auditor for tax compliance, tax advice, and tax planning ("Tax Services") were $2,230 in 2011and $2,300 in 2012. These services consisted of review or preparation of U.S. federal, state, local and excise tax returns. The aggregate fees billed in the Reporting Periods for Tax Services by the Auditor to Service Affiliates, which required pre-approval by the Audit Committee were $0 in 2011 and $0 in 2012.
(d) All Other Fees. The aggregate fees billed in the Reporting Periods for products and services provided by the Auditor, other than the services reported in paragraphs (a) through (c) of this Item, were $0 in 2011 and $0 in 2012.
The aggregate fees billed in the Reporting Periods for Non-Audit Services by the Auditor to Service Affiliates, other than the services reported in paragraphs (b) through (c) of this Item, which required pre-approval by the Audit Committee, were $0 in 2011 and $0 in 2012.
(e)(1) Audit Committee Pre-Approval Policies and Procedures. The Registrant's Audit Committee has established policies and procedures (the "Policy") for pre-approval (within specified fee limits) of the Auditor's engagements for non-audit services to the Registrant and Service Affiliates without specific case-by-case consideration. The pre-approved services in the Policy can include pre-approved audit services, pre-approved audit-related services, pre-approved tax services and pre-approved all other services. Pre-approval considerations include whether the proposed services are compatible with maintaining the Auditor's independence. Pre-approvals pursuant to the Policy are considered annually.
(e)(2) Note: None of the services described in paragraphs (b) through (d) of this Item 4 were approved by the Audit Committee pursuant to paragraph (c)(7)(i)(C) of Rule 2-01 of Regulation S-X.
(f) None of the hours expended on the principal accountant's engagement to audit the registrant's financial statements for the most recent fiscal year were attributed to work performed by persons other than the principal account's full-time, permanent employees.
Non-Audit Fees. The aggregate non-audit fees billed by the Auditor for services rendered to the Registrant, and rendered to Service Affiliates, for the Reporting Periods were $12,255,249 in 2011 and $12,372,510 in 2012.
Auditor Independence. The Registrant's Audit Committee has considered whether the provision of non-audit services that were rendered to Service Affiliates, which were not pre-approved (not requiring pre-approval), is compatible with maintaining the Auditor's independence.
Item 5. Audit Committee of Listed Registrants.
Not applicable.
Item 6. Investments.
(a) Not applicable.
Item 7. Disclosure of Proxy Voting Policies and Procedures for Closed-End Management Investment Companies.
Not applicable.
Item 8. Portfolio Managers of Closed-End Management Investment Companies.
Not applicable.
Item 9. Purchases of Equity Securities by Closed-End Management Investment Companies and Affiliated Purchasers.
Not applicable.
Item 10. Submission of Matters to a Vote of Security Holders.
There have been no material changes to the procedures applicable to Item 10.
Item 11. Controls and Procedures.
(a) The Registrant's principal executive and principal financial officers have concluded, based on their evaluation of the Registrant's disclosure controls and procedures as of a date within 90 days of the filing date of this report, that the Registrant's disclosure controls and procedures are reasonably designed to ensure that information required to be disclosed by the Registrant on Form N-CSR is recorded, processed, summarized and reported within the required time periods and that information required to be disclosed by the Registrant in the reports that it files or submits on Form N-CSR is accumulated and communicated to the Registrant's management, including its principal executive and principal financial officers, as appropriate to allow timely decisions regarding required disclosure.
(b) There were no changes to the Registrant's internal control over financial reporting that occurred during the second fiscal quarter of the period covered by this report that have materially affected, or are reasonably likely to materially affect, the Registrant's internal control over financial reporting.
Item 12. Exhibits.
(a)(1) Code of ethics referred to in Item 2.
(a)(2) Certifications of principal executive and principal financial officers as required by Rule 30a-2(a) under the Investment Company Act of 1940.
(a)(3) Not applicable.
(b) Certification of principal executive and principal financial officers as required by Rule 30a-2(b) under the Investment Company Act of 1940.
SIGNATURES
Pursuant to the requirements of the Securities Exchange Act of 1934 and the Investment Company Act of 1940, the Registrant has duly caused this Report to be signed on its behalf by the undersigned, thereunto duly authorized.
The Dreyfus/Laurel Funds Trust
By: /s/ Bradley J. Skapyak |
Bradley J. Skapyak, President |
Date: | February 26, 2013 |
|
Pursuant to the requirements of the Securities Exchange Act of 1934 and the Investment Company Act of 1940, this Report has been signed below by the following persons on behalf of the Registrant and in the capacities and on the dates indicated. |
|
By: /s/ Bradley J. Skapyak |
Bradley J. Skapyak, President |
Date: | February 26, 2013 |
|
By: /s/ James Windels |
James Windels, Treasurer |
Date: | February 26, 2013 |
|
EXHIBIT INDEX
(a)(1) Code of ethics referred to in Item 2.
(a)(2) Certifications of principal executive and principal financial officers as required by Rule 30a-2(a) under the Investment Company Act of 1940. (EX-99.CERT)
(b) Certification of principal executive and principal financial officers as required by Rule 30a-2(b) under the Investment Company Act of 1940. (EX-99.906CERT)