UNITED STATES
SECURITIES AND EXCHANGE COMMISSION
Washington, D.C. 20549
FORM N-CSR
CERTIFIED SHAREHOLDER REPORT OF REGISTERED MANAGEMENT
INVESTMENT COMPANIES
Investment Company Act file number | 811- 524 |
| |
| The Dreyfus/Laurel Funds Trust | |
| (Exact name of Registrant as specified in charter) | |
| | |
| c/o The Dreyfus Corporation 200 Park Avenue New York, New York 10166 | |
| (Address of principal executive offices) (Zip code) | |
| | |
| Janette E. Farragher, Esq. 200 Park Avenue New York, New York 10166 | |
| (Name and address of agent for service) | |
|
Registrant's telephone number, including area code: | (212) 922-6000 |
| |
Date of fiscal year end: | 12/31 | |
Date of reporting period: | 12/31/11 | |
| | | | | | | |
The following N-CSR relates only to Dreyfus High Yield Fund and does not affect the other series of the Registrant, which have different fiscal year ends and, therefore, different N-CSR reporting requirements. Separate N-CSR Forms will be filed for these series, as appropriate.
FORM N-CSR
Item 1. Reports to Stockholders.
ANNUAL REPORT December 31, 2011

Save time. Save paper. View your next shareholder report online as soon as it’s available. Log into www.dreyfus.com and sign up for Dreyfus eCommunications. It’s simple and only takes a few minutes.
The views expressed in this report reflect those of the portfolio manager only through the end of the period covered and do not necessarily represent the views of Dreyfus or any other person in the Dreyfus organization. Any such views are subject to change at any time based upon market or other conditions and Dreyfus disclaims any responsibility to update such views.These views may not be relied on as investment advice and, because investment decisions for a Dreyfus fund are based on numerous factors, may not be relied on as an indication of trading intent on behalf of any Dreyfus fund.
|
| Not FDIC-Insured • Not Bank-Guaranteed • May Lose Value |
| | Contents |
| | THE FUND |
| 2 | A Letter from the Chairman and CEO |
| 3 | Discussion of Fund Performance |
| 6 | Fund Performance |
| 8 | Understanding Your Fund’s Expenses |
| 8 | Comparing Your Fund’s Expenses With Those of Other Funds |
| 9 | Statement of Investments |
| 24 | Statement of Assets and Liabilities |
| 25 | Statement of Operations |
| 26 | Statement of Changes in Net Assets |
| 28 | Financial Highlights |
| 32 | Notes to Financial Statements |
| 49 | Report of Independent Registered Public Accounting Firm |
| 50 | Important Tax Information |
| 51 | Board Members Information |
| 53 | Officers of the Fund |
| | FOR MORE INFORMATION |
| | Back Cover |
Dreyfus
High Yield Fund
The Fund

A LETTER FROM THE CHAIRMAN AND CEO
Dear Shareholder:
We are pleased to present this annual report for Dreyfus High Yield Fund, covering the 12-month period from January 1, 2011, through December 31, 2011. For information about how the fund performed during the reporting period, as well as general market perspectives, we provide a Discussion of Fund Performance on the pages that follow.
U.S. bond markets in 2011 were primarily driven by a “flight to quality” in which investors fled riskier assets due to adverse macroeconomic developments ranging from natural disasters in Japan to an unprecedented downgrade of long-term U.S. debt securities and the resurgence of a sovereign debt crisis in Europe. Ironically, despite the rating downgrade, long-term U.S. Treasury securities ended the year with double-digit total returns as investors flocked to traditional safe havens. Corporate-backed bonds also fared well, but to a lesser degree than Treasuries, as investors sought competitive yields in a low interest-rate environment.
Our economic forecast calls for a mild acceleration of the U.S. recovery as the domestic banking system regains strength, credit conditions loosen and housing markets begin a long-awaited convalescence. In addition, we believe that long-term fundamentals currently appear to favor U.S. non-financial corporate credit, as well as emerging-markets local currency-denominated debt. Of course, we encourage you to talk with your financial adviser to help ensure that your investment objectives are properly aligned with your risk tolerance in pursuing potential market opportunities in 2012.
Thank you for your continued confidence and support.
Jonathan R. Baum
Chairman and Chief Executive Officer
The Dreyfus Corporation
January 17, 2012
2

DISCUSSION OF FUND PERFORMANCE
For the period of January 1, 2011, through December 31, 2011, as provided by Chris Barris, Portfolio Manager
Fund and Market Performance Overview
For the 12-month period ended December 31, 2011, Dreyfus High Yield Fund’s Class A shares produced a total return of 1.33%, Class B shares returned 0.82%, Class C shares returned 0.58% and Class I shares returned 1.74%.1 In comparison, the BofA Merrill Lynch U.S. High Yield Master II Constrained Index (the “Index”), the fund’s benchmark, achieved a total return of 4.37% over the same period.2
Macroeconomic disappointments weighed on high yield bonds during much of 2011, but rallies in the first and fourth quarters enabled the Index to end the year in positive territory.The fund produced lower returns than its benchmark, primarily due to its relatively constructive investment posture, including an emphasis on CCC-rated securities.
The Fund’s Investment Approach
The fund seeks to maximize total return, consisting of capital appreciation and current income.
At least 80% of the fund’s assets are invested in fixed-income securities that are rated below investment grade (“high yield” or “junk” bonds) or are the unrated equivalent as determined by Dreyfus. Individual issues are selected based on careful credit analysis. We thoroughly analyze the business, management and financial strength of each of the companies whose bonds we buy, then project each issuer’s ability to repay its debt.
Economic Downturn Drove High Yield Bond Prices Lower
Improved U.S. economic data supported high yield bond prices at the start of 2011, but political unrest in the Middle East and natural and nuclear disasters in Japan soon interrupted the rally. Nonetheless, riskier assets generally rebounded by the end of the first quarter.
DISCUSSION OF FUND PERFORMANCE (continued)
Economic sentiment began to deteriorate in earnest in late April when Greece appeared headed for default on its sovereign debt, U.S. economic data disappointed and a contentious debate regarding U.S. government spending and borrowing intensified. In addition, inflation-fighting measures in China threatened to derail a major engine of global economic growth. As a result, high yield bonds and other riskier assets suffered bouts of volatility as investors shifted their focus to traditionally defensive investments.
Turbulence among lower-rated bonds was particularly severe in August and September, after a major credit-rating agency downgraded its assessment of long-term U.S. debt securities.The effects of the ensuing market decline were particularly harsh among bonds at the lower end of the high yield range, while those at the upper end of the spectrum fared somewhat better. The high yield market rebounded from October through December when U.S. economic data improved and European policymakers made some progress in addressing the region’s problems.
Constructive Investment Posture Exacerbated Losses
The fund was positioned over the first half of the year for continued economic recovery, including an emphasis on securities at the lower end of the high yield credit spectrum.This investment posture proved detrimental to relative performance when economic conditions took a turn for the worse in the spring. Overweighted exposure and disappointing selections in the media, telecommunications and technology sectors proved particularly damaging to results compared to the benchmark.
On the other hand, the fund achieved above-average returns through an underweighted position in the home building sector and favorable security selections in the automotive industry. However, strong results in these areas were not enough to offset the impact of our bias toward lower-rated bonds at the time.
As economic conditions deteriorated, we took steps to upgrade the fund’s credit profile, reducing exposure to CCC-rated securities in some of the market’s more economically sensitive industry groups, including chemical companies, transportation providers and some media companies. Conversely, we increased the fund’s holdings of better-quality bonds with BB credit ratings from industries we regarded as better able
4
to withstand the economic downturn, such as cable television companies, packaging manufacturers and service providers. In addition, we increased the number of holdings in the fund in an effort to reduce the potential impact of unexpected weakness in any individual holding.
Focusing on Company Fundamentals
Although we recognize that a number of macroeconomic headwinds remain, we recently have seen encouraging signs of improvement in the United States and the emerging markets. In addition, the business fundamentals of most high yield issuers appear sound, particularly at the higher end of the high yield credit range. The default rate among high yield companies has remained below historical averages, partly due to efforts over the past several years to strengthen corporate balance sheets. From a technical standpoint, demand for high yield bonds is likely to remain robust from investors seeking competitive levels of current income in today’s low interest-rate environment. Consequently, we currently intend to maintain a relatively defensive approach over the near term, including a greater emphasis on bonds with B and BB credit ratings. Over the longer term, we are watchful for attractive values among bonds that may be trading below their intrinsic values.
January 17, 2012
| |
| | Bond funds are subject generally to interest rate, credit, liquidity and market risks, to varying |
| | degrees, all of which are more fully described in the fund’s prospectus. Generally, all other factors |
| | being equal, bond prices are inversely related to interest-rate changes, and rate increases can cause |
| | price declines. |
| | High yield bonds are subject to increased credit risk and are considered speculative in terms of the |
| | issuer’s perceived ability to continue making interest payments on a timely basis and to repay |
| | principal upon maturity. |
| 1 | Total return includes reinvestment of dividends and any capital gains paid, and does not take into |
| | consideration the maximum initial sales charge in the case of Class A shares, or the applicable |
| | contingent deferred sales charges imposed on redemptions in the case of Class B and Class C |
| | shares. Had these charges been reflected, returns would have been lower. Past performance is no |
| | guarantee of future results. Share price, yield and investment return fluctuate such that upon |
| | redemption, fund shares may be worth more or less than their original cost. |
| 2 | SOURCE: LIPPER INC. — Reflects reinvestment of dividends and, where applicable, capital |
| | gain distributions.The BofA Merrill Lynch U.S. HighYield Master II Constrained Index is an |
| | unmanaged performance benchmark composed of U.S. dollar-denominated domestic andYankee |
| | bonds rated below investment grade with at least $100 million par amount outstanding and at |
| | least one year remaining to maturity. Bonds are capitalization-weighted.Total allocations to an |
| | issuer are capped at 2%.The index does not reflect fees and expenses to which the fund is subject. |
FUND PERFORMANCE
|
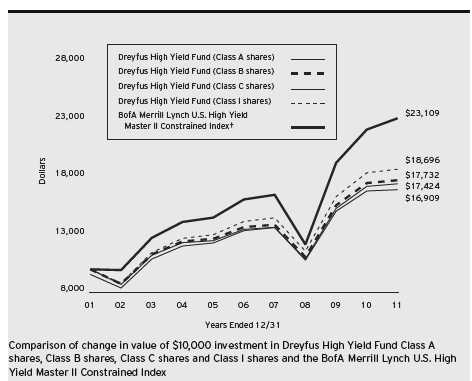
| † Source: Lipper Inc. |
| Past performance is not predictive of future performance. |
| The above graph compares a $10,000 investment made in each of the Class A, Class B, Class C and Class I shares |
| Dreyfus HighYield Fund on 12/31/01 to a $10,000 investment made in the BofA Merrill Lynch U.S. HighYield |
| Master II Constrained Index (the “Index”) on that date.All dividends and capital gain distributions are reinvested. |
| The fund’s performance shown in the line graph takes into account the maximum initial sales charge on Class A shares |
| and all other applicable fees and expenses on all classes. Performance for Class B shares assumes the conversion of Class |
| B shares to Class A shares at the end of the sixth year following the date of purchase.The Index is an unmanaged |
| performance benchmark composed of U.S. dollar-denominated domestic andYankee bonds rated below investment grade |
| with at least $100 million par amount outstanding and at least one year remaining to maturity. Bonds are |
| capitalization-weighted.Total allocations to an issuer are capped at 2%. Unlike a mutual fund, the Index is not subject |
| to charges, fees and other expenses. Investors cannot invest directly in any index. Further information relating to fund |
| performance, including expense reimbursements, if applicable, is contained in the Financial Highlights section of the |
| prospectus and elsewhere in this report. |
6
| | | | | | |
| Average Annual Total Returns as of 12/31/11 | | | |
| | 1Year | 5 Years | 10 Years |
| Class A shares | | | |
| with maximum sales charge (4.5%) | –3.21% | 4.49% | 5.71% |
| without sales charge | 1.33% | 5.45% | 6.19% |
| Class B shares | | | |
| with applicable redemption charge † | –2.93% | 4.62% | 5.90% |
| without redemption | 0.82% | 4.90% | 5.90% |
| Class C shares | | | |
| with applicable redemption charge †† | –0.36% | 4.64% | 5.39% |
| without redemption | 0.58% | 4.64% | 5.39% |
| Class I shares | 1.74% | 5.72% | 6.46% |
| BofA Merrill Lynch U.S. High Yield | | | |
| Master II Constrained Index | 4.37% | 7.54% | 8.74% |
Past performance is not predictive of future performance.The fund’s performance shown in the graph and table does not reflect the deduction of taxes that a shareholder would pay on fund distributions or the redemption of fund shares
| |
| † | The maximum contingent deferred sales charge for Class B shares is 4%.After six years Class B shares convert to |
| | Class A shares. |
| †† | The maximum contingent deferred sales charge for Class C shares is 1% for shares redeemed within one year of the |
| | date of purchase. |
UNDERSTANDING YOUR FUND’S EXPENSES (Unaudited)
As a mutual fund investor, you pay ongoing expenses, such as management fees and other expenses. Using the information below, you can estimate how these expenses affect your investment and compare them with the expenses of other funds.You also may pay one-time transaction expenses, including sales charges (loads) and redemption fees, which are not shown in this section and would have resulted in higher total expenses. For more information, see your fund’s prospectus or talk to your financial adviser.
Review your fund’s expenses
The table below shows the expenses you would have paid on a $1,000 investment in Dreyfus High Yield Fund from July 1, 2011 to December 31, 2011. It also shows how much a $1,000 investment would be worth at the close of the period, assuming actual returns and expenses.
Expenses and Value of a $1,000 Investment
assuming actual returns for the six months ended December 31, 2011
| | | | | | | | |
| | | Class A | | Class B | | Class C | | Class I |
| Expenses paid per $1,000† | $ | 4.72 | $ | 7.20 | $ | 8.44 | $ | 3.48 |
| Ending value (after expenses) | $ | 972.40 | $ | 969.90 | $ | 968.80 | $ | 973.70 |
COMPARING YOUR FUND’S EXPENSES
WITH THOSE OF OTHER FUNDS (Unaudited)
Using the SEC’s method to compare expenses
The Securities and Exchange Commission (SEC) has established guidelines to help investors assess fund expenses. Per these guidelines, the table below shows your fund’s expenses based on a $1,000 investment, assuming a hypothetical 5% annualized return. You can use this information to compare the ongoing expenses (but not transaction expenses or total cost) of investing in the fund with those of other funds.All mutual fund shareholder reports will provide this information to help you make this comparison. Please note that you cannot use this information to estimate your actual ending account balance and expenses paid during the period.
Expenses and Value of a $1,000 Investment
assuming a hypothetical 5% annualized return for the six months ended December 31, 2011
| | | | | | | | |
| | | Class A | | Class B | | Class C | | Class I |
| Expenses paid per $1,000† | $ | 4.84 | $ | 7.37 | $ | 8.64 | $ | 3.57 |
| Ending value (after expenses) | $ | 1,020.42 | $ | 1,017.90 | $ | 1,016.64 | $ | 1,021.68 |
|
| † Expenses are equal to the fund’s annualized expense ratio of .95% for Class A, 1.45% for Class B, 1.70% for |
| Class C and .70% for Class I, multiplied by the average account value over the period, multiplied by 184/365 (to |
| reflect the one-half year period). |
8
|
| STATEMENT OF INVESTMENTS |
| December 31, 2011 |
| | | | | |
| | Coupon | Maturity | Principal | | |
| Bonds and Notes—94.0% | Rate (%) | Date | Amount ($) | | Value ($) |
| Aerospace—1.5% | | | | | |
| Alion Science and Technology, | | | | | |
| Sr. Scd. Notes | 12.00 | 11/1/14 | 14,211 | | 11,795 |
| Bombardier, | | | | | |
| Sr. Unscd. Notes | 7.75 | 3/15/20 | 3,550,000 | a | 3,887,250 |
| DynCorp International, | | | | | |
| Gtd. Notes | 10.38 | 7/1/17 | 4,200,000 | b | 3,675,000 |
| Kratos Defense & Security | | | | | |
| Solutions, Sr. Scd. Notes | 10.00 | 6/1/17 | 3,645,000 | | 3,754,350 |
| TransDigm, | | | | | |
| Gtd. Notes | 7.75 | 12/15/18 | 4,245,000 | | 4,584,600 |
| | | | | | 15,912,995 |
| Automotive—4.3% | | | | | |
| Chrysler Group, | | | | | |
| Sr. Scd. Notes | 8.00 | 6/15/19 | 7,175,000 | a,b | 6,601,000 |
| Ford Motor Credit, | | | | | |
| Sr. Unscd. Notes | 8.13 | 1/15/20 | 5,600,000 | | 6,612,581 |
| Ford Motor, | | | | | |
| Sr. Unscd. Notes | 7.45 | 7/16/31 | 10,215,000 | b | 12,309,075 |
| Goodyear Tire & Rubber, | | | | | |
| Gtd. Notes | 8.25 | 8/15/20 | 4,575,000 | b | 5,009,625 |
| Lear, | | | | | |
| Gtd. Notes | 7.88 | 3/15/18 | 1,500,000 | | 1,631,250 |
| Lear, | | | | | |
| Gtd. Notes | 8.13 | 3/15/20 | 2,265,000 | | 2,502,825 |
| Tomkins, | | | | | |
| Scd. Notes | 9.00 | 10/1/18 | 4,433,000 | c | 4,937,254 |
| UCI International, | | | | | |
| Gtd. Notes | 8.63 | 2/15/19 | 5,010,000 | | 4,884,750 |
| | | | | | 44,488,360 |
| Building Products—2.5% | | | | | |
| Building Materials Corp. of | | | | | |
| America, Sr. Notes | 6.75 | 5/1/21 | 4,745,000 | a | 4,994,112 |
| Obrascon Huarte Lain, | | | | | |
| Sr. Unscd. Notes | 8.75 | 3/15/18 | 3,100,000 | | 3,972,044 |
| Ply Gem Industries, | | | | | |
| Sr. Scd. Notes | 8.25 | 2/15/18 | 2,085,000 | b | 1,826,981 |
| Reliance Intermediate Holdings, | | | | | |
| Sr. Scd. Notes | 9.50 | 12/15/19 | 4,615,000 | a | 4,914,975 |
STATEMENT OF INVESTMENTS (continued)
| | | | | |
| | Coupon | Maturity | Principal | | |
| Bonds and Notes (continued) | Rate (%) | Date | Amount ($) | | Value ($) |
| Building Products (continued) | | | | | |
| Shea Homes Funding, | | | | | |
| Sr. Scd. Notes | 8.63 | 5/15/19 | 5,700,000 | a | 5,343,750 |
| Standard Pacific, | | | | | |
| Gtd. Notes | 8.38 | 5/15/18 | 4,970,000 | | 4,746,350 |
| | | | | | 25,798,212 |
| Capital Goods—3.2% | | | | | |
| Ashtead Capital, | | | | | |
| Scd. Notes | 9.00 | 8/15/16 | 1,500,000 | a | 1,571,250 |
| Dynacast International, | | | | | |
| Scd. Notes | 9.25 | 7/15/19 | 5,875,000 | a | 5,551,875 |
| Griffon, | | | | | |
| Gtd. Notes | 7.13 | 4/1/18 | 5,380,000 | | 5,353,100 |
| Manitowoc, | | | | | |
| Gtd. Notes | 8.50 | 11/1/20 | 3,150,000 | | 3,335,062 |
| Manitowoc, | | | | | |
| Gtd. Notes | 9.50 | 2/15/18 | 1,240,000 | | 1,326,800 |
| Mueller Water Products, | | | | | |
| Gtd. Notes | 7.38 | 6/1/17 | 3,225,000 | b | 2,950,875 |
| RBS Global/Rexnord, | | | | | |
| Gtd. Notes | 8.50 | 5/1/18 | 4,145,000 | | 4,414,425 |
| WireCo WorldGroup, | | | | | |
| Gtd. Notes | 10.00 | 5/15/17 | 8,680,000 | a,c | 8,766,800 |
| | | | | | 33,270,187 |
| Chemicals—2.4% | | | | | |
| Hexion U.S. Finance/Nova Scotia, | | | | | |
| Scd. Notes | 9.00 | 11/15/20 | 3,215,000 | | 2,668,450 |
| Huntsman International, | | | | | |
| Gtd. Notes | 8.63 | 3/15/20 | 4,500,000 | b | 4,792,500 |
| Ineos Group Holdings, | | | | | |
| Scd. Notes | 8.50 | 2/15/16 | 6,300,000 | a,b | 5,040,000 |
| LyondellBasell Industries, | | | | | |
| Gtd. Notes | 6.00 | 11/15/21 | 215,000 | a | 224,137 |
| OXEA Finance, | | | | | |
| Sr. Scd. Notes | 9.50 | 7/15/17 | 4,650,000 | a | 4,673,250 |
| Polyone, | | | | | |
| Sr. Unscd. Notes | 7.38 | 9/15/20 | 4,600,000 | | 4,761,000 |
| TPC Group, | | | | | |
| Sr. Scd. Notes | 8.25 | 10/1/17 | 3,045,000 | | 3,060,225 |
| | | | | | 25,219,562 |
10
| | | | | |
| | Coupon | Maturity | Principal | | |
| Bonds and Notes (continued) | Rate (%) | Date | Amount ($) | | Value ($) |
| Containers—4.4% | | | | | |
| AEP Industries, | | | | | |
| Sr. Unscd. Notes | 8.25 | 4/15/19 | 3,020,000 | | 3,080,400 |
| ARD Finance, | | | | | |
| Sr. Scd. Notes | 11.13 | 6/1/18 | 4,609,444 | a | 3,964,122 |
| Ardagh Packaging Finance, | | | | | |
| Sr. Scd. Notes | 7.38 | 10/15/17 | 3,350,000 | a | 3,400,250 |
| BWAY Holding, | | | | | |
| Gtd. Notes | 10.00 | 6/15/18 | 2,380,000 | | 2,546,600 |
| BWAY Parent, | | | | | |
| Sr. Unscd. Notes | 10.13 | 11/1/15 | 7,141,940 | | 6,963,391 |
| Plastipak Holdings, | | | | | |
| Sr. Notes | 10.63 | 8/15/19 | 3,240,000 | a | 3,596,400 |
| Reynolds Group, | | | | | |
| Sr. Scd. Notes | 7.88 | 8/15/19 | 4,465,000 | a | 4,688,250 |
| Reynolds Group, | | | | | |
| Gtd. Notes | 9.25 | 5/15/18 | 7,955,000 | a,c | 7,656,687 |
| Reynolds Group, | | | | | |
| Sr. Unscd. Notes | 9.88 | 8/15/19 | 610,000 | a | 594,750 |
| Sealed Air, | | | | | |
| Gtd. Notes | 8.13 | 9/15/19 | 6,870,000 | a | 7,557,000 |
| Sealed Air, | | | | | |
| Gtd. Notes | 8.38 | 9/15/21 | 1,095,000 | a | 1,215,450 |
| | | | | | 45,263,300 |
| Energy—10.9% | | | | | |
| American Petroleum | | | | | |
| Tankers Parent, | | | | | |
| Sr. Scd. Notes | 10.25 | 5/1/15 | 4,287,000 | | 4,394,175 |
| Antero Resources Finance, | | | | | |
| Gtd. Notes | 7.25 | 8/1/19 | 5,470,000 | a | 5,634,100 |
| Chesapeake Energy, | | | | | |
| Gtd. Notes | 6.63 | 8/15/20 | 10,040,000 | | 10,818,100 |
| Chesapeake Energy, | | | | | |
| Gtd. Notes | 9.50 | 2/15/15 | 4,360,000 | | 5,014,000 |
| Continental Resources, | | | | | |
| Gtd. Notes | 7.13 | 4/1/21 | 3,160,000 | b | 3,444,400 |
| Dresser-Rand Group, | | | | | |
| Gtd. Notes | 6.50 | 5/1/21 | 3,565,000 | a | 3,663,037 |
| El Paso, | | | | | |
| Sr. Unscd. Notes | 6.50 | 9/15/20 | 3,524,000 | | 3,827,043 |
STATEMENT OF INVESTMENTS (continued)
| | | | | |
| | Coupon | Maturity | Principal | | |
| Bonds and Notes (continued) | Rate (%) | Date | Amount ($) | | Value ($) |
| Energy (continued) | | | | | |
| El Paso, | | | | | |
| Sr. Unscd. Notes | 7.80 | 8/1/31 | 1,665,000 | | 1,927,237 |
| Ferrellgas Partners, | | | | | |
| Sr. Unscd. Notes | 8.63 | 6/15/20 | 2,308,000 | | 2,244,530 |
| Ferrellgas, | | | | | |
| Sr. Unscd. Notes | 6.50 | 5/1/21 | 6,630,000 | | 5,867,550 |
| Ferrellgas, | | | | | |
| Sr. Unscd. Notes | 9.13 | 10/1/17 | 2,500,000 | | 2,625,000 |
| Inergy Finance, | | | | | |
| Gtd. Notes | 7.00 | 10/1/18 | 5,700,000 | b | 5,814,000 |
| Kodiak Oil & Gas, | | | | | |
| Gtd. Notes | 8.13 | 12/1/19 | 4,050,000 | a | 4,201,875 |
| MarkWest Energy Partners, | | | | | |
| Gtd. Notes | 6.25 | 6/15/22 | 1,700,000 | | 1,785,000 |
| McJunkin Red Man, | | | | | |
| Sr. Scd. Notes | 9.50 | 12/15/16 | 4,545,000 | | 4,635,900 |
| MEG Energy, | | | | | |
| Gtd. Notes | 6.50 | 3/15/21 | 6,315,000 | a | 6,488,662 |
| Newfield Exploration, | | | | | |
| Sr. Unscd. Notes | 5.75 | 1/30/22 | 1,790,000 | | 1,942,150 |
| Oasis Petroleum, | | | | | |
| Gtd. Notes | 6.50 | 11/1/21 | 1,165,000 | | 1,162,088 |
| Oasis Petroleum, | | | | | |
| Gtd. Notes | 7.25 | 2/1/19 | 5,680,000 | | 5,907,200 |
| Offshore Group Investments, | | | | | |
| Sr. Scd. Notes | 11.50 | 8/1/15 | 7,616,000 | | 8,272,880 |
| Precision Drilling, | | | | | |
| Gtd. Notes | 6.50 | 12/15/21 | 745,000 | a | 763,625 |
| Precision Drilling, | | | | | |
| Gtd. Notes | 6.63 | 11/15/20 | 5,170,000 | | 5,312,175 |
| Targa Resources Partners, | | | | | |
| Gtd. Notes | 6.88 | 2/1/21 | 5,300,000 | a | 5,392,750 |
| Trinidad Drilling, | | | | | |
| Sr. Unscd. Notes | 7.88 | 1/15/19 | 5,025,000 | a | 5,200,875 |
| Unit, | | | | | |
| Gtd. Notes | 6.63 | 5/15/21 | 6,635,000 | | 6,668,175 |
| | | | | | 113,006,527 |
12
| | | | | |
| | Coupon | Maturity | Principal | | |
| Bonds and Notes (continued) | Rate (%) | Date | Amount ($) | | Value ($) |
| Entertainment & Gaming—5.2% | | | | | |
| AMC Entertaiment, | | | | | |
| Gtd. Notes | 9.75 | 12/1/20 | 5,365,000 | b | 5,123,575 |
| Ameristar Casinos, | | | | | |
| Gtd. Notes | 7.50 | 4/15/21 | 3,955,000 | | 4,093,425 |
| Caesars Entertainment Operating, | | | | | |
| Scd. Notes | 10.00 | 12/15/18 | 3,230,000 | | 2,228,700 |
| Caesars Entertainment Operating, | | | | | |
| Sr. Scd. Notes | 11.25 | 6/1/17 | 3,605,000 | | 3,843,831 |
| Cinemark USA, | | | | | |
| Gtd. Notes | 7.38 | 6/15/21 | 4,200,000 | b | 4,315,500 |
| Cirsa Funding, | | | | | |
| Gtd. Notes | 8.75 | 5/15/18 | 4,045,000 | | 4,312,520 |
| Codere Finance, | | | | | |
| Gtd. Notes | 8.25 | 6/15/15 | 3,100,000 | | 3,711,253 |
| MGM Resorts International, | | | | | |
| Gtd. Notes | 10.00 | 11/1/16 | 3,325,000 | | 3,507,875 |
| MGM Resorts International, | | | | | |
| Sr. Unscd. Notes | 11.38 | 3/1/18 | 6,815,000 | b | 7,530,575 |
| Palace Entertainment Holdings, | | | | | |
| Sr. Scd. Notes | 8.88 | 4/15/17 | 2,015,000 | a | 2,009,962 |
| Peninsula Gaming, | | | | | |
| Gtd. Notes | 10.75 | 8/15/17 | 3,600,000 | | 3,789,000 |
| Penn National Gaming, | | | | | |
| Sr. Sub. Notes | 8.75 | 8/15/19 | 3,215,000 | | 3,512,387 |
| Pinnacle Entertainment, | | | | | |
| Gtd. Notes | 8.75 | 5/15/20 | 3,335,000 | b | 3,284,975 |
| ROC Finance, | | | | | |
| Scd. Notes | 12.13 | 9/1/18 | 2,350,000 | a | 2,485,125 |
| | | | | | 53,748,703 |
| Finance—8.3% | | | | | |
| Ally Financial, | | | | | |
| Gtd. Notes | 7.50 | 9/15/20 | 3,555,000 | | 3,603,881 |
| Ally Financial, | | | | | |
| Gtd. Notes | 8.00 | 11/1/31 | 965,000 | | 936,050 |
| Ally Financial, | | | | | |
| Gtd. Notes | 8.30 | 2/12/15 | 4,600,000 | | 4,864,500 |
STATEMENT OF INVESTMENTS (continued)
| | | | | |
| | Coupon | Maturity | Principal | | |
| Bonds and Notes (continued) | Rate (%) | Date | Amount ($) | | Value ($) |
| Finance (continued) | | | | | |
| CIT Group, | | | | | |
| Scd. Bonds | 7.00 | 5/4/15 | 2,170,000 | a | 2,175,425 |
| CIT Group, | | | | | |
| Scd. Notes, Ser. A | 7.00 | 5/1/16 | 3,310,000 | | 3,314,137 |
| CIT Group, | | | | | |
| Scd. Bonds | 7.00 | 5/2/16 | 5,120,000 | a | 5,126,400 |
| CIT Group, | | | | | |
| Scd. Bonds | 7.00 | 5/2/17 | 9,205,000 | a | 9,205,000 |
| FCE Bank, | | | | | |
| Sr. Unscd. Notes | 5.13 | 11/16/15 | 1,550,000 | | 2,358,989 |
| GMAC International Finance, | | | | | |
| Gtd. Bonds | 7.50 | 4/21/15 | 3,630,000 | | 4,486,702 |
| Host Hotels & Resorts, | | | | | |
| Gtd. Notes | 6.00 | 10/1/21 | 2,590,000 | a | 2,661,225 |
| HUB International Holdings, | | | | | |
| Sr. Sub. Notes | 10.25 | 6/15/15 | 7,826,000 | a | 7,806,435 |
| Icahn Enterprises Finance, | | | | | |
| Gtd. Notes | 8.00 | 1/15/18 | 9,350,000 | b | 9,770,750 |
| International Lease Finance, | | | | | |
| Sr. Unsed. Notes | 6.63 | 11/15/13 | 1,850,000 | b | 1,850,000 |
| International Lease Finance, | | | | | |
| Sr. Scd. Notes | 7.13 | 9/1/18 | 1,230,000 | a | 1,279,200 |
| International Lease Finance, | | | | | |
| Sr. Unscd. Notes | 8.25 | 12/15/20 | 3,325,000 | b | 3,366,562 |
| International Lease Finance, | | | | | |
| Sr. Unscd. Notes | 8.63 | 9/15/15 | 6,281,000 | c | 6,461,579 |
| International Lease Finance, | | | | | |
| Sr. Unscd. Notes | 8.63 | 1/15/22 | 2,545,000 | | 2,587,265 |
| International Lease Finance, | | | | | |
| Sr. Unscd. Notes | 8.88 | 9/1/17 | 2,350,000 | | 2,444,000 |
| SLM, | | | | | |
| Sr. Unscd. Notes | 8.00 | 3/25/20 | 985,000 | | 997,312 |
| SLM, | | | | | |
| Sr. Unscd. Notes | 8.45 | 6/15/18 | 7,125,000 | | 7,374,375 |
| USI Holdings, | | | | | |
| Sr. Sub. Notes | 9.75 | 5/15/15 | 3,605,000 | a | 3,469,812 |
| | | | | | 86,139,599 |
14
| | | | | |
| | Coupon | Maturity | Principal | | |
| Bonds and Notes (continued) | Rate (%) | Date | Amount ($) | | Value ($) |
| Food, Beverage & Tobacco—1.5% | | | | | |
| Dean Foods, | | | | | |
| Gtd. Notes | 7.00 | 6/1/16 | 4,844,000 | b | 4,807,670 |
| Del Monte, | | | | | |
| Gtd. Notes | 7.63 | 2/15/19 | 4,540,000 | | 4,381,100 |
| Michael Foods, | | | | | |
| Gtd. Notes | 9.75 | 7/15/18 | 5,955,000 | | 6,297,413 |
| | | | | | 15,486,183 |
| Health Care—6.7% | | | | | |
| Accellent, | | | | | |
| Gtd. Notes | 10.00 | 11/1/17 | 4,310,000 | | 3,512,650 |
| American Renal Associates | | | | | |
| Holdings, Sr. Unscd. Notes | 9.75 | 3/1/16 | 2,597,514 | | 2,655,958 |
| American Renal Holdings, | | | | | |
| Sr. Scd. Notes | 8.38 | 5/15/18 | 2,455,000 | | 2,590,025 |
| AMERIGROUP, | | | | | |
| Sr. Unscd. Notes | 7.50 | 11/15/19 | 1,620,000 | | 1,676,700 |
| Biomet, | | | | | |
| Gtd. Notes | 11.63 | 10/15/17 | 5,625,000 | | 6,131,250 |
| CHS/Community Health Systems, | | | | | |
| Gtd. Notes | 8.00 | 11/15/19 | 3,425,000 | a | 3,467,813 |
| CHS/Community Health Systems, | | | | | |
| Gtd. Notes | 8.88 | 7/15/15 | 2,048,000 | b | 2,119,680 |
| DaVita, | | | | | |
| Gtd. Notes | 6.63 | 11/1/20 | 3,800,000 | | 3,923,500 |
| DJO Finance, | | | | | |
| Gtd. Notes | 7.75 | 4/15/18 | 6,145,000 | | 4,747,013 |
| Emergency Medical Service, | | | | | |
| Gtd. Notes | 8.13 | 6/1/19 | 4,070,000 | | 4,080,175 |
| Fresenius Medical Care, | | | | | |
| Gtd. Notes | 6.50 | 9/15/18 | 3,610,000 | a | 3,799,525 |
| HCA Holdings, | | | | | |
| Sr. Unscd. Notes | 7.75 | 5/15/21 | 11,200,000 | b | 11,452,000 |
| HCA, | | | | | |
| Sr. Scd. Notes | 7.25 | 9/15/20 | 3,560,000 | | 3,773,600 |
| Health Management Associates, | | | | | |
| Sr. Scd. Notes | 6.13 | 4/15/16 | 1,120,000 | | 1,164,800 |
STATEMENT OF INVESTMENTS (continued)
| | | | | |
| | Coupon | Maturity | Principal | | |
| Bonds and Notes (continued) | Rate (%) | Date | Amount ($) | | Value ($) |
| Health Care (continued) | | | | | |
| Health Management Associates, | | | | | |
| Sr. Unscd. Notes | 7.38 | 1/15/20 | 1,315,000 | a | 1,370,888 |
| IASIS Healthcare, | | | | | |
| Gtd. Notes | 8.38 | 5/15/19 | 2,835,000 | | 2,487,713 |
| Radiation Therapy Services, | | | | | |
| Gtd. Notes | 9.88 | 4/15/17 | 2,035,000 | b | 1,531,337 |
| STHI Holding, | | | | | |
| Scd. Notes | 8.00 | 3/15/18 | 2,175,000 | a | 2,245,687 |
| Tenet Healthcare, | | | | | |
| Sr. Scd. Notes | 6.25 | 11/1/18 | 6,410,000 | a | 6,538,200 |
| Tenet Healthcare, | | | | | |
| Sr. Scd. Notes | 8.88 | 7/1/19 | 460,000 | | 518,650 |
| | | | | | 69,787,164 |
| Media—8.9% | | | | | |
| Allbritton Communications, | | | | | |
| Sr. Unscd. Notes | 8.00 | 5/15/18 | 5,510,000 | | 5,496,225 |
| AMC Networks, | | | | | |
| Gtd. Notes | 7.75 | 7/15/21 | 3,195,000 | a | 3,490,537 |
| Cablevision Systems, | | | | | |
| Sr. Unscd. Notes | 8.63 | 9/15/17 | 900,000 | | 1,001,250 |
| CCH II Capital, | | | | | |
| Gtd. Notes | 13.50 | 11/30/16 | 5,654,136 | | 6,558,798 |
| CCO Holdings, | | | | | |
| Gtd. Notes | 7.38 | 6/1/20 | 1,475,000 | | 1,563,500 |
| Cequel Communications Holdings I, | | | | | |
| Sr. Unscd. Notes | 8.63 | 11/15/17 | 6,641,000 | a | 7,072,665 |
| Clear Channel Communications, | | | | | |
| Sr. Scd. Notes | 9.00 | 3/1/21 | 5,085,000 | | 4,309,538 |
| Clear Channel Communications, | | | | | |
| Gtd. Notes | 10.75 | 8/1/16 | 4,010,000 | | 2,706,750 |
| CSC Holdings, | | | | | |
| Sr. Unscd. Notes | 6.75 | 11/15/21 | 2,645,000 | a | 2,797,087 |
| Cumulus Media, | | | | | |
| Gtd. Notes | 7.75 | 5/1/19 | 5,630,000 | a,b | 5,024,775 |
| Dish DBS, | | | | | |
| Gtd. Notes | 7.13 | 2/1/16 | 5,040,000 | | 5,455,800 |
| Gray Television, | | | | | |
| Scd. Notes | 10.50 | 6/29/15 | 8,020,000 | b | 7,619,000 |
16
| | | | | |
| | Coupon | Maturity | Principal | | |
| Bonds and Notes (continued) | Rate (%) | Date | Amount ($) | | Value ($) |
| Media (continued) | | | | | |
| Insight Communications, | | | | | |
| Sr. Unscd. Notes | 9.38 | 7/15/18 | 4,700,000 | a | 5,393,250 |
| Kabel BW, | | | | | |
| Sr. Scd. Notes | 7.50 | 3/15/19 | 6,600,000 | a | 6,963,000 |
| LBI Media, | | | | | |
| Gtd. Notes | 8.50 | 8/1/17 | 5,562,000 | a,b | 3,093,863 |
| LBI Media, | | | | | |
| Sr. Scd. Notes | 9.25 | 4/15/19 | 2,070,000 | a | 1,855,238 |
| Nexstar/Mission Broadcasting, | | | | | |
| Scd. Notes | 8.88 | 4/15/17 | 523,000 | | 538,690 |
| Ono Finance II, | | | | | |
| Gtd. Notes | 10.88 | 7/15/19 | 2,980,000 | a,b | 2,667,100 |
| Quebecor Media, | | | | | |
| Sr. Unscd. Notes | 7.75 | 3/15/16 | 4,875,000 | | 5,033,438 |
| Salem Communications, | | | | | |
| Scd. Notes | 9.63 | 12/15/16 | 4,119,000 | | 4,366,140 |
| Sinclair Television Group, | | | | | |
| Scd. Notes | 9.25 | 11/1/17 | 3,885,000 | a | 4,254,075 |
| Unitymedia, | | | | | |
| Sr. Notes | 9.63 | 12/1/19 | 3,375,000 | | 4,531,887 |
| | | | | | 91,792,606 |
| Metals Mining—5.3% | | | | | |
| American Rock Salt, | | | | | |
| Scd. Notes | 8.25 | 5/1/18 | 4,870,000 | a | 4,699,550 |
| Calcipar, | | | | | |
| Sr. Scd. Notes | 6.88 | 5/1/18 | 3,415,000 | a | 3,090,575 |
| FMG Resources August 2006, | | | | | |
| Sr. Notes | 8.25 | 11/1/19 | 5,905,000 | a | 6,037,863 |
| JMC Steel Group, | | | | | |
| Sr. Notes | 8.25 | 3/15/18 | 4,870,000 | a | 4,772,600 |
| Murray Energy, | | | | | |
| Scd. Notes | 10.25 | 10/15/15 | 6,580,000 | a | 6,563,550 |
| Peabody Energy, | | | | | |
| Gtd. Notes | 6.00 | 11/15/18 | 2,470,000 | a | 2,531,750 |
| Peabody Energy, | | | | | |
| Gtd. Notes | 6.25 | 11/15/21 | 1,590,000 | a | 1,653,600 |
| Severstal Columbus, | | | | | |
| Sr. Scd. Notes | 10.25 | 2/15/18 | 15,200,000 | | 15,998,000 |
STATEMENT OF INVESTMENTS (continued)
| | | | | |
| | Coupon | Maturity | Principal | | |
| Bonds and Notes (continued) | Rate (%) | Date | Amount ($) | | Value ($) |
| Metals Mining (continued) | | | | | |
| Tube City IMS, | | | | | |
| Gtd. Notes | 9.75 | 2/1/15 | 9,120,000 | | 9,256,800 |
| | | | | | 54,604,288 |
| Paper—1.0% | | | | | |
| Clearwater Paper, | | | | | |
| Gtd. Notes | 7.13 | 11/1/18 | 5,465,000 | | 5,710,925 |
| Verso Paper Holdings, | | | | | |
| Gtd. Notes, Ser. B | 11.38 | 8/1/16 | 1,955,000 | b | 811,325 |
| Xerium Technologies, | | | | | |
| Gtd. Notes | 8.88 | 6/15/18 | 3,815,000 | a | 3,471,650 |
| | | | | | 9,993,900 |
| Retail—2.8% | | | | | |
| Hillman Group, | | | | | |
| Gtd. Notes | 10.88 | 6/1/18 | 4,970,000 | | 4,945,150 |
| J. Crew Group, | | | | | |
| Gtd. Notes | 8.13 | 3/1/19 | 6,280,000 | b | 6,028,800 |
| Neiman Marcus Group, | | | | | |
| Gtd. Notes | 10.38 | 10/15/15 | 1,160,000 | b | 1,210,762 |
| QVC, | | | | | |
| Sr. Scd. Notes | 7.38 | 10/15/20 | 2,435,000 | a | 2,611,538 |
| QVC, | | | | | |
| Sr. Scd. Notes | 7.50 | 10/1/19 | 4,450,000 | a | 4,794,875 |
| Rite Aid, | | | | | |
| Gtd. Notes | 8.63 | 3/1/15 | 1,300,000 | b | 1,261,000 |
| Rite Aid, | | | | | |
| Gtd. Notes | 9.50 | 6/15/17 | 6,160,000 | b | 5,651,800 |
| Rite Aid, | | | | | |
| Scd. Notes | 10.38 | 7/15/16 | 2,780,000 | b | 2,967,650 |
| | | | | | 29,471,575 |
| Services—9.5% | | | | | |
| ARAMARK Holdings, | | | | | |
| Sr. Unscd. Notes | 8.63 | 5/1/16 | 5,645,000 | a | 5,842,575 |
| Brickman Group Holdings, | | | | | |
| Sr. Notes | 9.13 | 11/1/18 | 9,143,000 | a | 8,182,985 |
| Cardtronics, | | | | | |
| Gtd. Notes | 8.25 | 9/1/18 | 6,030,000 | | 6,587,775 |
| Casella Waste Systems, | | | | | |
| Gtd. Notes | 7.75 | 2/15/19 | 6,900,000 | | 6,779,250 |
18
| | | | | |
| | Coupon | Maturity | Principal | | |
| Bonds and Notes (continued) | Rate (%) | Date | Amount ($) | | Value ($) |
| Services (continued) | | | | | |
| Cenveo, | | | | | |
| Scd. Notes | 8.88 | 2/1/18 | 5,965,000 | b | 5,234,288 |
| FTI Consulting, | | | | | |
| Gtd. Notes | 6.75 | 10/1/20 | 4,705,000 | | 4,881,438 |
| Garda World Security, | | | | | |
| Sr. Unscd. Notes | 9.75 | 3/15/17 | 4,485,000 | a | 4,574,700 |
| Geo Group, | | | | | |
| Gtd. Notes | 6.63 | 2/15/21 | 3,000,000 | b | 3,030,000 |
| Good Sam Enterprises, | | | | | |
| Sr. Scd. Notes | 11.50 | 12/1/16 | 4,695,000 | | 4,624,575 |
| Interactive Data, | | | | | |
| Gtd. Notes | 10.25 | 8/1/18 | 3,995,000 | | 4,334,575 |
| Marquette Transportation Finance, | | | | | |
| Scd. Notes | 10.88 | 1/15/17 | 6,565,000 | | 6,647,063 |
| Mobile Mini, | | | | | |
| Gtd. Notes | 7.88 | 12/1/20 | 5,800,000 | | 5,858,000 |
| Navios Maritime Acquisition, | | | | | |
| Sr. Scd. Notes | 8.63 | 11/1/17 | 4,700,000 | b | 3,431,000 |
| Navios Maritime Holdings, | | | | | |
| Sr. Scd. Notes | 8.88 | 11/1/17 | 2,005,000 | b | 1,919,788 |
| Navios South American Logistics, | | | | | |
| Gtd. Notes | 9.25 | 4/15/19 | 4,105,000 | a,b | 3,304,525 |
| Ultrapetrol Bahamas, | | | | | |
| First Mortgage Notes | 9.00 | 11/24/14 | 4,872,000 | | 4,445,700 |
| United Rentals North America, | | | | | |
| Gtd. Notes | 8.38 | 9/15/20 | 2,820,000 | b | 2,763,600 |
| United Rentals North America, | | | | | |
| Gtd. Notes | 9.25 | 12/15/19 | 1,230,000 | | 1,294,575 |
| WCA Waste, | | | | | |
| Gtd. Notes | 7.50 | 6/15/19 | 4,680,000 | a | 4,750,200 |
| West, | | | | | |
| Gtd. Notes | 7.88 | 1/15/19 | 3,250,000 | | 3,241,875 |
| West, | | | | | |
| Gtd. Notes | 8.63 | 10/1/18 | 6,645,000 | | 6,744,675 |
| | | | | | 98,473,162 |
| Technology—4.8% | | | | | |
| CDW Finance, | | | | | |
| Sr. Scd. Notes | 8.00 | 12/15/18 | 4,890,000 | c | 5,122,275 |
STATEMENT OF INVESTMENTS (continued)
| | | | | |
| | Coupon | Maturity | Principal | | |
| Bonds and Notes (continued) | Rate (%) | Date | Amount ($) | | Value ($) |
| Technology (continued) | | | | | |
| CDW Finance, | | | | | |
| Gtd. Notes | 8.50 | 4/1/19 | 5,555,000 | | 5,624,437 |
| Ceridian, | | | | | |
| Gtd. Notes | 11.25 | 11/15/15 | 3,358,000 | c | 2,636,030 |
| Ceridian, | | | | | |
| Gtd. Notes | 12.25 | 11/15/15 | 8,301,490 | b | 6,578,931 |
| CommScope, | | | | | |
| Gtd. Notes | 8.25 | 1/15/19 | 8,025,000 | a | 8,065,125 |
| CPI International, | | | | | |
| Gtd. Notes | 8.00 | 2/15/18 | 3,410,000 | | 2,855,875 |
| Eagle Parent, | | | | | |
| Gtd. Notes | 8.63 | 5/1/19 | 6,890,000 | a,b | 6,614,400 |
| Equinix, | | | | | |
| Sr. Unsed. Notes | 7.00 | 7/15/21 | 200,000 | | 211,500 |
| First Data, | | | | | |
| Scd. Notes | 8.25 | 1/15/21 | 3,199,000 | a,b | 2,879,100 |
| First Data, | | | | | |
| Gtd. Notes | 9.88 | 9/24/15 | 258,000 | | 242,520 |
| First Data, | | | | | |
| Gtd. Notes | 9.88 | 9/24/15 | 480,000 | b | 453,600 |
| First Data, | | | | | |
| Gtd. Notes | 10.55 | 9/24/15 | 2,585,000 | | 2,478,369 |
| Goodman Networks, | | | | | |
| Sr. Scd. Notes | 12.13 | 7/1/18 | 2,725,000 | a | 2,609,188 |
| SunGard Data Systems, | | | | | |
| Gtd. Notes | 7.38 | 11/15/18 | 3,010,000 | | 3,096,537 |
| | | | | | 49,467,887 |
| Telecommunications—6.3% | | | | | |
| Cincinnati Bell, | | | | | |
| Gtd. Notes | 8.38 | 10/15/20 | 7,485,000 | | 7,485,000 |
| Digicel Group, | | | | | |
| Sr. Unscd. Notes | 8.88 | 1/15/15 | 6,800,000 | a | 6,732,000 |
| Digicel Group, | | | | | |
| Sr. Unscd. Notes | 9.13 | 1/15/15 | 3,542,457 | a | 3,489,320 |
| Digicel Group, | | | | | |
| Sr. Unscd. Notes | 10.50 | 4/15/18 | 1,408,000 | a | 1,429,120 |
| Digicel, | | | | | |
| Sr. Unscd. Notes | 8.25 | 9/1/17 | 2,955,000 | a | 2,999,325 |
20
| | | | | |
| | Coupon | Maturity | Principal | | |
| Bonds and Notes (continued) | Rate (%) | Date | Amount ($) | | Value ($) |
| Telecommunications (continued) | | | | | |
| EH Holding, | | | | | |
| Gtd. Notes | 7.63 | 6/15/21 | 5,010,000 | a | 5,285,550 |
| Intelsat Jackson Holdings, | | | | | |
| Gtd. Notes | 9.50 | 6/15/16 | 4,985,000 | | 5,221,788 |
| Intelsat Jackson Holdings, | | | | | |
| Gtd. Notes | 11.25 | 6/15/16 | 2,090,000 | | 2,201,031 |
| Intelsat Luxembourg, | | | | | |
| Gtd. Notes | 11.25 | 2/4/17 | 7,335,000 | | 7,114,950 |
| Nextel Communications, | | | | | |
| Gtd. Notes, Ser. E | 6.88 | 10/31/13 | 2,858,000 | | 2,858,000 |
| NII Capital, | | | | | |
| Gtd. Notes | 7.63 | 4/1/21 | 4,615,000 | | 4,603,462 |
| Sprint Capital, | | | | | |
| Gtd. Notes | 6.90 | 5/1/19 | 5,320,000 | | 4,402,300 |
| UPCB Finance V, | | | | | |
| Sr. Scd. Notes | 7.25 | 11/15/21 | 2,320,000 | a | 2,360,600 |
| Wind Acquisition Finance, | | | | | |
| Scd. Notes | 11.75 | 7/15/17 | 2,100,000 | a | 1,890,000 |
| Wind Acquisition Holdings Finance, | | | | | |
| Sr. Scd. Notes | 12.25 | 7/15/17 | 4,647,764 | a | 3,427,726 |
| Windstream, | | | | | |
| Gtd. Notes | 7.75 | 10/15/20 | 3,620,000 | | 3,760,275 |
| | | | | | 65,260,447 |
| Utilities—4.5% | | | | | |
| AES, | | | | | |
| Sr. Unscd. Notes | 7.38 | 7/1/21 | 5,735,000 | a | 6,208,137 |
| AES, | | | | | |
| Sr. Unscd. Notes | 8.00 | 10/15/17 | 2,500,000 | | 2,762,500 |
| AES, | | | | | |
| Sr. Unscd. Notes | 9.75 | 4/15/16 | 3,765,000 | | 4,329,750 |
| Calpine, | | | | | |
| Sr. Scd. Notes | 7.25 | 10/15/17 | 1,380,000 | a | 1,455,900 |
| Calpine, | | | | | |
| Sr. Scd. Notes | 7.50 | 2/15/21 | 5,740,000 | a | 6,170,500 |
| Calpine, | | | | | |
| Sr. Scd. Notes | 7.88 | 1/15/23 | 2,855,000 | a | 3,083,400 |
| GenOn Energy, | | | | | |
| Sr. Unscd. Notes | 9.50 | 10/15/18 | 10,295,000 | b | 10,475,163 |
STATEMENT OF INVESTMENTS (continued)
| | | | | | |
| | | Coupon | Maturity | Principal | | |
| | Bonds and Notes (continued) | Rate (%) | Date | Amount ($) | | Value ($) |
| | Utilities (continued) | | | | | |
| | North American Energy Alliance, | | | | | |
| | Scd. Notes | 10.88 | 6/1/16 | 2,935,000 | | 3,125,775 |
| | NRG Energy, | | | | | |
| | Gtd. Notes | 7.63 | 1/15/18 | 2,350,000 | | 2,361,750 |
| | NRG Energy, | | | | | |
| | Gtd. Notes | 7.63 | 5/15/19 | 6,875,000 | a | 6,771,875 |
| | | | | | | 46,744,750 |
| | Total Bonds and Notes | | | | | |
| | (cost $985,261,324) | | | | | 973,929,407 |
| |
| | Preferred Stocks—.3% | | | Shares | | Value ($) |
| | Special Purpose Entity | | | | | |
| | GMAC Capital Trust I, | | | | | |
| | Ser. 2, Cum., $1.40 | | | | | |
| | (cost $4,475,208) | | | 172,552 | c | 3,337,155 |
| |
| | | | | Number of | | |
| | Warrants—.0% | | | Warrants | | Value ($) |
| | Automobiles—.0% | | | | | |
| | General Motors (7/10/16) | | | 1 | d | 12 |
| | General Motors (7/10/19) | | | 734 | d | 5,740 |
| | Total Warrants | | | | | |
| | (cost $0) | | | | | 5,752 |
| | | | | Principal | | |
| Short-Term Investments—.0% | | | Amount ($) | | Value ($) |
| | U.S. Treasury Bills; | | | | | |
| | 0.03%, 5/17/12 | | | | | |
| | (cost $99,988) | | | 100,000 | | 99,988 |
| |
| | Other Investment—4.1% | | | Shares | | Value ($) |
| | Registered Investment Company; | | | | | |
| | Dreyfus Institutional Preferred | | | | | |
| | Plus Money Market Fund | | | | | |
| | (cost $42,531,755) | | | 42,531,755 | e | 42,531,755 |
22
| | | | |
| Investment of Cash Collateral | | |
| for Securities Loaned—9.2% | Shares | Value ($) |
| Registered Investment Company; | | |
| Dreyfus Institutional Cash Advantage Fund | | |
| (cost $95,781,799) | 95,781,799e | 95,781,799 |
| Total Investments (cost $1,128,150,074) | 107.6% | 1,115,685,856 |
| Liabilities, Less Cash and Receivables | (7.6%) | (78,786,868) |
| Net Assets | 100.0% | 1,036,898,988 |
|
| a Securities exempt from registration under Rule 144A of the Securities Act of 1933.These securities may be resold in |
| transactions exempt from registration, normally to qualified institutional buyers.At December 31, 2011, these |
| securities were valued at $350,192,321 or 33.8% of net assets. |
| b Security, or portion thereof, on loan.At December 31, 2011, the value of the fund’s securities on loan was |
| $91,419,685 and the value of the collateral held by the fund was $95,781,799. |
| c Variable rate security—interest rate subject to periodic change. |
| d Non-income producing security. |
| e Investment in affiliated money market mutual fund. |
| | | |
| Portfolio Summary (Unaudited)† | | |
| |
| | Value (%) | | Value (%) |
| Corporate Bonds | 94.0 | Preferred Stocks | .3 |
| Short-Term/ | | Warrants | .0 |
| Money Market Investments | 13.3 | | 107.6 |
| |
| † Based on net assets. | | | |
| See notes to financial statements. | | | |
|
| STATEMENT OF ASSETS AND LIABILITIES |
| December 31, 2011 |
| | | | | |
| | | | Cost | Value |
| Assets ($): | | | | |
| Investments in securities—See Statement of Investments (including | | |
| securities on loan, valued at $91,419,685)—Note 1(c): | | |
| Unaffiliated issuers | | | 989,836,520 | 977,372,302 |
| Affiliated issuers | | | 138,313,554 | 138,313,554 |
| Cash | | | | 4,626,563 |
| Cash denominated in foreign currencies | | 749,705 | 728,168 |
| Dividends, interest and securities lending income receivable | | 20,816,604 |
| Receivable for shares of Beneficial Interest subscribed | | | 3,059,285 |
| Unrealized appreciation on forward foreign | | | |
| currency exchange contracts—Note 4 | | | 85,517 |
| | | | | 1,145,001,993 |
| Liabilities ($): | | | | |
| Due to The Dreyfus Corporation and affiliates—Note 3(b) | | 778,827 |
| Liability for securities on loan—Note 1(c) | | | 95,781,799 |
| Payable for shares of Beneficial Interest redeemed | | | 11,532,750 |
| Unrealized depreciation on forward foreign | | | |
| currency exchange contracts—Note 4 | | | 9,629 |
| | | | | 108,103,005 |
| Net Assets ($) | | | | 1,036,898,988 |
| Composition of Net Assets ($): | | | | |
| Paid-in capital | | | | 1,151,612,998 |
| Accumulated undistributed investment income—net | | | 493,825 |
| Accumulated net realized gain (loss) on investments | | | (102,778,697) |
| Accumulated net unrealized appreciation (depreciation) | | |
| on investments and foreign currency transactions | | | (12,429,138) |
| Net Assets ($) | | | | 1,036,898,988 |
| |
| |
| Net Asset Value Per Share | | | | |
| | Class A | Class B | Class C | Class I |
| Net Assets ($) | 338,799,952 | 2,602,266 | 118,706,330 | 576,790,440 |
| Shares Outstanding | 54,554,201 | 418,989 | 19,107,670 | 92,795,158 |
| Net Asset Value Per Share ($) | 6.21 | 6.21 | 6.21 | 6.22 |
| |
| See notes to financial statements. | | | | |
24
|
| STATEMENT OF OPERATIONS |
| Year Ended December 31, 2011 |
| | |
| Investment Income ($): | |
| Income: | |
| Interest | 86,675,252 |
| Income from securities lending—Note 1(c) | 559,309 |
| Dividends; | |
| Unaffiliated issuers | 393,007 |
| Affiliated issuers | 27,871 |
| Total Income | 87,655,439 |
| Expenses: | |
| Management fee—Note 3(a) | 7,267,007 |
| Distribution and service fees—Note 3(b) | 2,195,331 |
| Trustees’ fees—Note 3(a) | 71,737 |
| Loan commitment fees—Note 2 | 17,435 |
| Interest expense—Note 2 | 1,132 |
| Total Expenses | 9,552,642 |
| Less—Trustees’ fees reimbursed by the Manager—Note 3(a) | (71,737) |
| Net Expenses | 9,480,905 |
| Investment Income—Net | 78,174,534 |
| Realized and Unrealized Gain (Loss) on Investments—Note 4 ($): | |
| Net realized gain (loss) on investments and foreign currency transactions | 9,051,822 |
| Net realized gain (loss) on swap transactions | (2,308,827) |
| Net realized gain (loss) on forward foreign currency exchange contracts | 1,075,571 |
| Net Realized Gain (Loss) | 7,818,566 |
| Net unrealized appreciation (depreciation) on | |
| investments and foreign currency transactions | (68,415,141) |
| Net unrealized appreciation (depreciation) on | |
| forward foreign currency exchange contracts | 75,888 |
| Net Unrealized Appreciation (Depreciation) | (68,339,253) |
| Net Realized and Unrealized Gain (Loss) on Investments | (60,520,687) |
| Net Increase in Net Assets Resulting from Operations | 17,653,847 |
| |
| See notes to financial statements. | |
STATEMENT OF CHANGES IN NET ASSETS
| | | | |
| | Year Ended December 31, |
| | 2011 | 2010 |
| Operations ($): | | |
| Investment income—net | 78,174,534 | 84,344,513 |
| Net realized gain (loss) on investments | 7,818,566 | 28,751,469 |
| Net unrealized appreciation | | |
| (depreciation) on investments | (68,339,253) | (3,163,302) |
| Net Increase (Decrease) in Net Assets | | |
| Resulting from Operations | 17,653,847 | 109,932,680 |
| Dividends to Shareholders from ($): | | |
| Investment income—net: | | |
| Class A Shares | (27,635,290) | (33,286,941) |
| Class B Shares | (409,291) | (1,356,850) |
| Class C Shares | (8,787,269) | (11,069,517) |
| Class I Shares | (43,654,301) | (44,108,787) |
| Total Dividends | (80,486,151) | (89,822,095) |
| Beneficial Interest Transactions ($): | | |
| Net proceeds from shares sold: | | |
| Class A Shares | 136,806,926 | 97,928,061 |
| Class B Shares | 135,638 | 352,891 |
| Class C Shares | 19,892,056 | 21,583,100 |
| Class I Shares | 303,522,777 | 258,158,429 |
| Dividends reinvested: | | |
| Class A Shares | 22,549,790 | 26,924,576 |
| Class B Shares | 307,000 | 992,798 |
| Class C Shares | 5,112,982 | 6,714,116 |
| Class I Shares | 17,568,875 | 15,399,278 |
| Cost of shares redeemed: | | |
| Class A Shares | (145,107,966) | (145,973,940) |
| Class B Shares | (7,643,267) | (13,948,913) |
| Class C Shares | (26,533,193) | (28,327,493) |
| Class I Shares | (255,548,488) | (140,494,086) |
| Increase (Decrease) in Net Assets from | | |
| Beneficial Interest Transactions | 71,063,130 | 99,308,817 |
| Total Increase (Decrease) in Net Assets | 8,230,826 | 119,419,402 |
| Net Assets ($): | | |
| Beginning of Period | 1,028,668,162 | 909,248,760 |
| End of Period | 1,036,898,988 | 1,028,668,162 |
| Undistributed investment income—net | 493,825 | 395,721 |
26
| | | | |
| | Year Ended December 31, |
| | 2011 | 2010 |
| Capital Share Transactions: | | |
| Class Aa | | |
| Shares sold | 21,019,936 | 15,151,222 |
| Shares issued for dividends reinvested | 3,465,683 | 4,168,352 |
| Shares redeemed | (22,322,755) | (22,612,119) |
| Net Increase (Decrease) in Shares Outstanding | 2,162,864 | (3,292,545) |
| Class Ba | | |
| Shares sold | 20,551 | 54,620 |
| Shares issued for dividends reinvested | 46,596 | 153,881 |
| Shares redeemed | (1,159,478) | (2,156,919) |
| Net Increase (Decrease) in Shares Outstanding | (1,092,331) | (1,948,418) |
| Class C | | |
| Shares sold | 3,065,892 | 3,327,504 |
| Shares issued for dividends reinvested | 786,919 | 1,039,667 |
| Shares redeemed | (4,113,629) | (4,389,798) |
| Net Increase (Decrease) in Shares Outstanding | (260,818) | (22,627) |
| Class I | | |
| Shares sold | 47,556,680 | 39,786,259 |
| Shares issued for dividends reinvested | 2,691,602 | 2,377,328 |
| Shares redeemed | (39,608,483) | (21,699,672) |
| Net Increase (Decrease) in Shares Outstanding | 10,639,799 | 20,463,915 |
|
| a During the period ended December 31, 2011, 367,643 Class B shares representing $2,440,186 were automatically |
| converted to 361,726 Class A shares and during the period ended December 31, 2010, 656,573 Class B shares |
| representing $4,251,782 were automatically converted to 656,762 Class A shares. |
See notes to financial statements.
FINANCIAL HIGHLIGHTS
The following tables describe the performance for each share class for the fiscal periods indicated.All information (except portfolio turnover rate) reflects financial results for a single fund share.Total return shows how much your investment in the fund would have increased (or decreased) during each period, assuming you had reinvested all dividends and distributions.These figures have been derived from the fund’s financial statements.
| | | | | | | | | | |
| | | Year Ended December 31, | |
| Class A Shares | 2011 | 2010 | 2009 | 2008 | 2007 |
| Per Share Data ($): | | | | | |
| Net asset value, beginning of period | 6.62 | 6.48 | 5.06 | 6.92 | 7.33 |
| Investment Operations: | | | | | |
| Investment income—neta | .49 | .59 | .54 | .50 | .49 |
| Net realized and unrealized | | | | | |
| gain (loss) on investments | (.40) | .17 | 1.43 | (1.82) | (.37) |
| Total from Investment Operations | .09 | .76 | 1.97 | (1.32) | .12 |
| Distributions: | | | | | |
| Dividends from investment income—net | (.50) | (.62) | (.55) | (.54) | (.53) |
| Net asset value, end of period | 6.21 | 6.62 | 6.48 | 5.06 | 6.92 |
| Total Return (%)b | 1.33 | 12.50 | 40.43 | (20.17) | 2.03 |
| Ratios/Supplemental Data (%): | | | | | |
| Ratio of total expenses | | | | | |
| to average net assets | .96 | .96 | .96 | .96 | .96 |
| Ratio of net expenses | | | | | |
| to average net assets | .95 | .95 | .95 | .95 | .95 |
| Ratio of net investment income | | | | | |
| to average net assets | 7.50 | 9.05 | 8.86 | 7.89 | 6.78 |
| Portfolio Turnover Rate | 75.87 | 70.07 | 77.94 | 48.85 | 50.65 |
| Net Assets, end of period ($ x 1,000) | 338,800 | 346,594 | 360,921 | 119,560 | 169,453 |
| |
| a | Based on average shares outstanding at each month end. |
| b | Exclusive of sales charge. |
See notes to financial statements.
28
| | | | | | | | | | |
| | | Year Ended December 31, | |
| Class B Shares | 2011 | 2010 | 2009 | 2008 | 2007 |
| Per Share Data ($): | | | | | |
| Net asset value, beginning of period | 6.62 | 6.48 | 5.06 | 6.93 | 7.34 |
| Investment Operations: | | | | | |
| Investment income—neta | .45 | .53 | .49 | .46 | .45 |
| Net realized and unrealized | | | | | |
| gain (loss) on investments | (.39) | .20 | 1.45 | (1.82) | (.37) |
| Total from Investment Operations | .06 | .73 | 1.94 | (1.36) | .08 |
| Distributions: | | | | | |
| Dividends from investment income—net | (.47) | (.59) | (.52) | (.51) | (.49) |
| Net asset value, end of period | 6.21 | 6.62 | 6.48 | 5.06 | 6.93 |
| Total Return (%)b | .82 | 11.94 | 39.78 | (20.69) | 1.53 |
| Ratios/Supplemental Data (%): | | | | | |
| Ratio of total expenses | | | | | |
| to average net assets | 1.46 | 1.46 | 1.46 | 1.46 | 1.46 |
| Ratio of net expenses | | | | | |
| to average net assets | 1.45 | 1.45 | 1.45 | 1.45 | 1.45 |
| Ratio of net investment income | | | | | |
| to average net assets | 7.05 | 8.48 | 8.35 | 7.31 | 6.24 |
| Portfolio Turnover Rate | 75.87 | 70.07 | 77.94 | 48.85 | 50.65 |
| Net Assets, end of period ($ x 1,000) | 2,602 | 10,002 | 22,434 | 17,568 | 39,892 |
| |
| a | Based on average shares outstanding at each month end. |
| b | Exclusive of sales charge. |
See notes to financial statements.
FINANCIAL HIGHLIGHTS (continued)
| | | | | | | | | | |
| | | Year Ended December 31, | |
| Class C Shares | 2011 | 2010 | 2009 | 2008 | 2007 |
| Per Share Data ($): | | | | | |
| Net asset value, beginning of period | 6.62 | 6.48 | 5.06 | 6.93 | 7.34 |
| Investment Operations: | | | | | |
| Investment income—neta | .44 | .54 | .50 | .45 | .43 |
| Net realized and unrealized | | | | | |
| gain (loss) on investments | (.40) | .18 | 1.42 | (1.83) | (.36) |
| Total from Investment Operations | .04 | .72 | 1.92 | (1.38) | .07 |
| Distributions: | | | | | |
| Dividends from investment income—net | (.45) | (.58) | (.50) | (.49) | (.48) |
| Net asset value, end of period | 6.21 | 6.62 | 6.48 | 5.06 | 6.93 |
| Total Return (%)b | .58 | 11.66 | 39.41 | (20.89) | 1.28 |
| Ratios/Supplemental Data (%): | | | | | |
| Ratio of total expenses | | | | | |
| to average net assets | 1.71 | 1.71 | 1.71 | 1.71 | 1.71 |
| Ratio of net expenses | | | | | |
| to average net assets | 1.70 | 1.70 | 1.70 | 1.70 | 1.70 |
| Ratio of net investment income | | | | | |
| to average net assets | 6.76 | 8.31 | 8.15 | 7.12 | 6.02 |
| Portfolio Turnover Rate | 75.87 | 70.07 | 77.94 | 48.85 | 50.65 |
| Net Assets, end of period ($ x 1,000) | 118,706 | 128,173 | 125,724 | 34,374 | 53,294 |
| |
| a | Based on average shares outstanding at each month end. |
| b | Exclusive of sales charge. |
See notes to financial statements.
30
| | | | | | | | | | |
| | | Year Ended December 31, | |
| Class I Shares | 2011 | 2010 | 2009 | 2008 | 2007a |
| Per Share Data ($): | | | | | |
| Net asset value, beginning of period | 6.62 | 6.49 | 5.06 | 6.92 | 7.33 |
| Investment Operations: | | | | | |
| Investment income—netb | .50 | .60 | .54 | .51 | .52 |
| Net realized and unrealized | | | | | |
| gain (loss) on investments | (.38) | .17 | 1.45 | (1.82) | (.38) |
| Total from Investment Operations | .12 | .77 | 1.99 | (1.31) | .14 |
| Distributions: | | | | | |
| Dividends from investment income—net | (.52) | (.64) | (.56) | (.55) | (.55) |
| Net asset value, end of period | 6.22 | 6.62 | 6.49 | 5.06 | 6.92 |
| Total Return (%) | 1.74 | 12.59 | 40.99 | (20.06) | 2.29 |
| Ratios/Supplemental Data (%): | | | | | |
| Ratio of total expenses | | | | | |
| to average net assets | .71 | .71 | .71 | .72 | .71 |
| Ratio of net expenses | | | | | |
| to average net assets | .70 | .70 | .70 | .69 | .70 |
| Ratio of net investment income | | | | | |
| to average net assets | 7.73 | 9.26 | 9.20 | 9.43 | 7.01 |
| Portfolio Turnover Rate | 75.87 | 70.07 | 77.94 | 48.85 | 50.65 |
| Net Assets, end of period ($ x 1,000) | 576,790 | 543,899 | 400,170 | 183,546 | 17,368 |
| |
| a | Effective June 1, 2007, Class R shares were redesignated as Class I shares. |
| b | Based on average shares outstanding at each month end. |
See notes to financial statements.
NOTES TO FINANCIAL STATEMENTS
NOTE 1—Significant Accounting Policies:
Dreyfus HighYield Fund (the “fund”) is a separate diversified series of The Dreyfus/Laurel Funds Trust (the “Trust”), which is registered under the Investment Company Act of 1940, as amended (the “Act”), as an open-end management investment company and operates as a series company currently offering five series, including the fund.The fund’s investment objective seeks to maximize total return, consisting of capital appreciation and current income.The Dreyfus Corporation (the “Manager” or “Dreyfus”), a wholly-owned subsidiary of The Bank of New York Mellon Corporation (“BNY Mellon”), serves as the fund’s investment adviser.
MBSC Securities Corporation (the “Distributor”), a wholly-owned subsidiary of the Manager, is the distributor of the fund’s shares.The fund is authorized to issue an unlimited number of $.001 par value shares of Beneficial Interest in each of the following classes of shares: Class A, Class B, Class C and Class I. Class A, Class B and Class C shares are sold primarily to retail investors through financial intermediaries and bear a distribution fee and/or shareholder services fee. Class A shares are subject to a sales charge imposed at the time of purchase. Class B shares are subject to a contingent deferred sales charge (“CDSC”) imposed on Class B share redemptions made within six years of purchase and automatically convert to Class A shares after six years.The fund no longer offers Class B shares, except in connection with dividend reinvestment and permitted exchanges of Class B shares and, effective on or about March 13, 2012, all outstanding Class B shares will be automatically convert to Class A shares. Class C shares are subject to a CDSC imposed on Class C shares redeemed within one year of purchase. Class I shares are sold primarily to bank trust departments and other financial service providers (including The Bank of New York Mellon, a subsidiary of BNY Mellon and an affiliate of Dreyfus), acting on behalf of customers having a qualified trust or investment account or relationship at such institution, and bear no distribution or shareholder services fees. Class I shares are offered without a front-end sales charge or CDSC. Other differences between the classes
32
include the services offered to and the expenses borne by each class, the allocation of certain transfer agency costs and certain voting rights. Income, expenses (other than expenses attributable to a specific class), and realized and unrealized gains or losses on investments are allocated to each class of shares based on its relative net assets.
The Trust accounts separately for the assets, liabilities and operations of each series. Expenses directly attributable to each series are charged to that series’ operations; expenses which are applicable to all series are allocated among them on a pro rata basis.
The Financial Accounting Standards Board (“FASB”) Accounting Standards Codification (“ASC”) is the exclusive reference of authoritative U.S. generally accepted accounting principles (“GAAP”) recognized by the FASB to be applied by nongovernmental entities. Rules and interpretive releases of the Securities and Exchange Commission (“SEC”) under authority of federal laws are also sources of authoritative GAAP for SEC registrants. The fund’s financial statements are prepared in accordance with GAAP, which may require the use of management estimates and assumptions.Actual results could differ from those estimates.
(a) Portfolio valuation: The fair value of a financial instrument is the amount that would be received to sell an asset or paid to transfer a liability in an orderly transaction between market participants at the measurement date (i.e. the exit price). GAAP establishes a fair value hierarchy that prioritizes the inputs of valuation techniques used to measure fair value.This hierarchy gives the highest priority to unadjusted quoted prices in active markets for identical assets or liabilities (Level 1 measurements) and the lowest priority to unobservable inputs (Level 3 measurements).
Additionally, GAAP provides guidance on determining whether the volume and activity in a market has decreased significantly and whether such a decrease in activity results in transactions that are not orderly. GAAP requires enhanced disclosures around valuation inputs and techniques used during annual and interim periods.
NOTES TO FINANCIAL STATEMENTS (continued)
Various inputs are used in determining the value of the fund’s investments relating to fair value measurements.These inputs are summarized in the three broad levels listed below:
Level 1—unadjusted quoted prices in active markets for identical investments.
Level 2—other significant observable inputs (including quoted prices for similar investments, interest rates, prepayment speeds, credit risk, etc.).
Level 3—significant unobservable inputs (including the fund’s own assumptions in determining the fair value of investments).
The inputs or methodology used for valuing securities are not necessarily an indication of the risk associated with investing in those securities.
Changes in valuation techniques may result in transfers in or out of an assigned level within the disclosure hierarchy. Valuation techniques used to value the fund’s investments are as follows:
Registered investment companies that are not traded on an exchange are valued at their net asset value and are categorized within Level 1 of the fair value hierarchy.
Investments in securities excluding short-term investments (other than U.S. Treasury Bills), swaps and forward foreign currency exchange contracts (“forward contracts”) are valued each business day by an independent pricing service (the “Service”) approved by the Board of Trustees. Investments for which quoted bid prices are readily available and are representative of the bid side of the market in the judgment of the Service are valued at the mean between the quoted bid prices (as obtained by the Service from dealers in such securities) and asked prices (as calculated by the Service based upon its evaluation of the market for such securities). Other investments (which constitute a majority of the portfolio securities) are valued as determined by the Service, based on methods which include consideration of: yields or prices of securities of comparable quality, coupon, maturity and type; indications as to values from dealers; and general market conditions.These securities are generally categorized within Level 2 of the fair value hierarchy.
34
U.S. Treasury Bills are valued at the mean price between quoted bid prices and asked prices by the Service. These securities are generally categorized within Level 2 of the fair value hierarchy
The Service’s procedures are reviewed by Dreyfus under the general supervision of the Board of Trustees.
When market quotations or official closing prices are not readily available, or are determined not to reflect accurately fair value, such as when the value of a security has been significantly affected by events after the close of the exchange or market on which the security is principally traded (for example, a foreign exchange or market), but before the fund calculates its net asset value, the fund may value these investments at fair value as determined in accordance with the procedures approved by the Board of Trustees. Certain factors may be considered when fair valuing investments such as: fundamental analytical data, the nature and duration of restrictions on disposition, an evaluation of the forces that influence the market in which the securities are purchased and sold, and public trading in similar securities of the issuer or comparable issuers. These securities are either categorized as Level 2 or 3 depending on the relevant inputs used.
For restricted securities where observable inputs are limited, assumptions about market activity and risk are used and are categorized within Level 3 of the fair value hierarchy.
Investments in swap transactions are valued each business day by the Service. Swaps are valued by the Service by using a swap pricing model which incorporates among other factors, default probabilities, recovery rates, credit curves of the underlying issuer and swap spreads on interest rates. These securities are generally categorized within Level 2 of the fair value hierarchy. Investments denominated in foreign currencies are translated to U.S. dollars at the prevailing rates of exchange. Forward contracts are valued at the forward rate. These securities are generally categorized within Level 2 of the fair value hierarchy.
NOTES TO FINANCIAL STATEMENTS (continued)
The following is a summary of the inputs used as of December 31, 2011 in valuing the fund’s investments:
| | | | | | |
| | | Level 2—Other | | Level 3— | | |
| | Level 1— | Significant | | Significant | | |
| | Unadjusted | Observable | | Unobservable | | |
| | Quoted Prices | Inputs | | Inputs | Total | |
| Assets ($) | | | | | | |
| Investments in Securities: | | | | | |
| Corporate Bonds† | — | 973,929,407 | | — | 973,929,407 | |
| Equity Securities— | | | | | | |
| Domestic† | — | 3,337,155 | | — | 3,337,155 | |
| Mutual Funds | 138,313,554 | — | | — | 138,313,554 | |
| U.S. Treasury | — | 99,988 | | — | 99,988 | |
| Warrants† | 5,752 | — | | — | 5,752 | |
| Other Financial | | | | | | |
| Instruments: | | | | | | |
| Forward Foreign | | | | | | |
| Currency Exchange | | | | | | |
| Contracts†† | — | 85,517 | | — | 85,517 | |
| Liabilities ($) | | | | | | |
| Other Financial | | | | | | |
| Instruments: | | | | | | |
| Forward Foreign | | | | | | |
| Currency Exchange | | | | | | |
| Contracts†† | — | (9,629 | ) | — | (9,629 | ) |
| |
| † | See Statement of Investments for additional detailed categorizations. |
| †† | Amount shown represents unrealized appreciation (depreciation) at period end. |
In May 2011, FASB issued Accounting Standards Update (“ASU”) No. 2011-04 “Amendments to Achieve Common FairValue Measurement and Disclosure Requirements in GAAP and International Financial Reporting Standards (“IFRS”)” (“ASU 2011-04”). ASU 2011-04 includes common requirements for measurement of and disclosure about fair value between GAAP and IFRS. ASU 2011-04 will require reporting entities to disclose the following information for fair value measurements categorized within Level 3 of the fair value hierarchy: quantitative information about the unobservable inputs used in the fair value measurement, the valuation processes used by the reporting entity and a narrative description of the sensitivity of the fair value measurement to changes in unobservable inputs and the interrelationships
36
between those unobservable inputs. In addition, ASU 2011-04 will require reporting entities to make disclosures about amounts and reasons for all transfers in and out of Level 1 and Level 2 fair value mea-surements.The new and revised disclosures are effective for interim and annual reporting periods beginning after December 15, 2011. At this time, management is evaluating the implications of ASU 2011-04 and its impact on the financial statements.
(b) Foreign currency transactions: The fund does not isolate that portion of the results of operations resulting from changes in foreign exchange rates on investments from the fluctuations arising from changes in the market prices of securities held. Such fluctuations are included with the net realized and unrealized gain or loss on investments.
Net realized foreign exchange gains or losses arise from sales of foreign currencies, currency gains or losses realized on securities transactions between trade and settlement date, and the difference between the amounts of dividends, interest and foreign withholding taxes recorded on the fund’s books and the U.S. dollar equivalent of the amounts actually received or paid. Net unrealized foreign exchange gains and losses arise from changes in the value of assets and liabilities other than investments resulting from changes in exchange rates. Foreign currency gains and losses on investments are included with net realized and unrealized gain or loss on investments.
(c) Securities transactions and investment income: Securities transactions are recorded on a trade date basis. Realized gains and losses from securities transactions are recorded on the identified cost basis. Dividend income is recognized on the ex-dividend date and interest income, including, where applicable, accretion of discount and amortization of premium on investments, is recognized on the accrual basis.
Pursuant to a securities lending agreement with The Bank of New York Mellon, the fund may lend securities to qualified institutions. It is the fund’s policy that, at origination, all loans are secured by collateral of at least 102% of the value of U.S. securities loaned and 105% of
NOTES TO FINANCIAL STATEMENTS (continued)
the value of foreign securities loaned. Collateral equivalent to at least 100% of the market value of securities on loan is maintained at all times. Collateral is either in the form of cash, which can be invested in certain money market mutual funds managed by the Manager, U.S. Government and Agency securities or letters of credit. The fund is entitled to receive all income on securities loaned, in addition to income earned as a result of the lending transaction. Although each security loaned is fully collateralized, the fund bears the risk of delay in recovery of, or loss of rights in, the securities loaned should a borrower fail to return the securities in a timely manner. During the period ended December 31, 2011, The Bank of New York Mellon earned $301,166 from lending portfolio securities, pursuant to the securities lending agreement.
(d) Affiliated issuers: Investments in other investment companies advised by Dreyfus are defined as “affiliated” in the Act.
The fund may invest in shares of certain affiliated investment companies also advised or managed by Dreyfus. Investments in affiliated investment companies for the period ended December 31, 2011 were as follows:
| | | | | |
| Affiliated | | | | | |
| Investment | Value | | | Value | Net |
| Company | 12/31/2010 ($) | Purchases ($) | Sales | ($) 12/31/2011 ($) | Assets (%) |
| Dreyfus | | | | | |
| Institutional | | | | | |
| Preferred | | | | | |
| Plus Money | | | | | |
| Market | | | | | |
| Fund | 19,289,000 | 505,256,242 | 482,013,487 | 42,531,755 | 4.1 |
| Dreyfus | | | | | |
| Institutional | | | | | |
| Cash | | | | | |
| Advantage | | | | | |
| Fund | 148,074,142 | 568,938,309 | 621,230,652 | 95,781,799 | 9.2 |
| Total | 167,363,142 | 1,074,194,551 | 1,103,244,139 | 138,313,554 | 13.3 |
(e) Concentration of Risk: The fund invests primarily in debt securities. Failure of an issuer of the debt securities to make timely interest or principal payments, or a decline or the perception of a decline in the
38
credit quality of a debt security, can cause the debt security’s price to fall, potentially lowering the fund’s share price. High yield (“junk”) bonds involve greater credit risk, including the risk of default, than investment grade bonds, and are considered predominantly speculative with respect to the issuer’s continuing ability to make principal and interest payments. In addition, the value of debt securities may decline due to general market conditions that are not specifically related to a particular issuer, such as real or perceived adverse economic conditions, changes in outlook for corporate earnings, changes in interest or currency rates or adverse investor sentiment.They may also decline because of factors that affect a particular industry.
(f) Dividends to shareholders: It is the policy of the fund to declare dividends daily from investment income-net. Such dividends are paid monthly. Dividends from net realized capital gains, if any, are normally declared and paid annually, but the fund may make distributions on a more frequent basis to comply with the distribution requirements of the Internal Revenue Code of 1986, as amended (the “Code”).To the extent that net realized capital gains can be offset by capital loss carryovers, it is the policy of the fund not to distribute such gains. Income and capital gain distributions are determined in accordance with income tax regulations, which may differ from GAAP.
(g) Federal income taxes: It is the policy of the fund to continue to qualify as a regulated investment company, if such qualification is in the best interests of its shareholders, by complying with the applicable provisions of the Code, and to make distributions of taxable income sufficient to relieve it from substantially all federal income and excise taxes.
As of and during the period ended December 31, 2011, the fund did not have any liabilities for any uncertain tax positions.The fund recognizes interest and penalties, if any, related to uncertain tax positions as income tax expense in the Statement of Operations. During the period, the fund did not incur any interest or penalties.
NOTES TO FINANCIAL STATEMENTS (continued)
Each of the tax years in the four-year period ended December 31, 2011 remains subject to examination by the Internal Revenue Service and state taxing authorities.
At December 31, 2011, the components of accumulated earnings on a tax basis were as follows: undistributed ordinary income $493,825, accumulated capital losses $98,610,029 and unrealized depreciation $15,421,931. In addition, the fund had $1,175,875 of capital losses realized after October 31, 2011, which were deferred for tax purposes to the first day of the following fiscal year.
Under the Regulated Investment Company Modernization Act of 2010 (the “2010 Act”), the fund will be permitted to carry forward capital losses incurred in taxable years beginning after December 22, 2010 (“post-enactment losses”) for an unlimited period. Post-enactment capital loss carryovers will retain their character as either short-term or long-term capital losses rather than be considered short-term as they were under previous statute. However, the 2010 Act requires post-enactment losses to be utilized before the utilization of losses incurred in taxable years prior to the effective date of the 2010 Act (“pre-enactment losses”). As a result of this ordering rule, pre-enactment losses may be more likely to expire unused.
The accumulated capital loss carryover is available for federal income tax purposes to be applied against future net securities profits, if any, realized subsequent to December 31, 2011. If not applied, $1,917,623 of the carryover expires in fiscal 2012, $11,766,163 expires in fiscal 2013, $2,406,483 expires in fiscal 2014, $16,497,195 expires in fiscal 2015, $42,229,566 expires in fiscal 2016 and $23,792,999 expires in fiscal 2017. Based on certain provisions in the Code, various limitations regarding the future utilization of these carry forwards, brought forward as a result of the fund’s merger with the following funds apply: BNY Hamilton High Yield Fund and Dreyfus High Income Fund. It is possible that the fund will not be able to utilize most of its capital loss carryover prior to its expiration date.
40
The tax character of distributions paid to shareholders during the fiscal periods ended December 31, 2011 and December 31, 2010 were as follows: ordinary income $80,486,151 and $89,822,095, respectively.
During the period ended December 31, 2011, as a result of permanent book to tax differences, primarily due to the tax treatment for consent fees, amortization of premiums, foreign currency gains and losses, swap periodic payments and expiration of capital loss carryovers, the fund increased accumulated undistributed investment income-net by $2,409,721, increased accumulated net realized gain (loss) on investments by $64,008,308 and decreased paid-in capital by $66,418,029. Net assets and net asset value per share were not affected by this reclassification.
NOTE 2—Bank Lines of Credit:
The fund participates with other Dreyfus-managed funds in a $225 million unsecured credit facility led by Citibank, N.A. and a $300 million unsecured credit facility provided by The Bank of New York Mellon (each, a “Facility”), each to be utilized primarily for temporary or emergency purposes, including the financing of redemptions. In connection therewith, the fund has agreed to pay its pro rata portion of commitment fees for each Facility. Interest is charged to the fund based on rates determined pursuant to the terms of the respective Facility at the time of borrowing.
The average amount of borrowings outstanding under the Facilities during the period ended December 31, 2011, was approximately $83,000 with a related weighted average annualized interest rate of 1.36%.
NOTE 3—Investment Management Fee and Other Transactions With Affiliates:
(a) Pursuant to an investment management agreement with the Manager, the Manager provides or arranges for one or more third parties and/or affiliates to provide investment advisory, administrative, custody, fund accounting and transfer agency services to the fund.The Manager
NOTES TO FINANCIAL STATEMENTS (continued)
also directs the investments of the fund in accordance with its investment objective, policies and limitations. For these services, the fund is contractually obligated to pay the Manager a fee, calculated daily and paid monthly, at the annual rate of .70% of the value of the fund’s average daily net assets. Out of its fee, the Manager pays all of the expenses of the fund except brokerage fees, taxes, interest expense, commitment fees on borrowings, Rule 12b-1 distribution fees and expenses, shareholder service fees, fees and expenses of non-interested Trustees (including counsel fees) and extraordinary expenses. In addition, the Manager is required to reduce its fee in an amount equal to the fund’s allocable portion of fees and expenses of the non-interestedTrustees (including counsel fees). Prior to January 1, 2012, eachTrustee who is not an “interested person” of theTrust (as defined in the Act) received $60,000 per annum, plus $7,000 per joint Board meeting of the Trust, The Dreyfus/Laurel Funds, Inc., The Dreyfus/Laurel Tax-Free Municipal Funds, Dreyfus Investment Funds and Dreyfus Funds, Inc. (collectively, the “Board Group Open-End Funds”) attended, $2,500 for separate in-person committee meetings attended which were not held in conjunction with a regularly scheduled Board meeting and $2,000 for Board meetings and separate committee meetings attended that were conducted by tele-phone.The Board Group Open-End Funds also reimburse each Trustee who is not an “interested person” of theTrust (as defined in the Act) for travel and out-of-pocket expenses.With respect to Board meetings, the Chair of the Board received an additional 25% of such compensation (with the exception of reimbursable amounts).The Chair of each of the Board’s committees, unless the Chair also served as Chair of the Board, received $1,350 per applicable committee meeting. In the event that there was an in-person joint committee meeting or a joint telephone meeting of the Board Group Open-End Funds and Dreyfus HighYield Strategies Fund (“DHF”), $2,500 was allocated between the Board Group Open-End Funds and DHF.
Effective January 1, 2012, the Board Group Open-End Funds and DHF (collectively, the “Board Group Funds”) will pay each Trustee their respective allocated portions of an annual retainer of $85,000 and a fee of
42
$10,000 for each regularly scheduled Board meeting attended ($75,000 and $8,000, respectively, in the aggregate, prior to January 1, 2012).With respect to the annual retainer and Board meetings of the Board Group Funds, the Chair of the Board receives an additional 25% of such compensation (with the exception of reimbursable amounts). Each Trustee will receive $2,500 for any separate in-person committee meetings attended, which are not held in conjunction with a regularly scheduled Board meeting, such amount will be allocated among the Board Group Funds, as applicable. In the event that there is a joint telephone meeting of the Board Group Funds, a fee of $2,000 will be allocated among the applicable Board Group Funds, accordingly (prior to January 1, 2012, the fee allocated was $2,500 if the meeting included DHF).The Chair of each of the Board’s committees, unless the Chair also serves as Chair of the Board, will receive $1,500 per applicable committee meeting. Each Emeritus Trustee is entitled to receive an annual retainer of one-half the amount paid as a retainer at the time theTrustee became Emeritus and a per meeting attended fee of one-half the amount paid to Trustees.The Board Group Funds also reimburse each Independent Trustee and Emeritus Trustees for travel and out-of-pocket expenses.
TheTrust’s portion of these fees and expenses are charged and allocated to each series based on net assets. Amounts required to be paid by the Trust directly to the non-interested Trustees, that would be applied to offset a portion of the management fee payable to the Manager, are in fact paid directly by the Manager to the non-interested Trustees.
During the period ended December 31, 2011, the Distributor retained $46,474 from commissions earned on sales of the fund’s Class A shares and $5,664 and $15,421 from CDSCs on redemptions of the fund’s Class B and Class C shares, respectively.
(b) Under separate Distribution Plans (the “Plans”) adopted pursuant to Rule 12b-1 under the Act, Class A shares pay annually up to .25% of the value of the average daily net assets to compensate the Distributor for shareholder servicing activities and expenses primarily
NOTES TO FINANCIAL STATEMENTS (continued)
intended to result in the sale of Class A shares. Class B and Class C shares pay the Distributor for distributing their shares at an aggregate annual rate of .50% and .75% of the value of the average daily net assets of Class B and Class C shares, respectively. Class B and Class C shares are also subject to a Service Plan adopted pursuant to Rule 12b-1 (the “Service Plan”), under which Class B and Class C shares pay the Distributor for providing certain services to the holders of their shares a fee at the annual rate of .25% of the value of the average daily net assets of Class B and Class C shares. During the period ended December 31, 2011, Class A, Class B and Class C shares were charged $894,461, $28,148 and $943,986, respectively, pursuant to their respective Plans. During the period ended December 31, 2011, Class B and Class C shares were charged $14,074 and $314,662, respectively, pursuant to the Service Plan.
Under its terms, the Plans and Service Plan shall remain in effect from year to year, provided such continuance is approved annually by a vote of a majority of those Trustees who are not “interested persons” of the Trust and who have no direct or indirect financial interest in the operation of or in any agreement related to the Plans or Service Plan.
The components of “Due to The Dreyfus Corporation and affiliates” in the Statement of Assets and Liabilities consist of: management fees $606,530, Rule 12b-1 distribution plan fees $146,735 and shareholder service plan fees $25,562.
NOTE 4—Securities Transactions:
The aggregate amount of purchases and sales (including paydowns) of investment securities, excluding short-term securities, forward contracts and swap transactions, during the period ended December 31, 2011, amounted to $807,231,922 and $754,937,456, respectively.
The following tables show the fund’s exposure to different types of market risk as it relates to the Statement of Assets and Liabilities and the Statement of Operations, respectively.
44
Fair value of derivative instruments as of December 31, 2011 is shown below:
| | | | |
| | | Derivative | Derivative | |
| Assets ($) | Liabilities ($) | |
| Foreign exchange risk1 | 85,517 Foreign exchange risk2 | (9,629 | ) |
| |
| Statement of Assets and Liabilities location: | | |
| 1 | Unrealized appreciation on forward foreign currency exchange contracts. | | |
| 2 | Unrealized depreciation on forward foreign currency exchange contracts. | | |
The effect of derivative instruments in the Statement of Operations during the period ended December 31, 2011 is shown below:
| | | | | |
| | Amount of realized gain or (loss) on derivatives recognized in income ($) |
| | Forward | | |
| Underlying risk | Contracts3 | Swaps4 | Total |
| Foreign exchange | 1,075,571 | — | 1,075,571 |
| Credit | — | (2,308,827) | (2,308,827) |
| Total | 1,075,571 | (2,308,827) | (1,233,256) |
| |
| Change in unrealized appreciation or (depreciation) on derivatives recognized in income ($) |
| | Forward |
| Underlying risk | Contracts5 |
| Foreign exchange | 75,888 |
| |
| Statement of Operations location: |
| 3 | Net realized gain (loss) on forward foreign currency exchange contracts. |
| 4 | Net realized gain (loss) on swap transactions. |
| 5 | Net unrealized appreciation (depreciation) on forward foreign currency exchange contracts. |
Forward Foreign Currency Exchange Contracts: The fund enters into forward contracts in order to hedge its exposure to changes in foreign currency exchange rates on its foreign portfolio holdings, to settle foreign currency transactions or as a part of its investment strategy. When executing forward contracts, the fund is obligated to buy or sell a foreign currency at a specified rate on a certain date in the future. With respect to sales of forward contracts, the fund incurs a loss if the value of the contract increases between the date the forward contract is opened and the date the forward contract is closed.The fund realizes a
NOTES TO FINANCIAL STATEMENTS (continued)
gain if the value of the contract decreases between those dates. With respect to purchases of forward contracts, the fund incurs a loss if the value of the contract decreases between the date the forward contract is opened and the date the forward contract is closed.The fund realizes a gain if the value of the contract increases between those dates. Any realized gain or loss which occurred during the period is reflected in the Statement of Operations.The fund is exposed to foreign currency risk as a result of changes in value of underlying financial instruments. The fund is also exposed to credit risk associated with counterparty nonperformance on these forward contracts, which is typically limited to the unrealized gain on each open contract.The following summarizes open forward contracts at December 31, 2011:
| | | | | | | | |
| Forward Foreign | | | | | | | |
| Currency | | | | Foreign | | | Unrealized |
| Exchange | Number of | Currency | | | Appreciation |
| Contracts | Contracts | Amounts | Proceeds ($) | Value ($) (Depreciation) ($) |
| Sales: | | | | | | | |
| Euro, | | | | | | | |
| Expiring: | | | | | | | |
| 1/31/2012a | | 2 | 2,340,000 | 3,053,851 | 3,029,222 | 24,629 |
| 1/31/2012b | | 1 | 5,810,000 | 7,550,676 | 7,521,276 | 29,400 |
| 1/31/2012c | | 1 | 9,100,000 | 11,811,799 | 11,780,311 | 31,488 |
| British Pound, | | | | | | | |
| Expiring | | | | | | | |
| 1/31/2012d | | 1 | 1,520,000 | 2,350,209 | 2,359,838 | (9,629) |
| Gross Unrealized | | | | | | |
| Appreciation | | | | | | | 85,517 |
| Gross Unrealized | | | | | | |
| Depreciation | | | | | | | (9,629) |
| |
| Counterparties: |
| a | Commonwealth |
| b | Credit Suisse First Boston |
| c | Deutsche Bank |
| d | Goldman Sachs |
| See notes to financial statements. |
Swaps: The fund enters into swap agreements to exchange the interest rate on, or return generated by, one nominal instrument for the return generated by another nominal instrument.The fund enters into these agreements to hedge certain market or interest rate risks, to manage the
46
interest rate sensitivity (sometimes called duration) of fixed income securities, to provide a substitute for purchasing or selling particular securities or to increase potential returns.
The fund accrues for the interim payments on swap contracts on a daily basis, with the net amount recorded within unrealized appreciation (depreciation) on swap contracts in the Statement of Assets and Liabilities. Once the interim payments are settled in cash, the net amount is recorded as realized gain (loss) on swaps, in addition to realized gain (loss) recorded upon the termination of swap contracts in the Statement of Operations. Upfront payments made and/or received by the fund, are recorded as an asset and/or liability in the Statement of Assets and Liabilities and are recorded as a realized gain or loss ratably over the contract’s term/event with the exception of forward starting interest rate swaps which are recorded as realized gains or losses on the termination date. Fluctuations in the value of swap contracts are recorded for financial statement purposes as unrealized appreciation or depreciation on swap transactions.
Credit Default Swaps: Credit default swaps involve commitments to pay a fixed interest rate in exchange for payment if a credit event affecting a third party (the referenced company, obligation or index ) occurs. Credit events may include a failure to pay interest or principal, bankruptcy, or restructuring.The fund enters into these agreements to manage its exposure to the market or certain sectors of the market, to reduce its risk exposure to defaults of corporate and sovereign issuers, or to create exposure to corporate or sovereign issuers to which it is not otherwise exposed. For those credit default swaps in which the fund is paying a fixed rate, the fund is buying credit protection on the instrument. In the event of a credit event, the fund would receive the full notional amount for the reference obligation. For those credit default swaps in which the fund is receiving a fixed rate, the fund is selling credit protection on the underlying instrument. The maximum payouts for these contracts are limited to the notional amount of each swap. Credit
NOTES TO FINANCIAL STATEMENTS (continued)
default swaps may involve greater risks than if the fund had invested in the reference obligation directly and are subject to general market risk, liquidity risk, counterparty risk and credit risk. At December 31, 2011, there were no credit default swap agreements outstanding.
The following summarizes the average market value of derivatives outstanding during the period ended December 31, 2011:
| |
| | Average Market Value ($) |
| Forward contracts | 6,260,228 |
The following summarizes the average notional value of swap contracts outstanding during the period ended December 31, 2011:
| |
| | Average Notional Value ($) |
| Credit default swap contracts | 25,942,308 |
At December 31, 2011, the cost of investments for federal income tax purposes was $1,131,066,979; accordingly, accumulated net unrealized depreciation on investments was $15,381,123, consisting of $22,338,077 gross unrealized appreciation and $37,719,200 gross unrealized depreciation.
NOTE 5—Other Matters:
At the October 27, 2011 Board meeting, the Board of theTrust approved a proposal to have shareholders consider the election of Francine J. Bovich as an additionalTrustee of theTrust, and also consider the election of Joseph S. DiMartino and Benaree Pratt Wiley, current Trustees of the Trust not previously proposed to shareholders of the fund. A proxy statement was mailed, on December 1, 2011, to shareholders of record as of the close of business on November 1, 2011 asking shareholders to consider these elections at a special joint meeting of shareholders to be held onWednesday, February 8, 2012.At the February 8, 2012 special joint meeting of shareholders, Ms. Bovich, Mr. DiMartino and Ms.Wiley were elected as Trustees by shareholders of the Trust.
48
|
| REPORT OF INDEPENDENT REGISTERED |
| PUBLIC ACCOUNTING FIRM |
The Board of Trustees and Shareholders The Dreyfus/Laurel Funds Trust
We have audited the accompanying statement of assets and liabilities of Dreyfus HighYield Fund (the “Fund”), a series of The Dreyfus/Laurel Funds Trust, including the statement of investments as of December 31, 2011, and the related statement of operations for the year then ended, the statement of changes in net assets for each of the years in the two-year period then ended and the financial highlights for each of the years in the five-year period then ended. These financial statements and financial highlights are the responsibility of the Fund’s management. Our responsibility is to express an opinion on these financial statements and financial highlights based on our audits.
We conducted our audits in accordance with the standards of the Public Company Accounting Oversight Board (United States).Those standards require that we plan and perform the audit to obtain reasonable assurance about whether the financial statements and financial highlights are free of material misstatement. An audit includes examining, on a test basis, evidence supporting the amounts and disclosures in the financial statements. Our procedures included confirmation of securities owned as of December 31, 2011, by correspondence with the custodian and brokers or by other appropriate auditing procedures where replies from brokers were not received.An audit also includes assessing the accounting principles used and significant estimates made by management, as well as evaluating the overall financial statement presentation.We believe that our audits provide a reasonable basis for our opinion.
In our opinion, the financial statements and financial highlights referred to above present fairly, in all material respects, the financial position of Dreyfus High Yield Fund as of December 31, 2011, and the results of its operations for the year then ended, the changes in its net assets for each of the years in the two-year period then ended and the financial highlights for each of the years in the five-year period then ended, in conformity with U.S. generally accepted accounting principles.

New York, New York
February 24, 2012
IMPORTANT TAX INFORMATION (Unaudited)
For federal tax purposes the fund reports the maximum amount allowable but not less than 98.48% as intertest-related dividends in accordance with Sections 871(k)(1) and 881(e) of the Internal Revenue Code.
50
BOARD MEMBERS INFORMATION (Unaudited)
|
| Joseph S. DiMartino (68) |
| Chairman of the Board (1999) |
| Principal Occupation During Past 5Years: |
| • Corporate Director and Trustee |
| Other Public Company Board Memberships During Past 5Years: |
| • CBIZ (formerly, Century Business Services, Inc.), a provider of outsourcing functions for small |
| and medium size companies, Director (1997-present) |
| • Sunair Services Corporation, a provider of certain outdoor-related services to homes and |
| businesses, Director (2005-2009) |
| • The Newark Group, a provider of a national market of paper recovery facilities, paperboard |
| mills and paperboard converting plants, Director (2000-2010) |
| No. of Portfolios for which Board Member Serves: 164 |
| ——————— |
| Francine J. Bovich (60)† |
| Board Member (2011) |
| Principal Occupation During Past 5Years: |
| • Trustee,The Bradley Trusts, private trust funds (2011-Present) |
| • Managing Director, Morgan Stanley Investment Management (1993-2010) |
| No. of Portfolios for which Board Member Serves: 13 |
| ——————— |
| James M. Fitzgibbons (77) |
| Board Member (1994) |
| Principal Occupation During Past 5Years: |
| • Corporate Director and Trustee |
| Other Public Company Board Memberships During Past 5Years: |
| • Bill Barrett Corporation, an oil and natural gas exploration company, Director (2004-present) |
| No. of Portfolios for which Board Member Serves: 31 |
| ——————— |
| Kenneth A. Himmel (65) |
| Board Member (1994) |
| Principal Occupation During Past 5Years: |
| • President and CEO, Related Urban Development, a real estate development company (1996-present) |
| • President and CEO, Himmel & Company, a real estate development company (1980-present) |
| • CEO,American Food Management, a restaurant company (1983-present) |
| No. of Portfolios for which Board Member Serves: 31 |
BOARD MEMBERS INFORMATION (Unaudited) (continued)
|
| Stephen J. Lockwood (64) |
| Board Member (1994) |
| Principal Occupation During Past 5Years: |
| • Chairman of the Board, Stephen J. Lockwood and Company LLC, a real estate investment |
| company (2000-present) |
| No. of Portfolios for which Board Member Serves: 31 |
| ——————— |
| Roslyn M. Watson (61) |
| Board Member (1994) |
| Principal Occupation During Past 5Years: |
| • Principal,Watson Ventures, Inc., a real estate investment company (1993-present) |
| No. of Portfolios for which Board Member Serves: 41 |
| ——————— |
| Benaree Pratt Wiley (65) |
| Board Member (1998) |
| Principal Occupation During Past 5Years: |
| • Principal,TheWiley Group, a firm specializing in strategy and business development (2005-present) |
| Other Public Company Board Memberships During Past 5Years: |
| • CBIZ (formerly, Century Business Services, Inc.), a provider of outsourcing functions for small |
| and medium size companies, Director (2008-present) |
| No. of Portfolios for which Board Member Serves: 66 |
| ——————— |
† Ms. Bovich was elected as a Trustee of the Trust, effective February 8, 2012. See Note 5.
Once elected all Board Members serve for an indefinite term, but achieve Emeritus status upon reaching age 80.The address of the Board Members and Officers is in c/o The Dreyfus Corporation, 200 Park Avenue, NewYork, NewYork 10166.Additional information about the Board Members is available in the fund’s Statement of Additional Information which can be obtained from Dreyfus free of charge by calling this toll free number: 1-800-DREYFUS.
J.Tomlinson Fort, Emeritus Board Member
52
OFFICERS OF THE FUND (Unaudited)
BRADLEY J. SKAPYAK, President since January 2010.
Chief Operating Officer and a director of the Manager since June 2009. From April 2003 to June 2009, Mr. Skapyak was the head of the Investment Accounting and Support Department of the Manager. He is an officer of 75 investment companies (comprised of 163 portfolios) managed by the Manager. He is 53 years old and has been an employee of the Manager since February 1988.
JANETTE E. FARRAGHER, Vice President and Secretary since December 2011.
Assistant General Counsel of BNY Mellon, and an officer of 76 investment companies (comprised of 189 portfolios) managed by the Manager. She is 49 years old and has been an employee of the Manager since February 1984.
KIESHA ASTWOOD, Vice President and Assistant Secretary since January 2010.
Counsel of BNY Mellon, and an officer of 76 investment companies (comprised of 189 portfolios) managed by the Manager. She is 38 years old and has been an employee of the Manager since July 1995.
JAMES BITETTO, Vice President and Assistant Secretary since August 2005.
Senior Counsel of BNY Mellon and Secretary of the Manager, and an officer of 76 investment companies (comprised of 189 portfolios) managed by the Manager. He is 45 years old and has been an employee of the Manager since December 1996.
JONI LACKS CHARATAN, Vice President and Assistant Secretary since August 2005.
Senior Counsel of BNY Mellon, and an officer of 76 investment companies (comprised of 189 portfolios) managed by the Manager. She is 56 years old and has been an employee of the Manager since October 1988.
JOSEPH M. CHIOFFI, Vice President and Assistant Secretary since August 2005.
Senior Counsel of BNY Mellon, and an officer of 76 investment companies (comprised of 189 portfolios) managed by the Manager. He is 50 years old and has been an employee of the Manager since June 2000.
KATHLEEN DENICHOLAS, Vice President and Assistant Secretary since January 2010.
Managing Counsel of BNY Mellon, and an officer of 76 investment companies (comprised of 189 portfolios) managed by the Manager. She is 37 years old and has been an employee of the Manager since February 2001.
JOHN B. HAMMALIAN, Vice President and Assistant Secretary since August 2005.
Senior Managing Counsel of BNY Mellon, and an officer of 76 investment companies (comprised of 189 portfolios) managed by the Manager. He is 48 years old and has been an employee of the Manager since February 1991.
M. CRISTINA MEISER, Vice President and Assistant Secretary since January 2010.
Senior Counsel of BNY Mellon, and an officer of 76 investment companies (comprised of 189 portfolios) managed by the Manager. She is 41 years old and has been an employee of the Manager since August 2001.
ROBERT R. MULLERY, Vice President and Assistant Secretary since August 2005.
Managing Counsel of BNY Mellon, and an officer of 76 investment companies (comprised of 189 portfolios) managed by the Manager. He is 59 years old and has been an employee of the Manager since May 1986.
OFFICERS OF THE FUND (Unaudited) (continued)
JEFF PRUSNOFSKY, Vice President and Assistant Secretary since August 2005.
Senior Managing Counsel of BNY Mellon, and an officer of 76 investment companies (comprised of 189 portfolios) managed by the Manager. He is 46 years old and has been an employee of the Manager since October 1990.
JAMES WINDELS, Treasurer since November 2001.
Director – Mutual Fund Accounting of the Manager, and an officer of 76 investment companies (comprised of 189 portfolios) managed by the Manager. He is 53 years old and has been an employee of the Manager since April 1985.
RICHARD CASSARO, Assistant Treasurer since January 2008.
Senior Accounting Manager – Money Market and Municipal Bond Funds of the Manager, and an officer of 76 investment companies (comprised of 189 portfolios) managed by the Manager. He is 52 years old and has been an employee of the Manager since September 1982.
GAVIN C. REILLY, Assistant Treasurer since December 2005.
Tax Manager of the Investment Accounting and Support Department of the Manager, and an officer of 76 investment companies (comprised of 189 portfolios) managed by the Manager. He is 43 years old and has been an employee of the Manager since April 1991.
ROBERT S. ROBOL, Assistant Treasurer since December 2002.
Senior Accounting Manager – Fixed Income Funds of the Manager, and an officer of 76 investment companies (comprised of 189 portfolios) managed by the Manager. He is 47 years old and has been an employee of the Manager since October 1988.
ROBERT SALVIOLO, Assistant Treasurer since July 2007.
Senior Accounting Manager – Equity Funds of the Manager, and an officer of 76 investment companies (comprised of 189 portfolios) managed by the Manager. He is 44 years old and has been an employee of the Manager since June 1989.
ROBERT SVAGNA, Assistant Treasurer since December 2002.
Senior Accounting Manager – Equity Funds of the Manager, and an officer of 76 investment companies (comprised of 189 portfolios) managed by the Manager. He is 44 years old and has been an employee of the Manager since November 1990.
JOSEPH W. CONNOLLY, Chief Compliance Officer since October 2004.
Chief Compliance Officer of the Manager and The Dreyfus Family of Funds (76 investment companies, comprised of 189 portfolios). From November 2001 through March 2004, Mr. Connolly was first Vice-President, Mutual Fund Servicing for Mellon Global Securities Services. In that capacity, Mr. Connolly was responsible for managing Mellon’s Custody, Fund Accounting and Fund Administration services to third-party mutual fund clients. He is 54 years old and has served in various capacities with the Manager since 1980, including manager of the firm’s Fund Accounting Department from 1997 through October 2001.
STEPHEN J. STOREN, Anti-Money Laundering Compliance Officer since May 2011.
Chief Compliance Officer of the Distributor, and the Anti-Money Laundering Compliance Officer of 72 investment companies (comprised of 185 portfolios) managed by the Manager. He is 57 years old and has been an employee of the Distributor since October 1999.
54
For More Information
Telephone Call your financial representative or 1-800-DREYFUS
Mail The Dreyfus Family of Funds, 144 Glenn Curtiss Boulevard, Uniondale, NY 11556-0144
The fund files its complete schedule of portfolio holdings with the Securities and Exchange Commission (“SEC”) for the first and third quarters of each fiscal year on Form N-Q. The fund’s Forms N-Q are available on the SEC’s website at http://www.sec.gov and may be reviewed and copied at the SEC’s Public Reference Room in Washington, DC. Information on the operation of the Public Reference Room may be obtained by calling 1-800-SEC-0330.
A description of the policies and procedures that the fund uses to determine how to vote proxies relating to portfolio securities, and information regarding how the fund voted these proxies for the most recent 12-month period ended June 30 is available at http://www.dreyfus.com and on the SEC’s website at http://www.sec.gov. The description of the policies and procedures is also available without charge, upon request, by calling 1-800-DREYFUS.

Item 2. Code of Ethics.
The Registrant has adopted a code of ethics that applies to the Registrant's principal executive officer, principal financial officer, principal accounting officer or controller, or persons performing similar functions. There have been no amendments to, or waivers in connection with, the Code of Ethics during the period covered by this Report.
Item 3. Audit Committee Financial Expert.
The Registrant's Board has determined that Joseph S. DiMartino, a member of the Audit Committee of the Board, is an audit committee financial expert as defined by the Securities and Exchange Commission (the "SEC"). Joseph S. DiMartino is "independent" as defined by the SEC for purposes of audit committee financial expert determinations.
Item 4. Principal Accountant Fees and Services.
(a) Audit Fees. The aggregate fees billed for each of the last two fiscal years (the "Reporting Periods") for professional services rendered by the Registrant's principal accountant (the "Auditor") for the audit of the Registrant's annual financial statements or services that are normally provided by the Auditor in connection with the statutory and regulatory filings or engagements for the Reporting Periods, were $79,895 in 2010 and $52,020 in 2011.
(b) Audit-Related Fees. The aggregate fees billed in the Reporting Periods for assurance and related services by the Auditor that are reasonably related to the performance of the audit of the Registrant's financial statements and are not reported under paragraph (a) of this Item 4 were $8,400 in 2010 and $4,280 in 2011. These services consisted of one or more of the following: (i) agreed upon procedures related to compliance with Internal Revenue Code section 817(h), (ii) security counts required by Rule 17f-2 under the Investment Company Act of 1940, as amended, (iii) advisory services as to the accounting or disclosure treatment of Registrant transactions or events and (iv) advisory services to the accounting or disclosure treatment of the actual or potential impact to the Registrant of final or proposed rules, standards or interpretations by the Securities and Exchange Commission, the Financial Accounting Standards Boards or other regulatory or standard-setting bodies.
The aggregate fees billed in the Reporting Periods for non-audit assurance and related services by the Auditor to the Registrant's investment adviser (not including any sub-investment adviser whose role is primarily portfolio management and is subcontracted with or overseen by another investment adviser), and any entity controlling, controlled by or under common control with the investment adviser that provides ongoing services to the Registrant ("Service Affiliates"), that were reasonably related to the performance of the annual audit of the Service Affiliate, which required pre-approval by the Audit Committee were $0 in 2010 and $0 in 2011.
(c) Tax Fees. The aggregate fees billed in the Reporting Periods for professional services rendered by the Auditor for tax compliance, tax advice, and tax planning ("Tax Services") were $4,520 in 2010 and $2,230 in 2011. These services consisted of review or preparation of U.S. federal, state, local and excise tax returns. The aggregate fees billed in the Reporting Periods for Tax Services by the Auditor to Service Affiliates, which required pre-approval by the Audit Committee were $0 in 2010 and $0 in 2011.
(d) All Other Fees. The aggregate fees billed in the Reporting Periods for products and services provided by the Auditor, other than the services reported in paragraphs (a) through (c) of this Item, were $0 in 2010 and $0 in 2011.
The aggregate fees billed in the Reporting Periods for Non-Audit Services by the Auditor to Service Affiliates, other than the services reported in paragraphs (b) through (c) of this Item, which required pre-approval by the Audit Committee, were $0 in 2010 and $0 in 2011.
(e)(1) Audit Committee Pre-Approval Policies and Procedures. The Registrant's Audit Committee has established policies and procedures (the "Policy") for pre-approval (within specified fee limits) of the Auditor's engagements for non-audit services to the Registrant and Service Affiliates without specific case-by-case consideration. The pre-approved services in the Policy can include pre-approved audit services, pre-approved audit-related services, pre-approved tax services and pre-approved all other services. Pre-approval considerations include whether the proposed services are compatible with maintaining the Auditor's independence. Pre-approvals pursuant to the Policy are considered annually.
(e)(2) Note: None of the services described in paragraphs (b) through (d) of this Item 4 were approved by the Audit Committee pursuant to paragraph (c)(7)(i)(C) of Rule 2-01 of Regulation S-X.
(f) None of the hours expended on the principal accountant's engagement to audit the registrant's financial statements for the most recent fiscal year were attributed to work performed by persons other than the principal account's full-time, permanent employees.
Non-Audit Fees. The aggregate non-audit fees billed by the Auditor for services rendered to the Registrant, and rendered to Service Affiliates, for the Reporting Periods were $3,693,000 in 2010 and $12,255,249 in 2011.
Auditor Independence. The Registrant's Audit Committee has considered whether the provision of non-audit services that were rendered to Service Affiliates, which were not pre-approved (not requiring pre-approval), is compatible with maintaining the Auditor's independence.
Item 5. Audit Committee of Listed Registrants.
Not applicable.
Item 6. Investments.
(a) Not applicable.
Item 7. Disclosure of Proxy Voting Policies and Procedures for Closed-End Management Investment Companies.
Not applicable.
Item 8. Portfolio Managers of Closed-End Management Investment Companies.
Not applicable.
Item 9. Purchases of Equity Securities by Closed-End Management Investment Companies and Affiliated Purchasers.
Not applicable.
Item 10. Submission of Matters to a Vote of Security Holders.
There have been no material changes to the procedures applicable to Item 10.
Item 11. Controls and Procedures.
(a) The Registrant's principal executive and principal financial officers have concluded, based on their evaluation of the Registrant's disclosure controls and procedures as of a date within 90 days of the filing date of this report, that the Registrant's disclosure controls and procedures are reasonably designed to ensure that information required to be disclosed by the Registrant on Form N-CSR is recorded, processed, summarized and reported within the required time periods and that information required to be disclosed by the Registrant in the reports that it files or submits on Form N-CSR is accumulated and communicated to the Registrant's management, including its principal executive and principal financial officers, as appropriate to allow timely decisions regarding required disclosure.
(b) There were no changes to the Registrant's internal control over financial reporting that occurred during the second fiscal quarter of the period covered by this report that have materially affected, or are reasonably likely to materially affect, the Registrant's internal control over financial reporting.
Item 12. Exhibits.
(a)(1) Code of ethics referred to in Item 2.
(a)(2) Certifications of principal executive and principal financial officers as required by Rule 30a-2(a) under the Investment Company Act of 1940.
(a)(3) Not applicable.
(b) Certification of principal executive and principal financial officers as required by Rule 30a-2(b) under the Investment Company Act of 1940.
SIGNATURES
Pursuant to the requirements of the Securities Exchange Act of 1934 and the Investment Company Act of 1940, the Registrant has duly caused this Report to be signed on its behalf by the undersigned, thereunto duly authorized.
The Dreyfus/Laurel Funds Trust
By: /s/ Bradley J. Skapyak |
Bradley J. Skapyak, President |
Date: | February 23, 2012 |
|
Pursuant to the requirements of the Securities Exchange Act of 1934 and the Investment Company Act of 1940, this Report has been signed below by the following persons on behalf of the Registrant and in the capacities and on the dates indicated. |
|
By: /s/ Bradley J. Skapyak |
Bradley J. Skapyak, President |
Date: | February 23, 2012 |
|
By: /s/ James Windels |
James Windels, Treasurer |
Date: | February 23, 2012 |
|
EXHIBIT INDEX
(a)(1) Code of ethics referred to in Item 2.
(a)(2) Certifications of principal executive and principal financial officers as required by Rule 30a-2(a) under the Investment Company Act of 1940. (EX-99.CERT)
(b) Certification of principal executive and principal financial officers as required by Rule 30a-2(b) under the Investment Company Act of 1940. (EX-99.906CERT)