UNITED STATES
SECURITIES AND EXCHANGE COMMISSION
Washington, D.C. 20549
FORM N-CSR
CERTIFIED SHAREHOLDER REPORT OF REGISTERED MANAGEMENT
INVESTMENT COMPANIES
Investment Company Act file number | 811- 524 |
| |
| The Dreyfus/Laurel Funds Trust | |
| (Exact name of Registrant as specified in charter) | |
| | |
| c/o The Dreyfus Corporation 200 Park Avenue New York, New York 10166 | |
| (Address of principal executive offices) (Zip code) | |
| | |
| Michael A. Rosenberg, Esq. 200 Park Avenue New York, New York 10166 | |
| (Name and address of agent for service) | |
|
Registrant's telephone number, including area code: | (212) 922-6000 |
| |
Date of fiscal year end: | 12/31 | |
Date of reporting period: | 12/31/10 | |
| | | | | | |
The following N-CSR relates only to the Registrant’s series listed below and does not affect the other series of the Registrant, which have different fiscal year ends and, therefore, different N-CSR reporting requirements. Separate N-CSR Forms will be filed for these series, as appropriate.
Dreyfus Core Value Fund
Dreyfus High Yield Fund
FORM N-CSR
Item 1. Reports to Stockholders.
ANNUAL REPORT December 31, 2010

Save time. Save paper. View your next shareholder report online as soon as it’s available. Log into www.dreyfus.com and sign up for Dreyfus eCommunications. It’s simple and only takes a few minutes.
The views expressed in this report reflect those of the portfolio manager only through the end of the period covered and do not necessarily represent the views of Dreyfus or any other person in the Dreyfus organization. Any such views are subject to change at any time based upon market or other conditions and Dreyfus disclaims any responsibility to update such views.These views may not be relied on as investment advice and, because investment decisions for a Dreyfus fund are based on numerous factors, may not be relied on as an indication of trading intent on behalf of any Dreyfus fund.

| | Contents |
| | THE FUND |
| 2 | A Letter from the Chairman and CEO |
| 3 | Discussion of Fund Performance |
| 6 | Fund Performance |
| 8 | Understanding Your Fund’s Expenses |
| 8 | Comparing Your Fund’s Expenses With Those of Other Funds |
| 9 | Statement of Investments |
| 13 | Statement of Assets and Liabilities |
| 14 | Statement of Operations |
| 15 | Statement of Changes in Net Assets |
| 18 | Financial Highlights |
| 23 | Notes to Financial Statements |
| 33 | Report of Independent Registered Public Accounting Firm |
| 34 | Important Tax Information |
| 35 | Board Members Information |
| 37 | Officers of the Fund |
| | FOR MORE INFORMATION |
| | Back Cover |
Dreyfus
Core Value Fund
The Fund

A LETTER FROM THE CHAIRMAN AND CEO
Dear Shareholder:
We are pleased to present this annual report for Dreyfus Core Value Fund, covering the 12-month period from January 1, 2010, through December 31, 2010.
Although 2010 proved to be a volatile year for stocks, the reporting period ended with a sustained market rally that produced above-average returns across most market-cap segments for the calendar year. Investors’ early concerns regarding sovereign debt issues in Europe and stubbornly high unemployment in the United States later gave way to optimism that massive economic stimulus programs, robust growth in the world’s emerging markets, a strong holiday retail season and rising corporate earnings signaled better economic times ahead.
We are aware that stocks have recently reached higher valuations, and that any new economic setbacks could result in market volatility as investors adjust their expectations. Nonetheless, we see value in many segments of equity market. For example, investors in volatile markets may turn to high-quality stocks of U.S. companies with track records of consistent growth in a variety of economic climates, and international equities could benefit from a declining U.S. dollar and potentially higher growth opportunities abroad.With 2011 now upon us, we suggest talking to your financial advisor, who can help you identify potential opportunities and suggest strategies suitable for your individual needs in today’s market environment.
For information about how the fund performed during the reporting period, as well as general market perspectives, we provide a Discussion of Fund Performance on the pages that follow.
Thank you for your continued confidence and support.

Jonathan R. Baum
Chairman and Chief Executive Officer
The Dreyfus Corporation
January 18, 2011
2

DISCUSSION OF FUND PERFORMANCE
For the period of January 1, 2010, through December 31, 2010, as provided by Brian Ferguson, Portfolio Manager
Fund and Market Performance Overview
For the 12-month period ended December 31, 2010, Dreyfus Core Value Fund, produced a total return of 12.99% for its Class A shares, Class B shares returned 12.13%, Class C shares returned 12.14%, Class I shares returned 13.23% and Institutional shares returned 13.11%.1 In comparison, the fund’s benchmark, the Russell 1000 Value Index (the “Index”), produced a total return of 15.51% for the same period.2
Despite heightened volatility over the first half of 2010, a later rally stemming from greater economic clarity enabled the stock market to achieve double-digit gains for the year. The fund generally produced lower returns than its benchmark, primarily due to shortfalls in the information technology, consumer discretionary and financials sectors.
The Fund’s Investment Approach
The fund invests primarily in large-cap companies that are considered undervalued based on traditional measures, such as price-to-earnings ratios. When choosing stocks, we use a “bottom-up” stock selection approach, focusing on individual companies, rather than a “top-down” approach that forecasts market trends. We also focus on a company’s relative value, financial strength, business momentum and likely catalysts that could ignite the stock price.
Waning Economic Concerns Fueled a Market Rally
Soon after the start of 2010, a number of new developments shook investors’ confidence in ongoing global and domestic economic recoveries. Europe was roiled by a sovereign debt crisis that led to austerity measures throughout the region, and mixed housing and employment data in the United States weighed on already mild domestic growth. As a result, U.S. stocks generally declined over the first half of the year.
On the other hand, investors’ economic concerns at the time may have been overblown. Corporate earnings over the second half of the year
DISCUSSION OF FUND PERFORMANCE (continued)
exceeded analysts’ expectations, commodity prices climbed amid robust demand from the world’s emerging markets, and the U.S. and global economies remained on mildly upward trajectories. The resolution of midterm elections and new stimulative programs by the Federal Reserve Board also boosted investor sentiment. However, growth-oriented stocks produced higher returns, on average, than value stocks in 2010.
Security Selections Dampened Returns in Some Sectors
Although the fund participated to a substantial degree in the stock market’s 2010 gains, disappointing security selections in certain market segments prevented it from matching the benchmark’s results. In the information technology sector, Cisco Systems struggled due to weakness in its European and U.S. public sector markets, and personal computer maker Hewlett-Packard declined when its CEO resigned abruptly. Software giant Microsoft lagged market averages as the company appeared to miss opportunities to capitalize on the trend toward “cloud computing,” in which data a nd applications are maintained and accessed over the Internet.
The fund’s consumer discretionary holdings also fell short of their respective benchmark components, as we favored media companies that create programming content over better performing content distributors. In addition, retailers Best Buy and Staples struggled amid changing consumer spending patterns and a lack of exciting new products.Among financial stocks, Bank of America, JPMorgan Chase & Co. and Morgan Stanley fared relatively poorly due to intensifying regulatory pressures, slower mergers-and-acquisitions activity and lower trading volumes. Relatively light exposure to real estate investment trusts also weighed on the fund’s relative performance.
On a more positive note, the fund focused successfully on industrial companies—including Caterpillar and Eaton—that have benefited from strong demand for the equipment and materials used in infrastructure construction in the world’s emerging markets.The materials sector also contained a number of top performers, including Freeport-McMoRan Copper & Gold, which gained value along with underlying commodity prices. An underweighted position in the health care sector helped the fund avoid the brunt of weakness stemming from large pharmaceutical
4
companies, such as Johnson & Johnson, that struggled with pricing pressures and a dearth of new products in their development pipelines. Instead, we emphasized service companies such as drug distributor AmerisourceBergen, which benefited from greater demand for generic medicines.
Positioned for a More Selective Market Environment
We expect the U.S. economic recovery to persist in 2011. Greater economic and political clarity in the wake of U.S. midterm elections—including fiscal stimulus from a cut in payroll taxes and extension of Bush-era tax cuts—may help convince business leaders to deploy some of their massive cash reserves for mergers-and-acquisitions, stock buybacks and other productive uses. However, a number of economic headwinds remain, including high levels of unemployment and troubled housing markets.
We expect investors to become more selective in this environment, favoring companies that can grow consistently in a slowly expanding economy. Therefore, we have maintained an overweighted position among attractively valued media companies with solid business fundamentals. Conversely, the fund currently holds relatively few utilities, which generally do not meet our value-oriented investment criteria.
January 18, 2011
| |
| | Please note, the position in any security highlighted in italicized typeface was sold during the |
| | reporting period. |
| | Equity funds are subject generally to market, market sector, market liquidity, issuer and investment |
| | style risks, among other factors, to varying degrees, all of which are more fully described in the |
| | fund’s prospectus. |
| 1 | Total return includes reinvestment of dividends and any capital gains paid, and does not take into |
| | consideration the maximum initial sales charges in the case of Class A shares or the applicable |
| | contingent deferred sales charges imposed on redemptions in the case of Class B and Class C |
| | shares. Had these charges been reflected, returns would have been lower. Past performance is no |
| | guarantee of future results. Share price and investment return fluctuate such that upon redemption, |
| | fund shares may be worth more or less than their original cost. |
| 2 | SOURCE: LIPPER INC. — Reflects the reinvestment of dividends and, where applicable, |
| | capital gain distributions.The Russell 1000 Value Index is an unmanaged index which measures |
| | the performance of those Russell 1000 companies with lower price-to-book ratios and lower |
| | forecasted growth values. Investors cannot invest directly in any index. |
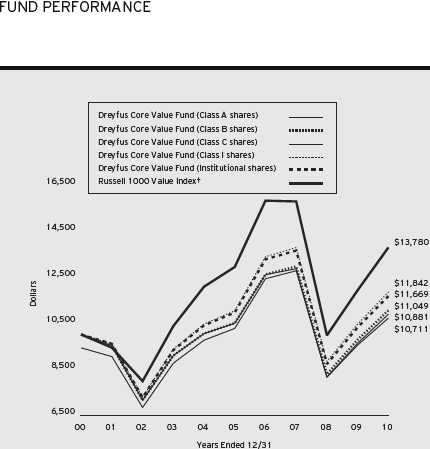
Comparison of change in value of $10,000 investment in Dreyfus Core Value Fund Class A shares, Class B shares, Class C shares, Class I shares and Institutional shares and the Russell 1000 Value Index
† Source: Lipper Inc.
Past performance is not predictive of future performance.
The above graph compares a $10,000 investment made in Class A shares, Class B shares, Class C shares, Class I shares and Institutional shares of Dreyfus Core Value Fund on 12/31/00 to a $10,000 investment made in the Russell 1000 Value Index (the “Index”) on that date.All dividends and capital gain distributions are reinvested.
The fund’s performance shown in the line graph takes into account the maximum initial sales charge on Class A shares and all other applicable fees and expenses on all classes. Performance for Class B shares assumes the conversion of Class B shares to Class A shares at the end of the sixth year following the date of purchase.The Index is an unmanaged index, which measures the performance of those Russell 1000 companies with lower price-to-book ratios and lower forecasted growth values. Unlike a mutual fund, the Index is not subject to charges, fees and other expenses. Investors cannot invest directly in any index. Further information relating to fund performance, including expense reimbursements, if applicable, is contained in the Financial Highlights section of the prospectus and elsewhere in this report.
6
| | | | | | |
| Average Annual Total Returns as of 12/31/10 | | | |
| |
| | 1Year | 5 Years | 10 Years |
| Class A shares | | | |
| with maximum sales charge (5.75%) | 6.50% | –0.02% | 0.85% |
| without sales charge | 12.99% | 1.17% | 1.45% |
| Class B shares | | | |
| with applicable redemption charge † | 8.13% | 0.10% | 1.00% |
| without redemption | 12.13% | 0.41% | 1.00% |
| Class C shares | | | |
| with applicable redemption charge †† | 11.14% | 0.40% | 0.69% |
| without redemption | 12.14% | 0.40% | 0.69% |
| Class I shares | 13.23% | 1.43% | 1.71% |
| Institutional shares | 13.11% | 1.27% | 1.56% |
| Russell 1000 Value Index | 15.51% | 1.28% | 3.26% |
Past performance is not predictive of future performance.The fund’s performance shown in the graph and table does not reflect the deduction of taxes that a shareholder would pay on fund distributions or the redemption of fund shares.
| |
| † | The maximum contingent deferred sales charge for Class B shares is 4%.After six years Class B shares convert to |
| | Class A shares. |
| †† | The maximum contingent deferred sales charge for Class C shares is 1% for shares redeemed within one year of the |
| | date of purchase. |
UNDERSTANDING YOUR FUND’S EXPENSES (Unaudited)
As a mutual fund investor, you pay ongoing expenses, such as management fees and other expenses. Using the information below, you can estimate how these expenses affect your investment and compare them with the expenses of other funds.You also may pay one-time transaction expenses, including sales charges (loads) and redemption fees, which are not shown in this section and would have resulted in higher total expenses. For more information, see your fund’s prospectus or talk to your financial adviser.
Review your fund’s expenses
The table below shows the expenses you would have paid on a $1,000 investment in Dreyfus Core Value Fund from July 1, 2010 to December 31, 2010. It also shows how much a $1,000 investment would be worth at the close of the period, assuming actual returns and expenses.
Expenses and Value of a $1,000 Investment
assuming actual returns for the six months ended December 31, 2010
| | | | | | | | | | |
| | | Class A | | Class B | | Class C | | Class I | | Institutional |
| Expenses paid per $1,000† | $ | 6.44 | $ | 10.61 | $ | 10.61 | $ | 5.04 | $ | 5.88 |
| Ending value (after expenses) | $ | 1,221.40 | $ | 1,216.30 | $ | 1,216.50 | $ | 1,222.40 | $ | 1,222.20 |
COMPARING YOUR FUND’S EXPENSES
WITH THOSE OF OTHER FUNDS (Unaudited)
Using the SEC’s method to compare expenses
The Securities and Exchange Commission (SEC) has established guidelines to help investors assess fund expenses. Per these guidelines, the table below shows your fund’s expenses based on a $1,000 investment, assuming a hypothetical 5% annualized return. You can use this information to compare the ongoing expenses (but not transaction expenses or total cost) of investing in the fund with those of other funds.All mutual fund shareholder reports will provide this information to help you make this comparison. Please note that you cannot use this information to estimate your actual ending account balance and expenses paid during the period.
Expenses and Value of a $1,000 Investment
assuming a hypothetical 5% annualized return for the six months ended December 31, 2010
| | | | | | | | | | |
| | | Class A | | Class B | | Class C | | Class I | | Institutional |
| Expenses paid per $1,000† | $ | 5.85 | $ | 9.65 | $ | 9.65 | $ | 4.58 | $ | 5.35 |
| Ending value (after expenses) | $ | 1,019.41 | $ | 1,015.63 | $ | 1,015.63 | $ | 1,020.67 | $ | 1,019.91 |
|
| † Expenses are equal to the fund’s annualized expense ratio of 1.15% for Class A, 1.90% for Class B, 1.90% for |
| Class C, .90% for Class I and 1.05% for Institutional Shares, multiplied by the average account value over the |
| period, multiplied by 184/365 (to reflect the one-half year period). |
8
|
| STATEMENT OF INVESTMENTS |
| December 31, 2010 |
| | | |
| Common Stocks—99.8% | Shares | Value ($) |
| Consumer Discretionary—11.9% | | |
| Carnival | 110,240 | 5,083,166 |
| General Motors | 24,794 | 913,906 |
| Home Depot | 52,550 | 1,842,403 |
| Johnson Controls | 109,440 | 4,180,608 |
| Lowe’s | 74,150 | 1,859,682 |
| Mattel | 71,060 | 1,807,056 |
| News, Cl. A | 357,180 | 5,200,541 |
| Omnicom Group | 190,150 | 8,708,870 |
| Staples | 79,800 | 1,817,046 |
| Target | 45,330 | 2,725,693 |
| Time Warner | 217,876 | 7,009,071 |
| Viacom, Cl. B | 45,810 | 1,814,534 |
| Whirlpool | 16,100 | 1,430,163 |
| | | 44,392,739 |
| Consumer Staples—7.5% | | |
| CVS Caremark | 151,870 | 5,280,520 |
| Dr. Pepper Snapple Group | 97,320 | 3,421,771 |
| Energizer Holdings | 50,750a | 3,699,675 |
| PepsiCo | 155,320 | 10,147,056 |
| Philip Morris International | 60,050 | 3,514,726 |
| Walgreen | 47,410 | 1,847,094 |
| | | 27,910,842 |
| Energy—16.1% | | |
| Anadarko Petroleum | 58,110 | 4,425,658 |
| Cameron International | 80,400a | 4,078,692 |
| EOG Resources | 79,960 | 7,309,144 |
| Exxon Mobil | 67,840 | 4,960,461 |
| Hess | 40,630 | 3,109,820 |
| Occidental Petroleum | 187,830 | 18,426,123 |
| Peabody Energy | 49,870 | 3,190,683 |
| QEP Resources | 103,590 | 3,761,353 |
| Schlumberger | 128,300 | 10,713,050 |
| | | 59,974,984 |
| Financial—23.9% | | |
| ACE | 47,040 | 2,928,240 |
| American Express | 45,210 | 1,940,413 |
STATEMENT OF INVESTMENTS (continued)
| | | |
| Common Stocks (continued) | Shares | Value ($) |
| Financial (continued) | | |
| Ameriprise Financial | 80,540 | 4,635,077 |
| AON | 69,080 | 3,178,371 |
| Bank of America | 659,026 | 8,791,407 |
| Capital One Financial | 26,020 | 1,107,411 |
| Citigroup | 1,225,140a | 5,794,912 |
| Franklin Resources | 15,840 | 1,761,566 |
| Genworth Financial, Cl. A | 141,500a | 1,859,310 |
| Goldman Sachs Group | 28,630 | 4,814,421 |
| JPMorgan Chase & Co. | 336,660 | 14,281,117 |
| Marsh & McLennan | 96,820 | 2,647,059 |
| MetLife | 154,820 | 6,880,201 |
| Morgan Stanley | 142,020 | 3,864,364 |
| PNC Financial Services Group | 40,070 | 2,433,050 |
| Prudential Financial | 65,750 | 3,860,183 |
| State Street | 41,720 | 1,933,305 |
| SunTrust Banks | 75,450 | 2,226,529 |
| U.S. Bancorp | 160,610 | 4,331,652 |
| Wells Fargo & Co. | 316,930 | 9,821,661 |
| | | 89,090,249 |
| Health Care—10.5% | | |
| AmerisourceBergen | 59,850 | 2,042,082 |
| Amgen | 46,590a | 2,557,791 |
| CIGNA | 49,630 | 1,819,436 |
| Covidien | 74,100 | 3,383,406 |
| McKesson | 53,820 | 3,787,852 |
| Merck & Co. | 198,210 | 7,143,488 |
| Pfizer | 632,120 | 11,068,421 |
| Thermo Fisher Scientific | 50,550a | 2,798,448 |
| UnitedHealth Group | 124,250 | 4,486,667 |
| | | 39,087,591 |
| Industrial—11.8% | | |
| Caterpillar | 23,690 | 2,218,805 |
| Cooper Industries | 51,420 | 2,997,272 |
| Dover | 85,020 | 4,969,419 |
| Eaton | 42,250 | 4,288,797 |
| General Electric | 515,130 | 9,421,728 |
10
| | | |
| Common Stocks (continued) | Shares | Value ($) |
| Industrial (continued) | | |
| Honeywell International | 38,430 | 2,042,939 |
| Ingersoll-Rand | 68,440 | 3,222,840 |
| Pitney Bowes | 145,750b | 3,524,235 |
| Republic Services | 77,450 | 2,312,657 |
| Union Pacific | 65,630 | 6,081,276 |
| United Technologies | 36,240 | 2,852,813 |
| | | 43,932,781 |
| Information Technology—7.0% | | |
| AOL | 65,418a | 1,551,061 |
| BMC Software | 75,140a | 3,542,100 |
| eBay | 60,210a | 1,675,644 |
| Microsoft | 191,530 | 5,347,518 |
| Motorola | 110,370a | 1,001,056 |
| Oracle | 91,420 | 2,861,446 |
| QUALCOMM | 122,050 | 6,040,254 |
| Teradata | 52,080a | 2,143,613 |
| Western Digital | 53,750a | 1,822,125 |
| | | 25,984,817 |
| Materials—4.6% | | |
| Air Products & Chemicals | 21,190 | 1,927,230 |
| Celanese, Ser. A | 46,300 | 1,906,171 |
| Dow Chemical | 107,440 | 3,668,002 |
| Freeport-McMoRan Copper & Gold | 47,250 | 5,674,252 |
| International Paper | 73,000 | 1,988,520 |
| United States Steel | 32,820b | 1,917,344 |
| | | 17,081,519 |
| Telecommunication Services—3.9% | | |
| AT&T | 128,085 | 3,763,137 |
| Vodafone Group, ADR | 407,650 | 10,774,189 |
| | | 14,537,326 |
| Utilities—2.6% | | |
| Entergy | 60,930 | 4,315,672 |
| NextEra Energy | 105,500 | 5,484,945 |
| | | 9,800,617 |
| Total Common Stocks | | |
| (cost $318,188,109) | | 371,793,465 |
STATEMENT OF INVESTMENTS (continued)
| | | | |
| Other Investment—.0% | Shares | Value ($) |
| Registered Investment Company; | | |
| Dreyfus Institutional Preferred | | |
| Plus Money Market Fund | | |
| (cost $151,000) | 151,000c | 151,000 |
| |
| Investment of Cash Collateral | | |
| for Securities Loaned—1.4% | | |
| Registered Investment Company; | | |
| Dreyfus Institutional Cash Advantage Fund | | |
| (cost $5,059,040) | 5,059,040c | 5,059,040 |
| |
| Total Investments (cost $323,398,149) | 101.2% | 377,003,505 |
| Liabilities, Less Cash and Receivables | (1.2%) | (4,412,487) |
| Net Assets | 100.0% | 372,591,018 |
ADR—American Depository Receipts
|
| a Non-income producing security. |
| b Security, or portion thereof, on loan.At December 31, 2010, the market value of the fund’s securities on loan was |
| $4,897,421 and the market value of the collateral held by the fund was $5,059,040. |
| c Investment in affiliated money market mutual fund. |
| | | |
| Portfolio Summary (Unaudited)† | | |
| |
| | Value (%) | | Value (%) |
| Financial | 23.9 | Information Technology | 7.0 |
| Energy | 16.1 | Materials | 4.6 |
| Consumer Discretionary | 11.9 | Telecommunication Services | 3.9 |
| Industrial | 11.8 | Utilities | 2.6 |
| Health Care | 10.5 | Money Market Investments | 1.4 |
| Consumer Staples | 7.5 | | 101.2 |
| |
| † Based on net assets. | | | |
| See notes to financial statements. | | | |
12
|
| STATEMENT OF ASSETS AND LIABILITIES |
| December 31, 2010 |
| | | | | | |
| | | | | Cost | Value |
| Assets ($): | | | | | |
| Investments in securities—See Statement of Investments (including | | |
| securities on loan, valued at $4,897,421)—Note 1(b): | | | |
| Unaffiliated issuers | | | 318,188,109 | 371,793,465 |
| Affiliated issuers | | | | 5,210,040 | 5,210,040 |
| Dividends and interest receivable | | | | 710,938 |
| Receivable for investment securities sold | | | | 677,273 |
| Receivable for shares of Beneficial Interest subscribed | | | 12,326 |
| | | | | | 378,404,042 |
| Liabilities ($): | | | | | |
| Due to The Dreyfus Corporation and affiliates—Note 3(b) | | | 387,210 |
| Cash overdraft due to Custodian | | | | 241,343 |
| Liability for securities on loan—Note 1(b) | | | | 5,059,040 |
| Payable for shares of Beneficial Interest redeemed | | | 125,431 |
| | | | | | 5,813,024 |
| Net Assets ($) | | | | | 372,591,018 |
| Composition of Net Assets ($): | | | | |
| Paid-in capital | | | | | 398,583,128 |
| Accumulated net realized gain (loss) on investments | | | (79,597,466) |
| Accumulated net unrealized appreciation | | | | |
| (depreciation) on investments | | | | 53,605,356 |
| Net Assets ($) | | | | | 372,591,018 |
| |
| |
| Net Asset Value Per Share | | | | |
| | Class A | Class B | Class C | Class I | Institutional |
| Net Assets ($) | 335,227,691 | 1,105,428 | 7,800,971 | 954,323 | 27,502,605 |
| Shares Outstanding | 13,724,804 | 46,207 | 326,372 | 39,072 | 1,126,447 |
| Net Asset Value | | | | | |
| Per Share ($) | 24.42 | 23.92 | 23.90 | 24.42 | 24.42 |
| |
| See notes to financial statements. | | | | | |
|
| STATEMENT OF OPERATIONS |
| Year Ended December 31, 2010 |
| | |
| Investment Income ($): | |
| Income: | |
| Cash dividends (net of $6,225 foreign taxes withheld at source): | |
| Unaffiliated issuers | 7,402,281 |
| Affiliated issuers | 2,152 |
| Income from securities lending—Note 1(b) | 2,091 |
| Interest | 274 |
| Total Income | 7,406,798 |
| Expenses: | |
| Management fee—Note 3(a) | 3,182,749 |
| Distribution and service fees—Note 3(b) | 924,579 |
| Trustees’ fees—Note 3(a) | 24,321 |
| Loan commitment fees—Note 2 | 2,570 |
| Total Expenses | 4,134,219 |
| Less—Trustees’ fees reimbursed by the Manager—Note 3(a) | (24,321) |
| Net Expenses | 4,109,898 |
| Investment Income—Net | 3,296,900 |
| Realized and Unrealized Gain (Loss) on Investments—Note 4 ($): | |
| Net realized gain (loss) on investments | 14,013,031 |
| Net unrealized appreciation (depreciation) on investments | 26,247,495 |
| Net Realized and Unrealized Gain (Loss) on Investments | 40,260,526 |
| Net Increase in Net Assets Resulting from Operations | 43,557,426 |
| |
| See notes to financial statements. | |
14
STATEMENT OF CHANGES IN NET ASSETS
| | | | |
| | Year Ended December 31, |
| | 2010 | 2009a |
| Operations ($): | | |
| Investment income—net | 3,296,900 | 4,312,321 |
| Net realized gain (loss) on investments | 14,013,031 | (36,235,669) |
| Net unrealized appreciation | | |
| (depreciation) on investments | 26,247,495 | 87,286,702 |
| Net Increase (Decrease) in Net Assets | | |
| Resulting from Operations | 43,557,426 | 55,363,354 |
| Dividends to Shareholders from ($): | | |
| Investment income—net: | | |
| Class A Shares | (3,001,921) | (3,933,828) |
| Class B Shares | (2,812) | (23,861) |
| Class C Shares | (16,307) | (44,329) |
| Class I Shares | (11,722) | (12,221) |
| Institutional Shares | (273,177) | (329,794) |
| Total Dividends | (3,305,939) | (4,344,033) |
| Beneficial Interest Transactions ($): | | |
| Net proceeds from shares sold: | | |
| Class A Shares | 7,132,668 | 11,628,595 |
| Class B Shares | 27,062 | 48,918 |
| Class C Shares | 725,284 | 565,585 |
| Class I Shares | 161,562 | 233,888 |
| Class T Shares | — | 4,900 |
| Institutional Shares | 1,456,964 | 259,267 |
STATEMENT OF CHANGES IN NET ASSETS (continued)
| | | | |
| | Year Ended December 31, |
| | 2010 | 2009a |
| Beneficial Interest Transactions ($) (continued): | | |
| Dividends reinvested: | | |
| Class A Shares | 2,602,555 | 3,386,255 |
| Class B Shares | 2,618 | 22,288 |
| Class C Shares | 14,302 | 38,504 |
| Class I Shares | 8,118 | 11,613 |
| Institutional Shares | 261,784 | 321,000 |
| Cost of shares redeemed: | | |
| Class A Shares | (35,931,256) | (37,592,218) |
| Class B Shares | (1,574,562) | (3,443,128) |
| Class C Shares | (1,606,770) | (2,215,012) |
| Class I Shares | (367,913) | (64,206) |
| Class T Shares | — | (1,037,083) |
| Institutional Shares | (2,970,535) | (2,093,420) |
| Increase (Decrease) in Net Assets from | | |
| Beneficial Interest Transactions | (30,058,119) | (29,924,254) |
| Total Increase (Decrease) in Net Assets | 10,193,368 | 21,095,067 |
| Net Assets ($): | | |
| Beginning of Period | 362,397,650 | 341,302,583 |
| End of Period | 372,591,018 | 362,397,650 |
| Undistributed investment income—net | — | 6,692 |
16
| | | | |
| | Year Ended December 31, |
| | 2010 | 2009a |
| Capital Share Transactions: | | |
| Class Ab,c | | |
| Shares sold | 321,577 | 644,580 |
| Shares issued for dividends reinvested | 117,211 | 186,499 |
| Shares redeemed | (1,612,026) | (2,017,879) |
| Net Increase (Decrease) in Shares Outstanding | (1,173,238) | (1,186,800) |
| Class Bb | | |
| Shares sold | 1,263 | 2,707 |
| Shares issued for dividends reinvested | 124 | 1,373 |
| Shares redeemed | (72,348) | (195,433) |
| Net Increase (Decrease) in Shares Outstanding | (70,961) | (191,353) |
| Class C | | |
| Shares sold | 32,442 | 30,654 |
| Shares issued for dividends reinvested | 672 | 2,342 |
| Shares redeemed | (74,366) | (122,745) |
| Net Increase (Decrease) in Shares Outstanding | (41,252) | (89,749) |
| Class I | | |
| Shares sold | 7,181 | 11,070 |
| Shares issued for dividends reinvested | 365 | 635 |
| Shares redeemed | (16,429) | (3,622) |
| Net Increase (Decrease) in Shares Outstanding | (8,883) | 8,083 |
| Class Tc | | |
| Shares sold | — | 291 |
| Shares issued for dividends reinvested | — | — |
| Shares redeemed | — | (62,134) |
| Net Increase (Decrease) in Shares Outstanding | — | (61,843) |
| Institutional Shares | | |
| Shares sold | 64,865 | 13,952 |
| Shares issued for dividends reinvested | 11,800 | 17,609 |
| Shares redeemed | (133,726) | (119,227) |
| Net Increase (Decrease) in Shares Outstanding | (57,061) | (87,666) |
|
| a Effective as of the close of business on February 4, 2009, the fund no longer offers Class T shares. |
| b During the period ended December 31, 2010, 40,652 Class B shares representing $882,759 were automatically |
| converted to 39,799 Class A shares and during the period ended Deceber 31, 2009, 94,322 Class B shares |
| representing $1,726,360 were automatically converted to 92,335 Class A shares. |
| c On the close of business on February 4, 2009, 61,363 Class T shares representing $1,023,527 were converted to |
| 61,326 Class A shares. |
See notes to financial statements.
FINANCIAL HIGHLIGHTS
The following tables describe the performance for each share class for the fiscal periods indicated.All information (except portfolio turnover rate) reflects financial results for a single fund share.Total return shows how much your investment in the fund would have increased (or decreased) during each period, assuming you had reinvested all dividends and distributions.These figures have been derived from the fund’s financial statements.
| | | | | | | | | | |
| | | Year Ended December 31, | |
| Class A Shares | 2010 | 2009 | 2008 | 2007 | 2006 |
| Per Share Data ($): | | | | | |
| Net asset value, beginning of period | 21.83 | 18.75 | 29.87 | 32.00 | 31.38 |
| Investment Operations: | | | | | |
| Investment income—neta | .21 | .25 | .38 | .45 | .38 |
| Net realized and unrealized | | | | | |
| gain (loss) on investments | 2.59 | 3.08 | (11.10) | .42 | 5.94 |
| Total from Investment Operations | 2.80 | 3.33 | (10.72) | .87 | 6.32 |
| Distributions: | | | | | |
| Dividends from investment income—net | (.21) | (.25) | (.40) | (.46) | (.37) |
| Dividends from net realized | | | | | |
| gain on investments | — | — | (.00)b | (2.54) | (5.33) |
| Total Distributions | (.21) | (.25) | (.40) | (3.00) | (5.70) |
| Net asset value, end of period | 24.42 | 21.83 | 18.75 | 29.87 | 32.00 |
| Total Return (%)c | 12.99 | 18.07 | (36.10) | 2.75 | 21.00 |
| Ratios/Supplemental Data (%): | | | | | |
| Ratio of total expenses | | | | | |
| to average net assets | 1.15 | 1.17 | 1.16 | 1.16 | 1.15 |
| Ratio of net expenses | | | | | |
| to average net assets | 1.15 | 1.16 | 1.15 | 1.15 | 1.15 |
| Ratio of net investment income | | | | | |
| to average net assets | .94 | 1.33 | 1.53 | 1.38 | 1.17 |
| Portfolio Turnover Rate | 55.41 | 64.35 | 53.58 | 45.19 | 44.73 |
| Net Assets, end of period ($ x 1,000) | 335,228 | 325,170 | 301,524 | 522,906 | 548,601 |
| |
| a | Based on average shares outstanding at each month end. |
| b | Amount represents less than $.01 per share. |
| c | Exclusive of sales charge. |
See notes to financial statements.
18
| | | | | | | | | | |
| | | Year Ended December 31, | |
| Class B Shares | 2010 | 2009 | 2008 | 2007 | 2006 |
| Per Share Data ($): | | | | | |
| Net asset value, beginning of period | 21.38 | 18.36 | 29.26 | 31.40 | 30.87 |
| Investment Operations: | | | | | |
| Investment income—neta | .03 | .13 | .17 | .22 | .13 |
| Net realized and unrealized | | | | | |
| gain (loss) on investments | 2.56 | 3.00 | (10.85) | .39 | 5.85 |
| Total from Investment Operations | 2.59 | 3.13 | (10.68) | .61 | 5.98 |
| Distributions: | | | | | |
| Dividends from investment income—net | (.05) | (.11) | (.22) | (.21) | (.12) |
| Dividends from net realized | | | | | |
| gain on investments | — | — | (.00)b | (2.54) | (5.33) |
| Total Distributions | (.05) | (.11) | (.22) | (2.75) | (5.45) |
| Net asset value, end of period | 23.92 | 21.38 | 18.36 | 29.26 | 31.40 |
| Total Return (%)c | 12.13 | 17.21 | (36.62) | 2.01 | 20.12 |
| Ratios/Supplemental Data (%): | | | | | |
| Ratio of total expenses | | | | | |
| to average net assets | 1.91 | 1.91 | 1.90 | 1.91 | 1.90 |
| Ratio of net expenses | | | | | |
| to average net assets | 1.90 | 1.90 | 1.90 | 1.90 | 1.90 |
| Ratio of net investment income | | | | | |
| to average net assets | .13 | .74 | .69 | .70 | .42 |
| Portfolio Turnover Rate | 55.41 | 64.35 | 53.58 | 45.19 | 44.73 |
| Net Assets, end of period ($ x 1,000) | 1,105 | 2,505 | 5,665 | 26,646 | 55,112 |
| |
| a | Based on average shares outstanding at each month end. |
| b | Amount represents less than $.01 per share. |
| c | Exclusive of sales charge. |
See notes to financial statements.
FINANCIAL HIGHLIGHTS (continued)
| | | | | | | | | | |
| | | Year Ended December 31, | |
| Class C Shares | 2010 | 2009 | 2008 | 2007 | 2006 |
| Per Share Data ($): | | | | | |
| Net asset value, beginning of period | 21.36 | 18.35 | 29.24 | 31.38 | 30.85 |
| Investment Operations: | | | | | |
| Investment income—neta | .04 | .11 | .19 | .21 | .14 |
| Net realized and unrealized | | | | | |
| gain (loss) on investments | 2.55 | 3.01 | (10.86) | .40 | 5.84 |
| Total from Investment Operations | 2.59 | 3.12 | (10.67) | .61 | 5.98 |
| Distributions: | | | | | |
| Dividends from investment income—net | (.05) | (.11) | (.22) | (.21) | (.12) |
| Dividends from net realized | | | | | |
| gain on investments | — | — | (.00)b | (2.54) | (5.33) |
| Total Distributions | (.05) | (.11) | (.22) | (2.75) | (5.45) |
| Net asset value, end of period | 23.90 | 21.36 | 18.35 | 29.24 | 31.38 |
| Total Return (%)c | 12.14 | 17.16 | (36.59) | 2.00 | 20.07 |
| Ratios/Supplemental Data (%): | | | | | |
| Ratio of total expenses | | | | | |
| to average net assets | 1.91 | 1.92 | 1.90 | 1.91 | 1.90 |
| Ratio of net expenses | | | | | |
| to average net assets | 1.90 | 1.91 | 1.90 | 1.90 | 1.90 |
| Ratio of net investment income | | | | | |
| to average net assets | .19 | .60 | .76 | .65 | .42 |
| Portfolio Turnover Rate | 55.41 | 64.35 | 53.58 | 45.19 | 44.73 |
| Net Assets, end of period ($ x 1,000) | 7,801 | 7,853 | 8,391 | 16,572 | 20,919 |
| |
| a | Based on average shares outstanding at each month end. |
| b | Amount represents less than $.01 per share. |
| c | Exclusive of sales charge. |
See notes to financial statements.
20
| | | | | | | | | | |
| | | Year Ended December 31, | |
| Class I Shares | 2010 | 2009 | 2008 | 2007a | 2006 |
| Per Share Data ($): | | | | | |
| Net asset value, beginning of period | 21.83 | 18.74 | 29.85 | 31.98 | 31.36 |
| Investment Operations: | | | | | |
| Investment income—netb | .27 | .30 | .45 | .57 | .46 |
| Net realized and unrealized | | | | | |
| gain (loss) on investments | 2.59 | 3.09 | (11.10) | .39 | 5.95 |
| Total from Investment Operations | 2.86 | 3.39 | (10.65) | .96 | 6.41 |
| Distributions: | | | | | |
| Dividends from investment income—net | (.27) | (.30) | (.46) | (.55) | (.46) |
| Dividends from net realized | | | | | |
| gain on investments | — | — | (.00)c | (2.54) | (5.33) |
| Total Distributions | (.27) | (.30) | (.46) | (3.09) | (5.79) |
| Net asset value, end of period | 24.42 | 21.83 | 18.74 | 29.85 | 31.98 |
| Total Return (%) | 13.23 | 18.43 | (35.93) | 3.04 | 21.26 |
| Ratios/Supplemental Data (%): | | | | | |
| Ratio of total expenses | | | | | |
| to average net assets | .90 | .92 | .90 | .91 | .90 |
| Ratio of net expenses | | | | | |
| to average net assets | .90 | .91 | .90 | .90 | .90 |
| Ratio of net investment income | | | | | |
| to average net assets | 1.19 | 1.57 | 1.74 | 1.63 | 1.42 |
| Portfolio Turnover Rate | 55.41 | 64.35 | 53.58 | 45.19 | 44.73 |
| Net Assets, end of period ($ x 1,000) | 954 | 1,047 | 747 | 1,395 | 6,012 |
| |
| a | Effective June 1, 2007, Class R shares were redesignated as Class I shares. |
| b | Based on average shares outstanding at each month end. |
| c | Amount represents less than $.01 per share. |
See notes to financial statements.
FINANCIAL HIGHLIGHTS (continued)
| | | | | | | | | | |
| | | Year Ended December 31, | |
| Institutional Shares | 2010 | 2009 | 2008 | 2007 | 2006 |
| Per Share Data ($): | | | | | |
| Net asset value, beginning of period | 21.82 | 18.74 | 29.85 | 31.98 | 31.36 |
| Investment Operations: | | | | | |
| Investment income—neta | .23 | .27 | .41 | .48 | .42 |
| Net realized and unrealized | | | | | |
| gain (loss) on investments | 2.61 | 3.08 | (11.09) | .43 | 5.94 |
| Total from Investment Operations | 2.84 | 3.35 | (10.68) | .91 | 6.36 |
| Distributions: | | | | | |
| Dividends from investment income—net | (.24) | (.27) | (.43) | (.50) | (.41) |
| Dividends from net realized | | | | | |
| gain on investments | — | — | (.00)b | (2.54) | (5.33) |
| Total Distributions | (.24) | (.27) | (.43) | (3.04) | (5.74) |
| Net asset value, end of period | 24.42 | 21.82 | 18.74 | 29.85 | 31.98 |
| Total Return (%) | 13.11 | 18.20 | (36.05) | 2.89 | 21.11 |
| Ratios/Supplemental Data (%): | | | | | |
| Ratio of total expenses | | | | | |
| to average net assets | 1.05 | 1.06 | 1.06 | 1.06 | 1.05 |
| Ratio of net expenses | | | | | |
| to average net assets | 1.05 | 1.06 | 1.05 | 1.05 | 1.05 |
| Ratio of net investment income | | | | | |
| to average net assets | 1.04 | 1.43 | 1.63 | 1.49 | 1.28 |
| Portfolio Turnover Rate | 55.41 | 64.35 | 53.58 | 45.19 | 44.73 |
| Net Assets, end of period ($ x 1,000) | 27,503 | 25,822 | 23,816 | 40,679 | 44,506 |
| |
| a | Based on average shares outstanding at each month end. |
| b | Amount represents less than $.01 per share. |
See notes to financial statements.
22
NOTES TO FINANCIAL STATEMENTS
NOTE 1—Significant Accounting Policies:
Dreyfus CoreValue Fund (the “fund”) is a separate diversified series of The Dreyfus/Laurel Funds Trust (the “Trust”) which is registered under the Investment Company Act of 1940, as amended (the “Act”), as an open-end management investment company and operates as a series company offering seven series, including the fund. The fund’s investment objective is to seek long-term capital growth.The Dreyfus Corporation (the “Manager” or “Dreyfus”), a wholly-owned subsidiary of The Bank of New York Mellon Corporation (“BNY Mellon”), serves as the fund’s investment adviser.
MBSC Securities Corporation (the “Distributor”), a wholly-owned subsidiary of the Manager, is the distributor of the fund’s shares. The fund is authorized to issue an unlimited number of shares of Beneficial Interest in each of the following classes of shares: Class A, Class B, Class C, Class I and Institutional shares. Class A, Class B and Class C shares are sold primarily to retail investors through financial intermediaries and bear a distribution fee and/or service fee. Class A shares are subject to a front-end sales charge, while Class B and Class C shares are subject to a contingent deferred sales charge (“CDSC”). Class B shares automatically convert to Class A shares after six years.The fund no longer offers Class B shares, except in connection with dividend reinvestment and permitted exchanges of Class B shares. Class I shares are sold primarily to bank trust departments and ot her financial service providers including The Bank of NewYork Mellon, a subsidiary of BNY Mellon and an affiliate of Dreyfus, acting on behalf of customers having a qualified trust or investment account or relationship at such institution, and bear no distribution or service fees. Class I and Institutional shares are offered without a front-end sales charge or CDSC. Institutional shares are offered only to those customers of certain financial planners and investment advisers who held shares of a predecessor class of the fund as of April 4, 1994, and bear a distribution fee. Each class of shares has identical rights and privileges, except with respect to the distribution
NOTES TO FINANCIAL STATEMENTS (continued)
and service fees and voting rights on matters affecting a single class. Income, expenses (other than expenses attributable to a specific class),and realized and unrealized gains or losses on investments are allocated to each class of shares based on its relative net assets.
The Financial Accounting Standards Board (“FASB”) Accounting Standards Codification (“ASC”) is the exclusive reference of authoritative U.S. generally accepted accounting principles (“GAAP”) recognized by the FASB to be applied by nongovernmental entities. Rules and interpretive releases of the Securities and Exchange Commission (“SEC”) under authority of federal laws are also sources of authoritative GAAP for SEC registrants. The fund’s financial statements are prepared in accordance with GAAP, which may require the use of management estimates and assumptions.Actual results could differ from those estimates.
(a) Portfolio valuation: Investments in securities are valued at the last sales price on the securities exchange or national securities market on which such securities are primarily traded. Securities listed on the National Market System, for which market quotations are available are valued at the official closing price or, if there is no official closing price that day, at the last sales price. Securities not listed on an exchange or the national securities market, or securities for which there were no transactions, are valued at the average of the most recent bid and asked prices. Bid price is used when no asked price is available. Registered investment companies that are not traded on an exchange are valued at their net asset value. When market quotations or official closing prices are not readily available, or are determ ined not to reflect accurately fair value, such as when the value of a security has been significantly affected by events after the close of the exchange or market on which the security is principally traded (for example, a foreign exchange or market), but before the fund calculates its net asset value, the fund may value these investments at fair value as determined in accordance with the procedures approved by the Board of Trustees. Fair valuing of securities may be determined with the assistance of a pricing service using calculations based on indices of domestic securities and other appropriate indicators,
24
such as prices of relevant ADRs and futures contracts. For other securities that are fair valued by the Board of Trustees, certain factors may be considered such as: fundamental analytical data, the nature and duration of restrictions on disposition, an evaluation of the forces that influence the market in which the securities are purchased and sold, and public trading in similar securities of the issuer or comparable issuers.
The fair value of a financial instrument is the amount that would be received to sell an asset or paid to transfer a liability in an orderly transaction between market participants at the measurement date (i.e. the exit price). GAAP establishes a fair value hierarchy that prioritizes the inputs of valuation techniques used to measure fair value.This hierarchy gives the highest priority to unadjusted quoted prices in active markets for identical assets or liabilities (Level 1 measurements) and the lowest priority to unobservable inputs (Level 3 measurements).
Additionally, GAAP provides guidance on determining whether the volume and activity in a market has decreased significantly and whether such a decrease in activity results in transactions that are not orderly. GAAP requires enhanced disclosures around valuation inputs and techniques used during annual and interim periods.
Various inputs are used in determining the value of the fund’s investments relating to fair value measurements.These inputs are summarized in the three broad levels listed below:
Level 1—unadjusted quoted prices in active markets for identical investments.
Level 2—other significant observable inputs (including quoted prices for similar investments, interest rates, prepayment speeds, credit risk, etc.).
Level 3—significant unobservable inputs (including the fund’s own assumptions in determining the fair value of investments).
The inputs or methodology used for valuing securities are not necessarily an indication of the risk associated with investing in those securities.
NOTES TO FINANCIAL STATEMENTS (continued)
The following is a summary of the inputs used as of December 31, 2010 in valuing the fund’s investments:
| | | | |
| | | Level 2—Other | Level 3— | |
| | Level 1— | Significant | Significant | |
| | Unadjusted | Observable | Unobservable | |
| | Quoted Prices | Inputs | Inputs | Total |
| Assets ($) | | | | |
| Investments in Securities: | | | |
| Equity Securities— | | | | |
| Domestic† | 361,019,276 | — | — | 361,019,276 |
| Equity Securities— | | | | |
| Foreign† | 10,774,189 | — | — | 10,774,189 |
| Mutual Funds | 5,210,040 | — | — | 5,210,040 |
| † See Statement of Investments for additional detailed categorizations. | |
In January 2010, FASB issued Accounting Standards Update (“ASU”) No. 2010-06 “Improving Disclosures about FairValue Measurements”. The portions of ASU No. 2010-06 which require reporting entities to prepare new disclosures surrounding amounts and reasons for significant transfers in and out of Level 1 and Level 2 fair value measurements as well as inputs and valuation techniques used to measure fair value for both recurring and nonrecurring fair value measurements that fall in either Level 2 or Level 3 have been adopted by the fund. No significant transfers between Level 1 or Level 2 fair value measurements occurred at December 31, 2010. The remaining portion of ASU No. 2010-06 requires reporting entities to make new disclosures about information on purchases, sales, issuances and settlements on a gross basis in the reconciliation of activity in Level 3 fair value measurements. These new an d revised disclosures are required to be implemented for fiscal years beginning after December 15, 2010. Management is currently evaluating the impact that the adoption of this remaining portion of ASU No. 2010-06 may have on the fund’s financial statement disclosures.
(b) Securities transactions and investment income: Securities transactions are recorded on a trade date basis. Realized gains and losses from securities transactions are recorded on the identified cost basis. Dividend income is recognized on the ex-dividend date and interest
26
income, including, where applicable, accretion of discount and amortization of premium on investments, is recognized on the accrual basis.
Pursuant to a securities lending agreement withThe Bank of NewYork Mellon, the fund may lend securities to qualified institutions. It is the fund’s policy that, at origination, all loans are secured by collateral of at least 102% of the value of U.S. securities loaned and 105% of the value of foreign securities loaned. Collateral equivalent to at least 100% of the market value of securities on loan is maintained at all times. Collateral is either in the form of cash, which can be invested in certain money market mutual funds managed by the Manager, U.S. Government and Agency securities or letters of credit.The fund is entitled to receive all income on securities loaned, in addition to income earned as a result of the lending transaction.Although each security loaned is fully collateralized, the fund bears the risk of delay in recovery of, or loss of rights in, the securities loaned should a borrower fail to return the securities in a timely manner. During the period ended December 31, 2010,The Bank of NewYork Mellon earned $896 from lending portfolio securities, pursuant to the securities lending agreement.
(c) Affiliated issuers: Investments in other investment companies advised by Dreyfus are defined as “affiliated” in the Act.
The fund may invest in shares of certain affiliated investment companies also advised or managed by Dreyfus. Investments in affiliated investment companies for the period ended December 31, 2010 were as follows:
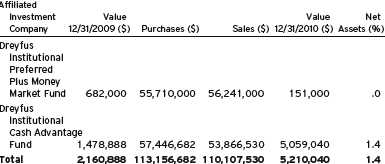
The Fund 27
NOTES TO FINANCIAL STATEMENTS (continued)
(d) Dividends to shareholders: Dividends are recorded on the ex-dividend date. Dividends from investment income-net are declared and paid on a quarterly basis. Dividends from net realized capital gains, if any, are normally declared and paid annually, but the fund may make distributions on a more frequent basis to comply with the distribution requirements of the Internal Revenue Code of 1986, as amended (the “Code”).To the extent that net realized capital gains can be offset by capital loss carryovers, it is the policy of the fund not to distribute such gains. Income and capital gain distributions are determined in accordance with income tax regulations, which may differ from GAAP.
(e) Federal income taxes: It is the policy of the fund to continue to qualify as a regulated investment company, if such qualification is in the best interests of its shareholders, by complying with the applicable provisions of the Code, and to make distributions of taxable income sufficient to relieve it from substantially all federal income and excise taxes.
As of and during the period ended December 31, 2010, the fund did not have any liabilities for any uncertain tax positions.The fund recognizes interest and penalties, if any, related to uncertain tax positions as income tax expense in the Statement of Operations. During the period, the fund did not incur any interest or penalties.
Each of the tax years in the four-year period ended December 31, 2010 remains subject to examination by the Internal Revenue Service and state taxing authorities.
At December 31, 2010, the components of accumulated earnings on a tax basis were as follows: accumulated capital losses $76,739,713 and unrealized appreciation $50,747,603.
The accumulated capital loss carryover is available for federal income tax purposes to be applied against future net securities profits, if any, realized subsequent to December 31, 2010. If not applied, $26,538,711 of the carryover expires in fiscal 2016 and $50,201,002 expires in fiscal 2017.
Under the recently enacted Regulated Investment Company Modernization Act of 2010, the fund will be permitted to carry forward
28
capital losses incurred in taxable years beginning after December 22, 2010 for an unlimited period. However, any losses incurred during those future taxable years will be required to be utilized prior to the losses incurred in pre-enactment taxable years. As a result of this ordering rule, pre-enactment capital loss carryovers may be more likely to expire unused.
The tax character of distributions paid to shareholders during the fiscal periods ended December 31, 2010 and December 31, 2009 were as follows: ordinary income $3,305,939 and $4,344,033, respectively.
During the period ended December 31, 2010, as a result of permanent book to tax differences, primarily due to the tax treatment for distributions in excess of taxable income, the fund increased accumulated undistributed investment income-net by $2,347 and decreased paid-in capital by the same amount. Net assets and net asset value per share were not affected by this reclassification.
NOTE 2—Bank Lines of Credit:
The fund participates with other Dreyfus-managed funds in a $225 million unsecured credit facility led by Citibank, N.A. and a $300 million unsecured credit facility provided by The Bank of New York Mellon (each, a “Facility”), each to be utilized primarily for temporary or emergency purposes, including the financing of redemptions. In connection therewith, the fund has agreed to pay its pro rata portion of commitment fees for each Facility. Interest is charged to the fund based on rates determined pursuant to the terms of the respective Facility at the time of borrowing. During the period ended December 31, 2010, the fund did not borrow under the Facilities.
NOTE 3—Investment Management Fee and Other Transactions With Affiliates:
(a) Pursuant to an investment management agreement with the Manager, the Manager provides or arranges for one or more third parties and/or affiliates to provide investment advisory, administrative, custody, fund accounting and transfer agency services to the fund.The
NOTES TO FINANCIAL STATEMENTS (continued)
Manager also directs the investments of the fund in accordance with its investment objective, policies and limitations. For these services, the fund is contractually obligated to pay the Manager a fee, calculated daily and paid monthly, at the annual rate of .90% of the value of the fund’s average daily net assets. Out of its fee, the Manager pays all of the expenses of the fund except brokerage fees, taxes, interest, commitment fees, Rule 12b-1 distribution fees and expenses, service fees and expenses of non-interested Trustees (including counsel fees) and extraordinary expenses. In addition, the Manager is required to reduce its fee in an amount equal to the fund’s allocable portion of fees and expenses of the non-interested Trustees (including counsel fees). EachTrustee who is not an “interested person” of theTrust (as defined in the Act) received $60,000 per annum, plus $7,000 per joint Board meeting of the Trust, The Dreyfus/Laurel Funds, Inc., The Dreyfus/Laurel Tax-Free Municipal Funds, Dreyfus Investment Funds and Dreyfus Funds, Inc. (collectively, the “Board Group Open-End Funds”) attended, $2,500 for separate in-person committee meetings attended which are not held in conjunction with a regularly scheduled Board meeting and $2,000 for Board meetings and separate committee meetings attended that are conducted by telephone. The Board Group Open-end Funds also reimburse each Trustee who is not an “interested person” of the Trust (as defined in the Act) for travel and out-of-pocket expenses. With respect to Board meetings, the Chairman of the Board receives an additional 25% of such compensation (with the exception of reimbursable amounts).The Chair of each of the Board’s committees, unless the Chair also serves as Chair of the Board, receives $1,350 per applicable committee meeting. In the event that there is an in-person joint committee meeting or a joint telephone meeting of the Board Group Open-end Funds and Dreyfus HighYield Strategies Fund, the $2,500 or $2,000 fee, as applicable, is allocated between the Board Group Open-end Funds and Dreyfus High Yield Strategie Fund. The Trust’s portion of these fees and expenses are charged and allocated to each series based on net assets. Amounts required to be paid by the Trust directly to the non-interested Trustees,
30
that would be applied to offset a portion of the management fee payable by certain other series of the Trust to the Manager, are in fact paid directly by the Manager to the non-interested Trustees.
During the period ended December 31, 2010, the Distributor retained $5,959 from commissions earned on sales of the fund’s Class A shares and $3,300 and $1,259 from CDSCs on redemptions on the fund’s Class B and Class C shares, respectively.
(b) Under separate Distribution Plans (the “Plans”) adopted pursuant to Rule 12b-1 under the Act, Class A shares and Institutional shares may pay annually up to .25% and .15%, respectively, of the value of their average daily net assets to compensate the Distributor for shareholder servicing activities and expenses primarily intended to result in the sale of Class A and Institutional shares. Class B and Class C shares pay the Distributor for distributing their shares at an aggregate annual rate of .75% of the value of the average daily net assets of Class B and Class C shares. Class B and Class C shares are also subject to a Service Plan adopted pursuant to Rule 12b-1 (the “Service Plan”), under which Class B and Class C shares pay the Distributor for providing certain services to the holders of their shares a fee at the annual rate of .25% of the value of the average daily net assets of Class B and Class C shares. During the period ended December 31, 2010, Class A, Class B, Class C and Institutional shares were charged $793,738, $11,602, $57,349 and $38,906, respectively, pursuant to their respective Plans. During the period ended December 31, 2010, Class B and Class C shares were charged $3,868 and $19,116, respectively, pursuant to the Service Plan.
Under its terms, the Plans and Service Plan shall remain in effect from year to year, provided such continuance is approved annually by a vote of majority of those Trustees who are not “interested persons” of the Trust and who have no direct or indirect financial interest in the operation of or in any agreement related to the Plans or Service Plan.
NOTES TO FINANCIAL STATEMENTS (continued)
The components of “Due to The Dreyfus Corporation and affiliates” in the Statement of Assets and Liabilities consist of: management fees $300,505, Rule 12b-1 distribution plan fees $84,733 and service plan fees $1,972.
NOTE 4—Securities Transactions:
The aggregate amount of purchases and sales of investment securities, excluding short-term securities, during the period ended December 31, 2010, amounted to $193,881,593 and $223,624,422, respectively.
The provisions of ASC Topic 815 “Derivatives and Hedging” require qualitative disclosures about objectives and strategies for using derivatives, quantitative disclosures about fair value amounts of gains and losses on derivative instruments and disclosures about credit-risk-related contingent features in derivative agreements.The fund held no derivatives during the period ended December 31, 2010.
At December 31, 2010, the cost of investments for federal income tax purposes was $326,255,902; accordingly, accumulated net unrealized appreciation on investments was $50,747,603, consisting of $62,464,602 gross unrealized appreciation and $11,716,999 gross unrealized depreciation.
32
REPORT OF INDEPENDENT REGISTERED
PUBLIC ACCOUNTING FIRM
The Board of Trustees and Shareholders The Dreyfus/Laurel Funds Trust
We have audited the accompanying statement of assets and liabilities of Dreyfus CoreValue Fund (the “Fund”), a series of The Dreyfus/Laurel FundsTrust, including the statement of investments as of December 31, 2010, and the related statement of operations for the year then ended, the statement of changes in net assets for each of the years in the two-year period then ended and the financial highlights for each of the years in the five-year period then ended. These financial statements and financial highlights are the responsibility of the Fund’s management. Our responsibility is to express an opinion on these financial statements and financial highlights based on our audits.
We conducted our audits in accordance with the standards of the Public Company Accounting Oversight Board (United States).Those standards require that we plan and perform the audit to obtain reasonable assurance about whether the financial statements and financial highlights are free of material misstatement. An audit includes examining, on a test basis, evidence supporting the amounts and disclosures in the financial statements. Our procedures included confirmation of securities owned as of December 31, 2010, by correspondence with the custodian and brokers. An audit also includes assessing the accounting principles used and significant estimates made by management, as well as evaluating the overall financial statement presentation.We believe that our audits provide a reasonable basis for our opinion.
In our opinion, the financial statements and financial highlights referred to above present fairly, in all material respects, the financial position of Dreyfus Core Value Fund as of December 31, 2010, and the results of its operations for the year then ended, the changes in its net assets for each of the years in the two-year period then ended and the financial highlights for each of the years in the five-year period then ended, in conformity with U.S. generally accepted accounting principles.

New York, New York
February 25, 2011
IMPORTANT TAX INFORMATION (Unaudited)
For federal tax purposes, the fund designates the maximum amount allowable, but not less than $3,305,939 as ordinary income dividends paid during the year ended December 31, 2010 as qualified dividend income in accordance with Section 854(b)(1)(B) of the Internal Revenue Code. Also, the fund designates the maximum amount allowable but not less than 100% of ordinary income dividends paid during the year ended December 31, 2010 as eligible for the corporate dividends received deduction provided under Section 243 of the Internal Revenue Code in accordance with Section 854(b)(1)(A) of the Internal Revenue Code. Shareholders will receive notification in early 2011 of the percentage applicable to the preparation of their 2010 income tax returns.
34
BOARD MEMBERS INFORMATION (Unaudited)
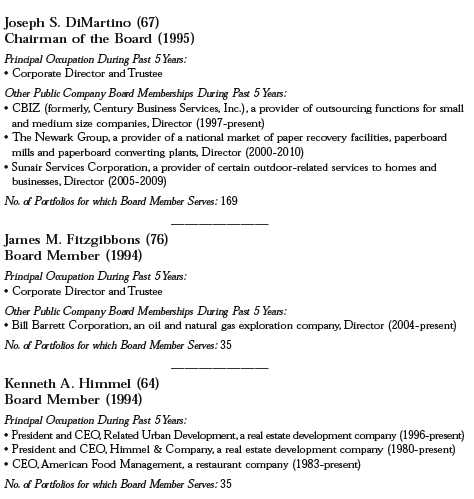
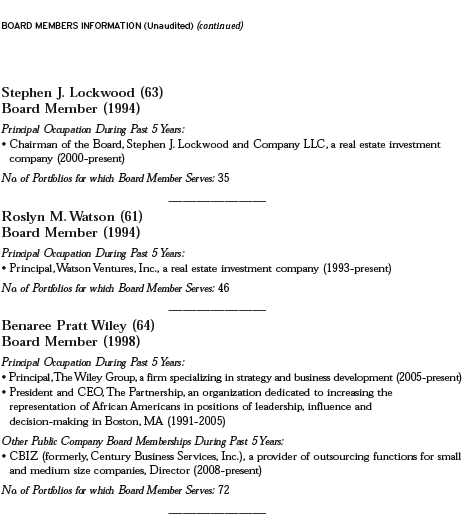
Once elected all Board Members serve for an indefinite term, but achieve Emeritus status upon reaching age 80.The address of the Board Members and Officers is in c/o The Dreyfus Corporation, 200 Park Avenue, NewYork, NewYork 10166.Additional information about the Board Members is available in the fund’s Statement of Additional Information which can be obtained from Dreyfus free of charge by calling this toll free number: 1-800-554-4611.
J.Tomlinson Fort, Emeritus Board Member
36
OFFICERS OF THE FUND (Unaudited)
BRADLEY J. SKAPYAK, President since January 2010.
Chief Operating Officer and a director of the Manager since June 2009. From April 2003 to June 2009, Mr. Skapyak was the head of the Investment Accounting and Support Department of the Manager. He is an officer of 76 investment companies (comprised of 169 portfolios) managed by the Manager. He is 52 years old and has been an employee of the Manager since February 1988.
PHILLIP N. MAISANO, Executive Vice President since July 2007.
Chief Investment Officer,Vice Chair and a director of the Manager, and an officer of 76 investment companies (comprised of 169 portfolios) managed by the Manager. Mr. Maisano also is an officer and/or Board member of certain other investment management subsidiaries of The Bank of New York Mellon Corporation, each of which is an affiliate of the Manager. He is 63 years old and has been an employee of the Manager since November 2006. Prior to joining the Manager, Mr. Maisano served as Chairman and Chief Executive Officer of EACM Advisors, an affiliate of the Manager, since August 2004.
MICHAEL A. ROSENBERG, Vice President and Secretary since August 2005.
Assistant General Counsel of BNY Mellon, and an officer of 77 investment companies (comprised of 194 portfolios) managed by the Manager. He is 50 years old and has been an employee of the Manager since October 1991.
KIESHA ASTWOOD, Vice President and Assistant Secretary since January 2010.
Counsel of BNY Mellon, and an officer of 77 investment companies (comprised of 194 portfolios) managed by the Manager. She is 37 years old and has been an employee of the Manager since July 1995.
JAMES BITETTO, Vice President and Assistant Secretary since August 2005.
Senior Counsel of BNY Mellon and Secretary of the Manager, and an officer of 77 investment companies (comprised of 194 portfolios) managed by the Manager. He is 44 years old and has been an employee of the Manager since December 1996.
JONI LACKS CHARATAN, Vice President and Assistant Secretary since August 2005.
Senior Counsel of BNY Mellon, and an officer of 77 investment companies (comprised of 194 portfolios) managed by the Manager. She is 55 years old and has been an employee of the Manager since October 1988.
JOSEPH M. CHIOFFI, Vice President and Assistant Secretary since August 2005.
Senior Counsel of BNY Mellon, and an officer of 77 investment companies (comprised of 194 portfolios) managed by the Manager. He is 49 years old and has been an employee of the Manager since June 2000.
KATHLEEN DENICHOLAS, Vice President and Assistant Secretary since January 2010.
Senior Counsel of BNY Mellon, and an officer of 77 investment companies (comprised of 194 portfolios) managed by the Manager. She is 36 years old and has been an employee of the Manager since February 2001.
JANETTE E. FARRAGHER, Vice President and Assistant Secretary since August 2005.
Assistant General Counsel of BNY Mellon, and an officer of 77 investment companies (comprised of 194 portfolios) managed by the Manager. She is 48 years old and has been an employee of the Manager since February 1984.
OFFICERS OF THE FUND (Unaudited) (continued)
JOHN B. HAMMALIAN, Vice President and Assistant Secretary since August 2005.
Managing Counsel of BNY Mellon, and an officer of 77 investment companies (comprised of 194 portfolios) managed by the Manager. He is 47 years old and has been an employee of the Manager since February 1991.
M. CRISTINA MEISER, Vice President and Assistant Secretary since January 2010.
Senior Counsel of BNY Mellon, and an officer of 77 investment companies (comprised of 194 portfolios) managed by the Manager. She is 40 years old and has been an employee of the Manager since August 2001.
ROBERT R. MULLERY, Vice President and Assistant Secretary since August 2005.
Managing Counsel of BNY Mellon, and an officer of 77 investment companies (comprised of 194 portfolios) managed by the Manager. He is 58 years old and has been an employee of the Manager since May 1986.
JEFF PRUSNOFSKY, Vice President and Assistant Secretary since August 2005.
Managing Counsel of BNY Mellon, and an officer of 77 investment companies (comprised of 194 portfolios) managed by the Manager. He is 45 years old and has been an employee of the Manager since October 1990.
JAMES WINDELS, Treasurer since November 2001.
Director – Mutual Fund Accounting of the Manager, and an officer of 77 investment companies (comprised of 194 portfolios) managed by the Manager. He is 52 years old and has been an employee of the Manager since April 1985.
RICHARD CASSARO, Assistant Treasurer since January 2008.
Senior Accounting Manager – Money Market and Municipal Bond Funds of the Manager, and an officer of 77 investment companies (comprised of 194 portfolios) managed by the Manager. He is 51 years old and has been an employee of the Manager since September 1982.
GAVIN C. REILLY, Assistant Treasurer since December 2005.
Tax Manager of the Investment Accounting and Support Department of the Manager, and an officer of 77 investment companies (comprised of 194 portfolios) managed by the Manager. He is 42 years old and has been an employee of the Manager since April 1991.
ROBERT ROBOL, Assistant Treasurer since December 2002.
Senior Accounting Manager – Fixed Income Funds of the Manager, and an officer of 77 investment companies (comprised of 194 portfolios) managed by the Manager. He is 46 years old and has been an employee of the Manager since October 1988.
ROBERT SALVIOLO, Assistant Treasurer since July 2007.
Senior Accounting Manager – Equity Funds of the Manager, and an officer of 77 investment companies (comprised of 194 portfolios) managed by the Manager. He is 43 years old and has been an employee of the Manager since June 1989.
38
ROBERT SVAGNA, Assistant Treasurer since December 2002.
Senior Accounting Manager – Equity Funds of the Manager, and an officer of 77 investment companies (comprised of 194 portfolios) managed by the Manager. He is 43 years old and has been an employee of the Manager since November 1990.
JOSEPH W. CONNOLLY, Chief Compliance Officer since October 2004.
Chief Compliance Officer of the Manager and The Dreyfus Family of Funds (77 investment companies, comprised of 194 portfolios). From November 2001 through March 2004, Mr. Connolly was first Vice-President, Mutual Fund Servicing for Mellon Global Securities Services. In that capacity, Mr. Connolly was responsible for managing Mellon’s Custody, Fund Accounting and Fund Administration services to third-party mutual fund clients. He is 53 years old and has served in various capacities with the Manager since 1980, including manager of the firm’s Fund Accounting Department from 1997 through October 2001.
NATALIA GRIBAS, Anti-Money Laundering Compliance Officer since July 2010.
Anti-Money Laundering Compliance Officer of the Distributor, and the Anti-Money Laundering Compliance Officer of 73 investment companies (comprised of 190 portfolios) managed by the Manager. She is 40 years old and has been an employee of the Distributor since September 2008.
For More Information
Telephone Call your financial representative or 1-800-554-4611
Mail The Dreyfus Family of Funds, 144 Glenn Curtiss Boulevard, Uniondale, NY 11556-0144
The fund files its complete schedule of portfolio holdings with the Securities and Exchange Commission (“SEC”) for the first and third quarters of each fiscal year on Form N-Q. The fund’s Forms N-Q are available on the SEC’s website at http://www.sec.gov and may be reviewed and copied at the SEC’s Public Reference Room in Washington, DC. Information on the operation of the Public Reference Room may be obtained by calling 1-800-SEC-0330.
A description of the policies and procedures that the fund uses to determine how to vote proxies relating to portfolio securities, and information regarding how the fund voted these proxies for the most recent 12-month period ended June 30 is available at http://www.dreyfus.com and on the SEC’s website at http://www.sec.gov. The description of the policies and procedures is also available without charge, upon request, by calling 1-800-645-6561.

ANNUAL REPORT December 31, 2010

Save time. Save paper. View your next shareholder report online as soon as it’s available. Log into www.dreyfus.com and sign up for Dreyfus eCommunications. It’s simple and only takes a few minutes.
The views expressed in this report reflect those of the portfolio manager only through the end of the period covered and do not necessarily represent the views of Dreyfus or any other person in the Dreyfus organization. Any such views are subject to change at any time based upon market or other conditions and Dreyfus disclaims any responsibility to update such views.These views may not be relied on as investment advice and, because investment decisions for a Dreyfus fund are based on numerous factors, may not be relied on as an indication of trading intent on behalf of any Dreyfus fund.

| | Contents |
| | THE FUND |
| 2 | A Letter from the Chairman and CEO |
| 3 | Discussion of Fund Performance |
| 6 | Fund Performance |
| 8 | Understanding Your Fund’s Expenses |
| 8 | Comparing Your Fund’s Expenses With Those of Other Funds |
| 9 | Statement of Investments |
| 21 | Statement of Assets and Liabilities |
| 22 | Statement of Operations |
| 23 | Statement of Changes in Net Assets |
| 25 | Financial Highlights |
| 29 | Notes to Financial Statements |
| 44 | Report of Independent Registered Public Accounting Firm |
| 45 | Important Tax Information |
| 46 | Board Members Information |
| 48 | Officers of the Fund |
| | FOR MORE INFORMATION |
| | Back Cover |
Dreyfus
High Yield Fund
The Fund

A LETTER FROM THE CHAIRMAN AND CEO
Dear Shareholder:
We are pleased to present this annual report for Dreyfus High Yield Fund, covering the 12-month period from January 1, 2010, through December 31, 2010.
2010 proved to be a volatile year for the financial markets, but most asset classes, including bonds, generally produced respectable returns for the year overall. Investors’ early concerns regarding sovereign debt issues in Europe and stubbornly high unemployment in the United States later gave way to optimism that massive economic stimulus programs, robust growth in the world’s emerging markets, a strong holiday retail season and rising corporate earnings signaled better economic times ahead. Consequently, returns were particularly strong in higher yielding fixed-income market sectors, including investment-grade and high yield corporate bonds. Although traditionally defensive U.S. government securities weathered pronounced weakness during the fourth quarter, they ended the year with modest gains, on average.
While unlikely, we are aware that short-term interest rates may rise later in 2011 from historically low levels if growth accelerates, and any new economic setbacks could spark heightened market volatility among corporate and mortgage-backed securities. Nonetheless, we continue to see value throughout the bond market, as a well-diversified bond portfolio can help temper volatility stemming from unexpected economic or market developments. With 2011 now upon us, we suggest talking to your financial advisor, who can help you identify potential opportunities across the global markets and suggest strategies suitable for your individual needs in today’s market environment.
For information about how the fund performed during the reporting period, as well as general market perspectives, we provide a Discussion of Fund Performance on the pages that follow.
Thank you for your continued confidence and support.

Jonathan R. Baum
Chairman and Chief Executive Officer
The Dreyfus Corporation
January 18, 2011
2

DISCUSSION OF FUND PERFORMANCE
For the period of January 1, 2010, through December 31, 2010, as provided by Karen Bater, Portfolio Manager
Fund and Market Performance Overview
For the 12-month period ended December 31, 2010, Dreyfus High Yield Fund’s Class A shares produced a total return of 12.50%, Class B shares returned 11.94%, Class C shares returned 11.66% and Class I shares returned 12.59%.1 In comparison, the BofA Merrill Lynch U.S. High Yield Master II Constrained Index (the “Index”), the fund’s benchmark, achieved a total return of 15.07% over the same period.2
Despite heightened market volatility early in 2010, high yield bonds rallied strongly, especially later in the year, as investors gained confidence in the U.S. economic recovery.The fund produced lower returns than its benchmark, primarily due to shortfalls in the first half of the year stemming from market volatility and security selections in the technology and financials sectors.
The Fund’s Investment Approach
The fund seeks to maximize total return, consisting of capital appreciation and current income.
At least 80% of the fund’s assets are invested in fixed-income securities that are rated below investment grade (“high yield” or “junk” bonds) or are the unrated equivalent as determined by Dreyfus. Individual issues are selected based on careful credit analysis.We thoroughly analyze the business, management and financial strength of each of the companies whose bonds we buy, then project each issuer’s ability to repay its debt.
Stimulative Policies Fueled Rallying Credit Markets
Although 2010 began in the midst of recovery from a global recession and financial crisis, new developments early in the year threatened to derail an already choppy rebound. A sovereign debt crisis in Europe roiled overseas bond markets and led to austerity measures that reduced
DISCUSSION OF FUND PERFORMANCE (continued)
fiscal stimuli throughout the region. Meanwhile, high unemployment and troubled housing markets weighed on economic growth in the United States.As a result, and despite their low yields, investors flocked to high-quality investments, such as U.S.Treasury securities.
In response to concerns regarding a potential return to recession, the Federal Reserve Board (the “Fed”) maintained its target for the federal funds rate in a range between 0% and 0.25%, and it announced a new round of quantitative easing of monetary policy for the fall. The Fed’s announcement helped trigger a resurgence among high yield bonds as investors grew more tolerant of credit risks. In addition, the high yield market was supported during the final months of 2010 by a rising stock market, declining default rates and robust demand for income-producing investments in a historically low interest-rate environment. In contrast, after rallying earlier in the year, U.S. government securities gave back a portion of their gains in the fourth quarter when investors shifted their attention away from traditional safe havens.
Quality Bias Produced Mixed Results
Stronger relative performance in a rallying market later in the year was not enough to fully offset shortfalls realized earlier in the year, when BB-rated high yield bonds, fared better. In addition, the fund suffered from sharp declines in telecommunications technology company Sorenson Communications, which received an unfavorable regulatory ruling.
Although our stock selection strategy in the financials sector fared relatively well, generally underweighted exposure to recovering financial institutions hindered relative returns. Conversely, an underweighted position in the energy sector added value, but our security selection strategy among energy companies produced lagging results. Other disappointments included power producer Dynegy, oil transporter General Maritime and the convertible bonds of MGM Resorts International.
On a more positive note, Italian wireless service provider Wind Acqusition received a takeover offer, boosting its bond price. Also in the telecommunications sector, Intelsat ranked among the fund’s top
4
performers. Overweighted exposure to the chemicals sector helped the fund benefit from rising industrial demand in a recovering global economy. Gains in radio station operator Clear Channel Communications helped support returns in the media industry, where the fund held an overweighted position. In other areas, finance company GMAC, which was sold during the reporting period, contributed positively to the fund’s relative performance.
Positioned for a Further Recovery
We have maintained the fund’s relatively constructive positioning, focusing on companies that, in our analysis, have the ability to grow their revenues and service their debt.As they reached fuller valuations, we reduced the fund’s holdings of CCC-rated bonds in favor of those in the B-rated tier. In our judgment, these strategies position the fund to participate fully in a market sector that we expect to continue to benefit from economic recovery and investor’s strong appetite for income-producing securities.
January 18, 2011
| |
| | Bond funds are subject generally to interest rate, credit, liquidity and market risks, to varying |
| | degrees, all of which are more fully described in the fund’s prospectus. Generally, all other factors |
| | being equal, bond prices are inversely related to interest-rate changes, and rate increases can cause |
| | price declines. |
| | High yield bonds are subject to increased credit risk and are considered speculative in terms of the |
| | issuer’s perceived ability to continue making interest payments on a timely basis and to repay |
| | principal upon maturity. |
| 1 | Total return includes reinvestment of dividends and any capital gains paid, and does not take into |
| | consideration the maximum initial sales charge in the case of Class A shares, or the applicable |
| | contingent deferred sales charges imposed on redemptions in the case of Class B and Class C |
| | shares. Had these charges been reflected, returns would have been lower. Past performance is no |
| | guarantee of future results. Share price, yield and investment return fluctuate such that upon |
| | redemption, fund shares may be worth more or less than their original cost. |
| 2 | SOURCE: Bloomberg — Reflects reinvestment of dividends and, where applicable, capital gain |
| | distributions.The BofA Merrill Lynch U.S. HighYield Master II Constrained Index is an |
| | unmanaged performance benchmark composed of U.S. dollar-denominated domestic andYankee |
| | bonds rated below investment grade with at least $100 million par amount outstanding and at |
| | least one year remaining to maturity. Bonds are capitalization-weighted.Total allocations to an |
| | issuer are capped at 2%.The index does not reflect fees and expenses to which the fund is subject. |
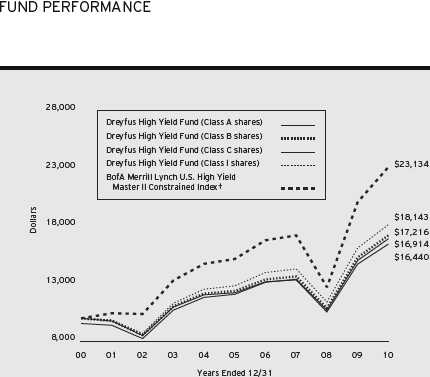
Comparison of change in value of $10,000 investment in Dreyfus High Yield Fund Class A shares, Class B shares, Class C shares and Class I shares and the BofA Merrill Lynch U.S. High Yield Master II Constrained Index
† Source: Bloomberg L.P.
Past performance is not predictive of future performance.
The above graph compares a $10,000 investment made in each of the Class A, Class B, Class C and Class I shares of Dreyfus HighYield Fund on 12/31/00 to a $10,000 investment made in the BofA Merrill Lynch U.S. HighYield Master II Constrained Index (the “Index”) on that date.All dividends and capital gain distributions are reinvested. The fund’s performance shown in the line graph takes into account the maximum initial sales charge on Class A shares and all other applicable fees and expenses on all classes. Performance for Class B shares assumes the conversion of Class B shares to Class A shares at the end of the sixth year following the date of purchase.The Index is an unmanaged performance benchmark composed of U.S. dollar-denominated domestic andYankee bonds rated below investment grade with at least $100 million par amount outstanding and at least one year remaining to maturity. Bonds are capitalization-weighted.Total allocations to an issuer are capped at 2%. Unlike a mutual fund, the Index is not subject to charges, fees and other expenses. Investors cannot invest directly in any index. Further information relating to fund performance, including expense reimbursements, if applicable, is contained in the Financial Highlights section of the prospectus and elsewhere in this report.
6
| | | | | | |
| Average Annual Total Returns as of 12/31/10 | | | |
| | 1Year | 5 Years | 10 Years |
| Class A shares | | | |
| with maximum sales charge (4.5%) | 7.36% | 5.96% | 5.40% |
| without sales charge | 12.50% | 6.93% | 5.88% |
| Class B shares | | | |
| with applicable redemption charge † | 7.94% | 6.09% | 5.58% |
| without redemption | 11.94% | 6.38% | 5.58% |
| Class C shares | | | |
| with applicable redemption charge †† | 10.66% | 6.11% | 5.10% |
| without redemption | 11.66% | 6.11% | 5.10% |
| Class I shares | 12.59% | 7.17% | 6.14% |
| BofA Merrill Lynch U.S. High Yield | | | |
| Master II Constrained Index | 15.07% | 8.82% | 8.74% |
Past performance is not predictive of future performance.The fund’s performance shown in the graph and table does not reflect the deduction of taxes that a shareholder would pay on fund distributions or the redemption of fund shares.
| |
| † | The maximum contingent deferred sales charge for Class B shares is 4%.After six years Class B shares convert to |
| | Class A shares. |
| †† | The maximum contingent deferred sales charge for Class C shares is 1% for shares redeemed within one year of the |
| | date of purchase. |
UNDERSTANDING YOUR FUND’S EXPENSES (Unaudited)
As a mutual fund investor, you pay ongoing expenses, such as management fees and other expenses. Using the information below, you can estimate how these expenses affect your investment and compare them with the expenses of other funds.You also may pay one-time transaction expenses, including sales charges (loads) and redemption fees, which are not shown in this section and would have resulted in higher total expenses. For more information, see your fund’s prospectus or talk to your financial adviser.
Review your fund’s expenses
The table below shows the expenses you would have paid on a $1,000 investment in Dreyfus High Yield Fund from July 1, 2010 to December 31, 2010. It also shows how much a $1,000 investment would be worth at the close of the period, assuming actual returns and expenses.
Expenses and Value of a $1,000 Investment
assuming actual returns for the six months ended December 31, 2010
| | | | | | | | |
| | | Class A | | Class B | | Class C | | Class I |
| Expenses paid per $1,000† | $ | 4.81 | $ | 7.36 | $ | 8.64 | $ | 3.54 |
| Ending value (after expenses) | $ | 1,009.50 | $ | 1,014.50 | $ | 1,017.00 | $ | 1,007.00 |
COMPARING YOUR FUND’S EXPENSES
WITH THOSE OF OTHER FUNDS (Unaudited)
Using the SEC’s method to compare expenses
The Securities and Exchange Commission (SEC) has established guidelines to help investors assess fund expenses. Per these guidelines, the table below shows your fund’s expenses based on a $1,000 investment, assuming a hypothetical 5% annualized return. You can use this information to compare the ongoing expenses (but not transaction expenses or total cost) of investing in the fund with those of other funds.All mutual fund shareholder reports will provide this information to help you make this comparison. Please note that you cannot use this information to estimate your actual ending account balance and expenses paid during the period.
Expenses and Value of a $1,000 Investment
assuming a hypothetical 5% annualized return for the six months ended December 31, 2010
| | | | | | | | |
| | | Class A | | Class B | | Class C | | Class I |
| Expenses paid per $1,000† | $ | 4.84 | $ | 7.37 | $ | 8.64 | $ | 3.57 |
| Ending value (after expenses) | $ | 1,020.42 | $ | 1,017.90 | $ | 1,016.64 | $ | 1,021.68 |
|
| Expenses are equal to the fund’s annualized expense ratio of .95% for Class A, 1.45% for Class B, 1.70% for |
| Class C and .70% for Class I, multiplied by the average account value over the period, multiplied by 184/365 (to |
| reflect the one-half year period). |
8
STATEMENT OF INVESTMENTS
December 31, 2010
| | | | | |
| | Coupon | Maturity | Principal | | |
| Bonds and Notes—95.3% | Rate (%) | Date | Amount ($) | | Value ($) |
| Aerospace—1.1% | | | | | |
| Alion Science and Technology, | | | | | |
| Sr. Scd. Notes | 12.00 | 11/1/14 | 13,931 | | 14,436 |
| Dyncorp International, | | | | | |
| Sr. Unscd. Notes | 10.38 | 7/1/17 | 6,935,000 | a | 7,143,050 |
| Transdigm, | | | | | |
| Sr. Sub. Notes | 7.75 | 12/15/18 | 4,245,000 | a | 4,414,800 |
| | | | | | 11,572,286 |
| Automotive—5.2% | | | | | |
| Ford Motor Credit, | | | | | |
| Sr. Unscd. Notes | 8.00 | 12/15/16 | 2,805,000 | | 3,138,220 |
| Ford Motor Credit, | | | | | |
| Sr. Unscd. Notes | 8.13 | 1/15/20 | 3,350,000 | b | 3,903,852 |
| Ford Motor Credit, | | | | | |
| Sr. Unscd. Notes | 8.70 | 10/1/14 | 8,580,000 | | 9,670,218 |
| Ford Motor, | | | | | |
| Sr. Unscd. Debs. | 6.50 | 8/1/18 | 730,000 | b | 759,200 |
| Ford Motor, | | | | | |
| Sr. Unscd. Notes | 7.45 | 7/16/31 | 9,215,000 | b | 9,917,644 |
| Goodyear Tire & Rubber, | | | | | |
| Sr. Unscd. Notes | 10.50 | 5/15/16 | 6,715,000 | b | 7,688,675 |
| Lear, | | | | | |
| Gtd. Bonds | 7.88 | 3/15/18 | 1,760,000 | | 1,892,000 |
| Lear, | | | | | |
| Gtd. Notes | 8.13 | 3/15/20 | 4,265,000 | b | 4,659,512 |
| Motors Liquidation, | | | | | |
| Sr. Unscd. Notes | 8.38 | 7/15/33 | 7,605,000 | b,c | 2,756,813 |
| Navistar International, | | | | | |
| Gtd. Notes | 8.25 | 11/1/21 | 4,595,000 | b | 4,962,600 |
| TRW Automotive, | | | | | |
| Gtd. Notes | 7.25 | 3/15/17 | 4,240,000 | a | 4,589,800 |
| | | | | | 53,938,534 |
| Building Products—1.3% | | | | | |
| Associated Materials, | | | | | |
| Sr. Scd. Notes | 9.13 | 11/1/17 | 2,555,000 | a | 2,676,362 |
| Standard Pacific, | | | | | |
| Gtd. Notes | 8.38 | 5/15/18 | 4,970,000 | a | 4,994,850 |
| Texas Industries, | | | | | |
| Gtd. Notes | 9.25 | 8/15/20 | 5,430,000 | a,b | 5,796,525 |
| | | | | | 13,467,737 |
STATEMENT OF INVESTMENTS (continued)
| | | | | |
| | Coupon | Maturity | Principal | | |
| Bonds and Notes (continued) | Rate (%) | Date | Amount ($) | | Value ($) |
| Cable/Satellite TV—4.1% | | | | | |
| CCH II Capital, | | | | | |
| Gtd. Notes | 13.50 | 11/30/16 | 20,424,136 | b | 24,457,903 |
| Cequel Communications Holdings I, | | | | | |
| Sr. Unscd. Notes | 8.63 | 11/15/17 | 2,375,000 | a | 2,493,750 |
| Dish DBS, | | | | | |
| Gtd. Notes | 7.13 | 2/1/16 | 6,790,000 | | 7,044,625 |
| Dish DBS, | | | | | |
| Gtd. Notes | 7.88 | 9/1/19 | 2,675,000 | | 2,808,750 |
| Insight Communications, | | | | | |
| Sr. Notes | 9.38 | 7/15/18 | 4,700,000 | a | 5,029,000 |
| | | | | | 41,834,028 |
| Capital Goods—1.1% | | | | | |
| RBS Global & Rexnord, | | | | | |
| Gtd. Notes | 8.50 | 5/1/18 | 5,395,000 | b | 5,759,163 |
| Wireco WorldGroup, | | | | | |
| Sr. Unscd. Notes | 9.50 | 5/15/17 | 5,415,000 | a | 5,739,900 |
| | | | | | 11,499,063 |
| Chemicals—4.1% | | | | | |
| Hexion U.S. Finance/Nova Scotia, | | | | | |
| Scd. Notes | 9.00 | 11/15/20 | 4,215,000 | a | 4,467,900 |
| Huntsman International, | | | | | |
| Gtd. Notes | 8.63 | 3/15/20 | 4,500,000 | b | 4,916,250 |
| Huntsman International, | | | | | |
| Gtd. Notes | 8.63 | 3/15/21 | 3,455,000 | a | 3,748,675 |
| Ineos Finance, | | | | | |
| Sr. Scd. Notes | 9.00 | 5/15/15 | 5,325,000 | a | 5,691,094 |
| Invista, | | | | | |
| Gtd. Notes | 9.25 | 5/1/12 | 898,000 | a | 915,960 |
| Lyondell Chemical, | | | | | |
| Sr. Scd. Notes | 8.00 | 11/1/17 | 1,845,000 | a | 2,045,644 |
| Momentive Performance Materials, | | | | | |
| Scd. Notes | 9.00 | 1/15/21 | 4,645,000 | a | 4,912,088 |
| OXEA Finance, | | | | | |
| Sr. Scd. Notes | 9.50 | 7/15/17 | 4,850,000 | a | 5,280,438 |
| Polyone, | | | | | |
| Sr. Unscd. Notes | 7.38 | 9/15/20 | 4,600,000 | | 4,778,250 |
| Texas Petrochemical, | | | | | |
| Sr. Scd. Notes | 8.25 | 10/1/17 | 3,045,000 | a | 3,197,250 |
10
| | | | | |
| | Coupon | Maturity | Principal | | |
| Bonds and Notes (continued) | Rate (%) | Date | Amount ($) | | Value ($) |
| Chemicals (continued) | | | | | |
| Vertellus Specialties, | | | | | |
| Sr. Scd. Notes | 9.38 | 10/1/15 | 1,610,000 | a | 1,710,625 |
| | | | | | 41,664,174 |
| Consumer Products—1.1% | | | | | |
| Reddy Ice, | | | | | |
| Sr. Scd. Notes | 11.25 | 3/15/15 | 8,215,000 | | 8,440,913 |
| Visant, | | | | | |
| Sr. Notes | 10.00 | 10/1/17 | 2,370,000 | a | 2,524,050 |
| | | | | | 10,964,963 |
| Containers—3.7% | | | | | |
| AEP Industries, | | | | | |
| Sr. Unscd. Notes | 7.88 | 3/15/13 | 8,321,000 | | 8,331,401 |
| Ball, | | | | | |
| Gtd. Notes | 5.75 | 5/15/21 | 2,030,000 | b | 1,969,100 |
| BWAY Holding, | | | | | |
| Gtd. Notes | 10.00 | 6/15/18 | 2,380,000 | a,b | 2,579,325 |
| BWAY Parent Company, | | | | | |
| Sr. Unscd. Notes | 10.13 | 11/1/15 | 6,775,000 | a | 6,876,625 |
| Plastipak Holdings, | | | | | |
| Sr. Notes | 10.63 | 8/15/19 | 2,435,000 | a | 2,748,506 |
| Reynolds Group Issuer, | | | | | |
| Gtd. Notes | 8.50 | 5/15/18 | 10,905,000 | a | 11,014,050 |
| Solo Cup, | | | | | |
| Sr. Scd. Notes | 10.50 | 11/1/13 | 4,295,000 | b | 4,509,750 |
| | | | | | 38,028,757 |
| Energy—7.9% | | | | | |
| American | | | | | |
| Petroleum Tankers, | | | | | |
| Sr. Scd. Notes | 10.25 | 5/1/15 | 4,735,000 | a | 4,924,400 |
| Aquilex Holdings, | | | | | |
| Gtd. Notes | 11.13 | 12/15/16 | 3,700,000 | | 3,764,750 |
| CHC Helicopter, | | | | | |
| Sr. Scd. Notes | 9.25 | 10/15/20 | 4,500,000 | a | 4,680,000 |
| Chesapeake Energy, | | | | | |
| Gtd. Notes | 6.63 | 8/15/20 | 10,040,000 | | 9,939,600 |
| Chesapeake Energy, | | | | | |
| Gtd. Notes | 9.50 | 2/15/15 | 4,360,000 | b | 4,937,700 |
STATEMENT OF INVESTMENTS (continued)
| | | | | |
| | Coupon | Maturity | Principal | | |
| Bonds and Notes (continued) | Rate (%) | Date | Amount ($) | | Value ($) |
| Energy (continued) | | | | | |
| Continental Resources, | | | | | |
| Gtd. Notes | 7.13 | 4/1/21 | 5,160,000 | a,b | 5,443,800 |
| El Paso, | | | | | |
| Sr. Unscd. Bonds | 6.50 | 9/15/20 | 3,524,000 | a | 3,565,597 |
| El Paso, | | | | | |
| Sr. Unscd. Notes | 7.00 | 6/15/17 | 763,000 | | 809,020 |
| El Paso, | | | | | |
| Notes | 7.75 | 1/15/32 | 4,821,000 | | 4,819,703 |
| Ferrellgas Partners, | | | | | |
| Sr. Unscd. Notes | 8.63 | 6/15/20 | 3,550,000 | | 3,834,000 |
| Ferrellgas, | | | | | |
| Sr. Unscd. Notes | 6.50 | 5/1/21 | 3,400,000 | a,b | 3,332,000 |
| Ferrellgas, | | | | | |
| Sr. Unscd. Notes | 9.13 | 10/1/17 | 3,025,000 | b | 3,342,625 |
| Inergy Finance, | | | | | |
| Gtd. Notes | 7.00 | 10/1/18 | 5,700,000 | a | 5,771,250 |
| McJunkin Red Man, | | | | | |
| Sr. Scd. Notes | 9.50 | 12/15/16 | 7,185,000 | a | 6,825,750 |
| Offshore Group Investments, | | | | | |
| Sr. Scd. Notes | 11.50 | 8/1/15 | 490,000 | a | 534,100 |
| Petrohawk Energy, | | | | | |
| Gtd. Notes | 10.50 | 8/1/14 | 2,180,000 | | 2,496,100 |
| Precision Drilling, | | | | | |
| Gtd. Notes | 6.63 | 11/15/20 | 1,770,000 | a | 1,805,400 |
| Range Resources, | | | | | |
| Gtd. Notes | 7.50 | 10/1/17 | 5,000,000 | | 5,293,750 |
| Trinidad Drilling, | | | | | |
| Sr. Unscd. Notes | 7.88 | 1/15/19 | 5,025,000 | a | 5,100,375 |
| | | | | | 81,219,920 |
| Finance—8.7% | | | | | |
| Ally Financial, | | | | | |
| Gtd. Notes | 7.50 | 9/15/20 | 2,375,000 | a | 2,502,656 |
| Ally Financial, | | | | | |
| Gtd. Notes | 8.00 | 11/1/31 | 13,885,000 | | 15,030,512 |
| American General Finance, | | | | | |
| Sr. Unscd. Notes | 6.90 | 12/15/17 | 7,290,000 | | 5,923,125 |
| Citigroup Capital XXI, | | | | | |
| Gtd. Bonds | 8.30 | 12/21/77 | 14,491,000 | d | 15,143,095 |
12
| | | | | |
| | Coupon | Maturity | Principal | | |
| Bonds and Notes (continued) | Rate (%) | Date | Amount ($) | | Value ($) |
| Finance (continued) | | | | | |
| HUB International Holdings, | | | | | |
| Sr. Sub. Notes | 10.25 | 6/15/15 | 10,376,000 | a | 10,453,820 |
| Icahn Enterprises Finance, | | | | | |
| Gtd. Notes | 8.00 | 1/15/18 | 12,795,000 | b | 12,858,975 |
| International Lease Finance, | | | | | |
| Sr. Unscd. Notes | 8.25 | 12/15/20 | 5,000,000 | b | 5,156,250 |
| iPayment, | | | | | |
| Gtd. Notes | 9.75 | 5/15/14 | 3,650,000 | | 3,449,250 |
| Pinafore, | | | | | |
| Sr. Scd. Notes | 9.00 | 10/1/18 | 11,125,000 | a | 12,070,625 |
| SLM, | | | | | |
| Sr. Unscd. Notes | 8.00 | 3/25/20 | 2,465,000 | | 2,503,318 |
| USI Holdings, | | | | | |
| Sr. Sub. Notes | 9.75 | 5/15/15 | 4,475,000 | a | 4,542,125 |
| | | | | | 89,633,751 |
| Food, Beverage & | | | | | |
| Tobacco—.8% | | | | | |
| Dean Foods, | | | | | |
| Gtd. Notes | 7.00 | 6/1/16 | 4,844,000 | b | 4,468,590 |
| Michael Foods, | | | | | |
| Sr. Notes | 9.75 | 7/15/18 | 3,280,000 | a | 3,599,800 |
| | | | | | 8,068,390 |
| Gaming—3.4% | | | | | |
| Ameristar Casinos, | | | | | |
| Gtd. Notes | 9.25 | 6/1/14 | 3,395,000 | b | 3,649,625 |
| Boyd Gaming, | | | | | |
| Sr. Sub. Notes | 6.75 | 4/15/14 | 1,425,000 | b | 1,407,187 |
| Boyd Gaming, | | | | | |
| Sr. Sub. Notes | 7.13 | 2/1/16 | 3,935,000 | b | 3,551,337 |
| Isle of Capri Casinos, | | | | | |
| Gtd. Notes | 7.00 | 3/1/14 | 3,742,000 | b | 3,685,870 |
| MGM Resorts International, | | | | | |
| Gtd. Notes | 6.75 | 4/1/13 | 1,020,000 | b | 1,018,980 |
| MGM Resorts International, | | | | | |
| Gtd. Notes | 7.50 | 6/1/16 | 2,455,000 | b | 2,307,700 |
| MGM Resorts International, | | | | | |
| Sr. Unscd. Notes | 11.38 | 3/1/18 | 6,260,000 | b | 6,823,400 |
STATEMENT OF INVESTMENTS (continued)
| | | | | |
| | Coupon | Maturity | Principal | | |
| Bonds and Notes (continued) | Rate (%) | Date | Amount ($) | | Value ($) |
| Gaming (continued) | | | | | |
| Penn National Gaming, | | | | | |
| Sr. Sub. Notes | 8.75 | 8/15/19 | 6,490,000 | b | 7,187,675 |
| Pokagon Gaming Authority, | | | | | |
| Sr. Notes | 10.38 | 6/15/14 | 4,288,000 | a | 4,491,680 |
| Wynn Las Vegas, | | | | | |
| First Mortgage Notes | 7.75 | 8/15/20 | 1,085,000 | | 1,179,938 |
| | | | | | 35,303,392 |
| Health Care—6.0% | | | | | |
| Alere, | | | | | |
| Sr. Unscd. Notes | 7.88 | 2/1/16 | 3,240,000 | | 3,264,300 |
| Alere, | | | | | |
| Gtd. Notes | 9.00 | 5/15/16 | 5,940,000 | | 6,147,900 |
| American Renal Holdings, | | | | | |
| Sr. Scd. Notes | 8.38 | 5/15/18 | 2,530,000 | a | 2,605,900 |
| Bausch & Lomb, | | | | | |
| Sr. Unscd. Notes | 9.88 | 11/1/15 | 8,445,000 | b | 9,078,375 |
| Biomet, | | | | | |
| Gtd. Notes | 11.63 | 10/15/17 | 26,595,000 | b | 29,520,450 |
| Capella Healthcare, | | | | | |
| Gtd. Notes | 9.25 | 7/1/17 | 4,095,000 | a | 4,350,938 |
| HCA, | | | | | |
| Sr. Scd. Notes | 7.25 | 9/15/20 | 3,835,000 | b | 4,026,750 |
| Radiation Therapy Services, | | | | | |
| Gtd. Notes | 9.88 | 4/15/17 | 2,210,000 | a | 2,215,525 |
| | | | | | 61,210,138 |
| Leisure—.4% | | | | | |
| AMC Entertaiment Holdings, | | | | | |
| Sr. Sub. Notes | 9.75 | 12/1/20 | 4,165,000 | a,b | 4,352,425 |
| Media—7.9% | | | | | |
| Allbritton Communications, | | | | | |
| Sr. Unscd. Notes | 8.00 | 5/15/18 | 4,880,000 | | 4,953,200 |
| Clear Channel Communications, | | | | | |
| Sr. Unscd. Notes | 4.90 | 5/15/15 | 6,840,000 | b | 5,301,000 |
| Clear Channel Communications, | | | | | |
| Sr. Unscd. Notes | 5.50 | 9/15/14 | 13,739,000 | b | 11,472,065 |
| Clear Channel Communications, | | | | | |
| Sr. Unscd. Notes | 5.75 | 1/15/13 | 14,118,000 | b | 13,765,050 |
14
| | | | | |
| | Coupon | Maturity | Principal | | |
| Bonds and Notes (continued) | Rate (%) | Date | Amount ($) | | Value ($) |
| Media (continued) | | | | | |
| Clear Channel Communications, | | | | | |
| Gtd. Notes | 10.75 | 8/1/16 | 6,385,000 | b | 5,746,500 |
| Gray Television, | | | | | |
| Sr. Scd. Notes | 10.50 | 6/29/15 | 9,920,000 | b | 10,044,000 |
| LBI Media, | | | | | |
| Sr. Sub. Notes | 8.50 | 8/1/17 | 8,982,000 | a,b | 7,342,785 |
| Nexstar Broadcasting, | | | | | |
| Gtd. Notes, Ser. 1 | 0.50 | 1/15/14 | 723,894 | | 707,606 |
| Nexstar/Mission Broadcasting, | | | | | |
| Sr. Scd. Notes | 8.88 | 4/15/17 | 780,000 | a,b | 832,650 |
| Quebecor Media, | | | | | |
| Sr. Unscd. Notes | 7.75 | 3/15/16 | 3,275,000 | | 3,397,812 |
| Quebecor Media, | | | | | |
| Sr. Unscd. Notes | 7.75 | 3/15/16 | 8,325,000 | | 8,637,187 |
| Salem Communications, | | | | | |
| Sr. Scd. Notes | 9.63 | 12/15/16 | 4,788,000 | | 5,099,220 |
| Sinclair Television Group, | | | | | |
| Scd. Notes | 9.25 | 11/1/17 | 3,885,000 | a | 4,224,938 |
| | | | | | 81,524,013 |
| Metals Mining—3.1% | | | | | |
| Drummond, | | | | | |
| Sr. Unscd. Notes | 7.38 | 2/15/16 | 4,705,000 | b | 4,899,081 |
| Murray Energy, | | | | | |
| Sr. Scd. Notes | 10.25 | 10/15/15 | 6,580,000 | a | 6,941,900 |
| Severstal Columbus, | | | | | |
| Sr. Scd. Notes | 10.25 | 2/15/18 | 15,200,000 | a | 16,112,000 |
| Tube City IMS, | | | | | |
| Gtd. Notes | 9.75 | 2/1/15 | 4,045,000 | | 4,206,800 |
| | | | | | 32,159,781 |
| Paper—1.5% | | | | | |
| Clearwater Paper, | | | | | |
| Gtd. Notes | 7.13 | 11/1/18 | 3,540,000 | a | 3,672,750 |
| Newpage, | | | | | |
| Sr. Scd. Notes | 11.38 | 12/31/14 | 5,424,000 | b | 5,125,680 |
| Smurfit Kappa Funding, | | | | | |
| Sr. Sub. Notes | 7.75 | 4/1/15 | 2,115,000 | | 2,178,450 |
STATEMENT OF INVESTMENTS (continued)
| | | | | |
| | Coupon | Maturity | Principal | | |
| Bonds and Notes (continued) | Rate (%) | Date | Amount ($) | | Value ($) |
| Paper (continued) | | | | | |
| Verso Paper Holdings, | | | | | |
| Sr. Scd. Notes | 11.50 | 7/1/14 | 3,775,000 | b | 4,161,938 |
| | | | | | 15,138,818 |
| Printing & Publishing—1.0% | | | | | |
| Cenveo, | | | | | |
| Sr. Scd. Notes | 8.88 | 2/1/18 | 9,565,000 | | 9,301,963 |
| Cenveo, | | | | | |
| Gtd. Notes | 10.50 | 8/15/16 | 650,000 | a | 641,875 |
| | | | | | 9,943,838 |
| Retail—3.4% | | | | | |
| Affinity Group, | | | | | |
| Sr. Scd. Notes | 11.50 | 12/1/16 | 7,000,000 | a | 6,912,500 |
| Hillman Group, | | | | | |
| Gtd. Notes | 10.88 | 6/1/18 | 3,960,000 | | 4,365,900 |
| Neiman Marcus Group, | | | | | |
| Gtd. Notes | 10.38 | 10/15/15 | 14,381,000 | b | 15,261,836 |
| QVC, | | | | | |
| Sr. Scd. Notes | 7.13 | 4/15/17 | 1,900,000 | a | 1,999,750 |
| QVC, | | | | | |
| Sr. Scd. Notes | 7.50 | 10/1/19 | 5,285,000 | a | 5,588,888 |
| Susser Holdings & Finance, | | | | | |
| Gtd. Notes | 8.50 | 5/15/16 | 1,050,000 | | 1,131,375 |
| | | | | | 35,260,249 |
| Retail-Food & Drug—2.0% | | | | | |
| Rite Aid, | | | | | |
| Gtd. Notes | 9.50 | 6/15/17 | 8,120,000 | b | 6,942,600 |
| Rite Aid, | | | | | |
| Sr. Scd. Notes | 10.38 | 7/15/16 | 8,680,000 | b | 9,070,600 |
| Stater Brothers Holdings, | | | | | |
| Gtd. Notes | 7.75 | 4/15/15 | 4,695,000 | b | 4,847,587 |
| | | | | | 20,860,787 |
| Services—5.5% | | | | | |
| Brickman Group Holdings, | | | | | |
| Sr. Notes | 9.13 | 11/1/18 | 5,078,000 | a | 5,166,865 |
| Cardtronics, | | | | | |
| Gtd. Notes | 8.25 | 9/1/18 | 5,850,000 | | 6,259,500 |
| FTI Consulting, | | | | | |
| Gtd. Notes | 6.75 | 10/1/20 | 4,705,000 | a | 4,693,238 |
| Garda World Security, | | | | | |
| Sr. Unscd. Notes | 9.75 | 3/15/17 | 4,485,000 | a | 4,832,588 |
16
| | | | | |
| | Coupon | Maturity | Principal | | |
| Bonds and Notes (continued) | Rate (%) | Date | Amount ($) | | Value ($) |
| Services (continued) | | | | | |
| General Maritime, | | | | | |
| Gtd. Notes | 12.00 | 11/15/17 | 11,145,000 | b | 10,810,650 |
| Hapag-Lloyd, | | | | | |
| Gtd. Notes | 9.75 | 10/15/17 | 2,600,000 | a | 2,827,500 |
| Marquette | | | | | |
| Transportation Finance, | | | | | |
| Sr. Scd. Notes | 10.88 | 1/15/17 | 6,565,000 | a | 6,729,125 |
| Mobile Mini, | | | | | |
| Gtd. Notes | 7.88 | 12/1/20 | 5,150,000 | a | 5,356,000 |
| Navios Maritime Acquisition, | | | | | |
| Sr. Scd. Notes | 8.63 | 11/1/17 | 4,700,000 | a | 4,829,250 |
| Navios Maritime Holdings, | | | | | |
| Sr. Scd. Notes | 8.88 | 11/1/17 | 2,005,000 | | 2,180,437 |
| Ultrapetrol Bahamas, | | | | | |
| First Mortgage Notes | 9.00 | 11/24/14 | 1,817,000 | | 1,848,797 |
| WCA Waste, | | | | | |
| Gtd. Notes | 9.25 | 6/15/14 | 1,075,000 | | 1,118,000 |
| | | | | | 56,651,950 |
| Technology—5.5% | | | | | |
| CDW Finance, | | | | | |
| Sr. Scd. Notes | 8.00 | 12/15/18 | 4,890,000 | a,b | 5,012,250 |
| Ceridian, | | | | | |
| Gtd. Notes | 11.25 | 11/15/15 | 15,638,000 | b,d | 15,559,810 |
| Ceridian, | | | | | |
| Gtd. Notes | 12.25 | 11/15/15 | 14,091,490 | b | 14,302,862 |
| First Data, | | | | | |
| Sr. Scd. Notes | 8.25 | 1/15/21 | 3,199,000 | a,b | 3,087,035 |
| First Data, | | | | | |
| Gtd. Notes | 9.88 | 9/24/15 | 258,000 | | 245,745 |
| First Data, | | | | | |
| Gtd. Notes | 9.88 | 9/24/15 | 458,000 | b | 438,535 |
| First Data, | | | | | |
| Sr. Notes | 12.63 | 1/15/21 | 3,199,000 | a,b | 3,071,040 |
| Sorenson Communications, | | | | | |
| Sr. Scd. Notes | 10.50 | 2/1/15 | 5,640,000 | a,b | 3,468,600 |
| Sungard Data Systems, | | | | | |
| Gtd. Notes | 10.25 | 8/15/15 | 7,417,000 | b | 7,815,664 |
| Sungard Data Systems, | | | | | |
| Gtd. Notes | 10.63 | 5/15/15 | 3,460,000 | | 3,831,950 |
| | | | | | 56,833,491 |
STATEMENT OF INVESTMENTS (continued)
| | | | | |
| | Coupon | Maturity | Principal | | |
| Bonds and Notes (continued) | Rate (%) | Date | Amount ($) | | Value ($) |
| Telecommunications—12.9% | | | | | |
| Digicel Group, | | | | | |
| Sr. Unscd. Notes | 8.88 | 1/15/15 | 20,635,000 | a,b | 20,944,525 |
| Digicel Group, | | | | | |
| Sr. Unscd. Notes | 9.13 | 1/15/15 | 3,542,457 | a | 3,604,450 |
| Digicel Group, | | | | | |
| Sr. Unscd. Notes | 10.50 | 4/15/18 | 1,408,000 | a | 1,555,840 |
| Digicel, | | | | | |
| Sr. Notes | 8.25 | 9/1/17 | 2,955,000 | a | 3,043,650 |
| Digicel, | | | | | |
| Sr. Unscd. Notes | 12.00 | 4/1/14 | 1,700,000 | a | 1,984,750 |
| Intelsat Jackson Holdings, | | | | | |
| Gtd. Notes | 11.25 | 6/15/16 | 9,260,000 | | 10,023,950 |
| Intelsat Luxembourg, | | | | | |
| Gtd. Notes | 11.25 | 2/4/17 | 11,535,000 | | 12,630,825 |
| Sprint Capital, | | | | | |
| Gtd. Notes | 6.88 | 11/15/28 | 9,170,000 | b | 8,069,600 |
| Sprint Capital, | | | | | |
| Gtd. Notes | 6.90 | 5/1/19 | 10,120,000 | | 10,044,100 |
| Sprint Capital, | | | | | |
| Gtd. Notes | 8.75 | 3/15/32 | 1,900,000 | | 1,928,500 |
| Telesat Canada, | | | | | |
| Sr. Unscd. Notes | 11.00 | 11/1/15 | 9,290,000 | | 10,474,475 |
| Telesat Canada, | | | | | |
| Sr. Sub. Notes | 12.50 | 11/1/17 | 2,415,000 | | 2,855,737 |
| West, | | | | | |
| Gtd. Notes | 7.88 | 1/15/19 | 3,250,000 | a | 3,315,000 |
| West, | | | | | |
| Gtd. Notes | 8.63 | 10/1/18 | 6,645,000 | a | 7,076,925 |
| Wind Acquisition Finance, | | | | | |
| Scd. Notes | 11.75 | 7/15/17 | 7,605,000 | a,b | 8,612,663 |
| Wind Acquisition Holdings Finance, | | | | | |
| Sr. Scd. Notes | 12.25 | 7/15/17 | 23,174,884 | a,b | 26,998,740 |
| | | | | | 133,163,730 |
18
| | | | | | |
| | Coupon | Maturity | Principal | | | |
| Bonds and Notes (continued) | Rate (%) | Date | Amount ($) | | | Value ($) |
| Utilities—3.6% | | | | | | |
| AES, | | | | | | |
| Sr. Unscd. Notes | 8.00 | 10/15/17 | 13,855,000 | | | 14,720,937 |
| AES, | | | | | | |
| Sr. Unscd. Notes | 9.75 | 4/15/16 | 3,765,000 | | | 4,226,212 |
| Dynegy Holdings, | | | | | | |
| Sr. Unscd. Notes | 8.38 | 5/1/16 | 1,892,000 | b | | 1,423,730 |
| Genon Energy, | | | | | | |
| Sr. Unscd. Notes | 9.50 | 10/15/18 | 7,570,000 | a | | 7,560,538 |
| North American Energy Alliance, | | | | | | |
| Sr. Scd. Notes | 10.88 | 6/1/16 | 2,935,000 | a | | 3,272,525 |
| NRG Energy, | | | | | | |
| Gtd. Notes | 7.38 | 1/15/17 | 5,275,000 | b | | 5,446,438 |
| | | | | | | 36,650,380 |
| Total Bonds and Notes | | | | | | |
| (cost $925,366,445) | | | | | | 980,944,595 |
| |
| Preferred Stocks—.1% | | | Shares | | | Value ($) |
| Media | | | | | | |
| Spanish Broadcasting System, | | | | | | |
| Ser. B, Cum. $26.88 | | | | | | |
| (cost $1,598,517) | | | 1,523 | e | 989,627 |
| |
| Common Stocks—.2% | | | | | | |
| Cable/Satellite TV | | | | | | |
| Charter Communications, Cl. A | | | | | | |
| (cost $1,200,921) | | | 55,002 | f | 2,141,778 |
| |
| Other Investment—1.9% | | | | | | |
| Registered Investment Company; | | | | | | |
| Dreyfus Institutional Preferred Plus Money Market Fund | | | | |
| (cost $19,289,000) | | | 19,289,000 | g | 19,289,000 |
STATEMENT OF INVESTMENTS (continued)
| | | | |
| Investment of Cash Collateral | | |
| for Securities Loaned—14.4% | Shares | Value ($) |
| Registered Investment Company; | | |
| Dreyfus Institutional Cash | | |
| Advantage Fund | | |
| (cost $148,074,141) | 148,074,141g | 148,074,141 |
| |
| Total Investments (cost $1,095,529,024) | 111.9% | 1,151,439,141 |
| Liabilities, Less Cash and Receivables | (11.9%) | (122,770,979) |
| Net Assets | 100.0% | 1,028,668,162 |
|
| a Securities exempt from registration under Rule 144A of the Securities Act of 1933.These securities may be resold in |
| transactions exempt from registration, normally to qualified institutional buyers.At December 31, 2010, these |
| securities had a market value of $385,071,566 or 37.4% of net assets. |
| b Security, or portion thereof, on loan.At December 31, 2010, the total market value of the fund’s securities on loan is |
| $141,906,996 and the total market value of the collateral held by the fund is $148,406,629, consisting of cash |
| collateral of $148,074,141 and U.S. Government and agencies securities valued at $332,488. |
| c Non-income producing—security in default. |
| d Variable rate security—interest rate subject to periodic change. |
| e The valuation of this security has been determined in good faith by management under the direction of the Board of |
| Trustees.At December 31, 2010, the value of this security amounted to $989,627 or .1% of net assets. |
| f Non-income producing security. |
| g Investment in affiliated money market mutual fund. |
| | | |
| Portfolio Summary (Unaudited)† | | |
| |
| | Value (%) | | Value (%) |
| Corporate Bonds | 95.3 | Preferred Stocks | .1 |
| Money Market Investments | 16.3 | | |
| Common Stocks | .2 | | 111.9 |
| |
| † Based on net assets. | | | |
| See notes to financial statements. | | | |
20
|
| STATEMENT OF ASSETS AND LIABILITIES |
| December 31, 2010 |
| | | | | |
| | | | Cost | Value |
| Assets ($): | | | | |
| Investments in securities—See Statement of Investments (including | | |
| securities on loan, valued at $141,906,996)—Note 1(c): | | |
| Unaffiliated issuers | | | 928,165,883 | 984,076,000 |
| Affiliated issuers | | | 167,363,141 | 167,363,141 |
| Cash denominated in foreign currencies | | 49 | 46 |
| Dividends and interest receivable | | | | 21,803,466 |
| Receivable for investment securities sold | | | 7,595,466 |
| Receivable for shares of Beneficial Interest subscribed | | 1,696,791 |
| | | | | 1,182,534,910 |
| Liabilities ($): | | | | |
| Due to The Dreyfus Corporation and affiliates—Note 3(b) | | 793,254 |
| Cash overdraft due to Custodian | | | | 2,891,718 |
| Liability for securities on loan—Note 1(c) | | | 148,074,141 |
| Payable for shares of Beneficial Interest redeemed | | | 1,621,343 |
| Payable for investment securities purchased | | | 486,292 |
| | | | | 153,866,748 |
| Net Assets ($) | | | | 1,028,668,162 |
| Composition of Net Assets ($): | | | |
| Paid-in capital | | | | 1,146,967,897 |
| Accumulated undistributed investment income—net | | | 395,721 |
| Accumulated net realized gain (loss) on investments | | | (174,605,571) |
| Accumulated net unrealized appreciation (depreciation) | | |
| on investments and foreign currency transactions | | | 55,910,115 |
| Net Assets ($) | | | | 1,028,668,162 |
| |
| |
| Net Asset Value Per Share | | | |
| | Class A | Class B | Class C | Class I |
| Net Assets ($) | 346,594,434 | 10,002,138 | 128,172,896 | 543,898,694 |
| Shares Outstanding | 52,391,337 | 1,511,320 | 19,368,488 | 82,155,359 |
| Net Asset Value Per Share ($) | 6.62 | 6.62 | 6.62 | 6.62 |
| |
| See notes to financial statements. | | | | |
STATEMENT OF OPERATIONS
Year Ended December 31, 2010
| | |
| Investment Income ($): | |
| Income: | |
| Interest | 92,293,206 |
| Income from securities lending—Note 1(c) | 726,494 |
| Dividends: | |
| Unaffiliated issuers | 40,917 |
| Affiliated issuers | 36,292 |
| Total Income | 93,096,909 |
| Expenses: | |
| Management fee—Note 3(a) | 6,527,478 |
| Distribution and service fees—Note 3(b) | 2,212,462 |
| Trustees’ fees—Note 3(a) | 66,861 |
| Loan commitment fees—Note 2 | 12,186 |
| Interest expense—Note 2 | 270 |
| Total Expenses | 8,819,257 |
| Less—Trustees’ fees reimbursed by the Manager—Note 3(a) | (66,861) |
| Net Expenses | 8,752,396 |
| Investment Income—Net | 84,344,513 |
| Realized and Unrealized Gain (Loss) on Investments—Note 4 ($): | |
| Net realized gain (loss) on investments and foreign currency transactions | 28,720,423 |
| Net realized gain (loss) on forward foreign currency exchange contracts | 31,046 |
| Net Realized Gain (Loss) | 28,751,469 |
| Net unrealized appreciation (depreciation) on | |
| investments and foreign currency transactions | (3,160,334) |
| Net unrealized appreciation (depreciation) on forward | |
| foreign currency exchange contracts | (2,968) |
| Net Unrealized Appreciation (Depreciation) | (3,163,302) |
| Net Realized and Unrealized Gain (Loss) on Investments | 25,588,167 |
| Net Increase in Net Assets Resulting from Operations | 109,932,680 |
| |
| See notes to financial statements. | |
22
STATEMENT OF CHANGES IN NET ASSETS
| | | | |
| | Year Ended December 31, |
| | 2010 | 2009 |
| Operations ($): | | |
| Investment income—net | 84,344,513 | 66,290,493 |
| Net realized gain (loss) on investments | 28,751,469 | (6,401,619) |
| Net unrealized appreciation | | |
| (depreciation) on investments | (3,163,302) | 181,196,172 |
| Net Increase (Decrease) in Net Assets | | |
| Resulting from Operations | 109,932,680 | 241,085,046 |
| Dividends to Shareholders from ($): | | |
| Investment income—net: | | |
| Class A Shares | (33,286,941) | (29,894,758) |
| Class B Shares | (1,356,850) | (2,849,188) |
| Class C Shares | (11,069,517) | (8,775,809) |
| Class I Shares | (44,108,787) | (27,846,038) |
| Total Dividends | (89,822,095) | (69,365,793) |
| Beneficial Interest Transactions ($): | | |
| Net proceeds from shares sold: | | |
| Class A Shares | 97,928,061 | 286,678,813 |
| Class B Shares | 352,891 | 1,476,907 |
| Class C Shares | 21,583,100 | 44,838,158 |
| Class I Shares | 258,158,429 | 232,223,371 |
| Net assets received in connection | | |
| with reorganization—Note 1 | — | 129,672,713 |
| Dividends reinvested: | | |
| Class A Shares | 26,924,576 | 22,562,646 |
| Class B Shares | 992,798 | 1,872,480 |
| Class C Shares | 6,714,116 | 5,010,735 |
| Class I Shares | 15,399,278 | 6,001,284 |
| Cost of shares redeemed: | | |
| Class A Shares | (145,973,940) | (198,188,481) |
| Class B Shares | (13,948,913) | (31,665,643) |
| Class C Shares | (28,327,493) | (19,316,179) |
| Class I Shares | (140,494,086) | (98,684,961) |
| Increase (Decrease) in Net Assets from | | |
| Beneficial Interest Transactions | 99,308,817 | 382,481,843 |
| Total Increase (Decrease) in Net Assets | 119,419,402 | 554,201,096 |
| Net Assets ($): | | |
| Beginning of Period | 909,248,760 | 355,047,664 |
| End of Period | 1,028,668,162 | 909,248,760 |
| Undistributed investment income—net | 395,721 | 1,421,325 |
STATEMENT OF CHANGES IN NET ASSETS (continued)
| | | | |
| | Year Ended December 31, |
| | 2010 | 2009 |
| Capital Share Transactions: | | |
| Class Aa | | |
| Shares sold | 15,151,222 | 51,207,569 |
| Shares issued in connection | | |
| with reorganization—Note 1 | — | 10,690,947 |
| Shares issued for dividends reinvested | 4,168,352 | 3,780,546 |
| Shares redeemed | (22,612,119) | (33,630,114) |
| Net Increase (Decrease) in Shares Outstanding | (3,292,545) | 32,048,948 |
| Class Ba | | |
| Shares sold | 54,620 | 257,820 |
| Shares issued in connection | | |
| with reorganization—Note 1 | — | 4,883,654 |
| Shares issued for dividends reinvested | 153,881 | 320,812 |
| Shares redeemed | (2,156,919) | (5,472,399) |
| Net Increase (Decrease) in Shares Outstanding | (1,948,418) | (10,113) |
| Class C | | |
| Shares sold | 3,327,504 | 7,842,855 |
| Shares issued in connection | | |
| with reorganization—Note 1 | — | 7,195,044 |
| Shares issued for dividends reinvested | 1,039,667 | 837,067 |
| Shares redeemed | (4,389,798) | (3,270,669) |
| Net Increase (Decrease) in Shares Outstanding | (22,627) | 12,604,297 |
| Class I | | |
| Shares sold | 39,786,259 | 39,340,054 |
| Shares issued in connection | | |
| with reorganization—Note 1 | — | 1,748,575 |
| Shares issued for dividends reinvested | 2,377,328 | 998,987 |
| Shares redeemed | (21,699,672) | (16,641,631) |
| Net Increase (Decrease) in Shares Outstanding | 20,463,915 | 25,445,985 |
|
| a During the period ended December 31, 2010, 656,573 Class B shares representing $4,251,782 were |
| automatically converted to 656,762 Class A shares and during the period ended December 31, 2009, 2,061,607 |
| Class B shares representing $12,009,537 were automatically converted to 2,063,045 Class A shares. |
See notes to financial statements.
24
FINANCIAL HIGHLIGHTS
The following tables describe the performance for each share class for the fiscal periods indicated.All information (except portfolio turnover rate) reflects financial results for a single fund share.Total return shows how much your investment in the fund would have increased (or decreased) during each period, assuming you had reinvested all dividends and distributions.These figures have been derived from the fun’s financial statements.
| | | | | | | | | | |
| | | Year Ended December 31, | |
| Class A Shares | 2010 | 2009 | 2008 | 2007 | 2006 |
| Per Share Data ($): | | | | | |
| Net asset value, beginning of period | 6.48 | 5.06 | 6.92 | 7.33 | 7.24 |
| Investment Operations: | | | | | |
| Investment income—neta | .59 | .54 | .50 | .49 | .49 |
| Net realized and unrealized | | | | | |
| gain (loss) on investments | .17 | 1.43 | (1.82) | (.37) | .14 |
| Total from Investment Operations | .76 | 1.97 | (1.32) | .12 | .63 |
| Distributions: | | | | | |
| Dividends from investment income—net | (.62) | (.55) | (.54) | (.53) | (.54) |
| Net asset value, end of period | 6.62 | 6.48 | 5.06 | 6.92 | 7.33 |
| Total Return (%)b | 12.50 | 40.43 | (20.17) | 2.03 | 8.66 |
| Ratios/Supplemental Data (%): | | | | | |
| Ratio of total expenses | | | | | |
| to average net assets | .96 | .96 | .96 | .96 | .95 |
| Ratio of net expenses | | | | | |
| to average net assets | .95 | .95 | .95 | .95 | .95 |
| Ratio of net investment income | | | | | |
| to average net assets | 9.05 | 8.86 | 7.89 | 6.78 | 6.76 |
| Portfolio Turnover Rate | 70.07 | 77.94 | 48.85 | 50.65 | 29.98 |
| Net Assets, end of period ($ x 1,000) | 346,594 | 360,921 | 119,560 | 169,453 | 202,098 |
| |
| a | Based on average shares outstanding at each month end. |
| b | Exclusive of sales charge. |
See notes to financial statements.
FINANCIAL HIGHLIGHTS (continued)
| | | | | | | | | | |
| | | Year Ended December 31, | |
| Class B Shares | 2010 | 2009 | 2008 | 2007 | 2006 |
| Per Share Data ($): | | | | | |
| Net asset value, beginning of period | 6.48 | 5.06 | 6.93 | 7.34 | 7.24 |
| Investment Operations: | | | | | |
| Investment income—neta | .53 | .49 | .46 | .45 | .45 |
| Net realized and unrealized | | | | | |
| gain (loss) on investments | .20 | 1.45 | (1.82) | (.37) | .16 |
| Total from Investment Operations | .73 | 1.94 | (1.36) | .08 | .61 |
| Distributions: | | | | | |
| Dividends from investment income—net | (.59) | (.52) | (.51) | (.49) | (.51) |
| Net asset value, end of period | 6.62 | 6.48 | 5.06 | 6.93 | 7.34 |
| Total Return (%)b | 11.94 | 39.78 | (20.69) | 1.53 | 8.12 |
| Ratios/Supplemental Data (%): | | | | | |
| Ratio of total expenses | | | | | |
| to average net assets | 1.46 | 1.46 | 1.46 | 1.46 | 1.45 |
| Ratio of net expenses | | | | | |
| to average net assets | 1.45 | 1.45 | 1.45 | 1.45 | 1.45 |
| Ratio of net investment income | | | | | |
| to average net assets | 8.48 | 8.35 | 7.31 | 6.24 | 6.25 |
| Portfolio Turnover Rate | 70.07 | 77.94 | 48.85 | 50.65 | 29.98 |
| Net Assets, end of period ($ x 1,000) | 10,002 | 22,434 | 17,568 | 39,892 | 67,834 |
| |
| a | Based on average shares outstanding at each month end. |
| b | Exclusive of sales charge. |
See notes to financial statements.
26
| | | | | | | | | | |
| | | Year Ended December 31, | |
| Class C Shares | 2010 | 2009 | 2008 | 2007 | 2006 |
| Per Share Data ($): | | | | | |
| Net asset value, beginning of period | 6.48 | 5.06 | 6.93 | 7.34 | 7.24 |
| Investment Operations: | | | | | |
| Investment income—neta | .54 | .50 | .45 | .43 | .43 |
| Net realized and unrealized | | | | | |
| gain (loss) on investments | .18 | 1.42 | (1.83) | (.36) | .16 |
| Total from Investment Operations | .72 | 1.92 | (1.38) | .07 | .59 |
| Distributions: | | | | | |
| Dividends from investment income—net | (.58) | (.50) | (.49) | (.48) | (.49) |
| Net asset value, end of period | 6.62 | 6.48 | 5.06 | 6.93 | 7.34 |
| Total Return (%)b | 11.66 | 39.41 | (20.89) | 1.28 | 7.85 |
| Ratios/Supplemental Data (%): | | | | | |
| Ratio of total expenses | | | | | |
| to average net assets | 1.71 | 1.71 | 1.71 | 1.71 | 1.70 |
| Ratio of net expenses | | | | | |
| to average net assets | 1.70 | 1.70 | 1.70 | 1.70 | 1.70 |
| Ratio of net investment income | | | | | |
| to average net assets | 8.31 | 8.15 | 7.12 | 6.02 | 6.01 |
| Portfolio Turnover Rate | 70.07 | 77.94 | 48.85 | 50.65 | 29.98 |
| Net Assets, end of period ($ x 1,000) | 128,173 | 125,724 | 34,374 | 53,294 | 65,728 |
| |
| a | Based on average shares outstanding at each month end. |
| b | Exclusive of sales charge. |
See notes to financial statements.
FINANCIAL HIGHLIGHTS (continued)
| | | | | | | | | | |
| | | Year Ended December 31, | |
| Class I Shares | 2010 | 2009 | 2008 | 2007a | 2006 |
| Per Share Data ($): | | | | | |
| Net asset value, | | | | | |
| beginning of period | 6.49 | 5.06 | 6.92 | 7.33 | 7.24 |
| Investment Operations: | | | | | |
| Investment income—netb | .60 | .54 | .51 | .52 | .51 |
| Net realized and unrealized | | | | | |
| gain (loss) on investments | .17 | 1.45 | (1.82) | (.38) | .14 |
| Total from | | | | | |
| Investment Operations | .77 | 1.99 | (1.31) | .14 | .65 |
| Distributions: | | | | | |
| Dividends from | | | | | |
| investment income—net | (.64) | (.56) | (.55) | (.55) | (.56) |
| Net asset value, end of period | 6.62 | 6.49 | 5.06 | 6.92 | 7.33 |
| Total Return (%) | 12.59 | 40.99 | (20.06) | 2.29 | 8.92 |
| Ratios/Supplemental Data (%): | | | | | |
| Ratio of total expenses | | | | | |
| to average net assets | .71 | .71 | .72 | .71 | .70 |
| Ratio of net expenses | | | | | |
| to average net assets | .70 | .70 | .69 | .70 | .70 |
| Ratio of net investment income | | | | | |
| to average net assets | 9.26 | 9.20 | 9.43 | 7.01 | 7.01 |
| Portfolio Turnover Rate | 70.07 | 77.94 | 48.85 | 50.65 | 29.98 |
| Net Assets, end of period | | | | | |
| ($ x 1,000) | 543,899 | 400,170 | 183,546 | 17,368 | 18,059 |
| |
| a | Effective June 1, 2007, Class R shares were redesignated as Class I shares. |
| b | Based on average shares outstanding at each month end. |
See notes to financial statements.
28
NOTES TO FINANCIAL STATEMENTS
NOTE 1—Significant Accounting Policies:
Dreyfus HighYield Fund (the “fund”) is a separate diversified series of The Dreyfus/Laurel Funds Trust (the “Trust”), which is registered under the Investment Company Act of 1940, as amended (the “Act”), as an open-end management investment company and operates as a series company currently offering seven series, including the fund.The fund’s investment objective seeks to maximize total return, consisting of capital appreciation and current income.The Dreyfus Corporation (the “Manager” or “Dreyfus”), a wholly-owned subsidiary ofThe Bank of New York Mellon Corporation (“BNY Mellon”), serves as the fund’s investment adviser.
As of the close of business on January 8, 2009, pursuant to an Agreement and Plan of Reorganization previously approved by the fund’s Board of Trustees, all of the assets, subject to the liabilities, of Dreyfus High Income Fund (“High Income”) were transferred to the fund in exchange for corresponding class of shares of Beneficial Interest of the fund of equal value.The purpose of the transaction was to combine two funds with comparable investment objectives and strategies. Shareholders of Class A, Class B, Class C and Class I shares of High Income received Class A, Class B, Class C and Class I shares of the fund, respectively, in each case in an amount equal to the aggregate net asset value of their investment in High Income at the time of the exchange. The exchange ratio for Class A, Class B, Class C and Class I shares are 1.96, 1.96, 1.95 and 1.96, respectively.The net asset value of the fund& #8217;s shares on the close of business January 8, 2009, after the reorganization was $5.29 for Class A, $5.29 for Class B, $5.29 for Class C and $5.29 for Class I shares, and a total of 10,690,947 Class A shares, 4,883,654 Class B shares, 7,195,044 Class C shares and 1,748,575 Class I shares were issued to shareholders of High Income in the exchange. The exchange was a tax-free event to the High Income shareholders. For financial reporting purposes, assets received and shares issued by the fund were recorded at fair value; however, the cost basis of investments
NOTES TO FINANCIAL STATEMENTS (continued)
received from High Income was carried forward to align ongoing reporting of the fund’s realized and unrealized gains and losses with amounts distributable to shareholders for tax purposes.
The net assets and net unrealized (depreciation) immediately before the acquisition were as follows:
| | | |
| | Unrealized | |
| | (Depreciation) ($) | Net Assets ($) |
| Dreyfus High Income | | |
| Fund-Target Fund | (23,749,040) | 129,672,713 |
| Dreyfus High Yield Fund- | | |
| Acquiring Fund | (81,332,832) | 382,765,045 |
| Total | (105,081,872) | 512,437,758 |
MBSC Securities Corporation (the “Distributor”), a wholly-owned subsidiary of the Manager, is the distributor of the fund’s shares.The fund is authorized to issue an unlimited number of shares of Beneficial Interest in each of the following classes of shares: Class A, Class B, Class C and Class I. Class A, Class B and Class C shares are sold primarily to retail investors through financial intermediaries and bear a distribution fee and/or shareholder services fee. Class A shares are sold with a front-end sales charge, while Class B and Class C shares are subject to a contingent deferred sales charge (“CDSC”). Class B shares automatically convert to Class A shares after six years.The fund no longer offers Class B shares, except in connection with dividend reinvestment and permitted exchanges of Class B shares. Class I shares are sold primarily to bank trust departments and other financi al service providers (including The Bank of New York Mellon, a subsidiary of BNY Mellon and an affiliate of Dreyfus), acting on behalf of customers having a qualified trust or investment account or relationship at such institution, and bear no distribution or services fees. Class I shares are offered without a front-end sales charge or CDSC. Other differences between the classes include the services offered to and the expenses borne by each class, the allocation of certain transfer agency costs and certain voting rights. Income, expenses (other than expenses attributable to a specific class), and realized and unrealized gains or losses on investments are allocated to each class of shares based on its relative net assets.
30
TheTrust accounts separately for the assets, liabilities and operations of each series. Expenses directly attributable to each series are charged to that series’ operations; expenses which are applicable to all series are allocated among them on a pro rata basis.
The Financial Accounting Standards Board (“FASB”) Accounting Standards Codification (“ASC”) is the exclusive reference of authoritative U.S. generally accepted accounting principles (“GAAP”) recognized by the FASB to be applied by nongovernmental entities. Rules and interpretive releases of the Securities and Exchange Commission (“SEC”) under authority of federal laws are also sources of authoritative GAAP for SEC registrants. The fund’s financial statements are prepared in accordance with GAAP, which may require the use of management estimates and assumptions.Actual results could differ from those estimates.
(a) Portfolio valuation: Investments in equity securities are valued at the last sales price on the securities exchange or national securities market on which such securities are primarily traded. Securities listed on the National Market System for which market quotations are available are valued at the official closing price or, if there is no official closing price that day, at the last sales price. Securities not listed on an exchange or the national securities market, or securities for which there were no transactions, are valued at the average of the most recent bid and asked prices, except for open short positions, where the asked price is used for valuation purposes. Bid price is used when no asked price is available. Registered investment companies that are not traded on an exchange are valued at their net asset valu e.When market quotations or official closing prices are not readily available, or are determined not to reflect accurately fair value, such as when the value of a security has been significantly affected by events after the close of the exchange or market on which the security is principally traded (for example, a foreign exchange or market), but before the fund calculates its net asset value, the fund may value these investments at fair value as determined in accordance with the procedures approved by the Board of Trustees.
NOTES TO FINANCIAL STATEMENTS (continued)
Fair valuing of securities may be determined with the assistance of a pricing service using calculations based on indices of domestic securities and other appropriate indicators, such as prices of relevant American Depository Receipts and futures contracts. For other securities that are fair valued by the Board of Trustees, certain factors may be considered such as: fundamental analytical data, the nature and duration of restrictions on disposition, an evaluation of the forces that influence the market in which the securities are purchased and sold and public trading in similar securities of the issuer or comparable issuers.
Investments in debt securities excluding short-term investments (other than U.S.Treasury Bills), and forward foreign currency exchange contracts (“forward contracts”) are valued each business day by an independent pricing service (the Service) approved by the Board of Trustees. Investments for which quoted bid prices are readily available and are representative of the bid side of the market in the judgment of the Service are valued at the mean between the quoted bid prices (as obtained by the Service from dealers in such securities) and asked prices (as calculated by the Service based upon its evaluation of the market for such securities). Other investments (which constitute a majority of the portfolio securities) are valued as determined by the Service, based on methods which include consideration of: yields or prices of securities of comparable quality, coupon, maturity and type; indications as to va lues from dealers; and general market conditions. Restricted securities, as well as securities or other assets for which recent market quotations are not readily available and are not valued by a pricing service approved by the Board of Trustees, or are determined by the fund not to reflect accurately fair value, are valued at fair value as determined in good faith under the direction of the Board ofTrustees.The factors that may be considered when fair valuing a security include fundamental analytical data, the nature and duration of restrictions on disposition, an evaluation of the forces that influence the market in which the securi-
32
ties are purchased and sold and public trading in similar securities of the issuer or comparable issuers. Short-term investments, excluding U.S. Treasury Bills, are carried at amortized cost, which approximates value. Investments denominated in foreign currencies are translated to U.S. dollars at the prevailing rates of the exchange. Forward contracts are valued at the forward rate.
The fair value of a financial instrument is the amount that would be received to sell an asset or paid to transfer a liability in an orderly transaction between market participants at the measurement date (i.e. the exit price). GAAP establishes a fair value hierarchy that prioritizes the inputs of valuation techniques used to measure fair value.This hierarchy gives the highest priority to unadjusted quoted prices in active markets for identical assets or liabilities (Level 1 measurements) and the lowest priority to unobservable inputs (Level 3 measurements).
Additionally, GAAP provides guidance on determining whether the volume and activity in a market has decreased significantly and whether such a decrease in activity results in transactions that are not orderly. GAAP requires enhanced disclosures around valuation inputs and techniques used during annual and interim periods.
Various inputs are used in determining the value of the fund’s investments relating to fair value measurements.These inputs are summarized in the three broad levels listed below:
Level 1—unadjusted quoted prices in active markets for identical investments.
Level 2—other significant observable inputs (including quoted prices for similar investments, interest rates, prepayment speeds, credit risk, etc.).
Level 3—significant unobservable inputs (including the fund’s own assumptions in determining the fair value of investments).
NOTES TO FINANCIAL STATEMENTS (continued)
The inputs or methodology used for valuing securities are not necessarily an indication of the risk associated with investing in those securities.
The following is a summary of the inputs used as of December 31, 2010 in valuing the fund’s investments:
| | | | |
| | | Level 2—Other | Level 3— | |
| | Level 1— | Significant | Significant | |
| | Unadjusted | Observable | Unobservable | |
| | Quoted Prices | Inputs | Inputs | Total |
| Investments in Securities: | | | |
| Corporate Bonds† | — | 980,944,595 | — | 980,944,595 |
| Equity Securities— | | | | |
| Domestic† | 2,141,778 | — | 989,627 | 3,131,405 |
| Mutual Funds | 167,363,141 | — | — | 167,363,141 |
| † See Statement of Investments for additional detailed categorizations. | |
The following is a reconciliation of Level 3 assets for which significant unobservable inputs were used to determine fair value:
| |
| | Equity Securities— |
| | Domestic ($) |
| Balance as of 12/31/2009 | 1,523 |
| Realized gain (loss) | — |
| Change in unrealized appreciation (depreciation) | 988,104 |
| Net purchases (sales) | — |
| Transfers in and/or out of Level 3 | — |
| Balance as of 12/31/2010 | 989,627 |
| The amount of total gains (losses) for the period | |
| included in earnings attributable to the change in | |
| unrealized gains (losses) relating to investments | |
| still held at 12/31/2010 | 988,104 |
In January 2010, FASB issued Accounting Standards Update (“ASU”) No. 2010-06 “Improving Disclosures about Fair Value Measurements.” The portions of ASU No. 2010-06 which require reporting entities to prepare new disclosures surrounding amounts and reasons for significant transfers in and out of Level 1 and Level 2 fair value measurements as well as inputs and valuation techniques used to measure fair value for both recurring and nonrecurring fair value measurements that fall in
34
either Level 2 or Level 3 have been adopted by the fund. No significant transfers between Level 1 or Level 2 fair value measurements occurred at December 31, 2010. The remaining portion of ASU No. 2010-06 requires reporting entities to make new disclosures about information on purchases, sales, issuances and settlements on a gross basis in the reconciliation of activity in Level 3 fair value measurements. These new and revised disclosures are required to be implemented for fiscal years beginning after December 15, 2010. Management is currently evaluating the impact that the adoption of this remaining portion of ASU No. 2010-06 may have on the fund’s financial statement disclosures.
(b) Foreign currency transactions: The fund does not isolate that portion of the results of operations resulting from changes in foreign exchange rates on investments from the fluctuations arising from changes in the market prices of securities held. Such fluctuations are included with the net realized and unrealized gain or loss on investments.
Net realized foreign exchange gains or losses arise from sales of foreign currencies, currency gains or losses realized on securities transactions between trade and settlement date, and the difference between the amounts of dividends, interest and foreign withholding taxes recorded on the fund’s books and the U.S. dollar equivalent of the amounts actually received or paid. Net unrealized foreign exchange gains and losses arise from changes in the value of assets and liabilities other than investments resulting from changes in exchange rates. Foreign currency gains and losses on investments are included with net realized and unrealized gain or loss on investments.
(c) Securities transactions and investment income: Securities transactions are recorded on a trade date basis. Realized gains and losses from securities transactions are recorded on the identified cost basis. Dividend income is recognized on the ex-dividend date and interest income, including, where applicable, accretion of discount and amortization of premium on investments, is recognized on the accrual basis.
NOTES TO FINANCIAL STATEMENTS (continued)
Pursuant to a securities lending agreement with The Bank of New York Mellon, the fund may lend securities to qualified institutions. It is the fund’s policy that, at origination, all loans are secured by collateral of at least 102% of the value of U.S. securities loaned and 105% of the value of foreign securities loaned. Collateral equivalent to at least 100% of the market value of securities on loan is maintained at all times. Collateral is either in the form of cash, which can be invested in certain money market mutual funds managed by the Manager, U.S. Government and Agency securities or letters of credit. The fund is entitled to receive all income on securities loaned, in addition to income earned as a result of the lending transaction. Although each security loaned is fully collateralized, the fund bears the risk of delay in recovery of, or loss of rights in, the securities loaned should a borrower fail to return the securities in a timely manner. During the period ended December 31, 2010, The Bank of New York Mellon earned $391,189 from lending portfolio securities, pursuant to the securities lending agreement.
(d) Affiliated issuers: Investments in other investment companies advised by Dreyfus are defined as “affiliated” in the Act.
The fund may invest in shares of certain affiliated investment companies also advised or managed by Dreyfus. Investments in affiliated investment companies for the period ended December 31, 2010 were as follows:
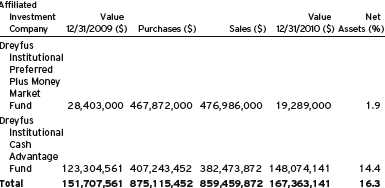
36
(e) Concentration of Risk: The fund invests primarily in debt securities. Failure of an issuer of the debt securities to make timely interest or principal payments, or a decline or the perception of a decline in the credit quality of a debt security, can cause the debt security’s price to fall, potentially lowering the fund’s share price. High yield (“junk”) bonds involve greater credit risk, including the risk of default, than investment grade bonds, and are considered predominantly speculative with respect to the issuer’s continuing ability to make principal and interest payments. In addition, the value of debt securities may decline due to general market conditions that are not specifically related to a particular company, such as real or perceived adverse economic conditions, changes in outl ook for corporate earnings, changes in interest or currency rates or adverse investor sentiment.They may also decline because of factors that affect a particular industry.
(f) Dividends to shareholders: It is the policy of the fund to declare dividends daily from investment income-net. Such dividends are paid monthly. Dividends from net realized capital gains, if any, are normally declared and paid annually, but the fund may make distributions on a more frequent basis to comply with the distribution requirements of the Internal Revenue Code of 1986, as amended (the “Code”).To the extent that net realized capital gains can be offset by capital loss carryovers, it is the policy of the fund not to distribute such gains. Income and capital gain distributions are determined in accordance with income tax regulations, which may differ from GAAP.
(g) Federal income taxes: It is the policy of the fund to continue to qualify as a regulated investment company, if such qualification is in the best interests of its shareholders, by complying with the applicable provisions of the Code, and to make distributions of taxable income sufficient to relieve it from substantially all federal income and excise taxes.
As of and during the period ended December 31, 2010, the fund did not have any liabilities for any uncertain tax positions.The fund recognizes interest and penalties, if any, related to uncertain tax positions
NOTES TO FINANCIAL STATEMENTS (continued)
as income tax expense in the Statement of Operations. During the period, the fund did not incur any interest or penalties.
Each of the tax years in the four-year period ended December 31, 2010 remains subject to examination by the Internal Revenue Service and state taxing authorities.
At December 31, 2010, the components of accumulated earnings on a tax basis were as follows: undistributed ordinary income $395,721, accumulated capital losses $171,103,666 and unrealized appreciation $52,408,212.
The accumulated capital loss carryover is available for federal income tax purposes to be applied against future net securities profits, if any, realized subsequent to December 31, 2010. If not applied, $72,493,638 of the carryover expires in fiscal 2011, $1,917,623 expires in fiscal 2012, $11,766,162 expires in fiscal 2013, $2,406,483 expires in fiscal 2014, $16,497,195 expires in fiscal 2015, $42,229,566 expires in fiscal 2016 and $23,792,999 expires in fiscal 2017. Based on certain provisions in the Code, various limitations regarding the future utilization of these carry forwards, brought forward as a result of the fund’s merger with the following funds may apply: High Yield Total Fund, BNY Hamilton High Yield Fund and Dreyfus High Income Fund. It is possible that the fund will not be able to utilize most of its capital loss carryover prior to its expiration date.
Under the recently enacted Regulated Investment Company Modernization Act of 2010, the fund will be permitted to carry forward capital losses incurred in taxable years beginning after December 22, 2010 for an unlimited period. However, any losses incurred during those future taxable years will be required to be utilized prior to the losses incurred in pre-enactment taxable years. As a result of this ordering rule, pre-enactment capital loss carryovers may be more likely to expire unused.
The tax character of distributions paid to shareholders during the fiscal periods ended December 31, 2010 and December 31, 2009 were as follows: ordinary income $89,822,095 and $69,365,793, respectively.
38
During the period ended December 31, 2010, as a result of permanent book to tax differences, primarily due to the tax treatment for consent fees, amortization of premiums and expiration of capital loss carryovers, the fund increased accumulated undistributed investment income-net by $4,451,978, increased accumulated net realized gain (loss) on investments by $110,109,029 and decreased paid-in capital by $114,561,007. Net assets and net asset value per share were not affected by this reclassification.
NOTE 2—Bank Lines of Credit:
The fund participates with other Dreyfus-managed funds in a $225 million unsecured credit facility led by Citibank, N.A. and a $300 million unsecured credit facility provided by The Bank of New York Mellon (each, a “Facility”), each to be utilized primarily for temporary or emergency purposes, including the financing of redemptions. In connection therewith, the fund has agreed to pay its pro rata portion of commitment fees for each Facility. Interest is charged to the fund based on rates determined pursuant to the terms of the respective Facility at the time of borrowing.
The average amount of borrowings outstanding under the Facilities during the period ended December 31, 2010, was approximately $19,200 with a related weighted average annualized interest rate of 1.41%.
NOTE 3—Investment Management Fee and Other Transactions With Affiliates:
(a) Pursuant to an investment management agreement with the Manager, the Manager provides or arranges for one or more third parties and/or affiliates to provide investment advisory, administrative, custody, fund accounting and transfer agency services to the fund.The Manager also directs the investments of the fund in accordance with its investment objective, policies and limitations. For these services, the fund is contractually obligated to pay the Manager a fee, calculated daily and paid monthly, at the annual rate of .70% of the value of the fund’s
NOTES TO FINANCIAL STATEMENTS (continued)
average daily net assets. Out of its fee, the Manager pays all of the expenses of the fund except brokerage fees, taxes, interest, commitment fees, Rule 12b-1 distribution fees and expenses, service fees, fees and expenses of non-interested Trustees (including counsel fees) and extraordinary expenses. In addition, the Manager is required to reduce its fee in an amount equal to the fund’s allocable portion of fees and expenses of the non-interested Trustees (including counsel fees). Effective January 1, 2010, each Trustee who is not an “interested person” of the Trust (as defined in the Act) received $60,000 per annum, plus $7,000 per joint Board meeting of the Trust,The Dreyfus/Laurel Funds, Inc., The Dreyfus/Laurel Tax-Free Municipal Funds, Dreyfus Investment Funds and Dreyfus Funds, Inc. (collectively, the “Board Group Open-End Funds”) attended, $2,500 for separate in-person committ ee meetings attended which are not held in conjunction with a regularly scheduled Board meeting and $2,000 for Board meetings and separate committee meetings attended that are conducted by telephone.The Board Group Open-End Funds also reimburse each Trustee who is not an “interested person” of the Trust (as defined in the Act) for travel and out-of-pocket expenses.With respect to Board meetings, the Chairman of the Board receives an additional 25% of such compensation (with the exception of reimbursable amounts). Effective January 1, 2010, the Chair of each of the Board’s committees, unless the Chair also serves as Chair of the Board, receives $1,350 per applicable committee meeting. In the event that there is an in-person joint committee meeting or a joint telephone meeting of the Board Group Open-End Funds and Dreyfus HighYield Strategies Fund, the $2,500 or $2,000 fee, as applicable, is allocated between the Board Group Open-End Funds and Dreyfus High Yield Strategies Fund. The TrustR 17;s portion of these fees and expenses are charged and allocated to each series based on net assets. Amounts required to be paid by the Trust directly to the non-interested Trustees, that would be applied to offset a portion of the management fee payable to the Manager, are in fact paid directly by the Manager to the non-interested Trustees.
40
During the period ended December 31, 2010, the Distributor retained $43,385 from commissions earned on sales of the fund’s Class A shares and $18,058 and $27,370 from CDSCs on redemptions of the fund’s Class B and Class C shares, respectively.
(b) Under separate Distribution Plans (the “Plans”) adopted pursuant to Rule 12b-1 under the Act, Class A shares pay annually up to .25% of the value of the average daily net assets to compensate the Distributor for shareholder servicing activities and expenses primarily intended to result in the sale of Class A shares. Class B and Class C shares pay the Distributor for distributing their shares at an aggregate annual rate of .50% and .75% of the value of the average daily net assets of Class B and Class C shares, respectively. Class B and Class C shares are also subject to a Service Plan adopted pursuant to Rule 12b-1 (the “Service Plan”), under which Class B and Class C shares pay the Distributor for providing certain services to the holders of their shares a fee at the annual rate of .25% of the va lue of the average daily net assets of Class B and Class C shares. During the period ended December 31, 2010, Class A, Class B and Class C shares were charged $860,686, $72,603 and $932,154, respectively, pursuant to their respective Plans. During the period ended December 31, 2010, Class B and Class C shares were charged $36,301 and $310,718, respectively, pursuant to the Service Plan.
Under its terms, the Plans and Service Plan shall remain in effect from year to year, provided such continuance is approved annually by a vote of a majority of those Trustees who are not “interested persons” of the Trust and who have no direct or indirect financial interest in the operation of or in any agreement related to the Plans or Service Plan.
The components of “Due to The Dreyfus Corporation and affiliates” in the Statement of Assets and Liabilities consist of: management fees $605,944, Rule 12b-1 distribution plan fees $158,142 and service plan fees $29,168.
NOTES TO FINANCIAL STATEMENTS (continued)
NOTE 4—Securities Transactions:
The aggregate amount of purchases and sales (including paydowns) of investment securities, excluding short-term securities and forward contracts, during the period ended December 31, 2010, amounted to $715,926,862 and $631,988,309, respectively.
The provisions of ASC Topic 815 “Derivatives and Hedging” require qualitative disclosures about objectives and strategies for using derivatives, quantitative disclosures about fair value amounts of gains and losses on derivative instruments and disclosures about credit-risk-related contingent features in derivative agreements. The disclosure requirements distinguish between derivatives, which are accounted for as“hedges” and those that do not qualify for hedge accounting. Because investment companies value their derivatives at fair value and recognize changes in fair value through the Statement of Operations, they do not qualify for such accounting. Accordingly, even though a fund’s investments in derivatives may represent economic hedges, they are considered to be non-hedge transactions for purposes of this disclosure.
Forward Foreign Currency Exchange Contracts: The fund enters into forward contracts in order to hedge its exposure to changes in foreign currency exchange rates on its foreign portfolio holdings, to settle foreign currency transactions or as a part of its investment strategy. When executing forward contracts, the fund is obligated to buy or sell a foreign currency at a specified rate on a certain date in the future. With respect to sales of forward contracts, the fund incurs a loss if the value of the contract increases between the date the forward contract is opened and the date the forward contract is closed.The fund realizes a gain if the value of the contract decreases between those dates. With respect to purchases of forward contracts, the fund incurs a loss if the value of the contract decreases between the date the fo rward contract
42
is opened and the date the forward contract is closed.The fund realizes a gain if the value of the contract increases between those dates. Any realized gain or loss which occurred during the period is reflected in the Statement of Operations.The fund is exposed to foreign currency risk as a result of changes in value of underlying financial instruments. The fund is also exposed to credit risk associated with counterparty nonperformance on these forward contracts, which is typically limited to the unrealized gain on each open contract. At December 31, 2010, there were no forward contracts outstanding.
The following summarizes the average market value of derivatives outstanding during the period ended December 31, 2010:
| |
| | Average Market Value ($) |
| Forward contracts | 84,492 |
At December 31, 2010, the cost of investments for federal income tax purposes was $1,099,030,929; accordingly, accumulated net unrealized appreciation on investments was $52,408,212, consisting of $62,340,322 gross unrealized appreciation and $9,932,110 gross unrealized depreciation.
|
| REPORT OF INDEPENDENT REGISTERED |
| PUBLIC ACCOUNTING FIRM |
The Board of Trustees and Shareholders The Dreyfus/Laurel Funds Trust
We have audited the accompanying statement of assets and liabilities of Dreyfus HighYield Fund (the “Fund”), a series of The Dreyfus/Laurel FundsTrust, including the statement of investments as of December 31, 2010, and the related statement of operations for the year then ended, the statement of changes in net assets for each of the years in the two-year period then ended and the financial highlights for each of the years in the five-year period then ended. These financial statements and financial highlights are the responsibility of the Fund’s management. Our responsibility is to express an opinion on these financial statements and financial highlights based on our audits.
We conducted our audits in accordance with the standards of the Public Company Accounting Oversight Board (United States).Those standards require that we plan and perform the audit to obtain reasonable assurance about whether the financial statements and financial highlights are free of material misstatement. An audit includes examining, on a test basis, evidence supporting the amounts and disclosures in the financial statements. Our procedures included confirmation of securities owned as of December 31, 2010, by correspondence with the custodian and brokers or by other appropriate auditing procedures where replies from brokers were not received.An audit also includes assessing the accounting principles used and significant estimates made by management, as well as evaluating the overall financial statement presentation.We believe that our audits provide a reasonable basis for our opinion.
In our opinion, the financial statements and financial highlights referred to above present fairly, in all material respects, the financial position of Dreyfus High Yield Fund as of December 31, 2010, and the results of its operations for the year then ended, the changes in its net assets for each of the years in the two-year period then ended and the financial highlights for each of the years in the five-year period then ended, in conformity with U.S. generally accepted accounting principles.

New York, New York
February 25, 2011
44
IMPORTANT TAX INFORMATION (Unaudited)
For federal tax purposes the fund designates the maximum amount allowable but not less than 99.65% as interest-related dividends in accordance with Sections 871(k)(1) and 881(e) of the Internal Revenue Code.
BOARD MEMBERS INFORMATION (Unaudited)
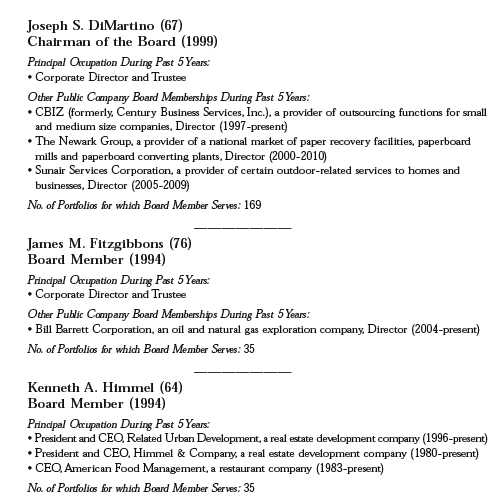
46

Once elected all Board Members serve for an indefinite term, but achieve Emeritus status upon reaching age 80.The address of the Board Members and Officers is in c/o The Dreyfus Corporation, 200 Park Avenue, NewYork, NewYork 10166.Additional information about the Board Members is available in the fund’s Statement of Additional Information which can be obtained from Dreyfus free of charge by calling this toll free number: 1-800-554-4611.
J.Tomlinson Fort, Emeritus Board Member
OFFICERS OF THE FUND (Unaudited)
BRADLEY J. SKAPYAK, President since January 2010.
Chief Operating Officer and a director of the Manager since June 2009. From April 2003 to June 2009, Mr. Skapyak was the head of the Investment Accounting and Support Department of the Manager. He is an officer of 76 investment companies (comprised of 169 portfolios) managed by the Manager. He is 52 years old and has been an employee of the Manager since February 1988.
PHILLIP N. MAISANO, Executive Vice President since July 2007.
Chief Investment Officer,Vice Chair and a director of the Manager, and an officer of 76 investment companies (comprised of 169 portfolios) managed by the Manager. Mr. Maisano also is an officer and/or Board member of certain other investment management subsidiaries of The Bank of New York Mellon Corporation, each of which is an affiliate of the Manager. He is 63 years old and has been an employee of the Manager since November 2006. Prior to joining the Manager, Mr. Maisano served as Chairman and Chief Executive Officer of EACM Advisors, an affiliate of the Manager, since August 2004.
MICHAEL A. ROSENBERG, Vice President and Secretary since August 2005.
Assistant General Counsel of BNY Mellon, and an officer of 77 investment companies (comprised of 194 portfolios) managed by the Manager. He is 50 years old and has been an employee of the Manager since October 1991.
KIESHA ASTWOOD, Vice President and Assistant Secretary since January 2010.
Counsel of BNY Mellon, and an officer of 77 investment companies (comprised of 194 portfolios) managed by the Manager. She is 37 years old and has been an employee of the Manager since July 1995.
JAMES BITETTO, Vice President and Assistant Secretary since August 2005.
Senior Counsel of BNY Mellon and Secretary of the Manager, and an officer of 77 investment companies (comprised of 194 portfolios) managed by the Manager. He is 44 years old and has been an employee of the Manager since December 1996.
JONI LACKS CHARATAN, Vice President and Assistant Secretary since August 2005.
Senior Counsel of BNY Mellon, and an officer of 77 investment companies (comprised of 194 portfolios) managed by the Manager. She is 55 years old and has been an employee of the Manager since October 1988.
JOSEPH M. CHIOFFI, Vice President and Assistant Secretary since August 2005.
Senior Counsel of BNY Mellon, and an officer of 77 investment companies (comprised of 194 portfolios) managed by the Manager. He is 49 years old and has been an employee of the Manager since June 2000.
KATHLEEN DENICHOLAS, Vice President and Assistant Secretary since January 2010.
Senior Counsel of BNY Mellon, and an officer of 77 investment companies (comprised of 194 portfolios) managed by the Manager. She is 36 years old and has been an employee of the Manager since February 2001.
JANETTE E. FARRAGHER, Vice President and Assistant Secretary since August 2005.
ssistant General Counsel of BNY Mellon, and an officer of 77 investment companies (comprised of 194 portfolios) managed by the Manager. She is 48 years old and has been an employee of the Manager since February 1984.
48
JOHN B. HAMMALIAN, Vice President and Assistant Secretary since August 2005.
Managing Counsel of BNY Mellon, and an officer of 77 investment companies (comprised of 194 portfolios) managed by the Manager. He is 47 years old and has been an employee of the Manager since February 1991.
M. CRISTINA MEISER, Vice President and Assistant Secretary since January 2010.
Senior Counsel of BNY Mellon, and an officer of 77 investment companies (comprised of 194 portfolios) managed by the Manager. She is 40 years old and has been an employee of the Manager since August 2001.
ROBERT R. MULLERY, Vice President and Assistant Secretary since August 2005.
Managing Counsel of BNY Mellon, and an officer of 77 investment companies (comprised of 194 portfolios) managed by the Manager. He is 58 years old and has been an employee of the Manager since May 1986.
JEFF PRUSNOFSKY, Vice President and Assistant Secretary since August 2005.
Managing Counsel of BNY Mellon, and an officer of 77 investment companies (comprised of 194 portfolios) managed by the Manager. He is 45 years old and has been an employee of the Manager since October 1990.
JAMES WINDELS, Treasurer since November 2001.
Director – Mutual Fund Accounting of the Manager, and an officer of 77 investment companies (comprised of 194 portfolios) managed by the Manager. He is 52 years old and has been an employee of the Manager since April 1985.
RICHARD CASSARO, Assistant Treasurer since January 2008.
Senior Accounting Manager – Money Market and Municipal Bond Funds of the Manager, and an officer of 77 investment companies (comprised of 194 portfolios) managed by the Manager. He is 51 years old and has been an employee of the Manager since September 1982.
GAVIN C. REILLY, Assistant Treasurer since December 2005.
Tax Manager of the Investment Accounting and Support Department of the Manager, and an officer of 77 investment companies (comprised of 194 portfolios) managed by the Manager. He is 42 years old and has been an employee of the Manager since April 1991.
ROBERT ROBOL, Assistant Treasurer since December 2002.
S enior Accounting Manager – Fixed Income Funds of the Manager, and an officer of 77 investment companies (comprised of 194 portfolios) managed by the Manager. He is 46 years old and has been an employee of the Manager since October 1988.
ROBERT SALVIOLO, Assistant Treasurer since July 2007.
Senior Accounting Manager – Equity Funds of the Manager, and an officer of 77 investment companies (comprised of 194 portfolios) managed by the Manager. He is 43 years old and has been an employee of the Manager since June 1989.
OFFICERS OF THE FUND (Unaudited) (continued)
ROBERT SVAGNA, Assistant Treasurer since December 2002.
Senior Accounting Manager – Equity Funds of the Manager, and an officer of 77 investment companies (comprised of 194 portfolios) managed by the Manager. He is 43 years old and has been an employee of the Manager since November 1990.
JOSEPH W. CONNOLLY, Chief Compliance Officer since October 2004.
Chief Compliance Officer of the Manager and The Dreyfus Family of Funds (77 investment companies, comprised of 194 portfolios). From November 2001 through March 2004, Mr. Connolly was first Vice-President, Mutual Fund Servicing for Mellon Global Securities Services. In that capacity, Mr. Connolly was responsible for managing Mellon’s Custody, Fund Accounting and Fund Administration services to third-party mutual fund clients. He is 53 years old and has served in various capacities with the Manager since 1980, including manager of the firm’s Fund Accounting Department from 1997 through October 2001.
NATALIA GRIBAS, Anti-Money Laundering Compliance Officer since July 2010.
Anti-Money Laundering Compliance Officer of the Distributor, and the Anti-Money Laundering Compliance Officer of 73 investment companies (comprised of 190 portfolios) managed by the Manager. She is 40 years old and has been an employee of the Distributor since September 2008.
50
For More Information
Telephone Call your financial representative or 1-800-554-4611
Mail The Dreyfus Family of Funds, 144 Glenn Curtiss Boulevard, Uniondale, NY 11556-0144
The fund files its complete schedule of portfolio holdings with the Securities and Exchange Commission (“SEC”) for the first and third quarters of each fiscal year on Form N-Q. The fund’s Forms N-Q are available on the SEC’s website at http://www.sec.gov and may be reviewed and copied at the SEC’s Public Reference Room in Washington, DC. Information on the operation of the Public Reference Room may be obtained by calling 1-800-SEC-0330.
A description of the policies and procedures that the fund uses to determine how to vote proxies relating to portfolio securities, and information regarding how the fund voted these proxies for the most recent 12-month period ended June 30 is available at http://www.dreyfus.com and on the SEC’s website at http://www.sec.gov. The description of the policies and procedures is also available without charge, upon request, by calling 1-800-645-6561.

Item 2. Code of Ethics.
The Registrant has adopted a code of ethics that applies to the Registrant's principal executive officer, principal financial officer, principal accounting officer or controller, or persons performing similar functions. There have been no amendments to, or waivers in connection with, the Code of Ethics during the period covered by this Report.
Item 3. Audit Committee Financial Expert.
The Registrant's Board has determined that Joseph S. DiMartino, a member of the Audit Committee of the Board, is an audit committee financial expert as defined by the Securities and Exchange Commission (the "SEC"). Joseph S. DiMartino is "independent" as defined by the SEC for purposes of audit committee financial expert determinations.
Item 4. Principal Accountant Fees and Services.
(a) Audit Fees. The aggregate fees billed for each of the last two fiscal years (the "Reporting Periods") for professional services rendered by the Registrant's principal accountant (the "Auditor") for the audit of the Registrant's annual financial statements or services that are normally provided by the Auditor in connection with the statutory and regulatory filings or engagements for the Reporting Periods, were $79,895 in 2009 and $79,895 in 2010.
(b) Audit-Related Fees. The aggregate fees billed in the Reporting Periods for assurance and related services by the Auditor that are reasonably related to the performance of the audit of the Registrant's financial statements and are not reported under paragraph (a) of this Item 4 were $ 8,400 in 2009 and $8,400 in 2010. These services consisted of one or more of the following: (i) agreed upon procedures related to compliance with Internal Revenue Code section 817(h), (ii) security counts required by Rule 17f-2 under the Investment Company Act of 1940, as amended, (iii) advisory services as to the accounting or disclosure treatment of Registrant transactions or events and (iv) advisory services to the accounting or disclosure treatment of the actual or potential impact to the Registrant of final or proposed rules, standards or interpretations by the Securities and Exchange Commission, the Financial Accounting Standards Boards or other regulatory or standard-setting bodies.
The aggregate fees billed in the Reporting Periods for non-audit assurance and related services by the Auditor to the Registrant's investment adviser (not including any sub-investment adviser whose role is primarily portfolio management and is subcontracted with or overseen by another investment adviser), and any entity controlling, controlled by or under common control with the investment adviser that provides ongoing services to the Registrant ("Service Affiliates"), that were reasonably related to the performance of the annual audit of the Service Affiliate, which required pre-approval by the Audit Committee were $0 in 2009 and $0 in 2010.
(c) Tax Fees. The aggregate fees billed in the Reporting Periods for professional services rendered by the Auditor for tax compliance, tax advice, and tax planning ("Tax Services") were $4,520 in 2009 and $4,520 in 2010. These services consisted of review or preparation of U.S. federal, state, local and excise tax returns. The aggregate fees billed in the Reporting Periods for Tax Services by the Auditor to Service Affiliates, which required pre-approval by the Audit Committee were $0 in 2009 and $0 in 2010.
(d) All Other Fees. The aggregate fees billed in the Reporting Periods for products and services provided by the Auditor, other than the services reported in paragraphs (a) through (c) of this Item, were $0 in 2009 and $0 in 2010.
The aggregate fees billed in the Reporting Periods for Non-Audit Services by the Auditor to Service Affiliates, other than the services reported in paragraphs (b) through (c) of this Item, which required pre-approval by the Audit Committee, were $0 in 2009 and $0 in 2010.
(e)(1) Audit Committee Pre-Approval Policies and Procedures. The Registrant's Audit Committee has established policies and procedures (the "Policy") for pre-approval (within specified fee limits) of the Auditor's engagements for non-audit services to the Registrant and Service Affiliates without specific case-by-case consideration. The pre-approved services in the Policy can include pre-approved audit services, pre-approved audit-related services, pre-approved tax services and pre-approved all other services. Pre-approval considerations include whether the proposed services are compatible with maintaining the Auditor's independence. Pre-approvals pursuant to the Policy are considered annually.
(e)(2) Note: None of the services described in paragraphs (b) through (d) of this Item 4 were approved by the Audit Committee pursuant to paragraph (c)(7)(i)(C) of Rule 2-01 of Regulation S-X.
(f) None of the hours expended on the principal accountant's engagement to audit the registrant's financial statements for the most recent fiscal year were attributed to work performed by persons other than the principal account's full-time, permanent employees.
Non-Audit Fees. The aggregate non-audit fees billed by the Auditor for services rendered to the Registrant, and rendered to Service Affiliates, for the Reporting Periods were $4,021,870 in 2009 and $3,693,000 in 2010.
Auditor Independence. The Registrant's Audit Committee has considered whether the provision of non-audit services that were rendered to Service Affiliates, which were not pre-approved (not requiring pre-approval), is compatible with maintaining the Auditor's independence.
Item 5. Audit Committee of Listed Registrants.
Not applicable. [CLOSED-END FUNDS ONLY]
Item 6. Investments.
(a) Not applicable.
Item 7. Disclosure of Proxy Voting Policies and Procedures for Closed-End Management Investment Companies.
Not applicable. [CLOSED-END FUNDS ONLY]
Item 8. Portfolio Managers of Closed-End Management Investment Companies.
Not applicable. [CLOSED-END FUNDS ONLY, beginning with reports for periods ended on and after December 31, 2005]
Item 9. Purchases of Equity Securities by Closed-End Management Investment Companies and Affiliated Purchasers.
Not applicable. [CLOSED-END FUNDS ONLY]
Item 10. Submission of Matters to a Vote of Security Holders.
There have been no material changes to the procedures applicable to Item 10.
Item 11. Controls and Procedures.
(a) The Registrant's principal executive and principal financial officers have concluded, based on their evaluation of the Registrant's disclosure controls and procedures as of a date within 90 days of the filing date of this report, that the Registrant's disclosure controls and procedures are reasonably designed to ensure that information required to be disclosed by the Registrant on Form N-CSR is recorded, processed, summarized and reported within the required time periods and that information required to be disclosed by the Registrant in the reports that it files or submits on Form N-CSR is accumulated and communicated to the Registrant's management, including its principal executive and principal financial officers, as appropriate to allow timely decisions regarding required disclosure.
(b) There were no changes to the Registrant's internal control over financial reporting that occurred during the second fiscal quarter of the period covered by this report that have materially affected, or are reasonably likely to materially affect, the Registrant's internal control over financial reporting.
Item 12. Exhibits.
(a)(1) Code of ethics referred to in Item 2.
(a)(2) Certifications of principal executive and principal financial officers as required by Rule 30a-2(a) under the Investment Company Act of 1940.
(a)(3) Not applicable.
(b) Certification of principal executive and principal financial officers as required by Rule 30a-2(b) under the Investment Company Act of 1940.
SIGNATURES
Pursuant to the requirements of the Securities Exchange Act of 1934 and the Investment Company Act of 1940, the Registrant has duly caused this Report to be signed on its behalf by the undersigned, thereunto duly authorized.
The Dreyfus/Laurel Funds Trust
By: /s/ Bradley J. Skapyak |
Bradley J. Skapyak, President |
Date: February 23, 2011 |
|
Pursuant to the requirements of the Securities Exchange Act of 1934 and the Investment Company Act of 1940, this Report has been signed below by the following persons on behalf of the Registrant and in the capacities and on the dates indicated. |
|
By: /s/ Bradley J. Skapyak |
Bradley J. Skapyak, President |
Date: February 23, 2011 |
|
By: /s/ James Windels |
James Windels, Treasurer |
Date: February 23, 2011 |
|
EXHIBIT INDEX
(a)(1) Code of ethics referred to in Item 2.
(a)(2) Certifications of principal executive and principal financial officers as required by Rule 30a-2(a) under the Investment Company Act of 1940. (EX-99.CERT)
(b) Certification of principal executive and principal financial officers as required by Rule 30a-2(b) under the Investment Company Act of 1940. (EX-99.906CERT)