UNITED STATES
SECURITIES AND EXCHANGE COMMISSION
Washington, D.C. 20549
FORM N-CSR
CERTIFIED SHAREHOLDER REPORT OF REGISTERED MANAGEMENT
INVESTMENT COMPANIES
| |
| Investment Company Act file number | 811-524 |
The Dreyfus/Laurel Funds Trust
(Exact name of Registrant as specified in charter)
c/o The Dreyfus Corporation
200 Park Avenue
New York, New York 10166
(Address of principal executive offices) (Zip code)
Michael A. Rosenberg, Esq.
200 Park Avenue
New York, New York 10166
(Name and address of agent for service)
| |
| Registrant's telephone number, including area code: | (212) 922-6000 |
| |
| Date of fiscal year end: | 05/31 |
| Date of reporting period: | 05/31/2010 |
The following N-CSR relates only to Dreyfus Equity Income Fund and Dreyfus Emerging Markets Debt Local Currency Fund and does not affect the other series of the Registrant, which have different fiscal year ends and, therefore, different N-CSR reporting requirements. Separate N-CSR Forms will be filed for these series, as appropriate.
FORM N-CSR
| |
| Item 1. | Reports to Stockholders. |
|
| Dreyfus |
| Equity Income Fund |
ANNUAL REPORT May 31, 2010

Save time. Save paper. View your next shareholder report online as soon as it’s available. Log into www.dreyfus.com and sign up for Dreyfus eCommunications. It’s simple and only takes a few minutes.
The views expressed in this report reflect those of the portfolio manager only through the end of the period covered and do not necessarily represent the views of Dreyfus or any other person in the Dreyfus organization. Any such views are subject to change at any time based upon market or other conditions and Dreyfus disclaims any responsibility to update such views.These views may not be relied on as investment advice and, because investment decisions for a Dreyfus fund are based on numerous factors, may not be relied on as an indication of trading intent on behalf of any Dreyfus fund.
Not FDIC-Insured • Not Bank-Guaranteed • May Lose Value
| | Contents |
| | THE FUND |
| 2 | A Letter from the Chairman and CEO |
| 3 | Discussion of Fund Performance |
| 6 | Fund Performance |
| 8 | Understanding Your Fund’s Expenses |
| 8 | Comparing Your Fund’s Expenses With Those of Other Funds |
| 9 | Statement of Investments |
| 14 | Statement of Assets and Liabilities |
| 15 | Statement of Operations |
| 16 | Statement of Changes in Net Assets |
| 18 | Financial Highlights |
| 21 | Notes to Financial Statements |
| 32 | Report of Independent Registered Public Accounting Firm |
| 33 | Important Tax Information |
| 34 | Information About the Review and Approval of the Fund’s Management Agreement |
| 39 | Board Members Information |
| 41 | Officers of the Fund |
| | FOR MORE INFORMATION |
| | Back Cover |
Dreyfus
Equity Income Fund
The Fund

A LETTER FROM THE CHAIRMAN AND CEO
Dear Shareholder:
We are pleased to present this annual report for Dreyfus Equity Income Fund, covering the 12-month period from June 1, 2009, through May 31, 2010.
Psychology historically has played an important role in how investors—especially individual investors—perceive the financial markets and make asset allocation decisions. Unlike the purely rational investor who, in an ideal world, would seek investments that potentially can deliver the best risk/return characteristics, the everyday investor typically has been influenced by emotions. Currently, investors’ emotions appear to be deeply divided, with a large number still seeking low risk investments (such as cash instruments), and others favoring higher risk investments (such as smaller-cap and emerging market stocks). Meanwhile, investment classes in the middle of the risk spectrum seemingly have been largely avoided.
It is important to note that investor sentiment often lags the economic cycle.That’s why we continue to stress the importance of a long-term, well balanced asset allocation strategy that can help cushion the volatility produced by the emotional swings of the financial markets. If you have not revisited your investment portfolio recently, we urge you to speak with your financial advisor about taking advantage of long-term market fundamentals rather than remaining susceptible to the effects of emotional reactions to short-term developments.
For information about how the fund performed during the reporting period, as well as general market perspectives, we provide a Discussion of Fund Performance on the pages that follow.
Thank you for your continued confidence and support.
Jonathan R. Baum
Chairman and Chief Executive Officer
The Dreyfus Corporation
June 15, 2010
2

DISCUSSION OF FUND PERFORMANCE
For the period of June 1, 2009, through May 31, 2010, as provided by Jocelin A. Reed, CFA, Portfolio Manager
Fund and Market Performance Overview
For the 12-month period ended May 31, 2010, Dreyfus Equity Income Fund’s Class A shares produced a total return of 15.55%, Class C shares returned 14.57% and Class I shares returned 15.73%.1 In comparison, the fund’s benchmark, the Standard & Poor’s 500 Composite Stock Price Index (“S&P 500 Index”), provided a total return of 20.98% for the same period.2
Stocks generally advanced over the reporting period’s first half during a sustained economic recovery, but gave back most of its gains in the second half as new global economic concerns intensified. The fund produced returns that were lower than its benchmark, mainly due to its emphasis on high-quality, dividend-paying stocks at a time when lower-quality companies rebounded more robustly.
The Fund’s Investment Approach
The fund seeks total return consisting of capital appreciation and income. To pursue its goal, the fund invests primarily in equity securities, with a particular focus on dividend-paying stocks and other investments and investment techniques that provide income.When selecting securities,we use a computer model to identify and rank stocks within an industry or sector. Next, based on fundamental analysis, we generally select what we believe to be the most attractive of the higher ranked securities. We manage risk by diversifying the fund’s investments across companies and industries, seeking to limit the potential adverse impact of a decline in any one stock or industry.
Stocks Encountered Volatility in a Subpar Recovery
The reporting period began near the start of an economic recovery as improved manufacturing activity and an apparent bottoming of housing prices helped boost confidence among businesses, consumers and
DISCUSSION OF FUND PERFORMANCE (continued)
investors. However, in early 2010, several developments appeared to threaten the global economic rebound. First, Europe was roiled by a sovereign debt crisis when Greece and other peripheral members of the European Union found themselves unable to finance heavy debt burdens. Meanwhile, robust economic growth in China seemed to spark local inflationary pressures, and investors grew worried that remedial measures might dampen growth in Asia. Finally, stubbornly high unemployment and ongoing troubles in domestic housing markets produced economic headwinds in the United States.
Consequently, U.S. stocks rallied early in the reporting period, but later gave back most of those gains.The rally over the reporting period’s first half was led by lower-quality stocks that had been severely punished during the downturn.Although in 2010 we began to see evidence of a shift in investor sentiment toward companies with sound fundamentals, the trend proved tentative due to heightened market volatility and renewed economic uncertainty.
Quality Bias Undermined Relative Performance
In this volatile environment, our disciplined security selection process led us to areas of the market where companies and industry groups displayed sound business fundamentals.We found a number of opportunities meeting these criteria in the utilities and telecommunications services sectors, which lagged market averages when investors favored less defensive businesses.
In addition, the fund suffered from an underweighted position in the consumer staples sector, where our stock selection strategy also fell short of sector averages. For example, high-quality fund holding McDonald’s gained value, but not as robustly as many of the benchmark’s consumer staples companies that the fund did not own. In fact, the sector’s advance was led by a rebound among hotels with less-than-impressive financial profiles. Similarly, fund holding Family Dollar Stores, a traditionally defensive retailer, lagged lower-quality department stores that did not meet our investment criteria. Among media companies, the fund’s positions i n major conglomerates such as Walt Disney and Time Warner trailed more speculative satellite and cable television operators.
4
The fund achieved better results in the materials sector, where robust global industrial demand and rising commodity prices buoyed the stock prices of steel producers Cliff’s Natural Resources and Walter Energy, as well as chemical producers such as Methanex and Dow Chemical. In the telecommunications services sector, the fund favored the better-performing AT&T overVerizon Communicatio ns, as the former continued to benefit from its relationship with electronics innovator Apple.
Finding Opportunities for Growth and Income
Although the U.S. stock market has rebounded slightly from the impacts of the 2008 recession and financial crisis, a number of headwinds remain, including uncertainty regarding proposed regulatory reform in the financials sector. Therefore, we have maintained underweighted exposure to financial companies, but we have adopted a more constructive posture with regard to potential growth and income opportunities stemming from rising economic activity in other market segments. Indeed, if security selection becomes a more critical determinant of market performance in the months ahead, as we expect it to, we believe that our research-intensive investment process may be particularly well suited to the upcoming market environment.
June 15, 2010
Please note, the position in any security highlighted with italicized typeface was sold during the reporting period.
Equity funds are subject generally to market, market sector, market liquidity, issuer and investment style risks, among other factors, to varying degrees, all of which are more fully described in the fund’s prospectus.
| |
| 1 | Total return includes reinvestment of dividends and any capital gains paid, and does not take into |
| | consideration the maximum initial sales charge in the case of Class A shares, or the applicable |
| | contingent deferred sales charge imposed on redemptions in the case of Class C shares. Had these |
| | charges been reflected, returns would have been lower. Past performance is no guarantee of future |
| | results. Share price and investment return fluctuate such that upon redemption, fund shares may be |
| | worth more or less than their original cost. Return figures provided reflect the absorption of certain |
| | fund expenses by The Dreyfus Corporation pursuant to an undertaking in effect through October |
| | 1, 2011, at which time it may be extended, terminated or modified. Had these expenses not been |
| | absorbed, the fund’s returns would have been lower. |
| 2 | SOURCE: LIPPER INC. — Reflects reinvestment of dividends and, where applicable, capital |
| | gain distributions.The Standard & Poor’s 500 Composite Stock Price Index is a widely accepted, |
| | unmanaged index of U.S. stock market performance. Investors cannot invest directly in any index. |
FUND PERFORMANCE
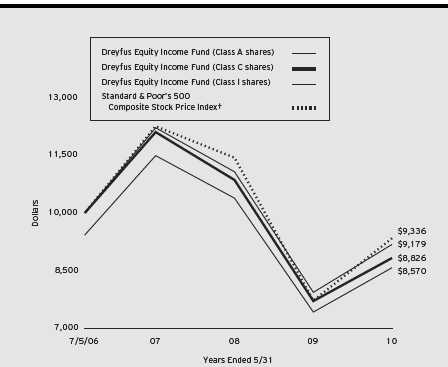
Comparison of change in value of $10,000 investment in Dreyfus Equity Income Fund Class A shares, Class C shares and Class I shares and the Standard & Poor’s 500 Composite Stock Price Index
|
| † Source: Lipper Inc. |
| Past performance is not predictive of future performance. |
| The above graph compares a $10,000 investment made in Class A, Class C and Class I shares of Dreyfus Equity |
| Income Fund on 7/5/06 (inception date) to a $10,000 investment made in the Standard & Poor’s 500 Composite |
| Stock Price Index (the “Index”) on that date. For comparative purposes, the value of the Index on 6/30/06 is used as |
| the beginning value on 7/5/06. All dividends and capital gain distributions are reinvested. |
| The fund’s performance shown in the line graph above takes into account the maximum initial sales charge on Class A |
| shares and all other applicable fees and expenses on all classes.The fund primarily seeks total return by investing in |
| stocks, focusing on dividend-paying stocks and other instruments that provide income.The Index is a widely accepted, |
| unmanaged index of U.S. stock market performance.These factors can contribute to the Index potentially outperforming |
| the fund. Unlike a mutual fund, the Index is not subject to charges, fees and other expenses. Investors cannot invest |
| directly in any index. Further information relating to fund performance, including expense reimbursements, if applicable, is |
| contained in the Financial Highlights section of the prospectus and elsewhere in this report. |
6
| | | |
| Average Annual Total Returns as of 5/31/10 | | |
| |
| | Inception | | From |
| | Date | 1 Year | Inception |
| Class A shares | | | |
| with maximum sales charge (5.75%) | 7/5/06 | 8.95% | –3.88% |
| without sales charge | 7/5/06 | 15.55% | –2.41% |
| Class C shares | | | |
| with applicable redemption charge † | 7/5/06 | 13.57% | –3.15% |
| without redemption | 7/5/06 | 14.57% | –3.15% |
| Class I shares | 7/5/06 | 15.73% | –2.17% |
| Standard & Poor’s 500 | | | |
| Composite Stock Price Index†† | 6/30/06 | 20.98% | –1.74% |
Past performance is not predictive of future performance.The fund’s performance shown in the graph and table does not reflect the deduction of taxes that a shareholder would pay on fund distributions or the redemption of fund shares.
| |
| † | The maximum contingent deferred sales charge for Class C shares is 1% for shares redeemed within one year of the |
| | date of purchase. |
| †† | The Index date is based on the life of Class A shares. For comparative purposes, the value of the Index as of the |
| | month end 6/30/06 is used as the beginning value on 7/5/06 (the inception date for Class A shares). |
UNDERSTANDING YOUR FUND’S EXPENSES (Unaudited)
As a mutual fund investor, you pay ongoing expenses, such as management fees and other expenses. Using the information below, you can estimate how these expenses affect your investment and compare them with the expenses of other funds.You also may pay one-time transaction expenses, including sales charges (loads) and redemption fees, which are not shown in this section and would have resulted in higher total expenses. For more information, see your fund’s prospectus or talk to your financial adviser.
Review your fund’s expenses
The table below shows the expenses you would have paid on a $1,000 investment in Dreyfus Equity Income Fund from December 1, 2009 to May 31, 2010. It also shows how much a $1,000 investment would be worth at the close of the period, assuming actual returns and expenses.
Expenses and Value of a $1,000 Investment
assuming actual returns for the six months ended May 31, 2010
| | | |
| | Class A | Class C | Class I |
| Expenses paid per $1,000† | $ 7.43 | $ 11.12 | $ 6.20 |
| Ending value (after expenses) | $986.90 | $983.00 | $988.60 |
COMPARING YOUR FUND’S EXPENSES
WITH THOSE OF OTHER FUNDS (Unaudited)
Using the SEC’s method to compare expenses
The Securities and Exchange Commission (SEC) has established guidelines to help investors assess fund expenses. Per these guidelines, the table below shows your fund’s expenses based on a $1,000 investment, assuming a hypothetical 5% annualized return. You can use this information to compare the ongoing expenses (but not transaction expenses or total cost) of investing in the fund with those of other funds.All mutual fund shareholder reports will provide this information to help you make this comparison. Please note that you cannot use this information to estimate your actual ending account balance and expenses paid during the period.
Expenses and Value of a $1,000 Investment
assuming a hypothetical 5% annualized return for the six months ended May 31, 2010
| | | |
| | Class A | Class C | Class I |
| Expenses paid per $1,000† | $ 7.54 | $ 11.30 | $ 6.29 |
| Ending value (after expenses) | $1,017.45 | $1,013.71 | $1,018.70 |
|
| † Expenses are equal to the fund’s annualized expense ratio of 1.50% for Class A, 2.25% for Class C and 1.25% |
| for Class I, multiplied by the average account value over the period, multiplied by 182/365 (to reflect the one-half |
| year period). |
8
|
| STATEMENT OF INVESTMENTS |
| May 31, 2010 |
| | |
| Common Stocks—99.9% | Shares | Value ($) |
| Consumer Discretionary—8.7% | | |
| Gannett | 350 | 5,439 |
| Gap | 650 | 14,170 |
| Garmin | 300 a | 10,074 |
| Johnson Controls | 800 | 22,824 |
| Limited Brands | 710 | 17,651 |
| McGraw-Hill | 150 | 4,170 |
| Regal Entertainment Group, Cl. A | 700 | 10,668 |
| Ross Stores | 235 | 12,314 |
| Time Warner | 540 | 16,735 |
| TJX | 130 | 5,910 |
| VF | 185 | 14,310 |
| Whirlpool | 50 | 5,222 |
| | | 139,487 |
| Consumer Staples—10.4% | | |
| Campbell Soup | 280 | 10,027 |
| Coca-Cola | 210 | 10,794 |
| ConAgra Foods | 800 | 19,344 |
| General Mills | 100 | 7,123 |
| Kimberly-Clark | 335 | 20,334 |
| Kroger | 170 | 3,422 |
| Lorillard | 185 | 13,226 |
| Philip Morris International | 230 | 10,148 |
| Procter & Gamble | 240 | 14,662 |
| Reynolds American | 255 | 13,296 |
| Wal-Mart Stores | 550 | 27,808 |
| Walgreen | 505 | 16,180 |
| | | 166,364 |
| Energy—11.3% | | |
| BP, ADR | 315 | 13,529 |
| Chevron | 600 | 44,322 |
| ConocoPhillips | 255 | 13,224 |
| ENSCO, ADR | 85 | 3,179 |
| Exxon Mobil | 790 | 47,763 |
| Frontline | 405 a | 13,320 |
| Halliburton | 180 | 4,469 |
STATEMENT OF INVESTMENTS (continued)
| | |
| Common Stocks (continued) | Shares | Value ($) |
| Energy (continued) | | |
| Marathon Oil | 315 | 9,793 |
| Patterson-UTI Energy | 375 | 5,261 |
| Schlumberger | 150 | 8,423 |
| Spectra Energy | 930 | 18,609 |
| | | 181,892 |
| Financial—15.4% | | |
| American Express | 430 | 17,144 |
| Annaly Capital Management | 1,130 b | 19,165 |
| Bank of America | 1,289 | 20,289 |
| Barclays, ADR | 595 | 10,484 |
| Berkshire Hathaway, Cl. B | 100 c | 7,055 |
| Charles Schwab | 425 | 6,945 |
| Deutsche Bank | 105 | 6,255 |
| Discover Financial Services | 425 | 5,716 |
| Federated Investors, Cl. B | 480 a | 10,661 |
| Goldman Sachs Group | 130 | 18,754 |
| Hospitality Properties Trust | 350 | 7,875 |
| Hudson City Bancorp | 300 | 3,783 |
| ING Groep, ADR | 695 c | 5,504 |
| JPMorgan Chase & Co. | 615 | 24,342 |
| KeyCorp | 500 | 4,010 |
| Moody’s | 745 a | 15,273 |
| Principal Financial Group | 320 | 8,701 |
| Progressive | 480 | 9,403 |
| Prudential Financial | 335 | 19,333 |
| Public Storage | 180 b | 16,684 |
| Wells Fargo & Co. | 305 | 8,750 |
| | | 246,126 |
| Health Care—11.9% | | |
| Abbott Laboratories | 100 | 4,756 |
| Aetna | 155 | 4,520 |
| Biovail | 330 | 4,953 |
| Bristol-Myers Squibb | 1,030 | 23,906 |
| Cardinal Health | 150 | 5,173 |
| CIGNA | 155 | 5,188 |
| Eli Lilly & Co. | 600 | 19,674 |
10
| | |
| Common Stocks (continued) | Shares | Value ($) |
| Health Care (continued) | | |
| Gilead Sciences | 140 c | 5,029 |
| Humana | 255 c | 11,743 |
| Johnson & Johnson | 755 | 44,016 |
| McKesson | 205 | 14,350 |
| Medtronic | 350 | 13,713 |
| Merck & Co. | 200 | 6,738 |
| Pfizer | 1,407 | 21,429 |
| Quest Diagnostics | 100 | 5,275 |
| | | 190,463 |
| Industrial—9.1% | | |
| 3M | 265 | 21,017 |
| Caterpillar | 135 | 8,203 |
| CSX | 140 | 7,315 |
| Deere & Co. | 320 | 18,458 |
| Expeditors International | | |
| of Washington | 195 | 7,447 |
| General Electric | 770 | 12,589 |
| Joy Global | 140 | 7,140 |
| Pitney Bowes | 455 | 10,301 |
| R.R. Donnelley & Sons | 200 | 3,832 |
| Raytheon | 430 | 22,536 |
| Tyco International | 235 | 8,505 |
| United Technologies | 200 | 13,476 |
| Waste Management | 150 | 4,877 |
| | | 145,696 |
| Information Technology—19.0% | | |
| Accenture, Cl. A | 280 | 10,506 |
| Activision Blizzard | 1,600 | 17,200 |
| Analog Devices | 295 | 8,605 |
| Apple | 50 c | 12,858 |
| Automatic Data Processing | 100 | 4,088 |
| Cisco Systems | 240 c | 5,558 |
| Fiserv | 100 c | 4,755 |
| Google, Cl. A | 10 c | 4,852 |
| Hewlett-Packard | 365 | 16,794 |
| Infosys Technologies, ADR | 315 | 18,122 |
STATEMENT OF INVESTMENTS (continued)
| | |
| Common Stocks (continued) | Shares | Value ($) |
| Information Technology (continued) | | |
| Intel | 1,855 | 39,734 |
| International Business Machines | 340 | 42,588 |
| MasterCard, Cl. A | 20 | 4,035 |
| Maxim Integrated Products | 365 | 6,482 |
| Microsoft | 955 | 24,639 |
| Motorola | 1,000 c | 6,850 |
| QUALCOMM | 645 | 22,936 |
| Seagate Technology | 900 c | 13,824 |
| Taiwan Semiconductor Manufacturing, ADR | 485 | 4,729 |
| Telefonaktiebolaget LM Ericsson, ADR | 1,170 | 11,747 |
| Texas Instruments | 215 | 5,250 |
| Western Union | 550 | 8,778 |
| Xilinx | 400 | 9,780 |
| | | 304,710 |
| Materials—5.9% | | |
| Cliffs Natural Resources | 185 | 10,334 |
| E.I. du Pont de Nemours & Co. | 480 | 17,362 |
| Freeport-McMoRan Copper & Gold | 345 | 24,167 |
| Huntsman | 1,850 | 18,463 |
| International Paper | 630 | 14,635 |
| Lubrizol | 100 | 8,857 |
| | | 93,818 |
| Telecommunication Services—3.8% | | |
| AT & T | 1,570 | 38,151 |
| BCE | 395 | 11,538 |
| Frontier Communications | 805 a | 6,400 |
| Qwest Communications International | 890 | 4,664 |
| | | 60,753 |
| Utilities—4.4% | | |
| Atmos Energy | 325 | 8,814 |
| DTE Energy | 435 | 19,797 |
| Duke Energy | 645 | 10,294 |
| Entergy | 50 | 3,753 |
| PG & E | 100 | 4,150 |
12
| | |
| Common Stocks (continued) | Shares | Value ($) |
| Utilities (continued) | | |
| Pinnacle West Capital | 285 | 10,006 |
| Progress Energy | 100 | 3,859 |
| Sempra Energy | 115 | 5,290 |
| TECO Energy | 300 | 4,665 |
| | | 70,628 |
| Total Common Stocks | | |
| (cost $1,711,373) | | 1,599,937 |
| |
| Investment of Cash Collateral | | |
| for Securities Loaned—2.6% | | |
| Registered Investment Company; | | |
| Dreyfus Institutional Cash | | |
| Advantage Fund | | |
| (cost $42,055) | 42,055 d | 42,055 |
| Total Investments (cost $1,753,428) | 102.5% | 1,641,992 |
| Liabilities, Less Cash and Receivables | (2.5%) | (39,343) |
| Net Assets | 100.0% | 1,602,649 |
ADR—American Depository Receipts
|
| a Security, or portion thereof, on loan. At May 31, 2010, the total market value of the fund’s securities on loan is |
| $40,489 and the total market value of the collateral held by the fund is $42,055. |
| b Investment in real estate investment trust. |
| c Non-income producing security. |
| d Investment in affiliated money market mutual fund. |
| | | |
| Portfolio Summary (Unaudited)† | | |
| |
| | Value (%) | | Value (%) |
| Information Technology | 19.0 | Consumer Discretionary | 8.7 |
| Financial | 15.4 | Materials | 5.9 |
| Health Care | 11.9 | Utilities | 4.4 |
| Energy | 11.3 | Telecommunication Services | 3.8 |
| Consumer Staples | 10.4 | Money Market Investment | 2.6 |
| Industrial | 9.1 | | 102.5 |
| |
| † Based on net assets. | | | |
| See notes to financial statements. | | | |
|
| STATEMENT OF ASSETS AND LIABILITIES |
| May 31, 2010 |
| | | |
| | | Cost | Value |
| Assets ($): | | | |
| Investments in securities—See Statement of Investments (including | | |
| securities on loan, valued at $40,489)—Note 1(b): | | | |
| Unaffiliated issuers | | 1,711,373 | 1,599,937 |
| Affiliated issuers | | 42,055 | 42,055 |
| Cash | | | 17,207 |
| Cash denominated in foreign currencies | | 565 | 604 |
| Dividends and interest receivable | | | 5,705 |
| Prepaid expenses | | | 27,494 |
| | | | 1,693,002 |
| Liabilities ($): | | | |
| Due to The Dreyfus Corporation and affiliates—Note 3(d) | | 2,076 |
| Liability for securities on loan—Note 1(b) | | | 42,055 |
| Accrued expenses | | | 46,222 |
| | | | 90,353 |
| Net Assets ($) | | | 1,602,649 |
| Composition of Net Assets ($): | | | |
| Paid-in capital | | | 1,878,635 |
| Accumulated undistributed investment income—net | | | 2,305 |
| Accumulated net realized gain (loss) on investments | | | (166,894) |
| Accumulated net unrealized appreciation | | | |
| (depreciation) on investments | | | (111,397) |
| Net Assets ($) | | | 1,602,649 |
| |
| |
| Net Asset Value Per Share | | | |
| | Class A | Class C | Class I |
| Net Assets ($) | 1,235,832 | 286,269 | 80,548 |
| Shares Outstanding | 117,518 | 27,447 | 7,643 |
| Net Asset Value Per Share ($) | 10.52 | 10.43 | 10.54 |
| |
| See notes to financial statements. | | | |
14
|
| STATEMENT OF OPERATIONS |
| Year Ended May 31, 2010 |
| |
| Investment Income ($): | |
| Income: | |
| Cash dividends (net of $310 foreign taxes withheld at source): | |
| Unaffiliated issuers | 43,999 |
| Affiliated issuers | 12 |
| Income from securities lending—Note 1(b) | 143 |
| Total Income | 44,154 |
| Expenses: | |
| Management fee—Note 3(a) | 11,067 |
| Registration fees | 53,872 |
| Auditing fees | 34,726 |
| Prospectus and shareholders’ reports | 8,338 |
| Shareholder servicing costs—Note 3(d) | 6,516 |
| Custodian fees—Note 3(d) | 5,475 |
| Legal fees | 4,281 |
| Distribution fees—Note 3(c) | 1,850 |
| Trustees’ fees and expenses—Note 3(b) | 1,006 |
| Loan commitment fees—Note 2 | 16 |
| Miscellaneous | 13,218 |
| Total Expenses | 140,365 |
| Less—expense reimbursement from The Dreyfus | |
| Corporation due to undertaking—Note 3(a) | (116,585) |
| Less—reduction in fees due to earnings credits—Note 1(b) | (3) |
| Net Expenses | 23,777 |
| Investment Income—Net | 20,377 |
| Realized and Unrealized Gain (Loss) on Investments—Note 4 ($): | |
| Net realized gain (loss) on investments and foreign currency transactions | (3,423) |
| Net unrealized appreciation (depreciation) | |
| on investments and foreign currency transactions | 161,651 |
| Net Realized and Unrealized Gain (Loss) on Investments | 158,228 |
| Net Increase in Net Assets Resulting from Operations | 178,605 |
| |
| See notes to financial statements. | |
STATEMENT OF CHANGES IN NET ASSETS
| | |
| | | Year Ended May 31, |
| | 2010 | 2009a |
| Operations ($): | | |
| Investment income—net | 20,377 | 22,292 |
| Net realized gain (loss) on investments | (3,423) | (109,661) |
| Net unrealized appreciation | | |
| (depreciation) on investments | 161,651 | (346,227) |
| Net Increase (Decrease) in Net Assets | | |
| Resulting from Operations | 178,605 | (433,596) |
| Dividends to Shareholders from ($): | | |
| Investment income—net: | | |
| Class A Shares | (16,570) | (18,173) |
| Class C Shares | (1,926) | (1,477) |
| Class I Shares | (1,264) | (1,177) |
| Class T Shares | — | (867) |
| Total Dividends | (19,760) | (21,694) |
| Beneficial Interest Transactions ($): | | |
| Net proceeds from shares sold: | | |
| Class A Shares | 209,915 | 141,502 |
| Class C Shares | 502,089 | 70,314 |
| Class I Shares | 16,483 | — |
| Class T Shares | — | 5,434 |
| Dividends reinvested: | | |
| Class A Shares | 16,029 | 17,485 |
| Class C Shares | 1,285 | 1,163 |
| Class I Shares | 1,263 | 1,177 |
| Class T Shares | — | 867 |
| Cost of shares redeemed: | | |
| Class A Shares | (77,806) | (136,263) |
| Class C Shares | (364,721) | (34,362) |
| Class I Shares | (11) | — |
| Class T Shares | — | (53,719) |
| Increase (Decrease) in Net Assets from | | |
| Beneficial Interest Transactions | 304,526 | 13,598 |
| Total Increase (Decrease) in Net Assets | 463,371 | (441,692) |
| Net Assets ($): | | |
| Beginning of Period | 1,139,278 | 1,580,970 |
| End of Period | 1,602,649 | 1,139,278 |
| Undistributed investment income—net | 2,305 | 2,401 |
16
| | |
| | | Year Ended May 31, |
| | 2010 | 2009a |
| Capital Share Transactions: | | |
| Class Ab | | |
| Shares sold | 19,904 | 16,231 |
| Shares issued for dividends reinvested | 1,550 | 1,724 |
| Shares redeemed | (7,495) | (13,571) |
| Net Increase (Decrease) in Shares Outstanding | 13,959 | 4,384 |
| Class C | | |
| Shares sold | 47,408 | 7,486 |
| Shares issued for dividends reinvested | 124 | 118 |
| Shares redeemed | (34,128) | (3,223) |
| Net Increase (Decrease) in Shares Outstanding | 13,404 | 4,381 |
| Class I | | |
| Shares sold | 1,755 | — |
| Shares issued for dividends reinvested | 122 | 117 |
| Shares redeemed | (1) | — |
| Net Increase (Decrease) in Shares Outstanding | 1,876 | 117 |
| Class Tb | | |
| Shares sold | — | 634 |
| Shares issued for dividends reinvested | — | 84 |
| Shares redeemed | — | (6,276) |
| Net Increase (Decrease) in Shares Outstanding | — | (5,558) |
|
| a Effective as of the close of business on February 4, 2009, the fund no longer offers Class T shares. |
| b On the close of business on February 4, 2009, 6,276 Class T shares representing $53,719 were converted to 6,268 |
| Class A shares. |
See notes to financial statements.
FINANCIAL HIGHLIGHTS
The following tables describe the performance for each share class for the fiscal periods indicated.All information (except portfolio turnover rate) reflects financial results for a single fund share.Total return shows how much your investment in the fund would have increased (or decreased) during each period, assuming you had reinvested all dividends and distributions.These figures have been derived from the fund’s financial statements.
| | | | |
| | | Year Ended May 31, | |
| Class A Shares | 2010 | 2009 | 2008 | 2007a |
| Per Share Data ($): | | | | |
| Net asset value, beginning of period | 9.24 | 13.17 | 15.00 | 12.50 |
| Investment Operations: | | | | |
| Investment income—netb | .16 | .19 | .19 | .16 |
| Net realized and unrealized | | | | |
| gain (loss) on investments | 1.27 | (3.93) | (1.63) | 2.56 |
| Total from Investment Operations | 1.43 | (3.74) | (1.44) | 2.72 |
| Distributions: | | | | |
| Dividends from investment income—net | (.15) | (.19) | (.18) | (.15) |
| Dividends from net realized | | | | |
| gain on investments | — | — | (.21) | (.07) |
| Total Distributions | (.15) | (.19) | (.39) | (.22) |
| Net asset value, end of period | 10.52 | 9.24 | 13.17 | 15.00 |
| Total Return (%)c | 15.55 | (28.60) | (9.59) | 21.89d |
| Ratios/Supplemental Data (%): | | | | |
| Ratio of total expenses to average net assets | 9.40 | 11.74 | 8.79 | 10.66d |
| Ratio of net expenses to average net assets | 1.50 | 1.50 | 1.50 | 1.36d |
| Ratio of net investment income | | | | |
| to average net assets | 1.49 | 1.95 | 1.38 | 1.18d |
| Portfolio Turnover Rate | 76.05 | 29.06 | 14.52 | 28.54d |
| Net Assets, end of period ($ x 1,000) | 1,236 | 957 | 1,307 | 1,304 |
| |
| a | From July 5, 2006 (commencement of operations) to May 31, 2007. |
| b | Based on average shares outstanding at each month end. |
| c | Exclusive of sales charge. |
| d | Not annualized. |
See notes to financial statements.
18
| | | | |
| | | Year Ended May 31, | |
| Class C Shares | 2010 | 2009 | 2008 | 2007a |
| Per Share Data ($): | | | | |
| Net asset value, beginning of period | 9.18 | 13.12 | 14.96 | 12.50 |
| Investment Operations: | | | | |
| Investment income—netb | .09 | .11 | .09 | .06 |
| Net realized and unrealized | | | | |
| gain (loss) on investments | 1.26 | (3.92) | (1.62) | 2.56 |
| Total from Investment Operations | 1.35 | (3.81) | (1.53) | 2.62 |
| Distributions: | | | | |
| Dividends from investment income—net | (.10) | (.13) | (.10) | (.09) |
| Dividends from net realized | | | | |
| gain on investments | — | — | (.21) | (.07) |
| Total Distributions | (.10) | (.13) | (.31) | (.16) |
| Net asset value, end of period | 10.43 | 9.18 | 13.12 | 14.96 |
| Total Return (%)c | 14.57 | (29.07) | (10.28) | 21.06d |
| Ratios/Supplemental Data (%): | | | | |
| Ratio of total expenses to average net assets | 10.13 | 13.47 | 9.82 | 11.39d |
| Ratio of net expenses to average net assets | 2.25 | 2.25 | 2.25 | 2.04d |
| Ratio of net investment income | | | | |
| to average net assets | .78 | 1.21 | .66 | .47d |
| Portfolio Turnover Rate | 76.05 | 29.06 | 14.52 | 28.54d |
| Net Assets, end of period ($ x 1,000) | 286 | 129 | 127 | 121 |
| |
| a | From July 5, 2006 (commencement of operations) to May 31, 2007. |
| b | Based on average shares outstanding at each month end. |
| c | Exclusive of sales charge. |
| d | Not annualized. |
See notes to financial statements.
FINANCIAL HIGHLIGHTS (continued)
| | | | |
| | | Year Ended May 31, | |
| Class I Shares | 2010 | 2009 | 2008a | 2007b |
| Per Share Data ($): | | | | |
| Net asset value, beginning of period | 9.25 | 13.19 | 15.01 | 12.50 |
| Investment Operations: | | | | |
| Investment income—netc | .18 | .22 | .22 | .19 |
| Net realized and unrealized | | | | |
| gain (loss) on investments | 1.28 | (3.95) | (1.62) | 2.56 |
| Total from Investment Operations | 1.46 | (3.73) | (1.40) | 2.75 |
| Distributions: | | | | |
| Dividends from investment income—net | (.17) | (.21) | (.21) | (.17) |
| Dividends from net realized | | | | |
| gain on investments | — | — | (.21) | (.07) |
| Total Distributions | (.17) | (.21) | (.42) | (.24) |
| Net asset value, end of period | 10.54 | 9.25 | 13.19 | 15.01 |
| Total Return (%) | 15.73 | (28.35) | (9.40) | 22.17d |
| Ratios/Supplemental Data (%):d | | | | |
| Ratio of total expenses to average net assets | 9.28 | 11.55 | 8.78 | 10.63d |
| Ratio of net expenses to average net assets | 1.25 | 1.25 | 1.25 | 1.13d |
| Ratio of net investment income | | | | |
| to average net assets | 1.72 | 2.19 | 1.63 | 1.44d |
| Portfolio Turnover Rate | 76.05 | 29.06 | 14.52 | 28.54d |
| Net Assets, end of period ($ x 1,000) | 81 | 53 | 75 | 82 |
| |
| a | Effective June 1, 2007, Class R shares were redesignated as Class I shares. |
| b | From July 5, 2006 (commencement of operations) to May 31, 2007. |
| c | Based on average shares outstanding at each month end. |
| d | Not annualized. |
See notes to financial statements.
20
NOTES TO FINANCIAL STATEMENTS
NOTE 1—Significant Accounting Policies:
Dreyfus Equity Income Fund (the “fund”) is a separate diversified series of The Dreyfus/Laurel Funds Trust (the “Trust”), which is registered under the Investment Company Act of 1940, as amended (the “Act”), as an open-end management investment company and operates as a series company currently offering seven series, including the fund.The fund’s investment objective seeks total return (consisting of capital appreciation and income).The Dreyfus Corporation (the “Manager” or “Dreyfus”), a wholly-owned subsidiary of The Bank of New York Mellon Corporation (“BNY Mellon”), serves as the fund’s investment adviser.
MBSC Securities Corporation (the “Distributor”), a wholly-owned subsidiary of the Manager, is the distributor of the fund’s shares. The fund is authorized to issue an unlimited number of shares of Beneficial Interest in each of the following classes of shares: Class A, Class C and Class I. Class A and Class C shares are sold primarily to retail investors through financial intermediaries and bear a distribution fee and/or service fee. Class A shares are sold with a front-end sales charge, while Class C shares are subject to a contingent deferred sales charge (“CDSC”). Class I shares are sold primarily to bank trust departments and other financial service providers (including The Bank of NewYork Mellon, a subsidiary of BNY Mellon and an affiliate of Dreyfus) acting on behalf of customers having a qualified trust or an investment account or relationship at such institution and bear no distribution or servi ce fees. Class I shares are offered without a front-end sales charge or CDSC. Each class of shares has identical rights and privileges, except with respect to distribution and service fees and voting rights on matters affecting a single class. Income, expenses (other than expenses attributable to a specific class), and realized and unrealized gains or losses on investments are allocated to each class of shares based on its relative net assets.
As of May 31, 2010, MBC Investments Corp., an indirect subsidiary of BNY Mellon, held 77,753 Class A, 4,231 Class C and 4,354 Class I shares of the fund.
NOTES TO FINANCIAL STATEMENTS (continued)
The Financial Accounting Standards Board (“FASB”) Accounting Standards Codification (“ASC”) has become the exclusive reference of authoritative U.S. generally accepted accounting principles (“GAAP”) recognized by the FASB to be applied by nongovernmental entities. Rules and interpretive releases of the Securities and Exchange Commission (“SEC”) under authority of federal laws are also sources of authoritative GAAP for SEC registrants. The ASC has superseded all existing non-SEC accounting and reporting standards. The fund’s financial statements are prepared in accordance with GAAP, which may require the use of management estimates and assumptions.Actual results could differ from those estimates.
(a) Portfolio valuation: Investments in securities are valued at the last sales price on the securities exchange or national securities market on which such securities are primarily traded. Securities listed on the National Market System for which market quotations are available are valued at the official closing price or, if there is no official closing price that day, at the last sales price. Securities not listed on an exchange or the national securities market, or securities for which there were no transactions, are valued at the average of the most recent bid and asked prices, except for open short positions, where the asked price is used for valuation purposes. Bid price is used when no asked price is available. Registered investment companies that are not traded on an exchange are valued at their net asset value. When market quotations or offici al closing prices are not readily available, or are determined not to reflect accurately fair value, such as when the value of a security has been significantly affected by events after the close of the exchange or market on which the security is principally traded (for example, a foreign exchange or market),but before the fund calculates its net asset value,the fund may value these investments at fair value as determined in accordance with the procedures approved by the Board of Trustees. Fair valuing of securities may be determined with the assistance of a pricing service using calculations based on indices of domestic securities and other appropriate indicators, such as prices of relevant ADRs and futures
22
contracts. For other securities that are fair valued by the Board of Trustees, certain factors may be considered such as: fundamental analytical data, the nature and duration of restrictions on disposition, an evaluation of the forces that influence the market in which the securities are purchased and sold and public trading in similar securities of the issuer or comparable issuers. Financial futures are valued at the last sales price.
The fair value of a financial instrument is the amount that would be received to sell an asset or paid to transfer a liability in an orderly transaction between market participants at the measurement date (i.e. the exit price). GAAP establishes a fair value hierarchy that prioritizes the inputs of valuation techniques used to measure fair value.This hierarchy gives the highest priority to unadjusted quoted prices in active markets for identical assets or liabilities (Level 1 measurements) and the lowest priority to unobservable inputs (Level 3 measurements).
Additionally, GAAP provides guidance on determining whether the volume and activity in a market has decreased significantly and whether such a decrease in activity results in transactions that are not orderly. GAAP requires enhanced disclosures around valuation inputs and techniques used during annual and interim periods.
Various inputs are used in determining the value of the fund’s investments relating to fair value measurements.These inputs are summarized in the three broad levels listed below:
Level 1—unadjusted quoted prices in active markets for
identical investments.
Level 2—other significant observable inputs (including quoted
prices for similar investments, interest rates, prepayment speeds,
credit risk, etc.).
Level 3—significant unobservable inputs (including the fund’s own
assumptions in determining the fair value of investments).
The inputs or methodology used for valuing securities are not necessarily an indication of the risk associated with investing in those securities.
NOTES TO FINANCIAL STATEMENTS (continued)
The following is a summary of the inputs used as of May 31, 2010 in valuing the fund’s investments:
| | | | |
| | | Level 2—Other | Level 3— | |
| | Level 1— | Significant | Significant | |
| | Unadjusted | Observable | Unobservable | |
| | Quoted Prices | Inputs | Inputs | Total |
| Assets ($) | | | | |
| Investments in Securities: | | | |
| Equity Securities— | | | | |
| Domestic† | 1,509,897 | — | — | 1,509,897 |
| Equity Securities— | | | | |
| Foreign† | 90,040 | — | — | 90,040 |
| Mutual Funds | 42,055 | — | — | 42,055 |
| † See Statement of Investments for industry classification. | | |
In January 2010, FASB issued Accounting Standards Update (“ASU”) No. 2010-06 “Improving Disclosures about Fair Value Measurements”. ASU 2010-06 will require reporting entities to make new disclosures about amounts and reasons for significant transfers in and out of Level 1 and Level 2 fair value measurements as well as inputs and valuation techniques used to measure fair value for both recurring and nonrecurring fair value measurements that fall in either Level 2 or Level 3, and information on purchases, sales, issuances and settlements on a gross basis in the reconciliation of activity in Level 3 fair value measurements. The new and revised disclosures are required to be implemented for fiscal years beginning after December 15, 2009 except for the disclosures surrounding purchases,sales,issuances and settlements on a gross basis in the reconciliation of Level 3 fair value measurements, which are effective f or fiscal years beginning after December 15, 2010. Management is currently evaluating the impact the adoption of ASU No. 2010-06 may have on the fund’s financial statement disclosures.
(b) Securities transactions and investment income: Securities transactions are recorded on a trade date basis. Realized gains and losses from securities transactions are recorded on the identified cost basis. Dividend income is recognized on the ex-dividend date and interest income, including, where applicable, accretion of discount and amortization of premium on investments, is recognized on the accrual basis.
24
The fund has arrangements with the custodian and cash management bank whereby the fund may receive earnings credits when positive cash balances are maintained, which are used to offset custody and cash management fees. For financial reporting purposes, the fund includes net earnings credits as an expense offset in the Statement of Operations.
Pursuant to a securities lending agreement with The Bank of New York Mellon, a subsidiary of BNY Mellon and an affiliate of Dreyfus, the fund may lend securities to qualified institutions. It is the fund’s policy that, at origination, all loans are secured by collateral of at least 102% of the value of U.S. securities loaned and 105% of the value of foreign securities loaned. Collateral equivalent to at least 100% of the market value of securities on loan is maintained at all times. Collateral is either in the form of cash, which can be invested in certain money market mutual funds managed by the Manager, U.S. Government and Agency securities or letters of credit.The fund is entitled to receive all income on securities loaned, in addition to income earned as a result of the lending transaction. Although each security loaned is fully collateralized, the fund bears the risk of delay in recovery of, or loss of rights in, the securities loaned should a borrower fail to return the securities in a timely manner. During the period ended May 31, 2010, The Bank of New York Mellon earned $61 from lending portfolio securities, pursuant to the securities lending agreement.
(c) Affiliated issuers: Investments in other investment companies advised by the Manager are defined as “affiliated” in the Act.
The fund may invest in shares of certain affiliated investment companies also advised or managed by Dreyfus. Investments in affiliated investment companies for the period ended May 31, 2010 were as follows:
| | | | | |
| Affiliated | | | | | |
| Investment | Value | | | Value | Net |
| Company | 5/31/2009 ($) | Purchases ($) | Sales ($) | 5/31/2010 ($) | Assets (%) |
| Dreyfus | | | | | |
| Institutional | | | | | |
| Cash | | | | | |
| Advantage | | | | | |
| Fund | — | 356,269 | 314,214 | 42,055 | 2.6 |
NOTES TO FINANCIAL STATEMENTS (continued)
(d) Dividends to shareholders: Dividends are recorded on the ex dividend date. Dividends from investment income-net are declared and paid monthly. Dividends from net realized capital gains, if any, are normally declared and paid annually, but the fund may make distributions on a more frequent basis to comply with the distribution requirements of the Internal Revenue Code of 1986, as amended (the “Code”).To the extent that net realized capital gains can be offset by capital loss carryovers, it is the policy of the fund not to distribute such gains. Income and capital gain distributions are determined in accordance with income tax regulations, which may differ from GAAP.
(e) Federal income taxes: It is the policy of the fund to continue to qualify as a regulated investment company, if such qualification is in the best interests of its shareholders, by complying with the applicable provisions of the Code, and to make distributions of taxable income sufficient to relieve it from substantially all federal income and excise taxes.
As of and during the period ended May 31, 2010, the fund did not have any liabilities for any uncertain tax positions.The fund recognizes interest and penalties, if any, related to uncertain tax positions as income tax expense in the Statement of Operations. During the period, the fund did not incur any interest or penalties.
Each of the tax years in the four-year period ended May 31, 2010 remains subject to examination by the Internal Revenue Service and state taxing authorities.
At May 31,2010,the components of accumulated earnings on a tax basis were as follows: undistributed ordinary income $2,305, accumulated capital losses $149,514 and unrealized depreciation $111,803. In addition, the fund had $16,974 of capital losses realized after October 31, 2009, which were deferred for tax purposes to the first day of the following fiscal year.
The accumulated capital loss carryover is available for federal income tax purposes to be applied against future net securities profits, if any, realized subsequent to May 31, 2010. If not applied, $121,261 of the carryover expires in fiscal 2017 and $28,253 expires in fiscal 2018.
26
The tax character of distributions paid to shareholders during the fiscal periods ended May 31, 2010 and May 31, 2009 were as follows: ordinary income $19,760 and $21,694, respectively.
During the period ended May 31, 2010, as a result of permanent book to tax differences, primarily due to the tax treatment for real estate investment trusts and foreign currency gains and losses, the fund decreased accumulated undistributed investment income-net by $713 and increased accumulated net realized gain (loss) on investments by the same amount. Net assets and net asset value per share were not affected by this reclassification.
NOTE 2—Bank Lines of Credit:
The fund participates with other Dreyfus-managed funds in a $225 million unsecured credit facility led by Citibank, N.A. and a $300 million unsecured credit facility provided by The Bank of New York Mellon, a subsidiary of BNY Mellon and an affiliate of Dreyfus, (each, a “Facility”), each to be utilized primarily for temporary or emergency purposes, including the financing of redemptions. In connection therewith, the fund has agreed to pay its pro rata portion of commitment fees for each Facility. Interest is charged to the fund based on rates determined pursuant to the terms of the respective Facility at the time of borrowing. During the period ended May 31, 2010, the fund did not borrow under the Facilities.
NOTE 3—Management Fee and Other Transactions With Affiliates:
(a) Pursuant to a management agreement (“Agreement”) with the Manager, the management fee is computed at the annual rate of .75% of the value of the fund’s average daily net assets and is payable monthly.The Manager has contractually agreed to waive receipt of its fees and/or assume the expenses of the fund, until October 1, 2010, so that annual fund operating expenses (excluding Rule 12b-1 fees, shareholder services fees, taxes, brokerage commissions, commitment fees on borrowings and extraordinary expenses) do not exceed 1.25%
NOTES TO FINANCIAL STATEMENTS (continued)
of the value of the fund’s average daily net assets. The expense reimbursement, pursuant to the undertaking, amounted to $116,585 during the period ended May 31, 2010.
(b) Prior to January 1, 2010, each Board member received $45,000 per year, plus $6,000 for each joint Board meeting of the Trust, The Dreyfus/Laurel Funds, Inc., The Dreyfus/Laurel Tax-Free Municipal Funds, Dreyfus Investment Funds and Dreyfus Funds, Inc. (collectively, the “Board Group Open-end Funds”) attended, $2,000 for separate in-person committee meetings attended which were not held in conjunction with a regularly scheduled Board meeting and $1,500 for Board meetings and separate committee meetings attended that were conducted by telephone. Effective January 1, 2010, the Board Group Open-end Funds pay each Board member who is not an “interested person” of the Trust (as defined in the Act) $60,000 per annum, plus $7,000 per joint Board Group Open-end Funds Board meeting attended, $2,500 for separate in-person committee meeting s attended which are not held in conjunction with a regularly scheduled Board meeting and $2,000 for Board meetings and separate committee meetings attended that are conducted by telephone. The Board Group Open-end Funds also reimburse each Board member who is not an “interested person” of the Trust (as defined in the Act) for travel and out-of-pocket expenses.With respect to Board meetings, the Chairman of the Board receives an additional 25% of such compensation (with the exception of reimbursable amounts).With respect to compensation committee meetings prior to January 1, 2010, the Chair of the compensation committee received $900 per compensation committee meeting, and, effective January 1, 2010, the Chair of each of the Board’s committees, unless the Chair also serves as Chair of the Board, receives $1,350 per applicable committee meeting. In the event that there is an in-person joint committee meeting or a joint telephone meeting of the Board Group Open-end Funds and Dreyfus High Yield S trategies Fund, the $2,000 or $1,500 fee (prior to January 1, 2010) or the $2,500 or $2,000 fee (effective January 1, 2010), as applicable, is allocated between the Board Group Open-end Funds and Dreyfus High Yield
28
Strategies Fund. The Trust’s portion of these fees and expenses are charged and allocated to each series based on net assets. Amounts required to be paid by the Trust directly to the non-interested Trustees, that would be applied to offset a portion of the management fee payable by certain other series of the Trust to the Manager, are in fact paid directly by the Manager to the non-interested Trustees.
(c) Under the Distribution Plan (the “Plan”) adopted pursuant to Rule 12b-1 under the Act, Class C shares pay the Distributor for distributing their shares at an annual rate of .75% of the value of the average daily net assets of Class C shares. During the period ended May 31, 2010, Class C shares were charged $1,850, pursuant to the Plan.
During the period ended May 31, 2010, the Distributor retained $120 from commissions earned on sales of the fund’s Class A shares and $19 from CDSCs on redemptions of the fund’s Class C Shares.
(d) Under the Shareholder Services Plan, Class A and Class C shares pay the Distributor at an annual rate of .25% of the value of their average daily net assets for the provision of certain services. The services provided may include personal services relating to shareholder accounts, such as answering shareholder inquiries regarding Class A and Class C shares and providing reports and other information, and services related to the maintenance of shareholder accounts.The Distributor may make payments to Service Agents (a securities dealer, financial institution or other industry professional) in respect of these services.The Distributor determines the amounts to be paid to Service Agents. During the period ended May 31, 2010, Class A and Class C shares were charged $2,874 and $617, pursuant to the Shareholder Services Plan.
Under its terms, the Plan and Shareholder Services Plan shall remain in effect from year to year, provided such continuance is approved annually by a vote of a majority of those Trustees who are not “interested persons” of the Trust and who had no direct or indirect financial interest in the operation of or in any agreement related to the Plan or Shareholder Services Plan.
NOTES TO FINANCIAL STATEMENTS (continued)
The fund compensates Dreyfus Transfer, Inc., a wholly-owned subsidiary of the Manager, under a transfer agency agreement for providing personnel and facilities to perform transfer agency services for the fund. During the period ended May 31, 2010, the fund was charged $1,959 pursuant to the transfer agency agreement, which is included in Shareholder servicing costs in the Statement of Operations.
The fund compensates The Bank of New York Mellon under cash management agreements for performing cash management services related to fund subscriptions and redemptions. During the period ended May 31, 2010, the fund was charged $324 pursuant to the cash management agreements, which is included in Shareholder servicing costs in the Statement of Operations. These fees were partially offset by earnings credits of $3.
The fund also compensates The Bank of New York Mellon under a custody agreement for providing custodial services for the fund. During the period ended May 31, 2010, the fund was charged $5,475 pursuant to the custody agreement.
During the period ended May 31, 2010, the fund was charged $5,436 for services performed by the Chief Compliance Officer.
The components of “Due from The Dreyfus Corporation and affiliates” in the Statement of Assets and Liabilities consist of: management fees $1,041,Rule 12b-1 distribution plan fees $187,shareholder services plan fees $329, custodian fees $4,213, chief compliance officer fees $3,656 and transfer agency per account fees $420, which are offset against an expense reimbursement currently in effect in the amount of $7,770.
30
NOTE 4—Securities Transactions:
The aggregate amount of purchases and sales of investment securities, excluding short-term securities during the period ended May 31, 2010, amounted to $1,410,910 and 1,083,256, respectively.
The provisions of ASC Topic 815 “Derivatives and Hedging” require qualitative disclosures about objectives and strategies for using derivatives, quantitative disclosures about fair value amounts of gains and losses on derivative instruments and disclosures about credit-risk-related contingent features in derivative agreements.The fund held no derivatives during the period ended May 31, 2010. These disclosures did not impact the notes to the financial statements.
At May 31,2010,the cost of investments for federal income tax purposes was $1,753,834; accordingly, accumulated net unrealized depreciation on investments was $111,842, consisting of $69,425 gross unrealized appreciation and $181,267 gross unrealized depreciation.
|
| REPORT OF INDEPENDENT REGISTERED |
| PUBLIC ACCOUNTING FIRM |
The Board of Trustees and Shareholders of
The Dreyfus/Laurel Funds Trust
We have audited the accompanying statement of assets and liabilities of Dreyfus Equity Income Fund (the “Fund”), a series of The Dreyfus/Laurel Funds Trust, including the statement of investments as of May 31, 2010, and the related statement of operations for the year then ended, the statement of changes in net assets for each of the years in the two-year period then ended and the financial highlights for each of the years in the three-year period then ended and for the period from July 5, 2006 (commencement of operations) to May 31, 2007.These financial statements and financial highlights are the responsibility of the Fund’s management. Our responsibility is to express an opinion on these financial statements and financial highlights based on our audits.
We conducted our audits in accordance with the standards of the Public Company Accounting Oversight Board (United States).Those standards require that we plan and perform the audit to obtain reasonable assurance about whether the financial statements and financial highlights are free of material misstatement. An audit includes examining, on a test basis, evidence supporting the amounts and disclosures in the financial statements. Our procedures included confirmation of securities owned as of May 31, 2010, by correspondence with the custodian and brokers or by other appropriate auditing procedures where replies from brokers were not received.An audit also includes assessing the accounting principles used and significant estimates made by management, as well as evaluating the overall financial statement presentation.We believe that our audits provide a reasonable basis for our opinion.
In our opinion, the financial statements and financial highlights referred to above present fairly, in all material respects, the financial position of Dreyfus Equity Income Fund, as of May 31, 2010, and the results of its operations for the year then ended, the changes in its net assets for each of the years in the two-year period then ended and the financial highlights for each of the years in the three-year period then ended and for the period from July 5, 2006 (commencement of operations) to May 31, 2007, in conformity with U.S. generally accepted accounting principles.

New York, New York
July 27, 2010
32
IMPORTANT TAX INFORMATION (Unaudited)
For federal tax purposes the fund designates the maximum amount allowable but not less than 100% of ordinary income dividends paid during the fiscal year ended May 31, 2010 as eligible for the corporate dividends received deduction provided under Section 243 of the Internal Revenue Code in accordance with Section 854(b)(1)(A) of the Internal Revenue Code.Also, the fund designates the maximum amount allowable but not less than $11,451 as ordinary income dividends paid during the fiscal year ended May 31, 2010 as qualified dividend income in accordance with Section 854(b)(1)(B) of the Internal Revenue Code. Shareholders will receive notification in early 2011 of the percentage applicable to the preparation of their 2010 income tax returns.
|
| INFORMATION ABOUT THE REVIEW AND APPROVAL |
| OF THE FUND’S MANAGEMENT AGREEMENT (Unaudited) |
At a meeting of the fund’s Board of Trustees held on February 9, 2010, the Board considered the re-approval of the fund’s Management Agreement (“Management Agreement”), pursuant to which the Manager provides the fund with investment advisory and administrative services.The Board members, none of whom are “interested persons” (as defined in the Investment Company Act of 1940, as amended) of the fund, were assisted in their review by independent legal counsel and met with counsel in executive session separate from representatives of the Manager.
Analysis of Nature, Extent and Quality of Services Provided to the Fund. The Board members considered information previously provided to them in a presentation from representatives of the Manager regarding services provided to the fund and other funds in the Dreyfus fund complex, and representatives of the Manager confirmed that there had been no material changes in this information. The Board also discussed the nature, extent and quality of the services provided to the fund pursuant to its Management Agreement.The Manager’s representatives reviewed the fund’s distribution of accounts and the relationships the Manager has with various intermediaries and the different needs of each. The Manager’s representatives noted the distribution channels for the fund, as well as the diversity of distribution among the funds in the Dreyfus fund complex, and t he Manager’s corresponding need for broad, deep, and diverse resources to be able to provide ongoing shareholder services to each distribution channel, including those of the fund. The Manager provided the number of shareholder accounts in the fund, as well as the fund’s asset size.
The Board members also considered the Manager’s research and portfolio management capabilities and that the Manager also provides oversight of day-to-day fund operations, including fund accounting and administration and assistance in meeting legal and regulatory requirements. The Board members also considered the Manager’s extensive administrative, accounting and compliance infrastructure.
34
The Board also considered the Manager’s brokerage policies and practices, the standards applied in seeking best execution and the Manager’s policies and practices regarding soft dollars.
Comparative Analysis of the Fund’s Performance and Management Fee and Expense Ratio. The Board members reviewed the fund’s performance and comparisons to a group of retail front-end load equity income funds (the “Performance Group”) and to a larger universe of funds, consisting of all retail and institutional equity income funds (the “Performance Universe”) selected and provided by Lipper, Inc., an independent provider of investment company data.The Board was provided with a description of the methodology Lipper used to select the Performance Group and Performance Universe, as well as the Expense Group and Expense Universe (discussed below). The Board members discussed the results of the comparisons and noted that the fund’s total return performance was at or above the Performance Group median for the one-, two- and three-year periods ended December 31, 2009, above the Performance Universe median for the two-year period ended December 31, 2009 and below the Performance Universe median for the one- and three-year periods ended December 31, 2009. The Manager also provided a comparison of the fund’s calendar year total returns to the returns of the fund’s benchmark index.
The Board members also discussed the fund’s contractual and actual management fees and expense ratio and reviewed the range of management fees and expense ratios of a comparable group of funds (the “Expense Group”) and a broader group of funds (the “Expense Universe”), each selected and provided by Lipper. A representative of the Manager noted that the Manager has contractually agreed to waive receipt of its fees and/or assume the expenses of the fund, until October 1, 2010, so that the annual direct fund operating expenses (excluding Rule 12b-1 fees, shareholder services fees, taxes, brokerage commissions, commitment fees on borrowing and extraordinary expenses) do
|
| INFORMATION ABOUT THE REVIEW AND APPROVAL OF THE |
| FUND’S MANAGEMENT AGREEMENT (Unaudited) (continued) |
not exceed 1.25% of the fund’s average daily net assets. The Board members noted that the fund’s contractual management fee was below the Expense Group median and that, taking into account the waiver, the fund did not pay a management fee for the fiscal year ended May 31, 2009.The Board members also noted that the fund’s expense ratio was above the Expense Group and Expense Universe medians.
Representatives of the Manager reviewed with the Board members the fees paid to the Manager or its affiliates by the only mutual fund managed by the Manager or its affiliates with similar investment objectives, policies and strategies, and included in the same Lipper category as the fund (the “Similar Fund”).They also noted that there were no other accounts managed by the Manager or its affiliates with similar investment objectives, policies and strategies as the fund. The Board analyzed differences in fees paid to the Manager and discussed the relationship of the fees paid in light of the services provided.The Board members considered the relevance of the fee information provided for the Similar Fund to evaluate the appropriateness and reasonableness of the fund’s management fee.
Analysis of Profitability and Economies of Scale.The Manager’s representatives reviewed the dollar amount of expenses allocated and profit received by the Manager and the method used to determine such expenses and profit. The Board previously had been provided with information prepared by an independent consulting firm regarding the Manager’s approach to allocating costs to, and determining the profitability of, individual funds and the entire Dreyfus mutual fund complex.The Board also was informed that the methodology had also been reviewed by an independent registered public accounting firm which,like the con-sultant,found the methodology to be reasonable.The consulting firm also analyzed where any economies of scale might emerge in connection with the management of the fund. The Board members evaluated the profitability analysis in light of the rel evant circumstances for the fund.
36
The Board members also considered potential benefits to the Manager from acting as investment adviser and noted that there were no soft dollar arrangements with respect to trading the fund’s portfolio.
It was noted that the Board members should consider the Manager’s profitability with respect to the fund as part of their evaluation of whether the fees under the Management Agreement bear a reasonable relationship to the mix of services provided by the Manager, including the nature, extent and quality of such services and that a discussion of economies of scale is predicated on increasing assets and that, if a fund’s assets had been decreasing, the possibility that the Manager may have realized any economies of scale would be less. It also was noted that the profitability percentage for managing the fund was within the range determined by appropriate court cases to be reasonable given the services rendered and generally superior service levels provided by the Manager.The Board also noted the fee waiver arrangement and its effect on the profitability of the Manager.
At the conclusion of these discussions, the Board agreed that it had been furnished with sufficient information to make an informed business decision with respect to continuation of the fund’s Management Agreement. Based on the discussions and considerations as described above, the Board made the following conclusions and determinations:
The Board concluded that the nature, extent and quality of the ser- vices provided by the Manager are adequate and appropriate.
The Board was generally satisfied with the fund’s relative performance.
The Board concluded, taking into account the fee waiver, that the fee paid by the fund to the Manager was reasonable in light of the services provided, comparative performance, expense and manage- ment fee information, costs of the services provided and profits to be realized and benefits derived or to be derived by the Manager from its relationship with the fund.
|
| INFORMATION ABOUT THE REVIEW AND APPROVAL OF THE |
| FUND’S MANAGEMENT AGREEMENT (Unaudited) (continued) |
The Board determined that the economies of scale which may accrue to the Manager and its affiliates in connection with the man- agement of the fund had been adequately considered by the Manager in connection with the management fee rate charged to the fund and that, to the extent in the future it were determined that material economies of scale had not been shared with the fund, the Board would seek to have those economies of scale shared with the fund.
The Board members considered these conclusions and determinations, along with information received on a routine and regular basis throughout the year, and, without any one factor being dispositive, the Board determined that re-approval of the fund’s Management Agreement was in the best interests of the fund and its shareholders.
38
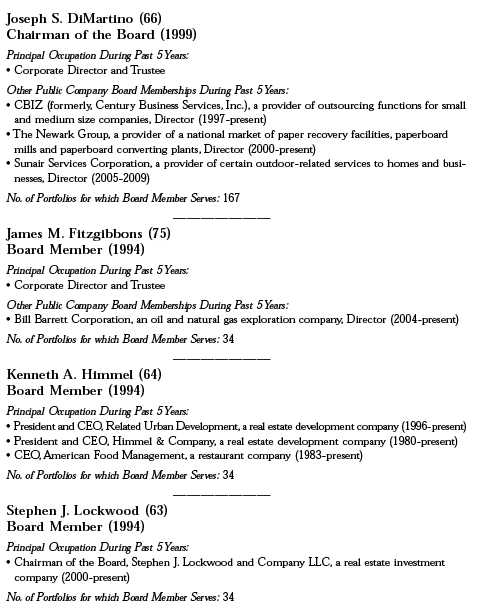
BOARD MEMBERS INFORMATION (Unaudited)
BOARD MEMBERS INFORMATION (Unaudited) (continued)

Once elected all Board Members serve for an indefinite term, but achieve Emeritus status upon reaching age 80.The address of the Board Members and Officers is in c/o The Dreyfus Corporation, 200 Park Avenue, NewYork, NewYork 10166. Additional information about the Board Members is available in the fund’s Statement of Additional Information which can be obtained from Dreyfus free of charge by calling this toll free number: 1-800-554-4611.
40
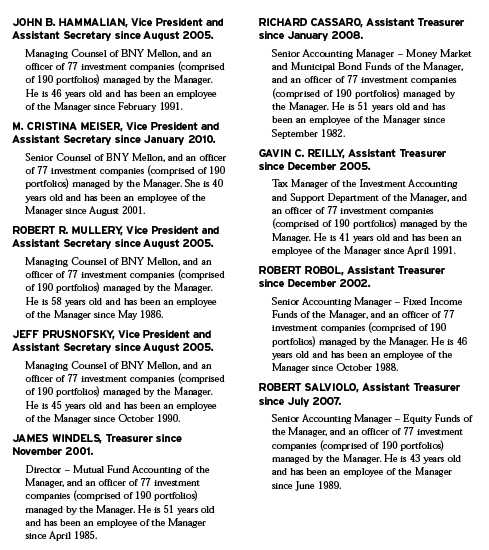
OFFICERS OF THE FUND (Unaudited)

OFFICERS OF THE FUND (Unaudited) (continued)
42

For More Information

Telephone Call your financial representative or 1-800-554-4611
Mail The Dreyfus Family of Funds, 144 Glenn Curtiss Boulevard, Uniondale, NY 11556-0144
The fund files its complete schedule of portfolio holdings with the Securities and Exchange Commission (“SEC”) for the first and third quarters of each fiscal year on Form N-Q. The fund’s Forms N-Q are available on the SEC’s website at http://www.sec.gov and may be reviewed and copied at the SEC’s Public Reference Room in Washington, DC. Information on the operation of the Public Reference Room may be obtained by calling 1-800-SEC-0330.
A description of the policies and procedures that the fund uses to determine how to vote proxies relating to portfolio securities, and information regarding how the fund voted these proxies for the 12-month period ended June 30 is available at http://www.dreyfus.com and on the SEC’s website at http://www.sec.gov. The description of the policies and procedures is also available without charge, upon request, by calling 1-800-645-6561.

|
| Dreyfus |
| Emerging Markets Debt |
| Local Currency Fund |
ANNUAL REPORT May 31, 2010

Save time. Save paper. View your next shareholder report online as soon as it’s available. Log into www.dreyfus.com and sign up for Dreyfus eCommunications. It’s simple and only takes a few minutes.
The views expressed in this report reflect those of the portfolio manager only through the end of the period covered and do not necessarily represent the views of Dreyfus or any other person in the Dreyfus organization. Any such views are subject to change at any time based upon market or other conditions and Dreyfus disclaims any responsibility to update such views.These views may not be relied on as investment advice and, because investment decisions for a Dreyfus fund are based on numerous factors, may not be relied on as an indication of trading intent on behalf of any Dreyfus fund.

| | Contents |
| | THE FUND |
| 2 | A Letter from the Chairman and CEO |
| 3 | Discussion of Fund Performance |
| 6 | Fund Performance |
| 8 | Understanding Your Fund’s Expenses |
| 8 | Comparing Your Fund’s Expenses With Those of Other Funds |
| 9 | Statement of Investments |
| 13 | Statement of Assets and Liabilities |
| 14 | Statement of Operations |
| 15 | Statement of Changes in Net Assets |
| 17 | Financial Highlights |
| 20 | Notes to Financial Statements |
| 38 | Report of Independent Registered Public Accounting Firm |
| 39 | Important Tax Information |
| 40 | Information About the Review and Approval of the Fund’s Management Agreement |
| 45 | Board Members Information |
| 47 | Officers of the Fund |
| | FOR MORE INFORMATION |
| | Back Cover |
Dreyfus
Emerging Markets Debt
Local Currency Fund
The Fund

A LETTER FROM THE CHAIRMAN AND CEO
Dear Shareholder:
We are pleased to present this annual report for Dreyfus Emerging Markets Debt Local Currency Fund, covering the 12-month period from June 1, 2009, through May 31, 2010.
Psychology historically has played an important role in how investors —especially individual investors — perceive the financial markets and make asset allocation decisions. Unlike the purely rational investor who, in an ideal world, would seek investments that potentially can deliver the best risk/return characteristics, the everyday investor typically has been influenced by emotions. Currently, investors’ emotions appear to be deeply divided, with a large number still seeking low risk investments (such as cash instruments), and others favoring higher risk investments (such as smaller-cap and emerging market stocks). Meanwhile, investment classes in the middle of the risk spectrum seemingly have been largely avoided.
It is important to note that investor sentiment often lags the economic cycle.That’s why we continue to stress the importance of a long-term, well balanced asset allocation strategy that can help cushion the volatility produced by the emotional swings of the financial markets. If you have not revisited your investment portfolio recently, we urge you to speak with your financial advisor about taking advantage of long-term market fundamentals rather than remaining susceptible to the effects of emotional reactions to short-term developments.
For information about how the fund performed during the reporting period, as well as general market perspectives, we provide a Discussion of Fund Performance on the pages that follow.
Thank you for your continued confidence and support.

Jonathan R. Baum
Chairman and Chief Executive Officer
The Dreyfus Corporation
June 15, 2010
2

DISCUSSION OF FUND PERFORMANCE
For the period of June 1, 2009, through May 31, 2010, as provided by Alexander Kozhemiakin and Javier Murcio, Primary Portfolio Managers
Fund and Market Performance Overview
For the 12-month period ended May 31, 2010, Dreyfus Emerging Markets Debt Local Currency Fund’s Class A shares produced a total return of 12.56%, Class C shares returned 11.73% and Class I shares returned 12.94%.1 In comparison, the fund’s benchmark, the JPMorgan Government Bond Index — Emerging Markets Diversified (the “Index”), produced a 13.82% total return for the same period.2
After a sustained rally over much of the reporting period, emerging bond and currency markets later encountered heightened volatility when investors grew concerned regarding a number of threats to global economic growth.The fund produced returns that were slightly lower than its benchmark, as the fund’s relatively constructive positioning enabled it to capture currency-related gains over much of the reporting period before encountering bouts of relative weakness in the spring of 2010.
The Fund’s Investment Approach
The fund seeks to maximize total return.To pursue its goal, the fund normally invests at least 80% of its assets in emerging market bonds and other debt instruments denominated in the local currency of issue, and in derivative instruments that provide investment exposure to such securities.
When choosing investments, we employ in-depth fundamental country analysis supported by the discipline of quantitative valuation models. A “top down” analysis of macroeconomics and financial and political variables guides country and currency allocations.We also consider technical market factors and the global risk environment.We seek to identify shifts in country fundamentals and consider the risk-adjusted attractiveness of currency and duration returns for each emerging market country.
DISCUSSION OF FUND PERFORMANCE (continued)
Rally Stalled Amid Economic Concerns
The reporting period began in the midst of a global economic recovery that was especially robust in the emerging markets. As the world was recovering from recession, investors sought opportunities in the riskier segments of the global financial markets, including emerging-markets debt securities. In addition, government stimulus programs in China, India and other developing nations sparked greater demand for industrial commodities, improved manufacturing activity and rising consumer consumption. As a result, stronger capital inflows to developing nations supported their currency exchange rates relative to the U.S. dollar.
However, in early 2010, several developments appeared to threaten the global economic rebound. First, robust economic growth in China seemed to spark local inflationary pressures, and investors grew worried that remedial measures might dampen regional growth. Moreover, a stubbornly high unemployment rate produced economic headwinds in the United States. Finally, Europe was roiled by a sovereign debt crisis when Greece and other peripheral nations found themselves unable to finance heavy debt burdens. Consequently, in the spring, emerging-markets bonds and currencies gave back some of their previous gains.
Eurocentric Currencies Dampened Fund Returns
In this environment, we had positioned the fund for the economic recovery by emphasizing exposure to currencies over debt securities. This allocation strategy helped generate excess returns over the first seven months of the reporting period, including strong results from currencies in Brazil,Turkey and Indonesia.
When market conditions changed in the first quarter of 2010, we responded by adopting a more neutral investment stance compared to the benchmark, reducing the fund’s exposure to currencies and increasing its exposure to bonds. Nonetheless, the currencies of Hungary, the Czech Republic and Poland lost value, dampening the fund’s relative performance.The fund also suffered setbacks as a result of its exposure to the currencies of Argentina and Turkey. The fund achieved better results from its exposure to the currencies of Indonesia, Brazil, Colombia and Malaysia, and emerging bond markets rallied late in the reporting period when expectations of higher interest rates were postponed.
4
However, these positive influences were not enough to fully offset Eurocentric weakness by the reporting period’s end.
A More Neutral Posture
We currently expect that the European debt crisis will have a relatively limited impact on economic growth in other parts of the world, including most emerging markets. Indeed, we anticipate that growth in the emerging markets will remain more robust than in developed markets, suggesting to us that capital flows to emerging markets will increase.
We have identified a number of opportunities among currencies that, in our judgment, recently became undervalued, especially in countries with strong economic fundamentals.We also have found attractive opportunities in the bond markets of countries where inflationary pressures remain negligible. In our view, the fund is well positioned for the continuation of a mild global economic recovery in the months ahead.
June 15, 2010
Bond funds are subject generally to interest rate, credit, liquidity and market risks, to varying degrees, all of which are more fully described in the fund’s prospectus. Generally, all other factors being equal, bond prices are inversely related to interest-rate changes, and rate increases can cause price declines.
Foreign bonds are subject to special risks including exposure to currency fluctuations, changing political and economic conditions, and potentially less liquidity. Investments in foreign currencies are subject to the risk that those currencies will decline in value relative to the U.S. dollar. Foreign currencies are also subject to risks caused by inflation, interest rates, budget deficits and low savings rate, political factors and government control.The fixed income securities of issuers located in emerging markets can be more volatile and less liquid than those of issuers in more mature economies.
The fund may use derivative instruments, such as options, futures and options on futures, forward contracts, swaps (including credit default swaps on corporate bonds and asset-backed securities), options on swaps and other credit derivatives.A small investment in derivatives could have a potentially large impact on the fund’s performance.
| |
| 1 | Total return includes reinvestment of dividends and any capital gains paid, and does not take into |
| | consideration the maximum initial sales charges in the case of Class A shares, or the applicable |
| | contingent deferred sales charges imposed on redemptions in the case of Class C shares. Had these |
| | charges been reflected, returns would have been lower. Past performance is no guarantee of future |
| | results. Share price and investment return fluctuate such that upon redemption, fund shares may be |
| | worth more or less than their original cost. Return figures provided reflect the absorption of certain |
| | fund expenses by The Dreyfus Corporation pursuant to an agreement in effect through October 1, |
| | 2010, at which time it may be extended, modified or terminated. Had these expenses not been |
| | absorbed, the fund’s returns would have been lower. |
| 2 | Source: FactSet — The JPMorgan Government Bond Index — Emerging Markets Diversified |
| | is a comprehensive global local emerging markets index, and consists of regularly traded, liquid |
| | fixed-rate, domestic currency government bonds. The Index does not include fund fees and |
| | expenses to which the fund is subject. Investors cannot invest directly in any index. |
FUND PERFORMANCE

Comparison of change in value of $10,000 investment in Dreyfus Emerging Markets Debt Local Currency Fund Class A shares, Class C shares and Class I shares and the JPMorgan Government Bond Index—Emerging Markets Diversified
|
| † Source: FactSet |
| Past performance is not predictive of future performance. |
| The above graph compares a $10,000 investment made in Class A, Class C and Class I shares of Dreyfus Emerging |
| Markets Debt Local Currency Fund on 9/12/08 (inception date) to a $10,000 investment made in the JPMorgan |
| Government Bond Index—Emerging Markets Diversified (the “Index”) on that date. For comparative purposes, the |
| value of the Index on 8/31/08 is used as the beginning value on 9/12/08. All dividends and capital gain |
| distributions are reinvested. |
| The fund’s performance shown in the line graph above takes into account the maximum initial sales charge on Class A |
| shares and all other applicable fees and expenses on all classes.The Index is a comprehensive global local emerging |
| markets index, and consists of regularly traded, liquid fixed-rate, domestic currency government bonds. Unlike a mutual |
| fund, the Index is not subject to charges, fees and other expenses. Investors cannot invest directly in any index. Further |
| information relating to fund performance, including expense reimbursements, if applicable, is contained in the Financial |
| Highlights section of the prospectus and elsewhere in this report. |
6
| | | |
| Average Annual Total Returns as of 5/31/10 | | | |
| |
| | Inception | | From |
| | Date | 1 Year | Inception |
| Class A shares | | | |
| with maximum sales charge (4.5%) | 9/12/08 | 7.50% | 3.71% |
| without sales charge | 9/12/08 | 12.56% | 6.53% |
| Class C shares | | | |
| with applicable redemption charge † | 9/12/08 | 10.73% | 5.74% |
| without redemption | 9/12/08 | 11.73% | 5.74% |
| Class I shares | 9/12/08 | 12.94% | 6.84% |
| JPMorgan Government Bond Index— | | | |
| Emerging Markets Diversified†† | 8/31/08 | 13.82% | 5.41% |
Past performance is not predictive of future performance.The fund’s performance shown in the graph and table does not reflect the deduction of taxes that a shareholder would pay on fund distributions or the redemption of fund shares.
| |
| † | The maximum contingent deferred sales charge for Class C shares is 1% for shares redeemed within one year of the |
| | date of purchase. |
| †† | The Index date is based on the life of Class A shares. For comparative purposes, the value of the Index as of the |
| | month end 8/31/08 is used as the beginning value on 9/12/08 (the inception date for Class A shares). |
UNDERSTANDING YOUR FUND’S EXPENSES (Unaudited)
As a mutual fund investor, you pay ongoing expenses, such as management fees and other expenses. Using the information below, you can estimate how these expenses affect your investment and compare them with the expenses of other funds.You also may pay one-time transaction expenses, including sales charges (loads) and redemption fees, which are not shown in this section and would have resulted in higher total expenses. For more information, see your fund’s prospectus or talk to your financial adviser.
Review your fund’s expenses
The table below shows the expenses you would have paid on a $1,000 investment in Dreyfus Emerging Markets Debt Local Currency Fund from December 1, 2009 to May 31, 2010. It also shows how much a $1,000 investment would be worth at the close of the period, assuming actual returns and expenses.
Expenses and Value of a $1,000 Investment
assuming actual returns for the six months ended May 31, 2010
| | | |
| | Class A | Class C | Class I |
| Expenses paid per $1,000† | $ 6.38 | $ 10.15 | $ 4.99 |
| Ending value (after expenses) | $999.60 | $996.50 | $1,001.80 |
COMPARING YOUR FUND’S EXPENSES
WITH THOSE OF OTHER FUNDS (Unaudited)
Using the SEC’s method to compare expenses
The Securities and Exchange Commission (SEC) has established guidelines to help investors assess fund expenses. Per these guidelines, the table below shows your fund’s expenses based on a $1,000 investment, assuming a hypothetical 5% annualized return. You can use this information to compare the ongoing expenses (but not transaction expenses or total cost) of investing in the fund with those of other funds.All mutual fund shareholder reports will provide this information to help you make this comparison. Please note that you cannot use this information to estimate your actual ending account balance and expenses paid during the period.
Expenses and Value of a $1,000 Investment
assuming a hypothetical 5% annualized return for the six months ended May 31, 2010
| | | |
| | Class A | Class C | Class I |
| Expenses paid per $1,000† | $ 6.44 | $ 10.25 | $ 5.04 |
| Ending value (after expenses) | $1,018.55 | $1,014.76 | $1,019.95 |
|
| † Expenses are equal to the fund’s annualized expense ratio of 1.28% for Class A, 2.04% for Class C and 1.00% |
| for Class I, multiplied by the average account value over the period, multiplied by 182/365 (to reflect the one-half |
| year period). |
8
|
| STATEMENT OF INVESTMENTS |
| May 31, 2010 |
| | | | | | |
| | | Coupon | Maturity | Principal | | |
| Bonds and Notes—74.2% | | Rate (%) | Date | Amount ($) | | Value ($) |
| Foreign/Governmental | | | | | | |
| Arab Republic of Egypt, | | | | | | |
| Sr. Unscd. Notes | EGP | 8.75 | 7/18/12 | 925,000 | a,b | 165,062 |
| Brazil Notas do | | | | | | |
| Tesouro Nacional, | | | | | | |
| Notes, Ser. B | BRL | 6.00 | 5/15/45 | 144,000 | a,h | 1,445,970 |
| Brazil Notas do | | | | | | |
| Tesouro Nacional, | | | | | | |
| Notes, Ser. F | BRL | 10.00 | 1/1/17 | 5,535,000 | a | 28,414,190 |
| Brazil Notas do | | | | | | |
| Tesouro Nacional, | | | | | | |
| Notes, Ser. F | BRL | 10.00 | 1/1/21 | 3,113,000 | a | 15,332,192 |
| Egypt Treasury, | | | | | | |
| Bills, Ser. 182 | EGP | 0.00 | 7/27/10 | 10,100,000 | a,c | 1,756,383 |
| Hungary Government, | | | | | | |
| Bonds, Ser. 19/A | HUF | 6.50 | 6/24/19 | 2,425,340,000 | a | 10,334,909 |
| Hungary Government, | | | | | | |
| Bonds, Ser. 17/B | HUF | 6.75 | 2/24/17 | 3,792,950,000 | a | 16,712,797 |
| Hungary Government, | | | | | | |
| Bonds, Ser. 12/B | HUF | 7.25 | 6/12/12 | 401,500,000 | a | 1,835,716 |
| Hungary Government, | | | | | | |
| Bonds, Ser. 15/A | HUF | 8.00 | 2/12/15 | 4,375,210,000 | a | 20,525,665 |
| Indonesia Government, | | | | | | |
| Sr. Unscd. Bonds, | | | | | | |
| Ser. FR49 | IDR | 9.00 | 9/15/13 | 26,100,000,000 | a,d | 2,900,980 |
| Malaysian Government, | | | | | | |
| Sr. Unscd. Bonds, | | | | | | |
| Ser. 0110 | MYR | 3.84 | 8/12/15 | 57,095,000 | a | 17,520,803 |
| Malaysian Government, | | | | | | |
| Sr. Unscd. Bonds, | | | | | | |
| Ser. 2/03 | MYR | 4.24 | 2/7/18 | 1,820,000 | a | 566,517 |
| Malaysian Government, | | | | | | |
| Sr. Unscd. Bonds, | | | | | | |
| Ser. 0902 | MYR | 4.38 | 11/29/19 | 33,070,000 | a | 10,325,435 |
| Mexican Bonos, | | | | | | |
| Bonds, Ser. M 10 | MXN | 7.25 | 12/15/16 | 11,400,000 | a | 908,524 |
| Mexican Bonos, | | | | | | |
| Bonds, Ser. M 10 | MXN | 7.75 | 12/14/17 | 170,770,000 | a | 13,889,681 |
| Mexican Bonos, | | | | | | |
| Bonds, Ser. M 20 | MXN | 10.00 | 12/5/24 | 112,860,000 | a | 10,592,579 |
STATEMENT OF INVESTMENTS (continued)
| | | | | | |
| | | Coupon | Maturity | Principal | | |
| Bonds and Notes (continued) | Rate (%) | Date | Amount ($) | | Value ($) |
| Foreign/ | | | | | | |
| Governmental (continued) | | | | | | |
| Mexican Bonos, | | | | | | |
| Bonds, Ser. M 30 | MXN | 10.00 | 11/20/36 | 28,955,000 | a | 2,747,846 |
| Peru Government, | | | | | | |
| Bonds | PEN | 6.95 | 8/12/31 | 4,225,000 | a | 1,503,361 |
| Peru Government, | | | | | | |
| Bonds | PEN | 8.20 | 8/12/26 | 34,015,000 | a | 13,819,976 |
| Peru Government, | | | | | | |
| Bonds, Ser. 7 | PEN | 8.60 | 8/12/17 | 30,300,000 | a | 12,449,568 |
| Poland Government, | | | | | | |
| Bonds, Ser. 0712 | PLN | 0.00 | 7/25/12 | 13,450,000 | a,c | 3,679,319 |
| Poland Government, | | | | | | |
| Bonds, Ser. 0412 | PLN | 4.75 | 4/25/12 | 38,585,000 | a | 11,673,720 |
| Poland Government, | | | | | | |
| Bonds, Ser. 1017 | PLN | 5.25 | 10/25/17 | 3,175,000 | a | 935,739 |
| Poland Government, | | | | | | |
| Bonds, Ser. 0415 | PLN | 5.50 | 4/25/15 | 98,850,000 | a | 29,985,966 |
| Poland Government, | | | | | | |
| Bonds, Ser. 0922 | PLN | 5.75 | 9/23/22 | 17,445,000 | a | 5,215,119 |
| Poland Government, | | | | | | |
| Bonds, Ser. 1015 | PLN | 6.25 | 10/24/15 | 9,135,000 | a | 2,859,396 |
| Republic of Colombia, | | | | | | |
| Sr. Unscd. Bonds | COP | 7.75 | 4/14/21 | 5,025,000,000 | a | 2,643,487 |
| Republic of Colombia, | | | | | | |
| Unsub. Bonds | COP | 9.85 | 6/28/27 | 1,864,000,000 | a | 1,177,638 |
| Republic of Colombia, | | | | | | |
| Unsub. Notes | COP | 12.00 | 10/22/15 | 31,480,000,000 | a | 20,325,873 |
| Russia Government, | | | | | | |
| Bonds, Ser. 5067 | RUB | 11.30 | 10/17/12 | 15,298,946 | a,b,e | 557,908 |
| Russia Government, | | | | | | |
| Bonds, Ser. 5067 | RUB | 11.30 | 10/17/12 | 32,000,000 | a,b,e | 1,166,947 |
| Russia Government, | | | | | | |
| Bonds, Ser. 5067 | RUB | 11.30 | 10/17/12 | 756,600,000 | a,b,e | 27,590,992 |
| South Africa Government, | | | | | | |
| Bonds, Ser. R207 | ZAR | 7.25 | 1/15/20 | 72,455,000 | a | 8,635,976 |
| South Africa Government, | | | | | | |
| Bonds, Ser. R206 | ZAR | 7.50 | 1/15/14 | 22,915,000 | a | 2,977,868 |
| South Africa Government, | | | | | | |
| Bonds, Ser. R204 | ZAR | 8.00 | 12/21/18 | 151,725,000 | a | 19,281,671 |
10
| | | | | | |
| | | Coupon | Maturity | Principal | | |
| Bonds and Notes (continued) | Rate (%) | Date | Amount ($) | | Value ($) |
| Foreign/ | | | | | | |
| Governmental (continued) | | | | | | |
| South Africa Government, | | | | | | |
| Bonds, Ser. R203 | ZAR | 8.25 | 9/15/17 | 247,905,000 | a | 32,132,252 |
| South Africa Government, | | | | | | |
| Sr. Unscd. Bonds, | | | | | | |
| Ser. R201 | ZAR | 8.75 | 12/21/14 | 450,000 | a | 61,072 |
| South Africa Government, | | | | | | |
| Bonds, Ser. R186 | ZAR | 10.50 | 12/21/26 | 27,635,000 | a | 4,142,778 |
| South Africa Government, | | | | | | |
| Bonds, Ser. R157 | ZAR | 13.50 | 9/15/15 | 3,255,000 | a | 528,675 |
| Thailand Government, | | | | | | |
| Sr. Unscd. Bonds | THB | 3.63 | 5/22/15 | 678,480,000 | a | 21,379,258 |
| Thailand Government, | | | | | | |
| Sr. Unscd. Bonds | THB | 3.88 | 6/13/19 | 176,580,000 | a | 5,658,289 |
| Thailand | | | | | | |
| Government, | | | | | | |
| Sr. Unscd. Bonds | THB | 5.13 | 3/13/18 | 40,330,000 | a | 1,385,310 |
| Turkey Government, | | | | | | |
| Bonds | TRY | 0.00 | 8/3/11 | 8,450,000 | a,c | 4,907,195 |
| Turkey Government, | | | | | | |
| Bonds, Ser. CPI | TRY | 10.00 | 2/15/12 | 4,485,000 | a,i | 4,240,534 |
| Turkey Government, | | | | | | |
| Bonds | TRY | 10.50 | 1/15/20 | 355,000 | a | 228,028 |
| Turkey Government, | | | | | | |
| Bonds | TRY | 11.00 | 8/6/14 | 21,955,000 | a | 14,536,352 |
| Turkey Government, | | | | | | |
| Bonds | TRY | 14.00 | 1/19/11 | 3,860,000 | a | 2,546,591 |
| Turkey Government, | | | | | | |
| Bonds | TRY | 14.00 | 9/26/12 | 44,955,000 | a | 31,398,280 |
| Turkey Government, | | | | | | |
| Bonds | TRY | 16.00 | 8/28/13 | 1,000,000 | a | 747,529 |
| Total Bonds and Notes | | | | | | |
| (cost $462,339,599) | | | | | | 446,347,916 |
| |
| Short-Term Investments—.1% | | | | | |
| U.S. Treasury Bills; | | | | | | |
| 0.15%, 7/22/10 | | | | | | |
| (cost $359,924) | | | | 360,000 f | 359,929 |
STATEMENT OF INVESTMENTS (continued)
| | |
| Other Investment—14.1% | Shares | Value ($) |
| Registered Investment Company; | | |
| Dreyfus Institutional Preferred Plus Money Market Fund | | |
| (cost $84,921,000) | 84,921,000 g | 84,921,000 |
| |
| Total Investments (cost $547,620,523) | 88.4% | 531,628,845 |
| Cash and Receivables (Net) | 11.6% | 70,087,725 |
| Net Assets | 100.0% | 601,716,570 |
|
| a Principal amount stated in U.S. Dollars unless otherwise noted. |
| BRL—Brazilian Real |
| COP—Colombian Peso |
| EGP—Egyptian Pound |
| HUF—Hungarian Forint |
| IDR—Indonesian Rupiah |
| MXN—Mexican New Peso |
| MYR—Malaysian Ringgit |
| PEN—Peruvian New Sol |
| PLN—Polish Zloty |
| RUB—Russian Ruble |
| THB—Thai Baht |
| TRY—Turkish Lira |
| ZAR—South African Rand |
| b Security exempt from registration under Rule 144A of the Securities Act of 1933.This security may be resold in |
| transactions exempt from registration, normally to qualified institutional buyers.At May 31, 2010, this security had a |
| total market value of $29,480,909 or 4.9% of net assets. |
| c Security issued with a zero coupon. Income is recognized through the accretion of discount. |
| d Purchased on a delayed delivery basis. |
| e Credit Linked Notes |
| f Held by a broker as collateral for open financial forward foreign currency exchange contacts positions. |
| g Investment in affiliated money market mutual fund. |
| h Principal amount for accrual purposes is periodically adjusted based on changes in the Brazilian Consumer Price Index. |
| i Principal amount of accrual purposes is periodically adjusted based on changes in the Turkish Consumer Price Index. |
| | | |
| Portfolio Summary (Unaudited)† | | |
| |
| | Value (%) | | Value (%) |
| Short-Term/ | | Malaysia | 4.7 |
| Money Market Investments | 14.2 | Mexico | 4.7 |
| South Africa | 11.3 | Thailand | 4.7 |
| Turkey | 9.8 | Peru | 4.6 |
| Poland | 9.0 | Colombia | 4.0 |
| Hungary | 8.2 | Indonesia | .5 |
| Brazil | 7.5 | Egypt | .3 |
| Russia | 4.9 | | 88.4 |
| |
| † Based on net assets. | | | |
| See notes to financial statements. | | | |
12
|
| STATEMENT OF ASSETS AND LIABILITIES |
| May 31, 2010 |
| | | |
| | | Cost | Value |
| Assets ($): | | | |
| Investments in securities—See Statement of Investments: | | |
| Unaffiliated issuers | | 462,699,523 | 446,707,845 |
| Affiliated issuers | | 84,921,000 | 84,921,000 |
| Cash | | | 2,477,068 |
| Cash denominated in foreign currencies | | 4,120,164 | 4,117,573 |
| Receivable for investment securities sold | | | 65,141,681 |
| Dividends and interest receivable | | | 9,038,031 |
| Receivable for shares of Beneficial Interest subscribed | | 5,491,521 |
| Unrealized appreciation on forward foreign | | | |
| currency exchange contracts—Note 4 | | | 1,400,653 |
| Prepaid expenses | | | 14,767 |
| | | | 619,310,139 |
| Liabilities ($): | | | |
| Due to The Dreyfus Corporation and affiliates—Note 3(d) | | 541,510 |
| Payable for investment securities purchased | | | 15,420,129 |
| Unrealized depreciation on forward foreign | | | |
| currency exchange contracts—Note 4 | | | 1,531,914 |
| Payable for shares of Beneficial Interest redeemed | | | 18,379 |
| Accrued expenses | | | 81,637 |
| | | | 17,593,569 |
| Net Assets ($) | | | 601,716,570 |
| Composition of Net Assets ($): | | | |
| Paid-in capital | | | 620,076,224 |
| Accumulated undistributed investment income—net | | | 841,614 |
| Accumulated net realized gain (loss) on investments | | | (2,906,469) |
| Accumulated net unrealized appreciation | | | |
| (depreciation) on investments, foreign | | | |
| currency transactions and swap transactions | | | (16,294,799) |
| Net Assets ($) | | | 601,716,570 |
| |
| |
| Net Asset Value Per Share | | | |
| | Class A | Class C | Class I |
| Net Assets ($) | 38,427,551 | 1,887,869 | 561,401,150 |
| Shares Outstanding | 2,870,427 | 142,097 | 41,825,700 |
| Net Asset Value Per Share ($) | 13.39 | 13.29 | 13.42 |
| |
| See notes to financial statements. | | | |
|
| STATEMENT OF OPERATIONS |
| Year Ended May 31, 2010 |
| |
| Investment Income ($): | |
| Income: | |
| Interest | 5,707,610 |
| Dividends; | |
| Affiliated issuers | 40,721 |
| Total Income | 5,748,331 |
| Expenses: | |
| Management fee—Note 3(a) | 895,997 |
| Custodian fees—Note 3(d) | 221,252 |
| Professional fees | 77,762 |
| Shareholder servicing costs—Note 3(d) | 70,257 |
| Registration fees | 51,794 |
| Distribution fees—Note 3(c) | 9,231 |
| Prospectus and shareholders’ reports | 8,152 |
| Trustees’ fees and expenses—Note 3(b) | 4,352 |
| Loan commitment fees—Note 2 | 287 |
| Miscellaneous | 12,345 |
| Total Expenses | 1,351,429 |
| Less—reduction in management fee due to undertaking—Note 3(a) | (55,525) |
| Less—reduction in fees due to earnings credits—Note 1(c) | (1) |
| Net Expenses | 1,295,903 |
| Investment Income—Net | 4,452,428 |
| Realized and Unrealized Gain (Loss) on Investments—Note 4 ($): | |
| Net realized gain (loss) on investments and foreign currency transactions | 569,870 |
| Net realized gain (loss) on swap transactions | 85,635 |
| Net realized gain (loss) on forward foreign currency exchange contracts | (5,260,122) |
| Net Realized Gain (Loss) | (4,604,617) |
| Net unrealized appreciation (depreciation) on | |
| investments and foreign currency transactions | (16,638,393) |
| Net unrealized appreciation (depreciation) on swap transactions | (93,563) |
| Net unrealized appreciation (depreciation) on | |
| forward foreign currency exchange contracts | (115,628) |
| Net Unrealized Appreciation (Depreciation) | (16,847,584) |
| Net Realized and Unrealized Gain (Loss) on Investments | (21,452,201) |
| Net Increase in Net Assets Resulting from Operations | (16,999,773) |
| |
| See notes to financial statements. | |
14
STATEMENT OF CHANGES IN NET ASSETS
| | |
| | | Year Ended May 31, |
| | 2010 | 2009a |
| Operations ($): | | |
| Investment income—net | 4,452,428 | 713,034 |
| Net realized gain (loss) on investments | (4,604,617) | (1,488,786) |
| Net unrealized appreciation | | |
| (depreciation) on investments | (16,847,584) | 552,785 |
| Net Increase (Decrease) in Net Assets | | |
| Resulting from Operations | (16,999,773) | (222,967) |
| Dividends to Shareholders from ($): | | |
| Investment income—net: | | |
| Class A Shares | (278,459) | (361,202) |
| Class C Shares | (12,675) | (18,040) |
| Class I Shares | (132,034) | (20,744) |
| Net realized gain on investments: | | |
| Class A Shares | (91,530) | — |
| Class C Shares | (4,964) | — |
| Class I Shares | (225,836) | — |
| Total Dividends | (745,498) | (399,986) |
| Beneficial Interest Transactions ($): | | |
| Net proceeds from shares sold: | | |
| Class A Shares | 20,977,020 | 18,029,888 |
| Class C Shares | 900,960 | 1,000,000 |
| Class I Shares | 581,558,353 | 1,000,000 |
| Dividends reinvested: | | |
| Class A Shares | 27,698 | 50 |
| Class C Shares | 1,483 | — |
| Class I Shares | 230,087 | — |
| Cost of shares redeemed: | | |
| Class A Shares | (1,360,537) | (2,450) |
| Class C Shares | (68,903) | — |
| Class I Shares | (2,208,855) | — |
| Increase (Decrease) in Net Assets from | | |
| Beneficial Interest Transactions | 600,057,306 | 20,027,488 |
| Total Increase (Decrease) in Net Assets | 582,312,035 | 19,404,535 |
| Net Assets ($): | | |
| Beginning of Period | 19,404,535 | — |
| End of Period | 601,716,570 | 19,404,535 |
| Undistributed (distributions in excess of) | | |
| investment income—net | 841,614 | (1,455,532) |
STATEMENT OF CHANGES IN NET ASSETS (continued)
| | |
| | | Year Ended May 31, |
| | 2010 | 2009a |
| Capital Share Transactions: | | |
| Class A | | |
| Shares sold | 1,527,767 | 1,442,509 |
| Shares issued for dividends reinvested | 2,125 | 4 |
| Shares redeemed | (101,763) | (215) |
| Net Increase (Decrease) in Shares Outstanding | 1,428,129 | 1,442,298 |
| Class C | | |
| Shares sold | 67,112 | 80,000 |
| Shares issued for dividends reinvested | 116 | — |
| Shares redeemed | (5,131) | — |
| Net Increase (Decrease) in Shares Outstanding | 62,097 | 80,000 |
| Class I | | |
| Shares sold | 41,892,247 | 80,000 |
| Shares issued for dividends reinvested | 17,345 | — |
| Shares redeemed | (163,892) | — |
| Net Increase (Decrease) in Shares Outstanding | 41,745,700 | 80,000 |
| |
| a From September 12, 2008 (commencement of operations) to May 31, 2009. | |
| See notes to financial statements. | | |
16
FINANCIAL HIGHLIGHTS
The following tables describe the performance for each share class for the fiscal periods indicated.All information (except portfolio turnover rate) reflects financial results for a single fund share.Total return shows how much your investment in the fund would have increased (or decreased) during each period, assuming you had reinvested all dividends and distributions.These figures have been derived from the fund’s financial statements.
| | |
| | Year Ended May 31, |
| Class A Shares | 2010 | 2009a |
| Per Share Data ($): | | |
| Net asset value, beginning of period | 12.11 | 12.50 |
| Investment Operations: | | |
| Investment income—netb | .55 | .45 |
| Net realized and unrealized | | |
| gain (loss) on investments | .96 | (.59) |
| Total from Investment Operations | 1.51 | (.14) |
| Distributions: | | |
| Dividends from investment income—net | (.18) | (.25) |
| Dividends from net realized gain on investments | (.05) | — |
| Total Distributions | (.23) | (.25) |
| Net asset value, end of period | 13.39 | 12.11 |
| Total Return (%)c | 12.56 | (.95)d |
| Ratios/Supplemental Data (%): | | |
| Ratio of total expenses to average net assets | 1.50 | 3.08e |
| Ratio of net expenses to average net assets | 1.32 | 1.35e |
| Ratio of net investment income to average net assets | 4.22 | 5.67e |
| Portfolio Turnover Rate | 74.25 | 108.46d |
| Net Assets, end of period ($ x 1,000) | 38,428 | 17,469 |
| |
| a | From September 12, 2008 (commencement of operations) to May 31, 2009. |
| b | Based on average shares outstanding at each month end. |
| c | Exclusive of sales charge. |
| d | Not annualized. |
| e | Annualized. |
See notes to financial statements.
FINANCIAL HIGHLIGHTS (continued)
| | |
| | Year Ended May 31, |
| Class C Shares | 2010 | 2009a |
| Per Share Data ($): | | |
| Net asset value, beginning of period | 12.07 | 12.50 |
| Investment Operations: | | |
| Investment income—netb | .46 | .39 |
| Net realized and unrealized | | |
| gain (loss) on investments | .95 | (.59) |
| Total from Investment Operations | 1.41 | (.20) |
| Distributions: | | |
| Dividends from investment income—net | (.14) | (.23) |
| Dividends from net realized gain on investments | (.05) | — |
| Total Distributions | (.19) | (.23) |
| Net asset value, end of period | 13.29 | 12.07 |
| Total Return (%)c | 11.73 | (1.49)d |
| Ratios/Supplemental Data (%): | | |
| Ratio of total expenses to average net assets | 2.27 | 3.84e |
| Ratio of net expenses to average net assets | 2.09 | 2.10e |
| Ratio of net investment income to average net assets | 3.53 | 4.92e |
| Portfolio Turnover Rate | 74.25 | 108.46d |
| Net Assets, end of period ($ x 1,000) | 1,888 | 966 |
| |
| a | From September 12, 2008 (commencement of operations) to May 31, 2009. |
| b | Based on average shares outstanding at each month end. |
| c | Exclusive of sales charge. |
| d | Not annualized. |
| e | Annualized. |
See notes to financial statements.
18
| | |
| | Year Ended May 31, |
| Class I Shares | 2010 | 2009a |
| Per Share Data ($): | | |
| Net asset value, beginning of period | 12.12 | 12.50 |
| Investment Operations: | | |
| Investment income—netb | .41 | .47 |
| Net realized and unrealized | | |
| gain (loss) on investments | 1.14 | (.59) |
| Total from Investment Operations | 1.55 | (.12) |
| Distributions: | | |
| Dividends from investment income—net | (.20) | (.26) |
| Dividends from net realized gain on investments | (.05) | — |
| Total Distributions | (.25) | (.26) |
| Net asset value, end of period | 13.42 | 12.12 |
| Total Return (%) | 12.94 | (.79)c |
| Ratios/Supplemental Data (%): | | |
| Ratio of total expenses to average net assets | 1.02 | 2.84d |
| Ratio of net expenses to average net assets | 1.01 | 1.10d |
| Ratio of net investment income to average net assets | 3.60 | 5.92d |
| Portfolio Turnover Rate | 74.25 | 108.46c |
| Net Assets, end of period ($ x 1,000) | 561,401 | 970 |
| |
| a | From September 12, 2008 (commencement of operations) to May 31, 2009. |
| b | Based on average shares outstanding at each month end. |
| c | Not annualized. |
| d | Annualized. |
See notes to financial statements.
NOTES TO FINANCIAL STATEMENTS
NOTE 1—Significant Accounting Policies:
Dreyfus Emerging Markets Debt Local Currency Fund (the “fund”) is a separate diversified series of The Dreyfus/Laurel Funds Trust (the “Trust”) which is registered under the Investment Company Act of 1940, as amended (the “Act”), as an open-end management investment company and operates as a series company offering seven series, including the fund. The fund’s investment objective seeks to maximize total return.The Dreyfus Corporation (the “Manager” or “Dreyfus”), a wholly-owned subsidiary of The Bank of New York Mellon Corporation (“BNY Mellon”), serves as the fund’s investment adviser.
MBSC Securities Corporation (the “Distributor”), a wholly-owned subsidiary of the Manager, is the distributor of the fund’s shares. The fund is authorized to issue an unlimited number of shares of Beneficial Interest in each of the following classes of shares: Class A, Class C and Class I. Class A and Class C shares are sold primarily to retail investors through financial intermediaries and bear a distribution fee and/or shareholder services fee. Class A shares are sold with a front-end sales charge, while Class C shares are subject to a contingent deferred sales charge (“CDSC”). Class I shares are sold primarily to bank trust departments and other financial service providers (including The Bank of New York Mellon, a subsidiary of BNY Mellon and an affiliate of Dreyfus), acting on behalf of customers having a qualified trust or investment account or relationship at such institution, and bear no distribu tion or shareholder service fees. Class I shares are offered without a front-end sales charge or CDSC. Other differences between the classes include the services offered to and the expenses borne by each class, the allocation of certain transfer agency costs and certain voting rights. Income, expenses (other than expenses attributable to a specific class), and realized and unrealized gains or losses on investments are allocated to each class of shares based on its relative net assets.
As of May 31, 2010, MBC Investments Corp., an indirect subsidiary of BNY Mellon, held 1,440,000 Class A and 80,000 Class C shares of the fund.
20
The Trust accounts separately for the assets, liabilities and operations of each series. Expenses directly attributable to each series are charged to that series’ operations; expenses which are applicable to all series are allocated among them on a pro rata basis.
The Financial Accounting Standards Board (“FASB”) Accounting Standards Codification (“ASC”) has become the exclusive reference of authoritative U.S. generally accepted accounting principles (“GAAP”) recognized by the FASB to be applied by nongovernmental entities. Rules and interpretive releases of the Securities and Exchange Commission (“SEC”) under authority of federal laws are also sources of authoritative GAAP for SEC registrants. The ASC has superseded all existing non-SEC accounting and reporting standards.The fund’s financial statements are prepared in accordance with GAAP, which may require the use of management estimates and assumptions.Actual results could differ from those estimates.
(a) Portfolio valuation: Investments in securities excluding short-term investments (other than U.S. Treasury Bills), swaps and forward foreign currency exchange contracts (“forward contracts”) are valued each business day by an independent pricing service (the “Service”) approved by the Board of Trustees. Investments for which quoted bid prices are readily available and are representative of the bid side of the market in the judgment of the Service are valued at the mean between the quoted bid prices (as obtained by the Service from dealers in such securities) and asked prices (as calculated by the Service based upon its evaluation of the market for such securities). Other investments (which constitute a majority of the portfolio securities) are valued as determined by the Service, based on methods which include consideration of: y ields or prices of securities of comparable quality, coupon, maturity and type; indications as to values from dealers; and general market conditions. Restricted securities, as well as securities or other assets for which recent market quotations are not readily available and are not valued by a pricing service approved by the Board of Trustees, or are determined by the fund not to reflect accurately fair value, are
NOTES TO FINANCIAL STATEMENTS (continued)
valued at fair value as determined in good faith under the direction of the Board of Trustees. The factors that may be considered when fair valuing a security include fundamental analytical data, the nature and duration of restrictions on disposition, an evaluation of the forces that influence the market in which the securities are purchased and sold and public trading in similar securities of the issuer or comparable issuers. Short-term investments of sufficient credit quality, excluding U.S.Treasury Bills, are carried at amortized cost, which approximates value. Registered investment companies that are not traded on an exchange are valued at their net asset value. Investments denominated in foreign currencies are translated to U.S. dollars at the prevailing rates of exchange. Forward contracts are valued at the forward rate. Investments in swap transactions are valued each business day by an independent pricing service approv ed by the Board of Trustees. Swaps are valued by the service by using a swap pricing model which incorporates among other factors, default probabilities, recovery rates, credit curves of the underlying issuer and swap spreads an interest rates.
The fair value of a financial instrument is the amount that would be received to sell an asset or paid to transfer a liability in an orderly transaction between market participants at the measurement date (i.e. the exit price). GAAP establishes a fair value hierarchy that prioritizes the inputs of valuation techniques used to measure fair value.This hierarchy gives the highest priority to unadjusted quoted prices in active markets for identical assets or liabilities (Level 1 measurements) and the lowest priority to unobservable inputs (Level 3 measurements).
Additionally, GAAP provides guidance on determining whether the volume and activity in a market has decreased significantly and whether such a decrease in activity results in transactions that are not orderly. GAAP requires enhanced disclosures around valuation inputs and techniques used during annual and interim periods.
22
Various inputs are used in determining the value of the fund’s investments relating to fair value measurements.These inputs are summarized in the three broad levels listed below:
Level 1—unadjusted quoted prices in active markets for
identical investments.
Level 2—other significant observable inputs (including quoted
prices for similar investments, interest rates, prepayment speeds,
credit risk, etc.).
Level 3—significant unobservable inputs (including the fund’s own
assumptions in determining the fair value of investments).
The inputs or methodology used for valuing securities are not necessarily an indication of the risk associated with investing in those securities.
The following is a summary of the inputs used as of May 31, 2010 in valuing the fund’s investments:
| | | | |
| | | Level 2—Other | Level 3— | |
| | Level 1— | Significant | Significant | |
| | Unadjusted | Observable | Unobservable | |
| | Quoted Prices | Inputs | Inputs | Total |
| Assets ($) | | | | |
| Investments in Securities: | | | |
| Foreign Government | — | 446,347,916 | — | 446,347,916 |
| Mutual Funds | 84,921,000 | — | — | 84,921,000 |
| U.S. Treasury | — | 359,929 | | 359,929 |
| Other Financial | | | | |
| Instruments† | — | 1,400,653 | — | 1,400,653 |
| Liabilities ($) | | | | |
| Other Financial | | | | |
| Instruments† | — | (1,531,914) | — | (1,531,914) |
|
| † Other financial instruments include derivative instruments such as futures, forward foreign currency |
| exchange contracts, swap contracts and options contracts.Amounts shown represent unrealized |
| appreciation (depreciation), or in the case of options, market value at period end. |
NOTES TO FINANCIAL STATEMENTS (continued)
In January 2010, FASB issued Accounting Standards Update (“ASU”) No. 2010-06 “Improving Disclosures about Fair Value Measurements”. ASU 2010-06 will require reporting entities to make new disclosures about amounts and reasons for significant transfers in and out of Level 1 and Level 2 fair value measurements as well as inputs and valuation techniques used to measure fair value for both recurring and nonrecurring fair value measurements that fall in either Level 2 or Level 3, and information on purchases, sales, issuances and settlements on a gross basis in the reconciliation of activity in Level 3 fair value measurements. The new and revised disclosures are required to be implemented for fiscal years beginning after December 15, 2009 except for the disclosures surrounding purchases,sales,issuances and settlements on a gross basis in the reconciliation of Level 3 fair value measurements, which are effective f or fiscal years beginning after December 15, 2010. Management is currently evaluating the impact the adoption of ASU No. 2010-06 may have on the fund’s financial statement disclosures.
(b) Foreign currency transactions: The fund does not isolate that portion of the results of operations resulting from changes in foreign exchange rates on investments from the fluctuations arising from changes in the market prices of securities held. Such fluctuations are included with the net realized and unrealized gain or loss on investments.
Net realized foreign exchange gains or losses arise from sales of foreign currencies, currency gains or losses realized on securities transactions between trade and settlement date, and the difference between the amounts of dividends, interest and foreign withholding taxes recorded on the fund’s books and the U.S. dollar equivalent of the amounts actually received or paid. Net unrealized foreign exchange gains and losses arise from changes in the value of assets and liabilities other than investments resulting from changes in exchange rates. Foreign currency gains and losses on investments are included with net realized and unrealized gain or loss on investments.
(c) Securities transactions and investment income: Securities transactions are recorded on a trade date basis. Realized gains and losses from securities transactions are recorded on the identified cost basis.
24
Dividend income is recognized on the ex-dividend date and interest income, including, where applicable, accretion of discount and amortization of premium on investments, is recognized on the accrual basis.
The fund has arrangements with the custodian and cash management bank whereby the fund may receive earnings credits when positive cash balances are maintained, which are used to offset custody and cash management fees. For financial reporting purposes, the fund includes net earnings credits as an expense offset in the Statement of Operations.
Investing in foreign markets may involve special risks and considerations not typically associated with investing in the U.S. These risks include revaluation of currencies, high rates of inflation, repatriation restrictions on income and capital, and adverse political and economic developments. Moreover, securities issued in these markets may be less liquid, subject to government ownership controls and delayed settlements, and their prices may be more volatile than those of comparable securities in the U.S.
(d) Affiliated issuers: Investments in other investment companies advised by the Manager are defined as “affiliated” in the Act.
The fund may invest in shares of certain affiliated investment companies also advised or managed by Dreyfus. Investments in affiliated investment companies for the period ended May 31, 2010 were as follows:
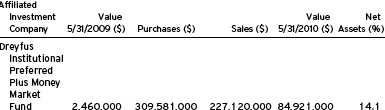
(e) Concentration of Risk: The fund invests primarily in debt securities. Failure of an issuer of the debt securities to make timely interest or principal payments, or a decline or the perception of a decline in the credit quality of a debt security, can cause the debt security’s price to fall,
NOTES TO FINANCIAL STATEMENTS (continued)
potentially lowering the fund’s share price. In addition, the value of debt securities may decline due to general market conditions that are not specifically related to a particular issuer, such as real or perceived adverse economic conditions, changes in outlook for corporate earnings, changes in interest or currency rates or adverse investor sentiment.They may also decline because of factors that affect a particular industry or country.
(f) Dividends to shareholders: It is the policy of the fund to continue to declare and pay dividends from investment income-net, quarterly. Dividends from net realized capital gains, if any, are normally declared and paid annually, but the fund may make distributions on a more frequent basis to comply with the distribution requirements of the Internal Revenue Code of 1986, as amended (the “Code”).To the extent that net realized capital gains can be offset by capital loss carryovers, it is the policy of the fund not to distribute such gains. Income and capital gain distributions are determined in accordance with income tax regulations, which may differ from GAAP.
(g) Federal income taxes: It is the policy of the fund to continue to qualify as a regulated investment company, if such qualification is in the best interests of its shareholders, by complying with the applicable provisions of the Code, and to make distributions of taxable income sufficient to relieve it from substantially all federal income and excise taxes.
As of and during the period ended May 31, 2010, the fund did not have any liabilities for any uncertain tax positions.The fund recognizes interest and penalties, if any, related to uncertain tax positions as income tax expense in the Statement of Operations. During the period, the fund did not incur any interest or penalties.
Each of the tax years in the two-year period ended May 31, 2010 remains subject to examination by the Internal Revenue Service and state taxing authorities.
At May 31,2010,the components of accumulated earnings on a tax basis were as follows: undistributed ordinary income $1,754,813 and unrealized depreciation $18,474,318. In addition, the fund had $1,640,149 of capital losses realized after October 31, 2009, which were deferred for tax purposes to the first day of the following fiscal year.
26
The tax character of distributions paid to shareholders during the fiscal periods ended May 31, 2010 and May 31, 2009 were as follows: ordinary income $655,559 and $399,986 and long-term capital gains $89,939 and $0, respectively.
During the period ended May 31, 2010, as a result of permanent book to tax differences, primarily due to the tax treatment foreign currency gains and losses and treatment of swap periodic payments, the fund decreased accumulated undistributed investment income-net by $1,732,114 and increased accumulated net realized gain (loss) on investments by the same amount. Net assets and net asset value per share were not affected by this reclassification.
NOTE 2—Bank Line of Credit:
The fund participates with other Dreyfus-managed funds in a $225 million unsecured credit facility led by Citibank, N.A. and a $300 million unsecured credit facility provided by The Bank of NewYork Mellon, a subsidiary of BNY Mellon and an affiliate of Dreyfus (each, a “Facility”), each to be utilized primarily for temporary or emergency purposes, including the financing of redemptions. In connection therewith, the fund has agreed to pay its pro rata portion of commitment fees for each Facility. Interest is charged to the fund based on rates determined pursuant to the terms of the respective Facility at the time of borrowing. During the period ended on May 31, 2010, the fund did not borrow under the Facilities.
NOTE 3—Management Fee and Other Transactions with Affiliates:
(a) Pursuant to a management agreement between the Manager and the Trust, the Trust has agreed to pay the Manager a management fee computed at the annual rate of .75% of the value of the fund’s average daily net assets and is payable monthly.The Manager has contractually agreed until October 1, 2010, to waive receipt of its fees and/or assume certain expenses of the fund, so that the expenses, exclusive of Rule 12b-1 distribution plan fees, shareholder services plan fees, taxes, interest, brokerage commissions, commitment fees on borrowings and extraordinary expenses, do not exceed an annual rate of 1.10% of the
NOTES TO FINANCIAL STATEMENTS (continued)
value of the fund’s average daily net assets.The reduction in management fee, pursuant to the undertaking, amounted to $55,525 during the period ended May 31, 2010.
(b) Prior to January 1, 2010, each Board member received $45,000 per year, plus $6,000 for each joint Board meeting of the Trust, The Dreyfus/Laurel Tax-Free Municipal Funds,The Dreyfus/Laurel Funds, Inc., Dreyfus Investment Funds and Dreyfus Funds, Inc. (collectively, the “Board Group Open-End Funds”) attended, $2,000 for separate in-person committee meetings attended which were not held in conjunction with a regularly scheduled Board meeting and $1,500 for Board meetings and separate committee meetings attended that were conducted by telephone. Effective January 1, 2010, the Board Group Open-End Funds pay each Board member who is not an “interested person” of the Trust (as defined in the Act) $60,000 per annum, plus $7,000 per joint Board Group Open-End Funds Board meeting attended, $2,500 for separate in-person committee meetings attended which are not held in conjunction with a regularly scheduled Board meeting and $2,000 for Board meetings and separate committee meetings attended that are conducted by telephone.The Board Group Open-End Funds also reimburse each Board member who is not an “interested person” of theTrust (as defined in the Act) for travel and out-of-pocket expenses.With respect to Board meetings, the Chairman of the Board receives an additional 25% of such compensation (with the exception of reimbursable amounts). With respect to compensation committee meetings prior to January 1, 2010, the Chair of the compensation committee received $900 per compensation committee meeting. Effective January 1, 2010, the Chair of each of the Board’s committees, unless the Chair also serves as Chair of the Board, receives $1,350 per applicable committee meeting. In the event that there is an in-person joint committee meeting or a joint telephone meeting of the Board Group Open-End Funds and Dreyfus HighYield Strategie s Fund, the $2,000 or $1,500 fee (prior to January 1, 2010) or the $2,500 or $2,000 fee (effective January 1, 2010), as applicable, is allocated between the Board Group Open-End Funds and Dreyfus High Yield Strategies Fund. The Trust’s portion of these fees and expenses
28
are charged and allocated to each series based on net assets. Amounts required to be paid by theTrust directly to the non-interestedTrustees, that would be applied to offset a portion of the management fee payable to the Manager, are in fact paid directly by the Manager to the non-interested Trustees.
(c) Under the Distribution Plan (the “Plan”) adopted pursuant to Rule 12b-1 under the Act, Class C shares pay the Distributor for distributing their shares at an annual rate of .75% of the value of the average daily net assets. During the period ended May 31, 2010, Class C shares were charged $9,231 pursuant to the Plan.
During the period ended May 31, 2010, the Distributor retained $464 from commissions earned on sales of the fund’s Class A shares and $50 from CDSCs on redemptions of the fund’s Class C shares.
(d) Under the Shareholder Services Plan, Class A and Class C shares pay the Distributor at an annual rate of .25% of the value of their average daily net assets for the provision of certain services. The services provided may include personal services relating to shareholder accounts, such as answering shareholder inquiries regarding the fund and providing reports and other information, and services related to the maintenance of shareholder accounts. The Distributor may make payments to Service Agents (a securities dealer, financial institution or other industry professional) in respect of these services.The Distributor determines the amounts to be paid to Service Agents. During the period ended May 31, 2010, Class A and Class C shares were charged $59,877 and $3,077, respectively, pursuant to the Shareholder Services Plan.
Under its terms, the Plan and Shareholder Services Plan shall remain in effect from year to year, provided such continuance is approved annually by a vote of a majority of those Trustees who are not “interested persons” of theTrust and who have no direct or indirect financial interest in the operation of or in any agreement related to the Plan or Shareholder Services Plan.
NOTES TO FINANCIAL STATEMENTS (continued)
The fund compensates DreyfusTransfer, Inc., a wholly-owned subsidiary of the Manager, under a transfer agency agreement for providing personnel and facilities to perform transfer agency services for the fund. During the period ended May 31, 2010, the fund was charged $1,979 pursuant to the transfer agency agreement, which is included in Shareholder servicing costs in the Statement of Operations.
The fund compensates The Bank of New York Mellon under cash management agreements for performing cash management services related to fund subscriptions and redemptions. During the period ended May 31, 2010, the fund was charged $843 pursuant to the cash management agreements, which is included in Shareholder servicing costs in the Statement of Operations. These fees were partially offset by earnings credits of $1.
The fund also compensates The Bank of New York Mellon under a custody agreement for providing custodial services for the fund. During the period ended May 31, 2010, the fund was charged $221,252 pursuant to the custody agreement.
During the period ended May 31, 2010, the fund was charged $5,436 for services performed by the Chief Compliance Officer.
The components of “Due to The Dreyfus Corporation and affiliates” in the Statement of Assets and Liabilities consist of: management fees $360,867, Rule 12b-1 distribution plan fees $1,091, shareholder services plan fees $8,472, custodian fees $166,087, chief compliance officer fees $3,656 and transfer agency per account fees $1,337.
(e) A 2% redemption fee is charged and retained by the fund on certain shares redeemed within sixty days following the date of issuance, subject to exceptions, including redemptions made through the use of the fund’s exchange privilege. During the period ended May 31, 2010, redemption fees charged and retained by the fund amounted to $4,788.
NOTE 4—Securities Transactions:
The aggregate amount of purchases and sales of investment securities, excluding short-term securities, forward contracts and swap transactions
30
during the period ended May 31, 2010, amounted to $528,400,629 and $78,542,448, respectively.
The provisions of ASC Topic 815 “Derivatives and Hedging” require qualitative disclosures about objectives and strategies for using derivatives, quantitative disclosures about fair value amounts of gains and losses on derivative instruments and disclosures about credit-risk-related contingent features in derivative agreements. The disclosure requirements distinguish between derivatives, which are accounted for as “hedges” and those that do not qualify for hedge accounting. Because investment companies value their derivatives at fair value and recognize changes in fair value through the Statement of Operations, they do not qualify for such accounting. Accordingly, even though a fund’s investments in derivatives may represent economic hedges, they are considered to be non-hedge transactions for purposes of this disclosure. The following tables show the fund’s exposure to different types of market ris k as it relates to the Statement of Assets and Liabilities and the Statement of Operations, respectively.
Fair value of derivative instruments as of May 31, 2010 is shown below:
| | | |
| | Derivative | | Derivative |
| | Assets ($) | | Liabilities ($) |
| Foreign exchange risk1 | 1,400,653 | Foreign exchange risk2 | (1,531,914) |
| Gross fair value of | | | |
| derivatives contracts | 1,400,653 | | (1,531,914) |
Statement of Assets and Liabilities location:
| |
| 1 | Unrealized appreciation on forward foreign currency exchange contracts. |
| 2 | Unrealized depreciation on forward foreign currency exchange contracts. |
The effect of derivative instruments on the Statement of Operations during the period ended May 31, 2010 is shown below:
Amount of realized gain or (loss) on derivatives recognized in income ($)
| | | |
| | Forward | | |
| Underlying risk | Contracts3 | Swaps4 | Total |
| Interest rate | — | 85,635 | 85,635 |
| Foreign exchange | (5,260,122) | — | (5,260,122) |
| Total | (5,260,122) | 85,635 | (5,174,487) |
NOTES TO FINANCIAL STATEMENTS (continued)
Change in unrealized appreciation or (depreciation) on derivatives recognized in income ($)5
| | | |
| | Forward | | |
| Underlying risk | Contracts | Swaps | Total |
| Interest rate | — | (93,563) | (93,563) |
| Foreign exchange | (115,628) | — | (115,628) |
| Total | (115,628) | (93,563) | (209,191) |
Statement of Operations location:
| |
| 3 | Net realized gain (loss) on forward foreign currency exchange contracts. |
| 4 | Net realized gain (loss) on swap transactions. |
| 5 | Net unrealized appreciation (depreciation) on investments, forward foreign currency exchange contracts. |
During the period ended May 31, 2010, the average market value of interest rate swap contracts was $261,627, which represented 0.22% of average net assets.The average market value of forward contracts was $54,814,547, which represented 45.88% of average net assets.
Forward Foreign Currency Exchange Contracts: The fund entered into forward contracts in order to hedge its exposure to changes in foreign currency exchange rates on its foreign portfolio holdings, to settle foreign currency transactions and as a part of its investment strategy. When executing forward contracts, the fund is obligated to buy or sell a foreign currency at a specified rate on a certain date in the future. With respect to sales of forward contracts, the fund incurs a loss if the value of the contract increases between the date the forward contract is opened and the date the forward contract is closed.The fund realizes a gain if the value of the contract decreases between those dates. With respect to purchases of forward contracts, the fund incurs a loss if the value of the contract decreases between the date the forward contract is opened a nd the date the forward contract is closed.The fund realizes a gain if the value of the contract increases between those dates. Any realized gain or loss which occurred during the period is reflected in the Statement of Operations.The fund is exposed to foreign currency risk as a result of changes in value of underlying financial instruments. The fund is also exposed to credit risk associated with counterparty nonperformance on these forward contracts, which is typically limited
32
to the unrealized gain on each open contract.The following summarizes open forward contracts at May 31, 2010:
| | | | |
| | Foreign | | | Unrealized |
| Forward Foreign Currency | Currency | | | Appreciation |
| Exchange Contracts | Amounts | Cost ($) | Value ($) (Depreciation) ($) |
| Purchases: | | | | |
| Brazilian Real, | | | | |
| Expiring 6/4/2010 | 1,097,634 | 599,309 | 605,006 | 5,697 |
| Brazilian Real, | | | | |
| Expiring 6/30/2010 | 21,785,000 | 11,596,401 | 11,924,147 | 327,746 |
| Brazilian Real, | | | | |
| Expiring 6/30/2010 | 4,835,000 | 2,573,725 | 2,646,465 | 72,740 |
| Chilean Peso, | | | | |
| Expiring 6/30/2010 | 211,240,000 | 392,530 | 398,744 | 6,214 |
| Hungarian Forint, | | | | |
| Expiring 6/1/2010 | 660,939,258 | 2,965,183 | 2,948,547 | (16,636) |
| Hungarian Forint, | | | | |
| Expiring 6/30/2010 | 5,165,000 | 23,307 | 22,963 | (344) |
| Indian Rupee, | | | | |
| Expiring 6/30/2010 | 127,125,000 | 2,817,487 | 2,734,209 | (83,278) |
| Indian Rupee, | | | | |
| Expiring 6/30/2010 | 69,685,000 | 1,474,503 | 1,498,788 | 24,285 |
| Indian Rupee, | | | | |
| Expiring 6/30/2010 | 122,970,000 | 2,601,989 | 2,644,843 | 42,854 |
| Indian Rupee, | | | | |
| Expiring 6/30/2010 | 79,035,000 | 1,672,345 | 1,699,888 | 27,543 |
| Malaysian Ringgit, | | | | |
| Expiring 6/30/2010 | 49,940,000 | 15,026,328 | 15,129,070 | 102,742 |
| Malaysian Ringgit, | | | | |
| Expiring 6/30/2010 | 38,150,000 | 11,588,700 | 11,557,349 | (31,351) |
| Mexican New Peso, | | | | |
| Expiring 6/30/2010 | 22,550,000 | 1,723,743 | 1,738,803 | 15,060 |
| Mexican New Peso, | | | | |
| Expiring 6/30/2010 | 34,010,000 | 2,620,488 | 2,622,469 | 1,981 |
| Mexican New Peso, | | | | |
| Expiring 6/30/2010 | 27,800,000 | 2,141,922 | 2,143,624 | 1,702 |
| Mexican New Peso, | | | | |
| Expiring 6/30/2010 | 15,460,000 | 1,167,674 | 1,192,102 | 24,428 |
| Mexican New Peso, | | | | |
| Expiring 6/30/2010 | 375,500,000 | 29,061,218 | 28,954,339 | (106,879) |
| Peruvian New Sol, | | | | |
| Expiring 6/30/2010 | 27,955,000 | 9,798,457 | 9,814,626 | 16,169 |
NOTES TO FINANCIAL STATEMENTS (continued)
| | | | |
| | Foreign | | | Unrealized |
| Forward Foreign Currency | Currency | | | Appreciation |
| Exchange Contracts | Amounts | Cost ($) | Value ($) (Depreciation) ($) |
| Purchases (continued): | | | | |
| Polish Zloty, | | | | |
| Expiring 6/1/2010 | 4,903,738 | 1,489,140 | 1,474,099 | (15,041) |
| Polish Zloty, | | | | |
| Expiring 6/30/2010 | 9,770,000 | 2,912,419 | 2,930,823 | 18,404 |
| Polish Zloty, | | | | |
| Expiring 6/30/2010 | 16,460,000 | 5,008,063 | 4,937,701 | (70,362) |
| Russian Ruble, | | | | |
| Expiring 8/12/2010 | 2,000,000 | 55,991 | 64,785 | 8,794 |
| Russian Ruble, | | | | |
| Expiring 8/12/2010 | 2,950,000 | 94,779 | 95,558 | 779 |
| Russian Ruble, | | | | |
| Expiring 11/16/2010 | 4,465,000 | 146,298 | 143,271 | (3,027) |
| Russian Ruble, | | | | |
| Expiring 11/16/2010 | 6,675,000 | 213,737 | 214,185 | 448 |
| Russian Ruble, | | | | |
| Expiring 11/16/2010 | 13,415,000 | 431,073 | 430,454 | (619) |
| Russian Ruble, | | | | |
| Expiring 11/16/2010 | 6,590,000 | 207,363 | 211,457 | 4,094 |
| Russian Ruble, | | | | |
| Expiring 11/16/2010 | 11,165,000 | 344,705 | 358,257 | 13,552 |
| Russian Ruble, | | | | |
| Expiring 11/16/2010 | 5,880,000 | 184,326 | 188,675 | 4,349 |
| Russian Ruble, | | | | |
| Expiring 11/16/2010 | 6,045,000 | 187,151 | 193,969 | 6,818 |
| Russian Ruble, | | | | |
| Expiring 11/16/2010 | 12,360,000 | 383,881 | 396,602 | 12,721 |
| Russian Ruble, | | | | |
| Expiring 11/16/2010 | 39,440,000 | 1,262,888 | 1,265,532 | 2,644 |
| Russian Ruble, | | | | |
| Expiring 11/16/2010 | 6,825,000 | 218,750 | 218,998 | 248 |
| Russian Ruble, | | | | |
| Expiring 11/16/2010 | 7,110,000 | 229,466 | 228,143 | (1,323) |
| Russian Ruble, | | | | |
| Expiring 11/16/2010 | 14,250,000 | 464,321 | 457,248 | (7,073) |
| Russian Ruble, | | | | |
| Expiring 11/16/2010 | 9,060,000 | 295,210 | 290,713 | (4,497) |
| Russian Ruble, | | | | |
| Expiring 11/16/2010 | 9,380,000 | 305,041 | 300,981 | (4,060) |
| Russian Ruble, | | | | |
| Expiring 11/16/2010 | 12,840,000 | 416,748 | 412,004 | (4,744) |
| Russian Ruble, | | | | |
| Expiring 11/16/2010 | 13,385,000 | 426,138 | 429,492 | 3,354 |
| Russian Ruble, | | | | |
| Expiring 11/16/2010 | 17,415,000 | 549,109 | 558,804 | 9,695 |
34
| | | | | |
| | | Foreign | | | Unrealized |
| Forward Foreign Currency | Currency | | | Appreciation |
| Exchange Contracts | Amounts | Cost ($) | Value ($) (Depreciation) ($) |
| Purchases (continued): | | | | |
| Russian Ruble, | | | | | |
| Expiring 11/16/2010 | 7,080,000 | 225,982 | 227,180 | 1,198 |
| Russian Ruble, | | | | | |
| Expiring 11/16/2010 | 7,635,000 | 244,555 | 244,989 | 434 |
| Russian Ruble, | | | | | |
| Expiring 11/16/2010 | 5,790,000 | 187,016 | 185,787 | (1,229) |
| Russian Ruble, | | | | | |
| Expiring 3/2/2011 | 12,130,000 | 386,675 | 384,766 | (1,909) |
| Russian Ruble, | | | | | |
| Expiring 3/2/2011 | 20,830,000 | 667,628 | 660,732 | (6,896) |
| Russian Ruble, | | | | | |
| Expiring 3/2/2011 | 231,345,000 | 7,685,880 | 7,338,319 | (347,561) |
| Russian Ruble, | | | | | |
| Expiring 3/2/2011 | 86,675,000 | 2,880,525 | 2,749,352 | (131,173) |
| Russian Ruble, | | | | | |
| Expiring 3/2/2011 | 32,180,000 | 1,064,153 | 1,020,757 | (43,396) |
| Russian Ruble, | | | | | |
| Expiring 3/2/2011 | 35,610,000 | 1,150,008 | 1,129,558 | (20,450) |
| Russian Ruble, | | | | | |
| Expiring 3/2/2011 | 74,085,000 | 2,354,147 | 2,349,994 | (4,153) |
| Russian Ruble, | | | | | |
| Expiring 3/2/2011 | 229,870,000 | 7,304,417 | 7,291,532 | (12,885) |
| South African Rand, | | | | |
| Expiring 6/1/2010 | 46,396,353 | 6,122,910 | 6,103,980 | (18,930) |
| South Korean Won, | | | | |
| Expiring | | | | | |
| 6/30/2010 | 19,832,680,000 | 16,248,304 | 16,588,750 | 340,446 |
| Thai Baht, | | | | | |
| Expiring | | | | | |
| 6/30/2010 | | 417,835,000 | 12,900,721 | 12,833,204 | (67,517) |
| Thai Baht, | | | | | |
| Expiring 6/30/2010 | 215,050,000 | 6,601,689 | 6,604,953 | 3,264 |
| Turkish Lira, | | | | | |
| Expiring 6/30/2010 | 2,000,000 | 1,264,142 | 1,268,492 | 4,350 |
| Sales: | | | Proceeds ($) | | |
| Colombian Peso, | | | | | |
| Expiring | | | | | |
| 6/30/2010 | 13,254,652,000 | 6,687,514 | 6,713,468 | (25,954) |
| Czech Republic Koruna, | | | | |
| Expiring 6/30/2010 | 71,120,000 | 3,497,229 | 3,376,173 | 121,056 |
| Euro, | | | | | |
| Expiring 6/30/2010 | 5,085,000 | 6,280,992 | 6,242,374 | 38,618 |
NOTES TO FINANCIAL STATEMENTS (continued)
| | | | |
| | Foreign | | | Unrealized |
| Forward Foreign Currency | Currency | | | Appreciation |
| Exchange Contracts | Amounts | Proceeds ($) | Value ($) (Depreciation) ($) |
| Sales (continued): | | | | |
| Malaysian Ringgit, | | | | |
| Expiring 6/1/2010 | 48,775 | 14,551 | 14,798 | (247) |
| Malaysian Ringgit, | | | | |
| Expiring 6/2/2010 | 38,534,016 | 11,719,591 | 11,691,146 | 28,445 |
| Mexican New Peso, | | | | |
| Expiring 6/1/2010 | 380,537,400 | 29,539,096 | 29,446,522 | 92,574 |
| Peruvian New Sol, | | | | |
| Expiring 6/30/2010 | 10,780,000 | 3,779,804 | 3,784,714 | (4,910) |
| Russian Ruble, | | | | |
| Expiring 8/12/2010 | 4,950,000 | 158,501 | 160,343 | (1,842) |
| South African Rand, | | | | |
| Expiring 6/30/2010 | 101,650,000 | 12,804,686 | 13,296,280 | (491,594) |
| South African Rand, | | | | |
| Expiring 6/30/2010 | 33,430,000 | 4,388,003 | 4,372,796 | 15,207 |
| Thai Baht, | | | | |
| Expiring 6/2/2010 | 215,632,746 | 6,621,611 | 6,623,645 | (2,034) |
| Gross Unrealized | | | | |
| Appreciation | | | | 1,400,653 |
| Gross Unrealized | | | | |
| Depreciation | | | | (1,531,914) |
Swaps: The fund entered into swap agreements to exchange the interest rate on, or return generated by, one nominal instrument for the return generated by another nominal instrument. The fund entered into these agreements to hedge certain market and interest rate risks, to manage the interest rate sensitivity (sometimes called duration) of fixed income securities, to provide a substitute for purchasing or selling particular securities and to increase potential returns.
The fund accrues for the interim payments on swap contracts on a daily basis, with the net amount recorded within unrealized appreciation (depreciation) on swap contracts in the Statement of Assets and Liabilities. Once the interim payments are settled in cash, the net amount is recorded as realized gain (loss) on swaps, in addition to realized gain (loss) recorded upon the termination of swaps contracts in the Statement of Operations. Upfront payments made and/or received by the fund, are recorded as an asset and/or liability in the Statement of Assets and Liabilities and are recorded as a realized gain or loss ratably over the contract’s term/event with the exception of forward starting
36
interest rate swaps which are recorded as realized gains or losses on the termination date. Fluctuations in the value of swap contracts are recorded for financial statement purposes as unrealized appreciation or depreciation on swap transactions.
Interest Rate Swaps: Interest rate swaps involve the exchange of commitments to pay and receive interest based on a notional principal amount.The fund entered into these agreements for a variety of reasons, including to hedge certain market or interest rate risks, to manage the interest rate sensitivity (sometimes called duration) of fixed income securities, to provide a substitute for purchasing and selling particular securities or to increase potential returns.The fund may elect to pay a fixed rate and receive a floating rate, or receive a fixed rate and pay a floating rate on a notional principal amount.The net interest received or paid on interest rate swap agreements is included within unrealized appreciation (depreciation) on swap contracts in the Statement of Assets and Liabilities. Interest rate swaps are valued daily and the change, if any, is recorded as an unrealized gain or loss in the Statement of Operations. When a swap contract is terminated early, the fund records a realized gain or loss equal to the difference between the current realized value and the expected cash flows.
The fund’s maximum risk of loss from counterparty credit risk is the discounted net value of the cash flows to be received from the counter-party over the contract’s remaining life, to the extent that the amount is positive.This risk is mitigated by having a master netting arrangement between the fund and the counterparty and by the posting of collateral by the counterparty to the fund to cover the fund’s exposure to the counterparty.At May 31, 2010, the fund had no open interest rate swaps.
At May 31,2010,the cost of investments for federal income tax purposes was $549,688,694; accordingly, accumulated net unrealized depreciation on investments was $18,059,849, consisting of $2,795,068 gross unrealized appreciation and $20,854,917 gross unrealized depreciation.
|
| REPORT OF INDEPENDENT REGISTERED |
| PUBLIC ACCOUNTING FIRM |
The Board of Trustees and Shareholders
The Dreyfus/Laurel Funds Trust
We have audited the accompanying statement of assets and liabilities of Dreyfus Emerging Markets Debt Local Currency Fund (the “Fund”), a series of The Dreyfus/Laurel Funds Trust, including the statement of investments, as of May 31, 2010, and the related statement of operations for the year then ended, and the statement of changes in net assets and the financial highlights for the year then ended and for the period from September 12, 2008 (commencement of operations) to May 31, 2009. These financial statements and financial highlights are the responsibility of the Fund’s management. Our responsibility is to express an opinion on these financial statements and financial highlights based on our audits.
We conducted our audits in accordance with the standards of the Public Company Accounting Oversight Board (United States). Those standards require that we plan and perform the audit to obtain reasonable assurance about whether the financial statements and financial highlights are free of material misstatement.An audit includes examining, on a test basis, evidence supporting the amounts and disclosures in the financial statements. Our procedures included confirmation of securities owned as of May 31, 2010, by correspondence with the custodian and brokers. An audit also includes assessing the accounting principles used and significant estimates made by management, as well as evaluating the overall financial statement presentation. We believe that our audits provide a reasonable basis for our opinion.
In our opinion, the financial statements and financial highlights referred to above present fairly, in all material respects, the financial position of Dreyfus Emerging Markets Debt Local Currency Fund as of May 31, 2010, and the results of its operations for the year then ended, and the changes in its net assets and the financial highlights for the year then ended and for the period from September 12, 2008 (commencement of operations) to May 31, 2009, in conformity with U.S. generally accepted accounting principles.

New York, New York
July 27, 2010
38
IMPORTANT TAX INFORMATION (Unaudited)
The fund designates the maximum amount allowable but not less than $.0149 per share as a capital gain dividend paid on December 28, 2009 in accordance with Section 852(b)(3)(C) of the Internal Revenue Code. Also, the fund designates the maximum amount allowable but not less than $.0385 per share as a short-term capital gain dividend paid on December 28, 2009 in accordance with Sections 871(k)(2) and 881(e) of the Internal Revenue Code.Also, the fund elects to provide each shareholder with their portion of the fund’s income sourced from foreign countries. The fund designates the maximum amount allowable but not less than $7,662,383 as income sourced from foreign countries for the fiscal year ended May 31, 2010 in accordance with Section 853(c)(2) of the Internal Revenue Code. Where required by federal tax law rules, shareholders will receive notification of their proportionate share of foreign sourced income for the 2010 ca lendar year with Form 1099-DIV which will be mailed by early 2011.
|
| INFORMATION ABOUT THE REVIEW AND APPROVAL |
| OF THE FUND’S MANAGEMENT AGREEMENT (Unaudited) |
At a meeting of the fund’s Board ofTrustees held on February 9,2010,the Board considered the re-approval of the fund’s Management Agreement (“Management Agreement”), pursuant to which the Manager provides the fund with investment advisory and administrative services.The Board members, none of whom are “interested persons” (as defined in the Investment Company Act of 1940, as amended) of the fund, were assisted in their review by independent legal counsel and met with counsel in executive session separate from representatives of the Manager.
Analysis of Nature, Extent and Quality of Services Provided to the Fund. The Board members considered information previously provided to them in a presentation from representatives of the Manager regarding services provided to the fund and other funds in the Dreyfus fund complex, and representatives of the Manager confirmed that there had been no material changes in this information. The Board also discussed the nature, extent and quality of the services provided to the fund pursuant to its Management Agreement. The Manager’s representatives reviewed the fund’s distribution of accounts and the relationships the Manager has with various intermediaries and the different needs of each.The Manager’s representatives noted the distribution channels for the fund, as well as the diversity of distribution among the funds in the Dreyfus fund complex, and t he Manager’s corresponding need for broad, deep, and diverse resources to be able to provide ongoing shareholder services to each distribution channel, including those of the fund.The Manager provided the number of shareholder accounts in the fund,as well as the fund’s asset size.
The Board members also considered the Manager’s research and portfolio management capabilities and that the Manager also provides oversight of day-to-day fund operations, including fund accounting and administration and assistance in meeting legal and regulatory requirements.The Board members also considered the Manager’s extensive administrative, accounting and compliance infrastructure.The Board also considered the Manager’s brokerage policies and practices and the standards applied in seeking best execution.
40
Comparative Analysis of the Fund’s Performance and Management Fee and Expense Ratio. The Board members reviewed the fund’s performance and comparisons to a group of retail front-end load emerging markets debt funds (the “Performance Group”) and to a larger universe of funds, consisting of all retail and institutional emerging markets debt funds (the “Performance Universe”) selected and provided by Lipper, Inc., an independent provider of investment company data.The Board was provided with a description of the methodology Lipper used to select the Performance Group and Performance Universe, as well as the Expense Group and Expense Universe (discussed below). The Board members discussed the results of the comparisons and noted that the fund’s yield performance and total return performance were below their respective Performance Group and Performance Universe medians for the one-year period ended December 31, 2009.The Manager also provided a comparison of the fund’s calendar year total returns to the returns of the fund’s benchmark index.
The Board members also discussed the fund’s contractual and actual management fees and expense ratio and reviewed the range of management fees and expense ratios of a comparable group of funds (the “Expense Group”) and a broader group of funds (the “Expense Universe”), each selected and provided by Lipper. A representative of the Manager noted that the Manager has contractually agreed to waive receipt of its fees and/or assume the expenses of the fund, until October 1, 2010, so that annual direct fund operating expenses (excluding Rule 12b-1 fees, shareholder services fees, taxes, brokerage commissions, commitment fees on borrowings and extraordinary expenses) do not exceed 1.10% of the fund’s average daily net assets.The Board members noted that the fund’s contractual management fee was below the Expense Group median and that, taking into account the waiver, the fund did not pay a management fee for the fiscal year ended May 31, 2009.The Board members also noted that the fund’s expense ratio was above the Expense Group and Expense Universe medians.
|
| INFORMATION ABOUT THE REVIEW AND APPROVAL OF THE |
| FUND’S MANAGEMENT AGREEMENT (Unaudited) (continued) |
Representatives of the Manager noted that there were no other funds managed by the Manager or its affiliates with similar investment objectives, policies and strategies, and included in the same Lipper category as the fund. Representatives of the Manager reviewed with the Board members the fees paid to the Manager or its affiliates by other accounts managed by the Manager or its affiliates with similar investment objectives, policies and strategies as the fund (the “Similar Accounts”). The Manager’s representatives explained the nature of the Similar Accounts and the differences, from the Manager’s perspective, in providing services to such Similar Accounts as compared to managing and providing services to the fund.The Board analyzed differences in fees paid to the Manager and discussed the relationship of the fees paid in light of the services provided.The Board members considered the relevance of the fee i nformation provided for the Similar Accounts to evaluate the appropriateness and reasonableness of the fund’s management fee.
Analysis of Profitability and Economies of Scale. The Manager’s representatives reviewed the dollar amount of expenses allocated and profit received by the Manager and the method used to determine such expenses and profit. The Board previously had been provided with information prepared by an independent consulting firm regarding the Manager’s approach to allocating costs to, and determining the profitability of, individual funds and the entire Dreyfus mutual fund complex.The Board also was informed that the methodology had also been reviewed by an independent registered public accounting firm which, like the consultant, found the methodology to be reasonable. The consulting firm also analyzed where any economies of scale might emerge in connection with the management of the fund.The Board members evaluated the profitability analysis in light of the r elevant circumstances for the fund.The Board members also considered potential benefits to the Manager from acting as investment adviser and noted there were no soft dollar arrangements with respect to trading the fund’s portfolio.
42
It was noted that the Board members should consider the Manager’s profitability with respect to the fund as part of their evaluation of whether the fees under the Management Agreement bear a reasonable relationship to the mix of services provided by the Manager, including the nature, extent and quality of such services and that a discussion of economies of scale is predicated on increasing assets and that, if a fund’s assets had been decreasing, the possibility that the Manager may have realized any economies of scale would be less. It also was noted that the profitability percentage for managing the fund was within the range determined by appropriate court cases to be reasonable given the services rendered and generally superior service levels provided by the Manager.The Board also noted the fee waiver arrangement and its effect on the profitability of the Manager.
At the conclusion of these discussions, the Board agreed that it had been furnished with sufficient information to make an informed business decision with respect to continuation of the fund’s Management Agreement. Based on the discussions and considerations as described above, the Board made the following conclusions and determinations.
The Board concluded that the nature, extent and quality of the services provided by the Manager are adequate and appropriate.
The Board was somewhat concerned with the fund’s relative perfor- mance and determined to closely monitor performance.
The Board concluded, taking into account the fee waiver, that the fee paid by the fund to the Manager was reasonable in light of the services provided, comparative performance, expense and manage- ment fee information, costs of the services provided and profits to be realized and benefits derived or to be derived by the Manager from its relationship with the fund.
|
| INFORMATION ABOUT THE REVIEW AND APPROVAL OF THE |
| FUND’S MANAGEMENT AGREEMENT (Unaudited) (continued) |
The Board determined that the economies of scale which may accrue to the Manager and its affiliates in connection with the management of the fund had been adequately considered by the Manager in con- nection with the management fee rate charged to the fund and that, to the extent in the future it were determined that material economies of scale had not been shared with the fund, the Board would seek to have those economies of scale shared with the fund.
The Board members considered these conclusions and determinations, along with information received on a routine and regular basis throughout the year, and, without any one factor being dispositive, the Board determined that re-approval of the fund’s Management Agreement was in the best interests of the fund and its shareholders.
44
BOARD MEMBERS INFORMATION (Unaudited)
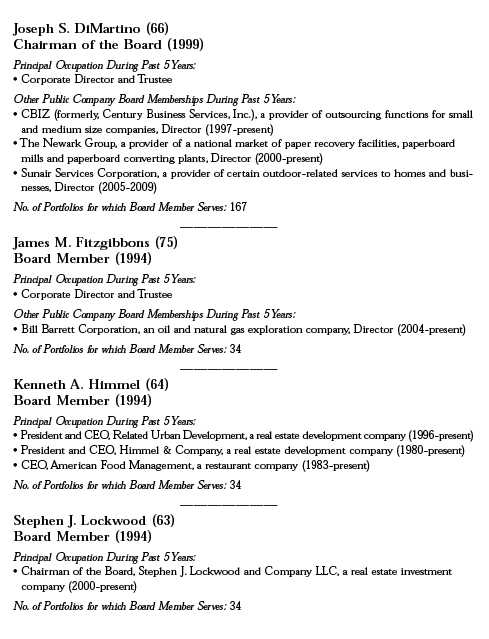
BOARD MEMBERS INFORMATION (Unaudited) (continued)

Once elected all Board Members serve for an indefinite term, but achieve Emeritus status upon reaching age 80.The address of the Board Members and Officers is in c/o The Dreyfus Corporation, 200 Park Avenue, NewYork, NewYork 10166.Additional information about the Board Members is available in the fund’s Statement of Additional Information which can be obtained from Dreyfus free of charge by calling this toll free number: 1-800-554-4611.
46
OFFICERS OF THE FUND (Unaudited)

OFFICERS OF THE FUND (Unaudited) (continued)
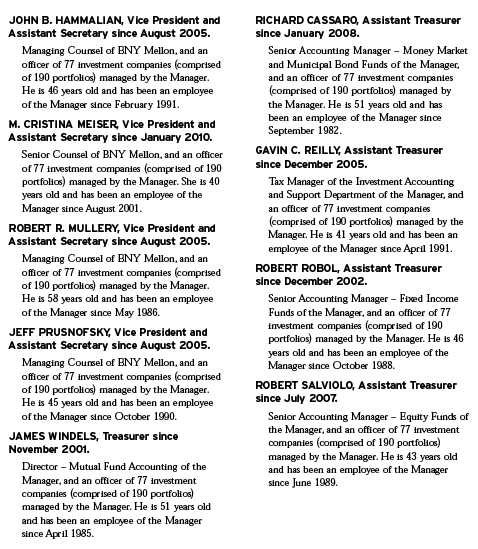
48
For More Information

Telephone Call your financial representative or 1-800-554-4611
Mail The Dreyfus Family of Funds, 144 Glenn Curtiss Boulevard, Uniondale, NY 11556-0144
The fund files its complete schedule of portfolio holdings with the Securities and Exchange Commission (“SEC”) for the first and third quarters of each fiscal year on Form N-Q. The fund’s Forms N-Q are available on the SEC’s website at http://www.sec.gov and may be reviewed and copied at the SEC’s Public Reference Room in Washington, DC. Information on the operation of the Public Reference Room may be obtained by calling 1-800-SEC-0330.
A description of the policies and procedures that the fund uses to determine how to vote proxies relating to portfolio securities is available at http://www.dreyfus.com and on the SEC’s website at http://www.sec.gov. The description of the policies and procedures is also available without charge, upon request, by calling 1-800-645-6561.

Item 2. Code of Ethics.
The Registrant has adopted a code of ethics that applies to the Registrant's principal executive officer, principal financial officer, principal accounting officer or controller, or persons performing similar functions. There have been no amendments to, or waivers in connection with, the Code of Ethics during the period covered by this Report.
Item 3. Audit Committee Financial Expert.
The Registrant's Board has determined that Joseph S. DiMartino, a member of the Audit Committee of the Board, is an audit committee financial expert as defined by the Securities and Exchange Commission (the "SEC"). Joseph S. DiMartino is "independent" as defined by the SEC for purposes of audit committee financial expert determinations.
Item 4. Principal Accountant Fees and Services.
(a) Audit Fees. The aggregate fees billed for each of the last two fiscal years (the "Reporting Periods") for professional services rendered by the Registrant's principal accountant (the "Auditor") for the audit of the Registrant's annual financial statements, or services that are normally provided by the Auditor in connection with the statutory and regulatory filings or engagements for the Reporting Periods, were $70,285 in 2009 and $70,285 in 2010.
(b) Audit-Related Fees. The aggregate fees billed in the Reporting Periods for assurance and related services by the Auditor that are reasonably related to the performance of the audit of the Registrant's financial statements and are not reported under paragraph (a) of this Item 4 were $9,200 in 2009 and $9,200 in 2010. These services consisted of one or more of the following: (i) agreed upon procedures related to compliance with Internal Revenue Code section 817(h), (ii) security counts required by Rule 17f-2 under the Investment Company Act of 1940, as amended, (iii) advisory services as to the accounting or disclosure treatment of Registrant transactions or events and (iv) advisory services to the accounting or disclosure treatment of the actual or potential impact to the Registrant of final or proposed rules, standards or interpretations by the Securities and Exchange Commission, the Financial Accounting Standards Boards or other regulatory or standard-setting bodies.
The aggregate fees billed in the Reporting Periods for non-audit assurance and related services by the Auditor to the Registrant's investment adviser (not including any sub-investment adviser whose role is primarily portfolio management and is subcontracted with or overseen by another investment adviser), and any entity controlling, controlled by or under common control with the investment adviser that provides ongoing services to the Registrant ("Service Affiliates"), that were reasonably related to the performance of the annual audit of the Service Affiliate, which required pre-approval by the Audit Committee were $0 in 2009 and $0 in 2010.
(c) Tax Fees. The aggregate fees billed in the Reporting Periods for professional services rendered by the Auditor for tax compliance, tax advice and tax planning ("Tax Services") were $4,540 in 2009 and $4,540 in 2010. These services consisted of review or preparation of U.S. federal, state, local and excise tax returns. The aggregate fees billed in the Reporting Periods for Tax Services by the Auditor to Service Affiliates which required pre-approval by the Audit Committee were $0 in 2009 and $0 in 2010.
(d) All Other Fees. The aggregate fees billed in the Reporting Periods for products and services provided by the Auditor, other than the services reported in paragraphs (a) through (c) of this Item, were $0 in 2009 and $0 in 2010.
The aggregate fees billed in the Reporting Periods for Non-Audit Services by the Auditor to Service Affiliates, other than the services reported in paragraphs (b) through (c) of this Item, which required pre-approval by the Audit Committee were $0 in 2009 and $0 in 2010.
(e)(1) Audit Committee Pre-Approval Policies and Procedures. The Registrant's Audit Committee has established policies and procedures (the "Policy") for pre-approval (within specified fee limits) of the Auditor's engagements for non-audit services to the Registrant and Service Affiliates without specific case-by-case consideration. The pre-approved services in the Policy can include pre-approved audit services, pre-approved audit-related services, pre-approved tax services and pre-approved all other services. Pre-approval considerations include whether the proposed services are compatible with maintaining the Auditor's independence. Pre-approvals pursuant to the Policy are considered annually.
(e)(2) Note: None of the services described in paragraphs (b) through (d) of this Item 4 were approved by the Audit Committee pursuant to paragraph (c)(7)(i)(C) of Rule 2-01 of Regulation S-X.
(f) None of the hours expended on the principal accountant's engagement to audit the registrant's financial statements for the most recent fiscal year were attributed to work performed by persons other than the principal account's full-time, permanent employees.
Non-Audit Fees. The aggregate non-audit fees billed by the Auditor for services rendered to the Registrant, and rendered to Service Affiliates, for the Reporting Periods were $5,285,507 in 2009 and $3,352,000 in 2010.
Auditor Independence. The Registrant's Audit Committee has considered whether the provision of non-audit services that were rendered to Service Affiliates which were not pre-approved (not requiring pre-approval) is compatible with maintaining the Auditor's independence.
| |
| Item 5. | Audit Committee of Listed Registrants. |
| | Not applicable. |
| Item 6. | Investments. |
| (a) | Not applicable. |
| Item 7. | Disclosure of Proxy Voting Policies and Procedures for Closed-End Management |
| | Investment Companies. |
| | Not applicable. |
| Item 8. | Portfolio Managers of Closed-End Management Investment Companies. |
| | Not applicable. |
| Item 9. | Purchases of Equity Securities by Closed-End Management Investment Companies and |
| | Affiliated Purchasers. |
| | Not applicable. |
| Item 10. | Submission of Matters to a Vote of Security Holders. |
| There have been no material changes to the procedures applicable to Item 10. |
| |
| Item 11. | Controls and Procedures. |
(a) The Registrant's principal executive and principal financial officers have concluded, based on their evaluation of the Registrant's disclosure controls and procedures as of a date within 90 days of the filing date of this report, that the Registrant's disclosure controls and procedures are reasonably designed to ensure that information required to be disclosed by the Registrant on Form N-CSR is recorded, processed, summarized and reported within the required time periods and that information required to be disclosed by the Registrant in the reports that it files or submits on Form N-CSR is accumulated and communicated to the Registrant's management, including its principal executive and principal financial officers, as appropriate to allow timely decisions regarding required disclosure.
(b) There were no changes to the Registrant's internal control over financial reporting that occurred during the second fiscal quarter of the period covered by this report that have materially affected, or are reasonably likely to materially affect, the Registrant's internal control over financial reporting.
(a)(1) Code of ethics referred to in Item 2.
(a)(2) Certifications of principal executive and principal financial officers as required by Rule 30a-2(a) under the Investment Company Act of 1940.
(a)(3) Not applicable.
(b) Certification of principal executive and principal financial officers as required by Rule 30a-2(b) under the Investment Company Act of 1940.
SIGNATURES
Pursuant to the requirements of the Securities Exchange Act of 1934 and the Investment Company Act of 1940, the Registrant has duly caused this Report to be signed on its behalf by the undersigned, thereunto duly authorized.
The Dreyfus/Laurel Funds Trust
| |
| By: | /s/ Bradley J. Skapyak |
| | Bradley J. Skapyak, |
| | President |
| |
| Date: | 07/23/2010 |
Pursuant to the requirements of the Securities Exchange Act of 1934 and the Investment Company Act of 1940, this Report has been signed below by the following persons on behalf of the Registrant and in the capacities and on the dates indicated.
| |
| By: | /s/ Bradley J. Skapyak |
| | Bradley J. Skapyak, |
| | President |
| |
| Date: | 07/23/2010 |
| |
| By: | /s/ James Windels |
| James Windels |
| | Treasurer |
| |
| Date: | 07/23/2010 |
EXHIBIT INDEX
(a)(1) Code of ethics referred to in Item 2.
(a)(2) Certifications of principal executive and principal financial officers as required by Rule 30a-2(a) under the Investment Company Act of 1940. (EX-99.CERT)
(b) Certification of principal executive and principal financial officers as required by Rule 30a-2(b) under the Investment Company Act of 1940. (EX-99.906CERT)