UNITED STATES
SECURITIES AND EXCHANGE COMMISSION
Washington, D.C. 20549 |
CERTIFIED SHAREHOLDER REPORT OF REGISTERED MANAGEMENT
INVESTMENT COMPANIES |
| Investment Company Act file number | | 811- 524 |
The Dreyfus/Laurel Funds Trust
(Exact name of Registrant as specified in charter) |
c/o The Dreyfus Corporation
200 Park Avenue
New York, New York 10166
(Address of principal executive offices) (Zip code) |
Michael A. Rosenberg, Esq.
200 Park Avenue
New York, New York 10166
(Name and address of agent for service) |
| Registrant's telephone number, including area code: | | (212) 922-6000 |
| Date of fiscal year end: | | 10/31 |
| Date of reporting period: | | 10/31/09 |
The following N-CSR relates only to the series of the Registrant listed below, and does not affect the other series of the Registrant, which have different fiscal year ends and, therefore, different N-CSR reporting requirements. Separate N-CSR Forms will be filed for those series, as appropriate.
| | Dreyfus Global Equity Income Fund
Dreyfus International Bond Fund |
| Item 1. | | Reports to Stockholders. |
| | Dreyfus
Global Equity
Income Fund |
| | ANNUAL REPORT October 31, 2009 |

Save time. Save paper. View your next shareholder report online as soon as it’s available. Log into www.dreyfus.com and sign up for Dreyfus eCommunications. It’s simple and only takes a few minutes.
The views expressed in this report reflect those of the portfolio manager only through the end of the period covered and do not necessarily represent the views of Dreyfus or any other person in the Dreyfus organization. Any such views are subject to change at any time based upon market or other conditions and Dreyfus disclaims any responsibility to update such views.These views may not be relied on as investment advice and, because investment decisions for a Dreyfus fund are based on numerous factors, may not be relied on as an indication of trading intent on behalf of any Dreyfus fund.
| | Contents |
| |
| | THE FUND |
| |
| 2 | A Letter from the Chairman and CEO |
| |
| 3 | Discussion of Fund Performance |
| |
| 6 | Fund Performance |
| |
| 8 | Understanding Your Fund’s Expenses |
| |
| 8 | Comparing Your Fund’s Expenses With Those of Other Funds |
| |
| 9 | Statement of Investments |
| |
| 13 | Statement of Assets and Liabilities |
| |
| 14 | Statement of Operations |
| |
| 15 | Statement of Changes in Net Assets |
| |
| 17 | Financial Highlights |
| |
| 20 | Notes to Financial Statements |
| |
| 33 | Report of Independent Registered Public Accounting Firm |
| |
| 34 | Important Tax Information |
| |
| 35 | Board Members Information |
| |
| 37 | Officers of the Fund |
| |
| | FOR MORE INFORMATION |
| |
| | Back Cover |
| |
Dreyfus
Global Equity
Income Fund |
The Fund

A LETTER FROM THE CHAIRMAN AND CEO
Dear Shareholder:
We are pleased to present this annual report for Dreyfus Global Equity Income Fund, covering the 12-month period from November 1, 2008, through October 31, 2009.
Recent reports of positive economic growth in the United States’, European and Asian markets may have signaled the end of the deep global recession that technically began here in the U.S. in late 2007. Signs that the world economies finally have turned a corner include inventory rebuilding among manufacturers, improvements in domestic housing, and more robust consumer spending. These developments helped fuel a sustained worldwide stock rally since the early spring, with the most beaten-down securities in less developed nations generally leading the rebound. Higher-quality stocks within more developed markets have participated in the rally, but have so far lagged on a relative performance basis.
In our judgment, the global financial markets currently appear poised to enter into a new phase in which underlying fundamentals, such as sound capital and financial structures—and not bargain hunting—are likely to drive investment returns. Of course, the best strategy for your portfolio depends not only on your view of the global economy’s direction, but on your current financial needs, future goals and attitudes toward risk. Your financial advisor can help you decide which investments have the potential to benefit from a recovery while guarding against the risk that may accompany unexpected market developments.
For information about how the fund performed during the reporting period, as well as market perspectives, we have provided a Discussion of Fund Performance.
Thank you for your continued confidence and support.
Jonathan R. Baum
Chairman and Chief Executive Officer
The Dreyfus Corporation
November 16, 2009 |
2

DISCUSSION OF FUND PERFORMANCE
For the period of November 1, 2008, through October 31, 2009, as provided by James Harries, Portfolio Manager
Fund and Market Performance Overview
For the 12-month period ended October 31, 2009, Dreyfus Global Equity Income Fund’s Class A shares produced a total return of 27.73%, Class C shares returned 26.53% and Class I shares returned 28.21%.1 In comparison, the fund’s benchmark, the FTSE World Index (the “Index”), produced a total return of 22.59% for the same period.2
Global stocks declined sharply early in the reporting period due to a global recession and banking crisis. However, equities throughout the world later rebounded strongly, enabling the markets to offset losses taken earlier in the reporting period.The fund produced higher returns than its benchmark, primarily due to the success of its security selection strategy in a number of economic sectors.
The Fund’s Investment Approach
The fund seeks total return, consisting of capital appreciation and income.To pursue this goal, the fund normally invests at least 80% of its assets in equity securities, seeking to focus on dividend-paying stocks of companies located in the developed capital markets, such as the United States, Canada, Japan, Australia, Hong Kong and Western Europe. The fund may invest in the securities of companies of any market capitalization, and it may invest up to 30% of its assets in emerging markets.
We combine “top-down” analysis of current economic trends and investment themes with “bottom-up” stock selection based on fundamental research. Within markets and sectors deemed to be relatively attractive, we seek attractively priced stocks of companies that we believe to have sustainable competitive advantages.
Global Equities Rebounded in a Sustained Rally
The reporting period saw both staggering losses and impressive gains in global stock markets. During the fall and winter of 2008 and into early
The Fund 3
| DISCUSSION OF FUND PERFORMANCE (continued) |
2009, investor sentiment was depressed by a deep recession characterized by rising unemployment rates, slumping housing prices and plummeting consumer confidence in many markets.At the same time, the world was in the grip of a financial crisis that limited credit availability and nearly led to the collapse of the global banking system. The effects of the financial crisis were particularly severe among multinational banks.
By mid-March, however, investor sentiment began to improve as it became clearer that massive government interventions had helped forestall a collapse of the global banking system. Stock markets throughout the world continued to rally as signs of economic recovery began to appear, and investors grew more tolerant of risks they previously had avoided. The rebound was led by stocks and market sectors that had been severely beaten down during the downturn.
Stock Selection Strategy Bolstered Fund Performance
Although the global market rebound generally was dominated by lower-quality stocks that pay low or no dividends, strong selections of individual dividend-paying companies helped the fund outperform its benchmark for the reporting period. For example, the utilities sector proved to be one of the benchmark’s poorer performing segments, but the fund’s holdings of Brazilian water and electricity producers Cia de Saneamento de Minas Gerais andTerna Participacoes,respectively,ranked among the fund’s top performers.The fund also achieved strong relative results among financial companies, where an underweighted position cushioned relative weakness in the troubled financials sector. In addition, we focused on banks that appeared poised to benefit from exposure to growing emerging markets, such as Standard Chartered in the United Kingdom, DBS Group Holdings in Singapore and Bank Sarasin & Cie in Switzerland. Conversely, we generally avoided the large, multinational banks at the epicenter of the financial crisis.Also in the financials sector, real estate investment trusts Mapletree Logistics Trust and Hong Kong Land Holdings and securities exchanges Bursa Malaysia and Deutsche Boerse contributed positively to the fund’s relative performance.
In the oil and gas sector, the fund’s lack of exposure to U.S.-based ExxonMobil buoyed returns, as did a position in Hong Kong’s
4
CNOOC. Industrial giant Noble Group benefited from rising commodity prices, and German basic materials producers K+S and Symrise advanced in anticipation of a stronger global economy.
Overall, the fund encountered relatively few disappointments during the reporting period with the exception that its underweighted exposure to the technology sector prevented the fund from participating more fully in relative strength among technology companies. In addition, the fund’s consumer goods holdings generally lagged sector averages, primarily due to weakness in tobacco producer Reynolds American.
Finding Opportunities in a Muted Recovery
As of the reporting period’s end, we have remained cautious with regard to the global economy. Historically, recessions driven by balance sheet deleveraging have been followed by relatively weak recoveries,and recent stimulative actions by monetary and government authorities appear to have done more to boost prices of financial assets than economic condi-tions.Therefore, we generally have favored high-quality, dividend-paying companies that we believe have good growth prospects, especially those with exposure to faster-growing emerging markets. In our judgment, maintaining a disciplined approach to identifying such opportunities is key to doing well over the long term.
November 16, 2009
Please note, the position in any security highlighted with italicized typeface was sold during the reporting period.
| 1 | Total return includes reinvestment of dividends and any capital gains paid, and does not take into consideration the maximum initial sales charge in the case of Class A shares, or the applicable contingent deferred sales charge imposed on redemptions in the case of Class C shares. Had these charges been reflected, returns would have been lower. Past performance is no guarantee of future results. Share price and investment return fluctuate such that upon redemption, fund shares may be worth more or less than their original cost. Return figures provided reflect the absorption of certain fund expenses by The Dreyfus Corporation through March 1, 2010, at which time it may be extended, terminated or modified. Had these expenses not been absorbed, the fund’s returns would have been lower. |
| |
| 2 | SOURCE: BLOOMBERG L.P. — Reflects reinvestment of dividends and, where applicable, capital gain distributions.The FTSE World Index is an unmanaged, free-floating, market- capitalization weighted index that is designed to measure the performance of 90% of the world’s investable stocks issued by large and midcap companies in developed and advanced emerging markets. |
| |
The Fund 5
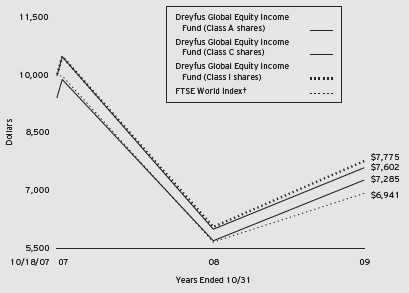
Comparison of change in value of $10,000 investment in Dreyfus Global Equity Income Fund Class A shares, Class C shares and Class I shares and the FTSE World Index
† Source: Bloomberg L.P.
Past performance is not predictive of future performance.
The above graph compares a $10,000 investment made in Class A, Class C and Class I shares of Dreyfus Global Equity Income Fund on 10/18/07 (inception date) to a $10,000 investment made in the FTSE World Index (the “Index”) on that date. All dividends and capital gain distributions are reinvested. For comparative purposes, the value of the Index on 10/31/07 is used as the beginning value on 10/18/07.
The fund’s performance shown in the line graph takes into account the maximum initial sales charge on Class A shares and all other applicable fees and expenses on all classes.The Index is a widely accepted, unmanaged, free-float market capitalization-weighted index that is designed to measure the performance of 90% of the world’s investable stocks issued by large and mid-cap companies in developed and advanced emerging markets. Unlike a mutual fund, the Index is not subject to charges, fees and other expenses. Investors cannot invest directly in any index. Further information relating to fund performance, including expense reimbursements, if applicable, is contained in the Financial Highlights section of the prospectus and elsewhere in this report.
6
| Average Annual Total Returns as of 10/31/09 | | | | | | |
| |
| | | Inception | | | | From |
| | | Date | | 1 Year | | Inception |
| |
| |
| |
|
| Class A shares | | | | | | |
| with maximum sales charge (5.75%) | | 10/18/07 | | 20.36% | | –14.39% |
| without sales charge | | 10/18/07 | | 27.73% | | –11.87% |
| Class C shares | | | | | | |
| with applicable redemption charge † | | 10/18/07 | | 25.53% | | –12.58% |
| without redemption | | 10/18/07 | | 26.53% | | –12.58% |
| Class I shares | | 10/18/07 | | 28.21% | | –11.61% |
Past performance is not predictive of future performance.The fund’s performance shown in the graph and table does not reflect the deduction of taxes that a shareholder would pay on fund distributions or the redemption of fund shares.
| † The maximum contingent deferred sales charge for Class C shares is 1% for shares redeemed within one year of the |
| date of purchase. |
The Fund 7
UNDERSTANDING YOUR FUND’S EXPENSES (Unaudited)
As a mutual fund investor, you pay ongoing expenses, such as management fees and other expenses. Using the information below, you can estimate how these expenses affect your investment and compare them with the expenses of other funds.You also may pay one-time transaction expenses, including sales charges (loads) and redemption fees, which are not shown in this section and would have resulted in higher total expenses. For more information, see your fund’s prospectus or talk to your financial adviser.
Review your fund’s expenses
The table below shows the expenses you would have paid on a $1,000 investment in Dreyfus Global Equity Income Fund from May 1, 2009 to October 31, 2009. It also shows how much a $1,000 investment would be worth at the close of the period, assuming actual returns and expenses.
| | Expenses and Value of a $1,000 Investment
assuming actual returns for the six months ended October 31, 2009 |
| | | Class A | | Class C | | Class I |
| |
| |
| |
|
| Expenses paid per $1,000† | | $ 8.49 | | $ 12.72 | | $ 7.08 |
| Ending value (after expenses) | | $1,259.30 | | $1,252.50 | | $1,263.90 |
| | COMPARING YOUR FUND’S EXPENSES
WITH THOSE OF OTHER FUNDS (Unaudited) |
Using the SEC’s method to compare expenses
The Securities and Exchange Commission (SEC) has established guidelines to help investors assess fund expenses. Per these guidelines, the table below shows your fund’s expenses based on a $1,000 investment, assuming a hypothetical 5% annualized return. You can use this information to compare the ongoing expenses (but not transaction expenses or total cost) of investing in the fund with those of other funds.All mutual fund shareholder reports will provide this information to help you make this comparison. Please note that you cannot use this information to estimate your actual ending account balance and expenses paid during the period.
| | Expenses and Value of a $1,000 Investment
assuming a hypothetical 5% annualized return for the six months ended October 31, 2009 |
| | | Class A | | Class C | | Class I |
| |
| |
| |
|
| Expenses paid per $1,000† | | $ 7.58 | | $ 11.37 | | $ 6.31 |
| Ending value (after expenses) | | $1,017.69 | | $1,013.91 | | $1,018.95 |
| † Expenses are equal to the fund’s annualized expense ratio of 1.49% for Class A, 2.24% for Class C and 1.24% |
| for Class I, multiplied by the average account value over the period, multiplied by 184/365 (to reflect the one-half |
| year period). |
8
STATEMENT OF INVESTMENTS
October 31, 2009 |
| Common Stocks—93.6% | | Shares | | Value ($) |
| |
| |
|
| Australia—2.7% | | | | |
| AMP | | 14,085 | | 73,572 |
| QBE Insurance Group | | 4,823 | | 97,073 |
| | | | | 170,645 |
| Brazil—7.8% | | | | |
| Cia de Saneamento de Minas Gerais | | 10,000 | | 178,531 |
| Tele Norte Leste Participacoes, ADR | | 10,082 | | 192,163 |
| Terna Participacoes | | 6,046 | | 125,958 |
| | | | | 496,652 |
| France—3.0% | | | | |
| Suez Environnement | | 3,160 | | 70,384 |
| Total | | 2,033 | | 121,574 |
| | | | | 191,958 |
| Germany—7.5% | | | | |
| Deutsche Post | | 10,038 | | 169,809 |
| Deutsche Telekom | | 6,903 | | 94,375 |
| K+S | | 850 | | 46,509 |
| Muenchener Rueckversicherungs | | 563 | | 89,184 |
| Symrise | | 4,155 | | 76,495 |
| | | | | 476,372 |
| Hong Kong—6.6% | | | | |
| CNOOC | | 45,000 | | 67,466 |
| Hongkong Land Holdings | | 17,000 | | 79,695 |
| Hopewell Highway Infrastructure | | 167,295 | | 100,770 |
| HSBC Holdings | | 9,600 | | 105,163 |
| Link REIT | | 29,000 a | | 65,703 |
| | | | | 418,797 |
| Israel—.6% | | | | |
| Israel Chemicals | | 2,958 | | 35,224 |
| Italy—1.9% | | | | |
| ENI | | 4,907 | | 122,114 |
| Japan—3.0% | | | | |
| Lawson | | 1,400 | | 62,511 |
| Nintendo | | 200 | | 51,000 |
| Nomura Holdings | | 3,700 | | 25,891 |
| Takeda Pharmaceutical | | 1,300 | | 52,278 |
| | | | | 191,680 |
The Fund 9
| STATEMENT OF INVESTMENTS (continued) |
| Common Stocks (continued) | | Shares | | Value ($) |
| |
| |
|
| Malaysia—.8% | | | | |
| Bursa Malaysia | | 22,600 | | 53,649 |
| Netherlands—5.5% | | | | |
| Reed Elsevier | | 5,830 | | 68,123 |
| Royal Dutch Shell, Cl. A | | 4,709 | | 140,055 |
| Unilever | | 4,583 | | 141,670 |
| | | | | 349,848 |
| Norway—2.7% | | | | |
| Aker Solutions | | 3,156 | | 38,087 |
| Statoil ASA | | 5,573 | | 132,271 |
| | | | | 170,358 |
| Philippines—1.5% | | | | |
| Philippine Long Distance Telephone | | 1,806 | | 97,420 |
| Poland—1.6% | | | | |
| Telekomunikacja Polska | | 17,649 | | 104,320 |
| Singapore—7.0% | | | | |
| DBS Group Holdings | | 9,500 | | 86,689 |
| Mapletree Logistics Trust | | 157,250 | | 83,361 |
| Parkway Holdings | | 78,666 | | 140,823 |
| Singapore Technologies Engineering | | 68,000 | | 137,199 |
| | | | | 448,072 |
| South Korea—1.9% | | | | |
| LG Telecom | | 16,133 | | 121,401 |
| Switzerland—5.3% | | | | |
| Bank Sarasin & Cie, Cl. B | | 1,100 | | 43,908 |
| Novartis | | 2,657 | | 139,208 |
| Verwaltungs-Und Privat-Bank | | 390 | | 41,817 |
| Zurich Financial Services | | 497 | | 114,282 |
| | | | | 339,215 |
10
| Common Stocks (continued) | | Shares | | Value ($) |
| |
| |
|
| Taiwan—2.3% | | | | |
| HTC | | 5,780 | | 57,791 |
| Taiwan Semiconductor Manufacturing | | 50,421 | | 91,707 |
| | | | | 149,498 |
| Thailand—2.2% | | | | |
| Advanced Info Service | | 55,300 | | 141,019 |
| United Kingdom—10.3% | | | | |
| BAE Systems | | 11,517 | | 59,448 |
| Cable & Wireless | | 54,469 | | 129,626 |
| GlaxoSmithKline | | 6,133 | | 125,823 |
| ICAP | | 9,000 | | 60,090 |
| Vodafone Group | | 97,977 | | 216,363 |
| Willis Group Holdings | | 2,300 | | 62,100 |
| | | | | 653,450 |
| United States—19.4% | | | | |
| Annaly Capital Management | | 7,042 a | | 119,080 |
| AT & T | | 4,605 | | 118,210 |
| Cal-Maine Foods | | 2,090 | | 56,744 |
| Coca-Cola | | 1,190 | | 63,439 |
| ConocoPhillips | | 2,091 | | 104,926 |
| Eli Lilly & Co. | | 1,782 | | 60,606 |
| Merck & Co. | | 4,348 | | 134,484 |
| PDL BioPharma | | 7,336 | | 61,696 |
| Pfizer | | 7,350 | | 125,170 |
| Philip Morris International | | 2,633 | | 124,699 |
| Reynolds American | | 5,491 | | 266,204 |
| | | | | 1,235,258 |
| Total Common Stocks | | | | |
| (cost $5,718,944) | | | | 5,966,950 |
The Fund 11
| STATEMENT OF INVESTMENTS (continued) |
| | | | | Coupon | | Maturity | | Principal | | |
| Bonds and Notes—3.0% | | | | Rate (%) | | Date | | Amount ($) | | Value ($) |
| |
| |
| |
| |
| |
|
| Germany—1.1% | | | | | | | | | | |
| Fresenius Finance Jersey, | | | | | | | | | | |
| Sr. Unsub. Bonds, Ser. FME | | EUR | | 5.63 | | 8/14/11 | | 50,000 b | | 72,111 |
| United Kingdom—1.9% | | | | | | | | | | |
| Standard Chartered, | | | | | | | | | | |
| Jr. Sub. Notes | | | | 8.13 | | 11/27/13 | | 120,000 | | 120,936 |
| Total Bonds and Notes | | | | | | | | | | |
| (cost $177,880) | | | | | | | | | | 193,047 |
| |
| Preferred Stocks—1.7% | | | | | | | | Shares | | Value ($) |
| |
| |
| |
| |
| |
|
| Brazil—1.1% | | | | | | | | | | |
| Vale Capital, | | | | | | | | | | |
| Ser. RIO, Conv. Cum. $3.73 | | | | | | | | 1,525 | | 74,801 |
| United States—.6% | | | | | | | | | | |
| Bunge, | | | | | | | | | | |
| Conv. Cum. $51.25 | | | | | | | | 61 | | 35,990 |
| Total Preferred Stocks | | | | | | | | | | |
| (cost $115,491) | | | | | | | | | | 110,791 |
| |
| Total Investments (cost $6,012,315) | | | | | | 98.3% | | 6,270,788 |
| Cash and Receivables (Net) | | | | | | | | 1.7% | | 104,814 |
| Net Assets | | | | | | | | 100.0% | | 6,375,602 |
| ADR—American Depository Receipts |
| a | | Investment in Real Estate Investment Trust. |
| b | | Principal amount stated in U.S. Dollars unless otherwise noted. |
| | | EUR— Euro |
| Portfolio Summary (Unaudited)† | | | | |
| |
| | | Value (%) | | | | Value (%) |
| |
| |
| |
|
| Financial | | 20.7 | | Utilities | | 5.9 |
| Telecommunications | | 19.1 | | Materials | | 3.7 |
| Health Care | | 14.3 | | Technology | | 2.3 |
| Consumer Goods | | 11.6 | | Consumer Services | | 2.0 |
| Oil & Gas | | 11.4 | | | | |
| Industrial | | 7.3 | | | | 98.3 |
| |
| † Based on net assets. | | | | | | |
| See notes to financial statements. | | | | | | |
12
STATEMENT OF ASSETS AND LIABILITIES
October 31, 2009
| | | | | Cost | | Value |
| |
| |
| |
|
| Assets ($): | | | | | | |
| Investments in securities—See Statement of Investments | | 6,012,315 | | 6,270,788 |
| Cash | | | | | | 96,453 |
| Cash denominated in foreign currencies | | | | 35,229 | | 35,523 |
| Dividends and interest receivable | | | | | | 31,416 |
| Unrealized appreciation on forward foreign | | | | | | |
| currency exchange contracts—Note 4 | | | | | | 7,938 |
| Prepaid expenses | | | | | | 24,082 |
| | | | | | | 6,466,200 |
| Liabilities ($): | | | | | | |
| Due to The Dreyfus Corporation and affiliates—Note 3(d) | | | | 21,382 |
| Payable for investment securities purchased | | | | | | 50,222 |
| Unrealized depreciation on forward foreign currency | | | | | | |
| exchange contracts—Note 4 | | | | | | 5,807 |
| Accrued expenses | | | | | | 13,187 |
| | | | | | | 90,598 |
| Net Assets ($) | | | | | | 6,375,602 |
| Composition of Net Assets ($): | | | | | | |
| Paid-in capital | | | | | | 7,709,285 |
| Accumulated undistributed investment income—net | | | | | | 59,434 |
| Accumulated net realized gain (loss) on investments | | | | | | (1,654,509) |
| Accumulated net unrealized appreciation (depreciation) | | | | |
| on investments and foreign currency transactions | | | | | | 261,392 |
| Net Assets ($) | | | | | | 6,375,602 |
| |
| |
| |
|
| |
| |
| Net Asset Value Per Share | | | | | | |
| | | Class A | | Class C | | Class I |
| |
| |
| |
|
| Net Assets ($) | | 3,738,312 | | 688,070 | | 1,949,220 |
| Shares Outstanding | | 414,214 | | 76,332 | | 220,647 |
| Net Asset Value Per Share ($) | | 9.03 | | 9.01 | | 8.83 |
| |
| See notes to financial statements. | | | | | | |
The Fund 13
STATEMENT OF OPERATIONS
Year Ended October 31, 2009 |
| Investment Income ($): | | |
| Income: | | |
| Cash dividends (net of $17,333 foreign taxes withheld at source): | | |
| Unaffiliated issuers | | 304,785 |
| Affiliated issuers | | 69 |
| Interest | | 13,587 |
| Total Income | | 318,441 |
| Expenses: | | |
| Management fee—Note 3(a) | | 41,703 |
| Registration fees | | 46,191 |
| Custodian fees—Note 3(d) | | 32,807 |
| Auditing fees | | 23,674 |
| Shareholder servicing costs—Note 3(d) | | 14,049 |
| Legal fees | | 9,754 |
| Distribution fees—Note 3(c) | | 5,719 |
| Prospectus and shareholders’ reports | | 4,608 |
| Trustees’ fees and expenses—Note 3(b) | | 1,727 |
| Interest expense—Note 2 | | 41 |
| Loan commitment fees—Note 2 | | 36 |
| Miscellaneous | | 21,848 |
| Total Expenses | | 202,157 |
| Less—expense reimbursement from The Dreyfus Corporation | | |
| due to undertaking—Note 3(a) | | (125,098) |
| Less—reduction in fees due to earnings credits—Note 1(c) | | (346) |
| Less—Trustees’ fees reimbursed by the Manager—Note 3(b) | | (441) |
| Net Expenses | | 76,272 |
| Investment Income—Net | | 242,169 |
| Realized and Unrealized Gain (Loss) on Investments—Note 4 ($): | | |
| Net realized gain (loss) on investments and foreign currency transactions | | (1,050,762) |
| Net realized gain (loss) on forward foreign currency exchange contracts | | (39,707) |
| Net Realized Gain (Loss) | | (1,090,469) |
| Net unrealized appreciation (depreciation) on investments and | | |
| foreign currency transactions [including ($39,253) net unrealized | | |
| (depreciation) on forward foreign currency exchange contracts] | | 2,201,924 |
| Net Realized and Unrealized Gain (Loss) on Investments | | 1,111,455 |
| Net Increase in Net Assets Resulting from Operations | | 1,353,624 |
| |
| See notes to financial statements. | | |
14
STATEMENT OF CHANGES IN NET ASSETS
| | | Year Ended October 31, |
| | |
|
| | | 2009a | | 2008 |
| |
| |
|
| Operations ($): | | | | |
| Investment income—net | | 242,169 | | 159,333 |
| Net realized gain (loss) on investments | | (1,090,469) | | (595,193) |
| Net unrealized appreciation | | | | |
| (depreciation) on investments | | 2,201,924 | | (2,141,662) |
| Net Increase (Decrease) in Net Assets | | | | |
| Resulting from Operations | | 1,353,624 | | (2,577,522) |
| Dividends to Shareholders from ($): | | | | |
| Investment income—net: | | | | |
| Class A Shares | | (109,249) | | (94,769) |
| Class C Shares | | (21,762) | | (26,748) |
| Class I Shares | | (23,917) | | (8,832) |
| Class T Shares | | (8,128) | | (8,647) |
| Total Dividends | | (163,056) | | (138,996) |
| Beneficial Interest Transactions ($): | | | | |
| Net proceeds from shares sold: | | | | |
| Class A Shares | | 1,065,848 | | 2,981,925 |
| Class C Shares | | 155,815 | | 1,176,028 |
| Class I Shares | | 1,987,426 | | 11,907 |
| Class T Shares | | — | | 42,500 |
| Dividends reinvested: | | | | |
| Class A Shares | | 43,871 | | 29,173 |
| Class C Shares | | 6,886 | | 8,737 |
| Class I Shares | | 264 | | 336 |
| Class T Shares | | 64 | | 66 |
| Cost of shares redeemed: | | | | |
| Class A Shares | | (602,720) | | (890,944) |
| Class C Shares | | (441,941) | | (48,989) |
| Class I Shares | | (591,401) | | (6,422) |
| Class T Shares | | (184,234) | | — |
| Increase (Decrease) in Net Assets from | | | | |
| Beneficial Interest Transactions | | 1,439,878 | | 3,304,317 |
| Total Increase (Decrease) in Net Assets | | 2,630,446 | | 587,799 |
| Net Assets ($): | | | | |
| Beginning of Period | | 3,745,156 | | 3,157,357 |
| End of Period | | 6,375,602 | | 3,745,156 |
| Undistributed investment income—net | | 59,434 | | 32,712 |
The Fund 15
STATEMENT OF CHANGES IN NET ASSETS (continued)
| | | Year Ended October 31, |
| | |
|
| | | 2009a | | 2008 |
| |
| |
|
| Capital Share Transactions: | | | | |
| Class Ab | | | | |
| Shares sold | | 149,182 | | 255,295 |
| Shares issued for dividends reinvested | | 5,939 | | 2,738 |
| Shares redeemed | | (84,445) | | (82,820) |
| Net Increase (Decrease) in Shares Outstanding | | 70,676 | | 175,213 |
| Class C | | | | |
| Shares sold | | 21,334 | | 95,823 |
| Shares issued for dividends reinvested | | 929 | | 809 |
| Shares redeemed | | (61,077) | | (5,486) |
| Net Increase (Decrease) in Shares Outstanding | | (38,814) | | 91,146 |
| Class I | | | | |
| Shares sold | | 275,451 | | 945 |
| Shares issued for dividends reinvested | | 31 | | 31 |
| Shares redeemed | | (78,918) | | (893) |
| Net Increase (Decrease) in Shares Outstanding | | 196,564 | | 83 |
| Class Tb | | | | |
| Shares sold | | — | | 3,360 |
| Shares issued for dividends reinvested | | 9 | | 6 |
| Shares redeemed | | (27,375) | | — |
| Net Increase (Decrease) in Shares Outstanding | | (27,366) | | 3,366 |
| a Effective as of the close of business on February 4, 2009, the fund no longer offers Class T shares. |
| b On the close of business on February 4, 2009, 27,375 Class T shares representing $184,234 were converted to |
| 26,935 Class A shares. |
| See notes to financial statements. |
16
FINANCIAL HIGHLIGHTS
The following tables describe the performance for each share class for the fiscal periods indicated. All information (except portfolio turnover rate) reflects financial results for a single fund share.Total return shows how much your investment in the fund would have increased (or decreased) during each period, assuming you had reinvested all dividends and distributions.These figures have been derived from the fund’s financial statements.
| | | | | Year Ended October 31, |
| | |
| |
|
| Class A Shares | | 2009 | | 2008 | | 2007a |
| |
| |
| |
|
| Per Share Data ($): | | | | | | |
| Net asset value, beginning of period | | 7.35 | | 13.14 | | 12.50 |
| Investment Operations: | | | | | | |
| Investment income—netb | | .36 | | .44 | | .02 |
| Net realized and unrealized | | | | | | |
| gain (loss) on investments | | 1.60 | | (5.90) | | .62 |
| Total from Investment Operations | | 1.96 | | (5.46) | | .64 |
| Distributions: | | | | | | |
| Dividends from investment income—net | | (.28) | | (.33) | | — |
| Net asset value, end of period | | 9.03 | | 7.35 | | 13.14 |
| Total Return (%)c | | 27.73 | | (42.41) | | 5.04d |
| Ratios/Supplemental Data (%): | | | | | | |
| Ratio of total expenses to average net assets | | 4.03 | | 5.84 | | 26.08e |
| Ratio of net expenses to average net assets | | 1.49 | | 1.44 | | 1.50e |
| Ratio of net investment income | | | | | | |
| to average net assets | | 5.05 | | 3.88 | | 3.62e |
| Portfolio Turnover Rate | | 70.29 | | 99.04 | | 3.45d |
| Net Assets, end of period ($ x 1,000) | | 3,738 | | 2,523 | | 2,211 |
| a | | From October 18, 2007 (commencement of operations) to October 31, 2007. |
| b | | Based on average shares outstanding at each month end. |
| c | | Exclusive of sales charge. |
| d | | Not annualized. |
| e | | Annualized. |
| See notes to financial statements. |
The Fund 17
| FINANCIAL HIGHLIGHTS (continued) |
| | | | | Year Ended October 31, |
| | |
| |
|
| Class C Shares | | 2009 | | 2008 | | 2007a |
| |
| |
| |
|
| Per Share Data ($): | | | | | | |
| Net asset value, beginning of period | | 7.33 | | 13.13 | | 12.50 |
| Investment Operations: | | | | | | |
| Investment income—netb | | .32 | | .36 | | .01 |
| Net realized and unrealized | | | | | | |
| gain (loss) on investments | | 1.58 | | (5.89) | | .62 |
| Total from Investment Operations | | 1.90 | | (5.53) | | .63 |
| Distributions: | | | | | | |
| Dividends from investment income—net | | (.22) | | (.27) | | — |
| Net asset value, end of period | | 9.01 | | 7.33 | | 13.13 |
| Total Return (%)c | | 26.53 | | (42.76) | | 4.96d |
| Ratios/Supplemental Data (%): | | | | | | |
| Ratio of total expenses to average net assets | | 4.81 | | 7.06 | | 26.83e |
| Ratio of net expenses to average net assets | | 2.25 | | 2.18 | | 2.25e |
| Ratio of net investment income | | | | | | |
| to average net assets | | 4.44 | | 3.35 | | 2.86e |
| Portfolio Turnover Rate | | 70.29 | | 99.04 | | 3.45d |
| Net Assets, end of period ($ x 1,000) | | 688 | | 844 | | 315 |
| a | | From October 18, 2007 (commencement of operations) to October 31, 2007. |
| b | | Based on average shares outstanding at each month end. |
| c | | Exclusive of sales charge. |
| d | | Not annualized. |
| e | | Annualized. |
| See notes to financial statements. |
18
| | | | | Year Ended October 31, |
| | |
| |
|
| Class I Shares | | 2009 | | 2008 | | 2007a |
| |
| |
| |
|
| Per Share Data ($): | | | | | | |
| Net asset value, beginning of period | | 7.34 | | 13.14 | | 12.50 |
| Investment Operations: | | | | | | |
| Investment income—netb | | .34 | | .45 | | .02 |
| Net realized and unrealized | | | | | | |
| gain (loss) on investments | | 1.61 | | (5.90) | | .62 |
| Total from Investment Operations | | 1.95 | | (5.45) | | .64 |
| Distributions: | | | | | | |
| Dividends from investment income—net | | (.46) | | (.35) | | — |
| Net asset value, end of period | | 8.83 | | 7.34 | | 13.14 |
| Total Return (%) | | 28.21 | | (42.27) | | 5.04c |
| Ratios/Supplemental Data (%): | | | | | | |
| Ratio of total expenses to average net assets | | 3.78 | | 5.32 | | 25.84d |
| Ratio of net expenses to average net assets | | 1.24 | | 1.21 | | 1.25d |
| Ratio of net investment income | | | | | | |
| to average net assets | | 4.99 | | 3.90 | | 3.86d |
| Portfolio Turnover Rate | | 70.29 | | 99.04 | | 3.45c |
| Net Assets, end of period ($ x 1,000) | | 1,949 | | 177 | | 315 |
| a | | From October 18, 2007 (commencement of operations) to October 31, 2007. |
| b | | Based on average shares outstanding at each month end. |
| c | | Not annualized. |
| d | | Annualized. |
| See notes to financial statements. |
The Fund 19
NOTES TO FINANCIAL STATEMENTS
NOTE 1—Significant Accounting Policies:
Dreyfus Global Equity Income Fund (the “fund”) is a separate diversified series of The Dreyfus/Laurel Funds Trust (the “Trust”), which is registered under the Investment Company Act of 1940, as amended (the “Act”), as an open-end management investment company and operates as a series company currently offering six series, including the fund.The fund’s investment objective is to seek total return (consisting of capital appreciation and income).The Dreyfus Corporation (the “Manager” or “Dreyfus”), a wholly-owned subsidiary of The Bank of New York Mellon Corporation (“BNY Mellon”), serves as the fund’s investment adviser. Newton Capital Management Limited (“Newton”), an affiliate of BNY Mellon, serves as the fund’s sub-investment adviser.
MBSC Securities Corporation (the “Distributor”), a wholly-owned subsidiary of Dreyfus is the distributor of the fund’s shares.The fund is authorized to issue an unlimited number of shares of Beneficial Interest in each of the following classes of shares: Class A, Class C and Class I. Class A and Class C shares are sold primarily to retail investors through financial intermediaries and bear a distribution fee and/or shareholder services fee. Class A shares are sold with a front-end sales charge, while Class C shares are subject to a contingent deferred sales charge (“CDSC”). Class I shares are sold primarily to bank trust departments and other financial service providers (including The Bank of New York Mellon, a subsidiary of BNY Mellon and an affiliate of Dreyfus), acting on behalf of customers having a qualified trust or an investment account or relationship at such institution, and bear no distribution or sharehold er services fees. Class I shares are offered without a front-end sales charge or CDSC. Each class of shares has identical rights and privileges, except with respect to distribution and shareholder service fees, the allocation of certain transfer agency costs and voting rights on matters affecting a single class. Income, expenses (other than expenses attributable to a specific class), and realized and unrealized gains or losses on investments are allocated to each class of shares based on its relative net assets.
20
Effective December 3, 2008, investments for new accounts were no longer permitted in Class T shares of the fund, except that participants in certain group retirement plans were able to open a new account in Class T shares of the fund, provided that the fund was established as an investment option under the plans before December 3, 2008. On February 4, 2009, the fund issued to each holder of its Class T shares, in exchange for said shares, Class A shares of the fund having an aggregate net asset value equal to the aggregate net asset value of the shareholder’s Class T shares. Subsequent investments in the fund’s Class A shares made by prior holders of the fund’s Class T shares who received Class A shares of the fund in exchange for their Class T shares are subject to the front-end sales load schedule that was in effect for Class T shares at the time of the exchange. Otherwise, all other Class A share attributes will be in effec t. Effective as of the close of business on February 4, 2009, the fund no longer offers Class T shares.
As of October 31, 2009, MBC Investments Corp., an indirect subsidiary of BNY Mellon, held 191,614 Class A, 24,000 Class C and Class I shares of the fund.
The Trust accounts separately for the assets, liabilities and operations of each series. Expenses directly attributable to each series are charged to that series’ operations; expenses which are applicable to all series are allocated among them on a pro rata basis.
The Financial Accounting Standards Board (“FASB”) Accounting Standards Codification (“ASC”) has become the exclusive reference of authoritative U.S. generally accepted accounting principles (“GAAP”) recognized by the FASB to be applied by nongovernmental entities. Rules and interpretive releases of the Securities and Exchange Commission (“SEC”) under authority of federal laws are also sources of authoritative GAAP for SEC registrants.The ASC has superseded all existing non-SEC accounting and reporting standards. The fund’s financial statements are prepared in accordance with GAAP, which may require the use of management estimates and assumptions.Actual results could differ from those estimates.
The Fund 21
| NOTES TO FINANCIAL STATEMENTS (continued) |
(a) Portfolio valuation: Investments in securities are valued at the last sales price on the securities exchange or national securities market on which such securities are primarily traded. Securities listed on the National Market System for which market quotations are available are valued at the official closing price or, if there is no official closing price that day, at the last sales price. Securities not listed on an exchange or the national securities market, or securities for which there were no transactions, are valued at the average of the most recent bid and asked prices, except for open short positions, where the asked price is used for valuation purposes. Bid price is used when no asked price is available. Registered investment companies that are not traded on an exchange are valued at their net asset value.When market quotations or official closing pric es are not readily available, or are determined not to reflect accurately fair value, such as when the value of a security has been significantly affected by events after the close of the exchange or market on which the security is principally traded (for example, a foreign exchange or market), but before the fund calculates its net asset value, the fund may value these investments at fair value as determined in accordance with the procedures approved by the Board of Trustees. Fair valuing of securities may be determined with the assistance of a pricing service using calculations based on indices of domestic securities and other appropriate indicators, such as prices of relevant ADRs and futures contracts. For other securities that are fair valued by the Board of Trustees, certain factors may be considered such as: fundamental analytical data, the nature and duration of restrictions on disposition, an evaluation of the forces that influence the market in which the securities are purchased and sold, and publi c trading in similar securities of the issuer or comparable issuers. Financial futures are valued at the last sales price. Investments denominated in foreign curren-
22
cies are translated to U.S. dollars at the prevailing rates of exchange Forward foreign currency exchange contracts (“forward contracts”) are valued at the forward rate.
The fair value of a financial instrument is the amount that would be received to sell an asset or paid to transfer a liability in an orderly transaction between market participants at the measurement date (i.e. the exit price). GAAP establishes a fair value hierarchy that prioritizes the inputs of valuation techniques used to measure fair value.This hierarchy gives the highest priority to unadjusted quoted prices in active markets for identical assets or liabilities (Level 1 measurements) and the lowest priority to unobservable inputs (Level 3 measurements).
Additionally, GAAP provides guidance on determining whether the volume and activity in a market has decreased significantly and whether such a decrease in activity results in transactions that are not orderly. GAAP requires enhanced disclosures around valuation inputs and techniques used during annual and interim periods.
Various inputs are used in determining the value of the fund’s investments relating to fair value measurements. These inputs are summarized in the three broad levels listed below:
| | Level 1—unadjusted quoted prices in active markets for
identical investments.
Level 2—other significant observable inputs (including quoted
prices for similar investments, interest rates, prepayment speeds,
credit risk, etc.).
Level 3—significant unobservable inputs (including the fund’s own
assumptions in determining the fair value of investments). |
The Fund 23
| NOTES TO FINANCIAL STATEMENTS (continued) |
The inputs or methodology used for valuing securities are not necessarily an indication of the risk associated with investing in those securities.
The following is a summary of the inputs used as of October 31, 2009 in valuing the fund’s investments:
| | | Level 1— | | Level 2—Other | | Level 3— | | |
| | | Unadjusted | | Significant | | Significant | | |
| | | Quoted | | Observable Unobservable | | |
| | | Prices | | Inputs | | Inputs | | Total |
| |
| |
| |
| |
|
| Assets ($) | | | | | | | | |
| Investments in Securities: | | | | | | |
| Equity Securities — | | | | | | | | |
| Domestic† | | 1,271,248 | | — | | — | | 1,271,248 |
| Equity Securities — | | | | | | | | |
| Foreign† | | 3,014,312 | | 1,792,181 | | — | | 4,806,493 |
| Corporate Bonds | | — | | 193,047 | | | | 193,047 |
| Other Financial | | | | | | | | |
| Instruments†† | | — | | 7,938 | | — | | 7,938 |
| Liabilities ($) | | | | | | | | |
| Other Financial | | | | | | | | |
| Instruments†† | | — | | (5,807) | | — | | (5,807) |
| † | | See Statement of Investments for country classification. |
| †† | | Other financial instruments include derivative instruments, such as futures, forward foreign currency |
| | | exchange contracts, swap contracts and options contracts. Amounts shown represent unrealized |
| | | appreciation (depreciation), or in the case of options, market value at period end. |
(b) Foreign currency transactions: The fund does not isolate that portion of the results of operations resulting from changes in foreign exchange rates on investments from the fluctuations arising from changes in market prices of securities held. Such fluctuations are included with the net realized and unrealized gain or loss on investments.
Net realized foreign exchange gains or losses arise from sales of foreign currencies, currency gains or losses realized on securities transactions and the difference between the amounts of dividends, interest and foreign withholding taxes recorded on the fund’s books and the U.S. dollar equivalent of the amounts actually received or paid. Net unrealized foreign exchange gains and losses arise from changes in the value of assets and liabilities other than investments resulting from changes in exchange rates. Foreign currency gains and losses on investments are included with net realized and unrealized gain or loss on investments.
24
(c) Securities transactions and investment income: Securities transactions are recorded on a trade date basis. Realized gains and losses from securities transactions are recorded on the identified cost basis. Dividend income is recognized on the ex-dividend date and interest income, including, where applicable, accretion of discount and amortization of premium on investments, is recognized on the accrual basis.
The fund has arrangements with the custodian and cash management bank whereby the fund may receive earnings credits when positive cash balances are maintained, which are used to offset custody and cash management fees. For financial reporting purposes, the fund includes net earnings credits as an expense offset in the Statement of Operations.
Investing in foreign markets may involve special risks and considerations not typically associated with investing in the U.S. These risks include revaluation of currencies, high rates of inflation, repatriation restrictions on income and capital, and adverse political and economic developments. Moreover, securities issued in these markets may be less liquid, subject to government ownership controls and delayed settlements, and their prices may be more volatile than those of comparable securities in the U.S.
(d) Affiliated issuers: Investments in other investment companies advised by Dreyfus are defined as “affiliated” in the Act.
(e) Dividends to shareholders: Dividends are recorded on the ex-dividend date. Dividends from investment income-net are declared and paid quarterly. Dividends from net realized capital gains, if any, are normally declared and paid annually, but the fund may make distributions on a more frequent basis to comply with the distribution requirements of the Internal Revenue Code of 1986, as amended (the “Code”).To the extent that net realized capital gains can be offset by capital loss carryovers, it is the policy of the fund not to distribute such gains. Income and capital gain distributions are determined in accordance with income tax regulations, which may differ from GAAP.
The Fund 25
| NOTES TO FINANCIAL STATEMENTS (continued) |
(f) Federal income taxes: It is the policy of the fund to continue to qualify as a regulated investment company, if such qualification is in the best interests of its shareholders, by complying with the applicable provisions of the Code, and to make distributions of taxable income sufficient to relieve it from substantially all federal income and excise taxes.
As of and during the period ended October 31, 2009, the fund did not have any liabilities for any uncertain tax positions.The fund recognizes interest and penalties, if any, related to uncertain tax positions as income tax expense in the Statement of Operations. During the period, the fund did not incur any interest or penalties.
Each of the tax years in the three-year period ended October 31, 2009 remains subject to examination by the Internal Revenue Service and state taxing authorities.
At October 31, 2009, the components of accumulated earnings on a tax basis were as follows: undistributed ordinary income $109,397, accumulated capital losses $1,348,590 and unrealized depreciation $94,490.
The accumulated capital loss carryover is available for federal income tax purposes to be applied against future net securities profits, if any, realized subsequent to October 31, 2009. If not applied, $550,003 of the carryover expires in fiscal 2016 and $798,587 expires in fiscal 2017.
The tax character of distributions paid to shareholders during the fiscal periods ended October 31, 2009 and October 31, 2008 were as follows: ordinary income $163,056 and $138,996, respectively.
During the period ended October 31, 2009, as a result of permanent book to tax differences, primarily due to the tax treatment for foreign currency gains and losses, passive foreign investment companies and Thailand capital gain tax, the fund decreased accumulated undistributed investment income-net by $52,391, increased accumulated net realized gain (loss) on investments by $52,764 and decreased paid-in capital by $373. Net assets and net asset value per share were not affected by this reclassification.
26
NOTE 2—Bank Lines of Credit:
The fund participated with other Dreyfus-managed funds in a $145 million unsecured credit facility led by Citibank, N.A. and a $300 million unsecured credit facility provided by The Bank of New York Mellon (each, a “Facility”), each to be utilized primarily for temporary or emergency purposes, including the financing of redemptions. Effective October 14, 2009, the $145 million unsecured credit facility with Citibank, N.A., was increased to $215 million and the fund continues participation in the $300 million unsecured credit facility provided by The Bank of NewYork Mellon. In connection therewith, the fund has agreed to pay its pro rata portion of commitment fees for each Facility. Interest is charged to the fund based on rates determined pursuant to the terms of the respective Facility at the time of borrowing.
The average amount of borrowings outstanding under the Facilities during the period ended October 31, 2009, was approximately $2,700 with a related weighted average annualized interest rate of 1.54%.
NOTE 3—Management Fee and Other Transactions With Affiliates:
(a) Pursuant to a management agreement with Dreyfus and the Trust, the Trust has agreed to pay Dreyfus a management fee computed at the annual rate of .85% of the value of the fund’s average daily net assets and is payable monthly. Dreyfus has contractually agreed, until March 1, 2011, to waive receipt of its fees and/or assume certain expenses of the fund so that the fund’s annual operating expenses (excluding Rule 12b-1 fees, shareholder services fees, taxes, interest fees, brokerage commissions, commitment fees on borrowings and extraordinary expenses) do not exceed 1.25% of the value of the fund’s average daily net assets. The expense reimbursement, pursuant to the undertaking, amounted to $125,098 during the period ended October 31, 2009.
The Fund 27
| NOTES TO FINANCIAL STATEMENTS (continued) |
Pursuant to a Sub-Investment Advisory Agreement between Dreyfus and Newton, Dreyfus pays Newton an annual fee of .41% of the value of the fund’s average daily net assets, payable monthly.
(b) Prior to January 1, 2010, each Board member received $45,000 per year, plus $6,000 for each joint Board meeting of the Trust, The Dreyfus/Laurel Funds, Inc., The Dreyfus/Laurel Tax-Free Municipal Funds, Dreyfus Investment Funds and Dreyfus Funds, Inc. (collectively, the “Board-Group Open-End Funds”) attended, $2,000 for separate in-person committee meetings attended which were not held in conjunction with a regularly scheduled Board meeting and $1,500 for Board meetings and separate committee meetings attended that were conducted by telephone. Effective January 1, 2010, the Board-Group Open-End Funds will pay each Board member who is not an “interested person” of the Trust (as defined in the 1940 Act) $60,000 per annum, plus $7,000 per joint Board-Group Open-End Funds Board meeting attended, $2,500 for separate in-person committee meetings at tended which are not held in conjunction with a regularly scheduled Board meeting and $2,000 for Board meetings and separate committee meetings attended that are conducted by telephone.The Board-Group Open-End Funds also reimburse each Board member who is not an “interested person” of the Trust (as defined in the 1940 Act) travel and out-of-pocket expenses.With respect to Board meetings, the Chairman of the Board receives an additional 25% of such compensation (with the exception of reimbursable amounts).With respect to compensation committee meetings prior to January 1, 2010, the Chair of the compensation committee received $900 per compensation committee meeting, and, effective January 1, 2010, the Chair of each of the Board’s committees, unless the Chair also serves as Chair of the Board, will receive $1,350 per applicable committee meeting. In the event that there is an in-person joint committee meeting or a joint telephone meeting of the Board-Group Open-End Funds and Dreyfus HighYield St rategies Fund, the $2,000 or $1,500 fee (prior to January 1, 2010) or the $2,500 or $2,000 fee (effective January 1, 2010), as applicable, is allocated between the Board-Group Open-End Funds and Dreyfus High Yield Strategies Fund. The Trust’s portion of these fees and
28
expenses are charged and allocated to each series based on net assets. Amounts required to be paid by the Trust directly to the non-interested Trustees, that would be applied to offset a portion of the management fee payable to Dreyfus, are in fact paid directly by Dreyfus to the non-interested Trustees.
During the period ended October 31, 2009, the Distributor retained $2 from commissions earned on sales of the fund’s Class A shares.
(c) Under the Distribution Plan (the “Plan”) adopted pursuant to Rule 12b-1 under the Act, Class C shares pay and Class T shares paid the Distributor for distributing their shares at an annual rate of .75% of the value of the average daily net assets of Class C shares and .25% of the value of the average daily net assets of Class T shares. During the period ended October 31, 2009, Class C and Class T shares were charged $5,592 and $127, respectively, pursuant to the Plan.
(d) Under the Shareholder Services Plan, Class A and Class C shares pay and Class T shares paid the Distributor at an annual rate of .25% of the value of their average daily net assets for the provision of certain services. The services provided may include personal services relating to shareholder accounts, such as answering shareholder inquiries regarding the fund and providing reports and other information, and services related to the maintenance of shareholder accounts. The Distributor may make payments to Service Agents (a securities dealer, financial institution or other industry professional) in respect of these services.The Distributor determines the amounts to be paid to Service Agents. During the period ended October 31, 2009, Class A, Class C and Class T shares were charged $7,770, $1,864 and $127, respectively, pursuant to the Shareholder Services Plan.
Under its terms, the Plan and Shareholder Services Plan shall remain in effect from year to year, provided such continuance is approved annually by a vote of majority of those Trustees who are not “interested persons” of the Trust and who have no direct or indirect financial interest in the operation of or in any agreement related to the Plan or Shareholder Services Plan.
The Fund 29
| NOTES TO FINANCIAL STATEMENTS (continued) |
The fund compensates DreyfusTransfer, Inc., a wholly-owned subsidiary of Dreyfus, under a transfer agency agreement for providing personnel and facilities to perform transfer agency services for the fund. During the period ended October 31, 2009, the fund was charged $1,612 pursuant to the transfer agency agreement,which is included in Shareholder servicing costs in the Statement of Operations.
The fund compensatesThe Bank of NewYork Mellon under cash management agreements for performing cash management services related to fund subscriptions and redemptions. During the period ended October 31, 2009, the fund was charged $346 pursuant to the cash management agreements, which is included in Shareholder servicing costs in the Statement of Operations.These fees were offset by earnings credits pursuant to the cash management agreements.
The fund also compensates The Bank of New York Mellon under a custody agreement for providing custodial services for the fund. During the period ended October 31, 2009, the fund was charged $32,807 pursuant to the custody agreement.
During the period ended October 31, 2009, the fund was charged $6,397 for services performed by the Chief Compliance Officer.
The components of “Due to The Dreyfus Corporation and affiliates” in the Statement of Assets and Liabilities consist of: management fees $10,776, Rule 12b-1 distribution plan fees $474, shareholder services plan fees $959, custodian fees $5,116, chief compliance officer fees $3,897 and transfer agency per account fees $160.
NOTE 4—Securities Transactions:
The aggregate amount of purchases and sales of investment securities, excluding short-term securities and forward contracts, during the period ended October 31, 2009, amounted to $4,800,409 and $3,337,986, respectively.
The fund adopted the provisions of ASC Topic 815 “Derivatives and Hedging” which requires qualitative disclosures about objectives and
30
strategies for using derivatives, quantitative disclosures about fair value amounts of gains and losses on derivative instruments and disclosures about credit-risk-related contingent features in derivative agreements. The disclosure requirements distinguish between derivatives, which are accounted for as “hedges” and those that do not qualify for hedge accounting. Because investment companies value their derivatives at fair value and recognize changes in fair value through the Statement of Operations, they do not qualify for such accounting. Accordingly, even though a fund’s investments in derivatives may represent economic hedges, they are considered to be non-hedge transactions for purposes of this disclosure.
During the period ended October 31, 2009, the average market value of forward contracts was $1,040,122, which represented 20.60% of average net assets.
Forward Foreign Currency Exchange Contracts: The fund may enter into forward contracts in order to hedge its exposure to changes in foreign currency exchange rates on its foreign portfolio holdings, to settle foreign currency transactions or as a part of an investment strat-egy.When executing forward contracts, the fund is obligated to buy or sell a foreign currency at a specified rate on a certain date in the future. With respect to sales of forward contracts, the fund would incur a loss if the value of the contract increases between the date the forward contract is opened and the date the forward contract is closed. The fund realizes a gain if the value of the contract decreases between those dates.With respect to purchases of forward contracts, the fund would incur a loss if the value of the contract decreases between the date the forward contract is opened and t he date the forward contract is closed. The fund realizes a gain if the value of the contract increases between those dates.The fund is exposed to foreign currency risk as a result of changes in value of underlying financial instruments.The fund is also exposed to credit risk associated with counterparty nonperformance
The Fund 31
| NOTES TO FINANCIAL STATEMENTS (continued) |
on these forward contracts, which is typically limited to the unrealized gain on each open contract.The following summarizes open forward contracts at October 31, 2009:
| | | Foreign | | | | | | Unrealized |
| Forward Foreign Currency | | Currency | | | | | | Appreciation |
| Exchange Contracts | | Amounts | | Cost ($) | | Value ($) (Depreciation) ($) |
| |
| |
| |
|
| Purchases: | | | | | | | | |
| Polish Zloty, | | | | | | | | |
| Expiring 11/2/2009 | | 63,831 | | 22,151 | | 22,064 | | (87) |
| Polish Zloty, | | | | | | | | |
| Expiring 11/3/2009 | | 67,866 | | 23,713 | | 23,459 | | (254) |
| |
| Sales: | | | | Proceeds ($) | | | | |
| British Pounds, | | | | | | | | |
| Expiring 2/12/2010 | | 135,000 | | 229,380 | | 221,442 | | 7,938 |
| Euro, | | | | | | | | |
| Expiring 2/12/2010 | | 183,000 | | 263,730 | | 269,196 | | (5,466) |
| Gross Unrealized Appreciation | | | | | | 7,938 |
| Gross Unrealized Depreciation | | | | | | (5,807) |
At October 31, 2009, the cost of investments for federal income tax purposes was $6,365,725; accordingly, accumulated net unrealized depreciation on investments was $94,937, consisting of $548,470 gross unrealized appreciation and $643,407 gross unrealized depreciation.
NOTE 5—Subsequent Events Evaluation:
Dreyfus has evaluated the need for disclosures and/or adjustments resulting from subsequent events through December 29, 2009, the date the financial statements were issued. This evaluation did not result in any subsequent events that necessitated disclosures and/or adjustments.
32
REPORT OF INDEPENDENT REGISTERED
PUBLIC ACCOUNTING FIRM |
| | The Board of Trustees and Shareholders
The Dreyfus/Laurel Funds Trust |
We have audited the accompanying statement of assets and liabilities of Dreyfus Global Equity Income Fund (the “Fund”) of The Dreyfus/Laurel Funds Trust, including the statement of investments, as of October 31, 2009, and the related statement of operations for the year then ended, the statement of changes in net assets for each of the years in the two-year period then ended and financial highlights for each of the years in the two-year period then ended and for the period from October 18, 2007 (commencement of operations) to October 31, 2007. These financial statements and financial highlights are the responsibility of the Fund’s management. Our responsibility is to express an opinion on these financial statements and financial highlights based on our audits.
We conducted our audit in accordance with the standards of the Public Company Accounting Oversight Board (United States).Those standards require that we plan and perform the audit to obtain reasonable assurance about whether the financial statements and financial highlights are free of material misstatement. An audit includes examining, on a test basis, evidence supporting the amounts and disclosures in the financial statements. Our procedures included confirmation of securities owned as of October 31, 2009, by correspondence with the custodian and brokers or by other appropriate auditing procedures where replies from brokers were not received.An audit also includes assessing the accounting principles used and significant estimates made by management, as well as evaluating the overall financial statement presentation.We believe that our audit provides a reasonable basis for our opinion.
In our opinion, the financial statements and financial highlights referred to above present fairly, in all material respects, the financial position of Dreyfus Global Equity Income Fund as of October 31, 2009, and the results of its operations for the year then ended, the changes in its net assets for each of the years in the two-year period then ended and the financial highlights for each of the years in the two-year period then ended and for the period from October 18, 2007 (commencement of operations) to October 31, 2007, in conformity with U.S. generally accepted accounting principles.

| | New York, New York
December 29, 2009 |
The Fund 33
IMPORTANT TAX INFORMATION (Unaudited)
In accordance with federal tax law, the fund elects to provide each shareholder with their portion of the fund’s foreign taxes paid and the income sourced from foreign countries. Accordingly, the fund hereby makes the following designations regarding its fiscal year ended October 31, 2009:
| — the total amount of taxes paid to foreign countries was $18,029 |
| — the total amount of income sourced from foreign countries was |
| $152,399. |
Where required by federal tax law rules, shareholders will receive notification of their proportionate share of foreign taxes paid and foreign sourced income for the 2009 calendar year with Form 1099-DIV which will be mailed in early 2010. For the fiscal year ended October 31, 2009, certain dividends paid by the fund may be subject to a maximum tax rate of 15%, as provided for by the Jobs and Growth Tax Relief Reconciliation Act of 2003. Of the distributions paid during the fiscal year, $163,056 represents the maximum amount that may be considered qualified dividend income.
34
BOARD MEMBERS INFORMATION (Unaudited)
| Joseph S. DiMartino (66) |
| Chairman of the Board (1999) |
| Principal Occupation During Past 5Years: |
| • Corporate Director and Trustee |
| Other Board Memberships and Affiliations: |
| • The Muscular Dystrophy Association, Director |
| • CBIZ (formerly, Century Business Services, Inc.), a provider of outsourcing functions for small |
| and medium size companies, Director |
| • The Newark Group, a provider of a national market of paper recovery facilities, paperboard |
| mills and paperboard converting plants, Director |
| • Sunair Services Corporation, a provider of certain outdoor-related services to homes and |
| businesses, Director |
| No. of Portfolios for which Board Member Serves: 173 |
| ——————— |
| James M. Fitzgibbons (75) |
| Board Member (1994) |
| Principal Occupation During Past 5Years: |
| • Corporate Director and Trustee |
| Other Board Memberships and Affiliations: |
| • Bill Barrett Company, an oil and gas exploration company, Director |
| No. of Portfolios for which Board Member Serves: 37 |
| ——————— |
| Kenneth A. Himmel (63) |
| Board Member (1994) |
| Principal Occupation During Past 5Years: |
| • President and CEO, Related Urban Development, a real estate development company |
| (1996-present) |
| • President and CEO, Himmel & Company, a real estate development company (1980-present) |
| • CEO, American Food Management, a restaurant company (1983-present) |
| |
| No. of Portfolios for which Board Member Serves: 37 |
| ——————— |
| Stephen J. Lockwood (62) |
| Board Member (1994) |
| Principal Occupation During Past 5Years: |
| • Chairman of the Board, Stephen J. Lockwood and Company LLC, a real estate investment |
| company (2000-present) |
| No. of Portfolios for which Board Member Serves: 37 |
The Fund 35
BOARD MEMBERS INFORMATION ( Unaudited) (continued)
| Roslyn M. Watson (60) |
| Board Member (1994) |
| Principal Occupation During Past 5Years: |
| • Principal,Watson Ventures, Inc., a real estate investment company (1993-present) |
| Other Board Memberships and Affiliations: |
| • American Express Bank, FSB, Director |
| • The Hyams Foundation Inc., a Massachusetts Charitable Foundation,Trustee |
| • National Osteoporosis Foundation,Trustee |
| • SBLI-USA, Director |
| No. of Portfolios for which Board Member Serves: 37 |
| ——————— |
| Benaree Pratt Wiley (63) |
| Board Member (1998) |
| Principal Occupation During Past 5Years: |
| • Principal,The Wiley Group, a firm specializing in strategy and business development |
| (2005-present) |
| • President and CEO,The Partnership, an organization dedicated to increasing the |
| representation of African Americans in positions of leadership, influence and decision-making |
| in Boston, MA (1991-2005) |
| Other Board Memberships and Affiliations: |
| • Blue Cross Blue Shield of Massachusetts, Director |
| • CBIZ (formerly, Century Business Services, Inc.), a provider of outsourcing functions for small |
| and medium size companies, Director |
| • Commonwealth Institute, Director |
| • Efficacy Institute, Director |
| • PepsiCo African-American, Chair of Advisory Board |
| • The Boston Foundation, Director |
| No. of Portfolios for which Board Member Serves: 60 |
| ——————— |
| Once elected all Board Members serve for an indefinite term, but achieve Emeritus status upon reaching age 80.The |
| address of the Board Members and Officers is in c/o The Dreyfus Corporation, 200 Park Avenue, NewYork, NewYork |
| 10166.Additional information about the Board Members is available in the fund’s Statement of Additional Information |
| which can be obtained from Dreyfus free of charge by calling this toll free number: 1-800-554-4611. |
| J.Tomlinson Fort, Emeritus Board Member |
36
OFFICERS OF THE FUND (Unaudited)
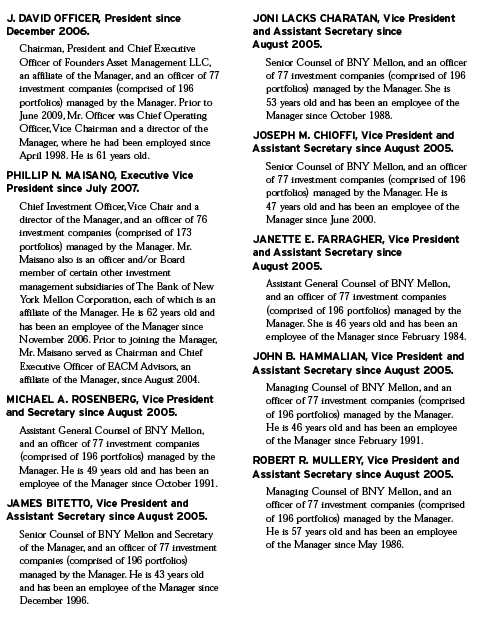
The Fund 37
OFFICERS OF THE FUND ( Unaudited) (continued)

38
NOTES
| | Dreyfus
International
Bond Fund |
| | ANNUAL REPORT October 31, 2009 |

Save time. Save paper. View your next shareholder report online as soon as it’s available. Log into www.dreyfus.com and sign up for Dreyfus eCommunications. It’s simple and only takes a few minutes.
The views expressed in this report reflect those of the portfolio manager only through the end of the period covered and do not necessarily represent the views of Dreyfus or any other person in the Dreyfus organization. Any such views are subject to change at any time based upon market or other conditions and Dreyfus disclaims any responsibility to update such views.These views may not be relied on as investment advice and, because investment decisions for a Dreyfus fund are based on numerous factors, may not be relied on as an indication of trading intent on behalf of any Dreyfus fund.
| | Contents |
| |
| | THE FUND |
| |
| 2 | A Letter from the Chairman and CEO |
| |
| 3 | Discussion of Fund Performance |
| |
| 6 | Fund Performance |
| |
| 8 | Understanding Your Fund’s Expenses |
| |
| 8 | Comparing Your Fund’s Expenses With Those of Other Funds |
| |
| 9 | Statement of Investments |
| |
| 26 | Statement of Financial Futures |
| |
| 27 | Statement of Options Written |
| |
| 28 | Statement of Assets and Liabilities |
| |
| 29 | Statement of Operations |
| |
| 30 | Statement of Changes in Net Assets |
| |
| 32 | Financial Highlights |
| |
| 35 | Notes to Financial Statements |
| |
| 59 | Report of Independent Registered Public Accounting Firm |
| |
| 60 | Important Tax Information |
| |
| 61 | Board Members Information |
| |
| 63 | Officers of the Fund |
| |
| | FOR MORE INFORMATION |
| |
| | Back Cover |
| |
Dreyfus
International Bond Fund |

A LETTER FROM THE CHAIRMAN AND CEO
Dear Shareholder:
We are pleased to present this annual report for Dreyfus International Bond Fund, covering the 12-month period from November 1, 2008, through October 31, 2009.
Reports of positive U.S. economic growth over the third quarter of 2009 may have signaled the end of the deep recession that technically began in December 2007. Signs that the economy finally has turned a corner include inventory rebuilding among manufacturers, improvements in home sales and prices, and an increase in consumer spending. These indicators, along with improved investor sentiment, have helped higher-yielding bonds rally during the reporting period, while a weak U.S. dollar has supported currency transactions in other global markets. Short-term securities and higher quality, corporate bond investments have participated in the rally as investors exchanged out of low-yielding cash investments, but they have so far lagged non-investment-grade counterparts. U.S.Treasury securities, still considered to rank among the safest investments in the world, continue to underperform relative to other fixed-income categories.
As the financial markets currently appear poised to enter into a new phase, the best strategy for your portfolio depends not only on your view of the economy’s direction, but on your current financial needs, future goals and attitudes toward risk.Your financial advisor can help you decide which investments have the potential to benefit from a recovery while guarding against the risks that may accompany unexpected market developments.
For information about how the fund performed during the reporting period, as well as market perspectives, we have provided a Discussion of Fund Performance.
Thank you for your continued confidence and support.
Jonathan R. Baum
Chairman and Chief Executive Officer
The Dreyfus Corporation
November 16, 2009 |
2

DISCUSSION OF FUND PERFORMANCE
For the period of November 1, 2008, through October 31, 2009, as provided by Thomas F. Fahey, Portfolio Manager
Fund and Market Performance Overview
For the 12-month period ended October 31, 2009, Dreyfus International Bond Fund’s Class A shares produced a total return of 29.42%, Class C shares returned 28.50% and Class I shares returned 29.79%.1 In comparison, the fund’s benchmark, the Barclays Capital Global Aggregate ex-U.S. Index (unhedged) (the “Index”) produced a total return of 21.29% for the same period.2 A severe recession and banking crisis sent prices of higher yielding bonds sharply lower in late 2008 and early 2009, but a sustained rally in anticipation of an economic recovery more than offset those losses over the remainder of the reporting period. Conversely, traditional safe havens, such as sovereign bonds, gained value during the downturn but declined as investor sentiment improved. The fund’s returns were higher than its benchmark Index, due primarily to the success of our sector allocation strategy as market conditions evolved.
The Fund’s Investment Approach
The fund seeks to maximize total return through capital appreciation and income.To pursue its goal, the fund normally invests at least 80% of its assets in fixed-income securities, and at least 65% of its assets in non-U.S. dollar-denominated fixed-income securities of foreign governments and companies located in various countries, including emerging markets. Generally, the fund seeks to maintain investment-grade average credit quality.
We focus on identifying undervalued government bond markets, currencies, sectors and securities.We look for fixed-income securities with the most potential for added value, such as those involving the potential for credit upgrades, unique structural characteristics or innovative features. We use fundamental economic research and quantitative analysis to allocate assets among countries and currencies.We then focus on sectors and individual securities that appear to be relatively undervalued.
Volatility Persisted as Global Markets Recovered
The international bond markets endured a year of extreme volatility. In the final months of 2008, a credit crisis affecting major financial insti-
The Fund 3
| DISCUSSION OF FUND PERFORMANCE (continued) |
tutions nearly led to the near collapse of the global banking system. Meanwhile, rising unemployment, plunging housing prices and depressed consumer confidence in most markets exacerbated the most severe global economic downturn since the 1930s. These influences fueled a bear market that drove many of the world’s financial markets to multi-year lows by the first quarter of 2009.
Global market sentiment began to improve in early March, as massive economic stimulus measures and lower interest rates were adopted around the world. As these measures gained traction, global economic activity rebounded faster than most analysts expected.As a result, riskier assets rallied sharply, with the emerging markets and high yield bonds leading the way. Conversely, traditional safe havens, such as the sovereign bonds of developed nations, gave back some of the gains they had achieved during the downturn.
A More Constructive Posture Bolstered Fund Performance
In this volatile investment environment, the fund began the reporting period with a relatively defensive investment mix, in which we emphasized longer-dated, higher-quality assets, such as sovereign bonds.This strategy proved successful as interest rates declined in response to stimulative monetary policies among the world’s central banks. In addition, we successfully employed credit default swaps to manage the risks of an increasingly uncertain credit environment on corporate bonds.
When it became clearer at the end of 2008 that the worst was behind us, we began to shift toward a more constructive investment posture in anticipation of narrower yield differences between riskier bond market sectors and sovereign bonds. Indeed, in the wake of the credit crisis and recession, yield spreads for investment-grade corporate bonds, high yield bonds and emerging markets securities stood near historically wide levels.This strategy enabled the fund to take advantage of newly issued corporate bonds and bank loans priced at attractive levels to entice nervous investors. Later in the reporting period, an increase in the fund’s allocation to high yield bonds benefited its relative performance. To manage the risks associated with these investments, we focused primarily on a broadly diversified array of securities with credit ratings toward the top of the high yield range. Finally, we increased the fund’s exposure to the sovere ign debt of developing nations—such as Brazil, Hungary, Poland, Mexico and Indonesia—that we believed were making structural improvements to their economies.
The fund also benefited during the reporting period from a weakening U.S. dollar, which made investments denominated in other currencies
4
more valuable for U.S. residents.With interest rates likely to remain at low levels for some time, we maintained the fund’s average duration in a range we considered slightly longer than industry averages.
In the “Sweet Spot” of the Credit Cycle
As of the reporting period’s end, we remain optimistic regarding the international bond markets.With inflation pressures low, interest rates at aggressively accommodative levels and global economic conditions improving,we may be in a particularly favorable phase of the global credit cycle. Therefore, we have maintained the fund’s generally constructive investment posture, including positions in high-yield securities and the sovereign bonds of emerging markets.
November 16, 2009
Foreign bonds are subject to special risks including exposure to currency fluctuations, changing political and economic conditions, and potentially less liquidity. The fixed income securities of issuers located in emerging markets can be more volatile and less liquid than those of issuers in more mature economies.
Investments in foreign currencies are subject to the risk that those currencies will decline in value relative to the U.S. dollar, or, in the case of hedged positions, that the U.S. dollar will decline relative to the currency being hedged. Currency rates in foreign countries may fluctuate significantly over short periods of time. A decline in the value of foreign currencies relative to the U.S. dollar will reduce the value of securities held by the fund and denominated in those currencies.
The fund may use derivative instruments, such as options, futures and options on futures, forward contracts, swaps (including credit default swaps on corporate bonds and asset-backed securities), options on swaps, and other credit derivatives.A small investment in derivatives could have a potentially large impact on the fund’s performance.The use of derivatives involves risks different from, or possibly greater than, the risks associated with investing directly in the underlying assets. Credit default swaps and similar instruments involve greater risks than if the fund had invested in the reference obligation directly, since, in addition to general market risks, they are subject to illiquidity risk, counterparty risk and credit risks.
| 1 | | Total return includes reinvestment of dividends and any capital gains paid and does not take into |
| | | consideration the maximum initial sales charge in the case of Class A shares or the applicable |
| | | contingent deferred sales charge imposed on redemptions in the case of Class C shares. Had these |
| | | charges been reflected, returns would have been lower. Class I shares are not subject to any initial |
| | | or deferred sales charge. Past performance is no guarantee of future results. Share price and |
| | | investment return fluctuate such that upon redemption, fund shares may be worth more or less |
| | | than their original cost. Return figures provided reflect the absorption of certain fund expenses by |
| | | The Dreyfus Corporation pursuant to an agreement in effect through March 1, 2010, at which |
| | | time it may be extended, modified or terminated. Had these expenses not been absorbed, the |
| | | fund’s returns would have been lower. |
| 2 | | SOURCE: BARCLAYS CAPITAL — Reflects reinvestment of dividends and, where |
| | | applicable, capital gain distributions.The Barclays Capital Global Aggregate ex-U.S. Index |
| | | (unhedged) provides a broad-based measure of the global investment-grade fixed income markets. |
The Fund 5
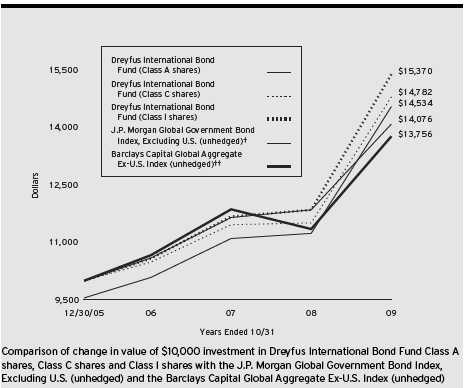
| † | | Source: Bloomberg L.P. |
| †† | | Source: Barclays Capital Inc. |
Past performance is not predictive of future performance.
The above graph compares a $10,000 investment made in Class A, Class C and Class I shares of Dreyfus International Bond Fund on 12/30/05 (inception date) to a $10,000 investment made in the J.P. Morgan Global Government Bond Index, Excluding U.S. (unhedged) (the “J.P. Morgan Index”) and the Barclays Capital Global Aggregate Ex-U.S. Index (unhedged) (the “Barclays Index”) on that date.All dividends and capital gain distributions are reinvested.
Effective 2/10/09, Dreyfus International Bond Fund changed its benchmark from J.P. Morgan Global Government Bond Index, Excluding U.S. (unhedged) to Barclays Capital Global Aggregate Ex-U.S. Index (unhedged). In future annual reports, the fund’s performance will no longer be compared to the J.P. Morgan Index because the Barclays Index is more reflective of the fund’s portfolio investment profile.
The fund invests 80% of its assets primarily in fixed-income securities.The fund’s performance shown in the line graph takes into account the maximum initial sales charge on Class A shares and all other applicable fees and expenses on all classes.The J.P. Morgan Index is a widely used benchmark for measuring performance and quantifying risk across international fixed-income bond markets.The Index measures the total, principal, and interest returns in each market.The Barclays Index is designed to measure the performance of global investment-grade, fixed-rate debt markets, excluding the United States, hedged into U.S. dollars. Unlike a mutual fund, the indices are not subject to charges, fees and other expenses. Investors cannot invest directly in any index. Further information relating to fund performance, including expense reimbursements, if applicable, is contained in the Financial Highlights section of the prospectus and els ewhere in this report.
6
| Average Annual Total Returns as of 10/31/09 | | | | | | |
| |
| | | Inception | | | | From |
| | | Date | | 1 Year | | Inception |
| |
| |
| |
|
| Class A shares | | | | | | |
| with maximum sales charge (4.5%) | | 12/30/05 | | 23.61% | | 10.23% |
| without sales charge | | 12/30/05 | | 29.42% | | 11.56% |
| Class C shares | | | | | | |
| with applicable redemption charge † | | 12/30/05 | | 27.50% | | 10.71% |
| without redemption | | 12/30/05 | | 28.50% | | 10.71% |
| Class I shares | | 12/30/05 | | 29.79% | | 11.84% |
Past performance is not predictive of future performance.The fund’s performance shown in the graph and table does not reflect the deduction of taxes that a shareholder would pay on the fund distributions or the redemption of fund shares.
| † The maximum contingent deferred sales charge for Class C shares is 1% for shares redeemed within one year of the |
| date of purchase. |
The Fund 7
UNDERSTANDING YOUR FUND’S EXPENSES (Unaudited)
As a mutual fund investor, you pay ongoing expenses, such as management fees and other expenses. Using the information below, you can estimate how these expenses affect your investment and compare them with the expenses of other funds.You also may pay one-time transaction expenses, including sales charges (loads) and redemption fees, which are not shown in this section and would have resulted in higher total expenses. For more information, see your fund’s prospectus or talk to your financial adviser.
Review your fund’s expenses
The table below shows the expenses you would have paid on a $1,000 investment in Dreyfus International Bond Fund from May 1, 2009 to October 31, 2009. It also shows how much a $1,000 investment would be worth at the close of the period, assuming actual returns and expenses.
Expenses and Value of a $1,000 Investment
assuming actual returns for the six months ended October 31, 2009 |
| | | Class A | | Class C | | Class I |
| |
| |
| |
|
| Expenses paid per $1,000† | | $ 5.97 | | $ 9.93 | | $ 4.54 |
| Ending value (after expenses) | | $1,193.30 | | $1,189.10 | | $1,194.80 |
COMPARING YOUR FUND’S EXPENSES
WITH THOSE OF OTHER FUNDS (Unaudited) |
Using the SEC’s method to compare expenses
The Securities and Exchange Commission (SEC) has established guidelines to help investors assess fund expenses. Per these guidelines, the table below shows your fund’s expenses based on a $1,000 investment, assuming a hypothetical 5% annualized return. You can use this information to compare the ongoing expenses (but not transaction expenses or total cost) of investing in the fund with those of other funds.All mutual fund shareholder reports will provide this information to help you make this comparison. Please note that you cannot use this information to estimate your actual ending account balance and expenses paid during the period.
Expenses and Value of a $1,000 Investment
assuming a hypothetical 5% annualized return for the six months ended October 31, 2009 |
| | | Class A | | Class C | | Class I |
| |
| |
| |
|
| Expenses paid per $1,000† | | $ 5.50 | | $ 9.15 | | $ 4.18 |
| Ending value (after expenses) | | $1,019.76 | | $1,016.13 | | $1,021.07 |
| † Expenses are equal to the fund's annualized expense ratio of 1.08% for Class A, 1.80% for Class C and .82% Class |
| I, multiplied by the average account value over the period, multiplied by 184/365 (to reflect the one-half year period). |
8
STATEMENT OF INVESTMENTS
October 31, 2009 |
| | | | | Coupon | | Maturity | | Principal | | | | |
| Bonds and Notes—95.8% | | | | Rate (%) | | Date | | Amount ($) | | | | Value ($) |
| |
| |
| |
| |
| |
| |
|
| Australia—1.7% | | | | | | | | | | | | |
| BHP Billiton Finance USA, | | | | | | | | | | | | |
| Gtd. Notes | | | | 5.50 | | 4/1/14 | | 275,000 | | | | 302,385 |
| Queensland Treasury, | | | | | | | | | | | | |
| Gov't Gtd. Notes, Ser. 13G | | AUD | | 6.00 | | 8/14/13 | | 3,620,000 | | a | | 3,307,412 |
| Rio Tinto Finance USA, | | | | | | | | | | | | |
| Gtd. Notes | | | | 5.88 | | 7/15/13 | | 1,340,000 | | | | 1,445,340 |
| Saint George Bank, | | | | | | | | | | | | |
| Sr. Unscd. Notes | | EUR | | 6.50 | | 6/24/13 | | 550,000 | | a | | 904,040 |
| | | | | | | | | | | | | 5,959,177 |
| Belgium—1.4% | | | | | | | | | | | | |
| Anheuser-Busch InBev Worldwide, | | | | | | | | | | | | |
| Gtd. Notes | | | | 6.38 | | 1/15/40 | | 1,110,000 | | b | | 1,164,915 |
| Anheuser-Busch InBev Worldwide, | | | | | | | | | | | | |
| Gtd. Notes | | | | 8.20 | | 1/15/39 | | 260,000 | | b | | 329,095 |
| Anheuser-Busch InBev, | | | | | | | | | | | | |
| Gtd. Notes | | GBP | | 9.75 | | 7/30/24 | | 125,000 | | a | | 283,410 |
| Belgium Kingdom, | | | | | | | | | | | | |
| Bonds, Ser. 44 | | EUR | | 5.00 | | 3/28/35 | | 1,365,000 | | a | | 2,189,840 |
| Delhaize Group, | | | | | | | | | | | | |
| Gtd. Notes | | | | 6.50 | | 6/15/17 | | 915,000 | | | | 1,003,242 |
| | | | | | | | | | | | | 4,970,502 |
| Brazil—2.5% | | | | | | | | | | | | |
| Brazil Nota do Tesouro Nacional, | | | | | | | | | | | | |
| Notes, Ser. F | | BRL | | 10.00 | | 1/1/17 | | 585,000 | | a | | 2,965,166 |
| Federal Republic of Brazil, | | | | | | | | | | | | |
| Sr. Unscd. Bonds | | BRL | | 10.25 | | 1/10/28 | | 1,900,000 | | a | | 1,081,261 |
| Federal Republic of Brazil, | | | | | | | | | | | | |
| Unsub. Bonds | | BRL | | 12.50 | | 1/5/16 | | 6,425,000 | | a,c | | 4,139,632 |
| Petrobras International Finance, | | | | | | | | | | | | |
| Gtd. Notes | | | | 5.75 | | 1/20/20 | | 845,000 | | | | 846,690 |
| | | | | | | | | | | | | 9,032,749 |
| Canada—1.9% | | | | | | | | | | | | |
| Barrick Gold, | | | | | | | | | | | | |
| Sr. Unscd. Notes | | | | 6.95 | | 4/1/19 | | 210,000 | | | | 240,135 |
| Canadian Government, | | | | | | | | | | | | |
| Bonds | | CAD | | 4.00 | | 6/1/16 | | 1,500,000 | | a | | 1,473,536 |
| Canadian Government, | | | | | | | | | | | | |
| Bonds, Cl. VWI7 | | CAD | | 8.00 | | 6/1/27 | | 940,000 | | a | | 1,301,423 |
The Fund 9
| STATEMENT OF INVESTMENTS (continued) |
| | | | | Coupon | | Maturity | | Principal | | | | |
| Bonds and Notes (continued) | | Rate (%) | | Date | | Amount ($) | | | | Value ($) |
| |
| |
| |
| |
| |
|
| Canada (continued) | | | | | | | | | | | | |
| Canadian National Railway, | | | | | | | | | | | | |
| Sr. Unscd. Notes | | | | 5.55 | | 3/1/19 | | 280,000 | | | | 307,607 |
| Encana, | | | | | | | | | | | | |
| Sr. Unscd. Notes | | | | 6.50 | | 5/15/19 | | 495,000 | | c | | 550,857 |
| Husky Energy, | | | | | | | | | | | | |
| Sr. Unscd. Notes | | | | 7.25 | | 12/15/19 | | 480,000 | | | | 555,903 |
| Potash-Saskatchewan, | | | | | | | | | | | | |
| Sr. Unscd. Notes | | | | 3.75 | | 9/30/15 | | 650,000 | | c | | 654,647 |
| Potash-Saskatchewan, | | | | | | | | | | | | |
| Sr. Unscd. Notes | | | | 5.25 | | 5/15/14 | | 130,000 | | | | 141,189 |
| Teck Resources, | | | | | | | | | | | | |
| Sr. Scd. Notes | | | | 9.75 | | 5/15/14 | | 605,000 | | | | 682,138 |
| Teck Resources, | | | | | | | | | | | | |
| Sr. Scd. Notes | | | | 10.25 | | 5/15/16 | | 130,000 | | | | 150,475 |
| Teck Resources, | | | | | | | | | | | | |
| Sr. Scd. Notes | | | | 10.75 | | 5/15/19 | | 220,000 | | | | 257,400 |
| Trans-Canada Pipelines, | | | | | | | | | | | | |
| Sr. Unscd. Notes | | | | 7.63 | | 1/15/39 | | 435,000 | | | | 557,038 |
| | | | | | | | | | | | | 6,872,348 |
| Colombia—.8% | | | | | | | | | | | | |
| Republic of Colombia, | | | | | | | | | | | | |
| Unsub. Notes | | COP | | 12.00 | | 10/22/15 | | 4,860,000,000 | | a | | 2,945,663 |
| Denmark—.8% | | | | | | | | | | | | |
| NYKREDIT, | | | | | | | | | | | | |
| Sub. Notes | | EUR | | 4.90 | | 9/29/49 | | 2,385,000 | | a,d | | 3,000,949 |
| France—6.4% | | | | | | | | | | | | |
| BNP Paribas, | | | | | | | | | | | | |
| Sr. Unscd. Notes | | EUR | | 3.25 | | 3/27/12 | | 925,000 | | a | | 1,393,637 |
| Carrefour, | | | | | | | | | | | | |
| Sr. Unscd. Notes | | EUR | | 5.13 | | 10/10/14 | | 900,000 | | a | | 1,422,424 |
| Danone Finance, | | | | | | | | | | | | |
| Gtd. Notes | | EUR | | 6.38 | | 2/4/14 | | 150,000 | | a | | 248,874 |
| GDF Suez, | | | | | | | | | | | | |
| Sr. Unscd. Notes | | EUR | | 6.25 | | 1/24/14 | | 510,000 | | a | | 842,439 |
| Government of France, | | | | | | | | | | | | |
| Bonds | | EUR | | 6.50 | | 4/25/11 | | 780,000 | | a | | 1,237,866 |
10
| | | | | Coupon | | Maturity | | Principal | | | | |
| Bonds and Notes (continued) | | Rate (%) | | Date | | Amount ($) | | | | Value ($) |
| |
| |
| |
| |
| |
|
| France (continued) | | | | | | | | | | | | |
| Government of France, | | | | | | | | | | | | |
| Bonds | | EUR | | 4.00 | | 10/25/14 | | 6,280,000 | | a | | 9,843,328 |
| Government of France, | | | | | | | | | | | | |
| Bonds | | EUR | | 4.75 | | 4/25/35 | | 1,745,000 | | a | | 2,789,337 |
| PPR, | | | | | | | | | | | | |
| Sr. Unscd. Notes | | EUR | | 8.63 | | 4/3/14 | | 835,000 | | a | | 1,447,573 |
| Societe Generale, | | | | | | | | | | | | |
| Sr. Unscd. Notes | | EUR | | 5.25 | | 3/28/13 | | 550,000 | | a | | 874,095 |
| Societe Generale, | | | | | | | �� | | | | | |
| Sub. Notes | | EUR | | 6.13 | | 8/20/18 | | 500,000 | | a | | 825,073 |
| Veolia Environnement, | | | | | | | | | | | | |
| Sr. Unsub. Notes | | EUR | | 6.13 | | 11/25/33 | | 650,000 | | a | | 1,001,341 |
| Veolia Environnement, | | | | | | | | | | | | |
| Sr. Unscd. Notes | | EUR | | 6.75 | | 4/24/19 | | 590,000 | | a | | 1,009,905 |
| | | | | | | | | | | | | 22,935,892 |
| Germany—6.7% | | | | | | | | | | | | |
| Bayer, | | | | | | | | | | | | |
| Jr. Sub. Bonds | | EUR | | 5.00 | | 7/29/2105 | | 140,000 | | a,d | | 189,981 |
| Bundesrepublik Deutschland, | | | | | | | | | | | | |
| Bonds, Ser. 05 | | EUR | | 4.00 | | 1/4/37 | | 1,800,000 | | a | | 2,637,402 |
| Bundesrepublik Deutschland, | | | | | | | | | | | | |
| Bonds, Ser. 01 | | EUR | | 5.00 | | 7/4/11 | | 4,135,000 | | a | | 6,464,964 |
| Bundesrepublik Deutschland, | | | | | | | | | | | | |
| Bonds, Ser. 03 | | EUR | | 4.25 | | 1/4/14 | | 4,960,000 | | a | | 7,871,408 |
| Bundesrepublik Deutschland, | | | | | | | | | | | | |
| Bonds, Ser. 08 | | EUR | | 4.25 | | 7/4/18 | | 1,780,000 | | a | | 2,837,365 |
| Bundesrepublik Deutschland, | | | | | | | | | | | | |
| Bonds, Ser. 03 | | EUR | | 4.75 | | 7/4/34 | | 1,345,000 | | a | | 2,177,045 |
| Deutsche Bank, | | | | | | | | | | | | |
| Sr. Unscd. Notes | | E U R | | 5.13 | | 8/31/17 | | 150,000 | | a | | 242,778 |
| Eurohypo, | | | | | | | | | | | | |
| Bonds, Ser. 2212 | | EUR | | 4.50 | | 1/21/13 | | 440,000 | | a,b | | 689,110 |
| Henkel & Co., | | | | | | | | | | | | |
| Sub. Bonds | | EUR | | 5.38 11/25/2104 | | 535,000 | | a,d | | 725,078 |
| KFW, | | | | | | | | | | | | |
| Gov't Gtd. Bonds | | JPY | | 1.75 | | 3/23/10 | | 21,000,000 | | a | | 234,592 |
The Fund 11
| STATEMENT OF INVESTMENTS (continued) |
| | | | | Coupon | | Maturity | | Principal | | | | |
| Bonds and Notes (continued) | | Rate (%) | | Date | | Amount ($) | | | | Value ($) |
| |
| |
| |
| |
| |
|
| Germany (continued) | | | | | | | | | | | | |
| KFW, | | | | | | | | | | | | |
| Gov't Gtd. Notes | | JPY | | 2.05 | | 2/16/26 | | 3,000,000 | | a | | 32,337 |
| | | | | | | | | | | | | 24,102,060 |
| Greece—1.6% | | | | | | | | | | | | |
| Hellenic Republic, | | | | | | | | | | | | |
| Sr. Unscd. Bonds | | EUR | | 4.30 | | 7/20/17 | | 3,865,000 | | a | | 5,756,672 |
| Hong Kong—.5% | | | | | | | | | | | | |
| Hutchison Whampoa International, | | | | | | | | | | |
| Gtd. Notes | | | | 4.63 | | 9/11/15 | | 725,000 | | b,c | | 731,102 |
| Hutchison Whampoa International, | | | | | | | | | | |
| Gtd. Notes | | | | 7.63 | | 4/9/19 | | 915,000 | | b | | 1,035,505 |
| | | | | | | | | | | | | 1,766,607 |
| Hungary—3.1% | | | | | | | | | | | | |
| Hungary Government, | | | | | | | | | | | | |
| Bonds, Ser. 17/B | | HUF | | 6.75 | | 2/24/17 | | 850,500,000 | | a | | 4,379,603 |
| Hungary Government, | | | | | | | | | | | | |
| Bonds, Ser. 19/A | | HUF | | 6.50 | | 6/24/19 | | 1,325,000,000 | | a | | 6,647,364 |
| | | | | | | | | | | | | 11,026,967 |
| Indonesia—1.4% | | | | | | | | | | | | |
| Indonesia Government, | | | | | | | | | | | | |
| Bonds, Ser. FR36 | | IDR | | 11.50 | | 9/15/19 | | 15,300,000,000 | | a | | 1,746,988 |
| Indonesia Government, | | | | | | | | | | | | |
| Bonds, Ser. FR44 | | IDR | | 10.00 | | 9/15/24 | | 7,000,000,000 | | a | | 704,318 |
| Indonesia Government, | | | | | | | | | | | | |
| Bonds, Ser. FR44 | | IDR | | 10.00 | | 9/15/24 | | 10,000,000,000 | | a | | 1,006,169 |
| Indonesia Government, | | | | | | | | | | | | |
| Bonds, Ser. FR36 | | IDR | | 11.50 | | 9/15/19 | | 12,500,000,000 | | a | | 1,427,278 |
| | | | | | | | | | | | | 4,884,753 |
| Ireland—2.8% | | | | | | | | | | | | |
| Irish Government, | | | | | | | | | | | | |
| Sr. Unsub. Bonds | | EUR | | 4.50 | | 10/18/18 | | 6,210,000 | | a | | 9,193,635 |
| Irish Government, | | | | | | | | | | | | |
| Bonds | | EUR | | 4.00 | | 11/11/11 | | 360,000 | | a | | 553,102 |
| Principal Financial | | | | | | | | | | | | |
| Global Funding II, | | | | | | | | | | | | |
| Sr. Scd. Notes | | EUR | | 4.50 | | 1/26/17 | | 250,000 | | a | | 321,747 |
| | | | | | | | | | | | | 10,068,484 |
12
| | | | | Coupon | | Maturity | | Principal | | | | |
| Bonds and Notes (continued) | | Rate (%) | | Date | | Amount ($) | | | | Value ($) |
| |
| |
| |
| |
| |
|
| Italy—3.2% | | | | | | | | | | | | |
| Atlantia, | | | | | | | | | | | | |
| Gtd. Notes | | EUR | | 1.25 | | 6/9/11 | | 100,000 | | a,d | | 145,997 |
| Buoni Poliennali del Tesoro, | | | | | | | | | | | | |
| Bonds | | EUR | | 4.25 | | 8/1/14 | | 1,195,000 | | a | | 1,875,039 |
| Buoni Poliennali del Tesoro, | | | | | | | | | | | | |
| Bonds | | EUR | | 4.50 | | 8/1/18 | | 1,590,000 | | a | | 2,483,859 |
| Buoni Poliennali del Tesoro, | | | | | | | | | | | | |
| Bonds | | EUR | | 5.00 | | 2/1/12 | | 1,000,000 | | a | | 1,575,524 |
| Enel-Societa Per Azioni, | | | | | | | | | | | | |
| Notes | | EUR | | 5.63 | | 6/21/27 | | 760,000 | | a | | 1,182,282 |
| Telecom Italia, | | | | | | | | | | | | |
| Sr. Unscd. Notes | | EUR | | 5.25 | | 3/17/55 | | 1,200,000 | | a | | 1,443,574 |
| Telecom Italia, | | | | | | | | | | | | |
| Sr. Unscd. Notes | | EUR | | 8.25 | | 3/21/16 | | 820,000 | | a | | 1,476,433 |
| Telecom Italia, | | | | | | | | | | | | |
| Sr. Unscd. Notes | | GBP | | 5.63 | | 12/29/15 | | 900,000 | | a | | 1,479,321 |
| | | | | | | | | | | | | 11,662,029 |
| Japan—14.5% | | | | | | | | | | | | |
| Development Bank of Japan, | | | | | | | | | | | | |
| Gov't Gtd. Notes | | JPY | | 1.05 | | 6/20/23 | | 34,000,000 | | a | | 338,208 |
| Development Bank of Japan, | | | | | | | | | | | | |
| Gov't Gtd. Bonds | | JPY | | 1.40 | | 6/20/12 | | 8,000,000 | | a | | 90,898 |
| Development Bank of Japan, | | | | | | | | | | | | |
| Gov't Gtd. Bonds | | JPY | | 1.70 | | 9/20/22 | | 24,000,000 | | a | | 262,376 |
| Japan Finance for | | | | | | | | | | | | |
| Municipal Enterprises, | | | | | | | | | | | | |
| Gov't Gtd. Notes | | JPY | | 1.35 | | 11/26/13 | | 11,000,000 | | a | | 125,365 |
| Japan Finance Organization | | | | | | | | | | | | |
| for Municipalities, | | | | | | | | | | | | |
| Gov't Gtd. Bonds | | JPY | | 1.55 | | 2/21/12 | | 6,000,000 | | a | | 68,260 |
| Japan Government, | | | | | | | | | | | | |
| Bonds, Ser. 288 | | JPY | | 1.70 | | 9/20/17 | | 2,955,650,000 | | a | | 34,254,215 |
| Japan Government, | | | | | | | | | | | | |
| Bonds, Ser. 11 | | JPY | | 1.70 | | 6/20/33 | | 1,484,050,000 | | a | | 14,846,501 |
| Japan Government, | | | | | | | | | | | | |
| Bonds, Ser. 8 | | JPY | | 1.00 | | 6/10/16 | | 210,000,000 | | a | | 2,170,459 |
| | | | | | | | | | | | | 52,156,282 |
The Fund 13
| STATEMENT OF INVESTMENTS (continued) |
| | | | | Coupon | | Maturity | | Principal | | | | |
| Bonds and Notes (continued) | | Rate (%) | | Date | | Amount ($) | | | | Value ($) |
| |
| |
| |
| |
| |
|
| Lithuania—.3% | | | | | | | | | | | | |
| Republic of Lithuania, | | | | | | | | | | | | |
| Bonds | | | | 6.75 | | 1/15/15 | | 1,145,000 | | b,c | | 1,157,580 |
| Luxembourg—1.4% | | | | | | | | | | | | |
| Enel Finance International, | | | | | | | | | | | | |
| Gtd. Notes | | | | 5.70 | | 1/15/13 | | 1,345,000 | | b | | 1,460,684 |
| Holcim US Finance, | | | | | | | | | | | | |
| Gtd. Notes | | | | 6.00 | | 12/30/19 | | 1,205,000 | | b,c | | 1,244,955 |
| Telecom Italia Financial SA, | | | | | | | | | | | | |
| Gtd. Notes | | EUR | | 7.50 | | 4/20/11 | | 355,000 | | a,d | | 562,361 |
| Tyco International Finance, | | | | | | | | | | | | |
| Gtd. Notes | | | | 4.13 | | 10/15/14 | | 260,000 | | | | 265,965 |
| Wind Acquisition Finance, | | | | | | | | | | | | |
| Sr. Notes | | EUR | | 11.75 | | 7/15/17 | | 970,000 | | a,b | | 1,598,799 |
| | | | | | | | | | | | | 5,132,764 |
| Malaysia—1.2% | | | | | | | | | | | | |
| Malaysian Government, | | | | | | | | | | | | |
| Bonds, Ser. 0409 | | MYR | | 3.74 | | 2/27/15 | | 15,250,000 | | a | | 4,430,128 |
| Mexico—.7% | | | | | | | | | | | | |
| Mexican Bonos, | | | | | | | | | | | | |
| Bonds, Ser. M10 | | MXN | | 7.75 | | 12/14/17 | | 35,160,000 | | a | | 2,635,985 |
| Netherlands—4.6% | | | | | | | | | | | | |
| BMW Finance, | | | | | | | | | | | | |
| Gtd. Notes | | EUR | | 5.25 | | 2/4/11 | | 350,000 | | a | | 535,946 |
| Daimler International | | | | | | | | | | | | |
| Finance, Gtd. Notes | | EUR | | 5.88 | | 9/8/11 | | 350,000 | | a | | 543,859 |
| Daimler International Finance, | | | | | | | | | | | | |
| Gtd. Notes, Ser. 6 | | EUR | | 6.88 | | 6/10/11 | | 345,000 | | a | | 542,181 |
| Deutsche Telekom International | | | | | | | | | | | | |
| Finance, Gtd. Notes | | EUR | | 5.75 | | 4/14/15 | | 905,000 | | a | | 1,454,477 |
| Deutsche Telekom International | | | | | | | | | | | | |
| Finance, Gtd. Bonds | | EUR | | 7.13 | | 7/11/11 | | 350,000 | | a,d | | 557,550 |
| Diageo Capital, | | | | | | | | | | | | |
| Gtd. Notes | | EUR | | 5.50 | | 7/1/13 | | 345,000 | | a | | 549,628 |
| E.ON International Finance, | | | | | | | | | | | | |
| Gtd. Notes | | EUR | | 4.88 | | 1/28/14 | | 130,000 | | a | | 203,328 |
| E.ON International Finance, | | | | | | | | | | | | |
| Gtd. Notes | | EUR | | 5.50 | | 10/2/17 | | 620,000 | | a | | 998,496 |
| Elsevier Finance, | | | | | | | | | | | | |
| Gtd. Notes | | EUR | | 6.50 | | 4/2/13 | | 900,000 | | a | | 1,454,849 |
14
| | | | | Coupon | | Maturity | | Principal | | | | |
| Bonds and Notes (continued) | | Rate (%) | | Date | | Amount ($) | | | | Value ($) |
| |
| |
| |
| |
| |
|
| Netherlands (continued) | | | | | | | | | | | | |
| ING Bank, | | | | | | | | | | | | |
| Sub. Notes | | EUR | | 5.50 | | 1/4/12 | | 560,000 | | a | | 864,404 |
| Koninklijke KPN, | | | | | | | | | | | | |
| Sr. Unscd. Notes | | EUR | | 4.75 | | 1/17/17 | | 575,000 | | a | | 868,271 |
| Koninklijke KPN, | | | | | | | | | | | | |
| Sr. Unscd. Bonds | | EUR | | 6.50 | | 1/15/16 | | 100,000 | | a | | 165,905 |
| Netherlands Government, | | | | | | | | | | | | |
| Bonds | | EUR | | 4.00 | | 7/15/18 | | 970,000 | | a | | 1,492,281 |
| Netherlands Government, | | | | | | | | | | | | |
| Bonds | | EUR | | 4.00 | | 1/15/37 | | 4,335,000 | | a | | 6,260,930 |
| Repsol International Finance, | | | | | | | | | | | | |
| Gtd. Notes | | EUR | | 4.63 | | 10/8/14 | | 15,000 | | a | | 23,268 |
| | | | | | | | | | | | | 16,515,373 |
| Norway—.0% | | | | | | | | | | | | |
| DNB Nor Bank, | | | | | | | | | | | | |
| Sub. Notes | | EUR | | 1.03 | | 5/30/17 | | 50,000 | | a,d | | 68,098 |
| Poland—1.7% | | | | | | | | | | | | |
| Poland Government, | | | | | | | | | | | | |
| Bonds, Ser. 0413 | | PLN | | 5.25 | | 4/25/13 | | 17,270,000 | | a | | 5,959,869 |
| Republic of Poland, | | | | | | | | | | | | |
| Sr. Unscd. Notes | | | | 6.38 | | 7/15/19 | | 120,000 | | | | 132,739 |
| | | | | | | | | | | | | 6,092,608 |
| Qatar—.1% | | | | | | | | | | | | |
| State of Qatar, | | | | | | | | | | | | |
| Sr. Notes | | | | 5.15 | | 4/9/14 | | 190,000 | | b | | 200,450 |
| Russia—.2% | | | | | | | | | | | | |
| Russian Federation, | | | | | | | | | | | | |
| Sr. Unscd. Bonds | | | | 7.50 | | 3/31/30 | | 770,800 | | d | | 865,300 |
| South Korea—.0% | | | | | | | | | | | | |
| Export-Import Bank of Korea, | | | | | | | | | | | | |
| Sr. Unscd. Notes | | EUR | | 5.75 | | 5/22/13 | | 100,000 | | a | | 156,711 |
| Spain—1.2% | | | | | | | | | | | | |
| Santander International, | | | | | | | | | | | | |
| Bank Gtd. Notes | | EUR | | 5.63 | | 2/14/12 | | 550,000 | | a | | 867,652 |
| Spanish Government, | | | | | | | | | | | | |
| Sr. Unsub. Bond | | EUR | | 4.10 | | 7/30/18 | | 660,000 | | a | | 1,009,799 |
| Telefonica Emisiones, | | | | | | | | | | | | |
| Gtd. Notes | | EUR | | 4.69 | | 11/11/19 | | 900,000 | | a,e | | 1,343,421 |
The Fund 15
| STATEMENT OF INVESTMENTS (continued) |
| | | | | Coupon | | Maturity | | Principal | | | | |
| Bonds and Notes (continued) | | Rate (%) | | Date | | Amount ($) | | | | Value ($) |
| |
| |
| |
| |
| |
|
| Spain (continued) | | | | | | | | | | | | |
| Telefonica Emisiones, | | | | | | | | | | | | |
| Gtd. Notes | | EUR | | 5.50 | | 4/1/16 | | 650,000 | | a | | 1,044,714 |
| | | | | | | | | | | | | 4,265,586 |
| Supranational—.3% | | | | | | | | | | | | |
| Eurasian | | | | | | | | | | | | |
| Development Bank, | | | | | | | | | | | | |
| Sr. Unscd. Notes | | | | 7.38 | | 9/29/14 | | 515,000 | | b,c | | 535,600 |
| European Investment Bank, | | | | | | | | | | | | |
| Sr. Unscd. Bonds | | JPY | | 1.40 | | 6/20/17 | | 38,600,000 | | a | | 433,579 |
| | | | | | | | | | | | | 969,179 |
| Sweden—1.7% | | | | | | | | | | | | |
| Svenska Handelsbanken, | | | | | | | | | | | | |
| Jr. Sub. Notes | | EUR | | 4.19 | | 12/29/49 | | 1,015,000 | | a,d | | 1,336,882 |
| Swedish Government, | | | | | | | | | | | | |
| Bonds, Ser. 1050 | | SEK | | 3.00 | | 7/12/16 | | 550,000 | | a | | 77,542 |
| Swedish Government, | | | | | | | | | | | | |
| Bonds, Ser. 1050 | | SEK | | 3.00 | | 7/12/16 | | 34,300,000 | | a | | 4,835,820 |
| | | | | | | | | | | | | 6,250,244 |
| Switzerland—1.0% | | | | | | | | | | | | |
| Credit Suisse Capital, | | | | | | | | | | | | |
| Bank Gtd. Notes | | EUR | | 6.91 | | 11/29/49 | | 1,000,000 | | a,d | | 1,465,468 |
| Credit Suisse Capital, | | | | | | | | | | | | |
| Bank Gtd. Notes | | EUR | | 7.97 | | 12/29/49 | | 160,000 | | a,d | | 234,875 |
| Credit Suisse London, | | | | | | | | | | | | |
| Sr. Unscd. Notes | | EUR | | 6.13 | | 5/16/14 | | 865,000 | | a | | 1,417,910 |
| Credit Suisse New York, | | | | | | | | | | | | |
| Sr. Unscd. Notes | | | | 5.50 | | 5/1/14 | | 215,000 | | | | 233,378 |
| Holcim Capital, | | | | | | | | | | | | |
| Gtd. Notes | | | | 6.88 | | 9/29/39 | | 290,000 | | b | | 301,840 |
| | | | | | | | | | | | | 3,653,471 |
| Turkey—.8% | | | | | | | | | | | | |
| Turkey Government, | | | | | | | | | | | | |
| Bonds | | TRY | | 11.00 | | 8/6/14 | | 4,250,000 | | a | | 2,954,432 |
| United Kingdom—11.3% | | | | | | | | | | | | |
| Barclays Bank, | | | | | | | | | | | | |
| Sr. Unscd. Notes, Ser. 1 | | | | 5.00 | | 9/22/16 | | 1,140,000 | | | | 1,166,736 |
| Barclays Bank, | | | | | | | | | | | | |
| Sr. Unscd. Notes | | | | 6.75 | | 5/22/19 | | 1,290,000 | | | | 1,453,154 |
16
| | | | | Coupon | | Maturity | | Principal | | | | |
| Bonds and Notes (continued) | | Rate (%) | | Date | | Amount ($) | | | | Value ($) |
| |
| |
| |
| |
| |
|
| United Kingdom (continued) | | | | | | | | | | | | |
| Barclays Bank, | | | | | | | | | | | | |
| Sub. Notes | | EUR | | 6.00 | | 1/23/18 | | 925,000 | | a | | 1,473,345 |
| BAT Internaltional Finance, | | | | | | | | | | | | |
| Gtd. Notes | | EUR | | 5.38 | | 6/29/17 | | 130,000 | | a | | 203,291 |
| BAT International Finance, | | | | | | | | | | | | |
| Gtd. Notes | | GBP | | 6.38 | | 12/12/19 | | 835,000 | | a | | 1,489,856 |
| HSBC Capital Funding, | | | | | | | | | | | | |
| Gtd. Bonds | | EUR | | 5.37 | | 10/29/49 | | 1,560,000 | | a,d | | 2,071,934 |
| HSBC Holdings, | | | | | | | | | | | | |
| Sub. Notes | | EUR | | 6.25 | | 3/19/18 | | 900,000 | | a | | 1,495,177 |
| National Grid, | | | | | | | | | | | | |
| Sr. Unscd. Notes | | | | 6.30 | | 8/1/16 | | 260,000 | | | | 284,294 |
| National Grid, | | | | | | | | | | | | |
| Sr. Unscd. Notes | | EUR | | 5.00 | | 7/2/18 | | 940,000 | | a | | 1,423,385 |
| Reed Elsevier Investment, | | | | | | | | | | | | |
| Gtd. Notes | | GBP | | 7.00 | | 12/11/17 | | 750,000 | | a | | 1,383,243 |
| United Kingdom Gilt, | | | | | | | | | | | | |
| Bonds | | GBP | | 4.25 | | 3/7/36 | | 6,000,000 | | a | | 9,986,899 |
| United Kingdom Gilt, | | | | | | | | | | | | |
| Bonds | | GBP | | 2.25 | | 3/7/14 | | 4,180,000 | | a | | 6,752,365 |
| United Kingdom Gilt, | | | | | | | | | | | | |
| Bonds | | GBP | | 4.50 | | 3/7/19 | | 5,780,000 | | a | | 10,142,999 |
| United Kingdom Gilt, | | | | | | | | | | | | |
| Bonds | | GBP | | 5.00 | | 3/7/12 | | 230,000 | | a | | 406,770 |
| Vodafone Group, | | | | | | | | | | | | |
| Sr. Unscd. Notes | | GBP | | 8.13 | | 11/26/18 | | 505,000 | | a | | 1,008,235 |
| | | | | | | | | | | | | 40,741,683 |
| United States—20.0% | | | | | | | | | | | | |
| AES, | | | | | | | | | | | | |
| Sr. Unscd. Notes | | | | 7.75 | | 10/15/15 | | 1,740,000 | | | | 1,759,575 |
| Allegheny Energy Supply, | | | | | | | | | | | | |
| Sr. Unscd. Notes | | | | 5.75 | | 10/15/19 | | 460,000 | | b | | 454,268 |
| American Express, | | | | | | | | | | | | |
| Sr. Unscd. Notes | | | | 7.25 | | 5/20/14 | | 1,265,000 | | | | 1,440,571 |
| Anadarko Petroleum, | | | | | | | | | | | | |
| Sr. Unscd. Notes | | | | 8.70 | | 3/15/19 | | 475,000 | | | | 582,485 |
| Aramark, | | | | | | | | | | | | |
| Gtd. Notes | | | | 8.50 | | 2/1/15 | | 1,725,000 | | | | 1,750,875 |
The Fund 17
| STATEMENT OF INVESTMENTS (continued) |
| | | | | Coupon | | Maturity | | Principal | | | | |
| Bonds and Notes (continued) | | Rate (%) | | Date | | Amount ($) | | | | Value ($) |
| |
| |
| |
| |
| |
|
| United States (continued) | | | | | | | | | | | | |
| AT&T, | | | | | | | | | | | | |
| Sr. Unscd. Notes | | | | 5.80 | | 2/15/19 | | 270,000 | | | | 289,652 |
| AT&T, | | | | | | | | | | | | |
| Sr. Unscd. Notes | | | | 6.40 | | 5/15/38 | | 540,000 | | | | 572,311 |
| AT&T, | | | | | | | | | | | | |
| Sr. Unscd. Notes | | EUR | | 6.13 | | 4/2/15 | | 50,000 | | a | | 81,621 |
| Autozone, | | | | | | | | | | | | |
| Sr. Unscd. Notes | | | | 5.75 | | 1/15/15 | | 1,090,000 | | | | 1,168,659 |
| Baker Hughes, | | | | | | | | | | | | |
| Sr. Unscd. Notes | | | | 7.50 | | 11/15/18 | | 475,000 | | | | 577,223 |
| Ball, | | | | | | | | | | | | |
| Gtd. Notes | | | | 7.38 | | 9/1/19 | | 665,000 | | | | 683,287 |
| Bank of America, | | | | | | | | | | | | |
| Sr. Unscd. Notes | | | | 4.90 | | 5/1/13 | | 575,000 | | | | 599,186 |
| Bank of America, | | | | | | | | | | | | |
| Sr. Unscd. Notes | | | | 7.38 | | 5/15/14 | | 225,000 | | | | 252,169 |
| Bank of America, | | | | | | | | | | | | |
| Sub. Notes | | EUR | | 4.00 | | 3/28/18 | | 250,000 | | a,d | | 330,991 |
| Bear Stearns Commercial | | | | | | | | | | | | |
| Mortgage Securities, | | | | | | | | | | | | |
| Ser. 2007-T26, Cl. A4 | | | | 5.47 | | 1/12/45 | | 170,000 | | d | | 164,577 |
| Bear Stearns Commercial | | | | | | | | | | | | |
| Mortgage Securities, | | | | | | | | | | | | |
| Ser. 2007-T28, Cl. A4 | | | | 5.74 | | 9/11/42 | | 285,000 | | d | | 287,489 |
| BMW US Capital, | | | | | | | | | | | | |
| Gtd. Notes | | EUR | | 5.00 | | 5/28/15 | | 355,000 | | a | | 550,958 |
| Boeing, | | | | | | | | | | | | |
| Sr. Unscd. Notes | | | | 5.00 | | 3/15/14 | | 335,000 | | | | 364,706 |
| Cargill, | | | | | | | | | | | | |
| Sr. Unscd. Notes | | EUR | | 4.38 | | 4/29/13 | | 950,000 | | a | | 1,436,398 |
| CC Holdings, | | | | | | | | | | | | |
| Sr. Scd. Notes | | | | 7.75 | | 5/1/17 | | 685,000 | | b | | 722,675 |
| CenturyTel, | | | | | | | | | | | | |
| Sr. Unscd. Notes, Ser. Q | | | | 6.15 | | 9/15/19 | | 285,000 | | | | 286,711 |
| Chesapeake Energy, | | | | | | | | | | | | |
| Gtd. Notes | | | | 7.50 | | 9/15/13 | | 475,000 | | | | 484,500 |
| Chesapeake Energy, | | | | | | | | | | | | |
| Gtd. Bonds | | EUR | | 6.25 | | 1/15/17 | | 1,170,000 | | a | | 1,592,692 |
18
| | | Coupon | | Maturity | | Principal | | | | |
| Bonds and Notes (continued) | | Rate (%) | | Date | | Amount ($) | | | | Value ($) |
| |
| |
| |
| |
| |
|
| United States (continued) | | | | | | | | | | |
| Cisco Systems, | | | | | | | | | | |
| Sr. Unscd. Notes | | 4.95 | | 2/15/19 | | 330,000 | | | | 347,931 |
| Citigroup, | | | | | | | | | | |
| Sr. Unscd. Notes | | 6.13 | | 5/15/18 | | 1,440,000 | | | | 1,459,755 |
| ConocoPhillips, | | | | | | | | | | |
| Gtd. Notes | | 5.75 | | 2/1/19 | | 200,000 | | | | 219,271 |
| Consumers Energy, | | | | | | | | | | |
| First Mortgage Bonds | | 6.70 | | 9/15/19 | | 480,000 | | | | 552,304 |
| CSC Holdings, | | | | | | | | | | |
| Sr. Unscd. Notes | | 8.50 | | 4/15/14 | | 592,000 | | b | | 628,260 |
| DIRECTV Holdings, | | | | | | | | | | |
| Gtd. Notes | | 5.88 | | 10/1/19 | | 340,000 | | b | | 350,222 |
| Discover Financial Services, | | | | | | | | | | |
| Sr. Unscd. Notes | | 10.25 | | 7/15/19 | | 310,000 | | | | 364,173 |
| Discovery | | | | | | | | | | |
| Communications, | | | | | | | | | | |
| Gtd. Notes | | 5.63 | | 8/15/19 | | 985,000 | | | | 1,014,795 |
| Dish DBS, | | | | | | | | | | |
| Gtd. Notes | | 7.88 | | 9/1/19 | | 470,000 | | b | | 483,512 |
| Dow Chemical, | | | | | | | | | | |
| Sr. Unscd. Notes | | 8.55 | | 5/15/19 | | 310,000 | | | | 354,496 |
| Dow Chemical, | | | | | | | | | | |
| Sr. Unscd. Notes | | 5.90 | | 2/15/15 | | 525,000 | | | | 543,724 |
| E.I. Du Pont de Nemours, | | | | | | | | | | |
| Sr. Unscd. Notes | | 5.88 | | 1/15/14 | | 255,000 | | | | 284,070 |
| Echostar DBS, | | | | | | | | | | |
| Gtd. Notes | | 7.75 | | 5/31/15 | | 1,050,000 | | | | 1,078,875 |
| Echostar DBS, | | | | | | | | | | |
| Gtd. Notes | | 7.13 | | 2/1/16 | | 700,000 | | | | 703,500 |
| El Paso, | | | | | | | | | | |
| Sr. Unscd. Notes | | 7.00 | | 6/15/17 | | 880,000 | | | | 884,717 |
| Energy Transfer Partners, | | | | | | | | | | |
| Sr. Unscd. Notes | | 8.50 | | 4/15/14 | | 225,000 | | | | 261,737 |
| Enterprise Products Operations, | | | | | | | | | | |
| Gtd. Notes | | 6.13 | | 10/15/39 | | 1,920,000 | | | | 1,930,441 |
| EQT, | | | | | | | | | | |
| Sr. Unscd. Notes | | 8.13 | | 6/1/19 | | 505,000 | | | | 579,608 |
The Fund 19
| STATEMENT OF INVESTMENTS (continued) |
| | | | | Coupon | | Maturity | | Principal | | | | |
| Bonds and Notes (continued) | | Rate (%) | | Date | | Amount ($) | | | | Value ($) |
| |
| |
| |
| |
| |
|
| United States (continued) | | | | | | | | | | | | |
| First Energy Solutions, | | | | | | | | | | | | |
| Gtd. Notes | | | | 4.80 | | 2/15/15 | | 360,000 | | b,c | | 369,358 |
| Freeport-McMoRan Cooper & Gold, | | | | | | | | | | |
| Sr. Unscd. Notes | | | | 8.38 | | 4/1/17 | | 1,341,000 | | | | 1,443,574 |
| Fresenius US Finance II, | | | | | | | | | | | | |
| Gtd. Notes | | | | 9.00 | | 7/15/15 | | 105,000 | | b | | 116,025 |
| General Electric Capital, | | | | | | | | | | | | |
| Sr. Unscd. Notes | | | | 5.88 | | 1/14/38 | | 1,080,000 | | | | 1,035,473 |
| General Electric Capital, | | | | | | | | | | | | |
| Sub. Bonds | | EUR | | 4.63 | | 9/15/66 | | 825,000 | | a,d | | 971,288 |
| Georgia-Pacific, | | | | | | | | | | | | |
| Gtd. Notes | | | | 7.00 | | 1/15/15 | | 295,000 | | b | | 299,425 |
| Georgia-Pacific, | | | | | | | | | | | | |
| Gtd. Notes | | | | 7.13 | | 1/15/17 | | 528,000 | | b | | 535,920 |
| GMAC Commercial Mortgage | | | | | | | | | | | | |
| Securities, Ser. 2003-C3, Cl. A2 | | 4.22 | | 4/10/40 | | 49,860 | | | | 50,345 |
| GMAC Commercial | | | | | | | | | | | | |
| Mortgage Securities, | | | | | | | | | | | | |
| Ser. 2002-C2, Cl. A2 | | | | 5.39 | | 10/15/38 | | 104,441 | | | | 107,674 |
| Goldman Sachs Group, | | | | | | | | | | | | |
| Sr. Unscd. Notes | | | | 7.50 | | 2/15/19 | | 1,260,000 | | | | 1,475,982 |
| Goodyear Tire & Rubber, | | | | | | | | | | | | |
| Sr. Unscd. Notes | | | | 10.50 | | 5/15/16 | | 310,000 | | | | 337,125 |
| Government National Mortgage | | | | | | | | | | |
| Association, Ser. 2005-79, Cl. A | | 4.00 | | 10/16/33 | | 23,421 | | | | 23,985 |
| HCA, | | | | | | | | | | | | |
| Sr. Scd. Notes | | | | 7.88 | | 2/15/20 | | 1,790,000 | | b | | 1,848,175 |
| IBM, | | | | | | | | | | | | |
| Sr. Unscd. Notes | | | | 8.00 | | 10/15/38 | | 225,000 | | | | 308,272 |
| IBM, | | | | | | | | | | | | |
| Sr. Unscd. Notes | | EUR | | 6.63 | | 1/30/14 | | 1,700,000 | | a | | 2,844,968 |
| Ipalco Enterprises, | | | | | | | | | | | | |
| Sr. Scd. Notes | | | | 7.25 | | 4/1/16 | | 370,000 | | b | | 374,625 |
| Iron Mountain, | | | | | | | | | | | | |
| Sr. Sub. Notes | | | | 8.38 | | 8/15/21 | | 800,000 | | | | 832,000 |
| JPMorgan Chase & Co., | | | | | | | | | | | | |
| Sr. Unscd. Notes | | | | 6.30 | | 4/23/19 | | 510,000 | | | | 560,739 |
20
| | | | | Coupon | | Maturity | | Principal | | | | |
| Bonds and Notes (continued) | | Rate (%) | | Date | | Amount ($) | | | | Value ($) |
| |
| |
| |
| |
| |
|
| United States (continued) | | | | | | | | | | | | |
| JPMorgan Chase & Co., | | | | | | | | | | | | |
| Sr. Unscd. Notes | | | | 4.75 | | 5/1/13 | | 275,000 | | | | 291,708 |
| JPMorgan Chase & Co., | | | | | | | | | | | | |
| Sr. Unscd. Notes | | EUR | | 5.25 | | 5/8/13 | | 200,000 | | a | | 314,622 |
| Kinder Morgan Energy Partners, | | | | | | | | | | | | |
| Sr. Unscd. Notes | | | | 5.80 | | 3/1/21 | | 1,095,000 | | c | | 1,130,293 |
| Kinder Morgan Energy Partners, | | | | | | | | | | | | |
| Sr. Unscd. Notes | | | | 6.85 | | 2/15/20 | | 320,000 | | | | 355,004 |
| Kraft Foods, | | | | | | | | | | | | |
| Sr. Unscd. Notes | | | | 6.88 | | 2/1/38 | | 300,000 | | | | 325,317 |
| Kraft Foods, | | | | | | | | | | | | |
| Sr. Unscd. Notes | | EUR | | 6.25 | | 3/20/15 | | 150,000 | | a | | 241,089 |
| Lamar Media, | | | | | | | | | | | | |
| Gtd. Notes | | | | 6.63 | | 8/15/15 | | 417,000 | | c | | 400,320 |
| Levi Strauss & Co., | | | | | | | | | | | | |
| Sr. Unscd. Notes | | EUR | | 8.63 | | 4/1/13 | | 300,000 | | a | | 441,495 |
| Marathon Oil, | | | | | | | | | | | | |
| Sr. Unscd. Notes | | | | 7.50 | | 2/15/19 | | 480,000 | | | | 563,696 |
| Merrill Lynch Mortgage Trust, | | | | | | | | | | | | |
| Ser. 2005-CIP1, Cl. A2 | | | | 4.96 | | 7/12/38 | | 135,000 | | | | 135,591 |
| Metropolitan Life Global Funding I, | | | | | | | | | | |
| Sr. Scd. Notes | | | | 5.13 | | 6/10/14 | | 240,000 | | b | | 255,235 |
| Metropolitan Life Global Funding I, | | | | | | | | | | |
| Sr. Scd. Notes | | | | 5.13 | | 4/10/13 | | 900,000 | | b | | 953,775 |
| Morgan Stanley Capital I, | | | | | | | | | | | | |
| Ser. 2006-IQ12, Cl. A1 | | | | 5.26 | | 12/15/43 | | 14,021 | | | | 14,419 |
| Morgan Stanley, | | | | | | | | | | | | |
| Sr. Unscd. Notes | | | | 7.30 | | 5/13/19 | | 1,390,000 | | | | 1,560,073 |
| Mosaic, | | | | | | | | | | | | |
| Sr. Unscd. Notes | | | | 7.38 | | 12/1/14 | | 290,000 | | b,d | | 308,791 |
| Newfield Exploration, | | | | | | | | | | | | |
| Sr. Sub. Notes | | | | 7.13 | | 5/15/18 | | 40,000 | | | | 40,350 |
| News America, | | | | | | | | | | | | |
| Gtd. Notes | | | | 6.15 | | 3/1/37 | | 900,000 | | | | 877,642 |
| News America, | | | | | | | | | | | | |
| Gtd. Notes | | | | 6.90 | | 3/1/19 | | 200,000 | | c | | 224,617 |
The Fund 21
| STATEMENT OF INVESTMENTS (continued) |
| | | Coupon | | Maturity | | Principal | | | | |
| Bonds and Notes (continued) | | Rate (%) | | Date | | Amount ($) | | | | Value ($) |
| |
| |
| |
| |
| |
|
| United States (continued) | | | | | | | | | | |
| NiSource Finance, | | | | | | | | | | |
| Gtd. Notes | | 6.40 | | 3/15/18 | | 585,000 | | | | 604,043 |
| Norfolk Southern, | | | | | | | | | | |
| Sr. Unscd. Notes | | 5.75 | | 1/15/16 | | 170,000 | | b | | 183,810 |
| NRG Energy, | | | | | | | | | | |
| Gtd. Notes | | 7.38 | | 1/15/17 | | 720,000 | | | | 714,600 |
| Pacific Gas & Electric, | | | | | | | | | | |
| Sr. Unscd. Notes | | 8.25 | | 10/15/18 | | 110,000 | | | | 138,555 |
| Peabody Energy, | | | | | | | | | | |
| Gtd. Notes | | 7.38 | | 11/1/16 | | 585,000 | | c | | 593,775 |
| Peabody Energy, | | | | | | | | | | |
| Gtd. Notes, Ser. B | | 6.88 | | 3/15/13 | | 110,000 | | | | 111,650 |
| Penn National Gaming, | | | | | | | | | | |
| Sr. Sub. Notes | | 8.75 | | 8/15/19 | | 710,000 | | b | | 697,575 |
| Petrohawk Energy, | | | | | | | | | | |
| Gtd. Notes | | 7.88 | | 6/1/15 | | 175,000 | | | | 177,625 |
| PetroHawk Energy, | | | | | | | | | | |
| Gtd. Notes | | 9.13 | | 7/15/13 | | 115,000 | | | | 119,600 |
| Petrohawk Energy, | | | | | | | | | | |
| Gtd. Notes | | 10.50 | | 8/1/14 | | 135,000 | | | | 147,825 |
| Philip Morris International, | | | | | | | | | | |
| Sr. Unscd. Notes | | 5.65 | | 5/16/18 | | 285,000 | | | | 307,065 |
| Plains All American Pipeline, | | | | | | | | | | |
| Gtd. Notes | | 4.25 | | 9/1/12 | | 500,000 | | | | 514,110 |
| Plains All American Pipeline, | | | | | | | | | | |
| Gtd. Notes | | 8.75 | | 5/1/19 | | 470,000 | | | | 571,459 |
| Potomac Electric Power, | | | | | | | | | | |
| First Mortgage Bonds | | 6.50 | | 11/15/37 | | 530,000 | | | | 600,246 |
| Prudential Financial, | | | | | | | | | | |
| Sr. Unscd. Notes | | 4.75 | | 9/17/15 | | 742,000 | | | | 745,588 |
| PSEG Power, | | | | | | | | | | |
| Gtd. Notes | | 7.75 | | 4/15/11 | | 205,000 | | | | 221,342 |
| Qwest, | | | | | | | | | | |
| Sr. Unscd. Notes | | 7.88 | | 9/1/11 | | 575,000 | | | | 596,562 |
22
| | | | | Coupon | | Maturity | | Principal | | | | |
| Bonds and Notes (continued) | | Rate (%) | | Date | | Amount ($) | | | | Value ($) |
| |
| |
| |
| |
| |
|
| United States (continued) | | | | | | | | | | | | |
| Reed Elsevier Capital, | | | | | | | | | | | | |
| Gtd. Notes | | | | 4.63 | | 6/15/12 | | 170,000 | | | | 177,893 |
| Reed Elsevier Capital, | | | | | | | | | | | | |
| Gtd. Notes | | | | 8.63 | | 1/15/19 | | 805,000 | | | | 1,000,089 |
| Reynolds Group Escrow, | | | | | | | | | | | | |
| Sr. Scd. Notes | | EUR | | 7.75 | | 10/15/16 | | 595,000 | | b,a | | 864,686 |
| Schering-Pough, | | | | | | | | | | | | |
| Gtd. Notes | | EUR | | 5.38 | | 10/1/14 | | 890,000 | | a | | 1,415,548 |
| Simon Property Group, | | | | | | | | | | | | |
| Sr. Unscd. Notes | | | | 6.75 | | 5/15/14 | | 1,315,000 | | | | 1,416,337 |
| Staples, | | | | | | | | | | | | |
| Gtd. Notes | | | | 9.75 | | 1/15/14 | | 830,000 | | c | | 1,006,729 |
| State of California | | | | | | | | | | | | |
| Build America, Taxable | | | | | | | | | | | | |
| Various Purpose Bonds | | | | 7.55 | | 4/1/39 | | 140,000 | | | | 145,590 |
| Sungard Data Systems, | | | | | | | | | | | | |
| Gtd. Notes | | | | 10.63 | | 5/15/15 | | 115,000 | | b,c | | 124,488 |
| SUPERVALUE, | | | | | | | | | | | | |
| Sr. Unscd. Notes | | | | 8.00 | | 5/1/16 | | 325,000 | | | | 332,313 |
| Terex, | | | | | | | | | | | | |
| Gtd. Notes | | | | 7.38 | | 1/15/14 | | 195,000 | | | | 192,563 |
| Time Warner Cable, | | | | | | | | | | | | |
| Gtd. Notes | | | | 8.75 | | 2/14/19 | | 1,165,000 | | | | 1,439,313 |
| U.S. Treasury Notes | | | | 4.25 | | 11/15/13 | | 2,015,000 | | | | 2,200,759 |
| Verizon Communications, | | | | | | | | | | | | |
| Sr. Unscd. Notes | | | | 6.10 | | 4/15/18 | | 285,000 | | | | 310,122 |
| Verizon Communications, | | | | | | | | | | | | |
| Sr. Unscd. Notes | | | | 7.35 | | 4/1/39 | | 150,000 | | | | 179,203 |
| Wachovia Bank Commercial | | | | | | | | | | | | |
| Mortgage Trust, | | | | | | | | | | | | |
| Ser. 2005-C16, Cl. A2 | | | | 4.38 | | 10/15/41 | | 46,688 | | | | 46,645 |
| Wachovia Bank Commercial | | | | | | | | | | | | |
| Mortgage Trust, Ser. 2007-C34, | | | | | | | | | | |
| Cl. A3 | | | | 5.68 | | 5/15/46 | | 1,415,000 | | | | 1,327,011 |
The Fund 23
| STATEMENT OF INVESTMENTS (continued) |
| | | | | Coupon | | Maturity | | Principal | | |
| Bonds and Notes (continued) | | Rate (%) | | Date | | Amount ($) | | Value ($) |
| |
| |
| |
| |
|
| United States (continued) | | | | | | | | | | |
| Waste Management, | | | | | | | | | | |
| Gtd. Notes | | | | 7.38 | | 3/11/19 | | 840,000 | | 981,011 |
| Wells Fargo, | | | | | | | | | | |
| Sr. Unscd. Notes | | | | 4.38 | | 1/31/13 | | 275,000 | | 286,567 |
| Windstream, | | | | | | | | | | |
| Gtd. Notes | | | | 7.88 | | 11/1/17 | | 805,000 b,c | | 817,075 |
| WM Covered Bond Program, | | | | | | | | | | |
| Notes | | EUR | | 4.00 | | 9/27/16 | | 510,000 a | | 735,065 |
| | | | | | | | | | | 72,488,397 |
| Total Bonds and Notes | | | | | | | | | | |
| (cost $336,653,854) | | | | | | | | | | 345,719,123 |
| |
| Short-Term Investments—1.4% | | | | | | | | |
| |
| |
| |
| |
|
| U.S. Treasury Bills; | | | | | | | | | | |
| 0.06% 1/14/10 | | | | | | | | | | |
| (cost $4,972,359) | | | | | | | | 4,973,000 f | | 4,972,726 |
| |
| Other Investment—3.7% | | | | | | | | Shares | | Value ($) |
| |
| |
| |
| |
| |
|
| Registered Investment Company; | | | | | | | | |
| Dreyfus Institutional Preferred | | | | | | | | | | |
| Plus Money Market Fund | | | | | | | | | | |
| (cost $13,446,000) | | | | | | | | 13,446,000 g | | 13,446,000 |
24
| Investment of Cash Collateral | | | | |
| for Securities Loaned—2.5% | | Shares | | Value ($) |
| |
| |
|
| Registered Investment Company; | | | | |
| Dreyfus Institutional Cash Advantage Fund | | | | |
| (cost $9,017,634) | | 9,017,634 g | | 9,017,634 |
| Total Investments (cost $364,089,847) | | 103.4% | | 373,155,483 |
| Liabilities, Less Cash and Receivables | | (3.4%) | | (12,267,115) |
| Net Assets | | 100.0% | | 360,888,368 |
| a Principal amount stated in U.S. Dollars unless otherwise noted. |
| AUD—Australian Dollar |
| BRL—Brazilian Real |
| CAD—Canadian Dollar |
| COP—Colombia |
| EUR—Euro |
| GBP—British Pound |
| HUF—Hungary Forint |
| IDR—Indonesian Rupiah |
| JPY—JapaneseYen |
| MXN—Mexican New Peso |
| MYR—Malaysian Ringgit |
| PLN— Polish Zloty |
| SEK—Swedish Krona |
| TRY—Turkish Lira |
| b Securities exempt from registration under Rule 144A of the Securities Act of 1933.These securities may be resold in |
| transactions exempt from registration, normally to qualified institutional buyers.At October 31, 2009, these securities |
| had a total market value of $20,837,535 or 5.8% of net assets. |
| c All or a portion of these securities are on loan.At October 31, 2009, the total market value of the fund’s securities |
| on loan is $9,984,313 and the total market value of the collateral held by the fund is $10,270,197, consisting of |
| cash collateral of $9,017,634 and U.S. Government and Agency securities valued at $1,252,563. |
| d Variable rate security—interest rate subject to periodic change. |
| e Purchased on a delayed delivery basis. |
| f Held by a broker as collateral for open financial futures positions, swap contracts and forward foreign currency |
| exchange contracts. |
| g Investment in affiliated money market mutual fund. |
| Portfolio Summary (Unaudited)† | | | | |
| |
| | | Value (%) | | | | Value (%) |
| |
| |
| |
|
| Non-US Government | | 57.2 | | US Government | | 2.0 |
| Corporate-Investment Grade | | 22.3 | | Securitized | | 1.0 |
| Corporate-High Yield | | 14.7 | | | | |
| Cash & Equivalents | | 6.2 | | | | 103.4 |
| |
| † Based on net assets. | | | | | | |
| See notes to financial statements. | | | | | | |
The Fund 25
STATEMENT OF FINANCIAL FUTURES
October 31, 2009 |
| | | | | | | | | Unrealized |
| | | | | Market Value | | | | Appreciation |
| | | | | Covered by | | | | (Depreciation) |
| Contracts | | Contracts ($) | | Expiration | | at 10/31/2009 ($) |
| |
| |
| |
|
| Financial Futures Short | | | | | | | | |
| U.S. Treasury 10 Year Notes | | 302 | | (35,820,031) | | December 2009 | | (178,064) |
| U.S. Treasury 30 Year Bonds | | 100 | | (12,015,625) | | December 2009 | | (50,708) |
| Financial Futures Long | | | | | | | | |
| Euro Bund 10 Year | | 132 | | 23,680,005 | | December 2009 | | 128,087 |
| Japanese 10 Year Bond | | 1 | | 1,532,967 | | December 2009 | | (563) |
| 10 Year Long Gilt | | 27 | | 5,252,967 | | December 2009 | | (18,666) |
| Gross Unrealized Appreciation | | | | | | | | 128,087 |
| Gross Unrealized Depreciation | | | | | | | | (248,001) |
| |
| See notes to financial statements. | | | | | | | | |
26
STATEMENT OF OPTIONS WRITTEN
October 31, 2009 |
| | | Face Amount | | |
| | | Covered by | | |
| | | Contracts ($) | | Value ($) |
| |
| |
|
| |
| Call Options: | | | | |
| 10-Year USD LIBOR-BBA, | | | | |
| September 2012 @ 4.47 | | 4,754,000 a | | (301,520) |
| Put Options: | | | | |
| 10-Year USD LIBOR-BBA, | | | | |
| September 2012 @ 4.47 | | 4,754,000 a | | (336,835) |
| (Premiums received $630,380) | | | | (638,355) |
| BBA—British Bankers Association |
| LIBOR—London Interbank Offered Rate |
| USD—US Dollar |
| a Non-income producing security. |
| See notes to financial statements. |
The Fund 27
| | STATEMENT OF ASSETS AND LIABILITIES
October 31, 2009 |
| | | Cost | | Value |
| |
| |
|
| Assets ($): | | | | |
| Investments in securities—See Statement of Investments (including | | | | |
| securities on loan, valued at $9,984,313)—Note 1(c): | | | | |
| Unaffiliated issuers | | 341,626,213 | | 350,691,849 |
| Affiliated issuers | | 22,463,634 | | 22,463,634 |
| Cash | | | | 2,734,516 |
| Cash denominated in foreign currencies | | 747,924 | | 740,200 |
| Dividends and interest receivable | | | | 5,622,159 |
| Receivable for shares of Beneficial Interest subscribed | | | | 5,454,202 |
| Receivable for investment securities sold | | | | 3,646,746 |
| Unrealized appreciation on forward foreign | | | | |
| currency exchange contracts—Note 4 | | | | 1,489,877 |
| Unrealized appreciation on swap contracts—Note 4 | | | | 374,030 |
| Prepaid expenses | | | | 53,049 |
| | | | | 393,270,262 |
| Liabilities ($): | | | | |
| Due to The Dreyfus Corporation and affiliates—Note 3(d) | | | | 264,628 |
| Payable for investment securities purchased | | | | 16,875,648 |
| Liability for securities on loan—Note 1(c) | | | | 9,017,634 |
| Unrealized depreciation on forward foreign | | | | |
| currency exchange contracts—Note 4 | | | | 2,613,502 |
| Swaps premium received—Note 4 | | | | 1,754,089 |
| Outstanding options written, at value (premiums received | | | | |
| $630,380)—See Statement of Options Written—Note 4 | | | | 638,355 |
| Payable for shares of Beneficial Interest redeemed | | | | 491,824 |
| Unrealized depreciation on swap contracts—Note 4 | | | | 340,046 |
| Payable for futures variation margin—Note 4 | | | | 262,767 |
| Accrued expenses | | | | 123,401 |
| | | | | 32,381,894 |
| Net Assets ($) | | | | 360,888,368 |
| Composition of Net Assets ($): | | | | |
| Paid-in capital | | | | 345,038,062 |
| Accumulated distributions in excess of investment income—net | | | | (250,364) |
| Accumulated net realized gain (loss) on investments | | | | 8,174,979 |
| Accumulated net unrealized appreciation (depreciation) on investments, | | |
| options transactions, swap transactions and foreign currency transactions | | |
| [including ($119,914) net unrealized (depreciation) on financial futures] | | 7,925,691 |
| Net Assets ($) | | | | 360,888,368 |
| Net Asset Value Per Share | | | | | | |
| | | Class A | | Class C | | Class I |
| |
| |
| |
|
| Net Assets ($) | | 186,456,299 | | 47,923,213 | | 126,508,856 |
| Shares Outstanding | | 11,474,613 | | 2,986,655 | | 7,757,894 |
| Net Asset Value Per Share ($) | | 16.25 | | 16.05 | | 16.31 |
| See notes to financial statements. | | | | | | |
28
| Investment Income ($): | | |
| Income: | | |
| Interest | | 4,210,816 |
| Dividends; | | |
| Affiliated issuers | | 7,146 |
| Income from securities lending—Note 1(c) | | 5,434 |
| Total Income | | 4,223,396 |
| Expenses: | | |
| Management fee—Note 3(a) | | 589,233 |
| Shareholder servicing costs—Note 3(d) | | 302,752 |
| Distribution fees—Note 3(c) | | 125,386 |
| Custodian fees—Note 3(d) | | 75,620 |
| Registration fees | | 59,707 |
| Professional fees | | 31,569 |
| Prospectus and shareholders’ reports | | 19,327 |
| Trustees’ fees and expenses—Note 3(b) | | 9,724 |
| Loan commitment fees—Note 2 | | 866 |
| Miscellaneous | | 60,392 |
| Total Expenses | | 1,274,576 |
| Less—reduction in management fee due to undertaking—Note 3(a) | | (128,154) |
| Less—reduction in fees due to earnings credits—Note 1(c) | | (9,336) |
| Net Expenses | | 1,137,086 |
| Investment Income—Net | | 3,086,310 |
| Realized and Unrealized Gain (Loss) on Investments—Note 4 ($): | | |
| Net realized gain (loss) on investments and foreign currency transactions | | 1,847,650 |
| Net realized gain (loss) on financial futures | | 79,649 |
| Net realized gain (loss) on swap transactions | | 1,743,455 |
| Net realized gain (loss) on forward foreign currency exchange contracts | | 4,924,270 |
| Net Realized Gain (Loss) | | 8,595,024 |
| Net unrealized appreciation (depreciation) on investments, foreign currency | | |
| transactions, financial futures, options transactions, swap transactions and | | |
| forward foreign currency exchange contracts [including ($393,803) | | |
| net unrealized (depreciation) on financial futures, ($7,975) net unrealized | | |
| (depreciation) on options transactions, ($191,152) net unrealized (depreciation) | | |
| on swap transactions and ($3,270,325) net unrealized (depreciation) on | | |
| forward foreign currency exchange contracts] | | 10,203,869 |
| Net Realized and Unrealized Gain (Loss) on Investments | | 18,798,893 |
| Net Increase in Net Assets Resulting from Operations | | 21,885,203 |
STATEMENT OF OPERATIONS
Year Ended October 31, 2009
See notes to financial statements.
The Fund 29
STATEMENT OF CHANGES IN NET ASSETS
| | | Year Ended October 31, |
| | |
|
| | | 2009 | | 2008 |
| |
| |
|
| Operations ($): | | | | |
| Investment income—net | | 3,086,310 | | 1,017,863 |
| Net realized gain (loss) on investments | | 8,595,024 | | (1,397,908) |
| Net unrealized appreciation | | | | |
| (depreciation) on investments | | 10,203,869 | | (2,671,723) |
| Net Increase (Decrease) in Net Assets | | | | |
| Resulting from Operations | | 21,885,203 | | (3,051,768) |
| Dividends to Shareholders from ($): | | | | |
| Investment income—net: | | | | |
| Class A Shares | | (2,047,014) | | (421,632) |
| Class C Shares | | (423,548) | | (108,517) |
| Class I Shares | �� | (278,715) | | (60,566) |
| Net realized gain on investments: | | | | |
| Class A Shares | | — | | (121,883) |
| Class C Shares | | — | | (82,940) |
| Class I Shares | | — | | (35,966) |
| Total Dividends | | (2,749,277) | | (831,504) |
| Beneficial Interest Transactions ($): | | | | |
| Net proceeds from shares sold: | | | | |
| Class A Shares | | 168,091,052 | | 53,804,947 |
| Class C Shares | | 40,133,739 | | 7,623,766 |
| Class I Shares | | 123,138,495 | | 3,049,252 |
| Dividends reinvested: | | | | |
| Class A Shares | | 1,766,695 | | 476,701 |
| Class C Shares | | 257,662 | | 143,509 |
| Class I Shares | | 137,776 | | 74,280 |
| Cost of shares redeemed: | | | | |
| Class A Shares | | (33,022,800) | | (17,568,645) |
| Class C Shares | | (3,420,507) | | (2,460,625) |
| Class I Shares | | (3,985,595) | | (159,825) |
| Increase (Decrease) in Net Assets | | | | |
| from Beneficial Interest Transactions | | 293,096,517 | | 44,983,360 |
| Total Increase (Decrease) in Net Assets | | 312,232,443 | | 41,100,088 |
| Net Assets ($): | | | | |
| Beginning of Period | | 48,655,925 | | 7,555,837 |
| End of Period | | 360,888,368 | | 48,655,925 |
| Undistributed (distributions in excess of) | | | | |
| investment income—net | | (250,364) | | 115,356 |
30
| | | Year Ended October 31, |
| | |
|
| | | 2009 | | 2008 |
| |
| |
|
| Capital Share Transactions: | | | | |
| Class A | | | | |
| Shares sold | | 10,837,689 | | 3,798,067 |
| Shares issued for dividends reinvested | | 125,830 | | 34,394 |
| Shares redeemed | | (2,297,542) | | (1,272,830) |
| Net Increase (Decrease) in Shares Outstanding | | 8,665,977 | | 2,559,631 |
| Class C | | | | |
| Shares sold | | 2,628,042 | | 541,519 |
| Shares issued for dividends reinvested | | 18,481 | | 10,619 |
| Shares redeemed | | (233,238) | | (178,301) |
| Net Increase (Decrease) in Shares Outstanding | | 2,413,285 | | 373,837 |
| Class I | | | | |
| Shares sold | | 7,689,518 | | 213,425 |
| Shares issued for dividends reinvested | | 9,489 | | 5,478 |
| Shares redeemed | | (249,511) | | (11,500) |
| Net Increase (Decrease) in Shares Outstanding | | 7,449,496 | | 207,403 |
| |
| See notes to financial statements. | | | | |
The Fund 31
FINANCIAL HIGHLIGHTS
The following tables describe the performance for each share class for the fiscal periods indicated. All information (except portfolio turnover rate) reflects financial results for a single fund share.Total return shows how much your investment in the fund would have increased (or decreased) during each period, assuming you had reinvested all dividends and distributions.These figures have been derived from the fund’s financial statements.
| | | | | Year Ended October 31, | | |
| | |
| |
| |
|
| Class A Shares | | 2009 | | 2008 | | 2007 | | 2006a |
| |
| |
| |
| |
|
| Per Share Data ($): | | | | | | | | |
| Net asset value, beginning of period | | 13.20 | | 13.77 | | 13.05 | | 12.50 |
| Investment Operations: | | | | | | | | |
| Investment income—netb | | .46 | | .45 | | .35 | | .24 |
| Net realized and unrealized | | | | | | | | |
| gain (loss) on investments | | 3.30 | | (.28) | | .92 | | .45 |
| Total from Investment Operations | | 3.76 | | .17 | | 1.27 | | .69 |
| Distributions: | | | | | | | | |
| Dividends from investment income—net | | (.71) | | (.39) | | (.52) | | (.14) |
| Dividends from net realized | | | | | | | | |
| gain on investments | | — | | (.35) | | (.03) | | — |
| Total Distributions | | (.71) | | (.74) | | (.55) | | (.14) |
| Net asset value, end of period | | 16.25 | | 13.20 | | 13.77 | | 13.05 |
| Total Return (%)c | | 29.42 | | 1.21 | | 10.06 | | 5.58d |
| Ratios/Supplemental Data (%): | | | | | | | | |
| Ratio of total expenses | | | | | | | | |
| to average net assets | | 1.25 | | 1.47 | | 3.33 | | 4.98e,f |
| Ratio of net expenses | | | | | | | | |
| to average net assets | | 1.08 | | 1.10 | | 1.09 | | 1.01e |
| Ratio of net investment income | | | | | | | | |
| to average net assets | | 3.27 | | 3.22 | | 2.69 | | 2.29e |
| Portfolio Turnover Rate | | 159.32g | | 168.59g | | 127.97g | | 105.86d |
| Net Assets, end of period ($ x 1,000) | | 186,456 | | 37,076 | | 3,429 | | 2,294 |
| a From December 30, 2005 (commencement of operations) to October 31, 2006. |
| b Based on average shares outstanding at each month end. |
| c Exclusive of sales charge. |
| d Not annualized. |
| e Annualized. |
| f The fund’s expense ratio net of earnings credits for Class A was 4.91%. |
| g The portfolio turnover rates excluding mortgage dollar roll transactions for the periods ended October 31, 2009, 2008 |
| and 2007, were 144.34%, 152.77% and 116.54%, respectively. |
| See notes to financial statements. |
32
| | | | | Year Ended October 31, | | |
| | |
| |
| |
|
| Class C Shares | | 2009 | | 2008 | | 2007 | | 2006a |
| |
| |
| |
| |
|
| Per Share Data ($): | | | | | | | | |
| Net asset value, beginning of period | | 13.08 | | 13.70 | | 13.02 | | 12.50 |
| Investment Operations: | | | | | | | | |
| Investment income—netb | | .36 | | .34 | | .25 | | .16 |
| Net realized and unrealized | | | | | | | | |
| gain (loss) on investments | | 3.26 | | (.28) | | .92 | | .45 |
| Total from Investment Operations | | 3.62 | | .06 | | 1.17 | | .61 |
| Distributions: | | | | | | | | |
| Dividends from investment income—net | | (.65) | | (.33) | | (.46) | | (.09) |
| Dividends from net realized | | | | | | | | |
| gain on investments | | — | | (.35) | | (.03) | | — |
| Total Distributions | | (.65) | | (.68) | | (.49) | | (.09) |
| Net asset value, end of period | | 16.05 | | 13.08 | | 13.70 | | 13.02 |
| Total Return (%)c | | 28.50 | | .40 | | 9.25 | | 4.88d |
| Ratios/Supplemental Data (%): | | | | | | | | |
| Ratio of total expenses | | | | | | | | |
| to average net assets | | 1.96 | | 2.28 | | 4.09 | | 5.72e,f |
| Ratio of net expenses | | | | | | | | |
| to average net assets | | 1.82 | | 1.85 | | 1.84 | | 1.76e |
| Ratio of net investment income | | | | | | | | |
| to average net assets | | 2.58 | | 2.45 | | 1.93 | | 1.53e |
| Portfolio Turnover Rate | | 159.32g | | 168.59g | | 127.97g | | 105.86d |
| Net Assets, end of period ($ x 1,000) | | 47,923 | | 7,500 | | 2,734 | | 2,211 |
| a From December 30, 2005 (commencement of operations) to October 31, 2006. |
| b Based on average shares outstanding at each month end. |
| c Exclusive of sales charge. |
| d Not annualized. |
| e Annualized. |
| f The fund’s expense ratio net earnings credits for Class C was 5.64%. |
| g The portfolio turnover rates excluding mortgage dollar roll transactions for the periods ended October 31, 2009, 2008 |
| and 2007, were 144.34%, 152.77% and 116.54%, respectively. |
| See notes to financial statements. |
The Fund 33
| FINANCIAL HIGHLIGHTS (continued) |
| | | | | Year Ended October 31, | | |
| | |
| |
| |
|
| Class I Shares | | 2009 | | 2008 | | 2007a | | 2006b |
| |
| |
| |
| |
|
| Per Share Data ($): | | | | | | | | |
| Net asset value, beginning of period | | 13.23 | | 13.79 | | 13.06 | | 12.50 |
| Investment Operations: | | | | | | | | |
| Investment income—netc | | .41 | | .48 | | .38 | | .27 |
| Net realized and unrealized | | | | | | | | |
| gain (loss) on investments | | 3.40 | | (.27) | | .92 | | .45 |
| Total from Investment Operations | | 3.81 | | .21 | | 1.30 | | .72 |
| Distributions: | | | | | | | | |
| Dividends from investment income—net | | (.73) | | (.42) | | (.54) | | (.16) |
| Dividends from net realized | | | | | | | | |
| gain on investments | | — | | (.35) | | (.03) | | — |
| Total Distributions | | (.73) | | (.77) | | (.57) | | (.16) |
| Net asset value, end of period | | 16.31 | | 13.23 | | 13.79 | | 13.06 |
| Total Return (%) | | 29.79 | | 1.47 | | 10.30 | | 5.80d |
| Ratios/Supplemental Data (%): | | | | | | | | |
| Ratio of total expenses | | | | | | | | |
| to average net assets | | .89 | | 1.22 | | 3.09 | | 4.74e,f |
| Ratio of net expenses | | | | | | | | |
| to average net assets | | .83 | | .85 | | .84 | | .76e |
| Ratio of net investment income | | | | | | | | |
| to average net assets | | 3.23 | | 3.49 | | 2.93 | | 2.53e |
| Portfolio Turnover Rate | | 159.32g | | 168.59g | | 127.97g | | 105.86d |
| Net Assets, end of period ($ x 1,000) | | 126,509 | | 4,080 | | 1,393 | | 1,158 |
| a Effective June 1, 2007, Class R shares were redesignated as Class I shares. |
| b From December 30, 2005 (commencement of operations) to October 31, 2006. |
| c Based on average shares outstanding at each month end. |
| d Not annualized. |
| e Annualized. |
| f The fund’s expense ratio net of earnings credits for Class I was 4.67%. |
| g The portfolio turnover rates excluding mortgage dollar roll transactions for the periods ended October 31, 2009, 2008 |
| and 2007, were 144.34%, 152.77% and 116.54%, respectively. |
| See notes to financial statements. |
34
NOTES TO FINANCIAL STATEMENTS
NOTE 1—Significant Accounting Policies:
Dreyfus International Bond Fund (the “fund”) is a separate diversified series of The Dreyfus/Laurel Funds Trust (the “Trust”), which is registered under the Investment Company Act of 1940, as amended (the “Act”), as an open-end management investment company and operates as a series company currently offering six series, including the fund. The fund’s investment objective seeks to maximize total return, consisting of capital appreciation and current income. The Dreyfus Corporation (the “Manager” or “Dreyfus”), a wholly-owned subsidiary of The Bank of New York Mellon Corporation (“BNY Mellon”), serves as the fund’s investment adviser.
MBSC Securities Corporation (the “Distributor”), a wholly-owned subsidiary of the Manager is the distributor of the fund’s shares.The fund is authorized to issue an unlimited number of shares of Beneficial Interest in each of the following classes of shares: Class A, Class C and Class I. Class A and Class C shares are sold primarily to retail investors through financial intermediaries and bear a distribution fee and/or shareholder services fee. Class A shares are sold with a front-end sales charge, while Class C shares are subject to a contingent deferred sales charge (“CDSC”). Class I shares are sold primarily to bank trust departments and other financial service providers (including The Bank of New York Mellon, a subsidiary of BNY Mellon and an affiliate of Dreyfus), acting on behalf of customers having a qualified trust or investment account or relationship at such institution, and bear no distribution or sharehol der services fees. Class I shares are offered without a front-end sales charge or CDSC.Each class of shares has identical rights and privileges,except with respect to distribution and shareholder service fees, the allocation of certain transfer agency costs and voting rights on matters affecting a single class. Income, expenses (other than expenses attributable to a specific class), and realized and unrealized gains or losses on investments are allocated to each class of shares based on its relative net assets.
As of October 31, 2009, MBC Investments Corp., an indirect subsidiary of BNY Mellon, held 186,613 Class A, 183,750 Class C and 93,830 Class I shares of the fund.
The Fund 35
| NOTES TO FINANCIAL STATEMENTS (continued) |
The Trust accounts separately for the assets, liabilities and operations of each series. Expenses directly attributable to each series are charged to that series’ operations; expenses which are applicable to all series are allocated among them on a pro rata basis.
The Financial Accounting Standards Board (“FASB”) Accounting Standards Codification (“ASC”) has become the exclusive reference of authoritative U.S. generally accepted accounting principles (“GAAP”) recognized by the FASB to be applied by nongovernmental entities. Rules and interpretive releases of the Securities and Exchange Commission (“SEC”) under authority of federal laws are also sources of authoritative GAAP for SEC registrants. The ASC has superseded all existing non-SEC accounting and reporting standards. The fund’s financial statements are prepared in accordance with GAAP, which may require the use of management estimates and assumptions.Actual results could differ from those estimates.
(a) Portfolio valuation: Investments in securities excluding short-term investments (other than U.S. Treasury Bills), financial futures, options, swaps and forward foreign currency exchange contracts (“forward contracts”) are valued each business day by an independent pricing service (the “Service”) approved by the Board of Trustees. Investments for which quoted bid prices are readily available and are representative of the bid side of the market in the judgment of the Service are valued at the mean between the quoted bid prices (as obtained by the Service from dealers in such securities) and asked prices (as calculated by the Service based upon its evaluation of the market for such securities). Other investments (which constitute a majority of the portfolio securities) are valued as determined by the Service, based on methods which include consi deration of: yields or prices of securities of comparable quality, coupon, maturity and type; indications as to values from dealers; and general market conditions. Restricted securities, as well as securities or other assets for which recent market quotations are not readily available and are not valued by a pricing service approved by the Board of Trustees, or are determined by the fund not to reflect accurately fair value, are valued at fair value as determined in good faith
36
under the direction of the Board of Trustees.The factors that may be considered when fair valuing a security include fundamental analytical data, the nature and duration of restrictions on disposition, an evaluation of the forces that influence the market in which the securities are purchased and sold and public trading in similar securities of the issuer or comparable issuers. Short-term investments, excluding U.S. Treasury Bills, are carried at amortized cost, which approximates value. Registered investment companies that are not traded on an exchange are valued at their net asset value. Financial futures and options, which are traded on an exchange, are valued at the last sales price on the securities exchange on which such securities are primarily traded or at the last sales price on the national securities market on each business day. Options traded over-the-counter are priced at the mean between the bid and asked price. Investments in swap transactions are valued each business day by a pricing service approved by the Board of Trustees. Swaps are valued by the service by using a swap pricing model which incorporates among other factors, default probabilities, recovery rates, credit curves of the underlying issuer and swap spreads on interest rates. Investments denominated in foreign currencies are translated to U.S. dollars at the prevailing rates of exchange. Forward contracts are valued at the forward rate.
The fair value of a financial instrument is the amount that would be received to sell an asset or paid to transfer a liability in an orderly transaction between market participants at the measurement date (i.e. the exit price). GAAP establishes a fair value hierarchy that prioritizes the inputs of valuation techniques used to measure fair value.This hierarchy gives the highest priority to unadjusted quoted prices in active markets for identical assets or liabilities (Level 1 measurements) and the lowest priority to unobservable inputs (Level 3 measurements).
Additionally, GAAP provides guidance on determining whether the volume and activity in a market has decreased significantly and whether such a decrease in activity results in transactions that are not orderly. GAAP requires enhanced disclosures around valuation inputs and techniques used during annual and interim periods.
The Fund 37
| NOTES TO FINANCIAL STATEMENTS (continued) |
Various inputs are used in determining the value of the fund’s investments relating to fair value measurements. These inputs are summarized in the three broad levels listed below:
| | Level 1—unadjusted quoted prices in active markets for
identical investments.
Level 2—other significant observable inputs (including quoted
prices for similar investments, interest rates, prepayment speeds,
credit risk, etc.).
Level 3—significant unobservable inputs (including the fund’s own
assumptions in determining the fair value of investments). |
The inputs or methodology used for valuing securities are not necessarily an indication of the risk associated with investing in those securities.
The following is a summary of the inputs used as of October 31, 2009 in valuing the fund’s investments:
| | | | | Level 2—Other | | Level 3— | | |
| | | Level 1— | | Significant | | Significant | | |
| | | Unadjusted | | Observable | | Unobservable | | |
| | | Quoted Prices | | Inputs | | Inputs | | Total |
| |
| |
| |
| |
|
| Assets ($) | | | | | | | | |
| Investments in Securities: | | | | | | |
| U.S. Treasury | | | | | | | | |
| Securities | | — | | 7,173,485 | | — | | 7,173,485 |
| Corporate Bonds | | — | | 136,877,740 | | — | | 136,877,740 |
| Foreign Government | | — | | 204,337,298 | | — | | 204,337,298 |
| Municipal Bonds | | — | | 145,590 | | — | | 145,590 |
| U.S. Government Agencies/ | | | | | | |
| Mortgage-Backed | | — | | 23,985 | | — | | 23,985 |
| Commercial | | | | | | | | |
| Mortgage-Backed | | — | | 2,133,751 | | — | | 2,133,751 |
| Mutual Funds | | 22,463,634 | | — | | — | | 22,463,634 |
| Other Financial | | | | | | | | |
| Instruments† | | 128,087 | | 1,863,907 | | — | | 1,991,994 |
| Liabilities ($) | | | | | | | | |
| Other Financial | | | | | | | | |
| Instruments† | | (248,001) | | (3,591,903) | | — | | (3,839,904) |
| † | | Other financial instruments include derivative instruments, such as futures, forward foreign currency |
| | | exchange contracts, swap contracts and options contracts.Amounts shown represent unrealized |
| | | appreciation (depreciation), or in the case of options, market value at period end. |
38
(b) Foreign currency transactions: The fund does not isolate that portion of the results of operations resulting from changes in foreign exchange rates on investments from the fluctuations arising from changes in the market prices of securities held. Such fluctuations are included with the net realized and unrealized gain or loss on investments.
Net realized foreign exchange gains or losses arise from sales of foreign currencies, currency gains or losses realized on securities transactions and the difference between the amounts of dividends, interest and foreign withholding taxes recorded on the fund’s books and the U.S. dollar equivalent of the amounts actually received or paid. Net unrealized foreign exchange gains and losses arise from changes in the value of assets and liabilities other than investments resulting from changes in exchange rates. Foreign currency gains and losses on investments are included with net realized and unrealized gain or loss on investments.
(c) Securities transactions and investment income: Securities transactions are recorded on a trade date basis. Realized gains and losses from securities transactions are recorded on the identified cost basis. Dividend income is recognized on the ex-dividend date and interest income, including, where applicable, accretion of discount and amortization of premium on investments, is recognized on the accrual basis.
The fund has arrangements with the custodian and cash management bank whereby the fund may receive earnings credits when positive cash balances are maintained, which are used to offset custody and cash management fees. For financial reporting purposes, the fund includes net earnings credits as an expense offset in the Statement of Operations.
Pursuant to a securities lending agreement with The Bank of New York Mellon, the fund may lend securities to qualified institutions. It is the fund’s policy that, at origination, all loans are secured by collateral of at least 102% of the value of U.S. securities loaned and 105% of the value of foreign securities loaned. Collateral equivalent to at least 100% of the market value of securities on loan is maintained at all times. Collateral is either in the form of cash, which can be invested in
The Fund 39
| NOTES TO FINANCIAL STATEMENTS (continued) |
certain money market mutual funds managed by the Manager, U.S. Government and Agency securities or letters of credit. The fund is entitled to receive all income on securities loaned, in addition to income earned as a result of the lending transaction. Although each security loaned is fully collateralized, the fund bears the risk of delay in recovery of, or loss of rights in, the securities loaned should a borrower fail to return the securities in a timely manner. During the period ended October 31, 2009, The Bank of New York Mellon earned $2,926 from lending fund portfolio securities, pursuant to the securities lending agreement.
(d) Affiliated issuers: Investments in other investment companies advised by the Manager are defined as “affiliated” in the Act.
(e) Concentration of Risk: The fund invests primarily in debt securities. Failure of an issuer of the debt securities to make timely interest or principal payments, or a decline or the perception of a decline in the credit quality of a debt security, can cause the debt security’s price to fall, potentially lowering the fund’s share price. In addition, the value of debt securities may decline due to general market conditions that are not specifically related to a particular company, such as real or perceived adverse economic conditions, changes in outlook for corporate earnings, changes in interest or currency rates or adverse investor sentiment.They may also decline because of factors that affect a particular industry.
(f) Dividends to shareholders: It is the policy of the fund to declare and pay dividends from investment income-net, quarterly. Dividends from net realized capital gains, if any, are normally declared and paid annually, but the fund may make distributions on a more frequent basis to comply with the distribution requirements of the Internal Revenue Code of 1986, as amended (the “Code”).To the extent that net realized capital gains can be offset by capital loss carryovers, it is the policy of the fund not to distribute such gains. Income and capital gain distributions are determined in accordance with income tax regulations, which may differ from GAAP.
40
On October 30, 2009, the Board of Directors declared a cash dividend of $.118, $.098 and $.127 per share from undistributed investment income-net for Class A, Class C and Class I shares, respectively, payable on November 2, 2009 (ex-dividend date), to shareholders of record as of the close of business on October 30, 2009.
(g) Federal income taxes: It is the policy of the fund to continue to qualify as a regulated investment company, if such qualification is in the best interests of its shareholders, by complying with the applicable provisions of the Code, and to make distributions of taxable income sufficient to relieve it from substantially all federal income and excise taxes.
As of and during the period ended October 31, 2009, the fund did not have any liabilities for any uncertain tax positions.The fund recognizes interest and penalties, if any, related to uncertain tax positions as income tax expense in the Statement of Operations. During the period, the fund did not incur any interest or penalties.
Each of the tax years in the four-year period ended October 31, 2009 remains subject to examination by the Internal Revenue Service and state taxing authorities.
At October 31, 2009, the components of accumulated earnings on a tax basis were as follows: undistributed ordinary income $7,192,004, undistributed capital gains $1,744,534 and unrealized appreciation $6,913,768.
The tax character of distributions paid to shareholders during the fiscal periods ended October 31, 2009 and October 31, 2008 were as follows: ordinary income $2,749,277 and $718,671 and long-term capital gains $0 and $112,833, respectively.
During the period ended October 31, 2009, as a result of permanent book to tax differences, primarily due to the tax treatment for pay-downs gains and losses, foreign currency transactions and treatment of swap periodic payments, the fund decreased accumulated undistributed investment income-net by $702,753 and increased accumulated
The Fund 41
| NOTES TO FINANCIAL STATEMENTS (continued) |
net realized gain (loss) on investments by the same amount. Net assets and net asset value per share were not affected by this reclassification.
NOTE 2—Bank Lines of Credit:
The fund participated with other Dreyfus-managed funds in a $145 million unsecured credit facility led by Citibank, N.A. and a $300 million unsecured credit facility provided by The Bank of New York Mellon (each, a “Facility”), each to be utilized primarily for temporary or emergency purposes, including the financing of redemptions. Effective October 14, 2009, the $145 million unsecured credit facility with Citibank, N.A., was increased to $215 million and the fund continues participation in the $300 million unsecured credit facility provided by The Bank of NewYork Mellon. In connection therewith, the fund has agreed to pay its pro rata portion of commitment fees for each Facility. Interest is charged to the fund based on rates determined pursuant to the terms of the respective Facility at the time of borrowing. During the period ended October 31, 2009, the fund did not borrow under the Facilities.
NOTE 3—Management Fee and Other Transactions with Affiliates:
(a) Pursuant to a management agreement with the Manager and the Trust, the Trust has agreed to pay the Manager a management fee computed at the annual rate of .60% of the value of the fund’s average daily net assets and is payable monthly.The Manager has contractually agreed to waive receipt of its fees and/or assume certain expenses of the fund, until March 1, 2010, so the expenses, exclusive of taxes, brokerage fees, Rule 12b-1 distribution plan fees, shareholder services plan fees, interest expense, commitment fees and extraordinary expenses, do not exceed an annual rate of .85% of the value of the fund’s average daily net assets.The reduction in management fee, pursuant to the undertaking, amounted to $128,154 during the period ended October 31, 2009.
42
(b) Prior to January 1, 2010, each Board member received $45,000 per year, plus $6,000 for each joint Board meeting of the Trust, The Dreyfus/Laurel Funds, Inc., The Dreyfus/Laurel Tax-Free Municipal Funds, Dreyfus Investment Funds and Dreyfus Fund, Inc. (collectively, the “Board-Group Open-End Funds”) attended, $2,000 for separate in-person committee meetings attended which were not held in conjunction with a regularly scheduled Board meeting and $1,500 for Board meetings and separate committee meetings attended that were conducted by telephone. Effective January 1, 2010, the Board-Group Open-End Funds will pay each Board member who is not an “interested person” of the Trust (as defined in the 1940 Act) $60,000 per annum, plus $7,000 per joint Board-Group Open-End Funds Board meeting attended, $2,500 for separate in-person committee meetings att ended which are not held in conjunction with a regularly scheduled Board meeting and $2,000 for Board meetings and separate committee meetings attended that are conducted by telephone. The Board-Group Open-End Funds also reimburse each Board member who is no an “interested person” of the Trust (as defined in the 1940 Act) for travel and out-of-pocket expenses.With respect to Board meetings, the Chairman of the Board receives an additional 25% of such compensation (with the exception of reimbursable amounts). With respect to compensation committee meetings prior to January 1, 2010, the Chair of the compensation committee received $900 per compensation committee meeting, and, effective January 1, 2010, the Chair of each of the Board’s committees, unless the Chair also serves as Chair of the Board, will receive $1,350 per applicable committee meeting. In the event that there is an in-person joint committee meeting or a joint telephone meeting of the Board-Group Open-End Funds and Dreyfus HighYiel d Strategies Fund, the $2,000 or $1,500 fee (prior to January 1, 2010) or the $2,500 or $2,000 fee (effective January 1, 2010), as applicable, is allocated between the Board-Group Open-End Funds and Dreyfus High Yield Strategies Fund. The Trust’s portion of these
The Fund 43
| NOTES TO FINANCIAL STATEMENTS (continued) |
fees and expenses are charged and allocated to each series based on net assets. Amounts required to be paid by the Trust directly to the non-interested Trustees, that would be applied to offset a portion of the management fee payable by the Manager, are in fact paid directly by the Manager to the non-interested Trustees.
During the period ended October 31, 2009,The Distributor retained $36,313 from commissions earned on sales of the fund’s Class A shares and $8,559 from CDSCs on redemptions of the fund’s Class C shares.
(c) Under the Distribution Plan (the “Plan”) adopted pursuant to Rule 12b-1 under the Act, Class C shares pay the Distributor for distributing their shares at an annual rate of .75% their value of the average daily net assets. During the period ended October 31, 2009, Class C shares were charged $125,386 pursuant to the Plan.
(d) Under the Shareholder Services Plan, Class A and Class C shares pay the Distributor at an annual rate of .25% of the value of their average daily net assets for the provision of certain services. The services provided may include personal services relating to shareholder accounts, such as answering shareholder inquiries regarding the fund and providing reports and other information, and services related to the maintenance of shareholder accounts. The Distributor may make payments to Service Agents (a securities dealer, financial institution or other industry professional) in respect of these services. The Distributor determines the amounts to be paid to Service Agents. During the period ended October 31, 2009, Class A and Class C shares were charged $155,197 and $41,795, respectively, pursuant to the Shareholder Services Plan.
Under its terms, the Plan and Shareholder Services Plan shall remain in effect from year to year, provided such continuance is approved annually by a vote of a majority of those Trustees who are not “interested persons” of the Trust and who have no direct or indirect financial interest in the operation of or in any agreement related to the Plan or Shareholder Services Plan.
44
The fund compensates Dreyfus Transfer, Inc., a wholly-owned subsidiary of the Manager, under a transfer agency agreement for providing personnel and facilities to perform transfer agency services for the fund. During the period ended October 31, 2009, the fund was charged $19,145 pursuant to the transfer agency agreement, which is included in Shareholder servicing costs in the Statement of Operations.
The fund compensatesThe Bank of NewYork Mellon under cash management agreements for performing cash management services related to fund subscriptions and redemptions. During the period ended October 31, 2009, the fund was charged $9,336 pursuant to the cash management agreements, which is included in Shareholder servicing costs in the Statement of Operations.These fees were offset by earnings credits pursuant to the cash management agreements.
The fund also compensates The Bank of New York Mellon under a custody agreement for providing custodial services for the fund. During the period ended October 31, 2009, the fund was charged $75,620 pursuant to the custody agreement.
During the period ended October 31, 2009, the fund was charged $6,397 for services performed by the Chief Compliance Officer.
The components of “Due to The Dreyfus Corporation and affiliates” in the Statement of Assets and Liabilities consist of: management fees $163,246, Rule 12b-1 distribution plan fees $26,099, shareholder services plan fees $43,099, custodian fees $23,107, chief compliance officer fees $3,897 and transfer agency per account fees $5,180.
NOTE 4—Securities Transactions:
The aggregate amount of purchases and sales (including paydowns) of investment securities, excluding short-term securities, forward contracts, financial futures, options transactions and swap transactions during the period ended October 31, 2009, amounted to $445,616,628
The Fund 45
| NOTES TO FINANCIAL STATEMENTS (continued) |
and $160,157,923, respectively, of which $15,024,413 in purchases and $15,061,239 in sales were from mortgage dollar roll transactions.
The fund adopted the provisions of ASC Topic 815 “Derivatives and Hedging” which requires qualitative disclosures about objectives and strategies for using derivatives, quantitative disclosures about fair value amounts of gains and losses on derivative instruments and disclosures about credit-risk-related contingent features in derivative agreements. The disclosure requirements distinguish between derivatives, which are accounted for as “hedges” and those that do not qualify for hedge accounting. Because investment companies value their derivatives at fair value and recognize changes in fair value through the Statement of Operations, they do not qualify for such accounting. Accordingly, even though a fund’s investments in derivatives may represent economic hedges, they are considered to be non-hedge transactions for purposes of this disclosure.The following tables show the fund’s exposure to different types of m arket risk as it relates to the Statement of Assets and Liabilities and the Statement of Operations, respectively.
Fair value of derivative instruments as of October 31, 2009 is shown below:
| | | Derivative | | | | Derivative |
| | | Assets ($) | | | | Liabilities ($) |
| |
| |
| |
|
| Interest rate risk 1, 2 | | 502,117 | | Interest rate risk 1, 3, 4 | | (1,047,942) |
| Foreign exchange risk 5 | | 1,489,877 | | Foreign exchange risk 6 | | (2,613,502) |
| Credit risk | | — | | Credit risk 3 | | (178,460) |
| Gross fair value of | | | | | | |
| derivatives contracts | | 1,991,994 | | | | (3,839,904) |
| | Statement of Assets and Liabilities location: |
| 1 | | Includes cumulative appreciation/depreciation of futures contracts as reported in the Statement of |
| | | Financial Futures, but only the unpaid variation margin is reported in the Statement of Assets |
| | | and Liabilities. |
| 2 | | Unrealized appreciation on swap contracts. |
| 3 | | Unrealized depreciation on swap contracts. |
| 4 | | Outstanding options written, at value. |
| 5 | | Unrealized appreciation on forward foreign currency exchange contracts. |
| 6 | | Unrealized depreciation on forward foreign currency exchange contracts. |
46
The effect of derivative instruments on the Statement of Operations during the period ended October 31, 2009 is shown below:
Amount of realized gain or (loss) on derivatives recognized in income ($)
| | | | | Forward | | | | |
| Underlying risk | | Futures7 | | Contracts8 | | Swaps9 | | Total |
| |
| |
| |
| |
|
| Interest rate | | 79,649 | | — | | 314,579 | | 394,228 |
| Foreign exchange | | — | | 4,924,270 | | — | | 4,924,270 |
| Credit | | — | | — | | 1,428,876 | | 1,428,876 |
| Total | | 79,649 | | 4,924,270 | | 1,743,455 | | 6,747,374 |
Change in unrealized appreciation or (depreciation) on derivatives recognized in income ($) 10
| | | | | | | Forward | | | | |
| Underlying risk | | Futures | | Options | | Contracts | | Swaps | | Total |
| |
| |
| |
| |
| |
|
| Interest rate | | (393,803) | | (7,975) | | — | | (34,687) | | (436,465) |
| Foreign exchange | | — | | — | | (3,270,325) | | — | | (3,270,325) |
| Credit | | — | | — | | — | | (156,465) | | (156,465) |
| Total | | (393,803) | | (7,975) | | (3,270,325) | | (191,152) | | (3,863,255) |
| Statement of Operations location: |
| 7 | | Net realized gain (loss) on financial futures. |
| 8 | | Net realized gain (loss) on forward foreign currency exchange contracts. |
| 9 | | Net realized gain (loss) on swap transactions. |
| 10 | | Net unrealized appreciation (depreciation) on investments, financial futures, options transactions, |
| | | forward foreign currency exchange contracts and swap transactions. |
During the period ended October 31, 2009, the average market value of interest rate futures contracts was $29,944,037, which represented 30.49% of average net assets.The average market value of interest rate options contracts was $98,164, which represented .10% of average net assets.The average market value of forward contracts was $59,140,189, which represented 60.22% of average net assets.The average notional value of interest rate swaps contracts was $14,871,396, which represented 15.14% of average net assets. The average notional value of credit default swaps contracts was $5,661,462, which represented 5.76% of average net assets.
Mortgage Dollar Rolls: A mortgage dollar roll transaction involves a sale by the fund of mortgage related securities that it holds with an
The Fund 47
| NOTES TO FINANCIAL STATEMENTS (continued) |
agreement by the fund to repurchase similar securities at an agreed upon price and date.The securities purchased will bear the same interest rate as those sold, but generally will be collateralized by pools of mortgages with different prepayment histories than those securities sold.
Futures Contracts: In the normal course of pursuing its investment objectives, the fund is exposed to market risk, including interest rate risk as a result of changes in value of underlying financial instruments.The fund may invest in financial futures contracts in order to manage its exposure to or protect against changes in the market.A futures contract represents a commitment for the future purchase or a sale of an asset at a specified date. Upon entering into such contracts, these investments require initial margin deposits with a broker, which consist of cash or cash equivalents. The amount of these deposits is determined by the exchange or Board of Trade on which the contract is traded and is subject to change. Accordingly, variation margin payments are received or made to reflect daily unrealized gains or losses which are recorded in the Statement of Operatio ns. Futures contracts are valued daily at the last sales price established by the Board of Trade or exchange upon which they are traded. When the contracts are closed, the fund recognizes a realized gain or loss. There is minimal counterparty credit risk to the fund with futures, since futures are exchange traded and the exchange’s clearinghouse, as counterparty to all exchange traded futures, guarantees the futures against default. Contracts open at October 31, 2009 are set forth in the Statement of Financial Futures.
Options: A call option gives the purchaser of the option the right (but not the obligation) to buy, and obligates the writer to sell, the underlying security or securities at the exercise price at any time during the option period, or at a specified date. Conversely, a put option gives the purchaser of the option the right (but not the obligation) to sell, and obligates the writer to buy the underlying security or securities at the exercise price at any time during the option period, or at a specified date.The fund may purchase and write (sell) put and call options primarily to hedge against changes in security prices, or securities that the fund intends to purchase, or against fluctuations in value caused by changes in prevailing market interest rates or other market conditions.
48
As a writer of call options, the fund receives a premium at the outset and then bears the market risk of unfavorable changes in the price of the financial instrument underlying the option. Generally, the fund would incur a gain, to the extent of the premium, if the price of the underlying financial instrument decreases between the date the option is written and the date on which the option is terminated. Generally, the fund would realize a loss, if the price of the financial instrument increases between those dates.
As a writer of put options, the fund receives a premium at the outset and then bears the market risk of unfavorable changes in the price of the financial instrument underlying the option. Generally, the fund would incur a gain, to the extent of the premium, if the price of the underlying financial instrument increases between the date the option is written and the date on which the option is terminated. Generally, the fund would realize a loss, if the price of the financial instrument decreases between those dates. As a writer of an option, the fund may have no control over whether the underlying securities may be sold (call) or purchased (put) and as a result bear the market risk of an unfavorable change in the price of the security underlying the written option. One risk of holding a put or a call option is that if the option is not sold or exercised prior to its expiration, it becomes worthless. However, this risk is limited to the premiu m paid by the fund. Upon the expiration or closing of the option transaction, a gain or loss is reported in the Statement of Operations.
The following summarizes the fund’s call/put options written for the period ended October 31, 2009:
| | | Face Amount | | | | Options Terminated |
| | | | | | |
|
| | | Covered by | | Premiums | | | | Net Realized |
| Options Written: | | Contracts ($) | | Received ($) | | Cost ($) | | Gain (Loss) ($) |
| |
| |
| |
| |
|
| Contracts outstanding | | | | | | | | |
| 10/31/2008 | | — | | — | | | | |
| Contracts written | | 9,508,000 | | 630,380 | | — | | — |
| Contracts Outstanding | | | | | | | | |
| 10/31/2009 | | 9,508,000 | | 630,380 | | | | |
The Fund 49
| NOTES TO FINANCIAL STATEMENTS (continued) |
Forward Foreign Currency Exchange Contracts: The fund may enter into forward contracts in order to hedge its exposure to changes in foreign currency exchange rates on its foreign portfolio holdings, to settle foreign currency transactions or as a part of an investment strat-egy.When executing forward contracts, the fund is obligated to buy or sell a foreign currency at a specified rate on a certain date in the future. With respect to sales of forward contracts, the fund would incur a loss if the value of the contract increases between the date the forward contract is opened and the date the forward contract is closed. The fund realizes a gain if the value of the contract decreases between those dates.With respect to purchases of forward contracts, the fund would incur a loss if the value of the contract decreases between the date the forward contract is opened and t he date the forward contract is closed. The fund realizes a gain if the value of the contract increases between those dates.The fund is exposed to foreign currency risk as a result of changes in value of underlying financial instruments.The fund is also exposed to credit risk associated with counterparty nonperformance on these forward contracts, which is typically limited to the unrealized gain on each open contract.The following summarizes open forward contracts at October 31, 2009:
| | | Foreign | | | | | | Unrealized |
| Forward Foreign Currency | | Currency | | | | | | Appreciation |
| Exchange Contracts | | Amounts | | Cost ($) | | Value ($) (Depreciation) ($) |
| |
| |
| |
|
| Purchases: | | | | | | | | |
| Argentine Peso, | | | | | | | | |
| Expiring 12/4/2009 | | 25,790,000 | | 6,723,149 | | 6,713,742 | | (9,407) |
| Australian Dollar, | | | | | | | | |
| Expiring 11/25/2009 | | 3,205,000 | | 2,939,081 | | 2,878,001 | | (61,080) |
| Brazilian Real, | | | | | | | | |
| Expiring 11/25/2009 | | 7,205,000 | | 4,187,736 | | 4,067,978 | | (119,758) |
| Brazilian Real, | | | | | | | | |
| Expiring 12/4/2009 | | 11,670,000 | | 6,687,679 | | 6,578,014 | | (109,665) |
| Canadian Dollar, | | | | | | | | |
| Expiring 11/25/2009 | | 2,985,000 | | 2,882,025 | | 2,758,699 | | (123,326) |
50
| | | Foreign | | | | | | Unrealized |
| Forward Foreign Currency | | Currency | | | | | | Appreciation |
| Exchange Contracts | | Amounts | | Cost ($) | | Value ($) (Depreciation) ($) |
| |
| |
| |
|
| Purchases (continued): | | | | | | | | |
| Canadian Dollar, | | | | | | | | |
| Expiring 11/25/2009 | | 13,440,000 | | 13,036,773 | | 12,421,078 | | (615,695) |
| Canadian Dollar, | | | | | | | | |
| Expiring 11/25/2009 | | 3,000,000 | | 2,862,596 | | 2,772,562 | | (90,034) |
| Euro, | | | | | | | | |
| Expiring 11/2/2009 | | 1,081,868 | | 1,602,896 | | 1,592,130 | | (10,766) |
| Euro, | | | | | | | | |
| Expiring 11/5/2009 | | 588,909 | | 868,288 | | 866,668 | | (1,620) |
| Euro, | | | | | | | | |
| Expiring 11/10/2009 | | 903,177 | | 1,337,406 | | 1,329,159 | | (8,247) |
| Euro, | | | | | | | | |
| Expiring 11/25/2009 | | 3,380,000 | | 5,051,191 | | 4,973,858 | | (77,333) |
| Japanese Yen, | | | | | | | | |
| Expiring 11/2/2009 | | 123,015,323 | | 1,346,785 | | 1,366,609 | | 19,824 |
| Japanese Yen, | | | | | | | | |
| Expiring 11/25/2009 | | 98,720,000 | | 1,090,120 | | 1,096,852 | | 6,732 |
| Japanese Yen, | | | | | | | | |
| Expiring 11/25/2009 1,653,830,000 | | 18,247,447 | | 18,375,285 | | 127,838 |
| Japanese Yen, | | | | | | | | |
| Expiring 11/25/2009 | | 9,015,000 | | 99,474 | | 100,164 | | 690 |
| Japanese Yen, | | | | | | | | |
| Expiring 11/25/2009 | | 276,000,000 | | 2,994,005 | | 3,066,565 | | 72,560 |
| Malaysian Ringgit, | | | | | | | | |
| Expiring 11/25/2009 | | 5,085,000 | | 1,504,438 | | 1,488,368 | | (16,070) |
| Malaysian Ringgit, | | | | | | | | |
| Expiring 12/4/2009 | | 22,760,000 | | 6,679,384 | | 6,659,352 | | (20,032) |
| Mexican New Peso, | | | | | | | | |
| Expiring 11/25/2009 | | 25,020,000 | | 1,925,697 | | 1,888,478 | | (37,219) |
| Mexican New Peso, | | | | | | | | |
| Expiring 12/4/2009 | | 89,040,000 | | 6,706,233 | | 6,712,548 | | 6,315 |
| Norwegian Krone, | | | | | | | | |
| Expiring 11/25/2009 | | 52,200,000 | | 9,373,485 | | 9,107,639 | | (265,846) |
| Norwegian Krone, | | | | | | | | |
| Expiring 11/25/2009 | | 21,990,000 | | 3,953,819 | | 3,836,723 | | (117,096) |
| Norwegian Krone, | | | | | | | | |
| Expiring 11/25/2009 | | 7,500,000 | | 1,348,506 | | 1,308,569 | | (39,937) |
The Fund 51
| NOTES TO FINANCIAL STATEMENTS (continued) |
| | | | | Foreign | | | | | | Unrealized |
| Forward Foreign Currency | | Currency | | | | | | Appreciation |
| Exchange Contracts | | Amounts | | Cost ($) | | Value ($) (Depreciation) ($) |
| |
| |
| |
|
| Purchases (continued): | | | | | | | | |
| Norwegian Krone, | | | | | | | | | | |
| Expiring 11/25/2009 | | 27,700,000 | | 4,982,552 | | 4,832,981 | | (149,571) |
| Poland Zloty, | | | | | | | | | | |
| Expiring 11/25/2009 | | 20,040,000 | | 7,172,513 | | 6,914,108 | | (258,405) |
| Russian Ruble, | | | | | | | | | | |
| Expiring 12/4/2009 | | 196,660,000 | | 6,705,080 | | 6,681,812 | | (23,268) |
| Russian Ruble, | | | | | | | | | | |
| Expiring 2/3/2010 | | 92,000,000 | | 3,064,624 | | 3,087,634 | | 23,010 |
| South Korean Won, | | | | | | | | |
| Expiring | | | | | | | | | | |
| 11/25/2009 | | 22,147,045,000 | | 18,945,291 | | 18,726,524 | | (218,767) |
| South Korean Won, | | | | | | | | |
| Expiring | | | | | | | | | | |
| 11/25/2009 | | | | 4,972,500,000 | | 4,264,580 | | 4,204,518 | | (60,062) |
| South Korean Won, | | | | | | | | |
| Expiring | | | | | | | | | | |
| 11/25/2009 | | | | 4,712,000,000 | | 3,989,839 | | 3,984,251 | | (5,588) |
| Swedish Krona, | | | | | | | | | | |
| Expiring 11/25/2009 | | 24,040,000 | | 3,474,192 | | 3,390,000 | | (84,192) |
| Swedish Krona, | | | | | | | | | | |
| Expiring 11/25/2009 | | 17,845,000 | | 2,578,909 | | 2,516,413 | | (62,496) |
| Sales: | | | | | | Proceeds ($) | | | | |
| British Pounds, | | | | | | | | | | |
| Expiring 11/25/2009 | | 710,000 | | 1,160,460 | | 1,165,088 | | (4,628) |
| British Pounds, | | | | | | | | | | |
| Expiring 11/25/2009 | | 3,310,000 | | 5,426,745 | | 5,431,607 | | (4,862) |
| British Pounds, | | | | | | | | | | |
| Expiring 11/25/2009 | | 340,000 | | 557,484 | | 557,929 | | (445) |
| British Pounds, | | | | | | | | | | |
| Expiring 11/25/2009 | | 320,000 | | 523,795 | | 525,110 | | (1,315) |
| British Pounds, | | | | | | | | | | |
| Expiring 11/25/2009 | | 370,000 | | 608,521 | | 607,159 | | 1,362 |
| British Pounds, | | | | | | | | | | |
| Expiring 11/25/2009 | | 740,000 | | 1,227,309 | | 1,214,317 | | 12,992 |
| British Pounds, | | | | | | | | | | |
| Expiring 11/25/2009 | | 1,420,000 | | 2,317,001 | | 2,330,176 | | (13,175) |
52
| | | Foreign | | | | | | Unrealized |
| Forward Foreign Currency | | Currency | | | | | | Appreciation |
| Exchange Contracts | | Amounts | | Proceeds ($) | | Value ($) (Depreciation) ($) |
| |
| |
| |
|
| Sales (continued): | | | | | | | | |
| British Pounds, | | | | | | | | |
| Expiring 11/25/2009 | | 1,040,000 | | 1,703,010 | | 1,706,607 | | (3,597) |
| Euro, | | | | | | | | |
| Expiring 11/25/2009 | | 1,270,000 | | 1,880,549 | | 1,868,876 | | 11,673 |
| Euro, | | | | | | | | |
| Expiring 11/25/2009 | | 1,040,000 | | 1,549,319 | | 1,530,417 | | 18,902 |
| Euro, | | | | | | | | |
| Expiring 11/25/2009 | | 300,000 | | 448,332 | | 441,467 | | 6,865 |
| Euro, | | | | | | | | |
| Expiring 11/25/2009 | | 1,140,000 | | 1,697,198 | | 1,677,573 | | 19,625 |
| Euro, | | | | | | | | |
| Expiring 11/25/2009 | | 13,550,000 | | 20,249,595 | | 19,939,577 | | 310,018 |
| Euro, | | | | | | | | |
| Expiring 11/25/2009 | | 1,330,000 | | 1,987,911 | | 1,957,169 | | 30,742 |
| Euro, | | | | | | | | |
| Expiring 11/25/2009 | | 2,370,000 | | 3,541,240 | | 3,487,587 | | 53,653 |
| Euro, | | | | | | | | |
| Expiring 11/25/2009 | | 1,490,000 | | 2,235,903 | | 2,192,618 | | 43,285 |
| Euro, | | | | | | | | |
| Expiring 11/25/2009 | | 1,940,000 | | 2,884,272 | | 2,854,818 | | 29,454 |
| Euro, | | | | | | | | |
| Expiring 11/25/2009 | | 910,000 | | 1,347,464 | | 1,339,115 | | 8,349 |
| Euro, | | | | | | | | |
| Expiring 11/25/2009 | | 50,000 | | 73,591 | | 73,578 | | 13 |
| Euro, | | | | | | | | |
| Expiring 11/25/2009 | | 35,870,000 | | 53,041,328 | | 52,784,695 | | 256,633 |
| Euro, | | | | | | | | |
| Expiring 11/25/2009 | | 1,090,000 | | 1,614,845 | | 1,603,995 | | 10,850 |
| Euro, | | | | | | | | |
| Expiring 11/25/2009 | | 590,000 | | 869,843 | | 868,218 | | 1,625 |
| Hungary Forint, | | | | | | | | |
| Expiring 11/25/2009 | | 1,460,650 | | 8,205,899 | | 7,789,032 | | 416,867 |
| Gross Unrealized Appreciation | | | | | | 1,489,877 |
| Gross Unrealized Depreciation | | | | | | (2,613,502) |
The Fund 53
| NOTES TO FINANCIAL STATEMENTS (continued) |
Swaps: The fund may enter into swap agreements to exchange the interest rate on, or return generated by, one nominal instrument for the return generated by another nominal instrument.The fund enters into these agreements for a variety of reasons, including to hedge certain market or interest rate risks, to manage the interest rate sensitivity (sometimes called duration) of fixed income securities, to provide a substitute for purchasing or selling particular securities or to increase potential returns.
The fund accrues for the interim payments on swap contracts on a daily basis, with the net amount recorded within unrealized appreciation (depreciation) on swap contracts in the Statement of Assets and Liabilities. Once the interim payments are settled in cash, the net amount is recorded as realized gain (loss) on swaps, in addition to realized gain (loss) recorded upon the termination of swaps contracts in the Statement of Operations. Upfront payments made and/or received by the fund, are recorded as an asset and/or liability in the Statement of Assets and Liabilities and are recorded as a realized gain or loss ratably over the contract’s term/event with the exception of forward started interest rate swaps which are recorded as realized gains or losses on the termination date. Fluctuations in the value of swap contracts are recorded for financial statement purposes as unrealized appreciation or depreciation on swap transactions.
Interest Rate Swaps: Interest rate swaps involve the exchange of commitments to pay and receive interest based on a notional principal amount.The fund enters into these agreements for a variety of reasons, including to hedge certain market or interest rate risks, to manage the interest rate sensitivity (sometimes called duration) of fixed income securities, to provide a substitute for purchasing or selling particular securities or to increase potential returns.The fund may elect to pay a fixed rate and receive a floating rate, or receive a fixed rate and pay a floating rate on a notional principal amount.The net interest received
54
or paid on interest rate swap agreements is included within unrealized appreciation (depreciation) on swap contracts in the Statement of Assets and Liabilities. Interest rate swaps are valued daily and the change, if any, is recorded as an unrealized gain or loss in the Statement of Operations. When a swap contract is terminated early, the fund records a realized gain or loss equal to the difference between the current realized value and the expected cash flows.
The fund’s maximum risk of loss from counterparty credit risk is the discounted net value of the cash flows to be received from the coun-terparty over the contract’s remaining life, to the extent that the amount is positive. This risk is mitigated by having a master netting arrangement between the fund and the counterparty and by the posting of collateral by the counterparty to the fund to cover the fund’s exposure to the counterparty.The following summarizes open interest rate swaps entered into by the fund at October 31, 2009:
| | | | | | | | | | | Unrealized |
| Notional | | Reference | | | | (Pay)/Receive | | | | Appreciation |
| Amount ($) | | Entity/Currency | | Counterparty | | Fixed Rate (%) Expiration (Depreciation) ($) |
| |
| |
| |
|
| |
| 3,700,000 | | EUR - 1 Year | | Goldman, | | 2.70 | | 5/14/2014 | | 40,930 |
| | | Libor | | Sachs & Co. | | | | | | |
| 1,800,000 | | EUR - 6 Month | | Goldman, | | 3.79 | | 6/12/2019 | | 97,603 |
| | | Libor | | Sachs & Co. | | | | | | |
| 1,340,000 | | GBP - 6 Month | | JP Morgan | | 6.30 | | 6/18/2011 | | 204,007 |
| | | Libor | | | | | | | | |
| 14,200,000 | | JPY - 6 Month | | JP Morgan | | 1.67 | | 12/7/2017 | | 5,209 |
| | | Yenibor | | | | | | | | |
| 33,000,000 | | JPY - 6 Month | | JP Morgan | | 1.36 | | 1/19/2012 | | 6,653 |
| | | Yenibor | | | | | | | | |
| 205,000,000 | | JPY - 6 Month | | JP Morgan | | 1.13 | | 2/16/2019 | | (65,550) |
| | | Yenibor | | | | | | | | |
| 27,000,000 | | JPY - 6 Month | | JP Morgan | | 2.08 | | 7/28/2016 | | 19,628 |
| | | Yenibor | | | | | | | | |
| 7,400,000 | | USD - 6 Month | | Goldman, | | (2.54) | | 5/14/2014 | | (96,036) |
| | | Libor | | Sachs & Co. | | | | | | |
| Gross Unrealized Appreciation | | | | | | | | 374,030 |
| Gross Unrealized Depreciation | | | | | | | | (161,586) |
The Fund 55
| NOTES TO FINANCIAL STATEMENTS (continued) |
Credit Default Swaps: Credit default swaps involve commitments to pay a fixed interest rate in exchange for payment if a credit event affecting a third party (the referenced company, obligation or index) occurs. Credit events may include a failure to pay interest or principal, bankruptcy, or restructuring.The fund enters into these agreements to manage its exposure to the market or certain sectors of the market, to reduce its risk exposure to defaults of corporate and sovereign issuers, or to create exposure to corporate or sovereign issuers to which it is not otherwise exposed. For those credit default swaps in which the fund is paying a fixed rate, the fund is buying credit protection on the instrument. In the event of a credit event, the fund would receive the full notional amount for the reference obligation. For those credit default swaps in which the fund is r eceiving a fixed rate, the fund is selling credit protection on the underlying instrument.The maximum payouts for these contracts are limited to the notional amount of each swap. Credit default swaps may involve greater risks than if the fund had invested in the reference obligation directly and are subject to general market risk, liquidity risk, counterparty risk and credit risk.
The maximum potential amount of future payments (undiscounted) that a fund as a seller of protection could be required to make under a credit default swap agreement would be an amount equal to the notional amount of the agreement which may exceed the amount of unrealized appreciation or depreciation reflected on the Statement of Assets and Liabilities. Notional amounts of all credit default swap agreements are disclosed in the following chart, which summarizes open credit default swaps on index issues entered into by the fund at October 31, 2009. These potential amounts would be partially offset by any recovery values of the respective referenced obligations, underlying securities comprising the referenced index, upfront payments received upon entering into the agreement, or net amounts received from the settlement of buy protection credit default swap agreements
56
entered into by the fund for the same referenced entity or entities.The following summarizes open credit default swaps entered into by the fund at October 31, 2009:
| | | | | (Pay) | | | | | | Upfront | | |
| | | | | Receive | | Implied | | | | Premiums | | |
| Reference | | Notional | | Fixed | | Credit | | Market | | Receivable | | Unrealized |
| Obligation | | Amount ($)2 | | Rate (%) | | Spread (%)3 | | Value ($) | | (Payable) ($) (Depreciation) ($) |
| |
| |
| |
| |
| |
|
| Sale Contracts:1 | | | | | | | | | | | | |
| Dow Jones | | | | | | | | | | | | |
| CDX.NA.HY.13 | | | | | | | | | | | | |
| Index | | | | | | | | | | | | |
| 12/20/2014† | | 19,100,000a | | 5.00 | | 7.03 (1,505,347) | | (1,267,616) | | (128,967) |
| Dow Jones | | | | | | | | | | | | |
| CDX.NA.HY.13 | | | | | | | | | | | | |
| Index | | | | | | | | | | | | |
| 12/20/2014† | | 7,330,000b | | 5.00 | | 7.03 | | (577,706) | | (486,473) | | (49,493) |
| Gross Unrealized | | | | | | | | | | | | |
| Depreciation | | | | | | | | | | | | (178,460) |
| |
| † Expiration Date | | | | | | | | | | | | |
| Counterparty: | | | | | | | | | | | | |
| a | | Barclays |
| b | | Goldman, Sachs & Co. |
| 1 | | If the fund is a seller of protection and a credit event occurs, as defined under the terms of the swap |
| | | agreement, the fund will either (i) pay to the buyer of protection an amount equal to the notional |
| | | amount of the swap and take delivery of the reference obligation or (ii) pay a net settlement |
| | | amount in the form of cash or securities equal to the notional amount of the swap less the recovery |
| | | value of the reference obligation. |
| 2 | | The maximum potential amount the fund could be required to pay as a seller of credit protection |
| | | or receive as a buyer of credit protection if a credit event occurs as defined under the terms of the |
| | | swap agreement. |
| 3 | | Implied credit spreads, represented in absolute terms, utilized in determining the market value as of |
| | | the period end serve as an indicator of the current status of the payment/performance risk and |
| | | represent the likelihood of risk of default for the credit derivative.The credit spread of a particular |
| | | referenced entity reflects the cost of buying/selling protection and may include upfront payments |
| | | required to be made to enter into the agreement.Wider credit spreads represent a deterioration of |
| | | the referenced entity’s credit soundness and a greater likelihood of risk of default or other credit |
| | | event occurring as defined under the terms of the agreement.A credit spread identified as |
| | | Defaulted indicates a credit event has occurred for the referenced entity. |
GAAP includes required disclosure for (i) the nature and terms of the credit derivative, reasons for entering into the credit derivative, the events or circumstances that would require the seller to perform under
The Fund 57
| NOTES TO FINANCIAL STATEMENTS (continued) |
the credit derivative, and the current status of the payment/performance risk of the credit derivative, (ii) the maximum potential amount of future payments (undiscounted) the seller could be required to make under the credit derivative, (iii) the fair value of the credit derivative, and (iv) the nature of any recourse provisions and assets held either as collateral or by third parties. There are amendments, which require additional disclosures about the current status of the payment/performance risk of a guarantee.All changes to accounting policies have been made in accordance with these amendments and are incorporated within current period as part of the Notes to the Statement of Investments and disclosures within this Note.
At October 31, 2009, the cost of investments for federal income tax purposes was $364,098,296; accordingly, accumulated net unrealized appreciation on investments was $9,057,187, consisting of $10,071,691 gross unrealized appreciation and $1,014,504 gross unrealized depreciation.
NOTE 5—Subsequent Events Evaluation:
Dreyfus has evaluated the need for disclosures and/or adjustments resulting from subsequent events through December 29, 2009, the date the financial statements were issued. This evaluation did not result in any subsequent events that necessitated disclosures and/or adjustments.
58
REPORT OF INDEPENDENT REGISTERED
PUBLIC ACCOUNTING FIRM |
The Board of Trustees and Shareholders The Dreyfus/Laurel Funds Trust
We have audited the accompanying statement of assets and liabilities of Dreyfus International Bond Fund (the “Fund”) a series of The Dreyfus/Laurel Funds Trust, including the statements of investments, financial futures and options written, as of October 31, 2009, and the related statement of operations for the year then ended, the statement of changes in net assets for each of the years in the two-year period then ended and the financial highlights for each of the years in the three-year period then ended and for the period from December 30, 2005 (commencement of operations) to October 31, 2006. These financial statements and financial highlights are the responsibility of the Fund’s management. Our responsibility is to express an opinion on these financial statements and financial highlights based on our audits.
We conducted our audits in accordance with the standards of the Public Company Accounting Oversight Board (United States).Those standards require that we plan and perform the audit to obtain reasonable assurance about whether the financial statements and financial highlights are free of material misstatement. An audit includes examining, on a test basis, evidence supporting the amounts and disclosures in the financial statements. Our procedures included confirmation of securities owned as of October 31, 2009, by correspondence with the custodian and brokers or by other appropriate auditing procedures where replies from brokers were not received. An audit also includes assessing the accounting principles used and significant estimates made by management, as well as evaluating the overall financial statement presentation.We believe that our audits provide a reasonable basis for our opinion.
In our opinion, the financial statements and financial highlights referred to above present fairly, in all material respects, the financial position of Dreyfus International Bond Fund as of October 31, 2009, and the results of its operations for the year then ended, the changes in its net assets for each of the years in the two-year period then ended and the financial highlights for each of the years in the three-year period then ended and for the period from December 30, 2005 (commencement of operations) to October 31, 2006, in conformity with U.S. generally accepted accounting principles.

| | New York, New York
December 29, 2009 |
The Fund 59
IMPORTANT TAX INFORMATION (Unaudited)
In accordance with federal tax law, the fund elects to provide each shareholder with their portion of the fund’s income sourced from foreign countries. Accordingly, the fund hereby makes the following designation regarding its fiscal year ended October 31, 2009:
| — the total amount of income sourced from foreign countries was $2,858,905. |
| |
Where required by federal tax law rules, shareholders will receive notification of their proportionate share of foreign sourced income for the 2009 calendar year with Form 1099-DIV which will be mailed in early 2010.Also, the fund hereby designates 28.90% of ordinary income dividends paid during the fiscal year ended October 31, 2009 as qualifying interest related dividends.
60
BOARD MEMBERS INFORMATION (Unaudited)
| Joseph S. DiMartino (66) |
| Chairman of the Board (1999) |
| Principal Occupation During Past 5Years: |
| • Corporate Director and Trustee |
| Other Board Memberships and Affiliations: |
| • The Muscular Dystrophy Association, Director |
| • CBIZ (formerly, Century Business Services, Inc.), a provider of outsourcing functions for small |
| and medium size companies, Director |
| • The Newark Group, a provider of a national market of paper recovery facilities, paperboard mills |
| and paperboard converting plants, Director |
| • Sunair Services Corporation, a provider of certain outdoor-related services to homes and busi- |
| nesses, Director |
| No. of Portfolios for which Board Member Serves: 173 |
| ——————— |
| James M. Fitzgibbons (75) |
| Board Member (1994) |
| Principal Occupation During Past 5Years: |
| • Corporate Director and Trustee |
| Other Board Memberships and Affiliations: |
| • Bill Barrett Company, an oil and gas exploration company, Director |
| No. of Portfolios for which Board Member Serves: 37 |
| ——————— |
| Kenneth A. Himmel (63) |
| Board Member (1994) |
| Principal Occupation During Past 5Years: |
| • President and CEO, Related Urban Development, a real estate development company (1996- |
| present) |
| • President and CEO, Himmel & Company, a real estate development company (1980-present) |
| • CEO, American Food Management, a restaurant company (1983-present) |
| No. of Portfolios for which Board Member Serves: 37 |
| ——————— |
| Stephen J. Lockwood (62) |
| Board Member (1994) |
| Principal Occupation During Past 5Years: |
| • Chairman of the Board, Stephen J. Lockwood and Company LLC, a real estate investment com- |
| pany (2000-present) |
| No. of Portfolios for which Board Member Serves: 37 |
The Fund 61
| | BOARD MEMBERS (Unaudited) (continued) |
| Roslyn M. Watson (60) |
| Board Member (1994) |
| Principal Occupation During Past 5Years: |
| • Principal,Watson Ventures, Inc., a real estate investment company (1993-present) |
| Other Board Memberships and Affiliations: |
| • American Express Bank, FSB, Director |
| • The Hyams Foundation Inc., a Massachusetts Charitable Foundation,Trustee |
| • National Osteoporosis Foundation,Trustee |
| • SBLI-USA, Director |
| No. of Portfolios for which Board Member Serves: 37 |
| ——————— |
| Benaree Pratt Wiley (63) |
| Board Member (1998) |
| Principal Occupation During Past 5Years: |
| • Principal, The Wiley Group, a firm specializing in strategy and business development |
| (2005-present) |
| • President and CEO,The Partnership, an organization dedicated to increasing the representation |
| of African Americans in positions of leadership, influence and decision-making in Boston, MA |
| (1991-2005) |
| Other Board Memberships and Affiliations: |
| • Blue Cross Blue Shield of Massachusetts, Director |
| • CBIZ (formerly, Century Business Services, Inc.), a provider of outsourcing functions for small |
| and medium size companies, Director |
| • Commonwealth Institute, Director |
| • Efficacy Institute, Director |
| • PepsiCo African-American, Chair of Advisory Board |
| • The Boston Foundation, Director |
| No. of Portfolios for which Board Member Serves: 60 |
| ——————— |
| Once elected all Board Members serve for an indefinite term, but achieve Emeritus status upon reaching age 80.The |
| address of the Board Members and Officers is in c/o The Dreyfus Corporation, 200 Park Avenue, NewYork, NewYork |
| 10166. Additional information about the Board Members is available in the fund’s Statement of Additional Information |
| which can be obtained from Dreyfus free of charge by calling this toll free number: 1-800-554-4611. |
| J.Tomlinson Fort, Emeritus Board Member |
62
OFFICERS OF THE FUND (Unaudited)
The Fund 63
OFFICERS OF THE FUND (Unaudited) (continued)
64
Item 2. Code of Ethics.
The Registrant has adopted a code of ethics that applies to the Registrant's principal executive officer, principal financial officer, principal accounting officer or controller, or persons performing similar functions. There have been no amendments to, or waivers in connection with, the Code of Ethics during the period covered by this Report.
Item 3. Audit Committee Financial Expert.
The Registrant's Board has determined that Joseph S. DiMartino, a member of the Audit Committee of the Board, is an audit committee financial expert as defined by the Securities and Exchange Commission (the "SEC"). Joseph S. DiMartino is "independent" as defined by the SEC for purposes of audit committee financial expert determinations.
Item 4. Principal Accountant Fees and Services.
(a) Audit Fees. The aggregate fees billed for each of the last two fiscal years (the "Reporting Periods") for professional services rendered by the Registrant's principal accountant (the "Auditor") for the audit of the Registrant's annual financial statements or services that are normally provided by the Auditor in connection with the statutory and regulatory filings or engagements for the Reporting Periods, were $96,420 in 2008 and $67,115 in 2009.
(b) Audit-Related Fees. The aggregate fees billed in the Reporting Periods for assurance and related services by the Auditor that are reasonably related to the performance of the audit of the Registrant's financial statements and are not reported under paragraph (a) of this Item 4 were $12,650 in 2008 and $8,600 in 2009. These services consisted of security counts required by Rule 17f-2 under the Investment Company Act of 1940, as amended.
The aggregate fees billed in the Reporting Periods for non-audit assurance and related services by the Auditor to the Registrant's investment adviser (not including any sub-investment adviser whose role is primarily portfolio management and is subcontracted with or overseen by another investment adviser), and any entity controlling, controlled by or under common control with the investment adviser that provides ongoing services to the Registrant ("Service Affiliates"), that were reasonably related to the performance of the annual audit of the Service Affiliate, which required pre-approval by the Audit Committee were $ -0- in 2008 and $ -0- in 2009.
(c) Tax Fees. The aggregate fees billed in the Reporting Periods for professional services rendered by the Auditor for tax compliance, tax advice, and tax planning ("Tax Services") were $6,450 in 2008 and $4,430 in 2009. These services consisted of a review or preparation of U.S. federal, state, local and excise tax returns.
The aggregate fees billed in the Reporting Periods for Tax Services by the Auditor to Service Affiliates, which required pre-approval by the Audit Committee were $ -0- in 2008 and $ -0- in 2009.
(d) All Other Fees. The aggregate fees billed in the Reporting Periods for products and services provided by the Auditor, other than the services reported in paragraphs (a) through (c) of this Item, were $ -0- in 2008 and $ -0- in 2009.
The aggregate fees billed in the Reporting Periods for Non-Audit Services by the Auditor to Service Affiliates, other than the services reported in paragraphs (b) through (c) of this Item, which required pre-approval by the Audit Committee, were $ -0- in 2008 and $ -0- in 2009.
Note: In each of (b) through (d) of this Item 4, 100% of all services provided by the Auditor were pre-approved as required.
Audit Committee Pre-Approval Policies and Procedures. The Registrant's Audit Committee has established policies and procedures (the "Policy") for pre-approval (within specified fee limits) of the Auditor's engagements for non-audit services to the Registrant and Service Affiliates without specific case-by-case consideration. Pre-approval considerations include whether the proposed services are compatible with maintaining the Auditor's independence. Pre-approvals pursuant to the Policy are considered annually.
Non-Audit Fees. The aggregate non-audit fees billed by the Auditor for services rendered to the Registrant, and rendered to Service Affiliates, for the Reporting Periods were $2,532,612 in 2008 and $3,802,000 in 2009.
Auditor Independence. The Registrant's Audit Committee has considered whether the provision of non-audit services that were rendered to Service Affiliates, which were not pre-approved (not requiring pre-approval), is compatible with maintaining the Auditor's independence.
| Item 5. | | Audit Committee of Listed Registrants. |
| | | Not applicable. |
| Item 6. | | Investments. |
| (a) | | Not applicable. |
| Item 7. | | Disclosure of Proxy Voting Policies and Procedures for Closed-End Management |
| | | Investment Companies. |
| | | Not applicable. |
| Item 8. | | Portfolio Managers of Closed-End Management Investment Companies. |
| | | Not applicable. |
| Item 9. | | Purchases of Equity Securities by Closed-End Management Investment Companies and |
| | | Affiliated Purchasers. |
| | | Not applicable. |
| Item 10. | | Submission of Matters to a Vote of Security Holders. |
| There have been no material changes to the procedures applicable to Item 10. |
Item 11. Controls and Procedures.
(a) The Registrant's principal executive and principal financial officers have concluded, based on their evaluation of the Registrant's disclosure controls and procedures as of a date within 90 days of the filing date of this report, that the Registrant's disclosure controls and procedures are reasonably designed to ensure that information required to be disclosed by the Registrant on Form N-CSR is recorded, processed, summarized and reported within the required time periods and that information required to be disclosed by the Registrant in the reports that it files or submits on Form N-CSR is accumulated and communicated to the Registrant's management, including its principal executive and principal financial officers, as appropriate to allow timely decisions regarding required disclosure.
(b) There were no changes to the Registrant's internal control over financial reporting that occurred during the second fiscal quarter of the period covered by this report that have materially affected, or are reasonably likely to materially affect, the Registrant's internal control over financial reporting.
Item 12. Exhibits.
(a)(1) Code of ethics referred to in Item 2.
(a)(2) Certifications of principal executive and principal financial officers as required by Rule 30a-2(a) under the Investment Company Act of 1940.
(a)(3) Not applicable.
(b) Certification of principal executive and principal financial officers as required by Rule 30a-2(b) under the Investment Company Act of 1940.
Pursuant to the requirements of the Securities Exchange Act of 1934 and the Investment Company Act of 1940, the Registrant has duly caused this Report to be signed on its behalf by the undersigned, thereunto duly authorized.
The Dreyfus/Laurel Funds Trust
| By: | | /s/ J. David Officer |
| | |
|
| | | J. David Officer, |
| | President |
| |
| Date: | | December 23, 2009 |
Pursuant to the requirements of the Securities Exchange Act of 1934 and the Investment Company Act of 1940, this Report has been signed below by the following persons on behalf of the Registrant and in the capacities and on the dates indicated.
| By: | | /s/ J. David Officer |
| | |
|
| | | J. David Officer, |
| | President |
| |
| Date: | | December 23, 2009 |
| |
| By: | | /s/ James Windels |
| | |
|
| | | James Windels, |
| | Treasurer |
| |
| Date: | | December 23, 2009 |
EXHIBIT INDEX
(a)(1) Code of ethics referred to in Item 2.
(a)(2) Certifications of principal executive and principal financial officers as required by Rule 30a-2(a) under the Investment Company Act of 1940. (EX-99.CERT)
(b) Certification of principal executive and principal financial officers as required by Rule 30a-2(b) under the Investment Company Act of 1940. (EX-99.906CERT)