UNITED STATES
SECURITIES AND EXCHANGE COMMISSION
Washington, D.C. 20549
FORM N-CSR
CERTIFIED SHAREHOLDER REPORT OF REGISTERED MANAGEMENT
INVESTMENT COMPANIES
Investment Company Act file number 811-524
Dreyfus/Laurel Funds Trust
(Exact name of Registrant as specified in charter)
c/o The Dreyfus Corporation
200 Park Avenue
New York, New York 10166
(Address of principal executive offices) (Zip code)
Michael A. Rosenberg, Esq.
200 Park Avenue
New York, New York 10166
(Name and address of agent for service)
| Registrant's telephone number, including area code: | (212) 922-6000 | | |
| Date of fiscal year end: | 12/31 | | |
| Date of reporting period: | 12/31/09 | | |
The following N-CSR relates only to the Registrant’s series listed below and does not affect the other series of the Registrant, which have different fiscal year ends and, therefore, different N-CSR reporting requirements. Separate N-CSR Forms will be filed for these series, as appropriate.
Dreyfus Core Value Fund
Dreyfus High Yield Fund
FORM N-CSR
Item 1. Reports to Stockholders.
ANNUAL REPORT December 31, 2009

Save time. Save paper. View your next shareholder report online as soon as it’s available. Log into www.dreyfus.com and sign up for Dreyfus eCommunications. It’s simple and only takes a few minutes.
The views expressed in this report reflect those of the portfolio manager only through the end of the period covered and do not necessarily represent the views of Dreyfus or any other person in the Dreyfus organization. Any such views are subject to change at any time based upon market or other conditions and Dreyfus disclaims any responsibility to update such views.These views may not be relied on as investment advice and, because investment decisions for a Dreyfus fund are based on numerous factors, may not be relied on as an indication of trading intent on behalf of any Dreyfus fund.

| | Contents |
| | THE FUND |
| 2 | A Letter from the Chairman and CEO |
| 3 | Discussion of Fund Performance |
| 6 | Fund Performance |
| 8 | Understanding Your Fund’s Expenses |
| 8 | Comparing Your Fund’s Expenses With Those of Other Funds |
| 9 | Statement of Investments |
| 13 | Statement of Assets and Liabilities |
| 14 | Statement of Operations |
| 15 | Statement of Changes in Net Assets |
| 18 | Financial Highlights |
| 23 | Notes to Financial Statements |
| 34 | Report of Independent Registered Public Accounting Firm |
| 35 | Important Tax Information |
| 36 | Board Members Information |
| 38 | Officers of the Fund |
| | FOR MORE INFORMATION |
| | Back Cover |
Dreyfus
Core Value Fund
The Fund

A LETTER FROM THE CHAIRMAN AND CEO
Dear Shareholder:
We are pleased to present this annual report for Dreyfus Core Value Fund, covering the 12-month period from January 1, 2009, through December 31, 2009.
The U.S. stock market ended 2009 with a healthy annual gain, but market indices across all capitalization ranges and investment styles remained well below the peaks reached in the fall of 2007.The equity market’s advance was driven by improving investor sentiment as the U.S. economy staged a gradual, but sustained, recovery from the recession and banking crisis that had depressed stock prices at the beginning of the year. After four consecutive quarters of contraction, the U.S. economy returned to growth during the third quarter of 2009, buoyed by greater manufacturing activity to replenish depleted inventories and satisfy export demand. The slumping housing market also showed signs of renewed life later in the year when home sales and prices rebounded modestly. However, economic headwinds remain, including a high unemployment rate and the prospect of anemic consumer spending.
As 2010 begins, our Chief Economist, as well as many securities analysts and portfolio managers have continued to find opportunities and survey potential challenges across a variety of asset classes, including equities. While no one can predict the future, we believe that the 2010 investment environment will likely require a broader range of investment considerations relative to last year. As always, your financial adviser can help you determine the mix of investments that may be best suited to helping you achieve your goals at a level of risk that is comfortable for you.
For information about how the fund performed during the reporting period, as well as market perspectives, we have provided a Discussion of Fund Performance.
Thank you for your continued confidence and support.

Jonathan R. Baum
Chairman and Chief Executive Officer
The Dreyfus Corporation
January 15, 2010
2

DISCUSSION OF FUND PERFORMANCE
For the reporting period of January 1, 2009, through December 31, 2009, as provided by Brian Ferguson, Portfolio Manager
Fund and Market Performance Overview
For the 12-month period ended December 31, 2009, Dreyfus CoreValue Fund’s Class A shares produced a total return of 18.07%, Class B shares returned 17.21%, Class C shares returned 17.16%, Class I shares returned 18.43%, and Institutional shares returned 18.20%.1 In comparison, the fund’s benchmark, the Russell 1000Value Index (the “Index”), produced a total return of 19.69% for the same period.2
In the wake of a severe recession and banking crisis, stocks rallied over much of 2009 as credit markets thawed and investors looked forward to better economic times. However, large-cap value stocks generally advanced less robustly than their smaller and more growth-oriented counterparts. The fund produced lower returns than its benchmark, due primarily to shortfalls in the consumer discretionary sector and, to a lesser extent, the utilities sector.
The Fund’s Investment Approach
The fund invests primarily in large-cap companies that are considered undervalued based on traditional measures, such as price-to-earnings ratios. When choosing stocks, we use a “bottom-up” stock selection approach, focusing on individual companies, rather than a “top-down” approach that forecasts market trends. We also focus on a company’s relative value, financial strength, business momentum and likely catalysts that could ignite the stock price.
U.S. Stock Market Rebounded Sharply
During the winter of 2009,equity markets were still reeling from a global financial crisis that nearly led to the collapse of the worldwide banking system. In addition, rising unemployment and declining housing markets had produced the most severe recession since the 1930s.These influences fueled a bear market that drove stocks across all capitalization ranges and
The Fund 3
DISCUSSION OF FUND PERFORMANCE (continued)
investment styles to multi-year lows during the first quarter of the year. The decline affected a wide variety of industry groups seemingly regardless of their underlying business fundamentals.
Market sentiment began to improve in early March, as aggressive measures adopted by government and monetary authorities to repair the credit markets—including historically low short-term interest rates, a massive economic stimulus program and rescues of troubled corporations—seemed to gain traction. Additional evidence of economic stabilization later appeared, sparking a sustained market rally through year-end. Smaller, lower-quality companies generally led the rally as investors sought bargains among stocks that had been severely punished in the downturn.
Stock Selection Strategy Drove Fund Performance
Although investor behavior during the downturn was motivated more by fear of losses than the strengths and weaknesses of individual companies, our stock selection strategy proved relatively effective, helping the fund cushion market declines. Our process continued to find value-oriented opportunities during the rally over the remainder of 2009, when investors’ appetite for risk returned, but returns were particularly strong among benchmark components that did not meet our investment criteria, causing the fund to lag the Russell 1000Value Index.
Disappointments were particularly pronounced in the economically sensitive consumer discretionary sector, where poor timing in the purchase and sale of used car chain AutoZone weighed on the fund’s relative performance.The fund did not own Ford Motor Company as the recession-stressed company did not meet our investment criteria, but Ford rallied strongly when it became clearer that bankruptcy was unlikely. Instead, we preferred automobile-related investments such as Johnson Controls, which does business with a variety of automakers but lagged sector averages. In the relatively small utilities sector, the fund encountered difficulties with several regulated electricity producers when proposed regulatory reforms were delayed.
On a more positive note, the fund’s relative performance was especially strong in the energy sector, where a more constructive investment
4
posture helped bolster the fund’s results as rising commodity prices drove stock prices higher.An underweighted position in industry bellwether Exxon Mobil boosted relative returns when investors turned toward less defensive investments in the rally. Instead, we focused on smaller oil producers such as Occidental Petroleum, which advanced due to an attractive valuation and strong growth prospects.
In the health care sector, the fund benefited from favorable timing in trades involving pharmaceutical developer Wyeth Pharmaceuticals, which was acquired by a former rival at a substantial premium to its prevailing stock price.We sold the stock soon after the acquisition was announced, avoiding subsequent declines stemming from arbitrage activity among institutional investors.
Positioned for a Global Economic Recovery
As of the reporting period’s end, the economy appears to be gaining strength, and we have seen signs that investors have been refocusing on companies with healthy finances and strong business fundamentals.In our judgment, these developments could lead to an investment environment that is especially well suited to our stock selection process. Indeed, we have continued to seek attractive opportunities among multinational companies, especially in the information technology and consumer discretionary sectors, that appear poised to prosper during an economic rebound that may be more robust overseas than in the United States.We have found fewer opportunities in the industrials and utilities sectors.
January 15, 2010
| |
| 1 | Total return includes reinvestment of dividends and any capital gains paid, and does not take into |
| | consideration the maximum initial sales charges in the case of Class A shares or the applicable |
| | contingent deferred sales charges imposed on redemptions in the case of Class B and Class C |
| | shares. Had these charges been reflected, returns would have been lower. Past performance is no |
| | guarantee of future results. Share price and investment return fluctuate such that upon redemption, |
| | fund shares may be worth more or less than their original cost. |
| 2 | SOURCE: LIPPER INC. — Reflects the reinvestment of dividends and, where applicable, |
| | capital gain distributions.The Russell 1000 Value Index is an unmanaged index, which measures |
| | the performance of those Russell 1000 companies with lower price-to-book ratios and lower |
| | forecasted growth values. |
The Fund 5
FUND PERFORMANCE
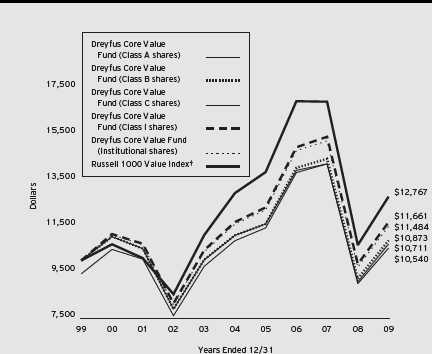
Comparison of change in value of $10,000 investment in Dreyfus Core Value Fund Class A shares, Class B shares, Class C shares, Class I shares and Institutional shares and the Russell 1000 Value Index
|
| † Source: Lipper Inc. |
| Past performance is not predictive of future performance. |
| The above graph compares a $10,000 investment made in Class A shares, Class B shares, Class C shares, Class I |
| shares and Institutional shares of Dreyfus Core Value Fund on 12/31/99 to a $10,000 investment made in the |
| Russell 1000 Value Index (the “Index”) on that date. All dividends and capital gain distributions are reinvested. |
| The fund’s performance shown in the line graph takes into account the maximum initial sales charge on Class A shares |
| and all other applicable fees and expenses on all classes.The Index is an unmanaged index, which measures the |
| performance of those Russell 1000 companies with lower price-to-book ratios and lower forecasted growth values. Unlike |
| a mutual fund, the Index is not subject to charges, fees and other expenses. Investors cannot invest directly in any index. |
| Further information relating to fund performance, including expense reimbursements, if applicable, is contained in the |
| Financial Highlights section of the prospectus and elsewhere in this report. |
6
| | | |
| Average Annual Total Returns as of 12/31/09 | | | |
| |
| | 1 Year | 5 Years | 10 Years |
| Class A shares | | | |
| with maximum sales charge (5.75%) | 11.30% | –1.44% | 0.69% |
| without sales charge | 18.07% | –0.27% | 1.29% |
| Class B shares | | | |
| with applicable redemption charge † | 13.21% | –1.30% | 0.84% |
| without redemption | 17.21% | –1.00% | 0.84% |
| Class C shares | | | |
| with applicable redemption charge †† | 16.16% | –1.02% | 0.53% |
| without redemption | 17.16% | –1.02% | 0.53% |
| Class I shares | 18.43% | –0.01% | 1.55% |
| Institutional shares | 18.20% | –0.16% | 1.39% |
Past performance is not predictive of future performance.The fund’s performance shown in the graph and table does not reflect the deduction of taxes that a shareholder would pay on fund distributions or the redemption of fund shares. Performance for Class B shares assumes the conversion of Class B shares to Class A shares at the end of the sixth year following the date of purchase.
† The maximum contingent deferred sales charge for Class B shares is 4%. After six years Class B shares convert to Class A shares.
The maximum contingent deferred sales charge for Class C shares is 1% for shares redeemed within one year of the date of purchase.
The Fund 7
UNDERSTANDING YOUR FUND’S EXPENSES (Unaudited)
As a mutual fund investor, you pay ongoing expenses, such as management fees and other expenses. Using the information below, you can estimate how these expenses affect your investment and compare them with the expenses of other funds.You also may pay one-time transaction expenses, including sales charges (loads) and redemption fees, which are not shown in this section and would have resulted in higher total expenses. For more information, see your fund’s prospectus or talk to your financial adviser.
Review your fund’s expenses
The table below shows the expenses you would have paid on a $1,000 investment in Dreyfus Core Value Fund from July 1, 2009 to December 31, 2009. It also shows how much a $1,000 investment would be worth at the close of the period, assuming actual returns and expenses.
Expenses and Value of a $1,000 Investment
assuming actual returns for the six months ended December 31, 2009
| | | | | |
| | Class A | Class B | Class C | Class I | Institutional |
| Expenses paid per $1,000† | $ 6.36 | $ 10.49 | $ 10.49 | $ 4.98 | $ 5.81 |
| Ending value (after expenses) | $1,195.40 | $1,190.40 | $1,190.60 | $1,196.90 | $1,196.10 |
COMPARING YOUR FUND’S EXPENSES
WITH THOSE OF OTHER FUNDS (Unaudited)
Using the SEC’s method to compare expenses
The Securities and Exchange Commission (SEC) has established guidelines to help investors assess fund expenses. Per these guidelines, the table below shows your fund’s expenses based on a $1,000 investment, assuming a hypothetical 5% annualized return. You can use this information to compare the ongoing expenses (but not transaction expenses or total cost) of investing in the fund with those of other funds.All mutual fund shareholder reports will provide this information to help you make this comparison. Please note that you cannot use this information to estimate your actual ending account balance and expenses paid during the period.
Expenses and Value of a $1,000 Investment
assuming a hypothetical 5% annualized return for the six months ended December 31, 2009
| | | | | |
| | Class A | Class B | Class C | Class I | Institutional |
| Expenses paid per $1,000† | $ 5.85 | $ 9.65 | $ 9.65 | $ 4.58 | $ 5.35 |
| Ending value (after expenses) | $1,019.41 | $1,015.63 | $1,015.63 | $1,020.67 | $1,019.91 |
|
| † Expenses are equal to the fund’s annualized expense ratio of 1.15% for Class A, 1.90% for Class B, 1.90% for Class |
| C, .90% for Class I and 1.05% for Institutional Shares, multiplied by the average account value over the period, |
| multiplied by 184/365 (to reflect the one-half year period). |
8
|
| STATEMENT OF INVESTMENTS |
| December 31, 2009 |
| | |
| Common Stocks—99.4% | Shares | Value ($) |
| Consumer Discretionary—11.1% | | |
| Best Buy | 55,170 | 2,177,008 |
| Carnival | 108,850 a | 3,449,456 |
| Dollar General | 85,090 a | 1,908,569 |
| Home Depot | 215,590 | 6,237,019 |
| Johnson Controls | 128,810 | 3,508,784 |
| Limited Brands | 97,490 | 1,875,708 |
| News, Cl. A | 306,210 | 4,192,015 |
| Omnicom Group | 97,060 | 3,799,899 |
| Staples | 72,060 b | 1,771,955 |
| Target | 36,330 | 1,757,282 |
| Time Warner | 233,626 | 6,807,862 |
| Toll Brothers | 62,390 a,b | 1,173,556 |
| Walt Disney | 54,800 | 1,767,300 |
| | | 40,426,413 |
| Consumer Staples—6.9% | | |
| Coca-Cola Enterprises | 82,040 | 1,739,248 |
| CVS Caremark | 179,270 | 5,774,287 |
| Kellogg | 67,360 | 3,583,552 |
| PepsiCo | 116,110 | 7,059,488 |
| Philip Morris International | 70,770 | 3,410,406 |
| Procter & Gamble | 56,920 | 3,451,060 |
| | | 25,018,041 |
| Energy—18.5% | | |
| Chevron | 181,710 | 13,989,852 |
| ConocoPhillips | 143,880 | 7,347,952 |
| Devon Energy | 31,720 | 2,331,420 |
| EOG Resources | 69,610 | 6,773,053 |
| Exxon Mobil | 145,042 | 9,890,414 |
| Hess | 64,150 | 3,881,075 |
| Marathon Oil | 83,170 | 2,596,567 |
| Occidental Petroleum | 200,850 | 16,339,147 |
| Peabody Energy | 40,750 | 1,842,307 |
| Schlumberger | 30,300 | 1,972,227 |
| | | 66,964,014 |
| Exchange Traded Funds—1.0% | | |
| iShares Russell 1000 Value Index Fund | 63,390 | 3,638,586 |
The Fund 9
STATEMENT OF INVESTMENTS (continued)
| | |
| Common Stocks (continued) | Shares | Value ($) |
| Financial—23.8% | | |
| ACE | 34,580 | 1,742,832 |
| Aflac | 41,080 | 1,899,950 |
| American Express | 50,050 | 2,028,026 |
| Ameriprise Financial | 89,160 | 3,461,191 |
| AON | 66,500 | 2,549,610 |
| Bank of America | 618,396 | 9,313,044 |
| Capital One Financial | 28,810 | 1,104,575 |
| Citigroup | 1,088,330 | 3,602,372 |
| Goldman Sachs Group | 41,360 | 6,983,222 |
| JPMorgan Chase & Co. | 372,680 | 15,529,576 |
| Marsh & McLennan Cos. | 107,200 | 2,366,976 |
| MetLife | 143,980 | 5,089,693 |
| Morgan Stanley | 157,230 | 4,654,008 |
| Prudential Financial | 58,780 | 2,924,892 |
| State Street | 72,200 | 3,143,588 |
| SunTrust Banks | 83,530 | 1,694,824 |
| Travelers Cos. | 105,960 | 5,283,166 |
| U.S. Bancorp | 149,470 | 3,364,570 |
| Wells Fargo & Co. | 350,850 | 9,469,441 |
| | | 86,205,556 |
| Health Care—10.4% | | |
| AmerisourceBergen | 83,560 | 2,178,409 |
| Amgen | 61,710 a | 3,490,935 |
| Covidien | 82,030 | 3,928,417 |
| Johnson & Johnson | 39,970 | 2,574,468 |
| McKesson | 30,320 | 1,895,000 |
| Merck & Co. | 130,900 | 4,783,086 |
| Pfizer | 640,640 | 11,653,242 |
| Thermo Fisher Scientific | 37,940 a | 1,809,359 |
| UnitedHealth Group | 54,540 | 1,662,379 |
| Warner Chilcott, Cl. A | 69,364 a | 1,974,793 |
| WellPoint | 30,450 a | 1,774,931 |
| | | 37,725,019 |
| Industrial—6.9% | | |
| Dover | 46,370 | 1,929,456 |
| Eaton | 48,730 | 3,100,203 |
| General Electric | 412,490 | 6,240,974 |
10
| | |
| Common Stocks (continued) | Shares | Value ($) |
| Industrial (continued) | | |
| Honeywell International | 45,250 | 1,773,800 |
| Raytheon | 51,240 | 2,639,885 |
| Republic Services | 66,690 | 1,887,994 |
| Tyco International | 57,230 | 2,041,966 |
| Union Pacific | 83,910 | 5,361,849 |
| | | 24,976,127 |
| Information Technology—8.3% | | |
| AOL | 21,649 a | 503,982 |
| Cisco Systems | 311,350 a | 7,453,719 |
| EMC | 112,420 a | 1,963,977 |
| Hewlett-Packard | 123,590 | 6,366,121 |
| Microsoft | 275,520 | 8,400,605 |
| Tyco Electronics | 158,040 | 3,879,882 |
| Western Union | 87,520 | 1,649,752 |
| | | 30,218,038 |
| Materials—3.8% | | |
| Air Products & Chemicals | 32,610 | 2,643,367 |
| Dow Chemical | 142,170 | 3,928,157 |
| Freeport-McMoRan Copper & Gold | 44,040 | 3,535,972 |
| International Paper | 136,360 | 3,651,721 |
| | | 13,759,217 |
| Telecommunication Services—2.9% | | |
| AT & T | 305,195 | 8,554,616 |
| Vodafone Group, ADR | 80,190 | 1,851,587 |
| | | 10,406,203 |
| Utilities—5.8% | | |
| Entergy | 67,460 | 5,520,926 |
| Exelon | 45,185 | 2,208,191 |
| FPL Group | 50,550 | 2,670,051 |
| NRG Energy | 76,390 a | 1,803,568 |
| PG & E | 42,090 | 1,879,318 |
| Questar | 104,750 | 4,354,457 |
| Southern | 80,330 | 2,676,596 |
| | | 21,113,107 |
| Total Common Stocks | | |
| (cost $333,085,102) | | 360,450,321 |
The Fund 11
STATEMENT OF INVESTMENTS (continued)
| | |
| Preferred Stocks—.4% | Shares | Value ($) |
| Financial | | |
| Bank of America (Convertible) | | |
| (cost $1,379,700) | 91,980 a | 1,372,342 |
| |
| Other Investment—.2% | | |
| Registered Investment Company; | | |
| Dreyfus Institutional Preferred | | |
| Plus Money Market Fund | | |
| (cost $682,000) | 682,000 c | 682,000 |
| |
| Investment of Cash Collateral | | |
| for Securities Loaned—.4% | | |
| Registered Investment Company; | | |
| Dreyfus Institutional Cash | | |
| Advantage Fund | | |
| (cost $1,478,888) | 1,478,888 c | 1,478,888 |
| Total Investments (cost $336,625,690) | 100.4% | 363,983,551 |
| Liabilities, Less Cash and Receivables | (.4%) | (1,585,901) |
| Net Assets | 100.0% | 362,397,650 |
ADR—American Depository Receipts
| a | Non-income producing security. |
| b | Security, or portion thereof, on loan. At December 31, 2009, the total market value of the fund’s securities on loan is $1,429,944 and the total market value of the collateral held by the fund is $1,478,888. |
| c | Investment in affiliated money market mutual fund. |
| | | |
| Portfolio Summary (Unaudited)† | | |
| |
| | Value (%) | | Value (%) |
| Financial | 24.2 | Utilities | 5.8 |
| Energy | 18.5 | Materials | 3.8 |
| Consumer Discretionary | 11.1 | Telecommunication Services | 2.9 |
| Health Care | 10.4 | Exchange Traded Funds | 1.0 |
| Information Technology | 8.3 | Money Market Investments | .6 |
| Consumer Staples | 6.9 | | |
| Industrial | 6.9 | | 100.4 |
| |
| † Based on net assets. | | | |
| See notes to financial statements. | | | |
12
|
| STATEMENT OF ASSETS AND LIABILITIES |
| December 31, 2009 |
| | |
| | Cost | Value |
| Assets ($): | | |
| Investments in securities—See Statement of Investments (including | | |
| securities on loan, valued at $1,429,944)—Note 1(c): | | |
| Unaffiliated issuers | 334,464,802 | 361,822,663 |
| Affiliated issuers | 2,160,888 | 2,160,888 |
| Cash | | 23,284 |
| Dividends and interest receivable | | 454,298 |
| Receivable for shares of Beneficial Interest subscribed | | 30,998 |
| Prepaid expenses | | 13,281 |
| | | 364,505,412 |
| Liabilities ($): | | |
| Due to The Dreyfus Corporation and affiliates—Note 3(b) | | 394,340 |
| Liability for securities on loan—Note 1(c) | | 1,478,888 |
| Payable for shares of Beneficial Interest redeemed | | 234,534 |
| | | 2,107,762 |
| Net Assets ($) | | 362,397,650 |
| Composition of Net Assets ($): | | |
| Paid-in capital | | 428,643,594 |
| Accumulated undistributed investment income—net | | 6,692 |
| Accumulated net realized gain (loss) on investments | | (93,610,497) |
| Accumulated net unrealized appreciation | | |
| (depreciation) on investments | | 27,357,861 |
| Net Assets ($) | | 362,397,650 |
| | | | | |
| Net Asset Value Per Share | | | | |
| | Class A | Class B | Class C | Class I | Institutional |
| Net Assets ($) | 325,170,403 | 2,504,921 | 7,853,247 | 1,046,714 | 25,822,365 |
| Shares Outstanding | 14,898,042 | 117,168 | 367,624 | 47,955 | 1,183,508 |
| Net Asset Value | | | | | |
| Per Share ($) | 21.83 | 21.38 | 21.36 | 21.83 | 21.82 |
See notes to financial statements.
The Fund 13
|
| STATEMENT OF OPERATIONS |
| Year Ended December 31, 2009 |
| |
| Investment Income ($): | |
| Income: | |
| Cash dividends (net of $32,068 foreign taxes withheld at source): | |
| Unaffiliated issuers | 8,117,027 |
| Affiliated issuers | 3,191 |
| Income from securities lending—Note 1(c) | 54,360 |
| Interest | 414 |
| Total Income | 8,174,992 |
| Expenses: | |
| Management fee—Note 3(a) | 2,974,825 |
| Distribution and service fees—Note 3(b) | 884,727 |
| Trustees’ fees and expenses—Note 3(a) | 23,539 |
| Loan commitment fees—Note 2 | 2,940 |
| Interest expense—Note 2 | 179 |
| Total Expenses | 3,886,210 |
| Less—Trustees’ fees reimbursed by the Manager—Note 3(a) | (23,539) |
| Net Expenses | 3,862,671 |
| Investment Income—Net | 4,312,321 |
| Realized and Unrealized Gain (Loss) on Investments—Note 4 ($): | |
| Net realized gain (loss) on investments | (36,235,669) |
| Net unrealized appreciation (depreciation) on investments | 87,286,702 |
| Net Realized and Unrealized Gain (Loss) on Investments | 51,051,033 |
| Net Increase in Net Assets Resulting from Operations | 55,363,354 |
| |
| See notes to financial statements. | |
14
STATEMENT OF CHANGES IN NET ASSETS
| | |
| | Year Ended December 31, |
| | 2009a | 2008 |
| Operations ($): | | |
| Investment income—net | 4,312,321 | 7,216,671 |
| Net realized gain (loss) on investments | (36,235,669) | (55,363,409) |
| Net unrealized appreciation | | |
| (depreciation) on investments | 87,286,702 | (157,803,948) |
| Net Increase (Decrease) in Net Assets | | |
| Resulting from Operations | 55,363,354 | (205,950,686) |
| Dividends to Shareholders from ($): | | |
| Investment income—net: | | |
| Class A Shares | (3,933,828) | (6,702,809) |
| Class B Shares | (23,861) | (93,674) |
| Class C Shares | (44,329) | (106,989) |
| Class I Shares | (12,221) | (20,206) |
| Class T Shares | — | (23,884) |
| Institutional Shares | (329,794) | (554,817) |
| Net realized gain on investments: | | |
| Class A Shares | — | (10,261) |
| Class B Shares | — | (393) |
| Class C Shares | — | (323) |
| Class I Shares | — | (27) |
| Class T Shares | — | (48) |
| Institutional Shares | — | (791) |
| Total Dividends | (4,344,033) | (7,514,222) |
| Beneficial Interest Transactions ($): | | |
| Net proceeds from shares sold: | | |
| Class A Shares | 11,628,595 | 21,187,961 |
| Class B Shares | 48,918 | 231,554 |
| Class C Shares | 565,585 | 1,180,466 |
| Class I Shares | 233,888 | 28,767 |
| Class T Shares | 4,900 | 79,816 |
| Institutional Shares | 259,267 | 1,476,417 |
The Fund 15
STATEMENT OF CHANGES IN NET ASSETS (continued)
| | |
| | Year Ended December 31, |
| | 2009a | 2008 |
| Beneficial Interest Transactions ($) (continued): | | |
| Dividends reinvested: | | |
| Class A Shares | 3,386,255 | 5,744,738 |
| Class B Shares | 22,288 | 88,274 |
| Class C Shares | 38,504 | 91,237 |
| Class I Shares | 11,613 | 19,967 |
| Class T Shares | — | 23,483 |
| Institutional Shares | 321,000 | 541,804 |
| Cost of shares redeemed: | | |
| Class A Shares | (37,592,218) | (61,389,288) |
| Class B Shares | (3,443,128) | (16,067,639) |
| Class C Shares | (2,215,012) | (4,063,553) |
| Class I Shares | (64,206) | (192,894) |
| Class T Shares | (1,037,083) | (554,116) |
| Institutional Shares | (2,093,420) | (4,249,615) |
| Increase (Decrease) in Net Assets from | | |
| Beneficial Interest Transactions | (29,924,254) | (55,822,621) |
| Total Increase (Decrease) in Net Assets | 21,095,067 | (269,287,529) |
| Net Assets ($): | | |
| Beginning of Period | 341,302,583 | 610,590,112 |
| End of Period | 362,397,650 | 341,302,583 |
| Undistributed investment income—net | 6,692 | 38,404 |
16
| | |
| | Year Ended December 31, |
| | 2009a | 2008 |
| Capital Share Transactions: | | |
| Class Ab,c | | |
| Shares sold | 644,580 | 812,842 |
| Shares issued for dividends reinvested | 186,499 | 252,379 |
| Shares redeemed | (2,017,879) | (2,486,143) |
| Net Increase (Decrease) in Shares Outstanding | (1,186,800) | (1,420,922) |
| Class Bb | | |
| Shares sold | 2,707 | 9,758 |
| Shares issued for dividends reinvested | 1,373 | 3,931 |
| Shares redeemed | (195,433) | (615,755) |
| Net Increase (Decrease) in Shares Outstanding | (191,353) | (602,066) |
| Class C | | |
| Shares sold | 30,654 | 54,315 |
| Shares issued for dividends reinvested | 2,342 | 4,220 |
| Shares redeemed | (122,745) | (168,022) |
| Net Increase (Decrease) in Shares Outstanding | (89,749) | (109,487) |
| Class I Shares | | |
| Shares sold | 11,070 | 1,177 |
| Shares issued for dividends reinvested | 635 | 865 |
| Shares redeemed | (3,622) | (8,900) |
| Net Increase (Decrease) in Shares Outstanding | 8,083 | (6,858) |
| Class Tc | | |
| Shares sold | 291 | 3,196 |
| Shares issued for dividends reinvested | — | 1,028 |
| Shares redeemed | (62,134) | (22,499) |
| Net Increase (Decrease) in Shares Outstanding | (61,843) | (18,275) |
| Institutional Shares | | |
| Shares sold | 13,952 | 55,057 |
| Shares issued for dividends reinvested | 17,609 | 23,745 |
| Shares redeemed | (119,227) | (170,281) |
| Net Increase (Decrease) in Shares Outstanding | (87,666) | (91,479) |
| a | Effective as of the close of business on February 4, 2009, the fund no longer offers Class T shares. |
| b | During the period ended Deceber 31, 2009, 94,322 Class B shares representing $1,726,360 were automatically converted to 92,335 Class A shares and during the period ended December 31, 2008, 356,742 Class B shares representing $9,460,479 were automatically converted to 349,259 Class A shares. |
| c | On the close of business on February 4, 2009, 61,363 Class T shares representing $1,023,527 were converted to 61,326 Class A shares. |
See notes to financial statements.
The Fund 17
FINANCIAL HIGHLIGHTS
The following tables describe the performance for each share class for the fiscal periods indicated. All information (except portfolio turnover rate) reflects financial results for a single fund share.Total return shows how much your investment in the fund would have increased (or decreased) during each period, assuming you had reinvested all dividends and distributions.These figures have been derived from the fund’s financial statements.
| | | | | |
| | | Year Ended December 31, | |
| Class A Shares | 2009 | 2008 | 2007 | 2006 | 2005 |
| Per Share Data ($): | | | | | |
| Net asset value, beginning of period | 18.75 | 29.87 | 32.00 | 31.38 | 30.34 |
| Investment Operations: | | | | | |
| Investment income—neta | .25 | .38 | .45 | .38 | .30 |
| Net realized and unrealized | | | | | |
| gain (loss) on investments | 3.08 | (11.10) | .42 | 5.94 | 1.26 |
| Total from Investment Operations | 3.33 | (10.72) | .87 | 6.32 | 1.56 |
| Distributions: | | | | | |
| Dividends from investment income—net | (.25) | (.40) | (.46) | (.37) | (.35) |
| Dividends from net realized | | | | | |
| gain on investments | — | (.00)b | (2.54) | (5.33) | (.17) |
| Total Distributions | (.25) | (.40) | (3.00) | (5.70) | (.52) |
| Net asset value, end of period | 21.83 | 18.75 | 29.87 | 32.00 | 31.38 |
| Total Return (%)c | 18.07 | (36.10) | 2.75 | 21.00 | 5.18 |
| Ratios/Supplemental Data (%): | | | | | |
| Ratio of total expenses | | | | | |
| to average net assets | 1.17 | 1.16 | 1.16 | 1.15 | 1.15 |
| Ratio of net expenses | | | | | |
| to average net assets | 1.16 | 1.15 | 1.15 | 1.15 | 1.15 |
| Ratio of net investment income | | | | | |
| to average net assets | 1.33 | 1.53 | 1.38 | 1.17 | .99 |
| Portfolio Turnover Rate | 64.35 | 53.58 | 45.19 | 44.73 | 55.95 |
| Net Assets, end of period ($ x 1,000) | 325,170 | 301,524 | 522,906 | 548,601 | 556,017 |
| a | Based on average shares outstanding at each month end. |
| b | Amount represents less than $.01 per share. |
| c | Exclusive of sales charge. |
See notes to financial statements.
18
| | | | | |
| | | Year Ended December 31, | |
| Class B Shares | 2009 | 2008 | 2007 | 2006 | 2005 |
| Per Share Data ($): | | | | | |
| Net asset value, beginning of period | 18.36 | 29.26 | 31.40 | 30.87 | 29.83 |
| Investment Operations: | | | | | |
| Investment income—neta | .13 | .17 | .22 | .13 | .07 |
| Net realized and unrealized gain | | | | | |
| (loss) on investments | 3.00 | (10.85) | .39 | 5.85 | 1.26 |
| Total from Investment Operations | 3.13 | (10.68) | .61 | 5.98 | 1.33 |
| Distributions: | | | | | |
| Dividends from investment income—net | (.11) | (.22) | (.21) | (.12) | (.12) |
| Dividends from net realized | | | | | |
| gain on investments | — | (.00)b | (2.54) | (5.33) | (.17) |
| Total Distributions | (.11) | (.22) | (2.75) | (5.45) | (.29) |
| Net asset value, end of period | 21.38 | 18.36 | 29.26 | 31.40 | 30.87 |
| Total Return (%)c | 17.21 | (36.62) | 2.01 | 20.12 | 4.47 |
| Ratios/Supplemental Data (%): | | | | | |
| Ratio of total expenses | | | | | |
| to average net assets | 1.91 | 1.90 | 1.91 | 1.90 | 1.90 |
| Ratio of net expenses | | | | | |
| to average net assets | 1.90 | 1.90d | 1.90 | 1.90 | 1.90 |
| Ratio of net investment income | | | | | |
| to average net assets | .74 | .69 | .70 | .42 | .24 |
| Portfolio Turnover Rate | 64.35 | 53.58 | 45.19 | 44.73 | 55.95 |
| Net Assets, end of period ($ x 1,000) | 2,505 | 5,665 | 26,646 | 55,112 | 64,239 |
| a | Based on average shares outstanding at each month end. |
| b | Amount represents less than $.01 per share. |
| c | Exclusive of sales charge. |
| d | Expense waivers and/or reimbursements amounted to less than .01%. |
See notes to financial statements.
The Fund 19
FINANCIAL HIGHLIGHTS (continued)
| | | | | |
| | | Year Ended December 31, | |
| Class C Shares | 2009 | 2008 | 2007 | 2006 | 2005 |
| Per Share Data ($): | | | | | |
| Net asset value, beginning of period | 18.35 | 29.24 | 31.38 | 30.85 | 29.83 |
| Investment Operations: | | | | | |
| Investment income—neta | .11 | .19 | .21 | .14 | .07 |
| Net realized and unrealized | | | | | |
| gain (loss) on investments | 3.01 | (10.86) | .40 | 5.84 | 1.24 |
| Total from Investment Operations | 3.12 | (10.67) | .61 | 5.98 | 1.31 |
| Distributions: | | | | | |
| Dividends from investment income—net | (.11) | (.22) | (.21) | (.12) | (.12) |
| Dividends from net realized | | | | | |
| gain on investments | — | (.00)b | (2.54) | (5.33) | (.17) |
| Total Distributions | (.11) | (.22) | (2.75) | (5.45) | (.29) |
| Net asset value, end of period | 21.36 | 18.35 | 29.24 | 31.38 | 30.85 |
| Total Return (%)c | 17.16 | (36.59) | 2.00 | 20.07 | 4.43 |
| Ratios/Supplemental Data (%): | | | | | |
| Ratio of total expenses | | | | | |
| to average net assets | 1.92 | 1.90 | 1.91 | 1.90 | 1.90 |
| Ratio of net expenses | | | | | |
| to average net assets | 1.91 | 1.90d | 1.90 | 1.90 | 1.90 |
| Ratio of net investment income | | | | | |
| to average net assets | .60 | .76 | .65 | .42 | .24 |
| Portfolio Turnover Rate | 64.35 | 53.58 | 45.19 | 44.73 | 55.95 |
| Net Assets, end of period ($ x 1,000) | 7,853 | 8,391 | 16,572 | 20,919 | 20,564 |
| a | Based on average shares outstanding at each month end. |
| b | Amount represents less than $.01 per share. |
| c | Exclusive of sales charge. |
| d | Expense waivers and/or reimbursements amounted to less than .01%. |
See notes to financial statements.
20
| | | | | |
| | | Year Ended December 31, | |
| Class I Shares | 2009 | 2008 | 2007a | 2006 | 2005 |
| Per Share Data ($): | | | | | |
| Net asset value, beginning of period | 18.74 | 29.85 | 31.98 | 31.36 | 30.33 |
| Investment Operations: | | | | | |
| Investment income—netb | .30 | .45 | .57 | .46 | .38 |
| Net realized and unrealized | | | | | |
| gain (loss) on investments | 3.09 | (11.10) | .39 | 5.95 | 1.25 |
| Total from Investment Operations | 3.39 | (10.65) | .96 | 6.41 | 1.63 |
| Distributions: | | | | | |
| Dividends from investment income—net | (.30) | (.46) | (.55) | (.46) | (.43) |
| Dividends from net realized | | | | | |
| gain on investments | — | (.00)c | (2.54) | (5.33) | (.17) |
| Total Distributions | (.30) | (.46) | (3.09) | (5.79) | (.60) |
| Net asset value, end of period | 21.83 | 18.74 | 29.85 | 31.98 | 31.36 |
| Total Return (%) | 18.43 | (35.93) | 3.04 | 21.26 | 5.45 |
| Ratios/Supplemental Data (%): | | | | | |
| Ratio of total expenses | | | | | |
| to average net assets | .92 | .90 | .91 | .90 | .90 |
| Ratio of net expenses | | | | | |
| to average net assets | .91 | .90d | .90 | .90 | .90 |
| Ratio of net investment income | | | | | |
| to average net assets | 1.57 | 1.74 | 1.63 | 1.42 | 1.25 |
| Portfolio Turnover Rate | 64.35 | 53.58 | 45.19 | 44.73 | 55.95 |
| Net Assets, end of period ($ x 1,000) | 1,047 | 747 | 1,395 | 6,012 | 4,740 |
| a | Effective June 1, 2007, Class R shares were redesignated as Class I shares. |
| b | Based on average shares outstanding at each month end. |
| c | Amount represents less than $.01 per share. |
| d | Expense waivers and/or reimbursements amounted to less than .01%. |
See notes to financial statements.
The Fund 21
FINANCIAL HIGHLIGHTS (continued)
| | | | | |
| | | Year Ended December 31, | |
| Institutional Shares | 2009 | 2008 | 2007 | 2006 | 2005 |
| Per Share Data ($): | | | | | |
| Net asset value, beginning of period | 18.74 | 29.85 | 31.98 | 31.36 | 30.32 |
| Investment Operations: | | | | | |
| Investment income—neta | .27 | .41 | .48 | .42 | .33 |
| Net realized and unrealized | | | | | |
| gain (loss) on investments | 3.08 | (11.09) | .43 | 5.94 | 1.26 |
| Total from Investment Operations | 3.35 | (10.68) | .91 | 6.36 | 1.59 |
| Distributions: | | | | | |
| Dividends from investment income—net | (.27) | (.43) | (.50) | (.41) | (.38) |
| Dividends from net realized | | | | | |
| gain on investments | — | (.00)b | (2.54) | (5.33) | (.17) |
| Total Distributions | (.27) | (.43) | (3.04) | (5.74) | (.55) |
| Net asset value, end of period | 21.82 | 18.74 | 29.85 | 31.98 | 31.36 |
| Total Return (%) | 18.20 | (36.05) | 2.89 | 21.11 | 5.33 |
| Ratios/Supplemental Data (%): | | | | | |
| Ratio of total expenses | | | | | |
| to average net assets | 1.06 | 1.06 | 1.06 | 1.05 | 1.05 |
| Ratio of net expenses | | | | | |
| to average net assets | 1.06 | 1.05 | 1.05 | 1.05 | 1.05 |
| Ratio of net investment income | | | | | |
| to average net assets | 1.43 | 1.63 | 1.49 | 1.28 | 1.09 |
| Portfolio Turnover Rate | 64.35 | 53.58 | 45.19 | 44.73 | 55.95 |
| Net Assets, end of period ($ x 1,000) | 25,822 | 23,816 | 40,679 | 44,506 | 40,341 |
| a | Based on average shares outstanding at each month end. |
| b | Amount represents less than $.01 per share. |
See notes to financial statements.
22
NOTES TO FINANCIAL STATEMENTS
NOTE 1—Significant Accounting Policies:
Dreyfus CoreValue Fund (the “fund”) is a separate diversified series of The Dreyfus/Laurel Funds Trust (the “Trust”) which is registered under the Investment Company Act of 1940, as amended (the “Act”), as an open-end management investment company and operates as a series company offering six series, including the fund. The fund’s investment objective is to seek long-term capital growth.The Dreyfus Corporation (the “Manager” or “Dreyfus”), a wholly-owned subsidiary of The Bank of New York Mellon Corporation (“BNY Mellon”), serves as the fund’s investment adviser.
MBSC Securities Corporation (the “Distributor”), a wholly-owned subsidiary of the Manager, is the distributor of the fund’s shares. The fund is authorized to issue an unlimited number of shares of Beneficial Interest in each of the following classes of shares: Class A, Class B, Class C, Class I and Institutional shares. Class A, Class B and Class C shares are sold primarily to retail investors through financial intermediaries and bear a distribution fee and/or service fee. Class A shares are subject to a front-end sales charge, while Class B and Class C shares are subject to a contingent deferred sales charge (“CDSC”). Class B shares automatically convert to Class A shares after six years. The fund does not offer Class B shares, except in connection with dividend reinvestment and permitted exchanges of Class B shares. Class I shares are sold primarily to bank trust departments and other financial servic e providers including The Bank of New York Mellon, a subsidiary of BNY Mellon and an affiliate of Dreyfus, acting on behalf of customers having a qualified trust or investment account or relationship at such institution, and bear no distribution or service fees. Class I and Institutional shares are offered without a front-end sales charge or CDSC. Institutional shares are offered only to those customers of certain financial planners and investment advisers who held shares of a predecessor class of the fund as of April 4, 1994, and bear a distribution fee. Each class of shares has identical rights and privileges, except with respect to the distribution and service fees and voting rights on matters affecting a single class. Income, expenses (other than expenses
The Fund 23
NOTES TO FINANCIAL STATEMENTS (continued)
attributable to a specific class), and realized and unrealized gains or losses on investments are allocated to each class of shares based on its relative net assets.
Effective December 3, 2008, investments for new accounts were no longer permitted in ClassT of the fund, except that participants in certain group retirement plans were able to open a new account in Class T of the fund, provided that the fund was established as an investment option under the plans before December 3, 2008. On February 4, 2009, the fund issued to each holder of its Class T shares, in exchange for said shares, Class A shares of the fund having an aggregate net asset value equal to the aggregate net asset value of the shareholder’s Class T shares. Subsequent investments in the fund’s Class A shares made by prior holders of the fund’s Class T shares who received Class A shares of the fund in exchange for their Class T shares are subject to the front-end sales load schedule that was in effect for Class T shares at the time of the exchange. Otherwise, all other Class A share attributes will be in effect . Effective as of the close of business on February 4, 2009, the fund no longer offers Class T shares.
The Financial Accounting Standards Board (“FASB”) Accounting Standards Codification (“ASC”) has become the exclusive reference of authoritative U.S. generally accepted accounting principles (“GAAP”) recognized by the FASB to be applied by nongovernmental entities. Rules and interpretive releases of the Securities and Exchange Commission (“SEC”) under authority of federal laws are also sources of authoritative GAAP for SEC registrants. The ASC has superseded all existing non-SEC accounting and reporting standards. The fund’s financial statements are prepared in accordance with GAAP, which may require the use of management estimates and assumptions.Actual results could differ from those estimates.
(a) Portfolio valuation: Investments in securities are valued at the last sales price on the securities exchange or national securities market on which such securities are primarily traded. Securities listed on the National Market System, for which market quotations are available are valued at the official closing price or, if there is no official closing price
24
that day, at the last sale price. Securities not listed on an exchange or the national securities market, or securities for which there were no transactions, are valued at the average of the most recent bid and asked prices. Bid price is used when no asked price is available. Registered investment companies that are not traded on an exchange are valued at their net asset value. When market quotations or official closing prices are not readily available, or are determined not to reflect accurately fair value, such as when the value of a security has been significantly affected by events after the close of the exchange or market on which the security is principally traded (for example, a foreign exchange or market), but before the fund calculates its net asset value, the fund may value these investments at fair value as determined in accordance with the procedures approved by the Board of Trustees. Fair valuing of securities may be determined with the assistance of a pricing service using calculations based on indices of domestic securities and other appropriate indicators, such as prices of relevant ADRs and futures contracts. For other securities that are fair valued by the Board of Trustees, certain factors may be considered such as: fundamental analytical data, the nature and duration of restrictions on disposition, an evaluation of the forces that influence the market in which the securities are purchased and sold, and public trading in similar securities of the issuer or comparable issuers. Investments denominated in foreign currencies are translated to U.S. dollars at the prevailing rates of exchange. Forward foreign currency exchange contracts (“forward contracts’) are valued at the forward rate.
The fair value of a financial instrument is the amount that would be received to sell an asset or paid to transfer a liability in an orderly transaction between market participants at the measurement date (i.e. the exit price). GAAP establishes a fair value hierarchy that prioritizes the inputs of valuation techniques used to measure fair value.This hierarchy gives the highest priority to unadjusted quoted prices in active markets for identical assets or liabilities (Level 1 measurements) and the lowest priority to unobservable inputs (Level 3 measurements).
The Fund 25
NOTES TO FINANCIAL STATEMENTS (continued)
Additionally, GAAP provides guidance on determining whether the volume and activity in a market has decreased significantly and whether such a decrease in activity results in transactions that are not orderly. GAAP requires enhanced disclosures around valuation inputs and techniques used during annual and interim periods.
Various inputs are used in determining the value of the fund’s investments relating to fair value measurements. These inputs are summarized in the three broad levels listed below:
Level 1—unadjusted quoted prices in active markets for
identical investments.
Level 2—other significant observable inputs (including quoted
prices for similar investments, interest rates, prepayment speeds,
credit risk, etc.).
Level 3—significant unobservable inputs (including the fund’s own
assumptions in determining the fair value of investments).
The inputs or methodology used for valuing securities are not necessarily an indication of the risk associated with investing in those securities.
The following is a summary of the inputs used as of December 31, 2009 in valuing the fund’s investments:
| | | | |
| | | Level 2—Other | Level 3— | |
| | Level 1— | Significant | Significant | |
| | Unadjusted | Observable | Unobservable | |
| | Quoted Prices | Inputs | Inputs | Total |
| Assets ($) | | | | |
| Investments in Securities: | | | |
| Equity Securities— | | | | |
| Domestic† | 356,332,490 | — | — | 356,332,490 |
| Equity Securities— | | | | |
| Foreign† | 1,851,587 | — | — | 1,851,587 |
| Mutual Funds/ | | | | |
| Exchange | | | | |
| Traded Funds | 5,799,474 | — | — | 5,799,474 |
| |
| † See Statement of Investments for industry classification. | | |
26
(b) Foreign currency transactions: The fund does not isolate that portion of the results of operations resulting from changes in foreign exchange rates on investments from the fluctuations arising from changes in the market prices of securities held. Such fluctuations are included with the net realized and unrealized gain or loss on investments.
Net realized foreign exchange gains or losses arise from sales of foreign currencies, currency gains or losses realized on securities transactions between trade and settlement date, and the difference between the amount of dividends, interest, and foreign withholding taxes recorded on the fund’s books and the U.S. dollar equivalent of the amounts actually received or paid. Net unrealized foreign exchange gains and losses arise from changes in the value of assets and liabilities other than investments, resulting from changes in exchange rates. Foreign currency gains and losses on investments are included with net realized and unrealized gain or loss on investments.
(c) Securities transactions and investment income: Securities transactions are recorded on a trade date basis. Realized gains and losses from securities transactions are recorded on the identified cost basis. Dividend income is recognized on the ex-dividend date and interest income, including, where applicable, accretion of discount and amortization of premium on investments, is recognized on the accrual basis.
Pursuant to a securities lending agreement with The Bank of New York Mellon, the fund may lend securities to qualified institutions. It is the fund’s policy that, at origination, all loans are secured by collateral of at least 102% of the value of U.S. securities loaned and 105% of the value of foreign securities loaned. Collateral equivalent to at least 100% of the market value of securities on loan is maintained at all times. Collateral is either in the form of cash, which can be invested in certain money market mutual funds managed by the Manager, U.S. Government and Agency securities or letters of credit. The fund is
The Fund 27
NOTES TO FINANCIAL STATEMENTS (continued)
entitled to receive all income on securities loaned, in addition to income earned as a result of the lending transaction. Although each security loaned is fully collateralized, the fund bears the risk of delay in recovery of, or loss of rights in, the securities loaned should a borrower fail to return the securities in a timely manner. During the period ended December 31, 2009, The Bank of New York Mellon earned $23,297 from lending portfolio securities, pursuant to the securities lending agreement.
(d) Affiliated issuers: Investments in other investment companies advised by the Manager are defined as “affiliated” in the Act.
(e) Dividends to shareholders: Dividends are recorded on the ex-dividend date. Dividends from investment income-net are declared and paid on a quarterly basis. Dividends from net realized capital gains, if any, are normally declared and paid annually, but the fund may make distributions on a more frequent basis to comply with the distribution requirements of the Internal Revenue Code of 1986, as amended (the “Code”).To the extent that net realized capital gains can be offset by capital loss carryovers, it is the policy of the fund not to distribute such gains. Income and capital gain distributions are determined in accordance with income tax regulations, which may differ from GAAP.
(f) Federal income taxes: It is the policy of the fund to continue to qualify as a regulated investment company, if such qualification is in the best interests of its shareholders, by complying with the applicable provisions of the Code, and to make distributions of taxable income sufficient to relieve it from substantially all federal income and excise taxes.
As of and during the period ended December 31, 2009, the fund did not have any liabilities for any uncertain tax positions.The fund recognizes interest and penalties, if any, related to uncertain tax positions as income tax expense in the Statement of Operations. During the period, the fund did not incur any interest or penalties.
Each of the tax years in the four-year ended December 31, 2009 remains subject to examination by the Internal Revenue Service and state taxing authorities.
28
At December 31, 2009, the components of accumulated earnings on a tax basis were as follows: undistributed ordinary income $6,692, accumulated capital losses $88,529,754 and unrealized appreciation $23,765,277. In addition, the fund had $1,488,159 of capital losses realized after October 31, 2009, which were deferred for tax purposes to the first day of the following fiscal period.
The accumulated capital loss carryover is available for federal income tax purposes to be applied against future net securities profits, if any, realized subsequent to December 31, 2009. If not applied, $38,328,752 of the carryover expires in fiscal 2016 and $50,201,002 expires in fiscal 2017.
The tax character of distributions paid to shareholders during the fiscal periods ended December 31, 2009 and December 31, 2008 were as follows: ordinary income $4,344,033 and $7,504,072 and long-term capital gains $0 and $10,150, respectively.
NOTE 2—Bank Lines of Credit:
The fund participates with other Dreyfus-managed funds in a $225 million unsecured credit facility led by Citibank, N.A. and a $300 million unsecured credit facility provided by The Bank of New York Mellon, (each, a “Facility”), each to be utilized primarily for temporary or emergency purposes, including the financing of redemptions. In connection therewith, the fund has agreed to pay its pro rata portion of commitment fees for each Facility. Interest is charged to the fund based on rates determined pursuant to the terms of the respective Facility at the time of borrowing.
The average amount of borrowings outstanding under the Facilities during the period ended December 31, 2009 was approximately $12,300 with a related weighted average annualized interest rate of 1.45%.
NOTE 3—Investment Management Fee and Other Transactions With Affiliates:
(a) Pursuant to an investment management agreement with the Manager, the Manager provides or arranges for one or more third par-
The Fund 29
NOTES TO FINANCIAL STATEMENTS (continued)
ties and/or affiliates to provide investment advisory, administrative, custody, fund accounting and transfer agency services to the fund.The Manager also directs the investments of the fund in accordance with its investment objective, policies and limitations. For these services, the fund is contractually obligated to pay the Manager a fee, calculated daily and paid monthly, at the annual rate of .90% of the value of the fund’s average daily net assets. Out of its fee, the Manager pays all of the expenses of the fund except brokerage fees, taxes, interest, commitment fees, Rule 12b-1 distribution fees and expenses, service fees and expenses of non-interested Trustees (including counsel fees) and extraordinary expenses. In addition, the Manager is required to reduce its fee in an amount equal to the fund’s allocable portion of fees and expenses of the non-interested Trustees (including counsel fees). Prior to January 1 , 2010, each Board member received $45,000 per year, plus $6,000 for each joint Board meeting of the Trust,The Dreyfus/Laurel Funds, Inc., The Dreyfus/Laurel Tax-Free Municipal Funds, Dreyfus Investment Funds and Dreyfus Fund, Inc. (collectively, the “Board Group Open-End Funds”) attended, $2,000 for separate in-person committee meetings attended which were not held in conjunction with a regularly scheduled Board meeting and $1,500 for Board meetings and separate committee meetings attended that were conducted by telephone. Effective January 1, 2010, the Board Group Open-End Funds will pay each Board member who is not an “interested person” of the Trust (as defined in the 1940 Act) $60,000 per annum, plus $7,000 per joint Board Group Open-End Funds Board meeting attended, $2,500 for separate in-person committee meetings attended which are not held in conjunction with a regularly scheduled Board meeting and $2,000 for Board meetings and separate committee meetings attended that are conduct ed by telephone. The Board Group Open-End Funds also reimburse each Board member who is not an “interested person” of the Trust (as defined in the 1940 Act) for travel and out-of-pocket expenses. With respect to Board meetings, the Chairman of the Board receives an additional 25% of such compensation (with the exception of reimbursable amounts). With respect to
30
compensation committee meetings prior to January 1, 2010, the Chair of the compensation committee received $900 per compensation committee meeting, and, effective January 1, 2010, the Chair of each of the Board’s committees, unless the Chair also serves as Chair of the Board, will receive $1,350 per applicable committee meeting. In the event that there is an in-person joint committee meeting or a joint telephone meeting of the Board Group Open-End Funds and Dreyfus HighYield Strategies Fund, the $2,000 or $1,500 fee (prior to January 1, 2010) or the $2,500 or $2,000 fee (effective January 1, 2010), as applicable, is allocated between the Board Group Open-End Funds and Dreyfus High Yield Strategies Fund. The Trust’s portion of these fees and expenses are charged and allocated to each series based on net assets. Amounts required to be paid by the Trust directly to the non-interested Trustees, that would be applied to of fset a portion of the management fee payable to the Manager, are in fact paid directly by the Manager to the non-interested Trustees.
During the period ended December 31, 2009, the Distributor retained $4,734 from commissions earned on sales of the fund’s Class A shares and $7,523 and $456 from CDSCs on redemptions on the fund’s Class B and Class C shares, respectively.
(b) Under separate Distribution Plans (the “Plans”) adopted pursuant to Rule 12b-1 under the Act, Class A shares and Institutional shares may pay annually up to .25% and .15%, respectively, of the value of their average daily net assets to compensate the Distributor for shareholder servicing activities and expenses primarily intended to result in the sale of Class A shares and Institutional shares. Class B and Class C shares pay and Class T shares paid the Distributor for distributing their shares at an aggregate annual rate of .75% of the value of the average daily net assets of Class B and Class C shares, and .25% of the value of average daily net assets of Class T shares.The Distributor may pay one or more agents in respect of advertising, marketing and other distribution services for Class T shares and determined the amounts, if any, to b e paid to agents and the basis on which such payments were made.
The Fund 31
NOTES TO FINANCIAL STATEMENTS (continued)
Class B, Class C and Class T shares are also subject to a Service Plan adopted pursuant to Rule 12b-1 (the “Service Plan”), under which Class B and Class C shares pay and Class T shares paid the Distributor for providing certain services to the holders of their shares a fee at the annual rate of .25% of the value of the average daily net assets of Class B, Class C and Class T shares. During the period ended December 31, 2009, Class A, Class B, Class C, Class T and Institutional shares were charged $738,749, $26,475, $56,645, $260 and $34,632, respectively, pursuant to their respective Plans. During the period ended December 31, 2009, Class B, Class C and Class T shares were charged $8,825, $18,881 and $260, respectively, pursuant to the Service Plan.
Under its terms, the Plans and Service Plan shall remain in effect from year to year, provided such continuance is approved annually by a vote of majority of those Trustees who are not “interested persons” of the Trust and who have no direct or indirect financial interest in the operation of or in any agreement related to the Plans or Service Plan.
The components of “Due to The Dreyfus Corporation and affiliates” in the Statement of Assets and Liabilities consist of: management fees $304,919, Rule 12b-1 distribution plan fees $86,963 and shareholder services plan fees $2,458.
NOTE 4—Securities Transactions:
The aggregate amount of purchases and sales of investment securities, excluding short-term securities, during the period ended December 31, 2009, amounted to $208,930,460 and $234,924,107, respectively.
The fund adopted the provisions of ASC Topic 815 “Derivatives and Hedging” which requires qualitative disclosures about objectives and strategies for using derivatives, quantitative disclosures about fair value amounts of gains and losses on derivative instruments and disclosures about credit-risk-related contingent features in derivative agreements. The fund held no derivatives during the period ended December 31, 2009. These disclosures did not impact the notes to the financial statements.
32
At December 31, 2009, the cost of investments for federal income tax purposes was $340,218,274; accordingly, accumulated net unrealized appreciation on investments was $23,765,277, consisting of $44,664,517 gross unrealized appreciation and $20,899,240 gross unrealized depreciation.
NOTE 5—New Accounting Pronouncement:
In January 2010, FASB issued Accounting Standards Update (“ASU”) No. 2010-06 “Improving Disclosures about Fair Value Measurements”. ASU 2010-06 will require reporting entities to make new disclosures about amounts and reasons for significant transfers in and out of Level 1 and Level 2 fair value measurements as well as inputs and valuation techniques used to measure fair value for both recurring and nonrecur-ring fair value measurements that fall in either Level 2 or Level 3, and information on purchases, sales, issuances and settlements on a gross basis in the reconciliation of activity in Level 3 fair value measurements.The new and revised disclosures are required to be implemented for fiscal years beginning after December 15, 2009 except for the disclosures surrounding purchases, sales, issuances and settlements on a gross basis in the reconciliation of Level 3 fair value measurements, which are effective for fiscal years beginning after December 15, 2010. Management is currently evaluating the impact the adoption of ASU No. 2010-06 may have on the fund’s financial statement disclosures.
NOTE 6—Subsequent Events Evaluation:
Dreyfus has evaluated the need for disclosures and/or adjustments resulting from subsequent events through February 26, 2010, the date the financial statements were issued. This evaluation did not result in any subsequent events that necessitated disclosures and/or adjustments.
The Fund 33
REPORT OF INDEPENDENT REGISTERED
PUBLIC ACCOUNTING FIRM
The Board of Trustees and Shareholders
The Dreyfus/Laurel Funds Trust
We have audited the accompanying statement of assets and liabilities of Dreyfus Core Value Fund (the “Fund”), a series of The Dreyfus/Laurel FundsTrust, including the statement of investments as of December 31, 2009, and the related statement of operations for the year then ended, the statement of changes in net assets for each of the years in the two-year period then ended, and the financial highlights for each of the years in the five-year period then ended.These financial statements and financial highlights are the responsibility of the Fund’s management. Our responsibility is to express an opinion on these financial statements and financial highlights based on our audits.
We conducted our audits in accordance with standards of the Public Company Accounting Oversight Board (United States).Those standards require that we plan and perform the audit to obtain reasonable assurance about whether the financial statements and financial highlights are free of material misstatement. An audit includes examining, on a test basis, evidence supporting the amounts and disclosures in the financial statements. Our procedures included confirmation of securities owned as of December 31, 2009 by correspondence with the custodian and brokers. An audit also includes assessing the accounting principles used and significant estimates made by management, as well as evaluating the overall financial statement presentation.We believe that our audits provide a reasonable basis for our opinion.
In our opinion, the financial statements and financial highlights referred to above present fairly, in all material respects, the financial position of Dreyfus CoreValue Fund as of December 31, 2009, and the results of its operations for the year then ended, the changes in its net assets for each of the years in the two-year period then ended, and the financial highlights for each of the years in the five-year period then ended, in conformity with U.S. generally accepted accounting principles.

New York, New York
February 26, 2010
34
IMPORTANT TAX INFORMATION (Unaudited)
In accordance with federal tax law, the fund hereby designates 100% of the ordinary dividends paid during the fiscal year ended December 31, 2009 as qualifying for the corporate dividends received deduction. For the fiscal year ended December 31, 2009, certain dividends paid by the fund may be subject to a maximum tax rate of 15%, as provided for by the Jobs and Growth Tax Relief Reconciliation Act of 2003. Of the distributions paid during the fiscal year, $4,344,033 represents the maximum amount that may be considered qualified dividend income. Shareholders will receive notification in early 2010 of the percentage applicable to the preparation of their 2009 income tax returns.
The Fund 35
BOARD MEMBERS INFORMATION (Unaudited)
36

Once elected all Board Members serve for an indefinite term, but achieve Emeritus status upon reaching age 80.The address of the Board Members and Officers is in c/o The Dreyfus Corporation, 200 Park Avenue, NewYork, NewYork 10166. Additional information about the Board Members is available in the fund’s Statement of Additional Information which can be obtained from Dreyfus free of charge by calling this toll free number: 1-800-554-4611.
J.Tomlinson Fort, Emeritus Board Member
The Fund 37
OFFICERS OF THE FUND (Unaudited)
38
The Fund 39
OFFICERS OF THE FUND (Unaudited) (continued)
40
For More Information
Telephone Call your financial representative or 1-800-554-4611
Mail The Dreyfus Family of Funds, 144 Glenn Curtiss Boulevard, Uniondale, NY 11556-0144
The fund files its complete schedule of portfolio holdings with the Securities and Exchange Commission (“SEC”) for the first and third quarters of each fiscal year on Form N-Q. The fund’s Forms N-Q are available on the SEC’s website at http://www.sec.gov and may be reviewed and copied at the SEC’s Public Reference Room in Washington, DC. Information on the operation of the Public Reference Room may be obtained by calling 1-800-SEC-0330.
A description of the policies and procedures that the fund uses to determine how to vote proxies relating to portfolio securities, and information regarding how the fund voted these proxies for the most recent 12-month period ended June 30 is available at http://www.dreyfus.com and on the SEC’s website at http://www.sec.gov. The description of the policies and procedures is also available without charge, upon request, by calling 1-800-645-6561.

ANNUAL REPORT December 31, 2009

Save time. Save paper. View your next shareholder report online as soon as it’s available. Log into www.dreyfus.com and sign up for Dreyfus eCommunications. It’s simple and only takes a few minutes.
The views expressed in this report reflect those of the portfolio manager only through the end of the period covered and do not necessarily represent the views of Dreyfus or any other person in the Dreyfus organization. Any such views are subject to change at any time based upon market or other conditions and Dreyfus disclaims any responsibility to update such views.These views may not be relied on as investment advice and, because investment decisions for a Dreyfus fund are based on numerous factors, may not be relied on as an indication of trading intent on behalf of any Dreyfus fund.

| | Contents |
| | THE FUND |
| 2 | A Letter from the Chairman and CEO |
| 3 | Discussion of Fund Performance |
| 6 | Fund Performance |
| 8 | Understanding Your Fund’s Expenses |
| 8 | Comparing Your Fund’s Expenses With Those of Other Funds |
| 9 | Statement of Investments |
| 21 | Statement of Assets and Liabilities |
| 22 | Statement of Operations |
| 23 | Statement of Changes in Net Assets |
| 25 | Financial Highlights |
| 29 | Notes to Financial Statements |
| 45 | Report of Independent Registered Public Accounting Firm |
| 46 | Important Tax Information |
| 47 | Board Members Information |
| 49 | Officers of the Fund |
| | FOR MORE INFORMATION |
| | Back Cover |
Dreyfus
High Yield Fund
The Fund

A LETTER FROM THE CHAIRMAN AND CEO
Dear Shareholder:
We are pleased to present this annual report for Dreyfus High Yield Fund, covering the 12-month period from January 1, 2009, through December 31, 2009.
The U.S. and global bond markets ended 2009 with healthy annual gains among higher yielding market sectors, but U.S.Treasury securities and other sovereign bonds from developed nations gave back a portion of their previous gains.The bond market’s advance was driven partly by government intervention and partly by improving investor sentiment as the global economy staged a gradual, but sustained, recovery from a severe recession and banking crisis. After four consecutive quarters of contraction, the U.S. economy returned to growth during the third quarter of 2009, buoyed by greater manufacturing activity to replenish depleted inventories and satisfy export demand.The slumping housing market also showed signs of renewed life later in the year when home sales and prices rebounded modestly. However, economic headwinds remain, including a high unemployment rate and the prospect of anemic consumer spending.
As 2010 begins, our Chief Economist, as well as many securities analysts and portfolio managers have continued to find opportunities and survey potential challenges across the various fixed-income markets, both domestic and international.While no one can predict the future, we believe that the 2010 investment environment will likely require a broader range of investment considerations relative to last year. As always, your financial adviser can help you determine the mix of investments that may be best suited to helping you achieve your goals at a level of risk that is comfortable for you.
For information about how the fund performed during the reporting period, as well as market perspectives, we have provided a Discussion of Fund Performance.
Thank you for your continued confidence and support.
Jonathan R. Baum
Chairman and Chief Executive Officer
The Dreyfus Corporation
January 15, 2010
2

DISCUSSION OF FUND PERFORMANCE
For the period of January 1, 2009, through December 31, 2009, as provided by Karen Bater, Portfolio Manager
Fund and Market Performance Overview
For the 12-month period ended December 31, 2009, Dreyfus High Yield Fund’s Class A shares produced a total return of 40.43%, Class B shares returned 39.78%, Class C shares returned 39.41% and Class I shares returned 40.99%.1 In comparison, the BofA Merrill Lynch U.S. High Yield Master II Constrained Index (the “Index”), the fund’s benchmark, achieved a total return of 58.10% over the same period.2
The reporting period saw a sustained market rally as investors responded positively to stabilizing credit markets and signs of economic recovery in the wake of the 2008 financial crisis and recession. The fund produced lower returns than its benchmark, as the fund’s higher-quality bias prevented it from participating more fully in a rebound led by lower-rated bonds.
The Fund’s Investment Approach
The fund seeks to maximize total return, consisting of capital appreciation and current income.
At least 80% of the fund’s assets are invested in fixed-income securities that are rated below investment grade (“high yield” or “junk” bonds) or are the unrated equivalent as determined by Dreyfus. Individual issues are selected based on careful credit analysis.We thoroughly analyze the business, management and financial strength of each of the companies whose bonds we buy, then project each issuer’s ability to repay its debt.
Renewed Optimism Fueled a Market Rally
The reporting period began in the midst of a severe recession and global banking crisis, which had produced steep declines for high yield bonds. The Federal Reserve Board and the U.S. government responded aggressively to the economic and financial crises, and those efforts began to gain traction in early March 2009.As a result, investors became more tolerant of risks, and they started to capitalize on attrac-
The Fund 3
DISCUSSION OF FUND PERFORMANCE (continued)
tive valuations among high yield bonds that had been severely beaten down during the credit crisis.
While all of the benchmark’s rating categories and market sectors posted positive absolute returns during the rally, gains were stronger among distressed and lower-quality bonds than those at the higher end of the high yield spectrum. Conversely, U.S. Treasury securities gave back some of their earlier gains.
Conservative Approach Dampened Fund Returns
Although a focus on higher-quality companies had sheltered the fund from the full brunt of declines during the 2008 bear market, it also limited the fund’s participation in the 2009 rally. We increased the fund’s exposure to higher yielding “triple-C” rated credits as the market recovered but, consistent with our research-intensive investment process, we continued to favor relatively healthy companies with positive cash flows, a degree of asset protection and proven operating models.We found a number of attractively valued bonds meeting our criteria in the cable television, wireless telephony, health care and technology industries.
As we expected, default rates in the high yield bond market increased, as the Moody’s Default Rate rose to approximately 13.8% in December 2009. Sub-par economic recovery and tighter credit availability sent some of the market’s weaker issuers into bankruptcy.The fund experienced a far lower percentage of defaults among its holdings, which we believe is testament to the effectiveness of our investment process.
The fund achieved strong relative performance in the technology sector, where electronic transaction processors fared especially well. The fund also received robust contributions to relative performance from the cable television and satellite television industries.
Disappointments during the reporting period were concentrated in the financials sector, where we generally avoided companies that we regarded as fundamentally troubled. However, lower-quality bonds from financial firms were among the leaders in the market rebound. We also maintained underweighted exposure to the building materials industry amid slumping housing markets, but bonds from such companies also ranked among the rally’s better performers when they rebounded from depressed levels.
4
Finding Opportunities in a Recovering Market
Bankruptcies of high yield issuers appear to have peaked for the current economic cycle, and we have become more optimistic about market fundamentals, including potentially milder market volatility in 2010. Supply-and-demand factors also have remained generally favorable. However, the reporting period’s 2009 rally was robust, suggesting that improved underlying financial conditions may already have been factored into high yield bond prices.
In this changing environment, we recently increased the fund’s exposure to the media industry, where radio and television broadcasters appear poised to benefit from recovering advertising spending.We also have increased the fund’s exposure to gaming companies, which should benefit from greater traffic in casinos as the economy recovers. The fund’s weighting in the cable television industry was reduced when one of the major high yield issuers, Charter Communications, exchanged its bonds at a premium to their then-prevailing prices. In these and other market sectors, we have continued to focus on high yield issuers with stable-to-improving balance sheets, positive cash flows and ready access to the capital markets.
January 15, 2010
| |
| 1 | Total return includes reinvestment of dividends and any capital gains paid, and does not take into |
| | consideration the maximum initial sales charge in the case of Class A shares, or the applicable |
| | contingent deferred sales charges imposed on redemptions in the case of Class B and Class C |
| | shares. Had these charges been reflected, returns would have been lower. Past performance is no |
| | guarantee of future results. Share price, yield and investment return fluctuate such that upon |
| | redemption, fund shares may be worth more or less than their original cost. Return figure provided |
| | for Class I shares reflects the absorption of certain fund expenses by The Dreyfus Corporation |
| | pursuant to an agreement in effect through September 30, 2010, at which time it may be |
| | extended, modified or terminated. Had these expenses not been absorbed, the fund’s Class I return |
| | would have been lower. |
| 2 | SOURCE: BLOOMBERG — Reflects reinvestment of dividends and, where applicable, |
| | capital gain distributions. The BofA Merrill Lynch U.S. High Yield Master II Constrained |
| | Index is an unmanaged performance benchmark composed of U.S. dollar-denominated domestic |
| | and Yankee bonds rated below investment grade with at least $100 million par amount |
| | outstanding and at least one year remaining to maturity. Bonds are capitalization-weighted. Total |
| | allocations to an issuer are capped at 2%. The index does not reflect fees and expenses to which |
| | the fund is subject. |
The Fund 5
FUND PERFORMANCE

Comparison of change in value of $10,000 investment in Dreyfus High Yield Fund Class A shares, Class B shares, Class C shares and Class I shares and the BofA Merrill Lynch U.S. High Yield Master II Constrained Index
|
| † Source: Bloomberg L.P. |
| Past performance is not predictive of future performance. |
| The above graph compares a $10,000 investment made in each of the Class A, Class B, Class C and Class I shares of |
| Dreyfus HighYield Fund on 12/31/99 to a $10,000 investment made in the BofA Merrill Lynch U.S. HighYield |
| Master II Constrained Index (the “Index”) on that date. All dividends and capital gain distributions are reinvested. |
| Effective April 1, 2009, the fund changed its name from Dreyfus Limited Term High Yield Fund to Dreyfus |
| High Yield Fund. |
| The fund’s performance shown in the line graph takes into account the maximum initial sales charge on Class A shares |
| and all other applicable fees and expenses on all classes.The Index is an unmanaged performance benchmark composed of |
| U.S. dollar-denominated domestic andYankee bonds rated below investment grade with at least $100 million par amount |
| outstanding and at least one year remaining to maturity. Bonds are capitalization-weighted.Total allocations to an issuer |
| are capped at 2%. Unlike a mutual fund, the Index is not subject to charges, fees and other expenses. Investors cannot |
| invest directly in any index. Further information relating to fund performance, including expense reimbursements, if |
| applicable, is contained in the Financial Highlights section of the prospectus and elsewhere in this report. |
6
| | | |
| Average Annual Total Returns as of 12/31/09 | | | |
| | 1 Year | 5 Years | 10 Years |
| Class A shares | | | |
| with maximum sales charge (4.5%) | 34.07% | 3.94% | 3.71% |
| without sales charge | 40.43% | 4.90% | 4.19% |
| Class B shares | | | |
| with applicable redemption charge † | 35.78% | 4.08% | 3.89% |
| without redemption | 39.78% | 4.36% | 3.89% |
| Class C shares | | | |
| with applicable redemption charge †† | 38.41% | 4.10% | 3.42% |
| without redemption | 39.41% | 4.10% | 3.42% |
| Class I shares | 40.99% | 5.15% | 4.46% |
Past performance is not predictive of future performance.The fund’s performance shown in the graph and table does not reflect the deduction of taxes that a shareholder would pay on fund distributions or the redemption of fund shares. Performance for Class B shares assumes the conversion of Class B shares to Class A shares at the end of the sixth year following the date of purchase.
| |
| † | The maximum contingent deferred sales charge for Class B shares is 4%. After six years Class B shares convert to |
| | Class A shares. |
| †† | The maximum contingent deferred sales charge for Class C shares is 1% for shares redeemed within one year of the |
| | date of purchase. |
The Fund 7
UNDERSTANDING YOUR FUND’S EXPENSES (Unaudited)
As a mutual fund investor, you pay ongoing expenses, such as management fees and other expenses. Using the information below, you can estimate how these expenses affect your investment and compare them with the expenses of other funds.You also may pay one-time transaction expenses, including sales charges (loads) and redemption fees, which are not shown in this section and would have resulted in higher total expenses. For more information, see your fund’s prospectus or talk to your financial adviser.
Review your fund’s expenses
The table below shows the expenses you would have paid on a $1,000 investment in Dreyfus High Yield Fund from July 1, 2009 to December 31, 2009. It also shows how much a $1,000 investment would be worth at the close of the period, assuming actual returns and expenses.
|
| Expenses and Value of a $1,000 Investment |
| assuming actual returns for the six months ended December 31, 2009 |
| | | | |
| | Class A | Class B | Class C | Class I |
| Expenses paid per $1,000† | $ 5.19 | $ 7.91 | $ 9.27 | $ 3.83 |
| Ending value (after expenses) | $1,167.10 | $1,164.20 | $1,162.60 | $1,168.30 |
COMPARING YOUR FUND’S EXPENSES
WITH THOSE OF OTHER FUNDS (Unaudited)
Using the SEC’s method to compare expenses
The Securities and Exchange Commission (SEC) has established guidelines to help investors assess fund expenses. Per these guidelines, the table below shows your fund’s expenses based on a $1,000 investment, assuming a hypothetical 5% annualized return. You can use this information to compare the ongoing expenses (but not transaction expenses or total cost) of investing in the fund with those of other funds.All mutual fund shareholder reports will provide this information to help you make this comparison. Please note that you cannot use this information to estimate your actual ending account balance and expenses paid during the period.
Expenses and Value of a $1,000 Investment
assuming a hypothetical 5% annualized return for the six months ended December 31, 2009
| | | | |
| | Class A | Class B | Class C | Class I |
| Expenses paid per $1,000† | $ 4.84 | $ 7.37 | $ 8.64 | $ 3.57 |
| Ending value (after expenses) | $1,020.42 | $1,017.90 | $1,016.64 | $1,021.68 |
|
| † Expenses are equal to the fund’s annualized expense ratio of .95% for Class A, 1.45% for Class B, 1.70% for |
| Class C and .70% for Class I, multiplied by the average account value over the period, multiplied by 184/365 (to |
| reflect the one-half year period). |
8
|
| STATEMENT OF INVESTMENTS |
| December 31, 2009 |
| | | | | |
| | Coupon | Maturity | Principal | | |
| Bonds and Notes—95.0% | Rate (%) | Date | Amount ($) | | Value ($) |
| Aerospace—.8% | | | | | |
| Bombardier, | | | | | |
| Sr. Unscd. Notes | 8.00 | 11/15/14 | 5,965,000 | a | 6,225,969 |
| MOOG, | | | | | |
| Sr. Sub. Notes | 7.25 | 6/15/18 | 1,000,000 | | 971,250 |
| | | | | | 7,197,219 |
| Automotive—3.6% | | | | | |
| American Axle and Manufacturing, | | | | | |
| Sr. Scd. Notes | 9.25 | 1/15/17 | 1,045,000 | a | 1,065,900 |
| Ford Motor Credit, | | | | | |
| Sr. Unscd. Notes | 8.00 | 12/15/16 | 2,805,000 | | 2,812,416 |
| Ford Motor Credit, | | | | | |
| Sr. Unscd. Notes | 8.70 | 10/1/14 | 8,580,000 | | 8,978,979 |
| Ford Motor, | | | | | |
| Sr. Unscd. Debs. | 6.50 | 8/1/18 | 730,000 | | 619,587 |
| Ford Motor, | | | | | |
| Sr. Unscd. Notes | 7.45 | 7/16/31 | 5,130,000 | | 4,559,288 |
| Goodyear Tire & Rubber, | | | | | |
| Sr. Unscd. Notes | 10.50 | 5/15/16 | 4,115,000 | b | 4,567,650 |
| Navistar International, | | | | | |
| Gtd. Notes | 8.25 | 11/1/21 | 4,595,000 | | 4,732,850 |
| TRW Automotive, | | | | | |
| Gtd. Notes | 7.25 | 3/15/17 | 4,240,000 | a,b | 4,134,000 |
| United Components, | | | | | |
| Gtd. Notes | 9.38 | 6/15/13 | 1,268,000 | | 1,229,960 |
| | | | | | 32,700,630 |
| Cable/Satellite TV—2.7% | | | | | |
| Cequel Communications Holdings, | | | | | |
| Sr. Unscd. Notes | 8.63 | 11/15/17 | 2,375,000 | a | 2,410,625 |
| Charter Communications, | | | | | |
| Scd. Notes | 8.38 | 4/30/14 | 3,815,000 | a,b,c | 3,938,987 |
| Dish DBS, | | | | | |
| Gtd. Notes | 7.13 | 2/1/16 | 11,717,000 | | 12,024,571 |
| Dish DBS, | | | | | |
| Gtd. Notes | 7.88 | 9/1/19 | 1,675,000 | a | 1,765,031 |
| Kabel Deutschland, | | | | | |
| Scd. Notes | 10.63 | 7/1/14 | 3,470,000 | | 3,643,500 |
| Mediacom Broadband, | | | | | |
| Sr. Unscd. Notes | 8.50 | 10/15/15 | 400,000 | b | 406,000 |
| | | | | | 24,188,714 |
The Fund 9
STATEMENT OF INVESTMENTS (continued)
| | | | | |
| | Coupon | Maturity | Principal | | |
| Bonds and Notes (continued) | Rate (%) | Date | Amount ($) | | Value ($) |
| Capital Goods—1.1% | | | | | |
| Leucadia National, | | | | | |
| Sr. Unscd. Notes | 7.13 | 3/15/17 | 3,055,000 | | 2,902,250 |
| RBS Global & Rexnord, | | | | | |
| Gtd. Notes | 9.50 | 8/1/14 | 4,220,000 | | 4,251,650 |
| Terex, | | | | | |
| Gtd. Notes | 7.38 | 1/15/14 | 3,095,000 | | 3,145,294 |
| | | | | | 10,299,194 |
| Chemicals—.7% | | | | | |
| Huntsman International, | | | | | |
| Gtd. Notes | 7.88 | 11/15/14 | 915,000 | | 898,987 |
| Invista, | | | | | |
| Sr. Unscd. Notes | 9.25 | 5/1/12 | 4,040,000 | a | 4,120,800 |
| Nalco, | | | | | |
| Gtd. Notes | 8.88 | 11/15/13 | 500,000 | | 517,500 |
| Westlake Chemical, | | | | | |
| Gtd. Notes | 6.63 | 1/15/16 | 1,125,000 | | 1,081,406 |
| | | | | | 6,618,693 |
| Consumer Products—.1% | | | | | |
| Easton-Bell Sports, | | | | | |
| Sr. Scd. Notes | 9.75 | 12/1/16 | 670,000 | a | 697,637 |
| Containers—3.5% | | | | | |
| Aep Industries, | | | | | |
| Sr. Unscd. Notes | 7.88 | 3/15/13 | 8,321,000 | | 8,008,963 |
| BWAY, | | | | | |
| Gtd. Notes | 10.00 | 4/15/14 | 7,840,000 | a | 8,330,000 |
| Plastipak Holdings, | | | | | |
| Sr. Notes | 8.50 | 12/15/15 | 8,380,000 | a | 8,641,875 |
| Plastipak Holdings, | | | | | |
| Sr. Notes | 10.63 | 8/15/19 | 2,435,000 | a | 2,696,762 |
| Solo Cup, | | | | | |
| Sr. Scd. Notes | 10.50 | 11/1/13 | 3,545,000 | a | 3,793,150 |
| | | | | | 31,470,750 |
| Energy—8.9% | | | | | |
| Amerigas Partners, | | | | | |
| Sr. Unscd. Notes | 7.25 | 5/20/15 | 4,665,000 | | 4,688,325 |
| Aquilex Holdings, | | | | | |
| Sr. Notes | 11.13 | 12/15/16 | 1,050,000 | a | 1,052,625 |
| Bristow Group, | | | | | |
| Gtd. Notes | 6.13 | 6/15/13 | 500,000 | | 496,250 |
10
| | | | | |
| | Coupon | Maturity | Principal | | |
| Bonds and Notes (continued) | Rate (%) | Date | Amount ($) | | Value ($) |
| Energy (continued) | | | | | |
| Bristow Group, | | | | | |
| Gtd. Notes | 7.50 | 9/15/17 | 1,555,000 | | 1,547,225 |
| Chesapeake Energy, | | | | | |
| Gtd. Notes | 7.00 | 8/15/14 | 2,315,000 | b | 2,355,512 |
| Chesapeake Energy, | | | | | |
| Gtd. Notes | 7.25 | 12/15/18 | 855,000 | | 865,687 |
| Chesapeake Energy, | | | | | |
| Gtd. Notes | 7.50 | 9/15/13 | 4,000,000 | | 4,090,000 |
| Chesapeake Energy, | | | | | |
| Gtd. Notes | 7.50 | 6/15/14 | 3,750,000 | | 3,843,750 |
| Chesapeake Energy, | | | | | |
| Gtd. Notes | 9.50 | 2/15/15 | 7,525,000 | | 8,296,313 |
| Cie Generale de | | | | | |
| Geophysique-Veritas, | | | | | |
| Gtd. Notes | 9.50 | 5/15/16 | 3,760,000 | a | 4,042,000 |
| Cimarex Energy, | | | | | |
| Gtd. Notes | 7.13 | 5/1/17 | 4,380,000 | | 4,445,700 |
| El Paso, | | | | | |
| Sr. Unscd. Notes | 7.00 | 6/15/17 | 1,255,000 | | 1,250,974 |
| El Paso, | | | | | |
| Sr. Unscd. Notes | 7.25 | 6/1/18 | 2,000,000 | | 1,985,996 |
| El Paso, | | | | | |
| Sr. Unscd. Notes | 8.25 | 2/15/16 | 5,517,000 | | 5,916,983 |
| El Paso, | | | | | |
| Sr. Unscd. Notes | 12.00 | 12/12/13 | 595,000 | b | 700,613 |
| Ferrellgas Finance Escrow, | | | | | |
| Sr. Unscd. Notes | 6.75 | 5/1/14 | 1,365,000 | | 1,351,350 |
| Ferrellgas Partners, | | | | | |
| Sr. Notes | 9.13 | 10/1/17 | 3,025,000 | a | 3,214,062 |
| Forest Oil, | | | | | |
| Gtd. Notes | 7.25 | 6/15/19 | 320,000 | | 317,600 |
| Forest Oil, | | | | | |
| Sr. Notes | 8.50 | 2/15/14 | 3,350,000 | a | 3,517,500 |
| MarkWest Energy Partners, | | | | | |
| Gtd. Notes, Ser. B | 8.75 | 4/15/18 | 1,600,000 | | 1,656,000 |
| McJunkin Red Man, | | | | | |
| Sr. Scd. Notes | 9.50 | 12/15/16 | 5,100,000 | a | 5,010,750 |
| Petrohawk Energy, | | | | | |
| Gtd. Notes | 9.13 | 7/15/13 | 6,520,000 | | 6,846,000 |
The Fund 11
STATEMENT OF INVESTMENTS (continued)
| | | | | |
| | Coupon | Maturity | Principal | | |
| Bonds and Notes (continued) | Rate (%) | Date | Amount ($) | | Value ($) |
| Energy (continued) | | | | | |
| Petrohawk Energy, | | | | | |
| Gtd. Notes | 10.50 | 8/1/14 | 2,180,000 | | 2,392,550 |
| Petroleos De Venezuela, | | | | | |
| Gtd. Notes | 5.25 | 4/12/17 | 7,180,000 | | 3,966,950 |
| Range Resources, | | | | | |
| Gtd. Notes | 7.25 | 5/1/18 | 1,530,000 | b | 1,568,250 |
| Sabine Pass LNG, | | | | | |
| Sr. Scd. Notes | 7.25 | 11/30/13 | 530,000 | | 483,625 |
| Sabine Pass LNG, | | | | | |
| Sr. Scd. Notes | 7.50 | 11/30/16 | 2,385,000 | b | 1,997,438 |
| Whiting Petroleum, | | | | | |
| Gtd. Notes | 7.25 | 5/1/13 | 4,060,000 | | 4,110,750 |
| | | | | | 82,010,778 |
| Finance—3.5% | | | | | |
| Developers Diversified Realty, | | | | | |
| Sr. Unscd. Notes | 9.63 | 3/15/16 | 4,200,000 | | 4,389,760 |
| GMAC, | | | | | |
| Gtd. Notes | 6.88 | 9/15/11 | 3,760,000 | a | 3,741,200 |
| GMAC, | | | | | |
| Gtd. Notes | 8.00 | 11/1/31 | 13,470,000 | a | 12,257,700 |
| HUB International Holdings, | | | | | |
| Sr. Sub. Notes | 10.25 | 6/15/15 | 6,685,000 | a | 6,183,625 |
| iPayment, | | | | | |
| Gtd. Notes | 9.75 | 5/15/14 | 6,010,000 | | 5,025,862 |
| | | | | | 31,598,147 |
| Food, Beverage & Tobacco—.3% | | | | | |
| Dean Foods, | | | | | |
| Gtd. Notes | 7.00 | 6/1/16 | 2,809,000 | b | 2,766,865 |
| Gaming—6.5% | | | | | |
| Ameristar Casinos, | | | | | |
| Sr. Unscd. Notes | 9.25 | 6/1/14 | 3,395,000 | a | 3,539,288 |
| Boyd Gaming, | | | | | |
| Sr. Sub. Notes | 6.75 | 4/15/14 | 1,425,000 | b | 1,291,406 |
| Boyd Gaming, | | | | | |
| Sr. Sub. Notes | 7.13 | 2/1/16 | 4,385,000 | b | 3,836,875 |
| Harrahs Operating, | | | | | |
| Sr. Scd. Notes | 11.25 | 6/1/17 | 8,875,000 | a,b | 9,329,844 |
| Isle of Capri Casinos, | | | | | |
| Gtd. Notes | 7.00 | 3/1/14 | 4,262,000 | b | 3,814,490 |
12
| | | | | |
| | Coupon | Maturity | Principal | | |
| Bonds and Notes (continued) | Rate (%) | Date | Amount ($) | | Value ($) |
| Gaming (continued) | | | | | |
| MGM Mirage, | | | | | |
| Gtd. Notes | 6.75 | 4/1/13 | 3,115,000 | b | 2,702,263 |
| MGM Mirage, | | | | | |
| Gtd. Notes | 7.50 | 6/1/16 | 9,230,000 | b | 7,245,550 |
| MGM Mirage, | | | | | |
| Gtd. Notes | 8.38 | 2/1/11 | 5,867,000 | b | 5,588,317 |
| MGM Mirage, | | | | | |
| Sr. Unscd. Notes | 11.38 | 3/1/18 | 10,655,000 | a,b | 9,589,500 |
| Penn National Gaming, | | | | | |
| Sr. Sub. Notes | 8.75 | 8/15/19 | 4,115,000 | a | 4,228,163 |
| Pinnacle Entertainment, | | | | | |
| Gtd. Notes | 8.25 | 3/15/12 | 194,000 | | 194,970 |
| Pokagon Gaming Authority, | | | | | |
| Sr. Notes | 10.38 | 6/15/14 | 4,288,000 | a | 4,480,960 |
| Scientific Games International, | | | | | |
| Gtd. Notes | 9.25 | 6/15/19 | 2,000,000 | b | 2,110,000 |
| Shingle Springs Tribal Group, | | | | | |
| Sr. Notes | 9.38 | 6/15/15 | 1,220,000 | a | 933,300 |
| | | | | | 58,884,926 |
| Health Care—8.5% | | | | | |
| Bausch & Lomb, | | | | | |
| Sr. Unscd. Notes | 9.88 | 11/1/15 | 12,045,000 | b | 12,767,700 |
| Biomet, | | | | | |
| Gtd. Notes | 11.63 | 10/15/17 | 30,930,000 | | 34,332,300 |
| Community Health Systems, | | | | | |
| Gtd. Notes | 8.88 | 7/15/15 | 1,750,000 | | 1,815,625 |
| Hanger Orthopedic Group, | | | | | |
| Gtd. Notes | 10.25 | 6/1/14 | 905,000 | | 963,825 |
| HCA, | | | | | |
| Sr. Unscd. Notes | 6.30 | 10/1/12 | 12,305,000 | | 12,366,525 |
| HCA, | | | | | |
| Sr. Unscd. Notes | 6.50 | 2/15/16 | 5,045,000 | | 4,817,975 |
| HCA, | | | | | |
| Sr. Unscd. Notes | 6.75 | 7/15/13 | 500,000 | | 495,000 |
| Inverness Medical Innovations, | | | | | |
| Sr. Unscd. Notes | 7.88 | 2/1/16 | 3,240,000 | b | 3,191,400 |
| Inverness Medical Innovations, | | | | | |
| Gtd. Notes | 9.00 | 5/15/16 | 5,940,000 | | 6,103,350 |
| | | | | | 76,853,700 |
The Fund 13
STATEMENT OF INVESTMENTS (continued)
| | | | | |
| | Coupon | Maturity | Principal | | |
| Bonds and Notes (continued) | Rate (%) | Date | Amount ($) | | Value ($) |
| Leisure—.6% | | | | | |
| Cinemark USA, | | | | | |
| Gtd. Notes | 8.63 | 6/15/19 | 4,945,000 | a,b | 5,167,525 |
| Media—13.8% | | | | | |
| Allbritton Communications, | | | | | |
| Sr. Sub. Notes | 7.75 | 12/15/12 | 15,945,000 | | 15,765,619 |
| CCH II LLC, | | | | | |
| Sr. Notes | 13.50 | 11/30/16 | 18,924,136 | b | 22,377,791 |
| Clear Channel Communication, | | | | | |
| Sr. Unscd. Notes | 5.75 | 1/15/13 | 2,805,000 | b | 2,236,988 |
| Clear Channel Communications, | | | | | |
| Sr. Unscd. Notes | 4.90 | 5/15/15 | 8,375,000 | | 4,836,563 |
| Clear Channel Communications, | | | | | |
| Sr. Unscd. Notes | 5.50 | 9/15/14 | 15,785,000 | | 10,418,100 |
| Clear Channel Communications, | | | | | |
| Sr. Unscd. Notes | 5.50 | 12/15/16 | 9,188,000 | | 5,145,280 |
| Clear Channel Communications, | | | | | |
| Sr. Unscd. Debs. | 6.88 | 6/15/18 | 4,945,000 | | 2,707,387 |
| Clear Channel Communications, | | | | | |
| Gtd. Notes | 10.75 | 8/1/16 | 3,330,000 | | 2,630,700 |
| Lamar Media, | | | | | |
| Gtd. Notes, Ser. C | 6.63 | 8/15/15 | 500,000 | | 482,500 |
| Lamar Media, | | | | | |
| Gtd. Notes, Ser. B | 6.63 | 8/15/15 | 1,754,000 | | 1,692,610 |
| Lamar Media, | | | | | |
| Gtd. Notes | 6.63 | 8/15/15 | 6,443,000 | b | 6,281,925 |
| Lamar Media, | | | | | |
| Gtd. Notes | 7.25 | 1/1/13 | 110,000 | b | 110,275 |
| LBI Media, | | | | | |
| Sr. Sub. Notes | 8.50 | 8/1/17 | 4,680,000 | a | 3,907,800 |
| LIN Television, | | | | | |
| Gtd. Notes, Ser. B | 6.50 | 5/15/13 | 4,635,000 | | 4,426,425 |
| LIN Television, | | | | | |
| Gtd. Notes | 6.50 | 5/15/13 | 9,840,000 | b | 9,544,800 |
| Nexstar Broadcasting, | | | | | |
| Gtd. Notes | 0.50 | 1/15/14 | 720,288 | a | 544,718 |
| Nexstar Broadcasting, | | | | | |
| Gtd. Notes | 7.00 | 1/15/14 | 201,000 | | 152,006 |
| Nexstar Finance Holdings, | | | | | |
| Sr. Discount Notes | 11.38 | 4/1/13 | 207,734 | c | 158,137 |
14
| | | | | |
| | Coupon | Maturity | Principal | | |
| Bonds and Notes (continued) | Rate (%) | Date | Amount ($) | | Value ($) |
| Media (continued) | | | | | |
| Quebecor Media, | | | | | |
| Sr. Unscd. Notes | 7.75 | 3/15/16 | 3,275,000 | | 3,283,188 |
| Quebecor Media, | | | | | |
| Sr. Unscd. Notes | 7.75 | 3/15/16 | 8,325,000 | | 8,345,813 |
| Salem Communications, | | | | | |
| Sr. Scd. Notes | 9.63 | 12/15/16 | 4,975,000 | a | 5,236,187 |
| Sinclair Television Group, | | | | | |
| Gtd. Notes | 8.00 | 3/15/12 | 11,929,000 | b | 11,690,420 |
| Sinclair Television Group, | | | | | |
| Sr. Scd. Notes | 9.25 | 11/1/17 | 3,885,000 | a | 4,059,825 |
| | | | | | 126,035,057 |
| Metals Mining—2.4% | | | | | |
| Drummond, | | | | | |
| Sr. Unscd. Notes | 7.38 | 2/15/16 | 4,705,000 | a | 4,622,662 |
| Freeport-McMoRan | | | | | |
| Copper & Gold, | | | | | |
| Sr. Unscd. Notes | 8.38 | 4/1/17 | 7,750,000 | | 8,497,883 |
| Murray Energy, | | | | | |
| Gtd. Notes | 10.25 | 10/15/15 | 860,000 | a | 860,000 |
| Teck Resources, | | | | | |
| Sr. Scd. Notes | 10.25 | 5/15/16 | 670,000 | | 783,900 |
| Teck Resources, | | | | | |
| Sr. Scd. Notes | 10.75 | 5/15/19 | 5,970,000 | | 7,164,000 |
| | | | | | 21,928,445 |
| Paper—1.9% | | | | | |
| Abitibi-Consolidated of Canada, | | | | | |
| Sr. Scd. Notes | 13.75 | 4/1/11 | 2,182,582 | a,d | 2,196,223 |
| NewPage, | | | | | |
| Sr. Scd. Notes | 10.00 | 5/1/12 | 490,000 | | 352,800 |
| Newpage, | | | | | |
| Sr. Scd. Notes | 11.38 | 12/31/14 | 7,105,000 | a | 7,211,575 |
| Smurfit Kappa Funding, | | | | | |
| Sr. Sub. Notes | 7.75 | 4/1/15 | 2,115,000 | b | 2,043,619 |
| Verso Paper Holdings, | | | | | |
| Gtd. Notes, Ser. B | 11.38 | 8/1/16 | 4,500,000 | | 3,645,000 |
| Verso Paper Holdings, | | | | | |
| Sr. Scd. Notes | 11.50 | 7/1/14 | 1,875,000 | a,b | 2,071,875 |
| | | | | | 17,521,092 |
The Fund 15
STATEMENT OF INVESTMENTS (continued)
| | | | | |
| | Coupon | Maturity | Principal | | |
| Bonds and Notes (continued) | Rate (%) | Date | Amount ($) | | Value ($) |
| Printing & Publishing—.4% | | | | | |
| Valassis Communication, | | | | | |
| Gtd. Notes | 8.25 | 3/1/15 | 3,360,000 | b | 3,368,400 |
| Retail—1.6% | | | | | |
| Levi Strauss & Co., | | | | | |
| Sr. Unscd. Notes | 9.75 | 1/15/15 | 1,755,000 | | 1,851,525 |
| Neiman Marcus Group, | | | | | |
| Gtd. Notes | 10.38 | 10/15/15 | 9,147,000 | b | 9,009,795 |
| QVC, | | | | | |
| Sr. Scd. Notes | 7.50 | 10/1/19 | 3,160,000 | a | 3,239,000 |
| | | | | | 14,100,320 |
| Retail-Food & Drug—2.4% | | | | | |
| Rite Aid, | | | | | |
| Gtd. Notes | 9.50 | 6/15/17 | 8,625,000 | b | 7,546,875 |
| Rite Aid, | | | | | |
| Sr. Scd. Notes | 10.38 | 7/15/16 | 8,680,000 | b | 9,244,200 |
| Stater Brothers Holdings, | | | | | |
| Gtd. Notes | 7.75 | 4/15/15 | 4,695,000 | | 4,788,900 |
| | | | | | 21,579,975 |
| Services—2.0% | | | | | |
| Aramark, | | | | | |
| Gtd. Notes | 8.50 | 2/1/15 | 3,250,000 | b | 3,363,750 |
| Education Management, | | | | | |
| Gtd. Notes | 8.75 | 6/1/14 | 2,738,000 | | 2,840,675 |
| Education Management, | | | | | |
| Gtd. Notes | 10.25 | 6/1/16 | 1,542,000 | b | 1,657,650 |
| General Maritime, | | | | | |
| Sr. Unscd. Notes | 12.00 | 11/15/17 | 5,170,000 | a,b | 5,409,113 |
| Iron Mountain, | | | | | |
| Gtd. Notes | 7.75 | 1/15/15 | 1,000,000 | | 1,010,000 |
| Navios Maritime Holdings, | | | | | |
| Notes | 8.88 | 11/1/17 | 2,005,000 | a,b | 2,092,719 |
| Ultrapetrol (Bahamas), | | | | | |
| First Mortgage Notes | 9.00 | 11/24/14 | 765,000 | | 708,581 |
| WCA Waste, | | | | | |
| Gtd. Notes | 9.25 | 6/15/14 | 1,075,000 | | 1,076,344 |
| | | | | | 18,158,832 |
16
| | | | | |
| | Coupon | Maturity | Principal | | |
| Bonds and Notes (continued) | Rate (%) | Date | Amount ($) | | Value ($) |
| Technology—7.5% | | | | | |
| Ceridian, | | | | | |
| Sr. Unscd. Notes | 11.25 | 11/15/15 | 19,270,000 | b,c | 18,475,112 |
| Ceridian, | | | | | |
| Gtd. Notes | 12.25 | 11/15/15 | 12,083,490 | b | 11,479,316 |
| First Data, | | | | | |
| Gtd. Notes | 9.88 | 9/24/15 | 2,565,000 | | 2,379,038 |
| First Data, | | | | | |
| Gtd. Notes | 9.88 | 9/24/15 | 7,070,000 | b | 6,628,125 |
| Sungard Data Systems, | | | | | |
| Gtd. Notes | 9.13 | 8/15/13 | 1,500,000 | | 1,545,000 |
| Sungard Data Systems, | | | | | |
| Gtd. Notes | 10.25 | 8/15/15 | 22,167,000 | | 23,718,690 |
| Sungard Data Systems, | | | | | |
| Gtd. Notes | 10.63 | 5/15/15 | 3,460,000 | b | 3,827,625 |
| | | | | | 68,052,906 |
| Telecommunications—13.8% | | | | | |
| Digicel Group, | | | | | |
| Sr. Unscd. Notes | 8.88 | 1/15/15 | 22,285,000 | a,b | 21,727,875 |
| Digicel Group, | | | | | |
| Sr. Unscd. Notes | 9.13 | 1/15/15 | 2,637,457 | a,b | 2,611,082 |
| Digicel Group, | | | | | |
| Sr. Unscd. Notes | 12.00 | 4/1/14 | 1,700,000 | a | 1,895,500 |
| Frontier Communications, | | | | | |
| Sr. Unscd. Notes | 6.25 | 1/15/13 | 500,000 | | 503,750 |
| Hughes Network Systems, | | | | | |
| Gtd. Notes | 9.50 | 4/15/14 | 2,500,000 | b | 2,593,750 |
| Intelsat Bermuda, | | | | | |
| Gtd. Notes | 11.25 | 2/4/17 | 21,300,000 | a,c | 21,459,750 |
| Intelsat Jackson Holdings, | | | | | |
| Gtd. Notes | 11.25 | 6/15/16 | 12,735,000 | | 13,849,313 |
| Intelsat, | | | | | |
| Sr. Unscd. Notes | 6.50 | 11/1/13 | 5,835,000 | b | 5,499,488 |
| Nordic Telephone Holdings, | | | | | |
| Sr. Scd. Bonds | 8.88 | 5/1/16 | 3,500,000 | a | 3,718,750 |
| Telesat Canada, | | | | | |
| Sr. Unscd. Notes | 11.00 | 11/1/15 | 6,790,000 | | 7,401,100 |
The Fund 17
STATEMENT OF INVESTMENTS (continued)
| | | | | |
| | Coupon | Maturity | Principal | | |
| Bonds and Notes (continued) | Rate (%) | Date | Amount ($) | | Value ($) |
| Telecommunications (continued) | | | | | |
| Telesat Canada, | | | | | |
| Sr. Sub. Notes | 12.50 | 11/1/17 | 2,415,000 | | 2,668,575 |
| Wind Acquisition Finance, | | | | | |
| Sr. Notes | 11.75 | 7/15/17 | 28,000,000 | a | 30,730,000 |
| Wind Acquisition Finance, | | | | | |
| Gtd. Bonds | 12.00 | 12/1/15 | 1,100,000 | a | 1,182,500 |
| Wind Acquisition Holding, | | | | | |
| Gtd. Notes | 12.25 | 7/15/17 | 8,245,000 | a | 8,162,550 |
| Windstream, | | | | | |
| Gtd. Notes | 7.00 | 3/15/19 | 2,000,000 | | 1,880,000 |
| Windstream, | | | | | |
| Gtd. Notes | 8.63 | 8/1/16 | 500,000 | | 511,250 |
| | | | | | 126,395,233 |
| Utilities—8.4% | | | | | |
| AES, | | | | | |
| Sr. Unscd. Notes | 7.75 | 10/15/15 | 3,045,000 | | 3,105,900 |
| AES, | | | | | |
| Sr. Unscd. Notes | 8.00 | 10/15/17 | 5,325,000 | | 5,491,406 |
| AES, | | | | | |
| Sr. Scd. Notes | 8.75 | 5/15/13 | 597,000 | a | 614,910 |
| AES, | | | | | |
| Sr. Unscd. Notes | 9.75 | 4/15/16 | 955,000 | a | 1,050,500 |
| Dynegy Holdings, | | | | | |
| Sr. Unscd. Notes | 6.88 | 4/1/11 | 1,000,000 | b | 1,045,000 |
| Dynegy Holdings, | | | | | |
| Sr. Unscd. Notes | 8.38 | 5/1/16 | 5,235,000 | b | 4,999,425 |
| Dynegy Holdings, | | | | | |
| Sr. Unscd. Notes | 8.75 | 2/15/12 | 270,000 | b | 284,850 |
| Edison Mission Energy, | | | | | |
| Sr. Unscd. Notes | 7.00 | 5/15/17 | 1,500,000 | b | 1,192,500 |
| Edison Mission Energy, | | | | | |
| Sr. Unscd. Notes | 7.50 | 6/15/13 | 4,741,000 | b | 4,480,245 |
| Energy Future Holdings, | | | | | |
| Gtd. Notes | 10.88 | 11/1/17 | 27,040,000 | b,c | 22,240,400 |
| Mirant North America, | | | | | |
| Gtd. Notes | 7.38 | 12/31/13 | 8,245,000 | | 8,193,469 |
18
| | | | | |
| | Coupon | Maturity | Principal | | |
| Bonds and Notes (continued) | Rate (%) | Date | Amount ($) | | Value ($) |
| Utilities (continued) | | | | | |
| North American Energy Alliance, | | | | | |
| Sr. Scd. Notes | 10.88 | 6/1/16 | 2,255,000 | a | 2,407,212 |
| NRG Energy, | | | | | |
| Gtd. Notes | 7.38 | 2/1/16 | 2,500,000 | | 2,509,375 |
| NRG Energy, | | | | | |
| Gtd. Notes | 7.38 | 1/15/17 | 10,865,000 | | 10,919,325 |
| NV Energy, | | | | | |
| Sr. Unscd. Notes | 8.63 | 3/15/14 | 3,200,000 | | 3,332,000 |
| RRI Energy, | | | | | |
| Sr. Unscd. Notes | 7.63 | 6/15/14 | 4,165,000 | b | 4,144,175 |
| Texas Competitive Electric | | | | | |
| Holdings, Gtd. Notes, Ser. A | 10.25 | 11/1/15 | 750,000 | b,c | 611,250 |
| | | | | | 76,621,942 |
| Total Bonds and Notes | | | | | |
| (cost $804,444,934) | | | | | 864,216,980 |
| |
| Preferred Stocks—.0% | | | Shares | | Value ($) |
| Media | | | | | |
| Spanish Broadcasting System, | | | | | |
| Ser. B, Cum. $26.88 | | | | | |
| (cost $1,598,517) | | | 1,523 f | 1,523 |
| |
| Common Stocks—.3% | | | | | |
| Cable & Media—.2% | | | | | |
| Charter Communications, Cl. A | | | 55,002 e | 1,952,570 |
| Media—.1% | | | | | |
| LIN TV, Cl. A | | | 174,220 e | 777,021 |
| Total Common Stocks | | | | | |
| (cost $1,834,195) | | | | | 2,729,591 |
| |
| Other Investment—3.1% | | | | | |
| Registered Investment Company; | | | | | |
| Dreyfus Institutional Preferred Plus Money Market Fund | | | |
| (cost $28,403,000) | | | 28,403,000 g | 28,403,000 |
The Fund 19
STATEMENT OF INVESTMENTS (continued)
| | |
| Investment of Cash Collateral | | |
| for Securities Loaned—13.6% | Shares | Value ($) |
| Registered Investment Company; | | |
| Dreyfus Institutional Cash | | |
| Advantage Fund | | |
| (cost $123,304,561) | 123,304,561 g | 123,304,561 |
| |
| Total Investments (cost $959,585,207) | 112.0% | 1,018,655,655 |
| Liabilities, Less Cash and Receivables | (12.0%) | (109,406,895) |
| Net Assets | 100.0% | 909,248,760 |
|
| a Securities exempt from registration under Rule 144A of the Securities Act of 1933.These securities may be resold in |
| transactions exempt from registration, normally to qualified institutional buyers. At December 31, 2009, these |
| securities had a total market value of $261,121,104 or 28.7% of net assets. |
| b Security, or portion thereof, on loan. At December 31, 2009, the total market value of the fund’s securities on loan is |
| $117,346,103 and the total market value of the collateral held by the fund is $125,412,661, consisting of |
| $123,304,561 of cash collateral and U.S. Government and agencies securities valued at $2,108,100. |
| c Variable rate security—interest rate subject to periodic change. |
| d Non-income producing—security in default. |
| e Non-income producing security. |
| f Illiquid security, fair valued by management. At the period end, the value of this security amounted to $1,523 or |
| .0002% of net assets.The valuation of this security has been determined in good faith under the direction of the |
| Board of Trustees. |
| g Investment in affiliated money market mutual fund. |
| | | |
| Portfolio Summary (Unaudited)† | | |
| |
| | Value (%) | | Value (%) |
| Corporate Bonds | 95.0 | Preferred Stocks | .0 |
| Money Market Investments | 16.7 | | |
| Common Stocks | .3 | | 112.0 |
|
| † Based on net assets. |
| See notes to financial statements. |
20
|
| STATEMENT OF ASSETS AND LIABILITIES |
| December 31, 2009 |
| | |
| | Cost | Value |
| Assets ($): | | |
| Investments in securities—See Statement of Investments (including | | |
| securities on loan, valued at $117,346,103)—Note 1(c): | | |
| Unaffiliated issuers | 807,877,646 | 866,948,094 |
| Affiliated issuers | 151,707,561 | 151,707,561 |
| Cash denominated in foreign currencies | 49 | 50 |
| Dividends and interest receivable | | 18,314,235 |
| Receivable for investment securities sold | | 3,422,548 |
| Receivable for shares of Beneficial Interest subscribed | | 1,447,293 |
| Unrealized appreciation on forward foreign | | |
| currency exchange contracts—Note 4 | | 2,968 |
| Prepaid expenses | | 8,452 |
| | | 1,041,851,201 |
| Liabilities ($): | | |
| Due to The Dreyfus Corporation and affiliates—Note 3(b) | | 724,537 |
| Cash overdraft due to Custodian | | 5,139,664 |
| Liability for securities on loan—Note 1(c) | | 123,304,561 |
| Payable for shares of Beneficial Interest redeemed | | 2,444,752 |
| Payable for investment securities purchased | | 988,781 |
| Interest payable—Note 2 | | 146 |
| | | 132,602,441 |
| Net Assets ($) | | 909,248,760 |
| Composition of Net Assets ($): | | |
| Paid-in capital | | 1,162,220,087 |
| Accumulated undistributed investment income—net | | 1,421,325 |
| Accumulated net realized gain (loss) on investments | | (313,466,069) |
| Accumulated net unrealized appreciation (depreciation) | | |
| on investments and foreign currency transactions | | 59,073,417 |
| Net Assets ($) | | 909,248,760 |
| | | | |
| Net Asset Value Per Share | | | |
| | Class A | Class B | Class C | Class I |
| Net Assets ($) | 360,921,475 | 22,433,729 | 125,723,835 | 400,169,721 |
| Shares Outstanding | 55,683,882 | 3,459,738 | 19,391,115 | 61,691,444 |
| Net Asset Value Per Share ($) | 6.48 | 6.48 | 6.48 | 6.49 |
See notes to financial statements.
The Fund 21
|
| STATEMENT OF OPERATIONS |
| Year Ended December 31, 2009 |
| |
| Investment Income ($): | |
| Income: | |
| Interest | 73,138,360 |
| Income from securities lending—Note 1(c) | 367,321 |
| Dividends: | |
| Unaffiliated issuers | 40,917 |
| Affiliated issuers | 45,331 |
| Total Income | 73,591,929 |
| Expenses: | |
| Management fee—Note 3(a) | 5,229,654 |
| Distribution and service fees—Note 3(b) | 2,071,367 |
| Trustees’ fees—Note 3(a) | 58,840 |
| Interest expense—Note 2 | 415 |
| Total Expenses | 7,360,276 |
| Less—Trustees’ fees reimbursed | |
| by the Manager—Note 3(a) | (58,840) |
| Net Expenses | 7,301,436 |
| Investment Income—Net | 66,290,493 |
| Realized and Unrealized Gain (Loss) on Investments—Note 4 ($): | |
| Net realized gain (loss) on investments and foreign currency transactions | (6,242,040) |
| Net realized gain (loss) on forward foreign currency exchange contracts | (159,579) |
| Net Realized Gain (Loss) | (6,401,619) |
| Net unrealized appreciation (depreciation) on investments, foreign | |
| currency transactions and forward foreign currency exchange | |
| contracts (including $136,173 net unrealized appreciation on | |
| forward foreign currency exchange contracts) | 181,196,172 |
| Net Realized and Unrealized Gain (Loss) on Investments | 174,794,553 |
| Net Increase in Net Assets Resulting from Operations | 241,085,046 |
| |
| See notes to financial statements. | |
22
STATEMENT OF CHANGES IN NET ASSETS
| | |
| | Year Ended December 31, |
| | 2009 | 2008 |
| Operations ($): | | |
| Investment income—net | 66,290,493 | 24,014,801 |
| Net realized gain (loss) on investments | (6,401,619) | (29,481,690) |
| Net unrealized appreciation | | |
| (depreciation) on investments | 181,196,172 | (85,582,367) |
| Net Increase (Decrease) in Net Assets | | |
| Resulting from Operations | 241,085,046 | (91,049,256) |
| Dividends to Shareholders from ($): | | |
| Investment income—net: | | |
| Class A Shares | (29,894,758) | (12,726,571) |
| Class B Shares | (2,849,188) | (2,203,947) |
| Class C Shares | (8,775,809) | (3,540,372) |
| Class I Shares | (27,846,038) | (7,462,886) |
| Total Dividends | (69,365,793) | (25,933,776) |
| Beneficial Interest Transactions ($): | | |
| Net proceeds from shares sold: | | |
| Class A Shares | 286,678,813 | 30,411,713 |
| Class B Shares | 1,476,907 | 409,187 |
| Class C Shares | 44,838,158 | 5,598,901 |
| Class I Shares | 232,223,371 | 80,848,983 |
| Net assets received in connection | | |
| with reorganization—Note 1 | 129,672,713 | 165,591,271 |
| Dividends reinvested: | | |
| Class A Shares | 22,562,646 | 7,191,210 |
| Class B Shares | 1,872,480 | 1,238,169 |
| Class C Shares | 5,010,735 | 1,464,954 |
| Class I Shares | 6,001,284 | 1,882,311 |
| Cost of shares redeemed: | | |
| Class A Shares | (198,188,481) | (44,066,236) |
| Class B Shares | (31,665,643) | (16,317,514) |
| Class C Shares | (19,316,179) | (12,729,359) |
| Class I Shares | (98,684,961) | (29,499,583) |
| Increase (Decrease) in Net Assets from | | |
| Beneficial Interest Transactions | 382,481,843 | 192,024,007 |
| Total Increase (Decrease) in Net Assets | 554,201,096 | 75,040,975 |
| Net Assets ($): | | |
| Beginning of Period | 355,047,664 | 280,006,689 |
| End of Period | 909,248,760 | 355,047,664 |
| Undistributed investment income—net | 1,421,325 | 106,615 |
The Fund 23
STATEMENT OF CHANGES IN NET ASSETS (continued)
| | |
| | Year Ended December 31, |
| | 2009 | 2008 |
| Capital Share Transactions: | | |
| Class Aa | | |
| Shares sold | 51,207,569 | 5,014,437 |
| Shares issued in connection with | | |
| reorganization—Note 1 | 10,690,947 | — |
| Shares issued for dividends reinvested | 3,780,546 | 1,179,978 |
| Shares redeemed | (33,630,114) | (7,044,007) |
| Net Increase (Decrease) in Shares Outstanding | 32,048,948 | (849,592) |
| Class Ba | | |
| Shares sold | 257,820 | 69,136 |
| Shares issued in connection with | | |
| reorganization—Note 1 | 4,883,654 | — |
| Shares issued for dividends reinvested | 320,812 | 200,148 |
| Shares redeemed | (5,472,399) | (2,557,751) |
| Net Increase (Decrease) in Shares Outstanding | (10,113) | (2,288,467) |
| Class C | | |
| Shares sold | 7,842,855 | 963,301 |
| Shares issued in connection with | | |
| reorganization—Note 1 | 7,195,044 | — |
| Shares issued for dividends reinvested | 837,067 | 239,274 |
| Shares redeemed | (3,270,669) | (2,106,684) |
| Net Increase (Decrease) in Shares Outstanding | 12,604,297 | (904,109) |
| Class I | | |
| Shares sold | 39,340,054 | 13,407,197 |
| Shares issued in connection with | | |
| reorganization—Note 1 | 1,748,575 | 25,436,850 |
| Shares issued for dividends reinvested | 998,987 | 319,245 |
| Shares redeemed | (16,641,631) | (5,426,110) |
| Net Increase (Decrease) in Shares Outstanding | 25,445,985 | 33,737,182 |
|
| a During the period ended December 31, 2009, 2,061,607 Class B shares representing $12,009,537, were |
| automatically converted to 2,063,045 Class A shares and during the period ended December 31, 2008, 682,327 |
| Class B shares representing $4,417,015 were automatically converted to 683,183 Class A shares. |
See notes to financial statements.
24
FINANCIAL HIGHLIGHTS
The following tables describe the performance for each share class for the fiscal periods indicated.All information (except portfolio turnover rate) reflects financial results for a single fund share.Total return shows how much your investment in the fund would have increased (or decreased) during each period, assuming you had reinvested all dividends and distributions.These figures have been derived from the fund’s financial statements.
| | | | | |
| | | Year Ended December 31, | |
| Class A Shares | 2009 | 2008 | 2007 | 2006 | 2005 |
| Per Share Data ($): | | | | | |
| Net asset value, beginning of period | 5.06 | 6.92 | 7.33 | 7.24 | 7.65 |
| Investment Operations: | | | | | |
| Investment income—neta | .54 | .50 | .49 | .49 | .51 |
| Net realized and unrealized | | | | | |
| gain (loss) on investments | 1.43 | (1.82) | (.37) | .14 | (.36) |
| Total from Investment Operations | 1.97 | (1.32) | .12 | .63 | .15 |
| Distributions: | | | | | |
| Dividends from investment income—net | (.55) | (.54) | (.53) | (.54) | (.56) |
| Net asset value, end of period | 6.48 | 5.06 | 6.92 | 7.33 | 7.24 |
| Total Return (%)b | 40.43 | (20.17) | 2.03 | 8.66 | 2.22 |
| Ratios/Supplemental Data (%): | | | | | |
| Ratio of total expenses | | | | | |
| to average net assets | .96 | .96 | .96 | .95 | .95 |
| Ratio of net expenses | | | | | |
| to average net assets | .95 | .95 | .95 | .95 | .95 |
| Ratio of net investment income | | | | | |
| to average net assets | 8.86 | 7.89 | 6.78 | 6.76 | 6.93 |
| Portfolio Turnover Rate | 77.94 | 48.85 | 50.65 | 29.98 | 40.57 |
| Net Assets, end of period ($ x 1,000) | 360,921 | 119,560 | 169,453 | 202,098 | 236,421 |
| a | Based on average shares outstanding at each month end. |
| b | Exclusive of sales charge. |
See notes to financial statements.
The Fund 25
FINANCIAL HIGHLIGHTS (continued)
| | | | | |
| | | Year Ended December 31, | |
| Class B Shares | 2009 | 2008 | 2007 | 2006 | 2005 |
| Per Share Data ($): | | | | | |
| Net asset value, beginning of period | 5.06 | 6.93 | 7.34 | 7.24 | 7.65 |
| Investment Operations: | | | | | |
| Investment income—neta | .49 | .46 | .45 | .45 | .46 |
| Net realized and unrealized | | | | | |
| gain (loss) on investments | 1.45 | (1.82) | (.37) | .16 | (.35) |
| Total from Investment Operations | 1.94 | (1.36) | .08 | .61 | .11 |
| Distributions: | | | | | |
| Dividends from investment income—net | (.52) | (.51) | (.49) | (.51) | (.52) |
| Net asset value, end of period | 6.48 | 5.06 | 6.93 | 7.34 | 7.24 |
| Total Return (%)b | 39.78 | (20.69) | 1.53 | 8.12 | 1.73 |
| Ratios/Supplemental Data (%): | | | | | |
| Ratio of total expenses | | | | | |
| to average net assets | 1.46 | 1.46 | 1.46 | 1.45 | 1.45 |
| Ratio of net expenses | | | | | |
| to average net assets | 1.45 | 1.45 | 1.45 | 1.45 | 1.45 |
| Ratio of net investment income | | | | | |
| to average net assets | 8.35 | 7.31 | 6.24 | 6.25 | 6.36 |
| Portfolio Turnover Rate | 77.94 | 48.85 | 50.65 | 29.98 | 40.57 |
| Net Assets, end of period ($ x 1,000) | 22,434 | 17,568 | 39,892 | 67,834 | 96,334 |
| |
| a | Based on average shares outstanding at each month end. |
| b | Exclusive of sales charge. |
See notes to financial statements.
26
| | | | | |
| | | Year Ended December 31, | |
| Class C Shares | 2009 | 2008 | 2007 | 2006 | 2005 |
| Per Share Data ($): | | | | | |
| Net asset value, beginning of period | 5.06 | 6.93 | 7.34 | 7.24 | 7.65 |
| Investment Operations: | | | | | |
| Investment income—neta | .50 | .45 | .43 | .43 | .45 |
| Net realized and unrealized | | | | | |
| gain (loss) on investments | 1.42 | (1.83) | (.36) | .16 | (.36) |
| Total from Investment Operations | 1.92 | (1.38) | .07 | .59 | .09 |
| Distributions: | | | | | |
| Dividends from investment income—net | (.50) | (.49) | (.48) | (.49) | (.50) |
| Net asset value, end of period | 6.48 | 5.06 | 6.93 | 7.34 | 7.24 |
| Total Return (%)b | 39.41 | (20.89) | 1.28 | 7.85 | 1.48 |
| Ratios/Supplemental Data (%): | | | | | |
| Ratio of total expenses | | | | | |
| to average net assets | 1.71 | 1.71 | 1.71 | 1.70 | 1.70 |
| Ratio of net expenses | | | | | |
| to average net assets | 1.70 | 1.70 | 1.70 | 1.70 | 1.70 |
| Ratio of net investment income | | | | | |
| to average net assets | 8.15 | 7.12 | 6.02 | 6.01 | 6.14 |
| Portfolio Turnover Rate | 77.94 | 48.85 | 50.65 | 29.98 | 40.57 |
| Net Assets, end of period ($ x 1,000) | 125,724 | 34,374 | 53,294 | 65,728 | 74,770 |
| |
| a | Based on average shares outstanding at each month end. |
| b | Exclusive of sales charge. |
See notes to financial statements.
The Fund 27
FINANCIAL HIGHLIGHTS (continued)
| | | | | |
| | | Year Ended December 31, | |
| Class I Shares | 2009 | 2008 | 2007a | 2006 | 2005 |
| Per Share Data ($): | | | | | |
| Net asset value, beginning of period | 5.06 | 6.92 | 7.33 | 7.24 | 7.65 |
| Investment Operations: | | | | | |
| Investment income—netb | .54 | .51 | .52 | .51 | .53 |
| Net realized and unrealized | | | | | |
| gain (loss) on investments | 1.45 | (1.82) | (.38) | .14 | (.36) |
| Total from Investment Operations | 1.99 | (1.31) | .14 | .65 | .17 |
| Distributions: | | | | | |
| Dividends from investment income—net | (.56) | (.55) | (.55) | (.56) | (.58) |
| Net asset value, end of period | 6.49 | 5.06 | 6.92 | 7.33 | 7.24 |
| Total Return (%) | 40.99 | (20.06) | 2.29 | 8.92 | 2.34 |
| Ratios/Supplemental Data (%): | | | | | |
| Ratio of total expenses | | | | | |
| to average net assets | .71 | .72 | .71 | .70 | .70 |
| Ratio of net expenses | | | | | |
| to average net assets | .70 | .69 | .70 | .70 | .70 |
| Ratio of net investment income | | | | | |
| to average net assets | 9.20 | 9.43 | 7.01 | 7.01 | 7.18 |
| Portfolio Turnover Rate | 77.94 | 48.85 | 50.65 | 29.98 | 40.57 |
| Net Assets, end of period ($ x 1,000) | 400,170 | 183,546 | 17,368 | 18,059 | 18,595 |
| |
| a | Effective June 1, 2007, Class R shares were redesignated as Class I shares. |
| b | Based on average shares outstanding at each month end. |
See notes to financial statements.
28
NOTES TO FINANCIAL STATEMENTS
NOTE 1—Significant Accounting Policies:
Dreyfus HighYield Fund (the “fund”) is a separate diversified series of The Dreyfus/Laurel Funds Trust (the “Trust”), which is registered under the Investment Company Act of 1940, as amended (the “Act”), as an open-end management investment company and operates as a series company currently offering six series, including the fund. The fund’s investment objective is to seek to maximize total return, consisting of capital appreciation and current income. The Dreyfus Corporation (the “Manager” or “Dreyfus”), a wholly-owned subsidiary of The Bank of New York Mellon Corporation (“BNY Mellon”), serves as the fund’s investment adviser.
At a meeting of the Board of Trustees held on February 10, 2009, the Board approved, effective April 1, 2009, a proposal to change the name of the fund from “Dreyfus LimitedTerm HighYield Fund” to “Dreyfus High Yield Fund”.
As of the close of business on January 8, 2009, pursuant to an Agreement and Plan of Reorganization previously approved by the fund’s Board of Trustees, all of the assets, subject to the liabilities, of Dreyfus High Income Fund (“High Income“) were transferred to the fund in exchange for corresponding class of shares of Beneficial Interest of the fund of equal value.The purpose of the transaction was to combine two funds with comparable investment objectives and strategies. Shareholders of Class A, Class B, Class C and Class I shares of High Income received Class A, Class B, Class C and Class I shares of the fund, respectively, in each case in an amount equal to the aggregate net asset value of their investment in High Income at the time of the exchange. The exchange ratio for Class A, Class B, Class C and Class I shares are 1.96, 1.96, 1.95 and 1.96, respectively.The net asset value of the fund’s shares on the close of business January 8, 2009, after the reorganization was $5.29 for Class A, $5.29 for Class B, $5.29 for Class C and $5.29 for Class I shares, and a total of 10,690,947 Class A shares, 4,883,654 Class B shares, 7,195,044 Class C shares and 1,748,575 Class I shares. The exchange was a tax-free event to the
The Fund 29
NOTES TO FINANCIAL STATEMENTS (continued)
High Income shareholders. For financial reporting purposes, assets received and shares issued by the fund were recorded at fair value; however the cost basis of investments received from High Income was carried forward to align ongoing reporting of the fund’s realized and unrealized gains and losses with amounts distributable to shareholders for tax purposes.
The net assets and net unrealized (depreciation) immediately before the acquisition were as follows:
| | |
| | Unrealized | |
| | (Depreciation) ($) | Net Assets ($) |
| Dreyfus High Income Fund— | | |
| Target Fund | (23,749,040) | 129,672,713 |
| Dreyfus High Yield Fund— | | |
| Acquiring Fund | (81,332,832) | 382,765,045 |
| Total | (105,081,872) | 512,437,758 |
Assuming the acquisition had been completed on January 1, 2009, the acquiring fund’s pro forma results of the Statement of Operations during the period ended December 31, 2009 were as follows:
| |
| Net investment income | $66,507,1271 |
| Net realized and unrealized gain on investments | $179,364,3222 |
| Net increase (decrease) in net assets | |
| resulting from operations | $245,871,449 |
| |
| 1 | $66,290,493 as reported in the Statement of Operations, plus $216,634 High Income pre-merger. |
| 2 | $174,794,553 as reported in the Statement of Operations, plus $4,569,769 High Income |
| | pre-merger. |
Because the combined funds have been managed as a single integrated fund since the acquisition was completed, it is not practicable to separate the amounts of revenue and earnings of High Income that have been included in the fund’s Statement of Operations since December 31,2009.
As of the close of business on September 12, 2008, pursuant to an Agreement and Plan of Reorganization previously approved by the fund’s Board of Trustees, all of the assets, subject to liabilities, of BNY Hamilton High Yield Fund (“Hamilton High Yield”) were transferred to the fund in exchange for shares of Beneficial Interest of the fund of equal value. Shareholders of Hamilton High Yield Institutional and
30
Class A shares received Class I shares of the fund, in an amount equal to the aggregate net asset value of their investment in Hamilton High Yield at the time of the exchange. The fund’s net asset value on the close of business on September 12, 2008 after the reorganization was $6.51 for Class I shares and a total of 25,436,850 Class I shares, representing net assets of $165,591,271 (including $6,516,278 net unrealized depreciation on investments) were issued to shareholders of Hamilton High Yield in the exchange. The exchange was a tax-free event to Hamilton HighYield shareholders.
MBSC Securities Corporation (the “Distributor”), a wholly-owned subsidiary of the Manager, is the distributor of the fund’s shares. The fund is authorized to issue an unlimited number of shares of Beneficial Interest in each of the following classes of shares: Class A, Class B, Class C and Class I. Class A, Class B and Class C shares are sold primarily to retail investors through financial intermediaries and bear a distribution fee and/or shareholder services fee. Class A shares are sold with a front-end sales charge, while Class B and Class C shares are subject to a contingent deferred sales charge (“CDSC”). Class B shares automatically convert to Class A shares after six years. The fund does not offer Class B shares, except in connection with dividend reinvestment and permitted exchanges of Class B shares. Class I shares are sold primarily to bank trust departments and other financial service provider s (including The Bank of New York Mellon, a subsidiary of BNY Mellon and an affiliate of Dreyfus), acting on behalf of customers having a qualified trust or investment account or relationship at such institution, and bear no distribution or services fees. Class I shares are offered without a front-end sales charge or CDSC. Each class of shares has identical rights and privileges, except with respect to the distribution, service fees and voting rights on matters affecting a single class. Income, expenses (other than expenses attributable to a specific class), and realized and unrealized gains or losses on investments are allocated to each class of shares based on its relative net assets.
The Fund 31
NOTES TO FINANCIAL STATEMENTS (continued)
The Trust accounts separately for the assets, liabilities and operations of each series. Expenses directly attributable to each series are charged to that series’ operations; expenses which are applicable to all series are allocated among them on a pro rata basis.
The Financial Accounting Standards Board (“FASB”) Accounting Standards Codification (“ASC”) has become the exclusive reference of authoritative U.S. generally accepted accounting principles (“GAAP”) recognized by the FASB to be applied by nongovernmental entities. Rules and interpretive releases of the Securities and Exchange Commission (“SEC”) under authority of federal laws are also sources of authoritative GAAP for SEC registrants. The ASC has superseded all existing non-SEC accounting and reporting standards. The fund’s financial statements are prepared in accordance with GAAP, which may require the use of management estimates and assumptions.Actual results could differ from those estimates.
(a) Portfolio valuation: Investments in securities excluding short-term investments (other than U.S. Treasury Bills), financial futures, options, swaps and forward foreign currency exchange contracts (“forward contracts”) are valued each business day by an independent pricing service (the “Service”) approved by the Board of Trustees. Investments for which quoted bid prices are readily available and are representative of the bid side of the market in the judgment of the Service are valued at the mean between the quoted bid prices (as obtained by the Service from dealers in such securities) and asked prices (as calculated by the Service based upon its evaluation of the market for such securities). Other investments (which constitute a majority of the portfolio securities) are valued as determined by the Service, based on methods which include consideration of: yields or prices of securities of comparable quality, coupon, maturity and type; indications as to values from dealers; and general market conditions. Restricted securities, as well as securities or other assets for which recent market quotations are not readily available and are not valued by a pricing service approved by the Board of
32
Trustees, or are determined by the fund not to reflect accurately fair value, are valued at fair value as determined in good faith under the direction of the Board of Trustees.The factors that may be considered when fair valuing a security include fundamental analytical data, the nature and duration of restrictions on disposition, an evaluation of the forces that influence the market in which the securities are purchased and sold and public trading in similar securities of the issuer or comparable issuers. Short-term investments, excluding U.S.Treasury Bills, are carried at amortized cost, which approximates value. Registered investment companies that are not traded on an exchange are valued at their net asset value. Financial futures and options, which are traded on an exchange, are valued at the last sales price on the securities exchange on which such securities are primarily traded or at the last sales price on the national securities market on each business day. Options traded over-the-counter are valued at the mean between the bid and asked price. Investments in swap transactions are valued each business day by an independent pricing service approved by the Board of Trustees. Swaps are valued by the service by using a swap pricing model which incorporates among other factors, default probabilities, recovery rates, credit curves of the underlying issuer and swap spreads on interest rates. Investments denominated in foreign currencies are translated to U.S. dollars at the prevailing rates of exchange. Forward contracts are valued at the forward rate.
The fair value of a financial instrument is the amount that would be received to sell an asset or paid to transfer a liability in an orderly transaction between market participants at the measurement date (i.e. the exit price). GAAP establishes a fair value hierarchy that prioritizes the inputs of valuation techniques used to measure fair value.This hierarchy gives the highest priority to unadjusted quoted prices in active markets for identical assets or liabilities (Level 1 measurements) and the lowest priority to unobservable inputs (Level 3 measurements).
The Fund 33
NOTES TO FINANCIAL STATEMENTS (continued)
Additionally, GAAP provides guidance on determining whether the volume and activity in a market has decreased significantly and whether such a decrease in activity results in transactions that are not orderly. GAAP requires enhanced disclosures around valuation inputs and techniques used during annual and interim periods.
Various inputs are used in determining the value of the fund’s investments relating to fair value measurements.These inputs are summarized in the three broad levels listed below:
Level 1—unadjusted quoted prices in active markets for
identical investments.
Level 2—other significant observable inputs (including quoted
prices for similar investments, interest rates, prepayment speeds,
credit risk, etc.).
Level 3—significant unobservable inputs (including the fund’s own
assumptions in determining the fair value of investments).
The inputs or methodology used for valuing securities are not necessarily an indication of the risk associated with investing in those securities.
The following is a summary of the inputs used as of December 31, 2009 in valuing the fund’s investments:
| | | | |
| | | Level 2—Other | Level 3— | |
| | Level 1— | Significant | Significant | |
| | Unadjusted | Observable | Unobservable | |
| | Quoted Prices | Inputs | Inputs | Total |
| Assets ($) | | | | |
| Investments in Securities: | | | |
| Equity Securities— | | | | |
| Domestic† | 2,729,591 | — | 1,523 | 2,731,114 |
| Corporate Bonds | — | 864,216,980 | — | 864,216,980 |
| Mutual Funds | 151,707,561 | — | — | 151,707,561 |
| Other Financial | | | | |
| Instruments†† | — | 2,968 | — | 2,968 |
| Liabilities ($) | | | | |
| Other Financial | | | | |
| Instruments†† | — | — | — | — |
| |
| † | See Statement of Investments for industry classification. |
| †† | Other financial instruments include derivative instruments, such as futures, forward foreign currency |
| | exchange contracts, swap contracts and options contracts. Amounts shown represent unrealized |
| | appreciation (depreciation), or in the case of options, market value at period end. |
34
The following is a reconciliation of Level 3 assets for which significant unobservable inputs were used to determine fair value:
| |
| | Investments in |
| | Preferred Stock ($) |
| Balance as of 12/31/2008 | — |
| Realized gain (loss) | — |
| Change in unrealized appreciation (depreciation) | — |
| Net purchases (sales) | — |
| Transfers in and/or out of Level 3 | 1,523 |
| Balance as of 12/31/2009 | 1,523 |
(b) Foreign currency transactions: The fund does not isolate that portion of the results of operations resulting from changes in foreign exchange rates on investments from the fluctuations arising from changes in the market prices of securities held. Such fluctuations are included with the net realized and unrealized gain or loss on investments.
Net realized foreign exchange gains or losses arise from sales of foreign currencies, currency gains or losses realized on securities transactions between trade and settlement date, and the difference between the amounts of dividends, interest and foreign withholding taxes recorded on the fund’s books and the U.S. dollar equivalent of the amounts actually received or paid. Net unrealized foreign exchange gains and losses arise from changes in the value of assets and liabilities other than investments resulting from changes in exchange rates. Foreign currency gains and losses on investments are included with net realized and unrealized gain or loss on investments.
(c) Securities transactions and investment income: Securities transactions are recorded on a trade date basis. Realized gains and losses from securities transactions are recorded on the identified cost basis. Dividend income is recognized on the ex-dividend date and interest income, including, where applicable, accretion of discount and amortization of premium on investments, is recognized on the accrual basis.
Pursuant to a securities lending agreement with The Bank of New York Mellon, the fund may lend securities to qualified institutions. It
The Fund 35
NOTES TO FINANCIAL STATEMENTS (continued)
is the fund’s policy that, at origination, all loans are secured by collateral of at least 102% of the value of U.S. securities loaned and 105% of the value of foreign securities loaned. Collateral equivalent to at least 100% of the market value of securities on loan is maintained at all times. Collateral is either in the form of cash, which can be invested in certain money market mutual funds managed by the Manager, U.S. Government and Agency securities or letters of credit. The fund is entitled to receive all income on securities loaned, in addition to income earned as a result of the lending transaction. Although each security loaned is fully collateralized, the fund bears the risk of delay in recovery of, or loss of rights in, the securities loaned should a borrower fail to return the securities in a timely manner. During the period ended December 31, 2009, The Bank of New York Mellon earned $197,788 from lending portf olio securities, pursuant to the securities lending agreement.
(d) Affiliated issuers: Investments in other investment companies advised by the Manager are defined as “affiliated” in the Act.
(e) Concentration of Risk: The fund invests primarily in debt securities. Failure of an issuer of the debt securities to make timely interest or principal payments, or a decline or the perception of a decline in the credit quality of a debt security, can cause the debt security’s price to fall, potentially lowering the fund’s share price. High yield (“junk”) bonds involve greater credit risk, including the risk of default, than investment grade bonds, and are considered predominantly speculative with respect to the issuer’s continuing ability to make principal and interest payments. In addition, the value of debt securities may decline due to general market conditions that are not specifically related to a particular company, such as real or perceived adverse economic conditions, changes in outlook for corporate earnings, chang es in interest or currency rates or adverse investor sentiment. They may also decline because of factors that affect a particular industry.
36
(f) Dividends to shareholders: It is the policy of the fund to declare dividends daily from investment income-net. Such dividends are paid monthly. Dividends from net realized capital gains, if any, are normally declared and paid annually, but the fund may make distributions on a more frequent basis to comply with the distribution requirements of the Internal Revenue Code of 1986, as amended (the “Code”).To the extent that net realized capital gains can be offset by capital loss carryovers, it is the policy of the fund not to distribute such gains. Income and capital gain distributions are determined in accordance with income tax regulations, which may differ from GAAP.
(g) Federal income taxes: It is the policy of the fund to continue to qualify as a regulated investment company, if such qualification is in the best interests of its shareholders, by complying with the applicable provisions of the Code, and to make distributions of taxable income sufficient to relieve it from substantially all federal income and excise taxes.
As of and during the period ended December 31, 2009, the fund did not have any liabilities for any uncertain tax positions.The fund recognizes interest and penalties, if any, related to uncertain tax positions as income tax expense in the Statement of Operations. During the period, the fund did not incur any interest or penalties.
Each of the tax years in the four-year period ended December 31, 2009 remains subject to examination by the Internal Revenue Service and state taxing authorities.
At December 31, 2009, the components of accumulated earnings on a tax basis were as follows: undistributed ordinary income $1,424,294, accumulated capital losses $309,880,382 and unrealized appreciation $55,484,761.
The accumulated capital loss carryover is available for federal income tax purposes to be applied against future net securities profits, if any, realized
The Fund 37
NOTES TO FINANCIAL STATEMENTS (continued)
subsequent to December 31, 2009. If not applied, $138,776,715 of the carryover expires in fiscal 2010, $72,493,638 expires in fiscal 2011, $1,917,623 expires in fiscal 2012, $11,766,163 expires in fiscal 2013, $2,406,483 expires in fiscal 2014, $16,497,195 expires in fiscal 2015, $42,229,566 expires in fiscal 2016 and 23,792,999 expires in fiscal 2017. Based on certain provisions in the Code, various limitations regarding the future utilization of these carry forwards, brought forward as a result of the fund’s merger with the following funds may apply: High Yield Total Fund, BNY Hamilton HighYield Fund and Dreyfus High Income Fund. It is possible that the fund will not be able to utilize most of its capital loss carryovers prior to its expiration date.
The tax character of distributions paid to shareholders during the fiscal periods ended December 31, 2009 and December 31, 2008 were as follows: ordinary income $69,365,793 and $25,933,776, respectively.
During the period ended December 31, 2009, as a result of permanent book to tax differences, primarily due to the tax treatment for foreign currency transactions, consent fees, amortization of premiums, expiration of capital loss carryovers, wash sales and capital loss carryover from the merger with Dreyfus High Income Fund, the fund increased accumulated undistributed investment income-net by $4,390,010, increased accumulated net realized gain (loss) on investments by $131,839,682 and decreased paid-in capital by $136,229,692. Net assets and net asset value per share were not affected by this reclassification.
NOTE 2—Bank Line of Credit:
The fund participates with other Dreyfus-managed funds in a $225 million unsecured credit facility led by Citibank, N.A. and a $300 million unsecured credit facility provided by The Bank of New York Mellon (each, a “Facility”), each to be utilized primarily for temporary or emergency purposes, including the financing of redemptions. In connection therewith, the fund has agreed to pay its pro rata portion of commitment fees for each Facility. Interest is charged to the fund based on rates determined pursuant to the terms of the respective Facility at the time of borrowing.
38
The average amount of borrowings outstanding under the Facilities during the period ended December 31, 2009, was approximately $27,100 with a related weighted average annualized interest rate of 1.53%.
NOTE 3—Investment Management Fee and Other Transactions with Affiliates:
(a) Pursuant to an investment management agreement with the Manager, the Manager provides or arranges for one or more third parties and/or affiliates to provide investment advisory, administrative, custody, fund accounting and transfer agency services to the fund.The Manager also directs the investments of the fund in accordance with its investment objective, policies and limitations. For these services, the fund is contractually obligated to pay the Manager a fee, calculated daily and paid monthly, at the annual rate of .70% of the value of the fund’s average daily net assets. Out of its fee, the Manager pays all of the expenses of the fund except brokerage fees, taxes, interest, commitment fees, Rule 12b-1 distribution fees and expenses, shareholder service fees, fees and expenses of non-interested Trustees (including counsel fees) and extraordi nary expenses. In addition, the Manager is required to reduce its fee in an amount equal to the fund’s allocable portion of fees and expenses of the non-interested Trustees (including counsel fees). Prior to January 1, 2010, each Board member received $45,000 per year, plus $6,000 for each joint Board meeting of the Trust, The Dreyfus/Laurel Funds, Inc., The Dreyfus/Laurel Tax-Free Municipal Funds, Dreyfus Investment Funds and Dreyfus Funds, Inc. (collectively, the “Board Group Open-End Funds”) attended, $2,000 for separate in-person committee meetings attended which were not held in conjunction with a regularly scheduled Board meeting and $1,500 for Board meetings and separate committee meetings attended that were conducted by telephone. Effective January 1, 2010, the Board Group Open-End Funds will pay each Board member who is not an “interested person” of the Trust (as defined in the 1940 Act) $60,000 per annum, plus $7,000 per joint Board Group Open-End Funds
The Fund 39
NOTES TO FINANCIAL STATEMENTS (continued)
Board meeting attended, $2,500 for separate in-person committee meetings attended which are not held in conjunction with a regularly scheduled Board meeting and $2,000 for Board meetings and separate committee meetings attended that are conducted by telephone. The Board Group Open-End Funds also reimburse each Board member who is not an “interested person” of the Trust (as defined in the 1940 Act) for travel and out-of-pocket expenses. With respect to Board meetings, the Chairman of the Board receives an additional 25% of such compensation (with the exception of reimbursable amounts). With respect to compensation committee meetings prior to January 1, 2010, the Chair of the compensation committee received $900 per compensation committee meeting, and, effective January 1, 2010, the Chair of each of the Board’s committees, unless the Chair also serves as Chair of the Board, will receive $1,350 per applicable commit tee meeting. In the event that there is an in-person joint committee meeting or a joint telephone meeting of the Board Group Open-End Funds and Dreyfus High Yield Strategies Fund, the $2,000 or $1,500 fee (prior to January 1, 2010) or the $2,500 or $2,000 fee (effective January 1, 2010), as applicable, is allocated between the Board Group Open-End Funds and Dreyfus HighYield Strategies Fund.The Trust’s portion of these fees and expenses are charged and allocated to each series based on net assets. Amounts required to be paid by the Trust directly to the non-interested Trustees, that would be applied to offset a portion of the management fee payable to the Manager, are in fact paid directly by the Manager to the non-interested Trustees.
The Manager has contractually agreed, until September 30, 2010, to waive receipt of its fees and/or assume the expenses of Class I shares of the fund so that the annual operating expenses (excluding taxes, interest, brokerage commissions, commitment fees on borrowings and extraordinary expenses) do not exceed .81% of the value of the fund’s average daily net assets. No expense reimbursement was required pursuant to the Agreement for the period ended December 31, 2009.
40
During the period ended December 31, 2009, the Distributor retained $52,524 from commissions earned on sales of the fund’s Class A shares and $59,904 and $37,768 from CDSCs on redemptions of the fund’s Class B and Class C shares, respectively.
(b) Under separate Distribution Plans (the “Plans”) adopted pursuant to Rule 12b-1 under the Act, Class A shares pay annually up to .25% of the value of the average daily net assets to compensate the Distributor for shareholder servicing activities and expenses primarily intended to result in the sale of Class A shares. Class B and Class C shares pay the Distributor for distributing their shares at an aggregate annual rate of .50% and .75% of the value of the average daily net assets of Class B and Class C shares, respectively. Class B and Class C shares are also subject to a Service Plan adopted pursuant to Rule 12b-1 (the “Service Plan”), under which Class B and Class C shares pay the Distributor for providing certain services to the holders of their shares a fee at the annual rate of .25% of the value of the average daily net ass ets of Class B and Class C shares. During the period ended December 31, 2009, Class A, Class B and Class C shares were charged $805,055, $161,055 and $768,547, respectively, pursuant to their respective Plans. During the period ended December 31, 2009, Class B and Class C shares were charged $80,528 and $256,182, respectively, pursuant to the Service Plan.
Under its terms, the Plans and Service Plan shall remain in effect from year to year, provided such continuance is approved annually by a vote of a majority of those Trustees who are not “interested persons” of the Trust and who have no direct or indirect financial interest in the operation of or in any agreement related to the Plans or Service Plan.
The components of “Due to The Dreyfus Corporation and affiliates” in the Statement of Assets and Liabilities consist of: management fees $528,602, Rule 12b-1 distribution plan fees $164,755 and service plan fees $31,180.
The Fund 41
NOTES TO FINANCIAL STATEMENTS (continued)
NOTE 4—Securities Transactions:
The aggregate amount of purchases and sales (including paydowns) of investment securities, excluding short-term securities and forward contracts, during the period ended December 31, 2009, amounted to $795,620,455 and $548,670,524, respectively.
The fund adopted the provisions of ASC Topic 815 “Derivatives and Hedging” which requires qualitative disclosures about objectives and strategies for using derivatives, quantitative disclosures about fair value amounts of gains and losses on derivative instruments and disclosures about credit-risk-related contingent features in derivative agreements. The disclosure requirements distinguish between derivatives, which are accounted for as “hedges” and those that do not qualify for hedge accounting. Because investment companies value their derivatives at fair value and recognize changes in fair value through the Statement of Operations, they do not qualify for such accounting. Accordingly, even though a fund’s investments in derivatives may represent economic hedges, they are considered to be non-hedge transactions for purposes of this disclosure.
During the period ended December 31, 2009, the average market value of forward contracts was $937,163, which represented .13% of average net assets.
Forward Foreign Currency Exchange Contracts: The fund enters into forward contracts in order to hedge its exposure to changes in foreign currency exchange rates on its foreign portfolio holdings, to settle foreign currency transactions or as a part of its investment strat-egy.When executing forward contracts, the fund is obligated to buy or sell a foreign currency at a specified rate on a certain date in the future. With respect to sales of forward contracts, the fund incurs a loss if the value of the contract increases between the date the forward contract is opened and the date the forward contract is closed.The fund realizes a gain if the value of the contract decreases between those dates.
42
With respect to purchases of forward contracts, the fund incurs a loss if the value of the contract decreases between the date the forward contract is opened and the date the forward contract is closed. The fund realizes a gain if the value of the contract increases between those dates. The fund is exposed to foreign currency risk as a result of changes in value of underlying financial instruments.The fund is also exposed to credit risk associated with counterparty nonperformance on these forward contracts, which is typically limited to the unrealized gain on each open contract.The following summarizes open forward contracts at December 31, 2009:
| | | | |
| | Foreign | | | |
| Forward Foreign Currency | Currency | | | Unrealized |
| Exchange Contracts | Amounts | Proceeds ($) | Value ($) | Appreciation ($) |
| Sales: | | | | |
| Euro, | | | | |
| Expiring 1/29/2010 | 160,000 | 232,520 | 229,552 | 2,968 |
At December 31, 2009, the cost of investments for federal income tax purposes was $963,170,894; accordingly, accumulated net unrealized appreciation on investments was $55,484,761, consisting of $66,813,813 gross unrealized appreciation and $11,329,052 gross unrealized depreciation.
NOTE 5—New Accounting Pronouncement:
In January 2010, FASB issued Accounting Standards Update (“ASU”) No. 2010-06 “Improving Disclosures about Fair Value Measurements”. ASU 2010-06 will require reporting entities to make new disclosures about amounts and reasons for significant transfers in and out of Level 1 and Level 2 fair value measurements as well as inputs and valuation techniques used to measure fair value for both recurring and nonrecurring fair value measurements that fall in either Level 2 or Level 3, and information on purchases, sales, issuances and settlements on a gross basis in the reconciliation of activity in Level 3 fair value measurements. The new and revised disclosures are required to be implemented for fiscal
The Fund 43
NOTES TO FINANCIAL STATEMENTS (continued)
years beginning after December 15, 2009 except for the disclosures surrounding purchases,sales,issuances and settlements on a gross basis in the reconciliation of Level 3 fair value measurements, which are effective for fiscal years beginning after December 15, 2010. Management is currently evaluating the impact the adoption of ASU No. 2010-06 may have on the fund’s financial statement disclosures.
NOTE 6—Subsequent Events Evaluation:
Dreyfus has evaluated the need for disclosures and/or adjustments resulting from subsequent events through February 26, 2010, the date the financial statements were issued. This evaluation did not result in any subsequent events that necessitated disclosures and/or adjustments.
44
REPORT OF INDEPENDENT REGISTERED
PUBLIC ACCOUNTING FIRM
The Board of Trustees and Shareholders
The Dreyfus/Laurel Funds Trust
We have audited the accompanying statement of assets and liabilities, of Dreyfus High Yield Fund (the “Fund”) (formerly, Dreyfus Limited Term High Yield Fund), a series of The Dreyfus/Laurel Funds Trust, including the statement of investments as of December 31, 2009, and the related statement of operations for the year then ended, the statements of changes in net assets for each of the years in the two-year period then ended, and the financial highlights for each of the years in the five-year period then ended.These financial statements and financial highlights are the responsibility of the Fund’s management. Our responsibility is to express an opinion on these financial statements and financial highlights based on our audits.
We conducted our audits in accordance with the standards of the Public Company Accounting Oversight Board (United States).Those standards require that we plan and perform the audit to obtain reasonable assurance about whether the financial statements and financial highlights are free of material misstatement. An audit includes examining, on a test basis, evidence supporting the amounts and disclosures in the financial statements. Our procedures included confirmation of securities owned as of December 31, 2009, by correspondence with the custodian and brokers or by other appropriate auditing procedures where replies from brokers were not received.An audit also includes assessing the accounting principles used and significant estimates made by management, as well as evaluating the overall financial statement presentation.We believe that our audits provide a reasonable basis for our opinion.
In our opinion, the financial statements and financial highlights referred to above present fairly, in all material respects, the financial position of Dreyfus High Yield Fund as of December 31, 2009, and the results of its operations for the year then ended, the changes in its net assets for each of the years in the two-year period then ended, and the financial highlights for each of the years in the five-year period then ended, in conformity with U.S. generally accepted accounting principles.

New York, New York
February 26, 2010
The Fund 45
IMPORTANT TAX INFORMATION (Unaudited)
For federal tax purposes the fund hereby designates 99.41% of ordinary income dividends paid during the fiscal year ended December 31, 2009 as qualifying “interest related dividends”.
46
BOARD MEMBERS INFORMATION (Unaudited)
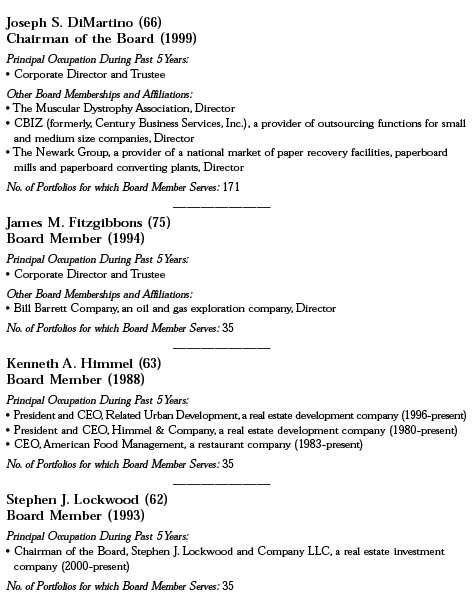
The Fund 47
BOARD MEMBERS INFORMATION (Unaudited) (continued)
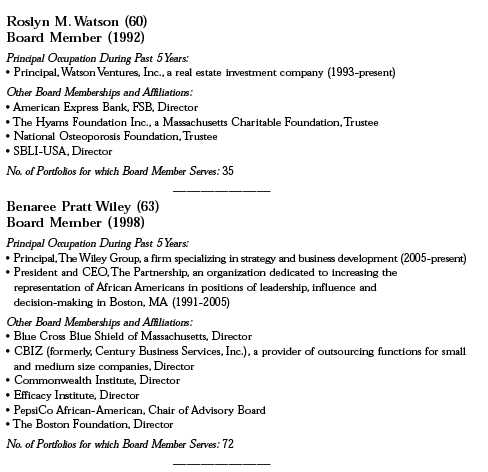
Once elected all Board Members serve for an indefinite term, but achieve Emeritus status upon reaching age 80.The address of the Board Members and Officers is in c/o The Dreyfus Corporation, 200 Park Avenue, NewYork, NewYork 10166. Additional information about the Board Members is available in the fund’s Statement of Additional Information which can be obtained from Dreyfus free of charge by calling this toll free number: 1-800-554-4611.
J.Tomlinson Fort, Emeritus Board Member
48
OFFICERS OF THE FUND (Unaudited)
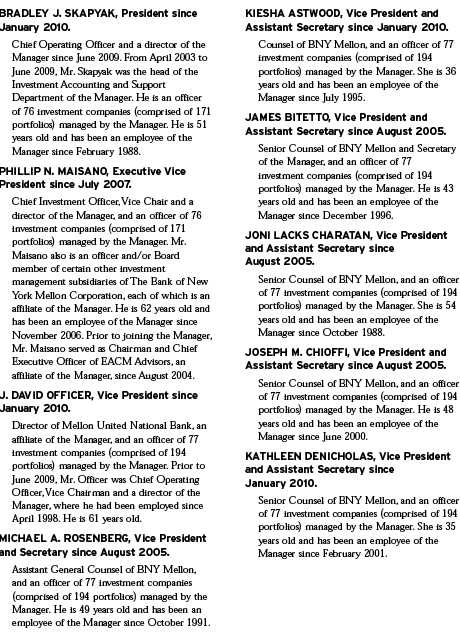
The Fund 49
OFFICERS OF THE FUND (Unaudited) (continued)
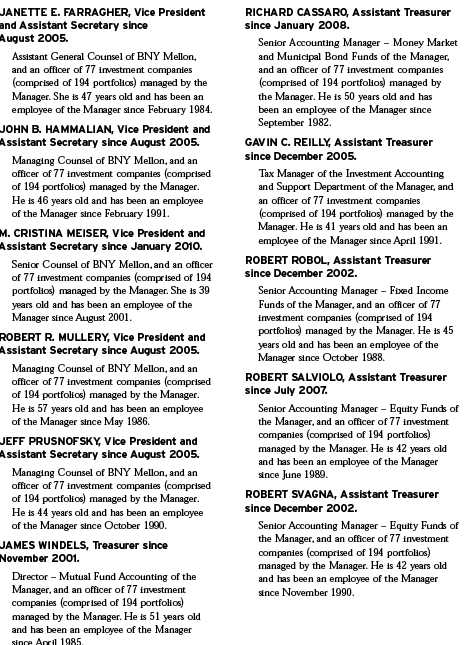
50
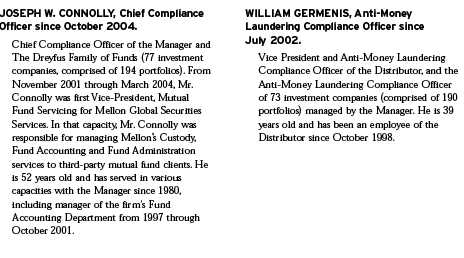
The Fund 51
For More Information
Telephone Call your financial representative or 1-800-554-4611
Mail The Dreyfus Family of Funds, 144 Glenn Curtiss Boulevard, Uniondale, NY 11556-0144
The fund files its complete schedule of portfolio holdings with the Securities and Exchange Commission (“SEC”) for the first and third quarters of each fiscal year on Form N-Q. The fund’s Forms N-Q are available on the SEC’s website at http://www.sec.gov and may be reviewed and copied at the SEC’s Public Reference Room in Washington, DC. Information on the operation of the Public Reference Room may be obtained by calling 1-800-SEC-0330.
A description of the policies and procedures that the fund uses to determine how to vote proxies relating to portfolio securities, and information regarding how the fund voted these proxies for the most recent 12-month period ended June 30 is available at http://www.dreyfus.com and on the SEC’s website at http://www.sec.gov. The description of the policies and procedures is also available without charge, upon request, by calling 1-800-645-6561.

Item 2. Code of Ethics.
The Registrant has adopted a code of ethics that applies to the Registrant's principal executive officer, principal financial officer, principal accounting officer or controller, or persons performing similar functions. There have been no amendments to, or waivers in connection with, the Code of Ethics during the period covered by this Report.
Item 3. Audit Committee Financial Expert.
The Registrant's Board has determined that Joseph S. DiMartino, a member of the Audit Committee of the Board, is an audit committee financial expert as defined by the Securities and Exchange Commission (the "SEC"). Mr. DiMartino is "independent" as defined by the SEC for purposes of audit committee financial expert determinations.
Item 4. Principal Accountant Fees and Services.
(a) Audit Fees. The aggregate fees billed for each of the last two fiscal years (the "Reporting Periods") for professional services rendered by the Registrant's principal accountant (the "Auditor") for the audit of the Registrant's annual financial statements or services that are normally provided by the Auditor in connection with the statutory and regulatory filings or engagements for the Reporting Periods, were $78,330 in 2008 and $79,895 in 2009.
(b) Audit-Related Fees. The aggregate fees billed in the Reporting Periods for assurance and related services by the Auditor that are reasonably related to the performance of the audit of the Registrant's financial statements and are not reported under paragraph (a) of this Item 4 were $8,070 in 2008 and $8,400 in 2009. These services consisted of (i) security counts required by Rule 17f-2 under the Investment Company Act of 1940, as amended.
The aggregate fees billed in the Reporting Periods for non-audit assurance and related services by the Auditor to the Registrant's investment adviser (not including any sub-investment adviser whose role is primarily portfolio management and is subcontracted with or overseen by another investment adviser), and any entity controlling, controlled by or under common control with the investment adviser that provides ongoing services to the Registrant ("Service Affiliates"), that were reasonably related to the performance of the annual audit of the Service Affiliate, which required pre-approval by the Audit Committee were $0 in 2008 and $0 in 2009.
(c) Tax Fees. The aggregate fees billed in the Reporting Periods for professional services rendered by the Auditor for tax compliance, tax advice, and tax planning ("Tax Services") were $4,430 in 2008 and $4,520 in 2009. These services consisted of: (i) review or preparation of U.S. federal, state, local and excise tax returns; (ii) U.S. federal, state and local tax planning, advice and assistance regarding statutory, regulatory or administrative developments; (iii) tax advice regarding tax qualification matters and/or treatment of various financial instruments held or proposed to be acquired or held. The aggregate fees billed in the Reporting Periods for Tax Services by the Auditor to Service Affiliates, which required pre-approval by the Audit Committee were $0 in 2008 and $0 in 2009.
(d) All Other Fees. The aggregate fees billed in the Reporting Periods for products and services provided by the Auditor, other than the services reported in paragraphs (a) through (c) of this Item, were $0 in 2008 and $0 in 2009.
The aggregate fees billed in the Reporting Periods for Non-Audit Services by the Auditor to Service Affiliates, other than the services reported in paragraphs (b) through (c) of this Item, which required pre-approval by the Audit Committee, were $0 in 2008 and $0 in 2009.
Note: None of the services described in paragraphs (b) through (d) of this Item 4 were approved by the Audit Committee pursuant to paragraph (c)(7)(i)(C) of Rule 2-01 of Regulation S-X.
Audit Committee Pre-Approval Policies and Procedures. The Registrant's Audit Committee has established policies and procedures (the "Policy") for pre-approval (within specified fee limits) of the Auditor's engagements for non-audit services to the Registrant and Service Affiliates without specific case-by-case consideration. Pre-approval considerations include whether the proposed services are compatible with maintaining the Auditor's independence. Pre-approvals pursuant to the Policy are considered annually.
Non-Audit Fees. The aggregate non-audit fees billed by the Auditor for services rendered to the Registrant, and rendered to Service Affiliates, for the Reporting Periods were $2,532,612 in 2008 and $4,021,870 in 2009.
Auditor Independence. The Registrant's Audit Committee has considered whether the provision of non-audit services that were rendered to Service Affiliates, which were not pre-approved (not requiring pre-approval), is compatible with maintaining the Auditor's independence.
Item 5. Audit Committee of Listed Registrants.
Not applicable. [CLOSED-END FUNDS ONLY]
Item 6. Investments.
(a) Not applicable.
Item 7. Disclosure of Proxy Voting Policies and Procedures for Closed-End Management Investment Companies.
Not applicable. [CLOSED-END FUNDS ONLY]
Item 8. Portfolio Managers of Closed-End Management Investment Companies.
Not applicable. [CLOSED-END FUNDS ONLY, beginning with reports for periods ended on and after December 31, 2005]
Item 9. Purchases of Equity Securities by Closed-End Management Investment Companies and Affiliated Purchasers.
Not applicable. [CLOSED-END FUNDS ONLY]
Item 10. Submission of Matters to a Vote of Security Holders.
There have been no material changes to the procedures applicable to Item 10.
Item 11. Controls and Procedures.
(a) The Registrant's principal executive and principal financial officers have concluded, based on their evaluation of the Registrant's disclosure controls and procedures as of a date within 90 days of the filing date of this report, that the Registrant's disclosure controls and procedures are reasonably designed to ensure that information required to be disclosed by the Registrant on Form N-CSR is recorded, processed, summarized and reported within the required time periods and that information required to be disclosed by the Registrant in the reports that it files or submits on Form N-CSR is accumulated and communicated to the Registrant's
management, including its principal executive and principal financial officers, as appropriate to allow timely decisions regarding required disclosure.
(b) There were no changes to the Registrant's internal control over financial reporting that occurred during the second fiscal quarter of the period covered by this report that have materially affected, or are reasonably likely to materially affect, the Registrant's internal control over financial reporting.
Item 12. Exhibits.
(a)(1) Code of ethics referred to in Item 2.
(a)(2) Certifications of principal executive and principal financial officers as required by Rule 30a-2(a) under the Investment Company Act of 1940.
(a)(3) Not applicable.
(b) Certification of principal executive and principal financial officers as required by Rule 30a-2(b) under the Investment Company Act of 1940.
SIGNATURES
Pursuant to the requirements of the Securities Exchange Act of 1934 and the Investment Company Act of 1940, the Registrant has duly caused this Report to be signed on its behalf by the undersigned, thereunto duly authorized.
Dreyfus/Laurel Funds Trust
| |
| By: | /s/ Bradley J. Skapyak |
| | Bradley J. Skapyak, |
| | President |
| |
| Date: | February 19, 2010 |
Pursuant to the requirements of the Securities Exchange Act of 1934 and the Investment Company Act of 1940, this Report has been signed below by the following persons on behalf of the Registrant and in the capacities and on the dates indicated.
| |
| By: | /s/ Bradley J. Skapyak |
| | Bradley J. Skapyak, |
| | President |
| |
| Date: | February 19, 2010 |
| |
| By: | /s/ James Windels |
| James Windels, |
| | Treasurer |
| |
| Date: | February 19, 2010 |
EXHIBIT INDEX
(a)(1) Code of ethics referred to in Item 2.
(a)(2) Certifications of principal executive and principal financial officers as required by Rule 30a-2(a) under the Investment Company Act of 1940. (EX-99.CERT)
(b) Certification of principal executive and principal financial officers as required by Rule 30a-2(b) under the Investment Company Act of 1940. (EX-99.906CERT)