UNITED STATES
SECURITIES AND EXCHANGE COMMISSION
Washington, D.C. 20549
FORM N-CSR
CERTIFIED SHAREHOLDER REPORT OF REGISTERED MANAGEMENT
INVESTMENT COMPANIES
Investment Company Act file number | 811- 524 |
| |
| The Dreyfus/Laurel Funds Trust | |
| (Exact name of Registrant as specified in charter) | |
| | |
| c/o The Dreyfus Corporation 200 Park Avenue New York, New York 10166 | |
| (Address of principal executive offices) (Zip code) | |
| | |
| Michael A. Rosenberg, Esq. 200 Park Avenue New York, New York 10166 | |
| (Name and address of agent for service) | |
|
Registrant's telephone number, including area code: | (212) 922-6000 |
| |
Date of fiscal year end: | 05/31 | |
Date of reporting period: | 05/31/2011 | |
| | | | | | | |
The following N-CSR relates only to Dreyfus Equity Income Fund and Dreyfus Emerging Markets Debt Local Currency Fund and does not affect the other series of the Registrant, which have different fiscal year ends and, therefore, different N-CSR reporting requirements. Separate N-CSR Forms will be filed for these series, as appropriate.
FORM N-CSR
Item 1. Reports to Stockholders.
Save time. Save paper. View your next shareholder report online as soon as it’s available. Log into www.dreyfus.com and sign up for Dreyfus eCommunications. It’s simple and only takes a few minutes.
The views expressed in this report reflect those of the portfolio manager only through the end of the period covered and do not necessarily represent the views of Dreyfus or any other person in the Dreyfus organization. Any such views are subject to change at any time based upon market or other conditions and Dreyfus disclaims any responsibility to update such views.These views may not be relied on as investment advice and, because investment decisions for a Dreyfus fund are based on numerous factors, may not be relied on as an indication of trading intent on behalf of any Dreyfus fund.
Not FDIC-Insured • Not Bank-Guaranteed • May Lose Value
| | Contents |
| | THE FUND |
| 2 | A Letter from the Chairman and CEO |
| 3 | Discussion of Fund Performance |
| 6 | Fund Performance |
| 8 | Understanding Your Fund’s Expenses |
| 8 | Comparing Your Fund’s Expenses With Those of Other Funds |
| 9 | Statement of Investments |
| 14 | Statement of Assets and Liabilities |
| 15 | Statement of Operations |
| 16 | Statement of Changes in Net Assets |
| 18 | Financial Highlights |
| 21 | Notes to Financial Statements |
| 37 | Report of Independent Registered Public Accounting Firm |
| 38 | Important Tax Information |
| 39 | Information About the Renewal of the Fund’s Management Agreement |
| 44 | Board Members Information |
| 46 | Officers of the Fund |
| | FOR MORE INFORMATION |
| | Back Cover |
Dreyfus
Emerging Markets Debt
Local Currency Fund
The Fund

A LETTER FROM THE CHAIRMAN AND CEO
Dear Shareholder:
We are pleased to present this annual report for Dreyfus Emerging Market Debt Local Currency Fund, covering the 12-month period from June 1, 2010, through May 31, 2011. For information about how the fund performed during the reporting period, as well as general market perspectives, we provide a Discussion of Fund Performance on the pages that follow.
The U.S. economy appears to have hit a soft patch in the spring of 2011 after accelerating over the second half of 2010. Disappointing labor, housing and manufacturing data have come at a time of higher energy prices and some tightening of monetary policy in global markets. In our view, the current slowdown should be relatively brief as the world recovers from the supply shocks created by weather impacts on food production, the decline in Libyan oil exports and supply-chain disruptions stemming from Japan’s natural and nuclear disasters. The municipal bond market produced mildly positive total returns, on average, in this choppy economic environment. Although municipal bonds were undermined over much of the reporting period as credit concerns intensified and supply-and-demand dynamics changed, bond prices rebounded in the spring when investors delayed their expectations of rising short-term interest rates.
We remain optimistic as the U.S. economy moves through the middle stages of its cycle. Indeed, global macroeconomic policy generally has remained stimulative despite the recent efforts of some central banks to forestall inflationary pressures. We continue to expect sustainable economic growth, a rising but volatile uptrend in inflation and an improving U.S. labor market in the months ahead.As always, to determine how these forces may affect your investments, we urge you to talk regularly with your financial advisor.
Thank you for your continued confidence and support.

Jonathan R. Baum
Chairman and Chief Executive Officer
The Dreyfus Corporation
June 15, 2011
2

DISCUSSION OF FUND PERFORMANCE
For the period of June 1, 2010, through May 31, 2011, as provided by Alexander Kozhemiakin and Javier Murcio, Primary Portfolio Managers
Fund and Market Performance Overview
For the 12-month period ended May 31, 2011, Dreyfus Emerging Markets Debt Local Currency Fund’s Class A shares produced a total return of 17.21%, Class C shares returned 16.28% and Class I shares returned 17.45%.1 In comparison, the fund’s benchmark, the JPMorgan Government Bond Index — Emerging Markets Diversified (the “Index”), produced a 19.17% total return for the same period.2
Currencies in the world’s emerging markets fared well over the reporting period as investment capital continued to flow into fast-growing nations in Asia and Latin America. The fund’s returns mildly lagged that of its benchmark, primarily due to the dampening effect of cash awaiting investment in a rallying market.
The Fund’s Investment Approach
The fund seeks to maximize total return.To pursue its goal, the fund normally invests at least 80% of its assets in emerging market bonds and other debt instruments denominated in the local currency of issue, and in derivative instruments that provide investment exposure to such securities.
When choosing investments, we employ in-depth fundamental country analysis supported by the discipline of quantitative valuation models. A “top down” analysis of macroeconomics and financial and political variables guides country and currency allocations.We also consider technical market factors and the global risk environment.We seek to identify shifts in country fundamentals and consider the risk-adjusted attractiveness of currency and duration returns for each emerging market country.
Currencies in Fast-Growing Emerging Markets Gained Value
The reporting period began on a relatively pessimistic note in the developed world because of the sovereign debt crisis in Europe and persistently high unemployment in the United States. As a result, the
DISCUSSION OF FUND PERFORMANCE (continued)
U.S. dollar generally lost value relative to other currencies. By the fall, however, better-than-expected economic data in Europe and a second round of quantitative easing of U.S. monetary policy convinced investors that a double-dip recession was unlikely.The U.S. dollar reversed course, strengthening against most currencies over the final months of 2010.
The economic outlook became murkier in February, when political unrest in the Middle East sent energy prices sharply higher. In March, a devastating earthquake, tsunami and nuclear disaster in Japan threatened the economies of nations whose industries rely on parts and materials from Japanese manufacturers. Indeed, disappointing U.S. GDP growth during the first quarter of the year lent credence to these worries, and the U.S. dollar resumed its downward trend compared to most currencies, including those from the emerging markets.
Currencies Drove the Fund’s Performance
In this environment, the fund’s currency positions proved to be a more significant driver of fund performance than its bond holdings. The beneficial effects of this trend were magnified by the fund’s overweighted exposure to currencies.The fund successfully employed forward contracts to establish its currency positions.
The fund benefited from its currency selection strategy, in which we favored countries such as Mexico, Russia, Poland and Colombia. The Mexican peso ranked among the fund’s top performers, primarily due to the country’s proximity to a recovering U.S. economy.The Russian ruble rebounded over the second half of 2010 from earlier weakness as investors recognized the oil-producing nation’s sound economic fundamentals. Asian currencies, such as the Malaysian ringgit, were supported by the strengthening of the Chinese renminbi that began in July 2010. On the other hand, underweight exposure to the South African rand undermined the fund’s relative results when the currency appreciated along with gold prices. Underweights in the Hungarian forint and the Thai baht also detracted from performance.
Returns from emerging market sovereign bonds were hindered by inflation fears as food and energy prices surged higher. Although the fund’s generally underweighted exposure to bonds helped bolster the fund’s relative performance, even a reduced position had a dampening effect on absolute returns.
4
Adjusting to a Changing Global Economy
Economies in the United States and other developed nations appear to have hit a soft patch as of the reporting period’s end, and investors have refocused on emerging markets with higher growth rates. In our judgment, conditions currently seem ripe for further gains in emerging market currencies against the U.S. dollar.The fund ended the reporting period with exposure to a diversified portfolio of local currency-denominated bonds represented in the benchmark and selected out of benchmark positions such as the Korean won. We closed out our exposure to Egypt due to ongoing political turmoil.
If inflation concerns decline in the emerging markets as we expect, we may see opportunities to purchase bonds at attractive valuations.
June 15, 2011
| |
| | Bond funds are subject generally to interest rate, credit, liquidity and market risks, to varying |
| | degrees, all of which are more fully described in the fund’s prospectus. Generally, all other factors |
| | being equal, bond prices are inversely related to interest-rate changes, and rate increases can cause |
| | price declines. |
| | Foreign bonds are subject to special risks including exposure to currency fluctuations, changing |
| | political and economic conditions, and potentially less liquidity. Investments in foreign currencies are |
| | subject to the risk that those currencies will decline in value relative to the U.S. dollar. Foreign |
| | currencies are also subject to risks caused by inflation, interest rates, budget deficits and low savings |
| | rate, political factors and government control.The fixed income securities of issuers located in emerging |
| | markets can be more volatile and less liquid than those of issuers in more mature economies. |
| | The fund may use derivative instruments, such as options, futures and options on futures, forward |
| | contracts, swaps (including credit default swaps on corporate bonds and asset-backed securities), |
| | options on swaps and other credit derivatives.A small investment in derivatives could have a |
| | potentially large impact on the fund’s performance. |
| 1 | Total return includes reinvestment of dividends and any capital gains paid, and does not take into |
| | consideration the maximum initial sales charges in the case of Class A shares, or the applicable |
| | contingent deferred sales charges imposed on redemptions in the case of Class C shares. Had these |
| | charges been reflected, returns would have been lower. Past performance is no guarantee of future |
| | results. Share price and investment return fluctuate such that upon redemption, fund shares may be |
| | worth more or less than their original cost. Return figures provided reflect the absorption of certain |
| | fund expenses by The Dreyfus Corporation pursuant to an undertaking in effect through October |
| | 1, 2011, at which time it may be extended, terminated or modified. Had these expenses not been |
| | absorbed, the fund’s returns would have been lower. |
| 2 | Source: FactSet. — The JPMorgan Government Bond Index—Emerging Markets Diversified is a |
| | comprehensive global local emerging markets index, and consists of regularly traded, liquid fixed- |
| | rate, domestic currency government bonds.The Index does not include fund fees and expenses to |
| | which the fund is subject. Investors cannot invest directly in any index. |
FUND PERFORMANCE
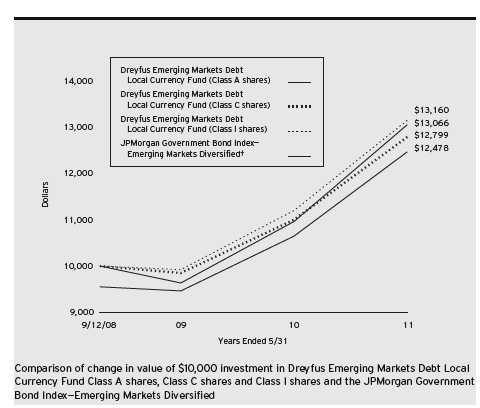
† Source: FactSet
Past performance is not predictive of future performance.
The above graph compares a $10,000 investment made in Class A, Class C and Class I shares of Dreyfus Emerging Markets Debt Local Currency Fund on 9/12/08 (inception date) to a $10,000 investment made in the JPMorgan Government Bond Index-Emerging Markets Diversified (the “Index”) on that date.All dividends and capital gain distributions are reinvested.
The fund’s performance shown in the line graph above takes into account the maximum initial sales charge on Class A shares and all other applicable fees and expenses on all classes.The Index is a comprehensive global local emerging markets index, and consists of regularly traded, liquid fixed-rate, domestic currency government bonds. Unlike a mutual fund, the Index is not subject to charges, fees and other expenses. Investors cannot invest directly in any index. Further information relating to fund performance, including expense reimbursements, if applicable, is contained in the Financial Highlights section of the prospectus and elsewhere in this report.
6
| | | |
| Average Annual Total Returns as of 5/31/11 | | | |
| |
| | Inception | | From |
| | Date | 1 Year | Inception |
| Class A shares | | | |
| with maximum sales charge (4.5%) | 9/12/08 | 11.94% | 8.48% |
| without sales charge | 9/12/08 | 17.21% | 10.34% |
| Class C shares | | | |
| with applicable redemption charge † | 9/12/08 | 15.28% | 9.50% |
| without redemption | 9/12/08 | 16.28% | 9.50% |
| Class I shares | 9/12/08 | 17.45% | 10.62% |
| JPMorgan Government Bond Index— | | | |
| Emerging Markets Diversified | 8/31/08 | 19.17% | 10.22%†† |
| |
| Past performance is not predictive of future performance.The fund’s performance shown in the graph and table does not |
| reflect the deduction of taxes that a shareholder would pay on fund distributions or the redemption of fund shares. |
| † | The maximum contingent deferred sales charge for Class C shares is 1% for shares redeemed within one year of the |
| | date of purchase. |
| †† | For comparative purposes, the value of the Index as of 8/31/08 is used as the beginning value on 9/12/08. |
UNDERSTANDING YOUR FUND’S EXPENSES (Unaudited)
As a mutual fund investor, you pay ongoing expenses, such as management fees and other expenses. Using the information below, you can estimate how these expenses affect your investment and compare them with the expenses of other funds.You also may pay one-time transaction expenses, including sales charges (loads) and redemption fees, which are not shown in this section and would have resulted in higher total expenses. For more information, see your fund’s prospectus or talk to your financial adviser.
Review your fund’s expenses
The table below shows the expenses you would have paid on a $1,000 investment in Dreyfus Emerging Markets Debt Local Currency Fund from December 1, 2010 to May 31, 2011. It also shows how much a $1,000 investment would be worth at the close of the period, assuming actual returns and expenses.
| | | |
| Expenses and Value of a $1,000 Investment | | |
| assuming actual returns for the six months ended May 31, 2011 | | |
| | Class A | Class C | Class I |
| Expenses paid per $1,000† | $ 6.36 | $ 10.20 | $ 4.90 |
| Ending value (after expenses) | $1,091.20 | $1,086.70 | $1,092.00 |
|
| COMPARING YOUR FUND’S EXPENSES |
| WITH THOSE OF OTHER FUNDS (Unaudited) |
Using the SEC’s method to compare expenses
The Securities and Exchange Commission (SEC) has established guidelines to help investors assess fund expenses. Per these guidelines, the table below shows your fund’s expenses based on a $1,000 investment, assuming a hypothetical 5% annualized return. You can use this information to compare the ongoing expenses (but not transaction expenses or total cost) of investing in the fund with those of other funds.All mutual fund shareholder reports will provide this information to help you make this comparison. Please note that you cannot use this information to estimate your actual ending account balance and expenses paid during the period.
| | | |
| Expenses and Value of a $1,000 Investment | | |
| assuming a hypothetical 5% annualized return for the six months ended May 31, 2011 |
| | Class A | Class C | Class I |
| Expenses paid per $1,000† | $ 6.14 | $ 9.85 | $ 4.73 |
| Ending value (after expenses) | $1,018.85 | $1,015.16 | $1,020.24 |
Expenses are equal to the fund’s annualized expense ratio of 1.22% for Class A, 1.96% for Class C and .94% for Class I, multiplied by the average account value over the period, multiplied by 182/365 (to reflect the one-half year period).
8
|
| STATEMENT OF INVESTMENTS |
| May 31, 2011 |
| | | | | | |
| | | Coupon | Maturity | Principal | | |
| Bonds and Notes—78.2% | | Rate (%) | Date | Amount ($)a | Value ($) |
| Foreign/Governmental | | | | | | |
| Brazil Notas do | | | | | | |
| Tesouro Nacional, | | | | | | |
| Notes, Ser. B | BRL | 6.00 | 5/15/45 | 2,240,000 | b | 3,018,544 |
| Brazil Notas do | | | | | | |
| Tesouro Nacional, | | | | | | |
| Notes, Ser. F | BRL | 10.00 | 1/1/17 | 72,650,000 | | 43,540,039 |
| Brazil Notas do | | | | | | |
| Tesouro Nacional, | | | | | | |
| Notes, Ser. F | BRL | 10.00 | 1/1/21 | 60,630,000 | | 35,018,182 |
| Brazilian Government, | | | | | | |
| Sr. Unscd. Bonds | BRL | 10.25 | 1/10/28 | 38,250,000 | | 26,243,464 |
| Chilean Government, | | | | | | |
| Sr. Unscd. Notes | CLP | 5.50 | 8/5/20 | 5,786,000,000 | | 12,492,333 |
| Colombian Government, | | | | | | |
| Bonds, Ser. B | COP | 7.25 | 6/15/16 | 10,099,918,100 | c,d | 5,621,355 |
| Colombian Government, | | | | | | |
| Bonds, Ser. B | COP | 7.25 | 6/15/16 | 150,346,558,854 | | 83,679,028 |
| Colombian Government, | | | | | | |
| Bonds, Ser. B | COP | 11.00 | 7/24/20 | 23,945,097,666 | c,d | 15,856,592 |
| Colombian Government, | | | | | | |
| Bonds, Ser. B | COP | 11.00 | 7/24/20 | 34,168,901,167 | | 22,626,859 |
| Colombian Government, | | | | | | |
| Bonds, Ser. B | COP | 11.25 | 10/24/18 | 1,489,838,823 | | 981,568 |
| Colombian Government, | | | | | | |
| Sr. Unscd. Notes | COP | 12.00 | 10/22/15 | 20,200,000,000 | | 14,680,832 |
| Hungarian Government, | | | | | | |
| Bonds, Ser. 23/A | HUF | 6.00 | 11/24/23 | 3,662,000,000 | | 17,810,903 |
| Hungarian Government, | | | | | | |
| Bonds, Ser. 19/A | HUF | 6.50 | 6/24/19 | 9,625,840,000 | | 49,969,235 |
| Hungarian Government, | | | | | | |
| Bonds, Ser. 17/B | HUF | 6.75 | 2/24/17 | 6,343,950,000 | | 33,745,054 |
| Hungarian Government, | | | | | | |
| Bonds, Ser. 20/A | HUF | 7.50 | 11/12/20 | 1,900,000,000 | | 10,503,928 |
| Malaysian Government, | | | | | | |
| Sr. Unscd. Bonds, | | | | | | |
| Ser. 0509 | MYR | 3.21 | 5/31/13 | 76,800,000 | | 25,507,677 |
STATEMENT OF INVESTMENTS (continued)
| | | | | |
| | | Coupon | Maturity | Principal | |
| Bonds and Notes (continued) | Rate (%) | Date | Amount ($)a | Value ($) |
| Foreign/ | | | | | |
| Governmental (continued) | | | | | |
| Malaysian Government, | | | | | |
| Bonds, Ser. 0211 | MYR | 3.43 | 8/15/14 | 25,225,000 | 8,398,530 |
| Malaysian Government, | | | | | |
| Sr. Unscd. Bonds, | | | | | |
| Ser. 0110 | MYR | 3.84 | 8/12/15 | 96,170,000 | 32,430,070 |
| Malaysian Government, | | | | | |
| Sr. Unscd. Bonds, | | | | | |
| Ser. 2/03 | MYR | 4.24 | 2/7/18 | 1,820,000 | 620,146 |
| Malaysian Government, | | | | | |
| Sr. Unscd. Bonds, | | | | | |
| Ser. 0902 | MYR | 4.38 | 11/29/19 | 142,520,000 | 48,897,923 |
| Mexican Bonos, | | | | | |
| Bonds, Ser. M | MXN | 8.00 | 6/11/20 | 375,000,000 | 35,180,178 |
| Mexican Bonos, | | | | | |
| Bonds, Ser. M 20 | MXN | 8.50 | 5/31/29 | 78,000,000 | 7,397,711 |
| Mexican Bonos, | | | | | |
| Bonds, Ser. M 30 | MXN | 8.50 | 11/18/38 | 112,600,000 | 10,476,486 |
| Mexican Bonos, | | | | | |
| Bonds, Ser. M 20 | MXN | 10.00 | 12/5/24 | 422,360,000 | 45,820,834 |
| Mexican Bonos, | | | | | |
| Bonds, Ser. M 30 | MXN | 10.00 | 11/20/36 | 133,655,000 | 14,377,337 |
| Peruvian Government, | | | | | |
| Bonds | PEN | 6.90 | 8/12/37 | 58,120,000 | 19,892,499 |
| Peruvian Government, | | | | | |
| Bonds | PEN | 6.95 | 8/12/31 | 68,225,000 | 23,760,151 |
| Peruvian Government, | | | | | |
| Bonds | PEN | 7.84 | 8/12/20 | 65,150,000 | 25,519,916 |
| Peruvian Government, | | | | | |
| Bonds | PEN | 8.20 | 8/12/26 | 231,780,000 | 93,104,862 |
| Peruvian Government, | | | | | |
| Bonds, Ser. 7 | PEN | 8.60 | 8/12/17 | 6,550,000 | 2,661,239 |
| Philippine Government, | | | | | |
| Sr. Unscd. Notes | PHP | 4.95 | 1/15/21 | 2,692,000,000 | 63,174,071 |
| Philippine Government, | | | | | |
| Sr. Unscd. Bonds | PHP | 6.25 | 1/14/36 | 177,000,000 | 3,978,089 |
10
| | | | | | |
| | | Coupon | Maturity | Principal | | |
| Bonds and Notes (continued) | Rate (%) | Date | Amount ($)a | Value ($) |
| Foreign/ | | | | | | |
| Governmental (continued) | | | | | | |
| Polish Government, | | | | | | |
| Bonds, Ser. 1017 | PLN | 5.25 | 10/25/17 | 122,675,000 | | 43,704,958 |
| Polish Government, | | | | | | |
| Bonds, Ser. 0922 | PLN | 5.75 | 9/23/22 | 191,590,000 | | 68,027,858 |
| Russian Government, | | | | | | |
| Bonds, Ser. 5072 | RUB | 7.15 | 1/23/13 | 2,761,000,000 | c,d | 101,087,122 |
| Russian Government, | | | | | | |
| Bonds, Ser. 5072 | RUB | 7.15 | 1/23/13 | 3,060,491,000 | | 112,052,237 |
| Russian Government, | | | | | | |
| Sr. Unscd. Bonds | RUB | 7.85 | 3/10/18 | 990,000,000 | | 37,292,151 |
| Russian Government, | | | | | | |
| Bonds, Ser. 5067 | RUB | 11.30 | 10/17/12 | 1,058,259,756 | c,d | 40,969,946 |
| South African Government, | | | | | | |
| Bonds, Ser. R207 | ZAR | 7.25 | 1/15/20 | 88,205,000 | | 12,186,429 |
| South African Government, | | | | | | |
| Bonds, Ser. R206 | ZAR | 7.50 | 1/15/14 | 22,915,000 | | 3,419,567 |
| South African Government, | | | | | | |
| Bonds, Ser. R204 | ZAR | 8.00 | 12/21/18 | 508,435,000 | | 74,407,841 |
| South African Government, | | | | | | |
| Bonds, Ser. R203 | ZAR | 8.25 | 9/15/17 | 734,630,000 | | 109,147,679 |
| South African Government, | | | | | | |
| Sr. Unscd. Bonds, | | | | | | |
| Ser. R201 | ZAR | 8.75 | 12/21/14 | 450,000 | | 69,400 |
| South African Government, | | | | | | |
| Bonds, Ser. R186 | ZAR | 10.50 | 12/21/26 | 384,350,000 | | 66,058,525 |
| South African | | | | | | |
| Government, Bonds, | | | | | | |
| Ser. R157 | ZAR | 13.50 | 9/15/15 | 76,470,000 | | 13,686,843 |
| Thai Government, | | | | | | |
| Sr. Unscd. Bonds | THB | 3.63 | 5/22/15 | 859,480,000 | | 28,532,807 |
| Thai Government, | | | | | | |
| Sr. Unscd. Bonds | THB | 3.65 | 12/17/21 | 911,900,000 | | 29,817,294 |
| Thai Government, | | | | | | |
| Sr. Unscd. Bonds | THB | 3.88 | 6/13/19 | 1,143,430,000 | | 38,622,914 |
STATEMENT OF INVESTMENTS (continued)
| | | | | | |
| | | Coupon | Maturity | Principal | | |
| Bonds and Notes (continued) | Rate (%) | Date | Amount ($)a | Value ($) |
| Foreign/ | | | | | | |
| Governmental (continued) | | | | | | |
| Thai Government, | | | | | | |
| Sr. Unscd. Bonds | THB | 5.13 | 3/13/18 | 40,330,000 | | 1,451,019 |
| Turkish Government, | | | | | | |
| Bonds | TRY | 0.00 | 8/3/11 | 12,050,000 | e | 7,450,342 |
| Turkish Government, | | | | | | |
| Bonds | TRY | 0.00 | 1/25/12 | 19,250,000 | e | 11,443,977 |
| Turkish Government, | | | | | | |
| Bonds | TRY | 0.00 | 8/8/12 | 100,080,000 | e | 56,887,480 |
| Turkish Government, | | | | | | |
| Bonds | TRY | 0.00 | 11/7/12 | 8,600,000 | e | 4,758,115 |
| Turkish Government, | | | | | | |
| Bonds | TRY | 8.00 | 1/29/14 | 47,950,000 | | 29,398,838 |
| Turkish Government, | | | | | | |
| Bonds, Ser. CPI | TRY | 10.00 | 2/15/12 | 13,580,000 | f | 12,421,391 |
| Turkish Government, | | | | | | |
| Bonds | TRY | 10.00 | 4/10/13 | 45,000,000 | | 28,802,594 |
| Turkish Government, | | | | | | |
| Bonds | TRY | 10.00 | 6/17/15 | 13,900,000 | | 8,956,549 |
| Turkish Government, | | | | | | |
| Bonds | TRY | 10.50 | 1/15/20 | 355,000 | | 239,677 |
| Turkish Government, | | | | | | |
| Bonds | TRY | 11.00 | 8/6/14 | 55,980,000 | | 37,005,483 |
| Turkish Government, | | | | | | |
| Bonds | TRY | 14.00 | 9/26/12 | 87,655,000 | | 58,520,883 |
| Turkish Government, | | | | | | |
| Bonds | TRY | 16.00 | 8/28/13 | 5,500,000 | | 3,935,587 |
| Total Bonds and Notes | | | | | | |
| (cost $1,799,214,940) | | | | | | 1,877,341,141 |
| |
| | | | | Principal | | |
| Short-Term Investments—.1% | | | Amount ($) | | Value ($) |
| U.S. Treasury Bills: | | | | | | |
| 0.11%, 6/9/11 | | | | 2,392,000 | | 2,391,995 |
| 0.07%, 11/17/11 | | | | 619,000 | g | 618,785 |
| Total Short-Term Investments | | | | | |
| (cost $3,010,726) | | | | | | 3,010,780 |
12
| | |
| Other Investment—11.3% | Shares | Value ($) |
| Registered Investment Company; | | |
| Dreyfus Institutional Preferred Plus Money Market Fund | | |
| (cost $270,257,000) | 270,257,000 h | 270,257,000 |
| |
| Total Investments (cost $2,072,482,666) | 89.6% | 2,150,608,921 |
| Cash and Receivables (Net) | 10.4% | 248,700,493 |
| Net Assets | 100.0% | 2,399,309,414 |
| a | Principal amount stated in U.S. Dollars unless otherwise noted. BRL—Brazilian Real CLP—Chilean Peso COP—Colombian Peso HUF—Hungarian Forint MXN—Mexican New Peso MYR—Malaysian Ringgit PEN—Peruvian New Sol PHP—Philippines Peso PLN—Polish Zloty RUB—Russian Ruble THB—Thai Baht TRY—Turkish Lira ZAR—South African Rand |
| b | Principal amount for accrual purposes is periodically adjusted based on changes in the Brazilian Consumer Price Index. |
| c | Securities exempt from registration under Rule 144A of the Securities Act of 1933.These securities may be resold in transactions exempt from registration, normally to qualified institutional buyers.At May 31, 2011, these securities were valued at $163,535,015 or 6.8% of net assets. |
| d | Credit Linked Notes. |
| e | Security issued with a zero coupon. Income is recognized through the accretion of discount. |
| f | Principal amount for accrual purposes is periodically adjusted based on changes in the Turkish Consumer Price Index. |
| g | Held by a broker as collateral for open forward foreign currency exchange contracts positions. |
| h | Investment in affiliated money market mutual fund. |
| | | |
| Portfolio Summary (Unaudited)† | | |
| |
| | Value (%) | | Value (%) |
| Russia | 12.2 | Hungary | 4.7 |
| South Africa | 11.6 | Mexico | 4.7 |
| Short-Term/ | | Poland | 4.7 |
| Money Market Investments | 11.4 | Brazil | 4.5 |
| Turkey | 10.8 | Thailand | 4.0 |
| Peru | 6.9 | Philippines | 2.8 |
| Columbia | 6.0 | Chile | .5 |
| Malaysia | 4.8 | | 89.6 |
| |
| † Based on net assets. | | | |
| See notes to financial statements. | | | |
|
| STATEMENT OF ASSETS AND LIABILITIES |
| May 31, 2011 |
| | | |
| | | Cost | Value |
| Assets ($): | | | |
| Investments in securities—See Statement of Investments: | | |
| Unaffiliated issuers | | 1,802,225,666 | 1,880,351,921 |
| Affiliated issuers | | 270,257,000 | 270,257,000 |
| Cash | | | 7,863,308 |
| Cash denominated in foreign currencies | | 2,353,492 | 2,367,700 |
| Receivable for investment securities sold | | | 212,765,366 |
| Dividends and interest receivable | | | 49,809,846 |
| Unrealized appreciation on forward foreign | | | |
| currency exchange contracts—Note 4 | | | 8,451,284 |
| Receivable for shares of Beneficial Interest subscribed | | 7,814,264 |
| Prepaid expenses | | | 34,408 |
| | | | 2,439,715,097 |
| Liabilities ($): | | | |
| Due to The Dreyfus Corporation and affiliates—Note 3(d) | | 2,253,032 |
| Payable for investment securities purchased | | | 33,399,108 |
| Unrealized depreciation on forward foreign | | | |
| currency exchange contracts—Note 4 | | | 3,613,857 |
| Payable for shares of Beneficial Interest redeemed | | | 778,950 |
| Accrued expenses | | | 360,736 |
| | | | 40,405,683 |
| Net Assets ($) | | | 2,399,309,414 |
| Composition of Net Assets ($): | | | |
| Paid-in capital | | | 2,272,050,952 |
| Accumulated undistributed investment income—net | | | 27,170,255 |
| Accumulated net realized gain (loss) on investments | | | 13,889,269 |
| Accumulated net unrealized appreciation (depreciation) | | |
| on investments and foreign currency transactions | | | 86,198,938 |
| Net Assets ($) | | | 2,399,309,414 |
| |
| |
| Net Asset Value Per Share | | | |
| | Class A | Class C | Class I |
| Net Assets ($) | 79,957,061 | 14,952,529 | 2,304,399,824 |
| Shares Outstanding | 5,253,338 | 992,667 | 151,103,764 |
| Net Asset Value Per Share ($) | 15.22 | 15.06 | 15.25 |
| |
| See notes to financial statements. | | | |
14
|
| STATEMENT OF OPERATIONS |
| Year Ended May 31, 2011 |
| |
| Investment Income ($): | |
| Income: | |
| Interest (net of $227,757 foreign taxes withheld at source) | 78,714,215 |
| Dividends; | |
| Affiliated issuers | 262,724 |
| Total Income | 78,976,939 |
| Expenses: | |
| Management fee—Note 3(a) | 10,389,843 |
| Custodian fees—Note 3(d) | 1,540,538 |
| Shareholder servicing costs—Note 3(d) | 1,120,395 |
| Registration fees | 264,253 |
| Prospectus and shareholders’ reports | 130,998 |
| Professional fees | 78,731 |
| Distribution fees—Note 3(c) | 54,217 |
| Trustees’ fees and expenses—Note 3(b) | 29,535 |
| Loan commitment fees—Note 2 | 11,146 |
| Miscellaneous | 56,856 |
| Total Expenses | 13,676,512 |
| Less—reduction in fees due to earnings credits—Note 3(d) | (3,919) |
| Net Expenses | 13,672,593 |
| Investment Income—Net | 65,304,346 |
| Realized and Unrealized Gain (Loss) on Investments—Note 4 ($): | |
| Net realized gain (loss) on investments and foreign currency transactions | 10,234,931 |
| Net realized gain (loss) on forward foreign currency exchange contracts | 10,791,816 |
| Net Realized Gain (Loss) | 21,026,747 |
| Net unrealized appreciation (depreciation) | |
| on investments and foreign currency transactions | 97,525,049 |
| Net unrealized appreciation (depreciation) | |
| on forward foreign currency exchange contracts | 4,968,688 |
| Net Unrealized Appreciation (Depreciation) | 102,493,737 |
| Net Realized and Unrealized Gain (Loss) on Investments | 123,520,484 |
| Net Increase in Net Assets Resulting from Operations | 188,824,830 |
| |
| See notes to financial statements. | |
STATEMENT OF CHANGES IN NET ASSETS
| | |
| | | Year Ended May 31, |
| | 2011 | 2010 |
| Operations ($): | | |
| Investment income—net | 65,304,346 | 4,452,428 |
| Net realized gain (loss) on investments | 21,026,747 | (4,604,617) |
| Net unrealized appreciation | | |
| (depreciation) on investments | 102,493,737 | (16,847,584) |
| Net Increase (Decrease) in Net Assets | | |
| Resulting from Operations | 188,824,830 | (16,999,773) |
| Dividends to Shareholders from ($): | | |
| Investment income—net: | | |
| Class A Shares | (1,330,289) | (278,459) |
| Class C Shares | (152,008) | (12,675) |
| Class I Shares | (34,730,559) | (132,034) |
| Net realized gain on investments: | | |
| Class A Shares | (245,632) | (91,530) |
| Class C Shares | (41,422) | (4,964) |
| Class I Shares | (6,706,804) | (225,836) |
| Total Dividends | (43,206,714) | (745,498) |
| Beneficial Interest Transactions ($): | | |
| Net proceeds from shares sold: | | |
| Class A Shares | 77,780,953 | 20,977,020 |
| Class C Shares | 15,201,455 | 900,960 |
| Class I Shares | 1,731,784,392 | 581,558,353 |
| Dividends reinvested: | | |
| Class A Shares | 1,146,179 | 27,698 |
| Class C Shares | 98,678 | 1,483 |
| Class I Shares | 7,241,861 | 230,087 |
| Cost of shares redeemed: | | |
| Class A Shares | (44,527,876) | (1,360,537) |
| Class C Shares | (2,824,705) | (68,903) |
| Class I Shares | (133,926,209) | (2,208,855) |
| Increase (Decrease) in Net Assets from | | |
| Beneficial Interest Transactions | 1,651,974,728 | 600,057,306 |
| Total Increase (Decrease) in Net Assets | 1,797,592,844 | 582,312,035 |
| Net Assets ($): | | |
| Beginning of Period | 601,716,570 | 19,404,535 |
| End of Period | 2,399,309,414 | 601,716,570 |
| Undistributed investment income—net | 27,170,255 | 841,614 |
16
| | |
| | | Year Ended May 31, |
| | 2011 | 2010 |
| Capital Share Transactions: | | |
| Class A | | |
| Shares sold | 5,321,897 | 1,527,767 |
| Shares issued for dividends reinvested | 80,495 | 2,125 |
| Shares redeemed | (3,019,481) | (101,763) |
| Net Increase (Decrease) in Shares Outstanding | 2,382,911 | 1,428,129 |
| Class C | | |
| Shares sold | 1,039,756 | 67,112 |
| Shares issued for dividends reinvested | 6,970 | 116 |
| Shares redeemed | (196,156) | (5,131) |
| Net Increase (Decrease) in Shares Outstanding | 850,570 | 62,097 |
| Class I | | |
| Shares sold | 117,919,000 | 41,892,247 |
| Shares issued for dividends reinvested | 508,308 | 17,345 |
| Shares redeemed | (9,149,244) | (163,892) |
| Net Increase (Decrease) in Shares Outstanding | 109,278,064 | 41,745,700 |
| |
| See notes to financial statements. | | |
FINANCIAL HIGHLIGHTS
The following tables describe the performance for each share class for the fiscal periods indicated.All information (except portfolio turnover rate) reflects financial results for a single fund share.Total return shows how much your investment in the fund would have increased (or decreased) during each period, assuming you had reinvested all dividends and distributions.These figures have been derived from the fund’s financial statements.
| | | |
| | | Year Ended May 31, |
| Class A Shares | 2011 | 2010 | 2009a |
| Per Share Data ($): | | | |
| Net asset value, beginning of period | 13.39 | 12.11 | 12.50 |
| Investment Operations: | | | |
| Investment income—netb | .65 | .55 | .45 |
| Net realized and unrealized | | | |
| gain (loss) on investments | 1.61 | .96 | (.59) |
| Total from Investment Operations | 2.26 | 1.51 | (.14) |
| Distributions: | | | |
| Dividends from investment income—net | (.36) | (.18) | (.25) |
| Dividends from net realized gain on investments | (.07) | (.05) | — |
| Total Distributions | (.43) | (.23) | (.25) |
| Net asset value, end of period | 15.22 | 13.39 | 12.11 |
| Total Return (%)c | 17.21 | 12.56 | (.95)d |
| Ratios/Supplemental Data (%): | | | |
| Ratio of total expenses to average net assets | 1.27 | 1.50 | 3.08e |
| Ratio of net expenses to average net assets | 1.27 | 1.32 | 1.35e |
| Ratio of net investment income | | | |
| to average net assets | 4.48 | 4.22 | 5.67e |
| Portfolio Turnover Rate | 97.99 | 74.25 | 108.46d |
| Net Assets, end of period ($ x 1,000) | 79,957 | 38,428 | 17,469 |
| |
| a | From September 12, 2008 (commencement of operations) to May 31, 2009. |
| b | Based on average shares outstanding at each month end. |
| c | Exclusive of sales charge. |
| d | Not annualized. |
| e | Annualized. |
| See notes to financial statements. |
18
| | | |
| | | Year Ended May 31, |
| Class C Shares | 2011 | 2010 | 2009a |
| Per Share Data ($): | | | |
| Net asset value, beginning of period | 13.29 | 12.07 | 12.50 |
| Investment Operations: | | | |
| Investment income—netb | .53 | .46 | .39 |
| Net realized and unrealized | | | |
| gain (loss) on investments | 1.60 | .95 | (.59) |
| Total from Investment Operations | 2.13 | 1.41 | (.20) |
| Distributions: | | | |
| Dividends from investment income—net | (.29) | (.14) | (.23) |
| Dividends from net realized gain on investments | (.07) | (.05) | — |
| Total Distributions | (.36) | (.19) | (.23) |
| Net asset value, end of period | 15.06 | 13.29 | 12.07 |
| Total Return (%)c | 16.28 | 11.73 | (1.49)d |
| Ratios/Supplemental Data (%): | | | |
| Ratio of total expenses to average net assets | 1.99 | 2.27 | 3.84e |
| Ratio of net expenses to average net assets | 1.99 | 2.09 | 2.10e |
| Ratio of net investment income | | | |
| to average net assets | 3.65 | 3.53 | 4.92e |
| Portfolio Turnover Rate | 97.99 | 74.25 | 108.46d |
| Net Assets, end of period ($ x 1,000) | 14,953 | 1,888 | 966 |
| |
| a | From September 12, 2008 (commencement of operations) to May 31, 2009. |
| b | Based on average shares outstanding at each month end. |
| c | Exclusive of sales charge. |
| d | Not annualized. |
| e | Annualized. |
| See notes to financial statements. |
FINANCIAL HIGHLIGHTS (continued)
| | | |
| | | Year Ended May 31, |
| Class I Shares | 2011 | 2010 | 2009a |
| Per Share Data ($): | | | |
| Net asset value, beginning of period | 13.42 | 12.12 | 12.50 |
| Investment Operations: | | | |
| Investment income—netb | .69 | .41 | .47 |
| Net realized and unrealized | | | |
| gain (loss) on investments | 1.62 | 1.14 | (.59) |
| Total from Investment Operations | 2.31 | 1.55 | (.12) |
| Distributions: | | | |
| Dividends from investment income—net | (.41) | (.20) | (.26) |
| Dividends from net realized gain on investments | (.07) | (.05) | — |
| Total Distributions | (.48) | (.25) | (.26) |
| Net asset value, end of period | 15.25 | 13.42 | 12.12 |
| Total Return (%) | 17.45 | 12.94 | (.79)c |
| Ratios/Supplemental Data (%): | | | |
| Ratio of total expenses to average net assets | .97 | 1.02 | 2.84d |
| Ratio of net expenses to average net assets | .97 | 1.01 | 1.10d |
| Ratio of net investment income | | | |
| to average net assets | 4.73 | 3.60 | 5.92d |
| Portfolio Turnover Rate | 97.99 | 74.25 | 108.46c |
| Net Assets, end of period ($ x 1,000) | 2,304,400 | 561,401 | 970 |
| |
| a | From September 12, 2008 (commencement of operations) to May 31, 2009. |
| b | Based on average shares outstanding at each month end. |
| c | Not annualized. |
| d | Annualized. |
| See notes to financial statements. |
20
NOTES TO FINANCIAL STATEMENTS
NOTE 1—Significant Accounting Policies:
Dreyfus Emerging Markets Debt Local Currency Fund (the “fund”) is a separate diversified series of The Dreyfus/Laurel Funds Trust (the “Trust”) which is registered under the Investment Company Act of 1940, as amended (the “Act”), as an open-end management investment company and operates as a series company offering six series, including the fund. The fund’s investment objective is to maximize total return.The Dreyfus Corporation (the “Manager” or “Dreyfus”), a wholly-owned subsidiary of The Bank of New York Mellon Corporation (“BNY Mellon”), serves as the fund’s investment adviser.
MBSC Securities Corporation (the “Distributor”), a wholly-owned subsidiary of the Manager, is the distributor of the fund’s shares. The fund is authorized to issue an unlimited number of shares of Beneficial Interest in each of the following classes of shares: Class A, Class C and Class I. Class A and Class C shares are sold primarily to retail investors through financial intermediaries and bear a distribution fee and/or shareholder services fee. Class A shares are subject to a sales charge imposed at the time of purchase. Class C shares are subject to a contingent deferred sales charge (“CDSC”) imposed on Class C shares redeemed within one year of purchase. Class I shares are sold primarily to bank trust departments and other financial service providers (includingThe Bank of NewYork Mellon, a subsidiary of BNY Mellon and an affiliate of Dreyfus), acting on behalf of customers having a qualified trust or investment account or relationship at such institution, and bear no distribution or shareholder service fees. Class I shares are offered without a front-end sales charge or CDSC. Other differences between the classes include the services offered to and the expenses borne by each class, the allocation of certain transfer agency costs and certain voting rights. Income, expenses (other than expenses attributable to a specific class), and realized and unrealized gains or losses on investments are allocated to each class of shares based on its relative net assets.
NOTES TO FINANCIAL STATEMENTS (continued)
The Trust accounts separately for the assets, liabilities and operations of each series. Expenses directly attributable to each series are charged to that series’ operations; expenses which are applicable to all series are allocated among them on a pro rata basis.
The Financial Accounting Standards Board (“FASB”) Accounting Standards Codification (“ASC”) is the exclusive reference of authoritative U.S. generally accepted accounting principles (“GAAP”) recognized by the FASB to be applied by nongovernmental entities. Rules and interpretive releases of the Securities and Exchange Commission (“SEC”) under authority of federal laws are also sources of authoritative GAAP for SEC registrants. The fund’s financial statements are prepared in accordance with GAAP, which may require the use of management estimates and assumptions.Actual results could differ from those estimates.
(a) Portfolio valuation: Investments in securities excluding short-term investments (other than U.S.Treasury Bills) and forward foreign currency exchange contracts (“forward contracts”) are valued each business day by an independent pricing service (the “Service”) approved by the Board of Trustees. Investments for which quoted bid prices are readily available and are representative of the bid side of the market in the judgment of the Service are valued at the mean between the quoted bid prices (as obtained by the Service from dealers in such securities) and asked prices (as calculated by the Service based upon its evaluation of the market for such securities). Other investments (which constitute a majority of the portfolio securities) are valued as determined by the Service, based on methods which include consideration of: yields or prices of securities of comparable quality, coupon, maturity and type; indications as to values from dealers; and general market conditions. Restricted securities, as well as securities or other assets for
22
which recent market quotations are not readily available and are not valued by a pricing service approved by the Board of Trustees, or are determined by the fund not to reflect accurately fair value, are valued at fair value as determined in good faith under the direction of the Board ofTrustees.The factors that may be considered when fair valuing a security include fundamental analytical data, the nature and duration of restrictions on disposition, an evaluation of the forces that influence the market in which the securities are purchased and sold and public trading in similar securities of the issuer or comparable issuers. Short-term investments of sufficient credit quality, excluding U.S. Treasury Bills, are carried at amortized cost, which approximates value. Registered investment companies that are not traded on an exchange are valued at their net asset value. Investments denominated in foreign currencies are translated to U.S. dollars at the prevailing rates of exchange. Forward contracts are valued at the forward rate.
The fair value of a financial instrument is the amount that would be received to sell an asset or paid to transfer a liability in an orderly transaction between market participants at the measurement date (i.e. the exit price). GAAP establishes a fair value hierarchy that prioritizes the inputs of valuation techniques used to measure fair value.This hierarchy gives the highest priority to unadjusted quoted prices in active markets for identical assets or liabilities (Level 1 measurements) and the lowest priority to unobservable inputs (Level 3 measurements).
Additionally, GAAP provides guidance on determining whether the volume and activity in a market has decreased significantly and whether such a decrease in activity results in transactions that are not orderly. GAAP requires enhanced disclosures around valuation inputs and techniques used during annual and interim periods.
NOTES TO FINANCIAL STATEMENTS (continued)
Various inputs are used in determining the value of the fund’s investments relating to fair value measurements.These inputs are summarized in the three broad levels listed below:
Level 1—unadjusted quoted prices in active markets for identical investments.
Level 2—other significant observable inputs (including quoted prices for similar investments, interest rates, prepayment speeds, credit risk, etc.).
Level 3—significant unobservable inputs (including the fund’s own assumptions in determining the fair value of investments).
The inputs or methodology used for valuing securities are not necessarily an indication of the risk associated with investing in those securities.
The following is a summary of the inputs used as of May 31, 2011 in valuing the fund’s investments:
| | | | |
| | | Level 2—Other | Level 3— | |
| | Level 1— | Significant | Significant | |
| | Unadjusted | Observable | Unobservable | |
| | Quoted Prices | Inputs | Inputs | Total |
| Assets ($) | | | | |
| Investments in Securities: | | | |
| Foreign | | | | |
| Government | — | 1,877,341,141 | — | 1,877,341,141 |
| Mutual Funds | 270,257,000 | — | — | 270,257,000 |
| U.S. Treasury | — | 3,010,780 | — | 3,010,780 |
| Other Financial | | | | |
| Instruments: | | | | |
| Forward Foreign | | | | |
| Currency Exchange | | | |
| Contracts† | — | 8,451,284 | — | 8,451,284 |
| Liabilities ($) | | | | |
| Other Financial | | | | |
| Instruments: | | | | |
| Forward Foreign | | | | |
| Currency Exchange | | | |
| Contracts† | — | (3,613,857) | — | (3,613,857) |
| |
| † Amount shown represents unrealized appreciation (depreciation) at period end. |
24
In January 2010, FASB issued Accounting Standards Update (“ASU”) No. 2010-06 “Improving Disclosures about FairValue Measurements”. The portions of ASU No. 2010-06 which require reporting entities to prepare new disclosures surrounding amounts and reasons for significant transfers in and out of Level 1 and Level 2 fair value measurements as well as inputs and valuation techniques used to measure fair value for both recurring and nonrecurring fair value measurements that fall in either Level 2 or Level 3 have been adopted by the fund. No significant transfers between Level 1 or Level 2 fair value measurements occurred at May 31, 2011.
In May 2011, FASB issued ASU No. 2011-04 “Amendments to Achieve Common Fair Value Measurement and Disclosure Requirements in GAAP and International Financial Reporting Standards (“IFRS”)”. ASU No. 2011-04 includes common requirements for measurement of and disclosure about fair value between GAAP and IFRS. ASU No. 2011-04 will require reporting entities to disclose the following information for fair value measurements categorized within Level 3 of the fair value hierarchy: quantitative information about the unobservable inputs used in the fair value measurement, the valuation processes used by the reporting entity and a narrative description of the sensitivity of the fair value measurement to changes in unobservable inputs and the interrelationships between those unobservable inputs. In addition,ASU No. 2011-04 will require reporting entities to make disclosures about amounts and reasons for all transfers in and out of Level 1 and Level 2 fair value measurements. The new and revised disclosures are effective for interim and annual reporting periods beginning after December 15, 2011. At this time, management is evaluating the implications of ASU No. 2011-04 and its impact on the financial statements.
(b) Foreign currency transactions: The fund does not isolate that portion of the results of operations resulting from changes in foreign exchange rates on investments from the fluctuations arising from changes
NOTES TO FINANCIAL STATEMENTS (continued)
in the market prices of securities held. Such fluctuations are included with the net realized and unrealized gain or loss on investments.
Net realized foreign exchange gains or losses arise from sales of foreign currencies, currency gains or losses realized on securities transactions between trade and settlement date, and the difference between the amounts of dividends, interest and foreign withholding taxes recorded on the fund’s books and the U.S. dollar equivalent of the amounts actually received or paid. Net unrealized foreign exchange gains and losses arise from changes in the value of assets and liabilities other than investments resulting from changes in exchange rates. Foreign currency gains and losses on investments are included with net realized and unrealized gain or loss on investments.
(c) Securities transactions and investment income: Securities transactions are recorded on a trade date basis. Realized gains and losses from securities transactions are recorded on the identified cost basis. Dividend income is recognized on the ex-dividend date and interest income, including, where applicable, accretion of discount and amortization of premium on investments, is recognized on the accrual basis.
Investment in foreign markets may involve special risks and considerations not typically associated with investing in the U.S. These risks include revaluation of currencies, high rates of inflation, repatriation restrictions on income and capital, and adverse political and economic developments. Moreover, securities issued in these markets may be less liquid, subject to government ownership controls and delayed settlements, and their prices may be more volatile than those of comparable securities in the U.S.
(d) Affiliated issuers: Investments in other investment companies advised by Dreyfus are defined as “affiliated” in the Act.
26
The fund may invest in shares of certain affiliated investment companies also advised or managed by Dreyfus. Investments in affiliated investment companies for the period ended May 31, 2011 were as follows:
| | | |
| Affiliated | | | |
| Investment | Value | Value | Net |
| Company | 5/31/2010 ($) Purchases ($) | Sales ($) 5/31/2011 ($) | Assets (%) |
| Dreyfus | | | |
| Institutional | | | |
| Preferred | | | |
| Plus Money | | | |
| Market | | | |
| Fund | 84,921,000 1,637,202,000 | 1,451,866,000 270,257,000 11.3 |
(e) Concentration of Risk: The fund invests primarily in debt securities. Failure of an issuer of the debt securities to make timely interest or principal payments, or a decline or the perception of a decline in the credit quality of a debt security, can cause the debt security’s price to fall, potentially lowering the fund’s share price. In addition, the value of debt securities may decline due to general market conditions that are not specifically related to a particular issuer, such as real or perceived adverse economic conditions, changes in outlook for corporate earnings, changes in interest or currency rates or adverse investor sentiment.They may also decline because of factors that affect a particular industry or country.
(f) Dividends to shareholders: It is the policy of the fund to continue to declare and pay dividends from investment income-net, quarterly. Dividends from net realized capital gains, if any, are normally declared and paid annually, but the fund may make distributions on a more frequent basis to comply with the distribution requirements of the Internal Revenue Code of 1986, as amended (the “Code”).To the extent that net realized capital gains can be offset by capital loss carryovers, it is the
NOTES TO FINANCIAL STATEMENTS (continued)
policy of the fund not to distribute such gains. Income and capital gain distributions are determined in accordance with income tax regulations, which may differ from GAAP.
On May 31, 2011, the Board of Trustees declared a cash dividend of $.190, $.167 and $.199 per share from undistributed investment income-net for Class A, Class C and Class I shares, respectively, payable on June 1, 2011 (ex-dividend date), to shareholders of record as of the close of business on May 31, 2011.
(g) Federal income taxes: It is the policy of the fund to continue to qualify as a regulated investment company, if such qualification is in the best interests of its shareholders, by complying with the applicable provisions of the Code, and to make distributions of taxable income sufficient to relieve it from substantially all federal income and excise taxes.
As of and during the period ended May 31, 2011, the fund did not have any liabilities for any uncertain tax positions.The fund recognizes interest and penalties, if any, related to uncertain tax positions as income tax expense in the Statement of Operations. During the period, the fund did not incur any interest or penalties.
Each of the tax years in the three-year period ended May 31, 2011 remains subject to examination by the Internal Revenue Service and state taxing authorities.
At May 31, 2011, the components of accumulated earnings on a tax basis were as follows: undistributed ordinary income $56,858,872, undistributed capital gains $13,111,840 and unrealized appreciation $57,287,750.
The tax character of distributions paid to shareholders during the fiscal periods ended May 31, 2011 and May 31, 2010 were as follows: ordinary income $41,482,201 and $655,559 and long-term capital gains $1,724,513 and $89,939, respectively.
During the period ended May 31, 2011, as a result of permanent book to tax differences, primarily due to the tax treatment for foreign currency gains and losses, the fund decreased accumulated undistributed
28
investment income-net by $2,762,849 and increased accumulated net realized gain (loss) on investments by the same amount. Net assets and net asset value per share were not affected by this reclassification.
NOTE 2—Bank Lines of Credit:
The fund participates with other Dreyfus-managed funds in a $225 million unsecured credit facility led by Citibank, N.A. and a $300 million unsecured credit facility provided by The Bank of New York Mellon (each, a “Facility”), each to be utilized primarily for temporary or emergency purposes, including the financing of redemptions. In connection therewith, the fund has agreed to pay its pro rata portion of commitment fees for each Facility. Interest is charged to the fund based on rates determined pursuant to the terms of the respective Facility at the time of borrowing. During the period ended on May 31, 2011, the fund did not borrow under the Facilities.
NOTE 3—Management Fee and Other Transactions With Affiliates:
(a) Pursuant to a management agreement between the Manager and the Trust, the Trust has agreed to pay the Manager a management fee computed at the annual rate of .75% of the value of the fund’s average daily net assets and is payable monthly.The Manager has contractually agreed, until October 1, 2011, to waive receipt of its fees and/or assume certain expenses of the fund, so that the expenses of none of the classes (excluding Rule 12b-1 fees, shareholder services fees, taxes, interest, brokerage commissions, commitment fees on borrowings and extraordinary expenses) exceed 1.10% of the value of the fund’s average daily net assets. During the period ended May 31, 2011, there was no expense reimbursement pursuant to the undertaking.
(b) Each Trustee who is not an “interested person” of the Trust (as defined in the Act) receives $60,000 per annum, plus $7,000 per joint Board meeting of the Trust, The Dreyfus/Laurel Funds, Inc., The Dreyfus/Laurel Tax-Free Municipal Funds, Dreyfus Investment Funds
NOTES TO FINANCIAL STATEMENTS (continued)
and Dreyfus Funds, Inc. (collectively, the “Board Group Open-End Funds”) attended, $2,500 for separate in-person committee meetings attended which are not held in conjunction with a regularly scheduled Board meeting and $2,000 for Board meetings and separate committee meetings attended that are conducted by telephone.The Board Group Open-End Funds also reimburse each Board member who is not an “interested person” of the Trust (as defined in the Act) for travel and out-of-pocket expenses. With respect to Board meetings, the Chairman of the Board receives an additional 25% of such compensation (with the exception of reimbursable amounts).The Chair of each of the Board’s committees, unless the Chair also serves as Chair of the Board, receives $1,350 per applicable committee meeting. In the event that there is an in-person joint committee meeting or a joint telephone meeting of the Board Group Open-End Funds and Dreyfus High Yield Strategies Fund, the $2,500 or $2,000 fee, as applicable, is allocated between the Board Group Open-End Funds and Dreyfus High Yield Strategies Fund.These fees and expenses are charged and allocated to each series based on net assets. Amounts required to be paid by the Trust directly to the non-interested Trustees, that would be applied to offset a portion of the management fee payable by certain other series of the Trust to the Manager, are in fact paid directly by the Manager to the non-interested Trustees.
During the period ended May 31, 2011, the Distributor retained $20,499 from commissions earned on sales of the fund’s Class A shares and $5,551 from CDSCs on redemptions of the fund’s Class C shares.
(c) Under the Distribution Plan (the “Plan”) adopted pursuant to Rule 12b-1 under the Act, Class C shares pay the Distributor for distributing its shares at an annual rate of .75% of the value of the average daily net assets of Class C shares. During the period ended May 31, 2011, Class C shares were charged $54,217 pursuant to the Plan.
(d) Under the Shareholder Services Plan, Class A and Class C shares pay the Distributor at an annual rate of .25% of the value of their average daily net assets for the provision of certain services.The services provided may include personal services relating to shareholder accounts, such
30
as answering shareholder inquiries regarding the fund and providing reports and other information, and services related to the maintenance of shareholder accounts.The Distributor may make payments to Service Agents (a securities dealer, financial institution or other industry professional) in respect of these services. The Distributor determines the amounts to be paid to Service Agents. During the period ended May 31, 2011, Class A and Class C shares were charged $140,551 and $18,072, respectively, pursuant to the Shareholder Services Plan.
Under its terms, the Plan and Shareholder Services Plan shall remain in effect from year to year, provided such continuance is approved annually by a vote of a majority of those Trustees who are not “interested persons” of theTrust and who have no direct or indirect financial interest in the operation of or in any agreement related to the Plan or Shareholder Services Plan.
The fund compensates Dreyfus Transfer, Inc., a wholly-owned subsidiary of the Manager, under a transfer agency agreement for providing personnel and facilities to perform transfer agency services for the fund. During the period ended May 31, 2011, the fund was charged $552,769 pursuant to the transfer agency agreement, which is included in Shareholder servicing costs in the Statement of Operations.
The fund has arrangements with the custodian and cash management bank whereby the fund may receive earnings credits when positive cash balances are maintained, which are used to offset custody and cash management fees. For financial reporting purposes, the fund includes net earnings credits as an expense offset in the Statement of Operations.
The fund compensates The Bank of New York Mellon under cash management agreements for performing cash management services related to fund subscriptions and redemptions. During the period ended May 31, 2011, the fund was charged $151,891 pursuant to the cash management agreements, which is included in Shareholder servicing costs in the Statement of Operations.These fees were partially offset by earnings credits of $3,919.
NOTES TO FINANCIAL STATEMENTS (continued)
The fund also compensates The Bank of New York Mellon under a custody agreement for providing custodial services for the fund. During the period ended May 31, 2011, the fund was charged $1,540,538 pursuant to the custody agreement.
During the period ended May 31, 2011, the fund was charged $6,387 for services performed by the Chief Compliance Officer.
The components of “Due to The Dreyfus Corporation and affiliates” in the Statement of Assets and Liabilities consist of: management fees $1,454,303, Rule 12b-1 distribution plan fees $8,602, shareholder services plan fees $18,991, custodian fees $641,473, chief compliance officer fees $3,006 and transfer agency per account fees $126,657.
(e) A 2% redemption fee is charged and retained by the fund on certain shares redeemed within sixty days following the date of issuance, subject to exceptions, including redemptions made through the use of the fund’s exchange privilege. During the period ended May 31, 2011, redemption fees charged and retained by the fund amounted to $65,278.
NOTE 4—Securities Transactions:
The aggregate amount of purchases and sales of investment securities, excluding short-term securities and forward contracts, during the period ended May 31, 2011, amounted to $2,490,728,742 and $1,154,496,920, respectively.
Forward Foreign Currency Exchange Contracts: The fund enters into forward contracts in order to hedge its exposure to changes in foreign currency exchange rates on its foreign portfolio holdings, to settle foreign currency transactions or as a part of its investment strategy. When executing forward contracts, the fund is obligated to buy or sell a foreign currency at a specified rate on a certain date in the future. With respect to sales of forward contracts, the fund incurs a loss if the value of the contract increases between the date the forward contract is opened and the date the forward contract is closed.The fund realizes a gain if the value of the contract decreases between those dates.With
32
respect to purchases of forward contracts, the fund incurs a loss if the value of the contract decreases between the date the forward contract is opened and the date the forward contract is closed.The fund realizes a gain if the value of the contract increases between those dates. Any realized gain or loss which occurred during the period is reflected in the Statement of Operations.The fund is exposed to foreign currency risk as a result of changes in value of underlying financial instruments. The fund is also exposed to credit risk associated with counterparty nonperformance on these forward contracts, which is typically limited to the unrealized gain on each open contract.The following summarizes open forward contracts at May 31, 2011:
| | | | | |
| | | Foreign | | | Unrealized |
| Forward Foreign Currency Currency | | | Appreciation |
| Exchange Contracts | Amounts | Cost ($) | Value ($) (Depreciation) ($) |
| Purchases: | | | | | |
| Argentine Peso, | | | | |
| Expiring | | | | | |
| 6/30/2011 | | 97,660,000 | 23,709,638 | 23,784,705 | 75,067 |
| Chilean Peso, | | | | | |
| Expiring | | | | | |
| 6/30/2011 | | 4,689,910,000 | 9,951,008 | 10,052,859 | 101,851 |
| Ghanian Cedi, | | | | | |
| Expiring | | | | | |
| 6/24/2011 | | 15,570,000 | 10,130,123 | 10,276,054 | 145,931 |
| Hungarian Forint, | | | | |
| Expiring | | | | | |
| 6/30/2011 | 11,773,240,000 | 62,206,700 | 63,297,435 | 1,090,735 |
| Hungarian Forint, | | | | |
| Expiring | | | | | |
| 6/30/2011 | | 6,668,870,000 | 35,482,149 | 35,854,392 | 372,243 |
| Malaysian Ringgit, | | | | |
| Expiring | | | | | |
| 6/30/2011 | | 290,310,000 | 94,689,977 | 96,210,376 | 1,520,399 |
| Malaysian Ringgit, | | | | |
| Expiring | | | | | |
| 6/30/2011 | | 35,180,000 | 11,524,979 | 11,658,851 | 133,872 |
| Malaysian Ringgit, | | | | |
| Expiring | | | | | |
| 6/30/2011 | | 289,910,000 | 96,130,380 | 96,077,814 | (52,566) |
| Mexican New Peso, | | | | |
| Expiring | | | | | |
| 6/30/2011 | | 1,298,350,000 | 110,391,708 | 111,965,333 | 1,573,625 |
NOTES TO FINANCIAL STATEMENTS (continued)
| | | | | |
| | | Foreign | | | Unrealized |
| Forward Foreign Currency | Currency | | | Appreciation |
| Exchange Contracts | Amounts | Cost ($) | Value ($) (Depreciation) ($) |
| Purchases (continued): | | | |
| Mexican New Peso, | | | | |
| Expiring | | | | | |
| 6/30/2011 | 1,134,320,000 | 97,383,242 | 97,819,938 | 436,696 |
| Nigerian Naira, | | | | | |
| Expiring | | | | | |
| 7/19/2011 | 500,600,000 | 3,168,354 | 3,198,196 | 29,842 |
| Philippine Peso, | | | | | |
| Expiring | | | | | |
| 7/14/2011 | 906,470,000 | 20,559,537 | 20,883,678 | 324,141 |
| Polish Zloty, | | | | | |
| Expiring | | | | | |
| 6/30/2011 | | 78,380,000 | 28,314,940 | 28,482,140 | 167,200 |
| Polish Zloty, | | | | | |
| Expiring | | | | | |
| 6/30/2011 | | 26,200,000 | 9,406,527 | 9,520,695 | 114,168 |
| Polish Zloty, | | | | | |
| Expiring | | | | | |
| 6/30/2011 | 242,690,000 | 87,132,445 | 88,189,977 | 1,057,532 |
| South Korean Won, | | | | |
| Expiring | | | | | |
| 6/30/2011 | 23,978,900,000 | 22,174,967 | 22,170,866 | (4,101) |
| Thai Baht, | | | | | |
| Expiring | | | | | |
| 6/30/2011 | 1,390,410,000 | 45,779,336 | 45,785,366 | 6,030 |
| Thai Baht, | | | | | |
| Expiring | | | | | |
| 6/30/2011 | 351,130,000 | 11,550,329 | 11,562,500 | 12,171 |
| Thai Baht, | | | | | |
| Expiring | | | | | |
| 6/30/2011 | 142,620,000 | 4,699,176 | 4,696,391 | (2,785) |
| Turkish Lira, | | | | | |
| Expiring | | | | | |
| 6/2/2011 | | 7,276,225 | 4,561,324 | 4,559,181 | (2,143) |
| Sales: | | | Proceeds ($) | | |
| Colombian Peso, | | | | | |
| Expiring | | | | | |
| 6/30/2011 | 16,306,850,000 | 8,902,995 | 9,039,274 | (136,279) |
| Colombian Peso, | | | | | |
| Expiring | | | | | |
| 6/30/2011 | 38,400,000,000 | 20,965,116 | 21,286,031 | (320,915) |
| Euro, | | | | | |
| Expiring | | | | | |
| 6/30/2011 | | 47,180,000 | 67,083,591 | 67,846,820 | (763,229) |
34
| | | |
| | Foreign | | Unrealized |
| Forward Foreign Currency Currency | | Appreciation |
| Exchange Contracts | Amounts | Proceeds ($) Value ($) (Depreciation) ($) |
| Sales (continued): | | | |
| Japanese Yen, | | | |
| Expiring | | | |
| 6/30/2011 | 1,794,000,000 | 22,045,270 22,011,865 | 33,405 |
| Malaysian Ringgit, | | | |
| Expiring | | | |
| 6/2/2011 | 283,852,190 | 94,199,778 94,287,391 | (87,613) |
| Mexican New Peso, | | | |
| Expiring | | | |
| 6/1/2011 | 1,357,899,845 | 116,909,156 117,485,711 | (576,555) |
| Peruvian New Sol, | | | |
| Expiring | | | |
| 6/30/2011 | 68,830,000 | 24,925,491 24,817,018 | 108,473 |
| Peruvian New Sol, | | | |
| Expiring | | | |
| 6/30/2011 | 32,000,000 | 11,621,572 11,537,768 | 83,804 |
| Philippine Peso, | | | |
| Expiring | | | |
| 7/14/2011 | 906,470,000 | 20,733,532 20,883,679 | (150,147) |
| Russian Ruble, | | | |
| Expiring | | | |
| 6/30/2011 | 740,000,000 | 26,129,943 26,371,778 | (241,835) |
| Russian Ruble, | | | |
| Expiring | | | |
| 7/11/2011 | 754,050,000 | 27,330,555 26,840,919 | 489,636 |
| South African Rand, | | | |
| Expiring | | | |
| 6/30/2011 | 372,240,000 | 53,558,942 54,395,605 | (836,663) |
| South African Rand, | | | |
| Expiring | | | |
| 6/30/2011 | 145,880,000 | 20,971,823 21,317,512 | (345,689) |
| Taiwan Dollar, | | | |
| Expiring | | | |
| 6/30/2011 | 598,950,000 | 20,811,327 20,904,664 | (93,337) |
| Turkish Lira, | | | |
| Expiring | | | |
| 6/30/2011 | 65,360,000 | 41,312,180 40,737,717 | 574,463 |
| Gross Unrealized | | | |
| Appreciation | | | 8,451,284 |
| Gross Unrealized | | | |
| Depreciation | | | (3,613,857) |
NOTES TO FINANCIAL STATEMENTS (continued)
The following summarizes the average market value of derivatives outstanding during the period ended May 31, 2011:
| |
| | Average Market Value ($) |
| Forward Contracts | 447,771,815 |
At May 31, 2011, the cost of investments for federal income tax purposes was $2,081,350,299; accordingly, accumulated net unrealized appreciation on investments was $69,258,622, consisting of $95,042,370 gross unrealized appreciation and $25,783,748 gross unrealized depreciation.
36
|
| REPORT OF INDEPENDENT REGISTERED |
| PUBLIC ACCOUNTING FIRM |
The Board of Trustees and Shareholders The Dreyfus/Laurel Funds Trust
We have audited the accompanying statement of assets and liabilities of Dreyfus Emerging Markets Debt Local Currency Fund (the “Fund”), a series of The Dreyfus/Laurel Funds Trust, including the statement of investments as of May 31, 2011, and the related statement of operations for the year then ended, the statement of changes in net assets for each of the years in the two-year period then ended and the financial highlights for each of the years in the two-year period then ended and for the period from September 12, 2008 (commencement of operations) to May 31, 2009.These financial statements and financial highlights are the responsibility of the Fund’s management. Our responsibility is to express an opinion on these financial statements and financial highlights based on our audits.
We conducted our audits in accordance with the standards of the Public Company Accounting Oversight Board (United States).Those standards require that we plan and perform the audit to obtain reasonable assurance about whether the financial statements and financial highlights are free of material misstatement. An audit includes examining, on a test basis, evidence supporting the amounts and disclosures in the financial statements. Our procedures included confirmation of securities owned as of May 31, 2011, by correspondence with the custodian and brokers. An audit also includes assessing the accounting principles used and significant estimates made by management, as well as evaluating the overall financial statement presentation. We believe that our audits provide a reasonable basis for our opinion.
In our opinion, the financial statements and financial highlights referred to above present fairly, in all material respects, the financial position of Dreyfus Emerging Markets Debt Local Currency Fund as of May 31, 2011, and the results of its operations for the year then ended, the changes in its net assets for each of the years in the two-year period then ended and the financial highlights for each of the years in the two-year period then ended and for the period from September 12, 2008 (commencement of operations) to May 31, 2009, in conformity with U.S. generally accepted accounting principles.

New York, New York
July 25, 2011
IMPORTANT TAX INFORMATION (Unaudited)
The fund designates the maximum amount allowable but not less than $.0162 per share as a capital gain dividend paid on December 28, 2010 in accordance with Section 852(b)(3)(c) of the Internal Revenue Code. Also, the fund designates the maximum amount allowable but not less than $.0495 as a short-term capital gain dividend paid on December 28, 2010 in accordance with Sections 871(k)(2) and 881(e) of the Internal Revenue Code. Also, the fund elects to provide each shareholder with their portion of the fund’s income sourced from foreign countries.The fund designates the maximum amount allowable but not less than $93,302,730 as income sourced from foreign countries for the fiscal year ended May 31, 2011 in accordance with Section 853 of the Internal Revenue Code, and also the fund designates the maximum amount allowable but not less than $227,757 as taxes paid from foreign countries for the fiscal year ended May 31, 2011 in accordance with Section 853 of the Internal Revenue Code. Where required by federal tax rules, shareholders will receive notification of their proportionate share of foreign sourced income and foreign taxes paid for the 2011 calendar year with Form 1099-DIV which will be mailed in early 2012.
38
|
| INFORMATION ABOUT THE RENEWAL OF THE |
| FUND’S MANAGEMENT AGREEMENT (Unaudited) |
At a meeting of the fund’s Board of Trustees held on February 15-16, 2011, the Board considered the renewal of the fund’s Management Agreement pursuant to which Dreyfus provides the fund with investment advisory and administrative services (the “Agreement”). The Board members, none of whom are “interested persons” (as defined in the Investment Company Act of 1940, as amended) of the fund, were assisted in their review by independent legal counsel and met with counsel in executive session separate from representatives of Dreyfus. In considering the renewal of the Agreement, the Board considered all factors that it believed to be relevant, including those discussed below.The Board did not identify any one factor as dispositive, and each Board member may have attributed different weights to the factors considered.
Analysis of Nature, Extent, and Quality of Services Provided to the Fund.The Board members considered information previously provided to them in presentations from representatives of Dreyfus regarding the nature, extent, and quality of the services provided to funds in the Dreyfus fund complex, and representatives of Dreyfus confirmed that there had been no material changes in this information. Dreyfus provided the number of open accounts in the fund, the fund’s asset size and the allocation of fund assets among distribution channels. Dreyfus also had previously provided information regarding the diverse intermediary relationships and distribution channels of funds in the Dreyfus fund complex and Dreyfus’ corresponding need for broad, deep, and diverse resources to be able to provide ongoing shareholder services to each distribution channel, including the distribution channel(s) for the fund.
The Board members also considered research support available to, and portfolio management capabilities of, the fund’s portfolio management personnel and that Dreyfus also provides oversight of day-to-day fund operations, including fund accounting and administration and assistance in meeting legal and regulatory requirements.The Board members also considered Dreyfus’ extensive administrative, accounting, and compliance infrastructures.
|
| INFORMATION ABOUT THE RENEWAL OF THE FUND’S |
| MANAGEMENT AGREEMENT (Unaudited) (continued) |
Comparative Analysis of the Fund’s Performance and Management Fee and Expense Ratio. The Board members reviewed reports prepared by Lipper, Inc. (“Lipper”), an independent provider of investment company data, which included information comparing (1) the fund’s performance with the performance of a group of comparable funds (the “Performance Group”) and with a broader group of funds (the “Performance Universe”), all for various periods ended December 31, 2010, and (2) the fund’s actual and contractual management fees and total expenses with those of a group of comparable funds (the “Expense Group”) and with a broader group of funds (the “Expense Universe”), the information for which was derived in part from fund financial statements available to Lipper as of May 31, 2010. Dreyfus previously had furnished the Board with a description of the methodology Lipper used to select the Performance Group and Performance Universe and the Expense Group and Expense Universe.
Dreyfus representatives stated that the usefulness of performance comparisons may be affected by a number of factors, including different investment limitations that may be applicable to the fund and comparison funds.The Board members discussed the results of the comparisons and noted that the fund’s total return performance was below the Performance Group and Performance Universe medians.The Board also noted that the fund’s yield performance was below the Performance Group and Performance Universe medians for the two one-year periods ended December 31st. Dreyfus also provided a comparison of the fund’s calendar year total returns to the returns of the fund’s benchmark index.
The Board members also reviewed the range of actual and contractual management fees and total expenses of the Expense Group and Expense Universe funds and discussed the results of the comparisons.They noted that the fund’s contractual management fee was above the Expense Group median, the fund’s actual management fee was below the Expense Group and Expense Universe medians and the fund’s total expenses were above the Expense Group and Expense Universe medians.
40
A representative of Dreyfus noted that Dreyfus has contractually agreed to waive receipt of its fees and/or assume the expenses of the fund, until October 1, 2011, so that annual direct fund operating expenses (excluding Rule 12b-1 fees, shareholder services fees, taxes, interest, brokerage commissions, acquired fund fees and extraordinary expenses) do not exceed 1.10% of the fund’s average daily net assets.
Representatives of Dreyfus reviewed with the Board members the management or investment advisory fees (1) paid by funds advised or administered by Dreyfus that are in the same Lipper category as the fund and (2) paid to Dreyfus or the Dreyfus-affiliated primary employer of the fund’s primary portfolio manager for advising any separate accounts and/or other types of client portfolios that are considered to have similar investment strategies and policies as the fund (the “Similar Clients”), and explained the nature of the Similar Clients. They discussed differences in fees paid and the relationship of the fees paid in light of any differences in the services provided and other relevant factors. The Board members considered the relevance of the fee information provided for the Similar Clients to evaluate the appropriateness and reasonableness of the fund’s management fee.
Analysis of Profitability and Economies of Scale. Dreyfus’ representatives reviewed the expenses allocated and profit received by Dreyfus and the resulting profitability percentage for managing the fund, and the method used to determine the expenses and profit. The Board concluded that the profitability results were not unreasonable, given the services rendered and service levels provided by Dreyfus. The Board also noted the expense limitation arrangement and its effect on Dreyfus’ profitability. The Board previously had been provided with information prepared by an independent consulting firm regarding Dreyfus’ approach to allocating costs to, and determining the profitability of, individual funds and the entire Dreyfus fund complex.The consulting firm also had analyzed where any economies of scale might emerge in connection with the management of a fund.
|
| INFORMATION ABOUT THE RENEWAL OF THE FUND’S |
| MANAGEMENT AGREEMENT (Unaudited) (continued) |
The Board’s counsel stated that the Board members should consider the profitability analysis (1) as part of their evaluation of whether the fees under the Agreement bear a reasonable relationship to the mix of services provided by Dreyfus, including the nature, extent and quality of such services, and (2) in light of the relevant circumstances for the fund and the extent to which economies of scale would be realized if the fund grows and whether fee levels reflect these economies of scale for the benefit of fund shareholders. Dreyfus representatives noted that, as a result of shared and allocated costs among funds in the Dreyfus funds complex, the extent of economies of scale could depend substantially on the level of assets in the complex as a whole, so that increases and decreases in complex-wide assets can affect potential economies of scale in a manner that is disproportionate to, or even in the opposite direction from, changes in the fund’s asset level. The Board members also considered potential benefits to Dreyfus from acting as investment adviser and noted that there were no soft dollar arrangements in effect for trading the fund’s investments.
At the conclusion of these discussions, the Board agreed that it had been furnished with sufficient information to make an informed business decision with respect to the renewal of the Agreement. Based on the discussions and considerations as described above, the Board concluded and determined as follows.
The Board concluded that the nature, extent and quality of the services provided by Dreyfus are adequate and appropriate.
The Board generally was concerned with the fund’s relative perfor- mance and agreed to closely monitor performance.
The Board concluded that the fee paid to Dreyfus was reasonable in light of the considerations described above.
42
The Board determined that the economies of scale which may accrue to Dreyfus and its affiliates in connection with the management of the fund had been adequately considered by Dreyfus in connection with the fee rate charged to the fund pursuant to the Agreement and that, to the extent in the future it were determined that material economies of scale had not been shared with the fund, the Board would seek to have those economies of scale shared with the fund.
The Board members considered these conclusions and determinations, along with information received on a routine and regular basis throughout the year. In addition, it should be noted that the Board’s consideration of the contractual fee arrangements for this fund had the benefit of a number of years of reviews of prior or similar agreements during which lengthy discussions took place between the Board members and Dreyfus representatives. Certain aspects of the arrangements may receive greater scrutiny in some years than in others, and the Board members’ conclusions may be based, in part, on their consideration of the same or similar arrangements in prior years.The Board members determined that renewal of the Agreement was in the best interests of the fund and its shareholders.

OFFICERS OF THE FUND (Unaudited)
BRADLEY J. SKAPYAK, President since January 2010.
Chief Operating Officer and a director of the Manager since June 2009. From April 2003 to June 2009, Mr. Skapyak was the head of the Investment Accounting and Support Department of the Manager. He is an officer of 76 investment companies (comprised of 170 portfolios) managed by the Manager. He is 52 years old and has been an employee of the Manager since February 1988.
MICHAEL A. ROSENBERG, Vice President and Secretary since August 2005.
Assistant General Counsel of BNY Mellon, and an officer of 77 investment companies (comprised of 195 portfolios) managed by the Manager. He is 51 years old and has been an employee of the Manager since October 1991.
KIESHA ASTWOOD, Vice President and Assistant Secretary since January 2010.
Counsel of BNY Mellon, and an officer of 77 investment companies (comprised of 195 portfolios) managed by the Manager. She is 38 years old and has been an employee of the Manager since July 1995.
JAMES BITETTO, Vice President and Assistant Secretary since August 2005.
Senior Counsel of BNY Mellon and Secretary of the Manager, and an officer of 77 investment companies (comprised of 195 portfolios) managed by the Manager. He is 44 years old and has been an employee of the Manager since December 1996.
JONI LACKS CHARATAN, Vice President and Assistant Secretary since August 2005.
Senior Counsel of BNY Mellon, and an officer of 77 investment companies (comprised of 195 portfolios) managed by the Manager. She is 55 years old and has been an employee of the Manager since October 1988.
JOSEPH M. CHIOFFI, Vice President and Assistant Secretary since August 2005.
Senior Counsel of BNY Mellon, and an officer of 77 investment companies (comprised of 195 portfolios) managed by the Manager. He is 49 years old and has been an employee of the Manager since June 2000.
KATHLEEN DENICHOLAS, Vice President and Assistant Secretary since January 2010.
Senior Counsel of BNY Mellon, and an officer of 77 investment companies (comprised of 195 portfolios) managed by the Manager. She is 36 years old and has been an employee of the Manager since February 2001.
JANETTE E. FARRAGHER, Vice President and Assistant Secretary since August 2005.
Assistant General Counsel of BNY Mellon, and an officer of 77 investment companies (comprised of 195 portfolios) managed by the Manager. She is 48 years old and has been an employee of the Manager since February 1984.
JOHN B. HAMMALIAN, Vice President and Assistant Secretary since August 2005.
Managing Counsel of BNY Mellon, and an officer of 77 investment companies (comprised of 195 portfolios) managed by the Manager. He is 47 years old and has been an employee of the Manager since February 1991.
M. CRISTINA MEISER, Vice President and Assistant Secretary since January 2010.
Senior Counsel of BNY Mellon, and an officer of 77 investment companies (comprised of 195 portfolios) managed by the Manager. She is 41 years old and has been an employee of the Manager since August 2001.
46
ROBERT R. MULLERY, Vice President and Assistant Secretary since August 2005.
Managing Counsel of BNY Mellon, and an officer of 77 investment companies (comprised of 195 portfolios) managed by the Manager. He is 59 years old and has been an employee of the Manager since May 1986.
JEFF PRUSNOFSKY, Vice President and Assistant Secretary since August 2005.
Managing Counsel of BNY Mellon, and an officer of 77 investment companies (comprised of 195 portfolios) managed by the Manager. He is 46 years old and has been an employee of the Manager since October 1990.
JAMES WINDELS, Treasurer since November 2001.
Director – Mutual Fund Accounting of the Manager, and an officer of 77 investment companies (comprised of 195 portfolios) managed by the Manager. He is 52 years old and has been an employee of the Manager since April 1985.
RICHARD CASSARO, Assistant Treasurer since January 2008.
Senior Accounting Manager – Money Market and Municipal Bond Funds of the Manager, and an officer of 77 investment companies (comprised of 195 portfolios) managed by the Manager. He is 52 years old and has been an employee of the Manager since September 1982.
GAVIN C. REILLY, Assistant Treasurer since December 2005.
Tax Manager of the Investment Accounting and Support Department of the Manager, and an officer of 77 investment companies (comprised of 195 portfolios) managed by the Manager. He is 42 years old and has been an employee of the Manager since April 1991.
ROBERT ROBOL, Assistant Treasurer since December 2002.
Senior Accounting Manager – Fixed Income Funds of the Manager, and an officer of 77 investment companies (comprised of 195 portfolios) managed by the Manager. He is 47 years old and has been an employee of the Manager since October 1988.
ROBERT SALVIOLO, Assistant Treasurer since July 2007.
Senior Accounting Manager – Equity Funds of the Manager, and an officer of 77 investment companies (comprised of 195 portfolios) managed by the Manager. He is 44 years old and has been an employee of the Manager since June 1989.
ROBERT SVAGNA, Assistant Treasurer since December 2002.
Senior Accounting Manager – Equity Funds of the Manager, and an officer of 77 investment companies (comprised of 195 portfolios) managed by the Manager. He is 44 years old and has been an employee of the Manager since November 1990.
OFFICERS OF THE FUND (Unaudited) (continued)
JOSEPH W. CONNOLLY, Chief Compliance Officer since October 2004.
Chief Compliance Officer of the Manager and The Dreyfus Family of Funds (77 investment companies, comprised of 195 portfolios). From November 2001 through March 2004, Mr. Connolly was first Vice-President, Mutual Fund Servicing for Mellon Global Securities Services. In that capacity, Mr. Connolly was responsible for managing Mellon’s Custody, Fund Accounting and Fund Administration services to third-party mutual fund clients. He is 54 years old and has served in various capacities with the Manager since 1980, including manager of the firm’s Fund Accounting Department from 1997 through October 2001.
STEPHEN J. STOREN, Anti-Money Laundering Compliance Officer since May 2011.
Chief Compliance Officer of the Distributor, and the Anti-Money Laundering Compliance Officer of 73 investment companies (comprised of 191 portfolios) managed by the Manager. He is 56 years old and has been an employee of the Distributor since October 1999.
48
Save time. Save paper. View your next shareholder report online as soon as it’s available. Log into www.dreyfus.com and sign up for Dreyfus eCommunications. It’s simple and only takes a few minutes.
The views expressed in this report reflect those of the portfolio manager only through the end of the period covered and do not necessarily represent the views of Dreyfus or any other person in the Dreyfus organization. Any such views are subject to change at any time based upon market or other conditions and Dreyfus disclaims any responsibility to update such views.These views may not be relied on as investment advice and, because investment decisions for a Dreyfus fund are based on numerous factors, may not be relied on as an indication of trading intent on behalf of any Dreyfus fund.
Not FDIC-Insured • Not Bank-Guaranteed • May Lose Value
| | Contents |
| | THE FUND |
| 2 | A Letter from the Chairman and CEO |
| 3 | Discussion of Fund Performance |
| 6 | Fund Performance |
| 8 | Understanding Your Fund’s Expenses |
| 8 | Comparing Your Fund’s Expenses With Those of Other Funds |
| 9 | Statement of Investments |
| 14 | Statement of Assets and Liabilities |
| 15 | Statement of Operations |
| 16 | Statement of Changes in Net Assets |
| 18 | Financial Highlights |
| 21 | Notes to Financial Statements |
| 32 | Report of Independent Registered Public Accounting Firm |
| 33 | Important Tax Information |
| 34 | Information About the Renewal of the Fund’s Management Agreement |
| 39 | Board Members Information |
| 41 | Officers of the Fund |
| | FOR MORE INFORMATION |
| | Back Cover |
Dreyfus
Equity Income Fund
The Fund

A LETTER FROM THE CHAIRMAN AND CEO
Dear Shareholder:
We are pleased to present this annual report for Dreyfus Equity Income Fund, covering the 12-month period from June 1, 2010, through May 31, 2011. For information about how the fund performed during the reporting period, as well as general market perspectives, we provide a Discussion of Fund Performance on the pages that follow.
The U.S. economy appears to have hit a soft patch in the spring of 2011 after accelerating over the second half of 2010. Disappointing labor, housing and manufacturing data have come at a time of higher energy prices and some tightening of monetary policy in global markets. In our view, the current slowdown should be relatively brief as the world recovers from the supply shocks created by weather impacts on food production, the decline in Libyan oil exports and supply-chain disruptions stemming from Japan’s natural and nuclear disasters. The U.S. stock market produced mostly positive results in this choppy economic environment due to better-than-expected corporate earnings and robust ongoing industrial demand from the emerging markets.
We remain optimistic as the U.S. economy moves through the middle stages of its cycle. Indeed, global macroeconomic policy generally has remained stimulative despite the recent efforts of some central banks to forestall inflationary pressures. We continue to expect sustainable economic growth, a rising but volatile uptrend in inflation and an improving U.S. labor market in the months ahead.As always, to determine how these forces may affect your investments, we urge you to talk regularly with your financial advisor.
Thank you for your continued confidence and support.

Jonathan R. Baum
Chairman and Chief Executive Officer
The Dreyfus Corporation
June 15, 2011
2

DISCUSSION OF FUND PERFORMANCE
For the period of June 1, 2010, through May 31, 2011, as provided by Jocelin A. Reed, CFA, Portfolio Manager
Fund and Market Performance Overview
For the 12-month period ended May 31, 2011, Dreyfus Equity Income Fund’s Class A shares produced a total return of 27.70%, Class C shares returned 26.79% and Class I shares returned 28.04%.1 In comparison, the fund’s benchmark, the Standard & Poor’s 500 Composite Stock Price Index (“S&P 500 Index”), provided a total return of 25.95% for the same period.2 Despite periodic bouts of market volatility, stocks generally rallied in a recovering economy. The fund produced higher returns than its benchmark, mainly due to successful stock selections in the financials, materials and industrials sectors.
As a side note, since May 2011, the fund has been managed by the Active EquityTeam of Mellon Capital Management Corporation, an affiliate of The Dreyfus Corporation. In addition to Jocelin A. Reed, CFA, the other members of the team are C.Wesley Boggs,Warren Chiang, CFA, Ronald Gala, CFA, Langton Garvin, CFA, and Patrick Slattery, CFA.
The Fund’s Investment Approach
The fund seeks total return consisting of capital appreciation and income.To pursue its goal, the fund invests primarily in equity securities, with a particular focus on dividend-paying stocks and other investments and investment techniques that provide income. When selecting securities, we use a computer model to identify and rank stocks within an industry or sector. Next, based on fundamental analysis, we generally select what we believe to be the most attractive of the higher ranked securities.We manage risk by diversifying the fund’s investments across companies and industries, seeking to limit the potential adverse impact of a decline in any one stock or industry.
Improved Economic Confidence Fueled Market Rallies
The reporting period began amid a sovereign debt crisis in Europe and persistently high unemployment in the United States, which contributed to a sluggish economic recovery and weighed on investor sentiment over
DISCUSSION OF FUND PERFORMANCE (continued)
the summer of 2010. By September, however, the announcement of a new round of quantitative easing of U.S. monetary policy by the Federal Reserve Board helped convince investors that the economy was unlikely to slip back into recession. A more optimistic economic outlook was reinforced by improvements in U.S. employment and consumer spending, better-than-expected GDP growth in Europe, higher corporate earnings and, later, the passage of fiscally stimulative U.S. tax legislation.
Although stocks continued to advance over the opening weeks of the new year, the stock market rally was interrupted in February when political unrest in the Middle East led to sharply higher crude oil prices, and again in March when devastating natural and nuclear disasters in Japan threatened one of the world’s largest economies.Although stocks soon bounced back from these unexpected shocks, disappointing U.S. economic data later in the spring dampened investor sentiment, and the market gave back some of its previous gains by the end of the reporting period.
Stock Selection Strategy Effective Across Markets
Our security selection strategy proved especially successful in the financials sector, where an emphasis on valuations and dividends proved beneficial. Winners included credit-rating agency Moody’s, which saw earnings rise due to greater bond issuance volumes, and regional banks PNC Financial Services Group and M&T Bank, which offer attractive dividend yields. Among consumer finance companies,
Discover Financial Services and American Express gained value as consumer confidence improved.
The materials sector generally flourished amid surging commodity prices as demand for industrial materials remained robust in the emerging markets and weather disruptions boosted agricultural prices. E.I. du Pont de Nemours & Co. achieved higher earnings in its agricultural chemicals unit, and Freeport-McMoRan Copper & Gold benefited from higher metals prices. Chemicals producer Lubrizol gained value when it was acquired by conglomerate Berkshire Hathaway. Overweighted exposure to machinery producers in the industrials sector also buoyed relative performance through investments in companies supplying equipment to the emerging markets, such as Deere & Co. and Caterpillar. In the energy sector, ConocoPhillips, Chevron, Marathon Oil and other companies with refinery operations advanced along with crude oil prices.
4
Disappointments during the reporting period were concentrated primarily in the information technology sector, where software giant Microsoft and microchip maker Intel were hurt by stalled growth in the personal-computer market as smartphones and tablet computers gained popularity. The fund did not own some of the sector’s top performers, primarily because they pay few or no dividends.
Positioned for a More Selective Market Environment
Although a number of headwinds remain, we expect the economic recovery to persist. However, we believe that investors are likely to become more selective, favoring companies that can produce consistent revenues and earnings in a slow-growth economy. In our judgment, our bottom-up security selection process may be particularly well suited to such an environment.We have found a number of opportunities meeting our investment criteria among companies with strong cash flows and an international presence. We have identified fewer opportunities among large banks, which have remained under pressure from under-performing loans.
In addition, we believe the fund’s dividend-oriented approach positions it well among companies that appear likely to return cash to shareholders. U.S. and multinational corporations have amassed enormous cash reserves, and we expect them to put that cash to work in shareholder-friendly ways, including dividend increases.
June 15, 2011
| |
| | Please note, the position in any security highlighted in italicized typeface was sold during the |
| | reporting period. |
| | Equity funds are subject generally to market, market sector, market liquidity, issuer and investment |
| | style risks, among other factors, to varying degrees, all of which are more fully described in the |
| | fund’s prospectus. |
| 1 | Total return includes reinvestment of dividends and any capital gains paid, and does not take into |
| | consideration the maximum initial sales charge in the case of Class A shares, or the applicable |
| | contingent deferred sales charge imposed on redemptions in the case of Class C shares. Had these |
| | charges been reflected, returns would have been lower. Past performance is no guarantee of future |
| | results. Share price and investment return fluctuate such that upon redemption, fund shares may be |
| | worth more or less than their original cost. Return figures provided reflect the absorption of certain |
| | fund expenses by The Dreyfus Corporation pursuant to an undertaking in effect through October |
| | 1, 2011, at which time it may be extended, terminated or modified. Had these expenses not been |
| | absorbed, the fund’s returns would have been lower. |
| 2 | SOURCE: LIPPER INC. — Reflects reinvestment of dividends and, where applicable, capital |
| | gain distributions.The Standard & Poor’s 500 Composite Stock Price Index is a widely accepted, |
| | unmanaged index of U.S. stock market performance. Investors cannot invest directly in any index. |
FUND PERFORMANCE
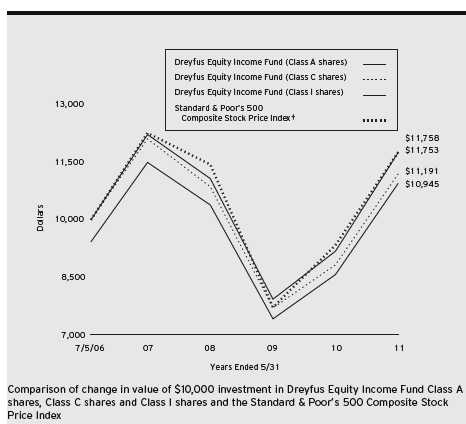
|
| † Source: Lipper Inc. |
| Past performance is not predictive of future performance. |
| The above graph compares a $10,000 investment made in Class A, Class C and Class I shares of Dreyfus Equity |
| Income Fund on 7/5/06 (inception date) to a $10,000 investment made in the Standard & Poor’s 500 Composite |
| Stock Price Index (the “Index”) on that date.All dividends and capital gain distributions are reinvested. |
| The fund’s performance shown in the line graph above takes into account the maximum initial sales charge on Class A |
| shares and all other applicable fees and expenses on all classes.The fund primarily seeks total return by investing in |
| stocks, focusing on dividend-paying stocks and other instruments that provide income.The Index is a widely accepted, |
| unmanaged index of U.S. stock market performance.These factors can contribute to the Index potentially outperforming |
| the fund. Unlike a mutual fund, the Index is not subject to charges, fees and other expenses. Investors cannot invest |
| directly in any index. Further information relating to fund performance, including expense reimbursements, if applicable, is |
| contained in the Financial Highlights section of the prospectus and elsewhere in this report. |
6
| | | |
| Average Annual Total Returns as of 5/31/11 | | |
| |
| | Inception | | From |
| | Date | 1 Year | Inception |
| Class A shares | | | |
| with maximum sales charge (5.75%) | 7/5/06 | 20.37% | 1.86% |
| without sales charge | 7/5/06 | 27.70% | 3.09% |
| Class C shares | | | |
| with applicable redemption charge † | 7/5/06 | 25.79% | 2.32% |
| without redemption | 7/5/06 | 26.79% | 2.32% |
| Class I shares | 7/5/06 | 28.04% | 3.35% |
| Standard & Poor’s 500 | | | |
| Composite Stock Price Index | 6/30/06 | 25.95% | 3.35%†† |
| |
| Past performance is not predictive of future performance.The fund’s performance shown in the graph and table does not |
| reflect the deduction of taxes that a shareholder would pay on fund distributions or the redemption of fund shares. |
| † | The maximum contingent deferred sales charge for Class C shares is 1% for shares redeemed within one year of the |
| | date of purchase. |
| †† | For comparative purposes, the value of the Index as of 6/30/06 is used as the beginning value on 7/5/06. |
UNDERSTANDING YOUR FUND’S EXPENSES (Unaudited)
As a mutual fund investor, you pay ongoing expenses, such as management fees and other expenses. Using the information below, you can estimate how these expenses affect your investment and compare them with the expenses of other funds.You also may pay one-time transaction expenses, including sales charges (loads) and redemption fees, which are not shown in this section and would have resulted in higher total expenses. For more information, see your fund’s prospectus or talk to your financial adviser.
Review your fund’s expenses
The table below shows the expenses you would have paid on a $1,000 investment in Dreyfus Equity Income Fund from December 1, 2010 to May 31, 2011. It also shows how much a $1,000 investment would be worth at the close of the period, assuming actual returns and expenses.
| | | |
| Expenses and Value of a $1,000 Investment | | |
| assuming actual returns for the six months ended May 31, 2011 | | |
| | Class A | Class C | Class I |
| Expenses paid per $1,000† | $ 8.14 | $ 12.19 | $ 6.78 |
| Ending value (after expenses) | $1,176.70 | $1,173.00 | $1,176.90 |
|
| COMPARING YOUR FUND’S EXPENSES |
| WITH THOSE OF OTHER FUNDS (Unaudited) |
Using the SEC’s method to compare expenses
The Securities and Exchange Commission (SEC) has established guidelines to help investors assess fund expenses. Per these guidelines, the table below shows your fund’s expenses based on a $1,000 investment, assuming a hypothetical 5% annualized return. You can use this information to compare the ongoing expenses (but not transaction expenses or total cost) of investing in the fund with those of other funds.All mutual fund shareholder reports will provide this information to help you make this comparison. Please note that you cannot use this information to estimate your actual ending account balance and expenses paid during the period.
| | | |
| Expenses and Value of a $1,000 Investment | | |
| assuming a hypothetical 5% annualized return for the six months ended May 31, 2011 |
| | Class A | Class C | Class I |
| Expenses paid per $1,000† | $ 7.54 | $ 11.30 | $ 6.29 |
| Ending value (after expenses) | $1,017.45 | $1,013.71 | $1,018.70 |
† Expenses are equal to the fund’s annualized expense ratio of 1.50% for Class A, 2.25% for Class C and 1.25% for Class I, multiplied by the average account value over the period, multiplied by 182/365 (to reflect the one-half year period).
8
|
| STATEMENT OF INVESTMENTS |
| May 31, 2011 |
| | |
| Common Stocks—96.6% | Shares | Value ($) |
| Consumer Discretionary—8.6% | | |
| Autoliv | 610 a | 46,958 |
| Ford Motor | 240 b | 3,581 |
| Gannett | 200 | 2,852 |
| H&R Block | 2,250 a | 36,450 |
| Home Depot | 140 | 5,079 |
| Limited Brands | 1,000 | 39,960 |
| Mattel | 470 | 12,406 |
| Regal Entertainment Group, Cl. A | 210 a | 2,845 |
| Target | 720 | 35,662 |
| Time Warner | 820 | 29,873 |
| TJX | 90 | 4,772 |
| VF | 315 | 31,396 |
| Washington Post, Cl. B | 10 a | 4,106 |
| Whirlpool | 280 | 23,464 |
| Wynn Resorts | 40 | 5,861 |
| | | 285,265 |
| Consumer Staples—13.2% | | |
| Altria Group | 1,480 a | 41,529 |
| Coca-Cola | 800 | 53,448 |
| Coca-Cola Enterprises | 280 | 8,089 |
| Colgate-Palmolive | 390 | 34,137 |
| ConAgra Foods | 1,120 | 28,482 |
| Costco Wholesale | 70 | 5,774 |
| Dr. Pepper Snapple Group | 1,280 | 52,736 |
| H.J. Heinz | 540 | 29,657 |
| Kimberly-Clark | 145 | 9,903 |
| Philip Morris International | 1,060 | 76,055 |
| Procter & Gamble | 460 | 30,820 |
| SYSCO | 290 | 9,341 |
| Wal-Mart Stores | 980 | 54,116 |
| | | 434,087 |
| Energy—10.7% | | |
| Chevron | 920 | 96,517 |
| ConocoPhillips | 935 | 68,461 |
| Devon Energy | 90 | 7,566 |
The Fund 9
STATEMENT OF INVESTMENTS (continued)
| | | |
| Common Stocks (continued) | Shares | | Value ($) |
| Energy (continued) | | | |
| Diamond Offshore Drilling | 70 | | 5,157 |
| Exxon Mobil | 1,150 | | 95,990 |
| Marathon Oil | 1,000 | | 54,170 |
| Murphy Oil | 100 | | 6,889 |
| Schlumberger | 110 | | 9,429 |
| Williams | 230 | | 7,220 |
| | | | 351,399 |
| Financial—14.7% | | | |
| Aflac | 810 | | 38,710 |
| Annaly Capital Management | 2,630 | c | 47,682 |
| Ares Capital | 890 | | 14,970 |
| Bank of America | 329 | | 3,866 |
| Charles Schwab | 195 | | 3,512 |
| Deutsche Bank | 315 | | 18,821 |
| Federated Investors, Cl. B | 450 | a | 11,533 |
| Fidelity National Financial, Cl. A | 1,520 | | 24,290 |
| Goldman Sachs Group | 100 | | 14,073 |
| HCP | 1,170 c | 44,390 |
| Hospitality Properties Trust | 1,630 c | 40,228 |
| JPMorgan Chase & Co. | 845 | | 36,538 |
| M&T Bank | 150 | | 13,245 |
| Moody’s | 1,255 a | 50,087 |
| New York Community Bancorp | 1,000 | | 16,200 |
| Piedmont Office Realty Trust, Cl. A | 1,380 a | 28,373 |
| PNC Financial Services Group | 140 | | 8,739 |
| Progressive | 270 | | 5,845 |
| Prudential Financial | 535 | | 34,122 |
| SEI Investments | 750 | | 17,730 |
| Travelers | 150 | | 9,312 |
| Wells Fargo & Co. | 155 | | 4,397 |
| | | | 486,663 |
| Health Care—9.8% | | | |
| Abbott Laboratories | 720 | | 37,620 |
| Baxter International | 150 | | 8,928 |
| Bristol-Myers Squibb | 1,950 | | 56,082 |
| Cardinal Health | 290 | | 13,172 |
10
| | |
| Common Stocks (continued) | Shares | Value ($) |
| Health Care (continued) | | |
| Eli Lilly & Co | 1,560 | 60,029 |
| Gilead Sciences | 110 b | 4,591 |
| Johnson & Johnson | 995 | 66,953 |
| Medtronic | 230 | 9,361 |
| Merck & Co. | 1,170 | 42,997 |
| Pfizer | 1,107 | 23,745 |
| | | 323,478 |
| Industrial—9.4% | | |
| 3M | 105 | 9,910 |
| Armstrong World Industries | 170 | 8,162 |
| Caterpillar | 325 | 34,385 |
| Cummins | 60 | 6,314 |
| Eaton | 70 | 3,617 |
| General Dynamics | 420 | 31,172 |
| General Electric | 1,160 | 22,782 |
| Illinois Tool Works | 200 | 11,464 |
| Lockheed Martin | 40 | 3,116 |
| Pitney Bowes | 1,835 a | 43,838 |
| R.R. Donnelley & Sons | 1,610 | 34,357 |
| Raytheon | 800 | 40,304 |
| Tyco International | 95 | 4,688 |
| United Parcel Service, Cl. B | 420 | 30,866 |
| United Technologies | 280 | 24,576 |
| | | 309,551 |
| Information Technology—14.5% | | |
| Activision Blizzard | 3,720 | 44,603 |
| Apple | 120 b | 41,740 |
| Broadridge Financial Solutions | 710 | 16,245 |
| Cisco Systems | 270 | 4,536 |
| Computer Sciences | 500 | 19,945 |
| Corning | 1,840 | 37,076 |
| Diebold | 500 | 16,525 |
| Fiserv | 50 b | 3,226 |
| Intel | 3,365 | 75,746 |
| International Business Machines | 400 | 67,572 |
| Maxim Integrated Products | 825 | 22,481 |
STATEMENT OF INVESTMENTS (continued)
| | |
| Common Stocks (continued) | Shares | Value ($) |
| Information Technology (continued) | | |
| Microsoft | 3,665 | 91,662 |
| Paychex | 70 | 2,261 |
| Visa, Cl. A | 240 | 19,454 |
| Western Union | 410 | 8,430 |
| Xerox | 790 | 8,066 |
| | | 479,568 |
| Materials—5.2% | | |
| E.I. du Pont de Nemours & Co. | 820 | 43,706 |
| Freeport-McMoRan Copper & Gold | 890 | 45,960 |
| International Paper | 430 | 13,425 |
| MeadWestvaco | 660 | 22,453 |
| PPG Industries | 200 | 17,740 |
| Southern Copper | 820 | 28,339 |
| | | 171,623 |
| Telecommunication Services—5.0% | | |
| AT&T | 3,070 | 96,889 |
| BCE | 875 | 35,210 |
| Verizon Communications | 860 | 31,760 |
| | | 163,859 |
| Utilities—5.5% | | |
| Ameren | 550 | 16,340 |
| American Electric Power | 740 | 28,268 |
| DTE Energy | 285 | 14,712 |
| Duke Energy | 1,885 | 35,344 |
| Entergy | 150 | 10,222 |
| FirstEnergy | 310 | 13,832 |
| NiSource | 1,900 a | 38,570 |
| Pepco Holdings | 570 | 11,383 |
| Pinnacle West Capital | 145 | 6,563 |
| TECO Energy | 250 | 4,800 |
| | | 180,034 |
| Total Common Stocks | | |
| (cost $2,989,730) | | 3,185,527 |
12
| | |
| Other Investment—2.0% | Shares | Value ($) |
| Registered Investment Company; | | |
| Dreyfus Institutional Preferred | | |
| Plus Money Market Fund | | |
| (cost $65,000) | 65,000 d | 65,000 |
| |
| Investment of Cash Collateral | | |
| for Securities Loaned—6.4% | | |
| Registered Investment Company; | | |
| Dreyfus Institutional Cash Advantage Fund | | |
| (cost $212,049) | 212,049 d | 212,049 |
| |
| Total Investments (cost $3,266,779) | 105.0% | 3,462,576 |
| Liabilities, Less Cash and Receivables | (5.0%) | (164,951) |
| Net Assets | 100.0% | 3,297,625 |
| a | Security, or portion thereof, on loan.At May 31, 2011, the value of the fund’s securities on loan was $209,090 and the value of the collateral held by the fund was $212,049. |
| b | Non-income producing security. |
| c | Investment in real estate investment trust. |
| d | Investment in affiliated money market mutual fund. |
| | | |
| Portfolio Summary (Unaudited)† | | |
| |
| | Value (%) | | Value (%) |
| Financial | 14.7 | Consumer Discretionary | 8.6 |
| Information Technology | 14.5 | Money Market Investments | 8.4 |
| Consumer Staples | 13.2 | Utilities | 5.5 |
| Energy | 10.7 | Materials | 5.2 |
| Health Care | 9.8 | Telecommunication Services | 5.0 |
| Industrial | 9.4 | | 105.0 |
| |
| † Based on net assets. | | | |
| See notes to financial statements. | | | |
|
| STATEMENT OF ASSETS AND LIABILITIES |
| May 31, 2011 |
| | | |
| | | Cost | Value |
| Assets ($): | | | |
| Investments in securities—See Statement of Investments (including | | |
| securities on loan, valued at $209,090)—Note 1(b): | | | |
| Unaffiliated issuers | | 2,989,730 | 3,185,527 |
| Affiliated issuers | | 277,049 | 277,049 |
| Cash | | | 52,392 |
| Dividends and interest receivable | | | 15,828 |
| Prepaid expenses | | | 28,668 |
| | | | 3,559,464 |
| Liabilities ($): | | | |
| Due to The Dreyfus Corporation and affiliates—Note 3(d) | | 720 |
| Liability for securities on loan—Note 1(b) | | | 212,049 |
| Accrued expenses | | | 49,070 |
| | | | 261,839 |
| Net Assets ($) | | | 3,297,625 |
| Composition of Net Assets ($): | | | |
| Paid-in capital | | | 2,910,602 |
| Accumulated undistributed investment income—net | | | 11,429 |
| Accumulated net realized gain (loss) on investments | | | 179,797 |
| Accumulated net unrealized appreciation | | | |
| (depreciation) on investments | | | 195,797 |
| Net Assets ($) | | | 3,297,625 |
| |
| |
| Net Asset Value Per Share | | | |
| | Class A | Class C | Class I |
| Net Assets ($) | 2,312,405 | 913,203 | 72,017 |
| Shares Outstanding | 174,791 | 69,693 | 5,431 |
| Net Asset Value Per Share ($) | 13.23 | 13.10 | 13.26 |
| |
| See notes to financial statements. | | | |
14
|
| STATEMENT OF OPERATIONS |
| Year Ended May 31, 2011 |
| |
| Investment Income ($): | |
| Income: | |
| Cash dividends (net of $310 foreign taxes withheld at source): | |
| Unaffiliated issuers | 94,380 |
| Affiliated issuers | 52 |
| Income from securities lending—Note 1(b) | 564 |
| Total Income | 94,996 |
| Expenses: | |
| Management fee—Note 3(a) | 21,280 |
| Auditing fees | 36,672 |
| Registration fees | 36,178 |
| Legal fees | 13,351 |
| Custodian fees—Note 3(d) | 11,927 |
| Shareholder servicing costs—Note 3(d) | 11,138 |
| Prospectus and shareholders’ reports | 6,834 |
| Distribution fees—Note 3(c) | 4,221 |
| Trustees’ fees and expenses—Note 3(b) | 1,618 |
| Loan commitment fees—Note 2 | 27 |
| Miscellaneous | 14,203 |
| Total Expenses | 157,449 |
| Less—expense reimbursement from The Dreyfus | |
| Corporation due to undertaking—Note 3(a) | (110,892) |
| Less—reduction in fees due to earnings credits—Note 3(d) | (8) |
| Net Expenses | 46,549 |
| Investment Income—Net | 48,447 |
| Realized and Unrealized Gain (Loss) on Investments—Note 4 ($): | |
| Net realized gain (loss) on investments and foreign currency transactions | 346,153 |
| Net unrealized appreciation (depreciation) on | |
| investments and foreign currency transactions | 307,194 |
| Net Realized and Unrealized Gain (Loss) on Investments | 653,347 |
| Net Increase in Net Assets Resulting from Operations | 701,794 |
| |
| See notes to financial statements. | |
STATEMENT OF CHANGES IN NET ASSETS
| | |
| | | Year Ended May 31, |
| | 2011 | 2010 |
| Operations ($): | | |
| Investment income—net | 48,447 | 20,377 |
| Net realized gain (loss) on investments | 346,153 | (3,423) |
| Net unrealized appreciation | | |
| (depreciation) on investments | 307,194 | 161,651 |
| Net Increase (Decrease) in Net Assets | | |
| Resulting from Operations | 701,794 | 178,605 |
| Dividends to Shareholders from ($): | | |
| Investment income—net: | | |
| Class A Shares | (31,860) | (16,570) |
| Class C Shares | (5,123) | (1,926) |
| Class I Shares | (1,801) | (1,264) |
| Total Dividends | (38,784) | (19,760) |
| Beneficial Interest Transactions ($): | | |
| Net proceeds from shares sold: | | |
| Class A Shares | 2,004,280 | 209,915 |
| Class C Shares | 678,007 | 502,089 |
| Class I Shares | 23,503 | 16,483 |
| Dividends reinvested: | | |
| Class A Shares | 12,745 | 16,029 |
| Class C Shares | 2,675 | 1,285 |
| Class I Shares | 913 | 1,263 |
| Cost of shares redeemed: | | |
| Class A Shares | (1,456,332) | (77,806) |
| Class C Shares | (176,017) | (364,721) |
| Class I Shares | (57,808) | (11) |
| Increase (Decrease) in Net Assets from | | |
| Beneficial Interest Transactions | 1,031,966 | 304,526 |
| Total Increase (Decrease) in Net Assets | 1,694,976 | 463,371 |
| Net Assets ($): | | |
| Beginning of Period | 1,602,649 | 1,139,278 |
| End of Period | 3,297,625 | 1,602,649 |
| Undistributed investment income—net | 11,429 | 2,305 |
16
| | |
| | | Year Ended May 31, |
| | 2011 | 2010 |
| Capital Share Transactions: | | |
| Class A | | |
| Shares sold | 169,627 | 19,904 |
| Shares issued for dividends reinvested | 1,079 | 1,550 |
| Shares redeemed | (113,433) | (7,495) |
| Net Increase (Decrease) in Shares Outstanding | 57,273 | 13,959 |
| Class C | | |
| Shares sold | 56,288 | 47,408 |
| Shares issued for dividends reinvested | 227 | 124 |
| Shares redeemed | (14,269) | (34,128) |
| Net Increase (Decrease) in Shares Outstanding | 42,246 | 13,404 |
| Class I | | |
| Shares sold | 2,067 | 1,755 |
| Shares issued for dividends reinvested | 78 | 122 |
| Shares redeemed | (4,357) | (1) |
| Net Increase (Decrease) in Shares Outstanding | (2,212) | 1,876 |
| |
| See notes to financial statements. | | |
FINANCIAL HIGHLIGHTS
The following tables describe the performance for each share class for the fiscal periods indicated.All information (except portfolio turnover rate) reflects financial results for a single fund share.Total return shows how much your investment in the fund would have increased (or decreased) during each period, assuming you had reinvested all dividends and distributions.These figures have been derived from the fund’s financial statements.
| | | | | |
| | | Year Ended May 31, | |
| Class A Shares | 2011 | 2010 | 2009 | 2008 | 2007a |
| Per Share Data ($): | | | | | |
| Net asset value, beginning of period | 10.52 | 9.24 | 13.17 | 15.00 | 12.50 |
| Investment Operations: | | | | | |
| Investment income—netb | .23 | .16 | .19 | .19 | .16 |
| Net realized and unrealized | | | | | |
| gain (loss) on investments | 2.66 | 1.27 | (3.93) | (1.63) | 2.56 |
| Total from Investment Operations | 2.89 | 1.43 | (3.74) | (1.44) | 2.72 |
| Distributions: | | | | | |
| Dividends from investment income—net | (.18) | (.15) | (.19) | (.18) | (.15) |
| Dividends from net realized | | | | | |
| gain on investments | — | — | — | (.21) | (.07) |
| Total Distributions | (.18) | (.15) | (.19) | (.39) | (.22) |
| Net asset value, end of period | 13.23 | 10.52 | 9.24 | 13.17 | 15.00 |
| Total Return (%)c | 27.70 | 15.55 | (28.60) | (9.59) | 21.89d |
| Ratios/Supplemental Data (%): | | | | | |
| Ratio of total expenses | | | | | |
| to average net assets | 5.40 | 9.40 | 11.74 | 8.79 | 10.66d |
| Ratio of net expenses | | | | | |
| to average net assets | 1.50 | 1.50 | 1.50 | 1.50 | 1.36d |
| Ratio of net investment income | | | | | |
| to average net assets | 1.85 | 1.49 | 1.95 | 1.38 | 1.18d |
| Portfolio Turnover Rate | 121.84 | 76.05 | 29.06 | 14.52 | 28.54d |
| Net Assets, end of period ($ x 1,000) | 2,312 | 1,236 | 957 | 1,307 | 1,304 |
| |
| a | From July 5, 2006 (commencement of operations) to May 31, 2007. |
| b | Based on average shares outstanding at each month end. |
| c | Exclusive of sales charge. |
| d | Not annualized. |
| See notes to financial statements. |
18
| | | | | |
| | | Year Ended May 31, | |
| Class C Shares | 2011 | 2010 | 2009 | 2008 | 2007a |
| Per Share Data ($): | | | | | |
| Net asset value, beginning of period | 10.43 | 9.18 | 13.12 | 14.96 | 12.50 |
| Investment Operations: | | | | | |
| Investment income—netb | .13 | .09 | .11 | .09 | .06 |
| Net realized and unrealized | | | | | |
| gain (loss) on investments | 2.65 | 1.26 | (3.92) | (1.62) | 2.56 |
| Total from Investment Operations | 2.78 | 1.35 | (3.81) | (1.53) | 2.62 |
| Distributions: | | | | | |
| Dividends from investment income—net | (.11) | (.10) | (.13) | (.10) | (.09) |
| Dividends from net realized | | | | | |
| gain on investments | — | — | — | (.21) | (.07) |
| Total Distributions | (.11) | (.10) | (.13) | (.31) | (.16) |
| Net asset value, end of period | 13.10 | 10.43 | 9.18 | 13.12 | 14.96 |
| Total Return (%)c | 26.79 | 14.57 | (29.07) | (10.28) | 21.06d |
| Ratios/Supplemental Data (%): | | | | | |
| Ratio of total expenses | | | | | |
| to average net assets | 6.19 | 10.13 | 13.47 | 9.82 | 11.39d |
| Ratio of net expenses | | | | | |
| to average net assets | 2.25 | 2.25 | 2.25 | 2.25 | 2.04d |
| Ratio of net investment income | | | | | |
| to average net assets | 1.09 | .78 | 1.21 | .66 | .47d |
| Portfolio Turnover Rate | 121.84 | 76.05 | 29.06 | 14.52 | 28.54d |
| Net Assets, end of period ($ x 1,000) | 913 | 286 | 129 | 127 | 121 |
| |
| a | From July 5, 2006 (commencement of operations) to May 31, 2007. |
| b | Based on average shares outstanding at each month end. |
| c | Exclusive of sales charge. |
| d | Not annualized. |
| See notes to financial statements. |
FINANCIAL HIGHLIGHTS (continued)
| | | | | |
| | | Year Ended May 31, | |
| Class I Shares | 2011 | 2010 | 2009 | 2008a | 2007b |
| Per Share Data ($): | | | | | |
| Net asset value, beginning of period | 10.54 | 9.25 | 13.19 | 15.01 | 12.50 |
| Investment Operations: | | | | | |
| Investment income—netc | .25 | .18 | .22 | .22 | .19 |
| Net realized and unrealized | | | | | |
| gain (loss) on investments | 2.67 | 1.28 | (3.95) | (1.62) | 2.56 |
| Total from Investment Operations | 2.92 | 1.46 | (3.73) | (1.40) | 2.75 |
| Distributions: | | | | | |
| Dividends from investment income—net | (.20) | (.17) | (.21) | (.21) | (.17) |
| Dividends from net realized | | | | | |
| gain on investments | — | — | — | (.21) | (.07) |
| Total Distributions | (.20) | (.17) | (.21) | (.42) | (.24) |
| Net asset value, end of period | 13.26 | 10.54 | 9.25 | 13.19 | 15.01 |
| Total Return (%) | 28.04 | 15.73 | (28.35) | (9.40) | 22.17d |
| Ratios/Supplemental Data (%): | | | | | |
| Ratio of total expenses | | | | | |
| to average net assets | 5.25 | 9.28 | 11.55 | 8.78 | 10.63d |
| Ratio of net expenses | | | | | |
| to average net assets | 1.25 | 1.25 | 1.25 | 1.25 | 1.13d |
| Ratio of net investment income | | | | | |
| to average net assets | 2.07 | 1.72 | 2.19 | 1.63 | 1.44d |
| Portfolio Turnover Rate | 121.84 | 76.05 | 29.06 | 14.52 | 28.54d |
| Net Assets, end of period ($ x 1,000) | 72 | 81 | 53 | 75 | 82 |
| |
| a | Effective June 1, 2007, Class R shares were redesignated as Class I shares. |
| b | From July 5, 2006 (commencement of operations) to May 31, 2007. |
| c | Based on average shares outstanding at each month end. |
| d | Not annualized. |
| See notes to financial statements. |
20
NOTES TO FINANCIAL STATEMENTS
NOTE 1—Significant Accounting Policies:
Dreyfus Equity Income Fund (the “fund”) is a separate diversified series of The Dreyfus/Laurel Funds Trust (the “Trust”), which is registered under the Investment Company Act of 1940, as amended (the “Act”), as an open-end management investment company and operates as a series company currently offering six series, including the fund.The fund’s investment objective is to seek total return (consisting of capital appreciation and income).The Dreyfus Corporation (the “Manager” or “Dreyfus”), a wholly-owned subsidiary ofThe Bank of NewYork Mellon Corporation (“BNY Mellon”), serves as the fund’s investment adviser.
MBSC Securities Corporation (the “Distributor”), a wholly-owned subsidiary of the Manager, is the distributor of the fund’s shares. The fund is authorized to issue an unlimited number of shares of Beneficial Interest in each of the following classes of shares: Class A, Class C and Class I. Class A and Class C shares are sold primarily to retail investors through financial intermediaries and bear a distribution fee and/or service fee. Class A shares are sold with a front-end sales charge, while Class C shares are subject to a contingent deferred sales charge (“CDSC”). Class I shares are sold primarily to bank trust departments and other financial service providers (including The Bank of NewYork Mellon, a subsidiary of BNY Mellon and an affiliate of Dreyfus) acting on behalf of customers having a qualified trust or an investment account or relationship at such institution and bear no distribution or service fees. Class I shares are offered without a front-end sales charge or CDSC. Each class of shares has identical rights and privileges, except with respect to distribution and service fees and voting rights on matters affecting a single class. Income, expenses (other than expenses attributable to a specific class), and realized and unrealized gains or losses on investments are allocated to each class of shares based on its relative net assets.
NOTES TO FINANCIAL STATEMENTS (continued)
The Financial Accounting Standards Board (“FASB”) Accounting Standards Codification (“ASC”) is the exclusive reference of authoritative U.S. generally accepted accounting principles (“GAAP”) recognized by the FASB to be applied by nongovernmental entities. Rules and interpretive releases of the Securities and Exchange Commission (“SEC”) under authority of federal laws are also sources of authoritative GAAP for SEC registrants. The fund’s financial statements are prepared in accordance with GAAP, which may require the use of management estimates and assumptions.Actual results could differ from those estimates.
(a) Portfolio valuation: Investments in securities are valued at the last sales price on the securities exchange or national securities market on which such securities are primarily traded. Securities listed on the National Market System for which market quotations are available are valued at the official closing price or, if there is no official closing price that day, at the last sales price. Securities not listed on an exchange or the national securities market, or securities for which there were no transactions, are valued at the average of the most recent bid and asked prices, except for open short positions, where the asked price is used for valuation purposes. Bid price is used when no asked price is available. Registered investment companies that are not traded on an exchange are valued at their net asset value.When market quotations or official closing prices are not readily available, or are determined not to reflect accurately fair value, such as when the value of a security has been significantly affected by events after the close of the exchange or market on which the security is principally traded (for example, a foreign exchange or market),but before the fund calculates its net asset value, the fund may value these investments at fair value as determined in accordance with the procedures approved by the Board of Trustees. Fair valuing of securities may be determined with the assistance of a pricing service using calculations based on indices of domestic securities and other appropriate indicators, such as prices of relevant American Depository Receipts and futures contracts. For other securities that are fair valued by the Board of Trustees, certain factors may
22
be considered such as: fundamental analytical data, the nature and duration of restrictions on disposition, an evaluation of the forces that influence the market in which the securities are purchased and sold and public trading in similar securities of the issuer or comparable issuers. Forward foreign currency exchange contracts (“forward contracts”) are valued at the forward rate.
The fair value of a financial instrument is the amount that would be received to sell an asset or paid to transfer a liability in an orderly transaction between market participants at the measurement date (i.e. the exit price). GAAP establishes a fair value hierarchy that prioritizes the inputs of valuation techniques used to measure fair value.This hierarchy gives the highest priority to unadjusted quoted prices in active markets for identical assets or liabilities (Level 1 measurements) and the lowest priority to unobservable inputs (Level 3 measurements).
Additionally, GAAP provides guidance on determining whether the volume and activity in a market has decreased significantly and whether such a decrease in activity results in transactions that are not orderly. GAAP requires enhanced disclosures around valuation inputs and techniques used during annual and interim periods.
Various inputs are used in determining the value of the fund’s investments relating to fair value measurements.These inputs are summarized in the three broad levels listed below:
Level 1—unadjusted quoted prices in active markets for identical investments.
Level 2—other significant observable inputs (including quoted prices for similar investments, interest rates, prepayment speeds, credit risk, etc.).
Level 3—significant unobservable inputs (including the fund’s own assumptions in determining the fair value of investments).
The inputs or methodology used for valuing securities are not necessarily an indication of the risk associated with investing in those securities.
NOTES TO FINANCIAL STATEMENTS (continued)
The following is a summary of the inputs used as of May 31, 2011 in valuing the fund’s investments:
| | | | |
| | | Level 2—Other | Level 3— | |
| | Level 1— | Significant | Significant | |
| | Unadjusted | Observable | Unobservable | |
| | Quoted Prices | Inputs | Inputs | Total |
| Assets ($) | | | | |
| Investments in Securities: | | | |
| Equity Securities— | | | | |
| Domestic† | 3,084,538 | — | — | 3,084,538 |
| Equity Securities— | | | | |
| Foreign† | 100,989 | — | — | 100,989 |
| Mutual Funds | 277,049 | — | — | 277,049 |
| † See Statement of Investments for additional detailed categorizations. | |
In January 2010, FASB issued Accounting Standards Update (“ASU”) No. 2010-06 “Improving Disclosures about FairValue Measurements”. The portions of ASU No. 2010-06 which require reporting entities to prepare new disclosures surrounding amounts and reasons for significant transfers in and out of Level 1 and Level 2 fair value measurements as well as inputs and valuation techniques used to measure fair value for both recurring and nonrecurring fair value measurements that fall in either Level 2 or Level 3 have been adopted by the fund. No significant transfers between Level 1 or Level 2 fair value measurements occurred at May 31, 2011.
In May 2011, FASB issued ASU No. 2011-04 “Amendments to Achieve Common Fair Value Measurement and Disclosure Requirements in GAAP and International Financial Reporting Standards (“IFRS”)”. ASU 2011-04 includes common requirements for measurement of and disclosure about fair value between GAAP and IFRS.ASU 2011-04 will require reporting entities to disclose the following information for fair value measurements categorized within Level 3 of the fair value hierarchy: quantitative information about the unobservable inputs used in the fair value measurement, the valuation processes used by the reporting entity and a narrative description of the sensitivity of the fair value measurement to changes in unobservable inputs and the interrelationships
24
between those unobservable inputs. In addition, ASU 2011-04 will require reporting entities to make disclosures about amounts and reasons for all transfers in and out of Level 1 and Level 2 fair value measurements. The new and revised disclosures are effective for interim and annual reporting periods beginning after December 15, 2011. At this time, management is evaluating the implications of ASU No. 2011-04 and its impact on the financial statements.
(b) Securities transactions and investment income: Securities transactions are recorded on a trade date basis. Realized gains and losses from securities transactions are recorded on the identified cost basis. Dividend income is recognized on the ex-dividend date and interest income, including, where applicable, accretion of discount and amortization of premium on investments, is recognized on the accrual basis.
Pursuant to a securities lending agreement withThe Bank of NewYork Mellon the fund may lend securities to qualified institutions. It is the fund’s policy that, at origination, all loans are secured by collateral of at least 102% of the value of U.S. securities loaned and 105% of the value of foreign securities loaned. Collateral equivalent to at least 100% of the market value of securities on loan is maintained at all times. Collateral is either in the form of cash, which can be invested in certain money market mutual funds managed by the Manager, U.S. Government and Agency securities or letters of credit.The fund is entitled to receive all income on securities loaned, in addition to income earned as a result of the lending transaction.Although each security loaned is fully collateralized, the fund bears the risk of delay in recovery of, or loss of rights in, the securities loaned should a borrower fail to return the securities in a timely manner. During the period ended May 31, 2011,The Bank of New York Mellon earned $242 from lending portfolio securities, pursuant to the securities lending agreement.
(c) Affiliated issuers: Investments in other investment companies advised by Dreyfus are defined as “affiliated” in the Act.
NOTES TO FINANCIAL STATEMENTS (continued)
The fund may invest in shares of certain affiliated investment companies also advised or managed by Dreyfus. Investments in affiliated investment companies for the period ended May 31, 2011 were as follows:
| | | | | |
| Affiliated | | | | | |
| Investment | Value | | | Value | Net |
| Company | 5/31/2010 ($) | Purchases ($) | Sales ($) | 5/31/2011 ($) | Assets (%) |
| Dreyfus | | | | | |
| Institutional | | | | | |
| Preferred | | | | | |
| Plus Money | | | | | |
| Market Fund | — | 1,555,000 | 1,490,000 | 65,000 | 2.0 |
| Dreyfus | | | | | |
| Institutional | | | | | |
| Cash | | | | | |
| Advantage | | | | | |
| Fund | 42,055 | 1,498,533 | 1,328,539 | 212,049 | 6.4 |
| Total | 42,055 | 3,053,533 | 2,818,539 | 277,049 | 8.4 |
(d) Dividends to shareholders: Dividends are recorded on the ex-dividend date. Dividends from investment income-net are declared and paid monthly. Dividends from net realized capital gains, if any, are normally declared and paid annually, but the fund may make distributions on a more frequent basis to comply with the distribution requirements of the Internal Revenue Code of 1986, as amended (the “Code”).To the extent that net realized capital gains can be offset by capital loss carryovers, it is the policy of the fund not to distribute such gains. Income and capital gain distributions are determined in accordance with income tax regulations, which may differ from GAAP.
(e) Federal income taxes: It is the policy of the fund to continue to qualify as a regulated investment company, if such qualification is in the best interests of its shareholders, by complying with the applicable provisions of the Code, and to make distributions of taxable income sufficient to relieve it from substantially all federal income and excise taxes.
As of and during the period ended May 31, 2011, the fund did not have any liabilities for any uncertain tax positions.The fund recognizes interest and penalties, if any, related to uncertain tax positions as
26
income tax expense in the Statement of Operations. During the period, the fund did not incur any interest or penalties.
Each of the tax years in the four-year period ended May 31, 2011 remains subject to examination by the Internal Revenue Service and state taxing authorities.
At May 31, 2011, the components of accumulated earnings on a tax basis were as follows: undistributed ordinary income $112,713, undistributed capital gains $84,571 and unrealized appreciation $189,739.
The tax character of distributions paid to shareholders during the fiscal periods ended May 31, 2011 and May 31, 2010 were as follows: ordinary income $38,784 and $19,760, respectively.
During the period ended May 31, 2011, as a result of permanent book to tax differences, primarily due to the tax treatment for real estate investment trusts and foreign currency gains and losses, the fund decreased accumulated undistributed investment income-net by $538 and increased accumulated net realized gain (loss) on investments by the same amount. Net assets and net asset value per share were not affected by this reclassification.
NOTE 2—Bank Lines of Credit:
The fund participates with other Dreyfus-managed funds in a $225 million unsecured credit facility led by Citibank, N.A. and a $300 million unsecured credit facility provided by The Bank of New York Mellon (each, a “Facility”), each to be utilized primarily for temporary or emergency purposes, including the financing of redemptions. In connection therewith, the fund has agreed to pay its pro rata portion of commitment fees for each Facility. Interest is charged to the fund based on rates determined pursuant to the terms of the respective Facility at the time of borrowing. During the period ended May 31, 2011, the fund did not borrow under the Facilities.
NOTES TO FINANCIAL STATEMENTS (continued)
NOTE 3—Management Fee and Other Transactions With Affiliates:
(a) Pursuant to a management agreement with the Manager, the management fee is computed at the annual rate of .75% of the value of the fund’s average daily net assets and is payable monthly.The Manager has contractually agreed to waive receipt of its fees and/or assume the expenses of the fund, until October 1, 2011, so that annual direct fund operating expenses (excluding Rule 12b-1 fees, shareholder services fees, taxes, brokerage commissions, commitment fees on borrowings and extraordinary expenses) do not exceed 1.25% of the value of the fund’s average daily net assets. The expense reimbursement, pursuant to the undertaking, amounted to $110,892 during the period ended May 31, 2011.
(b) Each Trustee who is not an “interested person” of the Trust (as defined in the Act) receives $60,000 per annum, plus $7,000 per joint Board meeting of the Trust, The Dreyfus/Laurel Funds, Inc., The Dreyfus/Laurel Tax-Free Municipal Funds, Dreyfus Investment Funds and Dreyfus Funds, Inc. (collectively, the “Board Group Open-End Funds”) attended, $2,500 for separate in-person committee meetings attended which are not held in conjunction with a regularly scheduled Board meeting and $2,000 for Board meetings and separate committee meetings attended that are conducted by telephone. The Board Group Open-End Funds also reimburse each Trustee who is not an “interested person” of the Trust (as defined in the Act) for travel and out-of-pocket expenses. With respect to Board meetings, the Chairman of the Board receives an additional 25% of such compensation (with the exception of reimbursable amounts). The Chair of each of the Board’s committees, unless the Chair also serves as Chair of the Board, receives $1,350 per applicable committee meeting. In the event that there is an in-person joint committee meeting or a joint telephone meeting of the Board Group Open-End Funds and Dreyfus High Yield Strategies Fund, the $2,500 or $2,000 fee, as applicable, is allocated between the Board Group Open-End Funds and Dreyfus High Yield Strategies Fund.These fees and expenses are
28
charged and allocated to each series based on net assets. Amounts required to be paid by the Trust directly to the non-interested Trustees, that would be applied to offset a portion of the management fee payable by certain other series of the Trust to the Manager, are in fact paid directly by the Manager to the non-interested Trustees.
During the period ended May 31, 2011, the Distributor retained $4,524 from commissions earned on sales of the fund’s Class A shares and $16 from CDSCs on redemptions of the fund’s Class C Shares.
(c) Under the Distribution Plan (the “Plan”) adopted pursuant to Rule 12b-1 under the Act, Class C shares pay the Distributor for distributing their shares at an annual rate of .75% of the value of the average daily net assets of Class C shares. During the period ended May 31, 2011, Class C shares were charged $4,221, pursuant to the Plan.
(d) Under the Shareholder Services Plan, Class A and Class C shares pay the Distributor at an annual rate of .25% of the value of their average daily net assets for the provision of certain services. The services provided may include personal services relating to shareholder accounts, such as answering shareholder inquiries regarding Class A and Class C shares and providing reports and other information, and services related to the maintenance of shareholder accounts. The Distributor may make payments to Service Agents (a securities dealer, financial institution or other industry professional) in respect of these services.The Distributor determines the amounts to be paid to Service Agents. During the period ended May 31, 2011, Class A and Class C shares were charged $5,427 and $1,407, respectively, pursuant to the Shareholder Services Plan.
Under its terms, the Plan and Shareholder Services Plan shall remain in effect from year to year, provided such continuance is approved annually by a vote of a majority of those Trustees who are not “interested persons” of theTrust and who have no direct or indirect financial interest in the operation of or in any agreement related to the Plan or Shareholder Services Plan.
NOTES TO FINANCIAL STATEMENTS (continued)
The fund compensates Dreyfus Transfer, Inc., a wholly-owned subsidiary of the Manager, under a transfer agency agreement for providing personnel and facilities to perform transfer agency services for the fund. During the period ended May 31, 2011, the fund was charged $2,297 pursuant to the transfer agency agreement, which is included in Shareholder servicing costs in the Statement of Operations.
The fund has arrangements with the custodian and cash management bank whereby the fund may receive earnings credits when positive cash balances are maintained, which are used to offset custody and cash management fees. For financial reporting purposes, the fund includes net earnings credits as an expense offset in the Statement of Operations.
The fund compensates The Bank of New York Mellon under a cash management agreement for performing cash management services related to fund subscriptions and redemptions. During the period ended May 31, 2011, the fund was charged $372 pursuant to the cash management agreement, which is included in Shareholder servicing costs in the Statement of Operations. These fees were partially offset by earnings credits of $8.
The fund also compensates The Bank of New York Mellon under a custody agreement for providing custodial services for the fund. During the period ended May 31, 2011, the fund was charged $11,927 pursuant to the custody agreement.
During the period ended May 31, 2011, the fund was charged $6,387 for services performed by the Chief Compliance Officer.
The components of “DueToThe Dreyfus Corporation and affiliates” in the Statement of Assets and Liabilities consist of: management fees $2,488, Rule 12b-1 distribution plan fees $570, shareholder services plan fees $807, custodian fees $9,512, chief compliance officer fees $3,006 and transfer agency per account fees $278, which are offset against an expense reimbursement currently in effect in the amount of $15,941.
30
NOTE 4—Securities Transactions:
The aggregate amount of purchases and sales of investment securities, excluding short-term securities, forward contracts, during the period ended May 31, 2011, amounted to $4,277,913 and 3,345,314, respectively.
Forward Foreign Currency Exchange Contracts: The fund enters into forward contracts in order to hedge its exposure to changes in foreign currency exchange rates on its foreign portfolio holdings, to settle foreign currency transactions or as a part of its investment strategy. When executing forward contracts, the fund is obligated to buy or sell a foreign currency at a specified rate on a certain date in the future. With respect to sales of forward contracts, the fund incurs a loss if the value of the contract increases between the date the forward contract is opened and the date the forward contract is closed.The fund realizes a gain if the value of the contract decreases between those dates.With respect to purchases of forward contracts, the fund incurs a loss if the value of the contract decreases between the date the forward contract is opened and the date the forward contract is closed.The fund realizes a gain if the value of the contract increases between those dates. Any realized gain or loss which occurred during the period is reflected in the Statement of Operations.The fund is exposed to foreign currency risk as a result of changes in value of underlying financial instruments. The fund is also exposed to credit risk associated with counterparty nonperformance on these forward contracts, which is typically limited to the unrealized gain on each open contract. At May 31, 2011, there were no forward contracts outstanding.
At May 31, 2011, the cost of investments for federal income tax purposes was $3,272,837; accordingly, accumulated net unrealized appreciation on investments was $189,739, consisting of $263,387 gross unrealized appreciation and $73,648 gross unrealized depreciation.
The Fund 31
|
| REPORT OF INDEPENDENT REGISTERED |
| PUBLIC ACCOUNTING FIRM |
The Board of Trustees and Shareholders The Dreyfus/Laurel Funds Trust
We have audited the accompanying statement of assets and liabilities of Dreyfus Equity Income Fund (the “Fund”), a series of The Dreyfus/Laurel FundsTrust, including the statement of investments as of May 31, 2011, and the related statement of operations for the year then ended, the statement of changes in net assets for each of the years in the two-year period then ended and the financial highlights for each of the years in the four-year period then ended and for the period from July 5, 2006 (commencement of operations) to May 31, 2007.These financial statements and financial highlights are the responsibility of the Fund’s management. Our responsibility is to express an opinion on these financial statements and financial highlights based on our audits.
We conducted our audits in accordance with the standards of the Public Company Accounting Oversight Board (United States).Those standards require that we plan and perform the audit to obtain reasonable assurance about whether the financial statements and financial highlights are free of material misstatement. An audit includes examining, on a test basis, evidence supporting the amounts and disclosures in the financial statements. Our procedures included confirmation of securities owned as of May 31, 2011, by correspondence with the custodian and brokers or by other appropriate auditing procedures where replies from brokers were not received. An audit also includes assessing the accounting principles used and significant estimates made by management, as well as evaluating the overall financial statement presentation.We believe that our audits provide a reasonable basis for our opinion.
In our opinion, the financial statements and financial highlights referred to above present fairly, in all material respects, the financial position of Dreyfus Equity Income Fund as of May 31, 2011, and the results of its operations for the year then ended, the changes in its net assets for each of the years in the two-year period then ended and the financial highlights for each of the years in the four-year period then ended and for the period from July 5, 2006 (commencement of operations) to May 31, 2007, in conformity with U.S. generally accepted accounting principles.

New York, New York
July 25, 2011
32
IMPORTANT TAX INFORMATION (Unaudited)
For federal tax purposes the fund designates the maximum amount allowable but not less than 57.98% of ordinary income dividends paid during the fiscal year ended May 31, 2011 as eligible for the corporate dividends received deduction provided under Section 243 of the Internal Revenue Code in accordance with Section 854(b)(1)(A) of the Internal Revenue Code.Also, the fund designates the maximum amount allowable but not less than $36,479 as ordinary income dividends paid during the fiscal year ended May 31, 2011 as qualified dividend income in accordance with Section 854(b)(1)(B) of the Internal Revenue Code. Shareholders will receive notification in early 2012 of the percentage applicable to the preparation of their 2011 income tax returns.
|
| INFORMATION ABOUT THE RENEWAL OF THE |
| FUND’S MANAGEMENT AGREEMENT (Unaudited) |
At a meeting of the fund’s Board of Trustees held on February 15-16, 2011, the Board considered the renewal of the fund’s Management Agreement pursuant to which Dreyfus provides the fund with investment advisory and administrative services (the “Agreement”). The Board members, none of whom are “interested persons” (as defined in the Investment Company Act of 1940, as amended) of the fund, were assisted in their review by independent legal counsel and met with counsel in executive session separate from representatives of Dreyfus. In considering the renewal of the Agreement, the Board considered all factors that it believed to be relevant, including those discussed below.The Board did not identify any one factor as dispositive, and each Board member may have attributed different weights to the factors considered.
Analysis of Nature, Extent, and Quality of Services Provided to the Fund.The Board members considered information previously provided to them in presentations from representatives of Dreyfus regarding the nature, extent, and quality of the services provided to funds in the Dreyfus fund complex, and representatives of Dreyfus confirmed that there had been no material changes in this information. Dreyfus provided the number of open accounts in the fund, the fund’s asset size and the allocation of fund assets among distribution channels. Dreyfus also had previously provided information regarding the diverse intermediary relationships and distribution channels of funds in the Dreyfus fund complex and Dreyfus’ corresponding need for broad, deep, and diverse resources to be able to provide ongoing shareholder services to each distribution channel, including the distribution channel(s) for the fund.
The Board members also considered research support available to, and portfolio management capabilities of, the fund’s portfolio management personnel and that Dreyfus also provides oversight of day-to-day fund operations, including fund accounting and administration and assistance in meeting legal and regulatory requirements.The Board members also considered Dreyfusí extensive administrative, accounting, and compliance infrastructures.The Board also considered portfolio managementís brokerage policies and practices (including policies and practices regarding soft dollars) and the standards applied in seeking best execution.
34
Comparative Analysis of the Fund’s Performance and Management Fee and Expense Ratio. The Board members reviewed reports prepared by Lipper, Inc. (“Lipper”), an independent provider of investment company data, which included information comparing (1) the fund’s performance with the performance of a group of comparable funds (the “Performance Group”) and with a broader group of funds (the “Performance Universe”), all for various periods ended December 31, 2010, and (2) the fund’s actual and contractual management fees and total expenses with those of a group of comparable funds (the “Expense Group”) and with a broader group of funds (the “Expense Universe”), the information for which was derived in part from fund financial statements available to Lipper as of May 31, 2010. Dreyfus previously had furnished the Board with a description of the methodology Lipper used to select the Performance Group and Performance Universe and the Expense Group and Expense Universe.
Dreyfus representatives stated that the usefulness of performance comparisons may be affected by a number of factors, including different investment limitations that may be applicable to the fund and comparison funds.The Board members discussed the results of the comparisons and noted that the fund’s total return performance was below the Performance Group and Performance Universe medians. Dreyfus also provided a comparison of the fund’s calendar year total returns to the returns of the fund’s benchmark index.
The Board members also reviewed the range of actual and contractual management fees and total expenses of the Expense Group and Expense Universe funds and discussed the results of the comparisons.They noted that the fund’s contractual management fee (which was waived to zero pursuant to an agreement with Dreyfus) was below the Expense Group median, the fund’s actual management fee was below the Expense Group and Expense Universe medians and the fund’s total expenses were above the Expense Group and Expense Universe medians.
|
| INFORMATION ABOUT THE RENEWAL OF THE FUND’S |
| MANAGEMENT AGREEMENT (Unaudited) (continued) |
A representative of Dreyfus noted that Dreyfus has contractually agreed to waive receipt of its fees and/or assume the expenses of the fund, until October 1, 2011, so that annual direct fund operating expenses (excluding Rule 12b-1 fees, shareholder services fees, taxes, interest, brokerage commissions, acquired fund fees and extraordinary expenses) do not exceed 1.25% of the fund’s average daily net assets.
Representatives of Dreyfus reviewed with the Board members the management or investment advisory fees (1) paid by funds advised or administered by Dreyfus that are in the same Lipper category as the fund and (2) paid to Dreyfus or the Dreyfus-affiliated primary employer of the fund’s primary portfolio manager for advising any separate accounts and/or other types of client portfolios that are considered to have similar investment strategies and policies as the fund (the “Similar Clients”), and explained the nature of the Similar Clients.They discussed differences in fees paid and the relationship of the fees paid in light of any differences in the services provided and other relevant factors.The Board members considered the relevance of the fee information provided for the Similar Clients to evaluate the appropriateness and reasonableness of the fund’s management fee.
Analysis of Profitability and Economies of Scale. Dreyfus’ representatives reviewed the expenses allocated and profit received by Dreyfus and the resulting profitability percentage for managing the fund, and the method used to determine the expenses and profit. The Board concluded that the profitability results were not unreasonable, given the services rendered and service levels provided by Dreyfus. The Board also noted the expense limitation arrangement and its effect on Dreyfus’ profitability. The Board previously had been provided with information prepared by an independent consulting firm regarding Dreyfus’ approach to allocating costs to, and determining the profitability of, individual funds and the entire Dreyfus fund complex.The consulting firm also had analyzed where any economies of scale might emerge in connection with the management of a fund.
The Board’s counsel stated that the Board members should consider the profitability analysis (1) as part of their evaluation of whether the
36
fees under the Agreement bear a reasonable relationship to the mix of services provided by Dreyfus, including the nature, extent and quality of such services, and (2) in light of the relevant circumstances for the fund and the extent to which economies of scale would be realized if the fund grows and whether fee levels reflect these economies of scale for the benefit of fund shareholders. Dreyfus representatives noted that, as a result of shared and allocated costs among funds in the Dreyfus funds complex, the extent of economies of scale could depend substantially on the level of assets in the complex as a whole, so that increases and decreases in complex-wide assets can affect potential economies of scale in a manner that is disproportionate to, or even in the opposite direction from, changes in the fund’s asset level. The Board members also considered potential benefits to Dreyfus from acting as investment adviser and noted that there were no soft dollar arrangements in effect for trading the fund’s investments.
At the conclusion of these discussions, the Board agreed that it had been furnished with sufficient information to make an informed business decision with respect to the renewal of the Agreement. Based on the discussions and considerations as described above, the Board concluded and determined as follows.
The Board concluded that the nature, extent and quality of the services provided by Dreyfus are adequate and appropriate.
The Board generally was concerned with the fund’s relative perfor- mance and agreed to closely monitor performance.
The Board concluded that the fee paid to Dreyfus was reasonable in light of the considerations described above.
The Board determined that the economies of scale which may accrue to Dreyfus and its affiliates in connection with the management of the fund had been adequately considered by Dreyfus in connection with the fee rate charged to the fund pursuant to the Agreement and that, to the extent in the future it were determined that material economies of scale had not been shared with the fund, the Board would seek to have those economies of scale shared with the fund.
|
| INFORMATION ABOUT THE RENEWAL OF THE FUND’S |
| MANAGEMENT AGREEMENT (Unaudited) (continued) |
The Board members considered these conclusions and determinations, along with information received on a routine and regular basis throughout the year. In addition, it should be noted that the Board’s consideration of the contractual fee arrangements for this fund had the benefit of a number of years of reviews of prior or similar agreements during which lengthy discussions took place between the Board members and Dreyfus representatives. Certain aspects of the arrangements may receive greater scrutiny in some years than in others, and the Board members’ conclusions may be based, in part, on their consideration of the same or similar arrangements in prior years. The Board members determined that renewal of the Agreement was in the best interests of the fund and its shareholders.
38
OFFICERS OF THE FUND (Unaudited)
BRADLEY J. SKAPYAK, President since January 2010.
Chief Operating Officer and a director of the Manager since June 2009. From April 2003 to June 2009, Mr. Skapyak was the head of the Investment Accounting and Support Department of the Manager. He is an officer of 76 investment companies (comprised of 170 portfolios) managed by the Manager. He is 52 years old and has been an employee of the Manager since February 1988.
MICHAEL A. ROSENBERG, Vice President and Secretary since August 2005.
Assistant General Counsel of BNY Mellon, and an officer of 77 investment companies (comprised of 195 portfolios) managed by the Manager. He is 51 years old and has been an employee of the Manager since October 1991.
KIESHA ASTWOOD, Vice President and Assistant Secretary since January 2010.
Counsel of BNY Mellon, and an officer of 77 investment companies (comprised of 195 portfolios) managed by the Manager. She is 38 years old and has been an employee of the Manager since July 1995.
JAMES BITETTO, Vice President and Assistant Secretary since August 2005.
Senior Counsel of BNY Mellon and Secretary of the Manager, and an officer of 77 investment companies (comprised of 195 portfolios) managed by the Manager. He is 44 years old and has been an employee of the Manager since December 1996.
JONI LACKS CHARATAN, Vice President and Assistant Secretary since August 2005.
Senior Counsel of BNY Mellon, and an officer of 77 investment companies (comprised of 195 portfolios) managed by the Manager. She is 55 years old and has been an employee of the Manager since October 1988.
JOSEPH M. CHIOFFI, Vice President and Assistant Secretary since August 2005.
Senior Counsel of BNY Mellon, and an officer of 77 investment companies (comprised of 195 portfolios) managed by the Manager. He is 49 years old and has been an employee of the Manager since June 2000.
KATHLEEN DENICHOLAS, Vice President and Assistant Secretary since January 2010.
Senior Counsel of BNY Mellon, and an officer of 77 investment companies (comprised of 195 portfolios) managed by the Manager. She is 36 years old and has been an employee of the Manager since February 2001.
JANETTE E. FARRAGHER, Vice President and Assistant Secretary since August 2005.
Assistant General Counsel of BNY Mellon, and an officer of 77 investment companies (comprised of 195 portfolios) managed by the Manager. She is 48 years old and has been an employee of the Manager since February 1984.
JOHN B. HAMMALIAN, Vice President and Assistant Secretary since August 2005.
Managing Counsel of BNY Mellon, and an officer of 77 investment companies (comprised of 195 portfolios) managed by the Manager. He is 47 years old and has been an employee of the Manager since February 1991.
M. CRISTINA MEISER, Vice President and Assistant Secretary since January 2010.
Senior Counsel of BNY Mellon, and an officer of 77 investment companies (comprised of 195 portfolios) managed by the Manager. She is 41 years old and has been an employee of the Manager since August 2001.
The Fund 41
OFFICERS OF THE FUND (Unaudited) (continued)
ROBERT R. MULLERY, Vice President and Assistant Secretary since August 2005.
Managing Counsel of BNY Mellon, and an officer of 77 investment companies (comprised of 195 portfolios) managed by the Manager. He is 59 years old and has been an employee of the Manager since May 1986.
JEFF PRUSNOFSKY, Vice President and Assistant Secretary since August 2005.
Managing Counsel of BNY Mellon, and an officer of 77 investment companies (comprised of 195 portfolios) managed by the Manager. He is 46 years old and has been an employee of the Manager since October 1990.
JAMES WINDELS, Treasurer since November 2001.
Director – Mutual Fund Accounting of the Manager, and an officer of 77 investment companies (comprised of 195 portfolios) managed by the Manager. He is 52 years old and has been an employee of the Manager since April 1985.
RICHARD CASSARO, Assistant Treasurer since January 2008.
Senior Accounting Manager – Money Market and Municipal Bond Funds of the Manager, and an officer of 77 investment companies (comprised of 195 portfolios) managed by the Manager. He is 52 years old and has been an employee of the Manager since September 1982.
GAVIN C. REILLY, Assistant Treasurer since December 2005.
Tax Manager of the Investment Accounting and Support Department of the Manager, and an officer of 77 investment companies (comprised of 195 portfolios) managed by the Manager. He is 42 years old and has been an employee of the Manager since April 1991.
ROBERT ROBOL, Assistant Treasurer since August 2002.
Senior Accounting Manager – Fixed Income Funds of the Manager, and an officer of 77 investment companies (comprised of 195 portfolios) managed by the Manager. He is 47 years old and has been an employee of the Manager since October 1988.
ROBERT SALVIOLO, Assistant Treasurer since July 2007.
Senior Accounting Manager – Equity Funds of the Manager, and an officer of 77 investment companies (comprised of 195 portfolios) managed by the Manager. He is 44 years old and has been an employee of the Manager since June 1989.
ROBERT SVAGNA, Assistant Treasurer since December 2002.
Senior Accounting Manager – Equity Funds of the Manager, and an officer of 77 investment companies (comprised of 195 portfolios) managed by the Manager. He is 44 years old and has been an employee of the Manager since November 1990.
42
JOSEPH W. CONNOLLY, Chief Compliance Officer since October 2004.
Chief Compliance Officer of the Manager and The Dreyfus Family of Funds (77 investment companies, comprised of 195 portfolios). From November 2001 through March 2004, Mr. Connolly was first Vice-President, Mutual Fund Servicing for Mellon Global Securities Services. In that capacity, Mr. Connolly was responsible for managing Mellon’s Custody, Fund Accounting and Fund Administration services to third-party mutual fund clients. He is 54 years old and has served in various capacities with the Manager since 1980, including manager of the firm’s Fund Accounting Department from 1997 through October 2001.
STEPHEN J. STOREN, Anti-Money Laundering Compliance Officer since May 2011.
Chief Compliance Officer of the Distributor, and the Anti-Money Laundering Compliance Officer of 73 investment companies (comprised of 191 portfolios) managed by the Manager. He is 56 years old and has been an employee of the Distributor since October 1999.
The Fund 43

Item 2. Code of Ethics.
The Registrant has adopted a code of ethics that applies to the Registrant's principal executive officer, principal financial officer, principal accounting officer or controller, or persons performing similar functions. There have been no amendments to, or waivers in connection with, the Code of Ethics during the period covered by this Report.
Item 3. Audit Committee Financial Expert.
The Registrant's Board has determined that Joseph S. DiMartino, a member of the Audit Committee of the Board, is an audit committee financial expert as defined by the Securities and Exchange Commission (the "SEC"). Joseph S. DiMartino is "independent" as defined by the SEC for purposes of audit committee financial expert determinations.
Item 4. Principal Accountant Fees and Services.
(a) Audit Fees. The aggregate fees billed for each of the last two fiscal years (the "Reporting Periods") for professional services rendered by the Registrant's principal accountant (the "Auditor") for the audit of the Registrant's annual financial statements or services that are normally provided by the Auditor in connection with the statutory and regulatory filings or engagements for the Reporting Periods, were $70,295 in 2010 and $71,690 in 2011.
(b) Audit-Related Fees. The aggregate fees billed in the Reporting Periods for assurance and related services by the Auditor that are reasonably related to the performance of the audit of the Registrant's financial statements and are not reported under paragraph (a) of this Item 4 were $ 9,200 in 2010 and $9,380 in 2011. These services consisted of one or more of the following: (i) agreed upon procedures related to compliance with Internal Revenue Code section 817(h), (ii) security counts required by Rule 17f-2 under the Investment Company Act of 1940, as amended, (iii) advisory services as to the accounting or disclosure treatment of Registrant transactions or events and (iv) advisory services to the accounting or disclosure treatment of the actual or potential impact to the Registrant of final or proposed rules, standards or interpretations by the Securities and Exchange Commission, the Financial Accounting Standards Boards or other regulatory or standard-setting bodies.
The aggregate fees billed in the Reporting Periods for non-audit assurance and related services by the Auditor to the Registrant's investment adviser (not including any sub-investment adviser whose role is primarily portfolio management and is subcontracted with or overseen by another investment adviser), and any entity controlling, controlled by or under common control with the investment adviser that provides ongoing services to the Registrant ("Service Affiliates"), that were reasonably related to the performance of the annual audit of the Service Affiliate, which required pre-approval by the Audit Committee were $0 in 2010 and $0 in 2011.
(c) Tax Fees. The aggregate fees billed in the Reporting Periods for professional services rendered by the Auditor for tax compliance, tax advice, and tax planning ("Tax Services") were $4,540 in 2010 and $4,620 in 2011. These services consisted of review or preparation of U.S. federal, state, local and excise tax returns. The aggregate fees billed in the Reporting Periods for Tax Services by the Auditor to Service Affiliates, which required pre-approval by the Audit Committee were $0 in 2010 and $0 in 2011.
(d) All Other Fees. The aggregate fees billed in the Reporting Periods for products and services provided by the Auditor, other than the services reported in paragraphs (a) through (c) of this Item, were $0 in 2010 and $0 in 2011.
The aggregate fees billed in the Reporting Periods for Non-Audit Services by the Auditor to Service Affiliates, other than the services reported in paragraphs (b) through (c) of this Item, which required pre-approval by the Audit Committee, were $0 in 2010 and $0 in 2011.
(e)(1) Audit Committee Pre-Approval Policies and Procedures. The Registrant's Audit Committee has established policies and procedures (the "Policy") for pre-approval (within specified fee limits) of the Auditor's engagements for non-audit services to the Registrant and Service Affiliates without specific case-by-case consideration. The pre-approved services in the Policy can include pre-approved audit services, pre-approved audit-related services, pre-approved tax services and pre-approved all other services. Pre-approval considerations include whether the proposed services are compatible with maintaining the Auditor's independence. Pre-approvals pursuant to the Policy are considered annually.
(e)(2) Note: None of the services described in paragraphs (b) through (d) of this Item 4 were approved by the Audit Committee pursuant to paragraph (c)(7)(i)(C) of Rule 2-01 of Regulation S-X.
(f) None of the hours expended on the principal accountant's engagement to audit the registrant's financial statements for the most recent fiscal year were attributed to work performed by persons other than the principal account's full-time, permanent employees.
Non-Audit Fees. The aggregate non-audit fees billed by the Auditor for services rendered to the Registrant, and rendered to Service Affiliates, for the Reporting Periods were $3,352,000 in 2010 and $13,285,000 in 2011.
Auditor Independence. The Registrant's Audit Committee has considered whether the provision of non-audit services that were rendered to Service Affiliates, which were not pre-approved (not requiring pre-approval), is compatible with maintaining the Auditor's independence.
Item 5. Audit Committee of Listed Registrants.
Not applicable. [CLOSED-END FUNDS ONLY]
Item 6. Investments.
(a) Not applicable.
Item 7. Disclosure of Proxy Voting Policies and Procedures for Closed-End Management Investment Companies.
Not applicable. [CLOSED-END FUNDS ONLY]
Item 8. Portfolio Managers of Closed-End Management Investment Companies.
Not applicable. [CLOSED-END FUNDS ONLY, beginning with reports for periods ended on and after December 31, 2005]
Item 9. Purchases of Equity Securities by Closed-End Management Investment Companies and Affiliated Purchasers.
Not applicable. [CLOSED-END FUNDS ONLY]
Item 10. Submission of Matters to a Vote of Security Holders.
There have been no material changes to the procedures applicable to Item 10.
Item 11. Controls and Procedures.
(a) The Registrant's principal executive and principal financial officers have concluded, based on their evaluation of the Registrant's disclosure controls and procedures as of a date within 90 days of the filing date of this report, that the Registrant's disclosure controls and procedures are reasonably designed to ensure that information required to be disclosed by the Registrant on Form N-CSR is recorded, processed, summarized and reported within the required time periods and that information required to be disclosed by the Registrant in the reports that it files or submits on Form N-CSR is accumulated and communicated to the Registrant's management, including its principal executive and principal financial officers, as appropriate to allow timely decisions regarding required disclosure.
(b) There were no changes to the Registrant's internal control over financial reporting that occurred during the second fiscal quarter of the period covered by this report that have materially affected, or are reasonably likely to materially affect, the Registrant's internal control over financial reporting.
Item 12. Exhibits.
(a)(1) Code of ethics referred to in Item 2.
(a)(2) Certifications of principal executive and principal financial officers as required by Rule 30a-2(a) under the Investment Company Act of 1940.
(a)(3) Not applicable.
(b) Certification of principal executive and principal financial officers as required by Rule 30a-2(b) under the Investment Company Act of 1940.
SIGNATURES
Pursuant to the requirements of the Securities Exchange Act of 1934 and the Investment Company Act of 1940, the Registrant has duly caused this Report to be signed on its behalf by the undersigned, thereunto duly authorized.
The Dreyfus/Laurel Funds Trust
By: /s/ Bradley J. Skapyak |
Bradley J. Skapyak, President |
Date: July 25, 2011 |
|
Pursuant to the requirements of the Securities Exchange Act of 1934 and the Investment Company Act of 1940, this Report has been signed below by the following persons on behalf of the Registrant and in the capacities and on the dates indicated. |
|
By: /s/ Bradley J. Skapyak |
Bradley J. Skapyak, President |
Date: July 25, 2011 |
|
By: /s/ James Windels |
James Windels, Treasurer |
Date: July 25, 2011 |
|
EXHIBIT INDEX
(a)(1) Code of ethics referred to in Item 2.
(a)(2) Certifications of principal executive and principal financial officers as required by Rule 30a-2(a) under the Investment Company Act of 1940. (EX-99.CERT)
(b) Certification of principal executive and principal financial officers as required by Rule 30a-2(b) under the Investment Company Act of 1940. (EX-99.906CERT)