UNITED STATES
SECURITIES AND EXCHANGE COMMISSION
Washington, D.C. 20549
FORM N-CSR
CERTIFIED SHAREHOLDER REPORT OF REGISTERED MANAGEMENT
INVESTMENT COMPANIES
Investment Company Act file number | 811- 524 |
| |
| The Dreyfus/Laurel Funds Trust | |
| (Exact name of Registrant as specified in charter) | |
| | |
| c/o The Dreyfus Corporation 200 Park Avenue New York, New York 10166 | |
| (Address of principal executive offices) (Zip code) | |
| | |
| Michael A. Rosenberg, Esq. 200 Park Avenue New York, New York 10166 | |
| (Name and address of agent for service) | |
|
Registrant's telephone number, including area code: | (212) 922-6000 |
| |
Date of fiscal year end: | 10/31 | |
Date of reporting period: | 10/31/11 | |
| | | | | | | |
The following N-CSR relates only to the series of the Registrant listed below, and does not affect the other series of the Registrant, which have different fiscal year ends and, therefore, different N-CSR reporting requirements. Separate N-CSR Forms will be filed for those series, as appropriate.
Dreyfus Global Equity Income Fund
Dreyfus International Bond Fund
FORM N-CSR
Item 1. Reports to Stockholders.
|
| Dreyfus |
| Global Equity |
| Income Fund |
ANNUAL REPORT October 31, 2011

Save time. Save paper. View your next shareholder report online as soon as it’s available. Log into www.dreyfus.com and sign up for Dreyfus eCommunications. It’s simple and only takes a few minutes.
The views expressed in this report reflect those of the portfolio manager only through the end of the period covered and do not necessarily represent the views of Dreyfus or any other person in the Dreyfus organization. Any such views are subject to change at any time based upon market or other conditions and Dreyfus disclaims any responsibility to update such views.These views may not be relied on as investment advice and, because investment decisions for a Dreyfus fund are based on numerous factors, may not be relied on as an indication of trading intent on behalf of any Dreyfus fund.
|
| Not FDIC-Insured • Not Bank-Guaranteed • May Lose Value |
| | Contents |
| | THE FUND |
| 2 | A Letter from the Chairman and CEO |
| 3 | Discussion of Fund Performance |
| 6 | Fund Performance |
| 8 | Understanding Your Fund’s Expenses |
| 8 | Comparing Your Fund’s Expenses With Those of Other Funds |
| 9 | Statement of Investments |
| 13 | Statement of Assets and Liabilities |
| 14 | Statement of Operations |
| 15 | Statement of Changes in Net Assets |
| 17 | Financial Highlights |
| 20 | Notes to Financial Statements |
| 35 | Report of Independent Registered Public Accounting Firm |
| 36 | Important Tax Information |
| 37 | Board Members Information |
| 39 | Officers of the Fund |
| | FOR MORE INFORMATION |
| | Back Cover |
Dreyfus
Global Equity
Income Fund
The Fund

A LETTER FROM THE CHAIRMAN AND CEO
Dear Shareholder:
We present to you this annual report for Dreyfus Global Equity Income Fund, covering the 12-month period from November 1, 2010, through October 31, 2011. For information about how the fund performed during the reporting period, as well as general market perspectives, we provide a Discussion of Fund Performance on the pages that follow.
Investors were encouraged by expectations of a more robust economic recovery during the final months of 2010, but sentiment deteriorated in 2011 due to disappointing global economic data, rising commodity prices, an escalating sovereign debt crisis in Europe and a contentious debate regarding taxes, spending and borrowing in the United States. International stocks proved sensitive to these macroeconomic developments, often regardless of underlying company fundamentals, and most international equity market indices ended the reporting period with mildly negative absolute returns.
The global economic outlook currently remains clouded by market turbulence and political infighting, but we believe that a continued sub-par global expansion is more likely than a return to recession.Although Europe continues to struggle with a debt crisis, inflationary pressures appear to be waning in most countries as energy prices recently have retreated from their highs. In Asia, China seems to have averted an economic contraction after implementing measures to dampen inflationary pressures. In the United States, moderately low core inflation and an accommodative monetary policy could help support near-trend growth despite ongoing deleveraging activity in the private sector.To assess the potential impact of these and other developments on your investments, we encourage you, as always, to speak with your financial advisor.
Thank you for your continued confidence and support.

Jonathan R. Baum
Chairman and Chief Executive Officer
The Dreyfus Corporation
November 15, 2011
2

DISCUSSION OF FUND PERFORMANCE
For the period of November 1, 2010, through October 31, 2011, as provided by James Harries, Portfolio Manager of Newton Capital Management Limited, Sub-Investment Adviser
Fund and Market Performance Overview
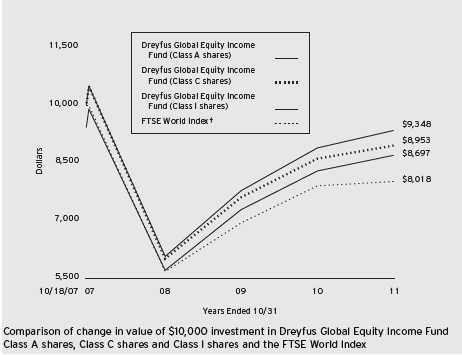
For the 12-month period ended October 31, 2011, Dreyfus Global Equity Income Fund’s Class A shares produced a total return of 4.86%, Class C shares returned 4.01% and Class I shares returned 5.11%.1 In comparison, the fund’s benchmark, the FTSE World Index (the “Index”), produced a total return of 1.41% for the same period.2 Strong corporate earnings drove global stocks higher over the reporting period’s first half, but macroeconomic challenges later caused the Index to give back most of those gains.The fund produced higher returns than its benchmark, primarily due to a generally defensive bias in the fund’s sector allocation and stock selection strategies.
The Fund’s Investment Approach
The fund seeks total return, consisting of capital appreciation and income.To pursue this goal, the fund normally invests at least 80% of its assets in equity securities, seeking to focus on dividend-paying stocks of companies located in emerging as well as developed capital markets, such as the United States, Canada, Japan, Australia, Hong Kong and Western Europe. The fund may invest in the securities of companies of any market capitalization, and it may invest up to 30% of its assets in emerging markets.
We combine “top-down” analysis of current economic trends and investment themes with “bottom-up” stock selection based on fundamental research. Within markets and sectors deemed to be relatively attractive, we seek attractively priced stocks of companies that we believe to have sustainable competitive advantages.
Macroeconomic Developments Challenged Global Growth
Positive market sentiment generally prevailed over the final months of 2010 amid expectations of continued global economic recovery. In early 2011, however, investors grew increasingly concerned about inflationary pressures in China and rising energy prices stemming from
DISCUSSION OF FUND PERFORMANCE (continued)
political unrest in the Middle East. In March, catastrophic natural and nuclear disasters struck Japan, disrupting the global industrial supply chain. Nonetheless, many equity markets rebounded quickly from these unexpected shocks.
By May, investor sentiment began to deteriorate in earnest. U.S. economic growth proved more sluggish than expected, and investors worried about a contentious debate regarding U.S. government spending, borrowing and taxes. In Europe, the debt problems facing Ireland, Portugal, Spain and Italy intensified, and Greece faced the possibility of default. Consequently, global markets lost nearly all of the ground they had gained earlier, ending the reporting period with only a mild gain, on average. In a reversal of the trend over the past several years, the developed markets generally fared better than the emerging markets.
Defensive Positioning Buoyed Relative Performance
In light of our longstanding concerns regarding deleveraging activity in the private and public sectors, we maintained a defensive investment posture throughout the reporting period, focusing primarily on larger, dividend-paying companies with stable customer demand and healthy finances. This bias helped the fund hold up better than the Index during the market downturn.
The fund’s relative results were particularly bolstered by underweighted exposure to the financials sector, where we generally avoided banks with exposure to euro zone debt.The fund’s holdings in more stable regions—including Norway’s DnB Nor, Singapore’s DBS Group Holdings and U.K.-based Standard Chartered—fared substantially better.The fund also scored successes in the traditionally defensive consumer goods sector, where we had identified attractive values among well-established companies with products that remain in demand regardless of economic conditions. For example, top performers in this area included U.S.-based multinationals Coca-Cola and Procter & Gamble.
Disappointments during the reporting period were concentrated to a degree in the industrials sector, where Hutchison Port Holdings Trust and Deutsche Post struggled amid global economic concerns, particularly regarding the potential impact of inflation-fighting efforts in China.The fund’s investments in the consumer services sector also lagged market averages, mainly due to underweighted exposure to a relatively strong industry group.
4
Valuations Becoming Increasingly Attractive
As of the reporting period’s end, we have maintained a generally cautious outlook. Although a renewed global recession looks unlikely at this point, inflation-fighting efforts in the emerging markets have dampened a major engine of global growth, Europe has continued to struggle with its sovereign debt crisis and unemployment has remained stubbornly elevated in the United States. However, the market downturn has produced more attractive valuations among companies that may have been punished more severely than warranted by underlying business fundamentals, and we may adopt a more constructive investment posture when conditions stabilize.
In the meantime, we have focused primarily on large, dividend-paying companies with solid fundamentals and strong balance sheets.We have found a number of opportunities in the telecommunications and health care sectors through our Networked World and Healthy Demand investment themes. Fewer companies have met our criteria in the more economically sensitive information technology and financials sectors.
November 15, 2011
| |
| | Please note, the position in any security highlighted with italicized typeface was sold during the |
| | reporting period. |
| | Equity funds are subject generally to market, market sector, market liquidity, issuer and investment |
| | style risks, among other factors, to varying degrees, all of which are more fully described in the |
| | fund’s prospectus. |
| | The fund’s performance will be influenced by political, social and economic factors affecting |
| | investments in foreign companies. Special risks associated with investments in foreign companies |
| | include exposure to currency fluctuations, less liquidity, less developed or less efficient trading |
| | markets, lack of comprehensive company information, political instability and differing auditing |
| | and legal standards.These risks generally are greater with emerging market countries than with |
| | more economically and politically established foreign countries. |
| 1 | Total return includes reinvestment of dividends and any capital gains paid, and does not take into |
| | consideration the maximum initial sales charge in the case of Class A shares, or the applicable |
| | contingent deferred sales charge imposed on redemptions in the case of Class C shares. Had these |
| | charges been reflected, returns would have been lower. Past performance is no guarantee of future |
| | results. Share price and investment return fluctuate such that upon redemption, fund shares may be |
| | worth more or less than their original cost. Return figures provided reflect the absorption of certain |
| | fund expenses pursuant to an agreement by The Dreyfus Corporation through March 1, 2012, at |
| | which time it may be extended, terminated or modified. Had these expenses not been absorbed, |
| | the fund’s returns would have been lower. |
| 2 | SOURCE: BLOOMBERG L.P. — Reflects reinvestment of dividends and, where applicable, |
| | capital gain distributions.The FTSE World Index is an unmanaged, free-floating, market- |
| | capitalization weighted index that is designed to measure the performance of 90% of the world’s |
| | investable stocks issued by large and midcap companies in developed and advanced emerging |
| | markets. Investors cannot invest directly in any index. |
FUND PERFORMANCE
|
| † Source: Bloomberg L.P. |
| Past performance is not predictive of future performance. |
| The above graph compares a $10,000 investment made in Class A, Class C and Class I shares of Dreyfus Global |
| Equity Income Fund on 10/18/07 (inception date) to a $10,000 investment made in the FTSE World Index (the |
| “Index”) on that date.All dividends and capital gain distributions are reinvested. |
| The fund’s performance shown in the line graph above takes into account the maximum initial sales charge on Class A |
| shares and all other applicable fees and expenses on all classes.The Index is a widely accepted, unmanaged, free-float |
| market capitalization-weighted index that is designed to measure the performance of 90% of the world’s investable stocks |
| issued by large and mid-cap companies in developed and advanced emerging markets. Unlike a mutual fund, the Index is |
| not subject to charges, fees and other expenses. Investors cannot invest directly in any index. Further information relating |
| to fund performance, including expense reimbursements, if applicable, is contained in the Financial Highlights section of |
| the prospectus and elsewhere in this report. |
6
| | | | | |
| Average Annual Total Returns as of 10/31/11 | | | |
| |
| | Inception | | From |
| | Date | 1Year | Inception |
| Class A shares | | | |
| with maximum sales charge (5.75%) | 10/18/07 | –1.19% | –3.40% |
| without sales charge | 10/18/07 | 4.86% | –1.97% |
| Class C shares | | | |
| with applicable redemption charge † | 10/18/07 | 3.01% | –2.70% |
| without redemption | 10/18/07 | 4.01% | –2.70% |
| Class I shares | 10/18/07 | 5.11% | –1.66% |
| FTSE World Index | 10/31/07 | 1.41% | –5.37%†† |
Past performance is not predictive of future performance.The fund’s performance shown in the graph and table does not reflect the deduction of taxes that a shareholder would pay on fund distributions or the redemption of fund shares.
| |
| † | The maximum contingent deferred sales charge for Class C shares is 1% for shares redeemed within one year of the |
| | date of purchase. |
| †† | For comparative purposes, the value of the Index as of 10/31/07 is used as the beginning value on 10/18/07. |
UNDERSTANDING YOUR FUND’S EXPENSES (Unaudited)
As a mutual fund investor, you pay ongoing expenses, such as management fees and other expenses. Using the information below, you can estimate how these expenses affect your investment and compare them with the expenses of other funds.You also may pay one-time transaction expenses, including sales charges (loads) and redemption fees, which are not shown in this section and would have resulted in higher total expenses. For more information, see your fund’s prospectus or talk to your financial adviser.
Review your fund’s expenses
The table below shows the expenses you would have paid on a $1,000 investment in Dreyfus Global Equity Income Fund from May 1, 2011 to October 31, 2011. It also shows how much a $1,000 investment would be worth at the close of the period, assuming actual returns and expenses.
Expenses and Value of a $1,000 Investment
assuming actual returns for the six months ended October 31, 2011
| | | | | | |
| | | Class A | | Class C | | Class I |
| Expenses paid per $1,000† | $ | 7.29 | $ | 10.92 | $ | 6.08 |
| Ending value (after expenses) | $ | 928.70 | $ | 925.50 | $ | 930.20 |
COMPARING YOUR FUND’S EXPENSES
WITH THOSE OF OTHER FUNDS (Unaudited)
Using the SEC’s method to compare expenses
The Securities and Exchange Commission (SEC) has established guidelines to help investors assess fund expenses. Per these guidelines, the table below shows your fund’s expenses based on a $1,000 investment, assuming a hypothetical 5% annualized return. You can use this information to compare the ongoing expenses (but not transaction expenses or total cost) of investing in the fund with those of other funds.All mutual fund shareholder reports will provide this information to help you make this comparison. Please note that you cannot use this information to estimate your actual ending account balance and expenses paid during the period.
|
| Expenses and Value of a $1,000 Investment |
| assuming a hypothetical 5% annualized return for the six months ended October 31, 2011 |
| | | | | | |
| | | Class A | | Class C | | Class I |
| Expenses paid per $1,000† | $ | 7.63 | $ | 11.42 | $ | 6.36 |
| Ending value (after expenses) | $ | 1,017.64 | $ | 1,013.86 | $ | 1,018.90 |
|
| † Expenses are equal to the fund’s annualized expense ratio of 1.50% for Class A, 2.25% for Class C and 1.25% |
| for Class I, multiplied by the average account value over the period, multiplied by 184/365 (to reflect the one-half |
| year period). |
8
|
| STATEMENT OF INVESTMENTS |
| October 31, 2011 |
| | |
| Common Stocks—93.3% | Shares | Value ($) |
| Australia—3.1% | | |
| AMP | 58,110 | 258,566 |
| WorleyParsons | 9,030 | 261,299 |
| | | 519,865 |
| Brazil—2.9% | | |
| Cia de Saneamento de Minas Gerais | 11,300 | 212,198 |
| Tele Norte Leste Participacoes, ADR | 15,269 | 165,669 |
| Transmissora Alianca de Energia Eletrica | 5,499 | 108,869 |
| | | 486,736 |
| Canada—1.1% | | |
| Husky Energy | 6,907 | 177,326 |
| France—3.2% | | |
| Suez Environnement | 11,184 | 175,567 |
| Total | 6,812 | 356,435 |
| | | 532,002 |
| Germany—7.1% | | |
| Bayer | 8,474 | 542,831 |
| Deutsche Post | 19,130 | 291,437 |
| Deutsche Telekom | 27,017 | 343,703 |
| | | 1,177,971 |
| Hong Kong—4.7% | | |
| China Mobile | 32,500 | 309,714 |
| Hopewell Highway Infrastructure | 254,229 | 139,776 |
| Link REIT | 95,500 | 326,416 |
| | | 775,906 |
| Italy—1.7% | | |
| ENI | 12,539 | 277,430 |
| Luxembourg—1.0% | | |
| SES | 6,454 | 165,212 |
| Netherlands—4.2% | | |
| Reed Elsevier | 14,547 | 179,387 |
| Royal Dutch Shell, Cl. A | 5,032 | 178,456 |
| Unilever | 9,601 | 331,724 |
| | | 689,567 |
STATEMENT OF INVESTMENTS (continued)
| | | |
| Common Stocks (continued) | Shares | Value ($) |
| Norway—4.1% | | |
| DnB NOR | 28,396 | 331,170 |
| Statoil | 13,724 | 350,179 |
| | | 681,349 |
| Poland—1.4% | | |
| Telekomunikacja Polska | 42,766 | 227,232 |
| Singapore—4.7% | | |
| DBS Group Holdings | 32,500 | 317,050 |
| Mapletree Logistics Trust | 235,030 | 159,296 |
| Parkway Life Real Estate Investment Trust | 103,000 | 147,042 |
| Singapore Technologies Engineering | 71,000 | 159,030 |
| | | 782,418 |
| South Africa—1.9% | | |
| MTN Group | 18,341 | 320,156 |
| Switzerland—7.8% | | |
| Nestle | 2,856 | 165,608 |
| Novartis | 5,747 | 324,799 |
| Roche Holding | 2,965 | 488,762 |
| Zurich Financial Services | 1,310a | 304,144 |
| | | 1,283,313 |
| Taiwan—3.4% | | |
| HTC | 10,422 | 231,749 |
| Taiwan Semiconductor Manufacturing | 139,000 | 338,997 |
| | | 570,746 |
| Thailand—1.9% | | |
| Advanced Info Service | 79,000 | 319,594 |
| United Kingdom—12.1% | | |
| Aberdeen Asset Management | 70,576 | 218,447 |
| BAE Systems | 45,040 | 200,313 |
10
| | | |
| Common Stocks (continued) | Shares | | Value ($) |
| United Kingdom (continued) | | | |
| Cable & Wireless Communications | 233,788 | | 136,229 |
| Centrica | 47,992 | | 228,952 |
| GlaxoSmithKline | 18,526 | | 417,031 |
| ICAP | 28,498 | | 185,166 |
| SSE | 19,278 | | 416,600 |
| Vodafone Group | 70,958 | | 197,210 |
| | | | 1,999,948 |
| United States—27.0% | | | |
| Abbott Laboratories | 6,176 | | 332,701 |
| Annaly Capital Management | 19,561 b | | 329,603 |
| AT&T | 11,267 | | 330,236 |
| Clorox | 4,924 | | 329,613 |
| ConocoPhillips | 3,834 | | 267,038 |
| Lockheed Martin | 2,195 | | 166,601 |
| Merck & Co. | 9,463 | | 326,474 |
| PDL BioPharma | 23,240 | | 141,067 |
| Pfizer | 16,464 | | 317,097 |
| Philip Morris International | 10,988 | | 767,732 |
| Procter & Gamble | 5,062 | | 323,917 |
| Reynolds American | 21,823 | | 844,113 |
| | | | 4,476,192 |
| Total Common Stocks | | | |
| (cost $15,117,160) | | | 15,462,963 |
| |
| Preferred Stocks—1.5% | | | |
| United Kingdom—1.5% | | | |
| AngloGold Ashanti Holdings Finance | | | |
| (cost $243,478) | 4,800 | | 246,048 |
STATEMENT OF INVESTMENTS (continued)
| | | | | |
| | Coupon | Maturity | Principal | |
| Bonds and Notes—1.9% | Rate (%) | Date | Amount ($) | Value ($) |
| United Kingdom | | | | |
| Standard Chartered, | | | | |
| Jr. Sub. Notes, | | | | |
| (cost $301,655) | 8.13 | 11/27/13 | 300,000a | 315,000 |
| |
| Other Investment—2.5% | | | Shares | Value ($) |
| Registered Investment Company; | | | | |
| Dreyfus Institutional Preferred | | | | |
| Plus Money Market Fund | | | | |
| (cost $414,588) | | | 414,588c | 414,588 |
| Total Investments (cost $16,076,881) | | | 99.2% | 16,438,599 |
| Cash and Receivables (Net) | | | .8% | 130,372 |
| Net Assets | | | 100.0% | 16,568,971 |
ADR—American Depository Receipts
REIT—Real Estate Investment Trust
| |
| a | Non-income producing security. |
| b | Investment in real estate investment trust. |
| c | Investment in affiliated money market mutual fund. |
| | | |
| Portfolio Summary (Unaudited)† | | |
| |
| | Value (%) | | Value (%) |
| Financial | 17.4 | Utilities | 6.9 |
| Consumer Goods | 16.6 | Materials | 4.8 |
| Health Care | 14.2 | Technology | 3.4 |
| Telecommunications | 14.2 | Money Market Investment | 2.5 |
| Oil & Gas | 9.7 | Consumer Services | 2.1 |
| Industrial | 7.4 | | 99.2 |
| |
| † Based on net assets. | | | |
| See notes to financial statements. | | | |
12
|
| STATEMENT OF ASSETS AND LIABILITIES |
| October 31, 2011 |
| | | |
| | Cost | Value |
| Assets ($): | | |
| Investments in securities—See Statement of Investments: | | |
| Unaffiliated issuers | 15,662,293 | 16,024,011 |
| Affiliated issuers | 414,588 | 414,588 |
| Cash | | 112,655 |
| Cash denominated in foreign currencies | 39,625 | 40,037 |
| Unrealized appreciation on forward foreign | | |
| currency exchange contracts—Note 4 | | 101,575 |
| Dividends and interest receivable | | 76,270 |
| Receivable for shares of Beneficial Interest subscribed | | 60,989 |
| Prepaid expenses | | 22,289 |
| | | 16,852,414 |
| Liabilities ($): | | |
| Due to The Dreyfus Corporation and affiliates—Note 3(c) | | 17,467 |
| Payable for investment securities purchased | | 200,217 |
| Payable for shares of Beneficial Interest redeemed | | 14,855 |
| Unrealized depreciation on forward foreign | | |
| currency exchange contracts—Note 4 | | 8,992 |
| Accrued expenses | | 41,912 |
| | | 283,443 |
| Net Assets ($) | | 16,568,971 |
| Composition of Net Assets ($): | | |
| Paid-in capital | | 16,774,596 |
| Accumulated undistributed investment income—net | | 179,372 |
| Accumulated net realized gain (loss) on investments | | (840,873) |
| Accumulated net unrealized appreciation (depreciation) | | |
| on investments and foreign currency transactions | | 455,876 |
| Net Assets ($) | | 16,568,971 |
| | | |
| Net Asset Value Per Share | | | |
| | Class A | Class C | Class I |
| Net Assets ($) | 5,709,601 | 2,657,603 | 8,201,767 |
| Shares Outstanding | 561,240 | 259,981 | 827,819 |
| Net Asset Value Per Share ($) | 10.17 | 10.22 | 9.91 |
|
| See notes to financial statements. |
|
| STATEMENT OF OPERATIONS |
| Year Ended October 31, 2011 |
| | |
| Investment Income ($): | |
| Income: | |
| Cash dividends (net of $45,030 foreign taxes withheld at source): | |
| Unaffiliated issuers | 781,189 |
| Affiliated issuers | 524 |
| Interest | 17,009 |
| Total Income | 798,722 |
| Expenses: | |
| Management fee—Note 3(a) | 137,864 |
| Auditing fees | 45,904 |
| Shareholder servicing costs—Note 3(c) | 41,717 |
| Registration fees | 38,115 |
| Custodian fees—Note 3(c) | 24,555 |
| Distribution fees—Note 3(b) | 19,770 |
| Prospectus and shareholders’ reports | 11,558 |
| Legal fees | 3,439 |
| Trustees’ fees and expenses—Note 3(d) | 853 |
| Loan commitment fees—Note 2 | 214 |
| Interest expense—Note 2 | 167 |
| Miscellaneous | 20,133 |
| Total Expenses | 344,289 |
| Less—reduction in management fee due to undertaking—Note 3(a) | (100,313) |
| Less—reduction in fees due to earnings credits—Note 3(c) | (8) |
| Net Expenses | 243,968 |
| Investment Income—Net | 554,754 |
| Realized and Unrealized Gain (Loss) on Investments—Note 4 ($): | |
| Net realized gain (loss) on investments and foreign currency transactions | 978,188 |
| Net realized gain (loss) on forward foreign currency exchange contracts | (270,345) |
| Net Realized Gain (Loss) | 707,843 |
| Net unrealized appreciation (depreciation) on | |
| investments and foreign currency transactions | (804,957) |
| Net unrealized appreciation (depreciation) on | |
| forward foreign currency exchange contracts | 194,194 |
| Net Unrealized Appreciation (Depreciation) | (610,763) |
| Net Realized and Unrealized Gain (Loss) on Investments | 97,080 |
| Net Increase in Net Assets Resulting from Operations | 651,834 |
| |
| See notes to financial statements. | |
14
STATEMENT OF CHANGES IN NET ASSETS
| | | | |
| | Year Ended October 31, |
| | 2011 | 2010 |
| Operations ($): | | |
| Investment income—net | 554,754 | 331,293 |
| Net realized gain (loss) on investments | 707,843 | 28,672 |
| Net unrealized appreciation | | |
| (depreciation) on investments | (610,763) | 805,247 |
| Net Increase (Decrease) in Net Assets | | |
| Resulting from Operations | 651,834 | 1,165,212 |
| Dividends to Shareholders from ($): | | |
| Investment income—net: | | |
| Class A Shares | (153,420) | (115,533) |
| Class C Shares | (43,286) | (13,752) |
| Class I Shares | (238,159) | (124,838) |
| Total Dividends | (434,865) | (254,123) |
| Beneficial Interest Transactions ($): | | |
| Net proceeds from shares sold: | | |
| Class A Shares | 4,540,839 | 1,977,236 |
| Class C Shares | 2,194,184 | 1,058,704 |
| Class I Shares | 4,452,679 | 6,539,111 |
| Dividends reinvested: | | |
| Class A Shares | 107,788 | 54,173 |
| Class C Shares | 9,818 | 4,451 |
| Class I Shares | 210,269 | 51,783 |
| Cost of shares redeemed: | | |
| Class A Shares | (4,417,557) | (791,830) |
| Class C Shares | (1,128,024) | (311,486) |
| Class I Shares | (2,682,554) | (2,804,273) |
| Increase (Decrease) in Net Assets from | | |
| Beneficial Interest Transactions | 3,287,442 | 5,777,869 |
| Total Increase (Decrease) in Net Assets | 3,504,411 | 6,688,958 |
| Net Assets ($): | | |
| Beginning of Period | 13,064,560 | 6,375,602 |
| End of Period | 16,568,971 | 13,064,560 |
| Undistributed investment income—net | 179,372 | 254,762 |
STATEMENT OF CHANGES IN NET ASSETS (continued)
| | | | |
| | Year Ended October 31, |
| | 2011 | 2010 |
| Capital Share Transactions: | | |
| Class A | | |
| Shares sold | 441,653 | 208,141 |
| Shares issued for dividends reinvested | 10,695 | 5,841 |
| Shares redeemed | (433,293) | (86,011) |
| Net Increase (Decrease) in Shares Outstanding | 19,055 | 127,971 |
| Class C | | |
| Shares sold | 215,127 | 113,469 |
| Shares issued for dividends reinvested | 969 | 477 |
| Shares redeemed | (112,314) | (34,079) |
| Net Increase (Decrease) in Shares Outstanding | 103,782 | 79,867 |
| Class I | | |
| Shares sold | 447,350 | 716,960 |
| Shares issued for dividends reinvested | 21,444 | 5,860 |
| Shares redeemed | (266,929) | (317,513) |
| Net Increase (Decrease) in Shares Outstanding | 201,865 | 405,307 |
| |
| See notes to financial statements. | | |
16
FINANCIAL HIGHLIGHTS
The following tables describe the performance for each share class for the fiscal periods indicated.All information (except portfolio turnover rate) reflects financial results for a single fund share.Total return shows how much your investment in the fund would have increased (or decreased) during each period, assuming you had reinvested all dividends and distributions.These figures have been derived from the fund’s financial statements.
| | | | | | | | | | |
| | | Year Ended October 31, | |
| Class A Shares | 2011 | 2010 | 2009 | 2008 | 2007a |
| Per Share Data ($): | | | | | |
| Net asset value, beginning of period | 9.97 | 9.03 | 7.35 | 13.14 | 12.50 |
| Investment Operations: | | | | | |
| Investment income—netb | .35 | .31 | .36 | .44 | .02 |
| Net realized and unrealized | | | | | |
| gain (loss) on investments | .13 | .92 | 1.60 | (5.90) | .62 |
| Total from Investment Operations | .48 | 1.23 | 1.96 | (5.46) | .64 |
| Distributions: | | | | | |
| Dividends from investment income—net | (.28) | (.29) | (.28) | (.33) | — |
| Net asset value, end of period | 10.17 | 9.97 | 9.03 | 7.35 | 13.14 |
| Total Return (%)c | 4.86 | 13.86 | 27.73 | (42.41) | 5.04d |
| Ratios/Supplemental Data (%): | | | | | |
| Ratio of total expenses | | | | | |
| to average net assets | 2.14 | 3.13 | 4.03 | 5.84 | 26.08e |
| Ratio of net expenses | | | | | |
| to average net assets | 1.50 | 1.50 | 1.49 | 1.44 | 1.50e |
| Ratio of net investment income | | | | | |
| to average net assets | 3.35 | 3.36 | 5.05 | 3.88 | 3.62e |
| Portfolio Turnover Rate | 54.88 | 56.17 | 70.29 | 99.04 | 3.45d |
| Net Assets, end of period ($ x 1,000) | 5,710 | 5,406 | 3,738 | 2,523 | 2,211 |
| |
| a | From October 18, 2007 (commencement of operations) to October 31, 2007. |
| b | Based on average shares outstanding at each month end. |
| c | Exclusive of sales charge. |
| d | Not annualized. |
| e | Annualized. |
See notes to financial statements.
FINANCIAL HIGHLIGHTS (continued)
| | | | | | | | | | |
| | | Year Ended October 31, | |
| Class C Shares | 2011 | 2010 | 2009 | 2008 | 2007a |
| Per Share Data ($): | | | | | |
| Net asset value, beginning of period | 10.02 | 9.01 | 7.33 | 13.13 | 12.50 |
| Investment Operations: | | | | | |
| Investment income—netb | .30 | .21 | .32 | .36 | .01 |
| Net realized and unrealized | | | | | |
| gain (loss) on investments | .10 | .97 | 1.58 | (5.89) | .62 |
| Total from Investment Operations | .40 | 1.18 | 1.90 | (5.53) | .63 |
| Distributions: | | | | | |
| Dividends from investment income—net | (.20) | (.17) | (.22) | (.27) | — |
| Net asset value, end of period | 10.22 | 10.02 | 9.01 | 7.33 | 13.13 |
| Total Return (%)c | 4.01 | 13.24 | 26.53 | (42.76) | 4.96d |
| Ratios/Supplemental Data (%): | | | | | |
| Ratio of total expenses | | | | | |
| to average net assets | 2.86 | 3.92 | 4.81 | 7.06 | 26.83e |
| Ratio of net expenses | | | | | |
| to average net assets | 2.25 | 2.25 | 2.25 | 2.18 | 2.25e |
| Ratio of net investment income | | | | | |
| to average net assets | 2.83 | 2.31 | 4.44 | 3.35 | 2.86e |
| Portfolio Turnover Rate | 54.88 | 56.17 | 70.29 | 99.04 | 3.45d |
| Net Assets, end of period ($ x 1,000) | 2,658 | 1,564 | 688 | 844 | 315 |
| |
| a | From October 18, 2007 (commencement of operations) to October 31, 2007. |
| b | Based on average shares outstanding at each month end. |
| c | Exclusive of sales charge. |
| d | Not annualized. |
| e | Annualized. |
See notes to financial statements.
18
| | | | | | | | | | |
| | | Year Ended October 31, | |
| Class I Shares | 2011 | 2010 | 2009 | 2008 | 2007a |
| Per Share Data ($): | | | | | |
| Net asset value, beginning of period | 9.74 | 8.83 | 7.34 | 13.14 | 12.50 |
| Investment Operations: | | | | | |
| Investment income—netb | .37 | .35 | .34 | .45 | .02 |
| Net realized and unrealized | | | | | |
| gain (loss) on investments | .12 | .89 | 1.61 | (5.90) | .62 |
| Total from Investment Operations | .49 | 1.24 | 1.95 | (5.45) | .64 |
| Distributions: | | | | | |
| Dividends from investment income—net | (.32) | (.33) | (.46) | (.35) | — |
| Net asset value, end of period | 9.91 | 9.74 | 8.83 | 7.34 | 13.14 |
| Total Return (%) | 5.11 | 14.39 | 28.21 | (42.27) | 5.04c |
| Ratios/Supplemental Data (%): | | | | | |
| Ratio of total expenses | | | | | |
| to average net assets | 1.86 | 2.82 | 3.78 | 5.32 | 25.84d |
| Ratio of net expenses | | | | | |
| to average net assets | 1.25 | 1.25 | 1.24 | 1.21 | 1.25d |
| Ratio of net investment income | | | | | |
| to average net assets | 3.68 | 3.85 | 4.99 | 3.90 | 3.86d |
| Portfolio Turnover Rate | 54.88 | 56.17 | 70.29 | 99.04 | 3.45c |
| Net Assets, end of period ($ x 1,000) | 8,202 | 6,094 | 1,949 | 177 | 315 |
| |
| a | From October 18, 2007 (commencement of operations) to October 31, 2007. |
| b | Based on average shares outstanding at each month end. |
| c | Not annualized. |
| d | Annualized. |
See notes to financial statements.
NOTES TO FINANCIAL STATEMENTS
NOTE 1—Significant Accounting Policies:
Dreyfus Global Equity Income Fund (the “fund”) is a separate diversified series of The Dreyfus/Laurel Funds Trust (the “Trust”), which is registered under the Investment Company Act of 1940, as amended (the “Act”), as an open-end management investment company and operates as a series company currently offering five series, including the fund.The fund’s investment objective is to seek total return (consisting of capital appreciation and income).The Dreyfus Corporation (the “Manager” or “Dreyfus”), a wholly-owned subsidiary of The Bank of New York Mellon Corporation (“BNY Mellon”), serves as the fund’s investment adviser. Newton Capital Management Limited (“Newton”), an affiliate of BNY Mellon, serves as the fund’s sub-investment adviser.
MBSC Securities Corporation (the “Distributor”), a wholly-owned subsidiary of Dreyfus is the distributor of the fund’s shares.The fund is authorized to issue an unlimited number of shares of Beneficial Interest in each of the following classes of shares: Class A, Class C and Class I. Class A and Class C shares are sold primarily to retail investors through financial intermediaries and bear a distribution fee and/or shareholder services fee. Class A shares are sold with a front-end sales charge, while Class C shares are subject to a contingent deferred sales charge (“CDSC”). Class I shares are sold primarily to bank trust departments and other financial service providers (including The Bank of NewYork Mellon, a subsidiary of BNY Mellon and an affiliate of Dreyfus), acting on behalf of customers having a qualified trust or an investment account or relationship at such institution, and bear no distribution or shareholder services fees. Class I shares are offered without a front-end sales charge or CDSC. Other differences between the classes include the services offered to, the expenses borne by each class, the allocation of certain transfer agency costs and certain voting rights. Income, expenses (other than expenses attributable to a specific class), and real-
20
ized and unrealized gains or losses on investments are allocated to each class of shares based on its relative net assets.
The Trust accounts separately for the assets, liabilities and operations of each series. Expenses directly attributable to each series are charged to that series’ operations; expenses which are applicable to all series are allocated among them on a pro rata basis.
The Financial Accounting Standards Board (“FASB”) Accounting Standards Codification (“ASC”) is the exclusive reference of authoritative U.S. generally accepted accounting principles (“GAAP”) recognized by the FASB to be applied by nongovernmental entities. Rules and interpretive releases of the Securities and Exchange Commission (“SEC”) under authority of federal laws are also sources of authoritative GAAP for SEC registrants. The fund’s financial statements are prepared in accordance with GAAP, which may require the use of management estimates and assumptions.Actual results could differ from those estimates.
(a) Portfolio valuation: The fair value of a financial instrument is the amount that would be received to sell an asset or paid to transfer a liability in an orderly transaction between market participants at the measurement date (i.e. the exit price). GAAP establishes a fair value hierarchy that prioritizes the inputs of valuation techniques used to measure fair value.This hierarchy gives the highest priority to unadjusted quoted prices in active markets for identical assets or liabilities (Level 1 measurements) and the lowest priority to unobservable inputs (Level 3 measurements).
Additionally, GAAP provides guidance on determining whether the volume and activity in a market has decreased significantly and whether such a decrease in activity results in transactions that are not orderly. GAAP requires enhanced disclosures around valuation inputs and techniques used during annual and interim periods.
NOTES TO FINANCIAL STATEMENTS (continued)
Various inputs are used in determining the value of the fund’s investments relating to fair value measurements.These inputs are summarized in the three broad levels listed below:
Level 1—unadjusted quoted prices in active markets for identical investments.
Level 2—other significant observable inputs (including quoted prices for similar investments, interest rates, prepayment speeds, credit risk, etc.).
Level 3—significant unobservable inputs (including the fund’s own assumptions in determining the fair value of investments).
The inputs or methodology used for valuing securities are not necessarily an indication of the risk associated with investing in those securities.
Changes in valuation techniques may result in transfers in or out of an assigned level within the disclosure hierarchy. Valuation techniques used to value the fund’s investments are as follows:
Investments in equity securities are valued at the last sales price on the securities exchange or national securities market on which such securities are primarily traded. Securities listed on the National Market System for which market quotations are available are valued at the official closing price or, if there is no official closing price that day, at the last sales price. Securities not listed on an exchange or the national securities market, or securities for which there were no transactions, are valued at the average of the most recent bid and asked prices, except for open short positions, where the asked price is used for valuation purposes. Bid price is used when no asked price is available. Registered investment companies that are not traded on an exchange are valued at their net asset value. All preceding securities are categorized within Level 1 of the fair value hierarchy.
Investments in debt securities excluding short-term investments (other than U.S.Treasury Bills) and forward foreign currency exchange contracts (“forward contracts”) are valued each business day by an independent
22
pricing service (the “Service”) approved by the Board of Trustees. Debt securities for which quoted bid prices are readily available and are representative of the bid side of the market in the judgment of the Service are valued at the mean between the quoted bid prices (as obtained by the Service from dealers in such securities) and asked prices (as calculated by the Service based upon its evaluation of the market for such securities). Other debt securities are valued as determined by the Service, based on methods which include consideration of: yields or prices of securities of comparable quality, coupon, maturity and type; indications as to values from dealers; and general market conditions.These securities are generally categorized within Level 2 of the fair value hierarchy.
Fair valuing of securities may be determined with the assistance of a pricing service using calculations based on indices of domestic securities and other appropriate indicators, such as prices of relevant ADRs and futures contracts. Utilizing these techniques may result in transfers between Level 1 and Level 2 of the fair value hierarchy.
When market quotations or official closing prices are not readily available, or are determined not to reflect accurately fair value, such as when the value of a security has been significantly affected by events after the close of the exchange or market on which the security is principally traded (for example, a foreign exchange or market), but before the fund calculates its net asset value, the fund may value these investments at fair value as determined in accordance with the procedures approved by the Board of Trustees. Certain factors may be considered when fair valuing investments such as: fundamental analytical data, the nature and duration of restrictions on disposition, an evaluation of the forces that influence the market in which the securities are purchased and sold, and public trading in similar securities of the issuer or comparable issuers.These securities are either categorized as Level 2 or 3 depending on the relevant inputs used.
NOTES TO FINANCIAL STATEMENTS (continued)
For restricted securities where observable inputs are limited, assumptions about market activity and risk are used and are categorized within Level 3 of the fair value hierarchy.
Investments denominated in foreign currencies are translated to U.S. dollars at the prevailing rates of exchange. Forward contracts are valued at the forward rate. These securities are generally categorized within Level 2 of the fair value hierarchy.
The following is a summary of the inputs used as of October 31, 2011 in valuing the fund’s investments:
| | | | | | |
| | | Level 2—Other | | Level 3— | | |
| | Level 1— | Significant | | Significant | | |
| Unadjusted | Observable | | Unobservable | | |
| | Quoted Prices | Inputs | | Inputs | Total | |
| Assets ($) | | | | | | |
| Investments in Securities: | | | | | |
| Corporate Bonds† | — | 315,000 | | — | 315,000 | |
| Equity Securities— | | | | | | |
| Domestic† | 4,476,192 | — | | — | 4,476,192 | |
| Equity Securities— | | | | | | |
| Foreign† | 8,264,290 | 2,968,529 | †† | — | 11,232,819 | |
| Mutual Funds | 414,588 | — | | — | 414,588 | |
| Other Financial | | | | | | |
| Instruments: | | | | | | |
| Forward Foreign | | | | | | |
| Currency Exchange | | | | | | |
| Contracts††† | — | 101,575 | | — | 101,575 | |
| Liabilities ($) | | | | | | |
| Other Financial | | | | | | |
| Instruments: | | | | | | |
| Forward Foreign | | | | | | |
| Currency Exchange | | | | | | |
| Contracts††† | — | (8,992 | ) | — | (8,992 | ) |
| |
| † | See Statement of Investments for additional detailed categorizations. |
| †† | Securities classified as Level 2 at period end as the values were determined pursuant to the fund’s |
| | fair valuation procedures. |
| ††† Amount shown represents unrealized appreciation (depreciation) at period end. |
24
In May 2011, FASB issued Accounting Standards Update (“ASU”) No. 2011-04 “Amendments to Achieve Common FairValue Measurement and Disclosure Requirements in GAAP and International Financial Reporting Standards (“IFRS”)” (“ASU 2011-04”). ASU 2011-04 includes common requirements for measurement of and disclosure about fair value between GAAP and IFRS. ASU 2011-04 will require reporting entities to disclose the following information for fair value measurements categorized within Level 3 of the fair value hierarchy: quantitative information about the unobservable inputs used in the fair value measurement, the valuation processes used by the reporting entity and a narrative description of the sensitivity of the fair value measurement to changes in unobservable inputs and the interrelationships between those unobservable inputs. In addition, ASU 2011-04 will require reporting entities to make disclosures about amounts and reasons for all transfers in and out of Level 1 and Level 2 fair value mea-surements.The new and revised disclosures are effective for interim and annual reporting periods beginning after December 15, 2011. At this time, management is evaluating the implications of ASU 2011-04 and its impact on the financial statements.
(b) Foreign currency transactions: The fund does not isolate that portion of the results of operations resulting from changes in foreign exchange rates on investments from the fluctuations arising from changes in market prices of securities held. Such fluctuations are included with the net realized and unrealized gain or loss on investments.
Net realized foreign exchange gains or losses arise from sales of foreign currencies, currency gains or losses realized on securities transactions between trade and settlement date and the difference between the amounts of dividends, interest and foreign withholding taxes recorded on the fund’s books and the U.S. dollar equivalent of the amounts actually received or paid. Net unrealized foreign exchange gains and
NOTES TO FINANCIAL STATEMENTS (continued)
losses arise from changes in the value of assets and liabilities other than investments resulting from changes in exchange rates. Foreign currency gains and losses on investments are included with net realized and unrealized gain or loss on investments.
(c) Securities transactions and investment income: Securities transactions are recorded on a trade date basis. Realized gains and losses from securities transactions are recorded on the identified cost basis. Dividend income is recognized on the ex-dividend date and interest income, including, where applicable, accretion of discount and amortization of premium on investments, is recognized on the accrual basis.
Investing in foreign markets may involve special risks and considerations not typically associated with investing in the U.S. These risks include revaluation of currencies, high rates of inflation, repatriation restrictions on income and capital, and adverse political and economic developments. Moreover, securities issued in these markets may be less liquid, subject to government ownership controls and delayed settlements, and their prices may be more volatile than those of comparable securities in the U.S.
(d) Affiliated issuers: Investments in other investment companies advised by Dreyfus are defined as “affiliated” in the Act.
The fund may invest in shares of certain affiliated investment companies also advised or managed by Dreyfus. Investments in affiliated investment companies for the period ended October 31, 2011 were as follows:
| | | | | | | |
| Affiliated | | | | | | | |
| Investment | Value | | | | Value | | Net |
| Company | 10/31/2010 | ($) | Purchases ($) | Sales ($) | 10/31/2011 | ($) | Assets (%) |
| Dreyfus | | | | | | | |
| Institutional | | | | | | | |
| Preferred | | | | | | | |
| Plus Money | | | | | | | |
| Market Fund | 890,000 | | 8,707,264 | 9,182,676 | 414,588 | | 2.5 |
(e) Dividends to shareholders: Dividends are recorded on the ex-dividend date. Dividends from investment income-net are declared and paid quarterly. Dividends from net realized capital gains, if any, are normally declared and paid annually, but the fund may make distributions
26
on a more frequent basis to comply with the distribution requirements of the Internal Revenue Code of 1986, as amended (the “Code”).To the extent that net realized capital gains can be offset by capital loss carryovers, it is the policy of the fund not to distribute such gains. Income and capital gain distributions are determined in accordance with income tax regulations, which may differ from GAAP.
(f) Federal income taxes: It is the policy of the fund to continue to qualify as a regulated investment company, if such qualification is in the best interests of its shareholders, by complying with the applicable provisions of the Code, and to make distributions of taxable income sufficient to relieve it from substantially all federal income and excise taxes.
As of and during the period ended October 31, 2011, the fund did not have any liabilities for any uncertain tax positions.The fund recognizes interest and penalties, if any, related to uncertain tax positions as income tax expense in the Statement of Operations. During the period, the fund did not incur any interest or penalties.
Each of the tax years in the four-year period ended October 31, 2011 remains subject to examination by the Internal Revenue Service and state taxing authorities.
At October 31, 2011, the components of accumulated earnings on tax basis were as follows: undistributed ordinary income $378,935, accumulated capital losses $694,861 and unrealized appreciation $110,301.
The accumulated capital loss carryover is available for federal income tax purposes to be applied against future net securities profits, if any, realized subsequent to October 31, 2011. If not applied, $634,314 of the carryover expires in fiscal 2017 and $60,547 expires in fiscal 2018.
Under the recently enacted Regulated Investment Company Modernization Act of 2010 (the “2010 Act”), the fund will be permitted to carry forward capital losses incurred in taxable years beginning after December 22, 2010 (“post-enactment losses”) for an unlimited period. However, the 2010 Act requires post-enactment losses to be utilized before the utilization of losses incurred in taxable years prior
NOTES TO FINANCIAL STATEMENTS (continued)
to the effective date of the 2010 Act. As a result of this ordering rule, capital loss carryovers related to taxable years beginning prior to the effective date of the 2010 Act may be more likely to expire unused.
The tax character of distributions paid to shareholders during the fiscal periods ended October 31, 2011 and October 31, 2010 were as follows: ordinary income $434,865 and $254,123, respectively.
During the period ended October 31, 2011, as a result of permanent book to tax differences, primarily due to the tax treatment for foreign currency gains and losses, passive foreign investment companies, real estate investment trusts,Thailand capital gain taxes and amortization of premiums, the fund decreased accumulated undistributed investment income-net by $195,279 and increased accumulated net realized gain (loss) on investments by the same amount. Net assets and net asset value per share were not affected by this reclassification.
NOTE 2—Bank Lines of Credit:
The fund participates with other Dreyfus-managed funds in a $225 million unsecured credit facility led by Citibank, N.A. and a $300 million unsecured credit facility provided by The Bank of New York Mellon, (each, a “Facility”), each to be utilized primarily for temporary or emergency purposes, including the financing of redemptions. In connection therewith, the fund has agreed to pay its pro rata portion of commitment fees for each Facility. Interest is charged to the fund based on rates determined pursuant to the terms of the respective Facility at the time of borrowing.
The average amount of borrowings outstanding under the Facilities during the period ended October 31, 2011, was approximately $11,800 with a related weighted average annualized interest rate of 1.41%.
NOTE 3—Management Fee, Sub-Investment Advisory Fee and Other Transactions with Affiliates:
(a) Pursuant to a management agreement with Dreyfus and the Trust, the Trust has agreed to pay Dreyfus a management fee computed at the annual rate of .85% of the value of the fund’s average daily net assets and
28
is payable monthly. Dreyfus has contractually agreed, until March 1, 2012, to waive receipt of its fees and/or assume certain expenses of the fund so that the fund’s annual operating expenses (excluding Rule 12b-1 fees, shareholder services fees, taxes, interest, brokerage commissions, commitment fees on borrowings and extraordinary expenses) do not exceed 1.25% of the value of the fund’s average daily net assets.The reduction in management fee, pursuant to the undertaking, amounted to $100,313 during the period ended October 31, 2011.
Pursuant to a Sub-Investment Advisory Agreement between Dreyfus and Newton, Dreyfus pays Newton an annual fee of .41% of the value of the fund’s average daily net assets, payable monthly.
During the period ended October 31, 2011, the Distributor retained $2,231 from commissions earned on sales of the fund’s Class A shares and $261 from CDSCs on redemptions of the fund’s Class C shares.
(b) Under the Distribution Plan (the “Plan”) adopted pursuant to Rule 12b-1 under the Act, Class C shares pay the Distributor for distributing its shares at an annual rate of .75% of the value of the average daily net assets of Class C chares. During the period ended October 31, 2011, Class C shares were charged $19,770, pursuant to the Plan.
(c) Under the Shareholder Services Plan, Class A and Class C shares pay the Distributor at an annual rate of .25% of the value of their average daily net assets for the provision of certain services. The services provided may include personal services relating to shareholder accounts, such as answering shareholder inquiries regarding the fund and providing reports and other information, and services related to the maintenance of shareholder accounts. The Distributor may make payments to Service Agents (a securities dealer, financial institution or other industry professional) in respect of these services. The Distributor determines the amounts to be paid to Service Agents. During the period ended October 31, 2011, Class A and Class C shares were charged $14,555 and $6,590, respectively, pursuant to the Shareholder Services Plan.
NOTES TO FINANCIAL STATEMENTS (continued)
Under its terms, the Plan and Shareholder Services Plan shall remain in effect from year to year, provided such continuance is approved annually by a vote of majority of those Trustees who are not “interested persons” of theTrust and who have no direct or indirect financial interest in the operation of or in any agreement related to the Plan or Shareholder Services Plan.
The fund compensates Dreyfus Transfer, Inc., a wholly-owned subsidiary of Dreyfus, under a transfer agency agreement for providing personnel and facilities to perform transfer agency services for the fund. During the period ended October 31, 2011, the fund was charged $3,848 pursuant to the transfer agency agreement, which is included in Shareholder servicing costs in the Statement of Operations.
The fund has arrangements with the custodian and cash management bank whereby the fund may receive earnings credits when positive cash balances are maintained, which are used to offset custody and cash management fees. For financial reporting purposes, the fund includes net earnings credits as an expense offset in the Statement of Operations.
The fund compensates The Bank of New York Mellon under cash management agreements for performing cash management services related to fund subscriptions and redemptions. During the period ended October 31, 2011, the fund was charged $257 pursuant to the cash management agreements, which is included in Shareholder servicing costs in the Statement of Operations.These fees were partially offset by earnings credits of $8.
The fund also compensates The Bank of New York Mellon under a custody agreement for providing custodial services for the fund. During the period ended October 31, 2011, the fund was charged $24,555 pursuant to the custody agreement.
During the period ended October 31, 2011, the fund was charged $6,751 for services performed by the Chief Compliance Officer.
The components of “Due toThe Dreyfus Corporation and affiliates” in the Statement of Assets and Liabilities consist of: management fees $11,484, Rule 12b-1 distribution plan fees $1,614, shareholder ser-
30
vices plan fees $1,684, custodian fees $7,455, chief compliance officer fees $4,246 and transfer agency per account fees $761, which are offset against an expense reimbursement currently in effect in the amount of $9,777.
(d) Each Trustee who is not an “interested person” of the Trust (as defined in the Act) receives $60,000 per annum, plus $7,000 per joint Board meeting of the Trust, The Dreyfus/Laurel Funds, Inc., The Dreyfus/Laurel Tax-Free Municipal Funds, Dreyfus Investment Funds and Dreyfus Funds, Inc. (collectively, the “Board Group Open-End Funds”) attended, $2,500 for separate in-person committee meetings attended which are not held in conjunction with a regularly scheduled Board meeting and $2,000 for Board meetings and separate committee meetings attended that are conducted by telephone.The Board Group Open-End Funds also reimburse eachTrustee who is not an “interested person” of theTrust (as defined in the Act) for travel and out-of-pocket expenses.With respect to Board meetings, the Chairman of the Board receives an additional 25% of such compensation (with the exception of reimbursable amounts).The Chair of each of the Board’s committees, unless the Chair also serves as Chair of the Board, receives $1,350 per applicable committee meeting. In the event that there is an in-person joint committee meeting or a joint telephone meeting of the Board Group Open-End Funds and Dreyfus High Yield Strategies Fund (“DHF”), a $2,500 fee is allocated between the Board Group Open-End Funds and DHF.
Effective January 1, 2012, the Board Group Open-End Funds and DHF (collectively, the “Board Group Funds”) will pay each Trustee their respective allocated portions of an annual retainer of $85,000 and a fee of $10,000 for each regularly scheduled Board meeting attended ($75,000 and $8,000, respectively, in the aggregate, prior to January 1, 2012).With respect to the annual retainer and Board meetings of the Board Group Funds, the Chair of the Board will receive an additional 25% of such compensation (with the exception of reimbursable amounts). Each Trustee will receive $2,500 for any separate in-person
NOTES TO FINANCIAL STATEMENTS (continued)
committee meetings attended, which are not held in conjunction with a regularly scheduled Board meeting, such amount to be allocated among the Board Group Funds, as applicable. In the event that there is a joint telephone meeting of the Board Group Funds, a fee of $2,000 will be allocated among the applicable Board Group Funds, accordingly (prior to January 1, 2012, the fee allocated was $2,500 if the meeting included DHF). The Chair of each of the Board’s committees, unless the Chair also serves as Chair of the Board, will receive $1,500 per applicable committee meeting. Each Emeritus Trustee is entitled to receive an annual retainer of one-half the amount paid as a retainer at the time the Trustee became Emeritus and a per meeting attended fee of one-half the amount paid to Trustees.The Board Group Funds also reimburse each Independent Trustee and Emeritus Trustees for travel and out-of-pocket expenses.
TheTrust’s portion of these fees and expenses are charged and allocated to each series based on net assets. Amounts required to be paid by the Trust directly to the non-interested Trustees, that would be applied to offset a portion of the management fee payable by certain other series of the Trust to the Manager, are in fact paid directly by the Manager to the non-interested Trustees.
NOTE 4—Securities Transactions:
The aggregate amount of purchases and sales of investment securities, excluding short-term securities and forward contracts, during the period ended October 31, 2011, amounted to $12,007,889 and $8,610,310, respectively.
Forward Foreign Currency Exchange Contracts: The fund enters into forward contracts in order to hedge its exposure to changes in foreign currency exchange rates on its foreign portfolio holdings, to settle foreign currency transactions or as a part of its investment strategy. When executing forward contracts, the fund is obligated to buy or sell a foreign currency at a specified rate on a certain date in the future. With respect to sales of forward contracts, the fund incurs a loss if the value of the contract increases between the date the forward contract is opened and the date the forward contract is closed.The fund realizes a
32
gain if the value of the contract decreases between those dates. With respect to purchases of forward contracts, the fund incurs a loss if the value of the contract decreases between the date the forward contract is opened and the date the forward contract is closed.The fund realizes a gain if the value of the contract increases between those dates. Any realized gain or loss which occurred during the period is reflected in the Statement of Operations.The fund is exposed to foreign currency risk as a result of changes in value of underlying financial instruments. The fund is also exposed to credit risk associated with counterparty nonperformance on these forward contracts, which is typically limited to the unrealized gain on each open contract.The following summarizes open forward contracts at October 31, 2011:
| | | | | |
| | Foreign | | | Unrealized | |
| Forward Foreign Currency | Currency | | | Appreciation | |
| Exchange Contracts | Amounts | Cost ($) | Value ($) (Depreciation) ($) | |
| Purchases: | | | | | |
| Brazilian Real, | | | | | |
| Expiring 12/15/2011 | 103,000 | 62,484 | 59,342 | (3,142 | ) |
| British Pound, | | | | | |
| Expiring 11/2/2011 | 985 | 1,578 | 1,583 | 5 | |
| South African Rand, | | | | | |
| Expiring 12/15/2011 | 332,000 | 47,324 | 41,553 | (5,771 | ) |
| Sales: | | Proceeds($) | | | |
| Australian Dollar, | | | | | |
| Expiring 1/13/2012 | 376,000 | 394,713 | 392,687 | 2,026 | |
| Australian Dollar, | | | | | |
| Expiring 1/13/2012 | 16,000 | 16,631 | 16,710 | (79 | ) |
| Brazilian Real, | | | | | |
| Expiring 12/15/2011 | 798,000 | 487,775 | 459,757 | 28,018 | |
| Brazilian Real, | | | | | |
| Expiring 12/15/2011 | 28,000 | 17,153 | 16,132 | 1,021 | |
| British Pound, | | | | | |
| Expiring 2/15/2012 | 221,000 | 360,360 | 354,931 | 5,429 | |
| Euro, | | | | | |
| Expiring 2/15/2012 | 549,000 | 779,189 | 759,219 | 19,970 | |
| South African Rand, | | | | | |
| Expiring 12/15/2011 | 2,254,000 | 325,171 | 282,109 | 43,062 | |
| South African Rand, | | | | | |
| Expiring 12/15/2011 | 120,000 | 17,063 | 15,019 | 2,044 | |
| Gross Unrealized | | | | | |
| Appreciation | | | | 101,575 | |
| Gross Unrealized | | | | | |
| Depreciation | | | | (8,992 | ) |
NOTES TO FINANCIAL STATEMENTS (continued)
The following summarizes the average market value of derivatives outstanding during the period ended October 31, 2011:
| |
| | Average Market Value ($) |
| Forward contracts | 2,381,417 |
At October 31, 2011, the cost of investments for federal income tax purposes was $16,329,877; accordingly, accumulated net unrealized appreciation on investments was $108,722, consisting of $1,003,274 gross unrealized appreciation and $894,552 gross unrealized depreciation.
NOTE 5–Other Matters:
At the October 27, 2011 Board meeting, the Board of the Trust approved a proposal to have shareholders consider the election of Francine J. Bovich as an additional Board member of the Company, and also consider the election of Joseph S. DiMartino and Benaree Pratt Wiley, current Board members of the Trust not previously proposed to shareholders of the fund. A proxy statement was mailed, on December 1, 2011, to shareholders of record as of the close of business on November 1, 2011 asking shareholders to consider these elections at a special joint meeting of shareholders to be held on Wednesday, February 8, 2012.
34
|
| REPORT OF INDEPENDENT REGISTERED |
| PUBLIC ACCOUNTING FIRM |
The Board of Trustees and Shareholders of The Dreyfus/Laurel Funds Trust
We have audited the accompanying statement of assets and liabilities of Dreyfus Global Equity Income Fund, a series of The Dreyfus/Laurel Funds Trust (the “Fund”), including the statement of investments, as of October 31, 2011, and the related statement of operations for the year then ended, the statements of changes in net assets for each of the years in the two-year period then ended, and the financial highlights for each of the years in the four-year period then ended and for the period from October 18, 2007 (commencement of operations) to October 31, 2007. These financial statements and financial highlights are the responsibility of the Fund’s management. Our responsibility is to express an opinion on these financial statements and financial highlights based on our audits.
We conducted our audits in accordance with the standards of the Public Company Accounting Oversight Board (United States).Those standards require that we plan and perform the audit to obtain reasonable assurance about whether the financial statements and financial highlights are free of material misstatement.An audit includes examining, on a test basis, evidence supporting the amounts and disclosures in the financial statements. Our procedures included confirmation of securities owned as of October 31, 2011, by correspondence with the custodian and brokers or by other appropriate auditing procedures where replies from brokers were not received.An audit includes assessing the accounting principles used and significant estimates made by management, as well as evaluating the overall financial statement presentation. We believe that our audits provide a reasonable basis for our opinion.
In our opinion, the financial statements and financial highlights referred to above present fairly, in all material respects, the financial position of Dreyfus Global Equity Income Fund as of October 31, 2011, the results of its operations for the year then ended, the changes in its net assets for each of the years in the two-year period then ended, and the financial highlights for each of the years in the four-year period then ended and for the period from October 18, 2007 (commencement of operations) to October 31, 2007, in conformity with U.S. generally accepted accounting principles.

|
| New York, New York |
| December 22, 2011 |
IMPORTANT TAX INFORMATION (Unaudited)
For federal tax purposes, the fund elects to provide each shareholder with their portion of the fund’s income sourced from foreign countries and taxes paid from foreign countries.The fund designates the maximum amount allowable but not less than $649,455 as income sourced from foreign countries for the fiscal year ended October 31, 2011 in accordance with Section 853(c)(2) of the Internal Revenue Code and also the fund designates the maximum amount allowable but not less than $50,570 as taxes paid from foreign countries for the fiscal year ended October 31, 2011 in accordance with Section 853(a) of the Internal Revenue Code.Where required by federal tax law rules, shareholders will receive notification of their proportionate share of foreign sourced income and foreign taxes paid for the 2011 calendar year with Form 1099-DIV which will be mailed in early 2012. Also, the fund designates $434,865 as ordinary income dividends paid during the fiscal year ended October 31, 2011 as qualified dividend income in accordance with Section 854(b)(1)(B) of the Internal Revenue Code.
36
BOARD MEMBERS INFORMATION (Unaudited)
|
| Joseph S. DiMartino (68) |
| Chairman of the Board (1999) |
| Principal Occupation During Past 5Years: |
| • Corporate Director and Trustee |
| Other Public Company Board Memberships During Past 5Years: |
| • CBIZ (formerly, Century Business Services, Inc.), a provider of outsourcing functions for small |
| and medium size companies, Director (1997-present) |
| • Sunair Services Corporation, a provider of certain outdoor-related services to homes and |
| businesses, Director (2005-2009) |
| • The Newark Group, a provider of a national market of paper recovery facilities, paperboard |
| mills and paperboard converting plants, Director (2000-2010) |
| No. of Portfolios for which Board Member Serves: 167 |
| ——————— |
| James M. Fitzgibbons (77) |
| Board Member (1994) |
| Principal Occupation During Past 5Years: |
| • Corporate Director and Trustee |
| Other Public Company Board Memberships During Past 5Years: |
| • Bill Barrett Corporation, an oil and natural gas exploration company, Director (2004-present) |
| No. of Portfolios for which Board Member Serves: 33 |
| ——————— |
| Kenneth A. Himmel (65) |
| Board Member (1994) |
| Principal Occupation During Past 5Years: |
| • President and CEO, Related Urban Development, a real estate development company (1996-present) |
| • President and CEO, Himmel & Company, a real estate development company (1980-present) |
| • CEO,American Food Management, a restaurant company (1983-present) |
| No. of Portfolios for which Board Member Serves: 33 |
The Fund 37
BOARD MEMBERS INFORMATION (Unaudited) (continued)
|
| Stephen J. Lockwood (64) |
| Board Member (1994) |
| Principal Occupation During Past 5Years: |
| • Chairman of the Board, Stephen J. Lockwood and Company LLC, a real estate investment |
| company (2000-present) |
| No. of Portfolios for which Board Member Serves: 33 |
| ——————— |
| Roslyn M. Watson (61) |
| Board Member (1994) |
| Principal Occupation During Past 5Years: |
| • Principal,Watson Ventures, Inc., a real estate investment company (1993-present) |
| No. of Portfolios for which Board Member Serves: 43 |
| ——————— |
| Benaree Pratt Wiley (65) |
| Board Member (1998) |
| Principal Occupation During Past 5Years: |
| • Principal,TheWiley Group, a firm specializing in strategy and business development (2005-present) |
| Other Public Company Board Memberships During Past 5Years: |
| • CBIZ (formerly, Century Business Services, Inc.), a provider of outsourcing functions for small |
| and medium size companies, Director (2008-present) |
| No. of Portfolios for which Board Member Serves: 68 |
| ——————— |
Once elected all Board Members serve for an indefinite term, but achieve Emeritus status upon reaching age 80.The address of the Board Members and Officers is in c/o The Dreyfus Corporation, 200 Park Avenue, NewYork, NewYork 10166.Additional information about the Board Members is available in the fund’s Statement of Additional Information which can be obtained from Dreyfus free of charge by calling this toll free number: 1-800-DREYFUS.
J.Tomlinson Fort, Emeritus Board Member
38
OFFICERS OF THE FUND (Unaudited)
BRADLEY J. SKAPYAK, President since January 2010.
Chief Operating Officer and a director of the Manager since June 2009. From April 2003 to June 2009, Mr. Skapyak was the head of the Investment Accounting and Support Department of the Manager. He is an officer of 75 investment companies (comprised of 167 portfolios) managed by the Manager. He is 52 years old and has been an employee of the Manager since February 1988.
MICHAEL A. ROSENBERG, Vice President and Secretary since August 2005.
Assistant General Counsel of BNY Mellon, and an officer of 76 investment companies (comprised of 192 portfolios) managed by the Manager. He is 51 years old and has been an employee of the Manager since October 1991.
KIESHA ASTWOOD, Vice President and Assistant Secretary since January 2010.
Counsel of BNY Mellon, and an officer of 76 investment companies (comprised of 192 portfolios) managed by the Manager. She is 38 years old and has been an employee of the Manager since July 1995.
JAMES BITETTO, Vice President and Assistant Secretary since August 2005.
Senior Counsel of BNY Mellon and Secretary of the Manager, and an officer of 76 investment companies (comprised of 192 portfolios) managed by the Manager. He is 45 years old and has been an employee of the Manager since December 1996.
JONI LACKS CHARATAN, Vice President and Assistant Secretary since August 2005.
Senior Counsel of BNY Mellon, and an officer of 76 investment companies (comprised of 192 portfolios) managed by the Manager. She is 55 years old and has been an employee of the Manager since October 1988.
JOSEPH M. CHIOFFI, Vice President and Assistant Secretary since August 2005.
Senior Counsel of BNY Mellon, and an officer of 76 investment companies (comprised of 192 portfolios) managed by the Manager. He is 49 years old and has been an employee of the Manager since June 2000.
KATHLEEN DENICHOLAS, Vice President and Assistant Secretary since January 2010.
Senior Counsel of BNY Mellon, and an officer of 76 investment companies (comprised of 192 portfolios) managed by the Manager. She is 37 years old and has been an employee of the Manager since February 2001.
JANETTE E. FARRAGHER, Vice President and Assistant Secretary since August 2005.
Assistant General Counsel of BNY Mellon, and an officer of 76 investment companies (comprised of 192 portfolios) managed by the Manager. She is 48 years old and has been an employee of the Manager since February 1984.
JOHN B. HAMMALIAN, Vice President and Assistant Secretary since August 2005.
Managing Counsel of BNY Mellon, and an officer of 76 investment companies (comprised of 192 portfolios) managed by the Manager. He is 48 years old and has been an employee of the Manager since February 1991.
M. CRISTINA MEISER, Vice President and Assistant Secretary since January 2010.
Senior Counsel of BNY Mellon, and an officer of 76 investment companies (comprised of 192 portfolios) managed by the Manager. She is 41 years old and has been an employee of the Manager since August 2001.
OFFICERS OF THE FUND (Unaudited) (continued)
ROBERT R. MULLERY, Vice President and Assistant Secretary since August 2005.
Managing Counsel of BNY Mellon, and an officer of 76 investment companies (comprised of 192 portfolios) managed by the Manager. He is 59 years old and has been an employee of the Manager since May 1986.
JEFF PRUSNOFSKY, Vice President and Assistant Secretary since August 2005.
Managing Counsel of BNY Mellon, and an officer of 76 investment companies (comprised of 192 portfolios) managed by the Manager. He is 46 years old and has been an employee of the Manager since October 1990.
JAMES WINDELS, Treasurer since November 2001.
Director – Mutual Fund Accounting of the Manager, and an officer of 76 investment companies (comprised of 192 portfolios) managed by the Manager. He is 53 years old and has been an employee of the Manager since April 1985.
RICHARD CASSARO, Assistant Treasurer since January 2008.
Senior Accounting Manager – Money Market and Municipal Bond Funds of the Manager, and an officer of 76 investment companies (comprised of 192 portfolios) managed by the Manager. He is 52 years old and has been an employee of the Manager since September 1982.
GAVIN C. REILLY, Assistant Treasurer since December 2005.
Tax Manager of the Investment Accounting and Support Department of the Manager, and an officer of 76 investment companies (comprised of 192 portfolios) managed by the Manager. He is 43 years old and has been an employee of the Manager since April 1991.
ROBERT ROBOL, Assistant Treasurer since August 2005.
Senior Accounting Manager – Fixed Income Funds of the Manager, and an officer of 76 investment companies (comprised of 192 portfolios) managed by the Manager. He is 47 years old and has been an employee of the Manager since October 1988.
ROBERT SALVIOLO, Assistant Treasurer since July 2007.
Senior Accounting Manager – Equity Funds of the Manager, and an officer of 76 investment companies (comprised of 192 portfolios) managed by the Manager. He is 44 years old and has been an employee of the Manager since June 1989.
ROBERT SVAGNA, Assistant Treasurer since December 2002.
Senior Accounting Manager – Equity Funds of the Manager, and an officer of 76 investment companies (comprised of 192 portfolios) managed by the Manager. He is 44 years old and has been an employee of the Manager since November 1990.
40
JOSEPH W. CONNOLLY, Chief Compliance Officer since October 2004.
Chief Compliance Officer of the Manager and The Dreyfus Family of Funds (76 investment companies, comprised of 192 portfolios). From November 2001 through March 2004, Mr. Connolly was first Vice-President, Mutual Fund Servicing for Mellon Global Securities Services. In that capacity, Mr. Connolly was responsible for managing Mellon’s Custody, Fund Accounting and Fund Administration services to third-party mutual fund clients. He is 54 years old and has served in various capacities with the Manager since 1980, including manager of the firm’s Fund Accounting Department from 1997 through October 2001.
STEPHEN J. STOREN, Anti-Money Laundering Compliance Officer since May 2011.
Chief Compliance Officer of the Distributor, and the Anti-Money Laundering Compliance Officer of 72 investment companies (comprised of 188 portfolios) managed by the Manager. He is 57 years old and has been an employee of the Distributor since October 1999.
For More Information
Telephone Call your financial representative or 1-800-DREYFUS
Mail The Dreyfus Family of Funds, 144 Glenn Curtiss Boulevard, Uniondale, NY 11556-0144
The fund files its complete schedule of portfolio holdings with the Securities and Exchange Commission (“SEC”) for the first and third quarters of each fiscal year on Form N-Q. The fund’s Forms N-Q are available on the SEC’s website at http://www.sec.gov and may be reviewed and copied at the SEC’s Public Reference Room in Washington, DC. Information on the operation of the Public Reference Room may be obtained by calling 1-800-SEC-0330.
A description of the policies and procedures that the fund uses to determine how to vote proxies relating to portfolio securities, and information regarding how the fund voted these proxies for the most recent 12-month period ended June 30 is available at http://www.dreyfus.com and on the SEC’s website at http://www.sec.gov. The description of the policies and procedures is also available without charge, upon request, by calling 1-800-DREYFUS.

|
| Dreyfus |
| International |
| Bond Fund |
ANNUAL REPORT October 31, 2011

Save time. Save paper. View your next shareholder report online as soon as it’s available. Log into www.dreyfus.com and sign up for Dreyfus eCommunications. It’s simple and only takes a few minutes.
The views expressed in this report reflect those of the portfolio manager only through the end of the period covered and do not necessarily represent the views of Dreyfus or any other person in the Dreyfus organization. Any such views are subject to change at any time based upon market or other conditions and Dreyfus disclaims any responsibility to update such views.These views may not be relied on as investment advice and, because investment decisions for a Dreyfus fund are based on numerous factors, may not be relied on as an indication of trading intent on behalf of any Dreyfus fund.
|
| Not FDIC-Insured • Not Bank-Guaranteed • May Lose Value |
| | Contents |
| | THE FUND |
| 2 | A Letter from the Chairman and CEO |
| 3 | Discussion of Fund Performance |
| 6 | Fund Performance |
| 8 | Understanding Your Fund’s Expenses |
| 8 | Comparing Your Fund’s Expenses With Those of Other Funds |
| 9 | Statement of Investments |
| 20 | Statement of Financial Futures |
| 21 | Statement of Assets and Liabilities |
| 22 | Statement of Operations |
| 23 | Statement of Changes in Net Assets |
| 25 | Financial Highlights |
| 28 | Notes to Financial Statements |
| 52 | Report of Independent Registered Public Accounting Firm |
| 53 | Important Tax Information |
| 54 | Board Members Information |
| 56 | Officers of the Fund |
| | FOR MORE INFORMATION |
| | Back Cover |
Dreyfus
International Bond Fund
The Fund

A LETTER FROM THE CHAIRMAN AND CEO
Dear Shareholder:
We are pleased to present this annual report for Dreyfus International Bond Fund, covering the 12-month period from November 1, 2010, through October 31, 2011. For information about how the fund performed during the reporting period, as well as general market perspectives, we provide a Discussion of Fund Performance on the pages that follow.
Investors were encouraged by expectations of a more robust economic recovery during the final months of 2010, but sentiment deteriorated sharply in 2011 due to disappointing global economic data, rising commodity prices, an escalating sovereign debt crisis in Europe and a contentious debate regarding taxes, spending and borrowing in the United States. International bond markets proved sensitive to these macroeconomic developments, as increasingly risk-averse investors flocked to traditional “safe havens,” such as U.S.Treasury securities and other high-quality developed nation sovereign debt. In contrast, bonds in emerging markets generally suffered, seemingly regardless of underlying credit fundamentals.
The economic outlook currently remains clouded by market turbulence and political infighting, but we believe that a continued subpar global expansion is more likely than a return to recession. Although Europe continues to struggle with a debt crisis, inflationary pressures appear to be waning in most countries as energy prices recently have retreated from their highs. In the United States, moderately low core inflation and an accommodative monetary policy could help support near-trend growth despite ongoing deleveraging activity in the private sector, potentially supporting a renewed rally among corporate-backed bonds.To assess the impact of these and other developments on your investments, we encourage you, as always, to speak with your financial advisor.
Thank you for your continued confidence and support.

Jonathan R. Baum
Chairman and Chief Executive Officer
The Dreyfus Corporation
November 15, 2011
2

DISCUSSION OF FUND PERFORMANCE
For the period of November 1, 2010, through October 31, 2011, as provided by David Leduc, CFA, Portfolio Manager
Fund and Market Performance Overview
For the 12-month period ended October 31, 2011, Dreyfus International Bond Fund’s Class A shares produced a total return of 1.65%, Class C shares returned 0.89% and Class I shares returned 1.87%.1 In comparison, the fund’s benchmark, the Barclays Capital Global Aggregate ex-U.S. (Unhedged) Bond Index (the “Index”) produced a total return of 3.57% for the same period.2
International bond markets produced mixed results amid heightened market volatility over much of the reporting period, as investors responded first to signs of global economic strength and later to renewed economic weakness.The fund produced lower returns than its benchmark, primarily due to a relatively short average duration when government bond yields fell over the reporting period’s second half.
The Fund’s Investment Approach
The fund seeks to maximize total return through capital appreciation and income.To pursue its goal, the fund normally invests at least 80% of its assets in fixed-income securities, and at least 65% of its assets in non-U.S. dollar-denominated fixed-income securities of foreign governments and companies located in various countries, including emerging markets.
Generally, the fund seeks to maintain investment-grade average credit quality.We focus on identifying undervalued government bond markets, currencies, sectors and securities.We look for fixed-income securities with the most potential for added value, such as those involving the potential for credit upgrades, unique structural characteristics or innovative features. We use fundamental economic research and quantitative analysis to allocate assets among countries and curren-cies.We then focus on sectors and individual securities that appear to be relatively undervalued.
Shifting Economic Sentiment Sparked Market Volatility
Global economic sentiment had improved over the final months of 2010, fueled by quantitative easing of U.S. monetary policy, better-than-expected economic data in Europe and strong corporate earnings across a number of regions.As a result, investors at the time favored riskier assets
DISCUSSION OF FUND PERFORMANCE (continued)
over traditional safe havens. However, a number of macroeconomic developments weighed on investor sentiment as 2011 unfolded. Inflation worries prompted a number of central banks, including those in China, India and Europe, to raise short-term interest rates, sparking fears of a global economic slowdown. Political uprisings in the Middle East and devastating natural and nuclear disasters in Japan added to global investors’ concerns. Later in the spring, worries intensified regarding the European sovereign debt crisis as Greece teetered on the brink of default.
These macroeconomic concerns caused corporate-backed bonds to give back many of their earlier gains, while lower yielding sovereign debt from fiscally sound nations rallied strongly as investors engaged in a “flight to quality.” Sovereign bonds in many markets, with the notable exception of some members of the European Union, also were buoyed by receding inflationary pressures and the prospect of low short-term interest rates for some time to come.
Short Duration Dampened Fund Performance
The fund benefited early in the reporting period from overweighted exposure to higher yielding market sectors, including investment-grade corporate bonds, high yield corporate bonds, commercial mortgage-backed securities and residential mortgage-backed securities. However, these positions later lost value, particularly in peripheral European markets, such as Spain and Italy, that were hit hard by the region’s debt crisis.
As economic conditions deteriorated, we adjusted the fund’s composition to reduce credit risks. Changes included a substantial reduction in exposure to high yield bonds and, to a lesser degree, investment-grade corporate bonds.We also shifted the fund’s emphasis from Europe to the United States, resulting in underweighted exposure to the peripheral nations of Europe by midyear. While this more defensive allocation proved beneficial, the fund’s relatively short average duration prevented it from participating fully in the rally among U.S. government securities over the summer.
The fund’s relative performance also was undermined by fluctuating currency exchange rates. Our efforts to hedge overseas currency risks proved counterproductive when the U.S. dollar weakened relative to many other currencies. Better results from a long position in the
4
Japanese yen and tactical positions in the Swiss franc were not enough to fully offset weakness in the U.S. dollar.
Maintaining a Cautious Investment Posture
We currently expect the global economic recovery to persist, but a number of headwinds appear likely to keep growth at subpar levels. Therefore, we have maintained an emphasis on higher-quality market sectors, including mortgage-backed securities in the United Kingdom and the Netherlands, automobile loans in Germany and covered bonds in Scandinavia and Northern Europe.We also have established positions in collateralized floating-rate securities with AAA credit ratings.As of the reporting period’s end, we set the fund’s average duration in a range that was roughly in line with industry averages. In our judgment, these are prudent strategies until global economic conditions stabilize, at which point we may move toward a more constructive investment posture.
November 15, 2011
Bond funds are subject generally to interest rate, credit, liquidity and market risks, to varying degrees, all of which are more fully described in the fund’s prospectus. Generally, all other factors being equal, bond prices are inversely related to interest-rate changes, and rate increases can cause price declines.
High yield bonds are subject to increased credit risk and are considered speculative in terms of the issuer’s perceived ability to continue making interest payments on a timely basis and to repay principal upon maturity.
Foreign bonds are subject to special risks including exposure to currency fluctuations, changing political and economic conditions, and potentially less liquidity.These risks are generally greater with emerging market countries than with more economically and politically established foreign countries. Investments in foreign currencies are subject to the risk that those currencies will decline in value relative to the U.S. dollar, or, in the case of hedged positions, that the U.S. dollar will decline relative to the currency being hedged. Currency rates in foreign countries may fluctuate significantly over short periods of time.A decline in the value of foreign currencies relative to the U.S. dollar will reduce the value of securities held by the fund and denominated in those currencies. The use of leverage may magnify the fund’s gains or losses. For derivatives with a leveraging component, adverse changes in the value or level of the underlying asset can result in a loss that is much greater than the original investment in the derivative.
| |
| 1 | Total return includes reinvestment of dividends and any capital gains paid and does not take into |
| | consideration the maximum initial sales charge in the case of Class A shares or the applicable |
| | contingent deferred sales charge imposed on redemptions in the case of Class C shares. Had these |
| | charges been reflected, returns would have been lower. Class I shares are not subject to any initial |
| | or deferred sales charge. Past performance is no guarantee of future results. Share price and |
| | investment return fluctuate such that upon redemption, fund shares may be worth more or less |
| | than their original cost. |
| 2 | SOURCE: FACTSET — Reflects reinvestment of dividends and, where applicable, capital gain |
| | distributions.The Barclays Capital Global Aggregate ex-U.S. (Unhedged) Bond Index provides a |
| | broad-based measure of the global investment-grade fixed income markets. Investors cannot invest |
| | directly in any index. |
FUND PERFORMANCE
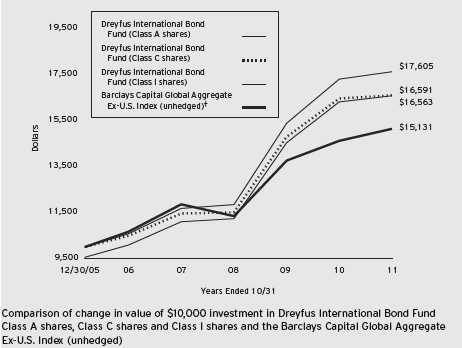
|
| † Source: FactSet |
| Past performance is not predictive of future performance. |
| The above graph compares a $10,000 investment made in Class A, Class C and Class I shares of Dreyfus International |
| Bond Fund on 12/30/05 (inception date) to a $10,000 investment made in the Barclays Capital Global Aggregate Ex- |
| U.S. Index (unhedged) (the “Index”) on that date.All dividends and capital gain distributions are reinvested. |
| The fund invests 80% of its assets primarily in fixed-income securities. The fund’s performance shown in the line graph |
| above takes into account the maximum initial sales charge on Class A shares and all other applicable fees and expenses |
| on all classes. The Index is designed to measure the performance of global investment-grade, fixed-rate debt markets, |
| excluding the United States, hedged into U. S. dollars. Unlike a mutual fund, the Index is not subject to charges, fees |
| and other expenses. Investors cannot invest directly in any index. Further information relating to fund performance, |
| including expense reimbursements, if applicable, is contained in the Financial Highlights section of the prospectus and |
| elsewhere in this report. |
6
| | | | | | | |
| Average Annual Total Returns as of 10/31/11 | | | |
| |
| | Inception | | | From |
| | Date | 1Year | 5 Years | Inception |
| Class A shares | | | | |
| with maximum sales charge (4.5%) | 12/30/05 | –2.93% | 9.44% | 9.03% |
| without sales charge | 12/30/05 | 1.65% | 10.44% | 9.89% |
| Class C shares | | | | |
| with applicable redemption charge † | 12/30/05 | –0.06% | 9.61% | 9.06% |
| without redemption | 12/30/05 | 0.89% | 9.61% | 9.06% |
| Class I shares | 12/30/05 | 1.87% | 10.72% | 10.17% |
| Barclays Capital Global Aggregate | | | | |
| Ex-U.S. Index (unhedged) | 12/31/05 | 3.57% | 7.24% | 7.36%†† |
Past performance is not predictive of future performance.The fund’s performance shown in the graph and table does not reflect the deduction of taxes that a shareholder would pay on the fund distributions or the redemption of fund shares.
| |
| † | The maximum contingent deferred sales charge for Class C shares is 1% for shares redeemed within one year of the |
| | date of purchase. |
| †† | For comparative purposes, the value of the Index as of 12/31/05 is used as the beginning value on 12/30/05. |
UNDERSTANDING YOUR FUND’S EXPENSES (Unaudited)
As a mutual fund investor, you pay ongoing expenses, such as management fees and other expenses. Using the information below, you can estimate how these expenses affect your investment and compare them with the expenses of other funds.You also may pay one-time transaction expenses, including sales charges (loads) and redemption fees, which are not shown in this section and would have resulted in higher total expenses. For more information, see your fund’s prospectus or talk to your financial adviser.
Review your fund’s expenses
The table below shows the expenses you would have paid on a $1,000 investment in Dreyfus International Bond Fund from May 1, 2011 to October 31, 2011. It also shows how much a $1,000 investment would be worth at the close of the period, assuming actual returns and expenses.
Expenses and Value of a $1,000 Investment
assuming actual returns for the six months ended October 31, 2011
| | | | | | |
| | | Class A | | Class C | | Class I |
| Expenses paid per $1,000† | $ | 5.07 | $ | 8.76 | $ | 3.81 |
| Ending value (after expenses) | $ | 989.60 | $ | 986.60 | $ | 990.80 |
COMPARING YOUR FUND’S EXPENSES
WITH THOSE OF OTHER FUNDS (Unaudited)
Using the SEC’s method to compare expenses
The Securities and Exchange Commission (SEC) has established guidelines to help investors assess fund expenses. Per these guidelines, the table below shows your fund’s expenses based on a $1,000 investment, assuming a hypothetical 5% annualized return. You can use this information to compare the ongoing expenses (but not transaction expenses or total cost) of investing in the fund with those of other funds.All mutual fund shareholder reports will provide this information to help you make this comparison. Please note that you cannot use this information to estimate your actual ending account balance and expenses paid during the period.
Expenses and Value of a $1,000 Investment
assuming a hypothetical 5% annualized return for the six months ended October 31, 2011
| | | | | | |
| | | Class A | | Class C | | Class I |
| Expenses paid per $1,000† | $ | 5.14 | $ | 8.89 | $ | 3.87 |
| Ending value (after expenses) | $ | 1,020.11 | $ | 1,016.38 | $ | 1,021.37 |
|
| † Expenses are equal to the fund’s annualized expense ratio of 1.01% for Class A, 1.75% for Class C and .76% |
| for Class I, multiplied by the average account value over the period, multiplied by 184/365 (to reflect the one-half |
| year period). |
8
|
| STATEMENT OF INVESTMENTS |
| October 31, 2011 |
| | | | | | |
| | | Coupon | Maturity | Principal | | |
| Bonds and Notes—96.5% | | Rate (%) | Date | Amount ($)a | Value ($) |
| Australia—2.0% | | | | | | |
| Australian Government, | | | | | | |
| Sr. Unscd. Bonds, Ser. 124 | AUD | 5.75 | 5/15/21 | 7,380,000 | | 8,520,227 |
| Queensland Treasury, | | | | | | |
| Gov’t Gtd. Bonds, Ser. 13G | AUD | 6.00 | 8/14/13 | 9,770,000 | | 10,559,808 |
| Smart Trust, | | | | | | |
| Ser. 2011-1USA, Cl. A3B | | 1.09 | 10/14/14 | 5,800,000 | b,c | 5,802,103 |
| | | | | | | 24,882,138 |
| Austria—1.0% | | | | | | |
| Austrian Government, | | | | | | |
| Sr. Unscd. Notes | EUR | 3.50 | 9/15/21 | 8,715,000 | c | 12,578,602 |
| Belgium—3.1% | | | | | | |
| Anheuser-Busch InBev, | | | | | | |
| Gtd. Notes | GBP | 9.75 | 7/30/24 | 125,000 | | 303,398 |
| Belgium Government, | | | | | | |
| Bonds, Ser. 43 | EUR | 4.25 | 9/28/14 | 26,690,000 | | 38,056,572 |
| | | | | | | 38,359,970 |
| Bermuda—.2% | | | | | | |
| Weatherford International, | | | | | | |
| Gtd. Notes | | 6.75 | 9/15/40 | 1,925,000 | | 2,253,472 |
| Brazil—1.4% | | | | | | |
| Brazil Notas do | | | | | | |
| Tesouro Nacional, | | | | | | |
| Notes, Ser. F | BRL | 10.00 | 1/1/12 | 13,350,000 | | 8,010,708 |
| Centrais Eletricas Brasileiras, | | | | | | |
| Sr. Unscd. Notes | | 5.75 | 10/27/21 | 3,110,000 | c | 3,249,950 |
| Vale Overseas, | | | | | | |
| Gtd. Notes | | 6.25 | 1/23/17 | 3,750,000 | | 4,214,062 |
| Vale Overseas, | | | | | | |
| Gtd. Notes | | 4.63 | 9/15/20 | 2,015,000 | | 2,056,972 |
| | | | | | | 17,531,692 |
| Canada—5.1% | | | | | | |
| Canadian Government, | | | | | | |
| Bonds | CAD | 4.00 | 6/1/16 | 16,735,000 | | 18,637,762 |
| Canadian Government, | | | | | | |
| Bonds, Ser. A55 | CAD | 8.00 | 6/1/23 | 4,750,000 | | 7,402,185 |
| Canadian Government, | | | | | | |
| Bonds, Ser. VW17 | CAD | 8.00 | 6/1/27 | 8,975,000 | | 15,052,608 |
STATEMENT OF INVESTMENTS (continued)
| | | | | | |
| | | Coupon | Maturity | Principal | | |
| Bonds and Notes (continued) | Rate (%) | Date | Amount ($)a | Value ($) |
| Canada (continued) | | | | | | |
| Ford Auto Securitization Trust, | | | | | | |
| Notes, Ser. 2011-R3A, | | | | | | |
| Cl. A2 | CAD | 1.96 | 7/15/15 | 5,110,000 | c | 5,127,841 |
| Ford Auto Securitization Trust, | | | | | | |
| Notes, Ser. 2011-R1A, | | | | | | |
| Cl. A2 | CAD | 2.43 | 11/15/14 | 2,350,000 | c | 2,374,166 |
| Rogers Communications, | | | | | | |
| Gtd. Notes | CAD | 6.56 | 3/22/41 | 3,190,000 | | 3,488,021 |
| Royal Bank of Canada, | | | | | | |
| Sr. Notes | | 1.45 | 10/30/14 | 4,755,000 | | 4,779,769 |
| Teck Resources, | | | | | | |
| Sr. Scd. Notes | | 10.75 | 5/15/19 | 1,960,000 | | 2,423,875 |
| Toronto-Dominion Bank, | | | | | | |
| Sr. Unscd. Notes | | 2.38 | 10/19/16 | 3,870,000 | | 3,942,799 |
| | | | | | | 63,229,026 |
| Chile—1.8% | | | | | | |
| Chilean Government, | | | | | | |
| Sr. Unscd. Notes | CLP | 5.50 | 8/5/20 | 6,062,000,000 | | 13,099,587 |
| Codelco, | | | | | | |
| Sr. Unscd. Notes | | 3.88 | 11/3/21 | 8,655,000 | c | 8,662,764 |
| | | | | | | 21,762,351 |
| Finland—.5% | | | | | | |
| Aktia Real Estate | | | | | | |
| Mortgage Bank, | | | | | | |
| Covered Bonds | EUR | 4.13 | 6/11/14 | 4,000,000 | | 5,813,693 |
| France—3.7% | | | | | | |
| BNP Paribas Home Loan, | | | | | | |
| Covered Bonds | EUR | 2.25 | 10/1/12 | 4,450,000 | | 6,172,729 |
| French Government, | | | | | | |
| Bonds | EUR | 5.00 | 10/25/16 | 19,625,000 | | 30,776,328 |
| Pernod-Ricard, | | | | | | |
| Sr. Unscd. Bonds | | 5.75 | 4/7/21 | 2,210,000 | c | 2,500,076 |
| Pernod-Ricard, | | | | | | |
| Sr. Unscd. Bonds | EUR | 5.00 | 3/15/17 | 1,700,000 | | 2,460,989 |
| Pernod-Ricard, | | | | | | |
| Sr. Unscd. Notes | EUR | 7.00 | 1/15/15 | 1,000,000 | | 1,531,272 |
| RCI Banque, | | | | | | |
| Sr. Unscd. Notes | | 2.26 | 4/11/14 | 2,080,000 | b,c | 1,928,782 |
| | | | | | | 45,370,176 |
10
| | | | | | |
| | | Coupon | Maturity | Principal | | |
| Bonds and Notes (continued) | Rate (%) | Date | Amount ($)a | | Value ($) |
| Germany—6.4% | | | | | | |
| Daimler, | | | | | | |
| Sr. Unscd. Notes | EUR | 4.63 | 9/2/14 | 2,100,000 | | 3,119,824 |
| Eurohypo, | | | | | | |
| Bonds, Ser. 2212 | EUR | 4.50 | 1/21/13 | 440,000 | c | 628,749 |
| German Government, | | | | | | |
| Bonds | EUR | 2.50 | 1/4/21 | 6,395,000 | | 9,249,849 |
| German Government, | | | | | | |
| Bonds | EUR | 3.25 | 7/4/42 | 20,525,000 | | 30,988,575 |
| German Government, | | | | | | |
| Bonds, Ser. 06 | EUR | 4.00 | 7/4/16 | 6,020,000 | | 9,418,214 |
| German Government, | | | | | | |
| Bonds, Ser. 2008 | EUR | 4.25 | 7/4/18 | 15,860,000 | | 25,691,642 |
| KFW, | | | | | | |
| Gov’t Gtd. Notes | JPY | 2.05 | 2/16/26 | 3,000,000 | | 41,181 |
| | | | | | | 79,138,034 |
| Italy—4.8% | | | | | | |
| Italian Government, | | | | | | |
| Bonds | EUR | 3.75 | 8/1/15 | 29,840,000 | | 38,924,540 |
| Italian Government, | | | | | | |
| Bonds | EUR | 4.25 | 3/1/20 | 8,835,000 | | 10,927,393 |
| Italian Government, | | | | | | |
| Bonds | EUR | 5.00 | 9/1/40 | 8,855,000 | | 9,741,309 |
| | | | | | | 59,593,242 |
| Japan—22.2% | | | | | | |
| Development Bank of Japan, | | | | | | |
| Gov’t Gtd. Notes | JPY | 1.05 | 6/20/23 | 34,000,000 | | 424,462 |
| Development Bank of Japan, | | | | | | |
| Gov’t Gtd. Bonds | JPY | 1.70 | 9/20/22 | 24,000,000 | | 322,483 |
| Japan Finance Organization | | | | | | |
| for Municipalities, | | | | | | |
| Gov’t Gtd. Notes | JPY | 1.35 | 11/26/13 | 11,000,000 | | 143,923 |
| Japanese Government, | | | | | | |
| Sr. Unscd. Bonds, Ser. 310 | JPY | 1.00 | 9/20/20 | 4,325,000,000 | | 55,793,164 |
| Japanese Government, | | | | | | |
| Sr. Unscd. Bonds, Ser. 273 | JPY | 1.50 | 9/20/15 | 1,732,000,000 | | 23,181,839 |
| Japanese Government, | | | | | | |
| Sr. Unscd. Bonds, Ser. 288 | JPY | 1.70 | 9/20/17 | 3,924,300,000 | | 53,755,933 |
| Japanese Government, | | | | | | |
| Sr. Unscd. Bonds, Ser. 11 | JPY | 1.70 | 6/20/33 | 6,250,950,000 | | 78,122,483 |
STATEMENT OF INVESTMENTS (continued)
| | | | | | |
| | | Coupon | Maturity | Principal | | |
| Bonds and Notes (continued) | Rate (%) | Date | Amount ($)a | Value ($) |
| Japan (continued) | | | | | | |
| Japanese Government, | | | | | | |
| Sr. Unscd. Bonds, Ser. 303 | JPY | 1.40 | 9/20/19 | 4,558,350,000 | | 60,977,348 |
| Japanese Government, | | | | | | |
| Sr. Unscd. Bonds, Ser. 8 | JPY | 1.00 | 6/10/16 | 210,000,000 | e | 2,728,778 |
| | | | | | | 275,450,413 |
| Luxembourg—.7% | | | | | | |
| Enel Finance International, | | | | | | |
| Gtd. Notes | | 5.13 | 10/7/19 | 1,950,000 | c,d | 1,890,626 |
| Holcim US Finance Sarl & Cie, | | | | | | |
| Gtd. Notes | | 6.00 | 12/30/19 | 3,695,000 | c | 3,973,067 |
| Telecom Italia Capital, | | | | | | |
| Gtd. Notes | | 7.18 | 6/18/19 | 2,100,000 | | 2,209,693 |
| | | | | | | 8,073,386 |
| Malaysia—.4% | | | | | | |
| Malaysian Government, | | | | | | |
| Sr. Unscd. Bonds, | | | | | | |
| Ser. 0409 | MYR | 3.74 | 2/27/15 | 15,250,000 | | 5,050,732 |
| Mexico—.7% | | | | | | |
| Mexican Government, | | | | | | |
| Bonds, Ser. M 30 | MXN | 8.50 | 11/18/38 | 44,500,000 | | 3,739,997 |
| Petroleos Mexicanos, | | | | | | |
| Gtd. Notes | | 6.50 | 6/2/41 | 4,660,000 | c,d | 5,044,450 |
| | | | | | | 8,784,447 |
| Netherlands—3.9% | | | | | | |
| BMW Finance, | | | | | | |
| Gtd. Notes | EUR | 3.88 | 1/18/17 | 1,300,000 | | 1,891,461 |
| E.ON International Finance, | | | | | | |
| Gtd. Notes | EUR | 4.88 | 1/28/14 | 580,000 | | 857,112 |
| E.ON International Finance, | | | | | | |
| Gtd. Notes | EUR | 5.50 | 10/2/17 | 620,000 | | 980,921 |
| Elsevier Finance, | | | | | | |
| Gtd. Notes | EUR | 6.50 | 4/2/13 | 900,000 | | 1,317,117 |
| ING Bank, | | | | | | |
| Covered Notes | EUR | 3.63 | 8/31/21 | 1,905,000 | | 2,688,602 |
| Netherlands Government, | | | | | | |
| Bonds | EUR | 3.25 | 7/15/21 | 14,440,000 | | 21,356,674 |
| Netherlands Government, | | | | | | |
| Bonds | EUR | 4.00 | 7/15/18 | 10,390,000 | | 16,195,935 |
12
| | | | | | |
| | | Coupon | Maturity | Principal | | |
| Bonds and Notes (continued) | Rate (%) | Date | Amount ($)a | Value ($) |
| Netherlands (continued) | | | | | | |
| RWE Finance, | | | | | | |
| Gtd. Notes | EUR | 6.63 | 1/31/19 | 1,350,000 | | 2,276,374 |
| Storm, | | | | | | |
| Ser. 2005, Cl. A | EUR | 1.58 | 5/26/47 | 977,144 | b | 1,345,550 |
| | | | | | | 48,909,746 |
| Norway—1.2% | | | | | | |
| DnB NOR Boligkreditt, | | | | | | |
| Covered Bonds | | 2.90 | 3/29/17 | 4,470,000 | c | 4,650,074 |
| DnB NOR Boligkreditt, | | | | | | |
| Covered Bonds | EUR | 3.38 | 1/20/17 | 4,920,000 | | 7,079,286 |
| Norwegian Government, | | | | | | |
| Bonds, Ser. 474 | NOK | 3.75 | 5/25/21 | 16,000,000 | | 3,121,470 |
| | | | | | | 14,850,830 |
| Philippines—.6% | | | | | | |
| Philippine Government, | | | | | | |
| Sr. Unscd. Notes | PHP | 4.95 | 1/15/21 | 22,000,000 | | 497,922 |
| Philippine Government, | | | | | | |
| Sr. Unscd. Bonds | PHP | 6.25 | 1/14/36 | 291,000,000 | | 6,653,078 |
| | | | | | | 7,151,000 |
| Poland—1.5% | | | | | | |
| Polish Government, | | | | | | |
| Sr. Unscd. Notes | | 5.00 | 3/23/22 | 8,100,000 | | 8,008,875 |
| Polish Government, | | | | | | |
| Bonds, Ser. 0413 | PLN | 5.25 | 4/25/13 | 32,255,000 | | 10,251,881 |
| | | | | | | 18,260,756 |
| South Africa—.3% | | | | | | |
| South African Government, | | | | | | |
| Bonds, Ser. R209 | ZAR | 6.25 | 3/31/36 | 33,445,000 | | 3,167,697 |
| South Korea—.0% | | | | | | |
| Export-Import | | | | | | |
| Bank of Korea, | | | | | | |
| Sr. Unscd. Notes | EUR | 5.75 | 5/22/13 | 100,000 | | 144,029 |
| Spain—1.9% | | | | | | |
| Spanish Government, | | | | | | |
| Bonds | EUR | 4.20 | 1/31/37 | 4,645,000 | | 4,783,829 |
| Spanish Government, | | | | | | |
| Bonds | EUR | 5.50 | 4/30/21 | 5,495,000 | d | 7,567,087 |
STATEMENT OF INVESTMENTS (continued)
| | | | | | |
| | | Coupon | Maturity | Principal | | |
| Bonds and Notes (continued) | Rate (%) | Date | Amount ($)a | Value ($) |
| Spain (continued) | | | | | | |
| Spanish Government, | | | | | | |
| Bonds | EUR | 3.15 | 1/31/16 | 8,530,000 | | 11,152,618 |
| | | | | | | 23,503,534 |
| Supranational—.7% | | | | | | |
| Asian Development Bank, | | | | | | |
| Sr. Unscd. Notes | CNY | 2.85 | 10/21/20 | 25,000,000 | | 4,094,227 |
| Corp Andina De Formento, | | | | | | |
| Sr. Unscd. Notes | | 3.75 | 1/15/16 | 3,835,000 | | 3,867,344 |
| European Investment Bank, | | | | | | |
| Sr. Unscd. Bonds | JPY | 1.40 | 6/20/17 | 38,600,000 | | 516,955 |
| | | | | | | 8,478,526 |
| Sweden—5.4% | | | | | | |
| Stadshypotek, | | | | | | |
| Covered Bonds | EUR | 3.00 | 10/1/14 | 3,675,000 | | 5,246,595 |
| Swedish Government, | | | | | | |
| Bonds, Ser. 1052 | SEK | 4.25 | 3/12/19 | 23,770,000 | | 4,243,030 |
| Swedish Government, | | | | | | |
| Bonds, Ser. 1050 | SEK | 3.00 | 7/12/16 | 84,850,000 | | 13,864,303 |
| Swedish Government, | | | | | | |
| Bonds, Ser. 1041 | SEK | 6.75 | 5/5/14 | 252,000,000 | | 43,836,659 |
| | | | | | | 67,190,587 |
| Switzerland—.4% | | | | | | |
| Credit Suisse Guernsey, | | | | | | |
| Covered Bonds | | 2.60 | 5/27/16 | 5,135,000 | c | 5,227,101 |
| United Kingdom—15.4% | | | | | | |
| Arkle Master Issuer, | | | | | | |
| Ser. 2010-2A, Cl. 2A | EUR | 3.04 | 5/17/60 | 2,600,000 | b,c | 3,598,775 |
| Arkle Master Issuer, | | | | | | |
| Ser. 2010-2A, Cl. 1A1 | | 1.69 | 5/17/60 | 7,025,000 | b,c | 7,023,476 |
| Arran Residential | | | | | | |
| Mortgages Funding, | | | | | | |
| Ser. 2011-1A, Cl. A1B | EUR | 2.74 | 11/19/47 | 4,121,279 | b,c | 5,698,137 |
| Barclays Bank, | | | | | | |
| Covered Notes | EUR | 2.13 | 9/8/15 | 2,805,000 | | 3,865,641 |
| Barclays Bank, | | | | | | |
| Covered Notes | EUR | 4.00 | 10/7/19 | 5,950,000 | | 8,598,372 |
| BP Capital Markets, | | | | | | |
| Gtd. Notes | | 2.25 | 11/1/16 | 1,655,000 | | 1,666,163 |
14
| | | | | | |
| | | Coupon | Maturity | Principal | | |
| Bonds and Notes (continued) | Rate (%) | Date | Amount ($)a | Value ($) |
| United Kingdom (continued) | | | | | | |
| BP Capital Markets, | | | | | | |
| Gtd. Notes | | 3.56 | 11/1/21 | 9,095,000 | | 9,241,357 |
| Fosse Master Issuer, | | | | | | |
| Ser. 2011-1A, Cl. A4 | EUR | 2.87 | 10/18/54 | 11,065,000 | b,c | 15,274,370 |
| Holmes Master Issuer, | | | | | | |
| Ser. 2011-3A, Cl. A3 | EUR | 2.98 | 10/15/54 | 3,660,000 | b,c | 5,064,342 |
| Lloyds TSB Bank, | | | | | | |
| Covered Notes | EUR | 3.38 | 3/17/16 | 4,500,000 | | 6,339,296 |
| Lloyds TSB Bank, | | | | | | |
| Covered Bonds | EUR | 4.00 | 9/29/21 | 1,500,000 | | 2,073,192�� |
| National Grid, | | | | | | |
| Sr. Unscd. Notes | EUR | 5.00 | 7/2/18 | 1,315,000 | | 2,012,159 |
| Nationwide Building Society, | | | | | | |
| Covered Notes | EUR | 2.88 | 9/14/15 | 2,105,000 | | 2,913,591 |
| Royal Bank of Scotland, | | | | | | |
| Covered Notes | EUR | 3.00 | 9/8/15 | 1,745,000 | | 2,414,851 |
| Royal Bank of Scotland, | | | | | | |
| Covered Notes | EUR | 3.88 | 10/19/20 | 6,350,000 | | 8,704,192 |
| Silverstone Master Issuer, | | | | | | |
| Ser. 2011-1A, Cl. 1A | | 1.96 | 1/21/55 | 5,650,000 | b,c | 5,650,007 |
| United Kingdom Gilt, | | | | | | |
| Bonds | GBP | 2.25 | 3/7/14 | 8,275,000 | | 13,826,128 |
| United Kingdom Gilt, | | | | | | |
| Bonds | GBP | 4.25 | 9/7/39 | 21,090,000 | | 39,156,805 |
| United Kingdom Gilt, | | | | | | |
| Bonds | GBP | 4.25 | 12/7/40 | 8,440,000 | | 15,694,956 |
| United Kingdom Gilt, | | | | | | |
| Bonds | GBP | 4.75 | 9/7/15 | 4,750,000 | | 8,724,899 |
| United Kingdom Gilt, | | | | | | |
| Bonds | GBP | 8.75 | 8/25/17 | 9,455,000 | | 21,297,063 |
| | | | | | | 188,837,772 |
| United States—11.2% | | | | | | |
| Ally Auto Receivables Trust, | | | | | | |
| Ser. 2010-1, Cl. A3 | | 1.45 | 5/15/14 | 1,495,725 | | 1,503,716 |
| Ally Financial, | | | | | | |
| Gtd. Notes | | 4.50 | 2/11/14 | 990,000 | | 970,200 |
| Ally Master Owner Trust, | | | | | | |
| Ser. 2011-5, Cl. A | | 0.89 | 6/15/15 | 5,965,000 | b | 5,967,489 |
STATEMENT OF INVESTMENTS (continued)
| | | | | | |
| | | Coupon | Maturity | Principal | | |
| Bonds and Notes (continued) | Rate (%) | Date | Amount ($)a | | Value ($) |
| United States (continued) | | | | | | |
| Altria Group, | | | | | | |
| Gtd. Notes | | 10.20 | 2/6/39 | 460,000 | | 712,778 |
| American International Group, | | | | | | |
| Sr. Unscd. Notes | EUR | 5.00 | 6/26/17 | 1,400,000 | | 1,777,733 |
| Anadarko Petroleum, | | | | | | |
| Sr. Unscd. Notes | | 6.38 | 9/15/17 | 1,390,000 | | 1,637,717 |
| Anheuser-Busch Inbev Worldwide, | | | | | | |
| Gtd. Notes | | 6.38 | 1/15/40 | 1,550,000 | | 2,105,235 |
| Anheuser-Busch InBev Worldwide, | | | | | | |
| Gtd. Notes | | 4.38 | 2/15/21 | 605,000 | | 680,294 |
| BMW US Capital, | | | | | | |
| Gtd. Notes | EUR | 5.00 | 5/28/15 | 355,000 | | 539,647 |
| Burlington North Santa Fe, | | | | | | |
| Sr. Unscd. Notes | | 5.05 | 3/1/41 | 1,000,000 | | 1,079,433 |
| Chrysler Financial Auto | | | | | | |
| Securitization Trust, | | | | | | |
| Ser. 2010-A, Cl. D | | 3.52 | 8/8/16 | 2,900,000 | | 2,938,032 |
| Citibank Omni Master Trust, | | | | | | |
| Ser. 2009-A8, Cl. A8 | | 2.34 | 5/16/16 | 5,850,000 | b,c | 5,903,450 |
| CNA Financial, | | | | | | |
| Sr. Unscd. Notes | | 5.75 | 8/15/21 | 2,005,000 | | 2,027,223 |
| Comcast, | | | | | | |
| Gtd. Notes | | 5.90 | 3/15/16 | 950,000 | | 1,099,201 |
| CVS Pass-Through Trust, | | | | | | |
| Pass Thru Certificates | | 6.04 | 12/10/28 | 2,249,225 | | 2,308,451 |
| Directv Holdings, | | | | | | |
| Gtd. Notes | | 5.00 | 3/1/21 | 3,700,000 | | 4,057,968 |
| Energy Transfer Partners, | | | | | | |
| Sr. Unscd. Notes | | 8.50 | 4/15/14 | 225,000 | | 255,778 |
| Enterprise Products Operating, | | | | | | |
| Gtd. Notes | | 6.13 | 10/15/39 | 1,920,000 | | 2,228,525 |
| Ford Motor Credit, | | | | | | |
| Sr. Unscd. Notes | | 3.88 | 1/15/15 | 6,580,000 | | 6,588,139 |
| Ford Motor Credit, | | | | | | |
| Sr. Unscd. Notes | | 6.63 | 8/15/17 | 1,385,000 | | 1,519,621 |
| Freeport-McMoRan Copper & Gold, | | | | | |
| Sr. Unscd. Notes | | 8.38 | 4/1/17 | 1,766,000 | | 1,891,677 |
| General Electric Capital, | | | | | | |
| Sub. Notes | | 5.30 | 2/11/21 | 1,950,000 | | 2,079,131 |
16
| | | | | | |
| | | Coupon | Maturity | Principal | | |
| Bonds and Notes (continued) | Rate (%) | Date | Amount ($)a | Value ($) |
| United States (continued) | | | | | | |
| General Electric Capital, | | | | | | |
| Sr. Unscd. Notes | | 6.88 | 1/10/39 | 870,000 | | 1,055,144 |
| Goodyear Tire & Rubber, | | | | | | |
| Gtd. Notes | | 10.50 | 5/15/16 | 880,000 | | 981,200 |
| Gracechurch Mortgage Financing, | | | | | | |
| Ser. 2007-1A, Cl. 3A1 | | 0.38 | 11/20/56 | 3,321,438 | b,c | 3,303,582 |
| Hartford Financial | | | | | | |
| Services Group, | | | | | | |
| Sr. Unscd. Notes | | 5.50 | 3/30/20 | 2,100,000 | | 2,156,750 |
| Holmes Master Issuer, | | | | | | |
| Ser. 2010-1A, Cl. A2 | | 1.80 | 10/15/54 | 7,185,000 | b,c | 7,183,405 |
| JPMorgan Chase Bank, | | | | | | |
| Sr. Unscd. Notes | | 4.35 | 8/15/21 | 8,530,000 | | 8,549,696 |
| JPMorgan Chase Bank, | | | | | | |
| Sub. Notes | EUR | 4.38 | 11/30/21 | 2,900,000 | | 3,578,232 |
| Kraft Foods, | | | | | | |
| Sr. Unscd. Notes | | 5.38 | 2/10/20 | 3,450,000 | | 3,983,115 |
| Levi Strauss & Co., | | | | | | |
| Sr. Unscd. Notes | EUR | 7.75 | 5/15/18 | 745,000 | | 992,199 |
| Macy’s Retail Holdings, | | | | | | |
| Gtd. Notes | | 6.38 | 3/15/37 | 3,845,000 | | 4,270,307 |
| Morgan Stanley, | | | | | | |
| Sr. Unscd. Notes | | 5.50 | 7/28/21 | 10,345,000 | | 10,123,079 |
| NBCUniversal Media, | | | | | | |
| Sr. Unscd. Notes | | 4.38 | 4/1/21 | 655,000 | | 697,894 |
| Paragon Mortgages, | | | | | | |
| Ser. 14A, Cl. A2C | | 0.45 | 9/15/39 | 11,922,518 | b,c | 8,906,288 |
| Pepsico, | | | | | | |
| Sr. Unscd. Notes | | 0.80 | 8/25/14 | 3,900,000 | | 3,893,292 |
| Plains All American Pipeline, | | | | | | |
| Gtd. Notes | | 5.00 | 2/1/21 | 2,075,000 | | 2,233,914 |
| Prudential Financial, | | | | | | |
| Sr. Unscd. Notes | | 5.38 | 6/21/20 | 1,100,000 | | 1,226,447 |
| Prudential Financial, | | | | | | |
| Sr. Unscd. Notes | | 6.20 | 11/15/40 | 5,750,000 | | 6,488,311 |
| Puget Energy, | | | | | | |
| Sr. Unscd. Notes | | 6.00 | 9/1/21 | 980,000 | | 1,014,855 |
| Reed Elsevier Capital, | | | | | | |
| Gtd. Notes | | 8.63 | 1/15/19 | 805,000 | | 1,004,395 |
STATEMENT OF INVESTMENTS (continued)
| | | | | | | | |
| | | | Coupon | Maturity | Principal | | | |
| | Bonds and Notes (continued) | Rate (%) | Date | Amount ($)a | | Value ($) |
| | United States (continued) | | | | | | | |
| | Santander Drive Auto | | | | | | | |
| | Receivables Trust, | | | | | | | |
| | Ser. 2010-1, Cl. A3, | | 1.84 | 11/17/14 | 3,050,000 | | | 3,072,606 |
| | Sempra Energy, | | | | | | | |
| | Sr. Unscd. Notes | | 1.11 | 3/15/14 | 4,065,000 | b | | 4,073,821 |
| | Time Warner Cable, | | | | | | | |
| | Gtd. Notes | | 4.00 | 9/1/21 | 1,950,000 | | | 2,001,020 |
| | Time Warner, | | | | | | | |
| | Gtd. Notes | | 5.38 | 10/15/41 | 1,920,000 | | | 2,032,383 |
| | Verizon Communications, | | | | | | | |
| | Sr. Unscd. Notes | | 4.75 | 11/1/41 | 3,445,000 | | | 3,542,283 |
| | WM Covered Bond Program, | | | | | | | |
| | Covered Notes | EUR | 4.00 | 9/27/16 | 510,000 | | | 736,632 |
| | WM Wrigley Jr., | | | | | | | |
| | Sr. Scd. Notes | | 3.70 | 6/30/14 | 2,595,000 | c | | 2,681,857 |
| | Xerox, | | | | | | | |
| | Sr. Unscd. Notes | | 1.11 | 5/16/14 | 1,070,000 | b | | 1,061,149 |
| �� | | | | | | | | 140,715,294 |
| | Total Bonds And Notes | | | | | | | |
| | (cost $1,155,217,935) | | | | | | | 1,194,308,246 |
| |
| Short-Term Investments—.7% | | | | | | | |
| | U.S. Treasury Bills: | | | | | | | |
| | 0.00%, 2/2/12 | | | | 1,350,000 | | | 1,349,969 |
| | 0.08%, 11/17/11 | | | | 7,790,000 | f | 7,789,699 |
| | Total Short-Term Investments | | | | | | |
| | (cost $9,139,692) | | | | | | | 9,139,668 |
| |
| | Other Investment—3.4% | | | | Shares | | | Value ($) |
| | Registered Investment Company; | | | | | | |
| | Dreyfus Institutional Preferred | | | | | | |
| | Plus Money Market Fund | | | | | | | |
| | (cost $42,476,691) | | | | 42,476,691 | g | 42,476,691 |
18
| | | | |
| Investment of Cash Collateral | | |
| for Securities Loaned—1.2% | Shares | Value ($) |
| Registered Investment Company; | | |
| Dreyfus Institutional Cash Advantage Fund | | |
| (cost $14,433,650) | 14,433,650g | 14,433,650 |
| Total Investments (cost $1,221,267,968) | 101.8% | 1,260,358,255 |
| Liabilities, Less Cash and Receivables | (1.8%) | (22,466,428) |
| Net Assets | 100.0% | 1,237,891,827 |
|
| a Principal amount stated in U.S. Dollars unless otherwise noted. |
| AUD—Australian Dollar |
| BRL—Brazilian Real |
| CAD—Canadian Dollar |
| CLP—Chilean Peso |
| CNY—Chinese Renminbi |
| EUR—Euro |
| GBP—British Pound |
| JPY—JapaneseYen |
| MXN—Mexican New Peso |
| MYR—Malaysin Ringgit |
| NOK—Norwegian Krone |
| PHP—Philippine Peso |
| PLN—Polish Zolty |
| SEK—Swedish Krona |
| ZAR—South African Rand |
| b Variable rate security—interest rate subject to periodic change. |
| c Securities exempt from registration under Rule 144A of the Securities Act of 1933.These securities may be resold in |
| transactions exempt from registration, normally to qualified institutional buyers.At October 31, 2011, these securities |
| were valued at $ 133,926,040 or 10.8% of net assets. |
| d Security, or portion thereof, on loan.At October 31, 2011, the value of the fund’s securities on loan was |
| $12,966,338 and the value of the collateral held by the fund was $14,433,650. |
| e Principal amount for accrual purposes is periodically adjusted based on changes in the Japanese Consumer Price Index. |
| f Held by a broker as collateral for open financial futures positions. |
| g Investment in affiliated money market mutual fund. |
| | | |
| Portfolio Summary (Unaudited)† | | |
| |
| | Value (%) | | Value (%) |
| Non-U.S. Government | 69.5 | Corporate-High Yield | 1.0 |
| Securitized | 13.7 | U.S. Government | .7 |
| Corporate-Investment Grade | 12.3 | | |
| Cash & Equivalents | 4.6 | | 101.8 |
| |
| † Based on net assets. | | | |
| See notes to financial statements. | | | |
|
| STATEMENT OF FINANCIAL FUTURES |
| October 2011 |
| | | | | | |
| | | | | Unrealized |
| | | Market Value | | Appreciation |
| | | Covered by | | (Depreciation) |
| | Contracts | Contracts ($) | Expiration | at 10/31/2011($) |
| Financial Futures Long | | | | |
| Euro-Bond | 202 | 37,864,868 | December 2011 | (5,579) |
| Euro-Schatz | 132 | 20,035,616 | December 2011 | 32,621 |
| Financial Futures Short | | | | |
| Long Gilt | 57 | (11,762,385) | December 2011 | (12,344) |
| U.S Treasury 2 Year Notes | 422 | (92,958,692) | December 2011 | 74,905 |
| U.S Treasury 5 Year Notes | 70 | (8,582,657) | December 2011 | (63,150) |
| U.S Treasury 10 Year Notes | 646 | (83,374,375) | December 2011 | (627,820) |
| U.S. Treasury 30 Year Bonds | 204 | (28,362,375) | December 2011 | (10,688) |
| U.S. Treasury Ultra | | | | |
| 30 Year Bonds | 30 | (4,571,250) | December 2011 | (136,752) |
| Gross Unrealized Appreciation | | | | 107,526 |
| Gross Unrealized Depreciation | | | | (856,333) |
| See notes to financial statements. | | | | |
20
|
| STATEMENT OF ASSETS AND LIABILITIES |
| October 31, 2011 |
| | | |
| | Cost | Value |
| Assets ($): | | |
| Investments in securities—See Statement of Investments (including | | |
| securities on loan, valued at $12,966,338)—Note 1(c) | | |
| Unaffiliated issuers | 1,164,357,627 | 1,203,447,914 |
| Affiliated issuers | 56,910,341 | 56,910,341 |
| Cash | | 5,547,285 |
| Cash denominated in foreign currencies | 1,888,288 | 1,879,715 |
| Receivable for investment securities sold | | 18,860,817 |
| Receivable for shares of Beneficial Interest subscribed | | 10,994,552 |
| Dividends, interest and securities lending income receivable | | 10,863,172 |
| Receivable from broker for swap transactions—Note 4 | | 1,048,888 |
| Unrealized appreciation on forward foreign | | |
| currency exchange contracts—Note 4 | | 1,015,827 |
| Prepaid expenses | | 60,625 |
| | | 1,310,629,136 |
| Liabilities ($): | | |
| Due to The Dreyfus Corporation and affiliates—Note 3(d) | | 995,979 |
| Payable for investment securities purchased | | 49,891,433 |
| Liability for securities on loan—Note 1(c) | | 14,433,650 |
| Unrealized depreciation on swap contracts—Note 4 | | 2,593,286 |
| Unrealized depreciation on forward foreign | | |
| currency exchange contracts—Note 4 | | 1,767,398 |
| Swaps premium received—Note 4 | | 1,181,480 |
| Payable for futures variation margin—Note 4 | | 897,490 |
| Payable for shares of Beneficial Interest redeemed | | 791,684 |
| Accrued expenses | | 184,909 |
| | | 72,737,309 |
| Net Assets ($) | | 1,237,891,827 |
| Composition of Net Assets ($): | | |
| Paid-in capital | | 1,196,344,155 |
| Accumulated distibutions in excess of investment income—net | | (4,349,942) |
| Accumulated net realized gain (loss) on investments | | 11,350,065 |
| Accumulated net unrealized appreciation (depreciation) on investments, | |
| swap transactions and foreign currency transactions [including | | |
| ($748,807) net unrealized (depreciation) on financial futures] | | 34,547,549 |
| Net Assets ($) | | 1,237,891,827 |
| | | |
| Net Asset Value Per Share | | | |
| | Class A | Class C | Class I |
| Net Assets ($) | 612,236,186 | 157,340,024 | 468,315,617 |
| Shares Outstanding | 36,334,828 | 9,514,729 | 27,646,429 |
| Net Asset Value Per Share ($) | 16.85 | 16.54 | 16.94 |
|
| See notes to financial statements. |
|
| STATEMENT OF OPERATIONS |
| Year Ended October 31, 2011 |
| | |
| Investment Income ($): | |
| Income: | |
| Interest (net of $4,068 forein taxes withheld at source) | 31,701,132 |
| Dividends; | |
| Affiliated issuers | 30,876 |
| Income from securities lending—Note 1(c) | 24,848 |
| Total Income | 31,756,856 |
| Expenses: | |
| Management fee—Note 3(a) | 5,621,867 |
| Shareholder servicing costs—Note 3(d) | 2,293,098 |
| Distribution fees—Note 3(c) | 875,968 |
| Custodian fees—Note 3(d) | 181,513 |
| Registration fees | 133,192 |
| Prospectus and shareholders’ reports | 76,601 |
| Professional fees | 65,360 |
| Trustees’ fees and expenses—Note 3(b) | 31,591 |
| Loan commitment fees—Note 2 | 12,968 |
| Miscellaneous | 72,393 |
| Total Expenses | 9,364,551 |
| Less—reduction in fees due to earnings credits—Note 3(d) | (901) |
| Net Expenses | 9,363,650 |
| Investment Income—Net | 22,393,206 |
| Realized and Unrealized Gain (Loss) on Investments—Note 4 ($): | |
| Net realized gain (loss) on investments and foreign currency transactions | 13,287,698 |
| Net realized gain (loss) on options transactions | (1,282,682) |
| Net realized gain (loss) on financial futures | (10,265,476) |
| Net realized gain (loss) on swap transactions | (7,190,554) |
| Net realized gain (loss) on forward foreign currency exchange contracts | 8,918,912 |
| Net Realized Gain (Loss) | 3,467,898 |
| Net unrealized appreciation (depreciation) on | |
| investments and foreign currency transactions | (16,712,365) |
| Net unrealized appreciation (depreciation) on options transactions | (626,922) |
| Net unrealized appreciation (depreciation) on financial futures | (708,616) |
| Net unrealized appreciation (depreciation) on swap transactions | 5,364,230 |
| Net unrealized appreciation (depreciation) on | |
| forward foreign currency exchange contracts | (1,381,389) |
| Net Unrealized Appreciation (Depreciation) | (14,065,062) |
| Net Realized and Unrealized Gain (Loss) on Investments | (10,597,164) |
| Net Increase in Net Assets Resulting from Operations | 11,796,042 |
| |
| See notes to financial statements. | |
22
STATEMENT OF CHANGES IN NET ASSETS
| | | | |
| | Year Ended October 31, |
| | 2011 | 2010 |
| Operations ($): | | |
| Investment income—net | 22,393,206 | 18,644,410 |
| Net realized gain (loss) on investments | 3,467,898 | 20,483,221 |
| Net unrealized appreciation | | |
| (depreciation) on investments | (14,065,062) | 40,686,920 |
| Net Increase (Decrease) in Net Assets | | |
| Resulting from Operations | 11,796,042 | 79,814,551 |
| Dividends to Shareholders from ($): | | |
| Investment income—net: | | |
| Class A Shares | (10,380,770) | (5,286,575) |
| Class C Shares | (2,083,054) | (1,187,558) |
| Class I Shares | (9,688,092) | (4,199,092) |
| Net realized gain on investments: | | |
| Class A Shares | (12,712,629) | (2,902,893) |
| Class C Shares | (3,488,325) | (812,274) |
| Class I Shares | (11,040,236) | (2,131,729) |
| Total Dividends | (49,393,106) | (16,520,121) |
| Beneficial Interest Transactions ($): | | |
| Net proceeds from shares sold: | | |
| Class A Shares | 440,292,262 | 322,578,042 |
| Class C Shares | 83,281,883 | 70,979,651 |
| Class I Shares | 270,572,264 | 256,451,399 |
| Dividends reinvested: | | |
| Class A Shares | 21,646,623 | 7,551,988 |
| Class C Shares | 3,791,154 | 1,314,172 |
| Class I Shares | 14,967,080 | 4,192,549 |
| Cost of shares redeemed: | | |
| Class A Shares | (206,524,904) | (171,617,175) |
| Class C Shares | (28,437,345) | (24,060,750) |
| Class I Shares | (131,071,188) | (84,601,612) |
| Increase (Decrease) in Net Assets from | | |
| Beneficial Interest Transactions | 468,517,829 | 382,788,264 |
| Total Increase (Decrease) in Net Assets | 430,920,765 | 446,082,694 |
| Net Assets ($): | | |
| Beginning of Period | 806,971,062 | 360,888,368 |
| End of Period | 1,237,891,827 | 806,971,062 |
| Undistributed (distributions in excess of) | | |
| investment income—net | (4,349,942) | 2,893,492 |
STATEMENT OF CHANGES IN NET ASSETS (continued)
| | | | |
| | Year Ended October 31, |
| | 2011 | 2010 |
| Capital Share Transactions: | | |
| Class A | | |
| Shares sold | 26,095,441 | 19,935,676 |
| Shares issued for dividends reinvested | 1,322,774 | 472,790 |
| Shares redeemed | (12,335,187) | (10,631,279) |
| Net Increase (Decrease) in Shares Outstanding | 15,083,028 | 9,777,187 |
| Class C | | |
| Shares sold | 5,015,149 | 4,438,452 |
| Shares issued for dividends reinvested | 236,532 | 83,319 |
| Shares redeemed | (1,735,681) | (1,509,697) |
| Net Increase (Decrease) in Shares Outstanding | 3,516,000 | 3,012,074 |
| Class I | | |
| Shares sold | 15,963,032 | 15,788,921 |
| Shares issued for dividends reinvested | 911,815 | 261,640 |
| Shares redeemed | (7,800,887) | (5,235,986) |
| Net Increase (Decrease) in Shares Outstanding | 9,073,960 | 10,814,575 |
| |
| See notes to financial statements. | | |
24
FINANCIAL HIGHLIGHTS
The following tables describe the performance for each share class for the fiscal periods indicated.All information (except portfolio turnover rate) reflects financial results for a single fund share.Total return shows how much your investment in the fund would have increased (or decreased) during each period, assuming you had reinvested all dividends and distributions.These figures have been derived from the fund’s financial statements.
| | | | | | | | | | |
| | | Year Ended October 31, | |
| Class A Shares | 2011 | 2010 | 2009 | 2008 | 2007 |
| Per Share Data ($): | | | | | |
| Net asset value, beginning of period | 17.62 | 16.25 | 13.20 | 13.77 | 13.05 |
| Investment Operations: | | | | | |
| Investment income—neta | .40 | .50 | .46 | .45 | .35 |
| Net realized and unrealized | | | | | |
| gain (loss) on investments | (.17) | 1.42 | 3.30 | (.28) | .92 |
| Total from Investment Operations | .23 | 1.92 | 3.76 | .17 | 1.27 |
| Distributions: | | | | | |
| Dividends from investment income—net | (.43) | (.35) | (.71) | (.39) | (.52) |
| Dividends from net realized | | | | | |
| gain on investments | (.57) | (.20) | — | (.35) | (.03) |
| Total Distributions | (1.00) | (.55) | (.71) | (.74) | (.55) |
| Net asset value, end of period | 16.85 | 17.62 | 16.25 | 13.20 | 13.77 |
| Total Return (%)b | 1.65 | 12.11 | 29.42 | 1.21 | 10.06 |
| Ratios/Supplemental Data (%): | | | | | |
| Ratio of total expenses | | | | | |
| to average net assets | 1.01 | 1.09 | 1.25 | 1.47 | 3.33 |
| Ratio of net expenses | | | | | |
| to average net assets | 1.01 | 1.09 | 1.08 | 1.10 | 1.09 |
| Ratio of net investment income | | | | | |
| to average net assets | 2.38 | 3.06 | 3.27 | 3.22 | 2.69 |
| Portfolio Turnover Rate | 213.45 | 153.71 | 159.32c 168.59c 127.97c |
| Net Assets, end of period ($ x 1,000) | 612,236 | 374,363 | 186,456 | 37,076 | 3,429 |
|
| a Based on average shares outstanding at each month end. |
| b Exclusive of sales charge. |
| c The portfolio turnover rates excluding mortgage dollar roll transactions for the periods ended October 31, 2009, 2008 |
| and 2007, were 144.34%, 152.77% and 116.54%, respectively. |
See notes to financial statements.
FINANCIAL HIGHLIGHTS (continued)
| | | | | | | | | | |
| | | Year Ended October 31, | |
| Class C Shares | 2011 | 2010 | 2009 | 2008 | 2007 |
| Per Share Data ($): | | | | | |
| Net asset value, beginning of period | 17.32 | 16.05 | 13.08 | 13.70 | 13.02 |
| Investment Operations: | | | | | |
| Investment income—neta | .27 | .37 | .36 | .34 | .25 |
| Net realized and unrealized | | | | | |
| gain (loss) on investments | (.16) | 1.39 | 3.26 | (.28) | .92 |
| Total from Investment Operations | .11 | 1.76 | 3.62 | .06 | 1.17 |
| Distributions: | | | | | |
| Dividends from investment income—net | (.32) | (.29) | (.65) | (.33) | (.46) |
| Dividends from net realized | | | | | |
| gain on investments | (.57) | (.20) | — | (.35) | (.03) |
| Total Distributions | (.89) | (.49) | (.65) | (.68) | (.49) |
| Net asset value, end of period | 16.54 | 17.32 | 16.05 | 13.08 | 13.70 |
| Total Return (%)b | .89 | 11.26 | 28.50 | .40 | 9.25 |
| Ratios/Supplemental Data (%): | | | | | |
| Ratio of total expenses | | | | | |
| to average net assets | 1.75 | 1.84 | 1.96 | 2.28 | 4.09 |
| Ratio of net expenses | | | | | |
| to average net assets | 1.75 | 1.84 | 1.82 | 1.85 | 1.84 |
| Ratio of net investment income | | | | | |
| to average net assets | 1.63 | 2.31 | 2.58 | 2.45 | 1.93 |
| Portfolio Turnover Rate | 213.45 | 153.71 | 159.32c 168.59c 127.97c |
| Net Assets, end of period ($ x 1,000) | 157,340 | 103,906 | 47,923 | 7,500 | 2,734 |
|
| a Based on average shares outstanding at each month end. |
| b Exclusive of sales charge. |
| c The portfolio turnover rates excluding mortgage dollar roll transactions for the periods ended October 31, 2009, 2008 |
| and 2007, were 144.34%, 152.77% and 116.54%, respectively. |
See notes to financial statements.
26
| | | | | | | | | | |
| | | Year Ended October 31, | |
| Class I Shares | 2011 | 2010 | 2009 | 2008 | 2007a |
| Per Share Data ($): | | | | | |
| Net asset value, beginning of period | 17.70 | 16.31 | 13.23 | 13.79 | 13.06 |
| Investment Operations: | | | | | |
| Investment income—netb | .44 | .54 | .41 | .48 | .38 |
| Net realized and unrealized | | | | | |
| gain (loss) on investments | (.16) | 1.42 | 3.40 | (.27) | .92 |
| Total from Investment Operations | .28 | 1.96 | 3.81 | .21 | 1.30 |
| Distributions: | | | | | |
| Dividends from investment income—net | (.47) | (.37) | (.73) | (.42) | (.54) |
| Dividends from net realized | | | | | |
| gain on investments | (.57) | (.20) | — | (.35) | (.03) |
| Total Distributions | (1.04) | (.57) | (.73) | (.77) | (.57) |
| Net asset value, end of period | 16.94 | 17.70 | 16.31 | 13.23 | 13.79 |
| Total Return (%) | 1.87 | 12.44 | 29.79 | 1.47 | 10.30 |
| Ratios/Supplemental Data (%): | | | | | |
| Ratio of total expenses | | | | | |
| to average net assets | .75 | .82 | .89 | 1.22 | 3.09 |
| Ratio of net expenses | | | | | |
| to average net assets | .75 | .82 | .83 | .85 | .84 |
| Ratio of net investment income | | | | | |
| to average net assets | 2.64 | 3.30 | 3.23 | 3.49 | 2.93 |
| Portfolio Turnover Rate | 213.45 | 153.71 | 159.32c 168.59c 127.97c |
| Net Assets, end of period ($ x 1,000) | 468,316 | 328,703 | 126,509 | 4,080 | 1,393 |
|
| a Effective June 1, 2007, Class R shares were redesignated as Class I shares. |
| b Based on average shares outstanding at each month end. |
| c The portfolio turnover rates excluding mortgage dollar roll transactions for the periods ended October 31, 2009, 2008 |
| and 2007, were 144.34%, 152.77% and 116.54%, respectively. |
See notes to financial statements.
NOTES TO FINANCIAL STATEMENTS
NOTE 1—Significant Accounting Policies:
Dreyfus International Bond Fund (the “fund”) is a separate non-diversified series of The Dreyfus/Laurel Funds Trust (the “Trust”), which is registered under the Investment Company Act of 1940, as amended (the “Act”), as an open-end management investment company and operates as a series company currently offering five series, including the fund. The fund’s investment objective seeks to maximize total return, consisting of capital appreciation and current income. The Dreyfus Corporation (the “Manager” or “Dreyfus”), a wholly-owned subsidiary of The Bank of New York Mellon Corporation (“BNY Mellon”), serves as the fund’s investment adviser.
MBSC Securities Corporation (the “Distributor”), a wholly-owned subsidiary of the Manager, is the distributor of the fund’s shares.The fund is authorized to issue an unlimited number of $.001 par value shares of Beneficial Interest in each of the following classes of shares: Class A, Class C and Class I. Class A and Class C shares are sold primarily to retail investors through financial intermediaries and bear a distribution fee and/or shareholder services fee. Class A shares are sold with a front-end sales charge, while Class C shares are subject to a contingent deferred sales charge (“CDSC”). Class I shares are sold primarily to bank trust departments and other financial service providers (including The Bank of New York Mellon, a subsidiary of BNY Mellon and an affiliate of Dreyfus), acting on behalf of customers having a qualified trust or investment account or relationship at such institution, and bear no distribution or shareholder services fees. Class I shares are offered without a front-end sales charge or CDSC. Other differences between the classes include the services offered to and the expenses borne by each class, the allocation of certain transfer agency costs and certain voting rights. Income, expenses (other than expenses attributable to a specific class), and realized and unrealized gains or losses on investments are allocated to each class of shares based on its relative net assets.
28
The Trust accounts separately for the assets, liabilities and operations of each series. Expenses directly attributable to each series are charged to that series’ operations; expenses which are applicable to all series are allocated among them on a pro rata basis.
The Financial Accounting Standards Board (“FASB”) Accounting Standards Codification (“ASC”) is the exclusive reference of authoritative U.S. generally accepted accounting principles (“GAAP”) recognized by the FASB to be applied by nongovernmental entities. Rules and interpretive releases of the Securities and Exchange Commission (“SEC”) under authority of federal laws are also sources of authoritative GAAP for SEC registrants. The fund’s financial statements are prepared in accordance with GAAP, which may require the use of management estimates and assumptions.Actual results could differ from those estimates.
(a) Portfolio valuation: The fair value of a financial instrument is the amount that would be received to sell an asset or paid to transfer a liability in an orderly transaction between market participants at the measurement date (i.e. the exit price). GAAP establishes a fair value hierarchy that prioritizes the inputs of valuation techniques used to measure fair value.This hierarchy gives the highest priority to unadjusted quoted prices in active markets for identical assets or liabilities (Level 1 measurements) and the lowest priority to unobservable inputs (Level 3 measurements).
Additionally, GAAP provides guidance on determining whether the volume and activity in a market has decreased significantly and whether such a decrease in activity results in transactions that are not orderly. GAAP requires enhanced disclosures around valuation inputs and techniques used during annual and interim periods.
NOTES TO FINANCIAL STATEMENTS (continued)
Various inputs are used in determining the value of the fund’s investments relating to fair value measurements.These inputs are summarized in the three broad levels listed below:
Level 1—unadjusted quoted prices in active markets for identical investments.
Level 2—other significant observable inputs (including quoted prices for similar investments, interest rates, prepayment speeds, credit risk, etc.).
Level 3—significant unobservable inputs (including the fund’s own assumptions in determining the fair value of investments).
The inputs or methodology used for valuing securities are not necessarily an indication of the risk associated with investing in those securities.
Changes in valuation techniques may result in transfers in or out of an assigned level within the disclosure hierarchy. Valuation techniques used to value the fund’s investments are as follows:
Registered investment companies that are not traded on an exchange are valued at their net asset value and are categorized within Level 1 of the fair value hierarchy.
Investments in securities excluding short-term investments (other than U.S. Treasury Bills), financial futures, options, swaps and forward foreign currency exchange contracts (“forward contracts”) are valued each business day by an independent pricing service (the “Service”) approved by the Board of Trustees. Investments for which quoted bid prices are readily available and are representative of the bid side of the market in the judgment of the Service are valued at the mean between the quoted bid prices (as obtained by the Service from dealers in such securities) and asked prices (as calculated by the Service based upon its evaluation of the market for such securities). Other investments (which constitute a majority of the portfolio securities) are valued as determined by the Service, based on methods which include consideration
30
of: yields or prices of securities of comparable quality, coupon, maturity and type; indications as to values from dealers; and general market conditions.These securities are generally categorized within Level 2 of the fair value hierarchy.
U.S.Treasury Bills are valued at the mean price between quoted bid prices and asked prices by an independent pricing service approved by the Board of Trustees. These securities are generally categorized within Level 2 of the fair value hierarchy
When market quotations or official closing prices are not readily available, or are determined not to reflect accurately fair value, such as when the value of a security has been significantly affected by events after the close of the exchange or market on which the security is principally traded (for example, a foreign exchange or market), but before the fund calculates its net asset value, the fund may value these investments at fair value as determined in accordance with the procedures approved by the Board of Trustees. Certain factors may be considered when fair valuing investments such as: fundamental analytical data, the nature and duration of restrictions on disposition, an evaluation of the forces that influence the market in which the securities are purchased and sold, and public trading in similar securities of the issuer or comparable issuers. These securities are either categorized as Level 2 or 3 depending on the relevant inputs used.
For restricted securities where observable inputs are limited, assumptions about market activity and risk are used and are categorized within Level 3 of the fair value hierarchy.
Financial futures and options, which are traded on an exchange, are valued at the last sales price on the securities exchange on which such securities are primarily traded or at the last sales price on the national securities market on each business day. These securities are generally categorized within Level 1 of the fair value hierarchy. Options traded
NOTES TO FINANCIAL STATEMENTS (continued)
over-the-counter are valued at the mean between the bid and asked price.These securities are generally categorized within Level 2 of the fair value hierarchy. Investments in swap transactions are valued each business day by a pricing service approved by the Board of Trustees. Swaps are valued by the service by using a swap pricing model which incorporates among other factors, default probabilities, recovery rates, credit curves of the underlying issuer and swap spreads on interest rates.These securities are generally categorized within Level 2 of the fair value hierarchy. Investments denominated in foreign currencies are translated to U.S. dollars at the prevailing rates of exchange. Forward contracts are valued at the forward rate.These securities are generally categorized within Level 2 of the fair value hierarchy.
The following is a summary of the inputs used as of October 31, 2011 in valuing the fund’s investments:
| | | | |
| | | Level 2—Other | Level 3— | |
| | Level 1— | Significant | Significant | |
| | Unadjusted | Observable | Unobservable | |
| | Quoted Prices | Inputs | Inputs | Total |
| Assets ($) | | | | |
| Investments in Securities: | | | |
| Asset-Backed | — | 32,689,403 | — | 32,689,403 |
| Commercial | | | | |
| Mortgage-Backed | — | 1,345,550 | — | 1,345,550 |
| Corporate Bonds† | — | 254,629,215 | — | 254,629,215 |
| Foreign Government | — | 843,941,696 | — | 843,941,696 |
| Mutual Funds | 56,910,341 | — | — | 56,910,341 |
| Residential | | | | |
| Mortgage-Backed | — | 61,702,382 | — | 61,702,382 |
| U.S. Treasury | — | 9,139,668 | — | 9,139,668 |
| Other Financial | | | | |
| Instruments: | | | | |
| Forward Foreign | | | | |
| Currency Exchange | | | | |
| Contracts†† | — | 1,015,827 | — | 1,015,827 |
| Futures†† | 107,526 | — | — | 107,526 |
32
| | | | | | | |
| | | Level 2—Other | Level 3— | |
| | Level 1— | Significant | Significant | |
| | Unadjusted | Observable | Unobservable | |
| | Quoted Prices | Inputs | Inputs | Total |
| Liabilities ($) | | | | |
| Other Financial | | | | |
| Instruments: | | | | |
| Forward Foreign | | | | |
| Currency Exchange | | | | |
| Contracts†† | — | (1,767,398) | — | (1,767,398) |
| Futures†† | (856,333) | — | — | (856,333) |
| Swaps†† | — | (2,593,286) | — | (2,593,286) |
| |
| † | See Statement of Investments for additional detailed categorizations. |
| †† | Amount shown represents unrealized appreciation (depreciation) at period end. |
In May 2011, FASB issued Accounting Standards Update (“ASU”) No. 2011-04 “Amendments to Achieve Common FairValue Measurement and Disclosure Requirements in GAAP and International Financial Reporting Standards (“IFRS”)” (“ASU 2011-04”). ASU 2011-04 includes common requirements for measurement of and disclosure about fair value between GAAP and IFRS. ASU 2011-04 will require reporting entities to disclose the following information for fair value measurements categorized within Level 3 of the fair value hierarchy: quantitative information about the unobservable inputs used in the fair value measurement, the valuation processes used by the reporting entity and a narrative description of the sensitivity of the fair value measurement to changes in unobservable inputs and the interrelationships between those unobservable inputs. In addition, ASU 2011-04 will require reporting entities to make disclosures about amounts and reasons for all transfers in and out of Level 1 and Level 2 fair value mea-surements.The new and revised disclosures are effective for interim and annual reporting periods beginning after December 15, 2011. At this time, management is evaluating the implications of ASU 2011-04 and its impact on the financial statements.
NOTES TO FINANCIAL STATEMENTS (continued)
(b) Foreign currency transactions: The fund does not isolate that portion of the results of operations resulting from changes in foreign exchange rates on investments from the fluctuations arising from changes in the market prices of securities held. Such fluctuations are included with the net realized and unrealized gain or loss on investments.
Net realized foreign exchange gains or losses arise from sales of foreign currencies, currency gains or losses realized on securities transactions between trade and settlement date, and the difference between the amounts of dividends, interest and foreign withholding taxes recorded on the fund’s books and the U.S. dollar equivalent of the amounts actually received or paid. Net unrealized foreign exchange gains and losses arise from changes in the value of assets and liabilities other than investments resulting from changes in exchange rates. Foreign currency gains and losses on investments are included with net realized and unrealized gain or loss on investments.
(c) Securities transactions and investment income: Securities transactions are recorded on a trade date basis. Realized gains and losses from securities transactions are recorded on the identified cost basis. Dividend income is recognized on the ex-dividend date and interest income, including, where applicable, accretion of discount and amortization of premium on investments, is recognized on the accrual basis.
Pursuant to a securities lending agreement with The Bank of New York Mellon, the fund may lend securities to qualified institutions. It is the fund’s policy that, at origination, all loans are secured by collateral of at least 102% of the value of U.S. securities loaned and 105% of the value of foreign securities loaned. Collateral equivalent to at least 100% of the market value of securities on loan is maintained at all times. Collateral is either in the form of cash, which can be invested in certain money market mutual funds managed by the Manager, U.S. Government and Agency securities or letters of credit. The fund is entitled to receive all income on securities loaned, in addition to income earned as a result of the lending transaction. Although each
34
security loaned is fully collateralized, the fund bears the risk of delay in recovery of, or loss of rights in, the securities loaned should a borrower fail to return the securities in a timely manner. During the period ended October 31, 2011, The Bank of New York Mellon earned $13,380 from lending portfolio securities, pursuant to the securities lending agreement.
(d) Affiliated issuers: Investments in other investment companies advised by Dreyfus are defined as “affiliated” in the Act.
The fund may invest in shares of certain affiliated investment companies also advised or managed by Dreyfus. Investments in affiliated investment companies for the period ended October 31, 2011 were as follows:
| | | | | | | |
| Affiliated | | | | | | | |
| Investment | Value | | | | | Value | Net |
| Company | 10/31/2010 | ($) | Purchases ($) | | Sales | ($) 10/31/2011 ($) | Assets (%) |
| Dreyfus | | | | | | | |
| Institutional | | | | | | | |
| Preferred | | | | | | | |
| Plus Money | | | | | | | |
| Market Fund | 7,119,000 | | 921,050,248 | | 885,692,557 | 42,476,691 | 3.4 |
| Dreyfus | | | | | | | |
| Institutional | | | | | | | |
| Cash | | | | | | | |
| Advantage | | | | | | | |
| Fund | 18,278,517 | | 171,658,496 | | 175,503,363 | 14,433,650 | 1.2 |
| Total | 25,397,517 | | 1,092,708,744 | | 1,061,195,920 | 56,910,341 | 4.6 |
(e) Concentration of Risk:The fund invests primarily in debt securities. Failure of an issuer of the debt securities to make timely interest or principal payments, or a decline or the perception of a decline in the credit quality of a debt security, can cause the debt security’s price to fall, potentially lowering the fund’s share price. In addition, the value of debt securities may decline due to general market conditions that are not specifically related to a particular company, such as real or perceived adverse economic conditions, changes in outlook for corporate earnings, changes in interest or currency rates or adverse investor sentiment.They may also decline because of factors that affect a particular industry.
NOTES TO FINANCIAL STATEMENTS (continued)
(f) Dividends to shareholders: Dividends are recorded on ex-dividend date. Dividends from investment income-net are declared and paid quarterly. Dividends from net realized capital gains, if any, are normally declared and paid annually, but the fund may make distributions on a more frequent basis to comply with the distribution requirements of the Internal Revenue Code of 1986, as amended (the “Code”).To the extent that net realized capital gains can be offset by capital loss carryovers, it is the policy of the fund not to distribute such gains. Income and capital gain distributions are determined in accordance with income tax regulations, which may differ from GAAP.
On October 31, 2011, the Board of Trustees declared a cash dividend of $.050, $.022 and $.058 per share from undistributed investment income-net for Class A, Class C and Class I shares, respectively, payable on November 1, 2011 (ex-dividend date), to shareholders of record as of the close of business on October 31, 2011.
(g) Federal income taxes: It is the policy of the fund to continue to qualify as a regulated investment company, if such qualification is in the best interests of its shareholders, by complying with the applicable provisions of the Code, and to make distributions of taxable income sufficient to relieve it from substantially all federal income and excise taxes.
As of and during the period ended October 31, 2011, the fund did not have any liabilities for any uncertain tax positions.The fund recognizes interest and penalties, if any, related to uncertain tax positions as income tax expense in the Statement of Operations. During the period, the fund did not incur any interest or penalties.
Each of the tax years in the four-year period ended October 31, 2011 remains subject to examination by the Internal Revenue Service and state taxing authorities.
At October 31, 2011, the components of accumulated earnings on a tax basis were as follows: undistributed ordinary income $2,865,497, undistributed capital gains $10,903,668 and unrealized appreciation $27,778,507.
36
The tax character of distributions paid to shareholders during the fiscal periods ended October 31, 2011 and October 31, 2010 were as follows: ordinary income $41,244,561 and $14,775,435 and long-term capital gains $8,148,545 and $1,744,686, respectively.
During the period ended October 31, 2011, as a result of permanent book to tax differences, primarily due to the tax treatment for paydowns gains and losses, foreign currency transactions, the treatment of swap periodic payments and dividend reclassification, the fund decreased accumulated undistributed investment income-net by $7,484,724 and increased accumulated net realized gain (loss) on investments by the same amount. Net assets and net asset value per share were not affected by this reclassification.
(h) New Accounting Pronouncement: In April 2011, FASB issued ASU No. 2011-03 “Transfers and Servicing (Topic 860) Reconsideration of Effective Control for Repurchase Agreements (“ASU 2011-03”) which relates to the accounting for repurchase agreements and similar agreements including mortgage dollar rolls, that both entitle and obligate a transferor to repurchase or redeem financial assets before their maturity. ASU 2011-03 modifies the criteria for determining effective control of transferred assets and as a result certain agreements may now be accounted for as secured borrowings.ASU 2011-03 is effective prospectively for new transfers and existing transactions that are modified in the first interim or annual period beginning on or after December 15, 2011. Management is currently evaluating the implications of this change and its impact on the financial statements.
NOTE 2—Bank Lines of Credit:
The fund participates with other Dreyfus-managed funds in a $225 million unsecured credit facility led by Citibank, N.A. and a $300 million unsecured credit facility provided by The Bank of New York Mellon (each, a “Facility”), each to be utilized primarily for temporary or emergency purposes, including the financing of redemptions. In
NOTES TO FINANCIAL STATEMENTS (continued)
connection therewith, the fund has agreed to pay its pro rata portion of commitment fees for each Facility. Interest is charged to the fund based on rates determined pursuant to the terms of the respective Facility at the time of borrowing. During the period ended October 31, 2011, the fund did not borrow under the Facilities.
NOTE 3—Management Fee and Other Transactions with Affiliates:
(a) Pursuant to a management agreement with the Manager and the Trust, the Trust has agreed to pay the Manager a management fee computed at the annual rate of .60% of the value of the fund’s average daily net assets and is payable monthly.The Manager had contractually agreed to waive receipt of its fees and/or assume certain expenses of the fund, until March 1, 2011, so that annual direct fund operating expenses (excluding taxes, brokerage fees, Rule 12b-1 distribution plan fees, shareholder services plan fees, interest expense, commitment fees on borrowings and extraordinary expenses) do not exceed an annual rate of .85% of the value of the fund’s average daily net assets. During the period ending October 31, 2011, there was no expense reimbursement pursuant to the undertaking.
(b) Each Trustee who is not an “interested person” of the Trust (as defined in the Act) receives $60,000 per annum, plus $7,000 per joint Board meeting of the Trust, The Dreyfus/Laurel Funds, Inc., The Dreyfus/Laurel Tax-Free Municipal Funds, Dreyfus Investment Funds and Dreyfus Fund, Inc. (collectively, the “Board Group Open-End Funds”) attended, $2,500 for separate in-person committee meetings attended which are not held in conjunction with a regularly scheduled Board meeting and $2,000 for Board meetings and separate committee meetings attended that are conducted by telephone.The Board Group Open-End Funds also reimburse each Trustee who is not an “interested person” of the Trust (as defined in the Act) for travel and out-of-pocket expenses. With respect to Board meetings, the Chair of the Board receives an additional 25% of such compensation (with the exception of reimbursable amounts).The Chair of each of the Board’s
38
committees, unless the Chair also serves as Chair of the Board, receives $1,350 per applicable committee meeting. In the event that there is an in-person joint committee meeting or a joint telephone meeting of the Board Group Open-End Funds and Dreyfus HighYield Strategies Fund (“DHF”), the $2,500 is allocated between the Board Group Open-End Funds and DHF.
Effective January 1, 2012, the Board Group Open-End Funds and DHF (collectively, the “Board Group Funds”) will pay each Trustee their respective allocated portions of an annual retainer of $85,000 and a fee of $10,000 for each regularly scheduled Board meeting attended ($75,000 and $8,000, respectively, in the aggregate, prior to January 1, 2012).With respect to the annual retainer and Board meetings of the Board Group Funds, the Chair of the Board will receive an additional 25% of such compensation (with the exception of reimbursable amounts). Each Trustee will receive $2,500 for any separate in-person committee meetings attended, which are not held in conjunction with a regularly scheduled Board meeting, such amount to be allocated among the Board Group Funds, as applicable. In the event that there is a joint telephone meeting of the Board Group Funds, a fee of $2,000 will be allocated among the applicable Board Group Funds, accordingly (prior to January 1, 2012, the fee allocated was $2,500 if the meeting included DHF).The Chair of each of the Board’s committees, unless the Chair also serves as Chair of the Board, will receive $1,500 per applicable committee meeting. Each Emeritus Trustee is entitled to receive an annual retainer of one-half the amount paid as a retainer at the time the Trustee became Emeritus and a per meeting attended fee of one-half the amount paid to Trustees. The Board Group Funds also reimburse each Independent Trustee and Emeritus Trustees for travel and out-of-pocket expenses.
TheTrust’s portion of these fees and expenses are charged and allocated to each series based on net assets. Amounts required to be paid by the Trust directly to the non-interested Trustees, that would be applied to offset a portion of the management fee payable to the Manager, are in fact paid directly by the Manager to the non-interested Trustees.
NOTES TO FINANCIAL STATEMENTS (continued)
During the period ended October 31, 2011, the Distributor retained $80,787 from commissions earned on sales of the fund’s Class A shares and $41,137 from CDSCs on redemptions of the fund’s Class C shares.
(c) Under the Distribution Plan (the “Plan”) adopted pursuant to Rule 12b-1 under the Act, Class C shares pay the Distributor for distributing its shares at an annual rate of .75% of the value of the average daily net assets of Class C shares. During the period ended October 31, 2011, Class C shares were charged $875,968, pursuant to the Plan.
(d) Under the Shareholder Services Plan, Class A and Class C shares pay the Distributor at an annual rate of .25% of the value of their average daily net assets for the provision of certain services.These services provided may include personal services relating to shareholder accounts, such as answering shareholder inquiries regarding the fund and providing reports and other information, and services related to the maintenance of shareholder accounts. The Distributor may make payments to Service Agents (a securities dealer, financial institution or other industry professional) in respect of these services. The Distributor determines the amounts to be paid to Service Agents. During the period ended October 31, 2011, Class A and Class C shares were charged $1,116,641 and $291,989, respectively, pursuant to the Shareholder Services Plan.
Under its terms, the Plan and Shareholder Services Plan shall remain in effect from year to year, provided such continuance is approved annually by a vote of a majority of those Trustees who are not “interested persons” of the Trust and who have no direct or indirect financial interest in the operation of or in any agreement related to the Plan or Shareholder Services Plan.
The fund compensates Dreyfus Transfer, Inc., a wholly-owned subsidiary of the Manager, under a transfer agency agreement for providing personnel and facilities to perform transfer agency services for the fund. During the period ended October 31, 2011, the fund was charged $175,296 pursuant to the transfer agency agreement, which is included in Shareholder servicing costs in the Statement of Operations.
40
The fund has arrangements with the custodian and cash management bank whereby the fund may receive earnings credits when positive cash balances are maintained, which are used to offset custody and cash management fees. For financial reporting purposes, the fund includes net earnings credits as an expense offset in the Statement of Operations.
The fund compensates The Bank of New York Mellon under cash management agreements for performing cash management services related to fund subscriptions and redemptions. During the period ended October 31, 2011, the fund was charged $29,670 pursuant to the cash management agreements, which is included in Shareholder servicing costs in the Statement of Operations. These fees were partially offset by earnings credits of $901.
The fund also compensates The Bank of New York Mellon under a custody agreement for providing custodial services for the fund. During the period ended October 31, 2011, the fund was charged $181,513 pursuant to the custody agreement.
During the period ended October 31, 2011, the fund was charged $6,751 for services performed by the Chief Compliance Officer.
The components of “Due to The Dreyfus Corporation and affiliates” in the Statement of Assets and Liabilities consist of: management fees $607,923, Rule 12b-1 distribution plan fees $97,388, shareholder services plan fees $156,831, custodian fees $85,818, chief compliance officer fees $4,246 and transfer agency per account fees $43,773.
NOTE 4—Securities Transactions:
The aggregate amount of purchases and sales (including paydowns) of investment securities, excluding short-term securities, forward contracts, financial futures, options transactions and swap transactions, during the period ended October 31, 2011, amounted to $2,337,435,281 and $1,909,091,487, respectively.
The following tables show the fund’s exposure to different types of market risk as it relates to the Statement of Assets and Liabilities and the Statement of Operations, respectively.
NOTES TO FINANCIAL STATEMENTS (continued)
Fair value of derivative instruments as of October 31, 2011 is shown below:
| | | | |
| | Derivative | | Derivative |
| | Assets ($) | | Liabilities ($) |
| Interest rate risk1 | 107,526 | Interest rate risk1,2 | (3,305,698) |
| Foreign exchange risk3 | 1,015,827 | Foreign exchange risk4 | (1,767,398) |
| Credit risk | — | Credit risk2 | (143,921) |
| Gross fair value of | | | |
| derivatives contracts | 1,123,353 | | (5,217,017) |
| |
| Statement of Assets and Liabilities location: |
| 1 | Includes cumulative appreciation (depreciation) on futures contracts as reported in the Statement of |
| | Financial Futures, but only the unpaid variation margin is reported in the Statement of Assets |
| | and Liabilities. |
| 2 | Unrealized depreciation on swap contracts. |
| 3 | Unrealized appreciation on forward foreign currency exchange contracts. |
| 4 | Unrealized depreciation on forward foreign currency exchange contracts. |
The effect of derivative instruments in the Statement of Operations during the period ended October 31, 2011 is shown below:
| | | | | | | | | |
| | Amount of realized gain or (loss) on derivatives recognized in income ($) |
| | | | Forward | | |
| Underlying risk | Futures5 | Options6 | Contracts7 | Swaps8 | Total |
| Interest | | | | | |
| rate | (10,265,476) | — | — | (8,357,320) (18,622,796) |
| Foreign | | | | | |
| exchange | — | (1,282,682) | 8,918,912 | — | 7,636,230 |
| Credit | — | — | — | 1,166,766 | 1,166,766 |
| Total | (10,265,476) | (1,282,682) | 8,918,912 | (7,190,554) | (9,819,800) |
| | | | | | | | | | |
| Change in unrealized appreciation or (depreciation) on derivatives recognized in income ($) |
| | | | Forward | | |
| Underlying risk | Futures9 | Options10 | Contracts11 | Swaps12 | Total |
| Interest rate | (708,616) | (1,620,170) | — | 6,232,725 | 3,903,939 |
| Foreign | | | | | |
| exchange | — | 993,248 | (1,381,389) | — | (388,141) |
| Credit | — | — | — | (868,495) | (868,495) |
| Total | (708,616) | (626,922) | (1,381,389) | 5,364,230 | 2,647,303 |
| |
| Statement of Operations location: |
| 5 | Net realized gain (loss) on financial futures. |
| 6 | Net realized gain (loss) on options transactions. |
| 7 | Net realized gain (loss) on forward foreign currency exchange contracts. |
| 8 | Net realized gain (loss) on swap transactions. |
| 9 | Net unrealized appreciation (depreciation) on financial futures. |
| 10 Net unrealized appreciation (depreciation) on options transactions. |
| 11 Net unrealized appreciation (depreciation) on forward foreign currency exchange contracts. |
| 12 Net unrealized appreciation (depreciation) on swap transactions. |
42
Futures Contracts: In the normal course of pursuing its investment objective, the fund is exposed to market risk, including interest rate risk as a result of changes in value of underlying financial instruments.The fund invests in financial futures contracts in order to manage its exposure to or protect against changes in the market. A futures contract represents a commitment for the future purchase or a sale of an asset at a specified date. Upon entering into such contracts, these investments require initial margin deposits with a broker, which consist of cash or cash equivalents. The amount of these deposits is determined by the exchange or Board of Trade on which the contract is traded and is subject to change.Accordingly, variation margin payments are received or made to reflect daily unrealized gains or losses which are recorded in the Statement of Operations. Futures contracts are valued daily at the last sales price established by the Board of Trade or exchange upon which they are traded.When the contracts are closed, the fund recognizes a realized gain or loss.There is minimal counterparty credit risk to the fund with futures since futures are exchange traded, and the exchange’s clearinghouse guarantees the futures against default. Contracts open at October 31, 2011 are set forth in the Statement of Financial Futures.
Options: The fund purchases and writes (sells) put and call options to hedge against changes in interest rates, foreign currencies, or as a substitute for an investment.The fund is subject to interest rate risk and currency risk in the course of pursuing its investment objectives through its investments in options contracts. A call option gives the purchaser of the option the right (but not the obligation) to buy, and obligates the writer to sell, the underlying security or securities at the exercise price at any time during the option period, or at a specified date. Conversely, a put option gives the purchaser of the option the right (but not the obligation) to sell, and obligates the writer to buy the underlying security or securities at the exercise price at any time during the option period, or at a specified date.
NOTES TO FINANCIAL STATEMENTS (continued)
As a writer of call options, the fund receives a premium at the outset and then bears the market risk of unfavorable changes in the price of the financial instrument underlying the option. Generally, the fund realizes a gain, to the extent of the premium, if the price of the underlying financial instrument decreases between the date the option is written and the date on which the option is terminated. Generally, the fund incurs a loss, if the price of the financial instrument increases between those dates.
As a writer of put options, the fund receives a premium at the outset and then bears the market risk of unfavorable changes in the price of the financial instrument underlying the option. Generally, the fund realizes a gain, to the extent of the premium, if the price of the underlying financial instrument increases between the date the option is written and the date on which the option is terminated. Generally, the fund incurs a loss, if the price of the financial instrument decreases between those dates.
As a writer of an option, the fund has no control over whether the underlying securities may be sold (call) or purchased (put) and as a result bears the market risk of an unfavorable change in the price of the security underlying the written option.There is a risk of loss from a change in value of such options which may exceed the related premiums received. One risk of holding a put or a call option is that if the option is not sold or exercised prior to its expiration, it becomes worthless. However, this risk is limited to the premium paid by the fund. Upon the expiration or closing of the option transaction, a gain or loss is reported in the Statement of Operations.
The following summarizes the fund’s call/put options written during the period ended October 31, 2011:
| | | | |
| | Face Amount | | Options Terminated |
| | Covered by | Premiums | | Net Realized |
| Options Written: | Contracts ($) | Received ($) | Cost ($) | Gain ($) |
| Contracts outstanding | | | | |
| October 31, 2010 | 21,500,000 | 322,500 | | |
| Contracts terminated: | | | | |
| Contracts expired | 21,500,000 | 322,500 | — | 322,500 |
| Contracts outstanding | | | | |
| October 31, 2011 | — | — | | |
44
Forward Foreign Currency Exchange Contracts: The fund enters into forward contracts in order to hedge its exposure to changes in foreign currency exchange rates on its foreign portfolio holdings, to settle foreign currency transactions or as a part of its investment strategy. When executing forward contracts, the fund is obligated to buy or sell a foreign currency at a specified rate on a certain date in the future. With respect to sales of forward contracts, the fund incurs a loss if the value of the contract increases between the date the forward contract is opened and the date the forward contract is closed.The fund realizes a gain if the value of the contract decreases between those dates. With respect to purchases of forward contracts, the fund incurs a loss if the value of the contract decreases between the date the forward contract is opened and the date the forward contract is closed.The fund realizes a gain if the value of the contract increases between those dates. Any realized gain or loss which occurred during the period is reflected in the Statement of Operations.The fund is exposed to foreign currency risk as a result of changes in value of underlying financial instruments. The fund is also exposed to credit risk associated with counterparty nonperformance on these forward contracts, which is typically limited to the unrealized gain on each open contract.The following summarizes open forward contracts at October 31, 2011:
| | | | | |
| | Foreign | | | Unrealized | |
| Forward Foreign Currency | Currency | | | Appreciation | |
| Exchange Contracts | Amounts | Cost ($) | Value ($) (Depreciation) ($) | |
| Purchases: | | | | | |
| Australian Dollar, | | | | | |
| Expiring | | | | | |
| 11/30/2011 | 4,316,000 | 4,573,837 | 4,532,042 | (41,795 | ) |
| British Pound, | | | | | |
| Expiring | | | | | |
| 11/30/2011 | 2,970,000 | 4,662,989 | 4,774,075 | 111,086 | |
| British Pound, | | | | | |
| Expiring | | | | | |
| 11/30/2011 | 910,000 | 1,427,762 | 1,462,763 | 35,001 | |
| Canadian Dollar, | | | | | |
| Expiring | | | | | |
| 11/30/2011 | 62,865,000 | 63,232,380 | 63,026,979 | (205,401 | ) |
NOTES TO FINANCIAL STATEMENTS (continued)
| | | | |
| | Foreign | | Unrealized | |
| Forward Foreign Currency Currency | | Appreciation | |
| Exchange Contracts | Amounts | Cost ($) Value ($) (Depreciation) ($) | |
| Purchases (continued): | | | |
| Japanese Yen, | | | | |
| Expiring | | | | |
| 11/30/2011 | 9,494,310,000 | 121,439,498 121,507,415 | 67,917 | |
| Malaysian Ringgit, | | | | |
| Expiring | | | | |
| 11/30/2011 | 113,370,000 | 36,928,339 36,887,486 | (40,853 | ) |
| Mexican New Peso, | | | | |
| Expiring | | | | |
| 11/30/2011 | 559,220,000 | 42,221,215 41,837,429 | (383,786 | ) |
| New Zeland Dollar, | | | | |
| Expiring | | | | |
| 11/30/2011 | 2,020,000 | 1,598,628 1,630,137 | 31,509 | |
| Singapore Dollar, | | | | |
| Expiring | | | | |
| 11/30/2011 | 34,000,000 | 26,773,761 27,095,735 | 321,974 | |
| Singapore Dollar, | | | | |
| Expiring | | | | |
| 11/30/2011 | 25,080,000 | 20,147,005 19,987,089 | (159,916 | ) |
| Swiss Franc, | | | | |
| Expiring | | | | |
| 11/30/2011 | 12,750,000 | 14,184,160 14,531,405 | 347,245 | |
| Sales: | | Proceeds ($) | | |
| Euro, | | | | |
| Expiring | | | | |
| 11/1/2011 | 10,447,773 | 14,553,935 14,456,583 | 97,352 | |
| Euro, | | | | |
| Expiring | | | | |
| 11/30/2011 | 9,675,000 | 13,250,415 13,383,408 | (132,993 | ) |
| Malaysian Ringgit, | | | | |
| Expiring | | | | |
| 11/30/2011 | 2,960,000 | 948,672 963,102 | (14,430 | ) |
| Norwegian Krone | | | | |
| Expiring | | | | |
| 11/30/2011 | 15,660,000 | 2,785,326 2,807,704 | (22,378 | ) |
| Polish Zloty, | | | | |
| Expiring | | | | |
| 11/30/2011 | 7,295,000 | 2,289,158 2,285,415 | 3,743 | |
| Swedish Krona, | | | | |
| Expiring | | | | |
| 11/30/2011 | 266,870,000 | 40,117,495 40,881,134 | (763,639 | ) |
| South African Rand, | | | | |
| Expiring | | | | |
| 11/30/2011 | 1,870,000 | 232,390 234,597 | (2,207 | ) |
| Gross Unrealized | | | | |
| Appreciation | | | 1,015,827 | |
| Gross Unrealized | | | | |
| Depreciation | | | (1,767,398 | ) |
46
Swaps: The fund enters into swap agreements to exchange the interest rate on, or return generated by, one nominal instrument for the return generated by another nominal instrument.The fund enters into these agreements to hedge certain market or interest rate risks, to manage the interest rate sensitivity (sometimes called duration) of fixed income securities, to provide a substitute for purchasing or selling particular securities or to increase potential returns.
The fund accrues for the interim payments on swap contracts on a daily basis, with the net amount recorded within unrealized appreciation (depreciation) on swap contracts in the Statement of Assets and Liabilities. Once the interim payments are settled in cash, the net amount is recorded as realized gain (loss) on swaps, in addition to realized gain (loss) recorded upon the termination of swap contracts in the Statement of Operations. Upfront payments made and/or received by the fund, are recorded as an asset and/or liability in the Statement of Assets and Liabilities and are recorded as a realized gain or loss ratably over the contract’s term/event with the exception of forward starting interest rate swaps which are recorded as realized gains or losses on the termination date. Fluctuations in the value of swap contracts are recorded for financial statement purposes as unrealized appreciation or depreciation on swap transactions.
Interest Rate Swaps: Interest rate swaps involve the exchange of commitments to pay and receive interest based on a notional principal amount.The fund enters into these agreements for a variety of reasons, including to hedge certain market or interest rate risks, to manage the interest rate sensitivity (sometimes called duration) of fixed income securities, to provide a substitute for purchasing or selling particular securities or to increase potential returns.The fund may elect to pay a fixed rate and receive a floating rate, or receive a fixed rate and pay a floating rate on a notional principal amount.The net interest received or paid on interest rate swap agreements is included within unrealized appreciation (depreciation) on swap contracts in the Statement of Assets and Liabilities. Interest rate swaps are valued daily and the
NOTES TO FINANCIAL STATEMENTS (continued)
change, if any, is recorded as an unrealized gain or loss in the Statement of Operations. When a swap contract is terminated early, the fund records a realized gain or loss equal to the difference between the current realized value and the expected cash flows.
The fund’s maximum risk of loss from counterparty credit risk is the discounted net value of the cash flows to be received from the coun-terparty over the contract’s remaining life, to the extent that the amount is positive. This risk is mitigated by having a master netting arrangement between the fund and the counterparty and by the posting of collateral by the counterparty to the fund to cover the fund’s exposure to the counterparty.The following summarizes open interest rate swaps entered into by the fund at October 31, 2011:
| | | | | | | |
| Notional | Reference | | (Pay)/Receive | | | Unrealized | |
| Amount ($) | Entity/Currency | Counterparty | Fixed Rate (%) | | Expiration (Depreciation) ($) | |
| |
| 17,345,000 | USD—6 Month | | | | | | |
| | Libor | Citibank | (3.68 | ) | 5/5/2020 | (2,449,365 | ) |
Credit Default Swaps: Credit default swaps involve commitments to pay a fixed interest rate in exchange for payment if a credit event affecting a third party (the referenced company, obligation or index) occurs. Credit events may include a failure to pay interest or principal, bankruptcy, or restructuring.The fund enters into these agreements to manage its exposure to the market or certain sectors of the market, to reduce its risk exposure to defaults of corporate and sovereign issuers, or to create exposure to corporate or sovereign issuers to which it is not otherwise exposed. For those credit default swaps in which the fund is paying a fixed rate, the fund is buying credit protection on the instrument. In the event of a credit event, the fund would receive the full notional amount for the reference obligation. For those credit default swaps in which the fund is receiving a fixed rate, the fund is selling credit protection on the underlying instrument.The maximum payouts for these contracts are limited to the notional amount of each swap. Credit default swaps may involve greater risks than if the fund had invested in the reference obligation directly and are subject to general market risk, liquidity risk, counterparty risk and credit risk.
48
The maximum potential amount of future payments (undiscounted) that a fund as a seller of protection could be required to make under a credit default swap agreement would be an amount equal to the notional amount of the agreement which may exceed the amount of unrealized appreciation or depreciation reflected in the Statement of Assets and Liabilities. Notional amounts of all credit default swap agreements are disclosed in the following chart, which summarizes open credit default swaps on index issues entered into by the fund. These potential amounts would be partially offset by any recovery values of the respective referenced obligations, underlying securities comprising the referenced index, upfront payments received upon entering into the agreement, or net amounts received from the settlement of buy protection credit default swap agreements entered into by the fund for the same referenced entity or entities. The following summarizes open credit default swaps entered into by the fund at October 31, 2011:
| | | | | | |
| | | (Pay) | | | | |
| | | Receive | Implied | | Upfront | |
| Reference | Notional | Fixed | Credit | Market | Premiums | Unrealized |
| Obligation | Amount ($)2 | Rate (%) | Spread (%)3 | Value ($) | Received ($) | (Depreciation) ($) |
| |
| Sales Contracts:1 | | | | | | |
| Dow Jones | | | | | | |
| CDX.NA.HY.17 | | | | | | |
| Index | | | | | | |
| 12/20/2016† | 25,600,000a | 5.00 | 6.42 | (1,325,401) | (1,181,480) | (143,921 |
| |
| † | Expiration Date |
| Counterparty: |
| a | Deutsche Bank |
| 1 | If the fund is a seller of protection and a credit event occurs, as defined under the terms of the swap |
| | agreement, the fund will either (i) pay to the buyer of protection an amount equal to the notional |
| | amount of the swap and take delivery of the reference obligation or (ii) pay a net settlement |
| | amount in the form of cash or securities equal to the notional amount of the swap less the recovery |
| | value of the reference obligation. |
| 2 | The maximum potential amount the fund could be required to pay as a seller of credit protection |
| | or receive as a buyer of credit protection if a credit event occurs as defined under the terms of the |
| | swap agreement. |
| 3 | Implied credit spreads, represented in absolute terms, utilized in determining the market value as of |
| | the period end serve as an indicator of the current status of the payment/performance risk and |
| | represent the likelihood of risk of default for the credit derivative.The credit spread of a particular |
| | referenced entity reflects the cost of buying/selling protection and may include upfront payments |
| | required to be made to enter into the agreement.Wider credit spreads represent a deterioration of |
| | the referenced entity’s credit soundness and a greater likelihood of risk of default or other credit |
| | event occurring as defined under the terms of the agreement.A credit spread identified as |
| | “Defaulted” indicates a credit event has occurred for the referenced entity. |
NOTES TO FINANCIAL STATEMENTS (continued)
GAAP requires disclosure for (i) the nature and terms of the credit derivative, reasons for entering into the credit derivative, the events or circumstances that would require the seller to perform under the credit derivative, and the current status of the payment/performance risk of the credit derivative, (ii) the maximum potential amount of future payments (undiscounted) the seller could be required to make under the credit derivative, (iii) the fair value of the credit derivative, and (iv) the nature of any recourse provisions and assets held either as collateral or by third parties.All required disclosures have been made and are incorporated within the current period as part of the Notes to the Statement of Investments and disclosures within this Note.
The following summarizes the average market value of derivatives outstanding during the period ended October 31, 2011:
| |
| | Average Market Value ($) |
| Interest rate futures contracts | 248,555,322 |
| Interest rate options contracts | 278,868 |
| Foreign currency options contracts | 168,605 |
| Forward contracts | 388,301,900 |
The following summarizes the average notional value of swap contracts outstanding during the period ended October 31, 2011:
| |
| | Average Notional Value ($) |
| Interest rate swap contracts | 87,673,905 |
| Credit default swap contracts | 15,800,000 |
At October 31, 2011, the cost of investments for federal income tax purposes was $1,224,785,134; accordingly, accumulated net unrealized appreciation on investments was $35,573,121, consisting of $49,543,844 gross unrealized appreciation and $13,970,723 gross unrealized depreciation.
50
NOTE 5—Other Matters:
At the October 27, 2011 Board meeting, the Board of the Trust approved a proposal to have shareholders consider the election of Francine J. Bovich as an additionalTrustee of theTrust and also consider the election of Joseph S. Dimartino and Benaree Pratt Wiley, current Trustees of the Trust not previously proposed to shareholders of the fund. A proxy statement was mailed, on December 1, 2011, to shareholders of record as of the close of business on November 1, 2011 asking shareholders to consider these elections at a special joint meeting of shareholders to be held on Wednesday, February 8, 2012.
|
| REPORT OF INDEPENDENT REGISTERED |
| PUBLIC ACCOUNTING FIRM |
The Board of Trustees and Shareholders of The Dreyfus/Laurel Funds Trust
We have audited the accompanying statement of assets and liabilities of Dreyfus International Bond Fund, a series of The Dreyfus/Laurel Funds Trust (the “Fund”), including the statement of investments and financial futures, as of October 31, 2011, and the related statement of operations for the year then ended, the statements of changes in net assets for each of the years in the two-year period then ended, and the financial highlights for each of the years in the five-year period then.These financial statements and financial highlights are the responsibility of the Fund’s management. Our responsibility is to express an opinion on these financial statements and financial highlights based on our audits.
We conducted our audits in accordance with the standards of the Public Company Accounting Oversight Board (United States).Those standards require that we plan and perform the audit to obtain reasonable assurance about whether the financial statements and financial highlights are free of material misstatement. An audit includes examining, on a test basis, evidence supporting the amounts and disclosures in the financial statements. Our procedures included confirmation of securities owned as of October 31, 2011, by correspondence with the custodian and brokers or by other appropriate auditing procedures where replies from brokers were not received. An audit also includes assessing the accounting principles used and significant estimates made by management, as well as evaluating the overall financial statement presentation.We believe that our audits provide a reasonable basis for our opinion.
In our opinion, the financial statements and financial highlights referred to above present fairly, in all material respects, the financial position of Dreyfus International Bond Fund as of October 31, 2011, the results of its operations for the year then ended, the changes in its net assets for each of the years in the two-year period then ended, and the financial highlights for each of the years in the five-year period then ended, in conformity with U.S. generally accepted accounting principles.

New York, New York
December 22, 2011
52
IMPORTANT TAX INFORMATION (Unaudited)
For federal tax purposes the fund designates the maximum amount allowable but not less than $.1711 per share as a capital gain dividend paid on December 29, 2010 in accordance with Section 852(b)(3)(C) of the Internal Revenue Code. Also, the fund designates the maximum amount allowable but not less than $.4009 as a short-term capital gain dividend paid on December 29, 2010 in accordance with Sections 871(k)(2) and 881(e) of the Internal Revenue Code. The fund also designates the maximum amount allowable but not less than 27.01% as interest-related dividends in accordance with Sections 871(k)(1) and 881(e) of the Internal Revenue Code.Where required by federal tax law rules, shareholders will receive notification of their proportionate share of foreign sourced income for the 2011 calendar year with Form 1099-DIV which will be mailed in early 2012.
BOARD MEMBERS INFORMATION (Unaudited)
|
| Joseph S. DiMartino (68) |
| Chairman of the Board (1999) |
| Principal Occupation During Past 5Years: |
| • Corporate Director and Trustee |
| Other Public Company Board Memberships During Past 5Years: |
| • CBIZ (formerly, Century Business Services, Inc.), a provider of outsourcing functions for small |
| and medium size companies, Director (1997-present) |
| • Sunair Services Corporation, a provider of certain outdoor-related services to homes and |
| businesses, Director (2005-2009) |
| • The Newark Group, a provider of a national market of paper recovery facilities, paperboard |
| mills and paperboard converting plants, Director (2000-2010) |
| No. of Portfolios for which Board Member Serves: 167 |
| ——————— |
| James M. Fitzgibbons (77) |
| Board Member (1994) |
| Principal Occupation During Past 5Years: |
| • Corporate Director and Trustee |
| Other Public Company Board Memberships During Past 5Years: |
| • Bill Barrett Corporation, an oil and natural gas exploration company, Director (2004-present) |
| No. of Portfolios for which Board Member Serves: 33 |
| ——————— |
| Kenneth A. Himmel (65) |
| Board Member (1988) |
| Principal Occupation During Past 5Years: |
| • President and CEO, Related Urban Development, a real estate development company (1996-present) |
| • President and CEO, Himmel & Company, a real estate development company (1980-present) |
| • CEO,American Food Management, a restaurant company (1983-present) |
| No. of Portfolios for which Board Member Serves: 33 |
54
|
| Stephen J. Lockwood (64) |
| Board Member (1993) |
| Principal Occupation During Past 5Years: |
| • Chairman of the Board, Stephen J. Lockwood and Company LLC, a real estate investment |
| company (2000-present) |
| No. of Portfolios for which Board Member Serves: 33 |
| ——————— |
| Roslyn M. Watson (61) |
| Board Member (1992) |
| Principal Occupation During Past 5Years: |
| • Principal,Watson Ventures, Inc., a real estate investment company (1993-present) |
| No. of Portfolios for which Board Member Serves: 43 |
| ——————— |
| Benaree Pratt Wiley (65) |
| Board Member (1998) |
| Principal Occupation During Past 5Years: |
| • Principal,TheWiley Group, a firm specializing in strategy and business development (2005-present) |
| Other Public Company Board Memberships During Past 5Years: |
| • CBIZ (formerly, Century Business Services, Inc.), a provider of outsourcing functions |
| for small and medium size companies, Director (2008-present) |
| No. of Portfolios for which Board Member Serves: 68 |
| ——————— |
|
| Once elected all Board Members serve for an indefinite term, but achieve Emeritus status upon reaching age 80.The |
| address of the Board Members and Officers is in c/o The Dreyfus Corporation, 200 Park Avenue, NewYork, NewYork |
| 10166.Additional information about the Board Members is available in the fund’s Statement of Additional Information |
| which can be obtained from Dreyfus free of charge by calling this toll free number: 1-800-DREYFUS. |
| J.Tomlinson Fort, Emeritus Board Member |
OFFICERS OF THE FUND (Unaudited)
BRADLEY J. SKAPYAK, President since January 2010.
Chief Operating Officer and a director of the Manager since June 2009. From April 2003 to June 2009, Mr. Skapyak was the head of the Investment Accounting and Support Department of the Manager. He is an officer of 75 investment companies (comprised of 167 portfolios) managed by the Manager. He is 52 years old and has been an employee of the Manager since February 1988.
MICHAEL A. ROSENBERG, Vice President and Secretary since August 2005.
Assistant General Counsel of BNY Mellon, and an officer of 76 investment companies (comprised of 192 portfolios) managed by the Manager. He is 51 years old and has been an employee of the Manager since October 1991.
KIESHA ASTWOOD, Vice President and Assistant Secretary since January 2010.
Counsel of BNY Mellon, and an officer of 76 investment companies (comprised of 192 portfolios) managed by the Manager. She is 38 years old and has been an employee of the Manager since July 1995.
JAMES BITETTO, Vice President and Assistant Secretary since August 2005.
Senior Counsel of BNY Mellon and Secretary of the Manager, and an officer of 76 investment companies (comprised of 192 portfolios) managed by the Manager. He is 45 years old and has been an employee of the Manager since December 1996.
JONI LACKS CHARATAN, Vice President and Assistant Secretary since August 2005.
Senior Counsel of BNY Mellon, and an officer of 76 investment companies (comprised of 192 portfolios) managed by the Manager. She is 55 years old and has been an employee of the Manager since October 1988.
JOSEPH M. CHIOFFI, Vice President and Assistant Secretary since August 2005.
Senior Counsel of BNY Mellon, and an officer of 76 investment companies (comprised of 192 portfolios) managed by the Manager. He is 49 years old and has been an employee of the Manager since June 2000.
KATHLEEN DENICHOLAS, Vice President and Assistant Secretary since January 2010.
Senior Counsel of BNY Mellon, and an officer of 76 investment companies (comprised of 192 portfolios) managed by the Manager. She is 37 years old and has been an employee of the Manager since February 2001.
JANETTE E. FARRAGHER, Vice President and Assistant Secretary since August 2005.
Assistant General Counsel of BNY Mellon, and an officer of 76 investment companies (comprised of 192 portfolios) managed by the Manager. She is 48 years old and has been an employee of the Manager since February 1984.
JOHN B. HAMMALIAN, Vice President and Assistant Secretary since August 2005.
Managing Counsel of BNY Mellon, and an officer of 76 investment companies (comprised of 192 portfolios) managed by the Manager. He is 48 years old and has been an employee of the Manager since February 1991.
M. CRISTINA MEISER, Vice President and Assistant Secretary since January 2010.
Senior Counsel of BNY Mellon, and an officer of 76 investment companies (comprised of 192 portfolios) managed by the Manager. She is 41 years old and has been an employee of the Manager since August 2001.
56
ROBERT R. MULLERY, Vice President and Assistant Secretary since August 2005.
Managing Counsel of BNY Mellon, and an officer of 76 investment companies (comprised of 192 portfolios) managed by the Manager. He is 59 years old and has been an employee of the Manager since May 1986.
JEFF PRUSNOFSKY, Vice President and Assistant Secretary since August 2005.
Managing Counsel of BNY Mellon, and an officer of 76 investment companies (comprised of 192 portfolios) managed by the Manager. He is 46 years old and has been an employee of the Manager since October 1990.
JAMES WINDELS, Treasurer since November 2001.
Director – Mutual Fund Accounting of the Manager, and an officer of 76 investment companies (comprised of 192 portfolios) managed by the Manager. He is 53 years old and has been an employee of the Manager since April 1985.
RICHARD CASSARO, Assistant Treasurer since January 2008.
Senior Accounting Manager – Money Market and Municipal Bond Funds of the Manager, and an officer of 76 investment companies (comprised of 192 portfolios) managed by the Manager. He is 52 years old and has been an employee of the Manager since September 1982.
GAVIN C. REILLY, Assistant Treasurer since December 2005.
Tax Manager of the Investment Accounting and Support Department of the Manager, and an officer of 76 investment companies (comprised of 192 portfolios) managed by the Manager. He is 43 years old and has been an employee of the Manager since April 1991.
ROBERT ROBOL, Assistant Treasurer since December 2002.
Senior Accounting Manager – Fixed Income Funds of the Manager, and an officer of 76 investment companies (comprised of 192 portfolios) managed by the Manager. He is 47 years old and has been an employee of the Manager since October 1988.
ROBERT SALVIOLO, Assistant Treasurer since July 2007.
Senior Accounting Manager – Equity Funds of the Manager, and an officer of 76 investment companies (comprised of 192 portfolios) managed by the Manager. He is 44 years old and has been an employee of the Manager since June 1989.
ROBERT SVAGNA, Assistant Treasurer since December 2002.
Senior Accounting Manager – Equity Funds of the Manager, and an officer of 76 investment companies (comprised of 192 portfolios) managed by the Manager. He is 44 years old and has been an employee of the Manager since November 1990.
OFFICERS OF THE FUND (Unaudited) (continued)
JOSEPH W. CONNOLLY, Chief Compliance Officer since October 2004.
Chief Compliance Officer of the Manager and The Dreyfus Family of Funds (76 investment companies, comprised of 192 portfolios). From November 2001 through March 2004, Mr. Connolly was first Vice-President, Mutual Fund Servicing for Mellon Global Securities Services. In that capacity, Mr. Connolly was responsible for managing Mellon’s Custody, Fund Accounting and Fund Administration services to third-party mutual fund clients. He is 54 years old and has served in various capacities with the Manager since 1980, including manager of the firm’s Fund Accounting Department from 1997 through October 2001.
STEPHEN J. STOREN, Anti-Money Laundering Compliance Officer since May 2011.
Chief Compliance Officer of the Distributor, and the Anti-Money Laundering Compliance Officer of 72 investment companies (comprised of 188 portfolios) managed by the Manager. He is 57 years old and has been an employee of the Distributor since October 1999.
58
For More Information
Telephone Call your financial representative or 1-800-DREYFUS
Mail The Dreyfus Family of Funds, 144 Glenn Curtiss Boulevard, Uniondale, NY 11556-0144
The fund files its complete schedule of portfolio holdings with the Securities and Exchange Commission (“SEC”) for the first and third quarters of each fiscal year on Form N-Q. The fund’s Forms N-Q are available on the SEC’s website at http://www.sec.gov and may be reviewed and copied at the SEC’s Public Reference Room in Washington, DC. Information on the operation of the Public Reference Room may be obtained by calling 1-800-SEC-0330.
A description of the policies and procedures that the fund uses to determine how to vote proxies relating to portfolio securities, and information regarding how the fund voted these proxies for the most recent 12-month period ended June 30 is available at http://www.dreyfus.com and on the SEC’s website at http://www.sec.gov. The description of the policies and procedures is also available without charge, upon request, by calling 1-800-DREYFUS.

Item 2. Code of Ethics.
The Registrant has adopted a code of ethics that applies to the Registrant's principal executive officer, principal financial officer, principal accounting officer or controller, or persons performing similar functions. There have been no amendments to, or waivers in connection with, the Code of Ethics during the period covered by this Report.
Item 3. Audit Committee Financial Expert.
The Registrant's Board has determined that Joseph S. DiMartino, a member of the Audit Committee of the Board, is an audit committee financial expert as defined by the Securities and Exchange Commission (the "SEC"). Mr. DiMartino is "independent" as defined by the SEC for purposes of audit committee financial expert determinations.
Item 4. Principal Accountant Fees and Services.
(a) Audit Fees. The aggregate fees billed for each of the last two fiscal years (the "Reporting Periods") for professional services rendered by the Registrant's principal accountant (the "Auditor") for the audit of the Registrant's annual financial statements or services that are normally provided by the Auditor in connection with the statutory and regulatory filings or engagements for the Reporting Periods, were $67,115 in 2010 and $68,460 in 2011.
(b) Audit-Related Fees. The aggregate fees billed in the Reporting Periods for assurance and related services by the Auditor that are reasonably related to the performance of the audit of the Registrant's financial statements and are not reported under paragraph (a) of this Item 4 were $8,600 in 2010 and $8,600 in 2011. These services consisted of one or more of the following: (i) agreed upon procedures related to compliance with Internal Revenue Code section 817(h), (ii) security counts required by Rule 17f-2 under the Investment Company Act of 1940, as amended, (iii) advisory services as to the accounting or disclosure treatment of Registrant transactions or events and (iv) advisory services to the accounting or disclosure treatment of the actual or potential impact to the Registrant of final or proposed rules, standards or interpretations by the Securities and Exchange Commission, the Financial Accounting Standards Boards or other regulatory or standard-setting bodies.
The aggregate fees billed in the Reporting Periods for non-audit assurance and related services by the Auditor to the Registrant's investment adviser (not including any sub-investment adviser whose role is primarily portfolio management and is subcontracted with or overseen by another investment adviser), and any entity controlling, controlled by or under common control with the investment adviser that provides ongoing services to the Registrant ("Service Affiliates"), that were reasonably related to the performance of the annual audit of the Service Affiliate, which required pre-approval by the Audit Committee were $0 in 2010 and $0 in 2011.
(c) Tax Fees. The aggregate fees billed in the Reporting Periods for professional services rendered by the Auditor for tax compliance, tax advice, and tax planning ("Tax Services") were $4,520 in 2010 and $4,520 in 2011. These services consisted of: (i) review or preparation of U.S. federal, state, local and excise tax returns and (ii) determination of Passive Foreign Investment Companies. The aggregate fees billed in the Reporting Periods for Tax Services by the Auditor to Service Affiliates, which required pre-approval by the Audit Committee were $0 in 2010 and $0 in 2011.
(d) All Other Fees. The aggregate fees billed in the Reporting Periods for products and services provided by the Auditor, other than the services reported in paragraphs (a) through (c) of this Item, were $0 in 2010 and $0 in 2011.
The aggregate fees billed in the Reporting Periods for Non-Audit Services by the Auditor to Service Affiliates, other than the services reported in paragraphs (b) through (c) of this Item, which required pre-approval by the Audit Committee, were $0 in 2010 and $0 in 2011.
(e)(1) Audit Committee Pre-Approval Policies and Procedures. The Registrant's Audit Committee has established policies and procedures (the "Policy") for pre-approval (within specified fee limits) of the Auditor's engagements for non-audit services to the Registrant and Service Affiliates without specific case-by-case consideration. The pre-approved services in the Policy can include pre-approved audit services, pre-approved audit-related services, pre-approved tax services and pre-approved all other services. Pre-approval considerations include whether the proposed services are compatible with maintaining the Auditor's independence. Pre-approvals pursuant to the Policy are considered annually.
(e)(2) Note: None of the services described in paragraphs (b) through (d) of this Item 4 were approved by the Audit Committee pursuant to paragraph (c)(7)(i)(C) of Rule 2-01 of Regulation S-X.
(f) None of the hours expended on the principal accountant's engagement to audit the registrant's financial statements for the most recent fiscal year were attributed to work performed by persons other than the principal account's full-time, permanent employees.
Non-Audit Fees. The aggregate non-audit fees billed by the Auditor for services rendered to the Registrant, and rendered to Service Affiliates, for the Reporting Periods were $3,221,000 in 2010 and $12,152,586 in 2011.
Auditor Independence. The Registrant's Audit Committee has considered whether the provision of non-audit services that were rendered to Service Affiliates, which were not pre-approved (not requiring pre-approval), is compatible with maintaining the Auditor's independence.
Item 5. Audit Committee of Listed Registrants.
Not applicable.
Item 6. Investments.
(a) Not applicable.
Item 7. Disclosure of Proxy Voting Policies and Procedures for Closed-End Management Investment Companies.
Not applicable.
Item 8. Portfolio Managers of Closed-End Management Investment Companies.
Not applicable.
Item 9. Purchases of Equity Securities by Closed-End Management Investment Companies and Affiliated Purchasers.
Not applicable.
Item 10. Submission of Matters to a Vote of Security Holders.
There have been no material changes to the procedures applicable to Item 10.
Item 11. Controls and Procedures.
(a) The Registrant's principal executive and principal financial officers have concluded, based on their evaluation of the Registrant's disclosure controls and procedures as of a date within 90 days of the filing date of this report, that the Registrant's disclosure controls and procedures are reasonably designed to ensure that information required to be disclosed by the Registrant on Form N-CSR is recorded, processed, summarized and reported within the required time periods and that information required to be disclosed by the Registrant in the reports that it files or submits on Form N-CSR is accumulated and communicated to the Registrant's management, including its principal executive and principal financial officers, as appropriate to allow timely decisions regarding required disclosure.
(b) There were no changes to the Registrant's internal control over financial reporting that occurred during the second fiscal quarter of the period covered by this report that have materially affected, or are reasonably likely to materially affect, the Registrant's internal control over financial reporting.
Item 12. Exhibits.
(a)(1) Code of ethics referred to in Item 2.
(a)(2) Certifications of principal executive and principal financial officers as required by Rule 30a-2(a) under the Investment Company Act of 1940.
(a)(3) Not applicable.
(b) Certification of principal executive and principal financial officers as required by Rule 30a-2(b) under the Investment Company Act of 1940.
SIGNATURES
Pursuant to the requirements of the Securities Exchange Act of 1934 and the Investment Company Act of 1940, the Registrant has duly caused this Report to be signed on its behalf by the undersigned, thereunto duly authorized.
The Dreyfus/Laurel Funds Trust
By: /s/ Bradley J. Skapyak |
Bradley J. Skapyak, President |
Date: | December 19, 2011 |
|
Pursuant to the requirements of the Securities Exchange Act of 1934 and the Investment Company Act of 1940, this Report has been signed below by the following persons on behalf of the Registrant and in the capacities and on the dates indicated. |
|
By: /s/ Bradley J. Skapyak |
Bradley J. Skapyak, President |
Date: | December 19, 2011 |
|
By: /s/ James Windels |
James Windels, Treasurer |
Date: | December 19, 2011 |
|
EXHIBIT INDEX
(a)(1) Code of ethics referred to in Item 2.
(a)(2) Certifications of principal executive and principal financial officers as required by Rule 30a-2(a) under the Investment Company Act of 1940. (EX-99.CERT)
(b) Certification of principal executive and principal financial officers as required by Rule 30a-2(b) under the Investment Company Act of 1940. (EX-99.906CERT)