UNITED STATES
SECURITIES AND EXCHANGE COMMISSION
Washington, D.C. 20549
FORM N-CSR
CERTIFIED SHAREHOLDER REPORT OF REGISTERED MANAGEMENT
INVESTMENT COMPANIES
Investment Company Act file number | 811- 524 |
| |
| The Dreyfus/Laurel Funds Trust | |
| (Exact name of Registrant as specified in charter) | |
| | |
| c/o The Dreyfus Corporation 200 Park Avenue New York, New York 10166 | |
| (Address of principal executive offices) (Zip code) | |
| | |
| Janette E. Farragher, Esq. 200 Park Avenue New York, New York 10166 | |
| (Name and address of agent for service) | |
|
Registrant's telephone number, including area code: | (212) 922-6000 |
| |
Date of fiscal year end: | 10/31 | |
Date of reporting period: | 10/31/2012 | |
| | | | | | | |
The following N-CSR relates only to the series of the Registrant listed below, and does not affect the other series of the Registrant, which have different fiscal year ends and, therefore, different N-CSR reporting requirements. Separate N-CSR Forms will be filed for those series, as appropriate.
Dreyfus Global Equity Income Fund
Dreyfus International Bond Fund
FORM N-CSR
Item 1. Reports to Stockholders.
Save time. Save paper. View your next shareholder report online as soon as it’s available. Log into www.dreyfus.com and sign up for Dreyfus eCommunications. It’s simple and only takes a few minutes.
The views expressed in this report reflect those of the portfolio manager only through the end of the period covered and do not necessarily represent the views of Dreyfus or any other person in the Dreyfus organization. Any such views are subject to change at any time based upon market or other conditions and Dreyfus disclaims any responsibility to update such views.These views may not be relied on as investment advice and, because investment decisions for a Dreyfus fund are based on numerous factors, may not be relied on as an indication of trading intent on behalf of any Dreyfus fund.
Not FDIC-Insured • Not Bank-Guaranteed • May Lose Value
| | Contents |
| | THE FUND |
| 2 | A Letter from the Chairman and CEO |
| 3 | Discussion of Fund Performance |
| 6 | Fund Performance |
| 8 | Understanding Your Fund’s Expenses |
| 8 | Comparing Your Fund’s Expenses With Those of Other Funds |
| 9 | Statement of Investments |
| 13 | Statement of Assets and Liabilities |
| 14 | Statement of Operations |
| 15 | Statement of Changes in Net Assets |
| 17 | Financial Highlights |
| 20 | Notes to Financial Statements |
| 34 | Report of Independent Registered Public Accounting Firm |
| 35 | Important Tax Information |
| 36 | Board Members Information |
| 38 | Officers of the Fund |
| | FOR MORE INFORMATION |
| | Back Cover |
Dreyfus
Global Equity
Income Fund
The Fund
A LETTER FROM THE CHAIRMAN AND CEO

Dear Shareholder:
We are pleased to present this annual report for Dreyfus Global Equity Income Fund, covering the 12-month period from November 1, 2011, through October 31, 2012. For information about how the fund performed during the reporting period, as well as general market perspectives, we provide a Discussion of Fund Performance on the pages that follow.
Despite pronounced stock market weakness during the spring of 2012, stocks generally advanced over the reporting period as investors responded to encouraging macroeconomic developments throughout the world. Employment gains in the United States, credible measures to prevent a more severe banking crisis in Europe, and the likelihood of a “soft landing” for China’s economy buoyed investor sentiment, as did aggressively accommodative monetary policies from central banks in the United States, Europe, Japan and China. Consequently, U.S. stocks across all capitalization ranges posted double-digit returns, on average, for the reporting period.
In light of the easy monetary policies adopted by many countries, we expect global growth to be slightly more robust in 2013 than in 2012.The U.S. economic recovery is likely to persist at subpar levels over the first half of the new year, as growth may remain constrained by uncertainties surrounding fiscal policy and tax reforms. However, successful resolution of the current fiscal debate may prompt corporate decision-makers to increase capital spending, which could have positive implications for the U.S. economy and domestic equity markets.As always, we encourage you to stay in touch with your financial advisor as new developments unfold.
Thank you for your continued confidence and support.

Jonathan R. Baum
Chairman and Chief Executive Officer
The Dreyfus Corporation
November 15, 2012
2
DISCUSSION OF FUND PERFORMANCE
For the period of November 1, 2011, through October 31, 2012, as provided by James Harries, Portfolio Manager of Newton Capital Management Limited, Sub-Investment Adviser
Fund and Market Performance Overview
For the 12-month period ended October 31, 2012, Dreyfus Global Equity Income Fund’s Class A shares produced a total return of 12.98%, Class C shares returned 12.19% and Class I shares returned 13.16%.1 In comparison, the fund’s benchmark, the FTSE World Index (the “Index”), produced a total return of 9.48% for the same period.2
Improving economic sentiment in many parts of the world supported the rise of global stock markets over the reporting period.The fund produced higher returns than its benchmark, largely due to the success of our stock selection in the basic materials, industrials, consumer goods, health care and financials sectors.
On a separate note, Nick Clay became a co-primary portfolio manager of the fund in October 2012.
The Fund’s Investment Approach
The fund seeks to generate total return, consisting of capital appreciation and income. To pursue this goal, the fund normally invests at least 80% of its assets in equity securities, aiming to focus on dividend-paying stocks of companies located in emerging as well as developed capital markets, incorporating investments in countries such as the United States, Canada, Japan, Australia, Hong Kong and Western Europe. The fund may invest in the securities of companies of any market capitalization, and it may invest up to 30% of its assets in emerging markets.The fund’s portfolio manager typically will purchase stocks that, at the time of purchase, have a yield premium over that of the FTSE World Index.
We combine “top-down” analysis of current economic trends and investment themes with “bottom-up” stock selection based on fundamental research. Within markets and sectors deemed to be relatively favorable, we seek attractively priced stocks of companies that we believe have sustainable competitive advantages.
DISCUSSION OF FUND PERFORMANCE (continued)
Markets Reacted to Macroeconomic Developments
The reporting period began in the wake of major stock market declines throughout the world, resulting in attractive valuations in a number of market sectors in November 2011. Indeed, by the beginning of 2012 stocks in many markets were rallying amid encouraging macroeconomic developments, including U.S. employment gains, a quantitative easing program in Europe that forestalled a more severe banking crisis in the region, and less restrictive monetary and fiscal policies in China in an environment of reduced inflationary pressures. Meanwhile, corporate earnings generally remained strong, and many companies had strengthened their balance sheets. Consequently, investors grew more tolerant of risks, focusing more intently on company fundamentals and less on macroeconomic developments.
These positive influences were called into question during the spring, when the U.S. labor market’s rebound slowed, measures designed to relieve fiscal pressures in Europe encountered resistance, and the Chinese economy remained sluggish. The summer saw the market rally resume amid more encouraging economic news, and global stocks on average ended the reporting period with respectable gains.
Security Selections Boosted Relative Results
The fund achieved particularly strong results in the basic materials sector, where Germany’s Bayer saw strong results from its crop sciences and pharmaceuticals busi-nesses.The fund successfully avoided weakness among metals producers, maintaining a substantial presence in China as demand for construction materials waned in the emerging markets.Among industrial stocks, positive performers in the aerospace and defense industry included Lockheed Martin and SingaporeTechnologies Engineering. German logistics company Deutsche Post and Brazilian toll roads operator CCR also added value during the reporting period.
In the consumer goods sector, across the reporting period as a whole, tobacco producers such as Philip Morris International and Reynolds American attracted investors’ attention with robust cash flows and generous dividend yields. In a similar vein, the relative stability of health care stocks also drew support from investors, and Merck & Co., Pfizer, Roche Holdings and Abbott Laboratories saw sales and earnings increase. The fund’s investments in the financials sector benefited from strong performance among real estate investment trusts (REITs), such as Singapore’s Mapletree Logistics Trust and Hong Kong’s Link REIT. In the United Kingdom, investment firm Aberdeen Asset Management attracted assets to its emerging markets mutual funds.
4
Laggards during the reporting period were concentrated mainly in the information technology sector, where low dividend yields prevented the fund from holding high-fliers such as Apple. In addition, Hong Kong-based smartphone maker HTC lost market share amid new product launches from strong competitors.
Volatility Likely to Continue
The European sovereign debt crisis and ongoing global deleveraging are likely to continue to place stress upon equity markets. In addition, valuations generally have grown richer in some sectors of the global stock market. On the other hand, most major central banks have adopted aggressively accommodative monetary policies, which could stimulate stronger economic growth. Consequently, we expect heightened volatility to persist in global equity markets, which could create attractive investment opportunities if macroeconomic developments drive nervous investors to the types of defensive, dividend-paying companies in which the fund primarily invests.
We have found a number of opportunities that meet our investment criteria in the telecommunications services, health care and utilities sectors, as well as in the tobacco industry. We have identified fewer opportunities in the financials and consumer services sectors.
November 15, 2012
|
| Equity funds are subject generally to market, market sector, market liquidity, issuer and investment style risks, among |
| other factors, to varying degrees, all of which are more fully described in the fund’s prospectus. |
| The fund’s performance will be influenced by political, social and economic factors affecting investments in foreign |
| companies. Special risks associated with investments in foreign companies include exposure to currency fluctuations, less |
| liquidity, less developed or less efficient trading markets, lack of comprehensive company information, political |
| instability and differing auditing and legal standards.These risks generally are greater with emerging market countries |
| than with more economically and politically established foreign countries. |
| 1 Total return includes reinvestment of dividends and any capital gains paid, and does not take into consideration the |
| maximum initial sales charge in the case of Class A shares, or the applicable contingent deferred sales charge imposed on |
| redemptions in the case of Class C shares. Had these charges been reflected, returns would have been lower. Past |
| performance is no guarantee of future results. Share price and investment return fluctuate such that upon redemption, |
| fund shares may be worth more or less than their original cost. Return figures provided reflect the absorption of certain |
| fund expenses pursuant to an agreement by The Dreyfus Corporation through March 1, 2013, at which time it may |
| be extended, terminated or modified. Had these expenses not been absorbed, the fund’s returns would have been lower. |
| 2 SOURCE: LIPPER INC. – Reflects reinvestment of dividends and, where applicable, capital gain distributions.The |
| FTSE World Index is an unmanaged, free-floating, market-capitalization weighted index that is designed to measure |
| the performance of 90% of the world’s investable stocks issued by large and midcap companies in developed and |
| advanced emerging markets. Investors cannot invest directly in any index. |
FUND PERFORMANCE
|
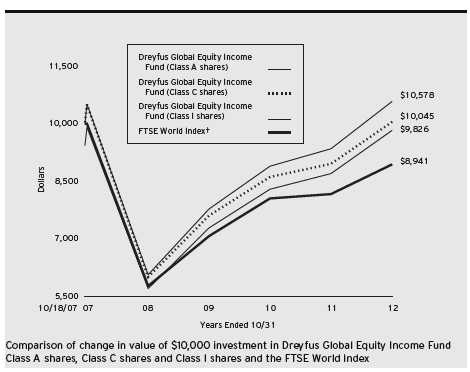
| † Source: FactSet |
| Past performance is not predictive of future performance. |
| The above graph compares a $10,000 investment made in each of the Class A, Class C and Class I shares of Dreyfus |
| Global Equity Income Fund on 10/18/07 (inception date) to a $10,000 investment made in the FTSE World Index |
| (the “Index”) on that date.All dividends and capital gain distributions are reinvested. |
| The fund’s performance shown in the line graph above takes into account the maximum initial sales charge on Class A |
| shares and all other applicable fees and expenses on all classes.The Index is a widely accepted, unmanaged, free-float |
| market capitalization-weighted index that is designed to measure the performance of 90% of the world’s investable stocks |
| issued by large and mid-cap companies in developed and advanced emerging markets. Unlike a mutual fund, the Index is |
| not subject to charges, fees and other expenses. Investors cannot invest directly in any index. Further information relating |
| to fund performance, including expense reimbursements, if applicable, is contained in the Financial Highlights section of |
| the prospectus and elsewhere in this report. |
6
| | | | | | | |
| Average Annual Total Returns as of 10/31/12 | | | | | | |
| |
| | Inception | | | | | From | |
| | Date | 1 | Year | 5 Years | | Inception | |
| Class A shares | | | | | | | |
| with maximum sales charge (5.75%) | 10/18/07 | 6.48 | % | –1.33 | % | –0.35 | % |
| without sales charge | 10/18/07 | 12.98 | % | –0.15 | % | 0.83 | % |
| Class C shares | | | | | | | |
| with applicable redemption charge † | 10/18/07 | 11.19 | % | –0.88 | % | 0.09 | % |
| without redemption | 10/18/07 | 12.19 | % | –0.88 | % | 0.09 | % |
| Class I shares | 10/18/07 | 13.16 | % | 0.14 | % | 1.12 | % |
| FTSE World Index | 10/31/07 | 9.48 | % | –2.21 | % | –2.21 | %†† |
| |
| Past performance is not predictive of future performance.The fund’s performance shown in the graph and table does not |
| reflect the deduction of taxes that a shareholder would pay on fund distributions or the redemption of fund shares. |
| † | The maximum contingent deferred sales charge for Class C shares is 1% for shares redeemed within one year of the |
| | date of purchase. |
| †† | For comparative purposes, the value of the Index as of 10/31/07 is used as the beginning value on 10/18/07. |
UNDERSTANDING YOUR FUND’S EXPENSES (Unaudited)
As a mutual fund investor, you pay ongoing expenses, such as management fees and other expenses. Using the information below, you can estimate how these expenses affect your investment and compare them with the expenses of other funds.You also may pay one-time transaction expenses, including sales charges (loads) and redemption fees, which are not shown in this section and would have resulted in higher total expenses. For more information, see your fund’s prospectus or talk to your financial adviser.
Review your fund’s expenses
The table below shows the expenses you would have paid on a $1,000 investment in Dreyfus Global Equity Income Fund from May 1, 2012 to October 31, 2012. It also shows how much a $1,000 investment would be worth at the close of the period, assuming actual returns and expenses.
| | | | | | |
| Expenses and Value of a $1,000 Investment | | | | |
| assuming actual returns for the six months ended October 31, 2012 | | |
| | | Class A | | Class C | | Class I |
| Expenses paid per $1,000† | $ | 7.73 | $ | 11.58 | $ | 6.45 |
| Ending value (after expenses) | $ | 1,051.00 | $ | 1,047.40 | $ | 1,052.40 |
|
| COMPARING YOUR FUND’S EXPENSES |
| WITH THOSE OF OTHER FUNDS (Unaudited) |
Using the SEC’s method to compare expenses
The Securities and Exchange Commission (SEC) has established guidelines to help investors assess fund expenses. Per these guidelines, the table below shows your fund’s expenses based on a $1,000 investment, assuming a hypothetical 5% annualized return. You can use this information to compare the ongoing expenses (but not transaction expenses or total cost) of investing in the fund with those of other funds.All mutual fund shareholder reports will provide this information to help you make this comparison. Please note that you cannot use this information to estimate your actual ending account balance and expenses paid during the period.
| | | | | | |
| Expenses and Value of a $1,000 Investment | | | | |
| assuming a hypothetical 5% annualized return for the six months ended October 31, 2012 |
| | | Class A | | Class C | | Class I |
| Expenses paid per $1,000† | $ | 7.61 | $ | 11.39 | $ | 6.34 |
| Ending value (after expenses) | $ | 1,017.60 | $ | 1,013.83 | $ | 1,018.85 |
|
| † Expenses are equal to the fund’s annualized expense ratio of 1.50% for Class A, 2.25% for Class C and 1.25% |
| for Class I, multiplied by the average account value over the period, multiplied by 184/366 (to reflect the one-half |
| year period). |
8
|
| STATEMENT OF INVESTMENTS |
| October 31, 2012 |
| | |
| Common Stocks—90.6% | Shares | Value ($) |
| Australia—2.6% | | |
| AMP | 502,022 | 2,391,971 |
| WorleyParsons | 48,955 | 1,253,680 |
| | | 3,645,651 |
| Brazil—2.1% | | |
| CCR | 317,104 | 2,788,448 |
| Transmissora Alianca de Energia Eletrica | 6,246 | 206,042 |
| | | 2,994,490 |
| Canada—1.8% | | |
| Husky Energy | 96,888 | 2,624,101 |
| Denmark—1.1% | | |
| TDC | 228,417 | 1,573,620 |
| France—2.8% | | |
| Suez Environnement | 124,854 | 1,325,862 |
| Total | 53,810 | 2,707,518 |
| | | 4,033,380 |
| Germany—4.3% | | |
| Bilfinger | 14,766 | 1,444,791 |
| Deutsche Post | 133,276 | 2,642,130 |
| Deutsche Telekom | 179,373 | 2,048,031 |
| | | 6,134,952 |
| Hong Kong—4.3% | | |
| China Mobile | 257,015 | 2,850,361 |
| Link REIT | 649,082 | 3,228,639 |
| | | 6,079,000 |
| Luxembourg—1.0% | | |
| SES | 51,075 | 1,413,380 |
| Netherlands—4.1% | | |
| Reed Elsevier | 125,449 | 1,685,347 |
| Royal Dutch Shell, Cl. A | 41,177 | 1,411,937 |
| Unilever | 73,962 | 2,715,864 |
| | | 5,813,148 |
| Norway—3.4% | | |
| DNB | 182,140 | 2,274,634 |
| Statoil | 104,835 | 2,590,857 |
| | | 4,865,491 |
STATEMENT OF INVESTMENTS (continued)
| | | |
| Common Stocks (continued) | Shares | | Value ($) |
| Poland—1.3% | | | |
| Telekomunikacja Polska | 501,232 | | 1,893,367 |
| Singapore—2.1% | | | |
| Mapletree Logistics Trust | 1,153,000 | | 1,049,213 |
| Parkway Life Real Estate Investment Trust | 290,000 | | 484,998 |
| Singapore Technologies Engineering | 482,000 | | 1,390,917 |
| | | | 2,925,128 |
| South Africa—2.8% | | | |
| Gold Fields | 106,008 | | 1,308,801 |
| MTN Group | 151,700 | | 2,735,294 |
| | | | 4,044,095 |
| South Korea—1.2% | | | |
| Macquarie Korea Infrastructure Fund | 281,290 | | 1,728,079 |
| Switzerland—8.6% | | | |
| Nestle | 25,553 | | 1,621,585 |
| Novartis | 65,587 | | 3,947,333 |
| Roche Holding | 22,822 | | 4,388,940 |
| Zurich Insurance Group | 9,113 | a | 2,245,714 |
| | | | 12,203,572 |
| Taiwan—1.8% | | | |
| HTC | 155,920 | | 1,126,200 |
| Taiwan Semiconductor Manufacturing | 456,000 | | 1,384,585 |
| | | | 2,510,785 |
| United Kingdom—11.6% | | | |
| Aberdeen Asset Management | 444,829 | | 2,329,417 |
| BAE Systems | 269,300 | | 1,356,778 |
| Cable & Wireless Communications | 1,820,296 | | 1,101,278 |
| Centrica | 321,452 | | 1,681,259 |
| GlaxoSmithKline | 120,231 | | 2,690,146 |
| ICAP | 323,987 | | 1,699,746 |
10
| | | |
| Common Stocks (continued) | Shares | | Value ($) |
| United Kingdom (continued) | | | |
| SSE | 148,026 | | 3,458,964 |
| Vodafone Group | 806,142 | | 2,188,800 |
| | | | 16,506,388 |
| United States—33.7% | | | |
| Abbott Laboratories | 39,630 | | 2,596,558 |
| Annaly Capital Management | 152,850 | b | 2,466,999 |
| AT&T | 77,246 | | 2,671,939 |
| Clorox | 38,075 | | 2,752,823 |
| ConocoPhillips | 47,295 | | 2,736,016 |
| Lockheed Martin | 29,500 | | 2,763,265 |
| Merck & Co. | 62,838 | | 2,867,298 |
| Paychex | 83,475 | | 2,707,094 |
| PDL BioPharma | 79,549 | | 592,640 |
| Pfizer | 117,515 | | 2,922,598 |
| Philip Morris International | 75,136 | | 6,654,044 |
| Procter & Gamble | 39,964 | | 2,767,107 |
| Reynolds American | 159,865 | | 6,656,779 |
| Staples | 121,422 | | 1,398,174 |
| Sysco | 131,717 | | 4,092,447 |
| Wisconsin Energy | 35,174 | | 1,353,144 |
| | | | 47,998,925 |
| Total Common Stocks | | | |
| (cost $125,148,755) | | | 128,987,552 |
| |
| Preferred Stocks—.5% | | | |
| United Kingdom | | | |
| AngloGold Ashanti Holdings Finance, | | | |
| Conv., Cum. $3 | | | |
| (cost $841,413) | 17,403 | | 703,603 |
STATEMENT OF INVESTMENTS (continued)
| | | | | | |
| | | Coupon | Maturity | Principal | | |
| Bonds and Notes—1.3% | Rate (%) | Date | Amount ($) | | Value ($) |
| United Kingdom | | | | | |
| Standard Chartered, | | | | | |
| Jr. Sub. Notes | | | | | |
| (cost $1,768,025) | 8.13 | 5/29/49 | 1,718,000 | | 1,804,244 |
| |
| Other Investment—3.5% | | | Shares | | Value ($) |
| Registered Investment Company; | | | | | |
| Dreyfus Institutional Preferred | | | | | |
| Plus Money Market Fund | | | | | |
| (cost $4,954,042) | | | 4,954,042 | c | 4,954,042 |
| |
| Total Investments (cost $132,712,235) | | 95.9 | % | 136,449,441 |
| Cash and Receivables (Net) | | | 4.1 | % | 5,859,577 |
| Net Assets | | | 100.0 | % | 142,309,018 |
| |
| REIT—Real Estate Investment Trust | | | | | |
| a | Non-income producing security. | | | | | |
| b | Investment in real estate investment trust. | | | | | |
| c | Investment in affiliated money market mutual fund. | | | | |
| |
| |
| |
| Portfolio Summary (Unaudited)† | | | | |
| | | Value (%) | | | | Value (%) |
| Consumer Goods | 16.3 | Utilities | | | 5.6 |
| Financials | 16.3 | Consumer Services | | 5.0 |
| Health Care | 14.0 | Money Market Investment | | 3.5 |
| Telecommunications | 13.0 | Technology | | | 1.8 |
| Industrials | 9.6 | Basic Materials | | | 1.4 |
| Oil & Gas | 9.4 | | | | 95.9 |
| |
| † | Based on net assets. | | | | | |
| See notes to financial statements. | | | | | |
12
|
| STATEMENT OF ASSETS AND LIABILITIES |
| October 31, 2012 |
| | | |
| | | Cost | Value |
| Assets ($): | | | |
| Investments in securities—See Statement of Investments: | | |
| Unaffiliated issuers | | 127,758,193 | 131,495,399 |
| Affiliated issuers | | 4,954,042 | 4,954,042 |
| Cash | | | 342,546 |
| Cash denominated in foreign currencies | | 22,327 | 22,378 |
| Receivable for shares of Beneficial Interest subscribed | | 5,899,595 |
| Dividends and interest receivable | | | 369,473 |
| Unrealized appreciation on forward foreign | | | |
| currency exchange contracts—Note 4 | | | 24,204 |
| Prepaid expenses | | | 27,519 |
| | | | 143,135,156 |
| Liabilities ($): | | | |
| Due to The Dreyfus Corporation and affiliates—Note 3(c) | | 152,299 |
| Unrealized depreciation on forward foreign | | | |
| currency exchange contracts—Note 4 | | | 276,764 |
| Payable for investment securities purchased | | | 210,758 |
| Payable for shares of Beneficial Interest redeemed | | | 116,548 |
| Accrued expenses | | | 69,769 |
| | | | 826,138 |
| Net Assets ($) | | | 142,309,018 |
| Composition of Net Assets ($): | | | |
| Paid-in capital | | | 137,606,150 |
| Accumulated undistributed investment income—net | | | 209,866 |
| Accumulated net realized gain (loss) on investments | | | 1,011,614 |
| Accumulated net unrealized appreciation (depreciation) | | |
| on investments and foreign currency transactions | | | 3,481,388 |
| Net Assets ($) | | | 142,309,018 |
| |
| |
| Net Asset Value Per Share | | | |
| | Class A | Class C | Class I |
| Net Assets ($) | 51,002,683 | 20,591,252 | 70,715,083 |
| Shares Outstanding | 4,640,694 | 1,849,243 | 6,631,020 |
| Net Asset Value Per Share ($) | 10.99 | 11.13 | 10.66 |
| |
| See notes to financial statements. | | | |
|
| STATEMENT OF OPERATIONS |
| Year Ended October 31, 2012 |
| | |
| Investment Income ($): | | |
| Income: | | |
| Cash dividends (net of $160,529 foreign taxes withheld at source): | | |
| Unaffiliated issuers | 2,652,818 | |
| Affiliated issuers | 3,415 | |
| Interest | 56,203 | |
| Total Income | 2,712,436 | |
| Expenses: | | |
| Management fee—Note 3(a) | 506,791 | |
| Shareholder servicing costs—Note 3(c) | 102,178 | |
| Custodian fees—Note 3(c) | 64,215 | |
| Registration fees | 60,954 | |
| Distribution fees—Note 3(b) | 57,871 | |
| Auditing fees | 47,332 | |
| Prospectus and shareholders’ reports | 16,968 | |
| Legal fees | 7,585 | |
| Trustees’ fees and expenses—Note 3(d) | 3,955 | |
| Loan commitment fees—Note 2 | 608 | |
| Miscellaneous | 18,144 | |
| Total Expenses | 886,601 | |
| Less—reduction in expenses due to undertaking—Note 3(a) | (22,188 | ) |
| Less—reduction in fees due to earnings credits—Note 3(c) | (13 | ) |
| Net Expenses | 864,400 | |
| Investment Income—Net | 1,848,036 | |
| Realized and Unrealized Gain (Loss) on Investments—Note 4 ($): | | |
| Net realized gain (loss) on investments and foreign currency transactions | 1,457,308 | |
| Net realized gain (loss) on forward foreign currency exchange contracts | 407,873 | |
| Net Realized Gain (Loss) | 1,865,181 | |
| Net unrealized appreciation (depreciation) on | | |
| investments and foreign currency transactions | 3,370,655 | |
| Net unrealized appreciation (depreciation) on | | |
| forward foreign currency exchange contracts | (345,143 | ) |
| Net Unrealized Appreciation (Depreciation) | 3,025,512 | |
| Net Realized and Unrealized Gain (Loss) on Investments | 4,890,693 | |
| Net Increase in Net Assets Resulting from Operations | 6,738,729 | |
| |
| See notes to financial statements. | | |
14
STATEMENT OF CHANGES IN NET ASSETS
| | | | |
| | Year Ended October 31, | |
| | 2012 | | 2011 | |
| Operations ($): | | | | |
| Investment income—net | 1,848,036 | | 554,754 | |
| Net realized gain (loss) on investments | 1,865,181 | | 707,843 | |
| Net unrealized appreciation | | | | |
| (depreciation) on investments | 3,025,512 | | (610,763 | ) |
| Net Increase (Decrease) in Net Assets | | | | |
| Resulting from Operations | 6,738,729 | | 651,834 | |
| Dividends to Shareholders from ($): | | | | |
| Investment income—net: | | | | |
| Class A Shares | (585,760 | ) | (153,420 | ) |
| Class C Shares | (145,439 | ) | (43,286 | ) |
| Class I Shares | (1,099,037 | ) | (238,159 | ) |
| Total Dividends | (1,830,236 | ) | (434,865 | ) |
| Beneficial Interest Transactions ($): | | | | |
| Net proceeds from shares sold: | | | | |
| Class A Shares | 46,767,868 | | 4,540,839 | |
| Class C Shares | 18,519,696 | | 2,194,184 | |
| Class I Shares | 63,154,459 | | 4,452,679 | |
| Dividends reinvested: | | | | |
| Class A Shares | 475,842 | | 107,788 | |
| Class C Shares | 49,568 | | 9,818 | |
| Class I Shares | 1,005,482 | | 210,269 | |
| Cost of shares redeemed: | | | | |
| Class A Shares | (2,948,038 | ) | (4,417,557 | ) |
| Class C Shares | (1,214,807 | ) | (1,128,024 | ) |
| Class I Shares | (4,978,516 | ) | (2,682,554 | ) |
| Increase (Decrease) in Net Assets | | | | |
| from Beneficial Interest Transactions | 120,831,554 | | 3,287,442 | |
| Total Increase (Decrease) in Net Assets | 125,740,047 | | 3,504,411 | |
| Net Assets ($): | | | | |
| Beginning of Period | 16,568,971 | | 13,064,560 | |
| End of Period | 142,309,018 | | 16,568,971 | |
| Undistributed investment income—net | 209,866 | | 179,372 | |
STATEMENT OF CHANGES IN NET ASSETS (continued)
| | | | |
| | Year Ended October 31, | |
| | 2012 | | 2011 | |
| Capital Share Transactions: | | | | |
| Class A | | | | |
| Shares sold | 4,309,492 | | 441,653 | |
| Shares issued for dividends reinvested | 45,655 | | 10,695 | |
| Shares redeemed | (275,693 | ) | (433,293 | ) |
| Net Increase (Decrease) in Shares Outstanding | 4,079,454 | | 19,055 | |
| Class C | | | | |
| Shares sold | 1,697,476 | | 215,127 | |
| Shares issued for dividends reinvested | 4,714 | | 969 | |
| Shares redeemed | (112,928 | ) | (112,314 | ) |
| Net Increase (Decrease) in Shares Outstanding | 1,589,262 | | 103,782 | |
| Class I | | | | |
| Shares sold | 6,195,023 | | 447,350 | |
| Shares issued for dividends reinvested | 99,050 | | 21,444 | |
| Shares redeemed | (490,872 | ) | (266,929 | ) |
| Net Increase (Decrease) in Shares Outstanding | 5,803,201 | | 201,865 | |
| |
| See notes to financial statements. | | | | |
16
FINANCIAL HIGHLIGHTS
The following tables describe the performance for each share class for the fiscal periods indicated.All information (except portfolio turnover rate) reflects financial results for a single fund share.Total return shows how much your investment in the fund would have increased (or decreased) during each period, assuming you had reinvested all dividends and distributions.These figures have been derived from the fund’s financial statements.
| | | | | | | | | | |
| | | | Year Ended October 31, | | | |
| Class A Shares | 2012 | | 2011 | | 2010 | | 2009 | | 2008 | |
| Per Share Data ($): | | | | | | | | | | |
| Net asset value, beginning of period | 10.17 | | 9.97 | | 9.03 | | 7.35 | | 13.14 | |
| Investment Operations: | | | | | | | | | | |
| Investment income—neta | .28 | | .35 | | .31 | | .36 | | .44 | |
| Net realized and unrealized | | | | | | | | | | |
| gain (loss) on investments | .99 | | .13 | | .92 | | 1.60 | | (5.90 | ) |
| Total from Investment Operations | 1.27 | | .48 | | 1.23 | | 1.96 | | (5.46 | ) |
| Distributions: | | | | | | | | | | |
| Dividends from investment income—net | (.45 | ) | (.28 | ) | (.29 | ) | (.28 | ) | (.33 | ) |
| Net asset value, end of period | 10.99 | | 10.17 | | 9.97 | | 9.03 | | 7.35 | |
| Total Return (%)b | 12.98 | | 4.86 | | 13.86 | | 27.73 | | (42.41 | ) |
| Ratios/Supplemental Data (%): | | | | | | | | | | |
| Ratio of total expenses | | | | | | | | | | |
| to average net assets | 1.55 | | 2.14 | | 3.13 | | 4.03 | | 5.84 | |
| Ratio of net expenses | | | | | | | | | | |
| to average net assets | 1.50 | | 1.50 | | 1.50 | | 1.49 | | 1.44 | |
| Ratio of net investment income | | | | | | | | | | |
| to average net assets | 2.76 | | 3.35 | | 3.36 | | 5.05 | | 3.88 | |
| Portfolio Turnover Rate | 21.89 | | 54.88 | | 56.17 | | 70.29 | | 99.04 | |
| Net Assets, end of period ($ x 1,000) | 51,003 | | 5,710 | | 5,406 | | 3,738 | | 2,523 | |
| |
| a | Based on average shares outstanding at each month end. |
| b | Exclusive of sales charge. |
| See notes to financial statements. |
FINANCIAL HIGHLIGHTS (continued)
| | | | | | | | | | |
| | | | Year Ended October 31, | | | |
| Class C Shares | 2012 | | 2011 | | 2010 | | 2009 | | 2008 | |
| Per Share Data ($): | | | | | | | | | | |
| Net asset value, beginning of period | 10.22 | | 10.02 | | 9.01 | | 7.33 | | 13.13 | |
| Investment Operations: | | | | | | | | | | |
| Investment income—neta | .22 | | .30 | | .21 | | .32 | | .36 | |
| Net realized and unrealized | | | | | | | | | | |
| gain (loss) on investments | .98 | | .10 | | .97 | | 1.58 | | (5.89 | ) |
| Total from Investment Operations | 1.20 | | .40 | | 1.18 | | 1.90 | | (5.53 | ) |
| Distributions: | | | | | | | | | | |
| Dividends from investment income—net | (.29 | ) | (.20 | ) | (.17 | ) | (.22 | ) | (.27 | ) |
| Net asset value, end of period | 11.13 | | 10.22 | | 10.02 | | 9.01 | | 7.33 | |
| Total Return (%)b | 12.19 | | 4.01 | | 13.24 | | 26.53 | | (42.76 | ) |
| Ratios/Supplemental Data (%): | | | | | | | | | | |
| Ratio of total expenses | | | | | | | | | | |
| to average net assets | 2.29 | | 2.86 | | 3.92 | | 4.81 | | 7.06 | |
| Ratio of net expenses | | | | | | | | | | |
| to average net assets | 2.25 | | 2.25 | | 2.25 | | 2.25 | | 2.18 | |
| Ratio of net investment income | | | | | | | | | | |
| to average net assets | 2.14 | | 2.83 | | 2.31 | | 4.44 | | 3.35 | |
| Portfolio Turnover Rate | 21.89 | | 54.88 | | 56.17 | | 70.29 | | 99.04 | |
| Net Assets, end of period ($ x 1,000) | 20,591 | | 2,658 | | 1,564 | | 688 | | 844 | |
| |
| a | Based on average shares outstanding at each month end. |
| b | Exclusive of sales charge. |
| See notes to financial statements. |
18
| | | | | | | | | | |
| | | | Year Ended October 31, | | | |
| Class I Shares | 2012 | | 2011 | | 2010 | | 2009 | | 2008 | |
| Per Share Data ($): | | | | | | | | | | |
| Net asset value, beginning of period | 9.91 | | 9.74 | | 8.83 | | 7.34 | | 13.14 | |
| Investment Operations: | | | | | | | | | | |
| Investment income—neta | .35 | | .37 | | .35 | | .34 | | .45 | |
| Net realized and unrealized | | | | | | | | | | |
| gain (loss) on investments | .90 | | .12 | | .89 | | 1.61 | | (5.90 | ) |
| Total from Investment Operations | 1.25 | | .49 | | 1.24 | | 1.95 | | (5.45 | ) |
| Distributions: | | | | | | | | | | |
| Dividends from investment income—net | (.50 | ) | (.32 | ) | (.33 | ) | (.46 | ) | (.35 | ) |
| Net asset value, end of period | 10.66 | | 9.91 | | 9.74 | | 8.83 | | 7.34 | |
| Total Return (%) | 13.16 | | 5.11 | | 14.39 | | 28.21 | | (42.27 | ) |
| Ratios/Supplemental Data (%): | | | | | | | | | | |
| Ratio of total expenses | | | | | | | | | | |
| to average net assets | 1.28 | | 1.86 | | 2.82 | | 3.78 | | 5.32 | |
| Ratio of net expenses | | | | | | | | | | |
| to average net assets | 1.25 | | 1.25 | | 1.25 | | 1.24 | | 1.21 | |
| Ratio of net investment income | | | | | | | | | | |
| to average net assets | 3.47 | | 3.68 | | 3.85 | | 4.99 | | 3.90 | |
| Portfolio Turnover Rate | 21.89 | | 54.88 | | 56.17 | | 70.29 | | 99.04 | |
| Net Assets, end of period ($ x 1,000) | 70,715 | | 8,202 | | 6,094 | | 1,949 | | 177 | |
| a Based on average shares outstanding at each month end. | | | | | | | | | |
| See notes to financial statements. | | | | | | | | | | |
NOTES TO FINANCIAL STATEMENTS
NOTE 1—Significant Accounting Policies:
Dreyfus Global Equity Income Fund (the “fund”) is a separate diversified series of The Dreyfus/Laurel Funds Trust (the “Trust”), which is registered under the Investment Company Act of 1940, as amended (the “Act”), as an open-end management investment company and operates as a series company currently offering five series, including the fund.The fund’s investment objective is to seek total return (consisting of capital appreciation and income).The Dreyfus Corporation (the “Manager” or “Dreyfus”), a wholly-owned subsidiary of The Bank of New York Mellon Corporation (“BNY Mellon”), serves as the fund’s investment adviser. Newton Capital Management Limited (“Newton”), an affiliate of BNY Mellon, serves as the fund’s sub-investment adviser.
MBSC Securities Corporation (the “Distributor”), a wholly-owned subsidiary of Dreyfus, is the distributor of the fund’s shares.The fund is authorized to issue an unlimited number of $.001 par value shares of Beneficial Interest in each of the following classes of shares: Class A, Class C and Class I. Class A and Class C shares are sold primarily to retail investors through financial intermediaries and bear a Distribution Plan fee and/or Shareholder Services Plan fee. Class A shares are subject to a sales charge imposed at the time of purchase. Class C shares are subject to a contingent deferred sales charge (“CDSC”) imposed on Class C shares redeemed within one year of purchase. Class I shares are sold primarily to bank trust departments and other financial service providers (including The Bank of New York Mellon, a subsidiary of BNY Mellon and an affiliate of Dreyfus, and its affiliates), acting on behalf of customers having a qualified trust or an investment account or relationship at such institution, and bear no Distribution or Shareholder Services Plan fees. Class I shares are offered without a front-end sales charge or CDSC. Other differences between the classes include the services offered to and the expenses borne by each class, the allocation of certain transfer agency costs and certain voting rights.
20
Income, expenses (other than expenses attributable to a specific class), and realized and unrealized gains or losses on investments are allocated to each class of shares based on its relative net assets.
The Trust accounts separately for the assets, liabilities and operations of each series. Expenses directly attributable to each series are charged to that series’ operations; expenses which are applicable to all series are allocated among them on a pro rata basis.
The Financial Accounting Standards Board (“FASB”) Accounting Standards Codification is the exclusive reference of authoritative U.S. generally accepted accounting principles (“GAAP”) recognized by the FASB to be applied by nongovernmental entities. Rules and interpretive releases of the Securities and Exchange Commission (“SEC”) under authority of federal laws are also sources of authoritative GAAP for SEC registrants. The fund’s financial statements are prepared in accordance with GAAP, which may require the use of management estimates and assumptions.Actual results could differ from those estimates.
(a) Portfolio valuation: The fair value of a financial instrument is the amount that would be received to sell an asset or paid to transfer a liability in an orderly transaction between market participants at the measurement date (i.e., the exit price). GAAP establishes a fair value hierarchy that prioritizes the inputs of valuation techniques used to measure fair value.This hierarchy gives the highest priority to unadjusted quoted prices in active markets for identical assets or liabilities (Level 1 measurements) and the lowest priority to unobservable inputs (Level 3 measurements).
Additionally, GAAP provides guidance on determining whether the volume and activity in a market has decreased significantly and whether such a decrease in activity results in transactions that are not orderly. GAAP requires enhanced disclosures around valuation inputs and techniques used during annual and interim periods.
NOTES TO FINANCIAL STATEMENTS (continued)
Various inputs are used in determining the value of the fund’s investments relating to fair value measurements.These inputs are summarized in the three broad levels listed below:
Level 1—unadjusted quoted prices in active markets for identical investments.
Level 2—other significant observable inputs (including quoted prices for similar investments, interest rates, prepayment speeds, credit risk, etc.).
Level 3—significant unobservable inputs (including the fund’s own assumptions in determining the fair value of investments).
The inputs or methodology used for valuing securities are not necessarily an indication of the risk associated with investing in those securities.
Changes in valuation techniques may result in transfers in or out of an assigned level within the disclosure hierarchy. Valuation techniques used to value the fund’s investments are as follows:
Investments in equity securities are valued at the last sales price on the securities exchange or national securities market on which such securities are primarily traded. Securities listed on the National Market System for which market quotations are available are valued at the official closing price or, if there is no official closing price that day, at the last sales price. Securities not listed on an exchange or the national securities market, or securities for which there were no transactions, are valued at the average of the most recent bid and asked prices, except for open short positions, where the asked price is used for valuation purposes. Bid price is used when no asked price is available. Registered investment companies that are not traded on an exchange are valued at their net asset value. All of the preceding securities are categorized within Level 1 of the fair value hierarchy.
Investments in debt securities excluding short-term investments (other than U.S. Treasury Bills) and forward foreign currency exchange contracts (“forward contracts”) are valued each business day by an independent pricing service (the “Service”) approved by the Trust’s
22
Board of Trustees (the “Board”). Investments for which quoted bid prices are readily available and are representative of the bid side of the market in the judgment of the Service are valued at the mean between the quoted bid prices (as obtained by the Service from dealers in such securities) and asked prices (as calculated by the Service based upon its evaluation of the market for such securities). Other investments are valued as determined by the Service, based on methods which include consideration of the following: yields or prices of securities of comparable quality, coupon, maturity and type; indications as to values from dealers; and general market conditions. These securities are generally categorized within Level 2 of the fair value hierarchy.
The Service’s procedures are reviewed by Dreyfus under the general supervision of the Board. Fair valuing of securities may be determined with the assistance of a pricing service using calculations based on indices of domestic securities and other appropriate indicators, such as prices of relevant American Depository Receipts and financial futures. Utilizing these techniques may result in transfers between Level 1 and Level 2 of the fair value hierarchy.
When market quotations or official closing prices are not readily available, or are determined not to reflect accurately fair value, such as when the value of a security has been significantly affected by events after the close of the exchange or market on which the security is principally traded (for example, a foreign exchange or market), but before the fund calculates its net asset value, the fund may value these investments at fair value as determined in accordance with the procedures approved by the Board. Certain factors may be considered when fair valuing investments such as: fundamental analytical data, the nature and duration of restrictions on disposition, an evaluation of the forces that influence the market in which the securities are purchased and sold, and public trading in similar securities of the issuer or comparable issuers.These securities are either categorized as Level 2 or 3 depending on the relevant inputs used.
NOTES TO FINANCIAL STATEMENTS (continued)
For restricted securities where observable inputs are limited, assumptions about market activity and risk are used and are categorized within Level 3 of the fair value hierarchy.
Investments denominated in foreign currencies are translated to U.S. dollars at the prevailing rates of exchange.
Forward contracts are valued at the forward rate. These securities are generally categorized within Level 2 of the fair value hierarchy.
The following is a summary of the inputs used as of October 31, 2012 in valuing the fund’s investments:
| | | | | | | |
| | | | Level 2—Other | | Level 3— | | |
| | | Level 1— | Significant | | Significant | | |
| | | Unadjusted | Observable Unobservable | | |
| | | Quoted Prices | Inputs | | Inputs | Total | |
| Assets ($) | | | | | | |
| Investments in Securities: | | | | | | |
| Corporate Bonds† | — | 1,804,244 | | — | 1,804,244 | |
| Equity Securities—Domestic | | | | | | |
| | Common Stocks† | 47,998,925 | — | | — | 47,998,925 | |
| Equity Securities—Foreign | | | | | | |
| | Common Stocks† | 80,988,627 | — | | — | 80,988,627 | |
| Mutual Funds | 4,954,042 | — | | — | 4,954,042 | |
| Preferred Stocks† | 703,603 | — | | — | 703,603 | |
| Other Financial | | | | | | |
| | Instruments: | | | | | | |
| Forward Foreign | | | | | | |
| | Currency Exchange | | | | | | |
| | Contracts†† | — | 24,204 | | — | 24,204 | |
| Liabilities ($) | | | | | | |
| Other Financial | | | | | | |
| | Instruments: | | | | | | |
| Forward Foreign | | | | | | |
| | Currency Exchange | | | | | | |
| | Contracts†† | — | (276,764 | ) | — | (276,764 | ) |
| |
| † | See Statement of Investments for additional detailed categorizations. | | |
| †† | Amount shown represents unrealized appreciation (depreciation) at period end. | | |
At October 31, 2011, $2,968,529 of exchange traded foreign equity securities were classified as Level 2 of the fair value hierarchy pursuant to the fund’s fair valuation procedures.
24
(b) Foreign currency transactions: The fund does not isolate that portion of the results of operations resulting from changes in foreign exchange rates on investments from the fluctuations arising from changes in market prices of securities held. Such fluctuations are included with the net realized and unrealized gain or loss on investments.
Net realized foreign exchange gains or losses arise from sales of foreign currencies, currency gains or losses realized on securities transactions between trade and settlement date, and the difference between the amounts of dividends, interest and foreign withholding taxes recorded on the fund’s books and the U.S. dollar equivalent of the amounts actually received or paid. Net unrealized foreign exchange gains and losses arise from changes in the value of assets and liabilities other than investments resulting from changes in exchange rates. Foreign currency gains and losses on investments are also included with net realized and unrealized gain or loss on investments.
(c) Securities transactions and investment income: Securities transactions are recorded on a trade date basis. Realized gains and losses from securities transactions are recorded on the identified cost basis. Dividend income is recognized on the ex-dividend date and interest income, including, where applicable, accretion of discount and amortization of premium on investments, is recognized on the accrual basis.
(d) Affiliated issuers: Investments in other investment companies advised by Dreyfus are defined as “affiliated” in the Act. Investments in affiliated investment companies for the period ended October 31, 2012 were as follows:
| | | | | | | |
| Affiliated | | | | | | | |
| Investment | Value | | | | Value | Net | |
| Company | 10/31/2011 | ($) | Purchases ($) | Sales ($) | 10/31/2012 | ($) Assets (%) |
| Dreyfus | | | | | | | |
| Institutional | | | | | | | |
| Preferred | | | | | | | |
| Plus Money | | | | | | | |
| Market Fund | 414,588 | | 73,749,087 | 69,209,633 | 4,954,042 | 3.5 | |
NOTES TO FINANCIAL STATEMENTS (continued)
(e) Risk: Investing in foreign markets may involve special risks and considerations not typically associated with investing in the U.S.These risks include revaluation of currencies, high rates of inflation, repatriation restrictions on income and capital, and adverse political and economic developments. Moreover, securities issued in these markets may be less liquid, subject to government ownership controls and delayed settlements, and their prices may be more volatile than those of comparable securities in the U.S.
(f) Dividends to shareholders: Dividends are recorded on the ex-dividend date. Dividends from investment income-net are declared and paid quarterly. Dividends from net realized capital gains, if any, are normally declared and paid annually, but the fund may make distributions on a more frequent basis to comply with the distribution requirements of the Internal Revenue Code of 1986, as amended (the “Code”).To the extent that net realized capital gains can be offset by capital loss carryovers, it is the policy of the fund not to distribute such gains. Income and capital gain distributions are determined in accordance with income tax regulations, which may differ from GAAP.
(g) Federal income taxes: It is the policy of the fund to continue to qualify as a regulated investment company, if such qualification is in the best interests of its shareholders, by complying with the applicable provisions of the Code, and to make distributions of taxable income sufficient to relieve it from substantially all federal income and excise taxes.
As of and during the period ended October 31, 2012, the fund did not have any liabilities for any uncertain tax positions.The fund recognizes interest and penalties, if any, related to uncertain tax positions as income tax expense in the Statement of Operations. During the period, the fund did not incur any interest or penalties.
Each of the tax years in the four-year period ended October 31, 2012 remains subject to examination by the Internal Revenue Service and state taxing authorities.
26
At October 31, 2012, the components of accumulated earnings on tax basis were as follows: undistributed ordinary income $1,345,504, undistributed capital gains $640,373 and unrealized appreciation $2,716,991.
The tax character of distributions paid to shareholders during the fiscal periods ended October 31, 2012 and October 31, 2011 were as follows: ordinary income $1,830,236 and $434,865, respectively.
During the period ended October 31, 2012 as a result of permanent book to tax differences, primarily due to the tax treatment for foreign currency gains and losses, passive foreign investment companies, real estate investment trusts, and amortization of premiums, the fund increased accumulated undistributed investment income-net by $12,694 and decreased accumulated net realized gain (loss) on investments by the same amount. Net assets and net asset value per share were not affected by this reclassification.
(h) New Accounting Pronouncement: In December 2011, FASB issued Accounting Standards Update No. 2011-11 “Disclosures about Offsetting Assets and Liabilities” (“ASU 2011-11”). These disclosure requirements are intended to help investors and other financial statement users to better assess the effect or potential effect of offsetting arrangements on a company’s financial position.They also improve transparency in the reporting of how companies mitigate credit risk, including disclosure of related collateral pledged or received. In addition,ASU 2011-11 facilitates comparison between those entities that prepare their financial statements on the basis of GAAP and those entities that prepare their financial statements on the basis of International Financial Reporting Standards (“IFRS”). ASU 2011-11 requires entities to: disclose both gross and net information about both instruments and transactions eligible for offset in the financial statements; and disclose instruments and transactions subject to an agreement similar to a master netting agreement. ASU 2011-11 is effective for fiscal years beginning on or
NOTES TO FINANCIAL STATEMENTS (continued)
after January 1, 2013, and interim periods within those annual periods. At this time, management is evaluating the implications of ASU 2011-11 and its impact on the fund’s financial statement disclosures.
NOTE 2—Bank Lines of Credit:
The fund participates with other Dreyfus-managed funds in a $225 million unsecured credit facility led by Citibank, N.A. and a $300 million unsecured credit facility provided by The Bank of New York Mellon, (each, a “Facility”), each to be utilized primarily for temporary or emergency purposes, including the financing of redemptions. Effective October 10, 2012, the $225 million unsecured credit facility with Citibank, N.A., was decreased to $210 million. In connection therewith, the fund has agreed to pay its pro rata portion of commitment fees for each Facility. Interest is charged to the fund based on rates determined pursuant to the terms of the respective Facility at the time of borrowing. During the period ended on October 31, 2012, the fund did not borrow under the Facilities.
NOTE 3—Management Fee, Sub-Investment Advisory Fee and Other Transactions with Affiliates:
(a) Pursuant to a management agreement with Dreyfus and the Trust, the Trust has agreed to pay Dreyfus a management fee computed at the annual rate of .85% of the value of the fund’s average daily net assets and is payable monthly. Dreyfus has contractually agreed, until March 1, 2013, to waive receipt of its fees and/or assume certain expenses of the fund so that the direct expenses of none of the fund’s classes (excluding Rule 12b-1 Distribution Plan fees, Shareholder Services Plan fees, taxes, interest expense, brokerage commissions, commitment fees on borrowings and extraordinary expenses) exceed 1.25% of the value of the fund’s average daily net assets.The reduction in expenses, pursuant to the undertaking, amounted to $22,188 during the period ended October 31, 2012.
28
Pursuant to a Sub-Investment Advisory Agreement between Dreyfus and Newton, Dreyfus pays Newton an annual fee of .41% of the value of the fund’s average daily net assets, payable monthly.
During the period ended October 31, 2012, the Distributor retained $49,782 from commissions earned on sales of the fund’s Class A shares and $3,790 from CDSCs on redemptions of the fund’s Class C shares.
(b) Under the Distribution Plan adopted pursuant to Rule 12b-1 under the Act, Class C shares pay the Distributor for distributing its shares at an annual rate of .75% of the value of the average daily net assets of Class C chares. During the period ended October 31, 2012, Class C shares were charged $57,871, pursuant to the Distribution Plan.
(c) Under the Shareholder Services Plan, Class A and Class C shares pay the Distributor at an annual rate of .25% of the value of their average daily net assets for the provision of certain services.The services provided may include personal services relating to shareholder accounts, such as answering shareholder inquiries regarding the fund and providing reports and other information, and services related to the maintenance of shareholder accounts.The Distributor may make payments to Service Agents (securities dealers, financial institutions or other industry professionals) in respect of these services. The Distributor determines the amounts to be paid to Service Agents. During the period ended October 31, 2012, Class A and Class C shares were charged $41,885 and $19,290, respectively, pursuant to the Shareholder Services Plan.
Under its terms, the Distribution Plan and Shareholder Services Plan shall remain in effect from year to year, provided such continuance is approved annually by a vote of a majority of those Trustees who are not “interested persons” of the Trust and who have no direct or indirect financial interest in the operation of or in any agreement related to the Distribution Plan or Shareholder Services Plan.
NOTES TO FINANCIAL STATEMENTS (continued)
The fund has arrangements with the transfer agent and the custodian whereby the fund may receive earnings credits when positive cash balances are maintained, which are used to offset transfer agency and custody fees. For financial reporting purposes, the fund includes net earnings credits as an expense offset in the Statement of Operations.
The fund compensates DreyfusTransfer, Inc. (“DTI”), a wholly-owned subsidiary of Dreyfus, under a transfer agency agreement for providing transfer agency services for the fund and, since May 29, 2012, cash management services related to fund subscriptions and redemptions. During the period ended October 31, 2012, the fund was charged $3,663 for transfer agency services and $60 for cash management services. Cash management fees were partially offset by earnings credits of $7. These fees are included in Shareholder servicing costs in the Statement of Operations.
The fund compensatesThe Bank of NewYork Mellon under a custody agreement for providing custodial services for the fund. During the period ended October 31, 2012, the fund was charged $64,215 pursuant to the custody agreement.
Prior to May 29, 2012, the fund compensated The Bank of NewYork Mellon under a cash management agreement for performing cash management services related to fund subscriptions and redemptions. During the period ended October 31, 2012, the fund was charged $170 pursuant to the cash management agreement, which is included in Shareholder servicing costs in the Statement of Operations. These fees were partially offset by earnings credits of $6.
During the period ended October 31, 2012, the fund was charged $8,517 for services performed by the Chief Compliance Officer and his staff.
The components of “Due to The Dreyfus Corporation and affiliates” in the Statement of Assets and Liabilities consist of: management fees $98,996, Distribution Plan fees $12,405, Shareholder Services Plan
30
fees $14,496, custodian fees $23,092, Chief Compliance Officer fees $2,654 and transfer agency fees $656.
(d) Each Board member also serves as a Board member of other funds within the Dreyfus complex. Annual retainer fees and attendance fees are allocated to each fund based on net assets.
NOTE 4—Securities Transactions:
The aggregate amount of purchases and sales of investment securities, excluding short term securities and forward contracts, during the period ended October 31, 2012, amounted to $123,284,585 and $12,736,605, respectively.
Derivatives: A derivative is a financial instrument whose performance is derived from the performance of another asset. Each type of derivative instrument that was held by the fund during the period ended October 31, 2012 is discussed below.
Forward Foreign Currency Exchange Contracts: The fund enters into forward contracts in order to hedge its exposure to changes in foreign currency exchange rates on its foreign portfolio holdings, to settle foreign currency transactions or as a part of its investment strategy. When executing forward contracts, the fund is obligated to buy or sell a foreign currency at a specified rate on a certain date in the future. With respect to sales of forward contracts, the fund incurs a loss if the value of the contract increases between the date the forward contract is opened and the date the forward contract is closed.The fund realizes a gain if the value of the contract decreases between those dates.With respect to purchases of forward contracts, the fund incurs a loss if the value of the contract decreases between the date the forward contract is opened and the date the forward contract is closed.The fund realizes a gain if the value of the contract increases between those dates. Any realized or unrealized gains or losses which occurred during the period are reflected in the Statement of Operations. The fund is exposed to
NOTES TO FINANCIAL STATEMENTS (continued)
foreign currency risk as a result of changes in value of underlying financial instruments.The fund is also exposed to credit risk associated with counterparty nonperformance on these forward contracts, which is typically limited to the unrealized gain on each open contract.The following summarizes open forward contracts at October 31, 2012:
| | | | | | |
| | | Foreign | | | Unrealized | |
| Forward Foreign Currency | | Currency | | | Appreciation | |
| Exchange Contracts | | Amounts | Cost ($) | Value ($) (Depreciation) ($) | |
| Purchases: | | | | | | |
| Singapore Dollar, | | | | | | |
| Expiring 11/1/2012a | | 66,730 | 54,650 | 54,706 | 56 | |
| South African Rand, | | | | | | |
| Expiring 11/1/2012b | | 1,353,067 | 154,432 | 156,052 | 1,620 | |
| Sales: | | | Proceeds ($) | | | |
| Australian Dollar, | | | | | | |
| Expiring: | | | | | | |
| 1/15/2013 | a | 959,000 | 969,357 | 989,296 | (19,939 | ) |
| 1/15/2013 | b | 161,000 | 164,386 | 166,086 | (1,700 | ) |
| 1/15/2013 | c | 604,000 | 623,069 | 623,080 | (11 | ) |
| Brazilian Real, | | | | | | |
| Expiring: | | | | | | |
| 12/14/2012 | a | 696,000 | 337,504 | 340,571 | (3,067 | ) |
| 12/14/2012 | c | 2,665,000 | 1,278,763 | 1,304,052 | (25,289 | ) |
| British Pound, | | | | | | |
| Expiring: | | | | | | |
| 2/15/2013 | b | 116,000 | 183,724 | 187,128 | (3,404 | ) |
| 2/15/2013 | c | 1,290,000 | 2,020,888 | 2,080,995 | (60,107 | ) |
| Euro, | | | | | | |
| Expiring: | | | | | | |
| 2/15/2013 | b | 393,000 | 492,974 | 509,945 | (16,971 | ) |
| 2/15/2013 | c | 3,062,000 | 3,826,885 | 3,973,161 | (146,276 | ) |
| South African Rand, | | | | | | |
| Expiring: | | | | | | |
| 12/14/2012 | a | 5,730,000 | 660,768 | 656,419 | 4,349 | |
| 12/14/2012 | b | 1,011,000 | 121,354 | 115,818 | 5,536 | |
| 12/14/2012 | c | 1,816,000 | 217,943 | 208,038 | 9,905 | |
| 12/14/2012 | d | 1,202,000 | 140,437 | 137,699 | 2,738 | |
| Gross Unrealized | | | | | | |
| Appreciation | | | | | 24,204 | |
| Gross Unrealized | | | | | | |
| Depreciation | | | | | (276,764 | ) |
| |
| Counterparties: | | | | | | |
| a Barclays Bank | | | | | | |
| b Royal Bank of Scotland | | | | | | |
| c UBS | | | | | | |
| d JPMorgan Chase & Co. | | | | | | |
32
The following summarizes the average market value of derivatives outstanding during the period ended October 31, 2012:
| |
| | Average Market Value ($) |
| Forward contracts | 7,270,004 |
At October 31, 2012, the cost of investments for federal income tax purposes was $133,729,248, accordingly, accumulated net unrealized appreciation on investments was $2,720,193, consisting of $6,399,949 gross unrealized appreciation and $3,679,756 gross unrealized depreciation.
|
| REPORT OF INDEPENDENT REGISTERED |
| PUBLIC ACCOUNTING FIRM |
The Board of Trustees and Shareholders of The Dreyfus/Laurel Funds Trust
We have audited the accompanying statement of assets and liabilities of Dreyfus Global Equity Income Fund, a series of The Dreyfus/Laurel Funds Trust (the “Fund”), including the statement of investments, as of October 31, 2012, and the related statement of operations for the year then ended, the statements of changes in net assets for each of the years in the two-year period then ended, and the financial highlights for each of the years in the five-year period then ended.These financial statements and financial highlights are the responsibility of the Fund’s management. Our responsibility is to express an opinion on these financial statements and financial highlights based on our audits.
We conducted our audits in accordance with the standards of the Public Company Accounting Oversight Board (United States).Those standards require that we plan and perform the audit to obtain reasonable assurance about whether the financial statements and financial highlights are free of material misstatement.An audit includes examining, on a test basis, evidence supporting the amounts and disclosures in the financial statements. Our procedures included confirmation of securities owned as of October 31, 2012, by correspondence with the custodian and brokers or by other appropriate auditing procedures where replies from brokers were not received. An audit includes assessing the accounting principles used and significant estimates made by management, as well as evaluating the overall financial statement presentation.We believe that our audits provide a reasonable basis for our opinion.
In our opinion, the financial statements and financial highlights referred to above present fairly, in all material respects, the financial position of Dreyfus Global Equity Income Fund as of October 31, 2012, the results of its operations for the year then ended, the changes in its net assets for each of the years in the two-year period then ended, and the financial highlights for each of the years in the five-year period then ended, in conformity with U.S. generally accepted accounting principles.

New York, New York
December 26, 2012
34
IMPORTANT TAX INFORMATION (Unaudited)
For federal tax purposes, the fund elects to provide each shareholder with their portion of the fund’s income sourced from foreign countries and taxes paid from foreign countries.The fund reports the maximum amount allowable but not less than $1,878,479 as income sourced from foreign countries for the fiscal year ended October 31, 2012 in accordance with Section 853(c) (2) of the Internal Revenue Code and also the fund reports the maximum amount allowable but not less than $132,809 as taxes paid from foreign countries for the fiscal year ended October 31, 2012 in accordance with Section 853(a) of the Internal Revenue Code.Where required by federal tax law rules, shareholders will receive notification of their proportionate share of foreign sourced income and foreign taxes paid for the 2012 calendar year with Form 1099-DIV which will be mailed in early 2013. Also, the fund designates the maximum amount allowable, but not less than $1,830,236 as ordinary income dividends paid during the fiscal year ended October 31, 2012 as qualified dividend income in accordance with Section 854(b)(1)(B) of the Internal Revenue Code.
OFFICERS OF THE FUND (Unaudited)
BRADLEY J. SKAPYAK, President since January 2010.
Chief Operating Officer and a director of the Manager since June 2009; from April 2003 to June 2009, Mr. Skapyak was the head of the Investment Accounting and Support Department of the Manager. He is an officer of 72 investment companies (comprised of 156 portfolios) managed by the Manager. He is 53 years old and has been an employee of the Manager since February 1988.
JANETTE E. FARRAGHER, Vice President and Secretary since December 2011.
Assistant General Counsel of BNY Mellon, and an officer of 73 investment companies (comprised of 183 portfolios) managed by the Manager. She is 49 years old and has been an employee of the Manager since February 1984.
KIESHA ASTWOOD, Vice President and Assistant Secretary since January 2010.
Counsel of BNY Mellon, and an officer of 73 investment companies (comprised of 183 portfolios) managed by the Manager. She is 39 years old and has been an employee of the Manager since July 1995.
JAMES BITETTO, Vice President and Assistant Secretary since August 2005.
Senior Counsel of BNY Mellon and Secretary of the Manager, and an officer of 73 investment companies (comprised of 183 portfolios) managed by the Manager. He is 46 years old and has been an employee of the Manager since December 1996.
JONI LACKS CHARATAN, Vice President and Assistant Secretary since August 2005.
Senior Counsel of BNY Mellon, and an officer of 73 investment companies (comprised of 183 portfolios) managed by the Manager. She is 56 years old and has been an employee of the Manager since October 1988.
JOSEPH M. CHIOFFI, Vice President and Assistant Secretary since August 2005.
Senior Counsel of BNY Mellon, and an officer of 73 investment companies (comprised of 183 portfolios) managed by the Manager. He is 50 years old and has been an employee of the Manager since June 2000.
JOHN B. HAMMALIAN, Vice President and Assistant Secretary since August 2005.
Senior Managing Counsel of BNY Mellon, and an officer of 73 investment companies (comprised of 183 portfolios) managed by the Manager. He is 49 years old and has been an employee of the Manager since February 1991.
ROBERT R. MULLERY, Vice President and Assistant Secretary since August 2005.
Managing Counsel of BNY Mellon, and an officer of 73 investment companies (comprised of 183 portfolios) managed by the Manager. He is 60 years old and has been an employee of the Manager since May 1986.
JEFF PRUSNOFSKY, Vice President and Assistant Secretary since August 2005.
Senior Managing Counsel of BNY Mellon, and an officer of 73 investment companies (comprised of 183 portfolios) managed by the Manager. He is 47 years old and has been an employee of the Manager since October 1990.
JAMES WINDELS, Treasurer since November 2001.
Director – Mutual Fund Accounting of the Manager, and an officer of 73 investment companies (comprised of 183 portfolios) managed by the Manager. He is 54 years old and has been an employee of the Manager since April 1985.
38
RICHARD CASSARO, Assistant Treasurer since January 2008.
Senior Accounting Manager – Money Market and Municipal Bond Funds of the Manager, and an officer of 73 investment companies (comprised of 183 portfolios) managed by the Manager. He is 53 years old and has been an employee of the Manager since September 1982.
GAVIN C. REILLY, Assistant Treasurer since December 2005.
Tax Manager of the Investment Accounting and Support Department of the Manager, and an officer of 73 investment companies (comprised of 183 portfolios) managed by the Manager. He is 44 years old and has been an employee of the Manager since April 1991.
ROBERT S. ROBOL, Assistant Treasurer since August 2005.
Senior Accounting Manager – Fixed Income Funds of the Manager, and an officer of 73 investment companies (comprised of 183 portfolios) managed by the Manager. He is 48 years old and has been an employee of the Manager since October 1988.
ROBERT SALVIOLO, Assistant Treasurer since July 2007.
Senior Accounting Manager – Equity Funds of the Manager, and an officer of 73 investment companies (comprised of 183 portfolios) managed by the Manager. He is 45 years old and has been an employee of the Manager since June 1989.
ROBERT SVAGNA, Assistant Treasurer since December 2002.
Senior Accounting Manager – Equity Funds of the Manager, and an officer of 73 investment companies (comprised of 183 portfolios) managed by the Manager. He is 45 years old and has been an employee of the Manager since November 1990.
JOSEPH W. CONNOLLY, Chief Compliance Officer since October 2004.
Chief Compliance Officer of the Manager and The Dreyfus Family of Funds (73 investment companies, comprised of 183 portfolios). He is 55 years old and has served in various capacities with the Manager since 1980, including manager of the firm’s Fund Accounting Department from 1997 through October 2001.
MATTHEW D. CONNOLLY, Anti-Money Laundering Compliance Officer since April 2012.
Anti-Money Laundering Compliance Officer of the Distributor since October 2011; from March 2010 to September 2011, Global Head, KYC Reviews and Director, UBS Investment Bank; until March 2010,AML Compliance Officer and Senior Vice President, Citi Global Wealth Management. He is an officer of 69 investment companies (comprised of 179 portfolios) managed by the Manager. He is 40 years old and has been an employee of the Distributor since October 2011.
Save time. Save paper. View your next shareholder report online as soon as it’s available. Log into www.dreyfus.com and sign up for Dreyfus eCommunications. It’s simple and only takes a few minutes.
The views expressed in this report reflect those of the portfolio manager only through the end of the period covered and do not necessarily represent the views of Dreyfus or any other person in the Dreyfus organization. Any such views are subject to change at any time based upon market or other conditions and Dreyfus disclaims any responsibility to update such views.These views may not be relied on as investment advice and, because investment decisions for a Dreyfus fund are based on numerous factors, may not be relied on as an indication of trading intent on behalf of any Dreyfus fund.
Not FDIC-Insured • Not Bank-Guaranteed • May Lose Value
| | Contents |
| | THE FUND |
| 2 | A Letter from the Chairman and CEO |
| 3 | Discussion of Fund Performance |
| 6 | Fund Performance |
| 8 | Understanding Your Fund’s Expenses |
| 8 | Comparing Your Fund’s Expenses With Those of Other Funds |
| 9 | Statement of Investments |
| 23 | Statement of Financial Futures |
| 24 | Statement of Assets and Liabilities |
| 25 | Statement of Operations |
| 26 | Statement of Changes in Net Assets |
| 28 | Financial Highlights |
| 31 | Notes to Financial Statements |
| 50 | Report of Independent Registered Public Accounting Firm |
| 51 | Important Tax Information |
| 52 | Board Members Information |
| 54 | Officers of the Fund |
| | FOR MORE INFORMATION |
| | Back Cover |
Dreyfus
International Bond Fund
The Fund
A LETTER FROM THE CHAIRMAN AND CEO
Dear Shareholder:
We are pleased to present this annual report for Dreyfus International Bond Fund, covering the 12-month period from November 1, 2011, through October 31, 2012. For information about how the fund performed during the reporting period, as well as general market perspectives, we provide a Discussion of Fund Performance on the pages that follow.
Despite heightened volatility, international bond markets generally advanced over the reporting period as investors responded to encouraging macroeconomic developments throughout the world. Employment gains in the United States, credible measures to prevent a more severe banking crisis in Europe, and the likelihood of a “soft landing” for China’s economy buoyed investor sentiment, as did aggressively accommodative monetary policies from central banks in the United States, Europe, Japan and China. Consequently, riskier segments of the international bond market gained value, while falling interest rates benefited government securities issued by more fiscally healthy nations.
In light of the easy monetary policies adopted by many countries, specifically within the U.S., we expect global growth to be slightly more robust in 2013 than in 2012, as further healing of the European financial crisis occurs and the likelihood of continued emerging markets economic growth helps to drive a modestly stronger pace of growth. As always, we encourage you to stay in touch with your financial advisor as new developments unfold.
Thank you for your continued confidence and support.

Jonathan R. Baum
Chairman and Chief Executive Officer
The Dreyfus Corporation
November 15, 2012
2
DISCUSSION OF FUND PERFORMANCE
For the period of November 1, 2011, through October 31, 2012, as provided by David Leduc, CFA, and Brendan Murphy, CFA, Portfolio Managers
Fund and Market Performance Overview
For the 12-month period ended October 31, 2012, Dreyfus International Bond Fund’s Class A shares produced a total return of 6.04%, Class C shares returned 5.23% and Class I shares returned 6.27%.1 In comparison, the fund’s benchmark, the Barclays Global Aggregate ex-U.S. (Unhedged) Bond Index (the “Index”), produced a total return of 2.21% for the same period.2
International bond prices generally were supported over the reporting period by aggressively accommodative monetary policy initiatives throughout the world.The fund’s returns were higher than its benchmark, mainly due to the success of our country allocation, currency allocation, and security selection strategies.
The Fund’s Investment Approach
The fund seeks to maximize total return through capital appreciation and income.To pursue its goal, the fund normally invests at least 80% of its net assets in fixed-income securities, and at least 65% of its assets in non-U.S. dollar-denominated fixed-income securities of foreign governments and companies located in various countries, including emerging markets.
Generally, the fund seeks to maintain investment-grade average credit quality. We focus on identifying undervalued government bond markets, currencies, sectors and securities. We look for fixed-income securities with the most potential for added value, such as those involving the potential for credit upgrades, unique structural characteristics or innovative features. We use fundamental economic research and quantitative analysis to allocate assets among countries and currencies.We then focus on sectors and individual securities that appear to be relatively undervalued.
Macroeconomic Developments Fueled Market Volatility
The reporting period began in the aftermath of steep market declines stemming from macroeconomic developments in the United States, Europe, and China. However, employment gains and other encouraging U.S. economic news helped alleviate domestic investors’ worries, and a quantitative easing program appeared to forestall a
DISCUSSION OF FUND PERFORMANCE (continued)
more severe banking crisis in Europe. These developments sparked the start of a strong and sustained rally among higher yielding bonds. Investors grew more tolerant of risks, and they turned away from traditional safe havens and toward riskier market sectors expected to benefit from better economic conditions.
The global economic recovery was called into question in the spring, when U.S. employment gains moderated, proposed austerity programs to relieve fiscal pressures in Europe encountered resistance, and China’s economy remained more sluggish than expected.These headwinds erased some of the gains previously posted by higher yielding bonds, and yields of sovereign debt securities from fiscally healthy nations plunged in a renewed flight to quality. Fortunately, more encouraging economic data over the summer—and the announcement of new policy initiatives by several central banks—cheered investors, enabling the international bond market to end the reporting period with respectable returns, on average.
Allocation and Selection Strategies Boosted Fund Results
In this volatile environment, the fund benefited from our currency allocation strategy, which called for underweighted exposure to the euro and Swiss franc and overweighted positions in the stronger Mexican peso and Singapore dollar. Our country allocation strategy also added value through overweighted exposure to U.S. corporate-backed bonds as yield differences narrowed along the market’s maturity range over the reporting period’s first half. In mid-2012, we shifted a portion of the fund’s credit allocation from the United States to Europe, a move that proved to be well timed.The fund also benefited from relatively light exposure to and a focus on longer maturities among Japanese bonds as the country continued to struggle with economic weakness and deflationary pressures.
Our security selection process scored successes among European sovereign bonds, including tactical shifts into debt securities from Italy, Slovakia, and Ireland at various times during the reporting period.The fund generally avoided weakness in Spain’s bond market early in 2012, and we gradually adopted a more constructive posture in European credit markets as the reporting period progressed.To a lesser degree, our interest rate strategies also buoyed the fund’s relative results, as we favored intermediate-term securities over their shorter-term counterparts.
We employed currency forwards and options to help implement the fund’s currency allocation strategy, and we used interest rate options and futures to set its interest rate positioning.
4
Finding Relative Values in International Markets
While we remain concerned regarding ongoing macroeconomic events in Europe, the United States, and the emerging markets, we expect accommodative monetary policies to boost economic global growth in 2013. Moreover, we believe that low interest rates in many parts of the world are likely to drive robust demand for international bonds. However, corporate-backed securities and sovereign bonds from fiscally sound countries have become more fully valued, suggesting that currencies may provide more attractive opportunities over the months ahead.We also intend to monitor international bond markets carefully with an eye toward purchasing securities at more attractive valuations during bouts of heightened volatility.
November 15, 2012
|
| Bond funds are subject generally to interest rate, credit, liquidity and market risks, to varying degrees, all of which are |
| more fully described in the fund’s prospectus. Generally, all other factors being equal, bond prices are inversely related |
| to interest-rate changes, and rate increases can cause price declines. |
| High yield bonds are subject to increased credit risk and are considered speculative in terms of the issuer’s perceived |
| ability to continue making interest payments on a timely basis and to repay principal upon maturity. |
| Foreign bonds are subject to special risks including exposure to currency fluctuations, changing political and economic |
| conditions, and potentially less liquidity.These risks are generally greater with emerging market countries than with |
| more economically and politically established foreign countries. |
| The use of derivatives involves risks different from, or possibly greater than, the risks associated with investing directly in |
| the underlying assets. Derivatives can be highly volatile, illiquid and difficult to value, and there is the risk that changes in |
| the value of a derivate held by the fund will not correlate with the underlying instruments or the fund’s other instruments. |
| Investments in foreign currencies are subject to the risk that those currencies will decline in value relative to the U.S. |
| dollar, or, in the case of hedged positions, that the U.S. dollar will decline relative to the currency being hedged. |
| Currency rates in foreign countries may fluctuate significantly over short periods of time.A decline in the value of |
| foreign currencies relative to the U.S. dollar will reduce the value of securities held by the fund and denominated in |
| those currencies.The use of leverage may magnify the fund’s gains or losses. For derivatives with a leveraging |
| component, adverse changes in the value or level of the underlying asset can result in a loss that is much greater than |
| the original investment in the derivative. |
| 1 Total return includes reinvestment of dividends and any capital gains paid and does not take into consideration the |
| maximum initial sales charge in the case of Class A shares or the applicable contingent deferred sales charge imposed on |
| redemptions in the case of Class C shares. Had these charges been reflected, returns would have been lower. Class I shares |
| are not subject to any initial or deferred sales charge. Past performance is no guarantee of future results. Share price and |
| investment return fluctuate such that upon redemption, fund shares may be worth more or less than their original cost. |
| 2 SOURCE: FACTSET — Reflects reinvestment of dividends and, where applicable, capital gain distributions.The |
| Barclays Global Aggregate ex-U.S. (Unhedged) Bond Index provides a broad-based measure of the global investment- |
| grade fixed income markets. Investors cannot invest directly in any index. |
FUND PERFORMANCE
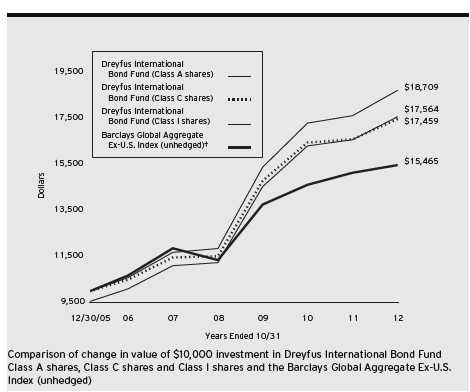
|
| † Source: Barclays Bank PLC |
| Past performance is not predictive of future performance. |
| The above graph compares a $10,000 investment made in each of the Class A, Class C and Class I shares of Dreyfus |
| International Bond Fund on 12/30/05 (inception date) to a $10,000 investment made in the Barclays Global Aggregate |
| Ex-U.S. Index (unhedged) (the “Index”) on that date.All dividends and capital gain distributions are reinvested. |
| The fund invests 80% of its assets primarily in fixed-income securities. The fund’s performance shown in the line graph |
| above takes into account the maximum initial sales charge on Class A shares and all other applicable fees and expenses |
| on all classes. The Index is designed to measure the performance of global investment-grade, fixed-rate debt markets, |
| excluding the United States, hedged into U. S. dollars. Unlike a mutual fund, the Index is not subject to charges, fees |
| and other expenses. Investors cannot invest directly in any index. Further information relating to fund performance, |
| including expense reimbursements, if applicable, is contained in the Financial Highlights section of the prospectus and |
| elsewhere in this report. |
6
| | | | | | | |
| Average Annual Total Returns as of 10/31/12 | | | | | | |
| |
| | Inception | | | | | From | |
| | Date | 1 | Year | 5 Years | | Inception | |
| Class A shares | | | | | | | |
| with maximum sales charge (4.5%) | 12/30/05 | 1.29 | % | 8.61 | % | 8.58 | % |
| without sales charge | 12/30/05 | 6.04 | % | 9.62 | % | 9.32 | % |
| Class C shares | | | | | | | |
| with applicable redemption charge † | 12/30/05 | 4.23 | % | 8.79 | % | 8.49 | % |
| without redemption | 12/30/05 | 5.23 | % | 8.79 | % | 8.49 | % |
| Class I shares | 12/30/05 | 6.27 | % | 9.90 | % | 9.59 | % |
| Barclays Global Aggregate | | | | | | | |
| Ex-U.S. Index (unhedged) | 12/31/05 | 2.21 | % | 5.46 | % | 6.59 | %†† |
| |
| Past performance is not predictive of future performance.The fund’s performance shown in the graph and table does not |
| reflect the deduction of taxes that a shareholder would pay on the fund distributions or the redemption of fund shares. |
| † | The maximum contingent deferred sales charge for Class C shares is 1% for shares redeemed within one year of the |
| | date of purchase. |
| †† | For comparative purposes, the value of the Index as of 12/31/05 is used as the beginning value on 12/30/05. |
UNDERSTANDING YOUR FUND’S EXPENSES (Unaudited)
As a mutual fund investor, you pay ongoing expenses, such as management fees and other expenses. Using the information below, you can estimate how these expenses affect your investment and compare them with the expenses of other funds.You also may pay one-time transaction expenses, including sales charges (loads) and redemption fees, which are not shown in this section and would have resulted in higher total expenses. For more information, see your fund’s prospectus or talk to your financial adviser.
Review your fund’s expenses
The table below shows the expenses you would have paid on a $1,000 investment in Dreyfus International Bond Fund from May 1, 2012 to October 31, 2012. It also shows how much a $1,000 investment would be worth at the close of the period, assuming actual returns and expenses.
| | | | | | | |
| Expenses and Value of a $1,000 Investment | | | | | |
| assuming actual returns for the six months ended October 31, 2012 | | |
| | | Class A | | | Class C | | Class I |
| Expenses paid per $1,000† | | $ 5.25 | | | $ 8.99 | | $ 3.81 |
| Ending value (after expenses) | | $ 1,047.40 | | $ 1,043.50 | | $ 1,048.70 |
|
| COMPARING YOUR FUND’S EXPENSES |
| WITH THOSE OF OTHER FUNDS (Unaudited) |
Using the SEC’s method to compare expenses
The Securities and Exchange Commission (SEC) has established guidelines to help investors assess fund expenses. Per these guidelines, the table below shows your fund’s expenses based on a $1,000 investment, assuming a hypothetical 5% annualized return. You can use this information to compare the ongoing expenses (but not transaction expenses or total cost) of investing in the fund with those of other funds.All mutual fund shareholder reports will provide this information to help you make this comparison. Please note that you cannot use this information to estimate your actual ending account balance and expenses paid during the period.
| | | | | | | | |
| Expenses and Value of a $1,000 Investment | | | | | | |
| assuming a hypothetical 5% annualized return for the six months ended October 31, 2012 |
| | | Class A | | | Class C | | | Class I |
| Expenses paid per $1,000† | | $5.18 | | | $ 8.87 | | | $ 4.27 |
| Ending value (after expenses) | | $1,020.01 | | $1,016.34 | | $1,020.91 |
† Expenses are equal to the fund’s annualized expense ratio of 1.02% for Class A, 1.75% for Class C and .84% for Class I, multiplied by the average account value over the period, multiplied by 184/366 (to reflect the one-half year period).
8
STATEMENT OF INVESTMENTS
October 31, 2012
| | | | | | |
| | | Coupon | Maturity | Principal | | |
| Bonds and Notes—94.9% | | Rate (%) | Date | Amount ($)a | Value ($) |
| Australia—2.3% | | | | | | |
| FMG Resources (August 2006), | | | | | | |
| Gtd. Notes | | 6.38 | 2/1/16 | 3,180,000 | b,c | 3,195,900 |
| Queensland Treasury, | | | | | | |
| Gov’t Gtd. Bonds, Ser. 13G | AUD | 6.00 | 8/14/13 | 9,770,000 | | 10,392,869 |
| Queensland Treasury, | | | | | | |
| Gov’t Gtd. Notes, Ser. 15 | AUD | 6.00 | 10/14/15 | 5,150,000 | | 5,792,138 |
| Queensland Treasury, | | | | | | |
| Gov’t Gtd. Notes, Ser. 21 | AUD | 6.00 | 6/14/21 | 15,160,000 | | 18,428,179 |
| SMART Trust, | | | | | | |
| Ser. 2011-1USA, Cl. A3B | | 1.06 | 10/14/14 | 4,100,964 | c,d | 4,112,196 |
| | | | | | | 41,921,282 |
| Austria—2.5% | | | | | | |
| Austrian Government, | | | | | | |
| Sr. Unscd. Notes | EUR | 3.15 | 6/20/44 | 5,760,000 | c | 7,826,581 |
| Austrian Government, | | | | | | |
| Sr. Unscd. Bonds | EUR | 3.90 | 7/15/20 | 24,865,000 | c | 37,630,099 |
| | | | | | | 45,456,680 |
| Belgium—1.2% | | | | | | |
| Anheuser-Busch InBev, | | | | | | |
| Gtd. Notes | GBP | 9.75 | 7/30/24 | 125,000 | | 325,837 |
| Belgium Government, | | | | | | |
| Sr. Unscd. Notes, Ser. 65 | EUR | 4.25 | 9/28/22 | 14,000,000 | | 21,035,203 |
| | | | | | | 21,361,040 |
| Brazil—.6% | | | | | | |
| Brazil Notas do | | | | | | |
| Tesouro Nacional, | | | | | | |
| Notes, Ser. F | BRL | 10.00 | 1/1/13 | 13,200,000 | | 6,748,199 |
| Petrobras | | | | | | |
| International Finance, | | | | | | |
| Gtd. Notes | EUR | 5.88 | 3/7/22 | 2,830,000 | | 4,311,649 |
| | | | | | | 11,059,848 |
| Canada—7.2% | | | | | | |
| Bombardier, | | | | | | |
| Sr. Unscd. Notes | EUR | 6.13 | 5/15/21 | 2,740,000 | c | 3,773,395 |
| Canadian Capital Auto | | | | | | |
| Receivables Asset Trust, | | | | | | |
| Ser. 2012-1A, Cl. A2 | CAD | 2.03 | 8/17/15 | 3,800,000 | c | 3,825,568 |
| Canadian Capital Auto | | | | | | |
| Receivables Asset Trust, | | | | | | |
| Ser. 2012-1A, Cl. A3 | CAD | 2.38 | 4/17/17 | 10,730,000 | c | 10,906,192 |
The Fund 9
STATEMENT OF INVESTMENTS (continued)
| | | | | | |
| | | Coupon | Maturity | Principal | | |
| Bonds and Notes (continued) | Rate (%) | Date | Amount ($)a | Value ($) |
| Canada (continued) | | | | | | |
| Canadian Capital Auto | | | | | | |
| Receivables Asset Trust, | | | | | | |
| Ser. 2011-1A, Cl. A2 | CAD | 2.63 | 8/17/14 | 12,457,134 | c | 12,541,449 |
| CIT Canada Equipment | | | | | | |
| Receivables Trust, | | | | | | |
| Ser. 2012-1A, Cl. A2 | CAD | 2.11 | 12/20/16 | 8,595,000 | c | 8,623,692 |
| CNH Capital Canada | | | | | | |
| Receivables Trust, | | | | | | |
| Ser. 2011-1A, Cl. A2 | CAD | 2.34 | 7/17/17 | 11,595,000 | c | 11,725,375 |
| Ford Auto Securitization Trust, | | | | | | |
| Ser. 2011-R3A, Cl. A2 | CAD | 1.96 | 7/15/15 | 5,110,000 | c | 5,138,038 |
| Ford Auto Securitization Trust, | | | | | | |
| Ser. 2012-R1, Cl. A2 | CAD | 2.02 | 3/15/16 | 8,400,000 | | 8,462,490 |
| Ford Auto Securitization Trust, | | | | | | |
| Ser. 2011-R1A, Cl. A2 | CAD | 2.43 | 11/15/14 | 5,496,919 | c | 5,531,306 |
| Ford Auto Securitization Trust, | | | | | | |
| Ser. 2010-R3A, Cl. A3 | CAD | 2.71 | 9/15/15 | 2,290,000 | c | 2,327,465 |
| MEG Energy, | | | | | | |
| Gtd. Notes | | 6.38 | 1/30/23 | 3,875,000 | c | 4,165,625 |
| Province of British Columbia, | | | | | | |
| Sr. Unscd. Bonds | CAD | 2.70 | 12/18/22 | 26,250,000 | | 26,366,696 |
| Province of Ontario Canada, | | | | | | |
| Bonds | CAD | 4.40 | 3/8/16 | 18,145,000 | | 19,850,766 |
| Rogers Communications, | | | | | | |
| Gtd. Notes | CAD | 6.56 | 3/22/41 | 3,190,000 | | 3,951,416 |
| Videotron, | | | | | | |
| Gtd. Notes | | 5.00 | 7/15/22 | 4,040,000 | | 4,201,600 |
| | | | | | | 131,391,073 |
| Chile—1.6% | | | | | | |
| Banco Santander Chile, | | | | | | |
| Sr. Unscd. Notes | | 3.88 | 9/20/22 | 2,900,000 | b,c | 3,000,726 |
| Chilean Government, | | | | | | |
| Sr. Unscd. Notes | CLP | 5.50 | 8/5/20 | 6,062,000,000 | | 13,758,088 |
| CODELCO, | | | | | | |
| Sr. Unscd. Notes | | 3.88 | 11/3/21 | 3,740,000 | c | 4,093,194 |
| Empresa Nacional de Petroleo, | | | | | | |
| Sr. Unscd. Notes | | 4.75 | 12/6/21 | 3,675,000 | c | 4,037,395 |
| Telefonica Chile, | | | | | | |
| Sr. Unscd. Notes | | 3.88 | 10/12/22 | 3,750,000 | c | 3,734,794 |
| | | | | | | 28,624,197 |
10
| | | | | | |
| | | Coupon | Maturity | Principal | | |
| Bonds and Notes (continued) | Rate (%) | Date | Amount ($)a | Value ($) |
| Colombia—.2% | | | | | | |
| Bancolombia, | | | | | | |
| Sub. Notes | | 5.13 | 9/11/22 | 3,150,000 | | 3,307,500 |
| France—6.8% | | | | | | |
| AXA, | | | | | | |
| Sub. Notes | EUR | 5.25 | 4/16/40 | 7,000,000 | d | 8,759,690 |
| AXA, | | | | | | |
| Jr. Sub. Notes | EUR | 5.78 | 7/29/49 | 6,740,000 | d | 7,885,884 |
| AXA, | | | | | | |
| Jr. Sub. Notes | EUR | 6.21 | 10/29/49 | 1,400,000 | d | 1,610,457 |
| BNP Paribas, | | | | | | |
| Sr. Unscd. Notes | | 2.38 | 9/14/17 | 13,695,000 | | 13,811,147 |
| French Government, | | | | | | |
| Bonds | EUR | 3.25 | 10/25/21 | 22,600,000 | | 32,214,725 |
| French Government, | | | | | | |
| Bonds | EUR | 4.50 | 4/25/41 | 10,115,000 | | 16,416,947 |
| French Government, | | | | | | |
| Bonds | EUR | 4.25 | 4/25/19 | 12,675,000 | | 19,291,556 |
| GDF Suez, | | | | | | |
| Sr. Unscd. Notes | | 1.63 | 10/10/17 | 3,675,000 | c | 3,704,363 |
| Pernod-Ricard, | | | | | | |
| Sr. Unscd. Bonds | EUR | 5.00 | 3/15/17 | 1,100,000 | | 1,622,748 |
| Societe Generale, | | | | | | |
| Bank Gtd. Notes | | 2.75 | 10/12/17 | 17,550,000 | | 17,703,527 |
| | | | | | | 123,021,044 |
| Germany—8.0% | | | | | | |
| Allianz, | | | | | | |
| Sub. Notes | EUR | 5.63 | 10/17/42 | 10,400,000 | d | 14,184,396 |
| Conti-Gummi Finance, | | | | | | |
| Sr. Scd. Bonds | EUR | 7.13 | 10/15/18 | 3,850,000 | c | 5,340,458 |
| Daimler, | | | | | | |
| Sr. Unscd. Notes | EUR | 4.63 | 9/2/14 | 2,100,000 | | 2,920,816 |
| German Government, | | | | | | |
| Unscd. Bonds | EUR | 2.00 | 1/4/22 | 42,500,000 | | 58,147,306 |
| German Government, | | | | | | |
| Bonds, Ser. 155 | EUR | 2.50 | 10/10/14 | 36,570,000 | | 49,663,427 |
| German Government, | | | | | | |
| Bonds | EUR | 3.25 | 7/4/42 | 5,780,000 | | 9,054,040 |
| KFW, | | | | | | |
| Gov’t Gtd. Notes | JPY | 2.05 | 2/16/26 | 3,000,000 | | 42,028 |
STATEMENT OF INVESTMENTS (continued)
| | | | | | |
| | | Coupon | Maturity | Principal | | |
| Bonds and Notes (continued) | Rate (%) | Date | Amount ($)a | Value ($) |
| Germany (continued) | | | | | | |
| Techem, | | | | | | |
| Sr. Scd. Notes | EUR | 6.13 | 10/1/19 | 1,760,000 | c | 2,400,975 |
| Unitymedia Hessen, | | | | | | |
| Sr. Scd. Notes | EUR | 7.50 | 3/15/19 | 2,545,000 | c | 3,628,551 |
| | | | | | | 145,381,997 |
| Iceland—.5% | | | | | | |
| Iceland Government, | | | | | | |
| Notes | | 4.88 | 6/16/16 | 7,905,000 | | 8,323,902 |
| Ireland—1.8% | | | | | | |
| Ardagh Packaging Finance, | | | | | | |
| Sr. Scd. Notes | EUR | 7.38 | 10/15/17 | 1,620,000 | | 2,236,235 |
| Bank of Ireland, | | | | | | |
| Gov’t Gtd. Notes | EUR | 4.00 | 1/28/15 | 14,000,000 | | 18,291,165 |
| Irish Government, | | | | | | |
| Bonds | EUR | 4.60 | 4/18/16 | 4,550,000 | b | 6,291,039 |
| Smurfit Kappa Acquisitions, | | | | | | |
| Sr. Scd. Notes | EUR | 5.13 | 9/15/18 | 1,565,000 | c | 2,091,853 |
| Smurfit Kappa Acquistions, | | | | | | |
| Sr. Scd. Notes | EUR | 7.75 | 11/15/19 | 2,545,000 | c | 3,645,045 |
| | | | | | | 32,555,337 |
| Italy—8.9% | | | | | | |
| Enel Finance International, | | | | | | |
| Gtd. Notes | | 5.13 | 10/7/19 | 1,950,000 | c | 2,066,830 |
| Enel, | | | | | | |
| Sr. Unscd. Bonds | EUR | 4.88 | 2/20/18 | 5,950,000 | | 8,108,101 |
| Intesa Sanpaolo, | | | | | | |
| Sr. Unscd. Notes | EUR | 4.13 | 9/19/16 | 1,800,000 | | 2,332,684 |
| Intesa Sanpaolo, | | | | | | |
| Sr. Notes | EUR | 5.00 | 2/28/17 | 7,700,000 | | 10,312,662 |
| Italian Government, | | | | | | |
| Treasury Bonds | EUR | 4.75 | 6/1/17 | 56,720,000 | | 76,726,239 |
| Italian Government, | | | | | | |
| Treasury Bonds | EUR | 4.75 | 9/1/21 | 12,655,000 | | 16,660,208 |
| Italian Government, | | | | | | |
| Treasury Bonds | EUR | 5.50 | 9/1/22 | 24,320,000 | | 33,180,257 |
| Telecom Italia Capital, | | | | | | |
| Gtd. Notes | | 7.18 | 6/18/19 | 2,100,000 | | 2,420,250 |
| Telecom Italia, | | | | | | |
| Sr. Unscd. Notes | EUR | 8.25 | 3/21/16 | 1,100,000 | | 1,677,303 |
12
| | | | | | |
| | | Coupon | Maturity | Principal | | |
| Bonds and Notes (continued) | Rate (%) | Date | Amount ($)a | Value ($) |
| Italy (continued) | | | | | | |
| Telecom Italia, | | | | | | |
| Sr. Unscd. Notes | GBP | 7.38 | 12/15/17 | 4,850,000 | | 8,770,206 |
| | | | | | | 162,254,740 |
| Japan—8.3% | | | | | | |
| Development Bank of Japan, | | | | | | |
| Gov’t Gtd. Notes | JPY | 1.05 | 6/20/23 | 34,000,000 | b | 437,882 |
| Development Bank of Japan, | | | | | | |
| Gov’t Gtd. Bonds | JPY | 1.70 | 9/20/22 | 24,000,000 | | 329,957 |
| Japan Finance Organization | | | | | | |
| for Municipalities, | | | | | | |
| Gov’t Gtd. Notes | JPY | 1.35 | 11/26/13 | 11,000,000 | | 139,545 |
| Japanese Government, | | | | | | |
| Sr. Unscd. Bonds, Ser. 11 | JPY | 1.70 | 6/20/33 | 1,366,150,000 | | 17,060,327 |
| Japanese Government, | | | | | | |
| Sr. Unscd. Bonds, Ser. 106 | JPY | 2.20 | 9/20/28 | 2,719,450,000 | | 37,896,692 |
| Japanese Government, | | | | | | |
| Sr. Unscd. Bonds, Ser. 25 | JPY | 2.30 | 12/20/36 | 1,253,700,000 | | 17,154,866 |
| Japanese Government, | | | | | | |
| Sr. Unscd. Bonds, Ser. 58 | JPY | 1.90 | 9/20/22 | 1,645,000,000 | | 22,850,354 |
| Japanese Government, | | | | | | |
| Sr. Unscd. Bonds, Ser. 108 | JPY | 1.90 | 12/20/28 | 1,315,000,000 | | 17,596,917 |
| Japanese Government, | | | | | | |
| Sr. Unscd. Bonds, Ser. 121 | JPY | 1.90 | 9/20/30 | 1,330,000,000 | | 17,486,593 |
| Japanese Government, | | | | | | |
| Sr. Unscd. Bonds, Ser. 35 | JPY | 2.00 | 9/20/41 | 1,350,000,000 | | 17,197,086 |
| Japanese Government, | | | | | | |
| Sr. Unscd. Bonds, Ser. 8 | JPY | 1.00 | 6/10/16 | 210,000,000 | e | 2,795,188 |
| | | | | | | 150,945,407 |
| Malaysia—.3% | | | | | | |
| Malaysian Government, | | | | | | |
| Sr. Unscd. Bonds, Ser. 0409 | MYR | 3.74 | 2/27/15 | 15,250,000 | | 5,084,814 |
| Mexico—1.4% | | | | | | |
| Comision Federal | | | | | | |
| de Electricidad, | | | | | | |
| Sr. Unscd. Notes | | 5.75 | 2/14/42 | 3,725,000 | c | 4,265,125 |
| Mexican Government, | | | | | | |
| Bonds, Cl. M | MXN | 6.50 | 6/10/21 | 87,550,000 | | 7,162,892 |
| Mexican Government, | | | | | | |
| Bonds, Ser. M 30 | MXN | 8.50 | 11/18/38 | 119,800,000 | | 11,369,335 |
STATEMENT OF INVESTMENTS (continued)
| | | | | | |
| | | Coupon | Maturity | Principal | | |
| Bonds and Notes (continued) | Rate (%) | Date | Amount ($)a | Value ($) |
| Mexico (continued) | | | | | | |
| Mexichem, | | | | | | |
| Sr. Unscd. Notes | | 4.88 | 9/19/22 | 2,300,000 | b,c | 2,438,000 |
| | | | | | | 25,235,352 |
| Netherlands—3.3% | | | | | | |
| ABN Amro Bank, | | | | | | |
| Sr. Unscd. Notes | | 4.25 | 2/2/17 | 7,300,000 | c | 7,931,231 |
| BMW Finance, | | | | | | |
| Gtd. Notes | EUR | 3.88 | 1/18/17 | 1,300,000 | | 1,875,225 |
| E.ON International Finance, | | | | | | |
| Gtd. Notes | EUR | 4.88 | 1/28/14 | 580,000 | | 791,757 |
| E.ON International Finance, | | | | | | |
| Gtd. Notes | EUR | 5.50 | 10/2/17 | 620,000 | | 966,908 |
| ELM, | | | | | | |
| Sub. Notes | EUR | 5.25 | 5/29/49 | 10,750,000 | d | 13,570,913 |
| Elsevier Finance, | | | | | | |
| Gtd. Notes | EUR | 6.50 | 4/2/13 | 900,000 | | 1,194,411 |
| Heineken, | | | | | | |
| Sr. Notes | | 0.80 | 10/1/15 | 5,600,000 | c | 5,615,271 |
| Iberdrola International, | | | | | | |
| Gtd. Notes | EUR | 4.50 | 9/21/17 | 1,700,000 | | 2,319,101 |
| ING Bank, | | | | | | |
| Covered Notes | | 3.63 | 8/31/21 | 1,905,000 | | 2,789,695 |
| Rabobank Nederland, | | | | | | |
| Sr. Unscd. Notes | EUR | 3.88 | 4/20/16 | 5,100,000 | | 7,209,865 |
| Repsol International Finance, | | | | | | |
| Gtd. Notes | EUR | 4.38 | 2/20/18 | 3,600,000 | | 4,862,520 |
| Repsol International Finance, | | | | | | |
| Gtd. Notes | EUR | 4.88 | 2/19/19 | 3,200,000 | | 4,382,339 |
| RWE Finance, | | | | | | |
| Gtd. Notes | EUR | 6.63 | 1/31/19 | 1,350,000 | | 2,233,334 |
| Ziggo Bond, | | | | | | |
| Gtd. Notes | EUR | 8.00 | 5/15/18 | 2,590,000 | b,c | 3,696,907 |
| | | | | | | 59,439,477 |
| Norway—1.1% | | | | | | |
| DNB Boligkreditt, | | | | | | |
| Covered Bonds | | 2.90 | 3/29/17 | 4,470,000 | c | 4,773,562 |
| DNB Boligkreditt, | | | | | | |
| Covered Bonds | EUR | 3.38 | 1/20/17 | 4,920,000 | | 7,023,811 |
14
| | | | | | |
| | | Coupon | Maturity | Principal | | |
| Bonds and Notes (continued) | Rate (%) | Date | Amount ($)a | Value ($) |
| Norway (continued) | | | | | | |
| Norwegian Government, | | | | | | |
| Bonds, Ser. 474 | NOK | 3.75 | 5/25/21 | 16,000,000 | | 3,225,482 |
| Statoil, | | | | | | |
| Gtd. Notes | | 4.25 | 11/23/41 | 4,895,000 | | 5,504,242 |
| | | | | | | 20,527,097 |
| Peru—1.0% | | | | | | |
| BBVA Banco Continental, | | | | | | |
| Sr. Unscd. Notes | | 5.00 | 8/26/22 | 550,000 | b,c | 587,125 |
| Corp Financiera de Desarrollo, | | | | | | |
| Sr. Unscd. Notes | | 4.75 | 2/8/22 | 2,355,000 | b,c | 2,643,487 |
| Peruvian Government, | | | | | | |
| Sr. Unscd. Notes | PEN | 6.95 | 8/12/31 | 31,234,000 | c | 14,713,667 |
| | | | | | | 17,944,279 |
| Philippines—.5% | | | | | | |
| Philippine Government, | | | | | | |
| Sr. Unscd. Notes | PHP | 4.95 | 1/15/21 | 22,000,000 | | 588,759 |
| Philippine Government, | | | | | | |
| Sr. Unscd. Bonds | PHP | 6.25 | 1/14/36 | 291,000,000 | | 8,304,509 |
| | | | | | | 8,893,268 |
| Poland—.5% | | | | | | |
| Polish Government, | | | | | | |
| Sr. Unscd. Notes | | 5.00 | 3/23/22 | 7,120,000 | | 8,313,953 |
| Slovakia—3.0% | | | | | | |
| Slovakian Government, | | | | | | |
| Sr. Unscd. Notes | | 4.38 | 5/21/22 | 14,100,000 | c | 15,120,699 |
| Slovakian Government, | | | | | | |
| Bonds, Ser. 213 | EUR | 3.50 | 2/24/16 | 10,990,000 | | 15,396,997 |
| Slovakian Government, | | | | | | |
| Bonds, Ser. 214 | EUR | 4.00 | 4/27/20 | 1,050,000 | | 1,499,835 |
| Slovakian Government, | | | | | | |
| Sr. Unsub. Notes | EUR | 4.00 | 3/26/21 | 9,220,000 | b | 13,286,614 |
| Slovakian Government, | | | | | | |
| Sr. Unscd. Notes | EUR | 4.38 | 1/21/15 | 6,380,000 | | 8,959,057 |
| | | | | | | 54,263,202 |
| Slovenia—.6% | | | | | | |
| Slovenian Government, | | | | | | |
| Sr. Unscd. Notes | | 5.50 | 10/26/22 | 10,400,000 | b,c | 10,540,400 |
STATEMENT OF INVESTMENTS (continued)
| | | | | | |
| | | Coupon | Maturity | Principal | | |
| Bonds and Notes (continued) | Rate (%) | Date | Amount ($)a | Value ($) |
| South Africa—1.4% | | | | | | |
| South African Government, | | | | | | |
| Sr. Unscd. Notes | | 4.67 | 1/17/24 | 3,625,000 | | 4,023,750 |
| South African Government, | | | | | | |
| Bonds, Ser. R213 | ZAR | 7.00 | 2/28/31 | 178,495,000 | | 18,097,563 |
| Transnet SOC, | | | | | | |
| Sr. Unscd. Notes | | 4.00 | 7/26/22 | 3,410,000 | c | 3,418,525 |
| | | | | | | 25,539,838 |
| South Korea—.5% | | | | | | |
| Export-Import Bank of Korea, | | | | | | |
| Sr. Unscd. Notes | EUR | 5.75 | 5/22/13 | 100,000 | | 133,360 |
| Korea Finance, | | | | | | |
| Sr. Unscd. Notes | | 2.25 | 8/7/17 | 9,560,000 | | 9,663,477 |
| | | | | | | 9,796,837 |
| Spain—5.9% | | | | | | |
| Banco Santander, | | | | | | |
| Covered Bonds | EUR | 4.63 | 1/20/16 | 10,500,000 | | 14,348,358 |
| BBVA Senior Finance, | | | | | | |
| Gtd. Notes | EUR | 4.38 | 9/21/15 | 7,100,000 | | 9,316,882 |
| BBVA US Senior, | | | | | | |
| Gtd. Notes | | 4.66 | 10/9/15 | 9,400,000 | | 9,499,367 |
| Iberdrola Finanzas, | | | | | | |
| Gtd. Notes | EUR | 3.50 | 10/13/16 | 8,000,000 | | 10,667,462 |
| Santander International Debt, | | | | | | |
| Bank Gtd. Notes | EUR | 4.00 | 3/27/17 | 10,200,000 | b | 13,177,159 |
| Spanish Government, | | | | | | |
| Bonds | EUR | 3.40 | 4/30/14 | 28,580,000 | | 37,475,243 |
| Telefonica Emisiones, | | | | | | |
| Gtd. Notes | GBP | 5.38 | 2/2/18 | 8,000,000 | b | 13,406,207 |
| | | | | | | 107,890,678 |
| Supranational—.6% | | | | | | |
| Asian Development Bank, | | | | | | |
| Sr. Unscd. Notes | CNY | 2.85 | 10/21/20 | 25,000,000 | | 3,973,361 |
| Corporacion Andina de Fomento, | | | | | | |
| Sr. Unscd. Notes | | 3.75 | 1/15/16 | 3,835,000 | | 4,046,784 |
| Eurasian Development Bank, | | | | | | |
| Covered Notes | | 4.77 | 9/20/22 | 3,310,000 | b,c | 3,393,578 |
| European Investment Bank, | | | | | | |
| Sr. Unscd. Bonds | JPY | 1.40 | 6/20/17 | 38,600,000 | | 508,552 |
| | | | | | | 11,922,275 |
16
| | | | | | |
| | | Coupon | Maturity | Principal | | |
| Bonds and Notes (continued) | Rate (%) | Date | Amount ($)a | Value ($) |
| Sweden—1.6% | | | | | | |
| Stadshypotek, | | | | | | |
| Covered Bonds | EUR | 3.00 | 10/1/14 | 3,675,000 | | 5,001,162 |
| Swedish Government, | | | | | | |
| Bonds, Ser. 1052 | SEK | 4.25 | 3/12/19 | 57,170,000 | | 10,234,196 |
| Swedish Government, | | | | | | |
| Bonds, Ser. 1050 | SEK | 3.00 | 7/12/16 | 84,850,000 | | 13,757,587 |
| | | | | | | 28,992,945 |
| Switzerland—1.0% | | | | | | |
| Credit Suisse, | | | | | | |
| Covered Bonds | | 2.60 | 5/27/16 | 5,135,000 | c | 5,405,091 |
| Credit Suisse, | | | | | | |
| Covered Notes | EUR | 2.13 | 1/18/17 | 5,600,000 | | 7,650,752 |
| Holcim US Finance | | | | | | |
| Sarl & Cie, | | | | | | |
| Gtd. Notes | | 6.00 | 12/30/19 | 4,145,000 | c | 4,653,003 |
| | | | | | | 17,708,846 |
| Thailand—.2% | | | | | | |
| Bangkok Bank, | | | | | | |
| Sr. Unscd. Notes | | 2.75 | 3/27/18 | 3,845,000 | c | 3,880,489 |
| Turkey—1.0% | | | | | | |
| Turkish Government, | | | | | | |
| Bonds, Ser. CPI | TRY | 3.00 | 2/23/22 | 27,590,000 | f | 17,412,359 |
| United Kingdom—11.5% | | | | | | |
| Abbey National Treasury | | | | | | |
| Services, Covered Bonds | EUR | 3.63 | 9/8/17 | 5,400,000 | | 7,659,766 |
| ArcelorMittal, | | | | | | |
| Sr. Unscd. Notes | | 6.75 | 2/25/22 | 3,740,000 | b,d | 3,680,489 |
| ArcelorMittal, | | | | | | |
| Sr. Unscd. Notes | EUR | 4.63 | 11/17/17 | 1,685,000 | b,d | 2,290,156 |
| Barclays Bank, | | | | | | |
| Covered Notes | EUR | 2.13 | 9/8/15 | 5,505,000 | | 7,355,888 |
| BP Capital Markets, | | | | | | |
| Gtd. Notes | | 2.25 | 11/1/16 | 1,655,000 | | 1,730,931 |
| GlaxoSmithKline Capital, | | | | | | |
| Gtd. Notes | | 0.75 | 5/8/15 | 7,535,000 | | 7,573,428 |
| Gracechurch Card Funding, | | | | | | |
| Ser. 2012-1A, Cl. A2 | EUR | 0.91 | 2/15/17 | 4,785,000 | c,d | 6,259,970 |
| Ineos Finance, | | | | | | |
| Sr. Scd. Notes | | 7.50 | 5/1/20 | 2,435,000 | c | 2,477,613 |
STATEMENT OF INVESTMENTS (continued)
| | | | | | |
| | | Coupon | Maturity | Principal | | |
| Bonds and Notes (continued) | Rate (%) | Date | Amount ($)a | Value ($) |
| United Kingdom (continued) | | | | | | |
| Ineos Finance, | | | | | | |
| Sr. Scd. Bonds | | 8.38 | 2/15/19 | 680,000 | c | 716,550 |
| Lloyds TSB Bank, | | | | | | |
| Covered Notes | EUR | 3.38 | 3/17/16 | 4,500,000 | | 6,210,988 |
| Lloyds TSB Bank, | | | | | | |
| Covered Bonds | EUR | 4.00 | 9/29/21 | 1,500,000 | | 2,243,744 |
| National Grid, | | | | | | |
| Sr. Unscd. Notes | EUR | 5.00 | 7/2/18 | 1,315,000 | | 2,016,698 |
| Nationwide Building Society, | �� | | | | | |
| Covered Notes | EUR | 2.88 | 9/14/15 | 5,405,000 | | 7,454,300 |
| Paragon Mortgages, | | | | | | |
| Ser. 14A, Cl. A2C | | 0.59 | 9/15/39 | 8,310,287 | c,d | 7,207,761 |
| Royal Bank of Scotland, | | | | | | |
| Covered Notes | EUR | 3.00 | 9/8/16 | 1,745,000 | | 2,409,313 |
| Royal Bank of Scotland, | | | | | | |
| Covered Notes | EUR | 3.88 | 10/19/21 | 6,350,000 | | 9,402,571 |
| Royal Bank of Scotland, | | | | | | |
| Sr. Unscd. Notes | EUR | 4.75 | 5/18/16 | 2,250,000 | | 3,245,416 |
| Royal Bank of Scotland, | | | | | | |
| Sub. Notes | | 9.50 | 3/16/22 | 3,660,000 | d | 4,205,091 |
| United Kingdom Gilt, | | | | | | |
| Bonds | GBP | 3.75 | 9/7/21 | 29,080,000 | | 55,173,911 |
| United Kingdom Gilt, | | | | | | |
| Bonds | GBP | 4.25 | 9/7/39 | 22,590,000 | | 44,453,454 |
| United Kingdom Gilt, | | | | | | |
| Bonds | GBP | 4.25 | 12/7/40 | 8,440,000 | | 16,685,068 |
| United Kingdom Gilt, | | | | | | |
| Bonds | GBP | 5.00 | 3/7/18 | 4,575,000 | | 8,967,508 |
| | | | | | | 209,420,614 |
| United States—9.2% | | | | | | |
| Ally Auto Receivables Trust, | | | | | | |
| Ser. 2010-1, Cl. A3 | | 1.45 | 5/15/14 | 263,261 | | 263,789 |
| Ally Financial, | | | | | | |
| Gtd. Notes | | 4.50 | 2/11/14 | 990,000 | | 1,022,175 |
| Ally Financial, | | | | | | |
| Gtd. Notes | | 5.50 | 2/15/17 | 5,440,000 | | 5,761,950 |
| Ally Master Owner Trust, | | | | | | |
| Ser. 2011-5, Cl. A | | 0.86 | 6/15/15 | 5,965,000 | d | 5,977,192 |
| American International Group, | | | | | | |
| Sr. Unscd. Notes | | 4.88 | 6/1/22 | 3,755,000 | | 4,243,195 |
18
| | | | | | |
| | | Coupon | Maturity | Principal | | |
| Bonds and Notes (continued) | Rate (%) | Date | Amount ($)a | Value ($) |
| United States (continued) | | | | | | |
| Anadarko Petroleum, | | | | | | |
| Sr. Unscd. Notes | | 6.38 | 9/15/17 | 1,390,000 | | 1,686,851 |
| Bank of America, | | | | | | |
| Sr. Unscd. Notes | | 3.88 | 3/22/17 | 6,925,000 | | 7,475,939 |
| BMW US Capital, | | | | | | |
| Gtd. Notes | EUR | 5.00 | 5/28/15 | 355,000 | | 509,580 |
| Chrysler Financial Auto | | | | | | |
| Securitization Trust, | | | | | | |
| Ser. 2010-A, Cl. D | | 3.52 | 8/8/16 | 2,900,000 | | 2,917,116 |
| CIT Group, | | | | | | |
| Sr. Unscd. Notes | | 4.25 | 8/15/17 | 2,980,000 | | 3,071,248 |
| CIT Group, | | | | | | |
| Sr. Unscd. Notes | | 5.00 | 5/15/17 | 3,625,000 | | 3,838,150 |
| Citigroup, | | | | | | |
| Sr. Unscd. Notes | | 2.65 | 3/2/15 | 7,140,000 | | 7,365,795 |
| Citigroup, | | | | | | |
| Sr. Unscd. Notes | | 4.50 | 1/14/22 | 5,275,000 | | 5,834,398 |
| Comcast, | | | | | | |
| Gtd. Notes | | 5.90 | 3/15/16 | 950,000 | | 1,105,183 |
| Davita, | | | | | | |
| Gtd. Notes | | 5.75 | 8/15/22 | 765,000 | | 803,250 |
| Energy Transfer Partners, | | | | | | |
| Sr. Unscd. Notes | | 8.50 | 4/15/14 | 181,000 | | 199,062 |
| Express Scripts Holding | | | | | | |
| Gtd. Notes | | 2.10 | 2/12/15 | 3,655,000 | c | 3,740,403 |
| Ford Motor Credit, | | | | | | |
| Sr. Unscd. Notes | | 3.00 | 6/12/17 | 3,410,000 | | 3,491,117 |
| Ford Motor Credit, | | | | | | |
| Sr. Unscd. Notes | | 3.88 | 1/15/15 | 4,675,000 | | 4,876,025 |
| General Electric Capital, | | | | | | |
| Sub. Notes | | 5.30 | 2/11/21 | 1,950,000 | | 2,272,856 |
| Goldman Sachs Group, | | | | | | |
| Sr. Unscd. Notes | | 5.75 | 1/24/22 | 4,800,000 | | 5,582,405 |
| Hyundai Capital America, | | | | | | |
| Gtd. Notes | | 4.00 | 6/8/17 | 3,100,000 | c | 3,354,662 |
| JP Morgan Chase Commercial | | | | | | |
| Mortgage Securities, | | | | | | |
| Ser. 2007-CB20, Cl. AM | | 5.88 | 2/12/51 | 3,640,000 | d | 4,190,548 |
| JPMorgan Chase Bank, | | | | | | |
| Sr. Unscd. Notes | | 4.35 | 8/15/21 | 3,170,000 | | 3,549,661 |
STATEMENT OF INVESTMENTS (continued)
| | | | | | |
| | | Coupon | Maturity | Principal | | |
| Bonds and Notes (continued) | Rate (%) | Date | Amount ($)a | Value ($) |
| United States (continued) | | | | | | |
| JPMorgan Chase Bank, | | | | | | |
| Sub. Notes | EUR | 4.38 | 11/30/21 | 2,900,000 | d | 3,761,798 |
| Lamar Media, | | | | | | |
| Gtd. Notes | | 5.88 | 2/1/22 | 2,325,000 | | 2,476,125 |
| Levi Strauss & Co., | | | | | | |
| Sr. Unscd. Notes | EUR | 7.75 | 5/15/18 | 745,000 | | 1,033,220 |
| LyondellBasell Industries, | | | | | | |
| Sr. Unscd. Notes | EUR | 5.00 | 4/15/19 | 3,225,000 | | 3,507,188 |
| Metropolitan Life | | | | | | |
| Global Funding I, | | | | | | |
| Sr. Scd. Notes | | 2.00 | 1/9/15 | 3,485,000 | c | 3,585,793 |
| MGM Resorts International, | | | | | | |
| Gtd. Notes | | 7.75 | 3/15/22 | 3,570,000 | | 3,708,338 |
| Morgan Stanley, | | | | | | |
| Sr. Unscd. Notes | | 5.50 | 7/24/20 | 4,005,000 | | 4,428,072 |
| NBCUniversal Media, | | | | | | |
| Sr. Unscd. Notes | | 4.38 | 4/1/21 | 655,000 | | 751,263 |
| Peabody Energy, | | | | | | |
| Gtd. Notes | | 6.00 | 11/15/18 | 3,305,000 | | 3,445,463 |
| Peabody Energy, | | | | | | |
| Gtd. Notes | | 6.25 | 11/15/21 | 1,570,000 | b | 1,628,875 |
| PepsiCo, | | | | | | |
| Sr. Unscd. Notes | | 0.80 | 8/25/14 | 3,900,000 | | 3,920,296 |
| Plains All American Pipeline, | | | | | | |
| Gtd. Notes | | 5.00 | 2/1/21 | 2,075,000 | | 2,462,239 |
| Prudential Financial, | | | | | | |
| Sr. Unscd. Notes | | 5.38 | 6/21/20 | 1,100,000 | | 1,291,560 |
| Puget Energy, | | | | | | |
| Sr. Scd. Notes | | 6.00 | 9/1/21 | 980,000 | | 1,103,093 |
| Santander Drive Auto | | | | | | |
| Receivables Trust, | | | | | | |
| Ser. 2010-1, Cl. A3 | | 1.84 | 11/17/14 | 2,005,620 | | 2,023,723 |
| Santander Drive Auto | | | | | | |
| Receivables Trust, | | | | | | |
| Ser. 2012-1, Cl. B | | 2.72 | 5/15/16 | 1,215,000 | | 1,244,715 |
| Sempra Energy, | | | | | | |
| Sr. Unscd. Notes | | 1.15 | 3/15/14 | 4,065,000 | d | 4,088,114 |
| SLM, | | | | | | |
| Sr. Unscd. Notes | | 7.25 | 1/25/22 | 4,930,000 | | 5,459,975 |
| U.S. Treasury Notes | | 3.13 | 9/30/13 | 5,425,000 | | 5,569,527 |
| |
| |
| 20 | | | | | | |
| | | | | | | |
| | | Coupon | Maturity | Principal | | | |
| Bonds and Notes (continued) | Rate (%) | Date | Amount ($)a | | Value ($) |
| United States (continued) | | | | | | | |
| Unit, | | | | | | | |
| Gtd. Notes | | 6.63 | 5/15/21 | 3,955,000 | c | | 4,053,875 |
| UPCB Finance VI, | | | | | | | |
| Sr. Scd. Notes | | 6.88 | 1/15/22 | 3,175,000 | c | | 3,413,125 |
| Ventas Realty, | | | | | | | |
| Gtd. Notes | | 4.25 | 3/1/22 | 1,625,000 | | | 1,747,681 |
| Watson Pharmaceuticals, | | | | | | | |
| Sr. Unscd. Notes | | 3.25 | 10/1/22 | 2,100,000 | | | 2,168,506 |
| Wells Fargo & Co. | | | | | | | |
| Sr. Unscd. Notes | | 2.63 | 12/15/16 | 6,025,000 | | | 6,370,841 |
| WM Covered Bond Program, | | | | | | | |
| Covered Notes | EUR | 4.00 | 11/26/16 | 510,000 | | | 732,056 |
| WM Wrigley Jr., | | | | | | | |
| Sr. Scd. Notes | | 3.70 | 6/30/14 | 2,595,000 | c | | 2,695,177 |
| Xerox, | | | | | | | |
| Sr. Unscd. Notes | | 1.26 | 5/16/14 | 1,070,000 | d | | 1,069,088 |
| ZFS Finance (USA) Trust V, | | | | | | | |
| Jr. Sub. Cap. Secs | | 6.50 | 5/9/67 | 6,785,000 | c,d | | 7,276,913 |
| | | | | | | | 168,149,189 |
| Venezuela—.3% | | | | | | | |
| Petroleos de Venezuela, | | | | | | | |
| Gtd. Notes | | 8.50 | 11/2/17 | 7,100,000 | | | 6,390,000 |
| Zambia—.1% | | | | | | | |
| Zambian Government, | | | | | | | |
| Unscd. Bonds | | 5.38 | 9/20/22 | 1,400,000 | c | | 1,417,500 |
| Total Bonds And Notes | | | | | | | |
| (cost $1,649,416,693) | | | | | | | 1,724,367,459 |
| |
| Short-Term Investments—.7% | | | | | | |
| U.S. Treasury Bills; | | | | | | | |
| 0.12%, 2/7/13 | | | | | | | |
| (cost $13,610,410) | | | | 13,615,000 | g | 13,610,929 |
| |
| Other Investment—1.9% | | | | Shares | | | Value ($) |
| Registered Investment Company; | | | | | | |
| Dreyfus Institutional Preferred | | | | | | |
| Plus Money Market Fund | | | | | | | |
| (cost $33,702,859) | | | | 33,702,859 | h | 33,702,859 |
STATEMENT OF INVESTMENTS (continued)
| | | | |
| Investment of Cash Collateral | | | | |
| for Securities Loaned—2.9% | Shares | | Value ($) | |
| Registered Investment Company; | | | | |
| Dreyfus Institutional Cash Advantage Fund | | | | |
| (cost $53,135,242) | 53,135,242 | h | 53,135,242 | |
| Total Investments (cost $1,749,865,204) | 100.4 | % | 1,824,816,489 | |
| Liabilities, Less Cash and Receivables | (.4 | %) | (7,797,260 | ) |
| Net Assets | 100.0 | % | 1,817,019,229 | |
|
| a Principal amount stated in U.S. Dollars unless otherwise noted. |
| AUD—Australian Dollar |
| BRL—Brazilian Real |
| CAD—Canadian Dollar |
| CLP—Chilean Peso |
| CNY—ChineseYuan Renminbi |
| EUR—Euro |
| GBP—British Pound |
| JPY—JapaneseYen |
| MYR—Malaysian Ringgit |
| MXN—Mexican New Peso |
| NOK—Norwegian Krone |
| PEN—Peruvian Nuevo Sol |
| PHP—Philippine Peso |
| SEK—Swedish Krona |
| TRY—Turkish Lira |
| ZAR—South African Rand |
| b Security, or portion thereof, on loan.At October 31, 2012, the value of the fund’s securities on loan was |
| $50,786,691 and the value of the collateral held by the fund was $53,135,242. |
| c Securities exempt from registration pursuant to Rule 144A under the Securities Act of 1933.These securities may be |
| resold in transactions exempt from registration, normally to qualified institutional buyers.At October 31, 2012, these |
| securities were valued at $298,342,567 or 16.4% of net assets. |
| d Variable rate security—interest rate subject to periodic change. |
| e Principal amount for accrual purposes is periodically adjusted based on changes in the Japanese Consumer Price Index. |
| f Principal amount for accrual purposes is periodically adjusted based on changes in the Turkish Consumer Price Index. |
| g Held by or on behalf of a counterparty for open financial futures positions. |
| h Investment in affiliated money market mutual fund. |
| | | |
| Portfolio Summary (Unaudited)† | | |
| |
| | Value (%) | | Value (%) |
| Non-U.S. Government | 58.9 | Cash & Equivalents | 4.8 |
| Securitized | 10.7 | U.S. Government | 1.0 |
| Corporate-Investment Grade | 19.8 | | |
| Corporate-High Yield | 5.2 | | 100.4 |
| |
| † Based on net assets. | | | |
| See notes to financial statements. | | | |
22
|
| STATEMENT OF FINANCIAL FUTURES |
| October 31, 2012 |
| | | | | | |
| | | | | | Unrealized | |
| | | Market Value | | | Appreciation | |
| | | Covered by | | | (Depreciation) | |
| | Contracts | Contracts ($) | | Expiration | at 10/31/2012 | ($) |
| Financial Futures Long | | | | | | |
| Canadian 10 Year Bond | 176 | 24,154,513 | | December 2012 | 228,293 | |
| Euro-Bond | 13 | 2,387,287 | | December 2012 | 21,592 | |
| Japanese 10 Year Bond | 133 | 240,326,318 | | December 2012 | 482,712 | |
| Long Gilt | 48 | 9,228,654 | | December 2012 | (128,099 | ) |
| Financial Futures Short | | | | | | |
| Euro-Bobl | 385 | (62,791,048 | ) | December 2012 | (437,139 | ) |
| Euro-Schatz | 79 | (11,336,180 | ) | December 2012 | (4,685 | ) |
| U.S. Treasury 5 Year Notes | 196 | (24,353,000 | ) | December 2012 | 64,953 | |
| U.S. Treasury 10 Year Notes | 1,577 | (209,790,281 | ) | December 2012 | 584,615 | |
| U.S. Treasury 30 Year Bonds | 90 | (13,438,125 | ) | December 2012 | 173,492 | |
| U.S. Treasury Ultra 30 Year Bonds | 119 | (19,646,156 | ) | December 2012 | (805,097 | ) |
| Gross Unrealized Appreciation | | | | | 1,555,657 | |
| Gross Unrealized Depreciation | | | | | (1,375,020 | ) |
| |
| See notes to financial statements. | | | | | | |
|
| STATEMENT OF ASSETS AND LIABILITIES |
| October 31, 2012 |
| | | |
| | | Cost | Value |
| Assets ($): | | | |
| Investments in securities—See Statement of Investments (including | | |
| securities on loan, valued at $50,786,691)—Note 1(c): | | |
| Unaffiliated issuers | | 1,663,027,103 | 1,737,978,388 |
| Affiliated issuers | | 86,838,101 | 86,838,101 |
| Cash | | | 1,167,033 |
| Cash denominated in foreign currencies | | 30,944,927 | 30,836,498 |
| Dividends, interest and securities lending income receivable | | 20,241,474 |
| Receivable for shares of Beneficial Interest subscribed | | 4,912,380 |
| Unrealized appreciation on swap contracts—Note 4 | | | 3,247,792 |
| Unrealized appreciation on forward foreign | | | |
| currency exchange contracts—Note 4 | | | 1,321,205 |
| Receivable for investment securities sold | | | 131,630 |
| Prepaid expenses | | | 97,794 |
| | | | 1,886,772,295 |
| Liabilities ($): | | | |
| Due to The Dreyfus Corporation and affiliates—Note 3(c) | | 1,338,835 |
| Liability for securities on loan—Note 1(c) | | | 53,135,242 |
| Payable for investment securities purchased | | | 7,072,377 |
| Unrealized depreciation on swap contracts—Note 4 | | | 3,252,794 |
| Payable for shares of Beneficial Interest redeemed | | | 2,310,285 |
| Unrealized depreciation on forward foreign | | | |
| currency exchange contracts—Note 4 | | | 1,236,918 |
| Payable for futures variation margin—Note 4 | | | 1,032,402 |
| Accrued expenses | | | 374,213 |
| | | | 69,753,066 |
| Net Assets ($) | | | 1,817,019,229 |
| Composition of Net Assets ($): | | | |
| Paid-in capital | | | 1,708,484,596 |
| Accumulated undistributed investment income—net | | | 11,107,080 |
| Accumulated net realized gain (loss) on investments | | 22,147,676 |
| Accumulated net unrealized appreciation (depreciation) on investments, | |
| swap transactions and foreign currency transactions (including | | |
| $180,637 net unrealized appreciation on financial futures) | | 75,279,877 |
| Net Assets ($) | | | 1,817,019,229 |
| |
| |
| |
| Net Asset Value Per Share | | | |
| | Class A | Class C | Class I |
| Net Assets ($) | 683,386,670 | 198,824,005 | 934,808,554 |
| Shares Outstanding | 39,104,959 | 11,621,167 | 53,177,985 |
| Net Asset Value Per Share ($) | 17.48 | 17.11 | 17.58 |
| |
| See notes to financial statements. | | | |
24
|
| STATEMENT OF OPERATIONS |
| Year Ended October 31, 2012 |
| | |
| Investment Income ($): | | |
| Income: | | |
| Interest | 46,403,358 | |
| Income from securities lending—Note 1(c) | 73,711 | |
| Dividends; | | |
| Affiliated issuers | 37,542 | |
| Total Income | 46,514,611 | |
| Expenses: | | |
| Management fee—Note 3(a) | 9,098,677 | |
| Shareholder servicing costs—Note 3(c) | 3,805,371 | |
| Distribution fees—Note 3(b) | 1,351,014 | |
| Custodian fees—Note 3(c) | 265,244 | |
| Professional fees | 173,698 | |
| Registration fees | 168,532 | |
| Prospectus and shareholders’ reports | 153,469 | |
| Trustees’ fees and expenses—Note 3(d) | 124,565 | |
| Loan commitment fees—Note 2 | 16,344 | |
| Interest expense—Note 2 | 1,864 | |
| Miscellaneous | 73,547 | |
| Total Expenses | 15,232,325 | |
| Less—reduction in fees due to earnings credits—Note 3(c) | (1,025 | ) |
| Net Expenses | 15,231,300 | |
| Investment Income—Net | 31,283,311 | |
| Realized and Unrealized Gain (Loss) on Investments—Note 4 ($): | | |
| Net realized gain (loss) on investments and foreign currency transactions | 32,369,205 | |
| Net realized gain (loss) on financial futures | (11,258,457 | ) |
| Net realized gain (loss) on swap transactions | (1,927,895 | ) |
| Net realized gain (loss) on forward foreign currency exchange contracts | 7,039,918 | |
| Net Realized Gain (Loss) | 26,222,771 | |
| Net unrealized appreciation (depreciation) on | | |
| investments and foreign currency transactions | 36,378,742 | |
| Net unrealized appreciation (depreciation) on financial futures | 929,444 | |
| Net unrealized appreciation (depreciation) on swap transactions | 2,588,284 | |
| Net unrealized appreciation (depreciation) on | | |
| forward foreign currency exchange contracts | 835,858 | |
| Net Unrealized Appreciation (Depreciation) | 40,732,328 | |
| Net Realized and Unrealized Gain (Loss) on Investments | 66,955,099 | |
| Net Increase in Net Assets Resulting from Operations | 98,238,410 | |
| |
| See notes to financial statements. | | |
STATEMENT OF CHANGES IN NET ASSETS
| | | | |
| | Year Ended October 31, | |
| | 2012 | | 2011 | |
| Operations ($): | | | | |
| Investment income—net | 31,283,311 | | 22,393,206 | |
| Net realized gain (loss) on investments | 26,222,771 | | 3,467,898 | |
| Net unrealized appreciation | | | | |
| (depreciation) on investments | 40,732,328 | | (14,065,062 | ) |
| Net Increase (Decrease) in Net Assets | | | | |
| Resulting from Operations | 98,238,410 | | 11,796,042 | |
| Dividends to Shareholders from ($): | | | | |
| Investment income—net: | | | | |
| Class A Shares | (7,018,864 | ) | (10,380,770 | ) |
| Class C Shares | (1,153,370 | ) | (2,083,054 | ) |
| Class I Shares | (9,302,141 | ) | (9,688,092 | ) |
| Net realized gain on investments: | | | | |
| Class A Shares | (6,735,315 | ) | (12,712,629 | ) |
| Class C Shares | (1,728,665 | ) | (3,488,325 | ) |
| Class I Shares | (5,313,094 | ) | (11,040,236 | ) |
| Total Dividends | (31,251,449 | ) | (49,393,106 | ) |
| Beneficial Interest Transactions ($): | | | | |
| Net proceeds from shares sold: | | | | |
| Class A Shares | 380,634,828 | | 440,292,262 | |
| Class C Shares | 79,126,186 | | 83,281,883 | |
| Class I Shares | 679,943,739 | | 270,572,264 | |
| Dividends reinvested: | | | | |
| Class A Shares | 12,959,753 | | 21,646,623 | |
| Class C Shares | 2,004,247 | | 3,791,154 | |
| Class I Shares | 9,721,577 | | 14,967,080 | |
| Cost of shares redeemed: | | | | |
| Class A Shares | (346,751,696 | ) | (206,524,904 | ) |
| Class C Shares | (46,725,916 | ) | (28,437,345 | ) |
| Class I Shares | (258,772,277 | ) | (131,071,188 | ) |
| Increase (Decrease) in Net Assets from | | | | |
| Beneficial Interest Transactions | 512,140,441 | | 468,517,829 | |
| Total Increase (Decrease) in Net Assets | 579,127,402 | | 430,920,765 | |
| Net Assets ($): | | | | |
| Beginning of Period | 1,237,891,827 | | 806,971,062 | |
| End of Period | 1,817,019,229 | | 1,237,891,827 | |
| Undistributed (distributions in excess of) | | | | |
| investment income—net | 11,107,080 | | (4,349,942 | ) |
26
| | | | |
| | Year Ended October 31, | |
| | 2012 | | 2011 | |
| Capital Share Transactions: | | | | |
| Class A | | | | |
| Shares sold | 22,762,243 | | 26,095,441 | |
| Shares issued for dividends reinvested | 787,986 | | 1,322,774 | |
| Shares redeemed | (20,780,098 | ) | (12,335,187 | ) |
| Net Increase (Decrease) in Shares Outstanding | 2,770,131 | | 15,083,028 | |
| Class C | | | | |
| Shares sold | 4,828,610 | | 5,015,149 | |
| Shares issued for dividends reinvested | 124,605 | | 236,532 | |
| Shares redeemed | (2,846,777 | ) | (1,735,681 | ) |
| Net Increase (Decrease) in Shares Outstanding | 2,106,438 | | 3,516,000 | |
| Class I | | | | |
| Shares sold | 40,368,812 | | 15,963,032 | |
| Shares issued for dividends reinvested | 585,476 | | 911,815 | |
| Shares redeemed | (15,422,732 | ) | (7,800,887 | ) |
| Net Increase (Decrease) in Shares Outstanding | 25,531,556 | | 9,073,960 | |
| |
| See notes to financial statements. | | | | |
FINANCIAL HIGHLIGHTS
The following tables describe the performance for each share class for the fiscal periods indicated.All information (except portfolio turnover rate) reflects financial results for a single fund share.Total return shows how much your investment in the fund would have increased (or decreased) during each period, assuming you had reinvested all dividends and distributions.These figures have been derived from the fund’s financial statements.
| | | | | | | | | | |
| | | | Year Ended October 31, | | | |
| Class A Shares | 2012 | | 2011 | | 2010 | | 2009 | | 2008 | |
| Per Share Data ($): | | | | | | | | | | |
| Net asset value, beginning of period | 16.85 | | 17.62 | | 16.25 | | 13.20 | | 13.77 | |
| Investment Operations: | | | | | | | | | | |
| Investment income—neta | .34 | | .40 | | .50 | | .46 | | .45 | |
| Net realized and unrealized | | | | | | | | | | |
| gain (loss) on investments | .65 | | (.17 | ) | 1.42 | | 3.30 | | (.28 | ) |
| Total from Investment Operations | .99 | | .23 | | 1.92 | | 3.76 | | .17 | |
| Distributions: | | | | | | | | | | |
| Dividends from investment income—net | (.19 | ) | (.43 | ) | (.35 | ) | (.71 | ) | (.39 | ) |
| Dividends from net realized | | | | | | | | | | |
| gain on investments | (.17 | ) | (.57 | ) | (.20 | ) | — | | (.35 | ) |
| Total Distributions | (.36 | ) | (1.00 | ) | (.55 | ) | (.71 | ) | (.74 | ) |
| Net asset value, end of period | 17.48 | | 16.85 | | 17.62 | | 16.25 | | 13.20 | |
| Total Return (%)b | 6.04 | | 1.65 | | 12.11 | | 29.42 | | 1.21 | |
| Ratios/Supplemental Data (%): | | | | | | | | | | |
| Ratio of total expenses | | | | | | | | | | |
| to average net assets | 1.02 | | 1.01 | | 1.09 | | 1.25 | | 1.47 | |
| Ratio of net expenses | | | | | | | | | | |
| to average net assets | 1.02 | | 1.01 | | 1.09 | | 1.08 | | 1.10 | |
| Ratio of net investment income | | | | | | | | | | |
| to average net assets | 2.02 | | 2.38 | | 3.06 | | 3.27 | | 3.22 | |
| Portfolio Turnover Rate | 192.50 | | 213.45 | | 153.71 | | 159.32c 168.59c | |
| Net Assets, end of period ($ x 1,000) | 683,387 | | 612,236 | | 374,363 | | 186,456 | | 37,076 | |
| |
| a | Based on average shares outstanding at each month end. |
| b | Exclusive of sales charge. |
| c | The portfolio turnover rates excluding mortgage dollar roll transactions for the periods ended October 31, 2009 and |
| | 2008, were 144.34% and 152.77%, respectively. |
| See notes to financial statements. |
28
| | | | | | | | | | |
| | | | Year Ended October 31, | | | |
| Class C Shares | 2012 | | 2011 | | 2010 | | 2009 | | 2008 | |
| Per Share Data ($): | | | | | | | | | | |
| Net asset value, beginning of period | 16.54 | | 17.32 | | 16.05 | | 13.08 | | 13.70 | |
| Investment Operations: | | | | | | | | | | |
| Investment income—neta | .21 | | .27 | | .37 | | .36 | | .34 | |
| Net realized and unrealized | | | | | | | | | | |
| gain (loss) on investments | .64 | | (.16 | ) | 1.39 | | 3.26 | | (.28 | ) |
| Total from Investment Operations | .85 | | .11 | | 1.76 | | 3.62 | | .06 | |
| Distributions: | | | | | | | | | | |
| Dividends from investment income—net | (.11 | ) | (.32 | ) | (.29 | ) | (.65 | ) | (.33 | ) |
| Dividends from net realized | | | | | | | | | | |
| gain on investments | (.17 | ) | (.57 | ) | (.20 | ) | — | | (.35 | ) |
| Total Distributions | (.28 | ) | (.89 | ) | (.49 | ) | (.65 | ) | (.68 | ) |
| Net asset value, end of period | 17.11 | | 16.54 | | 17.32 | | 16.05 | | 13.08 | |
| Total Return (%)b | 5.23 | | .89 | | 11.26 | | 28.50 | | .40 | |
| Ratios/Supplemental Data (%): | | | | | | | | | | |
| Ratio of total expenses | | | | | | | | | | |
| to average net assets | 1.76 | | 1.75 | | 1.84 | | 1.96 | | 2.28 | |
| Ratio of net expenses | | | | | | | | | | |
| to average net assets | 1.76 | | 1.75 | | 1.84 | | 1.82 | | 1.85 | |
| Ratio of net investment income | | | | | | | | | | |
| to average net assets | 1.31 | | 1.63 | | 2.31 | | 2.58 | | 2.45 | |
| Portfolio Turnover Rate | 192.50 | | 213.45 | | 153.71 | | 159.32c 168.59c | |
| Net Assets, end of period ($ x 1,000) | 198,824 | | 157,340 | | 103,906 | | 47,923 | | 7,500 | |
| |
| a | Based on average shares outstanding at each month end. |
| b | Exclusive of sales charge. |
| c | The portfolio turnover rates excluding mortgage dollar roll transactions for the periods ended October 31, 2009 and |
| | 2008, were 144.34% and 152.77%, respectively. |
| See notes to financial statements. |
FINANCIAL HIGHLIGHTS (continued)
| | | | | | | | | | |
| | | | Year Ended October 31, | | | |
| Class I Shares | 2012 | | 2011 | | 2010 | | 2009 | | 2008 | |
| Per Share Data ($): | | | | | | | | | | |
| Net asset value, beginning of period | 16.94 | | 17.70 | | 16.31 | | 13.23 | | 13.79 | |
| Investment Operations: | | | | | | | | | | |
| Investment income—neta | .39 | | .44 | | .54 | | .41 | | .48 | |
| Net realized and unrealized | | | | | | | | | | |
| gain (loss) on investments | .64 | | (.16 | ) | 1.42 | | 3.40 | | (.27 | ) |
| Total from Investment Operations | 1.03 | | .28 | | 1.96 | | 3.81 | | .21 | |
| Distributions: | | | | | | | | | | |
| Dividends from investment income—net | (.22 | ) | (.47 | ) | (.37 | ) | (.73 | ) | (.42 | ) |
| Dividends from net realized | | | | | | | | | | |
| gain on investments | (.17 | ) | (.57 | ) | (.20 | ) | — | | (.35 | ) |
| Total Distributions | (.39 | ) | (1.04 | ) | (.57 | ) | (.73 | ) | (.77 | ) |
| Net asset value, end of period | 17.58 | | 16.94 | | 17.70 | | 16.31 | | 13.23 | |
| Total Return (%) | 6.27 | | 1.87 | | 12.44 | | 29.79 | | 1.47 | |
| Ratios/Supplemental Data (%): | | | | | | | | | | |
| Ratio of total expenses | | | | | | | | | | |
| to average net assets | .80 | | .75 | | .82 | | .89 | | 1.22 | |
| Ratio of net expenses | | | | | | | | | | |
| to average net assets | .80 | | .75 | | .82 | | .83 | | .85 | |
| Ratio of net investment income | | | | | | | | | | |
| to average net assets | 2.29 | | 2.64 | | 3.30 | | 3.23 | | 3.49 | |
| Portfolio Turnover Rate | 192.50 | | 213.45 | | 153.71 | | 159.32b 168.59b | |
| Net Assets, end of period ($ x 1,000) | 934,809 | | 468,316 | | 328,703 | | 126,509 | | 4,080 | |
| |
| a | Based on average shares outstanding at each month end. |
| b | The portfolio turnover rates excluding mortgage dollar roll transactions for the periods ended October 31, 2009 and |
| | 2008, were 144.34% and 152.77%, respectively. |
| See notes to financial statements. |
30
NOTES TO FINANCIAL STATEMENTS
NOTE 1—Significant Accounting Policies:
Dreyfus International Bond Fund (the “fund”) is a separate non-diversified series of The Dreyfus/Laurel Funds Trust (the “Trust”), which is registered under the Investment Company Act of 1940, as amended (the “Act”), as an open-end management investment company and operates as a series company currently offering five series, including the fund. The fund’s investment objective seeks to maximize total return through capital appreciation and income. The Dreyfus Corporation (the “Manager” or “Dreyfus”), a wholly-owned subsidiary of The Bank of New York Mellon Corporation (”BNY Mellon”), serves as the fund’s investment adviser.
MBSC Securities Corporation (the “Distributor”), a wholly-owned subsidiary of the Manager, is the distributor of the fund’s shares.The fund is authorized to issue an unlimited number of $.001 par value shares of Beneficial Interest in each of the following classes of shares: Class A, Class C and Class I. Class A and Class C shares are sold primarily to retail investors through financial intermediaries and bear a Distribution Plan fee and/or Shareholder Services Plan fee. Class A shares are sold with a front-end sales charge, while Class C shares are subject to a contingent deferred sales charge (“CDSC”). Class I shares are sold primarily to bank trust departments and other financial service providers (including The Bank of New York Mellon, a subsidiary of BNY Mellon and an affiliate of Dreyfus, and its affiliates), acting on behalf of customers having a qualified trust or investment account or relationship at such institution, and bear no Distribution Plan or Shareholder Services Plan fees. Class I shares are offered without a front-end sales charge or CDSC. Other differences between the classes include the services offered to and the expenses borne by each class,
NOTES TO FINANCIAL STATEMENTS (continued)
the allocation of certain transfer agency costs and certain voting rights. Income, expenses (other than expenses attributable to a specific class), and realized and unrealized gains or losses on investments are allocated to each class of shares based on its relative net assets.
The Trust accounts separately for the assets, liabilities and operations of each series. Expenses directly attributable to each series are charged to that series’ operations; expenses which are applicable to all series are allocated among them on a pro rata basis.
The Financial Accounting Standards Board (“FASB”) Accounting Standards Codification is the exclusive reference of authoritative U.S. generally accepted accounting principles (“GAAP”) recognized by the FASB to be applied by nongovernmental entities. Rules and interpretive releases of the Securities and Exchange Commission (“SEC”) under authority of federal laws are also sources of authoritative GAAP for SEC registrants. The fund’s financial statements are prepared in accordance with GAAP, which may require the use of management estimates and assumptions.Actual results could differ from those estimates.
(a) Portfolio valuation: The fair value of a financial instrument is the amount that would be received to sell an asset or paid to transfer a liability in an orderly transaction between market participants at the measurement date (i.e., the exit price). GAAP establishes a fair value hierarchy that prioritizes the inputs of valuation techniques used to measure fair value.This hierarchy gives the highest priority to unadjusted quoted prices in active markets for identical assets or liabilities (Level 1 measurements) and the lowest priority to unobservable inputs (Level 3 measurements).
Additionally, GAAP provides guidance on determining whether the volume and activity in a market has decreased significantly and whether such a decrease in activity results in transactions that are not orderly. GAAP requires enhanced disclosures around valuation inputs and techniques used during annual and interim periods.
32
Various inputs are used in determining the value of the fund’s investments relating to fair value measurements.These inputs are summarized in the three broad levels listed below:
Level 1—unadjusted quoted prices in active markets for identical investments.
Level 2—other significant observable inputs (including quoted prices for similar investments, interest rates, prepayment speeds, credit risk, etc.).
Level 3—significant unobservable inputs (including the fund’s own assumptions in determining the fair value of investments).
The inputs or methodology used for valuing securities are not necessarily an indication of the risk associated with investing in those securities.
Changes in valuation techniques may result in transfers in or out of an assigned level within the disclosure hierarchy. Valuation techniques used to value the fund’s investments are as follows:
Registered investment companies that are not traded on an exchange are valued at their net asset value and are categorized within Level 1 of the fair value hierarchy.
Investments in securities excluding short-term investments (other than U.S.Treasury Bills), financial futures, swaps and forward foreign currency exchange contracts (“forward contracts”) are valued each business day by an independent pricing service (the “Service”) approved by the Trust’s Board of Trustees (the “Board”). Investments for which quoted bid prices are readily available and are representative of the bid side of the market in the judgment of the Service are valued at the mean between the quoted bid prices (as obtained by the Service from dealers in such securities) and asked prices (as calculated by the Service based upon its evaluation of the market for such securities). Other investments (which constitute a majority of the portfolio securities) are valued as determined by the Service, based on methods which include consideration of the
NOTES TO FINANCIAL STATEMENTS (continued)
following: yields or prices of securities of comparable quality, coupon, maturity and type; indications as to values from dealers; and general market conditions. These securities are generally categorized within Level 2 of the fair value hierarchy.
U.S. Treasury Bills are valued at the mean price between quoted bid prices and asked prices by the Service. These securities are generally categorized within Level 2 of the fair value hierarchy.
The Service’s procedures are reviewed by Dreyfus under the general supervision of the Board.
When market quotations or official closing prices are not readily available, or are determined not to reflect accurately fair value, such as when the value of a security has been significantly affected by events after the close of the exchange or market on which the security is principally traded (for example, a foreign exchange or market), but before the fund calculates its net asset value, the fund may value these investments at fair value as determined in accordance with the procedures approved by the Board. Certain factors may be considered when fair valuing investments such as: fundamental analytical data, the nature and duration of restrictions on disposition, an evaluation of the forces that influence the market in which the securities are purchased and sold, and public trading in similar securities of the issuer or comparable issuers.These securities are either categorized as Level 2 or 3 depending on the relevant inputs used.
For restricted securities where observable inputs are limited, assumptions about market activity and risk are used and are categorized within Level 3 of the fair value hierarchy.
Investments denominated in foreign currencies are translated to U.S. dollars at the prevailing rates of exchange.
Financial futures, which are traded on an exchange, are valued at the last sales price on the securities exchange on which such securities are primarily traded or at the last sales price on the national securities market on each business day.These securities are generally categorized within Level 1 of the fair value hierarchy. Investments in swap transactions are valued each business day by the Service using a swap pricing
34
model which incorporates among other factors, default probabilities, recovery rates, credit curves of the underlying issuer and swap spreads on interest rates. These securities are generally categorized within Level 2 of the fair value hierarchy. Forward contracts are valued at the forward rate.These securities are generally categorized within Level 2 of the fair value hierarchy.
The following is a summary of the inputs used as of October 31, 2012 in valuing the fund’s investments:
| | | | | | | | |
| | | | | Level 2—Other | | Level 3— | | |
| | | Level 1— | | Significant | | Significant | | |
| | | Unadjusted | | Observable | | Unobservable | | |
| | | Quoted Prices | | Inputs | | Inputs | Total | |
| Assets ($) | | | | | | | |
| Investments in Securities: | | | | | | |
| Asset-Backed | — | | 91,880,276 | | — | 91,880,276 | |
| Commercial | | | | | | | |
| | Mortgage-Backed | — | | 4,190,548 | | — | 4,190,548 | |
| Corporate Bonds† | — | | 572,901,458 | | — | 572,901,458 | |
| Foreign Government | — | | 1,042,617,889 | | — | 1,042,617,889 | |
| Mutual Funds | 86,838,101 | | — | | — | 86,838,101 | |
| Residential | | | | | | | |
| | Mortgage-Backed | — | | 7,207,761 | | — | 7,207,761 | |
| U.S. Treasury | — | | 19,180,456 | | — | 19,180,456 | |
| Other Financial | | | | | | | |
| | Instruments: | | | | | | | |
| Forward Foreign | | | | | | | |
| | Currency Exchange | | | | | | |
| | Contracts†† | — | | 1,321,205 | | — | 1,321,205 | |
| Financial Futures†† | 1,555,657 | | — | | — | 1,555,657 | |
| Swaps†† | — | | 3,247,792 | | — | 3,247,792 | |
| Liabilities ($) | | | | | | | |
| Other Financial | | | | | | | |
| | Instruments: | | | | | | | |
| Forward Foreign | | | | | | | |
| | Currency Exchange | | | | | | |
| | Contracts†† | — | | (1,236,918 | ) | — | (1,236,918 | ) |
| Financial Futures†† | (1,375,020 | ) | — | | — | (1,375,020 | ) |
| Swaps†† | — | | (3,252,794 | ) | — | (3,252,794 | ) |
| † | See Statement of Investments for additional detailed categorizations. | | |
| †† | Amount shown represents unrealized appreciation (depreciation) at period end. | |
NOTES TO FINANCIAL STATEMENTS (continued)
At October 31, 2012, there were no transfers between Level 1 and Level 2 of the fair value hierarchy.
(b) Foreign currency transactions: The fund does not isolate that portion of the results of operations resulting from changes in foreign exchange rates on investments from the fluctuations arising from changes in the market prices of securities held. Such fluctuations are included with the net realized and unrealized gain or loss on investments.
Net realized foreign exchange gains or losses arise from sales of foreign currencies, currency gains or losses realized on securities transactions between trade and settlement date, and the difference between the amounts of dividends, interest and foreign withholding taxes recorded on the fund’s books and the U.S. dollar equivalent of the amounts actually received or paid. Net unrealized foreign exchange gains and losses arise from changes in the value of assets and liabilities other than investments resulting from changes in exchange rates. Foreign currency gains and losses on investments are also included with net realized and unrealized gain or loss on investments.
(c) Securities transactions and investment income: Securities transactions are recorded on a trade date basis. Realized gains and losses from securities transactions are recorded on the identified cost basis. Dividend income is recognized on the ex-dividend date and interest income, including, where applicable, accretion of discount and amortization of premium on investments, is recognized on the accrual basis.
Pursuant to a securities lending agreement withThe Bank of NewYork Mellon, the fund may lend securities to qualified institutions. It is the fund’s policy that, at origination, all loans are secured by collateral of at least 102% of the value of U.S. securities loaned and 105% of the value of foreign securities loaned. Collateral equivalent to at least 100% of the market value of securities on loan is maintained at all times. Collateral is either in the form of cash, which can be invested in certain money market mutual funds managed by the Manager, U.S. Government and Agency securities or letters of credit.The fund is entitled to receive all
36
income on securities loaned, in addition to income earned as a result of the lending transaction.Although each security loaned is fully collateralized, the fund bears the risk of delay in recovery of, or loss of rights in, the securities loaned should a borrower fail to return the securities in a timely manner. During the period ended October 31, 2012,The Bank of New York Mellon earned $39,691 from lending portfolio securities, pursuant to the securities lending agreement.
(d) Affiliated issuers: Investments in other investment companies advised by Dreyfus are defined as “affiliated” in the Act. Investments in affiliated investment companies for the period ended October 31, 2012 were as follows:
| | | | | | |
| Affiliated | | | | | | |
| Investment | Value | | | Value | | Net |
| Company | 10/31/2011 | ($) Purchases ($) | Sales ($) | 10/31/2012 | ($) | Assets (%) |
| Dreyfus | | | | | | |
| Institutional | | | | | | |
| Preferred | | | | | | |
| Plus Money | | | | | | |
| Market | | | | | | |
| Fund | 42,476,691 1,001,136,406 | | 1,009,910,238 | 33,702,859 | | 1.9 |
| Dreyfus | | | | | | |
| Institutional | | | | | | |
| Cash | | | | | | |
| Advantage | | | | | | |
| Fund | 14,433,650 238,651,552 | | 199,949,960 | 53,135,242 | | 2.9 |
| Total | 56,910,341 1,239,787,958 | | 1,209,860,198 | 86,838,101 | | 4.8 |
(e) Risk: The fund invests primarily in debt securities. Failure of an issuer of the debt securities to make timely interest or principal payments, or a decline or the perception of a decline in the credit quality of a debt security, can cause the debt security’s price to fall, potentially lowering the fund’s share price. In addition, the value of debt securities may decline due to general market conditions that are not specifically related to a particular issuer, such as real or perceived adverse economic conditions, changes in outlook for corporate earnings, changes in interest or currency rates or adverse investor sentiment. They may also decline because of factors that affect a particular industry or country.
NOTES TO FINANCIAL STATEMENTS (continued)
Investing in foreign markets may involve special risks and considerations not typically associated with investing in the U.S. These risks include revaluation of currencies, high rates of inflation, repatriation restrictions on income and capital, and adverse political and economic developments. Moreover, securities issued in these markets may be less liquid, subject to government ownership controls and delayed settlements, and their prices may be more volatile than those of comparable securities in the U.S.
(f) Dividends to shareholders: Dividends are recorded on ex-dividend date. Dividends from investment income-net are declared and paid quarterly. Dividends from net realized capital gains, if any, are normally declared and paid annually, but the fund may make distributions on a more frequent basis to comply with the distribution requirements of the Internal Revenue Code of 1986, as amended (the “Code”).To the extent that net realized capital gains can be offset by capital loss carryovers, it is the policy of the fund not to distribute such gains. Income and capital gain distributions are determined in accordance with income tax regulations, which may differ from GAAP.
On October 31, 2012, the Board declared a cash dividend of $.093, $.062 and $.098 per share from undistributed investment income-net for Class A, Class C and Class I shares, respectively, payable on November 1, 2012 (ex-dividend date), to shareholders of record as of the close of business on October 31, 2012.
(g) Federal income taxes: It is the policy of the fund to continue to qualify as a regulated investment company, if such qualification is in the best interests of its shareholders, by complying with the applicable provisions of the Code, and to make distributions of taxable income sufficient to relieve it from substantially all federal income and excise taxes.
As of and during the period ended October 31, 2012, the fund did not have any liabilities for any uncertain tax positions.The fund recognizes interest and penalties, if any, related to uncertain tax positions as income tax expense in the Statement of Operations. During the period, the fund did not incur any interest or penalties.
38
Each of the tax years in the four-year period ended October 31, 2012 remains subject to examination by the Internal Revenue Service and state taxing authorities.
At October 31, 2012, the components of accumulated earnings on a tax basis were as follows: undistributed ordinary income $39,876,264 and unrealized appreciation $68,658,369.
The tax character of distributions paid to shareholders during the fiscal periods ended October 31, 2012 and October 31, 2011 were as follows: ordinary income $20,347,781 and $41,244,561 and long-term capital gains $10,903,668 and $8,148,545, respectively.
During the period ended October 31, 2012, as a result of permanent book to tax differences, primarily due to the tax treatment for paydowns gains and losses, foreign currency transactions, swap periodic payments and consent fees, the fund increased accumulated undistributed investment income-net by $1,648,086 and decreased accumulated net realized gain (loss) on investments by the same amount. Net assets and net asset value per share were not affected by this reclassification.
(h) New Accounting Pronouncement: In December 2011, FASB issued Accounting Standards Update No. 2011-11 “Disclosures about Offsetting Assets and Liabilities” (“ASU 2011-11”). These disclosure requirements are intended to help investors and other financial statement users to better assess the effect or potential effect of offsetting arrangements on a company’s financial position. They also improve transparency in the reporting of how companies mitigate credit risk, including disclosure of related collateral pledged or received. In addition, ASU 2011-11 facilitates comparison between those entities that prepare their financial statements on the basis of GAAP and those entities that prepare their financial statements on the basis of International Financial Reporting Standards (“IFRS”).ASU 2011-11 requires entities to: disclose both gross and net information about both instruments and transactions eligible for offset in the financial statements; and disclose instruments and transactions subject to an agreement similar to a
NOTES TO FINANCIAL STATEMENTS (continued)
master netting agreement. ASU 2011-11 is effective for fiscal years beginning on or after January 1, 2013, and interim periods within those annual periods.At this time, management is evaluating the implications of ASU 2011-11 and its impact on the fund’s financial statement disclosures.
NOTE 2—Bank Lines of Credit:
The fund participates with other Dreyfus-managed funds in a $225 million unsecured credit facility led by Citibank, N.A. and a $300 million unsecured credit facility provided by The Bank of New York Mellon (each, a “Facility”), each to be utilized primarily for temporary or emergency purposes, including the financing of redemptions. Effective October 10, 2012, the $225 million unsecured credit facility with Citibank, N.A., was decreased to $210 million. In connection therewith, the fund has agreed to pay its pro rata portion of commitment fees for each Facility. Interest is charged to the fund based on rates determined pursuant to the terms of the respective Facility at the time of borrowing.
The average amount of borrowings outstanding under the Facilities during the period ended October 31, 2012, was approximately $154,100 with a related weighted average annualized interest rate of 1.21%.
NOTE 3—Management Fee and Other Transactions with Affiliates:
(a) Pursuant to a management agreement with the Manager and the Trust, theTrust has agreed to pay the Manager a management fee computed at the annual rate of .60% of the value of the fund’s average daily net assets and is payable monthly.
During the period ended October 31, 2012, the Distributor retained $52,525 from commissions earned on sales of the fund’s Class A shares and $60,347 from CDSCs on redemptions of the fund’s Class C shares.
(b) Under the Distribution Plan adopted pursuant to Rule 12b-1 under the Act, Class C shares pay the Distributor for distributing its shares at an annual rate of .75% of the value of the average daily net assets of
40
Class C shares. During the period ended October 31, 2012, Class C shares were charged $1,351,014, pursuant to the Distribution Plan.
(c) Under the Shareholder Services Plan, Class A and Class C shares pay the Distributor at an annual rate of .25% of the value of their average daily net assets for the provision of certain services.These services provided may include personal services relating to shareholder accounts, such as answering shareholder inquiries regarding the fund and providing reports and other information, and services related to the maintenance of shareholder accounts. The Distributor may make payments to Service Agents (securities dealers, financial institutions or other industry professionals) in respect of these services. The Distributor determines the amounts to be paid to Service Agents. During the period ended October 31, 2012, Class A and Class C shares were charged $1,566,347 and $450,338, respectively, pursuant to the Shareholder Services Plan.
Under its terms, the Distribution Plan and Shareholder Services Plan shall remain in effect from year to year, provided such continuance is approved annually by a vote of a majority of those Trustees who are not “interested persons” of the Trust and who have no direct or indirect financial interest in the operation of or in any agreement related to the Distribution Plan or Shareholder Services Plan.
The fund has arrangements with the transfer agent and the custodian whereby the fund may receive earnings credits when positive cash balances are maintained, which are used to offset transfer agency and custody fees. For financial reporting purposes, the fund includes net earnings credits as an expense offset in the Statement of Operations.
The fund compensates DreyfusTransfer, Inc. (“DTI”), a wholly-owned subsidiary of the Manager, under a transfer agency agreement for providing transfer agency services for the fund and, since May 29, 2012, cash management services related to fund subscriptions and redemptions. During the period ended October 31, 2012, the fund was charged $181,354 for transfer agency services and $4,015 for cash management services. Cash management fees were partially offset by
NOTES TO FINANCIAL STATEMENTS (continued)
earnings credits of $472.These fees are included in Shareholder servicing costs in the Statement of Operations.
The fund compensates The Bank of New York Mellon under a custody agreement for providing custodial services for the fund. During the period ended October 31, 2012, the fund was charged $265,244 pursuant to the custody agreement.
Prior to May 29, 2012, the fund compensated The Bank of NewYork Mellon under a cash management agreement for performing cash management services related to fund subscriptions and redemptions. During the period ended October 31, 2012, the fund was charged $16,517 pursuant to the cash management agreement, which is included in Shareholder servicing costs in the Statement of Operations.These fees were partially offset by earnings credits of $553.
During the period ended October 31, 2012, the fund was charged $8,517 for services performed by the Chief Compliance Officer and his staff.
The components of “Due to The Dreyfus Corporation and affiliates” in the Statement of Assets and Liabilities consist of: management fees $911,687, Distribution Plan fees $126,060, Shareholder Services Plan fees $186,266, custodian fees $84,368, Chief Compliance Officer fees $2,654 and transfer agency fees $27,800.
(d) Each Board member also serves as a Board member of other funds within the Dreyfus complex. Annual retainer fees and attendance fees are allocated to each fund based on net assets.
NOTE 4—Securities Transactions:
The aggregate amount of purchases and sales (including paydowns) of investment securities, excluding short-term securities, forward contracts, financial futures and swap transactions, during the period ended October 31, 2012, amounted to $3,250,313,702 and $2,788,122,556, respectively.
42
Derivatives: A derivative is a financial instrument whose performance is derived from the performance of another asset. Each type of derivative instrument that was held by the fund during the period ended October 31, 2012 is discussed below.
The following tables show the fund’s exposure to different types of market risk as it relates to the Statement of Assets and Liabilities and the Statement of Operations, respectively.
Fair value of derivative instruments as of October 31, 2012 is shown below:
| | | | |
| | Derivative | | Derivative | |
| | Assets ($) | | Liabilities ($) | |
| Interest rate risk1,2 | 4,803,449 | Interest rate risk1,3 | (4,627,814 | ) |
| Foreign exchange risk4 | 1,321,205 | Foreign exchange risk5 | (1,236,918 | ) |
| Gross fair value of | | | | |
| derivatives contracts | 6,124,654 | | (5,864,732 | ) |
Statement of Assets and Liabilities location:
| 1 | Includes cumulative appreciation (depreciation) on financial futures as reported in the Statement of Financial Futures, but only the unpaid variation margin is reported in the Statement of Assets and Liabilities. |
| 2 | Unrealized appreciation on swap contracts. |
| 3 | Unrealized depreciation on swap contracts. |
| 4 | Unrealized appreciation on forward foreign currency exchange contracts. |
| 5 | Unrealized depreciation on forward foreign currency exchange contracts. |
The effect of derivative instruments in the Statement of Operations during the period ended October 31, 2012 is shown below:
Amount of realized gain or (loss) on derivatives recognized in income ($)
| | | | | | | |
| | Financial | | Forward | Swap | | | |
| Underlying risk | Futures6 | | Contracts7 Transactions8 | | Total | |
| Interest rate | (11,258,457 | ) | — | (1,070,264) (12,328,721) | |
| Foreign exchange | — | | 7,039,918 | — | | 7,039,918 | |
| Credit | — | | — | (857,631 | ) | (857,631 | ) |
| Total | (11,258,457 | ) | 7,039,918 | (1,927,895 | ) | (6,146,434 | ) |
NOTES TO FINANCIAL STATEMENTS (continued)
Change in unrealized appreciation or (depreciation) on derivatives recognized in income ($)
| | | | |
| | Financial | Forward | Swap | |
| Underlying risk | Futures9 | Contracts10 Transactions11 | Total |
| Interest rate | 929,444 | — | 2,444,362 | 3,373,806 |
| Foreign exchange | — | 835,858 | — | 835,858 |
| Credit | — | — | 143,922 | 143,922 |
| Total | 929,444 | 835,858 | 2,588,284 | 4,353,586 |
Statement of Operations location:
| 6 | Net realized gain (loss) on financial futures. |
| 7 | Net realized gain (loss) on forward foreign currency exchange contracts. |
| 8 | Net realized gain (loss) on swap transactions. |
| 9 | Net unrealized appreciation (depreciation) on financial futures. |
| 10 | Net unrealized appreciation (depreciation) on forward foreign currency exchange contracts. |
| 11 | Net unrealized appreciation (depreciation) on swap transactions. |
Financial Futures: In the normal course of pursuing its investment objective, the fund is exposed to market risk, including interest rate risk, as a result of changes in value of underlying financial instruments.The fund invests in financial futures in order to manage its exposure to or protect against changes in the market. A financial futures contract represents a commitment for the future purchase or a sale of an asset at a specified date. Upon entering into such contracts, these investments require initial margin deposits with a counterparty, which consist of cash or cash equivalents.The amount of these deposits is determined by the exchange or Board of Trade on which the contract is traded and is subject to change.Accordingly, variation margin payments are received or made to reflect daily unrealized gains or losses which are recorded in the Statement of Operations.When the contracts are closed, the fund recognizes a realized gain or loss which is reflected in the Statement of Operations.There is minimal counterparty credit risk to the fund with financial futures since they are exchange traded, and the exchange’s clearinghouse guarantees the financial futures against default. Financial futures open at October 31, 2012 are set forth in the Statement of Financial Futures.
Forward Foreign Currency Exchange Contracts: The fund enters into forward contracts in order to hedge its exposure to changes in foreign currency exchange rates on its foreign portfolio holdings, to settle
44
foreign currency transactions or as a part of its investment strategy. When executing forward contracts, the fund is obligated to buy or sell a foreign currency at a specified rate on a certain date in the future. With respect to sales of forward contracts, the fund incurs a loss if the value of the contract increases between the date the forward contract is opened and the date the forward contract is closed.The fund realizes a gain if the value of the contract decreases between those dates.With respect to purchases of forward contracts, the fund incurs a loss if the value of the contract decreases between the date the forward contract is opened and the date the forward contract is closed.The fund realizes a gain if the value of the contract increases between those dates. Any realized or unrealized gains or losses which occurred during the period are reflected in the Statement of Operations. The fund is exposed to foreign currency risk as a result of changes in value of underlying financial instruments.The fund is also exposed to credit risk associated with counterparty nonperformance on these forward contracts, which is typically limited to the unrealized gain on each open contract.The following summarizes open forward contracts at October 31, 2012:
| | | | | | | |
| | | | Foreign | | | Unrealized | |
| Forward Foreign Currency | Currency | | | Appreciation | |
| Exchange Contracts | | | Amounts | Cost ($) | Value ($) (Depreciation) ($) | |
| Purchases: | | | | | | | |
| Australian Dollar, | | | | | | | |
| Expiring | | | | | | | |
| 11/30/2012 | a | | 5,735,000 | 5,892,999 | 5,938,636 | 45,637 | |
| Brazilian Real, | | | | | | | |
| Expiring | | | | | | | |
| 12/4/2012 | b | | 7,810,000 | 3,830,121 | 3,827,156 | (2,965 | ) |
| British Pound, | | | | | | | |
| Expiring | | | | | | | |
| 11/30/2012 | c | | 53,495,000 | 86,014,327 | 86,318,455 | 304,128 | |
| Japanese Yen, | | | | | | | |
| Expiring: | | | | | | | |
| 11/30/2012 | a | 6,248,360,000 | 78,215,957 | 78,289,949 | 73,992 | |
| 11/30/2012 | b | | 758,910,000 | 9,512,181 | 9,508,898 | (3,283 | ) |
| 11/30/2012 | c | 5,575,280,000 | 69,792,198 | 69,856,472 | 64,274 | |
| 11/30/2012 | d | 7,801,220,000 | 97,656,307 | 97,746,786 | 90,479 | |
| Malaysian Ringgit | | | | | | | |
| Expiring | | | | | | | |
| 11/30/2012 | e | | 15,560,000 | 5,094,248 | 5,096,292 | 2,044 | |
NOTES TO FINANCIAL STATEMENTS (continued)
| | | | | | |
| | | Foreign | | | Unrealized | |
| Forward Foreign Currency | | Currency | | | Appreciation | |
| Exchange Contracts | | Amounts | Cost ($) | Value ($) (Depreciation) ($) | |
| Purchases (continued): | | | | |
| Mexican New Peso, | | | | | | |
| Expiring | | | | | | |
| 11/30/2012 | f | 764,920,000 | 59,068,549 | 58,239,683 | (828,866 | ) |
| New Zeland Dollar, | | | | | | |
| Expiring | | | | | | |
| 11/30/2012 | a | 4,650,000 | 3,788,029 | 3,816,668 | 28,639 | |
| Polish Zloty, | | | | | | |
| Expiring | | | | | | |
| 11/30/2012 | g | 34,445,000 | 10,895,834 | 10,749,684 | (146,150 | ) |
| Russian Ruble, | | | | | | |
| Expiring | | | | | | |
| 11/30/2012 | h | 530,000,000 | 16,950,101 | 16,809,121 | (140,980 | ) |
| Singapore Dollar, | | | | | | |
| Expiring | | | | | | |
| 11/30/2012 | a | 71,520,000 | 58,505,939 | 58,630,640 | 124,701 | |
| Swedish Krona, | | | | | | |
| Expiring | | | | | | |
| 11/30/2012 | b | 404,325,000 | 60,355,682 | 60,902,408 | 546,726 | |
| Swiss Franc, | | | | | | |
| Expiring: | | | | | | |
| 11/30/2012 | b | 20,950,000 | 22,574,702 | 22,504,860 | (69,842 | ) |
| Sales: | | | Proceeds ($) | | | |
| Canadian Dollar, | | | | | | |
| Expiring: | | | | | | |
| 11/2/2012 | g | 5,230,444 | 5,236,203 | 5,236,990 | (787 | ) |
| 11/30/2012 | g | 34,820,000 | 34,797,208 | 34,841,253 | (44,045 | ) |
| Euro, | | | | | | |
| Expiring | | | | | | |
| 11/30/2012 | i | 101,670,000 131,837,976 | 131,814,704 | 23,272 | |
| South African Rand, | | | | | | |
| Expiring | | | | | | |
| 11/30/2012 | g | 63,910,000 | 7,355,446 | 7,338,133 | 17,313 | |
| Gross Unrealized | | | | | | |
| Appreciation | | | | | 1,321,205 | |
| Gross Unrealized | | | | | | |
| Depreciation | | | | | (1,236,918 | ) |
| |
| Counterparties: | | | | | | |
| a Goldman Sachs | | | | | | |
| b Morgan Stanley | | | | | | |
| c Barclays Bank | | | | | | |
| d Bank of America | | | | | | |
| e Citigroup | | | | | | |
| f JPMorgan Chase & Co. | | | | |
| g Credit Suisse First Boston | | | | |
| h Deutsche Bank | | | | | | |
| i Royal Bank of Scotland | | | | | | |
46
Swap Transactions: The fund enters into swap agreements to exchange the interest rate on, or return generated by, one nominal instrument for the return generated by another nominal instrument.The fund enters into these agreements to hedge certain market or interest rate risks, to manage the interest rate sensitivity (sometimes called duration) of fixed income securities, to provide a substitute for purchasing or selling particular securities or to increase potential returns.
The fund accrues for the interim payments on swap contracts on a daily basis, with the net amount recorded within unrealized appreciation (depreciation) on swap contracts in the Statement of Assets and Liabilities. Once the interim payments are settled in cash, the net amount is recorded as a realized gain (loss) on swaps, in addition to realized gain (loss) recorded upon the termination of swap contracts in the Statement of Operations. Upfront payments made and/or received by the fund, are recorded as an asset and/or liability in the Statement of Assets and Liabilities and are recorded as a realized gain or loss ratably over the contract’s term/event with the exception of forward starting interest rate swaps which are recorded as realized gains or losses on the termination date. Fluctuations in the value of swap contracts are recorded for financial statement purposes as unrealized appreciation or depreciation on swap transactions.
Interest Rate Swaps: Interest rate swaps involve the exchange of commitments to pay and receive interest based on a notional principal amount. The fund may elect to pay a fixed rate and receive a floating rate, or receive a fixed rate and pay a floating rate on a notional principal amount.The net interest received or paid on interest rate swap agreements is included within unrealized appreciation (depreciation) on swap contracts in the Statement of Assets and Liabilities. Interest rate swaps are valued daily and the change, if any, is recorded as an unrealized gain or loss in the Statement of Operations.When a swap contract is terminated early, the fund records a realized gain or loss equal to the difference between the current realized value and the expected cash flows.
NOTES TO FINANCIAL STATEMENTS (continued)
The fund’s maximum risk of loss from counterparty credit risk is the discounted value of the cash flows to be received from the counterparty over the contract’s remaining life, to the extent that the amount is positive. This risk is mitigated by having a master netting arrangement between the fund and the counterparty and by the posting of collateral by the counterparty to the fund to cover the fund’s exposure to the counterparty. The following summarizes open interest rate swaps entered into by the fund at October 31, 2012:
| | | | | | | |
| | | | | | | Unrealized | |
| Notional | Reference | | (Pay) Receive | | | Appreciation | |
| Amount ($) | Entity/Currency | Counterparty | Fixed Rate (%) | | Expiration (Depreciation) ($) | |
| |
| 17,345,000 | USD—6 Month | | | | | | |
| | Libor | Citibank | (3.68 | ) | 5/5/2020 | (3,252,794 | ) |
| 42,200,000 | EUR—1 Year | | | | | | |
| | Libor | JP Morgan | 1.91 | | 11/4/2016 | 3,247,792 | |
| Gross Unrealized | | | | | | | |
| Appreciation | | | | | | 3,247,792 | |
| Gross Unrealized | | | | | | | |
| Depreciation | | | | | | (3,252,794 | ) |
Credit Default Swaps: Credit default swaps involve commitments to pay a fixed interest rate in exchange for payment if a credit event affecting a third party (the referenced company, obligation or index) occurs. Credit events may include a failure to pay interest or principal, bankruptcy, or restructuring. The fund enters into these agreements to manage its exposure to the market or certain sectors of the market, to reduce its risk exposure to defaults of corporate and sovereign issuers, or to create exposure to corporate or sovereign issuers to which it is not otherwise exposed. For those credit default swaps in which the fund is paying a fixed rate, the fund is buying credit protection on the instrument. In the event of a credit event, the fund would receive the full notional amount for the reference obligation. For those credit default swaps in which the fund is receiving a fixed rate, the fund is selling credit protection on the underlying instrument.The maximum payouts for these contracts are limited to the notional amount of each swap. Credit default swaps may involve greater risks than if the fund had invested in the reference obligation directly and are subject to general market risk, liquidity risk, counterparty risk and credit risk. At October 31, 2012, there were no credit default swap agreements outstanding.
48
The following summarizes the average market value of derivatives outstanding during the period ended October 31, 2012:
| |
| | Average Market Value ($) |
| Interest rate financial futures | 540,035,763 |
| Forward contracts | 621,442,392 |
The following summarizes the average notional value of swap contracts outstanding during the period ended October 31, 2012:
| |
| | Average Notional Value ($) |
| Interest rate swap contracts | 67,683,466 |
| Credit default swap contracts | 1,969,231 |
At October 31, 2012, the cost of investments for federal income tax purposes was $1,750,599,511; accordingly, accumulated net unrealized appreciation on investments was $74,216,978, consisting of $78,282,577 gross unrealized appreciation and $4,065,599 gross unrealized depreciation.
|
| REPORT OF INDEPENDENT REGISTERED |
| PUBLIC ACCOUNTING FIRM |
The Board of Trustees and Shareholders of The Dreyfus/Laurel Funds Trust
We have audited the accompanying statement of assets and liabilities of Dreyfus International Bond Fund, a series of The Dreyfus/Laurel Funds Trust (the “Fund”), including the statements of investments and financial futures, as of October 31, 2012, and the related statement of operations for the year then ended, the statements of changes in net assets for each of the years in the two-year period then ended, and the financial highlights for each of the years in the five-year period then.These financial statements and financial highlights are the responsibility of the Fund’s management. Our responsibility is to express an opinion on these financial statements and financial highlights based on our audits.
We conducted our audits in accordance with the standards of the Public Company Accounting Oversight Board (United States).Those standards require that we plan and perform the audit to obtain reasonable assurance about whether the financial statements and financial highlights are free of material misstatement. An audit includes examining, on a test basis, evidence supporting the amounts and disclosures in the financial statements. Our procedures included confirmation of securities owned as of October 31, 2012, by correspondence with the custodian and brokers or by other appropriate auditing procedures where replies from brokers were not received. An audit also includes assessing the accounting principles used and significant estimates made by management, as well as evaluating the overall financial statement presentation.We believe that our audits provide a reasonable basis for our opinion.
In our opinion, the financial statements and financial highlights referred to above present fairly, in all material respects, the financial position of Dreyfus International Bond Fund as of October 31, 2012, the results of its operations for the year then ended, the changes in its net assets for each of the years in the two-year period then ended, and the financial highlights for each of the years in the five-year period then ended, in conformity with U.S. generally accepted accounting principles.

New York, New York
December 26, 2012
50
IMPORTANT TAX INFORMATION (Unaudited)
For federal tax purposes, the fund designates the maximum amount allowable but not less than 29.26% as interest-related dividends in accordance with Sections 871(k)(1) and 881(e) of the Internal Revenue Code. Also, the fund reports the maximum amount allowable but not less than $.1354 per share as a capital gain dividend in accordance with Section 852(b)(3)(C) of the Internal Revenue Code. Also, the fund reports the maximum amount allowable but not less than $.0356 as a short-term capital gain dividend paid on December 28, 2011 in accordance with Sections 871(k)(2) and 881(e) of the Internal Revenue Code.
OFFICERS OF THE FUND (Unaudited)
BRADLEY J. SKAPYAK, President since January 2010.
Chief Operating Officer and a director of the Manager since June 2009; from April 2003 to June 2009, Mr. Skapyak was the head of the Investment Accounting and Support Department of the Manager. He is an officer of 72 investment companies (comprised of 156 portfolios) managed by the Manager. He is 53 years old and has been an employee of the Manager since February 1988.
JANETTE E. FARRAGHER, Vice President and Secretary since December 2011.
Assistant General Counsel of BNY Mellon, and an officer of 73 investment companies (comprised of 183 portfolios) managed by the Manager. She is 49 years old and has been an employee of the Manager since February 1984.
KIESHA ASTWOOD, Vice President and Assistant Secretary since January 2010.
Counsel of BNY Mellon, and an officer of 73 investment companies (comprised of 183 portfolios) managed by the Manager. She is 39 years old and has been an employee of the Manager since July 1995.
JAMES BITETTO, Vice President and Assistant Secretary since August 2005.
Senior Counsel of BNY Mellon and Secretary of the Manager, and an officer of 73 investment companies (comprised of 183 portfolios) managed by the Manager. He is 46 years old and has been an employee of the Manager since December 1996.
JONI LACKS CHARATAN, Vice President and Assistant Secretary since August 2005.
Senior Counsel of BNY Mellon, and an officer of 73 investment companies (comprised of 183 portfolios) managed by the Manager. She is 56 years old and has been an employee of the Manager since October 1988.
JOSEPH M. CHIOFFI, Vice President and Assistant Secretary since August 2005.
Senior Counsel of BNY Mellon, and an officer of 73 investment companies (comprised of 183 portfolios) managed by the Manager. He is 50 years old and has been an employee of the Manager since June 2000.
JOHN B. HAMMALIAN, Vice President and Assistant Secretary since August 2005.
Senior Managing Counsel of BNY Mellon, and an officer of 73 investment companies (comprised of 183 portfolios) managed by the Manager. He is 49 years old and has been an employee of the Manager since February 1991.
ROBERT R. MULLERY, Vice President and Assistant Secretary since August 2005.
Managing Counsel of BNY Mellon, and an officer of 73 investment companies (comprised of 183 portfolios) managed by the Manager. He is 60 years old and has been an employee of the Manager since May 1986.
JEFF PRUSNOFSKY, Vice President and Assistant Secretary since August 2005.
Senior Managing Counsel of BNY Mellon, and an officer of 73 investment companies (comprised of 183 portfolios) managed by the Manager. He is 47 years old and has been an employee of the Manager since October 1990.
JAMES WINDELS, Treasurer since November 2001.
Director - Mutual Fund Accounting of the Manager, and an officer of 73 investment companies (comprised of 183 portfolios) managed by the Manager. He is 54 years old and has been an employee of the Manager since April 1985.
54
RICHARD CASSARO, Assistant Treasurer since January 2008.
Senior Accounting Manager – Money Market and Municipal Bond Funds of the Manager, and an officer of 73 investment companies (comprised of 183 portfolios) managed by the Manager. He is 53 years old and has been an employee of the Manager since September 1982.
GAVIN C. REILLY, Assistant Treasurer since December 2005.
Tax Manager of the Investment Accounting and Support Department of the Manager, and an officer of 73 investment companies (comprised of 183 portfolios) managed by the Manager. He is 44 years old and has been an employee of the Manager since April 1991.
ROBERT S. ROBOL, Assistant Treasurer since December 2002.
Senior Accounting Manager – Fixed Income Funds of the Manager, and an officer of 73 investment companies (comprised of 183 portfolios) managed by the Manager. He is 48 years old and has been an employee of the Manager since October 1988.
ROBERT SALVIOLO, Assistant Treasurer since July 2007.
Senior Accounting Manager – Equity Funds of the Manager, and an officer of 73 investment companies (comprised of 183 portfolios) managed by the Manager. He is 45 years old and has been an employee of the Manager since June 1989.
ROBERT SVAGNA, Assistant Treasurer since December 2002.
Senior Accounting Manager – Equity Funds of the Manager, and an officer of 73 investment companies (comprised of 183 portfolios) managed by the Manager. He is 45 years old and has been an employee of the Manager since November 1990.
JOSEPH W. CONNOLLY, Chief Compliance Officer since October 2004.
Chief Compliance Officer of the Manager and The Dreyfus Family of Funds (73 investment companies, comprised of 183 portfolios). He is 55 years old and has served in various capacities with the Manager since 1980, including manager of the firm’s Fund Accounting Department from 1997 through October 2001.
MATTHEW D. CONNOLLY, Anti-Money Laundering Compliance Officer since April 2012.
Anti-Money Laundering Compliance Officer of the Distributor since October 2011; from March 2010 to September 2011, Global Head, KYC Reviews and Director, UBS Investment Bank; until March 2010,AML Compliance Officer and Senior Vice President, Citi Global Wealth Management. He is an officer of 69 investment companies (comprised of 179 portfolios) managed by the Manager. He is 40 years old and has been an employee of the Distributor since October 2011.
Item 2. Code of Ethics.
The Registrant has adopted a code of ethics that applies to the Registrant's principal executive officer, principal financial officer, principal accounting officer or controller, or persons performing similar functions. There have been no amendments to, or waivers in connection with, the Code of Ethics during the period covered by this Report.
Item 3. Audit Committee Financial Expert.
The Registrant's Board has determined that Joseph S. DiMartino a member of the Audit Committee of the Board, is an audit committee financial expert as defined by the Securities and Exchange Commission (the "SEC"). Mr. DiMartino is "independent" as defined by the SEC for purposes of audit committee financial expert determinations.
Item 4. Principal Accountant Fees and Services.
(a) Audit Fees. The aggregate fees billed for each of the last two fiscal years (the "Reporting Periods") for professional services rendered by the Registrant's principal accountant (the "Auditor") for the audit of the Registrant's annual financial statements or services that are normally provided by the Auditor in connection with the statutory and regulatory filings or engagements for the Reporting Periods, were $ 68,460 in 2011 and $70,010 in 2012.
(b) Audit-Related Fees. The aggregate fees billed in the Reporting Periods for assurance and related services by the Auditor that are reasonably related to the performance of the audit of the Registrant's financial statements and are not reported under paragraph (a) of this Item 4 were $ 8,600 in 2011 and $8,780 in 2012. These services consisted of one or more of the following: (i) agreed upon procedures related to compliance with Internal Revenue Code section 817(h), (ii) security counts required by Rule 17f-2 under the Investment Company Act of 1940, as amended, (iii) advisory services as to the accounting or disclosure treatment of Registrant transactions or events and (iv) advisory services to the accounting or disclosure treatment of the actual or potential impact to the Registrant of final or proposed rules, standards or interpretations by the Securities and Exchange Commission, the Financial Accounting Standards Boards or other regulatory or standard-setting bodies.
The aggregate fees billed in the Reporting Periods for non-audit assurance and related services by the Auditor to the Registrant's investment adviser (not including any sub-investment adviser whose role is primarily portfolio management and is subcontracted with or overseen by another investment adviser), and any entity controlling, controlled by or under common control with the investment adviser that provides ongoing services to the Registrant ("Service Affiliates"), that were reasonably related to the performance of the annual audit of the Service Affiliate, which required pre-approval by the Audit Committee were $0 in 2011 and $0 in 2012.
(c) Tax Fees. The aggregate fees billed in the Reporting Periods for professional services rendered by the Auditor for tax compliance, tax advice, and tax planning ("Tax Services") were $4,520 in 2011 and $4,620 in 2012. These services consisted of the review or preparation of U.S. federal, state, local and excise tax returns. The aggregate fees billed in the Reporting Periods for Tax Services by the Auditor to Service Affiliates, which required pre-approval by the Audit Committee were $0 in 2011 and $0 in 2012.
(d) All Other Fees. The aggregate fees billed in the Reporting Periods for products and services provided by the Auditor, other than the services reported in paragraphs (a) through (c) of this Item, were $0 in 2011 and $0 in 2012.
The aggregate fees billed in the Reporting Periods for Non-Audit Services by the Auditor to Service Affiliates, other than the services reported in paragraphs (b) through (c) of this Item, which required pre-approval by the Audit Committee, were $0 in 2011 and $0 in 2012.
(e)(1) Audit Committee Pre-Approval Policies and Procedures. The Registrant's Audit Committee has established policies and procedures (the "Policy") for pre-approval (within specified fee limits) of the Auditor's engagements for non-audit services to the Registrant and Service Affiliates without specific case-by-case consideration. The pre-approved services in the Policy can include pre-approved audit services, pre-approved audit-related services, pre-approved tax services and pre-approved all other services. Pre-approval considerations include whether the proposed services are compatible with maintaining the Auditor's independence. Pre-approvals pursuant to the Policy are considered annually.
(e)(2) Note: None of the services described in paragraphs (b) through (d) of this Item 4 were approved by the Audit Committee pursuant to paragraph (c)(7)(i)(C) of Rule 2-01 of Regulation S-X.
(f) None of the hours expended on the principal accountant's engagement to audit the registrant's financial statements for the most recent fiscal year were attributed to work performed by persons other than the principal account's full-time, permanent employees.
Non-Audit Fees. The aggregate non-audit fees billed by the Auditor for services rendered to the Registrant, and rendered to Service Affiliates, for the Reporting Periods were $12,152,586 in 2011 and $11,571,150 in 2012.
Auditor Independence. The Registrant's Audit Committee has considered whether the provision of non-audit services that were rendered to Service Affiliates, which were not pre-approved (not requiring pre-approval), is compatible with maintaining the Auditor's independence.
Item 5. Audit Committee of Listed Registrants.
Not applicable.
Item 6. Investments.
(a) Not applicable.
Item 7. Disclosure of Proxy Voting Policies and Procedures for Closed-End Management Investment Companies.
Not applicable.
Item 8. Portfolio Managers of Closed-End Management Investment Companies.
Not applicable.
Item 9. Purchases of Equity Securities by Closed-End Management Investment Companies and Affiliated Purchasers.
Not applicable.
Item 10. Submission of Matters to a Vote of Security Holders.
There have been no material changes to the procedures applicable to Item 10.
Item 11. Controls and Procedures.
(a) The Registrant's principal executive and principal financial officers have concluded, based on their evaluation of the Registrant's disclosure controls and procedures as of a date within 90 days of the filing date of this report, that the Registrant's disclosure controls and procedures are reasonably designed to ensure that information required to be disclosed by the Registrant on Form N-CSR is recorded, processed, summarized and reported within the required time periods and that information required to be disclosed by the Registrant in the reports that it files or submits on Form N-CSR is accumulated and communicated to the Registrant's management, including its principal executive and principal financial officers, as appropriate to allow timely decisions regarding required disclosure.
(b) There were no changes to the Registrant's internal control over financial reporting that occurred during the second fiscal quarter of the period covered by this report that have materially affected, or are reasonably likely to materially affect, the Registrant's internal control over financial reporting.
Item 12. Exhibits.
(a)(1) Code of ethics referred to in Item 2.
(a)(2) Certifications of principal executive and principal financial officers as required by Rule 30a-2(a) under the Investment Company Act of 1940.
(a)(3) Not applicable.
(b) Certification of principal executive and principal financial officers as required by Rule 30a-2(b) under the Investment Company Act of 1940.
SIGNATURES
Pursuant to the requirements of the Securities Exchange Act of 1934 and the Investment Company Act of 1940, the Registrant has duly caused this Report to be signed on its behalf by the undersigned, thereunto duly authorized.
The Dreyfus/Laurel Funds Trust
By: /s/ Bradley J. Skapyak |
Bradley J. Skapyak, President |
Date: | December 19, 2012 |
|
Pursuant to the requirements of the Securities Exchange Act of 1934 and the Investment Company Act of 1940, this Report has been signed below by the following persons on behalf of the Registrant and in the capacities and on the dates indicated. |
|
By: /s/ Bradley J. Skapyak |
Bradley J. Skapyak, President |
Date: | December 19, 2012 |
|
By: /s/ James Windels |
James Windels, Treasurer |
Date: | December 19, 2012 |
|
EXHIBIT INDEX
(a)(1) Code of ethics referred to in Item 2.
(a)(2) Certifications of principal executive and principal financial officers as required by Rule 30a-2(a) under the Investment Company Act of 1940. (EX-99.CERT)
(b) Certification of principal executive and principal financial officers as required by Rule 30a-2(b) under the Investment Company Act of 1940. (EX-99.906CERT)
Exhibit (a)(1)
[INSERT CODE OF ETHICS]
Exhibit A
Persons Covered by the Code of Ethics
Bradley J. Skapyak | President | (Principal Executive Officer) |
| | |
James Windels | Treasurer | (Principal Financial and Accounting Officer) |
Revised as of January 1, 2010