UNITED STATES
SECURITIES AND EXCHANGE COMMISSION
Washington, DC 20549
FORM N-CSR
CERTIFIED SHAREHOLDER REPORT OF REGISTERED
MANAGEMENT INVESTMENT COMPANIES
Investment Company Act file number 811-00082
CGM TRUST
(Exact name of registrant as specified in charter)
One International Place, Boston, Massachusetts 02110
(Address of principal executive offices) (Zip code)
Barry N. Hurwitz, Esq.
Morgan, Lewis & Bockius LLP
One Federal Street
Boston, MA 02110
(Name and address of agent for service)
Registrant's telephone number, including area code: 1-617-737-3225
Date of fiscal year end: December 31, 2019
Date of reporting period: December 31, 2019
ITEM 1. REPORTS TO STOCKHOLDERS.
|
| |
| INVESTMENT ADVISER |
| CAPITAL GROWTH MANAGEMENT |
| LIMITED PARTNERSHIP |
| Boston, Massachusetts 02110 |
|
| |
| CUSTODIAN OF ASSETS |
STATE STREET BANK AND TRUST COMPANY
Boston, Massachusetts 02111 |
|
| |
| TRANSFER AGENT |
DST ASSET MANAGER SOLUTIONS, INC.
P.O. Box 219252
Kansas City, Missouri 64121-9252 |
|
| | |
| TELEPHONE NUMBERS |
| For information about: |
| n | Account Procedures |
| n | Purchases |
| n | Redemptions |
| n | Exchanges
Call 800-343-5678 | |
| n | New Account Procedures and Status |
| n | Prospectus & SAI |
| n | Performance |
| n | Proxy Voting Policies and Voting Records |
| n | Complete Schedule of Portfolio Holdings
for the 1st & 3rd Quarters
Call 800-345-4048 |
| | | |
| MAILING ADDRESS |
| The CGM Funds |
| c/o DST Asset Manager Solutions, Inc. |
| P.O. Box 219252 |
| Kansas City, MO 64121-9252 |
| |
| |
| WEBSITE |
| www.cgmfunds.com |
| |
| |
| This report has been prepared for the shareholders of the Fund and is not authorized for distribution to current or prospective investors in the Fund unless it is accompanied or preceded by a prospectus. |
| | |
| MAR19 | Printed in U.S.A. |
CGM
Mutual Fund
90th Annual Report
December 31, 2019
A No-Load Fund
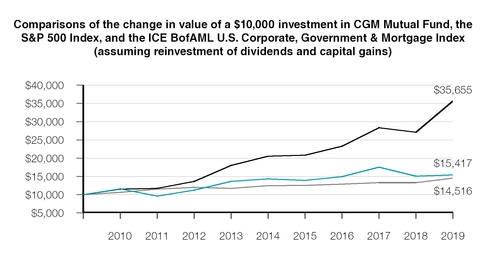
CGM Mutual Fund increased 1.8% during the fourth quarter of 2019, compared to the Standard and Poor’s 500 Index (S&P 500 Index) which increased 9.1% and the ICE BofAML U.S. Corporate, Government and Mortgage Index* which returned 0.1% over the same period. For the twelve months ended December 31, 2019, CGM Mutual Fund increased 2.1% the S&P 500 Index increased 31.5% and the ICE BofAML U.S. Corporate, Government and Mortgage Index returned 9.0%.
The Year in Review and Economic Outlook
The longest bull market in history continued into its tenth year in 2019. After a market sell-off in late 2018, U.S. stocks surged early in the year despite the lengthiest U.S. government shutdown in history and concerns about global economic growth. In January, strong employment numbers and wage reports from the Labor Department as well as indications from the Federal Reserve that interest rates would remain steady propelled the market to its best monthly performance in three years. U.S. - China trade tensions affected the market throughout the year and in early February, stocks rose when the Trump administration agreed to hold off on a 25% increase in tariffs on $200 billion of Chinese goods. But by March, impatience with progress in trade negotiations depressed stock prices. Markets were also discouraged, at least initially, when the European Central Bank attempted to boost its sluggish economy by holding interest rates unchanged through the end of the year. Nevertheless, the market enjoyed a strong finish to the first quarter after the Labor Department reported that worker productivity, which directly impacts wages and output, jumped 1.9% in the fourth quarter of 2018.
In April we learned that economic growth in the first quarter was the strongest in four years with gross domestic product rising at a vigorous 3.1% annualized rate. Concerns about a global recession faded as China reported surprisingly strong retail sales numbers and an overall 6.4% growth rate for its first quarter despite ongoing trade tensions with
the U.S. Domestic economic indicators remained largely positive through the rest of the first half of the year though tempered global growth, recurring trade tensions and a tightening labor market weighed on U.S. manufacturing growth and also led to contraction in European manufacturing. However, the Institute for Supply Management’s monthly non-manufacturing index indicated consistent expansion in the U.S. service sector in 2019 which offset the slowdown in manufacturing. Near the end of the second quarter, a meeting between President Trump and Chinese President Xi Jinping at the G-20 summit in Tokyo led to incremental progress in trade negotiations which helped boost stocks to their best mid-year returns in over two decades.
In the first of three rate cuts in 2019 (and the first reduction since 2008) the Fed reduced interest rates 0.25% in July. However, at the time, the Fed remained silent about future plans for economic stimulus and the market dropped on the rate cut news. In early August the Trump administration announced additional tariffs on Chinese goods which triggered new fears of a global economic slowdown and battered stock and commodity prices and bond yields. China subsequently reacted by allowing a swift and sizable depreciation of the yuan and threatened retaliatory tariffs on almost all remaining U.S. imports. The market declined in response to the heightening trade tensions along with news of slackening Chinese industrial production and contraction in the German economy. But again, trade tensions dissipated in late August and in mid-September, the Fed announced a second 0.25% rate cut. So, despite headwinds and conflicting indicators, markets closed in positive territory and the U.S. economy persevered with moderate gross domestic product growth of 2.1% in the third quarter.
U.S. economic growth continues to outperform global economies. Steady job growth, rising wages and solid consumer spending propelled the U.S. economy through year-end. In early December the unemployment rate dropped to a historically low 3.5% and the Labor Department reported the 110th consecutive month of job gains as employers added
266,000 new jobs. Wages were up 3.1% from a year earlier and continue to outpace inflation. Any immediate concerns about a recession have diminished. After a third rate cut in October to “provide some insurance against ongoing risks,” the Fed held off on an additional rate reduction in December citing a favorable overall outlook for the economy. Corporate earnings have been surprisingly strong, boosting stock prices. U.S. - China trade tensions have eased as the countries agreed in principle to a “phase one” limited trade agreement that curtails U.S. tariffs on Chinese goods and includes commitments by China to purchase $50 billion of U.S. agricultural products along with energy and other goods. Additionally, a new trade pact with Canada and Mexico is nearly complete. Improved trade relations and sustained growth in the U.S. economy ultimately pushed the S&P 500 to its best performance since 2013.
Portfolio Strategy
CGM Mutual Fund was fully invested during 2019 in anticipation of continued growth in the American and global economies. The largest concentrations were in large Brazilian banks and U.S. defense contractors.
The Fund had almost no participation in information technology stocks which led the markets and appreciated 48% in 2019. This significantly limited the Fund’s performance in a rising market. Individual gains and losses in portfolio securities were largely offsetting.
On December 31, 2019, CGM Mutual Fund was 26.0% invested in short-term U.S. Treasury securities. The equity portion of the portfolio was 14.4% invested in retail, 13.8% invested in electronic components and 8.1% invested in money center banks. The Fund’s three largest equity holdings were Petroleo Brasileiro S.A. - Petrobras ADR (oil - independent production), Thor Industries, Inc. (home products) and Skyworks Solutions, Inc. (electronic components).
David C. Fietze
President
G. Kenneth Heebner
Portfolio Manager
January 2, 2020
*The index data referenced herein is the property of ICE Data Indices, LLC, its affiliates (“ICE Data”) and/or its Third Party Suppliers and has been licensed for use by Capital Growth Management Limited Partnership. ICE Data and its Third Party Suppliers accept no liability in connection with its use. See prospectus for a full copy of the Disclaimer.
Average Annual Total Returns through 12/31/19
|
| | | | | | |
| | | | | 1 Year | 5 Year | 10 Year |
| | n | | CGM Mutual Fund | 2.1% | 1.5% | 4.4% |
| | n | | S&P 500 Index | 31.5% | 11.7% | 13.6% |
| | n | | ICE BofAML U.S. Corporate, Government & Mortgage Index | 9.0% | 3.1% | 3.8% |
Past performance is no indication of future results and current performance may be higher or lower than the figures shown. Unlike a fund, an index is not managed and does not reflect fees and expenses.
|
| | | |
| CGM MUTUAL FUND |
| Portfolio Manager |
G. Kenneth Heebner has managed CGM Mutual Fund since 1981. In 1990, Mr. Heebner founded Capital Growth Management Limited Partnership ("CGM") with Robert L. Kemp. Prior to establishing CGM, Mr. Heebner was at Loomis, Sayles & Company where he managed the Fund, then known as Loomis Sayles Mutual Fund. In addition to CGM Mutual Fund, he currently manages CGM Realty Fund and CGM Focus Fund.
|
| | | | |
| INVESTMENT PERFORMANCE |
| (unaudited) |
| Cumulative Total Returns for Periods Ended December 31, 2019 |
| | CGM
Mutual Fund (%) | |
| 10 Years | + | 54.2 | | |
| 5 Years | + | 7.6 | | |
| 1 Year | + | 2.1 | | |
| 3 Months | + | 1.8 | | |
The performance data contained in the report represent past performance, which is no guarantee of future results. The graph and table above do not reflect the deduction of taxes a shareholder would pay on Fund distributions or the redemption of Fund shares and assumes the reinvestment of all Fund distributions.
The investment return and the principal value of an investment in the Fund will fluctuate so that investors' shares, when redeemed, may be worth more or less than their original cost. Current performance may be higher or lower than the performance data quoted.
PORTFOLIO DIVERSIFICATION as of December 31, 2019 COMMON STOCKS |
| | |
| Industry | Percent of Net Assets |
|
| Retail | 14.4 | % |
| Electronic Components | 13.8 |
|
| Commercial Banks | 8.1 |
|
| Oil - Independent Production | 8.1 |
|
| Home Products | 6.5 |
|
| Housing and Building Materials | 5.0 |
|
| Drugs | 4.2 |
|
| Electronic and Communication Equipment | 4.0 |
|
| Computer Software and Services | 3.7 |
|
| Auto and Related | 2.6 |
|
| Leisure | 1.6 |
|
| Peripherals | 1.0 |
|
| BONDS |
| | |
| United States Treasury Notes | 26.0 | |
SCHEDULE OF INVESTMENTS as of December 31, 2019 COMMON STOCKS — 73.0% OF TOTAL NET ASSETS |
| | | | | | | | |
| Auto and Related — 2.6% | Shares | | Value(a) |
| | Lithia Motors, Inc. | 52,000 |
| | $ | 7,644,000 |
|
| | | | | |
| Commercial Banks — 8.1% | | | |
| | Bank of America Corporation | 230,000 |
| | 8,100,600 |
|
| | Citigroup Inc. | 20,000 |
| | 1,597,800 |
|
| | JPMorgan Chase & Co. | 102,000 |
| | 14,218,800 |
|
| | | | | 23,917,200 |
|
| Computer Software and Services — 3.7% | | | |
| | Microsoft Corporation | 69,000 |
| | 10,881,300 |
|
| | | | | |
| Drugs — 4.2% | | | |
| | AbbVie Inc. | 40,000 |
| | 3,541,600 |
|
| | Horizon Therapeutics Public Limited Company (b)(c) | 250,000 |
| | 9,050,000 |
|
| | | | | 12,591,600 |
|
| Electronic and Communication Equipment — 4.0% | | | |
| | Nokia Corporation ADR (c) | 3,200,000 |
| | 11,872,000 |
|
| | | | | |
| | | | | |
| | | | | |
| | | | | |
See accompanying notes to financial statements.
4
SCHEDULE OF INVESTMENTS as of December 31, 2019 (continued) COMMON STOCKS (continued) |
| | | | | | | | |
| Electronic Components — 13.8% | Shares | | Value(a) |
| | Micron Technology, Inc. (b) | 250,000 |
| | $ | 13,445,000 |
|
| | Qorvo, Inc. (b) | 105,000 |
| | 12,204,150 |
|
| | Skyworks Solutions, Inc. | 125,000 |
| | 15,110,000 |
|
| | | | | 40,759,150 |
|
| Home Products — 6.5% | | | |
| | Thor Industries, Inc. | 220,000 |
| | 16,343,800 |
|
| | Winnebago Industries, Inc. | 55,000 |
| | 2,913,900 |
|
| | | | | 19,257,700 |
|
| Housing and Building Materials — 5.0% | | | |
| | M.D.C. Holdings, Inc. | 390,000 |
| | 14,882,400 |
|
| | | | | |
| Leisure — 1.6% | | | |
| | Royal Caribbean Cruises Ltd. (c) | 35,000 |
| | 4,672,850 |
|
| | | | | |
| Oil - Independent Production — 8.1% | | | |
| | Petroleo Brasileiro S.A. - Petrobras ADR (c) | 1,500,000 |
| | 23,910,000 |
|
| | | | | |
| Peripherals — 1.0% | | | |
| | Western Digital Corporation | 45,000 |
| | 2,856,150 |
|
| | | | | |
| Retail — 14.4% | | | |
| | Alibaba Group Holding Limited ADR (b)(c) | 45,000 |
| | 9,544,500 |
|
| | RH (b) | 52,000 |
| | 11,102,000 |
|
| | Signet Jewelers Limited (c) | 600,000 |
| | 13,044,000 |
|
| | Target Corporation | 70,000 |
| | 8,974,700 |
|
| | | | | 42,665,200 |
|
| | | | | |
TOTAL COMMON STOCKS (Identified cost $201,135,368) | | 215,909,550 |
|
| BONDS — 26.0% OF TOTAL NET ASSETS | Face
Amount | | |
| United States Treasury — 26.0% | | | |
| | United States Treasury Notes, 1.500%, 11/30/2021 | $ | 2,500,000 |
| | 2,496,680 |
|
| | United States Treasury Notes, 1.875%, 12/15/2020 | 60,000,000 |
| | 60,131,250 |
|
| | United States Treasury Notes, 2.125%, 05/31/2021 | 5,000,000 |
| | 5,036,133 |
|
| | United States Treasury Notes, 2.500%, 02/28/2021 | 9,000,000 |
| | 9,087,890 |
|
TOTAL BONDS (Identified cost $76,111,555) | | 76,751,953 |
|
| | | | |
See accompanying notes to financial statements.
5
SCHEDULE OF INVESTMENTS as of December 31, 2019 (continued) |
| | | | | | | | |
| SHORT-TERM INVESTMENT — 0.6% OF TOTAL NET ASSETS | Face
Amount | | Value(a) |
| | Tri-party Repurchase Agreement with Fixed Income Clearing Corporation, dated 12/31/2019 at 0.12% to be repurchased at $1,730,012 on 01/02/2020 collateralized by $1,680,000 U.S. Treasury Note, 2.625% due 03/31/2025 valued at $1,768,194 including interest (Cost $1,730,000)(d) | $ | 1,730,000 |
| | $ | 1,730,000 |
|
| | | | |
TOTAL INVESTMENTS — 99.6% (Identified cost $278,976,923) | | 294,391,503 |
|
| | Cash and receivables | | 16,063,194 |
|
| | Liabilities | | (14,734,381 | ) |
| TOTAL NET ASSETS — 100.0% | | $ | 295,720,316 |
|
| | | | | |
| (a) | See Note 2A. |
| (b) | Non-income producing security.
|
| (c) | At December 31, 2019, the Fund had approximately 8.1% of net assets invested in companies incorporated in Brazil and is invested in other foreign countries that each account for less than 5% of net assets (in aggregate 16.3%). |
| (d) | See Note 2G.
|
| | | | | |
ADR: American Depositary Receipt - a certificate issued by a U.S. bank representing the right to receive securities of the foreign issuer described. The values of ADRs are significantly influenced by trading on exchanges not located in the U.S. or Canada. |
See accompanying notes to financial statements.
6
|
| | | | | | | | |
STATEMENT OF ASSETS AND LIABILITIES |
| |
| December 31, 2019 |
| |
| |
| Assets | | | | |
| Investments in securities, at value: | | |
| (Identified cost $278,976,923) | | $ | 294,391,503 |
|
| Cash | | 4,325 |
|
| Receivable for: | | | | |
| Securities sold | | $ | 15,680,423 |
| | |
| Shares of the Fund sold | | 365 |
| | |
| Dividends and interest | | 378,081 |
| | 16,058,869 |
|
| Total assets | | 310,454,697 |
|
| | | | | |
| Liabilities | | | | |
| Payable for: | | | | |
| Securities purchased | | 13,937,049 |
| | |
Shares of the Fund redeemed | | 256,477 |
| |
|
| Tax withholding | | 22,384 |
| | |
| Distributions declared | | 99,590 |
| | 14,315,500 |
|
| Accrued expenses: | | | | |
| Management fees | | 225,878 |
| | |
| Trustees’ fees | | 18,472 |
| | |
| Accounting, administration and compliance expenses | | 28,883 |
| | |
| Transfer agent fees | | 59,902 |
| | |
| Other expenses | | 85,746 |
| | 418,881 |
|
| Total liabilities | | 14,734,381 |
|
| Net Assets | | $ | 295,720,316 |
|
| | | |
| Net assets consist of: | | | |
| Capital paid-in | | $ | 307,099,439 |
|
| Accumulated loss | | (11,379,123 | ) |
| Net Assets | | $ | 295,720,316 |
|
| | | |
| Shares of beneficial interest outstanding, no par value | | 11,030,237 |
|
| | | |
| Net asset value per share* | | $26.81 |
| | | | | |
* Shares of the Fund are sold and redeemed at net asset
value ($295,720,316 ÷ 11,030,237).
|
| | | | |
STATEMENT OF OPERATIONS |
| |
| Twelve Months Ended December 31, 2019 |
| |
| |
| Investment Income | | |
| Income: | | |
| Dividends* (net of withholding tax of | | |
| $294,411) | | $ | 5,067,923 |
|
| Interest | | 1,978,738 |
|
| | | 7,046,661 |
|
| Expenses: | | |
| Management fees | | 2,896,505 |
|
| Trustees’ fees | | 73,614 |
|
| Accounting, administration and compliance expenses | | 346,597 |
|
| Custodian fees and expenses | | 94,036 |
|
| Transfer agent fees | | 326,807 |
|
| Audit and tax services | | 53,767 |
|
| Legal | | 50,435 |
|
| Printing | | 35,365 |
|
| Registration fees | | 23,645 |
|
| Miscellaneous expenses | | 12,613 |
|
| | | 3,913,384 |
|
| Net investment income | | 3,133,277 |
|
| | | |
| Realized and Unrealized Gain (Loss) on Investments | | |
| Net realized losses on investments | | (15,900,024 | ) |
| Net change in unrealized appreciation on investments | | 20,008,893 |
|
| Net realized and unrealized gains on investments | | 4,108,869 |
|
| | | |
| Change in Net Assets from Operations | | $ | 7,242,146 |
|
| | | |
| *Includes non-recurring dividends of $633,982. |
See accompanying notes to financial statements.
7
| STATEMENT OF CHANGES IN NET ASSETS |
| | | | | | | | |
| | | 2019 | | 2018 |
| From Operations | | | | |
| Net investment income | | $ | 3,133,277 |
| | $ | 3,150,512 |
|
| Net realized losses on investments and foreign currency transactions | | (15,900,024 | ) | | (10,163,292 | ) |
| Net change in unrealized appreciation (depreciation) on investments | | 20,008,893 |
| | (45,862,882 | ) |
| Change in net assets from operations | | 7,242,146 |
| | (52,875,662 | ) |
| | | | | |
| From Distributions to Shareholders | | | | |
| Total distributions | | (3,119,515 | ) | | (3,131,246 | ) |
| | |
|
| |
|
|
| From Capital Share Transactions | | | | |
| Proceeds from sale of shares | | 1,581,291 |
| | 3,370,990 |
|
| Net asset value of shares issued in connection with reinvestment of distributions | | 2,851,765 |
| | 2,861,674 |
|
| | | 4,433,056 |
| | 6,232,664 |
|
| Cost of shares redeemed | | (37,872,141 | ) | | (40,772,699 | ) |
| Change in net assets derived from capital share transactions | | (33,439,085 | ) | | (34,540,035 | ) |
| Total change in net assets | | (29,316,454 | ) | | (90,546,943 | ) |
| | | | | |
| Net Assets | | | | |
| Beginning of period | | 325,036,770 |
| | 415,583,713 |
|
| End of period | | $ | 295,720,316 |
| | $ | 325,036,770 |
|
| | | | | |
| Number of Shares of the Fund: | | | | |
| Issued from sale of shares | | 57,124 |
| | 112,345 |
|
| Issued in connection with reinvestment of distributions | | 104,192 |
| | 102,780 |
|
| | | 161,316 |
| | 215,125 |
|
| Redeemed | | (1,377,337 | ) | | (1,365,553 | ) |
| Net change | | (1,216,021 | ) | | (1,150,428 | ) |
| | | | | |
See accompanying notes to financial statements.
8
| FINANCIAL HIGHLIGHTS |
| | | | | | | | | | | | | | | | | | | |
| | For the Year Ended December 31, |
| | 2019 | | 2018 | | 2017 | | 2016 | | 2015 |
| For a share of the Fund outstanding throughout each period: | | | | | | | | | |
| Net asset value at beginning of period | $ | 26.54 |
| | $ | 31.02 |
| | $ | 30.76 |
| | $ | 29.38 |
| | $ | 30.31 |
|
| Net investment income (loss) (a) | 0.27 |
| (b) | 0.25 |
| (c) | 0.13 |
| | (0.04 | ) | | (0.11 | ) |
| Net realized and unrealized gains (losses) on investments and foreign currency transactions | 0.27 |
| | (4.48 | ) | | 5.13 |
| | 2.27 |
| | (0.82 | ) |
| Total from investment operations | 0.54 |
| | (4.23 | ) | | 5.26 |
| | 2.23 |
| | (0.93 | ) |
| | | | | | | | | | |
| Dividends from net investment income | (0.27 | ) | | (0.25 | ) | | (0.13 | ) | | — |
| | — |
|
| Distributions from net short-term realized gains | — |
| | — |
| | (4.33 | ) | | — |
| | — |
|
| Distributions from net long-term realized gains | — |
| | — |
| | (0.54 | ) | | (0.85 | ) | | — |
|
| Total distributions | (0.27 | ) | | (0.25 | ) | | (5.00 | ) | | (0.85 | ) | | — |
|
| | | | | | | | | | |
| Net increase (decrease) in net asset value | 0.27 |
| | (4.48 | ) | | 0.26 |
| | 1.38 |
| | (0.93 | ) |
| Net asset value at end of period | $ | 26.81 |
| | $ | 26.54 |
| | $ | 31.02 |
| | $ | 30.76 |
| | $ | 29.38 |
|
| | | | | | | | | | |
| Total return (%) | 2.1 |
| | (13.7 | ) | | 17.1 |
| | 7.6 |
| | (3.1 | ) |
| | | | | | | | | | |
| Ratios: | | | | | | | | | |
| Operating expenses to average net assets (%) | 1.22 |
| | 1.15 |
| | 1.15 |
| | 1.17 |
| | 1.12 |
|
| Net investment income (loss) to average net assets (%) | 0.97 |
| (b) | 0.82 |
| (c) | 0.38 |
| | (0.15 | ) | | (0.37 | ) |
| Portfolio turnover (%) | 442 |
| | 362 |
| | 423 |
| | 436 |
| | 345 |
|
| Net assets at end of period (in thousands) ($) | 295,720 |
| 325,037 | | 415,584 | | 387,721 | | 401,579 | |
(a) Per share net investment income (loss) has been calculated using the average shares outstanding during the period.
(b) Net Investment income per share reflects non-recurring dividends which amounted to $0.05 per share. Excluding these non-recurring dividends, the ratio of net investment income to average net assets would have been 0.77%.
(c) Net Investment income per share reflects non-recurring dividends which amounted to $0.08 per share. Excluding these non-recurring dividends, the ratio of net investment income to average net assets would have been 0.56%.
See accompanying notes to financial statements.
9
|
|
| |
| CGM MUTUAL FUND |
| |
| NOTES TO FINANCIAL STATEMENTS — December 31, 2019 |
| |
1. Organization — CGM Mutual Fund (the "Fund") is a diversified series of CGM Trust (the "Trust") which is organized as a Massachusetts business trust under the laws of Massachusetts pursuant to an Agreement and Declaration of Trust. The Trust is registered under the Investment Company Act of 1940 as an open-end management investment company and is following accounting and reporting guidance in the Financial Accounting Standards Board’s (“FASB”) Topic 946 “Financial Services—Investment Companies”. The Trust has two other funds whose financial statements are not presented herein. The Fund commenced operations on November 5, 1929. The Fund’s objective is reasonable long-term capital appreciation with a prudent approach to protection of capital from undue risks. Current income is a consideration in the selection of the Fund’s portfolio securities, but it is not a controlling factor.
2. Significant accounting policies — Management has evaluated the events and transactions from December 31, 2019 through the date of issuance of the Fund’s financial statements. For the Fund, there were no material subsequent events that required disclosure in the financial statements or footnotes.
A. Security valuation — Equity securities are valued on the basis of valuations furnished by a pricing service, authorized by the Board of Trustees (the “Board”). Equity securities listed or regularly traded on a securities exchange or in the over-the-counter (“OTC”) market are valued at the last quoted sale price or, for certain markets, the official closing price at the time the valuations are made. A security that is listed or traded on more than one exchange is valued at the quotation on the exchange determined to be the primary market for such security. For securities with no sale reported, the last reported bid price is used. Corporate debt securities are valued on the basis of valuations furnished by a pricing service, authorized by the Board, which determines valuations for normal, institutional-size trading units of such securities using market information, transactions for comparable securities and various relationships between securities which are generally recognized by institutional traders. United States government debt securities are valued at the current closing bid, as last reported by a pricing service approved by the Board.
When current market prices or quotations are not readily available or do not accurately reflect fair value, valuations may be determined in accordance with procedures adopted by the Board. For example, when developments occur between the close of a market and the close of the New York Stock Exchange ("NYSE") that may materially affect the value of some or all of the securities, or when trading in a security is halted, these procedures may be used. The frequency with which these procedures are used is unpredictable. These valuation procedures may result in a change to a particular security’s assigned level within the fair value hierarchy described below. The value of securities used for net asset value (“NAV”) calculation under these procedures may differ from published prices for the same securities.
The Fund may use valuation techniques consistent with the market, income, and cost approach to measure fair value. The market approach uses prices and other relevant information generated by market transactions involving identical or comparable assets or liabilities. The income approach uses valuation techniques to convert future amounts (cash flows, earnings) to a single present amount. The cost approach is based on the amount that currently would be required to replace the service capacity of an asset. To increase consistency and comparability in fair value measurements and related disclosure, the Fund utilizes a fair value hierarchy which prioritizes the various inputs to valuation techniques used to measure fair value into three broad levels:
| |
| • | Level 1 - Prices determined using: quoted prices in active markets for identical securities that the Fund has the ability to access at the measurement date. Valuation adjustments are not applied to Level 1 investments. |
| |
| • | Level 2 - Prices determined using: other significant observable inputs (including quoted prices for similar securities, interest rates, prepayment spreads, credit risk, etc.). |
|
|
| |
| CGM MUTUAL FUND |
| |
| NOTES TO FINANCIAL STATEMENTS (continued) |
| |
| |
| • | Level 3 - Prices determined using: significant unobservable inputs, including the Fund’s own assumptions and judgment in determining the fair value of investments. In situations where quoted prices or observable inputs are unavailable (for example, when there is little or no market activity for an investment at the end of the period), unobservable inputs may be used. Unobservable inputs reflect the Fund’s own assumptions about the factors market participants would use in pricing an investment, and would be based on the best information available in the circumstances. Investments falling into the Level 3 category are primarily supported by quoted prices from brokers and dealers participating in the market for those investments. However, these may be classified as Level 3 investments due to lack of market transparency and corroboration to support these quoted prices. Additionally, valuation models may be used as the pricing source for any remaining investments classified as Level 3. These models rely on one or more significant unobservable inputs and/or significant assumptions by Capital Growth Management Limited Partnership, the Fund’s investment adviser (“CGM”). Inputs used in valuations may include, but are not limited to, financial statement analysis, capital account balances, discount rates and estimated cash flows, and comparable company data. |
The inputs or methodology used for valuing securities are not necessarily an indication of the risk associated with investing in those securities. The following is a summary of the inputs used to value the Fund’s investments as of December 31, 2019:
|
| | | | | | | | | | | |
| | | | Valuation Inputs |
| | Classification | | Level 1 -
Quoted Prices | | Level 2 - Other Significant Observable Inputs | | Level 3 - Significant Unobservable Inputs |
| | Investments in Securities-Assets | | | | | | |
| | Common Stocks* | | $ | 215,909,550 |
| | — | | — |
| | Bonds | | | | | |
|
| | United States Treasury Notes | | — | | $ | 76,751,953 |
| | — |
| | Short-Term Investment | | | | | | |
| | Repurchase Agreement | | — | | 1,730,000 |
| | — |
| | Total | | $ | 215,909,550 |
| | $ | 78,481,953 |
| | — |
| | | | | | | | |
| * | All common stocks held in the Fund are Level 1 securities. For a detailed break-out of common stocks by major industry classification, please refer to the Schedule of Investments. |
B. Security transactions and related investment income — Security transactions are accounted for on the trade date plus one basis for daily NAV calculations. However, for financial reporting purposes, investment transactions are reported on the trade date (date the order to buy or sell is executed). Dividend income is recorded on the ex-dividend date net of applicable foreign taxes and fees, a portion of which may be recoverable. The Fund will accrue such taxes and recoveries as applicable based upon its current interpretations of the tax rules and regulations that exist in the markets in which it invests. Interest income is recorded on an accrual basis and includes amortization of premium and discount. Net gain or loss on securities sold is determined on the identified cost basis and may include proceeds from litigation. Dividend payments received by the Fund from its investment in real estate investment trusts (“REITs”) may consist of ordinary income, capital gains, and return of capital and as such are recorded as dividend income, capital gains or a reduction to security cost, as appropriate. Distributions from publicly traded partnerships are generally recorded based on the characterization reported on the Fund’s schedule K-1 received from the partnership. Non-cash dividend payments, if any, are recorded at the fair market value of the securities received.
|
|
| |
| CGM MUTUAL FUND |
| |
| NOTES TO FINANCIAL STATEMENTS (continued) |
| |
C. Federal income taxes — It is the Fund’s policy to comply with the requirements of the Internal Revenue Code ("IRC") applicable to regulated investment companies, and to distribute to its shareholders all of its taxable income and net realized capital gains, within the prescribed time period.
Capital accounts within the financial statements are adjusted for permanent book/tax differences. These adjustments have no impact on the Fund's net assets or results of operations. Temporary book/tax differences, if any, will reverse in a subsequent period. Any difference between book basis and tax basis unrealized appreciation is attributable primarily to the temporary book/tax difference of tax deferral of losses on wash sales.
As of December 31, 2019, the components of distributable earnings on a tax basis were as follows:
|
| | | | |
| Undistributed Ordinary Income | | Undistributed Long-term Capital Gains | | Net Unrealized Appreciation/ (Depreciation) |
| — | | — | | $14,562,158 |
The identified cost of investments in securities owned by the Fund for federal income tax purposes, and their respective gross unrealized appreciation and depreciation at December 31, 2019 was as follows:
|
| | | | | | |
| Identified Cost | | Gross Unrealized Appreciation | | Gross Unrealized Depreciation | | Net Unrealized Appreciation |
| $279,829,345 | | $15,779,118 | | $(1,216,960) | | $14,562,158 |
The Fund is permitted to carry forward capital losses for an unlimited period, and such losses, when carried forward, retain their character as either short-term or long-term capital losses. As of December 31, 2019, the capital loss carryforwards utilized and the accumulated net realized loss on sales of investments for federal income tax purposes which are available to offset future taxable gains, prior to distributing such gains to shareholders, are shown in the table below:
|
| | | | | | | | | | |
Short-term Capital Loss Carryforward Utilized | | Long-term Capital Loss Carryforward Utilized | | Total | | Remaining Short-term Capital Loss Carryforward | | Remaining Long-term Capital Loss Carryforward | | Total |
| — | | — | | — | | $24,124,600 | | $1,816,681 | | $25,941,281 |
Management has concluded that there are no significant uncertain tax positions for the open tax years as of December 31, 2019 that would require recognition in the financial statements. However, management’s conclusion may be subject to review and adjustment at a later date based on factors including, but not limited to, new tax laws, regulations, and administrative interpretations (including relevant court decisions). Generally, the Fund's federal tax returns for the prior three fiscal years remain subject to examination by the Internal Revenue Service.
D. Dividends and distributions to shareholders — Dividends and distributions are recorded by the Fund on the ex-dividend date. The classification of income and capital gains distributions is determined in accordance with income tax regulations. Distributions from net investment income and short-term capital gains are treated as ordinary income for income tax purposes. Permanent book/tax differences relating to shareholder distributions may result in reclassifications to paid-in capital or accumulated realized gain/(loss). The Fund also may utilize earnings and profits distributed to shareholders on redemption of shares as a part of the dividend deduction for income tax purposes. Undistributed net investment income or accumulated net investment loss may include temporary book/tax
|
|
| |
| CGM MUTUAL FUND |
| |
| NOTES TO FINANCIAL STATEMENTS (continued) |
| |
differences such as tax deferral of losses on wash sales, which will reverse in a subsequent period. Any taxable income or gain remaining at fiscal year end is distributed in the following year.
The tax characterization of distributions is determined on an annual basis. The tax character of distributions paid during the periods ended December 31, 2019 and 2018 were as follows:
|
| | | | | | |
| Year | | Ordinary
Income | | Long-term
Capital Gains | | Total |
| 2019 | | $ 3,119,515 | | — | | $ 3,119,515 |
| 2018 | | $ 3,131,246 | | — | | $ 3,131,246 |
E. Guarantees and indemnifications — Under the Trust's organizational documents, its officers and trustees are indemnified against certain liabilities arising out of the performance of their duties for the Fund. Additionally, in the normal course of business, the Fund may enter into contracts with service providers that contain general indemnification clauses. The Fund's maximum exposure under these arrangements is unknown, as this would involve future claims that may be made against the Fund that have not yet occurred. The risk of material loss from such claims is considered remote.
F. Foreign currency translation — All assets and liabilities initially expressed in terms of foreign currencies are translated into U.S. dollars each day at the prevailing exchange rate. Transactions affecting Statement of Operations accounts and net realized gain or loss on investments are translated at the rates prevailing at the dates of the transactions. The Fund does not isolate that portion of the results of operations resulting from changes in foreign exchange rates on investments from the fluctuations arising from changes in market prices of securities held. Such fluctuations are included with the net realized and unrealized gain or loss from investments. Reported net realized foreign exchange gains or losses arise from sales of foreign currency, currency gains or losses realized between the trade and settlement dates on securities transactions and the difference between the amounts of dividends, interest, and foreign withholding taxes recorded on the Fund’s books and the U.S. dollar equivalent of the amounts actually received or paid. Net unrealized foreign exchange gains or losses arise from changes in the value of assets and liabilities other than investments in securities at the end of the period, resulting from changes in the exchange rate.
G. Repurchase agreements — The Fund enters into repurchase agreements, under the terms of a Master Repurchase Agreement, secured by U.S. Government or Agency securities, which involve the purchase of securities from a counterparty with a simultaneous commitment to resell the securities at an agreed upon date and price. Certain repurchase agreements are tri-party arrangements whereby the collateral is held in a segregated account for the benefit of the Fund and on behalf of the counterparty. Repurchase agreements afford the Fund the opportunity to earn a return on temporarily available cash at minimal market risk. While the underlying security may be a bill, certificate of indebtedness, note or bond issued by an agency, authority or instrumentality of the U.S. Government, the obligation of the seller is not guaranteed by the U.S. Government and there is a risk that the seller may fail to repurchase the underlying security. Consequently, there may be possible delays or restrictions upon the Fund’s ability to dispose of the underlying securities. Upon an event of default under the Master Repurchase Agreement, the Fund would attempt to exercise its rights with respect to the underlying security, including taking possession of the cash and/or collateral provided by the seller.
At December 31, 2019, the Fund had an investment in a repurchase agreement with a gross value of $1,730,000 on the Statement of Assets and Liabilities. The value of the related collateral consisting of cash, interest and/or securities of $1,768,194 exceeded the value of the repurchase agreement at December 31, 2019 by $38,194.
|
|
| |
| CGM MUTUAL FUND |
| |
| NOTES TO FINANCIAL STATEMENTS (continued) |
| |
H. Use of estimates — The preparation of financial statements in accordance with U.S. Generally Accepted Accounting Principles (“GAAP”) requires management to make certain estimates and assumptions that affect the reported amounts of assets and liabilities, the disclosure of contingent assets and liabilities at the date of the financial statements and the reported amounts of revenue and expenses during the reporting period. Actual results could differ from those estimates.
3. Risks and uncertainties
A. Risks associated with focused investing — The Fund, although diversified, takes a focused approach to investing within particular industries or sectors of the economy and may invest in a relatively small number of individual holdings. Therefore, the Fund may be subject to greater price volatility and may be more adversely affected by the performance of particular industries, sectors, or individual holdings than would a more diversified fund. In addition, funds that invest more heavily in certain industries, sectors or individual holdings are particularly susceptible to the impact of market, economic, regulatory and other factors affecting those investments.
B. Risks associated with foreign investments — The Fund may invest in securities issued by institutions, corporations, and governments established by or located in foreign countries, which may be developed or undeveloped countries. Investing in foreign securities may involve significant risks. For example, there is often less publicly available information about foreign companies, particularly those not subject to the disclosure and reporting requirements of the U.S. securities laws. Foreign issuers are often not bound by uniform accounting, auditing, and financial reporting requirements and standards of practice comparable to those applicable to domestic issuers. Investments in foreign securities also involve the risk of possible adverse changes in investment or exchange control regulations, expropriation or confiscatory taxation, political or financial instability or diplomatic and other developments which could affect such investments. Foreign stock markets, while growing in volume and sophistication, are often not as developed as those in the U.S., and securities of some foreign issuers (particularly those located in developing countries) may be less liquid and more volatile than securities of comparable U.S. companies. There may also be less overall governmental supervision and regulation of foreign securities markets, broker-dealers and issuers than in the U.S. Additionally, because some foreign securities the Fund may acquire are purchased with and payable in foreign currencies, the value of these assets as measured in U.S. dollars may be affected favorably or unfavorably by changes in currency rates and exchange control regulations. There is no limit on the amount that the Fund may invest in issuers located in a single country or in foreign countries in the aggregate. To the extent the Fund focuses its investments in a single country or only a few countries in a particular geographic region, economic, political, regulatory or other conditions affecting such country or region may have a greater impact on Fund performance relative to a more geographically diversified fund.
A substantial portion of the Fund’s portfolio may be invested in American Depositary Receipts of companies domiciled in Brazil. The risks of foreign investments described above are generally heightened when investing in issuers in emerging market countries, such as Brazil. Investing in Brazilian issuers involves certain special risks, including investment and repatriation controls, fluctuations in the rate of exchange between Brazil’s currency (the Real) and the U.S. Dollar, political instability, corruption and price volatility. In addition, the market for Brazilian securities is influenced by the flow of international capital and economic and market conditions of certain countries, especially other emerging market countries in Central and South America. The Brazilian economy has historically been exposed to high rates of inflation and a high level of debt, each of which may reduce and/or prevent economic growth. Brazilian securities may also be particularly sensitive to market movements because their market prices tend to reflect speculative expectations.
4. Purchases and sales of securities — For the year ended December 31, 2019, purchases and sales of securities other than U.S. Government or Agency obligations and short-term investments aggregated $1,370,625,636 and
|
|
| |
| CGM MUTUAL FUND |
| |
| NOTES TO FINANCIAL STATEMENTS (continued) |
| |
$1,395,748,144, respectively. For long-term government obligations, there were $31,398,985 of purchases and $21,987,109 of sales.
5. Fees and expenses
A. Management fees — During the year ended December 31, 2019, the Fund incurred management fees of $2,896,505, paid or payable monthly to CGM, certain officers and employees of which are also officers and trustees of the Fund. The management agreement provides for a fee at the annual rate of 0.90% on the first $500 million of the Fund’s average daily net assets, 0.80% of the next $500 million of the Fund’s average daily net assets and 0.75% of such assets in excess of $1 billion of the Fund’s average daily net assets.
B. Other expenses — The majority of expenses are directly attributable to the Fund. Expenses that are not readily attributable to the Fund are allocated among each of the three funds comprising the Trust in an equitable manner, taking into consideration, among other things, the nature and type of expense and the funds' respective net assets. CGM performs certain administrative, accounting, compliance and other services for the Fund. The expenses of those services, which are paid to CGM by the Fund, include the following: (i) expenses for personnel performing bookkeeping, accounting and financial reporting and clerical functions relating to the Fund; (ii) expenses for services required in connection with the preparation of registration statements and prospectuses, shareholder reports and notices, proxy solicitation material furnished to shareholders of the Fund or regulatory authorities and reports and questionnaires for Securities and Exchange Commission ("SEC") compliance; (iii) registration, filing and other fees in connection with requirements of regulatory authorities and (iv) compliance in connection to the Investment Company Act of 1940 and the Sarbanes-Oxley Act of 2002. The accounting, administration and compliance expenses of $346,597, for the year ended December 31, 2019, are shown separately in the Statement of Operations. These expenses include the reimbursement of a portion of the compensation expenses incurred by CGM for its employees who provide these administrative, accounting, compliance, and other services to the Fund, including $313,088 of the salaries of CGM employees who are officers of the Fund.
C. Trustees fees and expenses — The Fund does not pay any compensation directly to any trustees who are “interested persons” (as defined in the Investment Company Act of 1940) of CGM or any affiliate of CGM (other than registered investment companies). For the year ended December 31, 2019, each disinterested trustee was compensated by the Trust with an annual fee of $90,000 plus travel expenses for each meeting attended. The disinterested trustees are responsible for the audit committee functions of the Trust’s Board and have designated a disinterested trustee to lead the Board's efforts in overseeing those functions, who receives an additional $30,000 annually. Of these amounts, the Fund is responsible for $10,000 per trustee annually, plus an annual variable fee calculated based on the proportion of the Fund’s average net assets relative to the aggregate average net assets of the Trust.
6. Recent accounting pronouncement
A. Fair value measurement — In August 2018, the FASB issued Accounting Standards Update 2018-13, Fair Value Measurement (Topic 820) - Disclosure Framework - Changes to the Disclosure Requirements for Fair Value Measurement (“ASU 2018-13”) which introduces new fair value disclosure requirements and eliminates and modifies certain existing fair value disclosure requirements. ASU 2018-13 would be effective for fiscal years beginning after December 15, 2019, and interim periods within those fiscal years; however, management has elected to adopt ASU 2018-13 effective with the current reporting period. The impact of the fund’s adoption is limited to changes in the fund’s financial statement disclosures regarding fair value, primarily those disclosures related to transfers between levels of the fair value hierarchy.
|
|
| |
| CGM MUTUAL FUND |
| |
| REPORT OF INDEPENDENT REGISTERED PUBLIC ACCOUNTING FIRM |
| |
To the Board of Trustees of CGM Trust and Shareholders of CGM Mutual Fund
Opinion on the Financial Statements
We have audited the accompanying statement of assets and liabilities, including the schedule of investments, of CGM Mutual Fund (the "Fund") as of December 31, 2019, the related statement of operations for the year ended December 31, 2019, the statement of changes in net assets for each of the two years in the period ended December 31, 2019, including the related notes, and the financial highlights for each of the five years in the period ended December 31, 2019 (collectively, referred to as the “financial statements”). In our opinion, the financial statements present fairly, in all material respects, the financial position of the Fund as of December 31, 2019, the results of its operations for the year then ended, the changes in its net assets for each of the two years in the period ended December 31, 2019 and the financial highlights for each of the five years in the period ended December 31, 2019 in conformity with accounting principles generally accepted in the United States of America.
Basis for Opinion
These financial statements are the responsibility of the Fund’s management. Our responsibility is to express an opinion on the Fund’s financial statements based on our audits. We are a public accounting firm registered with the Public Company Accounting Oversight Board (United States) (“PCAOB”) and are required to be independent with respect to the Fund in accordance with the U.S. federal securities laws and the applicable rules and regulations of the Securities and Exchange Commission and the PCAOB.
We conducted our audits of these financial statements in accordance with the standards of the PCAOB. Those standards require that we plan and perform the audit to obtain reasonable assurance about whether the financial statements are free of material misstatement, whether due to error or fraud.
Our audits included performing procedures to assess the risks of material misstatement of the financial statements, whether due to error or fraud, and performing procedures that respond to those risks. Such procedures included examining, on a test basis, evidence regarding the amounts and disclosures in the financial statements. Our audits also included evaluating the accounting principles used and significant estimates made by management, as well as evaluating the overall presentation of the financial statements. Our procedures included confirmation of securities owned as of December 31, 2019 by correspondence with the custodian and brokers; when replies were not received from brokers, we performed other auditing procedures. We believe that our audits provide a reasonable basis for our opinion.
PricewaterhouseCoopers LLP
Boston, Massachusetts
February 14, 2020
We have served as the auditor of one or more investment companies in Capital Growth Management Investment Company Complex since at least 1994. We have not determined a specific year we began serving as auditor.
|
|
| |
| CGM MUTUAL FUND |
| |
| ADDITIONAL INFORMATION |
| (unaudited) |
Availability of proxy voting information:
Proxy voting policies and information regarding how the Fund voted proxies relating to portfolio securities during the twelve month period ended June 30, 2019 are available without charge, by calling 800-345-4048. The policies also appear in the Fund’s Statement of Additional Information, which can be found on the CGM Funds' website, www.cgmfunds.com, and the SEC’s website, www.sec.gov. The voting records can also be found on the SEC’s website on the N-PX filing.
Portfolio holdings:
The Fund files its complete schedule of portfolio holdings with the SEC for the first and third quarters of each fiscal year on Form N–PORT, which is available on the SEC's website at www.sec.gov. Portfolio holdings are also disclosed in the Fund's quarterly reports. The Fund's four most recent quarterly reports can be obtained on the CGM Funds' website, www.cgmfunds.com.
The Fund’s Prospectus and Statement of Additional Information contain additional information on other risks and uncertainties relating to the Fund’s investments. The Fund’s Prospectus and Statement of Additional Information can be obtained on the CGM Funds' website, www.cgmfunds.com, and the SEC’s website, www.sec.gov or by calling 800-345-4048.
Liquidity Risk Management Program:
On October 13, 2016, the Securities and Exchange Commission (“SEC”) adopted Rule 22e-4 (“Liquidity Rule”) under the Investment Company Act of 1940 (“1940 Act”) which requires registered open-end funds to establish and implement a written Liquidity Risk Management Program reasonably designed to assess and manage its liquidity risk. The Fund must also periodically review its liquidity risk. In addition, a written report is provided to the Fund’s Board of Trustees annually which details the operation of the Fund’s program.
Pursuant to its program, the Fund classifies the liquidity of its portfolio investments into one of the four categories defined by the SEC: “Highly Liquid”, “Moderately Liquid”, “Less Liquid” and “Illiquid”. These classifications are reported to the SEC on Form N-PORT. The Liquidity Rule requires open-end funds that are not invested primarily in “Highly Liquid” investments to establish a “Highly Liquid Investment Minimum” (“HLIM”), which is the minimum percentage of net assets that must be invested in Highly Liquid investments (i.e., cash or investments that are reasonably expected to be convertible into cash within three business days without significantly changing the market value of the investment). It was determined through periodic reviews that the Fund’s portfolio holdings have been primarily Highly Liquid and, therefore, the Fund does not need to establish a HLIM.
The Fund may not acquire an investment if, immediately after the acquisition, over 15% of the Fund’s net asset would consist of Illiquid investments (an investment that cannot reasonably be expected to be sold or disposed of in current market conditions in seven calendar days or less without the sale or disposition significantly changing the market value of the investment). The Fund is required to report to the SEC and the Fund’s Board of Trustees if the Fund holds illiquid investments in excess of the 15% limit. No such reporting was required during the past year. In addition, periodic stress testing confirmed that the Fund held sufficient liquid investments to cover all reasonably foreseeable levels of cash flow.
|
|
| |
| CGM MUTUAL FUND |
| |
| ADDITIONAL INFORMATION |
| (unaudited) |
TAX INFORMATION FOR THE TAX YEAR ENDED December 31, 2019
(unaudited)
We are providing this information as required by the IRC.
For taxable non-corporate shareholders, 100% of the 2019 ordinary dividend is considered qualified dividend income that may be eligible for reduced capital gains rates.
For corporate shareholders, 31.7% of the 2019 ordinary dividend qualifies for the dividends-received deduction.
|
|
| |
| CGM MUTUAL FUND |
| |
| FUND EXPENSES |
| (unaudited) |
As a shareholder of CGM Mutual Fund, you incur two types of costs: (1) transaction costs, which could include, among other charges, wire fees and custodial maintenance fees for certain types of accounts and (2) ongoing costs, including management fees and other Fund expenses. This example is intended to help you understand your ongoing costs (in dollars) of investing in the Fund and to compare these costs with the ongoing costs of investing in other mutual funds.
The example is based on an investment of $1,000 invested at the beginning of the period and held for the entire period July 1, 2019 to December 31, 2019.
Actual return and expenses
The first line of the table below provides information about actual account values and actual expenses.
You may use the information in this line, together with the amount you invested, to estimate the expenses that you paid over the period. Simply divide your account value by $1,000 (for example, an $8,600 account value divided by $1,000 = 8.6), then multiply the result by the number in the first line under the heading entitled ‘‘Expenses Paid During Period’’ to estimate the expenses you paid on your account during this period.
Hypothetical example for comparison purposes
The second line of the table below provides information about hypothetical account values and hypothetical expenses based on the Fund’s actual expense ratio and an assumed rate of return of 5% per year before expenses, which is not the Fund’s actual return. The hypothetical account values and expenses may not be used to estimate the actual ending account balance or expenses you paid for the period.
You may use this information to compare the ongoing costs of investing in the Fund and other funds. To do so, compare this 5% hypothetical example with the 5% hypothetical examples that appear in the shareholder reports of the other funds.
Please note that the expenses shown in the table are meant to highlight your ongoing costs only and do not reflect any transactional costs such as any wire fees or custodial maintenance fees that may be payable. Therefore, the second line of the table is useful in comparing ongoing costs only, and will not help you determine the relative total costs of owning different funds. In addition, if these transactional costs were included, your costs would have been higher.
|
| | | |
| | Beginning Account Value 07/01/19 | Ending Account Value
12/31/19 | Expenses Paid During Period* 07/01/19 - 12/31/19 |
| Actual | $1,000.00 | $ 975.57 | $6.14 |
Hypothetical
(5% return before expenses) | $1,000.00 | $ 1,018.99 | $6.28 |
* Expenses are equal to the Fund’s annualized expense ratio of 1.23%, multiplied by the average account value over the period, multiplied by 184/365 (to reflect the one-half year period).
|
|
| |
| CGM MUTUAL FUND |
| |
| TRUSTEES AND OFFICERS |
The Fund is supervised by the Board of Trustees (the “Board”) of the Trust. The Board is responsible for the general oversight of the Fund, including general supervision and review of the Fund’s investment activities. The Board, in turn, elects the officers who are responsible for administering the Fund’s day-to-day operations.
An asterisk in the following table identifies those trustees and officers who are “interested persons” of the Trust as defined in the Investment Company Act of 1940. Each trustee and officer of the Trust noted as an interested person is interested by virtue of that individual’s position with CGM, as described in the table below. Each trustee serves during the continued lifetime of the Trust, until he or she earlier dies, resigns or is removed, or if sooner, until the election and qualification of his or her successor. Each officer serves until his or her successor is elected or qualified, or until the officer sooner dies, resigns, or is removed or becomes disqualified.
The trustees and officers of the Trust, their ages, their principal occupations during the past five years, the number of CGM Funds they oversee, and other directorships they hold are set forth below. Unless otherwise noted below, the address of each interested trustee and officer is One International Place, Boston, Massachusetts 02110. Correspondence intended for the trustees who are not “interested persons” of the Trust may be sent c/o Capital Growth Management, One International Place, Boston, Massachusetts 02110. The Statement of Additional Information for the Fund includes additional information about Fund trustees and is available on the CGM Funds' website, www.cgmfunds.com, or by calling 800-345-4048.
|
| | | | | | |
| Name |
| Positions Held and Length of Time Served |
| Principal Occupations and Other Directorships Held During Past 5 Years |
| Number of Funds in the CGM Funds Complex Overseen |
| (Birth Year) |
|
| Interested Trustees | |
| |
| |
|
| Ken Heebner* | | Trustee since 1993 | | Co-founder and Employee, CGM; Controlling owner of Kenbob, Inc. (general partner of CGM) | | 3 |
| (1940) | | | | |
Leslie A. Lake*
| | Trustee since 2013 | | Consultant to CGM (since 2013) | | 3 |
| (1945) | | | | |
| Disinterested Trustees | | | | | | |
Peter O. Brown
| | Trustee since 1993 | | Counsel (formerly, Partner), Harter, Secrest & Emery LLP (law firm); formerly Executive Vice President and Chief Operating Officer, The Glenmede Trust Company (from 1990 to 1993); formerly Senior Vice President, J.P. Morgan Chase Bank (from 1981 to 1990); formerly Trustee, TT International U.S.A. Master and Feeder Trusts (four mutual funds) (from 2000 to 2005) | | 3 |
| (1940) | | | | |
| Mark W. Holland | | Trustee since 2004 | | President, Wellesley Financial Advisors, LLC (since 2003); formerly Vice President and Chief Operating Officer, Fixed Income Management, Loomis, Sayles & Company, L.P. (from 1999 to 2002); formerly Director, Loomis, Sayles & Company, L.P. (from 1993 to 2001) | | 3 |
| (1949) | | | | |
| | | | | | | |
| | | | | | | |
|
| | | | | | |
| Name |
| Positions Held and Length of Time Served |
| Principal Occupations and Other Directorships Held During Past 5 Years |
| Number of Funds in the CGM Funds Complex Overseen |
| (Birth Year) |
|
| J. Baur Whittlesey | | Trustee since 1990 | | Member (1994 to 2016) and Senior Counsel (since 2017), Ledgewood, P.C. (law firm) | | 3 |
| (1946) | | | | |
| | | | | | | |
| Officers | |
| |
| |
|
| Ken Heebner* | | Vice President since 1990 | | Co-founder and Employee, CGM; Controlling owner of Kenbob, Inc. (general partner of CGM) | | 3 |
| (1940) | | | | |
David C. Fietze*
| | President since 2015 and Chief Compliance Officer since 2004 | | Employee – Legal Counsel, CGM | | 3 |
| (1969) | | | | |
Kathleen S. Haughton*
| | Vice President since
1992 and Anti-Money Laundering Compliance Officer since 2002 | | Employee – Investor Services Division, CGM | | 3 |
| (1960) | | | 38 Newbury St., Boston, MA 02116 | | |
| Jem A. Hudgins* | | Treasurer since 2004 | | Employee – Treasury Operations, CGM | | 3 |
| (1963) | | | | |
Leslie A. Lake*
| | Vice President (1992 to 2013) and Secretary since 1992
| | Consultant to CGM (since 2013) | | 3 |
| (1945) | | | | |
| Martha I. Maguire* | | Vice President since 1994 | | Consultant to CGM (since 2013) | | 3 |
| (1955) | | | | |
| Nicole M. Fembleaux* | | Assistant Vice President since 2011 | | Employee – Operations, CGM | | 3 |
| (1979) | | | | |
| Kevin Ure* | | Vice President since 2013 | | Employee – Accounts Admin. Operations, CGM | | 3 |
| (1971) | | | | |
| Tony Figueiredo* | | Vice President since 2013 | | Employee – Investor Services Division, CGM | | 3 |
| (1960) | | | 38 Newbury St., Boston, MA 02116 | | |
Deidra Hewardt*
| | Assistant Treasurer since 2014 | | Employee – Treasury Operations, CGM | | 3 |
| (1972) | | | 38 Newbury St., Boston, MA 02116 | | |
| | | | | | | |
|
| |
| INVESTMENT ADVISER |
| CAPITAL GROWTH MANAGEMENT |
| LIMITED PARTNERSHIP |
| Boston, Massachusetts 02110 |
|
| |
| CUSTODIAN OF ASSETS |
STATE STREET BANK AND TRUST COMPANY
Boston, Massachusetts 02111 |
|
| |
| TRANSFER AGENT |
DST ASSET MANAGER SOLUTIONS, INC.
P.O. Box 219252
Kansas City, Missouri 64121-9252 |
|
| | |
| TELEPHONE NUMBERS |
| For information about: |
| n | Account Procedures |
| n | Purchases |
| n | Redemptions |
| n | Exchanges
Call 800-343-5678 |
| n | New Account Procedures and Status |
| n | Prospectus & SAI |
| n | Performance |
| n | Proxy Voting Policies and Voting Records |
| n | Complete Schedule of Portfolio Holdings
for the 1st & 3rd Quarters
Call 800-345-4048 |
| | | |
| MAILING ADDRESS |
| The CGM Funds |
| c/o DST Asset Manager Solutions, Inc. |
| P.O. Box 219252 |
| Kansas City, MO 64121-9252 |
| |
| |
| WEBSITE |
| www.cgmfunds.com |
| |
| |
| This report has been prepared for the shareholders of the Fund and is not authorized for distribution to current or prospective investors in the Fund unless it is accompanied or preceded by a prospectus. |
| | |
| RAR19 | Printed in U.S.A. |
CGM
Realty Fund
26th Annual Report
December 31, 2019
A No-Load Fund
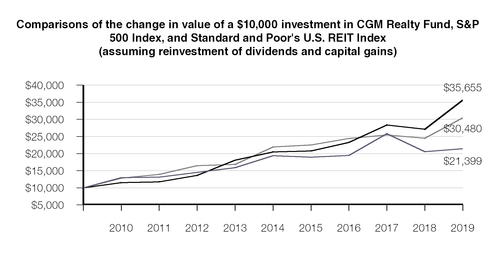
CGM Realty Fund decreased -1.8% during the fourth quarter of 2019 compared to the Standard and Poor’s 500 Index (S&P 500 Index) which increased 9.1% and the Standard and Poor’s U.S. REIT Index which returned -0.8%. For the twelve months ended December 31, 2019, CGM Realty Fund increased 3.9%, the S&P 500 Index increased 31.5% and the Standard and Poor’s U.S. REIT Index returned 24.5%.
The Year in Review and Economic Outlook
The longest bull market in history continued into its tenth year in 2019. After a market sell-off in late 2018, U.S. stocks surged early in the year despite the lengthiest U.S. government shutdown in history and concerns about global economic growth. In January, strong employment numbers and wage reports from the Labor Department as well as indications from the Federal Reserve that interest rates would remain steady propelled the market to its best monthly performance in three years. U.S. - China trade tensions affected the market throughout the year and in early February, stocks rose when the Trump administration agreed to hold off on a 25% increase in tariffs on $200 billion of Chinese goods. But by March, impatience with progress in trade negotiations depressed stock prices. Markets were also discouraged, at least initially, when the European Central Bank attempted to boost its sluggish economy by holding interest rates unchanged through the end of the year. Nevertheless, the market enjoyed a strong finish to the first quarter after the Labor Department reported that worker productivity, which directly impacts wages and output, jumped 1.9% in the fourth quarter of 2018.
In April we learned that economic growth in the first quarter was the strongest in four years with gross domestic product rising at a vigorous 3.1% annualized rate. Concerns about a global recession faded as China reported surprisingly strong retail sales numbers and an overall 6.4% growth rate for its first quarter despite ongoing trade tensions with the U.S. Domestic economic indicators remained largely positive through the rest of the first half of the
year though tempered global growth, recurring trade tensions and a tightening labor market weighed on U.S. manufacturing growth and also led to contraction in European manufacturing. However, the Institute for Supply Management’s monthly non-manufacturing index indicated consistent expansion in the U.S. service sector in 2019 which offset the slowdown in manufacturing. Near the end of the second quarter, a meeting between President Trump and Chinese President Xi Jinping at the G-20 summit in Tokyo led to incremental progress in trade negotiations which helped boost stocks to their best mid-year returns in over two decades.
In the first of three rate cuts in 2019 (and the first reduction since 2008) the Fed reduced interest rates 0.25% in July. However, at the time, the Fed remained silent about future plans for economic stimulus and the market dropped on the rate cut news. In early August the Trump administration announced additional tariffs on Chinese goods which triggered new fears of a global economic slowdown and battered stock and commodity prices and bond yields. China subsequently reacted by allowing a swift and sizable depreciation of the yuan and threatened retaliatory tariffs on almost all remaining U.S. imports. The market declined in response to the heightening trade tensions along with news of slackening Chinese industrial production and contraction in the German economy. But again, trade tensions dissipated in late August and in mid-September, the Fed announced a second 0.25% rate cut. So, despite headwinds and conflicting indicators, markets closed in positive territory and the U.S. economy persevered with moderate gross domestic product growth of 2.1% in the third quarter.
U.S. economic growth continues to outperform global economies. Steady job growth, rising wages and solid consumer spending propelled the U.S. economy through year-end. In early December the unemployment rate dropped to a historically low 3.5% and the Labor Department reported the 110th consecutive month of job gains as employers added 266,000 new jobs. Wages were up 3.1% from a year earlier and continue to outpace inflation. Any
immediate concerns about a recession have diminished. After a third rate cut in October to “provide some insurance against ongoing risks,” the Fed held off on an additional rate reduction in December citing a favorable overall outlook for the economy. Corporate earnings have been surprisingly strong, boosting stock prices. U.S. - China trade tensions have eased as the countries agreed in principle to a “phase one” limited trade agreement that curtails U.S. tariffs on Chinese goods and includes commitments by China to purchase $50 billion of U.S. agricultural products along with energy and other goods. Additionally, a new trade pact with Canada and Mexico is nearly complete. Improved trade relations and sustained growth in the U.S. economy ultimately pushed the S&P 500 to its best performance since 2013.
Portfolio Strategy
The CGM Realty Fund’s investment in real estate investment trusts (REITs) fluctuated between 50% and 65% of the portfolio during 2019. Other significant industry investments were mining, commercial real estate brokers, homebuilders and money center banks.
REITs generally performed well last year though the total return for the Standard and Poor’s U.S. REIT Index came in just shy of the S&P 500 Index’s extraordinary total return for 2019. Several of our REIT holdings had significant appreciation. However, these gains were substantially offset by a large loss in one of our mining investments and by losses in homebuilders and money center banks.
On December 31, 2019, CGM Realty Fund was 50.9% invested in real estate investment trusts, including 16.3% in specialty REITS and 14.8% in office and industrial REITS. The Fund also held 17.9% in metals and mining companies and 10.1% in real estate services. The Fund’s three largest holdings were American Tower Corporation, Crown Castle International Corp. (infrastructure REITs) and CoreCivic, Inc. (specialty REIT).
David C. Fietze
President
G. Kenneth Heebner
Portfolio Manager
January 2, 2020
Average Annual Total Returns through 12/31/19
|
| | | | | | |
| | | | | 1 Year | 5 Year | 10 Year |
| | n | | CGM Realty Fund | 3.9% | 2.0% | 7.9% |
| | n | | S&P 500 Index | 31.5% | 11.7% | 13.6% |
| | n | | Standard and Poor's U.S. REIT Index | 24.5% | 6.8% | 11.8% |
Past performance is no indication of future results and current performance may be higher or lower than the figures shown. Unlike a fund, an index is not managed and does not reflect fees and expenses.
|
| | | |
| CGM REALTY FUND |
| Portfolio Manager |
G. Kenneth Heebner has managed CGM Realty Fund since its inception on May 13, 1994. In 1990, Mr. Heebner founded Capital Growth Management Limited Partnership ("CGM") with Robert L. Kemp. Prior to establishing CGM, Mr. Heebner managed mutual funds at Loomis, Sayles & Company. In addition to CGM Realty Fund, he currently manages CGM Mutual Fund and CGM Focus Fund.
|
| | | | |
| INVESTMENT PERFORMANCE |
| (unaudited) |
| Cumulative Total Returns for Periods Ended December 31, 2019 |
| | CGM Realty Fund (%) |
| 10 Years | + | 114.0 | | |
| 5 Years | + | 10.5 | | |
| 1 Year | + | 3.9 | | |
| 3 Months | - | 1.8 | | |
The performance data contained in the report represent past performance, which is no guarantee of future results. The graph and table above do not reflect the deduction of taxes a shareholder would pay on Fund distributions or the redemption of Fund shares and assumes the reinvestment of all Fund distributions.
The investment return and the principal value of an investment in the Fund will fluctuate so that investors' shares, when redeemed, may be worth more or less than their original cost. Current performance may be higher or lower than the performance data quoted.
PORTFOLIO DIVERSIFICATION as of December 31, 2019 COMMON STOCKS |
| | |
| Real Estate Investment Trusts | Percent of Net Assets |
|
| Specialty | 16.3 | % |
| Office and Industrial | 14.8 |
|
| Infrastructure | 13.4 |
|
| Mortgage | 5.0 |
|
| Residential | 1.4 |
|
| | |
| Other Common Stocks | |
| Metals and Mining | 17.9 |
|
| Real Estate Services | 10.1 |
|
| Housing and Building Materials | 8.1 |
|
| Oil - Independent Production | 6.1 |
|
| Home Products | 4.4 |
|
SCHEDULE OF INVESTMENTS as of December 31, 2019 COMMON STOCKS — 97.5% OF TOTAL NET ASSETS REAL ESTATE INVESTMENT TRUSTS — 50.9% |
| | | | | | | | |
| Infrastructure — 13.4% | Shares | | Value(a) |
| | American Tower Corporation | 175,000 |
| | $ | 40,218,500 |
|
| | Crown Castle International Corp. | 275,000 |
| | 39,091,250 |
|
| | | | | 79,309,750 |
|
| Mortgage — 5.0% | | | |
| | New Residential Investment Corp. | 1,850,000 |
| | 29,803,500 |
|
| | | | | |
| Office and Industrial — 14.8% | | | |
| | Alexandria Real Estate Equities, Inc. | 195,000 |
| | 31,508,100 |
|
| | Prologis, Inc. | 335,000 |
| | 29,861,900 |
|
| | SL Green Realty Corp. | 285,000 |
| | 26,185,800 |
|
| | | | | 87,555,800 |
|
| Residential — 1.4% | | | |
| | AvalonBay Communities, Inc. | 10,000 |
| | 2,097,000 |
|
| | Equity Residential | 20,000 |
| | 1,618,400 |
|
| | Essex Property Trust, Inc. | 15,000 |
| | 4,512,900 |
|
| | | | | 8,228,300 |
|
| Specialty — 16.3% | | | |
| | CoreCivic, Inc. | 2,095,000 |
| | 36,411,100 |
|
| | The GEO Group, Inc. | 2,157,000 |
| | 35,827,770 |
|
| | VICI Properties Inc. | 940,000 |
| | 24,017,000 |
|
| | | | | 96,255,870 |
|
| | | | | |
TOTAL REAL ESTATE INVESTMENTS TRUSTS (Identified cost $299,402,693) | | 301,153,220 |
|
See accompanying notes to financial statements.
4
SCHEDULE OF INVESTMENTS as of December 31, 2019 (continued) COMMON STOCKS (continued) |
| | | | | | | | |
| OTHER COMMON STOCKS — 46.6% | | | |
| | | | |
| Home Products — 4.4% | Shares | | Value(a) |
| | Thor Industries, Inc. | 354,000 |
| | $ | 26,298,660 |
|
| | | | | |
| Housing and Building Materials — 8.1% | | | |
| | M.D.C. Holdings, Inc. | 642,000 |
| | 24,498,720 |
|
| | Meritage Homes Corporation (b) | 330,000 |
| | 20,166,300 |
|
| | Taylor Morrison Home Corporation (b) | 155,000 |
| | 3,388,300 |
|
| | | | | 48,053,320 |
|
| Metals and Mining — 17.9% | | | |
| | Freeport-McMoRan Inc. | 300,000 |
| | 3,936,000 |
|
| | Martin Marietta Materials, Inc. | 105,000 |
| | 29,362,200 |
|
| | Teck Resources Limited (c) | 600,000 |
| | 10,422,000 |
|
| | Vale S.A. ADR (c) | 2,200,000 |
| | 29,040,000 |
|
| | Vulcan Materials Company | 230,000 |
| | 33,117,700 |
|
| | | | | 105,877,900 |
|
| Oil - Independent Production — 6.1% | | | |
| | Petroleo Brasileiro S.A. - Petrobras ADR (c) | 2,270,000 |
| | 36,183,800 |
|
| | | | | |
| Real Estate Services — 10.1% | | | |
| | CBRE Group, Inc. (b) | 450,000 |
| | 27,580,500 |
|
| | Jones Lang LaSalle Incorporated | 185,000 |
| | 32,206,650 |
|
| | | | | 59,787,150 |
|
| | | | | |
TOTAL OTHER COMMON STOCKS (Identified cost $265,491,281) | | 276,200,830 |
|
| | | |
TOTAL COMMON STOCKS (Identified cost $564,893,974) | | 577,354,050 |
|
| | | | | |
| SHORT-TERM INVESTMENT — 1.5% OF TOTAL NET ASSETS | | | |
| | Tri-party Repurchase Agreement with Fixed Income Clearing Corporation, dated 12/31/2019 at 0.12% to be repurchased at $8,525,057 on 01/02/2020 collateralized by $8,260,000 U.S. Treasury Note, 2.625% due 03/31/2025 valued at $8,693,620 including interest (Cost $8,525,000)(d) | Face
Amount | | |
| | | |
| $ | 8,525,000 |
| | 8,525,000 |
|
| | | | | |
TOTAL INVESTMENTS — 99.0% (Identified cost $573,418,974) | | 585,879,050 |
|
| | Cash and receivables | | 10,117,060 |
|
| | Liabilities | | (3,991,396 | ) |
| TOTAL NET ASSETS — 100.0% | | $ | 592,004,714 |
|
| | | | | |
See accompanying notes to financial statements.
5
|
| | | | |
| (a) | See Note 2A. | | | |
| (b) | Non-income producing security. | | | |
| (c) | At December 31, 2019, the Fund had approximately 11.0% of net assets invested in companies incorporated in Brazil and had less than 5.0% invested in a company incorporated in Canada. |
| (d) | See Note 2G.
|
| | | | | |
ADR: American Depositary Receipt - a certificate issued by a U.S. bank representing the right to receive securities of the foreign issuer described. The values of ADRs are significantly influenced by trading on exchanges not located in the U.S. or Canada. |
See accompanying notes to financial statements.
6
|
| | | | | | | | |
STATEMENT OF ASSETS AND LIABILITIES |
| |
| December 31, 2019 |
| |
| |
| Assets | | | | |
| Investments in securities, at value: | | |
| (Identified cost $573,418,974) | | $ | 585,879,050 |
|
| Cash | | 3,170 |
|
| Receivable for: | | | | |
| Securities sold | | $ | 7,161,332 |
| | |
| Shares of the Fund sold | | 290 |
| | |
| Dividends and interest | | 2,952,268 |
| | 10,113,890 |
|
| Total assets | | 595,996,110 |
|
| | | | | |
| Liabilities | | | | |
| Payable for: | | | | |
| Securities purchased | | 1,226,800 |
| | |
Shares of the Fund redeemed | | 1,476,515 |
| |
|
|
| Distributions declared | | 480,573 |
| | |
| Tax withholding | | 138,055 |
| | 3,321,943 |
|
| Accrued expenses: | | | | |
| Management fees | | 420,124 |
| | |
| Trustees’ fees | | 29,883 |
| | |
| Accounting, administration and compliance expenses | | 50,218 |
| |
|
| Transfer agent fees | | 65,507 |
| | |
| Other expenses | | 103,721 |
| | 669,453 |
|
| Total liabilities | | 3,991,396 |
|
| Net Assets | | $ | 592,004,714 |
|
| | | |
| Net assets consist of: | | |
| Capital paid-in | | $ | 589,858,380 |
|
| Accumulated gain | | 2,146,334 |
|
| Net Assets | | $ | 592,004,714 |
|
| | | |
| Shares of beneficial interest outstanding, no par value | | 23,052,312 |
|
| | | |
| Net asset value per share* | | $25.68 |
* Shares of the Fund are sold and redeemed at net asset
value ($592,004,714 ÷ 23,052,312).
|
| | | | |
STATEMENT OF OPERATIONS |
| |
| Twelve Months Ended December 31, 2019 |
| |
| | | |
| Investment Income | | |
| Income: | | |
| Dividends (net of withholding tax of | | |
| $436,258) | | $ | 22,369,533 |
|
| Interest | | 67,734 |
|
| | | 22,437,267 |
|
| | | |
| Expenses: | | |
| Management fees | | 5,586,620 |
|
| Trustees’ fees | | 119,255 |
|
| Accounting, administration and compliance expenses | | 602,620 |
|
| Custodian fees and expenses | | 132,008 |
|
| Transfer agent fees | | 384,721 |
|
| Audit and tax services | | 53,767 |
|
| Legal | | 108,896 |
|
| Printing | | 36,580 |
|
| Registration fees | | 25,839 |
|
| Miscellaneous expenses | | 21,326 |
|
| | | 7,071,632 |
|
| Net investment income | | 15,365,635 |
|
| | |
|
| Realized and Unrealized Gain (Loss) on Investments | | |
| Net realized gains on investments | | 24,251,483 |
|
| Net change in unrealized depreciation on investments | | (9,755,441 | ) |
| Net realized and unrealized gains on investments | | 14,496,042 |
|
| | | |
| Change in Net Assets from Operations | | $ | 29,861,677 |
|
| | | |
See accompanying notes to financial statements.
7
| STATEMENT OF CHANGES IN NET ASSETS |
| | | | | | | | |
| | | 2019 | | 2018 |
| From Operations | | | | |
| Net investment income | | $ | 15,365,635 |
| | $ | 12,951,081 |
|
| Net realized gains (losses) on investments and foreign currency transactions | | 24,251,483 |
| | (35,797,015 | ) |
| Net change in unrealized depreciation on investments and foreign currency transactions | | (9,755,441 | ) | | (165,943,697 | ) |
| Change in net assets from operations | | 29,861,677 |
| | (188,789,631 | ) |
| | | | | |
| From Distributions to Shareholders | |
| | |
| Total distributions | | (15,462,280 | ) | | (11,249,171 | ) |
| | |
| |
|
| From Capital Share Transactions | | | | |
| Proceeds from sale of shares | | 5,107,837 |
| | 10,660,853 |
|
| Net asset value of shares issued in connection with reinvestment of distributions | | 13,561,342 |
| | 9,871,230 |
|
| | | 18,669,179 |
| | 20,532,083 |
|
| Cost of shares redeemed | | (126,977,401 | ) | | (139,373,124 | ) |
| Change in net assets derived from capital share transactions | | (108,308,222 | ) | | (118,841,041 | ) |
| Total change in net assets | | (93,908,825 | ) | | (318,879,843 | ) |
| | |
| | |
| Net Assets | | | | |
| Beginning of period | | 685,913,539 |
| | 1,004,793,382 |
|
| End of period | | $ | 592,004,714 |
| | $ | 685,913,539 |
|
| | | | | |
| Number of Shares of the Fund: | |
| | |
| Issued from sale of shares | | 187,912 |
| | 355,611 |
|
| Issued in connection with reinvestment of distributions | | 513,644 |
| | 362,111 |
|
| | | 701,556 |
| | 717,722 |
|
| Redeemed | | (4,752,996 | ) | | (4,826,071 | ) |
| Net change | | (4,051,440 | ) | | (4,108,349 | ) |
| | | | | |
| | | | | |
See accompanying notes to financial statements.
8
| FINANCIAL HIGHLIGHTS |
| | | | | | | | | | | | | | | | | | | | | | | |
| | For the Year Ended December 31, |
| | 2019 | | | 2018 | | | 2017 | | | 2016 | | | 2015 |
| For a share of the Fund outstanding throughout each period: | | | | | | | | | | | | | |
| Net asset value at beginning of period | $ | 25.31 |
| | | $ | 32.19 |
| | | $ | 29.67 |
| | | $ | 29.27 |
| | | $ | 32.89 |
|
| Net investment income (a) | 0.61 |
| | | 0.44 |
| | | 0.19 |
| | | 0.10 |
| | | 0.04 |
|
| Net realized and unrealized gains (losses) on investments and foreign currency transactions | 0.39 |
| | | (6.92 | ) | | | 9.52 |
| | | 0.68 |
| | | (0.81 | ) |
| Total from investment operations | 1.00 |
| | | (6.48 | ) | | | 9.71 |
| | | 0.78 |
| | | (0.77 | ) |
| | | | | | | | | | | | | | |
| Dividends from net investment income | (0.63 | ) | | | (0.40 | ) | | | (0.24 | ) | | | (0.11 | ) | | | (0.03 | ) |
| Distributions from net short-term realized gains | — |
| | | — |
| | | (6.54 | ) | | | — |
| | | — |
|
| Distributions from net long-term realized gains | — |
| | | — |
| | | (0.41 | ) | | | (0.27 | ) | | | (2.82 | ) |
| Total distributions | (0.63 | ) | | | (0.40 | ) | | | (7.19 | ) | | | (0.38 | ) | | | (2.85 | ) |
| | | | | | | | | | | | | | |
| Net increase (decrease) in net asset value | 0.37 |
| | | (6.88 | ) | | | 2.52 |
| | | 0.40 |
| | | (3.62 | ) |
| Net asset value at end of period | $ | 25.68 |
| | | $ | 25.31 |
| | | $ | 32.19 |
| | | $ | 29.67 |
| | | $ | 29.27 |
|
| | | | | | | | | | | | | | |
| Total return (%) | 3.9 |
| | | (20.2 | ) | | | 32.8 |
| | | 2.7 |
| | | (2.3 | ) |
| | | | | | | | | | | | | | |
| Ratios: | | | | | | | | | | | | | |
| Operating expenses to average net assets (%) | 1.04 |
| | | 0.98 |
| | | 0.97 |
| | | 0.99 |
| | | 0.92 |
|
| Net investment income to average net assets (%) | 2.27 |
| | | 1.50 |
| | | 0.57 |
| | | 0.35 |
| | | 0.11 |
|
| Portfolio turnover (%) | 264 |
| | | 239 |
| | | 269 |
| | | 241 |
| | | 224 |
|
| Net assets at end of period (in thousands) ($) | 592,005 |
| 685,914 | | 1,004,793 | | 870,995 | | 1,078,815 | |
(a) Per share net investment income has been calculated using the average shares outstanding during the period.
See accompanying notes to financial statements.
9
|
|
| |
| CGM REALTY FUND |
| |
| NOTES TO FINANCIAL STATEMENTS — December 31, 2019 |
| |
1. Organization — CGM Realty Fund (the "Fund") is a diversified series of CGM Trust (the "Trust") which is organized as a Massachusetts business trust under the laws of Massachusetts pursuant to an Agreement and Declaration of Trust. The Trust is registered under the Investment Company Act of 1940 as an open-end management investment company and is following accounting and reporting guidance in the Financial Accounting Standards Board’s (“FASB”) Topic 946 “Financial Services—Investment Companies”. The Trust has two other funds whose financial statements are not presented herein. The Fund commenced operations on May 13, 1994. The Fund’s investment objective is to provide a combination of income and long-term growth of capital. The Fund intends to pursue its objective by investing primarily in equity securities of companies in the real estate industry, including real estate investment trusts (“REITs”).
2. Significant accounting policies — Management has evaluated the events and transactions from December 31, 2019 through the date of issuance of the Fund’s financial statements. For the Fund, there were no material subsequent events that required disclosure in the financial statements or footnotes.
A. Security valuation — Equity securities are valued on the basis of valuations furnished by a pricing service, authorized by the Board of Trustees (the “Board”). Equity securities listed or regularly traded on a securities exchange or in the over-the-counter (“OTC”) market are valued at the last quoted sale price or, for certain markets, the official closing price at the time the valuations are made. A security that is listed or traded on more than one exchange is valued at the quotation on the exchange determined to be the primary market for such security. For securities with no sale reported, the last reported bid price is used. Corporate debt securities are valued on the basis of valuations furnished by a pricing service, authorized by the Board, which determines valuations for normal, institutional-size trading units of such securities using market information, transactions for comparable securities and various relationships between securities which are generally recognized by institutional traders. United States government debt securities are valued at the current closing bid, as last reported by a pricing service approved by the Board.
When current market prices or quotations are not readily available or do not accurately reflect fair value, valuations may be determined in accordance with procedures adopted by the Board. For example, when developments occur between the close of a market and the close of the New York Stock Exchange ("NYSE") that may materially affect the value of some or all of the securities, or when trading in a security is halted, these procedures may be used. The frequency with which these procedures are used is unpredictable. These valuation procedures may result in a change to a particular security’s assigned level within the fair value hierarchy described below. The value of securities used for net asset value (“NAV”) calculation under these procedures may differ from published prices for the same securities.
The Fund may use valuation techniques consistent with the market, income, and cost approach to measure fair value. The market approach uses prices and other relevant information generated by market transactions involving identical or comparable assets or liabilities. The income approach uses valuation techniques to convert future amounts (cash flows, earnings) to a single present amount. The cost approach is based on the amount that currently would be required to replace the service capacity of an asset. To increase consistency and comparability in fair value measurements and related disclosure, the Fund utilizes a fair value hierarchy which prioritizes the various inputs to valuation techniques used to measure fair value into three broad levels:
| |
| • | Level 1 - Prices determined using: quoted prices in active markets for identical securities that the Fund has the ability to access at the measurement date. Valuation adjustments are not applied to Level 1 investments. |
| |
| • | Level 2 - Prices determined using: other significant observable inputs (including quoted prices for similar securities, interest rates, prepayment spreads, credit risk, etc.). |
|
|
| |
| CGM REALTY FUND |
| |
| NOTES TO FINANCIAL STATEMENTS (continued) |
| |
| |
| • | Level 3 - Prices determined using: significant unobservable inputs, including the Fund’s own assumptions and judgment in determining the fair value of investments. In situations where quoted prices or observable inputs are unavailable (for example, when there is little or no market activity for an investment at the end of the period), unobservable inputs may be used. Unobservable inputs reflect the Fund’s own assumptions about the factors market participants would use in pricing an investment, and would be based on the best information available in the circumstances. Investments falling into the Level 3 category are primarily supported by quoted prices from brokers and dealers participating in the market for those investments. However, these may be classified as Level 3 investments due to lack of market transparency and corroboration to support these quoted prices. Additionally, valuation models may be used as the pricing source for any remaining investments classified as Level 3. These models rely on one or more significant unobservable inputs and/or significant assumptions by Capital Growth Management Limited Partnership, the Fund’s investment adviser (“CGM”). Inputs used in valuations may include, but are not limited to, financial statement analysis, capital account balances, discount rates and estimated cash flows, and comparable company data. |
The inputs or methodology used for valuing securities are not necessarily an indication of the risk associated with investing in those securities. The following is a summary of the inputs used to value the Fund’s investments as of December 31, 2019:
|
| | | | | | | | | | | |
| | | | Valuation Inputs |
| | Classification | | Level 1 -
Quoted Prices | | Level 2 - Other Significant Observable Inputs | | Level 3 - Significant Unobservable Inputs |
| | Investments in Securities-Assets | | | | | | |
| | Common Stocks* | | $ | 577,354,050 |
| | — | | — |
| | Short-Term Investment | | | | | | |
| | Repurchase Agreement | | — | | $ | 8,525,000 |
| | — |
| | Total | | $ | 577,354,050 |
| | $ | 8,525,000 |
| | — |
| | | | | | | | |
| * | All common stocks held in the Fund are Level 1 securities. For a detailed break-out of common stocks by major industry classification, please refer to the Schedule of Investments. |
B. Security transactions and related investment income — Security transactions are accounted for on the trade date plus one basis for daily NAV calculations. However, for financial reporting purposes, investment transactions are reported on the trade date (date the order to buy or sell is executed). Dividend income is recorded on the ex-dividend date net of applicable foreign taxes and fees, a portion of which may be recoverable. The Fund will accrue such taxes and recoveries as applicable based upon its current interpretations of the tax rules and regulations that exist in the markets in which it invests. Interest income is recorded on an accrual basis and includes amortization of premium and discount. Net gain or loss on securities sold is determined on the identified cost basis and may include proceeds from litigation. Dividend payments received by the Fund from its investment in REITs may consist of ordinary income, capital gains, and return of capital and as such are recorded as dividend income, capital gains or a reduction to security cost, as appropriate. Non-cash dividend payments, if any, are recorded at the fair market value of the securities received.
C. Federal income taxes — It is the Fund’s policy to comply with the requirements of the Internal Revenue Code ("IRC") applicable to regulated investment companies, and to distribute to its shareholders all of its taxable income and net realized capital gains, within the prescribed time period.
|
|
| |
| CGM REALTY FUND |
| |
| NOTES TO FINANCIAL STATEMENTS (continued) |
| |
Capital accounts within the financial statements are adjusted for permanent book/tax differences. These adjustments have no impact on the Fund's net assets or results of operations. Temporary book/tax differences, if any, will reverse in a subsequent period. Any difference between book basis and tax basis unrealized appreciation is attributable primarily to the temporary book/tax difference of tax deferral of losses on wash sales.
As of December 31, 2019, the components of distributable earnings on a tax basis were as follows:
|
| | | | |
| Undistributed Ordinary Income | | Undistributed Long-term Capital Gains | | Net Unrealized Appreciation/ (Depreciation) |
| — | | — | | $11,999,952 |
The identified cost of investments in securities owned by the Fund for federal income tax purposes, and their respective gross unrealized appreciation and depreciation at December 31, 2019 was as follows:
|
| | | | | | |
| Identified Cost | | Gross Unrealized Appreciation | | Gross Unrealized Depreciation | | Net Unrealized Appreciation |
| $573,879,098 | | $42,014,485 | | $(30,014,533) | | $11,999,952 |
The Fund is permitted to carry forward capital losses for an unlimited period, and such losses, when carried forward, retain their character as either short-term or long-term capital losses. As of December 31, 2019, the capital loss carryforwards utilized and the accumulated net realized loss on sales of investments for federal income tax purposes which are available to offset future taxable gains, prior to distributing such gains to shareholders, are shown in the table below:
|
| | | | | | | | | | |
Short-term Capital Loss Carryforward Utilized | | Long-term Capital Loss Carryforward Utilized | | Total | | Remaining Short-term Capital Loss Carryforward | | Remaining Long-term Capital Loss Carryforward | | Total |
| $12,715,474 | | — | | $12,715,474 | | $11,084,889 | | — | | $11,084,889 |
Management has concluded that there are no significant uncertain tax positions for the open tax years as of December 31, 2019 that would require recognition in the financial statements. However, management’s conclusion may be subject to review and adjustment at a later date based on factors including, but not limited to, new tax laws, regulations, and administrative interpretations (including relevant court decisions). Generally, the Fund's federal tax returns for the prior three fiscal years remain subject to examination by the Internal Revenue Service.
D. Dividends and distributions to shareholders — Dividends and distributions are recorded by the Fund on the ex-dividend date. The classification of income and capital gains distributions is determined in accordance with income tax regulations. Distributions from net investment income and short-term capital gains are treated as ordinary income for income tax purposes. Permanent book/tax differences relating to shareholder distributions may result in reclassifications to paid-in capital or accumulated realized gain/(loss). The Fund also may utilize earnings and profits distributed to shareholders on redemption of shares as a part of the dividend deduction for income tax purposes. Undistributed net investment income or accumulated net investment loss may include temporary book/tax differences such as tax deferral of losses on wash sales, which will reverse in a subsequent period. Any taxable income or gain remaining at fiscal year end is distributed in the following year.
|
|
| |
| CGM REALTY FUND |
| |
| NOTES TO FINANCIAL STATEMENTS (continued) |
| |
The tax characterization of distributions is determined on an annual basis. The tax character of distributions paid during the periods ended December 31, 2019 and 2018 were as follows:
|
| | | | | | | | |
| Year | | Ordinary
Income | | Long-term
Capital Gains | | Tax Return
of Capital | | Total |
| 2019 | | $ 15,462,280 | | — | | — | | $ 15,462,280 |
| 2018 | | $ 11,249,171 | | — | | — | | $ 11,249,171 |
E. Guarantees and indemnifications — Under the Trust's organizational documents, its officers and trustees are indemnified against certain liabilities arising out of the performance of their duties for the Fund. Additionally, in the normal course of business, the Fund may enter into contracts with service providers that contain general indemnification clauses. The Fund's maximum exposure under these arrangements is unknown, as this would involve future claims that may be made against the Fund that have not yet occurred. The risk of material loss from such claims is considered remote.
F. Foreign currency translation — All assets and liabilities initially expressed in terms of foreign currencies are translated into U.S. dollars each day at the prevailing exchange rate. Transactions affecting Statement of Operations accounts and net realized gain or loss on investments are translated at the rates prevailing at the dates of the transactions. The Fund does not isolate that portion of the results of operations resulting from changes in foreign exchange rates on investments from the fluctuations arising from changes in market prices of securities held. Such fluctuations are included with the net realized and unrealized gain or loss from investments. Reported net realized foreign exchange gains or losses arise from sales of foreign currency, currency gains or losses realized between the trade and settlement dates on securities transactions and the difference between the amounts of dividends, interest, and foreign withholding taxes recorded on the Fund’s books and the U.S. dollar equivalent of the amounts actually received or paid. Net unrealized foreign exchange gains or losses arise from changes in the value of assets and liabilities other than investments in securities at the end of the period, resulting from changes in the exchange rate.
G. Repurchase agreements — The Fund enters into repurchase agreements, under the terms of a Master Repurchase Agreement, secured by U.S. Government or Agency securities, which involve the purchase of securities from a counterparty with a simultaneous commitment to resell the securities at an agreed upon date and price. Certain repurchase agreements are tri-party arrangements whereby the collateral is held in a segregated account for the benefit of the Fund and on behalf of the counterparty. Repurchase agreements afford the Fund the opportunity to earn a return on temporarily available cash at minimal market risk. While the underlying security may be a bill, certificate of indebtedness, note or bond issued by an agency, authority or instrumentality of the U.S. Government, the obligation of the seller is not guaranteed by the U.S. Government and there is a risk that the seller may fail to repurchase the underlying security. Consequently, there may be possible delays or restrictions upon the Fund’s ability to dispose of the underlying securities. Upon an event of default under the Master Repurchase Agreement, the Fund would attempt to exercise its rights with respect to the underlying security, including taking possession of the cash and/or collateral provided by the seller.
At December 31, 2019, the Fund had an investment in a repurchase agreement with a gross value of $8,525,000 on the Statement of Assets and Liabilities. The value of the related collateral consisting of cash, interest and/or securities of $8,693,620 exceeded the value of the repurchase agreement at December 31, 2019 by $168,620.
H. Use of estimates — The preparation of financial statements in accordance with U.S. Generally Accepted Accounting Principles (“GAAP”) requires management to make certain estimates and assumptions that affect the reported amounts of assets and liabilities, the disclosure of contingent assets and liabilities at the date of the
|
|
| |
| CGM REALTY FUND |
| |
| NOTES TO FINANCIAL STATEMENTS (continued) |
| |
financial statements and the reported amounts of revenue and expenses during the reporting period. Actual results could differ from those estimates.
3. Risks and uncertainties
A. Risks associated with focused investing —The Fund, although diversified, takes a focused approach to investing within particular industries or sectors of the economy and may invest in a relatively small number of individual holdings. Therefore, the Fund may be subject to greater price volatility and may be more adversely affected by the performance of particular industries, sectors, or individual holdings than would a more diversified fund. In addition, the Fund invests primarily in companies in the real estate industry, including REITs. Funds with a concentration are particularly susceptible to the impact of market, economic, regulatory and other factors affecting the specific concentration.
B. Risks associated with foreign investments — The Fund may invest in securities issued by institutions, corporations, and governments established by or located in foreign countries, which may be developed or undeveloped countries. Investing in foreign securities may involve significant risks. For example, there is often less publicly available information about foreign companies, particularly those not subject to the disclosure and reporting requirements of the U.S. securities laws. Foreign issuers are often not bound by uniform accounting, auditing, and financial reporting requirements and standards of practice comparable to those applicable to domestic issuers. Investments in foreign securities also involve the risk of possible adverse changes in investment or exchange control regulations, expropriation or confiscatory taxation, political or financial instability or diplomatic and other developments which could affect such investments. Foreign stock markets, while growing in volume and sophistication, are often not as developed as those in the U.S., and securities of some foreign issuers (particularly those located in developing countries) may be less liquid and more volatile than securities of comparable U.S. companies. There may also be less overall governmental supervision and regulation of foreign securities markets, broker-dealers and issuers than in the U.S. Additionally, because some foreign securities the Fund may acquire are purchased with and payable in foreign currencies, the value of these assets as measured in U.S. dollars may be affected favorably or unfavorably by changes in currency rates and exchange control regulations. There is no limit on the amount that the Fund may invest in issuers located in a single country or in foreign countries in the aggregate. To the extent the Fund focuses its investments in a single country or only a few countries in a particular geographic region, economic, political, regulatory or other conditions affecting such country or region may have a greater impact on Fund performance relative to a more geographically diversified fund.
A substantial portion of the Fund’s portfolio may be invested in American Depositary Receipts of companies domiciled in Brazil. The risks of foreign investments described above are generally heightened when investing in issuers in emerging market countries, such as Brazil. Investing in Brazilian issuers involves certain special risks, including investment and repatriation controls, fluctuations in the rate of exchange between Brazil’s currency (the Real) and the U.S. Dollar, political instability, corruption and price volatility. In addition, the market for Brazilian securities is influenced by the flow of international capital and economic and market conditions of certain countries, especially other emerging market countries in Central and South America. The Brazilian economy has historically been exposed to high rates of inflation and a high level of debt, each of which may reduce and/or prevent economic growth. Brazilian securities may also be particularly sensitive to market movements because their market prices tend to reflect speculative expectations.
4. Purchases and sales of securities — For the year ended December 31, 2019, purchases and sales of securities other than short-term investments aggregated $1,744,691,228 and $1,850,383,807, respectively.
|
|
| |
| CGM REALTY FUND |
| |
| NOTES TO FINANCIAL STATEMENTS (continued) |
| |
5. Fees and expenses
A. Management fees — During the year ended December 31, 2019, the Fund incurred management fees of $5,586,620, paid or payable monthly to CGM, certain officers and employees of which are also officers and trustees of the Fund. The management agreement provides for a fee at the annual rate of 0.85% on the first $500 million of the Fund’s average daily net assets and 0.75% on amounts in excess of $500 million of the Fund’s average daily net assets.
B. Other expenses — The majority of expenses are directly attributable to the Fund. Expenses that are not readily attributable to the Fund are allocated among each of the three funds comprising the Trust in an equitable manner, taking into consideration, among other things, the nature and type of expense and the funds' respective net assets. CGM performs certain administrative, accounting, compliance and other services for the Fund. The expenses of those services, which are paid to CGM by the Fund, include the following: (i) expenses for personnel performing bookkeeping, accounting and financial reporting and clerical functions relating to the Fund; (ii) expenses for services required in connection with the preparation of registration statements and prospectuses, shareholder reports and notices, proxy solicitation material furnished to shareholders of the Fund or regulatory authorities and reports and questionnaires for Securities and Exchange Commission ("SEC") compliance; (iii) registration, filing and other fees in connection with requirements of regulatory authorities and (iv) compliance in connection to the Investment Company Act of 1940 and the Sarbanes-Oxley Act of 2002. The accounting, administration and compliance expenses of $602,620, for the year ended December 31, 2019, are shown separately in the Statement of Operations. These expenses include the reimbursement of a portion of the compensation expenses incurred by CGM for its employees who provide these administrative, accounting, compliance, and other services to the Fund, including $531,909 of the salaries of CGM employees who are officers of the Fund.
C. Trustees fees and expenses — The Fund does not pay any compensation directly to any trustees who are “interested persons” (as defined in the Investment Company Act of 1940) of CGM or any affiliate of CGM (other than registered investment companies). For the year ended December 31, 2019, each disinterested trustee was compensated by the Trust with an annual fee of $90,000 plus travel expenses for each meeting attended. The disinterested trustees are responsible for the audit committee functions of the Trust’s Board and have designated a disinterested trustee to lead the Board's efforts in overseeing those functions, who receives an additional $30,000 annually. Of these amounts, the Fund is responsible for $10,000 per trustee annually, plus an annual variable fee calculated based on the proportion of the Fund’s average net assets relative to the aggregate average net assets of the Trust.
6. Recent accounting pronouncement
A. Fair value measurement — In August 2018, the FASB issued Accounting Standards Update 2018-13, Fair Value Measurement (Topic 820) - Disclosure Framework - Changes to the Disclosure Requirements for Fair Value Measurement (“ASU 2018-13”) which introduces new fair value disclosure requirements and eliminates and modifies certain existing fair value disclosure requirements. ASU 2018-13 would be effective for fiscal years beginning after December 15, 2019, and interim periods within those fiscal years; however, management has elected to adopt ASU 2018-13 effective with the current reporting period. The impact of the fund’s adoption is limited to changes in the fund’s financial statement disclosures regarding fair value, primarily those disclosures related to transfers between levels of the fair value hierarchy.
|
|
| |
| CGM REALTY FUND |
| |
| REPORT OF INDEPENDENT REGISTERED PUBLIC ACCOUNTING FIRM |
| |
To the Board of Trustees of CGM Trust and Shareholders of CGM Realty Fund
Opinion on the Financial Statements
We have audited the accompanying statement of assets and liabilities, including the schedule of investments, of CGM Realty Fund (the "Fund") as of December 31, 2019, the related statement of operations for the year ended December 31, 2019, the statement of changes in net assets for each of the two years in the period ended December 31, 2019, including the related notes, and the financial highlights for each of the five years in the period ended December 31, 2019 (collectively, referred to as the “financial statements”). In our opinion, the financial statements present fairly, in all material respects, the financial position of the Fund as of December 31, 2019, the results of its operations for the year then ended, the changes in its net assets for each of the two years in the period ended December 31, 2019 and the financial highlights for each of the five years in the period ended December 31, 2019 in conformity with accounting principles generally accepted in the United States of America.
Basis for Opinion
These financial statements are the responsibility of the Fund’s management. Our responsibility is to express an opinion on the Fund’s financial statements based on our audits. We are a public accounting firm registered with the Public Company Accounting Oversight Board (United States) (“PCAOB”) and are required to be independent with respect to the Fund in accordance with the U.S. federal securities laws and the applicable rules and regulations of the Securities and Exchange Commission and the PCAOB.
We conducted our audits of these financial statements in accordance with the standards of the PCAOB. Those standards require that we plan and perform the audit to obtain reasonable assurance about whether the financial statements are free of material misstatement, whether due to error or fraud.
Our audits included performing procedures to assess the risks of material misstatement of the financial statements, whether due to error or fraud, and performing procedures that respond to those risks. Such procedures included examining, on a test basis, evidence regarding the amounts and disclosures in the financial statements. Our audits also included evaluating the accounting principles used and significant estimates made by management, as well as evaluating the overall presentation of the financial statements. Our procedures included confirmation of securities owned as of December 31, 2019 by correspondence with the custodian and brokers; when replies were not received from brokers, we performed other auditing procedures. We believe that our audits provide a reasonable basis for our opinion.
PricewaterhouseCoopers LLP
Boston, Massachusetts
February 14, 2020
We have served as the auditor of one or more investment companies in Capital Growth Management Investment Company Complex since at least 1994. We have not determined a specific year we began serving as auditor.
|
|
| |
| CGM REALTY FUND |
| |
| ADDITIONAL INFORMATION |
| (unaudited) |
Availability of proxy voting information:
Proxy voting policies and information regarding how the Fund voted proxies relating to portfolio securities during the twelve month period ended June 30, 2019 are available without charge, by calling 800-345-4048. The policies also appear in the Fund’s Statement of Additional Information, which can be found on the CGM Funds' website, www.cgmfunds.com, and the SEC’s website, www.sec.gov. The voting records can also be found on the SEC’s website on the N-PX filing.
Portfolio holdings:
The Fund files its complete schedule of portfolio holdings with the SEC for the first and third quarters of each fiscal year on Form N–PORT, which is available on the SEC's website at www.sec.gov. Portfolio holdings are also disclosed in the Fund's quarterly reports. The Fund's four most recent quarterly reports can be obtained on the CGM Funds' website, www.cgmfunds.com.
The Fund’s Prospectus and Statement of Additional Information contain additional information on other risks and uncertainties relating to the Fund’s investments. The Fund’s Prospectus and Statement of Additional Information can be obtained on the CGM Funds' website, www.cgmfunds.com, and the SEC’s website, www.sec.gov or by calling 800-345-4048.
Liquidity Risk Management Program:
On October 13, 2016, the Securities and Exchange Commission (“SEC”) adopted Rule 22e-4 (“Liquidity Rule”) under the Investment Company Act of 1940 (“1940 Act”) which requires registered open-end funds to establish and implement a written Liquidity Risk Management Program reasonably designed to assess and manage its liquidity risk. The Fund must also periodically review its liquidity risk. In addition, a written report is provided to the Fund’s Board of Trustees annually which details the operation of the Fund’s program.
Pursuant to its program, the Fund classifies the liquidity of its portfolio investments into one of the four categories defined by the SEC: “Highly Liquid”, “Moderately Liquid”, “Less Liquid” and “Illiquid”. These classifications are reported to the SEC on Form N-PORT. The Liquidity Rule requires open-end funds that are not invested primarily in “Highly Liquid” investments to establish a “Highly Liquid Investment Minimum” (“HLIM”), which is the minimum percentage of net assets that must be invested in Highly Liquid investments (i.e., cash or investments that are reasonably expected to be convertible into cash within three business days without significantly changing the market value of the investment). It was determined through periodic reviews that the Fund’s portfolio holdings have been primarily Highly Liquid and, therefore, the Fund does not need to establish a HLIM.
The Fund may not acquire an investment if, immediately after the acquisition, over 15% of the Fund’s net asset would consist of Illiquid investments (an investment that cannot reasonably be expected to be sold or disposed of in current market conditions in seven calendar days or less without the sale or disposition significantly changing the market value of the investment). The Fund is required to report to the SEC and the Fund’s Board of Trustees if the Fund holds illiquid investments in excess of the 15% limit. No such reporting was required during the past year. In addition, periodic stress testing confirmed that the Fund held sufficient liquid investments to cover all reasonably foreseeable levels of cash flow.
|
|
| |
| CGM REALTY FUND |
| |
| ADDITIONAL INFORMATION |
| (unaudited) |
TAX INFORMATION FOR THE TAX YEAR ENDED December 31, 2019
(unaudited)
We are providing this information as required by the IRC.
For taxable non-corporate shareholders, 45.9% of the 2019 ordinary dividend is considered qualified dividend income that may be eligible for reduced capital gains rates.
For corporate shareholders, 4.9% of the 2019 ordinary dividend qualifies for the dividends-received deduction.
54.1% of the 2019 ordinary dividend is considered qualified REIT income that may be eligible for the 20% qualified business income deduction under section 199A.
|
|
| |
| CGM REALTY FUND |
| |
| FUND EXPENSES |
| (unaudited) |
As a shareholder of CGM Realty Fund, you incur two types of costs: (1) transaction costs, which could include, among other charges, wire fees and custodial maintenance fees for certain types of accounts and (2) ongoing costs, including management fees and other Fund expenses. This example is intended to help you understand your ongoing costs (in dollars) of investing in the Fund and to compare these costs with the ongoing costs of investing in other mutual funds.
The example is based on an investment of $1,000 invested at the beginning of the period and held for the entire period July 1, 2019 to December 31, 2019.
Actual return and expenses
The first line of the table below provides information about actual account values and actual expenses.
You may use the information in this line, together with the amount you invested, to estimate the expenses that you paid over the period. Simply divide your account value by $1,000 (for example, an $8,600 account value divided by $1,000 = 8.6), then multiply the result by the number in the first line under the heading entitled ‘‘Expenses Paid During Period’’ to estimate the expenses you paid on your account during this period.
Hypothetical example for comparison purposes
The second line of the table below provides information about hypothetical account values and hypothetical expenses based on the Fund’s actual expense ratio and an assumed rate of return of 5% per year before expenses, which is not the Fund’s actual return. The hypothetical account values and expenses may not be used to estimate the actual ending account balance or expenses you paid for the period.
You may use this information to compare the ongoing costs of investing in the Fund and other funds. To do so, compare this 5% hypothetical example with the 5% hypothetical examples that appear in the shareholder reports of the other funds.
Please note that the expenses shown in the table are meant to highlight your ongoing costs only and do not reflect any transactional costs such as any wire fees or custodial maintenance fees that may be payable. Therefore, the second line of the table is useful in comparing ongoing costs only, and will not help you determine the relative total costs of owning different funds. In addition, if these transactional costs were included, your costs would have been higher.
|
| | | |
| | Beginning Account Value 07/01/19 | Ending Account Value
12/31/19 | Expenses Paid During Period* 07/01/19 - 12/31/19 |
| Actual | $1,000.00 | $ 951.51 | $5.21 |
Hypothetical
(5% return before expenses) | $1,000.00 | $ 1,019.87 | $5.39 |
* Expenses are equal to the Fund’s annualized expense ratio of 1.06%, multiplied by the average account value over the period, multiplied by 184/365 (to reflect the one-half year period).
|
|
| |
| CGM REALTY FUND |
| |
| TRUSTEES AND OFFICERS |
The Fund is supervised by the Board of Trustees (the “Board”) of the Trust. The Board is responsible for the general oversight of the Fund, including general supervision and review of the Fund’s investment activities. The Board, in turn, elects the officers who are responsible for administering the Fund’s day-to-day operations.
An asterisk in the following table identifies those trustees and officers who are “interested persons” of the Trust as defined in the Investment Company Act of 1940. Each trustee and officer of the Trust noted as an interested person is interested by virtue of that individual’s position with CGM, as described in the table below. Each trustee serves during the continued lifetime of the Trust, until he or she earlier dies, resigns or is removed, or if sooner, until the election and qualification of his or her successor. Each officer serves until his or her successor is elected or qualified, or until the officer sooner dies, resigns, or is removed or becomes disqualified.
The trustees and officers of the Trust, their ages, their principal occupations during the past five years, the number of CGM Funds they oversee, and other directorships they hold are set forth below. Unless otherwise noted below, the address of each interested trustee and officer is One International Place, Boston, Massachusetts 02110. Correspondence intended for the trustees who are not “interested persons” of the Trust may be sent c/o Capital Growth Management, One International Place, Boston, Massachusetts 02110. The Statement of Additional Information for the Fund includes additional information about Fund trustees and is available on the CGM Funds' website, www.cgmfunds.com, or by calling 800-345-4048.
|
| | | | | | |
| Name | | Positions Held and Length of Time Served | | Principal Occupations and Other Directorships Held During Past 5 Years | | Number of Funds in the CGM Funds Complex Overseen |
| (Birth Year) | |
| Interested Trustees | | | | | | |
| Ken Heebner* | | Trustee since 1993 | | Co-founder and Employee, CGM; Controlling owner of Kenbob, Inc. (general partner of CGM) | | 3 |
| (1940) | | | | |
Leslie A. Lake*
| | Trustee since 2013 | | Consultant to CGM (since 2013) | | 3 |
| (1945) | | | | |
| Disinterested Trustees | | | | | | |
Peter O. Brown
| | Trustee since 1993 | | Counsel (formerly, Partner), Harter, Secrest & Emery LLP (law firm); formerly Executive Vice President and Chief Operating Officer, The Glenmede Trust Company (from 1990 to 1993); formerly Senior Vice President, J.P. Morgan Chase Bank (from 1981 to 1990); formerly Trustee, TT International U.S.A. Master and Feeder Trusts (four mutual funds) (from 2000 to 2005) | | 3 |
| (1940) | | | | |
| Mark W. Holland | | Trustee since 2004 | | President, Wellesley Financial Advisors, LLC (since 2003); formerly Vice President and Chief Operating Officer, Fixed Income Management, Loomis, Sayles & Company, L.P. (from 1999 to 2002); formerly Director, Loomis, Sayles & Company, L.P. (from 1993 to 2001) | | 3 |
| (1949) | | | | |
|
| | | | | | |
| Name | | Positions Held and Length of Time Served | | Principal Occupations and Other Directorships Held During Past 5 Years | | Number of Funds in the CGM Funds Complex Overseen |
| (Birth Year) | |
| | | | | | | |
| J. Baur Whittlesey | | Trustee since 1990 | | Member (1994 to 2016) and Senior Counsel (since 2017), Ledgewood, P.C. (law firm) | | 3 |
| (1946) | | | | |
| Officers | | | | | | |
| Ken Heebner* | | Vice President since 1990 | | Co-founder and Employee, CGM; Controlling owner of Kenbob, Inc. (general partner of CGM) | | 3 |
| (1940) | | | | |
David C. Fietze*
| | President since 2015 and Chief Compliance Officer since 2004 | | Employee – Legal Counsel, CGM | | 3 |
| (1969) | | | | |
Kathleen S. Haughton*
| | Vice President since
1992 and Anti-Money Laundering Compliance Officer since 2002 | | Employee – Investor Services Division, CGM | | 3 |
| (1960) | | | 38 Newbury St., Boston, MA 02116 | | |
| Jem A. Hudgins* | | Treasurer since 2004 | | Employee – Treasury Operations, CGM | | 3 |
| (1963) | | | | |
Leslie A. Lake*
| | Vice President (1992 to 2013) and Secretary since 1992 | | Consultant to CGM (since 2013) | | 3 |
| (1945) | | | | |
| Martha I. Maguire* | | Vice President since
1994 | | Consultant to CGM (since 2013) | | 3 |
| (1955) | | | | |
| Nicole M. Fembleaux* | | Assistant Vice President since 2011 | | Employee – Operations, CGM | | 3 |
| (1979) | | | | |
| Kevin Ure* | | Vice President since
2013 | | Employee – Accounts Admin. Operations, CGM | | 3 |
| (1971) | | | | |
| Tony Figueiredo* | | Vice President since
2013 | | Employee – Investor Services Division, CGM | | 3 |
| (1960) | | | 38 Newbury St., Boston, MA 02116 | | |
Deidra Hewardt*
| | Assistant Treasurer since 2014 | | Employee – Treasury Operations, CGM | | 3 |
| (1972) | | | 38 Newbury St., Boston, MA 02116 | | |
| | | | | | | |
| | | | | | | |
| | | |
|
| |
| INVESTMENT ADVISER |
| CAPITAL GROWTH MANAGEMENT |
| LIMITED PARTNERSHIP |
| Boston, Massachusetts 02110 |
|
| |
| CUSTODIAN OF ASSETS |
STATE STREET BANK AND TRUST COMPANY
Boston, Massachusetts 02111 |
|
| |
| TRANSFER AGENT |
DST ASSET MANAGER SOLUTIONS, INC.
P.O. Box 219252
Kansas City, Missouri 64121-9252 |
|
| | |
| TELEPHONE NUMBERS |
| For information about: |
| n | Account Procedures |
| n | Purchases |
| n | Redemptions |
| n | Exchanges
Call 800-343-5678 |
| n | New Account Procedures and Status |
| n | Prospectus & SAI |
| n | Performance |
| n | Proxy Voting Policies and Voting Records |
| n | Complete Schedule of Portfolio Holdings
for the 1st & 3rd Quarters
Call 800-345-4048 |
| | | |
| MAILING ADDRESS |
| The CGM Funds |
| c/o DST Asset Manager Solutions, Inc. |
| P.O. Box 219252 |
| Kansas City, MO 64121-9252 |
| |
| |
| WEBSITE |
| www.cgmfunds.com |
| |
| |
| This report has been prepared for the shareholders of the Fund and is not authorized for distribution to current or prospective investors in the Fund unless it is accompanied or preceded by a prospectus. |
| | |
| FAR19 | Printed in U.S.A. |
CGM
Focus Fund
23rd Annual Report
December 31, 2019
A No-Load Fund
CGM Focus Fund decreased -1.4% during the fourth quarter of 2019 compared to the Standard and Poor’s 500 Index (S&P 500 Index) which increased 9.1%. For the twelve months ended December 31, 2019, CGM Focus Fund decreased -13.1% while the S&P 500 Index increased 31.5%.
The Year in Review and Economic Outlook
The longest bull market in history continued into its tenth year in 2019. After a market sell-off in late 2018, U.S. stocks surged early in the year despite the lengthiest U.S. government shutdown in history and concerns about global economic growth. In January, strong employment numbers and wage reports from the Labor Department as well as indications from the Federal Reserve that interest rates would remain steady propelled the market to its best monthly performance in three years. U.S. - China trade tensions affected the market throughout the year and in early February, stocks rose when the Trump administration agreed to hold off on a 25% increase in tariffs on $200 billion of Chinese goods. But by March, impatience with progress in trade negotiations depressed stock prices. Markets were also discouraged, at least initially, when the European Central Bank attempted to boost its sluggish economy by holding interest rates unchanged through the end of the year. Nevertheless, the market enjoyed a strong finish to the first quarter after the Labor Department reported that worker productivity, which directly impacts wages and output, jumped 1.9% in the fourth quarter of 2018.
In April we learned that economic growth in the first quarter was the strongest in four years with gross domestic product rising at a vigorous 3.1% annualized rate. Concerns about a global recession faded as China reported surprisingly strong retail sales numbers and an overall 6.4% growth rate for its first quarter despite ongoing trade tensions with the U.S. Domestic economic indicators remained largely positive through the rest of the first half of the year though tempered global growth, recurring trade tensions and a tightening labor market weighed on
U.S. manufacturing growth and also led to contraction in European manufacturing. However, the Institute for Supply Management’s monthly non-manufacturing index indicated consistent expansion in the U.S. service sector in 2019 which offset the slowdown in manufacturing. Near the end of the second quarter, a meeting between President Trump and Chinese President Xi Jinping at the G-20 summit in Tokyo led to incremental progress in trade negotiations which helped boost stocks to their best mid-year returns in over two decades.
In the first of three rate cuts in 2019 (and the first reduction since 2008) the Fed reduced interest rates 0.25% in July. However, at the time, the Fed remained silent about future plans for economic stimulus and the market dropped on the rate cut news. In early August the Trump administration announced additional tariffs on Chinese goods which triggered new fears of a global economic slowdown and battered stock and commodity prices and bond yields. China subsequently reacted by allowing a swift and sizable depreciation of the yuan and threatened retaliatory tariffs on almost all remaining U.S. imports. The market declined in response to the heightening trade tensions along with news of slackening Chinese industrial production and contraction in the German economy. But again, trade tensions dissipated in late August and in mid-September, the Fed announced a second 0.25% rate cut. So, despite headwinds and conflicting indicators, markets closed in positive territory and the U.S. economy persevered with moderate gross domestic product growth of 2.1% in the third quarter.
U.S. economic growth continues to outperform global economies. Steady job growth, rising wages and solid consumer spending propelled the U.S. economy through year-end. In early December the unemployment rate dropped to a historically low 3.5% and the Labor Department reported the 110th consecutive month of job gains as employers added 266,000 new jobs. Wages were up 3.1% from a year earlier and continue to outpace inflation. Any immediate concerns about a recession have diminished. After a third rate cut in October to
“provide some insurance against ongoing risks,” the Fed held off on an additional rate reduction in December citing a favorable overall outlook for the economy. Corporate earnings have been surprisingly strong, boosting stock prices. U.S. - China trade tensions have eased as the countries agreed in principle to a “phase one” limited trade agreement that curtails U.S. tariffs on Chinese goods and includes commitments by China to purchase $50 billion of U.S. agricultural products along with energy and other goods. Additionally, a new trade pact with Canada and Mexico is nearly complete. Improved trade relations and sustained growth in the U.S. economy ultimately pushed the S&P 500 to its best performance since 2013.
Portfolio Strategy
CGM Focus Fund was fully invested throughout 2019 in anticipation of continued growth in the American and global economies. The largest concentration was in Brazilian money center banks. Other significant positions were defense contractors, petroleum refineries and a large Brazilian oil and gas company. CGM Focus Fund also maintained a very substantial short position in information technology companies.
The Fund had almost no long participation in information technology stocks which appreciated 48% in 2019; rather, most of the Fund’s substantial short position was concentrated in these securities. This was the primary cause of the Fund’s decline in a rising stock market. Anticipating rising inflation that never materialized despite a growing economy, the Fund also experienced a significant loss on a short position in long term government bonds which was covered earlier in the year. Other gains and losses were largely offsetting.
On December 31, 2019 CGM Focus Fund was 24.5% invested in money center banks, 17.3% invested in retail and 14.9% invested in electronic components. The three largest holdings were Petroleo Brasileiro S.A. - Petrobras ADR (oil - independent production), Banco Bradesco S.A. ADR and Banco Santander (Brasil) S.A. ADR (money center banks). Approximately 74.9% of the portfolio was invested in securities sold short.
David C. Fietze
President
G. Kenneth Heebner
Portfolio Manager
January 2, 2020
Average Annual Total Returns through 12/31/19
|
| | | | | | |
| | | | | 1 Year | 5 Year | 10 Year |
| | n | | CGM Focus Fund | -13.1% | - 3.1% | 1.6% |
| | n | | S&P 500 Index | 31.5% | 11.7% | 13.6% |
Past performance is no indication of future results and current performance may be higher or lower than the figures shown. Unlike a fund, an index is not managed and does not reflect fees and expenses.
|
| | | | | |
| CGM FOCUS FUND | |
| Portfolio Manager | |
G. Kenneth Heebner has managed CGM Focus Fund since its inception on September 3, 1997. In 1990, Mr. Heebner founded Capital Growth Management Limited Partnership ("CGM") with Robert L. Kemp. Prior to establishing CGM, Mr. Heebner managed mutual funds at Loomis, Sayles & Company. In addition to CGM Focus Fund, he currently manages CGM Mutual Fund and CGM Realty Fund.
|
| | | | |
| INVESTMENT PERFORMANCE |
| (unaudited) |
| Cumulative Total Returns for Periods Ended December 31, 2019 |
| | CGM Focus Fund (%) |
| 10 Years | + | 17.3 | | |
| 5 Years | - | 14.6 | | |
| 1 Year | - | 13.1 | | |
| 3 Months | - | 1.4 | | |
The performance data contained in the report represent past performance, which is no guarantee of future results. The graph and table above do not reflect the deduction of taxes a shareholder would pay on Fund distributions or the redemption of Fund shares and assumes the reinvestment of all Fund distributions.
The investment return and the principal value of an investment in the Fund will fluctuate so that investors' shares, when redeemed, may be worth more or less than their original cost. Current performance may be higher or lower than the performance data quoted.
PORTFOLIO DIVERSIFICATION as of December 31, 2019 COMMON STOCKS |
| | |
| Industry | Percent of Net Assets |
|
| Banks - Money Center | 24.5 | % |
| Retail | 17.3 |
|
| Electronic Components | 14.9 |
|
| Oil - Independent Production | 9.8 |
|
| Home Products | 6.3 |
|
| Electronic and Communication Equipment | 5.7 |
|
| Drugs | 5.4 |
|
| Housing and Building Materials | 4.9 |
|
| Auto and Related | 3.5 |
|
| Computer Software and Services | 3.2 |
|
| Peripherals | 2.7 |
|
| Miscellaneous | 1.2 |
|
| Leisure | 0.9 |
|
| Financial Services - Miscellaneous | 0.8 |
|
| SECURITIES SOLD SHORT |
| | | |
| Computer Software and Services | (35.4 | ) | |
| Services | (12.8 | ) | |
| Miscellaneous | (7.4 | ) | |
| Leisure | (6.8 | ) | |
| Technology | (6.4 | ) | |
| Retail | (6.1 | ) | |
SCHEDULE OF INVESTMENTS as of December 31, 2019 INVESTMENTS HELD LONG — 102.1% OF TOTAL NET ASSETS COMMON STOCKS — 101.1% OF TOTAL NET ASSETS |
| | | | | | | | |
| Auto and Related — 3.5% | Shares | | Value(a) |
| | Lithia Motors, Inc. | 106,000 |
| | $ | 15,582,000 |
|
| | | | | |
| Banks - Money Center — 24.5% | | | |
| | Banco Bradesco S.A. ADR (b)(c) | 4,456,000 |
| | 39,881,200 |
|
| | Banco Santander (Brasil) S.A. ADR (b)(c) | 3,085,000 |
| | 37,421,050 |
|
| | Itau Unibanco Holding S.A. ADR (b)(c) | 3,300,000 |
| | 30,195,000 |
|
| | | | | 107,497,250 |
|
| Computer Software and Services — 3.2% | | | |
| | Microsoft Corporation (b) | 88,000 |
| | 13,877,600 |
|
| | | | | |
| | | | | |
| | | | | |
See accompanying notes to financial statements.
4
| SCHEDULE OF INVESTMENTS as of December 31, 2019 (continued) |
| | | | | | | | |
| COMMON STOCKS (continued) | | | |
| | | | | |
| Drugs — 5.4% | Shares | | Value(a) |
| | AbbVie Inc. | 25,000 |
| | $ | 2,213,500 |
|
| | Horizon Therapeutics Public Limited Company (b)(c)(d) | 595,000 |
| | 21,539,000 |
|
| | | | | 23,752,500 |
|
| Electronic and Communication Equipment — 5.7% | | | |
| | NetEase, Inc. ADR (c) | 26,500 |
| | 8,125,960 |
|
| | Nokia Corporation ADR (c) | 4,500,000 |
| | 16,695,000 |
|
| | | | | 24,820,960 |
|
| Electronic Components — 14.9% | | | |
| | Micron Technology, Inc. (d) | 400,000 |
| | 21,512,000 |
|
| | Qorvo, Inc. (d) | 180,000 |
| | 20,921,400 |
|
| | Skyworks Solutions, Inc. (b) | 190,000 |
| | 22,967,200 |
|
| | | | | 65,400,600 |
|
| Financial Services - Miscellaneous — 0.8% | | | |
| | OneMain Holdings, Inc. | 80,000 |
| | 3,372,000 |
|
| | | | | |
| Home Products — 6.3% | | | |
| | Thor Industries, Inc. (b) | 375,000 |
| | 27,858,750 |
|
| | | | | |
| Housing and Building Materials — 4.9% | | | |
| | M.D.C. Holdings, Inc. (b) | 560,000 |
| | 21,369,600 |
|
| | | | | |
| Leisure — 0.9% | | | |
| | Royal Caribbean Cruises Ltd. (c) | 30,000 |
| | 4,005,300 |
|
| | | | | |
| Miscellaneous — 1.2% | | | |
| | Quanta Services, Inc. | 125,000 |
| | 5,088,750 |
|
| | | | | |
| Oil - Independent Production — 9.8% | | | |
| | Petroleo Brasileiro S.A. - Petrobras ADR (b)(c) | 2,700,000 |
| | 43,038,000 |
|
| | | | | |
| Peripherals — 2.7% | | | |
| | Western Digital Corporation | 190,000 |
| | 12,059,300 |
|
| | | | | |
| Retail — 17.3% | | | |
| | Alibaba Group Holding Limited ADR (c)(d) | 105,000 |
| | 22,270,500 |
|
| | RH (d) | 90,000 |
| | 19,215,000 |
|
| | Signet Jewelers Limited (c) | 1,045,000 |
| | 22,718,300 |
|
| | Target Corporation (b) | 93,000 |
| | 11,923,530 |
|
| | | | | 76,127,330 |
|
| | | |
TOTAL COMMON STOCKS (Identified cost $402,962,658) | | 443,849,940 |
|
See accompanying notes to financial statements.
5
| SCHEDULE OF INVESTMENTS as of December 31, 2019 (continued) |
| | | | | | | | |
| COMMON STOCKS (continued) | | |
| | | | | |
| SHORT-TERM INVESTMENT — 1.0% OF TOTAL NET ASSETS | Face Amount | | Value(a) |
| | Tri-party Repurchase Agreement with Fixed Income Clearing Corporation, dated 12/31/2019 at 0.12% to be repurchased at $4,600,031 on 01/02/2020 collateralized by $4,460,000 U.S. Treasury Note, 2.625% due 03/31/2025 valued at $4,694,134 including interest. (Cost $4,600,000)(e) | $ | 4,600,000 |
| | $ | 4,600,000 |
|
| | . | | | |
TOTAL INVESTMENTS HELD LONG — 102.1% (Identified cost $407,562,658) | | 448,449,940 |
|
| | | | |
| INVESTMENTS HELD SHORT — (74.9)% OF TOTAL NET ASSETS | | | |
| | | | |
| COMMON STOCKS — (74.9)% OF TOTAL NET ASSETS | | | |
| | | | |
| Computer Software and Services — (35.4%) | Shares | | |
| | CloudFlare, Inc. (d) | (1,615,000 | ) | | (27,551,900 | ) |
| | Coupa Software Incorporated (d) | (100,000 | ) | | (14,625,000 | ) |
| | Crowdstrike Holdings, Inc. (d) | (500,000 | ) | | (24,935,000 | ) |
| | Dynatrace, Inc. (d) | (380,000 | ) | | (9,614,000 | ) |
| | Elastic N.V. (c)(d) | (350,000 | ) | | (22,505,000 | ) |
| | MongoDB, Inc.(d) | (130,000 | ) | | (17,109,300 | ) |
| | Okta, Inc. (d) | (150,000 | ) | | (17,305,500 | ) |
| | Twilio Inc. (d) | (220,000 | ) | | (21,621,600 | ) |
| | | | | (155,267,300 | ) |
| Leisure — (6.8%) | | | |
| | Netflix, Inc. (d) | (93,000 | ) | | (30,092,010 | ) |
| | | | | |
| Miscellaneous — (7.4%) | | | |
| | Peloton Interactive, Inc. (d) | (1,150,000 | ) | | (32,660,000 | ) |
| | | | | |
| Retail — (6.1%) | | | |
| | Wayfair Inc. (d) | (295,000 | ) | | (26,659,150 | ) |
| | | | | |
| Services — (12.8%) | | | |
| | Lyft, Inc. (d) | (650,000 | ) | | (27,963,000 | ) |
| | Uber Technologies, Inc. (d) | (950,000 | ) | | (28,253,000 | ) |
| | | | | (56,216,000 | ) |
| Technology — (6.4%) | | | |
| | Slack Technologies, Inc. (d) | (1,245,000 | ) | | (27,987,600 | ) |
| | | | | |
TOTAL COMMON STOCKS (Proceeds $367,354,088) | | (328,882,060 | ) |
| | | | |
| | | | | |
| | | | | |
| | | | | |
| | | | | |
| | | | | |
See accompanying notes to financial statements.
6
| SCHEDULE OF INVESTMENTS as of December 31, 2019 (continued) |
| | | | | | | | |
| | | | | Value(a) |
TOTAL INVESTMENTS HELD SHORT — (74.9)% (Proceeds $367,354,088) | | $ | (328,882,060 | ) |
| | Cash and receivables | | 329,335,351 |
|
| | Liabilities | | (9,817,535 | ) |
| TOTAL NET ASSETS — 100.0% | | $ | 439,085,696 |
|
|
| | | | |
| (a) | See Note 2A. | | |
| (b) | A portion of this security has been segregated as collateral in connection with short sale investments (See Note 2E). |
| (c) | At December 31, 2019, the Fund had approximately 34.3% of net assets invested in companies incorporated in Brazil, approximately 6.9% of net assets invested in companies incorporated in Cayman Islands, approximately 5.2% of net assets invested in companies incorporated in Bermuda, approximately 5.1% of net assets invested in companies incorporated in Netherlands and is invested in other foreign countries that each amount for less than 5.0% of net assets (in aggregate 9.6%).
|
| (d) | Non-income producing security. | | | |
| (e) | See Note 2H.
| | | |
| | | | | |
ADR: American Depositary Receipt - a certificate issued by a U.S. bank representing the right to receive securities of the foreign issuer described. The values of ADRs are significantly influenced by trading on exchanges not located in the U.S. or Canada. |
See accompanying notes to financial statements.
7
|
| | | | | | | |
STATEMENT OF ASSETS AND LIABILITIES |
| |
| December 31, 2019 |
| Assets | | | |
| Investments in securities, at value: | | |
| (Identified cost $407,562,658) | | $ | 448,449,940 |
|
| Cash | | 827 |
|
| Deposits with brokers for short sales | | 286,690,668 |
|
| Receivable for: | | | |
| Securities sold | $ | 41,620,233 |
| | |
| Shares of the Fund sold | 2,412 |
| | |
| Dividends and interest | 1,021,211 |
| | 42,643,856 |
|
| Total assets | | 777,785,291 |
|
| Liabilities | | | |
| Securities sold short at current market value (Proceeds $367,354,088) | | 328,882,060 |
|
| Payable for: | | |
| Securities purchased | 7,547,184 |
| | |
Shares of the Fund redeemed | 946,837 |
| | |
| Interest payable | 136,507 |
| | |
| Tax withholding | 136,910 |
| |
|
|
| Distributions declared | 406,703 |
| | 9,174,141 |
|
| Accrued expenses: | | |
| Management fees | 367,040 |
| | |
| Trustees’ fees | 28,745 |
| | |
| Accounting, administration and compliance expenses | 48,107 |
| | |
| Transfer agent fees | 97,781 |
| | |
| Other expenses | 101,721 |
| | 643,394 |
|
| Total liabilities | | 338,699,595 |
|
| Net Assets | | $ | 439,085,696 |
|
| | | |
| Net Assets consist of: | |
|
|
| Capital paid-in | | $ | 622,288,439 |
|
| Accumulated loss | | (183,202,743 | ) |
| Net Assets | | $ | 439,085,696 |
|
| Shares of beneficial interest outstanding, no par value | 12,734,377 |
|
| Net asset value per share* | $34.48 |
* Shares of the Fund are sold and redeemed at net asset
value ($439,085,696 ÷ 12,734,377).
|
| | | | | |
STATEMENT OF OPERATIONS |
| |
| Twelve Months Ended December 31, 2019 |
| Investment Income | | | |
| Income: | | | |
| Dividends (net of withholding tax of | | | |
| $737,456) | | $ | 12,288,124 |
| |
| Interest | | 37,217 |
| |
| | | 12,325,341 |
| |
| | | | |
| Expenses: | | | |
| Management fees | | 5,211,857 |
| |
| Trustees’ fees | | 114,703 |
| |
| Accounting, administration and compliance expenses | | 577,283 |
| |
| Custodian fees and expenses | | 149,828 |
| |
| Transfer agent fees | | 592,530 |
| |
| Audit and tax services | | 53,767 |
| |
| Legal | | 85,980 |
| |
| Printing | | 48,445 |
| |
| Registration fees | | 27,149 |
| |
| Interest expense on short sales | | 2,314,260 |
| |
| Miscellaneous expenses | | 19,360 |
| |
| | | 9,195,162 |
| |
| Net investment income | 3,130,179 |
| |
| | | | |
| Realized and Unrealized Gain (Loss) on Investments | | | |
| Net realized losses on investments : | | | |
| Long transactions | | (46,203,855 | ) | |
| Short transactions | | (61,997,019 | ) | |
| | | (108,200,874 | ) | |
| Net change in unrealized appreciation (depreciation) on investments: | | | |
| Long transactions | | 54,998,217 |
| |
| Short transactions | | (30,309,195 | ) | |
| | | 24,689,022 |
| |
| Net realized and unrealized losses on investments | | (83,511,852 | ) | |
Change in Net Assets from Operations | | $ | (80,381,673 | ) | |
| | | | |
See accompanying notes to financial statements.
8
| STATEMENT OF CHANGES IN NET ASSETS |
| | | | | | | | |
| | | 2019 | | 2018 |
| From Operations | | | | |
| Net investment income (loss) | | $ | 3,130,179 |
| | $ | (2,075,697 | ) |
| Net realized losses on investments and foreign currency transactions | | (108,200,874 | ) | | (131,170,273 | ) |
| Net change in unrealized appreciation (depreciation) on investments | | 24,689,022 |
| | (91,175,277 | ) |
| Change in net assets from operations | | (80,381,673 | ) | | (224,421,247 | ) |
| | | | | |
| From Distributions to Shareholders | | | | |
| Total distributions | | (3,807,425 | ) | | (2,338,045 | ) |
| | | | | |
| From Capital Share Transactions | | | | |
| Proceeds from sale of shares | | 4,440,344 |
| | 8,546,919 |
|
| Net asset value of shares issued in connection with reinvestment of distributions | | 3,400,723 |
| | 2,068,867 |
|
| | | 7,841,067 |
| | 10,615,786 |
|
| Cost of shares redeemed | | (134,765,301 | ) | | (131,371,461 | ) |
| Change in net assets derived from capital share transactions | | (126,924,234 | ) | | (120,755,675 | ) |
| Total change in net assets | | (211,113,332 | ) | | (347,514,967 | ) |
| | | | | |
| Net Assets | | | | |
| Beginning of period | | 650,199,028 |
| | 997,713,995 |
|
| End of period | | $ | 439,085,696 |
| | $ | 650,199,028 |
|
| | |
|
| |
|
|
| Number of Shares of the Fund: | | | |
|
|
| Issued from sale of shares | | 122,169 |
| | 170,665 |
|
| Issued in connection with reinvestment of distributions | | 98,600 |
| | 51,708 |
|
| | | 220,769 |
| | 222,373 |
|
| Redeemed | | (3,715,897 | ) | | (2,695,406 | ) |
| Net change | | (3,495,128 | ) | | (2,473,033 | ) |
| | | | | |
See accompanying notes to financial statements.
9
| FINANCIAL HIGHLIGHTS |
| | | | | | | | | | | | | | | | | | | |
| | For the Year Ended December 31, |
| | 2019 | | 2018 | | 2017 | | 2016 | | 2015 |
| For a share of the Fund outstanding throughout each period: | | | | | | | | | |
| Net asset value at beginning of period | $ | 40.06 |
| | $ | 53.35 |
| | $ | 42.74 |
| | $ | 39.20 |
| | $ | 40.88 |
|
| Net investment income (loss) (a)(b) | 0.22 |
| | (0.12 | ) | (c) | (0.67 | ) | | (0.41 | ) | | (0.52 | ) |
| Net realized and unrealized gains (losses) on investments and foreign currency transactions | (5.50 | ) | | (13.03 | ) | | 11.28 |
| | 3.95 |
| | (1.16 | ) |
| Total from investment operations | (5.28 | ) | | (13.15 | ) | | 10.61 |
| | 3.54 |
| | (1.68 | ) |
| | | | | | | | | | |
| Dividends from net investment income | (0.30 | ) | | (0.14 | ) | | — |
| | — |
| | — |
|
| | | | | | | | | | |
| Net increase (decrease) in net asset value | (5.58 | ) | | (13.29 | ) | | 10.61 |
| | 3.54 |
| | (1.68 | ) |
| Net asset value at end of period | $ | 34.48 |
| | $ | 40.06 |
| | $ | 53.35 |
| | $ | 42.74 |
| | $ | 39.20 |
|
| | | | | | | | | | |
| Total return (%) | (13.1 | ) | | (24.7 | ) | | 24.8 |
| | 9.0 |
| | (4.1 | ) |
| | | | | | | | | | |
| Ratios: | | | | | | | | | |
| Operating expenses to average net assets (%) | 1.32 |
| | 1.18 |
| | 1.16 |
| | 1.20 |
| | 1.13 |
|
| Dividends and interest on short positions to average net assets (%) | 0.44 |
| | 1.27 |
| | 1.92 |
| | 1.25 |
| | 1.09 |
|
| Total expenses to average net assets (%) | 1.76 |
| | 2.45 |
| | 3.08 |
| | 2.45 |
| | 2.22 |
|
| | | | | | | | | | |
| Net investment income (loss) to average net assets (%) | 0.60 |
| | (0.24 | ) | (c) | (1.38 | ) | | (1.13 | ) | | (1.27 | ) |
| Portfolio turnover (%) (d) | 451 |
| | 403 |
| | 388 |
| | 334 |
| | 268 |
|
| Net assets at end of period (in thousands) ($) | 439,086 |
| 650,199 | | 997,714 | | 936,846 | | 1,064,927 | |
| (a) Net investment income (loss) per share excluding all related | | | | |
| short sale income and expenses ($) | 0.38 |
| | 0.51 |
| | 0.26 |
| | 0.04 |
| | (0.07 | ) |
(b) Per share net investment income (loss) has been calculated using average shares outstanding during the period.
(c) Net Investment loss per share reflects non-recurring dividends which amounted to $0.17 per share. Excluding these non-recurring dividends, the ratio of net investment loss to average net assets would have been (0.58)%.
(d) Includes short sale bond transactions.
See accompanying notes to financial statements.
10
|
|
| |
| CGM FOCUS FUND |
| |
| NOTES TO FINANCIAL STATEMENTS — December 31, 2019 |
| |
1. Organization — CGM Focus Fund (the "Fund") is a diversified series of CGM Trust (the "Trust") which is organized as a Massachusetts business trust under the laws of Massachusetts pursuant to an Agreement and Declaration of Trust. The Trust is registered under the Investment Company Act of 1940 as an open-end management investment company and is following accounting and reporting guidance in the Financial Accounting Standards Board’s (“FASB”) Topic 946 “Financial Services—Investment Companies”. The Trust has two other funds whose financial statements are not presented herein. The Fund commenced operations on September 3, 1997. The Fund’s investment objective is long-term growth of capital. The Fund intends to pursue its objective by investing in a smaller number of companies, and/or in a more limited number of sectors than other diversified mutual funds. In addition, should the investment outlook of the Fund’s investment adviser so warrant, the Fund may engage in a variety of investment techniques including short sales designed to capitalize on declines in the market price of specific securities of one or more companies, or declines in market indexes or government securities.
2. Significant accounting policies — Management has evaluated the events and transactions from December 31, 2019 through the date of issuance of the Fund’s financial statements. For the Fund, there were no material subsequent events that required disclosure in the financial statements or footnotes.
A. Security valuation — Equity securities are valued on the basis of valuations furnished by a pricing service, authorized by the Board of Trustees (the “Board”). Equity securities listed or regularly traded on a securities exchange or in the over-the-counter (“OTC”) market are valued at the last quoted sale price or, for certain markets, the official closing price at the time the valuations are made. A security that is listed or traded on more than one exchange is valued at the quotation on the exchange determined to be the primary market for such security. For securities with no sale reported, the last reported bid price is used for long positions and the last reported ask price for short positions. Corporate debt securities are valued on the basis of valuations furnished by a pricing service, authorized by the Board, which determines valuations for normal, institutional-size trading units of such securities using market information, transactions for comparable securities and various relationships between securities which are generally recognized by institutional traders. United States government debt securities held long are valued at the current closing bid and if held short are valued at the current closing ask, as last reported by a pricing service approved by the Board.
When current market prices or quotations are not readily available or do not accurately reflect fair value, valuations may be determined in accordance with procedures adopted by the Board. For example, when developments occur between the close of a market and the close of the New York Stock Exchange ("NYSE") that may materially affect the value of some or all of the securities, or when trading in a security is halted, these procedures may be used. The frequency with which these procedures are used is unpredictable. These valuation procedures may result in a change to a particular security’s assigned level within the fair value hierarchy described below. The value of securities used for net asset value (“NAV”) calculation under these procedures may differ from published prices for the same securities.
The Fund may use valuation techniques consistent with the market, income, and cost approach to measure fair value. The market approach uses prices and other relevant information generated by market transactions involving identical or comparable assets or liabilities. The income approach uses valuation techniques to convert future amounts (cash flows, earnings) to a single present amount. The cost approach is based on the amount that currently would be required to replace the service capacity of an asset. To increase consistency and comparability in fair value measurements and related disclosure, the Fund utilizes a fair value hierarchy which prioritizes the various inputs to valuation techniques used to measure fair value into three broad levels:
| |
| • | Level 1 - Prices determined using: quoted prices in active markets for identical securities that the Fund has the ability to access at the measurement date. Valuation adjustments are not applied to Level 1 investments. |
|
|
| |
| CGM FOCUS FUND |
| |
| NOTES TO FINANCIAL STATEMENTS (continued) |
| |
| |
| • | Level 2 - Prices determined using: other significant observable inputs (including quoted prices for similar securities, interest rates, prepayment spreads, credit risk, etc.). |
| |
| • | Level 3 - Prices determined using: significant unobservable inputs, including the Fund’s own assumptions and judgment in determining the fair value of investments. In situations where quoted prices or observable inputs are unavailable (for example, when there is little or no market activity for an investment at the end of the period), unobservable inputs may be used. Unobservable inputs reflect the Fund’s own assumptions about the factors market participants would use in pricing an investment, and would be based on the best information available in the circumstances. Investments falling into the Level 3 category are primarily supported by quoted prices from brokers and dealers participating in the market for those investments. However, these may be classified as Level 3 investments due to lack of market transparency and corroboration to support these quoted prices. Additionally, valuation models may be used as the pricing source for any remaining investments classified as Level 3. These models rely on one or more significant unobservable inputs and/or significant assumptions by Capital Growth Management Limited Partnership, the Fund’s investment adviser (“CGM”). Inputs used in valuations may include, but are not limited to, financial statement analysis, capital account balances, discount rates and estimated cash flows, and comparable company data. |
The inputs or methodology used for valuing securities are not necessarily an indication of the risk associated with investing in those securities. The following is a summary of the inputs used to value the Fund’s investments as of December 31, 2019:
|
| | | | | | | | | | | |
| | | | Valuation Inputs |
| | Classification | | Level 1 -
Quoted Prices | | Level 2 - Other Significant Observable Inputs | | Level 3 - Significant Unobservable Inputs |
| | Investments in Securities-Assets | | | | | | |
| | Common Stocks* | | $ | 443,849,940 |
| | — | | — |
| | Short-Term Investment | | | | | | |
| | Repurchase Agreement | | — | | $ | 4,600,000 |
| | — |
| | Total | | $ | 443,849,940 |
| | $ | 4,600,000 |
| | — |
| | | | | | | | |
| | Investments in Securities-Liabilities | | | | | | |
| | Common Stocks* | | $ | (328,882,060 | ) | | — | | — |
| | Total | | $ | (328,882,060 | ) | | — | | — |
| | | | | | | | |
| * | All common stocks held in the Fund are Level 1 securities. For a detailed break-out of common stocks by major industry classification, please refer to the Schedule of Investments. |
B. Security transactions and related investment income — Security transactions are accounted for on the trade date plus one basis for daily NAV calculations. However, for financial reporting purposes, investment transactions are reported on the trade date (date the order to buy or sell is executed). Dividend income and expense is recorded on the ex-dividend date net of applicable foreign taxes and fees, a portion of which may be recoverable. The Fund will accrue such taxes and recoveries as applicable based upon its current interpretations of the tax rules and regulations that exist in the markets in which it invests. Interest income and expense is recorded on an accrual basis and includes amortization of premium and discount. Net gain or loss on securities sold is determined on the identified cost basis and may include proceeds from litigation. Dividend payments received by the Fund from its investment in real estate investment trusts (“REITs”) may consist of ordinary income, capital gains, and return of capital and as such are recorded as dividend income, capital gains or a reduction to security cost, as appropriate.
|
|
| |
| CGM FOCUS FUND |
| |
| NOTES TO FINANCIAL STATEMENTS (continued) |
| |
Distributions from publicly traded partnerships are generally recorded based on the characterization reported on the Fund’s schedule K-1 received from the partnership. Non-cash dividend payments, if any, are recorded at the fair market value of the securities received.
C. Federal income taxes — It is the Fund’s policy to comply with the requirements of the Internal Revenue Code ("IRC") applicable to regulated investment companies, and to distribute to its shareholders all of its taxable income and net realized capital gains, within the prescribed time period.
Capital accounts within the financial statements are adjusted for permanent book/tax differences. These adjustments have no impact on the Fund's net assets or results of operations. Temporary book/tax differences, if any, will reverse in a subsequent period. Any difference between book basis and tax basis unrealized appreciation is attributable primarily to the temporary book/tax difference of tax deferral of losses on wash sales.
As of December 31, 2019, the components of distributable earnings on a tax basis were as follows:
|
| | | | |
| Undistributed Ordinary Income | | Undistributed Long-term Capital Gains | | Net Unrealized Appreciation/ (Depreciation) |
| — | | — | | $70,583,628 |
The identified cost of investments in securities and securities sold short owned by the Fund for federal income tax purposes, and their respective gross unrealized appreciation and depreciation at December 31, 2019 was as follows:
|
| | | | | | |
| Identified Cost* | | Gross Unrealized Appreciation | | Gross Unrealized Depreciation | | Net Unrealized Appreciation |
| $48,984,252 | | $89,295,498 | | $(18,711,870) | | $70,583,628 |
| * The cost basis has been reduced by the proceeds of the short positions ($367,354,088) at December 31, 2019. Since the cost basis includes the proceeds from short sales it may result in a net negative cost basis. |
The Fund is permitted to carry forward capital losses for an unlimited period, and such losses, when carried forward, retain their character as either short-term or long-term capital losses. As of December 31, 2019, the capital loss carryforwards utilized and the accumulated net realized loss on sales of investments for federal income tax purposes which are available to offset future taxable gains, prior to distributing such gains to shareholders, are shown in the table below:
|
| | | | | | | | | | |
Short-term Capital Loss Carryforward Utilized | | Long-term Capital Loss Carryforward Utilized | | Total | | Remaining Short-term Capital Loss Carryforward | | Remaining Long-term Capital Loss Carryforward | | Total |
| — | | — | | — | | $248,926,640 | | — | | $248,926,640 |
Management has concluded that there are no significant uncertain tax positions for the open tax years as of December 31, 2019 that would require recognition in the financial statements. However, management’s conclusion may be subject to review and adjustment at a later date based on factors including, but not limited to, new tax laws, regulations, and administrative interpretations (including relevant court decisions). Generally, the Fund's federal tax returns for the prior three fiscal years remain subject to examination by the Internal Revenue Service.
|
|
| |
| CGM FOCUS FUND |
| |
| NOTES TO FINANCIAL STATEMENTS (continued) |
| |
D. Dividends and distributions to shareholders — Dividends and distributions are recorded by the Fund on the ex-dividend date. The classification of income and capital gains distributions is determined in accordance with income tax regulations. Distributions from net investment income and short-term capital gains are treated as ordinary income for income tax purposes. Permanent book/tax differences relating to shareholder distributions may result in reclassifications to paid-in capital or accumulated realized gain/(loss). The Fund also may utilize earnings and profits distributed to shareholders on redemption of shares as a part of the dividend deduction for income tax purposes. Undistributed net investment income or accumulated net investment loss may include temporary book/tax differences such as tax deferral of losses on wash sales and disallowed interest expense deduction, which will reverse in a subsequent period. Any taxable income or gain remaining at fiscal year end is distributed in the following year.
The tax characterization of distributions is determined on an annual basis. The tax character of distributions paid during the periods ended December 31, 2019 and 2018 were as follows:
|
| | | | | | |
| Year | | Ordinary
Income | | Long-term
Capital Gains | | Total |
| 2019 | | $3,807,425 | | — | | $3,807,425 |
| 2018 | | $2,338,045 | | — | | $2,338,045 |
E. Short sales — The Fund engages in short sales of securities. A short sale is a transaction in which the Fund sells a security it does not own in anticipation that the market price of that security will decline. When the Fund makes a short sale, it must borrow the security sold short to make delivery to the buyer. The Fund is then obligated to replace the security borrowed by purchasing the security at the market price at the time of the replacement. The Fund is liable for any fees, dividends or interest paid on securities sold short, which are recorded as expenses on the Statement of Operations. The net amount of income and/or fees are included as interest expense on short sales on the Statement of Operations. While the short sale is outstanding, the Fund is required to collateralize its obligations, which has the practical effect of limiting the extent to which the Fund may engage in short sales. Under certain market conditions, short sales can increase the volatility of the Fund and may lower the Fund’s return or result in losses, which potentially may be unlimited. The market value of securities held in a segregated account at December 31, 2019 was $211,253,100 and the value of cash held in a segregated account at December 31, 2019 was $286,690,668.
F. Guarantees and indemnifications — Under the Trust's organizational documents, its officers and trustees are indemnified against certain liabilities arising out of the performance of their duties for the Fund. Additionally, in the normal course of business, the Fund may enter into contracts with service providers that contain general indemnification clauses. The Fund's maximum exposure under these arrangements is unknown, as this would involve future claims that may be made against the Fund that have not yet occurred. The risk of material loss from such claims is considered remote.
G. Foreign currency translation — All assets and liabilities initially expressed in terms of foreign currencies are translated into U.S. dollars each day at the prevailing exchange rate. Transactions affecting Statement of Operations accounts and net realized gain or loss on investments are translated at the rates prevailing at the dates of the transactions. The Fund does not isolate that portion of the results of operations resulting from changes in foreign exchange rates on investments from the fluctuations arising from changes in market prices of securities held. Such fluctuations are included with the net realized and unrealized gain or loss from investments. Reported net realized foreign exchange gains or losses arise from sales of foreign currency, currency gains or losses realized between the trade and settlement dates on securities transactions and the difference between the amounts of dividends, interest, and foreign withholding taxes recorded on the Fund’s books and the U.S. dollar equivalent of the amounts actually
|
|
| |
| CGM FOCUS FUND |
| |
| NOTES TO FINANCIAL STATEMENTS (continued) |
| |
received or paid. Net unrealized foreign exchange gains or losses arise from changes in the value of assets and liabilities other than investments in securities at the end of the period, resulting from changes in the exchange rate.
H. Repurchase agreements — The Fund enters into repurchase agreements, under the terms of a Master Repurchase Agreement, secured by U.S. Government or Agency securities, which involve the purchase of securities from a counterparty with a simultaneous commitment to resell the securities at an agreed upon date and price. Certain repurchase agreements are tri-party arrangements whereby the collateral is held in a segregated account for the benefit of the Fund and on behalf of the counterparty. Repurchase agreements afford the Fund the opportunity to earn a return on temporarily available cash at minimal market risk. While the underlying security may be a bill, certificate of indebtedness, note or bond issued by an agency, authority or instrumentality of the U.S. Government, the obligation of the seller is not guaranteed by the U.S. Government and there is a risk that the seller may fail to repurchase the underlying security. Consequently, there may be possible delays or restrictions upon the Fund’s ability to dispose of the underlying securities. Upon an event of default under the Master Repurchase Agreement, the Fund would attempt to exercise its rights with respect to the underlying security, including taking possession of the cash and/or collateral provided by the seller.
At December 31, 2019, the Fund had an investment in a repurchase agreement with a gross value of $4,600,000 on the Statement of Assets and Liabilities. The value of the related collateral consisting of cash, interest and/or securities of $4,694,134 exceeded the value of the repurchase agreement at December 31, 2019 by $94,134.
I. Use of estimates — The preparation of financial statements in accordance with U.S. Generally Accepted Accounting Principles (“GAAP”) requires management to make certain estimates and assumptions that affect the reported amounts of assets and liabilities, the disclosure of contingent assets and liabilities at the date of the financial statements and the reported amounts of revenue and expenses during the reporting period. Actual results could differ from those estimates.
3. Risks and uncertainties
A. Risks associated with focused investing — The Fund, although diversified, takes a focused approach to investing within particular industries or sectors of the economy and may invest in a relatively small number of individual holdings. Therefore, the Fund may be subject to greater price volatility and may be more adversely affected by the performance of particular industries, sectors, or individual holdings than would a more diversified fund. In addition, funds that invest more heavily in certain industries, sectors or individual holdings are particularly susceptible to the impact of market, economic, regulatory and other factors affecting those investments.
B. Risks associated with foreign investments — The Fund may invest in securities issued by institutions, corporations, and governments established by or located in foreign countries, which may be developed or undeveloped countries. Investing in foreign securities may involve significant risks. For example, there is often less publicly available information about foreign companies, particularly those not subject to the disclosure and reporting requirements of the U.S. securities laws. Foreign issuers are often not bound by uniform accounting, auditing, and financial reporting requirements and standards of practice comparable to those applicable to domestic issuers. Investments in foreign securities also involve the risk of possible adverse changes in investment or exchange control regulations, expropriation or confiscatory taxation, political or financial instability or diplomatic and other developments which could affect such investments. Foreign stock markets, while growing in volume and sophistication, are often not as developed as those in the U.S., and securities of some foreign issuers (particularly those located in developing countries) may be less liquid and more volatile than securities of comparable U.S. companies. There may also be less overall governmental supervision and regulation of foreign securities markets, broker-dealers and issuers than in the U.S. Additionally, because some foreign securities the Fund may acquire are purchased with and payable in foreign currencies, the value of these assets as measured in
|
|
| |
| CGM FOCUS FUND |
| |
| NOTES TO FINANCIAL STATEMENTS (continued) |
| |
U.S. dollars may be affected favorably or unfavorably by changes in currency rates and exchange control regulations. There is no limit on the amount that the Fund may invest in issuers located in a single country or in foreign countries in the aggregate. To the extent the Fund focuses its investments in a single country or only a few countries in a particular geographic region, economic, political, regulatory or other conditions affecting such country or region may have a greater impact on Fund performance relative to a more geographically diversified fund.
A substantial portion of the Fund’s portfolio is invested in American Depositary Receipts of companies domiciled in Brazil. The risks of foreign investments described above are generally heightened when investing in issuers in emerging market countries, such as Brazil. Investing in Brazilian issuers involves certain special risks, including investment and repatriation controls, fluctuations in the rate of exchange between Brazil’s currency (the Real) and the U.S. Dollar, political instability, corruption and price volatility. In addition, the market for Brazilian securities is influenced by the flow of international capital and economic and market conditions of certain countries, especially other emerging market countries in Central and South America. The Brazilian economy has historically been exposed to high rates of inflation and a high level of debt, each of which may reduce and/or prevent economic growth. Brazilian securities may also be particularly sensitive to market movements because their market prices tend to reflect speculative expectations.
4. Purchases and sales of securities — For the year ended December 31, 2019, purchases and sales of securities other than U.S. Government or Agency obligations and short-term investments aggregated $2,596,015,285 and $2,803,283,899, respectively. Buys to cover for U.S. Treasury Bonds for the year ended December 31, 2019 were $407,434,375.
5. Fees and expenses
A. Management fees — During the year ended December 31, 2019, the Fund incurred management fees of $5,211,857, paid or payable monthly to CGM, certain officers and employees of which are also officers and trustees of the Fund. The management agreement provides for a fee at the annual rate of 1.00% on the first $500 million of the Fund’s average daily net assets, 0.95% of the next $500 million of the Fund's average daily net assets and 0.90% on amounts in excess of $1 billion of the Fund's average daily net assets.
B. Other expenses — The majority of expenses are directly attributable to the Fund. Expenses that are not readily attributable to the Fund are allocated among each of the three funds comprising the Trust in an equitable manner, taking into consideration, among other things, the nature and type of expense and the funds' respective net assets. CGM performs certain administrative, accounting, compliance and other services for the Fund. The expenses of those services, which are paid to CGM by the Fund, include the following: (i) expenses for personnel performing bookkeeping, accounting and financial reporting and clerical functions relating to the Fund; (ii) expenses for services required in connection with the preparation of registration statements and prospectuses, shareholder reports and notices, proxy solicitation material furnished to shareholders of the Fund or regulatory authorities and reports and questionnaires for Securities and Exchange Commission ("SEC") compliance; (iii) registration, filing and other fees in connection with requirements of regulatory authorities and (iv) compliance in connection to the Investment Company Act of 1940 and the Sarbanes-Oxley Act of 2002. The accounting, administration and compliance expenses of $577,283, for the year ended December 31, 2019, are shown separately in the Statement of Operations. These expenses include the reimbursement of a portion of the compensation expenses incurred by CGM for its employees who provide these administrative, accounting, compliance, and other services to the Fund, including $510,253 of the salaries of CGM employees who are officers of the Fund.
C. Trustees fees and expenses — The Fund does not pay any compensation directly to any trustees who are “interested persons” (as defined in the Investment Company Act of 1940) of CGM or any affiliate of CGM (other than registered investment companies). For the year ended December 31, 2019, each disinterested trustee was
|
|
| |
| CGM FOCUS FUND |
| |
| NOTES TO FINANCIAL STATEMENTS (continued) |
| |
compensated by the Trust with an annual fee of $90,000 plus travel expenses for each meeting attended. The disinterested trustees are responsible for the audit committee functions of the Trust’s Board and have designated a disinterested trustee to lead the Board's efforts in overseeing those functions, who receives an additional $30,000 annually. Of these amounts, the Fund is responsible for $10,000 per trustee annually, plus an annual variable fee calculated based on the proportion of the Fund’s average net assets relative to the aggregate average net assets of the Trust.
6. Recent accounting pronouncement
A. Fair value measurement — In August 2018, the FASB issued Accounting Standards Update 2018-13, Fair Value Measurement (Topic 820) - Disclosure Framework - Changes to the Disclosure Requirements for Fair Value Measurement (“ASU 2018-13”) which introduces new fair value disclosure requirements and eliminates and modifies certain existing fair value disclosure requirements. ASU 2018-13 would be effective for fiscal years beginning after December 15, 2019, and interim periods within those fiscal years; however, management has elected to adopt ASU 2018-13 effective with the current reporting period. The impact of the fund’s adoption is limited to changes in the fund’s financial statement disclosures regarding fair value, primarily those disclosures related to transfers between levels of the fair value hierarchy.
|
|
| |
| CGM FOCUS FUND |
| |
| REPORT OF INDEPENDENT REGISTERED PUBLIC ACCOUNTING FIRM |
| |
To the Board of Trustees of CGM Trust and Shareholders of CGM Focus Fund
Opinion on the Financial Statements
We have audited the accompanying statement of assets and liabilities, including the schedule of investments, of CGM Focus Fund (the "Fund") as of December 31, 2019, the related statement of operations for the year ended December 31, 2019, the statement of changes in net assets for each of the two years in the period ended December 31, 2019, including the related notes, and the financial highlights for each of the five years in the period ended December 31, 2019 (collectively, referred to as the “financial statements”). In our opinion, the financial statements present fairly, in all material respects, the financial position of the Fund as of December 31, 2019, the results of its operations for the year then ended, the changes in its net assets for each of the two years in the period ended December 31, 2019 and the financial highlights for each of the five years in the period ended December 31, 2019 in conformity with accounting principles generally accepted in the United States of America.
Basis for Opinion
These financial statements are the responsibility of the Fund’s management. Our responsibility is to express an opinion on the Fund’s financial statements based on our audits. We are a public accounting firm registered with the Public Company Accounting Oversight Board (United States) (“PCAOB”) and are required to be independent with respect to the Fund in accordance with the U.S. federal securities laws and the applicable rules and regulations of the Securities and Exchange Commission and the PCAOB.
We conducted our audits of these financial statements in accordance with the standards of the PCAOB. Those standards require that we plan and perform the audit to obtain reasonable assurance about whether the financial statements are free of material misstatement, whether due to error or fraud.
Our audits included performing procedures to assess the risks of material misstatement of the financial statements, whether due to error or fraud, and performing procedures that respond to those risks. Such procedures included examining, on a test basis, evidence regarding the amounts and disclosures in the financial statements. Our audits also included evaluating the accounting principles used and significant estimates made by management, as well as evaluating the overall presentation of the financial statements. Our procedures included confirmation of securities owned as of December 31, 2019 by correspondence with the custodian and brokers; when replies were not received from brokers, we performed other auditing procedures. We believe that our audits provide a reasonable basis for our opinion.
PricewaterhouseCoopers LLP
Boston, Massachusetts
February 14, 2020
We have served as the auditor of one or more investment companies in Capital Growth Management Investment Company Complex since at least 1994. We have not determined a specific year we began serving as auditor.
|
|
| |
| CGM FOCUS FUND |
| |
| ADDITIONAL INFORMATION |
| (unaudited) |
Availability of proxy voting information:
Proxy voting policies and information regarding how the Fund voted proxies relating to portfolio securities during the twelve month period ended June 30, 2019 are available without charge, by calling 800-345-4048. The policies also appear in the Fund’s Statement of Additional Information, which can be found on the CGM Funds' website, www.cgmfunds.com, and the SEC’s website, www.sec.gov. The voting records can also be found on the SEC’s website on the N-PX filing.
Portfolio holdings:
The Fund files its complete schedule of portfolio holdings with the SEC for the first and third quarters of each fiscal year on Form N–PORT, which is available on the SEC's website at www.sec.gov. Portfolio holdings are also disclosed in the Fund's quarterly reports. The Fund's four most recent quarterly reports can be obtained on the CGM Funds' website, www.cgmfunds.com.
The Fund’s Prospectus and Statement of Additional Information contain additional information on other risks and uncertainties relating to the Fund’s investments. The Fund’s Prospectus and Statement of Additional Information can be obtained on the CGM Funds' website, www.cgmfunds.com, and the SEC’s website, www.sec.gov or by calling 800-345-4048.
Liquidity Risk Management Program:
On October 13, 2016, the Securities and Exchange Commission (“SEC”) adopted Rule 22e-4 (“Liquidity Rule”) under the Investment Company Act of 1940 (“1940 Act”) which requires registered open-end funds to establish and implement a written Liquidity Risk Management Program reasonably designed to assess and manage its liquidity risk. The Fund must also periodically review its liquidity risk. In addition, a written report is provided to the Fund’s Board of Trustees annually which details the operation of the Fund’s program.
Pursuant to its program, the Fund classifies the liquidity of its portfolio investments into one of the four categories defined by the SEC: “Highly Liquid”, “Moderately Liquid”, “Less Liquid” and “Illiquid”. These classifications are reported to the SEC on Form N-PORT. The Liquidity Rule requires open-end funds that are not invested primarily in “Highly Liquid” investments to establish a “Highly Liquid Investment Minimum” (“HLIM”), which is the minimum percentage of net assets that must be invested in Highly Liquid investments (i.e., cash or investments that are reasonably expected to be convertible into cash within three business days without significantly changing the market value of the investment). It was determined through periodic reviews that the Fund’s portfolio holdings have been primarily Highly Liquid and, therefore, the Fund does not need to establish a HLIM.
The Fund may not acquire an investment if, immediately after the acquisition, over 15% of the Fund’s net asset would consist of Illiquid investments (an investment that cannot reasonably be expected to be sold or disposed of in current market conditions in seven calendar days or less without the sale or disposition significantly changing the market value of the investment). The Fund is required to report to the SEC and the Fund’s Board of Trustees if the Fund holds illiquid investments in excess of the 15% limit. No such reporting was required during the past year. In addition, periodic stress testing confirmed that the Fund held sufficient liquid investments to cover all reasonably foreseeable levels of cash flow.
|
|
| |
| CGM FOCUS FUND |
| |
| ADDITIONAL INFORMATION |
| (unaudited) |
TAX INFORMATION FOR THE TAX YEAR ENDED December 31, 2019
(unaudited)
We are providing this information as required by the IRC.
For taxable non-corporate shareholders, 100% of the 2019 ordinary dividend is considered qualified dividend income that may be eligible for reduced capital gains rates.
For corporate shareholders, 71.5% of the 2019 ordinary dividend qualifies for the dividends-received deduction.
|
|
| |
| CGM FOCUS FUND |
| |
| FUND EXPENSES |
| (unaudited) |
As a shareholder of CGM Focus Fund, you incur two types of costs: (1) transaction costs, which could include, among other charges, wire fees and custodial maintenance fees for certain types of accounts and (2) ongoing costs, including management fees and other Fund expenses. This example is intended to help you understand your ongoing costs (in dollars) of investing in the Fund and to compare these costs with the ongoing costs of investing in other mutual funds.
The example is based on an investment of $1,000 invested at the beginning of the period and held for the entire period July 1, 2019 to December 31, 2019.
Actual return and expenses
The first line of the table below provides information about actual account values and actual expenses.
You may use the information in this line, together with the amount you invested, to estimate the expenses that you paid over the period. Simply divide your account value by $1,000 (for example, an $8,600 account value divided by $1,000 = 8.6), then multiply the result by the number in the first line under the heading entitled ‘‘Expenses Paid During Period’’ to estimate the expenses you paid on your account during this period.
Hypothetical example for comparison purposes
The second line of the table below provides information about hypothetical account values and hypothetical expenses based on the Fund’s actual expense ratio and an assumed rate of return of 5% per year before expenses, which is not the Fund’s actual return. The hypothetical account values and expenses may not be used to estimate the actual ending account balance or expenses you paid for the period.
You may use this information to compare the ongoing costs of investing in the Fund and other funds. To do so, compare this 5% hypothetical example with the 5% hypothetical examples that appear in the shareholder reports of the other funds.
Please note that the expenses shown in the table are meant to highlight your ongoing costs only and do not reflect any transactional costs such as any wire fees or custodial maintenance fees that may be payable. Therefore, the second line of the table is useful in comparing ongoing costs only, and will not help you determine the relative total costs of owning different funds. In addition, if these transactional costs were included, your costs would have been higher.
|
| | | |
| | Beginning Account Value 07/01/19 | Ending Account Value
12/31/19 | Expenses Paid During Period* 07/01/19 - 12/31/19 |
| Actual | $1,000.00 | $1,013.72 | $7.89 |
Hypothetical
(5% return before expenses) | $1,000.00 | $1,017.37 | $7.90 |
* Expenses are equal to the Fund’s annualized expense ratio of 1.55%, which includes expenses related to short sales activity, multiplied by the average account value over the period, multiplied by 184/365 (to reflect the one-half year period).
|
|
| |
| CGM FOCUS FUND |
| |
| TRUSTEES AND OFFICERS |
The Fund is supervised by the Board of Trustees (the “Board”) of the Trust. The Board is responsible for the general oversight of the Fund, including general supervision and review of the Fund’s investment activities. The Board, in turn, elects the officers who are responsible for administering the Fund’s day-to-day operations.
An asterisk in the following table identifies those trustees and officers who are “interested persons” of the Trust as defined in the Investment Company Act of 1940. Each trustee and officer of the Trust noted as an interested person is interested by virtue of that individual’s position with CGM, as described in the table below. Each trustee serves during the continued lifetime of the Trust, until he or she earlier dies, resigns or is removed, or if sooner, until the election and qualification of his or her successor. Each officer serves until his or her successor is elected or qualified, or until the officer sooner dies, resigns, or is removed or becomes disqualified.
The trustees and officers of the Trust, their ages, their principal occupations during the past five years, the number of CGM Funds they oversee, and other directorships they hold are set forth below. Unless otherwise noted below, the address of each interested trustee and officer is One International Place, Boston, Massachusetts 02110. Correspondence intended for the trustees who are not “interested persons” of the Trust may be sent c/o Capital Growth Management, One International Place, Boston, Massachusetts 02110. The Statement of Additional Information for the Fund includes additional information about Fund trustees and is available on the CGM Funds' website, www.cgmfunds.com, or by calling 800-345-4048.
|
| | | | | | |
| Name | | Positions Held and Length of Time Served | | Principal Occupations and Other Directorships Held During Past 5 Years | | Number of Funds in the CGM Funds Complex Overseen |
| (Birth Year) | |
| Interested Trustees | | | | | | |
| Ken Heebner* | | Trustee since 1993 | | Co-founder and Employee, CGM; Controlling owner of Kenbob, Inc. (general partner of CGM) | | 3 |
| (1940) | | | | |
Leslie A. Lake*
| | Trustee since 2013 | | Consultant to CGM (since 2013) | | 3 |
| (1945) | | | | |
| Disinterested Trustees | | | | | | |
Peter O. Brown
| | Trustee since 1993 | | Counsel (formerly, Partner), Harter, Secrest & Emery LLP (law firm); formerly Executive Vice President and Chief Operating Officer, The Glenmede Trust Company (from 1990 to 1993); formerly Senior Vice President, J.P. Morgan Chase Bank (from 1981 to 1990); formerly Trustee, TT International U.S.A. Master and Feeder Trusts (four mutual funds) (from 2000 to 2005) | | 3 |
| (1940) | | | | |
| Mark W. Holland | | Trustee since 2004 | | President, Wellesley Financial Advisors, LLC (since 2003); formerly Vice President and Chief Operating Officer, Fixed Income Management, Loomis, Sayles & Company, L.P. (from 1999 to 2002); formerly Director, Loomis, Sayles & Company, L.P. (from 1993 to 2001) | | 3 |
| (1949) | | | | |
|
| | | | | | |
| Name | | Positions Held and Length of Time Served | | Principal Occupations and Other Directorships Held During Past 5 Years | | Number of Funds in the CGM Funds Complex Overseen |
| (Birth Year) | |
| | | | | | | |
| J. Baur Whittlesey | | Trustee since 1990 | | Member (1994 to 2016) and Senior Counsel (since 2017), Ledgewood, P.C. (law firm) | | 3 |
| (1946) | | | | |
| | | | | | | |
| Officers | | | | | | |
| Ken Heebner* | | Vice President since 1990 | | Co-founder and Employee, CGM; Controlling owner of Kenbob, Inc. (general partner of CGM) | | 3 |
| (1940) | | | | |
David C. Fietze*
| | President since 2015 and Chief Compliance Officer since 2004 | | Employee – Legal Counsel, CGM | | 3 |
| (1969) | | | | |
Kathleen S. Haughton*
| | Vice President since
1992 and Anti-Money Laundering Compliance Officer since 2002 | | Employee – Investor Services Division, CGM | | 3 |
| (1960) | | | 38 Newbury St., Boston, MA 02116 | | |
| Jem A. Hudgins* | | Treasurer since 2004 | | Employee – Treasury Operations, CGM | | 3 |
| (1963) | | | | |
Leslie A. Lake*
| | Vice President (1992 to 2013) and Secretary since 1992
| | Consultant to CGM (since 2013) | | 3 |
| (1945) | | | | |
| Martha I. Maguire* | | Vice President since
1994 | | Consultant to CGM (since 2013) | | 3 |
| (1955) | | | | |
| Nicole M. Fembleaux* | | Assistant Vice President since 2011 | | Employee – Operations, CGM | | 3 |
| (1979) | | | | |
| Kevin Ure* | | Vice President since
2013 | | Employee – Accounts Admin. Operations, CGM | | 3 |
| (1971) | | | | |
| Tony Figueiredo* | | Vice President since
2013 | | Employee – Investor Services Division, CGM | | 3 |
| (1960) | | | 38 Newbury St., Boston, MA 02116 | | |
Deidra Hewardt*
| | Assistant Treasurer since 2014 | | Employee – Treasury Operations, CGM | | 3 |
| (1972) | | | 38 Newbury St., Boston, MA 02116 | | |
| | | | | | | |
ITEM 2. CODE OF ETHICS.
CGM Trust has adopted a code of ethics that applies to the registrant's principal executive officer and principal financial officer (the "Code"). The Code is filed herewith as exhibit EX99_CODE. There were no amendments to the Code required to be disclosed in response to this Item 2 during the fiscal year ended December 31, 2019. There were no waivers or implicit waivers from the Code granted by the registrant during the fiscal year ended December 31, 2019.
ITEM 3. AUDIT COMMITTEE FINANCIAL EXPERT.
The Trust's Board of Trustees has determined that it has at least one audit committee financial expert serving on its audit committee. The name of the audit committee financial expert is Mark W. Holland. Mark W. Holland is "independent" as defined in Item 3(a)(2) of Form N-CSR.
ITEM 4. PRINCIPAL ACCOUNTANT FEES AND SERVICES.
| |
| (a) | Audit Fee: The aggregate fees billed for each of the last two fiscal years for professional services rendered by the principal accountant for the audit of CGM Trust’s annual financial statements or services that are normally provided by the accountant in connection with statutory and regulatory filings or engagements are the following: 2018 - $138,339 and 2019 - $141,105. |
| |
| (b) | Audit-Related Fees: The aggregate fees billed in each of the last two fiscal years for assurance and related services by the principal accountant that are reasonably related to the performance of the audit of CGM Trust’s financial statements and are not reported under paragraph (a) of this Item are the following: 2018 - $0 and 2019 - $0. |
| |
| (c) | Tax Fees: The aggregate fees billed in each of the last two fiscal years for professional services rendered by the principal accountant for tax compliance, tax advice, and tax planning are the following: 2018 - $19,800 and 2019 - $20,196. The nature of the services comprising the fees disclosed under this category is tax compliance services related to the preparation and review of federal income and excise tax returns and review of excise tax distribution requirements. |
| |
| (d) | All Other Fees: The aggregate fees billed in each of the last two fiscal years for products and services provided by the principal accountant, other than the services reported in paragraphs (a) through (c) of this Item are the following: 2018 - $0 and 2019 - $0. |
| |
| (e) | (1)The Trustees Committee of the Board of Trustees of the CGM Trust is required to pre-approve (i) all audit services, tax services and permitted non-audit services provided by PricewaterhouseCoopers LLP or any other independent public accountant engaged by the CGM Trust and (ii) any engagement of PricewaterhouseCoopers LLP to provide non-audit services to (a) Capital Growth Management Limited Partnership (“CGM”), and (b) any entity controlling, controlled by, or under common control with CGM that provides ongoing services to the Trust if the engagement relates directly to the operations and financial reporting of the Trust. The Trustees Committee generally reviews each necessary pre-approval on a case by case basis. However, the Trustees Committee has authorized the President or Treasurer of the CGM Trust, on behalf of its series (the “Funds”) to incur additional fees totaling in the aggregate not more than $7,500 for services relating to the audit of the Funds for the fiscal year ended December 31, 2019, the close-out of the 2019 accounts, calculation of year-end dividends, and/or related tax or accounting matters. |
(2) 0% of services described in each of paragraphs (b) through (d) of this Item were approved by the audit committee pursuant to the "de minimis" exception contained in paragraph (c)(7)(i)(C) of Rule 2-01 of Regulation S-X.
| |
| (g) | The aggregate non-audit fees billed by CGM Trust’s accountant for services rendered to (i) CGM Trust, (ii) CGM, and (iii) any entity controlling, controlled by, or under common control with CGM that provides ongoing services to the CGM Trust for each of the last two fiscal years of the CGM Trust are the following: 2018 - $19,800 and 2019 - $20,196. |
| |
| (h) | There were no non-audit services that were rendered to CGM or any entity controlling, controlled by, or under common control with CGM that provides ongoing services to the CGM Trust that were not pre-approved pursuant to paragraph (c)(7)(ii) of Rule 2-01 of Regulation S-X, thus no consideration by the Trustees Committees was necessary to determine if services were compatible with maintaining the principal accountant's independence. |
ITEM 5. AUDIT COMMITTEE OF LISTED REGISTRANTS.
Not applicable.
ITEM 6. SCHEDULE OF INVESTMENTS.
Not applicable. Investments in securities of unaffiliated issuers as of December 31, 2019, as set forth in Section 210.12-12 of Regulation S-X, are included as part of the report to shareholders filed under Item 1 of this Form.
ITEM 7. DISCLOSURE OF PROXY VOTING POLICIES AND PROCEDURES FOR CLOSED-END MANAGEMENT INVESTMENT COMPANIES.
Not applicable.
ITEM 8. PORTFOLIO MANAGERS OF CLOSED-END MANAGEMENT INVESTMENT COMPANIES.
Not applicable.
ITEM 9. PURCHASES OF EQUITY SECURITIES BY CLOSED-END MANAGEMENT INVESTMENT COMPANY AND AFFILIATED PURCHASERS.
Not applicable.
ITEM 10. SUBMISSION OF MATTERS TO A VOTE OF SECURITY HOLDERS.
As described in the CGM Trust’s proxy statement on Schedule 14A filed on September 24, 2004, the CGM Trust does not have a formal policy for considering any trustee candidates recommended by shareholders.
ITEM 11. CONTROLS AND PROCEDURES.
(a) Based on their evaluation of the CGM Trust’s disclosure controls and procedures within 90 days of the filing of this Form N-CSR, the principal executive officer and principal financial officer of CGM Trust have concluded that the CGM Trust’s disclosure controls and procedures are effective to provide reasonable assurance that information required
to be disclosed by the CGM Trust on Form N-CSR is recorded, processed, summarized and reported within the time periods specified in Securities and Exchange Commission rules and forms.
(b) There were no changes in CGM Trust’s internal control over financial reporting (as defined in Rule 30a-3(d) under the Act) that occurred during the CGM Trust’s period covered by this report that has materially affected, or is reasonably likely to materially affect, the CGM Trust's internal control over financial reporting.
ITEM 12. EXHIBITS.
(a)(1) Code of ethics described in Item 2 is attached hereto as EX99_CODE.
(a)(2) Certifications for each principal executive officer and principal financial officer of the registrant as required by Rule 30a-2(a) under the Investment Company Act of 1940 are attached hereto as EX99_CERT.
(a)(3) Not Applicable.
(b) Certifications for each principal executive officer and principal financial officer of the registrant as required by Rule 30a-2(b) under the Investment Company Act of 1940 are attached hereto as EX99_906CERT.
SIGNATURES
Pursuant to the requirements of the Securities Exchange Act of 1934 and the Investment Company Act of 1940, the Registrant has duly caused this report to be signed on its behalf by the undersigned, thereunto duly authorized.
CGM Trust
By: /S/David C. Fietze
David C. Fietze
President
Principal Executive Officer
Date: February 14, 2020
Pursuant to the requirements of the Securities Exchange Act of 1934 and the Investment Company Act of 1940, this report has been signed below by the following persons on behalf of the Registrant and in the capacities and on the dates indicated.
By: /S/ David C. Fietze
David C. Fietze
President
Principal Executive Officer
Date: February 14, 2020
By: /S/ Deidra Hewardt
Deidra Hewardt
Treasurer
Principal Financial Officer
Date: February 14, 2020