UNITED STATES
SECURITIES AND EXCHANGE COMMISSION
Washington, DC 20549
FORM N-CSR
CERTIFIED SHAREHOLDER REPORT OF REGISTERED
MANAGEMENT INVESTMENT COMPANIES
Investment Company Act file number 811-00082
CGM TRUST
(Exact name of registrant as specified in charter)
One International Place, Boston, Massachusetts 02110
(Address of principal executive offices) (Zip code)
Barry N. Hurwitz, Esq.
Morgan, Lewis & Bockius LLP
One Federal Street
Boston, MA 02110
(Name and address of agent for service)
Registrant's telephone number, including area code: 1-617-737-3225
Date of fiscal year end: December 31, 2021
Date of reporting period: December 31, 2021
ITEM 1. REPORTS TO STOCKHOLDERS.
| | | | | |
| INVESTMENT ADVISER |
| CAPITAL GROWTH MANAGEMENT |
| LIMITED PARTNERSHIP |
| Boston, Massachusetts 02110 |
| | | | | |
| CUSTODIAN OF ASSETS |
STATE STREET BANK AND TRUST COMPANY
Boston, Massachusetts 02111 |
| | | | | |
| TRANSFER AGENT |
|
|
DST ASSET MANAGER SOLUTIONS, INC.
P.O. Box 219252
Kansas City, Missouri 64121-9252 |
| | | | | | | | |
| TELEPHONE NUMBERS |
| For information about: |
| n | Account Procedures |
| n | Purchases |
| n | Redemptions |
| n | Exchanges
Call 800-343-5678 |
| n | New Account Procedures and Status |
| n | Prospectus & SAI |
| n | Performance |
| n | Proxy Voting Policies and Voting Records |
| n | Complete Schedule of Portfolio Holdings
for the 1st & 3rd Quarters
Call 800-345-4048 |
| | |
| MAILING ADDRESS |
| The CGM Funds |
|
| P.O. Box 219252 |
| Kansas City, MO 64121-9252 |
|
|
| WEBSITE |
| www.cgmfunds.com |
|
|
| This report has been prepared for the shareholders of the Fund and is not authorized for distribution to current or prospective investors in the Fund unless it is accompanied or preceded by a prospectus. |
| |
| MAR21 | Printed in U.S.A. |
CGM
Mutual Fund
92nd Annual Report
December 31, 2021
A No-Load Fund
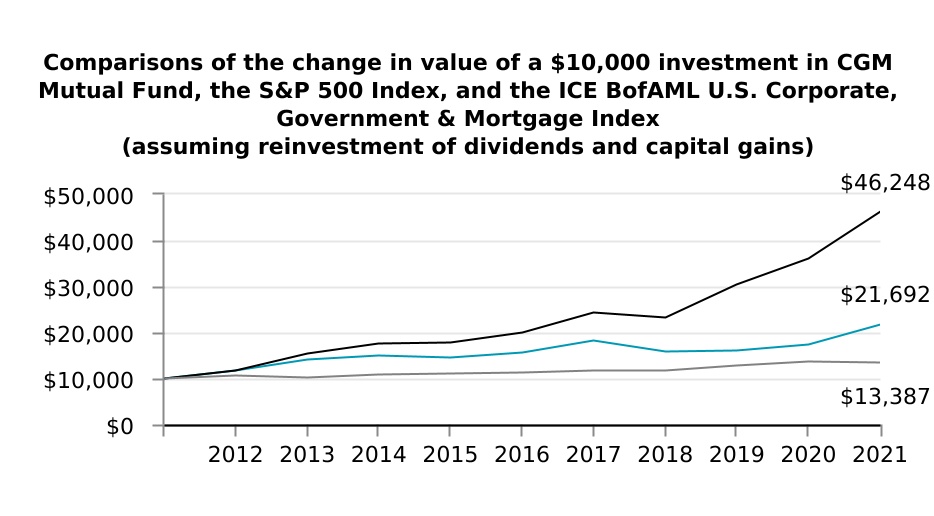
CGM Mutual Fund increased 1.4% during the fourth quarter of 2021, compared to the Standard and Poor’s 500 Index (S&P 500 Index) which increased 11.0% and the ICE BofAML U.S. Corporate, Government and Mortgage Index* which returned 0.1% over the same period. For the twelve months ended December 31, 2021, CGM Mutual Fund increased 25.1%, the S&P 500 Index increased 28.7% and the ICE BofAML U.S. Corporate, Government and Mortgage Index returned -1.6%.
The Year in Review and Economic Outlook
The market enjoyed a strong start to the year on signs of economic recovery including expanding orders for new goods and growing U.S. manufacturing activity. The passage of a $900 billion economic stimulus package in December 2020 along with rising government bond yields suggested an upward inflationary trend which hurt the technology sector but boosted banks, energy companies and other cyclical stocks. As COVID-19 vaccine production accelerated, states began to reduce or lift pandemic restrictions, fostering growth in economic activity. Rising vaccination rates lifted employment numbers, especially in the service sector which had lagged earlier in the economic recovery. By early March, the Institute For Supply Management reported that the U.S. service sector experienced solid expansion through the first two months of the year. An additional $1.9 trillion virus relief program passed in March provided more stimulus to the economy with $1,400 payments to most Americans, funding for vaccine distribution, schools and local governments and a one-year extension of unemployment aid and the child tax credit. By the end of the first quarter, improving economic conditions and rising consumer confidence added further momentum to the market.
By April 1, the S&P 500 closed above 4,000 for the first time. The economy continued to rebound as the Commerce Department reported a 21.1% surge in household income in March which helped drive a 4.2% increase in consumer spending and a 9.8% jump in retail sales. Stocks temporarily pulled back on indications from Treasury Secretary Janet Yellen and later from the Federal Reserve that interest rates may need to increase earlier than previously anticipated to keep inflation in check. The Fed
subsequently clarified that it still regarded the inflationary environment as temporary and its quantitative easing program would continue until the economy experienced sustained 2% inflation and further strength in the job market. Emerging inflationary indicators including shipping disruptions, expanding consumer demand, labor shortages and rising commodities prices briefly weighed on stocks throughout the quarter. While the pace of the labor recovery moderated, it continued to improve and reports of weekly jobless claims in June remained down significantly from the beginning of the year. The positive employment data was enough to lift both growth and value stocks and propel the S&P 500 to close the first half of the year at a record high.
In early July, the Labor Department reported the addition of 850,000 new jobs in June along with rising hourly wages. The news temporarily led stocks higher, particularly in the growth sector which often outperforms the market when bond yields are low. But inflation concerns continued to proliferate and weigh on the market. Strengthening demand in the travel, entertainment and recreation industries and stimulus dollars streaming into the economy all contributed to upward inflationary pressure. Stocks rallied on the news that second quarter GDP expanded 6.7%, driving the U.S. economy above its size before the start of the pandemic. The emergence of the COVID-19 Delta variant in August reintroduced the threat of travel and social restrictions in parts of the country, cutting into spending on leisure and travel and depressing retailers and other cyclical stocks. Indications from the Fed that it may begin reversing its economic stimulus program before the end of the year sent bond yields higher. Technology and growth stocks pulled back in response and brought the S&P 500 down 4.8% for the month of September.
The market rebounded early in the fourth quarter in response to surprisingly strong corporate earnings results, particularly from banks, healthcare companies and manufacturers. Stocks subsequently slumped in response to the discovery of the fast-spreading and highly transmissible Omicron COVID-19 variant but soon recovered on the belief that the impact on the economic recovery would be limited as cases generally appeared to be milder. The Fed began the termination of its pandemic
stimulus by gradually tapering its asset purchase program and Chairman Jerome Powell subsequently indicated that the Fed’s plan may need to accelerate to provide the flexibility to raise interest rates in early 2022 to combat climbing inflation. The Fed’s concerns were supported by the Labor Department’s report that the Consumer Price Index increased 6.8% in November from a year ago, its fastest pace since 1982. Additionally, the Producer Price Index, which measures changes in prices charged by suppliers and businesses, recorded its largest gain ever, jumping 9.6% for the trailing twelve months in November. At year-end, continuing strength in the jobs market and advancements in COVID-19 treatments and vaccines contributed to market optimism that the global economic recovery would continue into the new year.
Portfolio Strategy
CGM Mutual Fund was approximately 75% invested in stocks throughout 2021 in anticipation of recovery from the brief COVID-19 induced recession of 2020 and 25% invested in short term U.S. Treasury securities in anticipation of higher interest rates. Unprecedented monetary and fiscal stimulus supported a strong recovery throughout the year. The Fund had significant positions in retailers, banks and healthcare providers during the year. The largest gains were in retailers, automobile dealers and vehicle rental. The Fund had small losses in software and oil services.
On December 31, 2021, CGM Mutual Fund was 28.8% invested in short term U.S. Treasury securities. The equity portion of the portfolio was 15.2% invested in oil-independent production, 11.3% invested in retail and 5.9% invested in consumer staples. The Fund’s three largest equity holdings were Signet Jewelers Limited (retail), CVS Health Corporation (consumer staples) and Prudential Financial, Inc. (insurance).
David C. Fietze
President
G. Kenneth Heebner
Portfolio Manager
January 3, 2022
*The index data referenced herein is the property of ICE Data Indices, LLC, its affiliates (“ICE Data”) and/or its Third Party Suppliers and has been licensed for use by Capital Growth Management Limited Partnership. ICE Data and its Third Party Suppliers accept no liability in connection with its use. See prospectus for a full copy of the Disclaimer.
Average Annual Total Returns through December 31, 2021
| | | | | | | | | | | | | | | | | | | | |
| | | | 1 Year | 5 Year | 10 Year |
| n | | CGM Mutual Fund | 25.1% | 6.9% | 8.1% |
| n | | S&P 500 Index | 28.7% | 18.5% | 16.6% |
| n | | ICE BofAML U.S. Corporate, Government & Mortgage Index | -1.6% | 3.6% | 3.0% |
Past performance is no indication of future results and current performance may be higher or lower than the figures shown. Unlike a fund, an index is not managed and does not reflect fees and expenses.
| | | | | | | | | | | |
| CGM MUTUAL FUND |
| Portfolio Manager |
G. Kenneth Heebner has managed CGM Mutual Fund since 1981. In 1990, Mr. Heebner founded Capital Growth Management Limited Partnership ("CGM") with Robert L. Kemp. Prior to establishing CGM, Mr. Heebner was at Loomis, Sayles & Company where he managed the Fund, then known as Loomis Sayles Mutual Fund. In addition to CGM Mutual Fund, he currently manages CGM Realty Fund and CGM Focus Fund.
| | | | | | | | | | | | | | |
| INVESTMENT PERFORMANCE |
| (unaudited) |
| Cumulative Total Returns for Periods Ended December 31, 2021 |
| CGM
Mutual Fund (%) | |
| 10 Years | + | 116.9 | | | |
| 5 Years | + | 39.8 | | | |
| 1 Year | + | 25.1 | | | |
| 3 Months | + | 1.4 | | | |
The performance data contained in the report represent past performance, which is no guarantee of future results. The graph and table above do not reflect the deduction of taxes a shareholder would pay on Fund distributions or the redemption of Fund shares and assumes the reinvestment of all Fund distributions.
The investment return and the principal value of an investment in the Fund will fluctuate so that investors' shares, when redeemed, may be worth more or less than their original cost. Current performance may be higher or lower than the performance data quoted.
PORTFOLIO DIVERSIFICATION as of December 31, 2021
COMMON STOCKS
| | | | | | |
| Industry | Percent of Net Assets | |
| Oil - Independent Production | 15.2 | % | |
| Retail | 11.3 | | |
| Consumer Staples | 5.9 | | |
| Insurance | 5.6 | | |
| Housing and Building Materials | 5.6 | | |
| Building Materials | 5.2 | | |
| Health Care Services | 4.9 | | |
| Transportation | 3.8 | | |
| Machinery | 3.3 | | |
| Banks - Money Center | 3.2 | | |
| Commercial Banks | 2.9 | | |
| Consumer Products | 1.8 | | |
| Aerospace/Defense | 1.1 | | |
BONDS
| | | | | | | | | |
| United States Treasury Notes | 28.8 | | | |
SCHEDULE OF INVESTMENTS as of December 31, 2021
COMMON STOCKS — 69.8% OF TOTAL NET ASSETS
| | | | | | | | | | | | | | | | |
| | Aerospace/Defense — 1.1% | Shares | | Value(a) |
| | | Lockheed Martin Corporation | 10,000 | | | $ | 3,554,100 | |
| | | | | | |
| | Banks - Money Center — 3.2% | | | |
| | | Customers Bancorp, Inc. (b) | 155,000 | | | 10,132,350 | |
| | | | | | |
| | Building Materials — 5.2% | | | |
| | | Builders FirstSource Inc. (b) | 190,000 | | | 16,284,900 | |
| | | | | | |
| | Commercial Banks — 2.9% | | | |
| | | Citigroup Inc. | 150,000 | | | 9,058,500 | |
| | | | | | |
| | Consumer Products — 1.8% | | | |
| | | Dick’s Sporting Goods, Inc. | 50,000 | | | 5,749,500 | |
| | | | | | |
| | Consumer Staples — 5.9% | | | |
| | | CVS Health Corporation | 180,000 | | | 18,568,800 | |
| | | | | | |
| | Health Care Services — 4.9% | | | |
| | | Tenet Healthcare Corporation (b) | 190,000 | | | 15,521,100 | |
| | | | | | |
See accompanying notes to financial statements.
4
| | | | | | | | | | | | | | | | |
| | SCHEDULE OF INVESTMENTS as of December 31, 2021 (continued) | | |
| |
| | | |
| | COMMON STOCKS (continued) | | |
| | | | | | |
| | Housing and Building Materials — 5.6% | Shares | | Value(a) |
| | | Century Communities, Inc. | 60,000 | | | $ | 4,907,400 | |
| | | Lennar Corporation | 20,000 | | | 2,323,200 | |
| | | M/I Homes, Inc. (b) | 70,000 | | | 4,352,600 | |
| | | Meritage Homes Corporation (b) | 40,000 | | | 4,882,400 | |
| | | TRI Pointe Group, Inc. (b) | 40,000 | | | 1,115,600 | |
| | | | | | 17,581,200 | |
| | Insurance — 5.6% | | | |
| | | Prudential Financial, Inc. | 165,000 | | | 17,859,600 | |
| | | | | | |
| | Machinery — 3.3% | | | |
| | | Textron Inc. | 135,000 | | | 10,422,000 | |
| | | | | | |
| | Oil - Independent Production — 15.2% | | | |
| | | Callon Petroleum Company (b) | 170,000 | | | 8,032,500 | |
| | | Devon Energy Corporation | 220,000 | | | 9,691,000 | |
| | | Diamondback Energy, Inc. | 140,000 | | | 15,099,000 | |
| | | Oasis Petroleum Inc. | 120,000 | | | 15,118,800 | |
| | | | | | 47,941,300 | |
| | Retail — 11.3% | | | |
| | | Signet Jewelers Limited | 214,652 | | | 18,681,164 | |
| | | The Buckle, Inc. | 400,000 | | | 16,924,000 | |
| | | | | | |
| | | | | | |
| | | | | | |
| | | | | | |
| | | | | | 35,605,164 | |
| | Transportation — 3.8% | | | |
| | | C.H. Robinson Worldwide, Inc. | 50,000 | | | 5,381,500 | |
| | | Knight-Swift Transportation Holdings Inc. | 110,000 | | | 6,703,400 | |
| | | | | | 12,084,900 | |
| | | | | | |
| | TOTAL COMMON STOCKS (Identified cost $209,549,169) | | 220,363,414 | |
| | BONDS — 28.8% OF TOTAL NET ASSETS | Face
Amount | | |
| | United States Treasury — 28.8% | | | |
| | | United States Treasury Notes, 0.125%, 11/30/2022 | $ | 32,000,000 | | | 31,927,500 | |
| | | United States Treasury Notes, 0.125%, 01/31/2023 | 21,500,000 | | | 21,426,094 | |
| | | United States Treasury Notes, 0.125%, 01/15/2024 | 10,000,000 | | | 9,875,390 | |
| | | United States Treasury Notes, 0.250%, 09/30/2023 | 19,000,000 | | | 18,867,891 | |
| | | United States Treasury Notes, 0.375%, 03/31/2022 | 9,000,000 | | | 9,006,106 | |
| | TOTAL BONDS (Identified cost $91,412,966) | | 91,102,981 | |
| | | | | | |
| | | | | | |
| | | | | | |
See accompanying notes to financial statements.
5
| | | | | | | | | | | | | | | | |
| | | | | | |
| | SCHEDULE OF INVESTMENTS as of December 31, 2021 (continued) |
| | | | | | Value(a) |
| | TOTAL INVESTMENTS — 98.6% (Identified cost $300,962,135) | | $ | 311,466,395 | |
| | | Cash and receivables | | 18,910,221 | |
| | | Liabilities | | (14,491,876) | |
| | TOTAL NET ASSETS — 100.0% | | $ | 315,884,740 | |
| | | | | | |
| | (a) | See Note 2A. |
| | (b) | Non-income producing security. |
| | | | | | |
| | |
| | | | | | |
| | | | | | |
| | | | | | |
| | | | | | |
| | | | | | |
| | | | | | |
| | | | | | |
| | | | | | |
| | | | | | |
| | | | | | |
| | | | | | |
| | | | | | |
| | | | | | |
| | | | | | |
| | | | | | |
| | | | | | |
| | | | | | |
| | | | | | |
| | | | | | |
| | | | | | |
| | | | | | |
| | | | | | |
| | | | | | |
| | | | | | |
| | | | | | |
| | | | | | |
| | | | | | |
| | | | | | |
| | | | | | |
| | | | | | |
| | | | | | |
| | | | | | |
| | | | | | |
| | | | | | |
See accompanying notes to financial statements.
6
| | | | | | | | | | | | | | |
STATEMENT OF
ASSETS AND LIABILITIES |
|
| December 31, 2021 |
| |
|
| Assets | | | | |
| Investments in securities, at value: | | |
| (Identified cost $300,962,135) | | $ | 311,466,395 | |
| Cash | | 11,176,463 | |
| Receivable for: | | | | |
| Securities sold | | $ | 7,558,844 | | | |
| Shares of the Fund sold | | 6,417 | | | |
| Dividends and interest | | 168,497 | | | 7,733,758 | |
| | | | |
| Total assets | | 330,376,616 | |
| | | | |
| Liabilities | | | | |
| Payable for: | | | | |
| Securities purchased | | 9,278,264 | | | |
Shares of the Fund redeemed | | 252,071 | | | |
| | | | |
| Distributions declared | | 4,554,849 | | | 14,085,184 | |
| Accrued expenses: | | | | |
| Management fees | | 244,672 | | | |
| Trustees’ fees | | 21,156 | | | |
| Accounting, administration and compliance expenses | | 24,652 | | | |
| Transfer agent fees | | 37,604 | | | |
| Other expenses | | 78,608 | | | 406,692 | |
| Total liabilities | | 14,491,876 | |
Net Assets | | $ | 315,884,740 | |
| | |
| Net assets consist of: | | | |
| Capital paid-in | | $ | 307,927,047 | |
| Accumulated gain | | 7,957,693 | |
Net Assets | | $ | 315,884,740 | |
| | |
| Shares of beneficial interest outstanding, no par value | | 11,079,132 | |
| | |
| Net asset value per share* | | $28.51 |
| | | | |
* Shares of the Fund are sold and redeemed at net asset
value ($315,884,740 ÷ 11,079,132).
| | | | | | | | |
STATEMENT OF
OPERATIONS |
|
| Twelve Months Ended December 31, 2021 |
| |
|
| Investment Income | | |
| Income: | | |
| Dividends (net of withholding tax of | | |
| $4,994)* | | $ | 7,951,303 | |
| Interest | | 198,685 | |
| | 8,149,988 | |
| Expenses: | | |
| Management fees | | 2,910,406 | |
| Trustees’ fees | | 84,623 | |
| Accounting, administration and compliance expenses | | 295,820 | |
| Custodian fees and expenses | | 70,824 | |
| Transfer agent fees | | 285,492 | |
| Audit and tax services | | 61,841 | |
| Legal | | 69,199 | |
| Printing | | 38,149 | |
| Registration fees | | 26,393 | |
| Miscellaneous expenses | | 6,661 | |
| | 3,849,408 | |
| Less expense waiver | | (103,104) | |
| Net expenses | | 3,746,304 | |
| Net investment income | | 4,403,684 | |
| | |
| Realized and Unrealized Gain (Loss) on Investments | | |
| Net realized gains on investments | | 78,438,293 | |
Net change in unrealized depreciation
on investments | | (13,126,462) | |
Net realized and unrealized gains on
investments | | 65,311,831 | |
| | |
| Change in Net Assets from Operations | | $ | 69,715,515 | |
| | |
| *Includes non-recurring dividends of $2,844,500. |
See accompanying notes to financial statements.
7
STATEMENT OF CHANGES IN NET ASSETS
| | | | | | | | | | | | | | | |
| | | |
| | 2021 | | 2020 | |
| From Operations | | | | | |
| Net investment income | | $ | 4,403,684 | | | $ | 238,574 | | |
| Net realized gains on investments | | 78,438,293 | | | 11,569,818 | | |
| Net change in unrealized appreciation (depreciation) on investments | | (13,126,462) | | | 8,216,142 | | |
| Change in net assets from operations | | 69,715,515 | | | 20,024,534 | | |
| | | | | |
| From Distributions to Shareholders | | | | | |
| Total distributions | | (69,184,278) | | | (210,325) | | |
| | | | | |
| From Capital Share Transactions | | | | | |
| Proceeds from sale of shares | | 1,518,795 | | | 988,465 | | |
| Net asset value of shares issued in connection with reinvestment of distributions | | 64,505,653 | | | 191,690 | | |
| | 66,024,448 | | | 1,180,155 | | |
| Cost of shares redeemed | | (33,924,450) | | | (33,461,175) | | |
| Change in net assets derived from capital share transactions | | 32,099,998 | | | (32,281,020) | | |
| Total change in net assets | | 32,631,235 | | | (12,466,811) | | |
| | | | | |
| Net Assets | | | | | |
| Beginning of period | | 283,253,505 | | | 295,720,316 | | |
| End of period | | $ | 315,884,740 | | | $ | 283,253,505 | | |
| | | | | |
| Number of Shares of the Fund: | | | | | |
| Issued from sale of shares | | 43,267 | | | 40,715 | | |
| Issued in connection with reinvestment of distributions | | 2,252,547 | | | 9,076 | | |
| | 2,295,814 | | | 49,791 | | |
| Redeemed | | (979,961) | | | (1,316,749) | | |
| Net change | | 1,315,853 | | | (1,266,958) | | |
| | | | | |
| | | | | |
See accompanying notes to financial statements.
8
FINANCIAL HIGHLIGHTS
| | | | | | | | | | | | | | | | | | | | | | | | | | | | | | | | | | | | | |
| | | | For the Year Ended December 31, |
| | | 2021 | | 2020 | | 2019 | | 2018 | | 2017 |
| For a share of the Fund outstanding throughout each period: | | | | | | | | | | | | | |
| Net asset value at beginning of period | | | | | $ | 29.01 | | | $ | 26.81 | | | $ | 26.54 | | | $ | 31.02 | | | $ | 30.76 | |
| Net investment income (a) | | | | | 0.47 | | (b) | 0.02 | | | 0.27 | | (c) | 0.25 | | (d) | 0.13 | |
Net realized and unrealized gains (losses) on
investments and foreign currency transactions | | | | | 6.82 | | | 2.20 | | | 0.27 | | | (4.48) | | | 5.13 | |
| Total from investment operations | | | | | 7.29 | | | 2.22 | | | 0.54 | | | (4.23) | | | 5.26 | |
| | | | | | | | | | | | | |
| Dividends from net investment income | | | | | (0.49) | | | (0.02) | | | (0.27) | | | (0.25) | | | (0.13) | |
| Distributions from net short-term realized gains | | | | | (7.30) | | | — | | | — | | | — | | | (4.33) | |
| Distributions from net long-term realized gains | | | | | — | | | — | | | — | | | — | | | (0.54) | |
| Total distributions | | | | | (7.79) | | | (0.02) | | | (0.27) | | | (0.25) | | | (5.00) | |
| | | | | | | | | | | | | |
| Net increase (decrease) in net asset value | | | | | (0.50) | | | 2.20 | | | 0.27 | | | (4.48) | | | 0.26 | |
| Net asset value at end of period | | | | | $ | 28.51 | | | $ | 29.01 | | | $ | 26.81 | | | $ | 26.54 | | | $ | 31.02 | |
| | | | | | | | | | | | | |
| Total return (%) | | | | | 25.1 | | 8.3 | | 2.1 | | (13.7) | | 17.1 |
| | | | | | | | | | | | | |
| Ratios: | | | | | | | | | | | | | |
| Net operating expenses after waiver (%)* | | | | | 1.16 | | (e) | 1.19 | | (e) | 1.22 | | | 1.15 | | | 1.15 | |
| Total operating expenses before waiver (%)* | | | | | 1.19 | | (e) | 1.26 | | (e) | 1.22 | | | 1.15 | | | 1.15 | |
| Net investment income (%)* | | | | | 1.36 | | (b) | 0.09 | | | 0.97 | | (c) | 0.82 | | (d) | 0.38 | |
| Portfolio turnover (%) | | | | | 657 | | | 686 | | (f) | 442 | | | 362 | | | 423 | |
| Net assets at end of period (in thousands) ($) | | | 315,885 | | 283,254 | | 295,720 | | 325,037 | | 415,584 | |
(a) Per share net investment income has been calculated using the average shares outstanding during the period.
(b) Net Investment income per share reflects non-recurring dividends which amounted to $0.30 per share. Excluding these non-recurring dividends, the ratio of net investment income to average net assets would have been 0.48%.
(c) Net Investment income per share reflects non-recurring dividends which amounted to $0.05 per share. Excluding these non-recurring dividends, the ratio of net investment income to average net assets would have been 0.77%.
(d) Net Investment income per share reflects non-recurring dividends which amounted to $0.08 per share. Excluding these non-recurring dividends, the ratio of net investment income to average net assets would have been 0.56%.
(e) The effective dates of the expense waiver were May 1, 2020 through April 30, 2021.
(f) The increase in the turnover ratio from prior year was due to the decrease in the average market value and an increase in trading activity.
* Calculated based on average net assets.
See accompanying notes to financial statements.
9
| | |
|
| CGM MUTUAL FUND |
|
| NOTES TO FINANCIAL STATEMENTS — December 31, 2021 |
|
1. Organization — CGM Mutual Fund (the "Fund") is a diversified series of CGM Trust (the "Trust") which is organized as a Massachusetts business trust under the laws of Massachusetts pursuant to an Agreement and Declaration of Trust. The Trust is registered under the Investment Company Act of 1940 as an open-end management investment company and is following accounting and reporting guidance in the Financial Accounting Standards Board’s (“FASB”) Topic 946 “Financial Services—Investment Companies”. The Trust has two other funds whose financial statements are not presented herein. The Fund commenced operations on November 5, 1929. The Fund’s objective is reasonable long-term capital appreciation with a prudent approach to protection of capital from undue risks. Current income is a consideration in the selection of the Fund’s portfolio securities, but it is not a controlling factor.
2. Significant accounting policies — Management has evaluated the events and transactions from December 31, 2021 through the date of issuance of the Fund’s financial statements. For the Fund, there were no material subsequent events that required disclosure in the financial statements or footnotes.
A. Security valuation — Equity securities are valued on the basis of valuations furnished by a pricing service, authorized by the Board of Trustees (the “Board”). Equity securities listed or regularly traded on a securities exchange or in the over-the-counter (“OTC”) market are valued at the last quoted sale price or, for certain markets, the official closing price at the time the valuations are made. A security that is listed or traded on more than one exchange is valued at the quotation on the exchange determined to be the primary market for such security. For securities with no sale reported, the last reported bid price is used. Corporate debt securities are valued on the basis of valuations furnished by a pricing service, authorized by the Board, which determines valuations for normal, institutional-size trading units of such securities using market information, transactions for comparable securities and various relationships between securities which are generally recognized by institutional traders. United States government debt securities are valued at the current closing bid, as last reported by a pricing service approved by the Board.
When current market prices or quotations are not readily available or do not accurately reflect fair value, valuations may be determined in accordance with procedures adopted by the Board. For example, when developments occur between the close of a market and the close of the New York Stock Exchange ("NYSE") that may materially affect the value of some or all of the securities, or when trading in a security is halted, these procedures may be used. The frequency with which these procedures are used is unpredictable. These valuation procedures may result in a change to a particular security’s assigned level within the fair value hierarchy described below. The value of securities used for net asset value (“NAV”) calculation under these procedures may differ from published prices for the same securities.
The Fund may use valuation techniques consistent with the market, income, and cost approach to measure fair value. The market approach uses prices and other relevant information generated by market transactions involving identical or comparable assets or liabilities. The income approach uses valuation techniques to convert future amounts (cash flows, earnings) to a single present amount. The cost approach is based on the amount that currently would be required to replace the service capacity of an asset. To increase consistency and comparability in fair value measurements and related disclosure, the Fund utilizes a fair value hierarchy which prioritizes the various inputs to valuation techniques used to measure fair value into three broad levels:
• Level 1 - Prices determined using: quoted prices in active markets for identical securities that the Fund has the ability to access at the measurement date. Valuation adjustments are not applied to Level 1 investments.
• Level 2 - Prices determined using: other significant observable inputs (including quoted prices for similar securities, interest rates, prepayment spreads, credit risk, etc.).
• Level 3 - Prices determined using: significant unobservable inputs, including the Fund’s own assumptions and judgment in determining the fair value of investments. In situations where quoted prices or observable inputs
| | |
|
| CGM MUTUAL FUND |
|
| NOTES TO FINANCIAL STATEMENTS (continued) |
|
are unavailable (for example, when there is little or no market activity for an investment at the end of the period), unobservable inputs may be used. Unobservable inputs reflect the Fund’s own assumptions about the factors market participants would use in pricing an investment, and would be based on the best information available in the circumstances. Investments falling into the Level 3 category are primarily supported by quoted prices from brokers and dealers participating in the market for those investments. However, these may be classified as Level 3 investments due to lack of market transparency and corroboration to support these quoted prices. Additionally, valuation models may be used as the pricing source for any remaining investments classified as Level 3. These models rely on one or more significant unobservable inputs and/or significant assumptions by Capital Growth Management Limited Partnership, the Fund’s investment adviser (“CGM”). Inputs used in valuations may include, but are not limited to, financial statement analysis, capital account balances, discount rates and estimated cash flows, and comparable company data.
The inputs or methodology used for valuing securities are not necessarily an indication of the risk associated with investing in those securities. The following is a summary of the inputs used to value the Fund’s investments as of December 31, 2021: | | | | | | | | | | | | | | | | | | | | | | | |
| | | Valuation Inputs |
| Classification | | Level 1 -
Quoted Prices | | Level 2 - Other Significant Observable Inputs | | Level 3 - Significant Unobservable Inputs |
| Investments in Securities-Assets | | | | | | |
| Common Stocks* | | $ | 220,363,414 | | | — | | — |
| Bonds | | | | | | |
| United States Treasury Notes | | — | | $ | 91,102,981 | | | — |
| | | | | | | |
| | | | | | | |
| Total | | $ | 220,363,414 | | | $ | 91,102,981 | | | — |
| | | | | | | |
| * | All common stocks held in the Fund are Level 1 securities. For a detailed break-out of common stocks by major industry classification, please refer to the Schedule of Investments. |
B. Security transactions and related investment income — Security transactions are accounted for on the trade date plus one basis for daily NAV calculations. However, for financial reporting purposes, investment transactions are reported on the trade date (date the order to buy or sell is executed). Dividend income is recorded on the ex-dividend date net of applicable foreign taxes and fees, a portion of which may be recoverable. The Fund will accrue such taxes and recoveries as applicable based upon its current interpretations of the tax rules and regulations that exist in the markets in which it invests. Interest income is recorded on an accrual basis and includes amortization of premium and discount. Net gain or loss on securities sold is determined on the identified cost basis and may include proceeds from litigation. Dividend payments received by the Fund from its investment in real estate investment trusts (“REITs”) may consist of ordinary income, capital gains, and return of capital and as such are recorded as dividend income, capital gains or a reduction to security cost, as appropriate. Distributions from publicly traded partnerships are generally recorded based on the characterization reported on the Fund’s schedule K-1 received from the partnership. Non-cash dividend payments, if any, are recorded at the fair market value of the securities received.
C. Federal income taxes — It is the Fund’s policy to comply with the requirements of the Internal Revenue Code ("IRC") applicable to regulated investment companies, and to distribute to its shareholders all of its taxable income and net realized capital gains, within the prescribed time period.
| | |
|
| CGM MUTUAL FUND |
|
| NOTES TO FINANCIAL STATEMENTS (continued) |
|
Capital accounts within the financial statements are adjusted for permanent book/tax differences. These adjustments have no impact on the Fund's net assets or results of operations. Temporary book/tax differences, if any, will reverse in a subsequent period. Any difference between book basis and tax basis unrealized appreciation is attributable primarily to the temporary book/tax difference of tax deferral of losses on wash sales.
As of December 31, 2021, the components of distributable earnings on a tax basis were as follows:
| | | | | | | | | | | | | | |
| Undistributed Ordinary Income | | Undistributed Long-term Capital Gains | | Net Unrealized Appreciation/ (Depreciation) |
| — | | — | | $7,957,693 |
The identified cost of investments in securities owned by the Fund for federal income tax purposes, and their respective gross unrealized appreciation and depreciation at December 31, 2021 was as follows:
| | | | | | | | | | | | | | | | | | | | |
| Identified Cost | | Gross Unrealized Appreciation | | Gross Unrealized Depreciation | | Net Unrealized Appreciation |
| $303,508,702 | | $10,845,816 | | $(2,888,123) | | $7,957,693 |
The Fund is permitted to carry forward capital losses for an unlimited period, and such losses, when carried forward, retain their character as either short-term or long-term capital losses. As of December 31, 2021, the capital loss carryforwards utilized and the accumulated net realized loss on sales of investments for federal income tax purposes which are available to offset future taxable gains, prior to distributing such gains to shareholders, are shown in the table below:
| | | | | | | | | | | | | | | | | | | | | | | | | | | | | | | | |
Short-term
Capital Loss Carryforward Utilized | | Long-term
Capital Loss Carryforward Utilized | | Total | | Remaining Short-term
Capital Loss Carryforward | | Remaining Long-term
Capital Loss Carryforward | | Total |
| $13,510,135 | | — | | $13,510,135 | | — | | — | | — |
Management has concluded that there are no significant uncertain tax positions for the open tax years as of December 31, 2021 that would require recognition in the financial statements. However, management’s conclusion may be subject to review and adjustment at a later date based on factors including, but not limited to, new tax laws, regulations, and administrative interpretations (including relevant court decisions). Generally, the Fund's federal tax returns for the prior three fiscal years remain subject to examination by the Internal Revenue Service.
D. Dividends and distributions to shareholders — Dividends and distributions are recorded by the Fund on the ex-dividend date. The classification of income and capital gains distributions is determined in accordance with income tax regulations. Distributions from net investment income and short-term capital gains are treated as ordinary income for income tax purposes. Permanent book/tax differences relating to shareholder distributions may result in reclassifications to paid-in capital or accumulated realized gain/(loss). The Fund also may utilize earnings and profits distributed to shareholders on redemption of shares as a part of the dividend deduction for income tax purposes. Undistributed net investment income or accumulated net investment loss may include temporary book/tax differences such as tax deferral of losses on wash sales, which will reverse in a subsequent period. Any taxable income or gain remaining at fiscal year end is distributed in the following year.
| | |
|
| CGM MUTUAL FUND |
|
| NOTES TO FINANCIAL STATEMENTS (continued) |
|
The tax characterization of distributions is determined on an annual basis. The tax character of distributions paid during the periods ended December 31, 2021 and 2020 were as follows:
| | | | | | | | | | | | | | | | | | | | |
| Year | | Ordinary
Income | | Long-term
Capital Gains | | Total |
| 2021 | | $ 69,184,278 | | — | | $ 69,184,278 |
| 2020 | | $ 210,325 | | — | | $ 210,325 |
E. Guarantees and indemnifications — Under the Trust's organizational documents, its officers and trustees are indemnified against certain liabilities arising out of the performance of their duties for the Fund. Additionally, in the normal course of business, the Fund may enter into contracts with service providers that contain general indemnification clauses. The Fund's maximum exposure under these arrangements is unknown, as this would involve future claims that may be made against the Fund that have not yet occurred. The risk of material loss from such claims is considered remote.
F. Foreign currency translation — All assets and liabilities initially expressed in terms of foreign currencies are translated into U.S. dollars each day at the prevailing exchange rate. Transactions affecting Statement of Operations accounts and net realized gain or loss on investments are translated at the rates prevailing at the dates of the transactions. The Fund does not isolate that portion of the results of operations resulting from changes in foreign exchange rates on investments from the fluctuations arising from changes in market prices of securities held. Such fluctuations are included with the net realized and unrealized gain or loss from investments. Reported net realized foreign exchange gains or losses arise from sales of foreign currency, currency gains or losses realized between the trade and settlement dates on securities transactions and the difference between the amounts of dividends, interest, and foreign withholding taxes recorded on the Fund’s books and the U.S. dollar equivalent of the amounts actually received or paid. Net unrealized foreign exchange gains or losses arise from changes in the value of assets and liabilities other than investments in securities at the end of the period, resulting from changes in the exchange rate.
G. Repurchase agreements — The Fund enters into repurchase agreements, under the terms of a Master Repurchase Agreement, secured by U.S. Government or Agency securities, which involve the purchase of securities from a counterparty with a simultaneous commitment to resell the securities at an agreed upon date and price. Certain repurchase agreements are tri-party arrangements whereby the collateral is held in a segregated account for the benefit of the Fund and on behalf of the counterparty. Repurchase agreements afford the Fund the opportunity to earn a return on temporarily available cash at minimal market risk. While the underlying security may be a bill, certificate of indebtedness, note or bond issued by an agency, authority or instrumentality of the U.S. Government, the obligation of the seller is not guaranteed by the U.S. Government and there is a risk that the seller may fail to repurchase the underlying security. Consequently, there may be possible delays or restrictions upon the Fund’s ability to dispose of the underlying securities. Upon an event of default under the Master Repurchase Agreement, the Fund would attempt to exercise its rights with respect to the underlying security, including taking possession of the cash and/or collateral provided by the seller. At December 31, 2021, the Fund was not a party to any repurchase transactions.
H. Use of estimates — The preparation of financial statements in accordance with U.S. Generally Accepted Accounting Principles (“GAAP”) requires management to make certain estimates and assumptions that affect the reported amounts of assets and liabilities, the disclosure of contingent assets and liabilities at the date of the financial statements and the reported amounts of revenue and expenses during the reporting period. Actual results could differ from those estimates.
| | |
|
| CGM MUTUAL FUND |
|
| NOTES TO FINANCIAL STATEMENTS (continued) |
|
3. Risks and uncertainties
A. Risks associated with focused investing — The Fund, although diversified, takes a focused approach to investing within particular industries or sectors of the economy and may invest in a relatively small number of individual holdings. Therefore, the Fund may be subject to greater price volatility and may be more adversely affected by the performance of particular industries, sectors, or individual holdings than would a more diversified fund. In addition, funds that invest more heavily in certain industries, sectors or individual holdings are particularly susceptible to the impact of market, economic, regulatory and other factors affecting those investments.
B. Risks associated with foreign investments — The Fund may invest in securities issued by institutions, corporations, and governments established by or located in foreign countries, which may be developed or undeveloped countries. Investing in foreign securities may involve significant risks. For example, there is often less publicly available information about foreign companies, particularly those not subject to the disclosure and reporting requirements of the U.S. securities laws. Foreign issuers are often not bound by uniform accounting, auditing, and financial reporting requirements and standards of practice comparable to those applicable to domestic issuers. Investments in foreign securities also involve the risk of possible adverse changes in investment or exchange control regulations, expropriation or confiscatory taxation, political or financial instability or diplomatic and other developments which could affect such investments. Foreign stock markets, while growing in volume and sophistication, are often not as developed as those in the U.S., and securities of some foreign issuers (particularly those located in developing countries) may be less liquid and more volatile than securities of comparable U.S. companies. There may also be less overall governmental supervision and regulation of foreign securities markets, broker-dealers and issuers than in the U.S. Additionally, because some foreign securities the Fund may acquire are purchased with and payable in foreign currencies, the value of these assets as measured in U.S. dollars may be affected favorably or unfavorably by changes in currency exchange rates and exchange control regulations. There is no limit on the amount that the Fund may invest in issuers located in a single country or in foreign countries in the aggregate. To the extent the Fund focuses its investments in a single country or only a few countries in a particular geographic region, economic, political, regulatory or other conditions affecting such country or region may have a greater impact on Fund performance relative to a more geographically diversified fund.
C. Recent events — Financial markets have experienced and may continue to experience significant volatility resulting from the spread of the virus known as COVID–19. The outbreak of COVID–19 has resulted in, among other things, travel and border restrictions, quarantines, supply chain disruptions, lower consumer demand in some industries, and general market uncertainty. The effects of COVID–19 have adversely affected, and may continue to adversely affect, the global economy, the economies of certain nations, and individual issuers, all of which may negatively impact the fund’s performance.
4. Purchases and sales of securities — For the year ended December 31, 2021, purchases and sales of securities other than U.S. Government or Agency obligations and short-term investments aggregated $2,012,650,061 and $2,062,765,965, respectively. For long-term government obligations, there were $56,391,484 of purchases and $38,535,703 of sales.
5. Fees and expenses
A. Management fees — During the year ended December 31, 2021, the Fund incurred management fees of $2,910,406, paid or payable monthly to CGM, certain officers and employees of which are also officers and trustees of the Fund. The management agreement provides for a fee at the annual rate of 0.90% on the first $500 million of the Fund’s average daily net assets, 0.80% of the next $500 million of the Fund’s average daily net assets and 0.75% of such assets in excess of $1 billion of the Fund’s average daily net assets.
| | |
|
| CGM MUTUAL FUND |
|
| NOTES TO FINANCIAL STATEMENTS (continued) |
|
From May 1, 2020 through April 30, 2021, the investment adviser agreed to waive its fees and/or reimburse expenses of the Fund to the extent necessary to reduce the Fund's total annual operating expenses by 0.10%. As a result of the agreed waiver, for the period from January 1, 2021 through April 30, 2021, CGM waived $103,104 of its management fee.
B. Other expenses — The majority of expenses are directly attributable to the Fund. Expenses that are not readily attributable to the Fund are allocated among each of the three funds comprising the Trust in an equitable manner, taking into consideration, among other things, the nature and type of expense and the funds' respective net assets. CGM performs certain administrative, accounting, compliance and other services for the Fund. The expenses of those services, which are paid to CGM by the Fund, include the following: (i) expenses for personnel performing bookkeeping, accounting and financial reporting and clerical functions relating to the Fund; (ii) expenses for services required in connection with the preparation of registration statements and prospectuses, shareholder reports and notices, proxy solicitation material furnished to shareholders of the Fund or regulatory authorities and reports and questionnaires for Securities and Exchange Commission ("SEC") compliance; (iii) registration, filing and other fees in connection with requirements of regulatory authorities and (iv) compliance in connection to the Investment Company Act of 1940 and the Sarbanes-Oxley Act of 2002. The accounting, administration and compliance expenses of $295,820, for the year ended December 31, 2021, are shown separately in the Statement of Operations. These expenses include the reimbursement of a portion of the compensation expenses incurred by CGM for its employees who provide these administrative, accounting, compliance, and other services to the Fund, including $275,452 of the salaries of CGM employees who are officers of the Fund.
C. Trustees fees and expenses — The Fund does not pay any compensation directly to any trustees who are “interested persons” (as defined in the Investment Company Act of 1940) of CGM or any affiliate of CGM (other than registered investment companies). For the year ended December 31, 2021, each disinterested trustee was compensated by the Trust with an annual fee of $90,000 plus travel expenses for each meeting attended. The disinterested trustees are responsible for the audit committee functions of the Trust’s Board and have designated a disinterested trustee to lead the Board's efforts in overseeing those functions, who receives an additional $30,000 annually. Of these amounts, the Fund is responsible for $10,000 per trustee annually, plus an annual variable fee calculated based on the proportion of the Fund’s average net assets relative to the aggregate average net assets of the Trust.
| | |
|
| CGM MUTUAL FUND |
|
| REPORT OF INDEPENDENT REGISTERED PUBLIC ACCOUNTING FIRM |
|
To the Board of Trustees of CGM Trust and Shareholders of CGM Mutual Fund
Opinion on the Financial Statements
We have audited the accompanying statement of assets and liabilities, including the schedule of investments, of CGM Mutual Fund (one of the funds constituting CGM Trust, referred to hereafter as the "Fund") as of December 31, 2021, the related statement of operations for the year ended December 31, 2021, the statement of changes in net assets for each of the two years in the period ended December 31, 2021, including the related notes, and the financial highlights for each of the five years in the period ended December 31, 2021 (collectively referred to as the “financial statements”). In our opinion, the financial statements present fairly, in all material respects, the financial position of the Fund as of December 31, 2021, the results of its operations for the year then ended, the changes in its net assets for each of the two years in the period ended December 31, 2021 and the financial highlights for each of the five years in the period ended December 31, 2021 in conformity with accounting principles generally accepted in the United States of America.
Basis for Opinion
These financial statements are the responsibility of the Fund's management. Our responsibility is to express an opinion on the Fund's financial statements based on our audits. We are a public accounting firm registered with the Public Company Accounting Oversight Board (United States) (PCAOB) and are required to be independent with respect to the Fund in accordance with the U.S. federal securities laws and the applicable rules and regulations of the Securities and Exchange Commission and the PCAOB.
We conducted our audits of these financial statements in accordance with the standards of the PCAOB. Those standards require that we plan and perform the audit to obtain reasonable assurance about whether the financial statements are free of material misstatement, whether due to error or fraud.
Our audits included performing procedures to assess the risks of material misstatement of the financial statements, whether due to error or fraud, and performing procedures that respond to those risks. Such procedures included examining, on a test basis, evidence regarding the amounts and disclosures in the financial statements. Our audits also included evaluating the accounting principles used and significant estimates made by management, as well as evaluating the overall presentation of the financial statements. Our procedures included confirmation of securities owned as of December 31, 2021 by correspondence with the custodian and brokers; when replies were not received from brokers, we performed other auditing procedures. We believe that our audits provide a reasonable basis for our opinion.
PricewaterhouseCoopers LLP
Boston, Massachusetts
February 15, 2022
We have served as the auditor of one or more investment companies in Capital Growth Management Investment Company Complex since at least 1994. We have not determined a specific year we began serving as auditor.
| | |
|
| CGM MUTUAL FUND |
|
| ADDITIONAL INFORMATION |
| (unaudited) |
Availability of proxy voting information:
Proxy voting policies and information regarding how the Fund voted proxies relating to portfolio securities during the twelve month period ended June 30, 2021 are available without charge, by calling 800-345-4048. The policies also appear in the Fund’s Statement of Additional Information, which can be found on the CGM Funds' website, www.cgmfunds.com, and the SEC’s website, www.sec.gov. The voting records can also be found on the SEC’s website on the N-PX filing.
Portfolio holdings:
The Fund files its complete schedule of portfolio holdings with the SEC for the first and third quarters of each fiscal year on Form N–PORT, which is available on the SEC's website at www.sec.gov. Portfolio holdings are also disclosed in the Fund's quarterly reports. The Fund's four most recent quarterly reports can be obtained on the CGM Funds' website, www.cgmfunds.com.
The Fund’s Prospectus and Statement of Additional Information contain additional information on other risks and uncertainties relating to the Fund’s investments. The Fund’s Prospectus and Statement of Additional Information can be obtained on the CGM Funds' website, www.cgmfunds.com, and the SEC’s website, www.sec.gov or by calling 800-345-4048.
Liquidity Risk Management Program:
Rule 22e-4 (“Liquidity Rule”) under the Investment Company Act of 1940 (“1940 Act”) requires registered open-end funds to establish and implement a written Liquidity Risk Management Program reasonably designed to assess and manage its liquidity risk. The Fund must also periodically review its liquidity risk. In addition, a written report is provided to the Fund’s Board of Trustees annually which details the operation of the Fund’s program.
Pursuant to its program, the Fund classifies the liquidity of its portfolio investments into one of the four categories defined by the SEC: “Highly Liquid”, “Moderately Liquid”, “Less Liquid” and “Illiquid”. These classifications are reported to the SEC on Form N-PORT. The Liquidity Rule requires open-end funds that are not invested primarily in “Highly Liquid” investments to establish a “Highly Liquid Investment Minimum” (“HLIM”), which is the minimum percentage of net assets that must be invested in Highly Liquid investments (i.e., cash or investments that are reasonably expected to be convertible into cash within three business days without significantly changing the market value of the investment). It was determined through periodic reviews that the Fund’s portfolio holdings have been primarily Highly Liquid and, therefore, the Fund does not need to establish a HLIM.
The Fund may not acquire an investment if, immediately after the acquisition, over 15% of the Fund’s net asset would consist of Illiquid investments (an investment that cannot reasonably be expected to be sold or disposed of in current market conditions in seven calendar days or less without the sale or disposition significantly changing the market value of the investment). The Fund is required to report to the SEC and the Fund’s Board of Trustees if the Fund holds illiquid investments in excess of the 15% limit. No such reporting was required during the past year. For the year, there were no material changes to the Fund's program and periodic stress testing confirmed that the Fund held sufficient liquid investments to cover all reasonably foreseeable levels of cash flow.
| | |
|
| CGM MUTUAL FUND |
|
| TAX INFORMATION FOR THE TAX YEAR ENDED December 31, 2021 |
| (unaudited) |
|
We are providing this information as required by the IRC.
For taxable non-corporate shareholders, 8.5% of the 2021 ordinary dividend is considered qualified dividend income that may be eligible for reduced capital gains rates.
For corporate shareholders, 8.5% of the 2021 ordinary dividend qualifies for the dividends-received deduction.
| | |
|
| CGM MUTUAL FUND |
|
| FUND EXPENSES |
| (unaudited) |
As a shareholder of CGM Mutual Fund, you incur two types of costs: (1) transaction costs, which could include, among other charges, wire fees and custodial maintenance fees for certain types of accounts and (2) ongoing costs, including management fees and other Fund expenses. This example is intended to help you understand your ongoing costs (in dollars) of investing in the Fund and to compare these costs with the ongoing costs of investing in other mutual funds.
The example is based on an investment of $1,000 invested at the beginning of the period and held for the entire period July 1, 2021 to December 31, 2021.
Actual return and expenses
The first line of the table below provides information about actual account values and actual expenses.
You may use the information in this line, together with the amount you invested, to estimate the expenses that you paid over the period. Simply divide your account value by $1,000 (for example, an $8,600 account value divided by $1,000 = 8.6), then multiply the result by the number in the first line under the heading entitled ‘‘Expenses Paid During Period’’ to estimate the expenses you paid on your account during this period.
Hypothetical example for comparison purposes
The second line of the table below provides information about hypothetical account values and hypothetical expenses based on the Fund’s actual expense ratio and an assumed rate of return of 5% per year before expenses, which is not the Fund’s actual return. The hypothetical account values and expenses may not be used to estimate the actual ending account balance or expenses you paid for the period.
You may use this information to compare the ongoing costs of investing in the Fund and other funds. To do so, compare this 5% hypothetical example with the 5% hypothetical examples that appear in the shareholder reports of the other funds.
Please note that the expenses shown in the table are meant to highlight your ongoing costs only and do not reflect any transactional costs such as any wire fees or custodial maintenance fees that may be payable. Therefore, the second line of the table is useful in comparing ongoing costs only, and will not help you determine the relative total costs of owning different funds. In addition, if these transactional costs were included, your costs would have been higher.
| | | | | | | | | | | |
| Beginning Account Value 07/01/21 | Ending Account Value
12/31/21 | Expenses Paid During Period* 07/01/21 - 12/31/21 |
| Actual | $1,000.00 | $1,018.91 | $5.98 |
Hypothetical
(5% return before expenses) | $1,000.00 | $1,019.28 | $5.98 |
* Expenses are equal to the Fund’s annualized expense ratio of 1.18%, multiplied by the average account value over the period, multiplied by 184/365 (to reflect the one-half year period).
| | |
|
| CGM MUTUAL FUND |
|
| TRUSTEES AND OFFICERS |
The Fund is supervised by the Board of Trustees (the “Board”) of the Trust. The Board is responsible for the general oversight of the Fund, including general supervision and review of the Fund’s investment activities. The Board, in turn, elects the officers who are responsible for administering the Fund’s day-to-day operations.
An asterisk in the following table identifies those trustees and officers who are “interested persons” of the Trust as defined in the Investment Company Act of 1940. Each trustee and officer of the Trust noted as an interested person is interested by virtue of that individual’s position with CGM, as described in the table below. Each trustee serves during the continued lifetime of the Trust, until he or she earlier dies, resigns or is removed, or if sooner, until the election and qualification of his or her successor. Each officer serves until his or her successor is elected or qualified, or until the officer sooner dies, resigns, or is removed or becomes disqualified.
The trustees and officers of the Trust, their ages, their principal occupations during the past five years, the number of CGM Funds they oversee, and other directorships they hold are set forth below. Unless otherwise noted below, the address of each interested trustee and officer is One International Place, Boston, Massachusetts 02110. Correspondence intended for the trustees who are not “interested persons” of the Trust may be sent c/o Capital Growth Management, One International Place, Boston, Massachusetts 02110. The Statement of Additional Information for the Fund includes additional information about Fund trustees and is available on the CGM Funds' website, www.cgmfunds.com, or by calling 800-345-4048.
| | | | | | | | | | | | | | | | | | | | |
| Name | | Positions Held and Length of Time Served | | Principal Occupations and Other Directorships Held During Past 5 Years | | Number of Funds in the CGM Funds Complex Overseen |
| (Birth Year) | |
| Interested Trustees | | | | | | |
| Ken Heebner* | | Trustee since 1993 | | Co-founder and Employee, CGM; Controlling owner of Kenbob, Inc. (general partner of CGM) | | 3 |
| (1940) | | | | |
Leslie A. Lake*
| | Trustee since 2013 | | Consultant to CGM (since 2013) | | 3 |
| (1945) | | | | |
| Disinterested Trustees | | | | |
Peter O. Brown
| | Trustee since 1993 | | Counsel (formerly, Partner), Harter, Secrest & Emery LLP (law firm); formerly Executive Vice President and Chief Operating Officer, The Glenmede Trust Company (1990-1993); formerly Senior Vice President, J.P. Morgan Chase Bank (1981-1990); formerly Trustee, TT International U.S.A. Master and Feeder Trusts (four mutual funds) (2000-2005) | | 3 |
| (1940) | | | | |
| | | | | | |
| Mark W. Holland | | Trustee since 2004 | | President, Wellesley Financial Advisors, LLC (since 2003); formerly Vice President and Chief Operating Officer, Fixed Income Management, Loomis, Sayles & Company, L.P. (1999-2002); formerly Director, Loomis, Sayles & Company, L.P. (1993-2001) | | 3 |
| (1949) | | | | |
| | | | | | |
| | | | | | |
| | | | | | | | | | | | | | | | | | | | |
| Name | | Positions Held and Length of Time Served | | Principal Occupations and Other Directorships Held During Past 5 Years | | Number of Funds in the CGM Funds Complex Overseen |
| (Birth Year) | |
| J. Baur Whittlesey | | Trustee since 1990 | | Member (1994-2016) and Senior Counsel (since 2017), Ledgewood, P.C. (law firm) | | 3 |
| (1946) | | | | |
| | | | | | |
| Officers | |
| |
| |
|
| Ken Heebner* | | Vice President since 1990 | | Co-founder and Employee, CGM; Controlling owner of Kenbob, Inc. (general partner of CGM) | | 3 |
| (1940) | | | | |
David C. Fietze*
| | President since 2015 & Chief Compliance Officer since 2004 | | Employee – Legal Counsel, CGM | | 3 |
| (1969) | | | | |
Kathleen S. Haughton*
(1960) | | Sr. Vice President since 2013, Director of Human Resources since 2019, Vice President (1992-2013), AML Officer since 2002 & Principal since 1992 | | Employee – Investor Services Division, CGM
38 Newbury St., Boston, MA 02116 | | 3 |
| | | | | |
Leslie A. Lake*
| | Vice President (1992-2013) & Secretary since 1992
| | Consultant to CGM (since 2013) | | 3 |
| (1945) | | | | |
| | | | | | |
| | | | |
| Tony Figueiredo* | | Vice President since 2013 & Director of Operations (1996-2013) | | Employee – Investor Services Division, CGM
38 Newbury St., Boston, MA 02116 | | 3 |
| (1960) | | | | |
| | | | | | |
Deidra Hewardt*
| | Treasurer since 2020 & Assistant Treasurer (2014-2020) | | Employee – Treasury Operations, CGM | | 3 |
| (1972) | | |
| | |
| | | | | | |
| | | | | |
| INVESTMENT ADVISER |
| CAPITAL GROWTH MANAGEMENT |
| LIMITED PARTNERSHIP |
| Boston, Massachusetts 02110 |
| | | | | |
| CUSTODIAN OF ASSETS |
STATE STREET BANK AND TRUST COMPANY
Boston, Massachusetts 02111 |
| | | | | |
| TRANSFER AGENT |
|
|
DST ASSET MANAGER SOLUTIONS, INC.
P.O. Box 219252
Kansas City, Missouri 64121-9252 |
| | | | | | | | |
| TELEPHONE NUMBERS |
| For information about: |
| n | Account Procedures |
| n | Purchases |
| n | Redemptions |
| n | Exchanges
Call 800-343-5678 |
| n | New Account Procedures and Status |
| n | Prospectus & SAI |
| n | Performance |
| n | Proxy Voting Policies and Voting Records |
| n | Complete Schedule of Portfolio Holdings
for the 1st & 3rd Quarters
Call 800-345-4048 |
| | |
| MAILING ADDRESS |
| The CGM Funds |
|
| P.O. Box 219252 |
| Kansas City, MO 64121-9252 |
|
|
| WEBSITE |
| www.cgmfunds.com |
|
|
| This report has been prepared for the shareholders of the Fund and is not authorized for distribution to current or prospective investors in the Fund unless it is accompanied or preceded by a prospectus. |
| |
| RAR21 | Printed in U.S.A. |
CGM
Realty Fund
28th Annual Report
December 31, 2021
A No-Load Fund
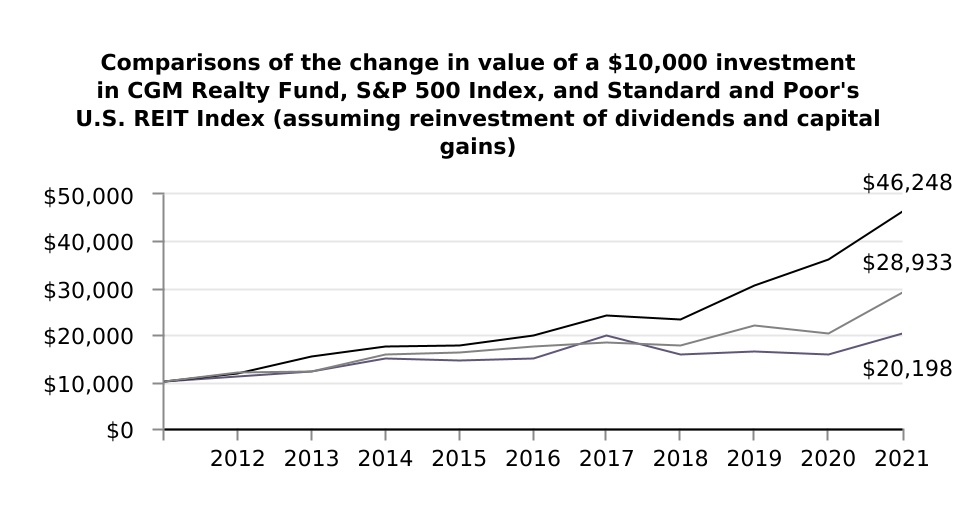
CGM Realty Fund increased 11.6% during the fourth quarter of 2021 compared to the Standard and Poor’s 500 Index (S&P 500 Index) which increased 11.0% and the Standard and Poor’s U.S. REIT Index which returned 16.4%. For the twelve months ended December 31, 2021, CGM Realty Fund increased 28.2%, the S&P 500 Index increased 28.7% and the Standard and Poor’s U.S. REIT Index returned 43.1%.
The Year in Review and Economic Outlook
The market enjoyed a strong start to the year on signs of economic recovery including expanding orders for new goods and growing U.S. manufacturing activity. The passage of a $900 billion economic stimulus package in December 2020 along with rising government bond yields suggested an upward inflationary trend which hurt the technology sector but boosted banks, energy companies and other cyclical stocks. As COVID-19 vaccine production accelerated, states began to reduce or lift pandemic restrictions, fostering growth in economic activity. Rising vaccination rates lifted employment numbers, especially in the service sector which had lagged earlier in the economic recovery. By early March, the Institute For Supply Management reported that the U.S. service sector experienced solid expansion through the first two months of the year. An additional $1.9 trillion virus relief program passed in March provided more stimulus to the economy with $1,400 payments to most Americans, funding for vaccine distribution, schools and local governments and a one-year extension of unemployment aid and the child tax credit. By the end of the first quarter, improving economic conditions and rising consumer confidence added further momentum to the market.
By April 1, the S&P 500 closed above 4,000 for the first time. The economy continued to rebound as the Commerce Department reported a 21.1% surge in household income in March which helped drive a 4.2% increase in consumer spending and a 9.8% jump in retail sales. Stocks temporarily pulled back on indications from Treasury Secretary Janet Yellen and later from the Federal Reserve that interest rates may need to increase earlier than previously anticipated to keep inflation in check. The Fed
subsequently clarified that it still regarded the inflationary environment as temporary and its quantitative easing program would continue until the economy experienced sustained 2% inflation and further strength in the job market. Emerging inflationary indicators including shipping disruptions, expanding consumer demand, labor shortages and rising commodities prices briefly weighed on stocks throughout the quarter. While the pace of the labor recovery moderated, it continued to improve and reports of weekly jobless claims in June remained down significantly from the beginning of the year. The positive employment data was enough to lift both growth and value stocks and propel the S&P 500 to close the first half of the year at a record high.
In early July, the Labor Department reported the addition of 850,000 new jobs in June along with rising hourly wages. The news temporarily led stocks higher, particularly in the growth sector which often outperforms the market when bond yields are low. But inflation concerns continued to proliferate and weigh on the market. Strengthening demand in the travel, entertainment and recreation industries and stimulus dollars streaming into the economy all contributed to upward inflationary pressure. Stocks rallied on the news that second quarter GDP expanded 6.7%, driving the U.S. economy above its size before the start of the pandemic. The emergence of the COVID-19 Delta variant in August reintroduced the threat of travel and social restrictions in parts of the country, cutting into spending on leisure and travel and depressing retailers and other cyclical stocks. Indications from the Fed that it may begin reversing its economic stimulus program before the end of the year sent bond yields higher. Technology and growth stocks pulled back in response and brought the S&P 500 down 4.8% for the month of September.
The market rebounded early in the fourth quarter in response to surprisingly strong corporate earnings results, particularly from banks, healthcare companies and manufacturers. Stocks subsequently slumped in response to the discovery of the fast-spreading and highly transmissible Omicron COVID-19 variant but soon recovered on the belief that the impact on the economic recovery would be limited as cases generally appeared to be milder.
The Fed began the termination of its pandemic stimulus by gradually tapering its asset purchase program and Chairman Jerome Powell subsequently indicated that the Fed’s plan may need to accelerate to provide the flexibility to raise interest rates in early 2022 to combat climbing inflation. The Fed’s concerns were supported by the Labor Department’s report that the Consumer Price Index increased 6.8% in November from a year ago, its fastest pace since 1982. Additionally, the Producer Price Index, which measures changes in prices charged by suppliers and businesses, recorded its largest gain ever, jumping 9.6% for the trailing twelve months in November. At year-end, continuing strength in the jobs market and advancements in COVID-19 treatments and vaccines contributed to market optimism that the global economic recovery would continue into the new year.
Portfolio Strategy
CGM Realty Fund was fully invested throughout 2021 in anticipation of recovery from the brief COVID-19 induced recession of 2020. Unprecedented monetary and fiscal stimulus supported a strong consumer driven recovery throughout the year. Real Estate Investment Trusts (REITS) were the dominant asset concentration during the year with significant positions in storage, apartments, hotels, and selected mall REITS. The Fund experienced significant gains in storage, mall and apartment REITS, but losses in mining REITS.
On December 31, 2021, CGM Realty Fund was 78.2% invested in REITS, including 25.6% in residential REITS, 23.0% in self-storage REITS, 15.1% in lodging and resorts REITS and 14.5% in retail REITS. The Fund also held 16.6% in real estate services. The Fund’s three largest holdings were Jones Lang LaSalle Incorporated (real estate services), Simon Property Group, Inc. (retail REIT) and NexPoint Residential Trust, Inc. (residential REIT).
David C. Fietze
President
G. Kenneth Heebner
Portfolio Manager
January 3, 2022
Average Annual Total Returns through December 31, 2021
| | | | | | | | | | | | | | | | | | | | |
| | | | 1 Year | 5 Year | 10 Year |
| n | | CGM Realty Fund | 28.2% | 6.4% | 7.3% |
| n | | S&P 500 Index | 28.7% | 18.5% | 16.6% |
| n | | Standard and Poor's U.S. REIT Index | 43.1% | 10.6% | 11.2% |
Past performance is no indication of future results and current performance may be higher or lower than the figures shown. Unlike a fund, an index is not managed and does not reflect fees and expenses.
| | | | | | | | | | | |
| CGM REALTY FUND |
| Portfolio Manager |
G. Kenneth Heebner has managed CGM Realty Fund since its inception on May 13, 1994. In 1990, Mr. Heebner founded Capital Growth Management Limited Partnership ("CGM") with Robert L. Kemp. Prior to establishing CGM, Mr. Heebner managed mutual funds at Loomis, Sayles & Company. In addition to CGM Realty Fund, he currently manages CGM Mutual Fund and CGM Focus Fund.
| | | | | | | | | | | | | | |
| INVESTMENT PERFORMANCE |
| (unaudited) |
| Cumulative Total Returns for Periods Ended December 31, 2021 |
| CGM Realty Fund (%) |
| 10 Years | + | 102.0 | | | |
| 5 Years | + | 36.1 | | | |
| 1 Year | + | 28.2 | | | |
| 3 Months | + | 11.6 | | | |
The performance data contained in the report represent past performance, which is no guarantee of future results. The graph and table above do not reflect the deduction of taxes a shareholder would pay on Fund distributions or the redemption of Fund shares and assumes the reinvestment of all Fund distributions.
The investment return and the principal value of an investment in the Fund will fluctuate so that investors' shares, when redeemed, may be worth more or less than their original cost. Current performance may be higher or lower than the performance data quoted.
PORTFOLIO DIVERSIFICATION as of December 31, 2021
COMMON STOCKS
| | | | | | |
| Real Estate Investment Trusts | Percent of Net Assets | |
| Residential | 25.6 | % | |
| Self Storage | 23.0 | | |
| Lodging and Resorts | 15.1 | | |
| Retail | 14.5 | | |
| | |
| Other Common Stocks | | |
| Real Estate Services | 16.6 | | |
| Miscellaneous | 2.6 | | |
| | |
| | |
| | |
| | |
| | |
| | |
| | |
| | |
| | |
| | |
| | |
| | |
| | |
SCHEDULE OF INVESTMENTS as of December 31, 2021
COMMON STOCKS — 97.4% OF TOTAL NET ASSETS
REAL ESTATE INVESTMENT TRUSTS — 78.2%
| | | | | | | | | | | | | | | | | |
| | | | | | | |
| | Lodging and Resorts — 15.1% | Shares | | Value(a) | |
| | | DiamondRock Hospitality Company (b) | 200,000 | | | $ | 1,922,000 | | |
| | | Host Hotels & Resorts, Inc. (b) | 300,000 | | | 5,217,000 | | |
| | | Park Hotels & Resorts Inc. (b) | 1,150,000 | | | 21,712,000 | | |
| | | Ryman Hospitality Properties, Inc. (b) | 280,000 | | | 25,748,800 | | |
| | | Sunstone Hotel Investors, Inc. (b) | 1,950,000 | | | 22,873,500 | | |
| | | | | | 77,473,300 | | |
| | Residential — 25.6% | | | | |
| | | AvalonBay Communities, Inc. | 105,000 | | | 26,521,950 | | |
| | | Camden Property Trust | 40,000 | | | 7,147,200 | | |
| | | Centerspace | 182,000 | | | 20,183,800 | | |
| | | Equity Residential | 235,000 | | | 21,267,500 | | |
| | | Mid-America Apartment Communities, Inc. | 40,000 | | | 9,177,600 | | |
| | | NexPoint Residential Trust, Inc. | 341,000 | | | 28,586,030 | | |
| | | UDR, Inc. | 300,000 | | | 17,997,000 | | |
| | | | | | 130,881,080 | | |
| | Retail — 14.5% | | | | |
| | | Federal Realty Investment Trust | 190,000 | | | 25,900,800 | | |
| | | Simon Property Group, Inc. | 200,000 | | | 31,954,000 | | |
| | | Tanger Factory Outlet Centers, Inc. | 850,000 | | | 16,388,000 | | |
| | | | | | 74,242,800 | | |
| | | | | | | |
| | | | | | | |
| | | | | | | |
| | | | | | | |
| | | | | | | |
| | | | | | | |
See accompanying notes to financial statements.
4
| | | | | | | | | | | | | | | | | |
| | | | | | | |
| | | | | | | |
| | SCHEDULE OF INVESTMENTS as of December 31, 2021 (continued) | |
| | | | | | |
| | COMMON STOCKS (continued) | |
| | | | | | | |
| | Self Storage — 23.0% | Shares | | Value(a) | |
| | | CubeSmart | 420,000 | | | $ | 23,902,200 | | |
| | | Extra Space Storage Inc. | 100,000 | | | 22,673,000 | | |
| | | Life Storage, Inc. | 180,000 | | | 27,572,400 | | |
| | | National Storage Affiliates Trust | 360,000 | | | 24,912,000 | | |
| | | Public Storage | 50,000 | | | 18,728,000 | | |
| | | | | | 117,787,600 | | |
| | | | | | | |
| | TOTAL REAL ESTATE INVESTMENTS TRUSTS (Identified cost $334,542,401) | | 400,384,780 | | |
| | | | | | | |
| | OTHER COMMON STOCKS — 19.2% | |
| | | | | | | |
| | Miscellaneous — 2.6% | | | | |
| | | The Howard Hughes Corporation (b) | 130,000 | | | 13,231,400 | | |
| | | | | | | |
| | Real Estate Services — 16.6% | | | | |
| | | CBRE Group, Inc. (b) | 255,000 | | | 27,670,050 | | |
| | | Cushman & Wakefield plc (b) | 550,000 | | | 12,232,000 | | |
| | | Jones Lang LaSalle Incorporated (b) | 130,000 | | | 35,014,200 | | |
| | | Newmark Group, Inc. | 530,000 | | | 9,911,000 | | |
| | | | | | 84,827,250 | | |
| | | | | | | |
| | TOTAL OTHER COMMON STOCKS (Identified cost $83,503,011) | | 98,058,650 | | |
| | | | | | | |
| | TOTAL INVESTMENTS — 97.4% (Identified cost $418,045,412) | | 498,443,430 | | |
| | | Cash and receivables | | 17,992,018 | | |
| | | Liabilities | | (4,581,736) | | |
| | TOTAL NET ASSETS — 100.0% | | $ | 511,853,712 | | |
| | | | | | | |
| | | | | | | |
| | | | | | | |
| | | | | | | |
| | | | | | | |
| | | | | | | |
| | | | | | | |
| | | | | | | |
| | | | | | | |
| | | | | | | |
| | | | | | | |
| | | | | | | |
| | | | | | | |
| | | | | | | |
| | | | | | | |
| | | | | | | |
| | | | | | | |
| | | | | | | |
| | | | | | | |
| | | | | | | |
| | | | | | | |
| | | | | | | |
| | | | | | | |
| | | | | | | |
| | | | | | | |
| | | | | | | |
| | | | | | | |
| | | | | | | |
| | | | | | | |
| | | | | | | |
| | | | | | | |
| | | | | | | |
| | | | | | | |
| | | | | | | |
| | | | | | | |
| | | | | | | |
| | | | | | | |
| | | | | | | |
| | | | | | | |
| | | | | | | |
| | | | | | | | | | | | | | |
| (a) | See Note 2A. | | | |
| (b) | Non-income producing security. |
| | | | |
|
See accompanying notes to financial statements.
5
| | | | | | | | | | | | | | |
STATEMENT OF
ASSETS AND LIABILITIES |
|
| December 31, 2021 |
| |
|
| Assets | | | | |
| Investments in securities, at value: | | |
| (Identified cost $418,045,412) | | $ | 498,443,430 | |
| Cash | | 13,205,703 | |
| Receivable for: | | | | |
| Securities sold | | $ | 3,870,160 | | | |
| Shares of the Fund sold | | 5,800 | | | |
| Dividends and interest | | 889,477 | | | |
Reimbursement from
investment adviser | | 20,878 | | | 4,786,315 | |
| Total assets | | 516,435,448 | |
| | | | |
| Liabilities | | | | |
| Payable for: | | | | |
| Securities purchased | | 3,022,496 | | | |
Shares of the Fund redeemed | | 560,390 | | | |
| Distributions declared | | 452,510 | | | 4,035,396 | |
| | | | |
| Accrued expenses: | | | | |
| Management fees | | 354,811 | | | |
| Trustees’ fees | | 29,841 | | | |
| Accounting, administration and compliance expenses | | 35,339 | | | |
| Transfer agent fees | | 42,124 | | | |
| Other expenses | | 84,225 | | | 546,340 | |
| Total liabilities | | 4,581,736 | |
Net Assets | | $ | 511,853,712 | |
| | |
| Net assets consist of: | | |
| Capital paid-in | | $ | 432,021,594 | |
| Accumulated gain | | 79,832,118 | |
Net Assets | | $ | 511,853,712 | |
| | |
| Shares of beneficial interest outstanding, no par value | | 16,618,929 |
| | |
| Net asset value per share* | | $30.80 |
* Shares of the Fund are sold and redeemed at net asset
value ($511,853,712 ÷ 16,618,929 ).
| | | | | | | | |
STATEMENT OF
OPERATIONS |
|
| Twelve Months Ended December 31, 2021 |
| |
| | |
| Investment Income | | |
| Income: | | |
| Dividends (net of withholding tax of | | |
| $88,722) | | $ | 10,681,614 | |
| | |
| | |
| | 10,681,614 | |
| | |
| Expenses: | | |
| Management fees | | 4,214,658 | |
| Trustees’ fees | | 119,366 | |
| Accounting, administration and compliance expenses | | 424,068 | |
| Custodian fees and expenses | | 92,866 | |
| Transfer agent fees | | 307,812 | |
| Audit and tax services | | 61,841 | |
| Legal | | 105,425 | |
| Printing | | 38,985 | |
| Registration fees | | 26,411 | |
| Miscellaneous expenses | | 6,661 | |
| | 5,398,093 | |
| Less expense waiver | | (328,158) | |
| Net expenses | | 5,069,935 | |
| Net investment income | | 5,611,679 | |
| | |
| Realized and Unrealized Gain (Loss) on Investments | | |
| Net realized gains on investments | | 65,387,874 | |
Net change in unrealized appreciation
on investments | | 50,762,293 | |
Net realized and unrealized gains on
investments | | 116,150,167 | |
| | |
| Change in Net Assets from Operations | | $ | 121,761,846 | |
| | |
|
See accompanying notes to financial statements.
6
STATEMENT OF CHANGES IN NET ASSETS
| | | | | | | | | | | | | | | |
| | | |
| | 2021 | | 2020 | |
| From Operations | | | | | |
| Net investment income | | $ | 5,611,679 | | | $ | 3,893,896 | | |
| Net realized gains (losses) on investments and foreign currency transactions | | 65,387,874 | | | (50,956,445) | | |
| Net change in unrealized appreciation on investments | | 50,762,293 | | | 17,175,649 | | |
| Change in net assets from operations | | 121,761,846 | | | (29,886,900) | | |
| | | | | |
| From Distributions to Shareholders | | | | | |
| Total distributions | | (10,065,137) | | | (3,974,615) | | |
| | | | | |
| From Capital Share Transactions | | | | | |
| Proceeds from sale of shares | | 3,307,066 | | | 4,170,782 | | |
| Net asset value of shares issued in connection with reinvestment of distributions | | 9,053,329 | | | 3,511,453 | | |
| | 12,360,395 | | | 7,682,235 | | |
| Cost of shares redeemed | | (74,861,730) | | | (103,167,096) | | |
| Change in net assets derived from capital share transactions | | (62,501,335) | | | (95,484,861) | | |
| Total change in net assets | | 49,195,374 | | | (129,346,376) | | |
| | | | | |
| Net Assets | | | | | |
| Beginning of period | | 462,658,338 | | | 592,004,714 | | |
| End of period | | $ | 511,853,712 | | | $ | 462,658,338 | | |
| | | | | |
| Number of Shares of the Fund: | | | | | |
| Issued from sale of shares | | 117,098 | | | 189,736 | | |
| Issued in connection with reinvestment of distributions | | 304,693 | | | 178,951 | | |
| | 421,791 | | | 368,687 | | |
| Redeemed | | (2,681,289) | | | (4,542,572) | | |
| Net change | | (2,259,498) | | | (4,173,885) | | |
| | | | | |
| | | | | |
See accompanying notes to financial statements.
7
FINANCIAL HIGHLIGHTS
| | | | | | | | | | | | | | | | | | | | | | | | | | | | | | | | | | | |
| | | | For the Year Ended December 31, |
| | | 2021 | | 2020 | | 2019 | | 2018 | | 2017 |
| For a share of the Fund outstanding throughout each period: | | | | | | | | | | | | | |
| Net asset value at beginning of period | | | | | $ | 24.51 | | | $ | 25.68 | | | $ | 25.31 | | | $ | 32.19 | | | $ | 29.67 | |
| Net investment income (a) | | | | | 0.32 | | | 0.19 | | | 0.61 | | | 0.44 | | | 0.19 | |
Net realized and unrealized gains (losses) on
investments and foreign currency transactions | | | | | 6.56 | | | (1.17) | | | 0.39 | | | (6.92) | | | 9.52 | |
| Total from investment operations | | | | | 6.88 | | | (0.98) | | | 1.00 | | | (6.48) | | | 9.71 | |
| | | | | | | | | | | | | |
| Dividends from net investment income | | | | | (0.36) | | | (0.19) | | | (0.63) | | | (0.40) | | | (0.24) | |
| Distributions from net short-term realized gains | | | | | (0.23) | | | — | | | — | | | — | | | (6.54) | |
| Distributions from net long-term realized gains | | | | | — | | | — | | | — | | | — | | | (0.41) | |
| | | | | | | | | | | | | |
| Total distributions | | | | | (0.59) | | | (0.19) | | | (0.63) | | | (0.40) | | | (7.19) | |
| | | | | | | | | | | | | |
| Net increase (decrease) in net asset value | | | | | 6.29 | | | (1.17) | | | 0.37 | | | (6.88) | | | 2.52 | |
| Net asset value at end of period | | | | | $ | 30.80 | | | $ | 24.51 | | | $ | 25.68 | | | $ | 25.31 | | | $ | 32.19 | |
| | | | | | | | | | | | | |
| Total return (%) | | | | | 28.2 | | (3.6) | | 3.9 | | (20.2) | | 32.8 |
| | | | | | | | | | | | | |
| Ratios: | | | | | | | | | | | | | |
| Net operating expenses after waiver (%)* | | | | | 1.02 | | (b) | 1.05 | | (b) | 1.04 | | | 0.98 | | | 0.97 | |
| Total operating expenses before waiver (%)* | | | | | 1.09 | | (b) | 1.12 | | (b) | 1.04 | | | 0.98 | | | 0.97 | |
| Net investment income (%)* | | | | | 1.13 | | | 0.83 | | | 2.27 | | | 1.50 | | | 0.57 | |
| Portfolio turnover (%) | | | | | 473 | | | 567 | | (c) | 264 | | | 239 | | | 269 | |
| Net assets at end of period (in thousands) ($) | | | 511,854 | | 462,658 | | 592,005 | | 685,914 | | 1,004,793 | |
(a) Per share net investment income has been calculated using the average shares outstanding during the period.
(b) The effective date of the expense waiver was May 1, 2020. The expense waiver was renewed at a reduced rate on May 1, 2021.
(c) The increase in the turnover ratio from prior year was due to the decrease in the average market value and an increase in trading activity.
* Calculated based on average net assets.
See accompanying notes to financial statements.
8
| | |
|
| CGM REALTY FUND |
|
| NOTES TO FINANCIAL STATEMENTS — December 31, 2021 |
|
1. Organization — CGM Realty Fund (the "Fund") is a diversified series of CGM Trust (the "Trust") which is organized as a Massachusetts business trust under the laws of Massachusetts pursuant to an Agreement and Declaration of Trust. The Trust is registered under the Investment Company Act of 1940 as an open-end management investment company and is following accounting and reporting guidance in the Financial Accounting Standards Board’s (“FASB”) Topic 946 “Financial Services—Investment Companies”. The Trust has two other funds whose financial statements are not presented herein. The Fund commenced operations on May 13, 1994. The Fund’s investment objective is to provide a combination of income and long-term growth of capital. The Fund intends to pursue its objective by investing primarily in equity securities of companies in the real estate industry, including real estate investment trusts (“REITs”).
2. Significant accounting policies — Management has evaluated the events and transactions from December 31, 2021 through the date of issuance of the Fund’s financial statements. For the Fund, there were no material subsequent events that required disclosure in the financial statements or footnotes.
A. Security valuation — Equity securities are valued on the basis of valuations furnished by a pricing service, authorized by the Board of Trustees (the “Board”). Equity securities listed or regularly traded on a securities exchange or in the over-the-counter (“OTC”) market are valued at the last quoted sale price or, for certain markets, the official closing price at the time the valuations are made. A security that is listed or traded on more than one exchange is valued at the quotation on the exchange determined to be the primary market for such security. For securities with no sale reported, the last reported bid price is used. Corporate debt securities are valued on the basis of valuations furnished by a pricing service, authorized by the Board, which determines valuations for normal, institutional-size trading units of such securities using market information, transactions for comparable securities and various relationships between securities which are generally recognized by institutional traders. United States government debt securities are valued at the current closing bid, as last reported by a pricing service approved by the Board.
When current market prices or quotations are not readily available or do not accurately reflect fair value, valuations may be determined in accordance with procedures adopted by the Board. For example, when developments occur between the close of a market and the close of the New York Stock Exchange ("NYSE") that may materially affect the value of some or all of the securities, or when trading in a security is halted, these procedures may be used. The frequency with which these procedures are used is unpredictable. These valuation procedures may result in a change to a particular security’s assigned level within the fair value hierarchy described below. The value of securities used for net asset value (“NAV”) calculation under these procedures may differ from published prices for the same securities.
The Fund may use valuation techniques consistent with the market, income, and cost approach to measure fair value. The market approach uses prices and other relevant information generated by market transactions involving identical or comparable assets or liabilities. The income approach uses valuation techniques to convert future amounts (cash flows, earnings) to a single present amount. The cost approach is based on the amount that currently would be required to replace the service capacity of an asset. To increase consistency and comparability in fair value measurements and related disclosure, the Fund utilizes a fair value hierarchy which prioritizes the various inputs to valuation techniques used to measure fair value into three broad levels:
• Level 1 - Prices determined using: quoted prices in active markets for identical securities that the Fund has the ability to access at the measurement date. Valuation adjustments are not applied to Level 1 investments.
• Level 2 - Prices determined using: other significant observable inputs (including quoted prices for similar securities, interest rates, prepayment spreads, credit risk, etc.).
| | |
|
| CGM REALTY FUND |
|
| NOTES TO FINANCIAL STATEMENTS (continued) |
|
• Level 3 - Prices determined using: significant unobservable inputs, including the Fund’s own assumptions and judgment in determining the fair value of investments. In situations where quoted prices or observable inputs are unavailable (for example, when there is little or no market activity for an investment at the end of the period), unobservable inputs may be used. Unobservable inputs reflect the Fund’s own assumptions about the factors market participants would use in pricing an investment, and would be based on the best information available in the circumstances. Investments falling into the Level 3 category are primarily supported by quoted prices from brokers and dealers participating in the market for those investments. However, these may be classified as Level 3 investments due to lack of market transparency and corroboration to support these quoted prices. Additionally, valuation models may be used as the pricing source for any remaining investments classified as Level 3. These models rely on one or more significant unobservable inputs and/or significant assumptions by Capital Growth Management Limited Partnership, the Fund’s investment adviser (“CGM”). Inputs used in valuations may include, but are not limited to, financial statement analysis, capital account balances, discount rates and estimated cash flows, and comparable company data.
The inputs or methodology used for valuing securities are not necessarily an indication of the risk associated with investing in those securities. The following is a summary of the inputs used to value the Fund’s investments as of December 31, 2021:
| | | | | | | | | | | | | | | | | | | | | | | |
| | | Valuation Inputs |
| Classification | | Level 1 -
Quoted Prices | | Level 2 - Other Significant Observable Inputs | | Level 3 - Significant Unobservable Inputs |
| Investments in Securities-Assets | | | | | | |
| Common Stocks* | | $ | 498,443,430 | | | — | | — |
| | | | | | | |
| | | | | | | |
| Total | | $ | 498,443,430 | | | — | | — |
| | | | | | | |
| * | All common stocks held in the Fund are Level 1 securities. For a detailed break-out of common stocks by major industry classification, please refer to the Schedule of Investments. |
B. Security transactions and related investment income — Security transactions are accounted for on the trade date plus one basis for daily NAV calculations. However, for financial reporting purposes, investment transactions are reported on the trade date (date the order to buy or sell is executed). Dividend income is recorded on the ex-dividend date net of applicable foreign taxes and fees, a portion of which may be recoverable. The Fund will accrue such taxes and recoveries as applicable based upon its current interpretations of the tax rules and regulations that exist in the markets in which it invests. Interest income is recorded on an accrual basis and includes amortization of premium and discount. Net gain or loss on securities sold is determined on the identified cost basis and may include proceeds from litigation. Dividend payments received by the Fund from its investment in REITs may consist of ordinary income, capital gains, and return of capital and as such are recorded as dividend income, capital gains or a reduction to security cost, as appropriate. Non-cash dividend payments, if any, are recorded at the fair market value of the securities received.
C. Federal income taxes — It is the Fund’s policy to comply with the requirements of the Internal Revenue Code ("IRC") applicable to regulated investment companies, and to distribute to its shareholders all of its taxable income and net realized capital gains, within the prescribed time period.
| | |
|
| CGM REALTY FUND |
|
| NOTES TO FINANCIAL STATEMENTS (continued) |
|
Capital accounts within the financial statements are adjusted for permanent book/tax differences. These adjustments have no impact on the Fund's net assets or results of operations. Temporary book/tax differences, if any, will reverse in a subsequent period. Any difference between book basis and tax basis unrealized appreciation is attributable primarily to the temporary book/tax difference of tax deferral of losses on wash sales.
As of December 31, 2021, the components of distributable earnings on a tax basis were as follows:
| | | | | | | | | | | | | | |
| Undistributed Ordinary Income | | Undistributed Long-term Capital Gains | | Net Unrealized Appreciation/ (Depreciation) |
| $619,666 | | — | | $79,212,451 |
The identified cost of investments in securities owned by the Fund for federal income tax purposes, and their respective gross unrealized appreciation and depreciation at December 31, 2021 was as follows:
| | | | | | | | | | | | | | | | | | | | |
| Identified Cost | | Gross Unrealized Appreciation | | Gross Unrealized Depreciation | | Net Unrealized Appreciation |
| $419,230,979 | | $80,926,241 | | $(1,713,790) | | $79,212,451 |
The Fund is permitted to carry forward capital losses for an unlimited period, and such losses, when carried forward, retain their character as either short-term or long-term capital losses. As of December 31, 2021, the capital loss carryforwards utilized and the accumulated net realized loss on sales of investments for federal income tax purposes which are available to offset future taxable gains, prior to distributing such gains to shareholders, are shown in the table below:
| | | | | | | | | | | | | | | | | | | | | | | | | | | | | | | | |
Short-term
Capital Loss Carryforward Utilized | | Long-term Capital Loss Carryforward Utilized | | Total | | Remaining Short-term Capital Loss Carryforward | | Remaining Long-term Capital Loss Carryforward | | Total |
| $41,522,671 | | $18,447,323 | | $59,969,994 | | — | | — | | — |
Management has concluded that there are no significant uncertain tax positions for the open tax years as of December 31, 2021 that would require recognition in the financial statements. However, management’s conclusion may be subject to review and adjustment at a later date based on factors including, but not limited to, new tax laws, regulations, and administrative interpretations (including relevant court decisions). Generally, the Fund's federal tax returns for the prior three fiscal years remain subject to examination by the Internal Revenue Service.
D. Dividends and distributions to shareholders — Dividends and distributions are recorded by the Fund on the ex-dividend date. The classification of income and capital gains distributions is determined in accordance with income tax regulations. Distributions from net investment income and short-term capital gains are treated as ordinary income for income tax purposes. Permanent book/tax differences relating to shareholder distributions may result in reclassifications to paid-in capital or accumulated realized gain/(loss). The Fund also may utilize earnings and profits distributed to shareholders on redemption of shares as a part of the dividend deduction for income tax purposes. Undistributed net investment income or accumulated net investment loss may include temporary book/tax differences such as tax deferral of losses on wash sales, which will reverse in a subsequent period. Any taxable income or gain remaining at fiscal year end is distributed in the following year.
| | |
|
| CGM REALTY FUND |
|
| NOTES TO FINANCIAL STATEMENTS (continued) |
|
The tax characterization of distributions is determined on an annual basis. The tax character of distributions paid during the periods ended December 31, 2021 and 2020 were as follows:
| | | | | | | | | | | | | | | | | | | | | | | | | | |
| Year | | Ordinary
Income | | Long-term
Capital Gains | | Tax Return
of Capital | | Total |
| | | | | | | | |
| 2021 | | $ 10,065,137 | | — | | — | | $ 10,065,137 |
| 2020 | | $ 3,974,615 | | — | | — | | $ 3,974,615 |
E. Guarantees and indemnifications — Under the Trust's organizational documents, its officers and trustees are indemnified against certain liabilities arising out of the performance of their duties for the Fund. Additionally, in the normal course of business, the Fund may enter into contracts with service providers that contain general indemnification clauses. The Fund's maximum exposure under these arrangements is unknown, as this would involve future claims that may be made against the Fund that have not yet occurred. The risk of material loss from such claims is considered remote.
F. Foreign currency translation — All assets and liabilities initially expressed in terms of foreign currencies are translated into U.S. dollars each day at the prevailing exchange rate. Transactions affecting Statement of Operations accounts and net realized gain or loss on investments are translated at the rates prevailing at the dates of the transactions. The Fund does not isolate that portion of the results of operations resulting from changes in foreign exchange rates on investments from the fluctuations arising from changes in market prices of securities held. Such fluctuations are included with the net realized and unrealized gain or loss from investments. Reported net realized foreign exchange gains or losses arise from sales of foreign currency, currency gains or losses realized between the trade and settlement dates on securities transactions and the difference between the amounts of dividends, interest, and foreign withholding taxes recorded on the Fund’s books and the U.S. dollar equivalent of the amounts actually received or paid. Net unrealized foreign exchange gains or losses arise from changes in the value of assets and liabilities other than investments in securities at the end of the period, resulting from changes in the exchange rate.
G. Repurchase agreements — The Fund enters into repurchase agreements, under the terms of a Master Repurchase Agreement, secured by U.S. Government or Agency securities, which involve the purchase of securities from a counterparty with a simultaneous commitment to resell the securities at an agreed upon date and price. Certain repurchase agreements are tri-party arrangements whereby the collateral is held in a segregated account for the benefit of the Fund and on behalf of the counterparty. Repurchase agreements afford the Fund the opportunity to earn a return on temporarily available cash at minimal market risk. While the underlying security may be a bill, certificate of indebtedness, note or bond issued by an agency, authority or instrumentality of the U.S. Government, the obligation of the seller is not guaranteed by the U.S. Government and there is a risk that the seller may fail to repurchase the underlying security. Consequently, there may be possible delays or restrictions upon the Fund’s ability to dispose of the underlying securities. Upon an event of default under the Master Repurchase Agreement, the Fund would attempt to exercise its rights with respect to the underlying security, including taking possession of the cash and/or collateral provided by the seller. At December 31, 2021, the Fund was not a party to any repurchase transactions.
H. Use of estimates — The preparation of financial statements in accordance with U.S. Generally Accepted Accounting Principles (“GAAP”) requires management to make certain estimates and assumptions that affect the reported amounts of assets and liabilities, the disclosure of contingent assets and liabilities at the date of the financial statements and the reported amounts of revenue and expenses during the reporting period. Actual results could differ from those estimates.
| | |
|
| CGM REALTY FUND |
|
| NOTES TO FINANCIAL STATEMENTS (continued) |
|
3. Risks and uncertainties
A. Risks associated with focused investing —The Fund, although diversified, takes a focused approach to investing within particular industries or sectors of the economy and may invest in a relatively small number of individual holdings. Therefore, the Fund may be subject to greater price volatility and may be more adversely affected by the performance of particular industries, sectors, or individual holdings than would a more diversified fund. In addition, the Fund invests primarily in companies in the real estate industry, including REITs. Funds with a concentration are particularly susceptible to the impact of market, economic, regulatory and other factors affecting the specific concentration.
B. Risks associated with foreign investments — The Fund may invest in securities issued by institutions, corporations, and governments established by or located in foreign countries, which may be developed or undeveloped countries. Investing in foreign securities may involve significant risks. For example, there is often less publicly available information about foreign companies, particularly those not subject to the disclosure and reporting requirements of the U.S. securities laws. Foreign issuers are often not bound by uniform accounting, auditing, and financial reporting requirements and standards of practice comparable to those applicable to domestic issuers. Investments in foreign securities also involve the risk of possible adverse changes in investment or exchange control regulations, expropriation or confiscatory taxation, political or financial instability or diplomatic and other developments which could affect such investments. Foreign stock markets, while growing in volume and sophistication, are often not as developed as those in the U.S., and securities of some foreign issuers (particularly those located in developing countries) may be less liquid and more volatile than securities of comparable U.S. companies. There may also be less overall governmental supervision and regulation of foreign securities markets, broker-dealers and issuers than in the U.S. Additionally, because some foreign securities the Fund may acquire are purchased with and payable in foreign currencies, the value of these assets as measured in U.S. dollars may be affected favorably or unfavorably by changes in currency exchange rates and exchange control regulations. There is no limit on the amount that the Fund may invest in issuers located in a single country or in foreign countries in the aggregate. To the extent the Fund focuses its investments in a single country or only a few countries in a particular geographic region, economic, political, regulatory or other conditions affecting such country or region may have a greater impact on Fund performance relative to a more geographically diversified fund.
C. Recent events — Financial markets have experienced and may continue to experience significant volatility resulting from the spread of the virus known as COVID–19. The outbreak of COVID–19 has resulted in, among other things, travel and border restrictions, quarantines, supply chain disruptions, lower consumer demand in some industries, and general market uncertainty. The effects of COVID–19 have adversely affected, and may continue to adversely affect, the global economy, the economies of certain nations, and individual issuers, all of which may negatively impact the fund’s performance.
4. Purchases and sales of securities — For the year ended December 31, 2021, purchases and sales of securities other than short-term investments aggregated $2,259,478,198 and $2,327,555,297, respectively.
| | |
|
| CGM REALTY FUND |
|
| NOTES TO FINANCIAL STATEMENTS (continued) |
|
5. Fees and expenses
A. Management fees — During the year ended December 31, 2021, the Fund incurred management fees of $4,214,658, paid or payable monthly to CGM, certain officers and employees of which are also officers and trustees of the Fund. The management agreement provides for a fee at the annual rate of 0.85% on the first $500 million of the Fund’s average daily net assets and 0.75% on amounts in excess of $500 million of the Fund’s average daily net assets.
For the period from May 1, 2020 through April 30, 2021, the investment adviser agreed to waive its fees and/or reimburse expenses of the Fund to the extent necessary to reduce the Fund's total annual operating expenses by 0.10%. For the period from May 1, 2021 through April 30, 2022 the investment adviser has agreed to waive its fees and/or reimburse expenses of the Fund to the extent necessary to reduce the Fund's total annual operating expenses by 0.05%. This arrangement may not be terminated without the consent of the Fund's Board of Trustees. As a result of the agreed waivers, year-to-date, CGM waived $328,158 of its management fee.
B. Other expenses — The majority of expenses are directly attributable to the Fund. Expenses that are not readily attributable to the Fund are allocated among each of the three funds comprising the Trust in an equitable manner, taking into consideration, among other things, the nature and type of expense and the funds' respective net assets. CGM performs certain administrative, accounting, compliance and other services for the Fund. The expenses of those services, which are paid to CGM by the Fund, include the following: (i) expenses for personnel performing bookkeeping, accounting and financial reporting and clerical functions relating to the Fund; (ii) expenses for services required in connection with the preparation of registration statements and prospectuses, shareholder reports and notices, proxy solicitation material furnished to shareholders of the Fund or regulatory authorities and reports and questionnaires for Securities and Exchange Commission ("SEC") compliance; (iii) registration, filing and other fees in connection with requirements of regulatory authorities and (iv) compliance in connection to the Investment Company Act of 1940 and the Sarbanes-Oxley Act of 2002. The accounting, administration and compliance expenses of $424,068, for the year ended December 31, 2021, are shown separately in the Statement of Operations. These expenses include the reimbursement of a portion of the compensation expenses incurred by CGM for its employees who provide these administrative, accounting, compliance, and other services to the Fund, including $386,579 of the salaries of CGM employees who are officers of the Fund.
C. Trustees fees and expenses — The Fund does not pay any compensation directly to any trustees who are “interested persons” (as defined in the Investment Company Act of 1940) of CGM or any affiliate of CGM (other than registered investment companies). For the year ended December 31, 2021, each disinterested trustee was compensated by the Trust with an annual fee of $90,000 plus travel expenses for each meeting attended. The disinterested trustees are responsible for the audit committee functions of the Trust’s Board and have designated a disinterested trustee to lead the Board's efforts in overseeing those functions, who receives an additional $30,000 annually. Of these amounts, the Fund is responsible for $10,000 per trustee annually, plus an annual variable fee calculated based on the proportion of the Fund’s average net assets relative to the aggregate average net assets of the Trust.
| | |
|
| CGM REALTY FUND |
|
| REPORT OF INDEPENDENT REGISTERED PUBLIC ACCOUNTING FIRM |
|
To the Board of Trustees of CGM Trust and Shareholders of CGM Realty Fund
Opinion on the Financial Statements
We have audited the accompanying statement of assets and liabilities, including the schedule of investments, of CGM Realty Fund (one of the funds constituting CGM Trust, referred to hereafter as the "Fund") as of December 31, 2021, the related statement of operations for the year ended December 31, 2021, the statement of changes in net assets for each of the two years in the period ended December 31, 2021, including the related notes, and the financial highlights for each of the five years in the period ended December 31, 2021 (collectively referred to as the “financial statements”). In our opinion, the financial statements present fairly, in all material respects, the financial position of the Fund as of December 31, 2021, the results of its operations for the year then ended, the changes in its net assets for each of the two years in the period ended December 31, 2021 and the financial highlights for each of the five years in the period ended December 31, 2021 in conformity with accounting principles generally accepted in the United States of America.
Basis for Opinion
These financial statements are the responsibility of the Fund's management. Our responsibility is to express an opinion on the Fund's financial statements based on our audits. We are a public accounting firm registered with the Public Company Accounting Oversight Board (United States) (PCAOB) and are required to be independent with respect to the Fund in accordance with the U.S. federal securities laws and the applicable rules and regulations of the Securities and Exchange Commission and the PCAOB.
We conducted our audits of these financial statements in accordance with the standards of the PCAOB. Those standards require that we plan and perform the audit to obtain reasonable assurance about whether the financial statements are free of material misstatement, whether due to error or fraud.
Our audits included performing procedures to assess the risks of material misstatement of the financial statements, whether due to error or fraud, and performing procedures that respond to those risks. Such procedures included examining, on a test basis, evidence regarding the amounts and disclosures in the financial statements. Our audits also included evaluating the accounting principles used and significant estimates made by management, as well as evaluating the overall presentation of the financial statements. Our procedures included confirmation of securities owned as of December 31, 2021 by correspondence with the custodian and brokers; when replies were not received from brokers, we performed other auditing procedures. We believe that our audits provide a reasonable basis for our opinion.
PricewaterhouseCoopers LLP
Boston, Massachusetts
February 15, 2022
We have served as the auditor of one or more investment companies in Capital Growth Management Investment Company Complex since at least 1994. We have not determined a specific year we began serving as auditor.
| | |
|
| CGM REALTY FUND |
|
| ADDITIONAL INFORMATION |
| (unaudited) |
Availability of proxy voting information:
Proxy voting policies and information regarding how the Fund voted proxies relating to portfolio securities during the twelve month period ended June 30, 2021 are available without charge, by calling 800-345-4048. The policies also appear in the Fund’s Statement of Additional Information, which can be found on the CGM Funds' website, www.cgmfunds.com, and the SEC’s website, www.sec.gov. The voting records can also be found on the SEC’s website on the N-PX filing.
Portfolio holdings:
The Fund files its complete schedule of portfolio holdings with the SEC for the first and third quarters of each fiscal year on Form N–PORT, which is available on the SEC's website at www.sec.gov. Portfolio holdings are also disclosed in the Fund's quarterly reports. The Fund's four most recent quarterly reports can be obtained on the CGM Funds' website, www.cgmfunds.com.
The Fund’s Prospectus and Statement of Additional Information contain additional information on other risks and uncertainties relating to the Fund’s investments. The Fund’s Prospectus and Statement of Additional Information can be obtained on the CGM Funds' website, www.cgmfunds.com, and the SEC’s website, www.sec.gov or by calling 800-345-4048.
Liquidity Risk Management Program:
Rule 22e-4 (“Liquidity Rule”) under the Investment Company Act of 1940 (“1940 Act”) requires registered open-end funds to establish and implement a written Liquidity Risk Management Program reasonably designed to assess and manage its liquidity risk. The Fund must also periodically review its liquidity risk. In addition, a written report is provided to the Fund’s Board of Trustees annually which details the operation of the Fund’s program.
Pursuant to its program, the Fund classifies the liquidity of its portfolio investments into one of the four categories defined by the SEC: “Highly Liquid”, “Moderately Liquid”, “Less Liquid” and “Illiquid”. These classifications are reported to the SEC on Form N-PORT. The Liquidity Rule requires open-end funds that are not invested primarily in “Highly Liquid” investments to establish a “Highly Liquid Investment Minimum” (“HLIM”), which is the minimum percentage of net assets that must be invested in Highly Liquid investments (i.e., cash or investments that are reasonably expected to be convertible into cash within three business days without significantly changing the market value of the investment). It was determined through periodic reviews that the Fund’s portfolio holdings have been primarily Highly Liquid and, therefore, the Fund does not need to establish a HLIM.
The Fund may not acquire an investment if, immediately after the acquisition, over 15% of the Fund’s net asset would consist of Illiquid investments (an investment that cannot reasonably be expected to be sold or disposed of in current market conditions in seven calendar days or less without the sale or disposition significantly changing the market value of the investment). The Fund is required to report to the SEC and the Fund’s Board of Trustees if the Fund holds illiquid investments in excess of the 15% limit. No such reporting was required during the past year. For the year, there were no material changes to the Fund's program and periodic stress testing confirmed that the Fund held sufficient liquid investments to cover all reasonably foreseeable levels of cash flow.
| | |
|
| CGM REALTY FUND |
|
| TAX INFORMATION FOR THE TAX YEAR ENDED December 31, 2021 |
| (unaudited) |
We are providing this information as required by the IRC.
For taxable non-corporate shareholders, 34.6% of the 2021 ordinary dividend is considered qualified dividend income that may be eligible for reduced capital gains rates.
For corporate shareholders, 3.1% of the 2021 ordinary dividend qualifies for the dividends-received deduction.
39.2% of the 2021 ordinary dividend is considered qualified REIT income that may be eligible for the 20% qualified business income deduction under section 199A.
| | |
|
| CGM REALTY FUND |
|
| FUND EXPENSES |
| (unaudited) |
As a shareholder of CGM Realty Fund, you incur two types of costs: (1) transaction costs, which could include, among other charges, wire fees and custodial maintenance fees for certain types of accounts and (2) ongoing costs, including management fees and other Fund expenses. This example is intended to help you understand your ongoing costs (in dollars) of investing in the Fund and to compare these costs with the ongoing costs of investing in other mutual funds.
The example is based on an investment of $1,000 invested at the beginning of the period and held for the entire period July 1, 2021 to December 31, 2021.
Actual return and expenses
The first line of the table below provides information about actual account values and actual expenses.
You may use the information in this line, together with the amount you invested, to estimate the expenses that you paid over the period. Simply divide your account value by $1,000 (for example, an $8,600 account value divided by $1,000 = 8.6), then multiply the result by the number in the first line under the heading entitled ‘‘Expenses Paid During Period’’ to estimate the expenses you paid on your account during this period.
Hypothetical example for comparison purposes
The second line of the table below provides information about hypothetical account values and hypothetical expenses based on the Fund’s actual expense ratio and an assumed rate of return of 5% per year before expenses, which is not the Fund’s actual return. The hypothetical account values and expenses may not be used to estimate the actual ending account balance or expenses you paid for the period.
You may use this information to compare the ongoing costs of investing in the Fund and other funds. To do so, compare this 5% hypothetical example with the 5% hypothetical examples that appear in the shareholder reports of the other funds.
Please note that the expenses shown in the table are meant to highlight your ongoing costs only and do not reflect any transactional costs such as any wire fees or custodial maintenance fees that may be payable. Therefore, the second line of the table is useful in comparing ongoing costs only, and will not help you determine the relative total costs of owning different funds. In addition, if these transactional costs were included, your costs would have been higher.
| | | | | | | | | | | |
| Beginning Account Value 07/01/21 | Ending Account Value
12/31/21 | Expenses Paid During Period* 07/01/21 - 12/31/21 |
| Actual | $1,000.00 | $1,127.88 | $5.50 |
Hypothetical
(5% return before expenses) | $1,000.00 | $1,020.04 | $5.22 |
* Expenses are equal to the Fund’s annualized expense ratio of 1.02%, multiplied by the average account value over the period, multiplied by 184/365 (to reflect the one-half year period).
| | |
|
| CGM REALTY FUND |
|
| TRUSTEES AND OFFICERS |
The Fund is supervised by the Board of Trustees (the “Board”) of the Trust. The Board is responsible for the general oversight of the Fund, including general supervision and review of the Fund’s investment activities. The Board, in turn, elects the officers who are responsible for administering the Fund’s day-to-day operations.
An asterisk in the following table identifies those trustees and officers who are “interested persons” of the Trust as defined in the Investment Company Act of 1940. Each trustee and officer of the Trust noted as an interested person is interested by virtue of that individual’s position with CGM, as described in the table below. Each trustee serves during the continued lifetime of the Trust, until he or she earlier dies, resigns or is removed, or if sooner, until the election and qualification of his or her successor. Each officer serves until his or her successor is elected or qualified, or until the officer sooner dies, resigns, or is removed or becomes disqualified.
The trustees and officers of the Trust, their ages, their principal occupations during the past five years, the number of CGM Funds they oversee, and other directorships they hold are set forth below. Unless otherwise noted below, the address of each interested trustee and officer is One International Place, Boston, Massachusetts 02110. Correspondence intended for the trustees who are not “interested persons” of the Trust may be sent c/o Capital Growth Management, One International Place, Boston, Massachusetts 02110. The Statement of Additional Information for the Fund includes additional information about Fund trustees and is available on the CGM Funds' website, www.cgmfunds.com, or by calling 800-345-4048.
| | | | | | | | | | | | | | | | | | | | |
| Name | | Positions Held and Length of Time Served | | Principal Occupations and Other Directorships Held During Past 5 Years | | Number of Funds in the CGM Funds Complex Overseen |
| (Birth Year) | |
| Interested Trustees | | | | | | |
| Ken Heebner* | | Trustee since 1993 | | Co-founder and Employee, CGM; Controlling owner of Kenbob, Inc. (general partner of CGM) | | 3 |
| (1940) | | | | |
Leslie A. Lake*
| | Trustee since 2013 | | Consultant to CGM (since 2013) | | 3 |
| (1945) | | | | |
| Disinterested Trustees | | | | |
Peter O. Brown
| | Trustee since 1993 | | Counsel (formerly, Partner), Harter, Secrest & Emery LLP (law firm); formerly Executive Vice President and Chief Operating Officer, The Glenmede Trust Company (1990-1993); formerly Senior Vice President, J.P. Morgan Chase Bank (1981-1990); formerly Trustee, TT International U.S.A. Master and Feeder Trusts (four mutual funds) (2000-2005) | | 3 |
| (1940) | | | | |
| Mark W. Holland | | Trustee since 2004 | | President, Wellesley Financial Advisors, LLC (since 2003); formerly Vice President and Chief Operating Officer, Fixed Income Management, Loomis, Sayles & Company, L.P. (1999-2002); formerly Director, Loomis, Sayles & Company, L.P. (1993-2001) | | 3 |
| (1949) | | | | |
| | | | | | |
| | | | | | | | | | | | | | | | | | | | |
| Name | | Positions Held and Length of Time Served | | Principal Occupations and Other Directorships Held During Past 5 Years | | Number of Funds in the CGM Funds Complex Overseen |
| (Birth Year) | |
| J. Baur Whittlesey | | Trustee since 1990 | | Member (1994-2016) and Senior Counsel (since 2017), Ledgewood, P.C. (law firm) | | 3 |
| (1946) | | | | |
| Officers | | | | | | |
| Ken Heebner* | | Vice President since 1990 | | Co-founder and Employee, CGM; Controlling owner of Kenbob, Inc. (general partner of CGM) | | 3 |
| (1940) | | | | |
David C. Fietze*
| | President since 2015 & Chief Compliance Officer since 2004 | | Employee – Legal Counsel, CGM | | 3 |
| (1969) | | | | |
Kathleen S. Haughton* (1960) | | Sr. Vice President since 2013, Director of Human Resources since 2019, Vice President (1992-2013), AML Officer since 2002 & Principal since 1992 | | Employee – Investor Services Division, CGM 38 Newbury St., Boston, MA 02116 | | 3 |
| | | | | |
Leslie A. Lake*
| | Vice President (1992-2013) & Secretary since 1992 | | Consultant to CGM (since 2013) | | 3 |
| (1945) | | | | |
| | | | | | |
| | | | |
| Tony Figueiredo* | | Vice President since 2013 & Director of Operations (1996-2013) | | Employee – Investor Services Division, CGM 38 Newbury St., Boston, MA 02116 | | 3 |
| (1960) | | | | |
Deidra Hewardt*
| | Treasurer since 2020 & Assistant Treasurer (2014-2020) | | Employee – Treasury Operations, CGM | | 3 |
| (1972) | | |
| | |
| | | | | | |
| | | | | | |
| | |
| | | | | |
| INVESTMENT ADVISER |
| CAPITAL GROWTH MANAGEMENT |
| LIMITED PARTNERSHIP |
| Boston, Massachusetts 02110 |
| | | | | |
| CUSTODIAN OF ASSETS |
STATE STREET BANK AND TRUST COMPANY
Boston, Massachusetts 02111 |
| | | | | |
| TRANSFER AGENT |
|
|
DST ASSET MANAGER SOLUTIONS, INC.
P.O. Box 219252
Kansas City, Missouri 64121-9252 |
| | | | | | | | |
| TELEPHONE NUMBERS |
| For information about: |
| n | Account Procedures |
| n | Purchases |
| n | Redemptions |
| n | Exchanges
Call 800-343-5678 |
| n | New Account Procedures and Status |
| n | Prospectus & SAI |
| n | Performance |
| n | Proxy Voting Policies and Voting Records |
| n | Complete Schedule of Portfolio Holdings
for the 1st & 3rd Quarters
Call 800-345-4048 |
| | |
| MAILING ADDRESS |
| The CGM Funds |
|
| P.O. Box 219252 |
| Kansas City, MO 64121-9252 |
|
|
| WEBSITE |
| www.cgmfunds.com |
|
|
| This report has been prepared for the shareholders of the Fund and is not authorized for distribution to current or prospective investors in the Fund unless it is accompanied or preceded by a prospectus. |
| |
| FAR21 | Printed in U.S.A. |
CGM
Focus Fund
25th Annual Report
December 31, 2021
A No-Load Fund
CGM Focus Fund increased 2.5% during the fourth quarter of 2021 compared to the Standard and Poor’s 500 Index (S&P 500 Index) which increased 11.0%. For the twelve months ended December 31, 2021, CGM Focus Fund increased 33.5%, while the S&P 500 Index increased 28.7%.
The Year in Review and Economic Outlook
The market enjoyed a strong start to the year on signs of economic recovery including expanding orders for new goods and growing U.S. manufacturing activity. The passage of a $900 billion economic stimulus package in December 2020 along with rising government bond yields suggested an upward inflationary trend which hurt the technology sector but boosted banks, energy companies and other cyclical stocks. As COVID-19 vaccine production accelerated, states began to reduce or lift pandemic restrictions, fostering growth in economic activity. Rising vaccination rates lifted employment numbers, especially in the service sector which had lagged earlier in the economic recovery. By early March, the Institute For Supply Management reported that the U.S. service sector experienced solid expansion through the first two months of the year. An additional $1.9 trillion virus relief program passed in March provided more stimulus to the economy with $1,400 payments to most Americans, funding for vaccine distribution, schools and local governments and a one-year extension of unemployment aid and the child tax credit. By the end of the first quarter, improving economic conditions and rising consumer confidence added further momentum to the market.
By April 1, the S&P 500 closed above 4,000 for the first time. The economy continued to rebound as the Commerce Department reported a 21.1% surge in household income in March which helped drive a 4.2% increase in consumer spending and a 9.8% jump in retail sales. Stocks temporarily pulled back on indications from Treasury Secretary Janet Yellen and later from the Federal Reserve that interest rates may need to increase earlier than previously anticipated to keep inflation in check. The Fed subsequently clarified that it still regarded the inflationary environment as temporary and its quantitative easing program would continue until the economy experienced sustained 2% inflation and
further strength in the job market. Emerging inflationary indicators including shipping disruptions, expanding consumer demand, labor shortages and rising commodities prices briefly weighed on stocks throughout the quarter. While the pace of the labor recovery moderated, it continued to improve and reports of weekly jobless claims in June remained down significantly from the beginning of the year. The positive employment data was enough to lift both growth and value stocks and propel the S&P 500 to close the first half of the year at a record high.
In early July, the Labor Department reported the addition of 850,000 new jobs in June along with rising hourly wages. The news temporarily led stocks higher, particularly in the growth sector which often outperforms the market when bond yields are low. But inflation concerns continued to proliferate and weigh on the market. Strengthening demand in the travel, entertainment and recreation industries and stimulus dollars streaming into the economy all contributed to upward inflationary pressure. Stocks rallied on the news that second quarter GDP expanded 6.7%, driving the U.S. economy above its size before the start of the pandemic. The emergence of the COVID-19 Delta variant in August reintroduced the threat of travel and social restrictions in parts of the country, cutting into spending on leisure and travel and depressing retailers and other cyclical stocks. Indications from the Fed that it may begin reversing its economic stimulus program before the end of the year sent bond yields higher. Technology and growth stocks pulled back in response and brought the S&P 500 down 4.8% for the month of September.
The market rebounded early in the fourth quarter in response to surprisingly strong corporate earnings results, particularly from banks, healthcare companies and manufacturers. Stocks subsequently slumped in response to the discovery of the fast-spreading and highly transmissible Omicron COVID-19 variant but soon recovered on the belief that the impact on the economic recovery would be limited as cases generally appeared to be milder. The Fed began the termination of its pandemic stimulus by gradually tapering its asset purchase program and Chairman Jerome Powell subsequently indicated that the Fed’s plan may need to accelerate to provide the flexibility to raise interest rates in early
2022 to combat climbing inflation. The Fed’s concerns were supported by the Labor Department’s report that the Consumer Price Index increased 6.8% in November from a year ago, its fastest pace since 1982. Additionally, the Producer Price Index, which measures changes in prices charged by suppliers and businesses, recorded its largest gain ever, jumping 9.6% for the trailing twelve months in November. At year-end, continuing strength in the jobs market and advancements in COVID-19 treatments and vaccines contributed to market optimism that the global economic recovery would continue into the new year.
Portfolio Strategy
CGM Focus Fund was fully invested throughout 2021 in anticipation of continued recovery from the brief COVID-19 induced recession in 2020. Unprecedented monetary and fiscal stimulus supported a strong consumer driven recovery throughout the year. The Fund participated in this recovery with significant investments in retailers, automobile dealers, and recreational vehicles. The Fund achieved its largest gains in retailers, steel companies, banks and other consumer products and realized small losses in automobile manufacturers and specialized finance companies.
On December 31, 2021, CGM Focus Fund was 18.4% invested in retail, 15.4% invested in housing and building materials and 13.6% invested in oil-independent production. The three largest holdings were Signet Jewelers Limited (retail), CVS Health Corporation (consumer staples) and Tenet Healthcare Corporation (health care services).
David C. Fietze
President
G. Kenneth Heebner
Portfolio Manager
January 3, 2022
Average Annual Total Returns through December 31, 2021
| | | | | | | | | | | | | | | | | | | | |
| | | | 1 Year | 5 Year | 10 Year |
| n | | CGM Focus Fund | 33.5% | 0.8% | 5.7% |
| n | | S&P 500 Index | 28.7% | 18.5% | 16.6% |
Past performance is no indication of future results and current performance may be higher or lower than the figures shown. Unlike a fund, an index is not managed and does not reflect fees and expenses.
| | | | | | | | | | | | | | | | | |
| CGM FOCUS FUND | |
| Portfolio Manager | |
G. Kenneth Heebner has managed CGM Focus Fund since its inception on September 3, 1997. In 1990, Mr. Heebner founded Capital Growth Management Limited Partnership ("CGM") with Robert L. Kemp. Prior to establishing CGM, Mr. Heebner managed mutual funds at Loomis, Sayles & Company. In addition to CGM Focus Fund, he currently manages CGM Mutual Fund and CGM Realty Fund.
| | | | | | | | | | | | | | |
| INVESTMENT PERFORMANCE |
| (unaudited) |
| Cumulative Total Returns for Periods Ended December 31, 2021 |
| CGM Focus Fund (%) |
| 10 Years | + | 73.8 | | | |
| 5 Years | + | 4.3 | | | |
| 1 Year | + | 33.5 | | | |
| 3 Months | + | 2.5 | | | |
The performance data contained in the report represent past performance, which is no guarantee of future results. The graph and table above do not reflect the deduction of taxes a shareholder would pay on Fund distributions or the redemption of Fund shares and assumes the reinvestment of all Fund distributions.
The investment return and the principal value of an investment in the Fund will fluctuate so that investors' shares, when redeemed, may be worth more or less than their original cost. Current performance may be higher or lower than the performance data quoted.
PORTFOLIO DIVERSIFICATION as of December 31, 2021
COMMON STOCKS
| | | | | |
| Industry | Percent of Net Assets |
| Retail | 18.4 | % |
| Housing and Building Materials | 15.4 | |
| Oil - Independent Production | 13.6 | |
| Transportation | 8.8 | |
| Building Materials | 7.2 | |
| Consumer Staples | 6.4 | |
| Commercial Banks | 6.4 | |
| Health Care Services | 6.1 | |
| Insurance | 5.5 | |
| Home Building Products | 2.9 | |
| Paper Products/Consumer | 2.7 | |
| Consumer Products | 1.4 | |
| Aerospace/Defense | 1.0 | |
| |
SCHEDULE OF INVESTMENTS as of December 31, 2021
COMMON STOCKS — 95.8% OF TOTAL NET ASSETS
| | | | | | | | | | | | | | | | |
| | Aerospace/Defense — 1.0% | Shares | | Value(a) |
| | | Northrop Grumman Corporation | 10,000 | | | $ | 3,870,700 | |
| | | | | | |
| | Building Materials — 7.2% | | | |
| | | Builders FirstSource Inc. (b) | 270,000 | | | 23,141,700 | |
| | | GMS Inc. (b) | 80,000 | | | 4,808,800 | |
| | | | | | 27,950,500 | |
| | Commercial Banks — 6.4% | | | |
| | | Bank of America Corporation | 200,000 | | | 8,898,000 | |
| | | Citigroup Inc. | 100,000 | | | 6,039,000 | |
| | | Wells Fargo & Company | 200,000 | | | 9,596,000 | |
| | | | | | 24,533,000 | |
| | Consumer Products — 1.4% | | | |
| | | Academy Sports and Outdoors, Inc. (b) | 120,000 | | | 5,268,000 | |
| | | | | | |
| | Consumer Staples — 6.4% | | | |
| | | CVS Health Corporation | 240,000 | | | 24,758,400 | |
| | | | 40,719,200 | | | |
| | Health Care Services — 6.1% | | | |
| | | Tenet Healthcare Corporation (b) | 290,000 | | | 23,690,100 | |
| | | | | | |
| | | | | | |
See accompanying notes to financial statements.
4
| | | | | | | | | | | | | | | | |
| | SCHEDULE OF INVESTMENTS as of December 31, 2021 (continued) |
| | | | | |
| | COMMON STOCKS (continued) | 110,070,700 | | | 259,783,552 | |
| | | | | | |
| | Home Building Products — 2.9% | Shares | | Value(a) |
| | | | | | |
| | | Louisiana-Pacific Corporation | 145,000 | | | $ | 11,360,750 | |
| | | | | | |
| | Housing and Building Materials — 15.4% | | | |
| | | D.R. Horton, Inc. | 160,000 | | | 17,352,000 | |
| | | Lennar Corporation | 170,000 | | | 19,747,200 | |
| | | Meritage Homes Corporation (b) | 80,000 | | | 9,764,800 | |
| | | Taylor Morrison Home Corporation (b) | 110,000 | | | 3,845,600 | |
| | | Toll Brothers, Inc. | 120,000 | | | 8,686,800 | |
| | | | | | 59,396,400 | |
| | Insurance — 5.5% | | | |
| | | Prudential Financial, Inc. | 195,000 | | | 21,106,800 | |
| | | | | | |
| | Oil - Independent Production — 13.6% | | | |
| | | Devon Energy Corporation | 200,000 | | | 8,810,000 | |
| | | Diamondback Energy, Inc. | 170,000 | | | 18,334,500 | |
| | | EOG Resources, Inc. | 80,000 | | | 7,106,400 | |
| | | Pioneer Natural Resources Company | 100,000 | | | 18,188,000 | |
| | | | | | 52,438,900 | |
| | Paper Products/Consumer — 2.7% | | | |
| | | West Fraser Timber Co. LTD. | 110,000 | | | 10,489,600 | |
| | | | | | |
| | Retail — 18.4% | | | |
| | | Foot Locker, Inc. | 450,000 | | | 19,633,500 | |
| | | Signet Jewelers Limited | 298,400 | | | 25,969,752 | |
| | | Target Corporation | 30,000 | | | 6,943,200 | |
| | | The Buckle, Inc. | 440,000 | | | 18,616,400 | |
| | | | | | 71,162,852 | |
| | Transportation — 8.8% | | | |
| | | ArcBest Corporation | 170,000 | | | 20,374,500 | |
| | | C.H. Robinson Worldwide, Inc. | 125,000 | | | 13,453,750 | |
| | | | | | 33,828,250 | |
| | TOTAL INVESTMENTS — 95.8% (Identified cost $347,930,256) | | 369,854,252 | |
| | | Cash and receivables | | 33,581,796 | |
| | | Liabilities | | (17,362,368) | |
| | TOTAL NET ASSETS — 100.0% | | $ | 386,073,680 | |
| | | | | | |
| | (a) | See Note 2A. | | |
| | (b) | Non-income producing security. | | | |
| | | | | | |
| | |
| | | | | | |
| | | | | | |
| | | | | | |
| | | | | | |
| | | | | | |
| | | | | | |
| | | | | | |
| | | | | | |
| | | | | | |
| | | | | | |
| | | | | | |
| | | | | | |
| | | | | | |
| | | | | | |
| | | | | | |
| | | | | | |
| | | | | | |
| | | | | | |
| | | | | | |
| | | | | | |
| | | | | | |
| | | | | | |
| | | | | | |
| | | | | | |
| | | | | | |
| | | | | | |
| | | | | | |
| | | | | | |
| | | | | | |
| | | | | | |
| | | | | | |
| | | | | | |
| | | | | | |
| | | | | | |
| | | | | | |
| | | | | | |
| | | | | | |
| | | | | | |
| | | | | | |
| | | | | | |
| | | | | | |
| | | | | | |
| | | | | | |
| | | | | | |
| | | | | | |
| | | | | | |
| | | | | | |
| | | | | | |
See accompanying notes to financial statements.
5
| | | | | | | | | | | |
STATEMENT OF
ASSETS AND LIABILITIES |
|
| December 31, 2021 |
| | | |
| | | |
| Assets | | | |
| Investments in securities, at value: | | |
| (Identified cost $347,930,256) | | $ | 369,854,252 | |
| Cash | | 27,101,249 | |
| Deposits with brokers for short sales | | 57,395 | |
| Receivable for: | | | |
| Securities sold | $ | 6,228,095 | | | |
| Shares of the Fund sold | 14,000 | | | |
| Dividends and interest | 148,486 | | | |
Reimbursement from
investment adviser | 32,571 | | | 6,423,152 | |
| Total assets | | 403,436,048 | |
| Liabilities | | | |
| | |
| Payable for: | | |
| Securities purchased | 16,005,944 | | | |
Shares of the Fund redeemed | 457,621 | | | |
| | | |
| Tax withholding | 3,300 | | | |
| Distributions declared | 373,277 | | | 16,840,142 | |
| | | |
| Accrued expenses: | | |
| Management fees | 325,707 | | | |
| Trustees’ fees | 24,003 | | | |
| Accounting, administration and compliance expenses | 28,164 | | | |
| Transfer agent fees | 59,154 | | | |
| Other expenses | 85,198 | | | 522,226 | |
| Total liabilities | | 17,362,368 | |
Net Assets | | $ | 386,073,680 | |
| | |
| Net Assets consist of: | | |
| Capital paid-in | | $ | 493,725,494 | |
| Accumulated loss | (107,651,814) | |
Net Assets | $ | 386,073,680 | |
| Shares of beneficial interest outstanding, no par value | 8,862,799 | |
| Net asset value per share* | $43.56 |
* Shares of the Fund are sold and redeemed at net asset
value ($386,073,680 ÷ 8,862,799).
| | | | | | | | | | | |
STATEMENT OF
OPERATIONS |
|
| Twelve Months Ended December 31, 2021 |
| | | |
| | | |
| Investment Income | | | |
| Income: | | | |
| Dividends (net of withholding tax of | | | |
| $11,172)* | | $ | 10,701,670 | | |
| | | |
| | 10,701,670 | | |
| | | |
| Expenses: | | | |
| Management fees | | 3,954,545 | | |
| Trustees’ fees | | 96,011 | | |
| Accounting, administration and compliance expenses | | 337,962 | | |
| Custodian fees and expenses | | 80,776 | | |
| Transfer agent fees | | 440,338 | | |
| Audit and tax services | | 61,841 | | |
| Legal | | 83,883 | | |
| Printing | | 49,321 | | |
| Registration fees | | 26,789 | | |
| Interest expenses on short sales | | 164 | | |
| | | |
| Miscellaneous expenses | | 6,661 | | |
| | 5,138,291 | | |
| Less expense waiver | | (395,454) | | |
| Net expenses | | 4,742,837 | | |
| Net investment income | | 5,958,833 | | |
| | | |
| Realized and Unrealized Gain (Loss) on Investments | | | |
| Net realized gains on investments | | 125,114,413 | | |
| | | |
Net change in unrealized depreciation
on investments | | (20,996,257) | | |
| | | |
| | | |
Net realized and unrealized gains
on investments | | 104,118,156 | | |
Change in Net Assets from Operations | | $ | 110,076,989 | | |
| | | |
| | | |
| *Includes non-recurring dividends of $3,641,000. | |
| | | |
|
See accompanying notes to financial statements.
6
STATEMENT OF CHANGES IN NET ASSETS
| | | | | | | | | | | | | | |
| | |
| | 2021 | | 2020 |
| From Operations | | | | |
| Net investment income (loss) | | $ | 5,958,833 | | | $ | (872,763) | |
| Net realized gains on investments | | 125,114,413 | | | 7,009,363 | |
| Net change in unrealized depreciation on investments | | (20,996,257) | | | (36,439,057) | |
| Change in net assets from operations | | 110,076,989 | | | (30,302,457) | |
| | | | |
| From Distributions to Shareholders | | | | |
| Total distributions | | (4,171,298) | | | (52,305) | |
| | | | |
| From Capital Share Transactions | | | | |
| Proceeds from sale of shares | | 2,381,278 | | | 2,745,002 | |
| Net asset value of shares issued in connection with reinvestment of distributions | | 3,798,021 | | | 47,859 | |
| | 6,179,299 | | | 2,792,861 | |
| Cost of shares redeemed | | (68,217,722) | | | (69,317,383) | |
| Change in net assets derived from capital share transactions | | (62,038,423) | | | (66,524,522) | |
| Total change in net assets | | 43,867,268 | | | (96,879,284) | |
| | | | |
| Net Assets | | | | |
| Beginning of period | | 342,206,412 | | | 439,085,696 | |
| End of period | | $ | 386,073,680 | | | $ | 342,206,412 | |
| | | | |
| Number of Shares of the Fund: | | | | |
| Issued from sale of shares | | 58,564 | | | 100,094 | |
| Issued in connection with reinvestment of distributions | | 87,191 | | | 1,447 | |
| | 145,755 | | | 101,541 | |
| Redeemed | | (1,661,191) | | | (2,457,683) | |
| Net change | | (1,515,436) | | | (2,356,142) | |
| | | | |
See accompanying notes to financial statements.
7
FINANCIAL HIGHLIGHTS
| | | | | | | | | | | | | | | | | | | | | | | | | | | | | | | | | | | | | | |
| | | For the Year Ended December 31, | |
| | 2021 | | 2020 | | 2019 | | 2018 | | 2017 | |
For a share of the Fund outstanding throughout each
period: | | | | | | | | | | | | | | |
| Net asset value at beginning of period | | | | | $ | 32.97 | | | $ | 34.48 | | | $ | 40.06 | | | $ | 53.35 | | | $ | 42.74 | | |
| Net investment income (loss) (a)(b) | | | | | 0.63 | | (c) | (0.08) | | | 0.22 | | | (0.12) | | (d) | (0.67) | | |
Net realized and unrealized gains (losses) on
investments and foreign currency transactions | | | | | 10.43 | | | (1.42) | | | (5.50) | | | (13.03) | | | 11.28 | | |
| Total from investment operations | | | | | 11.06 | | | (1.50) | | | (5.28) | | | (13.15) | | | 10.61 | | |
| | | | | | | | | | | | | | |
| Dividends from net investment income | | | | | (0.47) | | | (0.01) | | | (0.30) | | | (0.14) | | | — | | |
| | | | | | | | | | | | | | |
| Net increase (decrease) in net asset value | | | | | 10.59 | | | (1.51) | | | (5.58) | | | (13.29) | | | 10.61 | | |
| Net asset value at end of period | | | | | $ | 43.56 | | | $ | 32.97 | | | $ | 34.48 | | | $ | 40.06 | | | $ | 53.35 | | |
| | | | | | | | | | | | | | |
| Total return (%) | | | | | 33.5 | | (4.3) | | (13.1) | | (24.7) | | 24.8 | |
| Ratios: | | | | | | | | | | | | | | |
| Net operating expenses after waiver (%)* | | | | | 1.20 | | | 1.33 | | | 1.32 | | | 1.18 | | | 1.16 | | |
| Dividend and Interest expenses on short positions (%)* | | | | | — | | | 0.32 | | | 0.44 | | | 1.27 | | | 1.92 | | |
| Total net expenses after waiver (%)* | | | | | 1.20 | | | 1.65 | | (e) | 1.76 | | | 2.45 | | | 3.08 | | |
| Total operating expenses before waiver (%)* | | | | | 1.30 | | | 1.40 | | | 1.32 | | | 1.18 | | | 1.16 | | |
| Dividend and interest expenses on short positions (%)* | | | | | — | | | 0.32 | | | 0.44 | | | 1.27 | | | 1.92 | | |
| Total expenses before waiver (%)* | | | | | 1.30 | | | 1.72 | | (e) | 1.76 | | | 2.45 | | | 3.08 | | |
| Net investment income (loss) (%)* | | | | | 1.51 | | (c) | (0.28) | | | 0.60 | | | (0.24) | | (d) | (1.38) | | |
| Portfolio turnover (%) | | | | | 905 | | | 884 | | (f) | 451 | | (g) | 403 | | (g) | 388 | | (g) |
| Net assets at end of period (in thousands) ($) | | | 386,074 | | 342,206 | | 439,086 | | 650,199 | | 997,714 | | |
| (a) Net investment income (loss) per share excluding all related | | | | | |
| short sale income and expenses ($) | | | | | 0.63 | | | 0.01 | | | 0.38 | | | 0.51 | | | 0.26 | | |
(b) Per share net investment income (loss) has been calculated using average shares outstanding during the period.
(c) Net Investment income per share reflects non-recurring dividends which amounted to $0.38 per share. Excluding these non-recurring dividends, the ratio of net investment income to average net assets would have been 0.59%.
(d) Net Investment loss per share reflects non-recurring dividends which amounted to $0.17 per share. Excluding these non-recurring dividends, the ratio of net investment loss to average net assets would have been (0.58)%.
(e) Effective date of the expense waiver was May 1, 2020.
(f) The increase in the turnover ratio from prior year was due to the decrease in the average market value.
(g) Includes short sale bond transactions.
* Calculated based on average net assets.
See accompanying notes to financial statements.
8
| | |
|
| CGM FOCUS FUND |
|
| NOTES TO FINANCIAL STATEMENTS — December 31, 2021 |
|
1. Organization — CGM Focus Fund (the "Fund") is a diversified series of CGM Trust (the "Trust") which is organized as a Massachusetts business trust under the laws of Massachusetts pursuant to an Agreement and Declaration of Trust. The Trust is registered under the Investment Company Act of 1940 as an open-end management investment company and is following accounting and reporting guidance in the Financial Accounting Standards Board’s (“FASB”) Topic 946 “Financial Services—Investment Companies”. The Trust has two other funds whose financial statements are not presented herein. The Fund commenced operations on September 3, 1997. The Fund’s investment objective is long-term growth of capital. The Fund intends to pursue its objective by investing in a smaller number of companies, and/or in a more limited number of sectors than other diversified mutual funds. In addition, should the investment outlook of the Fund’s investment adviser so warrant, the Fund may engage in a variety of investment techniques including short sales designed to capitalize on declines in the market price of specific securities of one or more companies, or declines in market indexes or government securities.
2. Significant accounting policies — Management has evaluated the events and transactions from December 31, 2021 through the date of issuance of the Fund’s financial statements. For the Fund, there were no material subsequent events that required disclosure in the financial statements or footnotes.
A. Security valuation — Equity securities are valued on the basis of valuations furnished by a pricing service, authorized by the Board of Trustees (the “Board”). Equity securities listed or regularly traded on a securities exchange or in the over-the-counter (“OTC”) market are valued at the last quoted sale price or, for certain markets, the official closing price at the time the valuations are made. A security that is listed or traded on more than one exchange is valued at the quotation on the exchange determined to be the primary market for such security. For securities with no sale reported, the last reported bid price is used for long positions and the last reported ask price for short positions. Corporate debt securities are valued on the basis of valuations furnished by a pricing service, authorized by the Board, which determines valuations for normal, institutional-size trading units of such securities using market information, transactions for comparable securities and various relationships between securities which are generally recognized by institutional traders. United States government debt securities held long are valued at the current closing bid and if held short are valued at the current closing ask, as last reported by a pricing service approved by the Board.
When current market prices or quotations are not readily available or do not accurately reflect fair value, valuations may be determined in accordance with procedures adopted by the Board. For example, when developments occur between the close of a market and the close of the New York Stock Exchange ("NYSE") that may materially affect the value of some or all of the securities, or when trading in a security is halted, these procedures may be used. The frequency with which these procedures are used is unpredictable. These valuation procedures may result in a change to a particular security’s assigned level within the fair value hierarchy described below. The value of securities used for net asset value (“NAV”) calculation under these procedures may differ from published prices for the same securities.
The Fund may use valuation techniques consistent with the market, income, and cost approach to measure fair value. The market approach uses prices and other relevant information generated by market transactions involving identical or comparable assets or liabilities. The income approach uses valuation techniques to convert future amounts (cash flows, earnings) to a single present amount. The cost approach is based on the amount that currently would be required to replace the service capacity of an asset. To increase consistency and comparability in fair value measurements and related disclosure, the Fund utilizes a fair value hierarchy which prioritizes the various inputs to valuation techniques used to measure fair value into three broad levels:
• Level 1 - Prices determined using: quoted prices in active markets for identical securities that the Fund has the ability to access at the measurement date. Valuation adjustments are not applied to Level 1 investments.
| | |
|
| CGM FOCUS FUND |
|
| NOTES TO FINANCIAL STATEMENTS (continued) |
|
• Level 2 - Prices determined using: other significant observable inputs (including quoted prices for similar securities, interest rates, prepayment spreads, credit risk, etc.).
• Level 3 - Prices determined using: significant unobservable inputs, including the Fund’s own assumptions and judgment in determining the fair value of investments. In situations where quoted prices or observable inputs are unavailable (for example, when there is little or no market activity for an investment at the end of the period), unobservable inputs may be used. Unobservable inputs reflect the Fund’s own assumptions about the factors market participants would use in pricing an investment, and would be based on the best information available in the circumstances. Investments falling into the Level 3 category are primarily supported by quoted prices from brokers and dealers participating in the market for those investments. However, these may be classified as Level 3 investments due to lack of market transparency and corroboration to support these quoted prices. Additionally, valuation models may be used as the pricing source for any remaining investments classified as Level 3. These models rely on one or more significant unobservable inputs and/or significant assumptions by Capital Growth Management Limited Partnership, the Fund’s investment adviser (“CGM”). Inputs used in valuations may include, but are not limited to, financial statement analysis, capital account balances, discount rates and estimated cash flows, and comparable company data.
The inputs or methodology used for valuing securities are not necessarily an indication of the risk associated with investing in those securities. The following is a summary of the inputs used to value the Fund’s investments as of December 31, 2021:
| | | | | | | | | | | | | | | | | | | | | | | |
| | | Valuation Inputs |
| Classification | | Level 1 -
Quoted Prices | | Level 2 - Other Significant Observable Inputs | | Level 3 - Significant Unobservable Inputs |
| Investments in Securities-Assets | | | | | | |
| Common Stocks* | | $ | 369,854,252 | | — | | — |
| | | | | | | |
| | | | | | | |
| Total | | $ | 369,854,252 | | — | | — |
| | | | | | | |
| | | | | | | |
| | | | | | | |
| | | | | | | |
| | | | | | | |
| | | | | | | |
| | | | | | | |
| * | All common stocks held in the Fund are Level 1 securities. For a detailed break-out of common stocks by major industry classification, please refer to the Schedule of Investments. |
B. Security transactions and related investment income — Security transactions are accounted for on the trade date plus one basis for daily NAV calculations. However, for financial reporting purposes, investment transactions are reported on the trade date (date the order to buy or sell is executed). Dividend income and expense is recorded on the ex-dividend date net of applicable foreign taxes and fees, a portion of which may be recoverable. The Fund will accrue such taxes and recoveries as applicable based upon its current interpretations of the tax rules and regulations that exist in the markets in which it invests. Interest income and expense is recorded on an accrual basis and includes amortization of premium and discount. Net gain or loss on securities sold is determined on the identified cost basis and may include proceeds from litigation. Dividend payments received by the Fund from its investment in real estate investment trusts (“REITs”) may consist of ordinary income, capital gains, and return of capital and as such are recorded as dividend income, capital gains or a reduction to security cost, as appropriate. Distributions from publicly traded partnerships are generally recorded based on the characterization reported on the Fund’s schedule K-1 received from the partnership. Non-cash dividend payments, if any, are recorded at the fair market value of the securities received.
| | |
|
| CGM FOCUS FUND |
|
| NOTES TO FINANCIAL STATEMENTS (continued) |
|
C. Federal income taxes — It is the Fund’s policy to comply with the requirements of the Internal Revenue Code ("IRC") applicable to regulated investment companies, and to distribute to its shareholders all of its taxable income and net realized capital gains, within the prescribed time period.
Capital accounts within the financial statements are adjusted for permanent book/tax differences. These adjustments have no impact on the Fund's net assets or results of operations. Temporary book/tax differences, if any, will reverse in a subsequent period. Any difference between book basis and tax basis unrealized appreciation is attributable primarily to the temporary book/tax difference of tax deferral of losses on wash sales.
As of December 31, 2021, the components of distributable earnings on a tax basis were as follows:
| | | | | | | | | | | | | | |
| Undistributed Ordinary Income | | Undistributed Long-term Capital Gains | | Net Unrealized Appreciation/ (Depreciation) |
| — | | — | | $8,310,164 |
The identified cost of investments in securities owned by the Fund for federal income tax purposes, and their respective gross unrealized appreciation and depreciation at December 31, 2021 was as follows:
| | | | | | | | | | | | | | | | | | | | | | |
| | Identified Cost | | Gross Unrealized Appreciation | | Gross Unrealized Depreciation | | Net Unrealized Appreciation |
| | $361,544,088 | | $22,952,957 | | $(14,642,793) | | $8,310,164 |
| | |
The Fund is permitted to carry forward capital losses for an unlimited period, and such losses, when carried forward, retain their character as either short-term or long-term capital losses. As of December 31, 2021, the capital loss carryforwards utilized and the accumulated net realized loss on sales of investments for federal income tax purposes which are available to offset future taxable gains, prior to distributing such gains to shareholders, are shown in the table below:
| | | | | | | | | | | | | | | | | | | | | | | | | | | | | | | | |
Short-term
Capital Loss Carryforward Utilized | | Long-term
Capital Loss Carryforward Utilized | | Total | | Remaining Short-term
Capital Loss Carryforward | | Remaining Long-term
Capital Loss Carryforward | | Total |
| $135,525,301 | | — | | $135,525,301 | | $111,965,577 | | — | | $111,965,577 |
Management has concluded that there are no significant uncertain tax positions for the open tax years as of December 31, 2021 that would require recognition in the financial statements. However, management’s conclusion may be subject to review and adjustment at a later date based on factors including, but not limited to, new tax laws, regulations, and administrative interpretations (including relevant court decisions). Generally, the Fund's federal tax returns for the prior three fiscal years remain subject to examination by the Internal Revenue Service.
D. Dividends and distributions to shareholders — Dividends and distributions are recorded by the Fund on the ex-dividend date. The classification of income and capital gains distributions is determined in accordance with income tax regulations. Distributions from net investment income and short-term capital gains are treated as ordinary income for income tax purposes. Permanent book/tax differences relating to shareholder distributions may result in reclassifications to paid-in capital or accumulated realized gain/(loss). The Fund also may utilize earnings and profits distributed to shareholders on redemption of shares as a part of the dividend deduction for income tax purposes. Undistributed net investment income or accumulated net investment loss may include temporary book/tax differences such as tax deferral of losses on wash sales and disallowed interest expense deduction, which will reverse in a subsequent period. Any taxable income or gain remaining at fiscal year end is distributed in the following year.
| | |
|
| CGM FOCUS FUND |
|
| NOTES TO FINANCIAL STATEMENTS (continued) |
|
The tax characterization of distributions is determined on an annual basis. The tax character of distributions paid during the periods ended December 31, 2021 and 2020 were as follows:
| | | | | | | | | | | | | | | | | | | | |
| Year | | Ordinary
Income | | Long-term
Capital Gains | | Total |
| | | | | | |
| 2021 | | $ 4,171,298 | | — | | $ 4,171,298 |
| 2020 | | $ 52,305 | | — | | $ 52,305 |
E. Short sales — The Fund engages in short sales of securities. A short sale is a transaction in which the Fund sells a security it does not own in anticipation that the market price of that security will decline. When the Fund makes a short sale, it must borrow the security sold short to make delivery to the buyer. The Fund is then obligated to replace the security borrowed by purchasing the security at the market price at the time of the replacement. The Fund is liable for any fees, dividends or interest paid on securities sold short, which are recorded as expenses on the Statement of Operations. The net amount of income and/or fees are included as interest expense on short sales on the Statement of Operations. While the short sale is outstanding, the Fund is required to collateralize its obligations, which has the practical effect of limiting the extent to which the Fund may engage in short sales. Under certain market conditions, short sales can increase the volatility of the Fund and may lower the Fund’s return or result in losses, which potentially may be unlimited. The market value of securities held in a segregated account at December 31, 2021 was $0 and the value of cash held in a segregated account at December 31, 2021 was $57,395. As of December 31, 2021, the Fund did not have any open short sales.
F. Guarantees and indemnifications — Under the Trust's organizational documents, its officers and trustees are indemnified against certain liabilities arising out of the performance of their duties for the Fund. Additionally, in the normal course of business, the Fund may enter into contracts with service providers that contain general indemnification clauses. The Fund's maximum exposure under these arrangements is unknown, as this would involve future claims that may be made against the Fund that have not yet occurred. The risk of material loss from such claims is considered remote.
G. Foreign currency translation — All assets and liabilities initially expressed in terms of foreign currencies are translated into U.S. dollars each day at the prevailing exchange rate. Transactions affecting Statement of Operations accounts and net realized gain or loss on investments are translated at the rates prevailing at the dates of the transactions. The Fund does not isolate that portion of the results of operations resulting from changes in foreign exchange rates on investments from the fluctuations arising from changes in market prices of securities held. Such fluctuations are included with the net realized and unrealized gain or loss from investments. Reported net realized foreign exchange gains or losses arise from sales of foreign currency, currency gains or losses realized between the trade and settlement dates on securities transactions and the difference between the amounts of dividends, interest, and foreign withholding taxes recorded on the Fund’s books and the U.S. dollar equivalent of the amounts actually received or paid. Net unrealized foreign exchange gains or losses arise from changes in the value of assets and liabilities other than investments in securities at the end of the period, resulting from changes in the exchange rate.
H. Repurchase agreements — The Fund enters into repurchase agreements, under the terms of a Master Repurchase Agreement, secured by U.S. Government or Agency securities, which involve the purchase of securities from a counterparty with a simultaneous commitment to resell the securities at an agreed upon date and price. Certain repurchase agreements are tri-party arrangements whereby the collateral is held in a segregated account for the benefit of the Fund and on behalf of the counterparty. Repurchase agreements afford the Fund the opportunity to earn a return on temporarily available cash at minimal market risk. While the underlying security may be a bill, certificate of indebtedness, note or bond issued by an agency, authority or instrumentality of the U.S.
| | |
|
| CGM FOCUS FUND |
|
| NOTES TO FINANCIAL STATEMENTS (continued) |
|
Government, the obligation of the seller is not guaranteed by the U.S. Government and there is a risk that the seller may fail to repurchase the underlying security. Consequently, there may be possible delays or restrictions upon the Fund’s ability to dispose of the underlying securities. Upon an event of default under the Master Repurchase Agreement, the Fund would attempt to exercise its rights with respect to the underlying security, including taking possession of the cash and/or collateral provided by the seller. At December 31, 2021, the Fund was not a party to any repurchase transactions.
I. Use of estimates — The preparation of financial statements in accordance with U.S. Generally Accepted Accounting Principles (“GAAP”) requires management to make certain estimates and assumptions that affect the reported amounts of assets and liabilities, the disclosure of contingent assets and liabilities at the date of the financial statements and the reported amounts of revenue and expenses during the reporting period. Actual results could differ from those estimates.
3. Risks and uncertainties
A. Risks associated with focused investing — The Fund, although diversified, takes a focused approach to investing within particular industries or sectors of the economy and may invest in a relatively small number of individual holdings. Therefore, the Fund may be subject to greater price volatility and may be more adversely affected by the performance of particular industries, sectors, or individual holdings than would a more diversified fund. In addition, funds that invest more heavily in certain industries, sectors or individual holdings are particularly susceptible to the impact of market, economic, regulatory and other factors affecting those investments.
B. Risks associated with foreign investments — The Fund may invest in securities issued by institutions, corporations, and governments established by or located in foreign countries, which may be developed or undeveloped countries. Investing in foreign securities may involve significant risks. For example, there is often less publicly available information about foreign companies, particularly those not subject to the disclosure and reporting requirements of the U.S. securities laws. Foreign issuers are often not bound by uniform accounting, auditing, and financial reporting requirements and standards of practice comparable to those applicable to domestic issuers. Investments in foreign securities also involve the risk of possible adverse changes in investment or exchange control regulations, expropriation or confiscatory taxation, political or financial instability or diplomatic and other developments which could affect such investments. Foreign stock markets, while growing in volume and sophistication, are often not as developed as those in the U.S., and securities of some foreign issuers (particularly those located in developing countries) may be less liquid and more volatile than securities of comparable U.S. companies. There may also be less overall governmental supervision and regulation of foreign securities markets, broker-dealers and issuers than in the U.S. Additionally, because some foreign securities the Fund may acquire are purchased with and payable in foreign currencies, the value of these assets as measured in U.S. dollars may be affected favorably or unfavorably by changes in currency exchange rates and exchange control regulations. There is no limit on the amount that the Fund may invest in issuers located in a single country or in foreign countries in the aggregate. To the extent the Fund focuses its investments in a single country or only a few countries in a particular geographic region, economic, political, regulatory or other conditions affecting such country or region may have a greater impact on Fund performance relative to a more geographically diversified fund.
C. Recent events — Financial markets have experienced and may continue to experience significant volatility resulting from the spread of the virus known as COVID–19. The outbreak of COVID–19 has resulted in, among other things, travel and border restrictions, quarantines, supply chain disruptions, lower consumer demand in some industries, and general market uncertainty. The effects of COVID–19 have adversely affected, and may continue to adversely affect, the global economy, the economies of certain nations, and individual issuers, all of which may negatively impact the fund’s performance.
| | |
|
| CGM FOCUS FUND |
|
| NOTES TO FINANCIAL STATEMENTS (continued) |
|
4. Purchases and sales of securities — For the year ended December 31, 2021, purchases and sales of securities other than U.S. Government or Agency obligations and short-term investments aggregated $3,391,766,612 and $3,459,608,228, respectively.
5. Fees and expenses
A. Management fees — During the year ended December 31, 2021, the Fund incurred management fees of $3,954,545, paid or payable monthly to CGM, certain officers and employees of which are also officers and trustees of the Fund. The management agreement provides for a fee at the annual rate of 1.00% on the first $500 million of the Fund’s average daily net assets, 0.95% of the next $500 million of the Fund's average daily net assets and 0.90% on amounts in excess of $1 billion of the Fund's average daily net assets.
The investment adviser has agreed to waive its fees and/or reimburse expenses of the Fund through April 30, 2022 to the extent necessary to reduce the Fund's total annual operating expenses by 0.10%. This arrangement may not be terminated without the consent of the Fund's Board of Trustees. As a result of the agreed waiver, year-to-date, CGM waived $395,454 of its management fee.
B. Other expenses — The majority of expenses are directly attributable to the Fund. Expenses that are not readily attributable to the Fund are allocated among each of the three funds comprising the Trust in an equitable manner, taking into consideration, among other things, the nature and type of expense and the funds' respective net assets. CGM performs certain administrative, accounting, compliance and other services for the Fund. The expenses of those services, which are paid to CGM by the Fund, include the following: (i) expenses for personnel performing bookkeeping, accounting and financial reporting and clerical functions relating to the Fund; (ii) expenses for services required in connection with the preparation of registration statements and prospectuses, shareholder reports and notices, proxy solicitation material furnished to shareholders of the Fund or regulatory authorities and reports and questionnaires for Securities and Exchange Commission ("SEC") compliance; (iii) registration, filing and other fees in connection with requirements of regulatory authorities and (iv) compliance in connection to the Investment Company Act of 1940 and the Sarbanes-Oxley Act of 2002. The accounting, administration and compliance expenses of $337,962, for the year ended December 31, 2021, are shown separately in the Statement of Operations. These expenses include the reimbursement of a portion of the compensation expenses incurred by CGM for its employees who provide these administrative, accounting, compliance, and other services to the Fund, including $311,969 of the salaries of CGM employees who are officers of the Fund.
C. Trustees fees and expenses — The Fund does not pay any compensation directly to any trustees who are “interested persons” (as defined in the Investment Company Act of 1940) of CGM or any affiliate of CGM (other than registered investment companies). For the year ended December 31, 2021, each disinterested trustee was compensated by the Trust with an annual fee of $90,000 plus travel expenses for each meeting attended. The disinterested trustees are responsible for the audit committee functions of the Trust’s Board and have designated a disinterested trustee to lead the Board's efforts in overseeing those functions, who receives an additional $30,000 annually. Of these amounts, the Fund is responsible for $10,000 per trustee annually, plus an annual variable fee calculated based on the proportion of the Fund’s average net assets relative to the aggregate average net assets of the Trust.
| | |
|
| CGM FOCUS FUND |
|
| REPORT OF INDEPENDENT REGISTERED PUBLIC ACCOUNTING FIRM |
|
To the Board of Trustees of CGM Trust and Shareholders of CGM Focus Fund
Opinion on the Financial Statements
We have audited the accompanying statement of assets and liabilities, including the schedule of investments, of CGM Focus Fund (one of the funds constituting CGM Trust, referred to hereafter as the "Fund") as of December 31, 2021, the related statement of operations for the year ended December 31, 2021, the statement of changes in net assets for each of the two years in the period ended December 31, 2021, including the related notes, and the financial highlights for each of the five years in the period ended December 31, 2021 (collectively referred to as the “financial statements”). In our opinion, the financial statements present fairly, in all material respects, the financial position of the Fund as of December 31, 2021, the results of its operations for the year then ended, the changes in its net assets for each of the two years in the period ended December 31, 2021 and the financial highlights for each of the five years in the period ended December 31, 2021 in conformity with accounting principles generally accepted in the United States of America.
Basis for Opinion
These financial statements are the responsibility of the Fund's management. Our responsibility is to express an opinion on the Fund's financial statements based on our audits. We are a public accounting firm registered with the Public Company Accounting Oversight Board (United States) (PCAOB) and are required to be independent with respect to the Fund in accordance with the U.S. federal securities laws and the applicable rules and regulations of the Securities and Exchange Commission and the PCAOB.
We conducted our audits of these financial statements in accordance with the standards of the PCAOB. Those standards require that we plan and perform the audit to obtain reasonable assurance about whether the financial statements are free of material misstatement, whether due to error or fraud.
Our audits included performing procedures to assess the risks of material misstatement of the financial statements, whether due to error or fraud, and performing procedures that respond to those risks. Such procedures included examining, on a test basis, evidence regarding the amounts and disclosures in the financial statements. Our audits also included evaluating the accounting principles used and significant estimates made by management, as well as evaluating the overall presentation of the financial statements. Our procedures included confirmation of securities owned as of December 31, 2021 by correspondence with the custodian and brokers; when replies were not received from brokers, we performed other auditing procedures. We believe that our audits provide a reasonable basis for our opinion.
PricewaterhouseCoopers LLP
Boston, Massachusetts
February 15, 2022
We have served as the auditor of one or more investment companies in Capital Growth Management Investment Company Complex since at least 1994. We have not determined a specific year we began serving as auditor.
| | |
|
| CGM FOCUS FUND |
|
| ADDITIONAL INFORMATION |
| (unaudited) |
Availability of proxy voting information:
Proxy voting policies and information regarding how the Fund voted proxies relating to portfolio securities during the twelve month period ended June 30, 2021 are available without charge, by calling 800-345-4048. The policies also appear in the Fund’s Statement of Additional Information, which can be found on the CGM Funds' website, www.cgmfunds.com, and the SEC’s website, www.sec.gov. The voting records can also be found on the SEC’s website on the N-PX filing.
Portfolio holdings:
The Fund files its complete schedule of portfolio holdings with the SEC for the first and third quarters of each fiscal year on Form N–PORT, which is available on the SEC's website at www.sec.gov. Portfolio holdings are also disclosed in the Fund's quarterly reports. The Fund's four most recent quarterly reports can be obtained on the CGM Funds' website, www.cgmfunds.com.
The Fund’s Prospectus and Statement of Additional Information contain additional information on other risks and uncertainties relating to the Fund’s investments. The Fund’s Prospectus and Statement of Additional Information can be obtained on the CGM Funds' website, www.cgmfunds.com, and the SEC’s website, www.sec.gov or by calling 800-345-4048.
Liquidity Risk Management Program:
Rule 22e-4 (“Liquidity Rule”) under the Investment Company Act of 1940 (“1940 Act”) requires registered open-end funds to establish and implement a written Liquidity Risk Management Program reasonably designed to assess and manage its liquidity risk. The Fund must also periodically review its liquidity risk. In addition, a written report is provided to the Fund’s Board of Trustees annually which details the operation of the Fund’s program.
Pursuant to its program, the Fund classifies the liquidity of its portfolio investments into one of the four categories defined by the SEC: “Highly Liquid”, “Moderately Liquid”, “Less Liquid” and “Illiquid”. These classifications are reported to the SEC on Form N-PORT. The Liquidity Rule requires open-end funds that are not invested primarily in “Highly Liquid�� investments to establish a “Highly Liquid Investment Minimum” (“HLIM”), which is the minimum percentage of net assets that must be invested in Highly Liquid investments (i.e., cash or investments that are reasonably expected to be convertible into cash within three business days without significantly changing the market value of the investment). It was determined through periodic reviews that the Fund’s portfolio holdings have been primarily Highly Liquid and, therefore, the Fund does not need to establish a HLIM.
The Fund may not acquire an investment if, immediately after the acquisition, over 15% of the Fund’s net asset would consist of Illiquid investments (an investment that cannot reasonably be expected to be sold or disposed of in current market conditions in seven calendar days or less without the sale or disposition significantly changing the market value of the investment). The Fund is required to report to the SEC and the Fund’s Board of Trustees if the Fund holds illiquid investments in excess of the 15% limit. No such reporting was required during the past year. For the year, there were no material changes to the Fund's program and periodic stress testing confirmed that the Fund held sufficient liquid investments to cover all reasonably foreseeable levels of cash flow.
| | |
|
| CGM FOCUS FUND |
|
| TAX INFORMATION FOR THE TAX YEAR ENDED December 31, 2021 |
| (unaudited) |
We are providing this information as required by the IRC.
For taxable non-corporate shareholders, 100% of the 2021 ordinary dividend is considered qualified dividend income that may be eligible for reduced capital gains rates.
For corporate shareholders, 100% of the 2021 ordinary dividend qualifies for the dividends-received deduction.
| | |
|
| CGM FOCUS FUND |
|
| FUND EXPENSES |
| (unaudited) |
As a shareholder of CGM Focus Fund, you incur two types of costs: (1) transaction costs, which could include, among other charges, wire fees and custodial maintenance fees for certain types of accounts and (2) ongoing costs, including management fees and other Fund expenses. This example is intended to help you understand your ongoing costs (in dollars) of investing in the Fund and to compare these costs with the ongoing costs of investing in other mutual funds.
The example is based on an investment of $1,000 invested at the beginning of the period and held for the entire period July 1, 2021 to December 31, 2021.
Actual return and expenses
The first line of the table below provides information about actual account values and actual expenses.
You may use the information in this line, together with the amount you invested, to estimate the expenses that you paid over the period. Simply divide your account value by $1,000 (for example, an $8,600 account value divided by $1,000 = 8.6), then multiply the result by the number in the first line under the heading entitled ‘‘Expenses Paid During Period’’ to estimate the expenses you paid on your account during this period.
Hypothetical example for comparison purposes
The second line of the table below provides information about hypothetical account values and hypothetical expenses based on the Fund’s actual expense ratio and an assumed rate of return of 5% per year before expenses, which is not the Fund’s actual return. The hypothetical account values and expenses may not be used to estimate the actual ending account balance or expenses you paid for the period.
You may use this information to compare the ongoing costs of investing in the Fund and other funds. To do so, compare this 5% hypothetical example with the 5% hypothetical examples that appear in the shareholder reports of the other funds.
Please note that the expenses shown in the table are meant to highlight your ongoing costs only and do not reflect any transactional costs such as any wire fees or custodial maintenance fees that may be payable. Therefore, the second line of the table is useful in comparing ongoing costs only, and will not help you determine the relative total costs of owning different funds. In addition, if these transactional costs were included, your costs would have been higher.
| | | | | | | | | | | |
| Beginning Account Value 07/01/21 | Ending Account Value
12/31/21 | Expenses Paid During Period* 07/01/21 - 12/31/21 |
| Actual | $1,000.00 | $1,041.01 | $6.07 |
Hypothetical
(5% return before expenses) | $1,000.00 | $1,019.26 | $6.01 |
* Expenses are equal to the Fund’s annualized expense ratio of 1.18%, which includes expenses related to short sales activity, multiplied by the average account value over the period, multiplied by 184/365 (to reflect the one-half year period).
| | |
|
| CGM FOCUS FUND |
|
| TRUSTEES AND OFFICERS |
The Fund is supervised by the Board of Trustees (the “Board”) of the Trust. The Board is responsible for the general oversight of the Fund, including general supervision and review of the Fund’s investment activities. The Board, in turn, elects the officers who are responsible for administering the Fund’s day-to-day operations.
An asterisk in the following table identifies those trustees and officers who are “interested persons” of the Trust as defined in the Investment Company Act of 1940. Each trustee and officer of the Trust noted as an interested person is interested by virtue of that individual’s position with CGM, as described in the table below. Each trustee serves during the continued lifetime of the Trust, until he or she earlier dies, resigns or is removed, or if sooner, until the election and qualification of his or her successor. Each officer serves until his or her successor is elected or qualified, or until the officer sooner dies, resigns, or is removed or becomes disqualified.
The trustees and officers of the Trust, their ages, their principal occupations during the past five years, the number of CGM Funds they oversee, and other directorships they hold are set forth below. Unless otherwise noted below, the address of each interested trustee and officer is One International Place, Boston, Massachusetts 02110. Correspondence intended for the trustees who are not “interested persons” of the Trust may be sent c/o Capital Growth Management, One International Place, Boston, Massachusetts 02110. The Statement of Additional Information for the Fund includes additional information about Fund trustees and is available on the CGM Funds' website, www.cgmfunds.com, or by calling 800-345-4048.
| | | | | | | | | | | | | | | | | | | | |
| Name | | Positions Held and Length of Time Served | | Principal Occupations and Other Directorships Held During Past 5 Years | | Number of Funds in the CGM Funds Complex Overseen |
| (Birth Year) | |
| Interested Trustees | | | | | | |
| Ken Heebner* | | Trustee since 1993 | | Co-founder and Employee, CGM; Controlling owner of Kenbob, Inc. (general partner of CGM) | | 3 |
| (1940) | | | | |
Leslie A. Lake*
| | Trustee since 2013 | | Consultant to CGM (since 2013) | | 3 |
| (1945) | | | | |
| Disinterested Trustees | | | | |
Peter O. Brown
| | Trustee since 1993 | | Counsel (formerly, Partner), Harter, Secrest & Emery LLP (law firm); formerly Executive Vice President and Chief Operating Officer, The Glenmede Trust Company (1990-1993); formerly Senior Vice President, J.P. Morgan Chase Bank (1981-1990); formerly Trustee, TT International U.S.A. Master and Feeder Trusts (four mutual funds) (2000-2005) | | 3 |
| (1940) | | | | |
| Mark W. Holland | | Trustee since 2004 | | President, Wellesley Financial Advisors, LLC (since 2003); formerly Vice President and Chief Operating Officer, Fixed Income Management, Loomis, Sayles & Company, L.P. (1999-2002); formerly Director, Loomis, Sayles & Company, L.P. (1993-2001) | | 3 |
| (1949) | | | | |
| | | | | | | | | | | | | | | | | | | | |
| Name | | Positions Held and Length of Time Served | | Principal Occupations and Other Directorships Held During Past 5 Years | | Number of Funds in the CGM Funds Complex Overseen |
| (Birth Year) | |
| | | | | | |
| J. Baur Whittlesey | | Trustee since 1990 | | Member (1994-2016) and Senior Counsel (since 2017), Ledgewood, P.C. (law firm) | | 3 |
| (1946) | | | | |
| | | | | | |
| Officers | | | | | | |
| Ken Heebner* | | Vice President since 1990 | | Co-founder and Employee, CGM; Controlling owner of Kenbob, Inc. (general partner of CGM) | | 3 |
| (1940) | | | | |
David C. Fietze*
| | President since 2015 & Chief Compliance Officer since 2004 | | Employee – Legal Counsel, CGM | | 3 |
| (1969) | | | | |
Kathleen S. Haughton* (1960) | | Sr. Vice President since 2013, Director of Human Resources since 2019, Vice President (1992-2013), AML Officer since 2002 & Principal since 1992 | | Employee – Investor Services Division, CGM
38 Newbury St., Boston, MA 02116 | | 3 |
| | | | |
Leslie A. Lake*
| | Vice President (1992-2013) & Secretary since 1992 | | Consultant to CGM (since 2013) | | 3 |
| (1945) | | | | |
| | | | | | |
| | | | |
| Tony Figueiredo* | | Vice President since 2013 & Director of Operations (1996-2013) | | Employee – Investor Services Division, CGM 38 Newbury St., Boston, MA 02116 | | 3 |
| (1960) | | | | |
Deidra Hewardt*
| | Treasurer since 2020 & Assistant Treasurer (2014-2020) | | Employee – Treasury Operations, CGM | | 3 |
| (1972) | | |
| | |
| | | | | | |
ITEM 2. CODE OF ETHICS.
CGM Trust has adopted a code of ethics that applies to the registrant's principal executive officer and principal financial officer (the "Code"). The Code is filed herewith as exhibit EX99_CODE. There were no amendments to the Code required to be disclosed in response to this Item 2 during the fiscal year ended December 31, 2021. There were no waivers or implicit waivers from the Code granted by the registrant during the fiscal year ended December 31, 2021.
ITEM 3. AUDIT COMMITTEE FINANCIAL EXPERT.
The Trust's Board of Trustees has determined that it has at least one audit committee financial expert serving on its audit committee. The name of the audit committee financial expert is Mark W. Holland. Mark W. Holland is "independent" as defined in Item 3(a)(2) of Form N-CSR.
ITEM 4. PRINCIPAL ACCOUNTANT FEES AND SERVICES.
(a)Audit Fee: The aggregate fees billed for each of the last two fiscal years for professional services rendered by the principal accountant for the audit of CGM Trust’s annual financial statements or services that are normally provided by the accountant in connection with statutory and regulatory filings or engagements are the following: 2020 - $145,338 and 2021 - $149,697.
(b)Audit-Related Fees: The aggregate fees billed in each of the last two fiscal years for assurance and related services by the principal accountant that are reasonably related to the performance of the audit of CGM Trust’s financial statements and are not reported under paragraph (a) of this Item are the following: 2020 - $0 and 2021 - $0.
(c)Tax Fees: The aggregate fees billed in each of the last two fiscal years for professional services rendered by the principal accountant for tax compliance, tax advice, and tax planning are the following: 2020 - $28,302 and 2021 - $28,926. The nature of the services comprising the fees disclosed under this category is tax compliance services related to the preparation and review of federal income and excise tax returns and review of excise tax distribution requirements.
(d)All Other Fees: The aggregate fees billed in each of the last two fiscal years for products and services provided by the principal accountant, other than the services reported in paragraphs (a) through (c) of this Item are the following: 2020 - $0 and 2021 - $0.
(e)(1)The Trustees Committee of the Board of Trustees of the CGM Trust is required to pre-approve (i) all audit services, tax services and permitted non-audit services provided by PricewaterhouseCoopers LLP or any other independent public accountant engaged by the CGM Trust and (ii) any engagement of PricewaterhouseCoopers LLP to provide non-audit services to (a) Capital Growth Management Limited Partnership (“CGM”), and (b) any entity controlling, controlled by, or under common control with CGM that provides ongoing services to the Trust if the engagement relates directly to the operations and financial reporting of the Trust. The Trustees Committee generally reviews each necessary pre-approval on a case by case basis. However, the Trustees Committee has authorized the President or Treasurer of the CGM Trust, on behalf of its series (the “Funds”) to incur additional fees totaling in the aggregate not more than $7,500 for services relating to the audit of the Funds for the fiscal year ended December 31, 2021, the close-out of the 2021 accounts, calculation of year-end dividends, and/or related tax or accounting matters.
(2) 0% of services described in each of paragraphs (b) through (d) of this Item were approved by the audit committee pursuant to the "de minimis" exception contained in paragraph (c)(7)(i)(C) of Rule 2-01 of Regulation S-X.
(f) Not applicable.
(g) The aggregate non-audit fees billed by CGM Trust’s accountant for services rendered to (i) CGM Trust, (ii) CGM, and (iii) any entity controlling, controlled by, or under common control with CGM that provides ongoing services to the CGM Trust for each of the last two fiscal years of the CGM Trust are the following: 2020 - $28,302 and 2021 - $28,926.
(h) There were no non-audit services that were rendered to CGM or any entity controlling, controlled by, or under common control with CGM that provides ongoing services to the CGM Trust that were not pre-approved pursuant to paragraph (c)(7)(ii) of Rule 2-01 of Regulation S-X, thus no consideration by the Trustees Committees was necessary to determine if services were compatible with maintaining the principal accountant's independence.
ITEM 5. AUDIT COMMITTEE OF LISTED REGISTRANTS.
Not applicable.
ITEM 6. SCHEDULE OF INVESTMENTS.
Not applicable. Investments in securities of unaffiliated issuers as of December 31, 2021, as set forth in Section 210.12-12 of Regulation S-X, are included as part of the report to shareholders filed under Item 1 of this Form.
ITEM 7. DISCLOSURE OF PROXY VOTING POLICIES AND PROCEDURES FOR CLOSED-END MANAGEMENT INVESTMENT COMPANIES.
Not applicable.
ITEM 8. PORTFOLIO MANAGERS OF CLOSED-END MANAGEMENT INVESTMENT COMPANIES.
Not applicable.
ITEM 9. PURCHASES OF EQUITY SECURITIES BY CLOSED-END MANAGEMENT INVESTMENT COMPANY AND AFFILIATED PURCHASERS.
Not applicable.
ITEM 10. SUBMISSION OF MATTERS TO A VOTE OF SECURITY HOLDERS.
As described in the CGM Trust’s proxy statement on Schedule 14A filed on September 24, 2004, the CGM Trust does not have a formal policy for considering any trustee candidates recommended by shareholders.
ITEM 11. CONTROLS AND PROCEDURES.
(a) Based on their evaluation of the CGM Trust’s disclosure controls and procedures within 90 days of the filing of this Form N-CSR, the principal executive officer and principal financial officer of CGM Trust have concluded that the CGM Trust’s disclosure controls and procedures are effective to provide reasonable assurance that information required
to be disclosed by the CGM Trust on Form N-CSR is recorded, processed, summarized and reported within the time periods specified in Securities and Exchange Commission rules and forms.
(b) There were no changes in CGM Trust’s internal control over financial reporting (as defined in Rule 30a-3(d) under the Act) that occurred during the CGM Trust’s period covered by this report that has materially affected, or is reasonably likely to materially affect, the CGM Trust's internal control over financial reporting.
ITEM 12. EXHIBITS.
(a)(1) Code of ethics described in Item 2 is attached hereto as EX99_CODE.
(a)(2) Certifications for each principal executive officer and principal financial officer of the registrant as required by Rule 30a-2(a) under the Investment Company Act of 1940 are attached hereto as EX99_CERT.
(b) Certifications for each principal executive officer and principal financial officer of the registrant as required by Rule 30a-2(b) under the Investment Company Act of 1940 are attached hereto as EX99_906CERT.
SIGNATURES
Pursuant to the requirements of the Securities Exchange Act of 1934 and the Investment Company Act of 1940, the Registrant has duly caused this report to be signed on its behalf by the undersigned, thereunto duly authorized.
CGM Trust
By: /S/David C. Fietze
David C. Fietze
President
Principal Executive Officer
Date: February 18, 2022
Pursuant to the requirements of the Securities Exchange Act of 1934 and the Investment Company Act of 1940, this report has been signed below by the following persons on behalf of the Registrant and in the capacities and on the dates indicated.
By: /S/ David C. Fietze
David C. Fietze
President
Principal Executive Officer
Date: February 18, 2022
By: /S/ Deidra Hewardt
Deidra Hewardt
Treasurer
Principal Financial Officer
Date: February 18, 2022