UNITED STATES
SECURITIES AND EXCHANGE COMMISSION
Washington, D.C. 20549
FORM N-CSR
CERTIFIED SHAREHOLDER REPORT OF REGISTERED
MANAGEMENT INVESTMENT COMPANIES
Investment Company Act File Number: 811-02145
LORD ABBETT BOND-DEBENTURE FUND, INC.
(Exact name of Registrant as specified in charter)
90 Hudson Street, Jersey City, NJ 07302
(Address of principal executive offices) (Zip code)
Thomas R. Phillips, Esq., Vice President & Assistant Secretary
90 Hudson Street, Jersey City, NJ 07302
(Name and address of agent for service)
Registrant’s telephone number, including area code: (800) 201-6984
Date of fiscal year end: 12/31
Date of reporting period: 12/31/2010
| Item 1: | Report(s) to Shareholders. |
2010
LORD ABBETT
ANNUAL
REPORT 
Lord Abbett
Bond Debenture Fund
For the fiscal year ended December 31, 2010

Lord Abbett Bond Debenture Fund
Annual Report
For the fiscal year ended December 31, 2010

From left to right: Robert S. Dow, Director and Chairman of the Lord Abbett Funds; E. Thayer Bigelow, Independent Lead Director of the Lord Abbett Funds; and Daria L. Foster, Director and President of the Lord Abbett Funds.
Dear Shareholders: We are pleased to provide you with this overview of the performance of the Lord Abbett Bond Debenture Fund for the fiscal year ended December 31, 2010. On this page and the following pages, we discuss the major factors that influenced performance. For detailed and more timely information about the Fund, please visit our Website at www.lordabbett.com, where you also can access the quarterly commentaries by the Fund’s portfolio manager.
Thank you for investing in Lord Abbett mutual funds. We value the trust that you place in us and look forward to serving your investment needs in the years to come.
Best Regards,

Robert S. Dow
Chairman
For the fiscal year ended December 31, 2010, the Fund returned 12.94%, reflecting performance at the net asset value (NAV) of Class A shares, with all distributions reinvested, compared to its benchmark, the Barclays Capital U.S. Aggregate Bond Index,1 which returned 6.54% over the same period.
Many fixed-income categories posted positive returns during the year, and corporate credit assets, including convertible securities, lower-rated investment-grade bonds, high-yield bonds, and floating-rate loans, led the way. Historically low interest rates and strong investor demand created a positive environment for corporate credit during the year, as many companies were able to refinance existing debt, extend upcoming bond maturities, or otherwise enhance their financial flexibility. Amid these conditions, default rates on high-yield bonds and floating-rate loans dropped to historically low levels of about 1% and 2%, respectively, at the end of the year.
The most significant factor contributing to the Fund’s performance was an increase
1
in exposure to credit-sensitive assets such as high-yield corporates and convertible securities, as well as maintaining little to no allocation to more rate-sensitive holdings such as Treasuries and agency mortgage-backed securities (MBS). The bond market’s rally during the 12-month period was led by lower-rated credits, thus the portfolio benefited from increased positions in lower-quality credits. At the industry level, among the industries contributing the most to Fund performance were automobile parts and equipment, banking, and energy/exploration and production.
Among the industries detracting from Fund performance was electric-generation. The returns within household and leisure products and transportation (excluding air/rail), although positive, also were among the lowest. These higher-quality industries did not advance to the extent of the broader market, as lower-quality credits outperformed.
The Fund’s portfolio is actively managed and, therefore, its holdings and the weightings of a particular issuer or particular sector as a percentage of portfolio assets are subject to change. Sectors may include many industries.
1 The Barclays Capital U.S. Aggregate Bond Index represents securities that are U.S. domestic, taxable, nonconvertible, and dollar denominated. The index covers the investment-grade, fixed-rate bond market, with index components for government and corporate securities, mortgage pass-through securities, and asset-backed securities.
Unless otherwise specified, the index reflects total return, with all dividends reinvested. The index is unmanaged, does not reflect the deduction of fees or expenses, and is not available for direct investment.
Important Performance and Other Information
Performance data quoted in the following pages reflect past performance and are no guarantee of future results. Current performance may be higher or lower than the performance quoted. The investment return and principal value of an investment in the Fund will fluctuate so that shares, on any given day or when redeemed, may be worth more or less than their original cost. You can obtain performance data current to the most recent month end by calling Lord Abbett at 888-522-2388 or referring to www.lordabbett.com.
Except where noted, comparative Fund performance does not account for the deduction of sales charges and would be different if sales charges were included. The Fund offers several classes of shares with distinct pricing options. For a full description of the differences in pricing alternatives, please see the Fund’s prospectus.
The views of the Fund’s management and the portfolio holdings described above are as of December 31, 2010; these views and portfolio holdings may have changed subsequent to this date, and they do not guarantee the future performance of the markets or the Fund. Information provided in this report should not be considered a recommendation to purchase or sell securities.
A Note about Risk: See “Notes to Financial Statements” for a discussion of investment risks. For a more detailed discussion of the risks associated with the Fund, please see the Fund’s prospectus.
Mutual funds are not insured by the FDIC, are not deposits or other obligations of, or guaranteed by, banks, and are subject to investment risks including possible loss of principal amount invested.
2
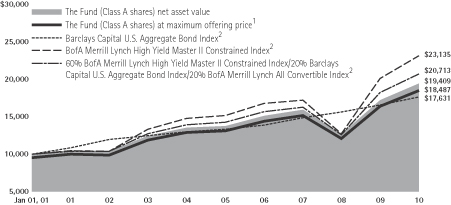
Investment Comparison
Below is a comparison of a $10,000 investment in Class A shares with the same investment in the Barclays Capital U.S. Aggregate Bond Index, the BofA Merrill Lynch High Yield Master II Constrained Index, and the 60% BofA Merrill Lynch High Yield Master II Constrained Index/20% Barclays Capital U.S. Aggregate Bond Index/20% BofA Merrill Lynch All Convertible Index, assuming reinvestment of all dividends and distributions. The performance of other classes will be greater than or less than the performance shown in the graph below due to different sales loads and expenses applicable to such classes. The graph and performance table below do not reflect the deduction of taxes that a shareholder would pay on Fund distributions or the redemption of Fund shares. Past performance is no guarantee of future results.
Average Annual Total Returns at Maximum Applicable
Sales Charge for the Periods Ended December 31, 2010
| 1 Year | 5 Years | 10 Years | Life of Class | |||||||||||||
Class A3 | 7.53% | 6.09% | 6.34% | – | ||||||||||||
Class B4 | 8.16% | 6.27% | 6.31% | – | ||||||||||||
Class C5 | 12.34% | 6.44% | 6.18% | – | ||||||||||||
Class F6 | 13.24% | – | – | 6.35% | ||||||||||||
Class I7 | 13.40% | 7.48% | 7.24% | – | ||||||||||||
Class P7 | 12.73% | 7.02% | 6.75% | – | ||||||||||||
Class R28 | 12.63% | – | – | 5.86% | ||||||||||||
Class R39 | 12.83% | – | – | 5.98% | ||||||||||||
1 Reflects the deduction of the maximum initial sales charge of 4.75%.
2 Performance of each unmanaged index does not reflect any fees or expenses. The performance of each index is not necessarily representative of the Fund’s performance.
3 Total return, which is the percentage change in net asset value, after deduction of the maximum initial sales charge of 4.75% applicable to Class A shares, with all dividends and distributions reinvested for the periods shown ended December 31, 2010, is calculated using the SEC-required uniform method to compute such return.
4 Performance reflects the deduction of a CDSC of 4% for 1 year, 1% for 5 years and 0% for 10 years. Class B shares automatically convert to Class A shares after approximately 8 years. (There is no initial sales charge for automatic conversions.) All returns for periods greater than 8 years reflect this conversion.
5 The 1% CDSC for Class C shares normally applies before the first anniversary of the purchase date. Performance is at net asset value.
6 Class F shares commenced operations on September 7, 2007 and performance for the Class began on September 28, 2007. Performance is at net asset value.
7 Performance is at net asset value.
8 Class R2 shares commenced operations on September 7, 2007 and performance for the Class began on September 28, 2007. Performance is at net asset value.
9 Class R3 shares commenced operations on September 7, 2007 and performance for the Class began on September 28, 2007. Performance is at net asset value.
3
Expense Example
As a shareholder of the Fund, you incur two types of costs: (1) transaction costs, including sales charges (loads) on purchase payments (these charges vary among the share classes); and (2) ongoing costs, including management fees; distribution and service (12b-1) fees (these charges vary among the share classes); and other Fund expenses. This Example is intended to help you understand your ongoing costs (in dollars) of investing in the Fund and to compare these costs with the ongoing costs of investing in other mutual funds.
The Example is based on an investment of $1,000 invested at the beginning of the period and held for the entire period (July 1, 2010 through December 31, 2010).
Actual Expenses
For each class of the Fund, the first line of the table on the following page provides information about actual account values and actual expenses. You may use the information in this line, together with the amount you invested, to estimate the expenses that you paid over the period. Simply divide your account value by $1,000 (for example, an $8,600 account value divided by $1,000 = 8.6), then multiply the result by the number in the first line under the heading titled “Expenses Paid During the Period 7/1/10 – 12/31/10” to estimate the expenses you paid on your account during this period.
Hypothetical Example for Comparison Purposes
For each class of the Fund, the second line of the table on the following page provides information about hypothetical account values and hypothetical expenses based on the Fund’s actual expense ratio and an assumed rate of return of 5% per year before expenses, which is not the Fund’s actual return. The hypothetical account values and expenses may not be used to estimate the actual ending account balance or expenses you paid for the period. You may use this information to compare the ongoing costs of investing in the Fund and other funds. To do so, compare this 5% hypothetical example with the 5% hypothetical examples that appear in the shareholder reports of the other funds.
4
Please note that the expenses shown in the table are meant to highlight your ongoing costs only and do not reflect any transactional costs, such as sales charges (loads). Therefore, the second line of the table is useful in comparing ongoing costs only, and will not help you determine the relative total costs of owning different funds. In addition, if these transactional costs were included, your costs would have been higher.
| Beginning Account Value | Ending Account Value | Expenses Paid During Period† | ||||||||||
| 7/1/10 | 12/31/10 | 7/1/10 - 12/31/10 | ||||||||||
Class A | ||||||||||||
Actual | $ | 1,000.00 | $ | 1,102.40 | $ | 5.14 | ||||||
Hypothetical (5% Return Before Expenses) | $ | 1,000.00 | $ | 1,020.33 | $ | 4.94 | ||||||
Class B | �� | |||||||||||
Actual | $ | 1,000.00 | $ | 1,098.40 | $ | 8.57 | ||||||
Hypothetical (5% Return Before Expenses) | $ | 1,000.00 | $ | 1,017.04 | $ | 8.24 | ||||||
Class C | ||||||||||||
Actual | $ | 1,000.00 | $ | 1,098.50 | $ | 8.57 | ||||||
Hypothetical (5% Return Before Expenses) | $ | 1,000.00 | $ | 1,017.04 | $ | 8.24 | ||||||
Class F | ||||||||||||
Actual | $ | 1,000.00 | $ | 1,104.00 | $ | 3.82 | ||||||
Hypothetical (5% Return Before Expenses) | $ | 1,000.00 | $ | 1,021.59 | $ | 3.67 | ||||||
Class I | ||||||||||||
Actual | $ | 1,000.00 | $ | 1,103.40 | $ | 3.29 | ||||||
Hypothetical (5% Return Before Expenses) | $ | 1,000.00 | $ | 1,022.09 | $ | 3.16 | ||||||
Class P | ||||||||||||
Actual | $ | 1,000.00 | $ | 1,101.40 | $ | 5.67 | ||||||
Hypothetical (5% Return Before Expenses) | $ | 1,000.00 | $ | 1,019.82 | $ | 5.45 | ||||||
Class R2 | ||||||||||||
Actual | $ | 1,000.00 | $ | 1,101.00 | $ | 6.46 | ||||||
Hypothetical (5% Return Before Expenses) | $ | 1,000.00 | $ | 1,019.07 | $ | 6.21 | ||||||
Class R3 | ||||||||||||
Actual | $ | 1,000.00 | $ | 1,101.80 | $ | 5.93 | ||||||
Hypothetical (5% Return Before Expenses) | $ | 1,000.00 | $ | 1,019.57 | $ | 5.70 | ||||||
| † | For each class of the Fund, net expenses are equal to the annualized expense ratio for such class (0.97% for Class A, 1.62% for Classes B and C, 0.72% for Class F, 0.62% for Class I, 1.07% for Class P, 1.22% for Class R2 and 1.12% for Class R3) multiplied by the average account value over the period, multiplied by 184/365 (to reflect one-half year period). |
Portfolio Holdings Presented by Sector
December 31, 2010
| Sector* | %** | Sector* | %** | |||||||||
Agency | 0.22% | Insurance | 1.79% | |||||||||
Automotive | 3.92% | Local-Authority | 0.19% | |||||||||
Banking | 4.65% | Media | 7.79% | |||||||||
Basic Industry | 9.62% | Municipal | 0.25% | |||||||||
Capital Goods | 8.97% | Real Estate | 1.36% | |||||||||
Consumer Cyclical | 4.64% | Services | 11.04% | |||||||||
Consumer Discretionary | 0.06% | Technology & Electronics | 6.52% | |||||||||
Consumer Non-Cyclical | 3.46% | Telecommunications | 7.54% | |||||||||
Energy | 11.42% | Utility | 2.93% | |||||||||
Financial Services | 4.19% | Short-Term Investment | 0.84% | |||||||||
Healthcare | 8.60% | Total | 100.00% | |||||||||
| * | A sector may comprise several industries. |
| ** | Represents percent of total investments. |
5
Schedule of Investments
December 31, 2010
| Investments | Shares (000) | Value | ||||||
| LONG-TERM INVESTMENTS 98.21% | ||||||||
| COMMON STOCKS 4.73% | ||||||||
| Aerospace & Defense 0.13% | ||||||||
| Hexcel Corp.* | 250 | $ | 4,522,500 | |||||
| SAIC, Inc.* | 400 | 6,344,000 | ||||||
| Total | 10,866,500 | |||||||
| Auto Parts & Equipment 0.42% | ||||||||
| Cooper-Standard Holdings, Inc.* | 111 | 5,003,955 | ||||||
| Cooper-Standard Holdings, Inc.*(a) | 642 | 28,878,300 | ||||||
| Total | 33,882,255 | |||||||
| Automakers 0.04% | ||||||||
| Oshkosh Corp.* | 100 | 3,524,000 | ||||||
| Banking 0.16% | ||||||||
| Bank of America Corp. | 300 | 4,002,000 | ||||||
| CIT Group, Inc.* | 124 | 5,821,890 | ||||||
| Fifth Third Bancorp | 200 | 2,936,000 | ||||||
| Total | 12,759,890 | |||||||
| Chemicals 0.23% | ||||||||
| LyondellBasell Industries NV Class A (Netherlands)*(b) | 353 | 12,126,000 | ||||||
| Rockwood Holdings, Inc.* | 135 | 5,281,200 | ||||||
| TPC Group, Inc.* | 35 | 1,067,628 | ||||||
| Total | 18,474,828 | |||||||
| Diversified Capital Goods 0.34% | ||||||||
| Emerson Electric Co. | 350 | 20,009,500 | ||||||
| Pall Corp. | 150 | 7,437,000 | ||||||
| Total | 27,446,500 | |||||||
| Electronics 0.03% | ||||||||
| Micron Technology, Inc.* | 350 | 2,807,000 | ||||||
| Energy: Exploration & Production 0.45% | ||||||||
| Continental Resources, Inc.* | 150 | 8,827,500 | ||||||
| Devon Energy Corp. | 100 | 7,851,000 | ||||||
| Whiting Petroleum Corp.* | 168 | 19,712,764 | ||||||
| Total | 36,391,264 | |||||||
See Notes to Financial Statements.
6
Schedule of Investments (continued)
December 31, 2010
| Investments | Shares (000) | Value | ||||||
| Food & Drug Retailers 0.09% | ||||||||
| Ingles Markets, Inc. Class A | 185 | $ | 3,552,000 | |||||
| SUPERVALU, INC. | 350 | 3,370,500 | ||||||
| Total | 6,922,500 | |||||||
| Forestry/Paper 0.35% | ||||||||
| Smurfit-Stone Container Corp.* | 1,100 | 28,160,000 | ||||||
| Integrated Energy 0.30% | ||||||||
| ConocoPhillips | 350 | 23,835,000 | ||||||
| Life Insurance 0.22% | ||||||||
| MetLife, Inc. | 400 | 17,776,000 | ||||||
| Media: Cable 0.64% | ||||||||
| Charter Communications, Inc. Class A*(c) | 1,320 | 51,400,800 | ||||||
| Media: Services 0.14% | ||||||||
| Omnicom Group, Inc. | 250 | 11,450,000 | ||||||
| Pharmaceuticals 0.70% | ||||||||
| Celgene Corp.* | 200 | 11,828,000 | ||||||
| Gilead Sciences, Inc.* | 150 | 5,436,000 | ||||||
| Mylan, Inc.* | 1,581 | 33,402,219 | ||||||
| Pfizer, Inc. | 300 | 5,253,000 | ||||||
| Total | 55,919,219 | |||||||
| Railroads 0.23% | ||||||||
| Union Pacific Corp. | 200 | 18,532,000 | ||||||
| Software/Services 0.22% | ||||||||
| Adobe Systems, Inc.* | 220 | 6,771,600 | ||||||
| Microsoft Corp. | 250 | 6,980,000 | ||||||
| Nuance Communications, Inc.* | 200 | 3,636,000 | ||||||
| Total | 17,387,600 | |||||||
| Support: Services 0.04% | ||||||||
| CRA International, Inc.* | 130 | 3,056,300 | ||||||
| Total Common Stocks (cost $283,435,165) | 380,591,656 | |||||||
See Notes to Financial Statements.
7
Schedule of Investments (continued)
December 31, 2010
| Investments | Interest Rate | Maturity Date | Principal Amount (000) | Value | ||||||||||||
| CONVERTIBLE BONDS 8.57% | ||||||||||||||||
| Airlines 0.27% | ||||||||||||||||
| AMR Corp. | 6.25% | 10/15/2014 | $ | 5,800 | $ | 6,597,500 | ||||||||||
| United Continental Holdings, Inc. | 4.50% | 6/30/2021 | 15,000 | 15,262,500 | ||||||||||||
| Total | 21,860,000 | |||||||||||||||
| Automakers 0.40% | ||||||||||||||||
| Ford Motor Co. | 4.25% | 11/15/2016 | 16,050 | 32,160,187 | ||||||||||||
| Beverages 0.16% | ||||||||||||||||
| Central European Distribution Corp. (Poland)(b) | 3.00% | 3/15/2013 | 14,033 | 13,085,773 | ||||||||||||
| Brokerage 0.07% | ||||||||||||||||
| Jefferies Group, Inc. | 3.875% | 11/1/2029 | 5,000 | 5,268,750 | ||||||||||||
| Building & Construction 0.05% | ||||||||||||||||
| Lennar Corp.† | 2.75% | 12/15/2020 | 4,000 | 4,390,000 | ||||||||||||
| Computer Hardware 0.43% | ||||||||||||||||
| Intel Corp. | 2.95% | 12/15/2035 | 20,000 | 20,025,000 | ||||||||||||
| SanDisk Corp. | 1.00% | 5/15/2013 | 15,100 | 14,609,250 | ||||||||||||
| Total | 34,634,250 | |||||||||||||||
| Diversified Capital Goods 0.30% | ||||||||||||||||
| General Cable Corp. (2.25% after 11/15/19)~ | 4.50% | 11/15/2029 | 11,150 | 13,310,313 | ||||||||||||
| Ingersoll-Rand Co., Ltd. | 4.50% | 4/15/2012 | 4,000 | 10,630,000 | ||||||||||||
| Total | 23,940,313 | |||||||||||||||
| Electronics 0.23% | ||||||||||||||||
| Itron, Inc. | 2.50% | 8/1/2026 | 17,500 | 18,506,250 | ||||||||||||
| Health Services 0.50% | ||||||||||||||||
| Human Genome Sciences, Inc. | 2.25% | 8/15/2012 | 1,000 | 1,522,500 | ||||||||||||
| Human Genome Sciences, Inc. | 2.25% | 10/15/2011 | 15,000 | 24,018,750 | ||||||||||||
| Incyte Corp. | 4.75% | 10/1/2015 | 3,000 | 6,243,750 | ||||||||||||
| Omnicare, Inc. | 3.75% | 12/15/2025 | 7,500 | 8,400,000 | ||||||||||||
| Total | 40,185,000 | |||||||||||||||
| Integrated Energy 0.24% | ||||||||||||||||
| SunPower Corp. | 4.75% | 4/15/2014 | 10,000 | 9,262,500 | ||||||||||||
| Suntech Power Holdings Co., Ltd. (China)(b) | 3.00% | 3/15/2013 | 11,250 | 9,914,063 | ||||||||||||
| Total | 19,176,563 | |||||||||||||||
See Notes to Financial Statements.
8
Schedule of Investments (continued)
December 31, 2010
| Investments | Interest Rate | Maturity Date | Principal Amount (000) | Value | ||||||||||||
| Media: Broadcast 0.26% | ||||||||||||||||
| Sinclair Broadcast Group, Inc. | 6.00% | 9/15/2012 | $ | 21,045 | $ | 20,966,081 | ||||||||||
| Media: Diversified 0.39% | ||||||||||||||||
| Liberty Media LLC (convertible into Viacom, Inc., Class B and CBS Corp.) | 3.25% | 3/15/2031 | 45,000 | 31,050,000 | ||||||||||||
| Media: Services 0.09% | ||||||||||||||||
| Omnicom Group, Inc. | Zero Coupon | 7/1/2038 | 7,000 | 7,446,250 | ||||||||||||
| Medical Products 0.68% | ||||||||||||||||
| Allergan, Inc. | 1.50% | 4/1/2026 | 8,500 | 9,647,500 | ||||||||||||
| Fisher Scientific International, Inc. | 3.25% | 3/1/2024 | 8,425 | 11,805,531 | ||||||||||||
| Life Technologies Corp. | 1.50% | 2/15/2024 | 20,000 | 24,250,000 | ||||||||||||
| Medtronic, Inc. | 1.625% | 4/15/2013 | 8,500 | 8,595,625 | ||||||||||||
| Total | 54,298,656 | |||||||||||||||
| Metals/Mining (Excluding Steel) 0.48% | ||||||||||||||||
| Newmont Mining Corp. | 1.25% | 7/15/2014 | 20,000 | 28,775,000 | ||||||||||||
| Newmont Mining Corp. | 3.00% | 2/15/2012 | 5,000 | 6,981,250 | ||||||||||||
| Patriot Coal Corp. | 3.25% | 5/31/2013 | 3,000 | 2,846,250 | ||||||||||||
| Total | 38,602,500 | |||||||||||||||
| Monoline Insurance 0.13% | ||||||||||||||||
| Radian Group, Inc. | 3.00% | 11/15/2017 | 10,800 | 10,624,500 | ||||||||||||
| Oil Field Equipment & Services 0.12% | ||||||||||||||||
| Exterran Energy Corp. | 4.75% | 1/15/2014 | 10,000 | 9,925,000 | ||||||||||||
| Packaging 0.21% | ||||||||||||||||
| Owens-Brockway Glass Container, Inc.† | 3.00% | 6/1/2015 | 16,375 | 16,559,219 | ||||||||||||
| Pharmaceuticals 1.08% | ||||||||||||||||
| Cephalon, Inc. | 2.00% | 6/1/2015 | 3,150 | 4,437,562 | ||||||||||||
| Gilead Sciences, Inc. | 0.625% | 5/1/2013 | 21,000 | 23,257,500 | ||||||||||||
| Salix Pharmaceuticals Ltd. | 2.75% | 5/15/2015 | 4,000 | 5,115,000 | ||||||||||||
| Teva Pharmaceutical Finance Co. BV (Israel)(b) | 1.75% | 2/1/2026 | 35,000 | 38,543,750 | ||||||||||||
| Vertex Pharmaceuticals, Inc. | 3.35% | 10/1/2015 | 15,000 | 15,243,750 | ||||||||||||
| Total | 86,597,562 | |||||||||||||||
See Notes to Financial Statements.
9
Schedule of Investments (continued)
December 31, 2010
| Investments | Interest Rate | Maturity Date | Principal Amount (000) | Value | ||||||||||||
| Software/Services 1.36% | ||||||||||||||||
| Alliance Data Systems Corp. | 1.75% | 8/1/2013 | $ | 8,500 | $ | 9,158,750 | ||||||||||
| Blackboard, Inc. | 3.25% | 7/1/2027 | 12,500 | 12,765,625 | ||||||||||||
| EMC Corp. | 1.75% | 12/1/2011 | 20,000 | 29,025,000 | ||||||||||||
| GSI Commerce, Inc. | 2.50% | 6/1/2027 | 5,000 | 5,456,250 | ||||||||||||
| Informatica Corp. | 3.00% | 3/15/2026 | 11,000 | 24,186,250 | ||||||||||||
| Nuance Communications, Inc. | 2.75% | 8/15/2027 | 2,775 | 3,271,031 | ||||||||||||
| Symantec Corp. | 1.00% | 6/15/2013 | 20,775 | 23,709,469 | ||||||||||||
| Xilinx, Inc.† | 2.625% | 6/15/2017 | 1,700 | 2,001,750 | ||||||||||||
| Total | 109,574,125 | |||||||||||||||
| Support: Services 0.10% | ||||||||||||||||
| CRA International, Inc. | 2.875% | 6/15/2034 | 7,560 | 7,947,450 | ||||||||||||
| Telecommunications Equipment 0.43% | ||||||||||||||||
| Ciena Corp.† | 3.75% | 10/15/2018 | 3,500 | 4,383,750 | ||||||||||||
| JDS Uniphase Corp. | 1.00% | 5/15/2026 | 32,000 | 30,480,000 | ||||||||||||
| Total | 34,863,750 | |||||||||||||||
| Telecommunications: Wireless 0.59% | ||||||||||||||||
| SBA Communications Corp. | 4.00% | 10/1/2014 | 32,000 | 47,680,000 | ||||||||||||
| Total Convertible Bonds (cost $618,830,319) | 689,342,179 | |||||||||||||||
Shares | ||||||||||||||||
| CONVERTIBLE PREFERRED STOCKS 4.04% | ||||||||||||||||
| Agency/Government Related 0.00% | ||||||||||||||||
| Fannie Mae | 8.75% | 450 | 225,000 | |||||||||||||
| Auto Parts & Equipment 0.05% | ||||||||||||||||
| Cooper-Standard Holdings, Inc. PIK(a) | 7.00% | 22 | 4,101,820 | |||||||||||||
| Automobiles 0.16% | ||||||||||||||||
| General Motors Co. | 4.75% | 238 | 12,856,536 | |||||||||||||
| Banking 1.58% | ||||||||||||||||
| Bank of America Corp. | 7.25% | 44 | 41,628,195 | |||||||||||||
| Citigroup, Inc. | 7.50% | 335 | 45,791,150 | |||||||||||||
| Wells Fargo & Co. | 7.50% | 40 | 40,022,000 | |||||||||||||
| Total | 127,441,345 | |||||||||||||||
See Notes to Financial Statements.
10
Schedule of Investments (continued)
December 31, 2010
| Investments | Interest Rate | Shares (000) | Value | |||||||||||||
| Energy: Exploration & Production 0.53% | ||||||||||||||||
| Apache Corp. | 6.00% | 635 | $ | 42,075,100 | ||||||||||||
| Whiting Petroleum Corp. | 6.25% | 2 | 549,902 | |||||||||||||
| Total | 42,625,002 | |||||||||||||||
| Food: Wholesale 0.45% | ||||||||||||||||
| Archer Daniels Midland Co. | 6.25% | 500 | 19,415,000 | |||||||||||||
| Bunge Ltd. | 4.875% | 180 | 16,762,500 | |||||||||||||
| Total | 36,177,500 | |||||||||||||||
| Gas Distribution 0.76% | ||||||||||||||||
| El Paso Corp. | 4.99% | 23 | 26,588,900 | |||||||||||||
| Williams Cos., Inc. (The) | 5.50% | 300 | 34,218,750 | |||||||||||||
| Total | 60,807,650 | |||||||||||||||
| Investments & Miscellaneous Financial Services 0.28% | ||||||||||||||||
| AMG Capital Trust I | 5.10% | 450 | 22,584,375 | |||||||||||||
| Multi-Line Insurance 0.08% | ||||||||||||||||
| Hartford Financial Services Group, Inc. (The) | 7.25% | 250 | 6,402,500 | |||||||||||||
| Railroads 0.15% | ||||||||||||||||
| Kansas City Southern | 5.125% | 8 | 12,001,875 | |||||||||||||
| Total Convertible Preferred Stocks (cost $293,992,549) | 325,223,603 | |||||||||||||||
Maturity | Principal Amount (000) | |||||||||||||||
| FLOATING RATE LOANS(d) 2.98% | ||||||||||||||||
| Aerospace/Defense 0.13% | ||||||||||||||||
| Hawker Beechcraft Acquisition Co. LLC Letter of Credit Facility Deposits | 2.289% | 3/26/2014 | $ | 646 | 567,223 | |||||||||||
| Hawker Beechcraft Acquisition Co. LLC Term Loan | 2.261% - 2.303% | 3/26/2014 | 10,773 | 9,463,170 | ||||||||||||
| Total | 10,030,393 | |||||||||||||||
| Automakers 0.12% | ||||||||||||||||
| Ford Motor Co. Term Loan B1 | 3.02% - 3.04% | 12/16/2013 | 9,154 | 9,130,032 | ||||||||||||
See Notes to Financial Statements.
11
Schedule of Investments (continued)
December 31, 2010
| Investments | Interest Rate | Maturity Date | Principal Amount (000) | Value | ||||||||||||
| Consumer/Commercial/Lease Financing 0.13% | ||||||||||||||||
| American General Finance Corp. Term Loan B | 7.25% | 4/21/2015 | $ | 10,000 | $ | 10,153,130 | ||||||||||
| Department Stores 0.12% | ||||||||||||||||
| Neiman-Marcus Group, Inc. (The) Term Loan B1 | 2.303% | 4/6/2013 | 10,062 | 9,893,190 | ||||||||||||
| Electric: Generation 0.17% | ||||||||||||||||
| Texas Competitive Electric Holdings Co. LLC Term Loan B2 | 3.764% | 10/10/2014 | 16,973 | 13,147,174 | ||||||||||||
| Forestry/Paper 0.08% | ||||||||||||||||
| Smurfit-Stone Container Enterprises Inc. Exit Term Loan B | 6.75% | 7/15/2016 | 6,468 | 6,585,532 | ||||||||||||
| Gaming 0.11% | ||||||||||||||||
| Caesars Entertainment Operating Company Term Loan B1 | 3.288% | 1/28/2015 | 10,000 | 9,055,470 | ||||||||||||
| Health Facilities 0.39% | ||||||||||||||||
| Community Health Systems, Inc. Non Extended Delayed Draw Term Loan | 2.544% | 7/25/2014 | 477 | 465,517 | ||||||||||||
| Community Health Systems, Inc. Non Extended Term Loan | 2.544% | 7/25/2014 | 9,255 | 9,038,947 | ||||||||||||
| HCA, Inc. Extended Term Loan B2 | 3.553% | 3/31/2017 | 7,057 | 7,055,797 | ||||||||||||
| HCA, Inc. Term Loan B | 2.553% | 11/18/2013 | 15,107 | 14,978,367 | ||||||||||||
| Total | 31,538,628 | |||||||||||||||
| Insurance Brokerage 0.10% | ||||||||||||||||
| USI Holdings Corp. Incremental Term Loan | 7.00% | 5/5/2014 | 7,900 | 7,821,000 | ||||||||||||
| Investments & Miscellaneous Financial Services 0.49% | ||||||||||||||||
| Nuveen Investments, Inc. 1st Lien Term Loan | 3.288% - 3.303% | 11/13/2014 | 11,509 | 10,972,793 | ||||||||||||
| Nuveen Investments, Inc. 2nd Lien Term Loan | 12.50% | 7/31/2015 | 13,800 | 14,964,375 | ||||||||||||
| Nuveen Investments, Inc. Extended Term Loan | 5.784% - 5.803% | 5/12/2017 | 13,447 | 13,447,234 | ||||||||||||
| Total | 39,384,402 | |||||||||||||||
See Notes to Financial Statements.
12
Schedule of Investments (continued)
December 31, 2010
| Investments | Interest Rate | Maturity Date | Principal Amount (000) | Value | ||||||||||||
| Machinery 0.20% | ||||||||||||||||
| Baldor Electric Co. Term Loan B | 5.25% | 1/31/2014 | $ | 8,847 | $ | 8,870,830 | ||||||||||
| Veyance Technologies, Inc. 2nd Lien Term Loan | 6.011% | 7/13/2015 | 9,000 | 7,447,500 | ||||||||||||
| Total | 16,318,330 | |||||||||||||||
| Media: Broadcast 0.42% | ||||||||||||||||
| Clear Channel Communication Term Loan B | 3.903% | 1/28/2016 | 10,000 | 8,598,210 | ||||||||||||
| FoxCo Acquisition Sub LLC Term Loan | 7.50% | 7/14/2015 | 7,902 | 7,857,850 | ||||||||||||
| Univision Communications, Inc. Extended First Lien Term Loan | 4.511% | 3/31/2017 | 10,252 | 9,765,202 | ||||||||||||
| Univision Communications, Inc. Initial Term Loan | 2.511% | 9/29/2014 | 8,145 | 7,797,608 | ||||||||||||
| Total | 34,018,870 | |||||||||||||||
| Pharmaceuticals 0.02% | ||||||||||||||||
| Mylan Laboratories, Inc. Term Loan B | 3.563% | 10/2/2014 | 1,809 | 1,817,044 | ||||||||||||
| Restaurants 0.08% | ||||||||||||||||
| Dunkin’ Brands, Inc. Term Loan B | 5.75% | 11/23/2017 | 6,500 | 6,586,073 | ||||||||||||
| Software/Services 0.19% | ||||||||||||||||
| Nuance Communications, Inc. Incremental Term Loan | 2.02% | 3/29/2013 | 5,969 | 5,905,651 | ||||||||||||
| Nuance Communications, Inc. Term Loan | 2.02% | 3/29/2013 | 3,979 | 3,936,834 | ||||||||||||
| Syniverse Technologies, Inc. Term Loan B | 5.25% | 12/21/2017 | 5,000 | 5,068,750 | ||||||||||||
| Total | 14,911,235 | |||||||||||||||
| Specialty Retail 0.11% | ||||||||||||||||
| Michaels Stores, Inc. Term Loan B1 | 2.563% | 10/31/2013 | 3,909 | 3,813,480 | ||||||||||||
| Michaels Stores, Inc. Term Loan B2 | 4.813% | 7/31/2016 | 5,260 | 5,267,964 | ||||||||||||
| Total | 9,081,444 | |||||||||||||||
| Support: Services 0.12% | ||||||||||||||||
| Brickman Group Holdings, Inc. New Term Loan B | 7.25% | 10/14/2016 | 9,600 | 9,736,003 | ||||||||||||
| Total Floating Rate Loans (cost $231,619,551) | 239,207,950 | |||||||||||||||
| FOREIGN BONDS(e) 0.30% | ||||||||||||||||
| Netherlands 0.12% | ||||||||||||||||
| Ziggo Bond Co. BV† | 8.00% | 5/15/2018 | EUR | 6,750 | 9,335,725 | |||||||||||
See Notes to Financial Statements.
13
Schedule of Investments (continued)
December 31, 2010
| Investments | Interest Rate | Maturity Date | Principal Amount (000) | Value | ||||||||||||
| United Kingdom 0.18% | ||||||||||||||||
| R&R Ice Cream Ltd.† | 8.375% | 11/15/2017 | EUR | 10,400 | $ | 14,592,743 | ||||||||||
| Total Foreign Bonds (cost $23,549,777) | 23,928,468 | |||||||||||||||
| GOVERNMENT SPONSORED ENTERPRISES PASS-THROUGH 0.21% | ||||||||||||||||
| Federal National Mortgage Assoc. (cost $16,917,417) | 4.50% | 2/1/2039 | $ | 16,685 | 17,147,668 | |||||||||||
| HIGH YIELD CORPORATE BONDS 76.92% | ||||||||||||||||
| Aerospace/Defense 1.03% | ||||||||||||||||
| Alliant Techsystems, Inc. | 6.875% | 9/15/2020 | 3,500 | 3,618,125 | ||||||||||||
| Esterline Technologies Corp. | 6.625% | 3/1/2017 | 8,000 | 8,120,000 | ||||||||||||
| Esterline Technologies Corp.† | 7.00% | 8/1/2020 | 9,100 | 9,418,500 | ||||||||||||
| Mantech International Corp. | 7.25% | 4/15/2018 | 15,000 | 15,750,000 | ||||||||||||
| Moog, Inc. | 6.25% | 1/15/2015 | 10,750 | 10,911,250 | ||||||||||||
| Spirit Aerosystems, Inc.† | 6.75% | 12/15/2020 | 15,650 | 15,728,250 | ||||||||||||
| Spirit Aerosystems, Inc. | 7.50% | 10/1/2017 | 7,575 | 7,915,875 | ||||||||||||
| Triumph Group, Inc. | 8.00% | 11/15/2017 | 10,820 | 11,306,900 | ||||||||||||
| Total | 82,768,900 | |||||||||||||||
| Airlines 0.56% | ||||||||||||||||
| Delta Air Lines, Inc. | 4.95% | 5/23/2019 | 3,700 | 3,713,875 | ||||||||||||
| Delta Air Lines, Inc.† | 9.50% | 9/15/2014 | 3,953 | 4,323,594 | ||||||||||||
| United Airlines, Inc. | 6.636% | 7/2/2022 | 8,124 | 8,144,013 | ||||||||||||
| United Airlines, Inc.† | 9.875% | 8/1/2013 | 16,650 | 18,023,625 | ||||||||||||
| United Airlines, Inc.† | 12.00% | 11/1/2013 | 9,600 | 10,632,000 | ||||||||||||
| Total | 44,837,107 | |||||||||||||||
| Apparel/Textiles 0.55% | ||||||||||||||||
| Hanesbrands, Inc.† | 6.375% | 12/15/2020 | 10,850 | 10,361,750 | ||||||||||||
| Levi Strauss & Co. | 7.625% | 5/15/2020 | 8,675 | 9,000,313 | ||||||||||||
| Levi Strauss & Co. | 8.875% | 4/1/2016 | 14,000 | 14,840,000 | ||||||||||||
| Quiksilver, Inc. | 6.875% | 4/15/2015 | 10,000 | 9,825,000 | ||||||||||||
| Total | 44,027,063 | |||||||||||||||
| Auto Loans 0.27% | ||||||||||||||||
| Ford Motor Credit Co. LLC | 8.00% | 6/1/2014 | 20,000 | 22,050,640 | ||||||||||||
| Auto Parts & Equipment 1.69% | ||||||||||||||||
| BorgWarner, Inc. | 4.625% | 9/15/2020 | 5,600 | 5,539,358 | ||||||||||||
| Cooper-Standard Automotive, Inc.† | 8.50% | 5/1/2018 | 15,000 | 15,975,000 | ||||||||||||
See Notes to Financial Statements.
14
Schedule of Investments (continued)
December 31, 2010
| Investments | Interest Rate | Maturity Date | Principal Amount (000) | Value | ||||||||||||
| Auto Parts & Equipment (continued) | ||||||||||||||||
| Goodyear Tire & Rubber Co. (The) | 10.50% | 5/15/2016 | $ | 15,000 | $ | 17,175,000 | ||||||||||
| Pinafore LLC/Pinafore, Inc.† | 9.00% | 10/1/2018 | 3,850 | 4,177,250 | ||||||||||||
| Stanadyne Corp. | 10.00% | 8/15/2014 | 10,000 | 10,175,000 | ||||||||||||
| Stanadyne Corp. | 12.00% | 2/15/2015 | 15,000 | 14,250,000 | ||||||||||||
| Stoneridge, Inc.† | 9.50% | 10/15/2017 | 7,250 | 7,866,250 | ||||||||||||
| Tenneco, Inc.† | 6.875% | 12/15/2020 | 11,575 | 11,893,312 | ||||||||||||
| Tenneco, Inc.† | 7.75% | 8/15/2018 | 2,950 | 3,141,750 | ||||||||||||
| TRW Automotive, Inc.† | 7.25% | 3/15/2017 | 26,500 | 28,686,250 | ||||||||||||
| TRW Automotive, Inc.† | 8.875% | 12/1/2017 | 15,000 | 16,875,000 | ||||||||||||
| Total | 135,754,170 | |||||||||||||||
| Automakers 0.71% | ||||||||||||||||
| Ford Motor Co. | 7.45% | 7/16/2031 | 20,375 | 21,928,594 | ||||||||||||
| Motors Liquidation Co.(f) | 8.375% | 7/15/2033 | 15,000 | 5,437,500 | ||||||||||||
| Navistar International Corp. | 8.25% | 11/1/2021 | 20,000 | 21,600,000 | ||||||||||||
| Oshkosh Corp. | 8.50% | 3/1/2020 | 7,350 | 8,103,375 | ||||||||||||
| Total | 57,069,469 | |||||||||||||||
| Banking 2.69% | ||||||||||||||||
| Ally Financial, Inc.† | 7.50% | 9/15/2020 | 13,150 | 13,856,812 | ||||||||||||
| Ally Financial, Inc. | 8.30% | 2/12/2015 | 30,250 | 33,350,625 | ||||||||||||
| Bank of America Corp. | 8.00% | – | (g) | 15,000 | 15,137,160 | |||||||||||
| Capital One Capital VI | 8.875% | 5/15/2040 | 20,000 | 20,975,000 | ||||||||||||
| Discover Bank | 8.70% | 11/18/2019 | 11,200 | 13,204,744 | ||||||||||||
| Fifth Third Capital Trust IV | 6.50% | 4/15/2037 | 16,250 | 15,559,375 | ||||||||||||
| Huntington BancShares, Inc. | 7.00% | 12/15/2020 | 5,050 | 5,326,659 | ||||||||||||
| JPMorgan Chase & Co. | 7.90% | – | (g) | 7,275 | 7,759,304 | |||||||||||
| Regions Bank | 7.50% | 5/15/2018 | 7,987 | 8,238,183 | ||||||||||||
| Regions Financial Corp. | 7.75% | 11/10/2014 | 6,025 | 6,271,182 | ||||||||||||
| Regions Financing Trust II | 6.625% | 5/15/2047 | 10,000 | 8,645,190 | ||||||||||||
| Royal Bank of Scotland Group plc (The) (United Kingdom)(b) | 6.40% | 10/21/2019 | 7,500 | 7,560,225 | ||||||||||||
| Silicon Valley Bank | 6.05% | 6/1/2017 | 10,000 | 10,158,890 | ||||||||||||
| SVB Financial Group | 5.375% | 9/15/2020 | 9,350 | 9,007,472 | ||||||||||||
| Wachovia Capital Trust III | 5.80% | – | (g) | 15,000 | 13,068,750 | |||||||||||
| Washington Mutual Bank(f) | 6.875% | 6/15/2011 | 22,500 | 84,375 | ||||||||||||
| Zions Bancorporation | 7.75% | 9/23/2014 | 27,000 | 28,170,369 | ||||||||||||
| Total | 216,374,315 | |||||||||||||||
See Notes to Financial Statements.
15
Schedule of Investments (continued)
December 31, 2010
| Investments | Interest Rate | Maturity Date | Principal Amount (000) | Value | ||||||||||||
| Beverages 0.37% | ||||||||||||||||
| CEDC Finance Corp. International, Inc.† | 9.125% | 12/1/2016 | $ | 11,300 | $ | 12,062,750 | ||||||||||
| Constellation Brands, Inc. | 7.25% | 5/15/2017 | 16,700 | 17,764,625 | ||||||||||||
| Total | 29,827,375 | |||||||||||||||
| Brokerage 0.63% | ||||||||||||||||
| Cantor Fitzgerald LP† | 7.875% | 10/15/2019 | 12,655 | 13,052,974 | ||||||||||||
| Lazard Group LLC | 7.125% | 5/15/2015 | 12,500 | 13,472,575 | ||||||||||||
| Raymond James Financial, Inc. | 8.60% | 8/15/2019 | 20,000 | 23,739,900 | ||||||||||||
| Total | 50,265,449 | |||||||||||||||
| Building & Construction 0.88% | ||||||||||||||||
| K. Hovnanian Enterprises, Inc. | 10.625% | 10/15/2016 | 9,750 | 10,042,500 | ||||||||||||
| KB Home | 9.10% | 9/15/2017 | 18,000 | 19,170,000 | ||||||||||||
| Lennar Corp. | 12.25% | 6/1/2017 | 17,700 | 21,417,000 | ||||||||||||
| Ryland Group, Inc. | 8.40% | 5/15/2017 | 7,500 | 8,343,750 | ||||||||||||
| Toll Brothers Finance Corp. | 8.91% | 10/15/2017 | 10,000 | 11,813,990 | ||||||||||||
| Total | 70,787,240 | |||||||||||||||
| Building Materials 0.53% | ||||||||||||||||
| Associated Materials LLC† | 9.125% | 11/1/2017 | 2,000 | 2,095,000 | ||||||||||||
| Building Materials Corp. of America† | 7.50% | 3/15/2020 | 5,150 | 5,265,875 | ||||||||||||
| Cemex Finance LLC† | 9.50% | 12/14/2016 | 4,825 | 4,999,906 | ||||||||||||
| Masco Corp. | 7.125% | 3/15/2020 | 12,000 | 12,574,716 | ||||||||||||
| Owens Corning, Inc. | 9.00% | 6/15/2019 | 15,000 | 17,624,775 | ||||||||||||
| Total | 42,560,272 | |||||||||||||||
| Chemicals 2.78% | ||||||||||||||||
| Airgas, Inc. | 7.125% | 10/1/2018 | 10,500 | 11,655,000 | ||||||||||||
| Ashland, Inc. | 9.125% | 6/1/2017 | 9,000 | 10,417,500 | ||||||||||||
| Celanese US Holdings LLC† | 6.625% | 10/15/2018 | 7,365 | 7,622,775 | ||||||||||||
| CF Industries, Inc. | 6.875% | 5/1/2018 | 3,650 | 3,914,625 | ||||||||||||
| CF Industries, Inc. | 7.125% | 5/1/2020 | 5,000 | 5,487,500 | ||||||||||||
| Chemtura Corp.† | 7.875% | 9/1/2018 | 10,000 | 10,650,000 | ||||||||||||
| Dow Chemical Co. (The) | 8.55% | 5/15/2019 | 15,000 | 18,828,150 | ||||||||||||
| Huntsman International LLC | 8.625% | 3/15/2020 | 23,000 | 25,127,500 | ||||||||||||
| INEOS Finance plc (United Kingdom)†(b) | 9.00% | 5/15/2015 | 4,350 | 4,649,063 | ||||||||||||
| INEOS Group Holdings plc (United Kingdom)†(b) | 8.50% | 2/15/2016 | 26,000 | 24,895,000 | ||||||||||||
| Lyondell Chemical Co.† | 8.00% | 11/1/2017 | 18,002 | 19,959,717 | ||||||||||||
| Momentive Performance Materials, Inc.† | 9.00% | 1/15/2021 | 10,000 | 10,575,000 | ||||||||||||
See Notes to Financial Statements.
16
Schedule of Investments (continued)
December 31, 2010
| Investments | Interest Rate | Maturity Date | Principal Amount (000) | Value | ||||||||||||
| Chemicals (continued) | ||||||||||||||||
| Nalco Co.† | 6.625% | 1/15/2019 | $ | 12,600 | $ | 12,946,500 | ||||||||||
| Nalco Co. | 8.25% | 5/15/2017 | 15,000 | 16,331,250 | ||||||||||||
| Phibro Animal Health Corp.† | 9.25% | 7/1/2018 | 11,000 | 11,385,000 | ||||||||||||
| Potash Corp. of Saskatchewan, Inc. (Canada)(b) | 4.875% | 3/30/2020 | 9,750 | 10,204,818 | ||||||||||||
| Rockwood Specialties Group, Inc. | 7.50% | 11/15/2014 | 18,250 | 18,797,500 | ||||||||||||
| Total | 223,446,898 | |||||||||||||||
| Computer Hardware 0.51% | ||||||||||||||||
| Brocade Communications Systems, Inc. | 6.625% | 1/15/2018 | 13,250 | 14,011,875 | ||||||||||||
| Brocade Communications Systems, Inc. | 6.875% | 1/15/2020 | 13,500 | 14,445,000 | ||||||||||||
| Seagate HDD Cayman† | 6.875% | 5/1/2020 | 13,200 | 12,672,000 | ||||||||||||
| Total | 41,128,875 | |||||||||||||||
| Consumer/Commercial/Lease Financing 1.92% | ||||||||||||||||
| American General Finance Corp. | 6.90% | 12/15/2017 | 18,650 | 15,153,125 | ||||||||||||
| AWAS Aviation Capital Ltd. (Ireland)†(b) | 7.00% | 10/15/2016 | 13,100 | 13,050,875 | ||||||||||||
| CIT Group, Inc. | 7.00% | 5/1/2014 | 6,000 | 6,075,000 | ||||||||||||
| CIT Group, Inc. | 7.00% | 5/1/2016 | 67,000 | 67,418,750 | ||||||||||||
| International Lease Finance Corp. | 8.25% | 12/15/2020 | 3,950 | 4,073,437 | ||||||||||||
| International Lease Finance Corp.† | 8.625% | 9/15/2015 | 12,100 | 13,037,750 | ||||||||||||
| International Lease Finance Corp.† | 8.75% | 3/15/2017 | 17,500 | 18,812,500 | ||||||||||||
| Provident Funding Associates† | 10.25% | 4/15/2017 | 15,800 | 16,471,500 | ||||||||||||
| Total | 154,092,937 | |||||||||||||||
| Consumer Products 0.47% | ||||||||||||||||
| Church & Dwight Co., Inc. | 3.35% | 12/15/2015 | 2,875 | 2,887,334 | ||||||||||||
| Elizabeth Arden, Inc. | 7.75% | 1/15/2014 | 25,000 | 25,484,375 | ||||||||||||
| Jarden Corp. | 6.125% | 11/15/2022 | 10,000 | 9,587,500 | ||||||||||||
| Total | 37,959,209 | |||||||||||||||
| Department Stores 0.76% | ||||||||||||||||
| J.C. Penney Corp., Inc. | 7.125% | 11/15/2023 | 5,025 | 5,213,437 | ||||||||||||
| Macy’s Retail Holdings, Inc. | 5.90% | 12/1/2016 | 25,000 | 26,812,500 | ||||||||||||
| Macy’s Retail Holdings, Inc. | 6.375% | 3/15/2037 | 12,900 | 12,706,500 | ||||||||||||
| Macy’s Retail Holdings, Inc. | 7.875% | 7/15/2015 | 14,000 | 16,450,000 | ||||||||||||
| Total | 61,182,437 | |||||||||||||||
| Diversified Capital Goods 2.48% | ||||||||||||||||
| Actuant Corp. | 6.875% | 6/15/2017 | 23,000 | 23,632,500 | ||||||||||||
| Amsted Industries, Inc.† | 8.125% | 3/15/2018 | 15,000 | 15,993,750 | ||||||||||||
See Notes to Financial Statements.
17
Schedule of Investments (continued)
December 31, 2010
| Investments | Interest Rate | Maturity Date | Principal Amount (000) | Value | ||||||||||||
| Diversified Capital Goods (continued) | ||||||||||||||||
| Belden, Inc. | 7.00% | 3/15/2017 | $ | 17,500 | $ | 17,806,250 | ||||||||||
| Belden, Inc. | 9.25% | 6/15/2019 | 12,000 | 13,215,000 | ||||||||||||
| Mueller Water Products, Inc. | 7.375% | 6/1/2017 | 23,500 | 22,795,000 | ||||||||||||
| Park-Ohio Industries, Inc. | 8.375% | 11/15/2014 | 11,850 | 12,087,000 | ||||||||||||
| RBS Global, Inc./Rexnord LLC | 8.50% | 5/1/2018 | 30,000 | 32,025,000 | ||||||||||||
| Sensus USA, Inc. | 8.625% | 12/15/2013 | 21,000 | 21,420,000 | ||||||||||||
| SPX Corp.† | 6.875% | 9/1/2017 | 21,000 | 22,417,500 | ||||||||||||
| Valmont Industries, Inc. | 6.625% | 4/20/2020 | 17,500 | 18,236,575 | ||||||||||||
| Total | 199,628,575 | |||||||||||||||
| Electric: Generation 1.67% | ||||||||||||||||
| Dynegy Holdings, Inc. | 7.75% | 6/1/2019 | 22,500 | 15,131,250 | ||||||||||||
| Dynegy Holdings, Inc. | 8.375% | 5/1/2016 | 32,500 | 24,456,250 | ||||||||||||
| Edison Mission Energy | 7.00% | 5/15/2017 | 20,000 | 15,950,000 | ||||||||||||
| Edison Mission Energy | 7.75% | 6/15/2016 | 5,900 | 5,103,500 | ||||||||||||
| Mirant Americas Generation LLC | 9.125% | 5/1/2031 | 30,250 | 29,947,500 | ||||||||||||
| NRG Energy, Inc. | 7.25% | 2/1/2014 | 15,000 | 15,337,500 | ||||||||||||
| Texas Competitive Electric Holdings Co. LLC | 10.25% | 11/1/2015 | 50,000 | 28,500,000 | ||||||||||||
| Total | 134,426,000 | |||||||||||||||
| Electric: Integrated 1.06% | ||||||||||||||||
| AES Corp. (The) | 8.00% | 10/15/2017 | 29,950 | 31,821,875 | ||||||||||||
| Black Hills Corp. | 5.875% | 7/15/2020 | 8,000 | 8,323,496 | ||||||||||||
| Black Hills Corp. | 6.50% | 5/15/2013 | 5,000 | 5,369,750 | ||||||||||||
| Duquesne Light Holdings, Inc.† | 6.40% | 9/15/2020 | 20,500 | 20,383,724 | ||||||||||||
| EDP Finance BV (Netherlands)†(b) | 4.90% | 10/1/2019 | 2,315 | 1,976,758 | ||||||||||||
| EDP Finance BV (Netherlands)†(b) | 6.00% | 2/2/2018 | 1,150 | 1,076,388 | ||||||||||||
| PSEG Power LLC | 5.32% | 9/15/2016 | 15,000 | 16,433,295 | ||||||||||||
| Total | 85,385,286 | |||||||||||||||
| Electronics 1.41% | ||||||||||||||||
| Advanced Micro Devices, Inc.† | 7.75% | 8/1/2020 | 16,000 | 16,680,000 | ||||||||||||
| Advanced Micro Devices, Inc. | 8.125% | 12/15/2017 | 9,225 | 9,824,625 | ||||||||||||
| Freescale Semiconductor, Inc.† | 9.25% | 4/15/2018 | 8,800 | 9,724,000 | ||||||||||||
| Freescale Semiconductor, Inc.† | 10.125% | 3/15/2018 | 9,200 | 10,396,000 | ||||||||||||
| Freescale Semiconductor, Inc.† | 10.75% | 8/1/2020 | 20,000 | 21,900,000 | ||||||||||||
| KLA-Tencor Corp. | 6.90% | 5/1/2018 | 12,850 | 14,155,586 | ||||||||||||
| NXP BV LLC (Netherlands)(b) | 9.50% | 10/15/2015 | 15,500 | 16,623,750 | ||||||||||||
| NXP BV LLC (Netherlands)†(b) | 9.75% | 8/1/2018 | 12,500 | 14,125,000 | ||||||||||||
| Total | 113,428,961 | |||||||||||||||
See Notes to Financial Statements.
18
Schedule of Investments (continued)
December 31, 2010
| Investments | Interest Rate | Maturity Date | Principal Amount (000) | Value | ||||||||||||
| Energy: Exploration & Production 4.19% | ||||||||||||||||
| Anadarko Petroleum Corp. | 7.625% | 3/15/2014 | $ | 10,000 | $ | 11,218,420 | ||||||||||
| Berry Petroleum Co. | 6.75% | 11/1/2020 | 4,175 | 4,206,313 | ||||||||||||
| BreitBurn Energy Partners LP† | 8.625% | 10/15/2020 | 3,400 | 3,434,000 | ||||||||||||
| Brigham Exploration Co.† | 8.75% | 10/1/2018 | 9,825 | 10,660,125 | ||||||||||||
| Chesapeake Energy Corp. | 6.625% | 8/15/2020 | 12,500 | 12,375,000 | ||||||||||||
| Cimarex Energy Co. | 7.125% | 5/1/2017 | 25,000 | 26,062,500 | ||||||||||||
| Concho Resources, Inc. | 7.00% | 1/15/2021 | 10,700 | 10,994,250 | ||||||||||||
| Concho Resources, Inc. | 8.625% | 10/1/2017 | 5,650 | 6,186,750 | ||||||||||||
| Continental Resources, Inc. | 7.375% | 10/1/2020 | 7,200 | 7,668,000 | ||||||||||||
| Continental Resources, Inc. | 8.25% | 10/1/2019 | 29,750 | 33,171,250 | ||||||||||||
| Forest Oil Corp. | 7.25% | 6/15/2019 | 32,000 | 32,640,000 | ||||||||||||
| Forest Oil Corp. | 8.50% | 2/15/2014 | 9,825 | 10,782,937 | ||||||||||||
| Kerr-McGee Corp. | 6.95% | 7/1/2024 | 12,900 | 14,053,299 | ||||||||||||
| Linn Energy LLC/Linn Energy Finance Corp.† | 7.75% | 2/1/2021 | 17,000 | 17,510,000 | ||||||||||||
| Nabors Industries, Inc. | 6.15% | 2/15/2018 | 10,000 | 10,688,950 | ||||||||||||
| Newfield Exploration Co. | 7.125% | 5/15/2018 | 16,500 | 17,448,750 | ||||||||||||
| Pan American Energy LLC (Argentina)†(b) | 7.875% | 5/7/2021 | 13,175 | 14,064,312 | ||||||||||||
| QEP Resources, Inc. | 6.80% | 3/1/2020 | 10,000 | 9,888,460 | ||||||||||||
| QEP Resources, Inc. | 6.875% | 3/1/2021 | 10,700 | 11,288,500 | ||||||||||||
| Quicksilver Resources, Inc. | 7.125% | 4/1/2016 | 10,000 | 9,625,000 | ||||||||||||
| Quicksilver Resources, Inc. | 8.25% | 8/1/2015 | 23,450 | 24,446,625 | ||||||||||||
| Range Resources Corp. | 7.25% | 5/1/2018 | 10,300 | 10,918,000 | ||||||||||||
| Range Resources Corp. | 8.00% | 5/15/2019 | 15,000 | 16,406,250 | ||||||||||||
| Ras Laffan Liquefied Natural Gas Co., Ltd. III (Qatar)†(b) | 5.50% | 9/30/2014 | 6,650 | 7,195,353 | ||||||||||||
| Whiting Petroleum Corp. | 6.50% | 10/1/2018 | 4,200 | 4,263,000 | ||||||||||||
| Total | 337,196,044 | |||||||||||||||
| Environmental 0.23% | ||||||||||||||||
| Clean Harbors, Inc. | 7.625% | 8/15/2016 | 12,420 | 13,258,350 | ||||||||||||
| EnergySolutions, Inc./EnergySolutions LLC† | 10.75% | 8/15/2018 | 5,000 | 5,481,250 | ||||||||||||
| Total | 18,739,600 | |||||||||||||||
| Food & Drug Retailers 0.55% | ||||||||||||||||
| Ingles Markets, Inc. | 8.875% | 5/15/2017 | 25,850 | 27,788,750 | ||||||||||||
| Rite Aid Corp. | 10.25% | 10/15/2019 | 7,650 | 7,984,688 | ||||||||||||
| Stater Bros Holdings, Inc.† | 7.375% | 11/15/2018 | 8,500 | 8,755,000 | ||||||||||||
| Total | 44,528,438 | |||||||||||||||
See Notes to Financial Statements.
19
Schedule of Investments (continued)
December 31, 2010
| Investments | Interest Rate | Maturity Date | Principal Amount (000) | Value | ||||||||||||
| Food: Wholesale 1.79% | ||||||||||||||||
| Bumble Bee Acquisition Corp.† | 9.00% | 12/15/2017 | $ | 7,250 | $ | 7,576,250 | ||||||||||
| Bumble Bee Foods LLC | 7.75% | 12/15/2015 | 17,200 | 19,756,436 | ||||||||||||
| Bunge NA Finance LP | 5.90% | 4/1/2017 | 9,050 | 9,325,753 | ||||||||||||
| Corn Products International, Inc. | 4.625% | 11/1/2020 | 10,000 | 9,882,030 | ||||||||||||
| Del Monte Corp. | 7.50% | 10/15/2019 | 7,000 | 8,198,750 | ||||||||||||
| Dole Food Co., Inc. | 8.75% | 7/15/2013 | 30,000 | 32,212,500 | ||||||||||||
| Dole Food Co., Inc. | 13.875% | 3/15/2014 | 5,395 | 6,622,363 | ||||||||||||
| Mead Johnson Nutrition Co. | 4.90% | 11/1/2019 | 15,000 | 15,851,340 | ||||||||||||
| Pinnacle Foods Finance LLC/Pinnacle Foods Finance Corp. | 8.25% | 9/1/2017 | 8,500 | 8,733,750 | ||||||||||||
| Pinnacle Foods Finance LLC/Pinnacle Foods Finance Corp. | 9.25% | 4/1/2015 | 8,250 | 8,631,562 | ||||||||||||
| Viterra, Inc. (Canada)†(b) | 5.95% | 8/1/2020 | 18,250 | 17,444,299 | ||||||||||||
| Total | 144,235,033 | |||||||||||||||
| Forestry/Paper 1.47% | ||||||||||||||||
| Boise Paper Holdings LLC/Boise Co-Issuer Co. | 8.00% | 4/1/2020 | 3,600 | 3,870,000 | ||||||||||||
| Boise Paper Holdings LLC/Boise Finance Co. | 9.00% | 11/1/2017 | 3,750 | 4,115,625 | ||||||||||||
| Cascades, Inc. (Canada)(b) | 7.75% | 12/15/2017 | 6,300 | 6,599,250 | ||||||||||||
| Cascades, Inc. (Canada)(b) | 7.875% | 1/15/2020 | 3,425 | 3,596,250 | ||||||||||||
| Georgia-Pacific LLC† | 5.40% | 11/1/2020 | 5,100 | 5,051,764 | ||||||||||||
| Georgia-Pacific LLC† | 8.25% | 5/1/2016 | 35,000 | 39,681,250 | ||||||||||||
| NewPage Corp. | 11.375% | 12/31/2014 | 11,150 | 10,536,750 | ||||||||||||
| Rock-Tenn Co. | 9.25% | 3/15/2016 | 10,000 | 10,950,000 | ||||||||||||
| Sino-Forest Corp. (Canada)†(b) | 6.25% | 10/21/2017 | 4,000 | 4,055,000 | ||||||||||||
| Smurfit Kappa Funding plc (Ireland)(b) | 7.75% | 4/1/2015 | 18,000 | 18,540,000 | ||||||||||||
| Weyerhaeuser Co. | 7.375% | 10/1/2019 | 10,000 | 10,942,590 | ||||||||||||
| Total | 117,938,479 | |||||||||||||||
| Gaming 3.34% | ||||||||||||||||
| Ameristar Casinos, Inc. | 9.25% | 6/1/2014 | 11,625 | 12,496,875 | ||||||||||||
| Boyd Gaming Corp. | 7.125% | 2/1/2016 | 12,500 | 11,281,250 | ||||||||||||
| Caesars Entertainment Operating Co., Inc.† | 12.75% | 4/15/2018 | 20,000 | 20,200,000 | ||||||||||||
| Downstream Development Authority Quapaw Tribe of Oklahoma† | 12.00% | 10/15/2015 | 12,000 | 11,895,000 | ||||||||||||
| International Game Technology | 7.50% | 6/15/2019 | 10,000 | 11,274,540 | ||||||||||||
| Isle of Capri Casinos, Inc. | 7.00% | 3/1/2014 | 25,000 | 24,625,000 | ||||||||||||
| Las Vegas Sands Corp. | 6.375% | 2/15/2015 | 8,000 | 8,210,000 | ||||||||||||
| Marina District Finance Co., Inc.† | 9.875% | 8/15/2018 | 18,000 | 17,820,000 | ||||||||||||
See Notes to Financial Statements.
20
Schedule of Investments (continued)
December 31, 2010
| Investments | Interest Rate | Maturity Date | Principal Amount (000) | Value | ||||||||||||
| Gaming (continued) | ||||||||||||||||
| MCE Finance Ltd. | 10.25% | 5/15/2018 | $ | 11,000 | $ | 12,663,750 | ||||||||||
| MGM Resorts International | 6.75% | 4/1/2013 | 15,000 | 14,985,000 | ||||||||||||
| MGM Resorts International† | 9.00% | 3/15/2020 | 4,950 | 5,469,750 | ||||||||||||
| Midwest Gaming Borrower LLC/Midwest Finance Corp.† | 11.625% | 4/15/2016 | 7,700 | 8,008,000 | ||||||||||||
| Mohegan Tribal Gaming Authority† | 11.50% | 11/1/2017 | 20,000 | 18,550,000 | ||||||||||||
| Peninsula Gaming LLC | 8.375% | 8/15/2015 | 4,600 | 4,858,750 | ||||||||||||
| River Rock Entertainment Authority (The) | 9.75% | 11/1/2011 | 17,000 | 15,257,500 | ||||||||||||
| Scientific Games International, Inc. | 9.25% | 6/15/2019 | 10,500 | 10,893,750 | ||||||||||||
| Seminole Indian Tribe of Florida† | 7.75% | 10/1/2017 | 11,000 | 11,412,500 | ||||||||||||
| Snoqualmie Entertainment Authority† | 9.125% | 2/1/2015 | 17,725 | 16,927,375 | ||||||||||||
| Station Casinos, Inc.(f) | 6.50% | 2/1/2014 | 27,000 | 2,700 | ||||||||||||
| Turning Stone Casino Resort† | 9.125% | 9/15/2014 | 10,000 | 10,312,500 | ||||||||||||
| Wynn Las Vegas LLC/Capital Corp. | 7.875% | 11/1/2017 | 20,000 | 21,650,000 | ||||||||||||
| Total | 268,794,240 | |||||||||||||||
| Gas Distribution 3.30% | ||||||||||||||||
| El Paso Corp.† | 6.50% | 9/15/2020 | 8,200 | 8,296,793 | ||||||||||||
| El Paso Corp. | 7.00% | 6/15/2017 | 30,000 | 31,809,450 | ||||||||||||
| El Paso Corp. | 7.25% | 6/1/2018 | 10,000 | 10,755,150 | ||||||||||||
| El Paso Corp. | 7.75% | 1/15/2032 | 10,000 | 9,997,310 | ||||||||||||
| Ferrellgas LP/Ferrellgas Finance Corp.† | 6.50% | 5/1/2021 | 10,325 | 10,118,500 | ||||||||||||
| Ferrellgas Partners LP | 8.625% | 6/15/2020 | 15,000 | 16,200,000 | ||||||||||||
| Florida Gas Transmission Co. LLC† | 7.90% | 5/15/2019 | 7,700 | 9,323,968 | ||||||||||||
| Inergy LP/Inergy Finance Corp. | 8.25% | 3/1/2016 | 23,500 | 24,616,250 | ||||||||||||
| Inergy LP/Inergy Finance Corp. | 8.75% | 3/1/2015 | 1,450 | 1,551,500 | ||||||||||||
| Kinder Morgan Finance Co. LLC† | 6.00% | 1/15/2018 | 14,400 | 14,220,000 | ||||||||||||
| MarkWest Energy Partners LP | 6.75% | 11/1/2020 | 17,000 | 17,085,000 | ||||||||||||
| MarkWest Energy Partners LP | 8.75% | 4/15/2018 | 6,000 | 6,525,000 | ||||||||||||
| National Fuel Gas Co. | 6.50% | 4/15/2018 | 25,400 | 27,862,962 | ||||||||||||
| National Fuel Gas Co. | 8.75% | 5/1/2019 | 5,000 | 6,059,515 | ||||||||||||
| NiSource Finance Corp. | 10.75% | 3/15/2016 | 2,200 | 2,945,360 | ||||||||||||
| NorthernStar Natural Gas, Inc. PIK(f) | 5.00% | 5/15/2014 | 4,229 | 423 | ||||||||||||
| Northwest Pipeline GP | 6.05% | 6/15/2018 | 5,025 | 5,690,053 | ||||||||||||
| Northwest Pipeline GP | 7.00% | 6/15/2016 | 6,250 | 7,408,694 | ||||||||||||
| Panhandle Eastern Pipeline Co. LP | 7.00% | 6/15/2018 | 7,600 | 8,446,131 | ||||||||||||
| Panhandle Eastern Pipeline Co. LP | 8.125% | 6/1/2019 | 13,800 | 15,931,493 | ||||||||||||
| Suburban Propane Partners LP/Suburban Energy Finance Corp. | 7.375% | 3/15/2020 | 6,600 | 7,078,500 | ||||||||||||
See Notes to Financial Statements.
21
Schedule of Investments (continued)
December 31, 2010
| Investments | Interest Rate | Maturity Date | Principal Amount (000) | Value | ||||||||||||
| Gas Distribution (continued) | ||||||||||||||||
| Williams Cos., Inc. (The) | 7.875% | 9/1/2021 | $ | 15,000 | $ | 17,738,220 | ||||||||||
| Williams Partners LP | 7.25% | 2/1/2017 | 5,000 | 5,819,870 | ||||||||||||
| Total | 265,480,142 | |||||||||||||||
| Health Facilities 4.23% | ||||||||||||||||
| Bausch & Lomb, Inc. | 9.875% | 11/1/2015 | 30,000 | 32,250,000 | ||||||||||||
| Biomet, Inc. | 10.00% | 10/15/2017 | 22,000 | 24,145,000 | ||||||||||||
| Capella Healthcare, Inc.† | 9.25% | 7/1/2017 | 10,000 | 10,625,000 | ||||||||||||
| Community Health Systems, Inc. | 8.875% | 7/15/2015 | 35,000 | 36,837,500 | ||||||||||||
| HCA Holdings, Inc.† | 7.75% | 5/15/2021 | 10,900 | 10,927,250 | ||||||||||||
| HCA, Inc. | 6.375% | 1/15/2015 | 15,000 | 14,812,500 | ||||||||||||
| HCA, Inc. | 7.875% | 2/15/2020 | 10,000 | 10,750,000 | ||||||||||||
| HCA, Inc. | 9.125% | 11/15/2014 | 33,500 | 35,216,875 | ||||||||||||
| HCA, Inc. | 9.875% | 2/15/2017 | 12,000 | 13,260,000 | ||||||||||||
| HealthSouth Corp. | 8.125% | 2/15/2020 | 24,650 | 26,622,000 | ||||||||||||
| Omega Healthcare Investors, Inc.† | 6.75% | 10/15/2022 | 5,075 | 5,043,281 | ||||||||||||
| Omega Healthcare Investors, Inc. | 7.50% | 2/15/2020 | 7,750 | 8,185,938 | ||||||||||||
| Select Medical Corp. | 7.625% | 2/1/2015 | 20,000 | 20,100,000 | ||||||||||||
| Tenet Healthcare Corp. | 8.875% | 7/1/2019 | 6,850 | 7,774,750 | ||||||||||||
| Tenet Healthcare Corp. | 9.25% | # | 2/1/2015 | 15,000 | 16,050,000 | |||||||||||
| United Surgical Partners International, Inc. | 8.875% | 5/1/2017 | 21,500 | 22,252,500 | ||||||||||||
| Vanguard Health Holding Co. II LLC/Vanguard Holding Co. II, Inc. | 8.00% | 2/1/2018 | 30,000 | 30,900,000 | ||||||||||||
| VWR Funding, Inc. PIK | 10.25% | 7/15/2015 | 13,969 | 14,737,196 | ||||||||||||
| Total | 340,489,790 | |||||||||||||||
| Health Services 0.13% | ||||||||||||||||
| Warner Chilcott Co. LLC/Warner Chilcott Finance LLC (Ireland)†(b) | 7.75% | 9/15/2018 | 10,250 | 10,403,750 | ||||||||||||
| Hotels 1.06% | ||||||||||||||||
| FelCor Lodging LP | 10.00% | 10/1/2014 | 9,950 | 11,193,750 | ||||||||||||
| Gaylord Entertainment Co. | 6.75% | 11/15/2014 | 9,600 | 9,504,000 | ||||||||||||
| Host Hotels & Resorts LP | 6.375% | 3/15/2015 | 15,000 | 15,300,000 | ||||||||||||
| Hyatt Hotels Corp.† | 5.75% | 8/15/2015 | 20,036 | 20,977,732 | ||||||||||||
| Starwood Hotels & Resorts Worldwide, Inc. | 6.75% | 5/15/2018 | 8,500 | 9,350,000 | ||||||||||||
| Starwood Hotels & Resorts Worldwide, Inc. | 7.875% | 10/15/2014 | 15,000 | 17,100,000 | ||||||||||||
| Wyndham Worldwide Corp. | 5.75% | 2/1/2018 | 2,015 | 2,051,879 | ||||||||||||
| Total | 85,477,361 | |||||||||||||||
See Notes to Financial Statements.
22
Schedule of Investments (continued)
December 31, 2010
| Investments | Interest Rate | Maturity Date | Principal Amount (000) | Value | ||||||||||||
| Household & Leisure Products 0.37% | ||||||||||||||||
| ACCO Brands Corp. | 10.625% | 3/15/2015 | $ | 3,600 | $ | 4,068,000 | ||||||||||
| Mattel, Inc. | 4.35% | 10/1/2020 | 2,550 | 2,475,889 | ||||||||||||
| Whirlpool Corp. | 8.60% | 5/1/2014 | 20,000 | 23,078,840 | ||||||||||||
| Total | 29,622,729 | |||||||||||||||
| Household Durables 0.06% | ||||||||||||||||
| Armored AutoGroup, Inc. | 9.25% | 11/1/2018 | 4,700 | 4,688,250 | ||||||||||||
| Insurance Brokerage 0.35% | ||||||||||||||||
| HUB International Holdings, Inc.† | 9.00% | 12/15/2014 | 12,875 | 13,100,313 | ||||||||||||
| USI Holdings Corp.† | 4.161% | # | 11/15/2014 | 17,250 | 15,180,000 | |||||||||||
| Total | 28,280,313 | |||||||||||||||
| Integrated Energy 0.43% | ||||||||||||||||
| Alta Wind Holdings LLC† | 7.00% | 6/30/2035 | 12,000 | 12,837,300 | ||||||||||||
| Coso Geothermal Power Holdings LLC† | 7.00% | 7/15/2026 | 12,883 | 11,170,957 | ||||||||||||
| Petrobras International Finance Co. (Brazil)(b) | 5.875% | 3/1/2018 | 10,000 | 10,698,180 | ||||||||||||
| Total | 34,706,437 | |||||||||||||||
| Investments & Miscellaneous Financial Services 0.64% | ||||||||||||||||
| FMR LLC† | 5.35% | 11/15/2021 | 14,800 | 14,743,257 | ||||||||||||
| KKR Group Finance Co.† | 6.375% | 9/29/2020 | 10,900 | 10,872,881 | ||||||||||||
| Nuveen Investments, Inc. | 10.50% | 11/15/2015 | 25,500 | 26,201,250 | ||||||||||||
| Total | 51,817,388 | |||||||||||||||
| Leisure 0.94% | ||||||||||||||||
| Equinox Holdings, Inc.† | 9.50% | 2/1/2016 | 7,000 | 7,428,750 | ||||||||||||
| MU Finance plc (United Kingdom)†(b) | 8.375% | 2/1/2017 | 20,600 | 21,037,750 | ||||||||||||
| NCL Corp. Ltd.† | 9.50% | 11/15/2018 | 9,275 | 9,599,625 | ||||||||||||
| Speedway Motorsports, Inc. | 8.75% | 6/1/2016 | 15,450 | 16,724,625 | ||||||||||||
| Universal City Development Partners Ltd. | 8.875% | 11/15/2015 | 9,250 | 9,874,375 | ||||||||||||
| Universal City Development Partners Ltd. | 10.875% | 11/15/2016 | 10,000 | 10,975,000 | ||||||||||||
| Total | 75,640,125 | |||||||||||||||
| Life Insurance 0.22% | ||||||||||||||||
| MetLife Capital Trust X† | 9.25% | 4/8/2038 | 15,075 | 17,788,500 | ||||||||||||
| Local-Authority 0.19% | ||||||||||||||||
| New York City Industrial Development Agency† | 11.00% | 3/1/2029 | 12,000 | 15,176,640 | ||||||||||||
See Notes to Financial Statements.
23
Schedule of Investments (continued)
December 31, 2010
| Investments | Interest Rate | Maturity Date | Principal Amount (000) | Value | ||||||||||||
| Machinery 1.34% | ||||||||||||||||
| Altra Holdings, Inc. | 8.125% | 12/1/2016 | $ | 20,000 | $ | 21,300,000 | ||||||||||
| Baldor Electric Co. | 8.625% | 2/15/2017 | 35,000 | 39,375,000 | ||||||||||||
| IDEX Corp. | 4.50% | 12/15/2020 | 9,045 | 8,884,578 | ||||||||||||
| Manitowoc Co., Inc. (The) | 8.50% | 11/1/2020 | 3,600 | 3,843,000 | ||||||||||||
| Manitowoc Co., Inc. (The) | 9.50% | 2/15/2018 | 20,450 | 22,495,000 | ||||||||||||
| Roper Industries, Inc. | 6.25% | 9/1/2019 | 10,350 | 11,475,128 | ||||||||||||
| Total | 107,372,706 | |||||||||||||||
| Managed Care 0.19% | ||||||||||||||||
| Centene Corp. | 7.25% | 4/1/2014 | 15,000 | 15,525,000 | ||||||||||||
| Media: Broadcast 1.50% | ||||||||||||||||
| Allbritton Communications Co. | 8.00% | 5/15/2018 | 12,825 | 13,017,375 | ||||||||||||
| Belo Corp. | 8.00% | 11/15/2016 | 10,000 | 10,825,000 | ||||||||||||
| Citadel Broadcasting Corp.† | 7.75% | 12/15/2018 | 5,650 | 5,876,000 | ||||||||||||
| Discovery Communications LLC | 5.625% | 8/15/2019 | 11,150 | 12,257,764 | ||||||||||||
| FoxCo Acquisition Sub LLC† | 13.375% | 7/15/2016 | 5,650 | 6,215,000 | ||||||||||||
| Gray Television, Inc. | 10.50% | 6/29/2015 | 10,000 | 10,125,000 | ||||||||||||
| Grupo Televisa SA (Mexico)(b) | 6.00% | 5/15/2018 | 5,050 | 5,580,644 | ||||||||||||
| ION Media Networks, Inc.†(f) | Zero Coupon | 1/15/2013 | 11,064 | 165,953 | ||||||||||||
| LIN Television Corp. | 6.50% | 5/15/2013 | 12,075 | 12,165,562 | ||||||||||||
| LIN Television Corp. | 8.375% | 4/15/2018 | 7,500 | 7,987,500 | ||||||||||||
| Salem Communications Corp. | 9.625% | 12/15/2016 | 8,100 | 8,626,500 | ||||||||||||
| Sinclair Television Group, Inc.† | 9.25% | 11/1/2017 | 8,750 | 9,515,625 | ||||||||||||
| Univision Communications, Inc.† | 8.50% | 5/15/2021 | 7,250 | 7,376,875 | ||||||||||||
| Univision Communications, Inc. PIK† | 9.75% | 3/15/2015 | 10,592 | 11,155,457 | ||||||||||||
| Total | 120,890,255 | |||||||||||||||
| Media: Cable 2.31% | ||||||||||||||||
| CCH II LLC/CCH II Capital Corp. | 13.50% | 11/30/2016 | 3,667 | 4,391,101 | ||||||||||||
| CCO Holdings LLC/CCO Holdings Capital Corp. | 8.125% | 4/30/2020 | 20,000 | 21,150,000 | ||||||||||||
| CSC Holdings LLC | 8.625% | 2/15/2019 | 20,100 | 22,813,500 | ||||||||||||
| DirecTV Holdings LLC/DirecTV Financing Co., Inc. | 6.375% | 6/15/2015 | 20,000 | 20,775,000 | ||||||||||||
| DISH DBS Corp. | 7.125% | 2/1/2016 | 26,000 | 26,975,000 | ||||||||||||
| Mediacom Broadband LLC | 8.50% | 10/15/2015 | 10,000 | 10,100,000 | ||||||||||||
| Mediacom Communications Corp. | 9.125% | 8/15/2019 | 32,450 | 33,261,250 | ||||||||||||
| Time Warner Cable, Inc. | 4.125% | 2/15/2021 | 10,000 | 9,534,820 | ||||||||||||
See Notes to Financial Statements.
24
Schedule of Investments (continued)
December 31, 2010
| Investments | Interest Rate | Maturity Date | Principal Amount (000) | Value | ||||||||||||
| Media: Cable (continued) | ||||||||||||||||
| Virgin Media Finance plc (United Kingdom)(b) | 8.375% | 10/15/2019 | $ | 15,000 | $ | 16,462,500 | ||||||||||
| Virgin Media Finance plc (United Kingdom)(b) | 9.50% | 8/15/2016 | 17,500 | 19,862,500 | ||||||||||||
| Total | 185,325,671 | |||||||||||||||
| Media: Diversified 0.06% | ||||||||||||||||
| Entravision Communications Corp.† | 8.75% | 8/1/2017 | 4,175 | 4,425,500 | ||||||||||||
| Media: Services 1.64% | ||||||||||||||||
| Affinion Group, Inc. | 11.50% | 10/15/2015 | 12,200 | 12,749,000 | ||||||||||||
| Interpublic Group of Cos., Inc. (The) | 6.25% | 11/15/2014 | 23,000 | 24,926,250 | ||||||||||||
| Interpublic Group of Cos., Inc. (The) | 10.00% | 7/15/2017 | 15,000 | 17,625,000 | ||||||||||||
| Lamar Media Corp. | 7.875% | 4/15/2018 | 7,500 | 8,006,250 | ||||||||||||
| Nielsen Finance LLC/Nielsen Finance Co.† | 7.75% | 10/15/2018 | 5,450 | 5,668,000 | ||||||||||||
| Nielsen Finance LLC/Nielsen Finance Co. | 11.50% | 5/1/2016 | 2,750 | 3,190,000 | ||||||||||||
| Nielsen Finance LLC/Nielsen Finance Co. (12.50% after 8/1/2011)~ | Zero Coupon | 8/1/2016 | 18,000 | 18,990,000 | ||||||||||||
| WMG Acquisition Corp. | 7.375% | 4/15/2014 | 14,000 | 13,510,000 | ||||||||||||
| WMG Acquisition Corp. | 9.50% | 6/15/2016 | 25,000 | 26,937,500 | ||||||||||||
| Total | 131,602,000 | |||||||||||||||
| Medical Products 0.24% | ||||||||||||||||
| Bio-Rad Laboratories, Inc. | 8.00% | 9/15/2016 | 12,500 | 13,625,000 | ||||||||||||
| Life Technologies Corp. | 6.00% | 3/1/2020 | 5,300 | 5,687,070 | ||||||||||||
| Total | 19,312,070 | |||||||||||||||
| Metals/Mining (Excluding Steel) 2.78% | ||||||||||||||||
| Arch Coal, Inc. | 7.25% | 10/1/2020 | 2,600 | 2,756,000 | ||||||||||||
| Arch Coal, Inc. | 8.75% | 8/1/2016 | 13,094 | 14,337,930 | ||||||||||||
| Cliffs Natural Resources, Inc. | 5.90% | 3/15/2020 | 10,000 | 10,554,080 | ||||||||||||
| CONSOL Energy, Inc.† | 8.25% | 4/1/2020 | 15,000 | 16,275,000 | ||||||||||||
| FMG Resources (August 2006) Pty Ltd. (Australia)†(b) | 6.875% | 2/1/2018 | 18,000 | 18,000,000 | ||||||||||||
| FMG Resources (August 2006) Pty Ltd. (Australia)†(b) | 7.00% | 11/1/2015 | 7,300 | 7,519,000 | ||||||||||||
| Foundation PA Coal Co. | 7.25% | 8/1/2014 | 14,000 | 14,315,000 | ||||||||||||
| Freeport-McMoRan Copper & Gold, Inc. | 8.375% | 4/1/2017 | 15,000 | 16,614,105 | ||||||||||||
| Gold Fields Orogen Holding BVI Ltd.† | 4.875% | 10/7/2020 | 14,500 | 13,897,656 | ||||||||||||
| Murray Energy Corp.† | 10.25% | 10/15/2015 | 10,000 | 10,550,000 | ||||||||||||
| Noranda Aluminum Acquisition Corp. PIK | 5.193% | # | 5/15/2015 | 16,361 | 14,734,611 | |||||||||||
| Novelis, Inc.† | 8.75% | 12/15/2020 | 9,500 | 9,903,750 | ||||||||||||
See Notes to Financial Statements.
25
Schedule of Investments (continued)
December 31, 2010
| Investments | Interest Rate | Maturity Date | Principal Amount (000) | Value | ||||||||||||
| Metals/Mining (Excluding Steel) (continued) | ||||||||||||||||
| Old AII, Inc. PIK(f) | 9.00% | 12/15/2014 | $ | 7,500 | $ | 33,750 | ||||||||||
| Old AII, Inc.(f) | 10.00% | 12/15/2016 | 14,175 | 35,579 | ||||||||||||
| Patriot Coal Corp. | 8.25% | 4/30/2018 | 12,500 | 12,781,250 | ||||||||||||
| Peabody Energy Corp. | 5.875% | 4/15/2016 | 12,250 | 12,372,500 | ||||||||||||
| Peabody Energy Corp. | 7.375% | 11/1/2016 | 9,300 | 10,369,500 | ||||||||||||
| Penn Virginia Resource Partners LP/Penn Virginia Resource Finance Corp. | 8.25% | 4/15/2018 | 14,275 | 14,774,625 | ||||||||||||
| Teck Resources Ltd. (Canada)(b) | 10.75% | 5/15/2019 | 18,000 | 23,434,524 | ||||||||||||
| Total | 223,258,860 | |||||||||||||||
| Monoline Insurance 0.20% | ||||||||||||||||
| Fidelity National Financial, Inc. | 6.60% | 5/15/2017 | 16,250 | 16,234,270 | ||||||||||||
| Multi-Line Insurance 0.16% | ||||||||||||||||
| AXA SA (France)†(b) | 6.379% | — | (g) | 11,225 | 10,256,844 | |||||||||||
| ZFS Finance (USA) Trust V† | 6.50% | 5/9/2037 | 3,024 | 2,963,520 | ||||||||||||
| Total | 13,220,364 | |||||||||||||||
| Oil Field Equipment & Services 0.75% | ||||||||||||||||
| Complete Production Services, Inc. | 8.00% | 12/15/2016 | 17,125 | 17,810,000 | ||||||||||||
| Key Energy Services, Inc. | 8.375% | 12/1/2014 | 8,600 | 9,116,000 | ||||||||||||
| Precision Drilling Corp. (Canada)†(b) | 6.625% | 11/15/2020 | 5,700 | 5,814,000 | ||||||||||||
| SEACOR Holdings, Inc. | 7.375% | 10/1/2019 | 19,750 | 20,518,769 | ||||||||||||
| Trinidad Drilling Ltd. (Canada)†(b) | 7.875% | 1/15/2019 | 6,600 | 6,699,000 | ||||||||||||
| Total | 59,957,769 | |||||||||||||||
| Oil Refining & Marketing 0.24% | ||||||||||||||||
| Tesoro Corp. | 9.75% | 6/1/2019 | 17,000 | 18,912,500 | ||||||||||||
| Packaging 2.73% | ||||||||||||||||
| Ardagh Packaging Finance plc (Ireland)†(b) | 7.375% | 10/15/2017 | 7,775 | 8,056,844 | ||||||||||||
| Ardagh Packaging Finance plc (Ireland)†(b) | 9.125% | 10/15/2020 | 9,500 | 9,927,500 | ||||||||||||
| Ball Corp. | 6.625% | 3/15/2018 | 10,000 | 10,225,000 | ||||||||||||
| Ball Corp. | 7.375% | 9/1/2019 | 10,000 | 10,800,000 | ||||||||||||
| Crown Americas LLC/Crown Americas Capital Corp. II | 7.625% | 5/15/2017 | 10,000 | 10,750,000 | ||||||||||||
| Crown Cork & Seal Co., Inc. | 7.375% | 12/15/2026 | 47,770 | 47,650,575 | ||||||||||||
| Graham Packaging Co. LP/GPC Capital Corp. I | 8.25% | 1/1/2017 | 10,000 | 10,450,000 | ||||||||||||
| Graham Packaging Co. LP/GPC Capital Corp. I | 8.25% | 10/1/2018 | 7,500 | 7,912,500 | ||||||||||||
| Graphic Packaging International, Inc. | 9.50% | 8/15/2013 | 13,607 | 13,947,175 | ||||||||||||
See Notes to Financial Statements.
26
Schedule of Investments (continued)
December 31, 2010
| Investments | Interest Rate | Maturity Date | Principal Amount (000) | Value | ||||||||||||
| Packaging (continued) | ||||||||||||||||
| Reynolds Group Issuer, Inc./Reynolds Group Issuer LLC/Reynolds Group Issuer Luxembourg SA† | 7.125% | 4/15/2019 | $ | 5,000 | $ | 5,112,500 | ||||||||||
| Reynolds Group Issuer, Inc./Reynolds Group Issuer LLC/Reynolds Group Issuer Luxembourg SA† | 7.75% | 10/15/2016 | 21,500 | 22,843,750 | ||||||||||||
| Reynolds Group Issuer, Inc./Reynolds Group Issuer LLC/Reynolds Group Issuer Luxembourg SA† | 8.50% | 5/15/2018 | 12,000 | 12,120,000 | ||||||||||||
| Reynolds Group Issuer, Inc./Reynolds Group Issuer LLC/Reynolds Group Issuer Luxembourg SA† | 9.00% | 4/15/2019 | 6,500 | 6,768,125 | ||||||||||||
| Sealed Air Corp. | 7.875% | 6/15/2017 | 15,000 | 16,516,485 | ||||||||||||
| Solo Cup Co. | 8.50% | 2/15/2014 | 15,400 | 13,937,000 | ||||||||||||
| Vitro SA de CV (Mexico)(b)(f) | 9.125% | 2/1/2017 | 20,000 | 12,300,000 | ||||||||||||
| Total | 219,317,454 | |||||||||||||||
| Pharmaceuticals 0.36% | ||||||||||||||||
| Axcan Intermediate Holdings, Inc. | 12.75% | 3/1/2016 | 10,000 | 10,325,000 | ||||||||||||
| Genzyme Corp. | 3.625% | 6/15/2015 | 4,500 | 4,624,578 | ||||||||||||
| Mylan, Inc.† | 7.625% | 7/15/2017 | 5,250 | 5,610,938 | ||||||||||||
| Mylan, Inc.† | 7.875% | 7/15/2020 | 7,500 | 8,118,750 | ||||||||||||
| Total | 28,679,266 | |||||||||||||||
| Printing & Publishing 0.15% | ||||||||||||||||
| ProQuest LLC/ProQuest Notes Co.† | 9.00% | 10/15/2018 | 11,625 | 12,031,875 | ||||||||||||
| Property & Casualty 0.30% | ||||||||||||||||
| Liberty Mutual Group, Inc.† | 10.75% | 6/15/2058 | 20,000 | 24,400,000 | ||||||||||||
| Real Estate Investment Trusts 1.35% | ||||||||||||||||
| Developers Diversified Realty Corp. | 7.875% | 9/1/2020 | 11,000 | 12,339,701 | ||||||||||||
| DuPont Fabros Technology LP | 8.50% | 12/15/2017 | 13,875 | 14,915,625 | ||||||||||||
| Goodman Funding Pty Ltd. (Australia)†(b) | 6.375% | 11/12/2020 | 12,000 | 11,530,428 | ||||||||||||
| Health Care REIT, Inc. | 6.125% | 4/15/2020 | 10,000 | 10,545,310 | ||||||||||||
| Kilroy Realty LP | 5.00% | 11/3/2015 | 8,000 | 7,950,416 | ||||||||||||
| ProLogis | 5.625% | 11/15/2016 | 12,000 | 12,348,240 | ||||||||||||
| ProLogis | 6.875% | 3/15/2020 | 21,000 | 22,334,382 | ||||||||||||
| ProLogis | 8.65% | 5/15/2016 | 11,475 | 13,096,658 | ||||||||||||
| Ventas Realty LP/Ventas Capital Corp. | 3.125% | 11/30/2015 | 3,700 | 3,568,898 | ||||||||||||
| Total | 108,629,658 | |||||||||||||||
See Notes to Financial Statements.
27
Schedule of Investments (continued)
December 31, 2010
| Investments | Interest Rate | Maturity Date | Principal Amount (000) | Value | ||||||||||||
| Restaurants 0.48% | ||||||||||||||||
| DineEquity, Inc.† | 9.50% | 10/30/2018 | $ | 6,425 | $ | 6,842,625 | ||||||||||
| Dunkin’ Finance Corp.† | 9.625% | 12/1/2018 | 7,500 | 7,612,500 | ||||||||||||
| Wendy’s/Arby’s Restaurants LLC | 10.00% | 7/15/2016 | 22,500 | 24,525,000 | ||||||||||||
| Total | 38,980,125 | |||||||||||||||
| Software/Services 1.65% | ||||||||||||||||
| Buccaneer Merger Sub, Inc.† | 9.125% | 1/15/2019 | 10,500 | 10,893,750 | ||||||||||||
| Ceridian Corp. | 11.25% | 11/15/2015 | 6,750 | 6,716,250 | ||||||||||||
| Fidelity National Information Services, Inc.† | 7.625% | 7/15/2017 | 5,000 | 5,287,500 | ||||||||||||
| First Data Corp.† | 8.25% | 1/15/2021 | 11,243 | 10,849,495 | ||||||||||||
| First Data Corp. | 9.875% | 9/24/2015 | 2,514 | 2,407,155 | ||||||||||||
| First Data Corp.† | 12.625% | 1/15/2021 | 11,243 | 10,793,280 | ||||||||||||
| SERENA Software, Inc. | 10.375% | 3/15/2016 | 7,600 | 7,809,000 | ||||||||||||
| SunGard Data Systems, Inc.† | 7.375% | 11/15/2018 | 15,250 | 15,402,500 | ||||||||||||
| SunGard Data Systems, Inc.† | 7.625% | 11/15/2020 | 6,100 | 6,206,750 | ||||||||||||
| SunGard Data Systems, Inc. | 10.25% | 8/15/2015 | 37,725 | 39,752,719 | ||||||||||||
| Unisys Corp.† | 14.25% | 9/15/2015 | 4,006 | 4,797,185 | ||||||||||||
| Vangent, Inc. | 9.625% | 2/15/2015 | 12,500 | 11,375,000 | ||||||||||||
| Total | 132,290,584 | |||||||||||||||
| Specialty Retail 1.47% | ||||||||||||||||
| Brookstone Co., Inc.† | 13.00% | 10/15/2014 | 7,821 | 7,253,977 | ||||||||||||
| Limited Brands, Inc. | 7.00% | 5/1/2020 | 15,000 | 15,900,000 | ||||||||||||
| Limited Brands, Inc. | 7.60% | 7/15/2037 | 7,500 | 7,387,500 | ||||||||||||
| Limited Brands, Inc. | 8.50% | 6/15/2019 | 12,500 | 14,343,750 | ||||||||||||
| PETCO Animal Supplies, Inc.† | 9.25% | 12/1/2018 | 6,700 | 7,093,625 | ||||||||||||
| QVC, Inc.† | 7.125% | 4/15/2017 | 7,800 | 8,209,500 | ||||||||||||
| QVC, Inc.† | 7.375% | 10/15/2020 | 17,500 | 18,418,750 | ||||||||||||
| Toys “R” Us Property Co. I LLC | 10.75% | 7/15/2017 | 23,575 | 26,993,375 | ||||||||||||
| Toys “R” Us Property Co. II LLC | 8.50% | 12/1/2017 | 12,000 | 12,960,000 | ||||||||||||
| Total | 118,560,477 | |||||||||||||||
| Steel Producers/Products 0.84% | ||||||||||||||||
| AK Steel Corp. | 7.625% | 5/15/2020 | 4,850 | 4,886,375 | ||||||||||||
| Algoma Acquisition Corp. (Canada)†(b) | 9.875% | 6/15/2015 | 18,700 | 16,923,500 | ||||||||||||
| Allegheny Ludlum Corp. | 6.95% | 12/15/2025 | 13,875 | 14,499,264 | ||||||||||||
| Allegheny Technologies, Inc. | 9.375% | 6/1/2019 | 10,200 | 11,934,000 | ||||||||||||
| Essar Steel Algoma, Inc. (Canada)†(b) | 9.375% | 3/15/2015 | 11,000 | 11,123,750 | ||||||||||||
| Steel Dynamics, Inc.† | 7.625% | 3/15/2020 | 7,500 | 8,062,500 | ||||||||||||
| Total | 67,429,389 | |||||||||||||||
See Notes to Financial Statements.
28
Schedule of Investments (continued)
December 31, 2010
| Investments | Interest Rate | Maturity Date | Principal Amount (000) | Value | ||||||||||||
| Support: Services 2.05% | ||||||||||||||||
| Avis Budget Car Rental | 9.625% | 3/15/2018 | $ | 13,675 | $ | 14,803,187 | ||||||||||
| Corrections Corp. of America | 7.75% | 6/1/2017 | 28,000 | 29,855,000 | ||||||||||||
| Diversey, Inc. | 8.25% | 11/15/2019 | 8,150 | 8,883,500 | ||||||||||||
| Expedia, Inc. | 8.50% | 7/1/2016 | 14,250 | 15,675,000 | ||||||||||||
| FTI Consulting, Inc.† | 6.75% | 10/1/2020 | 6,500 | 6,483,750 | ||||||||||||
| FTI Consulting, Inc. | 7.75% | 10/1/2016 | 12,075 | 12,497,625 | ||||||||||||
| Hertz Corp. (The)† | 7.50% | 10/15/2018 | 20,000 | 20,850,000 | ||||||||||||
| Iron Mountain, Inc. | 8.375% | 8/15/2021 | 11,250 | 12,121,875 | ||||||||||||
| PHH Corp.† | 9.25% | 3/1/2016 | 5,750 | 6,095,000 | ||||||||||||
| Travelport LLC | 9.875% | 9/1/2014 | 8,000 | 7,830,000 | ||||||||||||
| Travelport LLC/Travelport, Inc. | 9.00% | 3/1/2016 | 18,500 | 18,014,375 | ||||||||||||
| United Rentals (North America), Inc. | 10.875% | 6/15/2016 | 10,000 | 11,475,000 | ||||||||||||
| Total | 164,584,312 | |||||||||||||||
| Telecommunications: Integrated/Services 2.30% | ||||||||||||||||
| CenturyLink, Inc. | 6.15% | 9/15/2019 | 6,500 | 6,530,537 | ||||||||||||
| Equinix, Inc. | 8.125% | 3/1/2018 | 11,750 | 12,337,500 | ||||||||||||
| Hellas II (Luxembourg)†(b)(f) | 6.001% | # | 1/15/2015 | 15,000 | 112,500 | |||||||||||
| Hughes Network Systems LLC | 9.50% | 4/15/2014 | 11,500 | 11,916,875 | ||||||||||||
| Hughes Network Systems LLC | 9.50% | 4/15/2014 | 18,450 | 19,118,812 | ||||||||||||
| Intelsat Jackson Holdings SA (Luxembourg)(b) | 11.25% | 6/15/2016 | 11,000 | 11,907,500 | ||||||||||||
| Intelsat Luxembourg SA (Luxembourg)(b) | 11.25% | 2/4/2017 | 35,300 | 38,653,500 | ||||||||||||
| MasTec, Inc. | 7.625% | 2/1/2017 | 12,500 | 12,500,000 | ||||||||||||
| Qwest Communications International, Inc. | 8.00% | 10/1/2015 | 9,100 | 9,828,000 | ||||||||||||
| Telecom Italia Capital SA (Italy)(b) | 7.175% | 6/18/2019 | 5,250 | 5,626,094 | ||||||||||||
| Telefonica Emisiones SAU (Spain)(b) | 7.045% | 6/20/2036 | 6,700 | 6,875,728 | ||||||||||||
| Telemar Norte Leste SA (Brazil)†(b) | 5.50% | 10/23/2020 | 9,532 | 9,222,210 | ||||||||||||
| Valor Telecommunications Enterprises LLC | 7.75% | 2/15/2015 | 12,000 | 12,381,000 | ||||||||||||
| Windstream Corp. | 7.00% | 3/15/2019 | 28,000 | 27,720,000 | ||||||||||||
| Total | 184,730,256 | |||||||||||||||
| Telecommunications: Wireless 4.58% | ||||||||||||||||
| CC Holdings GS V LLC/Crown Castle GS III Corp.† | 7.75% | 5/1/2017 | 40,000 | 43,900,000 | ||||||||||||
| Clearwire Communications LLC/Clearwire Finance, Inc.† | 12.00% | 12/1/2017 | 3,800 | 3,942,500 | ||||||||||||
| Digicel Group Ltd. (Jamaica)†(b) | 10.50% | 4/15/2018 | 12,000 | 13,260,000 | ||||||||||||
| DigitalGlobe, Inc. | 10.50% | 5/1/2014 | 33,250 | 38,112,812 | ||||||||||||
| GeoEye, Inc. | 8.625% | 10/1/2016 | 3,500 | 3,675,000 | ||||||||||||
| GeoEye, Inc. | 9.625% | 10/1/2015 | 17,000 | 19,295,000 | ||||||||||||
See Notes to Financial Statements.
29
Schedule of Investments (continued)
December 31, 2010
| Investments | Interest Rate | Maturity Date | Principal Amount (000) | Value | ||||||||||||
| Telecommunications: Wireless (continued) | ||||||||||||||||
| Inmarsat Finance plc (United Kingdom)†(b) | 7.375% | 12/1/2017 | $ | 10,000 | $ | 10,550,000 | ||||||||||
| iPCS, Inc. PIK | 3.537% | # | 5/1/2014 | 4,868 | 4,697,394 | |||||||||||
| MetroPCS Wireless, Inc. | 6.625% | 11/15/2020 | 29,000 | 27,695,000 | ||||||||||||
| MetroPCS Wireless, Inc. | 7.875% | 9/1/2018 | 20,000 | 20,850,000 | ||||||||||||
| NII Capital Corp. | 8.875% | 12/15/2019 | 16,250 | 17,590,625 | ||||||||||||
| NII Capital Corp. | 10.00% | 8/15/2016 | 15,840 | 17,622,000 | ||||||||||||
| SBA Telecommunications, Inc. | 8.25% | 8/15/2019 | 10,000 | 10,975,000 | ||||||||||||
| Sprint Capital Corp. | 6.90% | 5/1/2019 | 45,000 | 44,662,500 | ||||||||||||
| Sprint Nextel Corp. | 8.375% | 8/15/2017 | 25,000 | 26,937,500 | ||||||||||||
| Telemovil Finance Co. Ltd. (El Salvador)†(b) | 8.00% | 10/1/2017 | 11,450 | 11,850,750 | ||||||||||||
| ViaSat, Inc. | 8.875% | 9/15/2016 | 12,750 | 13,642,500 | ||||||||||||
| Wind Acquisition Finance SA (Italy)†(b) | 7.25% | 2/15/2018 | 14,000 | 14,280,000 | ||||||||||||
| Wind Acquisition Finance SA (Italy)†(b) | 11.75% | 7/15/2017 | 21,625 | 24,490,313 | ||||||||||||
| Total | 368,028,894 | |||||||||||||||
| Theaters & Entertainment 0.54% | ||||||||||||||||
| AMC Entertainment, Inc. | 8.00% | 3/1/2014 | 6,000 | 6,090,000 | ||||||||||||
| Cinemark USA, Inc. | 8.625% | 6/15/2019 | 15,500 | 16,856,250 | ||||||||||||
| Live Nation Entertainment, Inc.† | 8.125% | 5/15/2018 | 20,000 | 20,350,000 | ||||||||||||
| Total | 43,296,250 | |||||||||||||||
| Transportation (Excluding Air/Rail) 0.25% | ||||||||||||||||
| Asciano Finance Ltd. (Australia)†(b) | 4.625% | 9/23/2020 | 9,750 | 9,059,466 | ||||||||||||
| Commercial Barge Line Co. | 12.50% | 7/15/2017 | 9,500 | 11,020,000 | ||||||||||||
| Total | 20,079,466 | |||||||||||||||
| Total High Yield Corporate Bonds (cost $5,904,927,714) | 6,185,079,408 | |||||||||||||||
| MUNICIPAL BONDS 0.25% | ||||||||||||||||
| Other Revenue 0.18% | ||||||||||||||||
| Metro Govt of Nashville & Davidson Cnty TN Convtn Ctr Auth Build America Bds Ser B | 6.731% | 7/1/2043 | 14,650 | 14,440,798 | ||||||||||||
| Transportation 0.07% | ||||||||||||||||
| Chicago IL O’Hare Intl Arpt Build America Bds Ser B | 6.395% | 1/1/2040 | 5,980 | 5,649,485 | ||||||||||||
| Total Municipal Bonds (cost $20,924,027) | 20,090,283 | |||||||||||||||
See Notes to Financial Statements.
30
Schedule of Investments (continued)
December 31, 2010
| Investments | Interest Rate | Shares (000) | Value | |||||||||||||
| NON-CONVERTIBLE PREFERRED STOCKS 0.18% | ||||||||||||||||
| Agency/Government Related 0.01% | ||||||||||||||||
| Fannie Mae* | Zero Coupon | 481 | $ | 269,584 | ||||||||||||
| Banking 0.17% | ||||||||||||||||
| Citigroup Capital XIII* | 7.875% | 131 | 3,519,828 | |||||||||||||
| US Bancorp* | 7.189% | 13 | 10,307,375 | |||||||||||||
| Total | 13,827,203 | |||||||||||||||
| Total Non-Convertible Preferred Stocks (cost $23,964,030) | 14,096,787 | |||||||||||||||
Exercise | Expiration Date | |||||||||||||||
| WARRANTS 0.03% | ||||||||||||||||
| Auto Parts & Equipment 0.02% | ||||||||||||||||
| Cooper-Standard Holdings, Inc.* | $27.33 | 11/27/2017 | 46 | 1,042,492 | ||||||||||||
| Cooper-Standard Holdings, Inc.*(a) | 27.33 | 11/27/2017 | 37 | 836,325 | ||||||||||||
| Total | 1,878,817 | |||||||||||||||
| Media: Cable 0.01% | ||||||||||||||||
| Charter Communications, Inc.* | 46.86 | 11/30/2014 | 84 | 693,644 | ||||||||||||
| Total Warrants (cost $1,116,680) | 2,572,461 | |||||||||||||||
| Total Long-Term Investments (cost $7,419,277,229) | 7,897,280,463 | |||||||||||||||
Principal | ||||||||||||||||
| SHORT-TERM INVESTMENT 0.83% | ||||||||||||||||
| Repurchase Agreement | ||||||||||||||||
| Repurchase Agreement dated 12/31/2010, 0.04% due 1/3/2011 with Fixed Income Clearing Corp. collateralized by $21,075,000 of Federal Home Loan Mortgage Corp. at 4.00% due 6/12/2013 and $41,675,000 of Federal National Mortgage Assoc. at 4.625% due 5/1/2013; value: $67,872,406 proceeds: $66,536,878 (cost $66,536,656) | $ | 66,537 | 66,536,656 | |||||||||||||
| Total Investments in Securities 99.04% (cost $7,485,813,885) | 7,963,817,119 | |||||||||||||||
| Cash and Other Assets in Excess of Liabilities(h) 0.96% | 77,511,334 | |||||||||||||||
| Net Assets 100.00% | $ | 8,041,328,453 | ||||||||||||||
See Notes to Financial Statements.
31
Schedule of Investments (concluded)
December 31, 2010
| EUR | euro. | |
| PIK | Payment-in-kind. | |
| * | Non-income producing security. | |
| † | Security was purchased pursuant to Rule 144A under the Securities Act of 1933 and, unless registered under the Act or exempted from registration, may only be resold to qualified institutional investors. Unless otherwise noted, 144A securities are deemed to be liquid. | |
| ~ | Deferred interest debentures pay the stated rate, after which they pay a predetermined interest rate. | |
| # | Variable rate security. The interest rate represents the rate in effect at December 31, 2010. | |
| (a) | Restricted securities of Cooper Standard Holdings, Inc. acquired through private placement during the fiscal year ended December 31, 2010 are as follows: |
| Investment Type | Acquisition Date | Acquired Shares | Cost on Acquisition Date | Fair value per share at December 31, 2010 | ||||
Common Stock | May 24, 2010 | 641,740 | $14,133,517 | $45.00 | ||||
Convertible Preferred Stock | May 24, 2010 | 21,945 | 2,194,500 | 185.00 | ||||
Convertible Preferred Stock | July 19, 2010 | 227 | 22,700 | 185.00 | ||||
Warrant | May 27, 2010 | 37,170 | – | 22.50 |
| (b) | Foreign security traded in U.S. dollars. | |
| (c) | Restricted security. The Fund acquired 1,597,250 shares in a private placement on June 11, 2009 for a cost of $29,948,438. The fair value per share on December 31, 2010 is $38.94. | |
| (d) | Floating Rate Loans in which the Fund invests generally pay interest at rates which are periodically re-determined at a margin above the London Interbank Offered Rate (“LIBOR”) or the prime rate offered by major U.S. banks. The rate(s) shown is the rate(s) in effect at December 31, 2010. | |
| (e) | Investment in non-U.S. dollar denominated securities. | |
| (f) | Defaulted security. | |
| (g) | Security is perpetual in nature and has no stated maturity. | |
| (h) | Cash and Other Assets in Excess of Liabilities include net unrealized appreciation on open futures contracts, as follows: |
| Open Futures Contracts At December 31, 2010: | ||||||||||||||||||
| Type | Expiration | Contracts | Position | Market Value | Unrealized Appreciation | |||||||||||||
| U.S. 10-Year Treasury Note | March 2011 | 1,000 | Short | $ | (120,437,500 | ) | $ | 3,582,907 | ||||||||||
See Notes to Financial Statements.
32
Statement of Assets and Liabilities
December 31, 2010
ASSETS: | ||||
Investments in securities, at value (cost $7,485,813,885) | $ | 7,963,817,119 | ||
Deposits with broker for futures collateral | 1,600,000 | |||
Cash | 1,397,668 | |||
Receivables: | ||||
Interest and dividends | 118,944,507 | |||
Capital shares sold | 44,898,376 | |||
Investment securities sold | 26,847,629 | |||
Prepaid expenses and other assets | 199,575 | |||
Total assets | 8,157,704,874 | |||
LIABILITIES: | ||||
Payables: | ||||
Investment securities purchased | 42,872,407 | |||
Capital shares reacquired | 22,211,782 | |||
12b-1 distribution fees | 4,673,591 | |||
Management fee | 3,089,822 | |||
Directors’ fees | 1,247,093 | |||
Variation margin | 453,029 | |||
Fund administration | 272,763 | |||
To affiliates (See Note 3) | 22,117 | |||
Distributions payable | 39,999,685 | |||
Accrued expenses | 1,534,132 | |||
Total liabilities | 116,376,421 | |||
NET ASSETS | $ | 8,041,328,453 | ||
COMPOSITION OF NET ASSETS: | ||||
Paid-in capital | $ | 7,970,090,177 | ||
Distributions in excess of net investment income | (48,851,298 | ) | ||
Accumulated net realized loss on investments, futures contracts and foreign currency related transactions | (361,496,823 | ) | ||
Net unrealized appreciation on investments, futures contracts and translation of assets and liabilities denominated in foreign currencies | 481,586,397 | |||
Net Assets | $ | 8,041,328,453 |
See Notes to Financial Statements.
33
Statement of Assets and Liabilities (concluded)
December 31, 2010
Net assets by class: | ||||
Class A Shares | $ | 4,415,645,061 | ||
Class B Shares | $ | 530,339,731 | ||
Class C Shares | $ | 1,866,405,152 | ||
Class F Shares | $ | 695,689,112 | ||
Class I Shares | $ | 353,941,310 | ||
Class P Shares | $ | 143,082,843 | ||
Class R2 Shares | $ | 1,234,452 | ||
Class R3 Shares | $ | 34,990,792 | ||
Outstanding shares by class: | ||||
Class A Shares (1.14 billion shares of common stock authorized, $.001 par value) | 565,470,751 | |||
Class B Shares (500 million shares of common stock authorized, $.001 par value) | 67,680,251 | |||
Class C Shares (600 million shares of common stock authorized, $.001 par value) | 238,421,797 | |||
Class F Shares (300 million shares of common stock authorized, $.001 par value) | 89,234,021 | |||
Class I Shares (300 million shares of common stock authorized, $.001 par value) | 45,531,074 | |||
Class P Shares (160 million shares of common stock authorized, $.001 par value) | 17,939,748 | |||
Class R2 Shares (300 million shares of common stock authorized, $.001 par value) | 158,101 | |||
Class R3 Shares (300 million shares of common stock authorized, $.001 par value) | 4,488,440 | |||
Net asset value, offering and redemption price per share | ||||
Class A Shares-Net asset value | $7.81 | |||
Class A Shares-Maximum offering price | $8.20 | |||
Class B Shares-Net asset value | $7.84 | |||
Class C Shares-Net asset value | $7.83 | |||
Class F Shares-Net asset value | $7.80 | |||
Class I Shares-Net asset value | $7.77 | |||
Class P Shares-Net asset value | $7.98 | |||
Class R2 Shares-Net asset value | $7.81 | |||
Class R3 Shares-Net asset value | $7.80 |
See Notes to Financial Statements.
34
Statement of Operations
For the Year Ended December 31, 2010
Investment income: | ||||
Dividends (net of foreign withholding taxes of $2,509) | $ | 22,674,044 | ||
Interest and other | 553,229,430 | |||
Total investment income | 575,903,474 | |||
Expenses: | ||||
Management fee | 36,461,629 | |||
12b-1 distribution plan-Class A | 15,677,046 | |||
12b-1 distribution plan-Class B | 6,291,211 | |||
12b-1 distribution plan-Class C | 18,684,667 | |||
12b-1 distribution plan-Class F | 575,779 | |||
12b-1 distribution plan-Class P | 653,253 | |||
12b-1 distribution plan-Class R2 | 5,654 | |||
12b-1 distribution plan-Class R3 | 140,319 | |||
Shareholder servicing | 8,260,893 | |||
Fund administration | 3,218,811 | |||
Reports to shareholders | 603,477 | |||
Subsidy (See Note 3) | 355,142 | |||
Registration | 351,307 | |||
Directors’ fees | 324,216 | |||
Professional | 124,240 | |||
Custody | 119,904 | |||
Other | 288,209 | |||
Gross expenses | 92,135,757 | |||
Expense reductions (See Note 7) | (10,484 | ) | ||
Net expenses | 92,125,273 | |||
Net investment income | 483,778,201 | |||
Net realized and unrealized gain: | ||||
Net realized gain on investments, futures contracts and foreign currency related transactions | 227,859,128 | |||
Net change in unrealized appreciation/depreciation on investments, futures contracts and translation of assets and liabilities denominated in foreign currencies | 256,550,239 | |||
Net realized and unrealized gain | 484,409,367 | |||
Net Increase in Net Assets Resulting From Operations | $ | 968,187,568 |
See Notes to Financial Statements.
35
Statements of Changes in Net Assets
| INCREASE (DECREASE) IN NET ASSETS | For the Year Ended December 31, 2010 | For the Year Ended December 31, 2009 | ||||||
Operations: | ||||||||
Net investment income | $ | 483,778,201 | $ | 465,066,385 | ||||
Net realized gain (loss) on investments, futures contracts and foreign currency related transactions | 227,859,128 | (258,256,792 | ) | |||||
Net change in unrealized appreciation/depreciation on investments, futures contracts and translation of assets and liabilities denominated in foreign currencies | 256,550,239 | 1,931,773,219 | ||||||
Net increase in net assets resulting from operations | 968,187,568 | 2,138,582,812 | ||||||
Distributions to shareholders from: | ||||||||
Net investment income | ||||||||
Class A | (274,946,555 | ) | (317,335,074 | ) | ||||
Class B | (34,252,312 | ) | (49,605,957 | ) | ||||
Class C | (102,248,065 | ) | (104,904,428 | ) | ||||
Class F | (36,820,969 | ) | (20,364,092 | ) | ||||
Class I | (20,369,323 | ) | (19,645,945 | ) | ||||
Class P | (8,598,647 | ) | (9,264,735 | ) | ||||
Class R2 | (55,546 | ) | (37,136 | ) | ||||
Class R3 | (1,695,379 | ) | (777,509 | ) | ||||
Total distributions to shareholders | (478,986,796 | ) | (521,934,876 | ) | ||||
Capital share transactions (Net of share conversions) (See Note 11): |
| |||||||
Net proceeds from sales of shares | 1,450,866,902 | 2,766,846,679 | ||||||
Reinvestment of distributions | 402,759,836 | 374,204,151 | ||||||
Cost of shares reacquired | (2,514,775,434 | ) | (1,884,665,385 | ) | ||||
Net increase (decrease) in net assets resulting from capital share transactions | (661,148,696 | ) | 1,256,385,445 | |||||
Net increase (decrease) in net assets | (171,947,924 | ) | 2,873,033,381 | |||||
NET ASSETS: | ||||||||
Beginning of year | $ | 8,213,276,377 | $ | 5,340,242,996 | ||||
End of year | $ | 8,041,328,453 | $ | 8,213,276,377 | ||||
Distributions in excess of net investment income | $ | (48,851,298 | ) | $ | (63,511,933 | ) | ||
See Notes to Financial Statements.
36
Financial Highlights
| Class A Shares | ||||||||||||||||||||
| Year Ended 12/31 | ||||||||||||||||||||
| 2010 | 2009 | 2008 | 2007 | 2006 | ||||||||||||||||
Per Share Operating Performance | ||||||||||||||||||||
Net asset value, beginning of year | $7.35 | $5.86 | $ 7.92 | $8.02 | $7.80 | |||||||||||||||
Investment operations: | ||||||||||||||||||||
Net investment income(a) | .47 | .45 | .47 | .46 | .43 | |||||||||||||||
Net realized and unrealized gain (loss) | .45 | 1.55 | (2.01 | ) | (.04 | ) | .31 | |||||||||||||
Total from investment operations | .92 | 2.00 | (1.54 | ) | .42 | .74 | ||||||||||||||
Distributions to shareholders from: | ||||||||||||||||||||
Net investment income | (.46 | ) | (.51 | ) | (.52 | ) | (.52 | ) | (.52 | ) | ||||||||||
Net asset value, end of year | $7.81 | $7.35 | $ 5.86 | $7.92 | $8.02 | |||||||||||||||
Total Return(b) | 12.94 | % | 35.37 | % | (20.26 | )% | 5.34 | % | 9.87 | % | ||||||||||
Ratios to Average Net Assets: | ||||||||||||||||||||
Expenses, including expense reductions | .97 | % | 1.00 | % | 1.00 | % | .99 | % | .99 | % | ||||||||||
Expenses, excluding expense reductions | .97 | % | 1.00 | % | 1.00 | % | .99 | % | .99 | % | ||||||||||
Net investment income | 6.19 | % | 6.82 | % | 6.63 | % | 5.73 | % | 5.54 | % | ||||||||||
| Supplemental Data: | ||||||||||||||||||||
Net assets, end of year (000) | $4,415,645 | $4,709,961 | $3,316,663 | $4,526,753 | $4,731,545 | |||||||||||||||
Portfolio turnover rate | 42.65 | % | 41.93 | % | 29.01 | % | 40.08 | % | 32.40 | % | ||||||||||
| (a) | Calculated using average shares outstanding during the year. |
| (b) | Total return does not consider the effects of sales loads and assumes the reinvestment of all distributions. |
See Notes to Financial Statements.
37
Financial Highlights (continued)
| Class B Shares | ||||||||||||||||||||
| Year Ended 12/31 | ||||||||||||||||||||
| 2010 | 2009 | 2008 | 2007 | 2006 | ||||||||||||||||
Per Share Operating Performance |
| |||||||||||||||||||
Net asset value, beginning of year | $7.37 | $5.87 | $ 7.93 | $8.03 | $7.80 | |||||||||||||||
Investment operations: | ||||||||||||||||||||
Net investment income(a) | .42 | .41 | .43 | .41 | .38 | |||||||||||||||
Net realized and unrealized gain (loss) | .46 | 1.55 | (2.02 | ) | (.04 | ) | .32 | |||||||||||||
Total from investment operations | .88 | 1.96 | (1.59 | ) | .37 | .70 | ||||||||||||||
Distributions to shareholders from: | ||||||||||||||||||||
Net investment income | (.41 | ) | (.46 | ) | (.47 | ) | (.47 | ) | (.47 | ) | ||||||||||
Net asset value, end of year | $7.84 | $7.37 | $ 5.87 | $7.93 | $8.03 | |||||||||||||||
Total Return(b) | 12.16 | % | 34.52 | % | (20.82 | )% | 4.63 | % | 9.26 | % | ||||||||||
Ratios to Average Net Assets: | ||||||||||||||||||||
Expenses, including expense reductions | 1.62 | % | 1.65 | % | 1.65 | % | 1.64 | % | 1.64 | % | ||||||||||
Expenses, excluding expense reductions | 1.62 | % | 1.65 | % | 1.65 | % | 1.64 | % | 1.64 | % | ||||||||||
Net investment income | 5.54 | % | 6.21 | % | 5.95 | % | 5.08 | % | 4.88 | % | ||||||||||
| Supplemental Data: | ||||||||||||||||||||
Net assets, end of year (000) | $530,340 | $717,671 | $660,920 | $1,061,150 | $1,269,914 | |||||||||||||||
Portfolio turnover rate | 42.65 | % | 41.93 | % | 29.01 | % | 40.08 | % | 32.40 | % | ||||||||||
| (a) | Calculated using average shares outstanding during the year. |
| (b) | Total return does not consider the effects of sales loads and assumes the reinvestment of all distributions. |
See Notes to Financial Statements.
38
Financial Highlights (continued)
| Class C Shares | ||||||||||||||||||||
| Year Ended 12/31 | ||||||||||||||||||||
| 2010 | 2009 | 2008 | 2007 | 2006 | ||||||||||||||||
Per Share Operating Performance |
| |||||||||||||||||||
Net asset value, beginning of year | $7.36 | $5.87 | $ 7.94 | $8.03 | $7.81 | |||||||||||||||
Investment operations: | ||||||||||||||||||||
Net investment income(a) | .42 | .41 | .43 | .41 | .38 | |||||||||||||||
Net realized and unrealized gain (loss) | .46 | 1.54 | (2.03 | ) | (.03 | ) | .31 | |||||||||||||
Total from investment operations | .88 | 1.95 | (1.60 | ) | .38 | .69 | ||||||||||||||
Distributions to shareholders from: | ||||||||||||||||||||
Net investment income | (.41 | ) | (.46 | ) | (.47 | ) | (.47 | ) | (.47 | ) | ||||||||||
Net asset value, end of year | $7.83 | $7.36 | $ 5.87 | $7.94 | $8.03 | |||||||||||||||
Total Return(b) | 12.34 | % | 34.44 | % | (20.90 | )% | 4.77 | % | 9.13 | % | ||||||||||
Ratios to Average Net Assets: | ||||||||||||||||||||
Expenses, including expense reductions | 1.62 | % | 1.65 | % | 1.65 | % | 1.64 | % | 1.64 | % | ||||||||||
Expenses, excluding expense reductions | 1.62 | % | 1.65 | % | 1.65 | % | 1.64 | % | 1.64 | % | ||||||||||
Net investment income | 5.54 | % | 6.13 | % | 5.98 | % | 5.08 | % | 4.88 | % | ||||||||||
| Supplemental Data: | ||||||||||||||||||||
Net assets, end of year (000) | $1,866,405 | $1,888,177 | $1,018,175 | $1,322,738 | $1,312,440 | |||||||||||||||
Portfolio turnover rate | 42.65 | % | 41.93 | % | 29.01 | % | 40.08 | % | 32.40 | % | ||||||||||
| (a) | Calculated using average shares outstanding during the year. |
| (b) | Total return does not consider the effects of sales loads and assumes the reinvestment of all distributions. |
See Notes to Financial Statements.
39
Financial Highlights (continued)
| Class F Shares | ||||||||||||||||
| Year Ended 12/31 | 9/7/2007(a) to 12/31/2007 | |||||||||||||||
| 2010 | 2009 | 2008 | ||||||||||||||
Per Share Operating Performance | ||||||||||||||||
Net asset value, beginning of period | $7.34 | $5.85 | $ 7.92 | $7.92 | ||||||||||||
Investment operations: | ||||||||||||||||
Net investment income(b) | – | (c) | ||||||||||||||
Net realized and unrealized gain | .03 | |||||||||||||||
Total from investment operations | .03 | |||||||||||||||
Net asset value on SEC Effective Date, 9/14/2007 | $7.95 | |||||||||||||||
Investment operations: | ||||||||||||||||
Net investment income(b) | .48 | .46 | .49 | .15 | ||||||||||||
Net realized and unrealized gain (loss) | .46 | 1.55 | (2.02 | ) | (.04 | ) | ||||||||||
Total from investment operations | .94 | 2.01 | (1.53 | ) | .11 | |||||||||||
Distributions to shareholders from: | ||||||||||||||||
Net investment income | (.48 | ) | (.52 | ) | (.54 | ) | (.14 | ) | ||||||||
Net asset value, end of period | $7.80 | $7.34 | $ 5.85 | $7.92 | ||||||||||||
Total Return(d) | .38 | %(e)(f) | ||||||||||||||
Total Return(d) | 13.24 | % | 35.81 | % | (20.17 | )% | 1.31 | %(e)(g) | ||||||||
Ratios to Average Net Assets: | ||||||||||||||||
Expenses, including expense reductions | .72 | % | .75 | % | .75 | % | .25 | %(e) | ||||||||
Expenses, excluding expense reductions | .72 | % | .75 | % | .75 | % | .25 | %(e) | ||||||||
Net investment income | 6.42 | % | 6.87 | % | 7.44 | % | 1.87 | %(e) | ||||||||
| Supplemental Data: | ||||||||||||||||
Net assets, end of period (000) | $695,689 | $435,085 | $35,771 | $10 | ||||||||||||
Portfolio turnover rate | 42.65 | % | 41.93 | % | 29.01 | % | 40.08 | % | ||||||||
| (a) | Commencement of operations was 9/7/2007, SEC effective date was 9/14/2007 and date shares first became available to the public was 10/1/2007. |
| (b) | Calculated using average shares outstanding during the period. |
| (c) | Amount is less than $.01. |
| (d) | Total return assumes the reinvestment of all distributions. |
| (e) | Not annualized. |
| (f) | Total return for the period 9/7/2007 through 9/14/2007. |
| (g) | Total return for the period 9/14/2007 through 12/31/2007. |
See Notes to Financial Statements.
40
Financial Highlights (continued)
| Class I Shares | ||||||||||||||||||||
| Year Ended 12/31 | ||||||||||||||||||||
| 2010 | 2009 | 2008 | 2007 | 2006 | ||||||||||||||||
Per Share Operating Performance | ||||||||||||||||||||
Net asset value, beginning of year | $7.31 | $5.83 | $ 7.90 | $8.00 | $7.78 | |||||||||||||||
Investment operations: | ||||||||||||||||||||
Net investment income(a) | .49 | .47 | .50 | .49 | .46 | |||||||||||||||
Net realized and unrealized gain (loss) | .46 | 1.54 | (2.02 | ) | (.04 | ) | .31 | |||||||||||||
Total from investment operations | .95 | 2.01 | (1.52 | ) | .45 | .77 | ||||||||||||||
Distributions to shareholders from: | ||||||||||||||||||||
Net investment income | (.49 | ) | (.53 | ) | (.55 | ) | (.55 | ) | (.55 | ) | ||||||||||
Net asset value, end of year | $7.77 | $7.31 | $ 5.83 | $7.90 | $8.00 | |||||||||||||||
Total Return(b) | 13.40 | % | 35.87 | % | (20.14 | )% | 5.72 | % | 10.29 | % | ||||||||||
Ratios to Average Net Assets: | ||||||||||||||||||||
Expenses, including expense reductions | .62 | % | .65 | % | .65 | % | .64 | % | .64 | % | ||||||||||
Expenses, excluding expense reductions | .62 | % | .65 | % | .65 | % | .64 | % | .64 | % | ||||||||||
Net investment income | 6.53 | % | 7.15 | % | 6.98 | % | 6.07 | % | 5.89 | % | ||||||||||
| Supplemental Data: | ||||||||||||||||||||
Net assets, end of year (000) | $353,941 | $294,144 | $203,843 | $262,929 | $342,363 | |||||||||||||||
Portfolio turnover rate | 42.65 | % | 41.93 | % | 29.01 | % | 40.08 | % | 32.40 | % | ||||||||||
| (a) | Calculated using average shares outstanding during the year. |
| (b) | Total return assumes the reinvestment of all distributions. |
See Notes to Financial Statements.
41
Financial Highlights (continued)
| Class P Shares | ||||||||||||||||||||
| Year Ended 12/31 | ||||||||||||||||||||
| 2010 | 2009 | 2008 | 2007 | 2006 | ||||||||||||||||
Per Share Operating Performance |
| |||||||||||||||||||
Net asset value, beginning of year | $7.49 | $5.97 | $ 8.06 | $8.15 | $7.91 | |||||||||||||||
Investment operations: | ||||||||||||||||||||
Net investment income(a) | .47 | .45 | .47 | .46 | .43 | |||||||||||||||
Net realized and unrealized gain (loss) | .48 | 1.57 | (2.05 | ) | (.04 | ) | .32 | |||||||||||||
Total from investment operations | .95 | 2.02 | (1.58 | ) | .42 | .75 | ||||||||||||||
Distributions to shareholders from: | ||||||||||||||||||||
Net investment income | (.46 | ) | (.50 | ) | (.51 | ) | (.51 | ) | (.51 | ) | ||||||||||
Net asset value, end of year | $7.98 | $7.49 | $ 5.97 | $8.06 | $8.15 | |||||||||||||||
Total Return(b) | 12.73 | % | 35.47 | % | (20.50 | )% | 5.27 | % | 9.86 | % | ||||||||||
Ratios to Average Net Assets: | ||||||||||||||||||||
Expenses, including expense reductions | 1.07 | % | 1.10 | % | 1.10 | % | 1.09 | % | 1.09 | % | ||||||||||
Expenses, excluding expense reductions | 1.07 | % | 1.10 | % | 1.10 | % | 1.09 | % | 1.09 | % | ||||||||||
Net investment income | 6.08 | % | 6.70 | % | 6.55 | % | 5.64 | % | 5.43 | % | ||||||||||
| Supplemental Data: | ||||||||||||||||||||
Net assets, end of year (000) | $143,083 | $150,002 | $99,134 | $120,343 | $106,734 | |||||||||||||||
Portfolio turnover rate | 42.65 | % | 41.93 | % | 29.01 | % | 40.08 | % | 32.40 | % | ||||||||||
| (a) | Calculated using average shares outstanding during the year. |
| (b) | Total return assumes the reinvestment of all distributions. |
See Notes to Financial Statements.
42
Financial Highlights (continued)
| Class R2 Shares | ||||||||||||||||
| Year Ended 12/31 | 9/7/2007(a) to 12/31/2007 | |||||||||||||||
| 2010 | 2009 | 2008 | ||||||||||||||
Per Share Operating Performance | ||||||||||||||||
Net asset value, beginning of period | $7.35 | $5.86 | $ 7.92 | $7.92 | ||||||||||||
Investment operations: | ||||||||||||||||
Net investment income(b) | – | (c) | ||||||||||||||
Net realized and unrealized gain | .03 | |||||||||||||||
Total from investment operations | .03 | |||||||||||||||
Net asset value on SEC Effective Date, 9/14/2007 | $7.95 | |||||||||||||||
Investment operations: | ||||||||||||||||
Net investment income(b) | .45 | .43 | .46 | .14 | ||||||||||||
Net realized and unrealized gain (loss) | .45 | 1.55 | (2.02 | ) | (.05 | ) | ||||||||||
Total from investment operations | .90 | 1.98 | (1.56 | ) | .09 | |||||||||||
Distributions to shareholders from: | ||||||||||||||||
Net investment income | (.44 | ) | (.49 | ) | (.50 | ) | (.12 | ) | ||||||||
Net asset value, end of period | $7.81 | $7.35 | $ 5.86 | $7.92 | ||||||||||||
Total Return(d) | .38 | %(e)(f) | ||||||||||||||
Total Return(d) | 12.63 | % | 35.26 | % | (20.61 | )% | 1.18 | %(e)(g) | ||||||||
Ratios to Average Net Assets: | ||||||||||||||||
Expenses, including expense reductions | 1.22 | % | 1.25 | % | 1.24 | % | .39 | %(e) | ||||||||
Expenses, excluding expense reductions | 1.22 | % | 1.25 | % | 1.24 | % | .39 | %(e) | ||||||||
Net investment income | 5.92 | % | 6.57 | % | 6.44 | % | 1.72 | %(e) | ||||||||
| Supplemental Data: | ||||||||||||||||
Net assets, end of period (000) | $1,234 | $456 | $338 | $46 | ||||||||||||
Portfolio turnover rate | 42.65 | % | 41.93 | % | 29.01 | % | 40.08 | % | ||||||||
| (a) | Commencement of operations was 9/7/2007, SEC effective date was 9/14/2007 and date shares first became available to the public was 10/1/2007. |
| (b) | Calculated using average shares outstanding during the period. |
| (c) | Amount is less than $.01. |
| (d) | Total return assumes the reinvestment of all distributions. |
| (e) | Not annualized. |
| (f) | Total return for the period 9/7/2007 through 9/14/2007. |
| (g) | Total return for the period 9/14/2007 through 12/31/2007. |
See Notes to Financial Statements.
43
Financial Highlights (concluded)
| Class R3 Shares | ||||||||||||||||
| Year Ended 12/31 | 9/7/2007(a) to 12/31/2007 | |||||||||||||||
| 2010 | 2009 | 2008 | ||||||||||||||
Per Share Operating Performance | ||||||||||||||||
Net asset value, beginning of period | $7.34 | $5.85 | $ 7.92 | $7.92 | ||||||||||||
Investment operations: | ||||||||||||||||
Net investment income(b) | – | (c) | ||||||||||||||
Net realized and unrealized gain | .03 | |||||||||||||||
Total from investment operations | .03 | |||||||||||||||
Net asset value on SEC Effective Date, 9/14/2007 | $7.95 | |||||||||||||||
Investment operations: | ||||||||||||||||
Net investment income(b) | .45 | .44 | .47 | .14 | ||||||||||||
Net realized and unrealized gain (loss) | .46 | 1.55 | (2.03 | ) | (.04 | ) | ||||||||||
Total from investment operations | .91 | 1.99 | (1.56 | ) | .10 | |||||||||||
Distributions to shareholders from: | ||||||||||||||||
Net investment income | (.45 | ) | (.50 | ) | (.51 | ) | (.13 | ) | ||||||||
Net asset value, end of period | $7.80 | $7.34 | $ 5.85 | $7.92 | ||||||||||||
Total Return(d) | .38 | %(e)(f) | ||||||||||||||
Total Return(d) | 12.83 | % | 35.31 | % | (20.52 | )% | 1.21 | %(e)(g) | ||||||||
Ratios to Average Net Assets: | ||||||||||||||||
Expenses, including expense reductions | 1.12 | % | 1.14 | % | 1.15 | % | .35 | %(e) | ||||||||
Expenses, excluding expense reductions | 1.12 | % | 1.14 | % | 1.15 | % | .35 | %(e) | ||||||||
Net investment income | 6.03 | % | 6.53 | % | 7.01 | % | 1.77 | %(e) | ||||||||
| Supplemental Data: | ||||||||||||||||
Net assets, end of period (000) | $34,991 | $17,780 | $5,399 | $14 | ||||||||||||
Portfolio turnover rate | 42.65 | % | 41.93 | % | 29.01 | % | 40.08 | % | ||||||||
| (a) | Commencement of operations was 9/7/2007, SEC effective date was 9/14/2007 and date shares first became available to the public was 10/1/2007. |
| (b) | Calculated using average shares outstanding during the period. |
| (c) | Amount is less than $.01. |
| (d) | Total return assumes the reinvestment of all distributions. |
| (e) | Not annualized. |
| (f) | Total return for the period 9/7/2007 through 9/14/2007. |
| (g) | Total return for the period 9/14/2007 through 12/31/2007. |
See Notes to Financial Statements.
44
Notes to Financial Statements
1. ORGANIZATION
Lord Abbett Bond-Debenture Fund, Inc. (the “Fund”) is registered under the Investment Company Act of 1940, as amended (the “Act”), as a diversified, open-end management investment company. The Fund was incorporated under Maryland law on January 23, 1976.
The Fund’s investment objective is to seek high current income and the opportunity for capital appreciation to produce a high total return. The Fund has eight classes of shares: Class A, B, C, F, I, P, R2 and R3, each with different expenses and dividends. A front-end sales charge is normally added to the net asset value (“NAV”) for Class A shares. There is no front-end sales charge in the case of Class B, C, F, I, P, R2 and R3 shares, although there may be a contingent deferred sales charge (“CDSC”) in certain cases as follows: Class A shares purchased without a sales charge and redeemed before the first day of the month in which the one-year anniversary of the purchase falls (subject to certain exceptions as set forth in the Fund’s prospectus); Class B shares redeemed before the sixth anniversary of purchase; and Class C shares redeemed before the first anniversary of purchase. Class B shares will automatically convert to Class A shares on the 25th day of the month (or, if the 25th day is not a business day, the next business day thereafter) following the eighth anniversary of the day on which the purchase order was accepted. The Fund’s Class P shares are closed to substantially all investors, with certain exceptions as set forth in the Fund’s prospectus. On March 31, 2010, the Fund no longer made Class B shares available for purchase.
The preparation of the financial statements in conformity with accounting principles generally accepted in the United States of America requires management to make certain estimates and assumptions that affect the reported amounts of assets and liabilities and disclosure of contingent assets and liabilities at the date of the financial statements and the reported amounts of increases and decreases in net assets from operations during the reporting period. Actual results could differ from those estimates.
2. SIGNIFICANT ACCOUNTING POLICIES
| (a) | Investment Valuation–Securities actively traded on any recognized U.S. or non-U.S. exchange or on The NASDAQ Stock Market LLC are valued at the last sale price or official closing price on the exchange or system on which they are principally traded. Events occurring after the close of trading on non-U.S. exchanges may result in adjustments to the valuation of foreign securities to more accurately reflect their fair value as of the close of regular trading on the New York Stock Exchange LLC. The Fund may rely on an independent fair valuation service in adjusting the valuations of foreign securities. Unlisted equity securities are valued at the last quoted sale price or, if no sale price is available, at the mean between the most recently quoted bid and asked prices. Fixed income securities are valued at the mean between the bid and asked prices on the basis of prices supplied by independent pricing services, which reflect broker/dealer supplied valuations and the independent pricing services’ own electronic data processing techniques. Exchange-traded options and futures contracts are valued at the last sale price in the market where they are principally traded. If no sale has occurred, the mean between the most recently quoted bid and asked prices is used. Floating rate loans are valued at the average of bid and ask quotations obtained from dealers in loans on the basis of prices supplied by independent pricing services. Securities for which market quotations are not readily available are valued at fair value as determined by management and approved in good faith by the Board of Directors. Short-term securities with 60 days or less remaining to maturity are valued using the amortized cost method, which approximates current fair value. |
45
Notes to Financial Statements (continued)
| (b) | Security Transactions–Security transactions are recorded as of the date that the securities are purchased or sold (trade date). Realized gains and losses on sales of portfolio securities are calculated using the identified-cost method. Realized and unrealized gains (losses) are allocated to each class of shares based upon the relative proportion of net assets at the beginning of the day. |
| (c) | Investment Income–Dividend income is recorded on the ex-dividend date. Interest income is recorded on the accrual basis as earned. Discounts are accreted and premiums are amortized using the effective interest method and are included in Interest and other income in the Statement of Operations. Withholding taxes on foreign dividends have been provided for in accordance with the applicable country’s tax rules and rates. Investment income is allocated to each class of shares based upon the relative proportion of net assets at the beginning of the day. |
| (d) | Income Taxes–It is the policy of the Fund to meet the requirements of Subchapter M of the Internal Revenue Code applicable to regulated investment companies and to distribute substantially all taxable income and capital gains to its shareholders. Therefore, no income tax provision is required. |
The Fund files U.S. federal and various state and local tax returns. No income tax returns are currently under examination. The statute of limitations on the Fund’s U.S. federal tax returns remains open for the fiscal years ended December 31, 2007 through December 31, 2010. The statutes of limitations on the Fund’s state and local tax returns may remain open for an additional year depending upon the jurisdiction.
| (e) | Expenses–Expenses, excluding class-specific expenses, are allocated to each class of shares based upon the relative proportion of net assets at the beginning of the day. Class A, B, C, F, P, R2 and R3 shares bear their class-specific share of all expenses and fees relating to the Fund’s 12b-1 Distribution Plan. |
| (f) | Foreign Transactions–The books and records of the Fund are maintained in U.S. dollars and transactions denominated in foreign currencies are recorded in the Fund’s records at the rate prevailing when earned or recorded. Asset and liability accounts that are denominated in foreign currencies are adjusted daily to reflect current exchange rates and any unrealized gain (loss) is included in Net change in unrealized appreciation/depreciation on investments, futures contracts and translation of assets and liabilities denominated in foreign currencies on the Fund’s Statement of Operations. The resultant exchange gains and losses upon settlement of such transactions are included in Net realized gain on investments, futures contracts and foreign currency related transactions on the Fund’s Statement of Operations. The Fund does not isolate that portion of the results of operations arising as a result of changes in the foreign exchange rates from the changes in market prices of the securities. |
The Fund uses foreign currency exchange contracts to facilitate transactions in foreign-denominated securities. Losses from these transactions may arise from changes in the value of the foreign currency or if the counterparties do not perform under the contracts’ terms.
| (g) | When-Issued or Forward Transactions–The Fund may purchase portfolio securities on a when-issued or forward basis. When-issued or forward transactions involve a commitment by a Fund to purchase securities, with payment and delivery (“settlement”) to take place in the future, in order to secure what is considered to be an advantageous price or yield at the time of entering into the transaction. During the period between purchase and settlement, the |
46
Notes to Financial Statements (continued)
value of the securities will fluctuate and assets consisting of cash and/or marketable securities (normally short-term U.S. Government or U.S. Government sponsored enterprise securities) marked to market daily in an amount sufficient to make payment at settlement will be segregated at the Fund’s custodian in order to pay for the commitment. At the time the Fund makes the commitment to purchase a security on a when-issued basis, it will record the transaction and reflect the liability for the purchase and value of the security in determining its NAV. The Fund generally has the ability to close out a purchase obligation on or before the settlement date rather than take delivery of the security. Under no circumstances will settlement for such securities take place more than 120 days after the purchase date. |
| (h) | Futures Contracts–The Fund may purchase and sell futures contracts to enhance returns, to attempt to hedge some of its investment risk, or as a substitute position for holding the underlying asset on which the instrument is based. At the time of entering into a futures transaction, an investor is required to deposit and maintain a specified amount of cash or eligible securities called “initial margin.” Subsequent payments made or received by a Fund called “variation margin” are made on a daily basis as the market price of the futures contract fluctuates. The Fund will record an unrealized gain (loss) based on the amount of variation margin. When a contract is closed, a realized gain (loss) is recorded equal to the difference between the opening and closing value of the contract. |
| (i) | Repurchase Agreements–The Fund may enter into repurchase agreements with respect to securities. A repurchase agreement is a transaction in which a Fund acquires a security and simultaneously commits to resell that security to the seller (a bank or securities dealer) at an agreed-upon price on an agreed-upon date. The Fund requires at all times that the repurchase agreement be collateralized by cash, or by securities of the U.S. Government, its agencies, its instrumentalities, or U.S. Government sponsored enterprises having a value equal to, or in excess of, the value of the repurchase agreement (including accrued interest). If the seller of the agreement defaults on its obligation to repurchase the underlying securities at a time when the value of these securities has declined, the Fund may incur a loss upon disposition of the securities. |
| (j) | Floating Rate Loans–The Fund may invest in floating rate loans, which usually take the form of loan participations and assignments. Loan participations and assignments are agreements to make money available to U.S. or foreign corporations, partnerships or other business entities (the “Borrower”) in a specified amount, at a specified rate and within a specified time. A loan is typically originated, negotiated and structured by a U.S. or foreign bank, insurance company or other financial institution (the “Agent”) for a group of loan investors (“Loan Investors”). The Agent typically administers and enforces the loan on behalf of the other Loan Investors in the syndicate and may hold any collateral on behalf of the Loan Investors. Such loan participations and assignments are typically senior, secured and collateralized in nature. A Fund records an investment when the Borrower withdraws money and records interest as earned. These loans pay interest at rates which are periodically reset by reference to a base lending rate plus a spread. These base lending rates are generally the prime rate offered by a designated U.S. bank or London InterBank Offered Rate (“LIBOR”). |
The loans in which the Fund invests may be subject to some restrictions on resale. For example, the Fund may be contractually obligated to receive approval from the Agent and/or Borrower prior to the sale of these investments. The Fund generally has no right to enforce compliance with the terms of the loan agreement with the Borrower. As a result, the Fund assumes the
47
Notes to Financial Statements (continued)
credit risk of the Borrower, the selling participant and any other persons interpositioned between the Fund and the Borrower (“Intermediate Participants”). In the event that the Borrower, selling participant or Intermediate Participants become insolvent or enter into bankruptcy, the Fund may incur certain costs and delays in realizing payment or may suffer a loss of principal and/or interest.
Unfunded commitments represent the remaining obligation of the Fund to the Borrower. At any point in time, up to the maturity date of the issue, the Borrower may demand the unfunded portion. As of December 31, 2010, the Fund had no unfunded loan commitments.
| (k) | Fair Value Measurements–Fair value is defined as the price that the Fund would receive upon selling an investment or transferring a liability in an orderly transaction to an independent buyer in the principal or most advantageous market of the investment. A three-tier hierarchy is used to maximize the use of observable market data and minimize the use of unobservable inputs and to establish classification of fair value measurements for disclosure purposes. Inputs refer broadly to the assumptions that market participants would use in pricing the asset or liability, including assumptions about risk—for example, the risk inherent in a particular valuation technique used to measure fair value (such as a pricing model) and/or the risk inherent in the inputs to the valuation technique. Inputs may be observable or unobservable. Observable inputs reflect the assumptions market participants would use in pricing the asset or liability. Observable inputs are based on market data obtained from sources independent of the reporting entity. Unobservable inputs reflect the reporting entity’s own assumptions about the assumptions market participants would use in pricing the asset or liability. Unobservable inputs are based on the best information available in the circumstances. The three-tier hierarchy of inputs is summarized in the three broad Levels listed below: |
| • | Level 1 - unadjusted quoted prices in active markets for identical investments; |
| • | Level 2 - other significant observable inputs (including quoted prices for similar investments, interest rates, prepayment speeds, credit risk, etc.); and |
| • | Level 3 - significant unobservable inputs (including the Fund’s own assumptions in determining the fair value of investments). |
The inputs or methodology used for valuing securities are not necessarily an indication of the risk associated with investing in those securities.
48
Notes to Financial Statements (continued)
The following is a summary of the inputs used as of December 31, 2010 in valuing the Fund’s investments carried at value:
| Investment Type* | Level 1 | Level 2 | Level 3 | Total | ||||||||||||
Common Stocks | $ | 351,713,356 | $ | 28,878,300 | $ | – | $ | 380,591,656 | ||||||||
Convertible Bonds | – | 689,342,179 | – | 689,342,179 | ||||||||||||
Convertible Preferred Stocks | 208,415,481 | 116,808,122 | – | 325,223,603 | ||||||||||||
Floating Rate Loans | – | 239,207,950 | – | 239,207,950 | ||||||||||||
Foreign Bonds | – | 23,928,468 | – | 23,928,468 | ||||||||||||
Government Sponsored Enterprises Pass-Through | – | 17,147,668 | – | 17,147,668 | ||||||||||||
High Yield Corporate Bonds | – | 6,185,078,985 | 423 | 6,185,079,408 | ||||||||||||
Municipal Bonds | – | 20,090,283 | – | 20,090,283 | ||||||||||||
Non-Convertible Preferred Stocks | 3,789,412 | 10,307,375 | – | 14,096,787 | ||||||||||||
Warrants | 693,644 | 1,878,817 | – | 2,572,461 | ||||||||||||
Repurchase Agreement | – | 66,536,656 | – | 66,536,656 | ||||||||||||
Total | $ | 564,611,893 | $ | 7,399,204,803 | $ | 423 | $ | 7,963,817,119 | ||||||||
| Other Financial Instruments | ||||||||||||||||
Futures Contracts | ||||||||||||||||
Assets | $ | 3,582,907 | $ | – | $ | – | $ | 3,582,907 | ||||||||
Liabilities | – | – | – | – | ||||||||||||
Total | $ | 3,582,907 | $ | – | $ | – | $ | 3,582,907 | ||||||||
| * | See Schedule of Investments for values in each industry. |
The following is a reconciliation of investments with unobservable inputs (Level 3) that were used in determining fair value:
| Investment Type | High Yield Corporate Bonds | |||
Balance as of January 1, 2010 | $ | 3,488,847 | ||
Accrued discounts/premiums | (51,390 | ) | ||
Realized gain (loss) | – | |||
Change in unrealized appreciation/depreciation | (3,437,034 | ) | ||
Net purchase (sales) | – | |||
Net transfers in or out of Level 3 | – | |||
Balance as of December 31, 2010 | $ | 423 | ||
| (l) | Disclosures about Derivative Instruments and Hedging Activities–The Fund entered into U.S. Treasury futures contracts during the fiscal year ended December 31, 2010 (as described in note 2(h)) to hedge against changes in interest rates. The Fund bears the risk of interest rates moving unexpectedly, in which case the Fund may not achieve the anticipated benefits of the futures contracts and realize a loss. There is minimal counterparty credit risk to the Fund since futures are exchange traded and the exchange’s clearinghouse, as counterparty to all exchange traded futures, guarantees futures against default. |
As of December 31, 2010, the Fund had a futures interest rate contract with a cumulative unrealized appreciation of $3,582,907, which is included in the Schedule of Investments. Only the current day’s variation margin is included in the Statement of Assets and Liabilities. Amounts of $(6,482,297) and $(855,948) are included in the Statement of Operations related to futures contracts under the captions Net realized gain on investments, futures contracts
49
Notes to Financial Statements (continued)
and foreign currency related transactions and Net change in unrealized appreciation/depreciation on investments, futures contracts and translation of assets and liabilities denominated in foreign currencies, respectively. The average number of futures contracts throughout the period was 985.
3. MANAGEMENT FEE AND OTHER TRANSACTIONS WITH AFFILIATES
Management Fee
The Fund has a management agreement with Lord, Abbett & Co. LLC (“Lord Abbett”), pursuant to which Lord Abbett supplies the Fund with investment management services and executive and other personnel, provides office space and pays for ordinary and necessary office and clerical expenses relating to research and statistical work and supervision of the Fund’s investment portfolio.
The management fee is based on the Fund’s average daily net assets at the following annual rate:
First $500 million | .50% | |||
Next $9.5 billion | .45% | |||
Over $10 billion | .40% |
For the fiscal year ended December 31, 2010, the effective management fee was at a rate of .45% of the Fund’s average daily net assets.
In addition, Lord Abbett provides certain administrative services to the Fund pursuant to an Administrative Services Agreement in return for a fee at an annual rate of .04% of the Fund’s average daily net assets.
The Fund, along with certain other funds managed by Lord Abbett (collectively, the “Underlying Funds”), has entered into a Servicing Arrangement with Lord Abbett Balanced Strategy Fund and Lord Abbett Diversified Income Strategy Fund of Lord Abbett Investment Trust (each, a “Fund of Funds”), pursuant to which each Underlying Fund pays a portion of the expenses (excluding management fees and distribution and service fees) of each Fund of Funds in proportion to the average daily value of the Underlying Fund shares owned by each Fund of Funds. Amounts paid pursuant to the Servicing Arrangement are included in Subsidy expense on the Fund’s Statement of Operations and Payable to affiliates on the Fund’s Statement of Assets and Liabilities.
As of December 31, 2010, the percentages of the Fund’s outstanding shares owned by Lord Abbett Balanced Strategy Fund and Lord Abbett Diversified Income Strategy Fund were 2.46% and .50%, respectively.
12b-1 Distribution Plan
The Fund has adopted a distribution plan with respect to Class A, B, C, F, P, R2 and R3 shares pursuant to Rule 12b-1 under the Act, which provides for the payment of ongoing distribution and service fees to Lord Abbett Distributor LLC (the “Distributor”), an affiliate of Lord Abbett. The fees are accrued daily at annual rates based upon the Fund’s average daily net assets as follows:
| Fees* | Class A | Class B | Class C | Class F | Class P | Class R2 | Class R3 | |||||||||||||||||||||
Service | .25% | (1) | .25% | .25% | – | .25% | .25% | .25% | ||||||||||||||||||||
Distribution | .10% | .75% | .75% | .10% | .20% | .35% | .25% | |||||||||||||||||||||
| * | The Fund may designate a portion of the aggregate fee as attributable to service activities for purposes of calculating Financial Industry Regulatory Authority, Inc. (“FINRA”) sales charge limitations. |
| (1) | Annual service fee on shares sold prior to June 1, 1990 is .15% of the average net asset value. |
50
Notes to Financial Statements (continued)
Class I shares do not have a distribution plan.
Commissions
Distributor received the following commissions on sales of shares of the Fund, after concessions were paid to authorized dealers, for the fiscal year ended December 31, 2010:
Distributor Commissions | Dealers’ Concessions | |||
| $1,941,189 | $ | 9,910,351 | ||
Distributor received CDSCs of $51,942 and $313,425 for Class A and Class C shares, respectively, for the fiscal year ended December 31, 2010.
Two Directors and certain of the Fund’s officers have an interest in Lord Abbett.
4. DISTRIBUTIONS AND CAPITAL LOSS CARRYFORWARDS
Dividends from net investment income, if any, are declared daily and paid monthly. Taxable net realized gains from investment transactions, reduced by allowable capital loss carryforwards, if any, are declared and distributed to shareholders at least annually. The capital loss carryforward amount, if any, is available to offset future net capital gains. Dividends and distributions to shareholders are recorded on the ex-dividend date. The amounts of dividends and distributions from net investment income and net realized capital gains are determined in accordance with federal income tax regulations, which may differ from accounting principles generally accepted in the United States of America. These book/tax differences are either considered temporary or permanent in nature. To the extent these differences are permanent in nature, such amounts are reclassified within the components of net assets based on their federal tax basis treatment; temporary differences do not require reclassification. Dividends and distributions, which exceed earnings and profits for tax purposes, are reported as a tax return of capital.
The tax character of distributions paid during the fiscal years ended December 31, 2010 and 2009 was as follows:
Year Ended 12/31/2010 | Year Ended 12/31/2009 | |||||||
Distributions paid from: | ||||||||
Ordinary income | $ | 478,986,796 | $ | 521,934,876 | ||||
Total distributions paid | $ | 478,986,796 | $ | 521,934,876 | ||||
As of December 31, 2010, the components of accumulated gains on a tax-basis were as follows:
Undistributed ordinary income – net | $ | 15,416,356 | ||
Total undistributed earnings | $ | 15,416,356 | ||
Capital loss carryforwards* | (344,891,919 | ) | ||
Temporary differences | (1,347,813 | ) | ||
Unrealized gains – net | 402,061,652 | |||
Total accumulated gains – net | $ | 71,238,276 |
| * | As of December 31, 2010, the capital loss carryforwards, along with the related expiration dates, were as follows: |
| 2016 | 2017 | Total | ||||||||
| $ | 19,692,828 | $ | 325,199,091 | $ | 344,891,919 | |||||
51
Notes to Financial Statements (continued)
Certain losses incurred after October 31 (“Post-October losses”) within the taxable year are deemed to arise on the first business day of the Fund’s next taxable year. The Fund incurred and will elect to defer ordinary losses of $100,720 during fiscal 2010.
As of December 31, 2010, the aggregate unrealized security gains and losses based on cost for U.S. federal income tax purposes were as follows:
Tax cost | $ | 7,561,755,723 | ||
Gross unrealized gain | 657,270,061 | |||
Gross unrealized loss | (255,208,665 | ) | ||
Net unrealized security gain | $ | 402,061,396 |
The difference between book-basis and tax-basis unrealized gains (losses) is attributable to the tax treatment of wash sales, premium amortization and certain securities.
Permanent items identified during the fiscal year ended December 31, 2010 have been reclassified among the components of net assets based on their tax basis treatment as follows:
| Distributions in Excess of Net Investment Income | Accumulated Net Realized Loss | Paid-in Capital | ||||||||
| $9,869,230 | $ | 149,146,750 | $ | (159,015,980 | ) | |||||
The permanent differences are attributable to the tax treatment of premium amortization, certain securities, paydown gains and losses, foreign currency transactions, and the expiration of capital loss carryforwards.
On December 22, 2010, the Regulated Investment Company Modernization Act of 2010 (the “Modernization Act”) was signed by the President. The Modernization Act includes numerous provisions that generally become effective for taxable years beginning after the date of enactment. Management is currently assessing the impact of the Modernization Act as it relates to the Fund.
5. PORTFOLIO SECURITIES TRANSACTIONS
Purchases and sales of investment securities (excluding short-term investments) for the fiscal year ended December 31, 2010 were as follows:
| Purchases | Sales | |||
| $3,380,174,704 | $ | 4,081,313,875 | ||
There were no purchases or sales of U.S. Government securities for the fiscal year ended December 31, 2010.
6. DIRECTORS’ REMUNERATION
The Fund’s officers and the two Directors who are associated with Lord Abbett do not receive any compensation from the Fund for serving in such capacities. Outside Directors’ fees are allocated among all Lord Abbett-sponsored funds based on the net assets of each fund. There is an equity-based plan available to all outside Directors under which outside Directors must defer receipt of a portion of, and may elect to defer receipt of an additional portion of Directors’ fees. The deferred amounts are treated as though equivalent dollar amounts had been invested in the funds. Such
52
Notes to Financial Statements (continued)
amounts and earnings accrued thereon are included in Directors’ fees on the Statement of Operations and in Directors’ fees payable on the Statement of Assets and Liabilities and are not deductible for U.S. federal income tax purposes until such amounts are paid.
7. EXPENSE REDUCTIONS
The Fund has entered into an arrangement with its transfer agent and custodian, whereby credits realized as a result of uninvested cash balances are used to reduce a portion of the Fund’s expenses.
8. LINE OF CREDIT
The Fund and certain other funds managed by Lord Abbett have available an unsecured revolving credit facility (“Facility”) from State Street Bank and Trust Company (“SSB”), to be used for temporary or emergency purposes as an additional source of liquidity to fund redemptions of investor shares. The Facility is renewed annually under terms that depend on market conditions at the time of the renewal. The amount available under the Facility is $200,000,000. The annual fee to maintain the Facility (of which each participating fund pays its pro rata share based on the net assets of each participating fund) is .15% of the amount available under the Facility. This amount is included in Other expenses on the Fund’s Statement of Operations. In connection with the current annual renewal, the Fund paid an upfront commitment fee of .05%, which is included in Prepaid expenses and other assets on the Statement of Assets and Liabilities, and is amortized through Other expenses on the Statement of Operations over the annual period of the Facility. Any borrowings under this Facility will bear interest at current market rates as set forth in the credit agreement. As of December 31, 2010, there were no loans outstanding pursuant to this Facility nor was the Facility utilized at any time during the fiscal year ended December 31, 2010.
On November 22, 2010, the Fund and certain other funds managed by Lord Abbett entered into a short term extension of the Facility through February 2, 2011. On February 3, 2011, the Facility was renewed for an annual period by the Fund and certain other funds managed by Lord Abbett. The amount available under the Facility remained the same. The annual fee to maintain the Facility was reduced from .15% to .125% and the upfront commitment fee of .05% was removed.
9. CUSTODIAN AND ACCOUNTING AGENT
SSB is the Fund’s custodian and accounting agent. SSB performs custodial, accounting and recordkeeping functions relating to portfolio transactions and calculating the Fund’s NAV.
10. INVESTMENT RISKS
The Fund is subject to the general risks and considerations associated with investing in debt securities. The value of an investment will change as interest rates fluctuate and in response to market movements. When interest rates rise, the prices of debt securities are likely to decline; when rates fall, such prices tend to rise. Longer-term debt securities are usually more sensitive to interest rate changes. There is also the risk that an issuer of a debt security will fail to make timely payments of principal or interest to the Fund, a risk that is greater with high yield securities (sometimes called “lower-rated bonds” or “junk bonds”), in which the Fund may invest. Some issuers, particularly of high yield securities, may default as to principal and/or interest payments after the Fund purchases its securities. A default, or concerns in the market about an increase in risk of default, may result in losses to the Fund. High yield bonds are subject to greater price fluctuations, as well as additional risks.
53
Notes to Financial Statements (continued)
The mortgage-related securities in which the Fund may invest may be particularly sensitive to changes in prevailing interest rates, and economic conditions, including delinquencies and/or defaults. These changes can affect the value, income and/or liquidity of such positions. When interest rates are declining, the value of these securities with prepayment features may not increase as much as other fixed income securities. Early principal repayment may deprive the Fund of income payments above current market rates. Alternatively, rising interest rates may cause payments to occur at a slower-than-expected rate, extending the duration of a security and typically reducing its value. The payment rate will thus affect the price and volatility of a mortgage-related security. In addition, while securities of government sponsored enterprises are guaranteed with respect to the timely payment of interest and principal by the particular enterprise involved, they commonly are not guaranteed by the U.S. Government.
The Fund may invest up to 20% of its net assets in equity securities, which may subject it to the general risks and considerations associated with investing in equity securities. The value of an investment will fluctuate in response to movements in the equity securities market in general and to the changing prospects of individual companies in which the Fund invests.
Due to the Fund’s exposure to foreign companies (and ADRs), the Fund may experience increased market, liquidity, currency, political, information, and other risks.
The Fund is subject to the risks associated with derivatives, which may be different from and greater than the risks associated with directly investing in securities. Derivatives may be subject to risks such as liquidity risk, leveraging risk, interest rate risk, market risk, and credit risk. Illiquid securities may lower the Fund’s returns since the Fund may be unable to sell these securities at their desired time or price. Derivatives also may involve the risk of mispricing or improper valuation and the risk that changes in the value of the derivative may not correlate perfectly with the value of the underlying asset, rate or index. Whether the Fund’s use of derivatives is successful will depend on, among other things, the Fund’s ability to correctly forecast market movements and other factors. If the Fund incorrectly forecasts these and other factors, the Fund’s performance could suffer.
The Fund may invest up to 10% of its net assets in floating rate or adjustable rate senior loans, which are subject to increased credit and liquidity risks. Senior loans are business loans made to borrowers that may be U.S. or foreign corporations, partnerships or other business entities.
These factors can affect the Fund’s performance.
11. SUMMARY OF CAPITAL TRANSACTIONS
Transactions in shares of capital stock were as follows:
| Year Ended December 31, 2010 | Year Ended December 31, 2009 | |||||||||||||||
| Class A Shares | Shares | Amount | Shares | Amount | ||||||||||||
Shares sold | 76,673,603 | $ | 576,997,631 | 214,281,990 | $ | 1,358,874,796 | ||||||||||
Converted from Class B* | 16,283,545 | 122,651,868 | 17,486,060 | 110,933,552 | ||||||||||||
Reinvestment of distributions | 33,237,112 | 250,228,410 | 38,380,899 | 247,238,214 | ||||||||||||
Shares reacquired | (201,853,834 | ) | (1,515,686,651 | ) | (195,328,196 | ) | (1,266,920,130 | ) | ||||||||
Increase (decrease) | (75,659,574 | ) | $ | (565,808,742 | ) | 74,820,753 | $ | 450,126,432 | ||||||||
54
Notes to Financial Statements (concluded)
| Year Ended December 31, 2010 | Year Ended December 31, 2009 | |||||||||||||||
| Class B Shares | Shares | Amount | Shares | Amount | ||||||||||||
Shares sold | 3,214,259 | $ | 24,040,503 | 19,007,896 | $ | 121,527,142 | ||||||||||
Reinvestment of distributions | 3,797,564 | 28,646,849 | 5,237,889 | 33,691,237 | ||||||||||||
Shares reacquired | (20,480,633 | ) | (154,900,511 | ) | (22,028,804 | ) | (148,357,424 | ) | ||||||||
Converted to Class A* | (16,235,495 | ) | (122,651,868 | ) | (17,437,815 | ) | (110,933,552 | ) | ||||||||
Decrease | (29,704,305 | ) | $ | (224,865,027 | ) | (15,220,834 | ) | $ | (104,072,597 | ) | ||||||
| Class C Shares | ||||||||||||||||
Shares sold | 33,788,212 | $ | 254,625,521 | 112,179,888 | $ | 714,417,118 | ||||||||||
Reinvestment of distributions | 9,454,389 | 71,369,236 | 9,141,107 | 59,462,644 | ||||||||||||
Shares reacquired | (61,213,937 | ) | (461,822,088 | ) | (38,373,338 | ) | (255,258,983 | ) | ||||||||
Increase (decrease) | (17,971,336 | ) | $ | (135,827,331 | ) | 82,947,657 | $ | 518,620,779 | ||||||||
| Class F Shares | ||||||||||||||||
Shares sold | 61,282,387 | $ | 459,491,221 | 68,284,444 | $ | 426,897,613 | ||||||||||
Reinvestment of distributions | 2,884,822 | 21,782,805 | 1,213,990 | 8,039,182 | ||||||||||||
Shares reacquired | (34,225,748 | ) | (257,202,177 | ) | (16,317,491 | ) | (109,578,509 | ) | ||||||||
Increase | 29,941,461 | $ | 224,071,849 | 53,180,943 | $ | 325,358,286 | ||||||||||
| Class I Shares | ||||||||||||||||
Shares sold | 11,353,565 | $ | 86,075,832 | 13,659,103 | $ | 85,936,408 | ||||||||||
Reinvestment of distributions | 2,662,515 | 19,972,137 | 2,610,364 | 16,780,060 | ||||||||||||
Shares reacquired | (8,699,327 | ) | (65,274,705 | ) | (10,992,939 | ) | (68,143,420 | ) | ||||||||
Increase | 5,316,753 | $ | 40,773,264 | 5,276,528 | $ | 34,573,048 | ||||||||||
| Class P Shares | ||||||||||||||||
Shares sold | 3,585,805 | $ | 27,457,010 | 6,993,007 | $ | 46,061,760 | ||||||||||
Reinvestment of distributions | 1,173,790 | 9,020,565 | 1,264,807 | 8,315,908 | ||||||||||||
Shares reacquired | (6,834,064 | ) | (52,126,819 | ) | (4,861,506 | ) | (32,487,520 | ) | ||||||||
Increase (decrease) | (2,074,469 | ) | $ | (15,649,244 | ) | 3,396,308 | $ | 21,890,148 | ||||||||
| Class R2 Shares | ||||||||||||||||
Shares sold | 147,551 | $ | 1,113,833 | 46,914 | $ | 301,071 | ||||||||||
Reinvestment of distributions | 2,492 | 18,872 | 1,288 | 8,338 | ||||||||||||
Shares reacquired | (54,084 | ) | (407,095 | ) | (43,718 | ) | (306,362 | ) | ||||||||
Increase | 95,959 | $ | 725,610 | 4,484 | $ | 3,047 | ||||||||||
| Class R3 Shares | ||||||||||||||||
Shares sold | 2,813,435 | $ | 21,065,351 | 1,960,670 | $ | 12,830,771 | ||||||||||
Reinvestment of distributions | 228,177 | 1,720,962 | 101,716 | 668,568 | ||||||||||||
Shares reacquired | (976,228 | ) | (7,355,388 | ) | (561,542 | ) | (3,613,037 | ) | ||||||||
Increase | 2,065,384 | $ | 15,430,925 | 1,500,844 | $ | 9,886,302 | ||||||||||
| * | Automatic conversion of Class B shares occurs on the 25th day of the month (or, if the 25th day is not a business day, the next business day thereafter) following the eighth anniversary of the day on which the purchase order was accepted. |
55
Report of Independent Registered Public Accounting Firm
To the Shareholders and Board of Directors of Lord Abbett Bond-Debenture Fund, Inc.:
We have audited the accompanying statement of assets and liabilities of Lord Abbett Bond-Debenture Fund, Inc. (the “Fund”), including the schedule of investments, as of December 31, 2010, and the related statement of operations for the year then ended, the statements of changes in net assets for each of the two years in the period then ended, and the financial highlights for each of the periods presented. These financial statements and financial highlights are the responsibility of the Fund’s management. Our responsibility is to express an opinion on these financial statements and financial highlights based on our audits.
We conducted our audits in accordance with the standards of the Public Company Accounting Oversight Board (United States). Those standards require that we plan and perform the audit to obtain reasonable assurance about whether the financial statements and financial highlights are free of material misstatement. The Fund is not required to have, nor were we engaged to perform, an audit of its internal control over financial reporting. Our audits included consideration of internal control over financial reporting as a basis for designing audit procedures that are appropriate in the circumstances, but not for the purpose of expressing an opinion on the effectiveness of the Fund’s internal control over financial reporting. Accordingly, we express no such opinion. An audit also includes examining, on a test basis, evidence supporting the amounts and disclosures in the financial statements, assessing the accounting principles used and significant estimates made by management, as well as evaluating the overall financial statement presentation. Our procedures included confirmation of securities owned as of December 31, 2010, by correspondence with the custodian, brokers and agent banks; where replies were not received from brokers and agent banks, we performed other auditing procedures. We believe that our audits provide a reasonable basis for our opinion.
In our opinion, the financial statements and financial highlights referred to above present fairly, in all material respects, the financial position of Lord Abbett Bond-Debenture Fund, Inc. as of December 31, 2010, the results of its operations for the year then ended, the changes in its net assets for each of the two years in the period then ended, and the financial highlights for each of the periods presented, in conformity with accounting principles generally accepted in the United States of America.
DELOITTE & TOUCHE LLP
New York, New York
February 25, 2011
56
Basic Information About Management
The Board of Directors (the “Board”) is responsible for the management of the business and affairs of the Fund in accordance with the laws of the State of Maryland. The Board appoints officers who are responsible for the day-to-day operations of the Fund and who execute policies authorized by the Board. The Board also approves an investment adviser to the Fund and continues to monitor the cost and quality of the services the investment adviser provides, and annually considers whether to renew the contract with the adviser. Generally, each Director holds office until his/her successor is elected and qualified or until his/her earlier resignation or removal, as provided in the Fund’s organizational documents.
Lord, Abbett & Co. LLC (“Lord Abbett”), a Delaware limited liability company, is the Fund’s investment adviser.
Interested Directors
The following Directors are associated with Lord Abbett and are “interested persons” of the Fund as defined in the Act. Mr. Dow and Ms. Foster are officers and directors or trustees of each of the 13 Lord Abbett-sponsored funds, which consist of 53 portfolios or series.
Name, Address and Year of Birth | Current Position and Length of Service with the Fund | Principal Occupation and Other Directorships During Past Five Years | ||
Robert S. Dow Lord, Abbett & Co. LLC 90 Hudson Street Jersey City, NJ 07302 (1945) | Director since 1989 and Chairman since 1996 | Principal Occupation: Senior Partner of Lord Abbett (since 2007) and was formerly Managing Partner (1996 - 2007) and Chief Investment Officer (1995 - 2007), joined Lord Abbett in 1972.
Other Directorships: None. | ||
Daria L. Foster Lord, Abbett & Co. LLC 90 Hudson Street Jersey City, NJ 07302 (1954) | Director and President since 2006 | Principal Occupation: Managing Partner of Lord Abbett (since 2007), and was formerly Director of Marketing and Client Service, joined Lord Abbett in 1990.
Other Directorships: None. | ||
Independent Directors
The following Independent Directors also are directors or trustees of each of the 13 Lord Abbett-sponsored funds, which consist of 53 portfolios or series.
Name, Address and Year of Birth | Current Position and Length of Service with the Fund | Principal Occupation and Other Directorships During Past Five Years | ||
E. Thayer Bigelow Lord, Abbett & Co. LLC c/o Legal Dept. 90 Hudson Street Jersey City, NJ 07302 (1941) | Director since 1994 | Principal Occupation: Managing General Partner, Bigelow Media, LLC (since 2000); Senior Adviser, Time Warner Inc. (1998 - 2000).
Other Directorships: Currently serves as director of Crane Co. (since 1984) and Huttig Building Products Inc. (since 1998). Previously served as a director of R.H. Donnelley Inc. (2009 - 2010) and Adelphia Communications Inc. (2003 - 2007). | ||
57
Basic Information About Management (continued)
Name, Address and Year of Birth | Current Position and Length of Service with the Fund | Principal Occupation and Other Directorships During Past Five Years | ||
Robert B. Calhoun, Jr. Lord, Abbett & Co. LLC c/o Legal Dept. 90 Hudson Street Jersey City, NJ 07302 (1942) | Director since 1998 | Principal Occupation: Senior Advisor of Monitor Clipper Partners, a private equity investment fund (since 1997); President of Clipper Asset Management Corp. (1991 - 2009).
Other Directorships: Previously served as a director of Avondale, Inc. (1991 - 2005) and Interstate Bakeries Corp. (1991 - 2008). | ||
Evelyn E. Guernsey Lord, Abbett & Co. LLC c/o Legal Dept. 90 Hudson Street Jersey City, NJ 07302 (1955) | Director since 2011 | Principal Occupation: CEO, Americas of J.P. Morgan Asset Management (2004 - 2010).
Other Directorships: None. | ||
Julie A. Hill Lord, Abbett & Co. LLC c/o Legal Dept. 90 Hudson Street Jersey City, NJ 07302 (1946) | Director since 2004 | Principal Occupation: Owner and CEO of The Hill Company, a business consulting firm (since 1998).
Other Directorships: Currently serves as director of WellPoint, Inc., a health benefits company (since 1994). Previously served as a director of Resources Connection, Inc., a consulting firm (2004 - 2007). | ||
Franklin W. Hobbs Lord, Abbett & Co. LLC c/o Legal Dept. 90 Hudson Street Jersey City, NJ 07302 (1947) | Director since 2000 | Principal Occupation: Advisor of One Equity Partners, a private equity firm (since 2004).
Other Directorships: Currently serves as a director and Chairman of the Board of Ally Financial Inc., a financial services firm (since 2009) and as a director of Molson Coors Brewing Company (since 2002). | ||
Thomas J. Neff Lord, Abbett & Co. LLC c/o Legal Dept. 90 Hudson Street Jersey City, NJ 07302 (1937) | Director since 1982 | Principal Occupation: Chairman of Spencer Stuart (U.S.), an executive search consulting firm (since 1996).
Other Directorships: Currently serves as director of Ace, Ltd. (since 1997). Previously served as a director of Hewitt Associates, Inc. (2004 - 2010). | ||
James L.L. Tullis Lord, Abbett & Co. LLC c/o Legal Dept. 90 Hudson Street Jersey City, NJ 07302 (1947) | Director since 2006 | Principal Occupation: CEO of Tullis-Dickerson and Co. Inc., a venture capital management firm (since 1990).
Other Directorships: Currently serves as director of Crane Co. (since 1998). Previously served as a director of Viacell Inc. (2003 - 2007). | ||
58
Basic Information About Management (continued)
Officers
None of the officers listed below have received compensation from the Fund. All of the officers of the Fund also may be officers of the other Lord Abbett-sponsored funds and maintain offices at 90 Hudson Street, Jersey City, NJ 07302. Unless otherwise indicated, the position(s) and title(s) listed under the “Principal Occupation” column indicate each officer’s position(s) and title(s) with Lord Abbett.
| Name and Year of Birth | Current Position with the Fund | Length of Service of Current | Principal Occupation During Past Five Years | |||
Robert S. Dow (1945) | Chief Executive Officer and Chairman | Elected in 1996 | Senior Partner of Lord Abbett (since 2007), and was formerly Managing Partner (1996 - 2007) and Chief Investment Officer (1995 - 2007), joined Lord Abbett in 1972. | |||
Daria L. Foster (1954) | President | Elected in 2006 | Managing Partner of Lord Abbett (since 2007), and was formerly Director of Marketing and Client Service, joined Lord Abbett in 1990. | |||
Robert I. Gerber (1954) | Executive Vice President | Elected in 2007 | Partner and Chief Investment Officer (since 2007), joined Lord Abbett in 1997 as Director of Taxable Fixed Income Management. | |||
Christopher J. Towle (1957) | Executive Vice President | Elected in 1995 | Partner and Director, joined Lord Abbett in 1987. | |||
James W. Bernaiche (1956) | Chief Compliance Officer | Elected in 2004 | Partner and Chief Compliance Officer, joined Lord Abbett in 2001. | |||
Joan A. Binstock (1954) | Chief Financial Officer and Vice President | Elected in 1999 | Partner and Chief Operations Officer, joined Lord Abbett in 1999. | |||
John K. Forst (1960) | Vice President and Assistant Secretary | Elected in 2005 | Deputy General Counsel, joined Lord Abbett in 2004. | |||
Lawrence H. Kaplan (1957) | Vice President and Secretary | Elected in 1997 | Partner and General Counsel, joined Lord Abbett in 1997. | |||
Elizabeth O. MacLean (1966) | Vice President | Elected in 2008 | Partner and Portfolio Manager, joined Lord Abbett in 2006 and was formerly a Managing Director/Portfolio Manager at Nomura Corporate Research and Asset Management, Inc. (2000 - 2006). | |||
59
Basic Information About Management (concluded)
| Name and Year of Birth | Current Position with the Fund | Length of Service of Current | Principal Occupation During Past Five Years | |||
| A. Edward Oberhaus, III (1959) | Vice President | Elected in 1996 | Partner and Director, joined Lord Abbett in 1983. | |||
Thomas R. Phillips (1960) | Vice President and Assistant Secretary | Elected in 2008 | Deputy General Counsel, joined Lord Abbett in 2006 and was formerly an attorney at Morgan, Lewis & Bockius LLP. | |||
Lawrence B. Stoller (1963) | Vice President and Assistant Secretary | Elected in 2007 | Partner and Senior Deputy General Counsel, joined Lord Abbett in 2007 and was formerly an Executive Vice President and the General Counsel at Cohen & Steers Capital Management, Inc. (1999 - - 2007). | |||
Bernard J. Grzelak (1971) | Treasurer | Elected in 2003 | Partner and Director of Fund Administration, joined Lord Abbett in 2003. | |||
Please call 888-522-2388 for a copy of the statement of additional information (“SAI”), which contains further information about the Fund’s Directors. It is available free upon request.
60
Approval of Advisory Contract
At meetings held on December 15 and 16, 2010, the Board, including all of the Directors who are not interested persons of the Fund or Lord, Abbett & Co. LLC (“Lord Abbett”), considered whether to approve the continuation of the existing management agreement between the Fund and Lord Abbett. In addition to the materials the Board had reviewed throughout the course of the year, including information about the investment performance of the Fund compared to the performance of its benchmark, the Board received materials relating to the management agreement before the meeting and had the opportunity to ask questions and request further information in connection with its consideration. The Board also took into account its familiarity with Lord Abbett gained through its previous meetings and discussions, and the examination of the portfolio management team conducted by members of the Contract Committee during the year.
The materials received by the Board included, but were not limited to: (1) information provided by Lipper Inc. (“Lipper”) regarding the investment performance of the Fund compared to the investment performance of one or more groups of funds with substantially similar investment objectives, including a group of funds within the same investment classification/objective (each group a “performance universe”) and to the investment performance of an appropriate fund index; (2) information on the expense ratios, effective management fee rates, and other expense components for the Fund and similar funds (the “peer group”); (3) information provided by Lord Abbett on the projected expense ratios, management fee rates, and other expense components for the Fund; (4) sales and redemption information for the Fund; (5) information regarding Lord Abbett’s financial condition; (6) an analysis of the relative profitability of the management agreement to Lord Abbett; (7) information provided by Lord Abbett regarding the investment management fees Lord Abbett receives from its other advisory clients maintaining accounts with a similar investment strategy as the Fund; (8) information regarding the distribution arrangements of the Fund; and (9) information regarding the personnel and other resources devoted by Lord Abbett to managing the Fund.
Investment Management Services Generally. The Board considered the investment management services provided by Lord Abbett to the Fund, including investment research, portfolio management, and trading, and Lord Abbett’s commitment to compliance with all relevant legal requirements. The Board also observed that Lord Abbett was solely engaged in the investment management business and accordingly did not experience the conflicts of interest resulting from being engaged in other lines of business. The Board noted that in recent years Lord Abbett had not used brokerage commissions to purchase third-party research, but had changed this practice in 2009, as it previously had discussed with the Board. The Board considered the investment advisory services provided by Lord Abbett to other clients, the fees charged for the services, and the differences in the nature of the services provided to the Fund and other Lord Abbett Funds, on the one hand, and the services provided to other clients, on the other.
Investment Performance and Compliance. The Board observed that the investment performance of the Class A shares of the Fund was in the fourth quintile of the performance universe for the nine-month period, the second quintile for the one-year period, the fourth quintile for the three-year and ten-year periods, and the third quintile for the five-year period. The Board also observed that the investment performance was lower than that of the Lipper Multi-Sector Income Index for the nine-month, three-year, five-year, and ten-year periods and higher than that of the Index for the one-year period.
61
Lord Abbett’s Personnel and Methods. The Board considered the qualifications of the personnel providing investment management services to the Fund, in light of its investment objective and discipline. Among other things, the Board considered the size, experience, and turnover of Lord Abbett’s investment management staff, Lord Abbett’s investment methodology and philosophy, and Lord Abbett’s approach to recruiting, training, and retaining investment management personnel. The Board determined that Lord Abbett had the expertise and resources to manage the Fund effectively.
Nature and Quality of Other Services. The Board considered the nature, quality, costs, and extent of compliance, administrative, and other services performed by Lord Abbett and Lord Abbett Distributor LLC (“Distributor”) and the nature and extent of Lord Abbett’s supervision of third party service providers, including the Fund’s transfer agent and custodian.
Expenses. The Board observed that for the fiscal year ended December 31, 2009 the contractual management and administrative services fees were approximately five basis points below the median of the peer group and the actual management and administrative services fees were approximately four basis points below the median of the peer group. The Board also observed that for the fiscal year ended December 31, 2009 the total expense ratio of Class A was approximately one basis point above the median of the peer group, the total expense ratios of Class B, Class C were approximately seven basis points, and Class P were approximately eight basis points below the median of the peer group, the total expense ratio of Class F was approximately the same as the median of the peer group, the total expense ratio of Class I was approximately six basis points below the median of the peer group, the total expense ratio of Class R2 was approximately seven basis points above the median of the peer group, and the total expense ratio of Class R3 was approximately four basis points below the median of the peer group. The Board also considered the projected expense ratio of each class and how those expense ratios would relate to those of the peer group.
Profitability. The Board considered the level of Lord Abbett’s profits in managing the Fund, including a review of Lord Abbett’s methodology for allocating its costs to its management of the Fund. The Board concluded that the allocation methodology had a reasonable basis and was appropriate. It considered any profits realized by Lord Abbett in connection with the operation of the Fund and whether the amount of profit was fair for the management of the Fund. The Board also considered the profits realized from other businesses of Lord Abbett, which may benefit from or be related to the Fund’s business. The Board considered Lord Abbett’s profit margins in comparison with available industry data, both accounting for and ignoring marketing and distribution expenses, and how those profit margins could affect Lord Abbett’s ability to recruit and retain investment personnel. The Board recognized that Lord Abbett’s profitability was a factor in enabling it to attract and retain qualified investment management personnel to provide services to the Fund. The Board noted that Lord Abbett’s overall profitability had increased in its 2010 fiscal year. The Board concluded that Lord Abbett’s profitability overall and as to the Fund was not excessive.
Economies of Scale. The Board considered whether there had been any economies of scale in managing the Fund, whether the Fund had appropriately benefited from any such economies of scale, and whether there was potential for realization of any further economies of scale. The Board concluded that the existing advisory fee schedule, with its breakpoints in the level of the advisory fee, adequately addressed any economies of scale in managing the Fund.
Other Benefits to Lord Abbett. The Board considered the character and amount of fees paid by the Fund and the Fund’s shareholders to Lord Abbett and Distributor for services other than investment advisory services. The Board also considered the revenues and profitability of Lord
62
Abbett’s investment advisory business apart from its mutual fund business, and the intangible benefits enjoyed by Lord Abbett by virtue of its relationship with the Fund. The Board observed that Distributor receives 12b-1 fees from certain of the Lord Abbett Funds as to shares held in accounts for which there is no other broker of record, may retain a portion of the 12b-1 fees from the Funds, and receives a portion of the sales charges on sales and redemptions of some classes of shares. The Board observed that, in addition, Lord Abbett accrues certain benefits for its business of providing investment advice to clients other than the Lord Abbett Funds, but that that business also benefits the Funds. The Board also noted that Lord Abbett, as disclosed in the prospectus of the Fund, has entered into revenue sharing arrangements with certain entities that distribute shares of the Fund. The Board also took into consideration the investment research that Lord Abbett receives as a result of Fund brokerage transactions.
Alternative Arrangements. The Board considered whether, instead of approving continuation of the management agreement, it might be in the best interests of the Fund to implement one or more alternative arrangements, such as continuing to employ Lord Abbett, but on different terms.
In considering whether to approve the continuation of the management agreement, the Board did not identify any single factor as paramount or controlling. This summary does not discuss in detail all matters considered. After considering all of the relevant factors, the Board unanimously found that continuation of the existing management agreement was in the best interests of the Fund and its shareholders and voted unanimously to approve the continuation of the management agreement.
63
Householding
The Fund has adopted a policy that allows it to send only one copy of the Fund‘s prospectus, proxy material, annual report and semiannual report to certain shareholders residing at the same “household.” This reduces Fund expenses, which benefits you and other shareholders. If you need additional copies or do not want your mailings to be “householded,” please call Lord Abbett at 888-522-2388 or send a written request with your name, the name of your fund or funds and your account number or numbers to Lord Abbett Family of Funds, P.O. Box 219336, Kansas City, MO 64121.
Proxy Voting Policies, Procedures and Records
A description of the policies and procedures that Lord Abbett uses to vote proxies related to the Fund’s portfolio securities, and information on how Lord Abbett voted the Fund’s proxies during the 12-month period ended June 30 are available without charge, upon request, (i) by calling 888-522-2388; (ii) on Lord Abbett’s Website at www.lordabbett.com; and (iii) on the Securities and Exchange Commission’s (“SEC”) Website at www.sec.gov.
Shareholder Reports and Quarterly Portfolio Disclosure
The Fund is required to file its complete schedule of portfolio holdings with the SEC for its first and third fiscal quarters on Form N-Q. Copies of the filings are available without charge, upon request on the SEC’s Website at www.sec.gov and may be available by calling Lord Abbett at 888-522-2388. You can also obtain copies of Form N-Q by (i) visiting the SEC’s Public Reference Room in Washington, DC (information on the operation of the Public Reference Room may be obtained by calling 800-SEC-0330); (ii) sending your request and duplicating fee to the SEC’s Public Reference Section, Washington, DC 20549-1520; or (iii) sending your request electronically, after paying a duplicating fee, to publicinfo@sec.gov.
Tax Information
3.51% of the ordinary income distributions paid by the Fund during the year is qualified dividend income. For corporate shareholders, 3.43% of the ordinary income distributions is qualified for the dividends received deduction.
For foreign shareholders, 96.53% of the ordinary income distributions paid by the Fund during the year ended December 31, 2010 represents interest-related dividends.
64


This report, when not used for the general information of shareholders of the Fund, is to be distributed only if preceded or accompanied by a current fund prospectus.
Lord Abbett mutual fund shares are distributed by LORD ABBETT DISTRIBUTOR LLC.
Lord Abbett Bond-Debenture Fund, Inc.
LABD-2-1210
(2/11)
| Item 2: | Code of Ethics. |
| (a) | In accordance with applicable requirements, the Registrant adopted a Sarbanes-Oxley Code of Ethics on June 19, 2003 that applies to the principal executive officer and senior financial officers of the Registrant (“Code of Ethics”). The Code of Ethics was in effect during the fiscal year ended December 31, 2010 (the “Period”). |
| (b) | Not applicable. |
| (c) | The Registrant has not amended the Code of Ethics as described in Form N-CSR during the Period. |
| (d) | The Registrant has not granted any waiver, including an implicit waiver, from a provision of the Code of Ethics as described in Form N-CSR during the Period. |
| (e) | Not applicable. |
| (f) | See Item 12(a)(1) concerning the filing of the Code of Ethics. The Registrant will provide a copy of the Code of Ethics to any person without charge, upon request. To obtain a copy, please call Lord Abbett at 888-522-2388. |
| Item 3: | Audit Committee Financial Expert. |
| The Registrant’s board of directors has determined that each of the following independent directors who are members of the audit committee is an audit committee financial expert: E. Thayer Bigelow, Robert B. Calhoun Jr., Franklin W. Hobbs, and James L.L. Tullis. Each of these persons is independent within the meaning of the Form N-CSR. |
| Item 4: | Principal Accountant Fees and Services. |
| In response to sections (a), (b), (c) and (d) of Item 4, the aggregate fees billed to the Registrant for the fiscal years ended December 31, 2010 and 2009 by the Registrant’s principal accounting firm, Deloitte & Touche LLP, the member firms of Deloitte Touche Tohmatsu and their respective affiliates (collectively, “Deloitte”) were as follows: |
| Fiscal year ended: | ||||
| 2010 | 2009 | |||
Audit Fees {a} | $67,000 | $65,500 | ||
Audit-Related Fees | - 0 - | - 0 - | ||
Total audit and audit-related fees | $67,000 | 65,500 | ||
Tax Fees {b} | 11,244 | 9,542 | ||
All Other Fees | - 0 - | - 0 - | ||
Total Fees | $78,244 | $75,042 | ||
{a} Consists of fees for audits of the Registrant’s annual financial statements.
{b} Fees for the fiscal year ended December 31, 2010 and 2009 consist of fees for preparing the U.S. Income Tax Return for Regulated Investment Companies, New Jersey Corporation Business Tax Return, New Jersey Annual Report Form, U.S. Return of Excise Tax on Undistributed Income of Investment Companies, IRS Forms 1099-MISC and 1096 Annual Summary and Transmittal of U.S. Information Returns.
(e) (1) Pursuant to Rule 2-01(c) (7) of Regulation S-X, the Registrant’s Audit Committee has adopted pre-approval policies and procedures. Such policies and procedures generally provide that the Audit Committee must pre-approve:
| • | any audit, audit-related, tax, and other services to be provided to the Lord Abbett Funds, including the Registrant, and |
| • | any audit-related, tax, and other services to be provided to the Registrant’s investment adviser and any entity controlling, controlled by or under common control with the investment adviser that provides ongoing services to one or more Funds comprising the Registrant if the engagement relates directly to operations and financial reporting of a Fund, by the independent auditor to assure that the provision of such services does not impair the auditor’s independence. |
The Audit Committee has delegated pre-approval authority to its Chairman, subject to a fee limit of $10,000 per event, and not to exceed $25,000 annually. The Chairman will report any pre-approval decisions to the Audit Committee at its next scheduled meeting. Unless a type of service to be provided by the independent auditor has received general pre-approval, it must be pre-approved by the Audit Committee. Any proposed services exceeding pre-approved cost levels will require specific pre-approval by the Audit Committee.
(e) (2) The Registrant’s Audit Committee has approved 100% of the services described in this Item 4 (b) through (d).
(f) Not applicable.
(g) The aggregate non-audit fees billed by Deloitte for services rendered to the Registrant are shown above in the response to Item 4 (a), (b), (c) and (d) as “All Other Fees”.
The aggregate non-audit fees billed by Deloitte for services rendered to the Registrant’s investment adviser, Lord, Abbett & Co. LLC (“Lord Abbett”), for the fiscal years ended December 31, 2010 and 2009 were:
| Fiscal year ended: | ||||
| 2010 | 2009 | |||
All Other Fees {a} | $171,360 | $161,385 | ||
{a} Consist of fees for Independent Services Auditors’ Report on Controls Placed in Operation and Tests of Operating Effectiveness related to Lord Abbett’s Asset Management Services (“SAS 70 Report”).
The aggregate non-audit fees billed by Deloitte for services rendered to entities under the common control of Lord Abbett for the fiscal years ended December 31, 2010 and 2009 were:
| Fiscal year ended: | ||||
| 2010 | 2009 | |||
All Other Fees | $ - 0 - | $ - 0- | ||
(h) The Registrant’s Audit Committee has considered the provision of non-audit services that were rendered to the Registrant’s investment adviser, and any entity controlling, controlled by or under common control with the investment adviser that provides ongoing services to the Registrant, that were not pre-approved pursuant to Rule 2-01 (c)(7)(ii) of Regulation S-X and has determined that the provision of such services is compatible with maintaining Deloitte’s independence.
| Item 5: | Audit Committee of Listed Registrants. |
| Not applicable. |
| Item 6: | Investments. |
| Not applicable. |
| Item 7: | Disclosure of Proxy Voting Policies and Procedures for Closed-End Management Investment Companies. |
| Not applicable. |
| Item 8: | Portfolio Managers of Closed-End Management Investment Companies. |
| Not applicable. |
| Item 9: | Purchases of Equity Securities by Closed-End Management Investment Company and Affiliated Purchasers. |
| Not applicable. |
| Item 10: | Submission of Matters to a Vote of Security Holders. |
| Not applicable. |
| Item 11: | Controls and Procedures. |
| (a) | Based on their evaluation of the Registrant’s disclosure controls and procedures (as defined in Rule 30a-3(c) under the Investment Company Act of 1940) as of a date within 90 days prior to the filing date of this report, the Chief Executive Officer and Chief Financial Officer of the Registrant have concluded that such disclosure controls and procedures are reasonably designed and effective to ensure that material information relating to the Registrant, including its consolidated subsidiaries, is made known to them by others within those entities. |
| (b) | There were no changes in the Registrant’s internal control over financial reporting (as defined in Rule 30a-3(d) under the Investment Company Act of 1940) that occurred during the second fiscal quarter of the period covered by this report that have materially affected, or are reasonably likely to materially affect, the Registrant’s internal control over financial reporting. |
| Item 12: | Exhibits. |
| (a)(1) | Amendments to Code of Ethics – Not applicable. |
| (a)(2) | Certification of each principal executive officer and principal financial officer of the Registrant as required by Rule 30a-2 under the Investment Company Act of 1940 is attached hereto as a part of EX-99.CERT. |
| (a)(3) | Not applicable. |
| (b) | Certification of each principal executive officer and principal financial officer of the Registrant as required by Section 906 of the Sarbanes-Oxley Act of 2002 is provided as a part of EX-99.906CERT. |
SIGNATURES
Pursuant to the requirements of the Securities Exchange Act of 1934 and the Investment Company Act of 1940, the Registrant has duly caused this report to be signed on its behalf by the undersigned, thereunto duly authorized.
| LORD ABBETT BOND-DEBENTURE FUND, INC. | ||||||
| By: | /s/ Robert S. Dow | |||||
| Robert S. Dow | ||||||
| Chief Executive Officer and Chairman | ||||||
| Date: February 25, 2011 | ||||||
| By: | /s/ Joan A. Binstock | |||||
| Joan A. Binstock | ||||||
| Chief Financial Officer and Vice President | ||||||
| Date: February 25, 2011 | ||||||
Pursuant to the requirements of the Securities Exchange Act of 1934 and the Investment Company Act of 1940, this report has been signed below by the following persons on behalf of the Registrant and in the capacities and on the dates indicated.
| By: | /s/ Robert S. Dow | |||||
| Robert S. Dow | ||||||
| Chief Executive Officer and Chairman | ||||||
| Date: February 25, 2011 | ||||||
| By: | /s/ Joan A. Binstock | |||||
| Joan A. Binstock | ||||||
| Chief Financial Officer and Vice President | ||||||
| Date: February 25, 2011 | ||||||