UNITED STATES
SECURITIES AND EXCHANGE COMMISSION
Washington, D.C. 20549
FORM N-CSR
CERTIFIED SHAREHOLDER REPORT OF REGISTERED
MANAGEMENT INVESTMENT COMPANIES
Investment Company Act File Number: 811-02145
LORD ABBETT BOND-DEBENTURE FUND, INC.
(Exact name of Registrant as specified in charter)
| 90 Hudson Street, Jersey City, NJ 07302 | ||
| (Address of principal executive offices) (Zip code) |
Thomas R. Phillips, Esq., Vice President & Assistant Secretary
| 90 Hudson Street, Jersey City, NJ 07302 | ||
| (Name and address of agent for service) |
Registrant’s telephone number, including area code: (800) 201-6984
Date of fiscal year end: 12/31
Date of reporting period: 12/31/2013
| Item 1: | Report(s) to Shareholders. |
![]()
2013
LO R D A B B E T T
A N N U A L
R E P O RT
Lord Abbett
Bond Debenture Fund
For the fiscal year ended December 31, 2013
Table of Contents
Lord Abbett Bond Debenture Fund
Annual Report
For the fiscal year ended December 31, 2013

Daria L. Foster, Director, President and Chief Executive Officer of the Lord Abbett Funds, and E. Thayer Bigelow, Independent Chairman of the Lord Abbett Funds.
Dear Shareholders: We are pleased to provide you with this overview of the performance of Lord Abbett Bond Debenture Fund for the fiscal year ended December 31, 2013. On this page and the following pages, we discuss the major factors that influenced fiscal year performance. For additional information about the Fund, please visit our Website at www.lordabbett.com, where you also can access quarterly commentaries and other portfolio related updates.
Thank you for investing in Lord Abbett mutual funds. We value the trust that you place in us and look forward to serving your investment needs in the years to come.
Best regards,

Daria L. Foster
Director, President and Chief Executive Officer
For the fiscal year ended December 31, 2013, the Fund returned 7.78%, reflecting performance at the net asset value (NAV) of Class A shares, with all distributions reinvested, compared to its benchmark, the Barclays U.S. Aggregate Bond Index,1 which returned -2.02% over the same period.
During the period, credit sectors of the bond market outperformed Treasuries due to demand for higher-yielding investments, and were supported by continued monetary stimulus by the Federal Reserve. Interest rates rose and credit spreads tightened during the period.
A major contributor to absolute performance was the Fund’s positioning in high-yield bonds. As it has in the past, the Fund maintained an overweight in high
1
yield versus the benchmark, as we remained positive on the high-yield market from a fundamental perspective. Within the Fund’s high-yield allocation, among the top performing names was gaming holding River Rock Entertainment Authority. Metals and mining holding James River Coal Co. was among the worst performers within the sector.
The Fund’s convertible allocation also added to absolute performance. One of the top performers within the convertible portion of the Fund was computer hardware holding Micron Technology, Inc., while our holding in oil exploration company Cobalt International Energy was among the convertible holdings that detracted the most from absolute performance. We continue to seek convertible securities of companies with good prospects for improving earnings results.
Within the Fund’s investment-grade bond allocation, we maintained little to no exposure to U.S. Treasuries, which added to absolute performance, as corporates outperformed Treasuries during the period.
Overall across the Fund, among the industries that contributed the most to absolute performance were technology and electronics, health care, and capital goods. Among those that either detracted from absolute performance or contributed the least were mortgage-backed securities, foreign sovereign, and real estate.
The Fund’s portfolio is actively managed and, therefore, its holdings and the weightings of a particular issuer or particular sector as a percentage of portfolio assets are subject to change. Sectors may include many industries.
2
1 The Barclays U.S. Aggregate Bond Index is an unmanaged index composed of securities from the Barclays Government/Corporate Bond Index, Mortgage-Backed Securities Index and the Asset-Backed Securities Index. Total return comprises price appreciation/depreciation and income as a percentage of the original investment. Indexes are rebalanced monthly by market capitalization.
Unless otherwise specified, indexes reflect total return, with all dividends reinvested. Indexes are unmanaged, do not reflect the deduction of fees or expenses, and are not available for direct investment.
Important Performance and Other Information
Performance data quoted in the following pages reflect past performance and are no guarantee of future results. Current performance may be higher or lower than the performance quoted. The investment return and principal value of an investment in the Fund will fluctuate so that shares, on any given day or when redeemed, may be worth more or less than their original cost. You can obtain performance data current to the most recent month end by calling Lord Abbett at 888-522-2388 or referring to www.lordabbett.com.
Except where noted, comparative Fund performance does not account for the deduction of sales charges and would be different if sales charges were included. The Fund offers classes of shares with distinct pricing options. For a full description of the differences in pricing alternatives, please see the Fund’s prospectus.
The annual commentary above discusses the views of the Fund’s management and various portfolio holdings of the Fund as of December 31, 2013. These views and portfolio holdings may have changed after this date. Information provided in the commentary is not a recommendation to buy or sell securities. Because the Fund’s portfolio is actively managed and may change significantly, the Fund may no longer own the securities described above or may have otherwise changed its positions in the securities. For more recent information about the Fund’s portfolio holdings, please visit www.lordabbett.com.
A Note about Risk: See Notes to Financial Statements for a discussion of investment risks. For a more detailed discussion of the risks associated with the Fund, please see the Fund’s prospectus.
Mutual funds are not insured by the FDIC, are not deposits or other obligations of, or guaranteed by, banks, and are subject to investment risks including possible loss of principal amount invested.
3
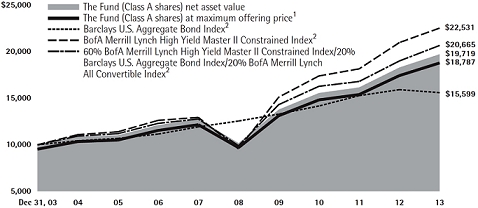
Below is a comparison of a $10,000 investment in Class A shares with the same investment in the Barclays U.S. Aggregate Bond Index, the BofA Merrill Lynch High Yield Master II Constrained Index, and the 60% BofA Merrill Lynch High Yield Master II Constrained Index/20% Barclays U.S. Aggregate Bond Index/20% BofA Merrill Lynch All Convertible Index, assuming reinvestment of all dividends and distributions. The performance of other classes will be greater than or less than the performance shown in the graph below due to different sales loads and expenses applicable to such classes. The graph and performance table below do not reflect the deduction of taxes that a shareholder would pay on Fund distributions or the redemption of Fund shares. Past performance is no guarantee of future results.
Average Annual Total Returns at Maximum Applicable
Sales Charge for the Periods Ended December 31, 2013
| 1 Year | 5 Years | 10 Years | Life of Class | |||||||
| Class A3 | 2.61 | % | 13.05 | % | 6.51% | — | ||||
| Class B4 | 2.08 | % | 13.19 | % | 6.48% | — | ||||
| Class C5 | 6.08 | % | 13.43 | % | 6.33% | — | ||||
| Class F6 | 8.05 | % | 14.45 | % | — | 7.37% | ||||
| Class I7 | 8.16 | % | 14.56 | % | 7.39% | — | ||||
| Class P7 | 7.92 | % | 14.15 | % | 6.96% | — | ||||
| Class R28 | 7.52 | % | 13.90 | % | — | 6.86% | ||||
| Class R39 | 7.63 | % | 14.02 | % | — | 6.98% | ||||
1 Reflects the deduction of the maximum initial sales charge of 4.75%.
2 Performance of each unmanaged index does not reflect any fees or expenses. The performance of each index is not necessarily representative of the Fund’s performance.
3 Total return, which is the percentage change in net asset value, after deduction of the maximum initial sales charge of 4.75% applicable to Class A shares, with all dividends and distributions reinvested for the periods shown ended December 31, 2013 is calculated using the SEC-required uniform method to compute such return.
4 Performance reflects the deduction of a CDSC of 5% for 1 year, 2% for 5 years and 0% for 10 years. Class B shares automatically convert to Class A shares after approximately 8 years. (There is no initial sales charge for automatic conversions.) All returns for periods greater than 8 years reflect this conversion.
5 The 1% CDSC for Class C shares normally applies before the first anniversary of the purchase date. Performance for other periods is at net asset value.
6 Class F shares commenced operations on September 7, 2007 and performance for the Class began on September 28, 2007. Performance is at net asset value.
7 Performance is at net asset value.
8 Class R2 shares commenced operations on September 7, 2007 and performance for the Class began on September 28, 2007. Performance is at net asset value.
9 Class R3 shares commenced operations on September 7, 2007 and performance for the Class began on September 28, 2007. Performance is at net asset value.
4
As a shareholder of the Fund, you incur two types of costs: (1) transaction costs, including sales charges (loads) on purchase payments (these charges vary among the share classes); and (2) ongoing costs, including management fees; distribution and service (12b-1) fees (these charges vary among the share classes); and other Fund expenses. This Example is intended to help you understand your ongoing costs (in dollars) of investing in the Fund and to compare these costs with the ongoing costs of investing in other mutual funds.
The Example is based on an investment of $1,000 invested at the beginning of the period and held for the entire period (July 1, 2013 through December 31, 2013).
Actual Expenses
For each class of the Fund, the first line of the table on the following page provides information about actual account values and actual expenses. You may use the information in this line, together with the amount you invested, to estimate the expenses that you paid over the period. Simply divide your account value by $1,000 (for example, an $8,600 account value divided by $1,000 = 8.6), then multiply the result by the number in the first line under the heading titled “Expenses Paid During Period 7/1/13 – 12/31/13” to estimate the expenses you paid on your account during this period.
Hypothetical Example for Comparison Purposes
For each class of the Fund, the second line of the table on the following page provides information about hypothetical account values and hypothetical expenses based on the Fund’s actual expense ratio and an assumed rate of return of 5% per year before expenses, which is not the Fund’s actual return. The hypothetical account values and expenses may not be used to estimate the actual ending account balance or expenses you paid for the period. You may use this information to compare the ongoing costs of investing in the Fund and other funds. To do so, compare this 5% hypothetical example with the 5% hypothetical examples that appear in the shareholder reports of the other funds.
5
Please note that the expenses shown in the table are meant to highlight your ongoing costs only and do not reflect any transactional costs, such as sales charges (loads). Therefore, the second line of the table is useful in comparing ongoing costs only, and will not help you determine the relative total costs of owning different funds. In addition, if these transactional costs were included, your costs would have been higher.
| Beginning Account Value | Ending Account Value | Expenses Paid During Period† | ||||
| 7/1/13 - | ||||||
| 7/1/13 | 12/31/13 | 12/31/13 | ||||
| Class A | ||||||
| Actual | $1,000.00 | $1,061.00 | $5.04 | |||
| Hypothetical (5% Return Before Expenses) | $1,000.00 | $1,020.33 | $4.94 | |||
| Class B | ||||||
| Actual | $1,000.00 | $1,057.50 | $8.40 | |||
| Hypothetical (5% Return Before Expenses) | $1,000.00 | $1,017.05 | $8.24 | |||
| Class C | ||||||
| Actual | $1,000.00 | $1,057.50 | $8.40 | |||
| Hypothetical (5% Return Before Expenses) | $1,000.00 | $1,017.06 | $8.24 | |||
| Class F | ||||||
| Actual | $1,000.00 | $1,062.40 | $3.74 | |||
| Hypothetical (5% Return Before Expenses) | $1,000.00 | $1,021.60 | $3.67 | |||
| Class I | ||||||
| Actual | $1,000.00 | $1,061.70 | $3.22 | |||
| Hypothetical (5% Return Before Expenses) | $1,000.00 | $1,022.10 | $3.16 | |||
| Class P | ||||||
| Actual | $1,000.00 | $1,062.10 | $4.52 | |||
| Hypothetical (5% Return Before Expenses) | $1,000.00 | $1,020.84 | $4.43 | |||
| Class R2 | ||||||
| Actual | $1,000.00 | $1,059.70 | $6.33 | |||
| Hypothetical (5% Return Before Expenses) | $1,000.00 | $1,019.07 | $6.21 | |||
| Class R3 | ||||||
| Actual | $1,000.00 | $1,060.30 | $5.82 | |||
| Hypothetical (5% Return Before Expenses) | $1,000.00 | $1,019.59 | $5.70 |
| † | For each class of the Fund, net expenses are equal to the annualized expense ratio for such class (0.97% for Class A, 1.62% for Classes B and C, 0.72% for Class F, 0.62% for Class I, 0.87% for Class P, 1.22% for Class R2 and 1.12% for Class R3) multiplied by the average account value over the period, multiplied by 184/365 (to reflect one-half year period). |
Portfolio Holdings Presented by Sector
December 31, 2013
| Sector* | %** | |||
| Agency | 0.08 | % | ||
| Automotive | 2.25 | % | ||
| Banking | 3.00 | % | ||
| Basic Industry | 6.44 | % | ||
| Capital Goods | 8.77 | % | ||
| Consumer Cyclical | 5.52 | % | ||
| Consumer Non-Cyclical | 3.76 | % | ||
| Energy | 15.82 | % | ||
| Financial Services | 5.52 | % | ||
| Foreign Government | 0.22 | % | ||
| Healthcare | 8.83 | % | ||
| Sector* | %** | |||
| Insurance | 1.49 | % | ||
| Media | 6.04 | % | ||
| Municipal | 0.19 | % | ||
| Real Estate | 1.47 | % | ||
| Services | 8.46 | % | ||
| Technology & Electronics | 10.04 | % | ||
| Telecommunications | 8.58 | % | ||
| U.S. Government | 0.70 | % | ||
| Utility | 2.23 | % | ||
| Repurchase Agreement | 0.59 | % | ||
| Total | 100.00 | % | ||
| * | A sector may comprise several industries. |
| ** | Represents percent of total investments. |
6
December 31, 2013
| Investments | Shares (000) | Fair Value | ||||||
| LONG-TERM INVESTMENTS 97.42% | ||||||||
| COMMON STOCKS 4.32% | ||||||||
| Agency/Government Related 0.03% | ||||||||
| Fannie Mae* | 750 | $ | 2,257,500 | |||||
| Airlines 0.10% | ||||||||
| United Continental Holdings, Inc.* | 225 | 8,511,750 | ||||||
| Auto Parts & Equipment 0.05% | ||||||||
| Cooper-Standard Holdings, Inc.* | 96 | 4,727,427 | ||||||
| Banking 0.21% | ||||||||
| Fifth Third Bancorp | 350 | 7,360,500 | ||||||
| Huntington Bancshares, Inc. | 500 | 4,825,000 | ||||||
| Regions Financial Corp. | 600 | 5,934,000 | ||||||
| Total | 18,119,500 | |||||||
| Chemicals 0.33% | ||||||||
| Axiall Corp. | 150 | 7,116,000 | ||||||
| Monsanto Co. | 185 | 21,561,750 | ||||||
| Total | 28,677,750 | |||||||
| Computer Hardware 0.10% | ||||||||
| Apple, Inc. | 15 | 8,416,650 | ||||||
| Consumer/Commercial/Lease Financing 0.06% | ||||||||
| General Electric Co. | 175 | 4,905,250 | ||||||
| Consumer Products 0.18% | ||||||||
| Estee Lauder Cos., Inc. (The) Class A | 200 | 15,064,000 | ||||||
| Diversified Capital Goods 0.15% | ||||||||
| Emerson Electric Co. | 185 | 12,983,300 | ||||||
| Electronics 0.05% | ||||||||
| Broadcom Corp. Class A | 150 | 4,447,500 | ||||||
| Energy: Exploration & Production 0.63% | ||||||||
| Antero Resources Corp.* | 46 | 2,892,864 | ||||||
| Chesapeake Energy Corp. | 100 | 2,714,000 | ||||||
| Concho Resources, Inc.* | 129 | 13,964,400 | ||||||
| Diamondback Energy, Inc.* | 65 | 3,435,900 | ||||||
| Kodiak Oil & Gas Corp.* | 500 | 5,605,000 | ||||||
| See Notes to Financial Statements. | 7 |
Schedule of Investments (continued)
December 31, 2013
| Investments | Shares (000) | Fair Value | ||||||
| Energy: Exploration & Production (continued) | ||||||||
| Whiting Petroleum Corp.* | 409 | $ | 25,309,161 | |||||
| Total | 53,921,325 | |||||||
| Food: Wholesale 0.06% | ||||||||
| Boulder Brands, Inc.* | 310 | 4,916,600 | ||||||
| Health Services 0.12% | ||||||||
| Team Health Holdings, Inc.* | 220 | 10,021,000 | ||||||
| Investments & Miscellaneous Financial Services 0.21% | ||||||||
| SPDR S&P 500 ETF Trust | 100 | 18,467,000 | ||||||
| Life Insurance 0.16% | ||||||||
| MetLife, Inc. | 250 | 13,480,000 | ||||||
| Machinery 0.18% | ||||||||
| Chart Industries, Inc.* | 85 | 8,129,400 | ||||||
| Generac Holdings, Inc. | 135 | 7,646,400 | ||||||
| Total | 15,775,800 | |||||||
| Media: Diversified 0.06% | ||||||||
| Twenty-First Century Fox, Inc. Class A | 150 | 5,277,000 | ||||||
| Metals/Mining (Excluding Steel) 0.12% | ||||||||
| Precision Castparts Corp. | 40 | 10,772,000 | ||||||
| Multi-Line Insurance 0.06% | ||||||||
| Hartford Financial Services Group, Inc. | 140 | 5,072,200 | ||||||
| Oil Field Equipment & Services 0.05% | ||||||||
| Dresser-Rand Group, Inc.* | 80 | 4,770,400 | ||||||
| Pharmaceuticals 0.49% | ||||||||
| BioMarin Pharmaceutical, Inc.* | 200 | 14,054,000 | ||||||
| Bristol-Myers Squibb Co. | 385 | 20,462,750 | ||||||
| Vertex Pharmaceuticals, Inc.* | 100 | 7,430,000 | ||||||
| Total | 41,946,750 | |||||||
| Real Estate Investment Trusts 0.07% | ||||||||
| Camden Property Trust | 100 | 5,688,000 | ||||||
| Software/Services 0.39% | ||||||||
| Alliance Data Systems Corp.* | 50 | 13,146,500 | ||||||
| FireEye, Inc.* | 65 | 2,834,650 | ||||||
| 8 | See Notes to Financial Statements. |
Schedule of Investments (continued)
December 31, 2013
| Investments | Shares (000) | Fair Value | ||||||
| Software/Services (continued) | ||||||||
| Fortinet, Inc.* | 250 | $ | 4,782,500 | |||||
| Informatica Corp.* | 300 | 12,450,000 | ||||||
| Total | 33,213,650 | |||||||
| Specialty Retail 0.10% | ||||||||
| Home Depot, Inc. (The) | 100 | 8,234,000 | ||||||
| Telecommunications Equipment 0.27% | ||||||||
| Aruba Networks, Inc.* | 550 | 9,845,000 | ||||||
| Palo Alto Networks, Inc.* | 235 | 13,505,450 | ||||||
| Total | 23,350,450 | |||||||
| Telecommunications: Wireless 0.09% | ||||||||
| QUALCOMM, Inc. | 100 | 7,425,000 | ||||||
| Total Common Stocks (cost $322,882,613) | 370,441,802 | |||||||
| Interest Rate | Maturity Date | Principal Amount (000) | ||||||||||
| CONVERTIBLE BONDS 8.01% | ||||||||||||
| Apparel/Textiles 0.16% | ||||||||||||
| Iconix Brand Group, Inc.† | 1.50% | 3/15/2018 | $ | 10,000 | 13,700,000 | |||||||
| Auto Loans 0.31% | ||||||||||||
| Volkswagen International Finance NV (Netherlands)†(a) | 5.50% | 11/9/2015 | EUR | 15,700 | 26,789,314 | |||||||
| Auto Parts & Equipment 0.09% | ||||||||||||
| Meritor, Inc. (Zero Coupon after 2/15/2019)~ | 4.00% | 2/15/2027 | $ | 8,250 | 7,935,469 | |||||||
| Automakers 0.14% | ||||||||||||
| Ford Motor Co. | 4.25% | 11/15/2016 | 6,250 | 11,562,500 | ||||||||
| Building Materials 0.06% | ||||||||||||
| RPM International, Inc. | 2.25% | 12/15/2020 | 4,310 | 4,792,181 | ||||||||
| Computer Hardware 0.40% | ||||||||||||
| Micron Technology, Inc. | 2.375% | 5/1/2032 | 10,300 | 23,876,687 | ||||||||
| SanDisk Corp.† | 0.50% | 10/15/2020 | 10,675 | 10,621,625 | ||||||||
| Total | 34,498,312 | |||||||||||
| Electronics 0.52% | ||||||||||||
| Intel Corp. | 2.95% | 12/15/2035 | 6,200 | 6,959,500 | ||||||||
| See Notes to Financial Statements. | 9 |
Schedule of Investments (continued)
December 31, 2013
| Investments | Interest Rate | Maturity Date | Principal Amount (000) | Fair Value | ||||||||
| Electronics (continued) | ||||||||||||
| Intel Corp. | 3.25% | 8/1/2039 | $ | 7,000 | $ | 9,528,785 | ||||||
| InvenSense, Inc.† | 1.75% | 11/1/2018 | 6,250 | 7,308,594 | ||||||||
| Novellus Systems, Inc. | 2.625% | 5/15/2041 | 7,500 | 12,571,875 | ||||||||
| ON Semiconductor Corp. | 2.625% | 12/15/2026 | 7,000 | 7,730,625 | ||||||||
| Total | 44,099,379 | |||||||||||
| Energy: Exploration & Production 0.21% | ||||||||||||
| Cobalt International Energy, Inc. | 2.625% | 12/1/2019 | 3,500 | 3,099,688 | ||||||||
| Energy XXI Bermuda Ltd.† | 3.00% | 12/15/2018 | 15,000 | 14,840,625 | ||||||||
| Total | 17,940,313 | |||||||||||
| Health Services 0.37% | ||||||||||||
| Brookdale Senior Living, Inc. | 2.75% | 6/15/2018 | 18,000 | 21,465,000 | ||||||||
| Illumina, Inc.† | 0.25% | 3/15/2016 | 7,500 | 10,439,062 | ||||||||
| Total | 31,904,062 | |||||||||||
| Hotels 0.35% | ||||||||||||
| Host Hotels & Resorts LP† | 2.50% | 10/15/2029 | 20,000 | 30,300,000 | ||||||||
| Integrated Energy 0.06% | ||||||||||||
| SunPower Corp.† | 0.75% | 6/1/2018 | 1,000 | 1,260,625 | ||||||||
| SunPower Corp. | 4.50% | 3/15/2015 | 3,000 | 4,216,875 | ||||||||
| Total | 5,477,500 | |||||||||||
| Machinery 0.32% | ||||||||||||
| Altra Industrial Motion Corp. | 2.75% | 3/1/2031 | 8,750 | 12,047,656 | ||||||||
| Chart Industries, Inc. | 2.00% | 8/1/2018 | 9,675 | 14,990,203 | ||||||||
| Total | 27,037,859 | |||||||||||
| Managed Care 0.12% | ||||||||||||
| WellPoint, Inc. | 2.75% | 10/15/2042 | 7,500 | 10,190,625 | ||||||||
| Media: Diversified 0.08% | ||||||||||||
| Liberty Media Corp.† | 1.375% | 10/15/2023 | 7,115 | 7,119,447 | ||||||||
| Metals/Mining (Excluding Steel) 0.06% | ||||||||||||
| Newmont Mining Corp. | 1.25% | 7/15/2014 | 5,000 | 5,009,375 | ||||||||
| Monoline Insurance 0.07% | ||||||||||||
| MGIC Investment Corp. | 2.00% | 4/1/2020 | 4,375 | 6,059,375 | ||||||||
| Oil Field Equipment & Services 0.24% | ||||||||||||
| Hornbeck Offshore Services, Inc. | 1.50% | 9/1/2019 | 17,500 | 20,792,188 | ||||||||
| 10 | See Notes to Financial Statements. |
Schedule of Investments (continued)
December 31, 2013
| Investments | Interest Rate | Maturity Date | Principal Amount (000) | Fair Value | ||||||||
| Pharmaceuticals 1.44% | ||||||||||||
| BioMarin Pharmaceutical, Inc. | 0.75% | 10/15/2018 | $ | 1,000 | $ | 1,064,375 | ||||||
| Cubist Pharmaceuticals, Inc.† | 1.875% | 9/1/2020 | 14,000 | 16,038,750 | ||||||||
| Gilead Sciences, Inc. | 1.625% | 5/1/2016 | 14,000 | 46,200,070 | ||||||||
| Medivation, Inc. | 2.625% | 4/1/2017 | 18,400 | 26,956,000 | ||||||||
| Mylan, Inc. | 3.75% | 9/15/2015 | 10,000 | 32,837,500 | ||||||||
| Total | 123,096,695 | |||||||||||
| Railroads 0.14% | ||||||||||||
| Trinity Industries, Inc. | 3.875% | 6/1/2036 | 9,000 | 11,896,875 | ||||||||
| Software/Services 2.12% | ||||||||||||
| Concur Technologies, Inc.† | 0.50% | 6/15/2018 | 10,000 | 11,631,250 | ||||||||
| Electronic Arts, Inc. | 0.75% | 7/15/2016 | 2,575 | 2,752,031 | ||||||||
| EMC Corp.(b) | 1.75% | 12/1/2013 | 7,250 | 11,431,800 | ||||||||
| Medidata Solutions, Inc.† | 1.00% | 8/1/2018 | 8,640 | 11,064,600 | ||||||||
| NetSuite, Inc.† | 0.25% | 6/1/2018 | 15,000 | 16,612,500 | ||||||||
| Nuance Communications, Inc. | 2.75% | 11/1/2031 | 7,000 | 6,873,125 | ||||||||
| Proofpoint, Inc.† | 1.25% | 12/15/2018 | 12,250 | 13,268,281 | ||||||||
| Salesforce.com, Inc. | 0.75% | 1/15/2015 | 8,300 | 21,414,000 | ||||||||
| Shutterfly, Inc.† | 0.25% | 5/15/2018 | 6,475 | 6,956,578 | ||||||||
| SINA Corp. (China)†(c) | 1.00% | 12/1/2018 | 13,050 | 13,319,156 | ||||||||
| Trulia, Inc.† | 2.75% | 12/15/2020 | 6,245 | 7,591,578 | ||||||||
| Web.com Group, Inc. | 1.00% | 8/15/2018 | 8,375 | 9,442,813 | ||||||||
| Workday, Inc.† | 0.75% | 7/15/2018 | 10,000 | 11,781,250 | ||||||||
| Xilinx, Inc. | 2.625% | 6/15/2017 | 15,500 | 24,800,000 | ||||||||
| Yahoo!, Inc.† | Zero Coupon | 12/1/2018 | 12,500 | 12,976,563 | ||||||||
| Total | 181,915,525 | |||||||||||
| Steel Producers/Products 0.06% | ||||||||||||
| U.S. Steel Corp. | 2.75% | 4/1/2019 | 3,500 | 4,650,625 | ||||||||
| Support: Services 0.33% | ||||||||||||
| priceline.com, Inc. | 1.00% | 3/15/2018 | 14,000 | 19,372,500 | ||||||||
| priceline.com, Inc. | 1.25% | 3/15/2015 | 2,358 | 9,007,544 | ||||||||
| Total | 28,380,044 | |||||||||||
| Telecommunications Equipment 0.31% | ||||||||||||
| Ciena Corp.† | 3.75% | 10/15/2018 | 5,000 | 7,228,125 | ||||||||
| Ciena Corp. | 4.00% | 12/15/2020 | 2,550 | 3,764,437 | ||||||||
| See Notes to Financial Statements. | 11 |
Schedule of Investments (continued)
December 31, 2013
| Investments | Interest Rate | Maturity Date | Principal Amount (000) | Fair Value | ||||||||
| Telecommunications Equipment (continued) | ||||||||||||
| Nortel Networks Corp. (Canada)(c)(d) | 2.125% | 4/15/2014 | $ | 15,800 | $ | 15,730,875 | ||||||
| Total | 26,723,437 | |||||||||||
| Telecommunications: Wireless 0.05% | ||||||||||||
| Clearwire Communications LLC/Clearwire Finance, Inc.† | 8.25% | 12/1/2040 | 3,500 | 4,042,500 | ||||||||
| Total Convertible Bonds (cost $578,786,316) | 685,913,600 | |||||||||||
| Dividend Rate | Shares (000) | |||||||||||
| CONVERTIBLE PREFERRED STOCKS 2.65% | ||||||||||||
| Aerospace/Defense 0.33% | ||||||||||||
| United Technologies Corp. | 7.50% | 435 | 28,479,450 | |||||||||
| Banking 0.41% | ||||||||||||
| Bank of America Corp. | 7.25% | 18 | 18,965,375 | |||||||||
| Wells Fargo & Co. | 7.50% | 15 | 16,575,000 | |||||||||
| Total | 35,540,375 | |||||||||||
| Electric: Integrated 0.50% | ||||||||||||
| Dominion Resources, Inc. | 6.00% | 150 | 8,131,500 | |||||||||
| NextEra Energy, Inc. | 5.889% | 300 | 16,989,000 | |||||||||
| PPL Corp. | 8.75% | 335 | 17,714,800 | |||||||||
| Total | 42,835,300 | |||||||||||
| Energy: Exploration & Production 0.03% | ||||||||||||
| Chesapeake Energy Corp.† | 5.75% | 3 | 2,923,437 | |||||||||
| Food: Wholesale 0.23% | ||||||||||||
| Bunge Ltd. | 4.875% | 180 | 19,350,000 | |||||||||
| Investments & Miscellaneous Financial Services 0.35% | ||||||||||||
| AMG Capital Trust I | 5.10% | 180 | 13,112,825 | |||||||||
| AMG Capital Trust II | 5.15% | 262 | 16,637,000 | |||||||||
| Total | 29,749,825 | |||||||||||
| Life Insurance 0.15% | ||||||||||||
| MetLife, Inc. | 5.00% | 400 | 12,616,000 | |||||||||
| Metals/Mining (Excluding Steel) 0.21% | ||||||||||||
| Cliffs Natural Resources, Inc. | 7.00% | 800 | 18,368,000 | |||||||||
| 12 | See Notes to Financial Statements. |
Schedule of Investments (continued)
December 31, 2013
| Investments | Dividend Rate | Shares (000) | Fair Value | |||||||||
| Railroads 0.18% | ||||||||||||
| Genesee & Wyoming, Inc. | 5.00% | 120 | $ | 15,450,000 | ||||||||
| Real Estate Investment Trusts 0.04% | ||||||||||||
| Alexandria Real Estate Equities, Inc. | 7.00% | 120 | 3,012,000 | |||||||||
| Steel Producers/Products 0.08% | ||||||||||||
| ArcelorMittal (Luxembourg)(c) | 6.00% | 280 | 7,280,000 | |||||||||
| Telecommunications: Integrated/Services 0.03% | ||||||||||||
| Intelsat SA (Luxembourg)(c) | 5.75% | 40 | 2,340,000 | |||||||||
| Telecommunications: Wireless 0.11% | ||||||||||||
| Crown Castle International Corp. | 4.50% | 95 | 9,503,800 | |||||||||
| Total Convertible Preferred Stocks (cost $206,045,739) | 227,448,187 | |||||||||||
| Interest Rate | Maturity Date | Principal Amount (000) | ||||||||||
| FLOATING RATE LOANS(e) 1.80% | ||||||||||||
| Chemicals 0.05% | ||||||||||||
| OXEA Finance & Cy S.C.A. 2nd Lien Term Loan | 8.25% | 7/15/2020 | $ | 4,000 | 4,087,520 | |||||||
| Food & Drug Retailers 0.19% | ||||||||||||
| Albertson’s LLC Term Loan B2 | 4.75% | 3/21/2019 | 7,214 | 7,264,823 | ||||||||
| Rite Aid Corp. 2nd Lien Tranche 1 Term Loan | 5.75% | 8/21/2020 | 8,700 | 8,941,991 | ||||||||
| Total | 16,206,814 | |||||||||||
| Food: Wholesale 0.15% | ||||||||||||
| Diamond Foods, Inc. Revolver | 6.25% | 2/25/2015 | 2,088 | 2,057,124 | ||||||||
| Diamond Foods, Inc. Term Loan | 6.25% | 2/25/2015 | 4,012 | 4,007,154 | ||||||||
| New HB Acquisition LLC Term Loan B | 6.75% | 4/9/2020 | 6,450 | 6,691,875 | ||||||||
| Total | 12,756,153 | |||||||||||
| Health Facilities 0.15% | ||||||||||||
| Ardent Medical Services, Inc. 2nd Lien Term Loan | 11.00% | 1/2/2019 | 3,400 | 3,442,500 | ||||||||
| CHG Healthcare Services, Inc. 1st Lien Term Loan | 4.25% | 11/19/2019 | 9,864 | 9,925,613 | ||||||||
| Total | 13,368,113 | |||||||||||
| Investments & Miscellaneous Financial Services 0.06% | ||||||||||||
| Sedgwick CMS Inc. Additional Term Loan B | 8.00% | 12/12/2018 | 5,250 | 5,348,438 | ||||||||
| See Notes to Financial Statements. | 13 |
Schedule of Investments (continued)
December 31, 2013
| Investments | Interest Rate | Maturity Date | Principal Amount (000) | Fair Value | ||||||||
| Machinery 0.11% | ||||||||||||
| Generac Power Systems, Inc. Term Loan B | 3.50% | 5/31/2020 | $ | 9,975 | $ | 10,006,109 | ||||||
| Media: Broadcast 0.20% | ||||||||||||
| Clear Channel Communications, Inc. Tranche Term Loan B | 3.819% | 1/29/2016 | 17,564 | 17,045,185 | ||||||||
| Media: Cable 0.10% | ||||||||||||
| Virgin Media Investment Holdings Ltd. Facility Term Loan B (United Kingdom)(c) | 3.50% | 6/8/2020 | 8,500 | 8,529,750 | ||||||||
| Media: Services 0.26% | ||||||||||||
| Affinion Group, Inc. Tranche B Term Loan | 6.50% | 10/10/2016 | 15,355 | 15,167,736 | ||||||||
| Digital Generation, Inc. Initial Term Loan | 7.25% | 7/26/2018 | 6,992 | 7,036,152 | ||||||||
| Total | 22,203,888 | |||||||||||
| Oil Field Equipment & Services 0.17% | ||||||||||||
| Fieldwood Energy LLC 2nd Lien Closing Date Loan | 8.375% | 9/30/2020 | 14,000 | 14,329,560 | ||||||||
| Software/Services 0.26% | ||||||||||||
| Mitchell International, Inc. 2nd Lien Term Loan | 8.50% | 10/8/2021 | 4,000 | 4,068,760 | ||||||||
| SRA International, Inc. Term Loan | 6.50% | 7/20/2018 | 13,248 | 13,264,912 | ||||||||
| Syniverse Holdings, Inc. Term Loan | 4.00% | 4/23/2019 | 4,799 | 4,815,640 | ||||||||
| Total | 22,149,312 | |||||||||||
| Specialty Retail 0.10% | ||||||||||||
| BJ’s Wholesale Club, Inc. 2nd Lien 2013 (November) Loan | 8.50% | 3/26/2020 | 8,150 | 8,331,663 | ||||||||
| Total Floating Rate Loans (cost $150,692,473) | 154,362,505 | |||||||||||
| FOREIGN BONDS(a) 0.47% | ||||||||||||
| Luxembourg 0.10% | ||||||||||||
| Matterhorn Mobile SA† | 6.75% | 5/15/2019 | CHF | 6,900 | 8,431,142 | |||||||
| Netherlands 0.09% | ||||||||||||
| Goodyear Dunlop Tires Europe BV† | 6.75% | 4/15/2019 | EUR | 5,200 | 7,815,348 | |||||||
| United Kingdom 0.28% | ||||||||||||
| Old Mutual plc | 6.376% | — | (f) | GBP | 5,258 | 8,410,947 | ||||||
| R&R Ice Cream plc† | 8.375% | 11/15/2017 | EUR | 10,400 | 15,278,523 | |||||||
| Total | 23,689,470 | |||||||||||
| Total Foreign Bonds (cost $37,057,348) | 39,935,960 | |||||||||||
| 14 | See Notes to Financial Statements. |
Schedule of Investments (continued)
December 31, 2013
| Investments | Interest Rate | Maturity Date | Principal Amount (000) | Fair Value | ||||||||
| FOREIGN GOVERNMENT OBLIGATIONS 0.22% | ||||||||||||
| Bermuda 0.11% | ||||||||||||
| Bermuda Government† | 4.138% | 1/3/2023 | $ | 9,450 | $ | 9,080,524 | ||||||
| Canada 0.11% | ||||||||||||
| Government of Canada(a) | 2.75% | 9/1/2016 | CAD | 10,000 | 9,785,738 | |||||||
| Total Foreign Government Obligations (cost $19,950,176) | 18,866,262 | |||||||||||
| GOVERNMENT SPONSORED ENTERPRISES PASS-THROUGHS 0.69% | ||||||||||||
| Federal National Mortgage Assoc. (cost $60,345,891) | 3.50% | 7/1/2043 | $ | 58,909 | 58,690,147 | |||||||
| HIGH YIELD CORPORATE BONDS 78.49% | ||||||||||||
| Aerospace/Defense 2.04% | ||||||||||||
| Alliant Techsystems, Inc.† | 5.25% | 10/1/2021 | 5,900 | 5,944,250 | ||||||||
| B/E Aerospace, Inc. | 5.25% | 4/1/2022 | 43,700 | 44,574,000 | ||||||||
| Bombardier, Inc. (Canada)†(c) | 6.125% | 1/15/2023 | 10,100 | 10,074,750 | ||||||||
| CPI International, Inc. | 8.00% | 2/15/2018 | 15,500 | 16,275,000 | ||||||||
| Esterline Technologies Corp. | 7.00% | 8/1/2020 | 9,100 | 9,873,500 | ||||||||
| GenCorp, Inc. | 7.125% | 3/15/2021 | 15,000 | 16,125,000 | ||||||||
| Huntington Ingalls Industries, Inc. | 7.125% | 3/15/2021 | 15,000 | 16,537,500 | ||||||||
| ManTech International Corp. | 7.25% | 4/15/2018 | 12,700 | 13,398,500 | ||||||||
| Spirit Aerosystems, Inc. | 6.75% | 12/15/2020 | 21,300 | 23,030,625 | ||||||||
| SRA International, Inc. | 11.00% | 10/1/2019 | 7,475 | 7,811,375 | ||||||||
| Triumph Group, Inc. | 4.875% | 4/1/2021 | 11,700 | 11,407,500 | ||||||||
| Total | 175,052,000 | |||||||||||
| Airlines 0.12% | ||||||||||||
| Continental Airlines, Inc. | 6.125% | 4/29/2018 | 2,800 | 2,926,000 | ||||||||
| United Airlines, Inc. | 6.636% | 7/2/2022 | 6,697 | 7,098,313 | ||||||||
| Total | 10,024,313 | |||||||||||
| Apparel/Textiles 0.64% | ||||||||||||
| Hanesbrands, Inc. | 6.375% | 12/15/2020 | 7,500 | 8,231,250 | ||||||||
| Levi Strauss & Co. | 6.875% | 5/1/2022 | 5,000 | 5,525,000 | ||||||||
| Levi Strauss & Co. | 7.625% | 5/15/2020 | 8,675 | 9,564,188 | ||||||||
| Perry Ellis International, Inc. | 7.875% | 4/1/2019 | 10,100 | 10,807,000 | ||||||||
| PVH Corp. | 4.50% | 12/15/2022 | 3,300 | 3,143,250 | ||||||||
| SIWF Merger Sub, Inc./Springs Industries, Inc.† | 6.25% | 6/1/2021 | 5,500 | 5,561,875 | ||||||||
| William Carter Co. (The)† | 5.25% | 8/15/2021 | 8,000 | 8,160,000 | ||||||||
| See Notes to Financial Statements. | 15 |
Schedule of Investments (continued)
December 31, 2013
| Investments | Interest Rate | Maturity Date | Principal Amount (000) | Fair Value | ||||||||
| Apparel/Textiles (continued) | ||||||||||||
| Wolverine World Wide, Inc. | 6.125% | 10/15/2020 | $ | 3,900 | $ | 4,192,500 | ||||||
| Total | 55,185,063 | |||||||||||
| Auto Loans 0.04% | ||||||||||||
| General Motors Financial Co., Inc.† | 4.25% | 5/15/2023 | 3,900 | 3,719,625 | ||||||||
| Auto Parts & Equipment 1.23% | ||||||||||||
| Accuride Corp. | 9.50% | 8/1/2018 | 4,000 | 3,930,000 | ||||||||
| Dana Holding Corp. | 5.375% | 9/15/2021 | 19,700 | 19,872,375 | ||||||||
| Dana Holding Corp. | 6.50% | 2/15/2019 | 12,000 | 12,810,000 | ||||||||
| Delphi Corp. | 5.00% | 2/15/2023 | 9,330 | 9,644,888 | ||||||||
| International Automotive Components Group SA (Luxembourg)†(c) | 9.125% | 6/1/2018 | 14,500 | 15,188,750 | ||||||||
| LKQ Corp.† | 4.75% | 5/15/2023 | 9,950 | 9,278,375 | ||||||||
| Stanadyne Corp. | 10.00% | 8/15/2014 | 8,000 | 7,800,000 | ||||||||
| Stanadyne Holdings, Inc. | 12.00% | 2/15/2015 | 17,000 | 10,965,000 | ||||||||
| Stoneridge, Inc.† | 9.50% | 10/15/2017 | 7,250 | 7,902,500 | ||||||||
| Tenneco, Inc. | 6.875% | 12/15/2020 | 7,500 | 8,231,250 | ||||||||
| Total | 105,623,138 | |||||||||||
| Automakers 0.22% | ||||||||||||
| General Motors Co.(d) | 8.375% | — | (f) | 15,000 | 1,500 | |||||||
| Jaguar Land Rover Automotive plc (United Kingdom)†(c) | 5.625% | 2/1/2023 | 12,500 | 12,562,500 | ||||||||
| Oshkosh Corp. | 8.50% | 3/1/2020 | 6,000 | 6,660,000 | ||||||||
| Total | 19,224,000 | |||||||||||
| Banking 2.01% | ||||||||||||
| Astoria Depositor Corp.† | 5.744% | 5/1/2016 | 6,427 | 6,651,761 | ||||||||
| Bank of America Corp. | 8.00% | — | (f) | 15,000 | 16,698,330 | |||||||
| HBOS plc (United Kingdom)†(c) | 6.75% | 5/21/2018 | 8,000 | 9,089,016 | ||||||||
| JPMorgan Chase & Co. | 6.30% | 4/23/2019 | 10,000 | 11,816,120 | ||||||||
| JPMorgan Chase & Co. | 7.90% | — | (f) | 5,000 | 5,517,580 | |||||||
| LBG Capital No.1 plc†(g) | 8.00% | — | (f) | 7,500 | 8,034,345 | |||||||
| Macquarie Group Ltd. (Australia)†(c) | 6.00% | 1/14/2020 | 10,000 | 11,059,480 | ||||||||
| Morgan Stanley | 5.00% | 11/24/2025 | 7,300 | 7,338,128 | ||||||||
| Nordea Bank AB (Sweden)†(c) | 4.25% | 9/21/2022 | 9,000 | 8,914,977 | ||||||||
| People’s United Financial, Inc. | 3.65% | 12/6/2022 | 15,550 | 14,728,649 | ||||||||
| Regions Bank | 6.45% | 6/26/2037 | 6,650 | 7,047,424 | ||||||||
| Regions Bank | 7.50% | 5/15/2018 | 9,942 | 11,789,084 | ||||||||
| 16 | See Notes to Financial Statements. |
Schedule of Investments (continued)
December 31, 2013
| Investments | Interest Rate | Maturity Date | Principal Amount (000) | Fair Value | ||||||||
| Banking (continued) | ||||||||||||
| Royal Bank of Scotland Group plc (The) (United Kingdom)(c) | 6.125% | 12/15/2022 | $ | 5,700 | $ | 5,845,396 | ||||||
| Royal Bank of Scotland Group plc (The) (United Kingdom)(c) | 7.64% | — | (f) | 10,000 | 9,850,000 | |||||||
| Santander UK plc (United Kingdom)†(c) | 5.00% | 11/7/2023 | 5,250 | 5,279,699 | ||||||||
| SVB Financial Group | 5.375% | 9/15/2020 | 9,350 | 10,326,318 | ||||||||
| Synovus Financial Corp. | 7.875% | 2/15/2019 | 7,750 | 8,738,125 | ||||||||
| Wachovia Capital Trust III | 5.57% | — | (f) | 15,000 | 13,800,000 | |||||||
| Washington Mutual Bank(d) | 6.875% | 6/15/2011 | 22,500 | 2,250 | ||||||||
| Total | 172,526,682 | |||||||||||
| Beverages 0.21% | ||||||||||||
| Constellation Brands, Inc. | 3.75% | 5/1/2021 | 4,700 | 4,429,750 | ||||||||
| Constellation Brands, Inc. | 4.25% | 5/1/2023 | 14,350 | 13,417,250 | ||||||||
| Total | 17,847,000 | |||||||||||
| Brokerage 0.45% | ||||||||||||
| Cantor Fitzgerald LP† | 7.875% | 10/15/2019 | 12,655 | 13,351,025 | ||||||||
| Raymond James Financial, Inc. | 8.60% | 8/15/2019 | 20,000 | 25,180,920 | ||||||||
| Total | 38,531,945 | |||||||||||
| Building & Construction 0.67% | ||||||||||||
| K. Hovnanian Enterprises, Inc. | 5.00% | 11/1/2021 | 5,779 | 5,229,995 | ||||||||
| KB Home | 9.10% | 9/15/2017 | 15,000 | 17,662,500 | ||||||||
| Lennar Corp. | 4.125% | 12/1/2018 | 5,500 | 5,555,000 | ||||||||
| Lennar Corp. | 12.25% | 6/1/2017 | 9,500 | 12,266,875 | ||||||||
| Ryland Group, Inc. (The) | 5.375% | 10/1/2022 | 8,500 | 8,117,500 | ||||||||
| Taylor Morrison Communities, Inc./Monarch Communities, Inc.† | 5.25% | 4/15/2021 | 8,500 | 8,287,500 | ||||||||
| Total | 57,119,370 | |||||||||||
| Building Materials 0.94% | ||||||||||||
| American Builders & Contractors Supply Co., Inc.† | 5.625% | 4/15/2021 | 3,700 | 3,727,750 | ||||||||
| Associated Materials LLC/AMH New Finance, Inc. | 9.125% | 11/1/2017 | 2,300 | 2,466,750 | ||||||||
| HD Supply, Inc. | 11.50% | 7/15/2020 | 7,750 | 9,270,937 | ||||||||
| Interline Brands, Inc. PIK | 10.00% | 11/15/2018 | 2,675 | 2,935,813 | ||||||||
| Masco Corp. | 7.125% | 3/15/2020 | 12,000 | 13,758,108 | ||||||||
| Owens Corning, Inc. | 4.20% | 12/15/2022 | 10,000 | 9,566,840 | ||||||||
| Owens Corning, Inc. | 9.00% | 6/15/2019 | 15,000 | 18,539,265 | ||||||||
| RSI Home Products, Inc.† | 6.875% | 3/1/2018 | 5,000 | 5,262,500 | ||||||||
| See Notes to Financial Statements. | 17 |
Schedule of Investments (continued)
December 31, 2013
| Investments | Interest Rate | Maturity Date | Principal Amount (000) | Fair Value | ||||||||
| Building Materials (continued) | ||||||||||||
| USG Corp.† | 5.875% | 11/1/2021 | $ | 2,500 | $ | 2,603,125 | ||||||
| WESCO Distribution, Inc.† | 5.375% | 12/15/2021 | 12,800 | 12,832,000 | ||||||||
| Total | 80,963,088 | |||||||||||
| Chemicals 2.18% | ||||||||||||
| Ashland, Inc. | 4.75% | 8/15/2022 | 11,200 | 10,696,000 | ||||||||
| Axiall Corp.† | 4.875% | 5/15/2023 | 14,000 | 13,282,500 | ||||||||
| CF Industries, Inc. | 3.45% | 6/1/2023 | 5,000 | 4,575,120 | ||||||||
| Chemtura Corp. | 5.75% | 7/15/2021 | 14,000 | 14,262,500 | ||||||||
| Dow Chemical Co. (The) | 8.55% | 5/15/2019 | 10,000 | 12,926,440 | ||||||||
| Eagle Spinco, Inc.† | 4.625% | 2/15/2021 | 22,075 | 21,716,281 | ||||||||
| Hexion U.S. Finance Corp./Hexion Nova Scotia Finance ULC | 8.875% | 2/1/2018 | 9,000 | 9,393,750 | ||||||||
| Huntsman International LLC | 8.625% | 3/15/2020 | 15,000 | 16,668,750 | ||||||||
| INEOS Finance plc (United Kingdom)†(c) | 7.50% | 5/1/2020 | 7,200 | 7,929,000 | ||||||||
| INEOS Group Holdings SA (Luxembourg)†(c) | 6.125% | 8/15/2018 | 2,900 | 2,921,750 | ||||||||
| LyondellBasell Industries NV (Netherlands)(c) | 6.00% | 11/15/2021 | 2,000 | 2,303,898 | ||||||||
| Methanex Corp. (Canada)(c) | 5.25% | 3/1/2022 | 9,900 | 10,498,495 | ||||||||
| NewMarket Corp. | 4.10% | 12/15/2022 | 6,780 | 6,470,737 | ||||||||
| NOVA Chemicals Corp. (Canada)†(c) | 5.25% | 8/1/2023 | 3,625 | 3,745,078 | ||||||||
| Nufarm Australia Ltd. (Australia)†(c) | 6.375% | 10/15/2019 | 12,000 | 12,480,000 | ||||||||
| PetroLogistics LP/PetroLogistics Finance Corp.† | 6.25% | 4/1/2020 | 5,200 | 5,239,000 | ||||||||
| Phibro Animal Health Corp.† | 9.25% | 7/1/2018 | 16,300 | 17,441,000 | ||||||||
| Rockwood Specialties Group, Inc. | 4.625% | 10/15/2020 | 10,000 | 10,262,500 | ||||||||
| TPC Group, Inc.† | 8.75% | 12/15/2020 | 3,900 | 4,163,250 | ||||||||
| Total | 186,976,049 | |||||||||||
| Computer Hardware 0.40% | ||||||||||||
| Brocade Communications Systems, Inc. | 6.875% | 1/15/2020 | 12,500 | 13,468,750 | ||||||||
| NCR Corp. | 5.00% | 7/15/2022 | 3,200 | 3,060,000 | ||||||||
| NCR Escrow Corp.† | 5.875% | 12/15/2021 | 2,225 | 2,277,844 | ||||||||
| NCR Escrow Corp.† | 6.375% | 12/15/2023 | 6,275 | 6,439,719 | ||||||||
| Seagate HDD Cayman | 6.875% | 5/1/2020 | 8,000 | 8,690,000 | ||||||||
| Total | 33,936,313 | |||||||||||
| Consumer/Commercial/Lease Financing 2.66% | ||||||||||||
| Air Lease Corp. | 5.625% | 4/1/2017 | 17,500 | 19,315,625 | ||||||||
| Aircastle Ltd. | 6.25% | 12/1/2019 | 5,000 | 5,381,250 | ||||||||
| CIT Group, Inc. | 4.25% | 8/15/2017 | 20,000 | 20,900,000 | ||||||||
| 18 | See Notes to Financial Statements. |
Schedule of Investments (continued)
December 31, 2013
| Investments | Interest Rate | Maturity Date | Principal Amount (000) | Fair Value | ||||||||
| Consumer/Commercial/Lease Financing (continued) | ||||||||||||
| CIT Group, Inc. | 5.00% | 8/15/2022 | $ | 25,000 | $ | 24,479,075 | ||||||
| Discover Financial Services | 3.85% | 11/21/2022 | 8,545 | 8,117,109 | ||||||||
| International Lease Finance Corp. | 6.25% | 5/15/2019 | 10,000 | 10,875,000 | ||||||||
| International Lease Finance Corp. | 8.25% | 12/15/2020 | 6,100 | 7,152,250 | ||||||||
| International Lease Finance Corp. | 8.75% | 3/15/2017 | 34,000 | 40,205,000 | ||||||||
| Nationstar Mortgage LLC/Nationstar Capital Corp. | 6.50% | 7/1/2021 | 24,160 | 23,133,200 | ||||||||
| Nationstar Mortgage LLC/Nationstar Capital Corp. | 6.50% | 6/1/2022 | 14,425 | 13,595,562 | ||||||||
| Nationstar Mortgage LLC/Nationstar Capital Corp. | 7.875% | 10/1/2020 | 10,000 | 10,425,000 | ||||||||
| Provident Funding Associates LP/PFG Finance Corp.† | 6.75% | 6/15/2021 | 10,950 | 10,950,000 | ||||||||
| SLM Corp. | 4.875% | 6/17/2019 | 5,900 | 5,886,041 | ||||||||
| SLM Corp. | 5.50% | 1/15/2019 | 15,400 | 15,998,875 | ||||||||
| SLM Corp. | 8.45% | 6/15/2018 | 10,000 | 11,687,500 | ||||||||
| Total | 228,101,487 | |||||||||||
| Consumer Products 0.82% | ||||||||||||
| Avon Products, Inc. | 4.60% | 3/15/2020 | 5,680 | 5,640,030 | ||||||||
| Avon Products, Inc. | 5.00% | 3/15/2023 | 7,000 | 6,817,916 | ||||||||
| Elizabeth Arden, Inc. | 7.375% | 3/15/2021 | 27,700 | 30,331,500 | ||||||||
| Prestige Brands, Inc.† | 5.375% | 12/15/2021 | 10,000 | 10,150,000 | ||||||||
| Spectrum Brands Escrow Corp.† | 6.375% | 11/15/2020 | 11,350 | 12,144,500 | ||||||||
| Spectrum Brands Escrow Corp.† | 6.625% | 11/15/2022 | 5,000 | 5,331,250 | ||||||||
| Total | 70,415,196 | |||||||||||
| Department Stores 0.09% | ||||||||||||
| Bon-Ton Department Stores, Inc. (The) | 8.00% | 6/15/2021 | 7,800 | 7,897,500 | ||||||||
| Diversified Capital Goods 1.88% | ||||||||||||
| Actuant Corp. | 5.625% | 6/15/2022 | 8,845 | 8,999,787 | ||||||||
| Amsted Industries, Inc.† | 8.125% | 3/15/2018 | 10,000 | 10,562,500 | ||||||||
| Anixter, Inc. | 5.625% | 5/1/2019 | 11,300 | 11,935,625 | ||||||||
| Artesyn Escrow, Inc.† | 9.75% | 10/15/2020 | 14,000 | 14,770,000 | ||||||||
| BC Mountain LLC/BC Mountain Finance, Inc.† | 7.00% | 2/1/2021 | 5,000 | 5,075,000 | ||||||||
| Belden, Inc.† | 5.50% | 9/1/2022 | 15,000 | 14,775,000 | ||||||||
| Mueller Water Products, Inc. | 7.375% | 6/1/2017 | 10,800 | 11,124,000 | ||||||||
| Park-Ohio Industries, Inc. | 8.125% | 4/1/2021 | 11,400 | 12,597,000 | ||||||||
| Silver II Borrower/Silver II US Holdings LLC (Luxembourg)†(c) | 7.75% | 12/15/2020 | 20,000 | 21,300,000 | ||||||||
| SPX Corp. | 6.875% | 9/1/2017 | 21,000 | 23,835,000 | ||||||||
| Unifrax I LLC/Unifrax Holding Co.† | 7.50% | 2/15/2019 | 6,175 | 6,422,000 | ||||||||
| See Notes to Financial Statements. | 19 |
Schedule of Investments (continued)
December 31, 2013
| Investments | Interest Rate | Maturity Date | Principal Amount (000) | Fair Value | ||||||||
| Diversified Capital Goods (continued) | ||||||||||||
| Valmont Industries, Inc. | 6.625% | 4/20/2020 | $ | 17,500 | $ | 19,660,025 | ||||||
| Total | 161,055,937 | |||||||||||
| Electric: Generation 0.67% | ||||||||||||
| Calpine Corp.† | 7.50% | 2/15/2021 | 2,244 | 2,459,985 | ||||||||
| DPL, Inc. | 7.25% | 10/15/2021 | 15,725 | 16,000,187 | ||||||||
| Energy Future Intermediate Holding Co. LLC/EFIH Finance, Inc. PIK† | 11.25% | 12/1/2018 | 6,749 | 4,728,407 | ||||||||
| Mirant Americas Generation LLC | 9.125% | 5/1/2031 | 15,125 | 15,465,313 | ||||||||
| NSG Holdings LLC/NSG Holdings, Inc.† | 7.75% | 12/15/2025 | 17,485 | 18,708,950 | ||||||||
| Total | 57,362,842 | |||||||||||
| Electric: Integrated 1.02% | ||||||||||||
| AES Corp. (The) | 4.875% | 5/15/2023 | 7,000 | 6,580,000 | ||||||||
| AES Corp. (The) | 8.00% | 10/15/2017 | 12,500 | 14,750,000 | ||||||||
| Black Hills Corp. | 5.875% | 7/15/2020 | 8,000 | 8,937,224 | ||||||||
| Duquesne Light Holdings, Inc.† | 6.40% | 9/15/2020 | 20,500 | 23,480,782 | ||||||||
| National Fuel Gas Co. | 4.90% | 12/1/2021 | 4,000 | 4,168,336 | ||||||||
| National Fuel Gas Co. | 6.50% | 4/15/2018 | 20,000 | 22,913,180 | ||||||||
| National Fuel Gas Co. | 8.75% | 5/1/2019 | 5,000 | 6,234,785 | ||||||||
| Total | 87,064,307 | |||||||||||
| Electronics 1.09% | ||||||||||||
| Advanced Micro Devices, Inc. | 7.75% | 8/1/2020 | 15,000 | 14,962,500 | ||||||||
| Altera Corp. | 2.50% | 11/15/2018 | 9,000 | 8,933,985 | ||||||||
| Freescale Semiconductor, Inc.† | 6.00% | 1/15/2022 | 18,000 | 18,270,000 | ||||||||
| Freescale Semiconductor, Inc. | 10.75% | 8/1/2020 | 21,810 | 24,863,400 | ||||||||
| Jabil Circuit, Inc. | 4.70% | 9/15/2022 | 10,000 | 9,650,000 | ||||||||
| Magnachip Semiconductor Corp. (South Korea)(c) | 6.625% | 7/15/2021 | 8,000 | 8,180,000 | ||||||||
| Sensata Technologies BV (Netherlands)†(c) | 6.50% | 5/15/2019 | 7,550 | 8,135,125 | ||||||||
| Total | 92,995,010 | |||||||||||
| Energy: Exploration & Production 8.03% | ||||||||||||
| Antero Resources Finance Corp.† | 5.375% | 11/1/2021 | 7,000 | 7,074,375 | ||||||||
| Antero Resources Finance Corp. | 7.25% | 8/1/2019 | 6,500 | 7,020,000 | ||||||||
| Atlas Energy Holdings Operating Co. LLC/Atlas Resource Finance Corp.† | 7.75% | 1/15/2021 | 18,700 | 18,045,500 | ||||||||
| Berry Petroleum Co. | 6.375% | 9/15/2022 | 6,300 | 6,441,750 | ||||||||
| Berry Petroleum Co. | 6.75% | 11/1/2020 | 21,000 | 21,892,500 | ||||||||
| 20 | See Notes to Financial Statements. |
Schedule of Investments (continued)
December 31, 2013
| Investments | Interest Rate | Maturity Date | Principal Amount (000) | Fair Value | ||||||||
| Energy: Exploration & Production (continued) | ||||||||||||
| BreitBurn Energy Partners LP/BreitBurn Finance Corp. | 7.875% | 4/15/2022 | $ | 26,000 | $ | 27,170,000 | ||||||
| Chaparral Energy, Inc. | 7.625% | 11/15/2022 | 13,850 | 14,888,750 | ||||||||
| Chaparral Energy, Inc. | 8.25% | 9/1/2021 | 19,400 | 21,146,000 | ||||||||
| Concho Resources, Inc. | 5.50% | 4/1/2023 | 28,400 | 29,394,000 | ||||||||
| Concho Resources, Inc. | 7.00% | 1/15/2021 | 10,700 | 11,823,500 | ||||||||
| Continental Resources, Inc. | 4.50% | 4/15/2023 | 8,000 | 8,120,000 | ||||||||
| Continental Resources, Inc. | 7.375% | 10/1/2020 | 5,600 | 6,328,000 | ||||||||
| Continental Resources, Inc. | 8.25% | 10/1/2019 | 15,000 | 16,462,500 | ||||||||
| CrownRock LP/CrownRock Finance, Inc.† | 7.125% | 4/15/2021 | 16,525 | 17,186,000 | ||||||||
| Diamondback Energy, Inc.† | 7.625% | 10/1/2021 | 12,500 | 13,250,000 | ||||||||
| Energy XXI Gulf Coast, Inc. | 7.75% | 6/15/2019 | 27,800 | 29,954,500 | ||||||||
| Forest Oil Corp. | 7.25% | 6/15/2019 | 13,120 | 12,841,200 | ||||||||
| Halcon Resources Corp. | 8.875% | 5/15/2021 | 5,000 | 5,075,000 | ||||||||
| Halcon Resources Corp. | 9.75% | 7/15/2020 | 15,800 | 16,550,500 | ||||||||
| Kerr-McGee Corp. | 6.95% | 7/1/2024 | 12,900 | 15,014,181 | ||||||||
| Kodiak Oil & Gas Corp. | 5.50% | 1/15/2021 | 14,000 | 14,035,000 | ||||||||
| Kodiak Oil & Gas Corp. | 8.125% | 12/1/2019 | 19,165 | 21,368,975 | ||||||||
| Laredo Petroleum, Inc. | 7.375% | 5/1/2022 | 7,000 | 7,630,000 | ||||||||
| Legacy Reserves LP/Finance Corp.† | 6.625% | 12/1/2021 | 9,500 | 9,238,750 | ||||||||
| Legacy Reserves LP/Finance Corp.† | 8.00% | 12/1/2020 | 19,400 | 20,273,000 | ||||||||
| LINN Energy LLC/LINN Energy Finance Corp. | 7.75% | 2/1/2021 | 15,000 | 15,937,500 | ||||||||
| MEG Energy Corp. (Canada)†(c) | 6.375% | 1/30/2023 | 4,100 | 4,146,125 | ||||||||
| MEG Energy Corp. (Canada)†(c) | 6.50% | 3/15/2021 | 18,750 | 19,828,125 | ||||||||
| Newfield Exploration Co. | 5.625% | 7/1/2024 | 28,000 | 28,000,000 | ||||||||
| Oasis Petroleum, Inc. | 6.50% | 11/1/2021 | 7,500 | 8,062,500 | ||||||||
| Oasis Petroleum, Inc. | 7.25% | 2/1/2019 | 20,000 | 21,600,000 | ||||||||
| OGX Austria GmbH (Austria)†(c)(d) | 8.50% | 6/1/2018 | 20,000 | 1,700,000 | ||||||||
| Pacific Rubiales Energy Corp. (Canada)†(c) | 5.125% | 3/28/2023 | 9,300 | 8,579,250 | ||||||||
| PDC Energy, Inc. | 7.75% | 10/15/2022 | 17,800 | 19,313,000 | ||||||||
| Plains Exploration & Production Co. | 6.50% | 11/15/2020 | 22,250 | 24,583,313 | ||||||||
| Plains Exploration & Production Co. | 6.875% | 2/15/2023 | 6,200 | 6,944,000 | ||||||||
| QEP Resources, Inc. | 6.80% | 3/1/2020 | 10,000 | 10,550,000 | ||||||||
| QEP Resources, Inc. | 6.875% | 3/1/2021 | 8,000 | 8,620,000 | ||||||||
| Quicksilver Resources, Inc. | 7.125% | 4/1/2016 | 10,000 | 9,825,000 | ||||||||
| Range Resources Corp. | 5.00% | 3/15/2023 | 13,600 | 13,362,000 | ||||||||
| SM Energy Co. | 6.50% | 11/15/2021 | 10,000 | 10,650,000 | ||||||||
| SM Energy Co. | 6.50% | 1/1/2023 | 5,000 | 5,268,750 |
| See Notes to Financial Statements. | 21 |
Schedule of Investments (continued)
December 31, 2013
| Investments | Interest Rate | Maturity Date | Principal Amount (000) | Fair Value | ||||||||
| Energy: Exploration & Production (continued) | ||||||||||||
| SM Energy Co. | 6.625% | 2/15/2019 | $ | 18,700 | $ | 19,962,250 | ||||||
| Stone Energy Corp. | 7.50% | 11/15/2022 | 38,000 | 39,900,000 | ||||||||
| Ultra Petroleum Corp.† | 5.75% | 12/15/2018 | 1,825 | 1,879,750 | ||||||||
| W&T Offshore, Inc. | 8.50% | 6/15/2019 | 10,275 | 10,917,187 | ||||||||
| WPX Energy, Inc. | 6.00% | 1/15/2022 | 20,000 | 20,100,000 | ||||||||
| Total | 687,952,731 | |||||||||||
| Environmental 0.21% | ||||||||||||
| ADS Waste Holdings, Inc. | 8.25% | 10/1/2020 | 5,000 | 5,450,000 | ||||||||
| Clean Harbors, Inc. | 5.25% | 8/1/2020 | 12,500 | 12,937,500 | ||||||||
| Total | 18,387,500 | |||||||||||
| Food & Drug Retailers 0.83% | ||||||||||||
| Cencosud SA (Chile)†(c) | 4.875% | 1/20/2023 | 4,650 | 4,362,509 | ||||||||
| Ingles Markets, Inc. | 5.75% | 6/15/2023 | 1,625 | 1,600,625 | ||||||||
| New Albertson’s, Inc. | 7.45% | 8/1/2029 | 3,500 | 2,887,500 | ||||||||
| New Albertson’s, Inc. | 7.75% | 6/15/2026 | 5,290 | 4,311,350 | ||||||||
| Rite Aid Corp.† | 6.875% | 12/15/2028 | 3,150 | 3,016,125 | ||||||||
| Rite Aid Corp. | 7.70% | 2/15/2027 | 32,000 | 33,200,000 | ||||||||
| Tops Holding Corp./Tops Markets LLC† | 8.875% | 12/15/2017 | 10,850 | 11,975,687 | ||||||||
| Tops Holding II Corp. PIK† | 8.75% | 6/15/2018 | 9,750 | 10,079,063 | ||||||||
| Total | 71,432,859 | |||||||||||
| Food: Wholesale 1.88% | ||||||||||||
| B&G Foods, Inc. | 4.625% | 6/1/2021 | 20,000 | 19,250,000 | ||||||||
| BRF SA (Brazil)†(c) | 3.95% | 5/22/2023 | 4,250 | 3,686,875 | ||||||||
| Bumble Bee Holdco SCA PIK (Luxembourg)†(c) | 9.625% | 3/15/2018 | 5,725 | 6,068,500 | ||||||||
| Del Monte Corp. | 7.625% | 2/15/2019 | 18,000 | 18,742,500 | ||||||||
| Hawk Acquisition Sub, Inc.† | 4.25% | 10/15/2020 | 10,000 | 9,700,000 | ||||||||
| Ingredion, Inc. | 4.625% | 11/1/2020 | 8,000 | 8,353,728 | ||||||||
| Land O’Lakes, Inc.† | 6.00% | 11/15/2022 | 9,750 | 10,091,250 | ||||||||
| Michael Foods Holding, Inc. PIK† | 8.50% | 7/15/2018 | 4,700 | 4,982,000 | ||||||||
| Post Holdings, Inc. | 7.375% | 2/15/2022 | 20,000 | 21,500,000 | ||||||||
| Post Holdings, Inc.† | 7.375% | 2/15/2022 | 1,900 | 2,042,500 | ||||||||
| Shearer’s Foods LLC/Chip Finance Corp.† | 9.00% | 11/1/2019 | 7,000 | 7,420,000 | ||||||||
| Smithfield Foods, Inc. | 6.625% | 8/15/2022 | 4,710 | 5,016,150 | ||||||||
| US Foods, Inc. | 8.50% | 6/30/2019 | 22,300 | 24,446,375 | ||||||||
| Viterra, Inc. (Canada)†(c) | 5.95% | 8/1/2020 | 18,250 | 19,409,678 | ||||||||
| Total | 160,709,556 | |||||||||||
| 22 | See Notes to Financial Statements. |
Schedule of Investments (continued)
December 31, 2013
| Investments | Interest Rate | Maturity Date | Principal Amount (000) | Fair Value | ||||||||
| Forestry/Paper 0.46% | ||||||||||||
| Louisiana-Pacific Corp. | 7.50% | 6/1/2020 | $ | 8,000 | $ | 8,940,000 | ||||||
| Millar Western Forest Products Ltd. (Canada)(c) | 8.50% | 4/1/2021 | 10,000 | 10,325,000 | ||||||||
| Rock-Tenn Co. | 3.50% | 3/1/2020 | 5,000 | 4,924,665 | ||||||||
| Rock-Tenn Co. | 4.90% | 3/1/2022 | 3,248 | 3,348,993 | ||||||||
| Weyerhaeuser Co. | 7.375% | 10/1/2019 | 10,000 | 12,138,480 | ||||||||
| Total | 39,677,138 | |||||||||||
| Gaming 2.09% | ||||||||||||
| CCM Merger, Inc.† | 9.125% | 5/1/2019 | 12,000 | 12,600,000 | ||||||||
| Downstream Development Authority of the Quapaw Tribe of Oklahoma† | 10.50% | 7/1/2019 | 6,250 | 6,343,750 | ||||||||
| Graton Economic Development Authority† | 9.625% | 9/1/2019 | 20,725 | 24,144,625 | ||||||||
| MCE Finance Ltd. (Macao)†(c) | 5.00% | 2/15/2021 | 18,000 | 17,595,000 | ||||||||
| MGM Resorts International | 7.625% | 1/15/2017 | 7,500 | 8,568,750 | ||||||||
| Mohegan Tribal Gaming Authority† | 9.75% | 9/1/2021 | 7,800 | 8,443,500 | ||||||||
| MTR Gaming Group, Inc. | 11.50% | 8/1/2019 | 8,200 | 9,153,250 | ||||||||
| Peninsula Gaming LLC/Peninsula Gaming Corp.† | 8.375% | 2/15/2018 | 12,000 | 13,140,000 | ||||||||
| Pinnacle Entertainment, Inc. | 7.75% | 4/1/2022 | 7,500 | 8,212,500 | ||||||||
| PNK Finance Corp.† | 6.375% | 8/1/2021 | 13,700 | 14,076,750 | ||||||||
| River Rock Entertainment Authority (The) | 9.00% | 11/1/2018 | 11,520 | 9,504,000 | ||||||||
| Rivers Pittsburgh Borrower LP/Rivers Pittsburgh Finance Corp.† | 9.50% | 6/15/2019 | 10,160 | 11,201,400 | ||||||||
| Snoqualmie Entertainment Authority† | 9.125% | 2/1/2015 | 15,500 | 15,374,062 | ||||||||
| Sugarhouse HSP Gaming Prop. Mezz. LP/Sugarhouse HSP Gaming Finance Corp.† | 6.375% | 6/1/2021 | 16,000 | 15,520,000 | ||||||||
| Wynn Las Vegas LLC/Capital Corp. | 5.375% | 3/15/2022 | 5,300 | 5,379,500 | ||||||||
| Total | 179,257,087 | |||||||||||
| Gas Distribution 3.36% | ||||||||||||
| Access Midstream Partners LP/ACMP Finance Corp. | 6.125% | 7/15/2022 | 5,000 | 5,375,000 | ||||||||
| Crestwood Midstream Partners LP/Crestwood Midstream Finance Corp. | 6.00% | 12/15/2020 | 3,650 | 3,777,750 | ||||||||
| Crestwood Midstream Partners LP/Crestwood Midstream Finance Corp.† | 6.125% | 3/1/2022 | 7,200 | 7,416,000 | ||||||||
| El Paso Corp. | 6.50% | 9/15/2020 | 12,000 | 12,927,864 | ||||||||
| El Paso Corp. | 7.25% | 6/1/2018 | 10,000 | 11,466,400 | ||||||||
| El Paso Corp. | 7.75% | 1/15/2032 | 10,000 | 10,200,540 | ||||||||
| Energy Transfer Partners LP | 5.20% | 2/1/2022 | 22,100 | 23,304,185 | ||||||||
| Ferrellgas LP/Ferrellgas Finance Corp. | 6.50% | 5/1/2021 | 12,000 | 12,300,000 | ||||||||
| See Notes to Financial Statements. | 23 |
Schedule of Investments (continued)
December 31, 2013
| Investments | Interest Rate | Maturity Date | Principal Amount (000) | Fair Value | ||||||||
| Gas Distribution (continued) | ||||||||||||
| Ferrellgas Partners LP | 8.625% | 6/15/2020 | $ | 9,750 | $ | 10,310,625 | ||||||
| Florida Gas Transmission Co. LLC† | 7.90% | 5/15/2019 | 7,700 | 9,423,853 | ||||||||
| Hiland Partners LP/Hiland Partners Finance Corp.† | 7.25% | 10/1/2020 | 13,075 | 14,088,312 | ||||||||
| IFM US Colonial Pipeline 2 LLC† | 6.45% | 5/1/2021 | 19,000 | 20,038,749 | ||||||||
| Kinder Morgan Finance Co. LLC† | 6.00% | 1/15/2018 | 15,000 | 16,511,745 | ||||||||
| LBC Tank Terminals Holding Netherlands BV (Belgium)†(c) | 6.875% | 5/15/2023 | 7,900 | 8,206,125 | ||||||||
| MarkWest Energy Partners LP/MarkWest Energy Finance Corp. | 5.50% | 2/15/2023 | 13,250 | 13,415,625 | ||||||||
| MarkWest Energy Partners LP/MarkWest Energy Finance Corp. | 6.25% | 6/15/2022 | 3,153 | 3,350,063 | ||||||||
| MarkWest Energy Partners LP/MarkWest Energy Finance Corp. | 6.75% | 11/1/2020 | 17,000 | 18,530,000 | ||||||||
| Martin Midstream Partners LP/Martin Midstream Finance Corp. | 7.25% | 2/15/2021 | 3,000 | 3,075,000 | ||||||||
| Panhandle Eastern Pipeline Co. LP | 7.00% | 6/15/2018 | 7,600 | 8,802,115 | ||||||||
| Panhandle Eastern Pipeline Co. LP | 8.125% | 6/1/2019 | 13,800 | 16,573,317 | ||||||||
| Regency Energy Partners LP/Regency Finance Corp. | 4.50% | 11/1/2023 | 5,500 | 5,032,500 | ||||||||
| Regency Energy Partners LP/Regency Energy Finance Corp. | 5.50% | 4/15/2023 | 5,800 | 5,684,000 | ||||||||
| Sabine Pass Liquefaction LLC† | 5.625% | 2/1/2021 | 10,000 | 9,825,000 | ||||||||
| Suburban Propane Partners LP/Suburban Energy Finance Corp. | 7.375% | 8/1/2021 | 16,220 | 17,760,900 | ||||||||
| Tesoro Logistics LP/Tesoro Logistics Finance Corp.† | 5.875% | 10/1/2020 | 3,475 | 3,570,562 | ||||||||
| Tesoro Logistics LP/Tesoro Logistics Finance Corp. | 5.875% | 10/1/2020 | 8,525 | 8,759,437 | ||||||||
| Tesoro Logistics LP/Tesoro Logistics Finance Corp. | 6.125% | 10/15/2021 | 7,800 | 8,073,000 | ||||||||
| Total | 287,798,667 | |||||||||||
| Health Facilities 3.51% | ||||||||||||
| Amsurg Corp. | 5.625% | 11/30/2020 | 10,860 | 11,348,700 | ||||||||
| Capella Healthcare, Inc. | 9.25% | 7/1/2017 | 14,125 | 15,078,438 | ||||||||
| CHS/Community Health Systems, Inc. | 8.00% | 11/15/2019 | 55,000 | 59,950,000 | ||||||||
| DaVita, Inc. | 5.75% | 8/15/2022 | 25,000 | 25,437,500 | ||||||||
| Dignity Health | 4.50% | 11/1/2042 | 8,400 | 6,808,880 | ||||||||
| HCA Holdings, Inc. | 6.25% | 2/15/2021 | 5,000 | 5,243,750 | ||||||||
| HCA Holdings, Inc. | 7.75% | 5/15/2021 | 40,000 | 43,800,000 | ||||||||
| HCA, Inc. | 6.50% | 2/15/2020 | 10,000 | 11,012,500 | ||||||||
| HCA, Inc. | 7.50% | 2/15/2022 | 22,000 | 24,200,000 | ||||||||
| HCA, Inc. | 7.69% | 6/15/2025 | 7,400 | 7,770,000 | ||||||||
| 24 | See Notes to Financial Statements. |
Schedule of Investments (continued)
December 31, 2013
| Principal | ||||||||||||
| Interest | Maturity | Amount | Fair | |||||||||
| Investments | Rate | Date | (000) | Value | ||||||||
| Health Facilities (continued) | ||||||||||||
| HealthSouth Corp. | 8.125% | 2/15/2020 | $ | 21,000 | $ | 23,126,250 | ||||||
| LifePoint Hospitals, Inc.† | 5.50% | 12/1/2021 | 6,000 | 6,037,500 | ||||||||
| Omega Healthcare Investors, Inc. | 6.75% | 10/15/2022 | 6,900 | 7,529,625 | ||||||||
| Omega Healthcare Investors, Inc. | 7.50% | 2/15/2020 | 7,750 | 8,486,250 | ||||||||
| Tenet Healthcare Corp. | 8.125% | 4/1/2022 | 36,600 | 39,528,000 | ||||||||
| Tenet Healthcare Corp. | 9.25% | 2/1/2015 | 5,000 | 5,400,000 | ||||||||
| Total | 300,757,393 | |||||||||||
| Health Services 0.38% | ||||||||||||
| STHI Holding Corp.† | 8.00% | 3/15/2018 | 12,500 | 13,437,500 | ||||||||
| Truven Health Analytics, Inc. | 10.625% | 6/1/2020 | 17,000 | 19,316,250 | ||||||||
| Total | 32,753,750 | |||||||||||
| Hotels 0.66% | ||||||||||||
| Hilton Worldwide Finance LLC/Hilton Worldwide Finance Corp.† | 5.625% | 10/15/2021 | 15,000 | 15,590,625 | ||||||||
| Host Hotels & Resorts LP | 5.25% | 3/15/2022 | 3,880 | 4,051,325 | ||||||||
| Playa Resorts Holding BV (Netherlands)†(c) | 8.00% | 8/15/2020 | 12,000 | 12,795,000 | ||||||||
| RHP Hotel Properties LP/RHP Finance Corp. | 5.00% | 4/15/2021 | 5,000 | 4,962,500 | ||||||||
| Starwood Hotels & Resorts Worldwide, Inc. | 6.75% | 5/15/2018 | 8,500 | 9,847,471 | ||||||||
| Wyndham Worldwide Corp. | 3.90% | 3/1/2023 | 10,000 | 9,437,490 | ||||||||
| Total | 56,684,411 | |||||||||||
| Household & Leisure Products 0.19% | ||||||||||||
| Serta Simmons Holdings LLC† | 8.125% | 10/1/2020 | 15,000 | 16,387,500 | ||||||||
| Insurance Brokerage 0.34% | ||||||||||||
| A-S Co-Issuer Subsidiary, Inc./A-S Merger Sub LLC† | 7.875% | 12/15/2020 | 10,235 | 10,797,925 | ||||||||
| Hockey Merger Sub 2, Inc.† | 7.875% | 10/1/2021 | 10,000 | 10,325,000 | ||||||||
| Trinity Acquisition plc (United Kingdom)(c) | 4.625% | 8/15/2023 | 7,800 | 7,677,314 | ||||||||
| Total | 28,800,239 | |||||||||||
| Integrated Energy 0.34% | ||||||||||||
| Alta Wind Holdings LLC† | 7.00% | 6/30/2035 | 10,211 | 10,852,763 | ||||||||
| LUKOIL International Finance BV (Netherlands)†(c) | 6.656% | 6/7/2022 | 9,000 | 9,888,750 | ||||||||
| Rosneft Oil Co via Rosneft International Finance Ltd. (Ireland)†(c) | 4.199% | 3/6/2022 | 9,000 | 8,280,000 | ||||||||
| Total | 29,021,513 | |||||||||||
| See Notes to Financial Statements. | 25 |
Schedule of Investments (continued)
December 31, 2013
| Principal | ||||||||||||
| Interest | Maturity | Amount | Fair | |||||||||
| Investments | Rate | Date | (000) | Value | ||||||||
| Investments & Miscellaneous Financial Services 1.52% | ||||||||||||
| Ares Capital Corp. | 4.875% | 11/30/2018 | $ | 11,700 | $ | 11,988,721 | ||||||
| FMR LLC† | 5.35% | 11/15/2021 | 14,800 | 15,821,245 | ||||||||
| Invesco Finance plc (United Kingdom)(c) | 4.00% | 1/30/2024 | 11,700 | 11,620,662 | ||||||||
| KKR Group Finance Co.† | 6.375% | 9/29/2020 | 10,900 | 12,257,126 | ||||||||
| Legg Mason, Inc. | 5.50% | 5/21/2019 | 10,000 | 10,952,050 | ||||||||
| Neuberger Berman Group LLC/Neuberger Berman Finance Corp.† | 5.625% | 3/15/2020 | 3,700 | 3,903,500 | ||||||||
| Neuberger Berman Group LLC/Neuberger Berman Finance Corp.† | 5.875% | 3/15/2022 | 21,000 | 21,735,000 | ||||||||
| Nuveen Investments, Inc.† | 9.125% | 10/15/2017 | 27,000 | 27,135,000 | ||||||||
| Nuveen Investments, Inc.† | 9.50% | 10/15/2020 | 15,000 | 15,112,500 | ||||||||
| Total | 130,525,804 | |||||||||||
| Leisure 0.45% | ||||||||||||
| Cedar Fair LP/Canada’s Wonderland Co./Magnum | ||||||||||||
| Management Corp. | 5.25% | 3/15/2021 | 10,000 | 9,925,000 | ||||||||
| MU Finance plc (United Kingdom)†(c) | 8.375% | 2/1/2017 | 14,110 | 14,779,900 | ||||||||
| Royal Caribbean Cruises Ltd. | 5.25% | 11/15/2022 | 10,000 | 10,050,000 | ||||||||
| Viking Cruises Ltd.† | 8.50% | 10/15/2022 | 3,000 | 3,405,000 | ||||||||
| Total | 38,159,900 | |||||||||||
| Life Insurance 0.37% | ||||||||||||
| American Equity Investment Life Holding Co. | 6.625% | 7/15/2021 | 11,500 | 12,075,000 | ||||||||
| MetLife Capital Trust X† | 9.25% | 4/8/2068 | 15,075 | 19,446,750 | ||||||||
| Total | 31,521,750 | |||||||||||
| Machinery 1.29% | ||||||||||||
| Cleaver-Brooks, Inc.† | 8.75% | 12/15/2019 | 10,500 | 11,445,000 | ||||||||
| Flowserve Corp. | 3.50% | 9/15/2022 | 3,880 | 3,661,707 | ||||||||
| Gardner Denver, Inc.† | 6.875% | 8/15/2021 | 14,000 | 14,035,000 | ||||||||
| Manitowoc Co., Inc. (The) | 5.875% | 10/15/2022 | 11,750 | 11,926,250 | ||||||||
| Manitowoc Co., Inc. (The) | 8.50% | 11/1/2020 | 25,000 | 28,500,000 | ||||||||
| Mcron Finance Sub LLC/Mcron Finance Corp.† | 8.375% | 5/15/2019 | 16,500 | 18,480,000 | ||||||||
| Milacron LLC/Mcron Finance Corp.† | 7.75% | 2/15/2021 | 10,000 | 10,550,000 | ||||||||
| Steelcase, Inc. | 6.375% | 2/15/2021 | 11,175 | 12,289,729 | ||||||||
| Total | 110,887,686 | |||||||||||
| Managed Care 0.19% | ||||||||||||
| Centene Corp. | 5.75% | 6/1/2017 | 15,525 | 16,572,938 | ||||||||
| 26 | See Notes to Financial Statements. |
Schedule of Investments (continued)
December 31, 2013
| Principal | ||||||||||||
| Interest | Maturity | Amount | Fair | |||||||||
| Investments | Rate | Date | (000) | Value | ||||||||
| Media: Broadcast 0.83% | ||||||||||||
| AMC Networks, Inc. | 4.75% | 12/15/2022 | $ | 12,000 | $ | 11,490,000 | ||||||
| AMC Networks, Inc. | 7.75% | 7/15/2021 | 12,000 | 13,560,000 | ||||||||
| Clear Channel Communications, Inc. | 4.90% | 5/15/2015 | 3,000 | 2,895,000 | ||||||||
| Clear Channel Communications, Inc. | 9.00% | 12/15/2019 | 17,500 | 17,937,500 | ||||||||
| Clear Channel Communications, Inc. | 11.25% | 3/1/2021 | 17,500 | 18,900,000 | ||||||||
| Gray Television, Inc. | 7.50% | 10/1/2020 | 2,700 | 2,882,250 | ||||||||
| Univision Communications, Inc.† | 5.125% | 5/15/2023 | 3,525 | 3,538,219 | ||||||||
| Total | 71,202,969 | |||||||||||
| Media: Cable 3.54% | ||||||||||||
| Cablevision Systems Corp. | 5.875% | 9/15/2022 | 28,000 | 26,950,000 | ||||||||
| CCO Holdings LLC/CCO Holdings Capital Corp.† | 5.25% | 3/15/2021 | 8,100 | 7,776,000 | ||||||||
| CCO Holdings LLC/CCO Holdings Capital Corp.† | 5.75% | 9/1/2023 | 11,500 | 10,953,750 | ||||||||
| CCO Holdings LLC/CCO Holdings Capital Corp. | 8.125% | 4/30/2020 | 17,500 | 19,075,000 | ||||||||
| CSC Holdings LLC | 8.625% | 2/15/2019 | 7,375 | 8,684,063 | ||||||||
| DISH DBS Corp. | 5.125% | 5/1/2020 | 35,600 | 35,778,000 | ||||||||
| DISH DBS Corp. | 5.875% | 7/15/2022 | 15,000 | 15,075,000 | ||||||||
| DISH DBS Corp. | 6.75% | 6/1/2021 | 16,650 | 17,732,250 | ||||||||
| Harron Communications LP/Harron Finance Corp.† | 9.125% | 4/1/2020 | 6,600 | 7,342,500 | ||||||||
| Mediacom Broadband LLC/Mediacom Broadband Corp. | 6.375% | 4/1/2023 | 26,925 | 27,665,438 | ||||||||
| Mediacom Communications Corp. | 9.125% | 8/15/2019 | 32,450 | 35,248,812 | ||||||||
| Nara Cable Funding Ltd. (Ireland)†(c) | 8.875% | 12/1/2018 | 8,550 | 9,234,000 | ||||||||
| Ono Finance II plc (Ireland)†(c) | 10.875% | 7/15/2019 | 7,075 | 7,782,500 | ||||||||
| Unitymedia Hessen GmbH & Co. KG/Unitymedia NRW GmbH†(a) | 5.50% | 9/15/2022 | EUR | 6,000 | 8,523,448 | |||||||
| Unitymedia Hessen GmbH & Co. KG/Unitymedia NRW GmbH (Germany)†(c) | 5.50% | 1/15/2023 | $ | 14,000 | 13,650,000 | |||||||
| Unitymedia Hessen GmbH & Co. KG/Unitymedia NRW GmbH (Germany)†(c) | 7.50% | 3/15/2019 | 4,450 | 4,861,625 | ||||||||
| UPCB Finance V Ltd.† | 7.25% | 11/15/2021 | 14,000 | 15,260,000 | ||||||||
| Virgin Media Finance plc (United Kingdom)(c) | 8.375% | 10/15/2019 | 15,000 | 16,425,000 | ||||||||
| Virgin Media Secured Finance plc (United Kingdom)†(c) | 5.375% | 4/15/2021 | 15,000 | 15,075,000 | ||||||||
| Total | 303,092,386 | |||||||||||
| Media: Diversified 0.26% | ||||||||||||
| Netflix, Inc.† | 5.375% | 2/1/2021 | 22,000 | 22,385,000 | ||||||||
| See Notes to Financial Statements. | 27 |
Schedule of Investments (continued)
December 31, 2013
| Principal | ||||||||||||
| Interest | Maturity | Amount | Fair | |||||||||
| Investments | Rate | Date | (000) | Value | ||||||||
| Media: Services 0.44% | ||||||||||||
| Affinion Investments LLC† | 13.50% | 8/15/2018 | $ | 10,200 | $ | 10,200,000 | ||||||
| Griffey Intermediate, Inc./Griffey Finance Sub LLC† | 7.00% | 10/15/2020 | 5,000 | 4,012,500 | ||||||||
| Southern Graphics, Inc.† | 8.375% | 10/15/2020 | 10,000 | 10,400,000 | ||||||||
| WMG Acquisition Corp.† | 6.00% | 1/15/2021 | 3,870 | 4,039,313 | ||||||||
| WMG Acquisition Corp. | 11.50% | 10/1/2018 | 7,500 | 8,662,500 | ||||||||
| Total | 37,314,313 | |||||||||||
| Medical Products 0.83% | ||||||||||||
| Biomet, Inc. | 6.50% | 8/1/2020 | 25,500 | 26,902,500 | ||||||||
| Grifols, Inc. | 8.25% | 2/1/2018 | 5,100 | 5,444,250 | ||||||||
| Kinetic Concepts, Inc./KCI USA, Inc. | 10.50% | 11/1/2018 | 7,500 | 8,662,500 | ||||||||
| Life Technologies Corp. | 5.00% | 1/15/2021 | 7,000 | 7,590,142 | ||||||||
| Life Technologies Corp. | 6.00% | 3/1/2020 | 5,300 | 6,097,777 | ||||||||
| Mallinckrodt International Finance SA (Luxembourg)†(c) | 4.75% | 4/15/2023 | 5,750 | 5,316,617 | ||||||||
| Polymer Group, Inc. | 7.75% | 2/1/2019 | 8,000 | 8,570,000 | ||||||||
| Thermo Fisher Scientific, Inc. | 2.40% | 2/1/2019 | 2,350 | 2,330,890 | ||||||||
| Total | 70,914,676 | |||||||||||
| Metals/Mining (Excluding Steel) 0.66% | ||||||||||||
| Allied Nevada Gold Corp.†(a) | 8.75% | 6/1/2019 | CAD | 345 | 209,485 | |||||||
| Arch Coal, Inc. | 7.25% | 6/15/2021 | $ | 15,000 | 11,550,000 | |||||||
| Arch Coal, Inc.† | 8.00% | 1/15/2019 | 6,700 | 6,700,000 | ||||||||
| Boart Longyear Management Pty Ltd. (Australia)†(c) | 7.00% | 4/1/2021 | 7,500 | 5,681,250 | ||||||||
| Cliffs Natural Resources, Inc. | 5.90% | 3/15/2020 | 5,000 | 5,283,085 | ||||||||
| FMG Resources (August 2006) Pty Ltd. (Australia)†(c) | 8.25% | 11/1/2019 | 15,000 | 16,893,750 | ||||||||
| James River Coal Co. | 7.875% | 4/1/2019 | 5,000 | 1,375,000 | ||||||||
| Mirabela Nickel Ltd. (Australia)†(c)(d) | 8.75% | 4/15/2018 | 14,350 | 3,946,250 | ||||||||
| Teck Resources Ltd. (Canada)(c) | 4.75% | 1/15/2022 | 4,675 | 4,727,603 | ||||||||
| Total | 56,366,423 | |||||||||||
| Monoline Insurance 0.21% | ||||||||||||
| Fidelity National Financial, Inc. | 6.60% | 5/15/2017 | 16,250 | 18,158,433 | ||||||||
| Oil Field Equipment & Services 2.09% | ||||||||||||
| BakerCorp International, Inc. | 8.25% | 6/1/2019 | 4,400 | 4,411,000 | ||||||||
| Basic Energy Services, Inc. | 7.75% | 2/15/2019 | 8,000 | 8,400,000 | ||||||||
| Dresser-Rand Group, Inc. | 6.50% | 5/1/2021 | 16,000 | 17,120,000 | ||||||||
| FMC Technologies, Inc. | 3.45% | 10/1/2022 | 6,475 | 5,974,042 | ||||||||
| Gulfmark Offshore, Inc. | 6.375% | 3/15/2022 | 16,800 | 17,010,000 | ||||||||
| 28 | See Notes to Financial Statements. |
Schedule of Investments (continued)
December 31, 2013
| Principal | ||||||||||||
| Interest | Maturity | Amount | Fair | |||||||||
| Investments | Rate | Date | (000) | Value | ||||||||
| Oil Field Equipment & Services (continued) | ||||||||||||
| Hornbeck Offshore Services, Inc. | 5.00% | 3/1/2021 | $ | 12,000 | $ | 11,820,000 | ||||||
| Hornbeck Offshore Services, Inc. | 5.875% | 4/1/2020 | 20,000 | 20,750,000 | ||||||||
| Key Energy Services, Inc. | 6.75% | 3/1/2021 | 5,750 | 5,922,500 | ||||||||
| Offshore Group Investment Ltd. | 7.125% | 4/1/2023 | 6,200 | 6,355,000 | ||||||||
| Oil States International, Inc. | 5.125% | 1/15/2023 | 3,000 | 3,397,500 | ||||||||
| Oil States International, Inc. | 6.50% | 6/1/2019 | 16,000 | 17,100,000 | ||||||||
| Precision Drilling Corp. (Canada)(c) | 6.50% | 12/15/2021 | 3,250 | 3,477,500 | ||||||||
| Precision Drilling Corp. (Canada)(c) | 6.625% | 11/15/2020 | 1,825 | 1,957,313 | ||||||||
| SEACOR Holdings, Inc. | 7.375% | 10/1/2019 | 19,750 | 21,478,125 | ||||||||
| Seadrill Ltd.† | 6.125% | 9/15/2020 | 20,000 | 20,050,000 | ||||||||
| SESI LLC | 6.375% | 5/1/2019 | 6,700 | 7,185,750 | ||||||||
| Trinidad Drilling Ltd. (Canada)†(c) | 7.875% | 1/15/2019 | 6,600 | 7,045,500 | ||||||||
| Total | 179,454,230 | |||||||||||
| Oil Refining & Marketing 0.31% | ||||||||||||
| Tesoro Corp. | 5.375% | 10/1/2022 | 10,000 | 10,175,000 | ||||||||
| Tesoro Corp. | 9.75% | 6/1/2019 | 15,000 | 16,312,500 | ||||||||
| Total | 26,487,500 | |||||||||||
| Packaging 2.29% | ||||||||||||
| AEP Industries, Inc. | 8.25% | 4/15/2019 | 15,000 | 16,200,000 | ||||||||
| Ardagh Packaging Finance plc (Ireland)†(c) | 9.125% | 10/15/2020 | 5,000 | 5,500,000 | ||||||||
| Ball Corp. | 4.00% | 11/15/2023 | 12,000 | 10,800,000 | ||||||||
| Crown Cork & Seal Co., Inc. | 7.375% | 12/15/2026 | 46,570 | 51,692,700 | ||||||||
| Reynolds Group Issuer, Inc./Reynolds Group | ||||||||||||
| Issuer LLC/Reynolds Group Issuer (Luxembourg) SA | 5.75% | 10/15/2020 | 10,000 | 10,250,000 | ||||||||
| Reynolds Group Issuer, Inc./Reynolds Group Issuer LLC/Reynolds Group Issuer (Luxembourg) SA | 8.50% | 5/15/2018 | 50,000 | 53,000,000 | ||||||||
| Reynolds Group Issuer, Inc./Reynolds Group Issuer LLC/Reynolds Group Issuer (Luxembourg) SA | 9.875% | 8/15/2019 | 8,225 | 9,191,437 | ||||||||
| Sealed Air Corp.† | 6.875% | 7/15/2033 | 25,000 | 24,000,000 | ||||||||
| Sealed Air Corp.† | 8.375% | 9/15/2021 | 13,500 | 15,390,000 | ||||||||
| Total | 196,024,137 | |||||||||||
| Pharmaceuticals 0.93% | ||||||||||||
| Capsugel SA PIK (Luxembourg)†(c) | 7.00% | 5/15/2019 | 4,850 | 4,950,031 | ||||||||
| Endo Finance Co.† | 5.75% | 1/15/2022 | 7,800 | 7,858,500 | ||||||||
| Par Pharmaceutical Cos., Inc. | 7.375% | 10/15/2020 | 23,100 | 23,995,125 | ||||||||
| Salix Pharmaceuticals Ltd.† | 6.00% | 1/15/2021 | 7,600 | 7,809,000 | ||||||||
| Valeant Pharmaceuticals International† | 5.625% | 12/1/2021 | 8,450 | 8,513,375 | ||||||||
| See Notes to Financial Statements. | 29 |
Schedule of Investments (continued)
December 31, 2013
| Principal | ||||||||||||
| Interest | Maturity | Amount | Fair | |||||||||
| Investments | Rate | Date | (000) | Value | ||||||||
| Pharmaceuticals (continued) | ||||||||||||
| Valeant Pharmaceuticals International† | 6.375% | 10/15/2020 | $ | 20,000 | $ | 21,175,000 | ||||||
| Warner Chilcott Co. LLC/Warner Chilcott Finance LLC | 7.75% | 9/15/2018 | 5,000 | 5,437,500 | ||||||||
| Total | 79,738,531 | |||||||||||
| Printing & Publishing 0.15% | ||||||||||||
| ProQuest LLC/ProQuest Notes Co.† | 9.00% | 10/15/2018 | 12,625 | 13,130,000 | ||||||||
| Property & Casualty 0.04% | ||||||||||||
| Liberty Mutual Group, Inc.† | 5.00% | 6/1/2021 | 3,000 | 3,151,233 | ||||||||
| Railroads 0.45% | ||||||||||||
| Florida East Coast Railway Corp. | 8.125% | 2/1/2017 | 20,000 | 20,975,000 | ||||||||
| Kansas City Southern de Mexico SA de CV (Mexico)(c) | 2.35% | 5/15/2020 | 11,750 | 10,962,515 | ||||||||
| Watco Cos. LLC/Watco Finance Corp.† | 6.375% | 4/1/2023 | 6,250 | 6,218,750 | ||||||||
| Total | 38,156,265 | |||||||||||
| Real Estate Development & Management 0.19% | ||||||||||||
| Brookfield Residential Properties, Inc. (Canada)†(c) | 6.50% | 12/15/2020 | 9,000 | 9,382,500 | ||||||||
| Jones Lang LaSalle, Inc. | 4.40% | 11/15/2022 | 7,200 | 6,927,804 | ||||||||
| Total | 16,310,304 | |||||||||||
| Real Estate Investment Trusts 1.07% | ||||||||||||
| DDR Corp. | 7.875% | 9/1/2020 | 11,000 | 13,607,396 | ||||||||
| Goodman Funding Pty Ltd. (Australia)†(c) | 6.00% | 3/22/2022 | 7,000 | 7,585,431 | ||||||||
| Goodman Funding Pty Ltd. (Australia)†(c) | 6.375% | 11/12/2020 | 10,000 | 11,090,860 | ||||||||
| Health Care REIT, Inc. | 4.95% | 1/15/2021 | 11,700 | 12,389,551 | ||||||||
| Health Care REIT, Inc. | 6.125% | 4/15/2020 | 10,000 | 11,269,740 | ||||||||
| Kilroy Realty LP | 3.80% | 1/15/2023 | 10,000 | 9,343,050 | ||||||||
| ProLogis LP | 6.875% | 3/15/2020 | 7,000 | 8,254,967 | ||||||||
| ProLogis LP(h) | 8.65% | 5/15/2016 | 8,150 | 8,583,436 | ||||||||
| Washington Real Estate Investment Trust | 3.95% | 10/15/2022 | 10,000 | 9,512,720 | ||||||||
| Total | 91,637,151 | |||||||||||
| Restaurants 0.08% | ||||||||||||
| Seminole Hard Rock Entertainment, | ||||||||||||
| Inc./Seminole Hard Rock International LLC† | 5.875% | 5/15/2021 | 6,700 | 6,616,250 | ||||||||
| Software/Services 3.93% | ||||||||||||
| Activision Blizzard, Inc.† | 5.625% | 9/15/2021 | 15,800 | 16,392,500 | ||||||||
| Activision Blizzard, Inc.† | 6.125% | 9/15/2023 | 6,300 | 6,583,500 | ||||||||
| 30 | See Notes to Financial Statements. |
Schedule of Investments (continued)
December 31, 2013
| Principal | ||||||||||||
| Interest | Maturity | Amount | Fair | |||||||||
| Investments | Rate | Date | (000) | Value | ||||||||
| Software/Services (continued) | ||||||||||||
| Alliance Data Systems Corp.† | 6.375% | 4/1/2020 | $ | 53,000 | $ | 55,782,500 | ||||||
| BMC Software Finance, Inc.† | 8.125% | 7/15/2021 | 12,000 | 12,420,000 | ||||||||
| Ceridian Corp. | 11.25% | 11/15/2015 | 5,750 | 5,821,875 | ||||||||
| Dun & Bradstreet Corp. (The) | 4.375% | 12/1/2022 | 15,000 | 14,488,035 | ||||||||
| First Data Corp.† | 8.25% | 1/15/2021 | 34,900 | 37,299,375 | ||||||||
| First Data Corp.† | 11.25% | 1/15/2021 | 14,325 | 15,882,844 | ||||||||
| First Data Corp. | 12.625% | 1/15/2021 | 35,200 | 41,492,000 | ||||||||
| Infor US, Inc. | 9.375% | 4/1/2019 | 10,000 | 11,300,000 | ||||||||
| NeuStar, Inc. | 4.50% | 1/15/2023 | 16,500 | 14,973,750 | ||||||||
| Nuance Communications, Inc.† | 5.375% | 8/15/2020 | 8,000 | 7,860,000 | ||||||||
| SERENA Software, Inc. | 10.375% | 3/15/2016 | 5,963 | 5,992,815 | ||||||||
| Sophia LP/Sophia Finance, Inc.† | 9.75% | 1/15/2019 | 18,000 | 20,025,000 | ||||||||
| SunGard Data Systems, Inc. | 6.625% | 11/1/2019 | 31,500 | 33,232,500 | ||||||||
| SunGard Data Systems, Inc. | 7.625% | 11/15/2020 | 6,100 | 6,679,500 | ||||||||
| Syniverse Holdings, Inc. | 9.125% | 1/15/2019 | 12,500 | 13,718,750 | ||||||||
| VeriSign, Inc. | 4.625% | 5/1/2023 | 17,500 | 16,800,000 | ||||||||
| Total | 336,744,944 | |||||||||||
| Specialty Retail 3.04% | ||||||||||||
| Brookstone Co., Inc.† | 13.00% | 10/15/2014 | 7,058 | 5,434,660 | ||||||||
| Brown Shoe Co., Inc. | 7.125% | 5/15/2019 | 12,500 | 13,343,750 | ||||||||
| Chinos Intermediate Holdings A, Inc. PIK† | 7.75% | 5/1/2019 | 13,000 | 13,325,000 | ||||||||
| Claire’s Stores, Inc.† | 7.75% | 6/1/2020 | 6,000 | 5,610,000 | ||||||||
| Claire’s Stores, Inc. | 8.875% | 3/15/2019 | 10,500 | 10,867,500 | ||||||||
| Claire’s Stores, Inc.† | 9.00% | 3/15/2019 | 9,700 | 10,573,000 | ||||||||
| CST Brands, Inc. | 5.00% | 5/1/2023 | 12,000 | 11,640,000 | ||||||||
| DBP Holding Corp.† | 7.75% | 10/15/2020 | 29,220 | 29,220,000 | ||||||||
| J. Crew Group, Inc. | 8.125% | 3/1/2019 | 10,000 | 10,550,000 | ||||||||
| Limited Brands, Inc. | 7.00% | 5/1/2020 | 15,000 | 16,912,500 | ||||||||
| Limited Brands, Inc. | 7.60% | 7/15/2037 | 7,500 | 7,659,375 | ||||||||
| Limited Brands, Inc. | 8.50% | 6/15/2019 | 12,500 | 15,062,500 | ||||||||
| Michaels FinCo Holdings LLC/Michaels FinCo, Inc. PIK† | 7.50% | 8/1/2018 | 9,375 | 9,796,875 | ||||||||
| Michaels Stores, Inc. | 7.75% | 11/1/2018 | 7,400 | 8,066,000 | ||||||||
| Neiman Marcus Group Ltd., Inc.† | 8.00% | 10/15/2021 | 24,300 | 25,515,000 | ||||||||
| PETCO Animal Supplies, Inc.† | 9.25% | 12/1/2018 | 10,000 | 10,775,000 | ||||||||
| PETCO Holdings, Inc. PIK† | 8.50% | 10/15/2017 | 5,000 | 5,125,000 | ||||||||
| QVC, Inc. | 4.375% | 3/15/2023 | 9,625 | 9,015,516 | ||||||||
| QVC, Inc.† | 7.375% | 10/15/2020 | 17,500 | 18,874,450 | ||||||||
| See Notes to Financial Statements. | 31 |
Schedule of Investments (continued)
December 31, 2013
| Principal | ||||||||||||
| Interest | Maturity | Amount | Fair | |||||||||
| Investments | Rate | Date | (000) | Value | ||||||||
| Specialty Retail (continued) | ||||||||||||
| Sally Holdings LLC/Sally Capital, Inc. | 5.50% | 11/1/2023 | $ | 7,800 | $ | 7,761,000 | ||||||
| Sally Holdings LLC/Sally Capital, Inc. | 5.75% | 6/1/2022 | 7,700 | 8,046,500 | ||||||||
| Toys “R” Us Property Co. II LLC | 8.50% | 12/1/2017 | 7,000 | 7,245,000 | ||||||||
| Total | 260,418,626 | |||||||||||
| Steel Producers/Products 0.98% | ||||||||||||
| Allegheny Ludlum Corp. | 6.95% | 12/15/2025 | 13,875 | 14,766,857 | ||||||||
| Allegheny Technologies, Inc. | 9.375% | 6/1/2019 | 10,200 | 12,475,539 | ||||||||
| ArcelorMittal (Luxembourg)(c) | 5.75% | 8/5/2020 | 25,000 | 26,625,000 | ||||||||
| ArcelorMittal (Luxembourg)(c) | 6.00% | 3/1/2021 | 10,000 | 10,650,000 | ||||||||
| Essar Steel Algoma, Inc. (Canada)†(c) | 9.375% | 3/15/2015 | 8,000 | 7,600,000 | ||||||||
| Essar Steel Algoma, Inc. (Canada)†(c) | 9.875% | 6/15/2015 | 6,500 | 3,997,500 | ||||||||
| JMC Steel Group† | 8.25% | 3/15/2018 | 8,000 | 8,100,000 | ||||||||
| Total | 84,214,896 | |||||||||||
| Support: Services 2.32% | ||||||||||||
| ADT Corp. (The) | 4.125% | 6/15/2023 | 8,510 | 7,567,075 | ||||||||
| Ashtead Capital, Inc.† | 6.50% | 7/15/2022 | 3,600 | 3,856,500 | ||||||||
| Audatex North America, Inc.† | 6.00% | 6/15/2021 | 5,000 | 5,262,500 | ||||||||
| Avis Budget Car Rental | 9.75% | 3/15/2020 | 5,500 | 6,476,250 | ||||||||
| Avis Budget Car Rental LLC/Avis Budget Finance, Inc. | 5.50% | 4/1/2023 | 5,000 | 4,868,750 | ||||||||
| Compiler Finance Sub, Inc.† | 7.00% | 5/1/2021 | 18,700 | 18,653,250 | ||||||||
| FTI Consulting, Inc. | 6.00% | 11/15/2022 | 9,300 | 9,462,750 | ||||||||
| FTI Consulting, Inc. | 6.75% | 10/1/2020 | 14,350 | 15,569,750 | ||||||||
| Hertz Corp. (The) | 5.875% | 10/15/2020 | 10,000 | 10,412,500 | ||||||||
| Hertz Corp. (The) | 7.50% | 10/15/2018 | 10,000 | 10,825,000 | ||||||||
| Iron Mountain, Inc. | 5.75% | 8/15/2024 | 15,000 | 13,987,500 | ||||||||
| Iron Mountain, Inc. | 7.75% | 10/1/2019 | 8,500 | 9,520,000 | ||||||||
| Iron Mountain, Inc. | 8.375% | 8/15/2021 | 5,000 | 5,412,500 | ||||||||
| NES Rentals Holdings, Inc.† | 7.875% | 5/1/2018 | 7,800 | 8,287,500 | ||||||||
| NESCO LLC/NESCO Holdings Corp.† | 11.75% | 4/15/2017 | 12,400 | 14,012,000 | ||||||||
| Rent-A-Center, Inc. | 4.75% | 5/1/2021 | 5,450 | 5,143,437 | ||||||||
| Sotheby’s† | 5.25% | 10/1/2022 | 20,000 | 18,850,000 | ||||||||
| United Rentals North America, Inc. | 6.125% | 6/15/2023 | 7,000 | 7,140,000 | ||||||||
| United Rentals North America, Inc. | 7.625% | 4/15/2022 | 10,000 | 11,162,500 | ||||||||
| United Rentals North America, Inc. | 8.25% | 2/1/2021 | 10,700 | 12,117,750 | ||||||||
| Total | 198,587,512 | |||||||||||
| 32 | See Notes to Financial Statements. |
Schedule of Investments (continued)
December 31, 2013
| Principal | ||||||||||||
| Interest | Maturity | Amount | Fair | |||||||||
| Investments | Rate | Date | (000) | Value | ||||||||
| Telecommunications Equipment 0.07% | ||||||||||||
| Alcatel-Lucent USA, Inc. | 6.45% | 3/15/2029 | $ | 6,900 | $ | 6,141,000 | ||||||
| Telecommunications: Integrated/Services 3.43% | ||||||||||||
| CenturyLink, Inc. | 6.15% | 9/15/2019 | 5,000 | 5,300,000 | ||||||||
| CenturyLink, Inc. | 6.45% | 6/15/2021 | 30,000 | 31,350,000 | ||||||||
| CenturyLink, Inc. | 6.75% | 12/1/2023 | 14,000 | 14,245,000 | ||||||||
| DigitalGlobe, Inc.† | 5.25% | 2/1/2021 | 18,500 | 18,130,000 | ||||||||
| Dycom Investments, Inc. | 7.125% | 1/15/2021 | 16,750 | 18,131,875 | ||||||||
| Equinix, Inc. | 5.375% | 4/1/2023 | 3,950 | 3,880,875 | ||||||||
| Equinix, Inc. | 7.00% | 7/15/2021 | 12,150 | 13,319,437 | ||||||||
| Frontier Communications Corp. | 7.125% | 1/15/2023 | 3,950 | 3,940,125 | ||||||||
| Frontier Communications Corp. | 7.625% | 4/15/2024 | 7,800 | 7,819,500 | ||||||||
| Frontier Communications Corp. | 9.25% | 7/1/2021 | 7,275 | 8,420,813 | ||||||||
| GCI, Inc. | 6.75% | 6/1/2021 | 5,000 | 4,812,500 | ||||||||
| Hellas II (Luxembourg)†(c)(d) | Zero Coupon | 1/15/2015 | 15,000 | 1,500 | ||||||||
| Hughes Satellite Systems Corp. | 7.625% | 6/15/2021 | 27,500 | 30,800,000 | ||||||||
| Intelsat Jackson Holdings SA (Luxembourg)(c) | 7.25% | 4/1/2019 | 3,500 | 3,797,500 | ||||||||
| Intelsat Jackson Holdings SA (Luxembourg)(c) | 7.50% | 4/1/2021 | 22,175 | 24,558,812 | ||||||||
| Intelsat Luxembourg SA (Luxembourg)†(c) | 7.75% | 6/1/2021 | 17,075 | 18,376,969 | ||||||||
| Intelsat Luxembourg SA (Luxembourg)†(c) | 8.125% | 6/1/2023 | 7,300 | 7,856,625 | ||||||||
| MasTec, Inc. | 4.875% | 3/15/2023 | 12,950 | 12,270,125 | ||||||||
| Sable International Finance Ltd.† | 8.75% | 2/1/2020 | 12,500 | 14,125,000 | ||||||||
| SES (Luxembourg)†(c) | 3.60% | 4/4/2023 | 8,600 | 8,064,091 | ||||||||
| Softbank Corp. (Japan)†(c) | 4.50% | 4/15/2020 | 13,400 | 13,132,000 | ||||||||
| Verizon Communications, Inc. | 5.15% | 9/15/2023 | 9,850 | 10,596,177 | ||||||||
| ViaSat, Inc. | 6.875% | 6/15/2020 | 10,000 | 10,625,000 | ||||||||
| Windstream Corp. | 7.50% | 4/1/2023 | 10,000 | 10,100,000 | ||||||||
| Total | 293,653,924 | |||||||||||
| Telecommunications: Wireless 4.63% | ||||||||||||
| American Tower Corp. | 4.70% | 3/15/2022 | 20,300 | 20,325,010 | ||||||||
| CC Holdings GS V LLC/Crown Castle GS III Corp. | 3.849% | 4/15/2023 | 15,310 | 14,359,203 | ||||||||
| Clearwire Communications LLC/Clearwire Finance, Inc.† | 14.75% | 12/1/2016 | 2,000 | 2,735,000 | ||||||||
| Cricket Communications, Inc. | 7.75% | 10/15/2020 | 20,000 | 22,875,000 | ||||||||
| Crown Castle International Corp. | 5.25% | 1/15/2023 | 6,825 | 6,722,625 | ||||||||
| Digicel Group Ltd. (Jamaica)†(c) | 8.25% | 9/30/2020 | 11,700 | 12,182,625 | ||||||||
| Digicel Group Ltd. (Jamaica)†(c) | 10.50% | 4/15/2018 | 18,432 | 19,814,400 | ||||||||
| Digicel Ltd. (Jamaica)†(c) | 7.00% | 2/15/2020 | 16,500 | 16,747,500 | ||||||||
| See Notes to Financial Statements. | 33 |
Schedule of Investments (continued)
December 31, 2013
| Principal | ||||||||||||
| Interest | Maturity | Amount | Fair | |||||||||
| Investments | Rate | Date | (000) | Value | ||||||||
| Telecommunications: Wireless (continued) | ||||||||||||
| MetroPCS Wireless, Inc. | 6.625% | 11/15/2020 | $ | 15,000 | $ | 15,956,250 | ||||||
| MetroPCS Wireless, Inc. | 7.875% | 9/1/2018 | 10,000 | 10,762,500 | ||||||||
| Millicom International Cellular SA (Luxembourg)†(c) | 4.75% | 5/22/2020 | 5,350 | 5,162,750 | ||||||||
| NII Capital Corp. | 8.875% | 12/15/2019 | 8,300 | 3,610,500 | ||||||||
| NII Capital Corp. | 10.00% | 8/15/2016 | 2,500 | 1,337,500 | ||||||||
| SBA Telecommunications, Inc. | 5.75% | 7/15/2020 | 12,000 | 12,540,000 | ||||||||
| SBA Telecommunications, Inc. | 8.25% | 8/15/2019 | 5,000 | 5,387,500 | ||||||||
| Sprint Capital Corp. | 6.90% | 5/1/2019 | 43,100 | 47,302,250 | ||||||||
| Sprint Communications, Inc.† | 7.00% | 3/1/2020 | 10,000 | 11,200,000 | ||||||||
| Sprint Communications, Inc. | 7.00% | 8/15/2020 | 23,600 | 25,665,000 | ||||||||
| Sprint Corp.† | 7.125% | 6/15/2024 | 6,000 | 6,105,000 | ||||||||
| Sprint Corp.† | 7.875% | 9/15/2023 | 9,400 | 10,128,500 | ||||||||
| Sprint Nextel Corp. | 9.125% | 3/1/2017 | 10,000 | 11,800,000 | ||||||||
| T-Mobile USA, Inc. | 6.125% | 1/15/2022 | 9,700 | 9,894,000 | ||||||||
| T-Mobile USA, Inc. | 6.50% | 1/15/2024 | 10,000 | 10,150,000 | ||||||||
| T-Mobile USA, Inc. | 6.542% | 4/28/2020 | 20,000 | 21,325,000 | ||||||||
| Telemovil Finance Co., Ltd. (El Salvador)†(c) | 8.00% | 10/1/2017 | 11,450 | 12,251,500 | ||||||||
| Vimpel Communications via VIP Finance Ireland Ltd. OJSC (Luxembourg)†(c) | 7.748% | 2/2/2021 | 8,550 | 9,308,812 | ||||||||
| Wind Acquisition Finance SA (Italy)†(c) | 7.25% | 2/15/2018 | 8,500 | 8,988,750 | ||||||||
| Wind Acquisition Finance SA (Italy)†(c) | 11.75% | 7/15/2017 | 34,000 | 36,210,000 | ||||||||
| Wind Acquisition Holdings Finance SA PIK (Italy)†(c) | 12.25% | 7/15/2017 | 5,550 | 5,553,741 | ||||||||
| Total | 396,400,916 | |||||||||||
| Transportation (Excluding Air/Rail) 0.24% | ||||||||||||
| Asciano Finance Ltd. (Australia)†(c) | 4.625% | 9/23/2020 | 7,000 | 7,017,290 | ||||||||
| Great Lakes Dredge & Dock Corp. | 7.375% | 2/1/2019 | 13,000 | 13,650,000 | ||||||||
| Total | 20,667,290 | |||||||||||
| Total High Yield Corporate Bonds (cost $6,491,471,288) | 6,725,878,196 | |||||||||||
| MUNICIPAL BOND 0.19% | ||||||||||||
| Other Revenue | ||||||||||||
| NYC Indus Dev Agy, NY† (cost $12,000,000) | 11.00% | 3/1/2029 | 12,000 | 16,394,520 | ||||||||
| 34 | See Notes to Financial Statements. |
Schedule of Investments (continued)
December 31, 2013
| Dividend | Shares | Fair | ||||||||||||
| Investments | Rate | (000) | Value | |||||||||||
| PREFERRED STOCKS 0.55% | ||||||||||||||
| Agency/Government Related 0.05% | ||||||||||||||
| Fannie Mae* | Zero Coupon | 481 | $ | 4,212,250 | ||||||||||
| Banking 0.31% | ||||||||||||||
| GMAC Capital Trust I | 8.125% | 275 | 7,353,500 | |||||||||||
| Texas Capital Bancshares, Inc. | 6.50% | 467 | 9,815,160 | |||||||||||
| U.S. Bancorp | 3.50% | 13 | 9,401,438 | |||||||||||
| Total | 26,570,098 | |||||||||||||
| Forestry/Paper 0.11% | ||||||||||||||
| Weyerhaeuser Co. | 6.375% | 177 | 9,941,496 | |||||||||||
| Property & Casualty 0.08% | ||||||||||||||
| Allstate Corp. (The) | 5.10% | 274 | 6,611,926 | |||||||||||
| Total Preferred Stocks (cost $55,598,301) | 47,335,770 | |||||||||||||
| Exercise | Expiration | |||||||||||||
| Price | Date | |||||||||||||
| WARRANTS 0.03% | ||||||||||||||
| Auto Parts & Equipment 0.02% | ||||||||||||||
| Cooper-Standard Holdings, Inc.* | $ | 27.33 | 11/27/2017 | 84 | 1,923,074 | |||||||||
| Media: Broadcast 0.01% | ||||||||||||||
| ION Media Networks, Inc.*(i) | 687.00 | 12/18/2016 | 2 | 191,178 | ||||||||||
| ION Media Networks, Inc.*(i) | 500.00 | 12/18/2016 | 2 | 193,629 | ||||||||||
| Total | 384,807 | |||||||||||||
| Total Warrants (cost $10,926,080) | 2,307,881 | |||||||||||||
| Total Long-Term Investments (cost $7,945,756,225) | 8,347,574,830 | |||||||||||||
| Principal | ||||||||||||||
| Interest | Maturity | Amount | ||||||||||||
| Rate | Date | (000) | ||||||||||||
| SHORT-TERM INVESTMENTS 0.75% | ||||||||||||||
| CONVERTIBLE BONDS 0.17% | ||||||||||||||
| Health Services 0.09% | ||||||||||||||
| LifePoint Hospitals, Inc. | 3.50% | 5/15/2014 | $ | 7,000 | 7,643,125 | |||||||||
| See Notes to Financial Statements. | 35 |
Schedule of Investments (continued)
December 31, 2013
| Principal | ||||||||||||
| Interest | Maturity | Amount | Fair | |||||||||
| Investments | Rate | Date | (000) | Value | ||||||||
| Real Estate Investment Trusts 0.08% | ||||||||||||
| Boston Properties LP† | 3.625% | 2/15/2014 | $ | 7,000 | $ | 7,030,625 | ||||||
| Total Convertible Bonds (cost $14,773,049) | 14,673,750 | |||||||||||
| REPURCHASE AGREEMENT 0.58% | ||||||||||||
| Repurchase Agreement dated 12/31/2013, Zero Coupon due 1/2/2014 with Fixed Income Clearing Corp. collateralized by $49,480,000 of U.S. Treasury Note at 2.375% due 8/31/2014; value: $50,603,394 proceeds: $49,609,372 (cost $49,609,372) | 49,609 | 49,609,372 | ||||||||||
| Total Short-Term Investments (cost $64,382,421) | 64,283,122 | |||||||||||
| Total Investments in Securities 98.17% (cost $8,010,138,646) | 8,411,857,952 | |||||||||||
| Cash and Other Assets in Excess of Liabilities(j) 1.83% | 156,902,082 | |||||||||||
| Net Assets 100.00% | $ | 8,568,760,034 | ||||||||||
| CAD | Canadian dollar. | |
| CHF | Swiss franc. | |
| EUR | euro. | |
| GBP | British pound. | |
| ETF | Exchange Traded Fund. | |
| PIK | Payment-in-kind. | |
| * | Non-income producing security. | |
| † | Security was purchased pursuant to Rule 144A under the Securities Act of 1933 and, unless registered under such Act or exempted from registration, may only be resold to qualified institutional buyers. | |
| ~ | Deferred interest debentures pay the stated rate, after which they pay a predetermined interest rate. | |
| (a) | Investment in non-U.S. dollar denominated securities. | |
| (b) | Security converted to cash and common stock on January 8, 2014. | |
| (c) | Foreign security traded in U.S. dollars. | |
| (d) | Defaulted security. | |
| (e) | Floating Rate Loans in which the Fund invests generally pay interest at rates which are periodically re-determined at a margin above the London Interbank Offered Rate (“LIBOR”) or the prime rate offered by major U.S. banks. The rate shown is the rate(s) in effect at December 31, 2013. | |
| (f) | Security is perpetual in nature and has no stated maturity. | |
| (g) | Debenture pays interest at an annual fixed rate of 8.00% through June 15, 2020. Thereafter, interest will be paid at an annual floating rate of 3-month LIBOR plus 6.405% through December 29, 2049. This debenture is subject to full redemption at the option of the issuer any time prior to December 29, 2049. | |
| (h) | Security has been partially segregated to cover margin requirements for open futures contracts as of December 31, 2013. |
| 36 | See Notes to Financial Statements. |
Schedule of Investments (continued)
December 31, 2013
| (i) | Restricted securities of ION Media Networks, Inc. acquired through private placement are as follows: |
| Cost on | Fair value | ||||||||||||||
| Acquisition | Acquired | Acquisition | per share at | ||||||||||||
| Investment Type | Date | Shares | Date | December 31, 2013 | |||||||||||
| Warrant | April 15, 2011 | 1,950 | $4,318,663 | $98.04 | |||||||||||
| Warrant | April 15, 2011 | 1,975 | 5,785,009 | 98.04 | |||||||||||
| (j) | Cash and Other Assets in Excess of Liabilities include net unrealized appreciation (depreciation) on open forward foreign currency exchange contracts and futures contracts as follows: |
Open Forward Foreign Currency Exchange Contracts at December 31, 2013:
| Forward | ||||||||||||||||||||||
| Foreign | U.S. $ | |||||||||||||||||||||
| Currency | Cost on | U.S. $ | ||||||||||||||||||||
| Exchange | Transaction | Expiration | Foreign | Origination | Current | Unrealized | ||||||||||||||||
| Contracts | Type | Counterparty | Date | Currency | Date | Value | Depreciation | |||||||||||||||
| British pound | Sell | J.P. Morgan | 1/17/2014 | 5,300,000 | $ | 8,570,302 | $ | 8,775,721 | $(205,419 | ) | ||||||||||||
| euro | Sell | J.P. Morgan | 2/21/2014 | 3,325,000 | 4,491,480 | 4,574,113 | (82,633 | ) | ||||||||||||||
| euro | Sell | Goldman Sachs | 3/11/2014 | 38,900,000 | 53,358,702 | 53,513,538 | (154,836 | ) | ||||||||||||||
| Unrealized Depreciation on Forward Foreign Currency Exchange Contracts | $(442,888 | ) | ||||||||||||||||||||
| Open Futures Contracts at December 31, 2013: | ||||||||||||||
| Unrealized | ||||||||||||||
| Type | Expiration | Contracts | Position | Fair Value | Appreciation | |||||||||
| U.S. 10-Year Treasury Note | March 2014 | 1,313 | Short | $ | (161,560,547 | ) | $2,952,044 | |||||||
| See Notes to Financial Statements. | 37 |
Schedule of Investments (continued)
December 31, 2013
The following is a summary of the inputs used as of December 31, 2013 in valuing the Fund’s investments carried at fair value(1):
| Investment Type(2) | Level 1 | Level 2 | Level 3 | Total | ||||||||||||
| Common Stocks | $ | 370,441,802 | $ | — | $ | — | $ | 370,441,802 | ||||||||
| Convertible Bonds | — | 700,587,350 | — | 700,587,350 | ||||||||||||
| Convertible Preferred Stocks | ||||||||||||||||
| Aerospace/Defense | 28,479,450 | — | — | 28,479,450 | ||||||||||||
| Banking | 35,540,375 | — | — | 35,540,375 | ||||||||||||
| Electric: Integrated | 42,835,300 | — | — | 42,835,300 | ||||||||||||
| Energy: Exploration & Production | — | 2,923,437 | — | 2,923,437 | ||||||||||||
| Food: Wholesale | — | 19,350,000 | — | 19,350,000 | ||||||||||||
| Investments & Miscellaneous Financial Services | 16,637,000 | 13,112,825 | — | 29,749,825 | ||||||||||||
| Life Insurance | 12,616,000 | — | — | 12,616,000 | ||||||||||||
| Metals/Mining (Excluding Steel) | 18,368,000 | — | — | 18,368,000 | ||||||||||||
| Railroads(3) | — | 15,450,000 | — | 15,450,000 | ||||||||||||
| Real Estate Investment Trusts | 3,012,000 | — | — | 3,012,000 | ||||||||||||
| Steel Producers/Products | 7,280,000 | — | — | 7,280,000 | ||||||||||||
| Telecommunications: Integrated/Services | — | 2,340,000 | — | 2,340,000 | ||||||||||||
| Telecommunications: Wireless | 9,503,800 | — | — | 9,503,800 | ||||||||||||
| Floating Rate Loans(4) | ||||||||||||||||
| Chemicals | — | 4,087,520 | — | 4,087,520 | ||||||||||||
| Food & Drug Retailers | — | 16,206,814 | — | 16,206,814 | ||||||||||||
| Food: Wholesale | — | 10,699,029 | 2,057,124 | 12,756,153 | ||||||||||||
| Health Facilities | — | 13,368,113 | — | 13,368,113 | ||||||||||||
| Investments & Miscellaneous Financial Services | — | — | 5,348,438 | 5,348,438 | ||||||||||||
| Machinery | — | 10,006,109 | — | 10,006,109 | ||||||||||||
| Media: Broadcast | — | 17,045,185 | — | 17,045,185 | ||||||||||||
| Media: Cable | — | 8,529,750 | — | 8,529,750 | ||||||||||||
| Media: Services | — | 22,203,888 | — | 22,203,888 | ||||||||||||
| Oil Field Equipment & Services | — | 14,329,560 | — | 14,329,560 | ||||||||||||
| Software/Services | — | 22,149,312 | — | 22,149,312 | ||||||||||||
| Specialty Retail | — | 8,331,663 | — | 8,331,663 | ||||||||||||
| Foreign Bonds | — | 39,935,960 | — | 39,935,960 | ||||||||||||
| Foreign Government Obligations | — | 18,866,262 | — | 18,866,262 | ||||||||||||
| Government Sponsored Enterprises Pass-throughs | — | 58,690,147 | — | 58,690,147 | ||||||||||||
| High Yield Corporate Bonds | ||||||||||||||||
| Automakers | — | 19,222,500 | 1,500 | 19,224,000 | ||||||||||||
| Banking | — | 172,524,432 | 2,250 | 172,526,682 | ||||||||||||
| Telecommunications: Integrated/Services | — | 293,652,424 | 1,500 | 293,653,924 | ||||||||||||
| Other | — | 6,240,473,590 | — | 6,240,473,590 | ||||||||||||
| Municipal Bonds | — | 16,394,520 | — | 16,394,520 | ||||||||||||
| Preferred Stocks | ||||||||||||||||
| Banking | 17,168,660 | 9,401,438 | — | 26,570,098 | ||||||||||||
| Other | 20,765,672 | — | — | 20,765,672 | ||||||||||||
| Warrants | ||||||||||||||||
| Auto Parts & Equipment | 1,923,074 | — | — | 1,923,074 | ||||||||||||
| Media: Broadcast | — | — | 384,807 | 384,807 | ||||||||||||
| Repurchase Agreement | — | 49,609,372 | — | 49,609,372 | ||||||||||||
| Total | $ | 584,571,133 | $ | 7,819,491,200 | $ | 7,795,619 | $ | 8,411,857,952 | ||||||||
| 38 | See Notes to Financial Statements. |
Schedule of Investments (concluded)
December 31, 2013
| Investment Type(2) | Level 1 | Level 2 | Level 3 | Total | ||||||||||||
| Other Financial Instruments | ||||||||||||||||
| Forward Foreign Currency Exchange Contracts | ||||||||||||||||
| Assets | $ | — | $ | — | $ | — | $ | — | ||||||||
| Liabilities | — | (442,888 | ) | — | (442,888 | ) | ||||||||||
| Futures Contracts | ||||||||||||||||
| Assets | 2,952,044 | — | — | 2,952,044 | ||||||||||||
| Liabilities | — | — | — | — | ||||||||||||
| Unfunded Commitments | ||||||||||||||||
| Assets | — | 55,927 | — | 55,927 | ||||||||||||
| Liabilities | — | — | — | — | ||||||||||||
| Total | $ | 2,952,044 | $ | (386,961 | ) | $ | — | $ | 2,565,083 | |||||||
| (1) | Refer to note 2(l) for a description of fair value measurements and the three-tier hierarchy of inputs. |
| (2) | See Schedule of Investments for fair values in each industry and identification of foreign issuers and/or geography. The table above is presented by Investment Type. Industries are presented within an Investment type should such Investment Type include securities classified as two or more levels within the three-tier fair value hierachy. |
| (3) | As of December 31, 2013, Genesee & Wyoming, Inc. was categorized as Level 2 due to limited market activity resulting in observable input pricing. During the fiscal year ended December 31, 2013, $11,152,141 was transferred from Level 1 to Level 2. |
| (4) | Floating Rate Loans categorized as Level 3 are valued based on a single quotation obtained from a dealer. Accounting principles generally accepted in the United States of America do not require the Fund to create quantitative unobservable inputs that were not developed by the Fund. Therefore, the Fund does not have access to unobservable inputs and cannot disclose such inputs in the valuation. |
The following is a reconciliation of investments with unobservable inputs (Level 3) that were used in determining fair value:
| High Yield | ||||||||||||
| Floating | Corporate | |||||||||||
| Investment Type | Rate Loans | Bonds | Warrants | |||||||||
| Balance as of January 1, 2013 | $ | 14,455,169 | $ | 42,975 | $ | 1,081,250 | ||||||
| Accrued discounts/premiums | 113,846 | — | — | |||||||||
| Realized gain (loss) | 225,905 | — | — | |||||||||
| Change in unrealized appreciation/depreciation | (252,640 | ) | (37,725 | ) | (696,443 | ) | ||||||
| Purchases | 7,047,744 | — | — | |||||||||
| Sales | (14,184,462 | ) | — | — | ||||||||
| Net transfers in or out of Level 3 | — | — | — | |||||||||
| Balance as of December 31, 2013 | $ | 7,405,562 | $ | 5,250 | $ | 384,807 | ||||||
| See Notes to Financial Statements. | 39 |
Statement of Assets and Liabilities
December 31, 2013
| ASSETS: | ||||
| Investments in securities, at fair value (cost $8,010,138,646) | $ | 8,411,857,952 | ||
| Cash | 49,194,197 | |||
| Receivables: | ||||
| Interest and dividends | 121,423,777 | |||
| Investment securities sold | 11,357,509 | |||
| Capital shares sold | 58,173,514 | |||
| Variation margin for futures contracts | 225,765 | |||
| Unrealized appreciation on unfunded commitments | 55,927 | |||
| Prepaid expenses and other assets | 170,063 | |||
| Total assets | 8,652,458,704 | |||
| LIABILITIES: | ||||
| Payables: | ||||
| Investment securities purchased | 15,119,521 | |||
| Capital shares reacquired | 22,151,607 | |||
| Management fee | 3,269,753 | |||
| 12b-1 distribution fees | 4,329,710 | |||
| Directors’ fees | 1,513,942 | |||
| Fund administration | 288,757 | |||
| Unrealized depreciation on forward foreign currency exchange contracts | 442,888 | |||
| Distributions payable | 35,038,168 | |||
| Accrued expenses | 1,544,324 | |||
| Total liabilities | 83,698,670 | |||
| NET ASSETS | $ | 8,568,760,034 | ||
| COMPOSITION OF NET ASSETS: | ||||
| Paid-in capital | $ | 8,148,298,412 | ||
| Distributions in excess of net investment income | (5,504,364 | ) | ||
| Accumulated net realized gain on investments, futures contracts and foreign currency related transactions | 21,635,459 | |||
| Net unrealized appreciation on investments, futures contracts, unfunded commitments and translation of assets and liabilities denominated in foreign currencies | 404,330,527 | |||
| Net Assets | $ | 8,568,760,034 |
| 40 | See Notes to Financial Statements. |
Statement of Assets and Liabilities (concluded)
December 31, 2013
| Net assets by class: | ||||
| Class A Shares | $ | 4,784,258,206 | ||
| Class B Shares | $ | 166,433,199 | ||
| Class C Shares | $ | 1,986,431,141 | ||
| Class F Shares | $ | 1,118,411,316 | ||
| Class I Shares | $ | 345,614,281 | ||
| Class P Shares | $ | 79,050,892 | ||
| Class R2 Shares | $ | 3,441,524 | ||
| Class R3 Shares | $ | 85,119,475 | ||
| Outstanding shares by class: | ||||
| Class A Shares (1.14 billion shares of common stock authorized, $.001 par value) | 586,891,141 | |||
| Class B Shares (500 million shares of common stock authorized, $.001 par value) | 20,345,563 | |||
| Class C Shares (600 million shares of common stock authorized, $.001 par value) | 243,066,493 | |||
| Class F Shares (300 million shares of common stock authorized, $.001 par value) | 137,377,971 | |||
| Class I Shares (300 million shares of common stock authorized, $.001 par value) | 42,601,378 | |||
| Class P Shares (160 million shares of common stock authorized, $.001 par value) | 9,491,225 | |||
| Class R2 Shares (300 million shares of common stock authorized, $.001 par value) | 422,149 | |||
| Class R3 Shares (300 million shares of common stock authorized, $.001 par value) | 10,457,857 | |||
| Net asset value, offering and redemption price per share (Net assets divided by outstanding shares): | ||||
| Class A Shares-Net asset value | $8.15 | |||
| Class A Shares-Maximum offering price (Net asset value plus sales charge of 4.75%) | $8.56 | |||
| Class B Shares-Net asset value | $8.18 | |||
| Class C Shares-Net asset value | $8.17 | |||
| Class F Shares-Net asset value | $8.14 | |||
| Class I Shares-Net asset value | $8.11 | |||
| Class P Shares-Net asset value | $8.33 | |||
| Class R2 Shares-Net asset value | $8.15 | |||
| Class R3 Shares-Net asset value | $8.14 |
| See Notes to Financial Statements. | 41 |
For the Year Ended December 31, 2013
| Investment income: | ||||
| Dividends | $ | 18,622,101 | ||
| Interest | 503,826,647 | |||
| Total investment income | 522,448,748 | |||
| Expenses: | ||||
| Management fee | 38,653,083 | |||
| 12b-1 distribution plan-Class A | 16,886,624 | |||
| 12b-1 distribution plan-Class B | 1,935,162 | |||
| 12b-1 distribution plan-Class C | 20,275,800 | |||
| 12b-1 distribution plan-Class F | 1,057,187 | |||
| 12b-1 distribution plan-Class P | 241,094 | |||
| 12b-1 distribution plan-Class R2 | 19,373 | |||
| 12b-1 distribution plan-Class R3 | 373,470 | |||
| Shareholder servicing | 8,532,046 | |||
| Fund administration | 3,413,607 | |||
| Reports to shareholders | 630,836 | |||
| Directors’ fees | 349,466 | |||
| Registration | 288,203 | |||
| Custody | 139,411 | |||
| Professional | 118,447 | |||
| Other | 165,933 | |||
| Gross expenses | 93,079,742 | |||
| Expense reductions (See Note 9) | (8,866 | ) | ||
| Net expenses | 93,070,876 | |||
| Net investment income | 429,377,872 | |||
| Net realized and unrealized gain: | ||||
| Net realized gain on investments, futures contracts and foreign currency related transactions | 245,348,705 | |||
| Net change in unrealized appreciation/depreciation on investments, futures contracts, unfunded commitments and translation of assets and liabilities denominated in foreign currencies | (47,933,372 | ) | ||
| Net realized and unrealized gain | 197,415,333 | |||
| Net Increase in Net Assets Resulting From Operations | $ | 626,793,205 |
| 42 | See Notes to Financial Statements. |
Statements of Changes in Net Assets
| INCREASE (DECREASE) IN NET ASSETS | For the Year Ended December 31, 2013 | For the Year Ended December 31, 2012 | |||||
| Operations: | |||||||
| Net investment income | $ | 429,377,872 | $ | 470,722,591 | |||
| Net realized gain on investments, futures contracts and foreign currency related transactions | 245,348,705 | 179,468,950 | |||||
| Net change in unrealized appreciation/depreciation on investments, futures contracts, unfunded commitments and translation of assets and liabilities denominated in foreign currencies | (47,933,372 | ) | 348,185,327 | ||||
| Net increase in net assets resulting from operations | 626,793,205 | 998,376,868 | |||||
| Distributions to shareholders from: | |||||||
| Net investment income | |||||||
| Class A | (254,994,033 | ) | (276,284,375 | ) | |||
| Class B | (9,000,173 | ) | (13,966,875 | ) | |||
| Class C | (94,034,072 | ) | (103,530,439 | ) | |||
| Class F | (58,299,116 | ) | (60,760,217 | ) | |||
| Class I | (14,671,124 | ) | (13,613,665 | ) | |||
| Class P | (4,344,347 | ) | (6,491,817 | ) | |||
| Class R2 | (162,607 | ) | (135,484 | ) | |||
| Class R3 | (3,860,772 | ) | (3,346,105 | ) | |||
| Net realized gain | |||||||
| Class A | (99,409,953 | ) | — | ||||
| Class B | (3,539,456 | ) | — | ||||
| Class C | (41,275,633 | ) | — | ||||
| Class F | (22,888,039 | ) | — | ||||
| Class I | (6,739,382 | ) | — | ||||
| Class P | (1,613,105 | ) | — | ||||
| Class R2 | (67,184 | ) | — | ||||
| Class R3 | (1,699,622 | ) | — | ||||
| Total distributions to shareholders | (616,598,618 | ) | (478,128,977 | ) | |||
| Capital share transactions (Net of share conversions) (See Note 13): | |||||||
| Net proceeds from sales of shares | 1,867,968,221 | 1,851,708,040 | |||||
| Reinvestment of distributions | 531,496,118 | 398,371,696 | |||||
| Cost of shares reacquired | (2,416,841,301 | ) | (1,947,729,826 | ) | |||
| Net increase (decrease) in net assets resulting from capital share transactions | (17,376,962 | ) | 302,349,910 | ||||
| Net increase (decrease) in net assets | (7,182,375 | ) | 822,597,801 | ||||
| NET ASSETS: | |||||||
| Beginning of year | $ | 8,575,942,409 | $ | 7,753,344,608 | |||
| End of year | $ | 8,568,760,034 | $ | 8,575,942,409 | |||
| Distributions in excess of net investment income | $ | (5,504,364 | ) | $ | (49,080,118 | ) | |
| See Notes to Financial Statements. | 43 |
| Class A Shares | ||||||||||||||||||||
| Year Ended 12/31 | ||||||||||||||||||||
| 2013 | 2012 | 2011 | 2010 | 2009 | ||||||||||||||||
| Per Share Operating Performance | ||||||||||||||||||||
| Net asset value, beginning of year | $8.14 | $7.63 | $7.81 | $7.35 | $5.86 | |||||||||||||||
| Investment operations: | ||||||||||||||||||||
| Net investment income(a) | .42 | .47 | .47 | .47 | .45 | |||||||||||||||
| Net realized and unrealized gain (loss) | .19 | .51 | (.17 | ) | .45 | 1.55 | ||||||||||||||
| Total from investment operations | .61 | .98 | .30 | .92 | 2.00 | |||||||||||||||
| Distributions to shareholders from: | ||||||||||||||||||||
| Net investment income | (.43 | ) | (.47 | ) | (.48 | ) | (.46 | ) | (.51 | ) | ||||||||||
| Net realized gain | (.17 | ) | — | — | — | — | ||||||||||||||
| Total distributions | (.60 | ) | (.47 | ) | (.48 | ) | (.46 | ) | (.51 | ) | ||||||||||
| Net asset value, end of year | $8.15 | $8.14 | $7.63 | $7.81 | $7.35 | |||||||||||||||
| Total Return(b) | 7.78 | % | 13.22 | % | 3.88 | % | 12.94 | % | 35.37 | % | ||||||||||
| Ratios to Average Net Assets: | ||||||||||||||||||||
| Expenses, including expense reductions | .96 | % | .96 | % | .97 | % | .97 | % | 1.00 | % | ||||||||||
| Expenses, excluding expense reductions | .96 | % | .96 | % | .97 | % | .97 | % | 1.00 | % | ||||||||||
| Net investment income | 5.16 | % | 5.88 | % | 6.07 | % | 6.19 | % | 6.82 | % | ||||||||||
| Supplemental Data: | ||||||||||||||||||||
| Net assets, end of year (000) | $ | 4,784,258 | $ | 4,850,567 | $ | 4,345,679 | $ | 4,415,645 | $ | 4,709,961 | ||||||||||
| Portfolio turnover rate | 43.16 | % | 45.87 | % | 35.73 | % | 42.65 | % | 41.93 | % | ||||||||||
| (a) | Calculated using average shares outstanding during the year. |
| (b) | Total return does not consider the effects of sales loads and assumes the reinvestment of all distributions. |
| 44 | See Notes to Financial Statements. |
Financial Highlights (continued)
| Class B Shares | ||||||||||||||||||||
| Year Ended 12/31 | ||||||||||||||||||||
| 2013 | 2012 | 2011 | 2010 | 2009 | ||||||||||||||||
| Per Share Operating Performance | ||||||||||||||||||||
| Net asset value, beginning of year | $8.17 | $7.66 | $7.84 | $7.37 | $5.87 | |||||||||||||||
| Investment operations: | ||||||||||||||||||||
| Net investment income(a) | .37 | .42 | .42 | .42 | .41 | |||||||||||||||
| Net realized and unrealized gain (loss) | .19 | .51 | (.17 | ) | .46 | 1.55 | ||||||||||||||
| Total from investment operations | .56 | .93 | .25 | .88 | 1.96 | |||||||||||||||
| Distributions to shareholders from: | ||||||||||||||||||||
| Net investment income | (.38 | ) | (.42 | ) | (.43 | ) | (.41 | ) | (.46 | ) | ||||||||||
| Net realized gain | (.17 | ) | — | — | — | — | ||||||||||||||
| Total distributions | (.55 | ) | (.42 | ) | (.43 | ) | (.41 | ) | (.46 | ) | ||||||||||
| Net asset value, end of year | $8.18 | $8.17 | $7.66 | $7.84 | $7.37 | |||||||||||||||
| Total Return(b) | 7.08 | % | 12.47 | % | 3.35 | % | 12.16 | % | 34.52 | % | ||||||||||
| Ratios to Average Net Assets: | ||||||||||||||||||||
| Expenses, including expense reductions | 1.61 | % | 1.61 | % | 1.62 | % | 1.62 | % | 1.65 | % | ||||||||||
| Expenses, excluding expense reductions | 1.61 | % | 1.61 | % | 1.62 | % | 1.62 | % | 1.65 | % | ||||||||||
| Net investment income | 4.53 | % | 5.25 | % | 5.39 | % | 5.54 | % | 6.21 | % | ||||||||||
| Supplemental Data: | ||||||||||||||||||||
| Net assets, end of year (000) | $ | 166,433 | $ | 225,154 | $ | 295,027 | $ | 530,340 | $ | 717,671 | ||||||||||
| Portfolio turnover rate | 43.16 | % | 45.87 | % | 35.73 | % | 42.65 | % | 41.93 | % | ||||||||||
| (a) | Calculated using average shares outstanding during the year. |
| (b) | Total return does not consider the effects of sales loads and assumes the reinvestment of all distributions. |
| See Notes to Financial Statements. | 45 |
Financial Highlights (continued)
| Class C Shares | ||||||||||||||||||||
| Year Ended 12/31 | ||||||||||||||||||||
| 2013 | 2012 | 2011 | 2010 | 2009 | ||||||||||||||||
| Per Share Operating Performance | ||||||||||||||||||||
| Net asset value, beginning of year | $8.16 | $7.65 | $7.83 | $7.36 | $5.87 | |||||||||||||||
| Investment operations: | ||||||||||||||||||||
| Net investment income(a) | .37 | .42 | .42 | .42 | .41 | |||||||||||||||
| Net realized and unrealized gain (loss) | .19 | .51 | (.17 | ) | .46 | 1.54 | ||||||||||||||
| Total from investment operations | .56 | .93 | .25 | .88 | 1.95 | |||||||||||||||
| Distributions to shareholders from: | ||||||||||||||||||||
| Net investment income | (.38 | ) | (.42 | ) | (.43 | ) | (.41 | ) | (.46 | ) | ||||||||||
| Net realized gain | (.17 | ) | — | — | — | — | ||||||||||||||
| Total distributions | (.55 | ) | (.42 | ) | (.43 | ) | (.41 | ) | (.46 | ) | ||||||||||
| Net asset value, end of year | $8.17 | $8.16 | $7.65 | $7.83 | $7.36 | |||||||||||||||
| Total Return(b) | 7.08 | % | 12.47 | % | 3.22 | % | 12.34 | % | 34.44 | % | ||||||||||
| Ratios to Average Net Assets: | ||||||||||||||||||||
| Expenses, including expense reductions | 1.61 | % | 1.61 | % | 1.62 | % | 1.62 | % | 1.65 | % | ||||||||||
| Expenses, excluding expense reductions | 1.61 | % | 1.61 | % | 1.62 | % | 1.62 | % | 1.65 | % | ||||||||||
| Net investment income | 4.52 | % | 5.23 | % | 5.42 | % | 5.54 | % | 6.13 | % | ||||||||||
| Supplemental Data: | ||||||||||||||||||||
| Net assets, end of year (000) | $ | 1,986,431 | $ | 2,051,198 | $ | 1,790,610 | $ | 1,866,405 | $ | 1,888,177 | ||||||||||
| Portfolio turnover rate | 43.16 | % | 45.87 | % | 35.73 | % | 42.65 | % | 41.93 | % | ||||||||||
| (a) | Calculated using average shares outstanding during the year. |
| (b) | Total return does not consider the effects of sales loads and assumes the reinvestment of all distributions. |
| 46 | See Notes to Financial Statements. |
Financial Highlights (continued)
| Class F Shares | ||||||||||||||||||||
| Year Ended 12/31 | ||||||||||||||||||||
| 2013 | 2012 | 2011 | 2010 | 2009 | ||||||||||||||||
| Per Share Operating Performance | ||||||||||||||||||||
| Net asset value, beginning of year | $8.13 | $7.62 | $7.80 | $7.34 | $5.85 | |||||||||||||||
| Investment operations: | ||||||||||||||||||||
| Net investment income(a) | .44 | .49 | .49 | .48 | .46 | |||||||||||||||
| Net realized and unrealized gain (loss) | .19 | .51 | (.17 | ) | .46 | 1.55 | ||||||||||||||
| Total from investment operations | .63 | 1.00 | .32 | .94 | 2.01 | |||||||||||||||
| Distributions to shareholders from: | ||||||||||||||||||||
| Net investment income | (.45 | ) | (.49 | ) | (.50 | ) | (.48 | ) | (.52 | ) | ||||||||||
| Net realized gain | (.17 | ) | — | — | — | — | ||||||||||||||
| Total distributions | (.62 | ) | (.49 | ) | (.50 | ) | (.48 | ) | (.52 | ) | ||||||||||
| Net asset value, end of year | $8.14 | $8.13 | $7.62 | $7.80 | $7.34 | |||||||||||||||
| Total Return(b) | 8.05 | % | 13.50 | % | 4.12 | % | 13.24 | % | 35.81 | % | ||||||||||
| Ratios to Average Net Assets: | ||||||||||||||||||||
| Expenses, including expense reductions | .71 | % | .71 | % | .72 | % | .72 | % | .75 | % | ||||||||||
| Expenses, excluding expense reductions | .71 | % | .71 | % | .72 | % | .72 | % | .75 | % | ||||||||||
| Net investment income | 5.40 | % | 6.11 | % | 6.30 | % | 6.42 | % | 6.87 | % | ||||||||||
| Supplemental Data: | ||||||||||||||||||||
| Net assets, end of year (000) | $ | 1,118,411 | $ | 1,047,325 | $ | 847,032 | $ | 695,689 | $ | 435,085 | ||||||||||
| Portfolio turnover rate | 43.16 | % | 45.87 | % | 35.73 | % | 42.65 | % | 41.93 | % | ||||||||||
| (a) | Calculated using average shares outstanding during the year. |
| (b) | Total return assumes the reinvestment of all distributions. |
| See Notes to Financial Statements. | 47 |
Financial Highlights (continued)
| Class I Shares | ||||||||||||||||||||
| Year Ended 12/31 | ||||||||||||||||||||
| 2013 | 2012 | 2011 | 2010 | 2009 | ||||||||||||||||
| Per Share Operating Performance | ||||||||||||||||||||
| Net asset value, beginning of year | $8.10 | $7.60 | $7.77 | $7.31 | $5.83 | |||||||||||||||
| Investment operations: | ||||||||||||||||||||
| Net investment income(a) | .45 | .49 | .50 | .49 | .47 | |||||||||||||||
| Net realized and unrealized gain (loss) | .19 | .51 | (.16 | ) | .46 | 1.54 | ||||||||||||||
| Total from investment operations | .64 | 1.00 | .34 | .95 | 2.01 | |||||||||||||||
| Distributions to shareholders from: | ||||||||||||||||||||
| Net investment income | (.46 | ) | (.50 | ) | (.51 | ) | (.49 | ) | (.53 | ) | ||||||||||
| Net realized gain | (.17 | ) | — | — | — | — | ||||||||||||||
| Total distributions | (.63 | ) | (.50 | ) | (.51 | ) | (.49 | ) | (.53 | ) | ||||||||||
| Net asset value, end of year | $8.11 | $8.10 | $7.60 | $7.77 | $7.31 | |||||||||||||||
| Total Return(b) | 8.16 | % | 13.49 | % | 4.35 | % | 13.40 | % | 35.87 | % | ||||||||||
| Ratios to Average Net Assets: | ||||||||||||||||||||
| Expenses, including expense reductions | .61 | % | .62 | % | .62 | % | .62 | % | .65 | % | ||||||||||
| Expenses, excluding expense reductions | .61 | % | .62 | % | .62 | % | .62 | % | .65 | % | ||||||||||
| Net investment income | 5.48 | % | 6.25 | % | 6.39 | % | 6.53 | % | 7.15 | % | ||||||||||
| Supplemental Data: | ||||||||||||||||||||
| Net assets, end of year (000) | $ | 345,614 | $ | 230,006 | $ | 316,777 | $ | 353,941 | $ | 294,144 | ||||||||||
| Portfolio turnover rate | 43.16 | % | 45.87 | % | 35.73 | % | 42.65 | % | 41.93 | % | ||||||||||
| (a) | Calculated using average shares outstanding during the year. |
| (b) | Total return assumes the reinvestment of all distributions. |
| 48 | See Notes to Financial Statements. |
Financial Highlights (continued)
| Class P Shares | ||||||||||||||||||||
| Year Ended 12/31 | ||||||||||||||||||||
| 2013 | 2012 | 2011 | 2010 | 2009 | ||||||||||||||||
| Per Share Operating Performance | ||||||||||||||||||||
| Net asset value, beginning of year | $8.31 | $7.79 | $7.98 | $7.49 | $5.97 | |||||||||||||||
| Investment operations: | ||||||||||||||||||||
| Net investment income(a) | .44 | .48 | .48 | .47 | .45 | |||||||||||||||
| Net realized and unrealized gain (loss) | .20 | .52 | (.18 | ) | .48 | 1.57 | ||||||||||||||
| Total from investment operations | .64 | 1.00 | .30 | .95 | 2.02 | |||||||||||||||
| Distributions to shareholders from: | ||||||||||||||||||||
| Net investment income | (.45 | ) | (.48 | ) | (.49 | ) | (.46 | ) | (.50 | ) | ||||||||||
| Net realized gain | (.17 | ) | — | — | — | — | ||||||||||||||
| Total distributions | (.62 | ) | (.48 | ) | (.49 | ) | (.46 | ) | (.50 | ) | ||||||||||
| Net asset value, end of year | $8.33 | $8.31 | $7.79 | $7.98 | $7.49 | |||||||||||||||
| Total Return(b) | 7.92 | % | 13.21 | % | 3.88 | % | 12.73 | % | 35.47 | % | ||||||||||
| Ratios to Average Net Assets: | ||||||||||||||||||||
| Expenses, including expense reductions | .91 | % | .96 | % | 1.03 | % | 1.07 | % | 1.10 | % | ||||||||||
| Expenses, excluding expense reductions | .91 | % | .96 | % | 1.03 | % | 1.07 | % | 1.10 | % | ||||||||||
| Net investment income | 5.23 | % | 5.88 | % | 6.01 | % | 6.08 | % | 6.70 | % | ||||||||||
| Supplemental Data: | ||||||||||||||||||||
| Net assets, end of year (000) | $ | 79,051 | $ | 99,968 | $ | 109,252 | $ | 143,083 | $ | 150,002 | ||||||||||
| Portfolio turnover rate | 43.16 | % | 45.87 | % | 35.73 | % | 42.65 | % | 41.93 | % | ||||||||||
| (a) | Calculated using average shares outstanding during the year. |
| (b) | Total return assumes the reinvestment of all distributions. |
| See Notes to Financial Statements. | 49 |
Financial Highlights (continued)
| Class R2 Shares | ||||||||||||||||||||
| Year Ended 12/31 | ||||||||||||||||||||
| 2013 | 2012 | 2011 | 2010 | 2009 | ||||||||||||||||
| Per Share Operating Performance | ||||||||||||||||||||
| Net asset value, beginning of year | $8.14 | $7.63 | $7.81 | $7.35 | $5.86 | |||||||||||||||
| Investment operations: | ||||||||||||||||||||
| Net investment income(a) | .40 | .45 | .46 | .45 | .43 | |||||||||||||||
| Net realized and unrealized gain (loss) | .19 | .52 | (.18 | ) | .45 | 1.55 | ||||||||||||||
| Total from investment operations | .59 | .97 | .28 | .90 | 1.98 | |||||||||||||||
| Distributions to shareholders from: | ||||||||||||||||||||
| Net investment income | (.41 | ) | (.46 | ) | (.46 | ) | (.44 | ) | (.49 | ) | ||||||||||
| Net realized gain | (.17 | ) | — | — | — | — | ||||||||||||||
| Total distributions | (.58 | ) | (.46 | ) | (.46 | ) | (.44 | ) | (.49 | ) | ||||||||||
| Net asset value, end of year | $8.15 | $8.14 | $7.63 | $7.81 | $7.35 | |||||||||||||||
| Total Return(b) | 7.52 | % | 12.94 | % | 3.62 | % | 12.63 | % | 35.26 | % | ||||||||||
| Ratios to Average Net Assets: | ||||||||||||||||||||
| Expenses, including expense reductions | 1.21 | % | 1.21 | % | 1.22 | % | 1.22 | % | 1.25 | % | ||||||||||
| Expenses, excluding expense reductions | 1.21 | % | 1.21 | % | 1.22 | % | 1.22 | % | 1.25 | % | ||||||||||
| Net investment income | 4.92 | % | 5.62 | % | 5.84 | % | 5.92 | % | 6.57 | % | ||||||||||
| Supplemental Data: | ||||||||||||||||||||
| Net assets, end of year (000) | $3,442 | $2,624 | $1,629 | $1,234 | $456 | |||||||||||||||
| Portfolio turnover rate | 43.16 | % | 45.87 | % | 35.73 | % | 42.65 | % | 41.93 | % | ||||||||||
| (a) | Calculated using average shares outstanding during the year. |
| (b) | Total return assumes the reinvestment of all distributions. |
| 50 | See Notes to Financial Statements. |
Financial Highlights (concluded)
| Class R3 Shares | ||||||||||||||||||||
| Year Ended 12/31 | ||||||||||||||||||||
| 2013 | 2012 | 2011 | 2010 | 2009 | ||||||||||||||||
| Per Share Operating Performance | ||||||||||||||||||||
| Net asset value, beginning of year | $8.13 | $7.62 | $7.80 | $7.34 | $5.85 | |||||||||||||||
| Investment operations: | ||||||||||||||||||||
| Net investment income(a) | .41 | .45 | .46 | .45 | .44 | |||||||||||||||
| Net realized and unrealized gain (loss) | .19 | .52 | (.17 | ) | .46 | 1.55 | ||||||||||||||
| Total from investment operations | .60 | .97 | .29 | .91 | 1.99 | |||||||||||||||
| Distributions to shareholders from: | ||||||||||||||||||||
| Net investment income | (.42 | ) | (.46 | ) | (.47 | ) | (.45 | ) | (.50 | ) | ||||||||||
| Net realized gain | (.17 | ) | — | — | — | — | ||||||||||||||
| Total distributions | (.59 | ) | (.46 | ) | (.47 | ) | (.45 | ) | (.50 | ) | ||||||||||
| Net asset value, end of year | $8.14 | $8.13 | $7.62 | $7.80 | $7.34 | |||||||||||||||
| Total Return(b) | 7.63 | % | 13.07 | % | 3.73 | % | 12.83 | % | 35.31 | % | ||||||||||
| Ratios to Average Net Assets: | ||||||||||||||||||||
| Expenses, including expense reductions | 1.11 | % | 1.11 | % | 1.12 | % | 1.12 | % | 1.14 | % | ||||||||||
| Expenses, excluding expense reductions | 1.11 | % | 1.11 | % | 1.12 | % | 1.12 | % | 1.14 | % | ||||||||||
| Net investment income | 5.01 | % | 5.73 | % | 5.94 | % | 6.03 | % | 6.53 | % | ||||||||||
| Supplemental Data: | ||||||||||||||||||||
| Net assets, end of year (000) | $85,119 | $69,100 | $47,338 | $34,991 | $17,780 | |||||||||||||||
| Portfolio turnover rate | 43.16 | % | 45.87 | % | 35.73 | % | 42.65 | % | 41.93 | % | ||||||||||
| (a) | Calculated using average shares outstanding during the year. |
| (b) | Total return assumes the reinvestment of all distributions. |
| See Notes to Financial Statements. | 51 |
| 1. | ORGANIZATION |
Lord Abbett Bond-Debenture Fund, Inc. (the “Fund”) is registered under the Investment Company Act of 1940, as amended (the “Act”), as a diversified, open-end management investment company. The Fund was organized in 1970 and incorporated under Maryland law on January 23, 1976.
The Fund’s investment objective is to seek high current income and the opportunity for capital appreciation to produce a high total return. The Fund has eight classes of shares: Class A, B, C, F, I, P, R2 and R3, each with different expenses and dividends. A front-end sales charge is normally added to the net asset value (“NAV”) for Class A shares. There is no front-end sales charge in the case of Class B, C, F, I, P, R2 and R3 shares, although there may be a contingent deferred sales charge (“CDSC”) in certain cases as follows: Class A shares purchased without a sales charge and redeemed before the first day of the month in which the one-year anniversary of the purchase falls (subject to certain exceptions as set forth in the Fund’s prospectus); Class B shares redeemed before the sixth anniversary of purchase; and Class C shares redeemed before the first anniversary of purchase. Class B shares will automatically convert to Class A shares on the 25th day of the month (or, if the 25th day is not a business day, the next business day thereafter) following the eighth anniversary of the day on which the purchase order was accepted. The Fund no longer issues Class B shares for purchase. The Fund’s Class P shares are closed to substantially all investors, with certain exceptions as set forth in the Fund’s prospectus.
The preparation of the financial statements in conformity with accounting principles generally accepted in the United States of America requires management to make certain estimates and assumptions that affect the reported amounts of assets and liabilities and disclosure of contingent assets and liabilities at the date of the financial statements and the reported amounts of increases and decreases in net assets from operations during the reporting period. Actual results could differ from those estimates.
| 2. | SIGNIFICANT ACCOUNTING POLICIES |
| (a) | Investment Valuation–Under procedures approved by the Fund’s Board of Directors (the “Board”), Lord, Abbett & Co. LLC (“Lord Abbett”), the Fund’s investment manager, has formed a Pricing Committee to administer the pricing and valuation of portfolio investments and to ensure that prices utilized reasonably reflect fair value. Among other things, these procedures allow the Fund to utilize independent pricing services, quotations from securities and financial instrument dealers and other market sources to determine fair value. |
| Securities actively traded on any recognized U.S. or non-U.S. exchange or on The NASDAQ Stock Market LLC are valued at the last sale price or official closing price on the exchange or system on which they are principally traded. Events occurring after the close of trading on non-U.S. exchanges may result in adjustments to the valuation of foreign securities to reflect their fair value as of the close of regular trading on the New York Stock Exchange. The Fund may rely on an independent fair valuation service in adjusting the valuations of foreign securities. Unlisted equity securities are valued at the last quoted sale price or, if no sale price is available, at the mean between the most recently quoted bid and asked prices. Fixed income securities are valued at the mean between the bid and asked prices on the basis of prices supplied by independent pricing services, which reflect broker/dealer supplied valuations and the independent pricing services’ own electronic data processing techniques. Floating rate loans are valued at the average of bid and ask quotations obtained from dealers in loans on the basis of prices supplied by independent pricing services. Exchange traded options and |
52
Notes to Financial Statements (continued)
| futures contracts are valued at the last sale price in the market where they are principally traded. If no sale has occurred, the mean between the most recently quoted bid and asked prices is used. Forward foreign currency exchange contracts are valued using daily forward exchange rates. | |
| Securities for which prices are not readily available are valued at fair value as determined by the Pricing Committee and approved by the Board. The Pricing Committee considers a number of factors, including observable and unobservable inputs, when arriving at fair value. The Pricing Committee may use related or comparable assets or liabilities, recent transactions, market multiples, book values, yield curves, broker quotes, observable trading activity, option adjusted spread models and other relevant information to determine fair value of portfolio investments. The Board or a designated committee thereof regularly reviews fair value determinations made by the Pricing Committee and employs techniques such as reviewing related market activity, reviewing inputs and assumptions, and retrospectively comparing prices of subsequent purchases and sales transactions to fair value determinations made by the Pricing Committee. | |
| Short-term securities with 60 days or less remaining to maturity are valued using the amortized cost method, which approximates fair value. | |
| (b) | Security Transactions–Security transactions are recorded as of the date that the securities are purchased or sold (trade date). Realized gains and losses on sales of portfolio securities are calculated using the identified-cost method. Realized and unrealized gains (losses) are allocated to each class of shares based upon the relative proportion of net assets at the beginning of the day. |
| (c) | Investment Income–Dividend income is recorded on the ex-dividend date. Interest income is recorded on the accrual basis as earned. Discounts are accreted and premiums are amortized using the effective interest method and are included in Interest income on the Statement of Operations. Investment income is allocated to each class of shares based upon the relative proportion of net assets at the beginning of the day. |
| (d) | Income Taxes–It is the policy of the Fund to meet the requirements of Subchapter M of the Internal Revenue Code applicable to regulated investment companies and to distribute substantially all taxable income and capital gains to its shareholders. Therefore, no income tax provision is required. |
| The Fund files U.S. federal and various state and local tax returns. No income tax returns are currently under examination. The statute of limitations on the Fund’s filed U.S. federal tax returns remains open for the fiscal years ended December 31, 2010 through December 31, 2013. The statutes of limitations on the Fund’s state and local tax returns may remain open for an additional year depending upon the jurisdiction. | |
| (e) | Expenses–Expenses, excluding class-specific expenses, are allocated to each class of shares based upon the relative proportion of net assets at the beginning of the day. Class A, B, C, F, P, R2 and R3 shares bear their class-specific share of all expenses and fees relating to the Fund’s 12b-1 Distribution Plan. |
| (f) | Foreign Transactions–The books and records of the Fund are maintained in U.S. dollars and transactions denominated in foreign currencies are recorded in the Fund’s records at the rate prevailing when earned or recorded. Asset and liability accounts that are denominated in foreign currencies are adjusted daily to reflect current exchange rates and any unrealized gain |
53
Notes to Financial Statements (continued)
| (loss) is included in Net change in unrealized appreciation/depreciation on investments, futures contracts, unfunded commitments and translation of assets and liabilities denominated in foreign currencies on the Fund’s Statement of Operations. The resultant exchange gains and losses upon settlement of such transactions are included in Net realized gain on investments, futures contracts and foreign currency related transactions on the Fund’s Statement of Operations. The Fund does not isolate that portion of the results of operations arising as a result of changes in the foreign exchange rates from the changes in market prices of the securities. | |
| The Fund uses foreign currency exchange contracts to facilitate transactions in foreign-denominated securities. Losses from these transactions may arise from changes in the value of the foreign currency or if the counterparties do not perform under the contracts’ terms. | |
| (g) | Forward Foreign Currency Exchange Contracts–The Fund may enter into forward foreign currency exchange contracts in order to reduce exposure to changes in foreign currency exchange rates on foreign portfolio holdings or gain or reduce exposure to foreign currency for investment purposes. A forward foreign currency exchange contract is a commitment to purchase or sell a foreign currency at a future date at a negotiated rate. The contracts are valued daily at forward exchange rates and any unrealized gain (loss) is included in Net change in unrealized appreciation/depreciation on investments, futures contracts, unfunded commitments and translation of assets and liabilities denominated in foreign currencies on the Fund’s Statement of Operations. The gain (loss) arising from the difference between the U.S. dollar cost of the original contract and the value of the foreign currency in U.S. dollars upon closing of such contracts is included in Net realized gain on investments, futures contracts and foreign currency related transactions on the Fund’s Statement of Operations. |
| (h) | Futures Contracts–The Fund may purchase and sell futures contracts to enhance returns, to attempt to hedge some of its investment risk, or as a substitute position for holding the underlying asset on which the instrument is based. At the time of entering into a futures transaction, an investor is required to deposit and maintain a specified amount of cash or eligible securities called “initial margin.” Subsequent payments made or received by the Fund called “variation margin” are made on a daily basis as the market price of the futures contract fluctuates. The Fund will record an unrealized gain (loss) based on the amount of variation margin. When a contract is closed, a realized gain (loss) is recorded equal to the difference between the opening and closing value of the contract. |
| (i) | When-Issued, Forward Transactions or To-Be-Announced (“TBA”) Transactions–The Fund may purchase portfolio securities on a when-issued or forward basis. When-issued, forward transactions or TBA transactions involve a commitment by a fund to purchase securities, with payment and delivery (“settlement”) to take place in the future, in order to secure what is considered to be an advantageous price or yield at the time of entering into the transaction. During the period between purchase and settlement, the fair value of the securities will fluctuate and assets consisting of cash and/or marketable securities (normally short-term U.S. Government or U.S. Government sponsored enterprise securities) marked to market daily in an amount sufficient to make payment at settlement will be segregated at the Fund’s custodian in order to pay for the commitment. At the time the Fund makes the commitment to purchase a security on a when-issued basis, it will record the transaction and reflect the liability for the purchase and fair value of the security in determining its NAV. The Fund, generally, has the ability to close out a purchase obligation on or before the settlement |
54
Notes to Financial Statements (continued)
| date rather than take delivery of the security. Under no circumstances will settlement for such securities take place more than 120 days after the purchase date. | |
| (j) | Repurchase Agreements–The Fund may enter into repurchase agreements with respect to securities. A repurchase agreement is a transaction in which a fund acquires a security and simultaneously commits to resell that security to the seller (a bank or securities dealer) at an agreed-upon price on an agreed-upon date. The Fund requires at all times that the repurchase agreement be collateralized by cash, or by securities of the U.S. Government, its agencies, its instrumentalities, or U.S. Government sponsored enterprises having a value equal to, or in excess of, the value of the repurchase agreement (including accrued interest). If the seller of the agreement defaults on its obligation to repurchase the underlying securities at a time when the fair value of these securities has declined, the Fund may incur a loss upon disposition of the securities. |
| (k) | Floating Rate Loans–The Fund may invest in floating rate loans, which usually take the form of loan participations and assignments. Loan participations and assignments are agreements to make money available to U.S. or foreign corporations, partnerships or other business entities (the “Borrower”) in a specified amount, at a specified rate and within a specified time. A loan is typically originated, negotiated and structured by a U.S. or foreign bank, insurance company or other financial institution (the “Agent”) for a group of loan investors (“Loan Investors”). The Agent typically administers and enforces the loan on behalf of the other Loan Investors in the syndicate and may hold any collateral on behalf of the Loan Investors. Such loan participations and assignments are typically senior, secured and collateralized in nature. The Fund records an investment when the Borrower withdraws money and records interest as earned. These loans pay interest at rates which are periodically reset by reference to a base lending rate plus a spread. These base lending rates are generally the prime rate offered by a designated U.S. bank or London InterBank Offered Rate (“LIBOR”). |
| The loans in which the Fund invests may be subject to some restrictions on resale. For example, the Fund may be contractually obligated to receive approval from the Agent and/or Borrower prior to the sale of these investments. The Fund generally has no right to enforce compliance with the terms of the loan agreement with the Borrower. As a result, the Fund assumes the credit risk of the Borrower, the selling participant and any other persons interpositioned between the Fund and the Borrower (“Intermediate Participants”). In the event that the Borrower, selling participant or Intermediate Participants become insolvent or enter into bankruptcy, the Fund may incur certain costs and delays in realizing payment or may suffer a loss of principal and/or interest. | |
| Unfunded commitments represent the remaining obligation of the Fund to the Borrower. At any point in time, up to the maturity date of the issue, the Borrower may demand the unfunded portion. Until demanded by the Borrower, unfunded commitments are not recognized as an asset on the Statement of Assets and Liabilities. Unrealized appreciation/depreciation on unfunded commitments presented on the Statement of Assets and Liabilities represents mark to market of the unfunded portion of the Fund’s floating rate notes. As of December 31, 2013, the Fund had the following unfunded loan commitment: | |
| Security Name | ||
| Diamond Foods, Inc. Revolver | $2,318,373 |
55
Notes to Financial Statements (continued)
| (l) | Fair Value Measurements–Fair value is defined as the price that the Fund would receive upon selling an investment or transferring a liability in an orderly transaction to an independent buyer in the principal or most advantageous market of the investment. A three-tier hierarchy is used to maximize the use of observable market data and minimize the use of unobservable inputs and to establish classification of fair value measurements for disclosure purposes. Inputs refer broadly to the assumptions that market participants would use in pricing the asset or liability, including assumptions about risk – for example, the risk inherent in a particular valuation technique used to measure fair value (such as a pricing model) and/or the risk inherent in the inputs to the valuation technique. Inputs may be observable or unobservable. Observable inputs reflect the assumptions market participants would use in pricing the asset or liability. Observable inputs are based on market data obtained from sources independent of the reporting entity. Unobservable inputs reflect the reporting entity’s own assumptions about the assumptions market participants would use in pricing the asset or liability. Unobservable inputs are based on the best information available in the circumstances. The three-tier hierarchy of inputs is summarized in the three broad Levels listed below: | ||
| • | Level 1 – | unadjusted quoted prices in active markets for identical investments; | |
| • | Level 2 – | other significant observable inputs (including quoted prices for similar investments, interest rates, prepayment speeds, credit risk, etc.); and | |
| • | Level 3 – | significant unobservable inputs (including the Fund’s own assumptions in determining the fair value of investments). | |
| A summary of inputs used in valuing the Fund’s investments and other financial instruments as of December 31, 2013 and, if applicable, Level 1/Level 2 transfers and Level 3 rollforwards for the fiscal year then ended is included in the Fund’s Schedule of Investments. | |||
| Changes in valuation techniques may result in transfers into or out of an assigned level within the three-tier hierarchy. All transfers between different levels within the three-tier hierarchy are deemed to have occurred as of the beginning of the reporting period. The inputs or methodology used for valuing securities are not necessarily an indication of the risk associated with investing in those securities. | |||
| 3. | MANAGEMENT FEE AND OTHER TRANSACTIONS WITH AFFILIATES |
Management Fee
The Fund has a management agreement with Lord Abbett, pursuant to which Lord Abbett supplies the Fund with investment management services and executive and other personnel, provides office space and pays for ordinary and necessary office and clerical expenses relating to research and statistical work and supervision of the Fund’s investment portfolio.
The management fee is based on the Fund’s average daily net assets at the following annual rate:
| First $500 million | .50% |
| Next $9.5 billion | .45% |
| Over $10 billion | .40% |
For the fiscal year ended December 31, 2013, the effective management fee paid to Lord Abbett was at an annualized rate of .45% of the Fund’s average daily net assets.
56
Notes to Financial Statements (continued)
In addition, Lord Abbett provides certain administrative services to the Fund pursuant to an Administrative Services Agreement in return for a fee at an annual rate of .04% of the Fund’s average daily net assets.
12b-1 Distribution Plan
The Fund has adopted a distribution plan with respect to Class A, B, C, F, P, R2 and R3 shares pursuant to Rule 12b-1 under the Act, which provides for the payment of ongoing distribution and service fees to Lord Abbett Distributor LLC (the “Distributor”), an affiliate of Lord Abbett. The following annual rates have been approved by the Board pursuant to the plan:
| Fees* | Class A | Class B | Class C | Class F | Class P | Class R2 | Class R3 | |||||||||||||
| Service | .25 | % | (1) | .25 | % | .25 | % | — | .25 | % | .25 | % | .25 | % | ||||||
| Distribution | .10 | % | .75 | % | .75 | % | .10% | .20 | % | .35 | % | .25 | % | |||||||
| * | The Fund may designate a portion of the aggregate fee as attributable to service activities for purposes of calculating Financial Industry Regulatory Authority, Inc. (“FINRA”) sales charge limitations. |
| (1) | Annual service fee on shares sold prior to June 1, 1990 is .15% of the average daily net assets attributable to Class A shares. |
Class I shares do not have a distribution plan.
Commissions
Distributor received the following commissions on sales of shares of the Fund, after concessions were paid to authorized dealers, for the fiscal year ended December 31, 2013:
| Distributor Commissions | Dealers’ Concessions |
| $1,835,508 | $9,391,390 |
Distributor received CDSCs of $28,017 and $202,700 for Class A and Class C shares, respectively, for the fiscal year ended December 31, 2013.
A Director and certain of the Fund’s officers have an interest in Lord Abbett.
| 4. | DISTRIBUTIONS AND CAPITAL LOSS CARRYFORWARDS |
Dividends from net investment income, if any, are declared daily and paid monthly. Taxable net realized gains from investment transactions, reduced by allowable capital loss carryforwards, if any, are declared and distributed to shareholders at least annually. The capital loss carryforward amount, if any, is available to offset future net capital gains. Dividends and distributions to shareholders are recorded on the ex-dividend date. The amounts of dividends and distributions from net investment income and net realized capital gains are determined in accordance with federal income tax regulations, which may differ from accounting principles generally accepted in the United States of America. These book/tax differences are either considered temporary or permanent in nature. To the extent these differences are permanent in nature, such amounts are reclassified within the components of net assets based on their federal tax basis treatment; temporary differences do not require reclassification. Dividends and distributions, which exceed earnings and profits for tax purposes, are reported as a tax return of capital.
57
Notes to Financial Statements (continued)
The tax character of distributions paid during the fiscal years ended December 31, 2013 and 2012 was as follows:
| Year Ended 12/31/2013 | Year Ended 12/31/2012 | |||||||
| Distributions paid from: | ||||||||
| Ordinary income | $ | 472,257,012 | $ | 478,128,977 | ||||
| Net long-term capital gains | 144,341,606 | — | ||||||
| Total distributions paid | $ | 616,598,618 | $ | 478,128,977 | ||||
As of December 31, 2013, the components of accumulated gains on a tax-basis were as follows:
| Undistributed ordinary income – net | $ | 6,743,808 | ||
| Undistributed long-term capital gains | 30,411,274 | |||
| Total undistributed earnings | $ | 37,155,082 | ||
| Temporary differences | (1,513,942 | ) | ||
| Unrealized gains – net | 384,820,482 | |||
| Total accumulated gains – net | $ | 420,461,622 |
As of December 31, 2013, the aggregate unrealized security gains and losses based on cost for U.S. federal income tax purposes were as follows:
| Tax cost | $ | 8,027,139,644 | ||
| Gross unrealized gain | 578,902,500 | |||
| Gross unrealized loss | (194,184,192 | ) | ||
| Net unrealized security gain | $ | 384,718,308 |
The difference between book-basis and tax-basis unrealized gains (losses) is attributable to the tax treatment of premium amortization, certain securities, certain distributions received, and wash sales.
Permanent items identified during the fiscal year ended December 31, 2013 have been reclassified among the components of net assets based on their tax basis treatment as follows:
| Distributions in Excess of Net Investment Income | Accumulated Net Realized Gain |
| $53,564,126 | $(53,564,126) |
The permanent differences are primarily attributable to the tax treatment of premium amortization, certain securities, certain distributions and foreign currency transactions.
| 5. | PORTFOLIO SECURITIES TRANSACTIONS |
Purchases and sales of investment securities (excluding short-term investments) for the fiscal year ended December 31, 2013 were as follows:
| U.S. Government Purchases* | Non-U.S. Government Purchases | U.S. Government Sales* | Non-U.S. Government Sales |
| $122,953,125 | $3,499,670,729 | $61,583,919 | $3,785,259,976 |
| * | Includes U.S. Government sponsored enterprises securities. |
58
Notes to Financial Statements (continued)
| 6. | DISCLOSURES ABOUT DERIVATIVE INSTRUMENTS AND HEDGING ACTIVITIES |
The Fund entered into forward foreign currency exchange contracts for the fiscal year ended December 31, 2013 (as described in note 2(g)). A forward foreign currency exchange contract reduces the Fund’s exposure to changes in the value of the currency it will deliver (or settle in cash) and increases its exposure to changes in the value of the currency it will receive (or settle in cash) for the duration of the contract. The Fund’s use of forward foreign currency exchange contracts involves the risk that Lord Abbett will not accurately predict currency movements, and the Fund’s returns could be reduced as a result. Forward foreign currency exchange contracts are subject to the risk that those currencies will decline in value relative to the U.S. dollar, or, in the case of hedged positions, that the U.S. dollar will decline relative to the currency being hedged. Currency rates in foreign countries may fluctuate significantly over short periods of time. The Fund’s risk of loss from counterparty credit risk is the unrealized appreciation on forward foreign currency exchange contracts.
The Fund entered into U.S. Treasury futures contracts for the fiscal year ended December 31, 2013 (as described in note 2(h)) to hedge against changes in interest rates. The Fund bears the risk of interest rates moving unexpectedly, in which case the Fund may not achieve the anticipated benefits of the futures contracts and realize a loss. There is minimal counterparty credit risk to the Fund since futures are exchange traded and the exchange’s clearinghouse, as counterparty to all exchange traded futures, guarantees futures against default.
As of December 31, 2013, the Fund had the following derivatives, grouped into appropriate risk categories that illustrate how and why the Fund uses derivative instruments:
| Asset Derivatives | Interest Rate Contracts | Forward Foreign Currency Exchange Contracts | Fair Value | |||||||||
| Futures Contracts(1) | $ | 2,952,044 | $ | — | $ | 2,952,044 | ||||||
| Total | $ | 2,952,044 | $ | — | $ | 2,952,044 | ||||||
| Liability Derivatives | ||||||||||||
| Forward Foreign Currency Exchange Contracts(2) | $ | — | $ | 442,888 | $ | 442,888 | ||||||
| Total | $ | — | $ | 442,888 | $ | 442,888 | ||||||
| (1) | Statement of Assets and Liabilities location: Includes cumulative unrealized appreciation/depreciation of futures contracts as reported in the Schedule of Investments. Only current day’s variation margin is reported within the Statement of Assets and Liabilities. |
| (2) | Statement of Assets and Liabilities location: Unrealized depreciation on forward foreign currency exchange contracts. |
59
Notes to Financial Statements (continued)
Transactions in derivative instruments for the fiscal year ended December 31, 2013, were as follows:
| Interest Rate Contracts | Forward Foreign Currency Exchange Contracts | Total | ||||||||||
| Net Realized Gain (Loss)(1) | ||||||||||||
| Forward Foreign Currency Exchange Contracts | $ | — | $ | (3,722,516 | ) | $ | (3,722,516 | ) | ||||
| Futures Contracts | 1,545,923 | — | 1,545,923 | |||||||||
| Net Change in Unrealized Appreciation/Depreciation(2) | ||||||||||||
| Forward Foreign Currency Exchange Contracts | $ | — | $ | 161,818 | $ | 161,818 | ||||||
| Futures Contracts | 2,799,524 | — | 2,799,524 | |||||||||
| Average Number of Contracts/Notional Amounts* | ||||||||||||
| Forward Foreign Currency Exchange Contracts(3) | — | 45,217,662 | 45,217,662 | |||||||||
| Futures Contracts(4) | 933 | — | 933 | |||||||||
| * | Calculated based on the number of contracts or notional amounts for the fiscal year ended December 31, 2013. |
| (1) | Statement of Operations location: Net realized gain on investments, futures contracts and foreign currency related transactions. |
| (2) | Statement of Operations location: Net change in unrealized appreciation/depreciation on investments, futures contracts, unfunded commitments and translation of assets and liabilities denominated in foreign currencies. |
| (3) | Amount represents notional amounts in U.S. dollars. |
| (4) | Amount represents number of contracts. |
| 7. | DISCLOSURES ABOUT OFFSETTING ASSETS AND LIABILITIES |
The Financial Accounting Standards Board (“FASB”) issued Accounting Standards Update No. 2011–11 “Disclosures about Offsetting Assets and Liabilities” (“ASU 2011–11”). These disclosure requirements are intended to help better assess the effect or potential effect of offsetting arrangements on a fund’s financial position. In addition, FASB issued Accounting Standards Update No. 2013–01 “Clarifying the Scope of Disclosures about Offsetting Assets and Liabilities” (“ASU 2013–01”), specifying which transactions are subject to disclosures about offsetting.
The following tables illustrate gross and net information about recognized assets and liabilities eligible for offset in the statement of assets and liabilities; and disclose such amounts subject to an enforceable master netting agreement or similar agreement, by counterparty. A master netting agreement is an agreement between the Fund and a counterparty which provides for the net settlement of amounts owed under all contracts traded under that agreement, as well as cash collateral, through a single payment by one party to the other in the event of default on or termination of any one contract. The Fund’s accounting policy with respect to balance sheet offsetting is that, absent an event of default by the counterparty or a termination of the agreement, the master netting agreement does not result in an offset of reported amounts of financial assets and liabilities in the statement of assets and liabilities across transactions between the Fund and the applicable counterparty.
| Description | Gross Amounts of Recognized Assets | Gross Amounts Offset in the Statement of Assets and Liabilities | Net Amounts of Assets Presented in the Statement of Assets and Liabilities | |||||||||
| Repurchase Agreement | $ | 49,609,372 | $ | — | $ | 49,609,372 | ||||||
| Total | $ | 49,609,372 | $ | — | $ | 49,609,372 | ||||||
60
Notes to Financial Statements (continued)
| Net Amounts of Assets Presented in | Amounts Not Offset in the Statement of Assets and Liabilities | |||||||||||||||
| Counterparty | the Statement of Assets and Liabilities | Financial Instruments Collateral(a) | Cash Collateral Received(a) | Net Amount(b) | ||||||||||||
| Fixed Income Clearing Corp. | $ | 49,609,372 | $ | (49,609,372 | ) | $ | — | $ | — | |||||||
| Total | $ | 49,609,372 | $ | (49,609,372 | ) | $ | — | $ | — | |||||||
| Description | Gross Amounts of Recognized Liabilities | Gross Amounts Offset in the Statement of Assets and Liabilities | Net Amounts of Liabilities Presented in the Statement of Assets and Liabilities | |||||||||||||
| Forward Foreign Currency | ||||||||||||||||
| Exchange Contracts | $ | 442,888 | $ | — | $ | 442,888 | ||||||||||
| Total | $ | 442,888 | $ | — | $ | 442,888 | ||||||||||
| Net Amounts of Liabilities Presented in the Statement | Amounts Not Offset in the Statement of Assets and Liabilities | |||||||||||||||
| Counterparty | of Assets and Liabilities | Financial Instruments | Cash Collateral Pledged(a) | Net Amount(c) | ||||||||||||
| Goldman Sachs | $ | 154,836 | $ | — | $ | — | $ | 154,836 | ||||||||
| J.P. Morgan | 288,052 | — | — | 288,052 | ||||||||||||
| Total | $ | 442,888 | $ | — | $ | — | $ | 442,888 | ||||||||
| (a) | Collateral received (or pledged) is limited to an amount not to exceed 100% of the net amount of assets (or liabilities) presented in the tables presented above, for each respective counterparty. |
| (b) | Net Amount represents the amount that is subject to loss in the event of a counterparty failure as of December 31, 2013. |
| (c) | Net Amount represents the amount owed by the Fund to each counterparty as of December 31, 2013. |
| 8. | DIRECTORS’ REMUNERATION |
The Fund’s officers and a Director, who are associated with Lord Abbett, do not receive any compensation from the Fund for serving in such capacities. Independent Directors’ fees are allocated among all Lord Abbett-sponsored funds based on the net assets of each fund. There is an equity-based plan available to all Independent Directors under which Independent Directors must defer receipt of a portion of, and may elect to defer receipt of an additional portion of Directors’ fees. The deferred amounts are treated as though equivalent dollar amounts had been invested in the funds. Such amounts and earnings accrued thereon are included in Directors’ fees on the Statement of Operations and in Directors’ fees payable on the Statement of Assets and Liabilities and are not deductible for U.S. federal income tax purposes until such amounts are paid.
| 9. | EXPENSE REDUCTIONS |
The Fund has entered into an arrangement with its transfer agent and custodian, whereby credits realized as a result of uninvested cash balances are used to reduce a portion of the Fund’s expenses.
61
Notes to Financial Statements (continued)
| 10. | LINE OF CREDIT |
During the fiscal year ended December 31, 2013, the Fund and certain other funds managed by Lord Abbett (the “participating funds”) participated in an unsecured revolving credit facility (“Facility”) with State Street Bank and Trust Company (“SSB”). The Facility is to be used for temporary or emergency purposes as an additional source of liquidity to fund redemptions of investor shares. The Board considers annual renewal of the Facility under terms that depend on market conditions at the time of the renewal. The amounts available under the Facility are (i) the lesser of either $250,000,000 or 33.33% of total assets per participating fund and (ii) $350,000,000 in the aggregate for all participating funds. The annual fee to maintain the Facility is .09% of the amount available under the Facility. Each participating fund pays its pro rata share based on the net assets of each participating fund. This amount is included in Other expenses on the Fund’s Statement of Operations. Any borrowings under this Facility will bear interest at current market rates as set forth in the credit agreement.
Effective July 1, 2013, the Fund and participating funds renewed the Facility through June 30, 2014 under the same terms as described above.
During the fiscal year ended December 31, 2013, a participating fund also managed by Lord Abbett utilized the Facility and fully repaid its borrowings on June 13, 2013. As of December 31, 2013, there were no loans outstanding pursuant to this Facility.
| 11. | CUSTODIAN AND ACCOUNTING AGENT |
SSB is the Fund’s custodian and accounting agent. SSB performs custodial, accounting and recordkeeping functions relating to portfolio transactions and calculating the Fund’s NAV.
| 12. | INVESTMENT RISKS |
The Fund is subject to the general risks and considerations associated with investing in debt securities. The value of an investment will change as interest rates fluctuate and in response to market movements. When interest rates rise, the prices of debt securities are likely to decline; when rates fall, such prices tend to rise. Longer-term debt securities are usually more sensitive to interest rate changes. There is also the risk that an issuer of a debt security will fail to make timely payments of principal and/or interest to the Fund, a risk that is greater with high-yield securities (sometimes called “junk bonds”), in which the Fund may substantially invest. Some issuers, particularly of high-yield securities, may default as to principal and/or interest payments after the Fund purchases its securities. A default, or concerns in the market about an increase in risk of default, may result in losses to the Fund. High-yield securities are subject to greater price fluctuations, as well as additional risks.
The mortgage-related securities in which the Fund may invest may be particularly sensitive to changes in prevailing interest rates, and economic conditions, including delinquencies and/or defaults. These changes can affect the value, income and/or liquidity of such positions. When interest rates are declining, the value of these securities with prepayment features may not increase as much as other fixed income securities. Early principal repayment may deprive the Fund of income payments above current market rates. Alternatively, rising interest rates may cause prepayments to occur at a slower-than-expected rate, extending the duration of a security and
62
Notes to Financial Statements (continued)
typically reducing its value. The payment rate will thus affect the price and volatility of a mortgage-related security. In addition, while securities of government sponsored enterprises are guaranteed with respect to the timely payment of interest and principal by the particular enterprise involved, they are not guaranteed by the U.S. Government. In addition, the Fund may invest in non-agency asset backed and mortgage related securities, which are issued by private institutions, not by government-sponsored enterprises.
The Fund may invest up to 20% of its net assets in equity securities, the value of which fluctuates in response to movements in the equity securities market in general and to the changing prospects of individual companies in which the Fund invests.
The Fund may invest in convertible securities, which have both equity and fixed income risk characteristics. Generally, convertible securities offer lower interest or dividend yields than non-convertible securities of similar quality and less potential for gains or capital appreciation in a rising equity securities market than equity securities. They tend to be more volatile than other fixed income securities and the market for convertible securities may be less liquid than markets for stocks or bonds. A significant portion of convertible securities have below investment grade credit ratings and are subject to increased credit and liquidity risks.
Due to the Fund’s investment exposure to foreign companies and American Depositary Receipts, the Fund may experience increased market, liquidity, currency, political, information, and other risks.
The Fund is subject to the risks associated with derivatives, which may be different from and greater than the risks associated with directly investing in securities. Derivatives may be subject to risks such as liquidity risk, leveraging risk, interest rate risk, market risk, and credit risk. Illiquid securities may lower the Fund’s returns since the Fund may be unable to sell these securities at their desired time or price. Derivatives also may involve the risk of mispricing or improper valuation and the risk that changes in the value of the derivative may not correlate perfectly with the value of the underlying asset, rate or index. Whether the Fund’s use of derivatives is successful will depend on, among other things, the Fund’s ability to correctly forecast market movements and other factors. If the Fund incorrectly forecasts these and other factors, the Fund’s performance could suffer. The Fund’s use of derivatives could result in a loss exceeding the amount of the Fund’s investment in these instruments.
The Fund may invest up to 15% of its net assets in floating rate or adjustable rate senior loans, including bridge loans, novations, assignments, and participations, which are subject to increased credit and liquidity risks. Senior loans are business loans made to borrowers that may be U.S. or foreign corporations, partnerships or other business entities.
These factors can affect the Fund’s performance.
63
Notes to Financial Statements (continued)
| 13. | SUMMARY OF CAPITAL TRANSACTIONS |
Transactions in shares of beneficial interest were as follows:
| Year Ended December 31, 2013 | Year Ended December 31, 2012 | |||||||||||||||
| Class A Shares | Shares | Amount | Shares | Amount | ||||||||||||
| Shares sold | 107,365,729 | $ | 883,385,731 | 113,405,450 | $ | 901,531,118 | ||||||||||
| Converted from Class B* | 3,929,544 | 32,346,034 | 7,952,536 | 63,182,965 | ||||||||||||
| Reinvestment of distributions | 39,931,625 | 327,041,912 | 30,870,088 | 245,805,551 | ||||||||||||
| Shares reacquired | (160,172,218 | ) | (1,315,484,645 | ) | (125,783,061 | ) | (998,948,340 | ) | ||||||||
| Increase (decrease) | (8,945,320 | ) | $ | (72,710,968 | ) | 26,445,013 | $ | 211,571,294 | ||||||||
| Class B Shares | ||||||||||||||||
| Shares sold | 497,025 | $ | 4,103,667 | 728,928 | $ | 5,808,870 | ||||||||||
| Reinvestment of distributions | 1,294,051 | 10,637,684 | 1,459,038 | 11,647,331 | ||||||||||||
| Shares reacquired | (5,092,507 | ) | (41,999,327 | ) | (5,222,900 | ) | (41,627,628 | ) | ||||||||
| Converted to Class A* | (3,915,646 | ) | (32,346,034 | ) | (7,926,571 | ) | (63,182,965 | ) | ||||||||
| Decrease | (7,217,077 | ) | $ | (59,604,010 | ) | (10,961,505 | ) | $ | (87,354,392 | ) | ||||||
| Class C Shares | ||||||||||||||||
| Shares sold | 33,195,277 | $ | 274,014,272 | 43,431,158 | $ | 345,607,243 | ||||||||||
| Reinvestment of distributions | 12,940,571 | 106,216,574 | 9,698,893 | 77,422,450 | ||||||||||||
| Shares reacquired | (54,414,040 | ) | (448,073,380 | ) | (35,818,624 | ) | (285,600,334 | ) | ||||||||
| Increase (decrease) | (8,278,192 | ) | $ | (67,842,534 | ) | 17,311,427 | $ | 137,429,359 | ||||||||
| Class F Shares | ||||||||||||||||
| Shares sold | 53,642,855 | $ | 440,882,707 | 49,243,438 | $ | 390,285,417 | ||||||||||
| Reinvestment of distributions | 7,342,940 | 60,056,843 | 5,478,089 | 43,569,360 | ||||||||||||
| Shares reacquired | (52,422,568 | ) | (429,985,942 | ) | (37,026,612 | ) | (294,113,712 | ) | ||||||||
| Increase | 8,563,227 | $ | 70,953,608 | 17,694,915 | $ | 139,741,065 | ||||||||||
| Class I Shares | ||||||||||||||||
| Shares sold | 25,713,396 | $ | 209,677,696 | 19,113,668 | $ | 150,302,380 | ||||||||||
| Reinvestment of distributions | 1,964,578 | 16,006,256 | 1,273,862 | 10,102,393 | ||||||||||||
| Shares reacquired | (13,461,931 | ) | (109,388,366 | ) | (33,699,673 | ) | (262,212,677 | ) | ||||||||
| Increase (decrease) | 14,216,043 | $ | 116,295,586 | (13,312,143 | ) | $ | (101,807,904 | ) | ||||||||
| Class P Shares | ||||||||||||||||
| Shares sold | 1,880,168 | $ | 15,833,136 | 2,822,147 | $ | 22,863,521 | ||||||||||
| Reinvestment of distributions | 707,990 | 5,924,936 | 793,851 | 6,453,217 | ||||||||||||
| Shares reacquired | (5,121,847 | ) | (43,088,315 | ) | (5,608,703 | ) | (45,634,569 | ) | ||||||||
| Decrease | (2,533,689 | ) | $ | (21,330,243 | ) | (1,992,705 | ) | $ | (16,317,831 | ) | ||||||
| Class R2 Shares | ||||||||||||||||
| Shares sold | 281,354 | $ | 2,310,371 | 284,046 | $ | 2,249,955 | ||||||||||
| Reinvestment of distributions | 7,625 | 62,430 | 3,903 | 31,129 | ||||||||||||
| Shares reacquired | (189,212 | ) | (1,559,521 | ) | (179,073 | ) | (1,425,565 | ) | ||||||||
| Increase | 99,767 | $ | 813,280 | 108,876 | $ | 855,519 | ||||||||||
64
Notes to Financial Statements (concluded)
| Year Ended December 31, 2013 | Year Ended December 31, 2012 | |||||||||||||||
| Class R3 Shares | Shares | Amount | Shares | Amount | ||||||||||||
| Shares sold | 4,597,830 | $ | 37,760,641 | 4,155,103 | $ | 33,059,536 | ||||||||||
| Reinvestment of distributions | 678,776 | 5,549,483 | 419,876 | 3,340,265 | ||||||||||||
| Shares reacquired | (3,319,472 | ) | (27,261,805 | ) | (2,286,070 | ) | (18,167,001 | ) | ||||||||
| Increase | 1,957,134 | $ | 16,048,319 | 2,288,909 | $ | 18,232,800 | ||||||||||
| * | Automatic conversion of Class B shares occurs on the 25th day of the month (or, if the 25th day is not a business day, the next business day thereafter) following the eighth anniversary of the day on which the purchase order was accepted |
65
Report of Independent Registered Public Accounting Firm
To the Shareholders and Board of Directors of Lord Abbett Bond-Debenture Fund, Inc.:
We have audited the accompanying statement of assets and liabilities of Lord Abbett Bond-Debenture Fund, Inc. (the “Fund”), including the schedule of investments, as of December 31, 2013, and the related statement of operations for the year then ended, the statements of changes in net assets for each of the two years in the period then ended, and the financial highlights for each of the five years in the period then ended. These financial statements and financial highlights are the responsibility of the Fund’s management. Our responsibility is to express an opinion on these financial statements and financial highlights based on our audits.
We conducted our audits in accordance with the standards of the Public Company Accounting Oversight Board (United States). Those standards require that we plan and perform the audit to obtain reasonable assurance about whether the financial statements and financial highlights are free of material misstatement. The Fund is not required to have, nor were we engaged to perform, an audit of its internal control over financial reporting. Our audits included consideration of internal control over financial reporting as a basis for designing audit procedures that are appropriate in the circumstances, but not for the purpose of expressing an opinion on the effectiveness of the Fund’s internal control over financial reporting. Accordingly, we express no such opinion. An audit also includes examining, on a test basis, evidence supporting the amounts and disclosures in the financial statements, assessing the accounting principles used and significant estimates made by management, as well as evaluating the overall financial statement presentation. Our procedures included confirmation of securities owned as of December 31, 2013, by correspondence with the custodian, brokers and agent banks; where replies were not received from brokers and agent banks, we performed other auditing procedures. We believe that our audits provide a reasonable basis for our opinion.
In our opinion, such financial statements and financial highlights referred to above present fairly, in all material respects, the financial position of Lord Abbett Bond-Debenture Fund, Inc. as of December 31, 2013, the results of its operations for the year then ended, the changes in its net assets for each of the two years in the period then ended, and the financial highlights for each of the five years in the period then ended, in conformity with accounting principles generally accepted in the United States of America.
DELOITTE & TOUCHE LLP
New York, New York
February 27, 2014
66
Basic Information About Management
The Board is responsible for the management of the business and affairs of the Fund in accordance with the laws of the State of Maryland. The Board elects officers who are responsible for the day-to-day operations of the Fund and who execute policies authorized by the Board. The Board also approves an investment adviser to the Fund and continues to monitor the cost and quality of the services the investment adviser provides, and annually considers whether to renew the contract with the adviser. Generally, each Director holds office until his/her successor is elected and qualified or until his/her earlier resignation or removal, as provided in the Fund’s organizational documents.
Lord Abbett, a Delaware limited liability company, is the Fund’s investment adviser. Designated Lord Abbett personnel are responsible for the day-to-day management of the Fund.
Interested Director
Ms. Foster is affiliated with Lord Abbett and is an “interested person” of the Fund as defined in the Act. Ms. Foster is a director/trustee and officer of each of the 12 Lord Abbett-sponsored funds, which consist of 55 portfolios or series.
| Name, Address and Year of Birth | Current Position and Length of Service with the Fund | Principal Occupation and Other Directorships During the Past Five Years | ||
| Daria L. Foster Lord, Abbett & Co. LLC 90 Hudson Street Jersey City, NJ 07302 (1954) | Director and President since 2006; Chief Executive Officer since 2012 | Principal Occupation: Managing Partner of Lord Abbett (since 2007), and was formerly Director of Marketing and Client Service, joined Lord Abbett in 1990.
Other Directorships: None. |
Independent Directors
The following Independent Directors also are directors/trustees of each of the 12 Lord Abbett-sponsored funds, which consist of 55 portfolios or series.
| Name, Address and Year of Birth | Current Position and Length of Service with the Fund | Principal Occupation and Other Directorships During the Past Five Years | ||
| E. Thayer Bigelow Lord, Abbett & Co. LLC c/o Legal Dept. 90 Hudson Street Jersey City, NJ 07302 (1941) | Director since 1994; Chairman since 2013 | Principal Occupation: Managing General Partner, Bigelow Media, LLC (since 2000); Senior Adviser, Time Warner Inc. (1998 - 2000).
Other Directorships: Currently serves as director of Crane Co. (since 1984) and Huttig Building Products Inc. (since 1998). Previously served as a director of R.H. Donnelley Inc. (2009 - 2010). | ||
| Robert B. Calhoun, Jr. Lord, Abbett & Co. LLC c/o Legal Dept. 90 Hudson Street Jersey City, NJ 07302 (1942) | Director since 1998 | Principal Occupation: Senior Advisor of Monitor Clipper Partners, a private equity investment fund (since 1997); President of Clipper Asset Management Corp. (1991 - 2009).
Other Directorships: Previously served as a director of Interstate Bakeries Corp. (1991 - 2008). |
67
Basic Information About Management (continued)
| Name, Address and Year of Birth | Current Position and Length of Service with the Fund | Principal Occupation and Other Directorships During the Past Five Years | ||
| Evelyn E. Guernsey Lord, Abbett & Co. LLC c/o Legal Dept. 90 Hudson Street Jersey City, NJ 07302 (1955) | Director since 2011 | Principal Occupation: CEO, Americas of J.P. Morgan Asset Management (2004 - 2010).
Other Directorships: None. | ||
| Julie A. Hill Lord, Abbett & Co. LLC c/o Legal Dept. 90 Hudson Street Jersey City, NJ 07302 (1946) | Director since 2004 | Principal Occupation: Owner and CEO of The Hill Company, a business consulting firm (since 1998).
Other Directorships: Currently serves as director of WellPoint, Inc., a health benefits company (since 1994). Previously served as a director of Lend Lease Corporation Limited, an international retail and residential property group (2006 - 2012). | ||
| Franklin W. Hobbs Lord, Abbett & Co. LLC c/o Legal Dept. 90 Hudson Street Jersey City, NJ 07302 (1947) | Director since 2000 | Principal Occupation: Advisor of One Equity Partners, a private equity firm (since 2004).
Other Directorships: Currently serves as director and Chairman of the Board of Ally Financial Inc., a financial services firm (since 2009), and as director of Molson Coors Brewing Company (since 2002). | ||
| James M. McTaggart Lord, Abbett & Co. LLC c/o Legal Dept. 90 Hudson Street Jersey City, NJ 07302 (1947) | Director since 2012 | Principal Occupation: Independent management advisor and consultant (since 2012); Vice President, CRA International, Inc. (doing business as Charles River Associates), a global management consulting firm (2009 - 2012); Founder and Chairman of Marakon Associates, Inc., a strategy consulting firm (1978 - 2009); and Officer and Director of Trinsum Group, a holding company (2007 - 2009).
Other Directorships: Currently serves as director of Blyth, Inc., a home products company (since 2004). | ||
| James L.L. Tullis Lord, Abbett & Co. LLC c/o Legal Dept. 90 Hudson Street Jersey City, NJ 07302 (1947) | Director since 2006 | Principal Occupation: CEO of Tullis-Dickerson and Co. Inc., a venture capital management firm (since 1990); CEO of Tullis Health Investors Inc. (since 2012).
Other Directorships: Currently serves as director of Crane Co. (since 1998). Previously served as a director of Synageva BioPharma Corp., a biopharmaceutical company (2009 - 2011). |
Officers
None of the officers listed below have received compensation from the Fund. All of the officers of the Fund also may be officers of the other Lord Abbett-sponsored funds and maintain offices at 90 Hudson Street, Jersey City, NJ 07302. Unless otherwise indicated, the position(s) and title(s) listed under the “Principal Occupation During the Past Five Years” column indicate each officer’s position(s) and title(s) with Lord Abbett.
68
Basic Information About Management (continued)
| Name and Year of Birth | Current Position with the Fund | Length of Service of Current Position | Principal Occupation During the Past Five Years | |||
| Daria L. Foster (1954) | President and Chief Executive Officer | Elected as President in 2006 and Chief Executive Officer in 2012 | Managing Partner of Lord Abbett (since 2007), and was formerly Director of Marketing and Client Service, joined Lord Abbett in 1990. | |||
| Robert I. Gerber (1954) | Executive Vice President | Elected in 2007 | Partner and Chief Investment Officer (since 2007), joined Lord Abbett in 1997 as Director of Taxable Fixed Income Management. | |||
| Robert A. Lee (1969) | Executive Vice President | Elected in 2013 | Partner and Director of Taxable Fixed Income, joined Lord Abbett in 1997. | |||
| Christopher J. Towle (1957) | Executive Vice President | Elected in 1995 | Partner and Director, joined Lord Abbett in 1987. | |||
| Joan A. Binstock (1954) | Chief Financial Officer and Vice President | Elected in 1999 | Partner and Chief Financial and Operations Officer, joined Lord Abbett in 1999. | |||
| John K. Forst (1960) | Vice President and Assistant Secretary | Elected in 2005 | Partner and Deputy General Counsel, joined Lord Abbett in 2004. | |||
| Lawrence H. Kaplan (1957) | Vice President and Secretary | Elected in 1997 | Partner and General Counsel, joined Lord Abbett in 1997. | |||
| Joseph M. McGill (1962) | Chief Compliance Officer | Elected in 2014 | Chief Compliance Officer, joined Lord Abbett in 2014 and was formerly a Managing Director and Chief Compliance Officer at UBS Global Asset Management (2003 - 2013). | |||
| A. Edward Oberhaus, III (1959) | Vice President | Elected in 1996 | Partner and Director, joined Lord Abbett in 1983. | |||
| Thomas R. Phillips (1960) | Vice President and Assistant Secretary | Elected in 2008 | Partner and Deputy General Counsel, joined Lord Abbett in 2006. | |||
| Lawrence B. Stoller (1963) | Vice President and Assistant Secretary | Elected in 2007 | Partner and Senior Deputy General Counsel, joined Lord Abbett in 2007. |
69
Basic Information About Management (concluded)
| Name and Year of Birth | Current Position with the Fund | Length of Service of Current Position | Principal Occupation During the Past Five Years | |||
| Scott S. Wallner (1955) | AML Compliance Officer | Elected in 2011 | Assistant General Counsel, joined Lord Abbett in 2004. | |||
| Bernard J. Grzelak (1971) | Treasurer | Elected in 2003 | Partner and Director of Fund Administration, joined Lord Abbett in 2003. |
Please call 888-522-2388 for a copy of the statement of additional information, which contains further information about the Fund’s Directors. It is available free upon request.
70
Approval of Advisory Contract
The Board of Directors of the Fund, including all of the Directors who are not interested persons of the Fund Lord Abbett, annually considers whether to approve the continuation of the existing management agreement between the Fund and Lord Abbett. In connection with its most recent approval, the Board reviewed materials relating specifically to the management agreement, as well as numerous materials received throughout the course of the year, including information about the Fund’s investment performance compared to the performance of its benchmark. Before making its decision as to the Fund, the Board had the opportunity to ask questions and request further information, taking into account its familiarity with Lord Abbett gained through its meetings and discussions. These meetings and discussions included the examination of the portfolio management team conducted by members of the Contract Committee, the deliberations of the Contract Committee, and discussions between the Contract Committee and Lord Abbett’s management.
The materials received by the Board included, but were not limited to: (1) information provided by Morningstar Associates, LLC (“Morningstar”) regarding the investment performance of the Fund compared to the investment performance of a group of funds in the same Morningstar investment category (the “performance peer group”) and the investment performance of one or more appropriate benchmarks; (2) information provided by Morningstar regarding the expense ratios, contractual and effective management fee rates, and other expense components for the Fund and one or more groups of funds in the same Morningstar category, with the same share classes and operational characteristics, including asset size (the “expense peer group”); (3) certain supplemental investment performance information provided by Lord Abbett; (4) information provided by Lord Abbett on the projected expense ratios, management fee rates, and other expense components for the Fund; (5) sales and redemption information for the Fund; (6) information regarding Lord Abbett’s financial condition; (7) an analysis of the relative profitability of the management agreement to Lord Abbett; (8) information provided by Lord Abbett regarding the investment management fees Lord Abbett receives from its other advisory clients maintaining accounts with a similar investment strategy as the Fund; (9) information regarding the distribution arrangements of the Fund; and (10) information regarding the personnel and other resources devoted by Lord Abbett to managing the Fund.
Investment Management Services Generally. The Board considered the investment management services provided by Lord Abbett to the Fund, including investment research, portfolio management, and trading, and Lord Abbett’s commitment to compliance with all applicable legal requirements. The Board also observed that Lord Abbett was solely engaged in the investment management business and accordingly did not experience the conflicts of interest that may result from being engaged in other lines of business. The Board considered the investment advisory services provided by Lord Abbett to other clients, the fees charged for the services, and the differences in the nature of the services provided to the Fund and other Lord Abbett Funds, on the one hand, and the services provided to other clients, on the other.
Investment Performance. The Board reviewed the Fund’s investment performance in relation to that of the performance peer group as of various periods ended August 31, 2013. The Board observed that the Fund’s investment performance was above the median of the performance peer group for each of the periods. The Board also considered the performance of the Fund in comparison to a group of funds with similar investment strategies.
71
Approval of Advisory Contract (continued)
Lord Abbett’s Personnel and Methods. The Board considered the qualifications of the personnel providing investment management services to the Fund, in light of its investment objective and discipline. Among other things, the Board considered the size, experience, and turnover of Lord Abbett’s investment management staff, Lord Abbett’s investment methodology and philosophy, and Lord Abbett’s approach to recruiting, training, and retaining investment management personnel.
Nature and Quality of Other Services. The Board considered the nature, quality, costs, and extent of compliance, administrative, and other services performed by Lord Abbett and the Distributorand the nature and extent of Lord Abbett’s supervision of third party service providers, including the Fund’s transfer agent and custodian.
Expenses. The Board considered the expense level of the Fund and the expense levels of the expense peer group. It also considered the projected expense levels and how those levels would relate to those of the expense peer group and the amount and nature of the fees paid by shareholders. The Board observed that the overall expense level of the Fund was below the median of the expense peer group.
Profitability. The Board considered the level of Lord Abbett’s profits in managing the Fund, including a review of Lord Abbett’s methodology for allocating its costs to its management of the Fund. The Board concluded that the allocation methodology had a reasonable basis and was appropriate. It considered any profits realized by Lord Abbett in connection with the operation of the Fund, including the fee that Lord Abbett receives from the Fund for providing administrative services to the Fund, and whether the amount of profit was fair for the management of the Fund. The Board also considered the profits realized from other business segments of Lord Abbett, which may benefit from or be related to the Fund’s business. The Board considered Lord Abbett’s profit margins in comparison with available industry data, both accounting for and ignoring marketing and distribution expenses, and how those profit margins could affect Lord Abbett’s ability to recruit and retain investment personnel. The Board recognized that Lord Abbett’s profitability was a factor in enabling it to attract and retain qualified investment management personnel to provide services to the Fund. The Board concluded that Lord Abbett’s profitability as to the Fund was not excessive.
Economies of Scale. The Board considered whether there had been any economies of scale in managing the Fund, whether the Fund had appropriately benefited from any such economies of scale, and whether there was potential for realization of any further economies of scale. The Board concluded that the existing management fee schedule, with its breakpoint or breakpoints in the level of the management fee, adequately addressed any economies of scale in managing the Fund.
Other Benefits to Lord Abbett. The Board considered the character and amount of fees paid by the Fund and the Fund’s shareholders to Lord Abbett and the Distributor for services other than investment advisory services. The Board also considered the revenues and profitability of Lord Abbett’s investment advisory business apart from its mutual fund business, and the intangible benefits enjoyed by Lord Abbett by virtue of its relationship with the Fund. The Board observed that the Distributor receives 12b-1 fees from certain of the Lord Abbett Funds as to shares held in accounts for which there is no other broker of record, may retain a portion of the 12b-1 fees it receives, and receives a portion of the sales charges on sales and redemptions of some classes of shares. In addition, the Board observed that Lord Abbett accrues certain benefits for its business of providing investment advice to clients other than the Lord Abbett Funds, but that business also benefits the Funds. The Board also noted that Lord Abbett, as disclosed in the prospectus of the Fund, has entered into revenue sharing arrangements with certain entities that distribute shares of the Fund.
72
Approval of Advisory Contract (concluded)
Alternative Arrangements. The Board considered whether, instead of approving continuation of the management agreement, it might be in the best interests of the Fund to implement one or more alternative arrangements, such as continuing to employ Lord Abbett, but on different terms. After considering all of the relevant factors, the Board unanimously found that continuation of the existing management agreement was in the best interests of the Fund and its shareholders and voted unanimously to approve the continuation of the management agreement. In considering whether to approve the continuation of the management agreement, the Board did not identify any single factor as paramount or controlling. This summary does not discuss in detail all matters considered.
73
Householding
The Fund has adopted a policy that allows it to send only one copy of the Fund’s prospectus, proxy material, annual report and semiannual report to certain shareholders residing at the same “household.” This reduces Fund expenses, which benefits you and other shareholders. If you need additional copies or do not want your mailings to be “householded,” please call Lord Abbett at 888-522-2388 or send a written request with your name, the name of your fund or funds and your account number or numbers to Lord Abbett Family of Funds, P.O. Box 219336, Kansas City, MO 64121.
Proxy Voting Policies, Procedures and Records
A description of the policies and procedures that Lord Abbett uses to vote proxies related to the Fund’s portfolio securities, and information on how Lord Abbett voted the Fund’s proxies during the 12-month period ended June 30 are available without charge, upon request, (i) by calling 888-522-2388; (ii) on Lord Abbett’s Website at www.lordabbett.com; and (iii) on the Securities and Exchange Commission’s (“SEC”) Website at www.sec.gov.
Shareholder Reports and Quarterly Portfolio Disclosure
The Fund is required to file its complete schedule of portfolio holdings with the SEC for its first and third fiscal quarters on Form N-Q. Copies of the filings are available without charge, upon request on the SEC’s Website at www.sec.gov and may be available by calling Lord Abbett at 888-522-2388. You can also obtain copies of Form N-Q by visiting the SEC’s Public Reference Room in Washington, DC (information on the operation of the Public Reference Room may be obtained by calling 800-SEC-0330).
Tax Information
2% of the ordinary income distributions paid by the Fund during the year is qualified dividend income. For corporate shareholders, 2% of the Fund’s ordinary income distributions qualified for the dividends received deduction.
For foreign shareholders, 83% of the ordinary income distributions paid by the Fund during the fiscal year ended December 31, 2013 represents interest-related dividends.
Additionally, of the distributions paid to shareholders during the fiscal year ended December 31, 2013, $58,319,967 and $144,341,606, respectively, represent short-term capital gains and long-term capital gains.
74


This report, when not used for the general information of shareholders of the Fund, is to be distributed only if preceded or accompanied by a current fund prospectus.
Lord Abbett mutual fund shares are distributed by | Lord Abbett Bond-Debenture Fund, Inc. | LABD-2-1213 (2/14) |
| Item 2: | Code of Ethics. |
| (a) | In accordance with applicable requirements, the Registrant adopted a Sarbanes-Oxley Code of Ethics on June 19, 2003 that applies to the principal executive officer and senior financial officers of the Registrant (“Code of Ethics”). The Code of Ethics was in effect during the fiscal year ended December 31, 2013 (the “Period”). | |
| (b) | Not applicable. | |
| (c) | The Registrant has not amended the Code of Ethics as described in Form N-CSR during the Period. | |
| (d) | The Registrant has not granted any waiver, including an implicit waiver, from a provision of the Code of Ethics as described in Form N-CSR during the Period. | |
| (e) | Not applicable. | |
| (f) | See Item 12(a)(1) concerning the filing of the Code of Ethics. |
| Item 3: | Audit Committee Financial Expert. |
| The Registrant’s board of directors has determined that each of the following independent directors who are members of the audit committee is an audit committee financial expert: E. Thayer Bigelow and Robert B. Calhoun, Jr. Each of these persons is independent within the meaning of the Form N-CSR. |
| Item 4: | Principal Accountant Fees and Services. |
In response to sections (a), (b), (c) and (d) of Item 4, the aggregate fees billed to the Registrant for the fiscal years ended December 31, 2013 and 2012 by the Registrant’s principal accounting firm, Deloitte & Touche LLP, the member firms of Deloitte Touche Tohmatsu and their respective affiliates (collectively, “Deloitte”) were as follows:
| Fiscal year ended: | ||||||||
| 2013 | 2012 | |||||||
| Audit Fees {a} | $ | 75,500 | $ | 72,500 | ||||
| Audit-Related Fees | - 0 - | - 0 - | ||||||
| Total audit and audit-related fees | 75,500 | 72,500 | ||||||
| Tax Fees {b} | 11,996 | 11,682 | ||||||
| All Other Fees | - 0 - | - 0 - | ||||||
| Total Fees | $ | 87,496 | $ | 84,182 | ||||
{a} Consists of fees for audits of the Registrant’s annual financial statements.
{b} Fees for the fiscal year ended December 31, 2013 and 2012 consist of fees for preparing the U.S. Income Tax Return for Regulated Investment Companies, New Jersey Corporation Business Tax Return, New Jersey Annual Report Form, U.S. Return of Excise Tax on Undistributed Income of Investment Companies, IRS Forms 1099-MISC and 1096 Annual Summary and Transmittal of U.S. Information Returns.
(e) (1) Pursuant to Rule 2-01(c) (7) of Regulation S-X, the Registrant’s Audit Committee has adopted pre-approval policies and procedures. Such policies and procedures generally provide that the Audit Committee must pre-approve:
| · | any audit, audit-related, tax, and other services to be provided to the Lord Abbett Funds, including the Registrant, and | |
| · | any audit-related, tax, and other services to be provided to the Registrant’s investment adviser and any entity controlling, controlled by or under common control with the investment adviser that provides ongoing services to one or more Funds comprising the Registrant if the engagement relates directly to operations and financial reporting of a Fund, by the independent auditor to assure that the provision of such services does not impair the auditor’s independence. |
The Audit Committee has delegated pre-approval authority to its Chairman, subject to a fee limit of $10,000 per event, and not to exceed $25,000 annually. The Chairman will report any pre-approval decisions to the Audit Committee at its next scheduled meeting. Unless a type of service to be provided by the independent auditor has received general pre-approval, it must be pre-approved by the Audit Committee. Any proposed services exceeding pre-approved cost levels will require specific pre-approval by the Audit Committee.
(e) (2) The Registrant’s Audit Committee has approved 100% of the services described in this Item 4 (b) through (d).
(f) Not applicable.
(g) The aggregate non-audit fees billed by Deloitte for services rendered to the Registrant are shown above in the response to Item 4 (a), (b), (c) and (d) as “All Other Fees”.
The aggregate non-audit fees billed by Deloitte for services rendered to the Registrant’s investment adviser, Lord, Abbett & Co. LLC (“Lord Abbett”), for the fiscal years ended December 31, 2013 and 2012 were:
| Fiscal year ended: | ||||||||
| 2013 | 2012 | |||||||
| All Other Fees {a} | $ | 180,602 | $ | 194,431 | ||||
{a} Consist of fees for Independent Services Auditors’ Report on Controls Placed in Operation and Tests of Operating Effectiveness related to Lord Abbett’s Asset Management Services (“SOC-1 Report”).
The aggregate non-audit fees billed by Deloitte for services rendered to entities under the common control of Lord Abbett for the fiscal years ended December 31, 2013 and 2012 were:
| Fiscal year ended: | ||||||||
| 2013 | 2012 | |||||||
| All Other Fees | $ | - 0 - | $ | - 0 - | ||||
(h) The Registrant’s Audit Committee has considered the provision of non-audit services that were rendered to the Registrant’s investment adviser, and any entity controlling, controlled by or under common control with the investment adviser that provides ongoing services to the Registrant, that were not pre-approved pursuant to Rule 2-01 (c)(7)(ii) of Regulation S-X and has determined that the provision of such services is compatible with maintaining Deloitte’s independence.
| Item 5: | Audit Committee of Listed Registrants. |
| Not applicable. |
| Item 6: | Investments. |
| Not applicable. |
| Item 7: | Disclosure of Proxy Voting Policies and Procedures for Closed-End Management Investment Companies. |
| Not applicable. |
| Item 8: | Portfolio Managers of Closed-End Management Investment Companies. |
| Not applicable. |
| Item 9: | Purchases of Equity Securities by Closed-End Management Investment Company and Affiliated Purchasers. |
| Not applicable. |
| Item 10: | Submission of Matters to a Vote of Security Holders. |
| Not applicable. |
| Item 11: | Controls and Procedures. |
| (a) | Based on their evaluation of the Registrant’s disclosure controls and procedures (as defined in Rule 30a-3(c) under the Investment Company Act of 1940) as of a |
| date within 90 days prior to the filing date of this report, the Chief Executive Officer and Chief Financial Officer of the Registrant have concluded that such disclosure controls and procedures are reasonably designed and effective to ensure that material information relating to the Registrant, including its consolidated subsidiaries, is made known to them by others within those entities. | ||
| (b) | There were no changes in the Registrant’s internal control over financial reporting (as defined in Rule 30a-3(d) under the Investment Company Act of 1940) that occurred during the second fiscal quarter of the period covered by this report that have materially affected, or are reasonably likely to materially affect, the Registrant’s internal control over financial reporting. |
| Item 12: | Exhibits. |
| (a)(1) | The Lord Abbett Family of Funds Sarbanes Oxley Code of Ethics for the Principal Executive Officer and Senior Financial Officers is attached hereto as part of Ex-99. CODEETH. | |
| (a)(2) | Certification of each Principal Executive Officer and Principal Financial Officer of the Registrant as required by Rule 30a-2 under the Investment Company Act of 1940 is attached hereto as a part of EX-99.CERT. | |
| (b) | Certification of each Principal Executive Officer and Principal Financial Officer of the Registrant as required by Section 906 of the Sarbanes-Oxley Act of 2002 is provided as a part of EX-99.906CERT. |
SIGNATURES
Pursuant to the requirements of the Securities Exchange Act of 1934 and the Investment Company Act of 1940, the Registrant has duly caused this report to be signed on its behalf by the undersigned, thereunto duly authorized.
| LORD ABBETT BOND-DEBENTURE FUND, INC. |
| By: | /s/ Daria L. Foster | ||
| Daria L. Foster | |||
| President and Chief Executive Officer | |||
Date: February 26, 2014
| By: | /s/ Joan A. Binstock | ||
| Joan A. Binstock | |||
| Chief Financial Officer and Vice President | |||
Date: February 26, 2014
Pursuant to the requirements of the Securities Exchange Act of 1934 and the Investment Company Act of 1940, this report has been signed below by the following persons on behalf of the Registrant and in the capacities and on the dates indicated.
| By: | /s/ Daria L. Foster | ||
| Daria L. Foster | |||
| President and Chief Executive Officer | |||
Date: February 26, 2014
| By: | /s/ Joan A. Binstock | ||
| Joan A. Binstock | |||
| Chief Financial Officer and Vice President | |||
Date: February 26, 2014