UNITED STATES
SECURITIES AND EXCHANGE COMMISSION
Washington, D.C. 20549
FORM N-CSR
CERTIFIED SHAREHOLDER REPORT OF REGISTERED
MANAGEMENT INVESTMENT COMPANIES
Investment Company Act File Number: 811-02145
LORD ABBETT BOND-DEBENTURE FUND, INC.
(Exact name of Registrant as specified in charter)
90 Hudson Street, Jersey City, NJ 07302
(Address of principal executive offices) (Zip code)
Brooke A. Fapohunda, Esq., Vice President & Assistant Secretary
90 Hudson Street, Jersey City, NJ 07302
(Name and address of agent for service)
Registrant’s telephone number, including area code: (800) 201-6984
Date of fiscal year end: 12/31
Date of reporting period: 12/31/2015
| Item 1: | Report(s) to Shareholders. |
![]()
2015 LORD ABBETT
ANNUAL REPORT
Lord Abbett
Bond Debenture Fund
For the fiscal year ended December 31, 2015
Lord Abbett Bond Debenture Fund
Annual Report
For the fiscal year ended December 31, 2015
Daria L. Foster, Director, President and Chief Executive Officer of the Lord Abbett Funds, and E. Thayer Bigelow, Independent Chairman of the Lord Abbett Funds. | Dear Shareholders: We are pleased to provide you with this overview of the performance of Lord Abbett Bond Debenture Fund for the fiscal year ended December 31, 2015. On this page and the following pages, we discuss the major factors that influenced fiscal year performance. For detailed and more timely information about the Fund, please visit our website at www.lordabbett.com, where you also can access quarterly commentaries that provide updates on the Fund’s performance and other portfolio related updates. Thank you for investing in Lord Abbett mutual funds. We value the trust that you place in us and look forward to serving your investment needs in the years to come.
Best regards,
Daria L. Foster Director, President and Chief Executive Officer | |


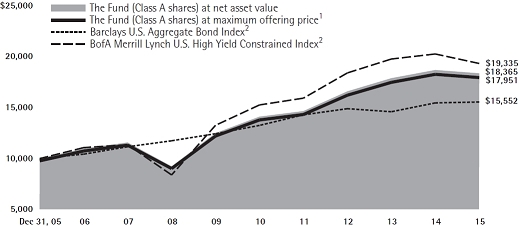
For the fiscal year ended December 31, 2015, the Fund returned -1.74%, reflecting performance at the net asset value (NAV) of Class A shares, with all distributions reinvested, compared to its benchmark, the Barclays U.S. Aggregate Bond Index1, which returned 0.55% over the same period.
The high yield sector of the U.S. fixed income market experienced negative returns during the 12-month period, underperforming traditional government related and investment grade securities within the fixed income market as well as the U.S. equity market. Leveraged loans also
experienced negative returns, although not to the same extent as high yield bonds. High yield corporate spreads versus Treasuries widened during the period.
As in its previous fiscal year, the Fund maintained a significant allocation to high yield bonds, as the Fund’s portfolio management team remained positive on the high yield market from a fundamental perspective, excluding certain segments of the energy sector. However, the Fund’s exposure to high yield bonds likely detracted from relative performance, as the high yield market underperformed
1
government related and investment-grade securities, which make up a significant portion of the Fund’s benchmark.
The Fund maintained a sizable allocation to equities throughout the period, as the Fund’s portfolio management team maintained its belief that equities provided portfolio diversification, a high degree of liquidity, and a more diverse opportunity set to express certain investment themes than did certain fixed income securities. The Fund’s allocation to equities was divided in roughly equal amounts between securities of large cap companies and mid cap companies. The Fund’s allocation to mid cap equities likely detracted from relative performance, as mid cap equities broadly underperformed the
Fund’s benchmark. Its allocation to large cap equities, conversely, was likely a contributor to relative performance, as large cap equities modestly outperformed the Fund’s benchmark.
Within the Fund’s investment-grade bond allocation, we maintained little to no exposure to U.S. Treasuries, which likely detracted from relative performance, as Treasuries outperformed corporates during the period and represent a sizable component of the Fund’s benchmark.
The Fund’s portfolio is actively managed and, therefore, its holdings and the weightings of a particular issuer or particular sector as a percentage of portfolio assets are subject to change. Sectors may include many industries.
1 The Barclays U.S. Aggregate Bond Index represents securities that are SEC-registered, taxable, and dollar-denominated. The index covers the U.S. investment-grade fixed-rate bond market, with index components for government and corporate securities, mortgage pass-through securities, and asset-backed securities. Total return comprises price appreciation/ depreciation and income as a percentage of the original investment.
Unless otherwise specified, indexes reflect total return, with all dividends reinvested. Indexes are unmanaged, do not reflect the deduction of fees or expenses, and are not available for direct investment.
Important Performance and Other Information
Performance data quoted in the following pages reflect past performance and are no guarantee of future results. Current performance may be higher or lower than the performance quoted. The investment return and principal value of an investment in the Fund will fluctuate so that shares, on any given day or when redeemed, may be worth more or less than their original cost. You can obtain performance data current to the most recent month end by calling Lord Abbett at 888-522-2388 or referring to www.lordabbett.com.
Except where noted, comparative Fund performance does not account for the deduction of sales charges
and would be different if sales charges were included. The Fund offers several classes of shares with distinct pricing options. For a full description of the differences in pricing alternatives, please see the Fund’s prospectus.
The annual commentary above discusses the views of the Fund’s management and various portfolio holdings of the Fund as of December 31, 2015. These views and portfolio holdings may have changed after this date. Information provided in the commentary is not a recommendation to buy or sell securities. Because the Fund’s portfolio is actively managed and may change significantly, the Fund may no longer own the securities described above or may have otherwise changed its positions in the securities. For more recent information about the Fund’s portfolio holdings, please visit www.lordabbett.com.
A Note about Risk: See Notes to Financial Statements for a discussion of investment risks. For a more detailed discussion of the risks associated with the Fund, please see the Fund’s prospectus.
Mutual funds are not insured by the FDIC, are not deposits or other obligations of, or guaranteed by, banks, and are subject to investment risks including possible loss of principal amount invested.
2
Below is a comparison of a $10,000 investment in Class A shares with the same investment in the Barclays U.S. Aggregate Bond Index and the BofA Merrill Lynch U.S. High Yield Constrained Index, assuming reinvestment of all dividends and distributions. The performance of other classes will be greater than or less than the performance shown in the graph below due to different sales loads and expenses applicable to such classes. The graph and performance table below do not reflect the deduction of taxes that a shareholder would pay on Fund distributions or the redemption of Fund shares. Past performance is no guarantee of future results.
| Average Annual Total Returns at Maximum Applicable Sales Charge for the Periods Ended December 31, 2015 | |||||||||
| 1 Year | 5 Years | 10 Years | Life of Class | ||||||
| Class A3 | -3.92% | 4.94% | 6.03% | – | |||||
| Class B4 | -7.05% | 4.40% | 5.73% | – | |||||
| Class C5 | -3.28% | 4.74% | 5.59% | – | |||||
| Class F6 | -1.53% | 5.62% | – | 5.91% | |||||
| Class I7 | -1.59% | 5.72% | 6.60% | – | |||||
| Class P7 | -1.66% | 5.43% | 6.23% | – | |||||
| Class R26 | -2.13% | 5.10% | – | 5.40% | |||||
| Class R36 | -1.91% | 5.21% | – | 5.52% | |||||
| Class R48 | – | – | – | -4.59% | * | ||||
| Class R58 | – | – | – | -4.50% | * | ||||
| Class R68 | – | – | – | -4.36% | * | ||||
1 Reflects the deduction of the maximum initial sales charge of 2.25%.
2 Performance of each unmanaged index does not reflect any fees or expenses. The performance of each index is not necessarily representative of the Fund’s performance.
3 Total return, which is the percentage change in net asset value, after deduction of the maximum initial sales charge of 2.25% applicable to Class A shares, with all dividends and distributions reinvested for the periods shown ended December 31, 2015 is calculated using the SEC-required uniform method to compute such return.
4 Performance reflects the deduction of a CDSC of 5% for 1 year, 2% for 5 years and 0% for 10 years. Class B shares automatically convert to Class A shares after approximately
8 years. (There is no initial sales charge for automatic conversions.) All returns for periods greater than 8 years reflect this conversion.
5 The 1% CDSC for Class C shares normally applies before the first anniversary of the purchase date. Performance for other periods is at net asset value.
6 Commenced operations on September 7, 2007 and performance for the Class began on September 28, 2007. Performance is at net asset value.
7 Performance is at net asset value.
8 Commenced operations and performance for the class began on June 30, 2015. Performance is at net asset value.
* Since share Class has existed for less than one year, average annual returns are not provided.
3
Expense Example
As a shareholder of the Fund, you incur two types of costs: (1) transaction costs, including sales charges (loads) on purchase payments (these charges vary among the share classes); and (2) ongoing costs, including management fees; distribution and service (12b-1) fees (these charges vary among the share classes); and other Fund expenses. This Example is intended to help you understand your ongoing costs (in dollars) of investing in the Fund and to compare these costs with the ongoing costs of investing in other mutual funds.
The Example is based on an investment of $1,000 invested at the beginning of the period and held for the entire period (July 1, 2015 through December 31, 2015).
Actual Expenses
For each class of the Fund, the first line of the table on the following page provides information about actual account values and actual expenses. You may use the information in this line, together with the amount you invested, to estimate the expenses that you paid over the period. Simply divide your account value by $1,000 (for example, an $8,600 account value divided by $1,000 = 8.6), then multiply the result by the number in the first line under the heading titled “Expenses Paid During Period 7/1/15 – 12/31/15” to estimate the expenses you paid on your account during this period.
Hypothetical Example for Comparison Purposes
For each class of the Fund, the second line of the table on the following page provides information about hypothetical account values and hypothetical expenses based on the Fund’s actual expense ratio and an assumed rate of return of 5% per year before expenses, which is not the Fund’s actual return. The hypothetical account values and expenses may not be used to estimate the actual ending account balance or expenses you paid for the period. You may use this information to compare the ongoing costs of investing in the Fund and other funds. To do so, compare this 5% hypothetical example with the 5% hypothetical examples that appear in the shareholder reports of the other funds.
4
Please note that the expenses shown in the table are meant to highlight your ongoing costs only and do not reflect any transactional costs, such as sales charges (loads). Therefore, the second line of the table is useful in comparing ongoing costs only, and will not help you determine the relative total costs of owning different funds. In addition, if these transactional costs were included, your costs would have been higher.
| Beginning Account Value | Ending Account Value | Expenses Paid During Period† | |||||||
| 7/1/15 | 12/31/15 | 7/1/15 - 12/31/15 | |||||||
| Class A | |||||||||
| Actual | $1,000.00 | $ | 954.30 | $4.14 | |||||
| Hypothetical (5% Return Before Expenses) | $1,000.00 | $ | 1,020.97 | $4.28 | |||||
| Class B | |||||||||
| Actual | $1,000.00 | $ | 950.80 | $8.06 | |||||
| Hypothetical (5% Return Before Expenses) | $1,000.00 | $ | 1,016.94 | $8.34 | |||||
| Class C | |||||||||
| Actual | $1,000.00 | $ | 951.50 | $7.23 | |||||
| Hypothetical (5% Return Before Expenses) | $1,000.00 | $ | 1,017.80 | $7.48 | |||||
| Class F | |||||||||
| Actual | $1,000.00 | $ | 954.70 | $3.65 | |||||
| Hypothetical (5% Return Before Expenses) | $1,000.00 | $ | 1,021.48 | $3.77 | |||||
| Class I | |||||||||
| Actual | $1,000.00 | $ | 955.00 | $3.10 | |||||
| Hypothetical (5% Return Before Expenses) | $1,000.00 | $ | 1,022.03 | $3.21 | |||||
| Class P | |||||||||
| Actual | $1,000.00 | $ | 954.40 | $4.38 | |||||
| Hypothetical (5% Return Before Expenses) | $1,000.00 | $ | 1,020.72 | $4.53 | |||||
| Class R2 | |||||||||
| Actual | $1,000.00 | $ | 952.40 | $6.10 | |||||
| Hypothetical (5% Return Before Expenses) | $1,000.00 | $ | 1,018.95 | $6.31 | |||||
| Class R3 | |||||||||
| Actual | $1,000.00 | $ | 952.80 | $5.56 | |||||
| Hypothetical (5% Return Before Expenses) | $1,000.00 | $ | 1,019.51 | $5.75 | |||||
| Class R4 | |||||||||
| Actual | $1,000.00 | $ | 954.10 | $4.29 | |||||
| Hypothetical (5% Return Before Expenses) | $1,000.00 | $ | 1,020.82 | $4.43 | |||||
| Class R5 | |||||||||
| Actual | $1,000.00 | $ | 955.00 | $3.06 | |||||
| Hypothetical (5% Return Before Expenses) | $1,000.00 | $ | 1,022.08 | $3.16 | |||||
| Class R6 | |||||||||
| Actual | $1,000.00 | $ | 956.40 | $2.66 | |||||
| Hypothetical (5% Return Before Expenses) | $1,000.00 | $ | 1,022.48 | $2.75 | |||||
| † | For each class of the Fund, net expenses are equal to the annualized expense ratio for such class (0.84% for Class A, 1.64% for Class B, 1.47% for Class C, 0.74% for Class F, 0.63% for Class I, 0.89% for Class P, 1.24% for Class R2, 1.13% for Class R3, 0.87% for Class R4, 0.62% for Class R5 and 0.54% for Class R6) multiplied by the average account value over the period, multiplied by 184/365 (to reflect one-half year period). |
5
Portfolio Holdings Presented by Sector
December 31, 2015
| Sector* | %** | |
| Asset Backed | 0.61 | % |
| Automotive | 1.21 | % |
| Banking | 8.37 | % |
| Basic Industry | 7.03 | % |
| Capital Goods | 5.65 | % |
| Consumer Goods | 6.20 | % |
| Energy | 10.11 | % |
| Financial Services | 3.37 | % |
| Foreign Government | 2.32 | % |
| Healthcare | 8.82 | % |
| Insurance | 1.64 | % |
| Leisure | 5.01 | % |
| Sector* | %** | |
| Media | 6.09 | % |
| Mortgage Backed | 4.58 | % |
| Municipal | 0.18 | % |
| Real Estate | 2.11 | % |
| Retail | 6.51 | % |
| Services | 2.14 | % |
| Technology & Electronics | 7.69 | % |
| Telecommunications | 5.78 | % |
| Transportation | 1.54 | % |
| Utility | 1.77 | % |
| Repurchase Agreement | 1.27 | % |
| Total | 100.00 | % |
| * | A sector may comprise several industries. |
| ** | Represents percent of total investments. |
6
December 31, 2015
| Principal | ||||||||||||
| Interest | Maturity | Amount | Fair | |||||||||
| Investments | Rate | Date | (000) | Value | ||||||||
| LONG-TERM INVESTMENTS 97.60% | ||||||||||||
| ASSET-BACKED SECURITIES 0.60% | ||||||||||||
| Other | ||||||||||||
| Guggenheim 5180-2 CLO LP 2015-1A A2B† | 2.914% | # | 11/25/2027 | $ | 22,500 | $ | 22,209,208 | |||||
| JFIN CLO II Ltd. 2015-2A B1† | 2.915% | # | 10/19/2026 | 13,500 | 13,509,237 | |||||||
| NorthStar Real Estate CDO VIII Ltd. 2006-8A A2† | 0.604% | # | 2/1/2041 | 4,700 | 4,443,810 | |||||||
| OZLM VIII Ltd. 2014-8A A2A† | 2.439% | # | 10/17/2026 | 11,750 | 11,589,175 | |||||||
| Total Asset-Backed Securities (cost $51,149,214) | 51,751,430 | |||||||||||
| Shares | ||||||||||||
| (000) | ||||||||||||
| COMMON STOCKS 13.45% | ||||||||||||
| Aerospace/Defense 0.30% | ||||||||||||
| General Dynamics Corp. | 62 | 8,449,975 | ||||||||||
| Orbital ATK, Inc. | 96 | 8,537,777 | ||||||||||
| Raytheon Co. | 68 | 8,435,662 | ||||||||||
| Total | 25,423,414 | |||||||||||
| Air Transportation 0.20% | ||||||||||||
| Alaska Air Group, Inc. | 102 | 8,226,190 | ||||||||||
| Southwest Airlines Co. | 204 | 8,798,665 | ||||||||||
| Total | 17,024,855 | |||||||||||
| Auto Parts & Equipment 0.31% | ||||||||||||
| Chassix Holdings, Inc.* | 629 | 17,372,672 | ||||||||||
| Drew Industries, Inc. | 147 | 8,950,830 | ||||||||||
| Total | 26,323,502 | |||||||||||
| Banking 0.61% | ||||||||||||
| Bank of the Ozarks, Inc. | 170 | 8,403,650 | ||||||||||
| BankUnited, Inc. | 242 | 8,720,281 | ||||||||||
| First Republic Bank | 135 | 8,931,180 | ||||||||||
| Signature Bank* | 57 | 8,779,359 | ||||||||||
| Synovus Financial Corp. | 272 | 8,820,312 | ||||||||||
| Western Alliance Bancorp* | 237 | 8,506,566 | ||||||||||
| Total | 52,161,348 | |||||||||||
| See Notes to Financial Statements. | 7 |
Schedule of Investments (continued)
December 31, 2015
| Shares | Fair | |||||||
| Investments | (000) | Value | ||||||
| Beverages 0.61% | ||||||||
| Amplify Snack Brands, Inc.* | 375 | $ | 4,322,638 | |||||
| Brown-Forman Corp. Class B | 90 | 8,933,314 | ||||||
| Constellation Brands, Inc. Class A | 90 | 12,885,265 | ||||||
| Dr. Pepper Snapple Group, Inc. | 96 | 8,908,149 | ||||||
| Fomento Economico Mexicano SAB de CV ADR | 93 | 8,564,631 | ||||||
| Monster Beverage Corp.* | 57 | 8,420,709 | ||||||
| Total | 52,034,706 | |||||||
| Brokerage 0.15% | ||||||||
| CBOE Holdings, Inc. | 131 | 8,517,800 | ||||||
| E*TRADE Financial Corp.* | 151 | 4,472,943 | ||||||
| Total | 12,990,743 | |||||||
| Building & Construction 0.10% | ||||||||
| Granite Construction, Inc. | 205 | 8,795,091 | ||||||
| Building Materials 0.58% | ||||||||
| Advanced Drainage Systems, Inc. | 89 | 2,131,341 | ||||||
| Beacon Roofing Supply, Inc.* | 250 | 10,281,864 | ||||||
| Fortune Brands Home & Security, Inc. | 153 | 8,512,201 | ||||||
| Martin Marietta Materials, Inc. | 56 | 7,690,410 | ||||||
| Masco Corp. | 157 | 4,448,760 | ||||||
| Summit Materials, Inc. Class A* | 436 | 8,729,705 | ||||||
| Vulcan Materials Co. | 87 | 8,305,506 | ||||||
| Total | 50,099,787 | |||||||
| Chemicals 0.50% | ||||||||
| Chemtura Corp.* | 298 | 8,129,078 | ||||||
| Ecolab, Inc. | 75 | 8,581,588 | ||||||
| International Flavors & Fragrances, Inc. | 37 | 4,447,617 | ||||||
| Scotts Miracle-Gro Co. (The) Class A | 130 | 8,393,396 | ||||||
| Trinseo SA* | 481 | 13,560,534 | ||||||
| Total | 43,112,213 | |||||||
| Discount Stores 0.22% | ||||||||
| Amazon.com, Inc.* | 27 | 18,426,113 | ||||||
| 8 | See Notes to Financial Statements. |
Schedule of Investments (continued)
December 31, 2015
| Shares | Fair | |||||||
| Investments | (000) | Value | ||||||
| Diversified Capital Goods 0.25% | ||||||||
| A.O. Smith Corp. | 114 | $ | 8,749,858 | |||||
| Acuity Brands, Inc. | 36 | 8,527,154 | ||||||
| Danaher Corp. | 47 | 4,354,864 | ||||||
| Total | 21,631,876 | |||||||
| Electronics 0.10% | ||||||||
| Fitbit, Inc. Class A* | 296 | 8,752,633 | ||||||
| Energy: Exploration & Production 0.41% | ||||||||
| Concho Resources, Inc.* | 95 | 8,846,308 | ||||||
| Diamondback Energy, Inc.* | 132 | 8,815,212 | ||||||
| OGX Petroleo e Gas SA ADR* | 315 | 477,431 | ||||||
| Parsley Energy, Inc. Class A* | 489 | 9,030,592 | ||||||
| Seven Generations Energy Ltd. Class A*(a) | CAD | 788 | 7,675,105 | |||||
| Total | 34,844,648 | |||||||
| Food & Drug Retailers 0.39% | ||||||||
| Alimentation Couche-Tard, Inc. Class B(a) | CAD | 158 | 6,933,140 | |||||
| Casey’s General Stores, Inc. | 97 | 11,641,252 | ||||||
| Kroger Co. (The) | 106 | 4,442,472 | ||||||
| Sprouts Farmers Market, Inc.* | 392 | 10,419,105 | ||||||
| Total | 33,435,969 | |||||||
| Food: Wholesale 0.41% | ||||||||
| B&G Foods, Inc. | 239 | 8,353,391 | ||||||
| Blue Buffalo Pet Products, Inc.* | 485 | 9,080,281 | ||||||
| Core-Mark Holding Co., Inc. | 104 | 8,492,343 | ||||||
| Ingredion, Inc. | 92 | 8,831,848 | ||||||
| Total | 34,757,863 | |||||||
| Gaming 0.53% | ||||||||
| Boyd Gaming Corp.* | 681 | 13,528,311 | ||||||
| Churchill Downs, Inc. | 31 | 4,374,305 | ||||||
| Isle of Capri Casinos, Inc.* | 349 | 4,866,069 | ||||||
| MGM Resorts International* | 392 | 8,914,169 | ||||||
| Wynn Resorts Ltd. | 201 | 13,895,013 | ||||||
| Total | 45,577,867 | |||||||
| Health Facilities 0.09% | ||||||||
| Acadia Healthcare Co., Inc.* | 125 | 7,782,141 | ||||||
| See Notes to Financial Statements. | 9 |
Schedule of Investments (continued)
December 31, 2015
| Shares | Fair | |||||||
| Investments | (000) | Value | ||||||
| Insurance-Reinsurance 0.11% | ||||||||
| Aspen Insurance Holdings Ltd. | 185 | $ | 8,958,056 | |||||
| Investments & Miscellaneous Financial Services 0.15% | ||||||||
| Intercontinental Exchange, Inc. | 34 | 8,684,139 | ||||||
| Public Storage | 17 | 4,292,145 | ||||||
| Total | 12,976,284 | |||||||
| Machinery 0.26% | ||||||||
| Graco, Inc. | 63 | 4,567,508 | ||||||
| Roper Technologies, Inc. | 47 | 8,889,384 | ||||||
| Toro Co. (The) | 121 | 8,817,796 | ||||||
| Total | 22,274,688 | |||||||
| Media: Content 0.35% | ||||||||
| ION Media Networks, Inc.* | 4 | 1,135,895 | ||||||
| Netflix, Inc.* | 176 | 20,144,606 | ||||||
| Starz Class A* | 257 | 8,603,537 | ||||||
| Total | 29,884,038 | |||||||
| Medical Products 0.37% | ||||||||
| C.R. Bard, Inc. | 47 | 8,848,742 | ||||||
| Edwards Lifesciences Corp.* | 169 | 13,359,151 | ||||||
| STERIS plc (United Kingdom)(b) | 124 | 9,340,955 | ||||||
| Total | 31,548,848 | |||||||
| Metals/Mining (Excluding Steel) 0.00% | ||||||||
| Mirabela Nickel Ltd.*(a) | AUD | 31,268 | 227,849 | |||||
| Multi-Line Insurance 0.10% | ||||||||
| Hanover Insurance Group, Inc. (The) | 110 | 8,922,347 | ||||||
| Non-Electric Utilities 0.20% | ||||||||
| American Water Works Co., Inc. | 142 | 8,513,001 | ||||||
| Aqua America, Inc. | 298 | 8,885,287 | ||||||
| Total | 17,398,288 | |||||||
| Packaging 0.15% | ||||||||
| AptarGroup, Inc. | 61 | 4,425,838 | ||||||
| Berry Plastics Group, Inc.* | 240 | 8,701,181 | ||||||
| Total | 13,127,019 | |||||||
| 10 | See Notes to Financial Statements. |
Schedule of Investments (continued)
December 31, 2015
| Shares | Fair | |||||||
| Investments | (000) | Value | ||||||
| Personal & Household Products 0.31% | ||||||||
| Clorox Co. (The) | 68 | $ | 8,564,069 | |||||
| Estee Lauder Cos., Inc. (The) Class A | 53 | 4,679,949 | ||||||
| Pool Corp. | 105 | 8,518,574 | ||||||
| Shiseido Co., Ltd.(a) | JPY | 209 | 4,335,863 | |||||
| Total | 26,098,455 | |||||||
| Pharmaceuticals 0.50% | ||||||||
| Alexion Pharmaceuticals, Inc.* | 46 | 8,696,674 | ||||||
| Eli Lilly & Co. | 101 | 8,497,705 | ||||||
| Regeneron Pharmaceuticals, Inc.* | 23 | 12,235,747 | ||||||
| Vertex Pharmaceuticals, Inc.* | 70 | 8,769,974 | ||||||
| Zoetis, Inc. | 95 | 4,561,792 | ||||||
| Total | 42,761,892 | |||||||
| Property & Casualty 0.10% | ||||||||
| Argo Group International Holdings Ltd. | 148 | 8,865,116 | ||||||
| Real Estate Investment Trusts 0.49% | ||||||||
| CubeSmart | 286 | 8,759,739 | ||||||
| Extra Space Storage, Inc. | 98 | 8,626,232 | ||||||
| InfraREIT, Inc.* | 575 | 10,638,629 | ||||||
| National Storage Affiliates Trust | 295 | 5,048,108 | ||||||
| QTS Realty Trust, Inc. Class A | 192 | 8,657,150 | ||||||
| Total | 41,729,858 | |||||||
| Recreation & Travel 0.37% | ||||||||
| Royal Caribbean Cruises Ltd. | 92 | 9,343,302 | ||||||
| Six Flags Entertainment Corp. | 240 | 13,178,842 | ||||||
| Vail Resorts, Inc. | 69 | 8,873,035 | ||||||
| Total | 31,395,179 | |||||||
| Restaurants 0.58% | ||||||||
| McDonald’s Corp. | 76 | 8,969,189 | ||||||
| Restaurant Brands International, Inc. (Canada)(b) | 249 | 9,301,594 | ||||||
| Shake Shack, Inc. Class A* | 233 | 9,228,067 | ||||||
| Starbucks Corp. | 299 | 17,941,947 | ||||||
| Wendy’s Co. (The) | 433 | 4,667,244 | ||||||
| Total | 50,108,041 | |||||||
| See Notes to Financial Statements. | 11 |
Schedule of Investments (continued)
December 31, 2015
| Shares | Fair | |||||||
| Investments | (000) | Value | ||||||
| Software/Services 1.48% | ||||||||
| Accenture plc Class A (Ireland)(b) | 44 | $ | 4,582,429 | |||||
| Alibaba Group Holding Ltd. ADR* | 103 | 8,381,700 | ||||||
| Alphabet, Inc. Class C* | 17 | 12,872,123 | ||||||
| Arista Networks, Inc.* | 115 | 8,959,073 | ||||||
| Booz Allen Hamilton Holding Corp. | 150 | 4,618,831 | ||||||
| Facebook, Inc. Class A* | 171 | 17,886,080 | ||||||
| First Data Corp. Class A* | 792 | 12,688,545 | ||||||
| LinkedIn Corp. Class A* | 38 | 8,463,908 | ||||||
| MasterCard, Inc. Class A | 94 | 9,110,462 | ||||||
| PayPal Holdings, Inc.* | 243 | 8,811,225 | ||||||
| Proofpoint, Inc.* | 127 | 8,251,784 | ||||||
| ServiceNow, Inc.* | 103 | 8,873,612 | ||||||
| SS&C Technologies Holdings, Inc. | 128 | 8,748,391 | ||||||
| Tableau Software, Inc. Class A* | 53 | 5,013,917 | ||||||
| Total | 127,262,080 | |||||||
| Specialty Retail 0.71% | ||||||||
| Home Depot, Inc. (The) | 100 | 13,278,164 | ||||||
| Moncler SpA(a) | EUR | 587 | 8,166,713 | |||||
| Murphy USA, Inc.* | 192 | 11,683,218 | ||||||
| NIKE, Inc. Class B | 235 | 14,695,875 | ||||||
| Tile Shop Holdings, Inc.* | 545 | 8,939,197 | ||||||
| Wayfair, Inc. Class A* | 89 | 4,238,180 | ||||||
| Total | 61,001,347 | |||||||
| Support: Services 0.55% | ||||||||
| Bright Horizons Family Solutions, Inc.* | 141 | 9,430,824 | ||||||
| Cintas Corp. | 50 | 4,520,450 | ||||||
| Equifax, Inc. | 82 | 9,159,960 | ||||||
| Korn/Ferry International | 123 | 4,082,533 | ||||||
| Leidos Holdings, Inc. | 190 | 10,667,065 | ||||||
| TripAdvisor, Inc.* | 109 | 9,251,586 | ||||||
| Total | 47,112,418 | |||||||
| Technology Hardware & Equipment 0.25% | ||||||||
| Cavium, Inc.* | 70 | 4,594,246 | ||||||
| Ingram Micro, Inc. Class A | 280 | 8,513,023 | ||||||
| NVIDIA Corp. | 260 | 8,575,434 | ||||||
| Total | 21,682,703 | |||||||
| 12 | See Notes to Financial Statements. |
Schedule of Investments (continued)
December 31, 2015
| Shares | Fair | |||||||
| Investments | (000) | Value | ||||||
| Telecommunications: Wireless 0.10% | ||||||||
| T-Mobile US, Inc.* | 227 | $ | 8,898,744 | |||||
| Telecommunications: Wireline Integrated & Services 0.15% | ||||||||
| Dycom Industries, Inc.* | 120 | 8,399,398 | ||||||
| Equinix, Inc. | 15 | 4,681,454 | ||||||
| Total | 13,080,852 | |||||||
| Theaters & Entertainment 0.10% | ||||||||
| Activision Blizzard, Inc. | 222 | 8,583,517 | ||||||
| Tobacco 0.21% | ||||||||
| Altria Group, Inc. | 157 | 9,111,728 | ||||||
| Reynolds American, Inc. | 194 | 8,944,516 | ||||||
| Total | 18,056,244 | |||||||
| Trucking & Delivery 0.10% | ||||||||
| AMERCO | 23 | 8,880,990 | ||||||
| Total Common Stocks (cost $1,137,693,977) | 1,154,009,622 | |||||||
| Principal | ||||||||||||
| Interest | Maturity | Amount | ||||||||||
| Rate | Date | (000) | ||||||||||
| CONVERTIBLE BONDS 0.75% | ||||||||||||
| Automakers 0.11% | ||||||||||||
| Tesla Motors, Inc. | 1.25% | 3/1/2021 | $ | 10,156 | 9,356,215 | |||||||
| Electronics 0.10% | ||||||||||||
| Novellus Systems, Inc. | 2.625% | 5/15/2041 | 3,774 | 8,899,564 | ||||||||
| Energy: Exploration & Production 0.01% | ||||||||||||
| Oleo e Gas Participacoes SA(a)(c) | 10.00% | 6/1/2016 | BRL | 254 | 444,545 | |||||||
| Oleo e Gas Participacoes SA(a)(c) | 10.00% | 6/1/2016 | BRL | 201 | 352,238 | |||||||
| Total | 796,783 | |||||||||||
| Pharmaceuticals 0.11% | ||||||||||||
| Incyte Corp. Ltd. | 0.375% | 11/15/2018 | $ | 4,418 | 9,534,596 | |||||||
| See Notes to Financial Statements. | 13 |
Schedule of Investments (continued)
December 31, 2015
| Principal | ||||||||||||
| Interest | Maturity | Amount | Fair | |||||||||
| Investments | Rate | Date | (000) | Value | ||||||||
| Software/Services 0.42% | ||||||||||||
| Red Hat, Inc. | 0.25% | 10/1/2019 | $ | 7,230 | $ | 9,448,706 | ||||||
| salesforce.com, Inc. | 0.25% | 4/1/2018 | 6,942 | 8,946,503 | ||||||||
| Twitter, Inc. | 1.00% | 9/15/2021 | 10,347 | 8,697,947 | ||||||||
| Workday, Inc. | 1.50% | 7/15/2020 | 7,200 | 8,577,000 | ||||||||
| Total | 35,670,156 | |||||||||||
| Total Convertible Bonds (cost $66,140,210) | 64,257,314 | |||||||||||
| Dividend | Shares | |||||||||||
| Rate | (000) | |||||||||||
| CONVERTIBLE PREFERRED STOCKS 0.37% | ||||||||||||
| Building & Construction 0.11% | ||||||||||||
| William Lyon Homes, Inc. Unit | 6.50% | 106 | 9,387,360 | |||||||||
| Food: Wholesale 0.11% | ||||||||||||
| Post Holdings, Inc. | 5.25% | 77 | 9,075,537 | |||||||||
| Gas Distribution 0.15% | ||||||||||||
| Kinder Morgan, Inc. | 9.75% | 321 | 12,930,255 | |||||||||
| Total Convertible Preferred Stocks (cost $34,208,096) | 31,393,152 | |||||||||||
| Principal | ||||||||||||
| Interest | Maturity | Amount | ||||||||||
| Rate | Date | (000) | ||||||||||
| FLOATING RATE LOANS(d) 2.21% | ||||||||||||
| Auto Parts & Equipment 0.09% | ||||||||||||
| Chassix, Inc. Initial Term Loan | 12.00% | 7/29/2019 | $ | 8,138 | 8,137,590 | |||||||
| Consumer/Commercial/Lease Financing 0.10% | ||||||||||||
| AWAS Finance Luxembourg 2012 SA Term Loan (Luxembourg)(b) | 3.50% | 7/16/2018 | 8,560 | 8,551,710 | ||||||||
| Electronics 0.28% | ||||||||||||
| Avago Technologies Term Loan B | 4.25% | 2/1/2023 | 17,516 | 17,364,136 | ||||||||
| NXP B.V. Tranche D Term Loan (Netherlands)(b) | 3.25% | 1/11/2020 | 7,026 | 6,957,970 | ||||||||
| Total | 24,322,106 | |||||||||||
| 14 | See Notes to Financial Statements. |
Schedule of Investments (continued)
December 31, 2015
| Principal | ||||||||||||
| Interest | Maturity | Amount | Fair | |||||||||
| Investments | Rate | Date | (000) | Value | ||||||||
| Energy: Exploration & Production 0.11% | ||||||||||||
| Chief Exploration & Development LLC 2nd Lien Term Loan | 7.50% | 5/16/2021 | $ | 10,111 | $ | 6,909,126 | ||||||
| Templar Energy LLC 2nd Lien New Term Loan | 8.50% | 11/25/2020 | 17,180 | 2,083,075 | ||||||||
| Total | 8,992,201 | |||||||||||
| Gaming 0.28% | ||||||||||||
| Caesar’s Entertainment Resort Properties LLC Term Loan B | 7.00% | 10/11/2020 | 9,551 | 8,720,972 | ||||||||
| Cowlitz Tribal Gaming Authority Term Loan B | 11.50% | 12/6/2021 | 16,050 | 15,167,250 | ||||||||
| Total | 23,888,222 | |||||||||||
| Health Facilities 0.16% | ||||||||||||
| CHG Healthcare Services, Inc. 1st Lien Term Loan | 4.25% | 11/19/2019 | 13,870 | 13,661,723 | ||||||||
| Metals/Mining (Excluding Steel) 0.19% | ||||||||||||
| FMG Resources Pty Ltd. Term Loan (Australia)(b) | 4.25% | 6/30/2019 | 22,149 | 16,535,016 | ||||||||
| Packaging 0.14% | ||||||||||||
| Crown Holdings, Inc. Delayed Draw Term Loan A | 2.174% | 12/19/2018 | 12,059 | 12,051,523 | ||||||||
| Personal & Household Products 0.11% | ||||||||||||
| Britax US Holdings, Inc. Initial Dollar Term Loan | 4.50% | 10/15/2020 | 13,581 | 9,658,070 | ||||||||
| Pharmaceuticals 0.10% | ||||||||||||
| RPI Finance Trust Term Loan B4 | 3.50% | 11/9/2020 | 8,662 | 8,643,005 | ||||||||
| Recreation & Travel 0.10% | ||||||||||||
| Delta 2 (Lux) S.A.R.L. 2nd Lien Facility Term Loan (Luxembourg)(b) | 7.75% | 7/29/2022 | 9,195 | 8,523,765 | ||||||||
| Software/Services 0.10% | ||||||||||||
| First Data Corp. New 2022 B Dollar Term Loan | 4.168% | 7/8/2022 | 8,525 | 8,415,241 | ||||||||
| Specialty Retail 0.14% | ||||||||||||
| Bass Pro Group LLC 2015 New Term Loan | 4.00% | 6/5/2020 | 7,690 | 7,427,126 | ||||||||
| Rue21, Inc. Term Loan B | 5.625% | 10/9/2020 | 5,562 | 4,516,162 | ||||||||
| Total | 11,943,288 | |||||||||||
| Technology Hardware & Equipment 0.01% | ||||||||||||
| TTM Technologies, Inc. Term Loan B | 6.00% | 5/31/2021 | 669 | 607,027 | ||||||||
| Telecommunications: Wireline Integrated & Services 0.11% | ||||||||||||
| Fairpoint Communications, Inc. Term Loan | 7.50% | 2/14/2019 | 9,547 | 9,511,031 | ||||||||
| See Notes to Financial Statements. | 15 |
Schedule of Investments (continued)
December 31, 2015
| Principal | |||||||||||
| Interest | Maturity | Amount | Fair | ||||||||
| Investments | Rate | Date | (000) | Value | |||||||
| Theaters & Entertainment 0.19% | |||||||||||
| Kasima LLC Term Loan | 3.25% | 5/17/2021 | $ | 7,951 | $ | 7,904,443 | |||||
| Six Flags Theme Parks, Inc. Tranche B Term Loan | 3.50% | 6/30/2022 | 8,585 | 8,585,384 | |||||||
| Total | 16,489,827 | ||||||||||
| Total Floating Rate Loans (cost $211,010,895) | 189,931,345 | ||||||||||
| FOREIGN BONDS(a) 0.72% | |||||||||||
| Luxembourg 0.06% | |||||||||||
| Altice Luxembourg SA† | 6.25% | 2/15/2025 | EUR | 5,200 | 4,789,307 | ||||||
| Mexico 0.05% | |||||||||||
| Red de Carreteras de Occidente S.A.P.I.B. de CV† | 9.00% | 6/10/2028 | MXN | 82,360 | 4,643,753 | ||||||
| Netherlands 0.11% | |||||||||||
| Hema Bondco I BV† | 6.25% | 6/15/2019 | EUR | 11,825 | 9,670,239 | ||||||
| Spain 0.25% | |||||||||||
| Banco Popular Espanol SA | 11.50% | – | (e) | EUR | 18,300 | 21,677,398 | |||||
| United Kingdom 0.25% | |||||||||||
| New Look Secured Issuer plc† | 6.50% | 7/1/2022 | GBP | 8,020 | 11,765,742 | ||||||
| Premier Foods Finance plc† | 6.50% | 3/15/2021 | GBP | 6,725 | 9,490,172 | ||||||
| Total | 21,255,914 | ||||||||||
| Total Foreign Bonds (cost $68,583,609) | 62,036,611 | ||||||||||
| FOREIGN GOVERNMENT OBLIGATIONS 2.30% | |||||||||||
| Angola 0.11% | |||||||||||
| Republic of Angola†(b) | 9.50% | 11/12/2025 | $ | 9,710 | 9,054,575 | ||||||
| Argentina 0.38% | |||||||||||
| City of Buenos Aires†(b) | 8.95% | 2/19/2021 | 8,675 | 9,195,500 | |||||||
| Republic of Argentina(b) | 8.75% | 5/7/2024 | 22,400 | 23,657,355 | |||||||
| Total | 32,852,855 | ||||||||||
| Bahamas 0.11% | |||||||||||
| Commonwealth of Bahamas†(b) | 5.75% | 1/16/2024 | 9,025 | 9,476,250 | |||||||
| Bermuda 0.27% | |||||||||||
| Government of Bermuda† | 4.138% | 1/3/2023 | 13,720 | 13,742,295 | |||||||
| Government of Bermuda† | 4.854% | 2/6/2024 | 9,225 | 9,557,100 | |||||||
| Total | 23,299,395 | ||||||||||
| Cayman Islands 0.07% | |||||||||||
| Cayman Islands Government† | 5.95% | 11/24/2019 | 5,280 | 5,966,400 | |||||||
| 16 | See Notes to Financial Statements. |
Schedule of Investments (continued)
December 31, 2015
| Principal | |||||||||||
| Interest | Maturity | Amount | Fair | ||||||||
| Investments | Rate | Date | (000) | Value | |||||||
| Cyprus 0.25% | |||||||||||
| Republic of Cyprus(a) | 4.75% | 6/25/2019 | EUR | 18,200 | $ | 21,331,486 | |||||
| Dominican Republic 0.18% | |||||||||||
| Dominican Republic†(b) | 6.85% | 1/27/2045 | $ | 16,485 | 15,619,538 | ||||||
| Egypt 0.15% | |||||||||||
| Arab Republic of Egypt†(b) | 5.875% | 6/11/2025 | 14,525 | 12,643,286 | |||||||
| Ethiopia 0.15% | |||||||||||
| Republic of Ethiopia†(b) | 6.625% | 12/11/2024 | 14,500 | 12,910,800 | |||||||
| Greece 0.11% | |||||||||||
| Hellenic Republic†(a) | 4.75% | 4/17/2019 | EUR | 8,967 | 8,966,951 | ||||||
| Honduras 0.11% | |||||||||||
| Honduras Government†(b) | 7.50% | 3/15/2024 | $ | 9,100 | 9,623,250 | ||||||
| Jamaica 0.41% | |||||||||||
| Government of Jamaica(b) | 6.75% | 4/28/2028 | 15,650 | 15,571,750 | |||||||
| Government of Jamaica(b) | 7.625% | 7/9/2025 | 9,550 | 10,182,688 | |||||||
| Government of Jamaica(b) | 8.00% | 3/15/2039 | 8,890 | 9,352,280 | |||||||
| Total | 35,106,718 | ||||||||||
| Total Foreign Government Obligations (cost $200,247,150) | 196,851,504 | ||||||||||
| HIGH YIELD CORPORATE BONDS 72.49% | |||||||||||
| Advertising 0.13% | |||||||||||
| Southern Graphics, Inc.† | 8.375% | 10/15/2020 | 11,075 | 11,185,750 | |||||||
| Aerospace/Defense 1.39% | |||||||||||
| Aerojet Rocketdyne Holdings, Inc. | 7.125% | 3/15/2021 | 15,000 | 15,675,000 | |||||||
| BAE Systems Holdings, Inc.† | 3.85% | 12/15/2025 | 15,884 | 15,756,896 | |||||||
| CPI International, Inc. | 8.75% | 2/15/2018 | 12,906 | 12,776,940 | |||||||
| Harris Corp. | 4.854% | 4/27/2035 | 3,990 | 3,938,154 | |||||||
| Harris Corp. | 5.054% | 4/27/2045 | 17,473 | 17,173,565 | |||||||
| Hexcel Corp. | 4.70% | 8/15/2025 | 12,927 | 12,825,665 | |||||||
| Huntington Ingalls Industries, Inc.† | 5.00% | 12/15/2021 | 7,725 | 7,898,813 | |||||||
| Huntington Ingalls Industries, Inc.† | 5.00% | 11/15/2025 | 4,497 | 4,575,698 | |||||||
| Lockheed Martin Corp. | 3.55% | 1/15/2026 | 11,923 | 11,989,530 | |||||||
| Lockheed Martin Corp. | 4.70% | 5/15/2046 | 7,948 | 8,174,637 | |||||||
| TransDigm, Inc. | 6.50% | 7/15/2024 | 8,823 | 8,818,589 | |||||||
| Total | 119,603,487 | ||||||||||
| See Notes to Financial Statements. | 17 |
Schedule of Investments (continued)
December 31, 2015
| Principal | |||||||||||
| Interest | Maturity | Amount | Fair | ||||||||
| Investments | Rate | Date | (000) | Value | |||||||
| Air Transportation 0.25% | |||||||||||
| Air Canada (Canada)†(b) | 7.75% | 4/15/2021 | $ | 12,983 | $ | 13,534,778 | |||||
| Air Canada 2015-2 Class A Pass-Through Trust (Canada)†(b) | 4.125% | 12/15/2027 | 7,986 | 7,952,658 | |||||||
| Total | 21,487,436 | ||||||||||
| Auto Parts & Equipment 0.68% | |||||||||||
| Gates Global LLC/Gates Global Co.† | 6.00% | 7/15/2022 | 11,902 | 8,628,950 | |||||||
| International Automotive Components Group SA (Luxembourg)†(b) | 9.125% | 6/1/2018 | 10,028 | 8,624,080 | |||||||
| Midas Intermediate Holdco II LLC/Midas Intermediate Holdco II Finance, Inc.† | 7.875% | 10/1/2022 | 10,400 | 9,360,000 | |||||||
| MPG Holdco I, Inc. | 7.375% | 10/15/2022 | 8,530 | 8,657,950 | |||||||
| Nemak SA de CV (Mexico)†(b) | 5.50% | 2/28/2023 | 2,651 | 2,670,883 | |||||||
| Omega US Sub LLC† | 8.75% | 7/15/2023 | 12,004 | 11,133,710 | |||||||
| ZF North America Capital, Inc.† | 4.50% | 4/29/2022 | 9,750 | 9,567,187 | |||||||
| Total | 58,642,760 | ||||||||||
| Automakers 0.00% | |||||||||||
| General Motors Co.(c) | 8.375% | – | (e) | 15,000 | 1,500 | ||||||
| Banking 7.42% | |||||||||||
| ABN AMRO Bank NV (Netherlands)†(b) | 4.75% | 7/28/2025 | 21,539 | 21,509,922 | |||||||
| Ally Financial, Inc. | 5.75% | 11/20/2025 | 24,904 | 25,277,560 | |||||||
| ANZ New Zealand Int’l Ltd. (United Kingdom)†(b) | 2.85% | 8/6/2020 | 11,843 | 11,955,236 | |||||||
| Banco Bilbao Vizcaya Argentaria SA (Spain)(b) | 9.00% | – | (e) | 9,000 | 9,666,639 | ||||||
| Bank of America Corp. | 4.20% | 8/26/2024 | 7,900 | 7,852,284 | |||||||
| Bank of America Corp. | 4.25% | 10/22/2026 | 17,498 | 17,357,264 | |||||||
| Bank of America Corp. | 6.50% | – | (e) | 7,000 | 7,385,000 | ||||||
| Bank of America Corp. | 8.00% | – | (e) | 7,000 | 7,131,250 | ||||||
| Bank of China Ltd. (China)†(b) | 5.00% | 11/13/2024 | 13,400 | 13,846,287 | |||||||
| BankUnited, Inc. | 4.875% | 11/17/2025 | 22,890 | 22,556,790 | |||||||
| Barclays plc (United Kingdom)(b) | 5.25% | 8/17/2045 | 7,637 | 7,797,912 | |||||||
| BNP Paribas SA (France)†(b) | 4.375% | 9/28/2025 | 16,015 | 15,714,559 | |||||||
| BNP Paribas SA (France)†(b) | 7.375% | – | (e) | 8,311 | 8,539,553 | ||||||
| CIT Group, Inc. | 5.00% | 8/15/2022 | 18,253 | 18,789,273 | |||||||
| Citigroup, Inc. | 4.40% | 6/10/2025 | 11,907 | 12,049,241 | |||||||
| Citigroup, Inc. | 4.45% | 9/29/2027 | 17,359 | 17,283,141 | |||||||
| Citigroup, Inc. | 5.95% | – | (e) | 16,000 | 15,676,000 | ||||||
| Citizens Financial Group, Inc. | 4.35% | 8/1/2025 | 7,971 | 7,954,165 | |||||||
| Citizens Financial Group, Inc.† | 5.50% | – | (e) | 14,385 | 14,197,995 | ||||||
| 18 | See Notes to Financial Statements. |
Schedule of Investments (continued)
December 31, 2015
| Principal | |||||||||||
| Interest | Maturity | Amount | Fair | ||||||||
| Investments | Rate | Date | (000) | Value | |||||||
| Banking (continued) | |||||||||||
| Commerzbank AG (Germany)†(b) | 8.125% | 9/19/2023 | $ | 15,800 | $ | 18,193,068 | |||||
| Credit Suisse Group AG (Switzerland)†(b) | 7.50% | – | (e) | 13,694 | 14,437,803 | ||||||
| Credit Suisse Group Funding Guernsey Ltd. (Guernsey)†(b) | 3.80% | 9/15/2022 | 17,016 | 17,027,503 | |||||||
| Fifth Third Bancorp | 2.875% | 7/27/2020 | 8,596 | 8,595,579 | |||||||
| Goldman Sachs Group, Inc. (The) | 5.15% | 5/22/2045 | 8,971 | 8,746,743 | |||||||
| HSBC Holdings plc (United Kingdom)(b) | 4.25% | 8/18/2025 | 15,676 | 15,587,415 | |||||||
| HSBC Holdings plc (United Kingdom)(b) | 6.375% | – | (e) | 8,610 | 8,620,763 | ||||||
| Industrial & Commercial Bank of China Ltd. | 3.231% | 11/13/2019 | 16,050 | 16,334,053 | |||||||
| Intesa Sanpaolo SpA (Italy)†(b) | 7.70% | – | (e) | 8,027 | 8,191,393 | ||||||
| JPMorgan Chase & Co. | 3.875% | 9/10/2024 | 17,386 | 17,326,244 | |||||||
| JPMorgan Chase & Co. | 6.75% | – | (e) | 7,902 | 8,623,058 | ||||||
| LBG Capital No.1 plc (United Kingdom)†(b)(f) | 8.00% | – | (e) | 3,000 | 3,152,250 | ||||||
| Lloyds Banking Group plc (United Kingdom)†(b) | 4.582% | 12/10/2025 | 21,539 | 21,634,202 | |||||||
| Lloyds Banking Group plc (United Kingdom)(b) | 7.50% | – | (e) | 10,008 | 10,683,540 | ||||||
| Macquarie Bank Ltd. (Australia)†(b) | 1.60% | 10/27/2017 | 17,075 | 16,957,968 | |||||||
| Macquarie Group Ltd. (Australia)†(b) | 6.00% | 1/14/2020 | 7,700 | 8,506,044 | |||||||
| Morgan Stanley | 4.00% | 7/23/2025 | 8,326 | 8,590,875 | |||||||
| MUFG Americas Holdings Corp. | 3.00% | 2/10/2025 | 7,971 | 7,646,253 | |||||||
| National Savings Bank (Sri Lanka)†(b) | 5.15% | 9/10/2019 | 9,585 | 8,961,975 | |||||||
| Nationwide Building Society (United Kingdom)†(b) | 3.90% | 7/21/2025 | 16,566 | 17,108,089 | |||||||
| Nordea Bank AB (Sweden)†(b) | 6.125% | – | (e) | 8,297 | 8,132,719 | ||||||
| Popular, Inc. | 7.00% | 7/1/2019 | 18,940 | 17,779,925 | |||||||
| Royal Bank of Scotland Group plc (United Kingdom)(b) | 7.50% | – | (e) | 10,369 | 10,822,644 | ||||||
| Santander Holdings USA, Inc. | 4.50% | 7/17/2025 | 12,621 | 12,871,741 | |||||||
| Santander UK Group Holdings plc (United Kingdom)†(b) | 4.75% | 9/15/2025 | 4,619 | 4,580,381 | |||||||
| Santander UK plc (United Kingdom)(b) | 7.95% | 10/26/2029 | 1,956 | 2,497,961 | |||||||
| Societe Generale SA (France)†(b) | 6.00% | – | (e) | 9,360 | 8,874,216 | ||||||
| Societe Generale SA (France)†(b) | 8.00% | – | (e) | 8,184 | 8,354,055 | ||||||
| Standard Chartered plc (United Kingdom)†(b) | 6.50% | – | (e) | 15,550 | 15,079,815 | ||||||
| Synovus Financial Corp. | 7.875% | 2/15/2019 | 7,750 | 8,631,562 | |||||||
| UBS Group Funding Jersey Ltd. (Jersey)†(b) | 4.125% | 9/24/2025 | 15,051 | 15,065,268 | |||||||
| Washington Mutual Bank(c) | 6.875% | 6/15/2011 | 22,500 | 2,250 | |||||||
| Wells Fargo & Co. | 4.90% | 11/17/2045 | 15,891 | 16,070,457 | |||||||
| Zions Bancorporation | 5.80% | – | (e) | 274 | 263,040 | ||||||
| Total | 636,490,923 | ||||||||||
| See Notes to Financial Statements. | 19 |
Schedule of Investments (continued)
December 31, 2015
| Principal | |||||||||||
| Interest | Maturity | Amount | Fair | ||||||||
| Investments | Rate | Date | (000) | Value | |||||||
| Beverages 1.24% | |||||||||||
| Brown-Forman Corp. | 4.50% | 7/15/2045 | $ | 15,274 | $ | 15,834,785 | |||||
| Coca-Cola Bottling Co. Consolidated | 3.80% | 11/25/2025 | 7,947 | 7,967,090 | |||||||
| Constellation Brands, Inc. | 3.75% | 5/1/2021 | 4,700 | 4,723,500 | |||||||
| Constellation Brands, Inc. | 4.25% | 5/1/2023 | 14,350 | 14,385,875 | |||||||
| Constellation Brands, Inc. | 6.00% | 5/1/2022 | 8,929 | 9,844,222 | |||||||
| Cott Beverages, Inc. | 5.375% | 7/1/2022 | 2,935 | 2,883,637 | |||||||
| Cott Beverages, Inc. | 6.75% | 1/1/2020 | 5,778 | 5,980,230 | |||||||
| Dr. Pepper Snapple Group, Inc. | 3.40% | 11/15/2025 | 15,891 | 15,641,178 | |||||||
| Dr. Pepper Snapple Group, Inc. | 4.50% | 11/15/2045 | 7,946 | 7,800,668 | |||||||
| Fomento Economico Mexicano SAB de CV (Mexico)(b) | 4.375% | 5/10/2043 | 9,464 | 8,425,534 | |||||||
| PepsiCo, Inc. | 4.25% | 10/22/2044 | 4,605 | 4,580,400 | |||||||
| PepsiCo, Inc. | 4.45% | 4/14/2046 | 8,417 | 8,716,107 | |||||||
| Total | 106,783,226 | ||||||||||
| Brokerage 0.58% | |||||||||||
| Charles Schwab Corp. (The) | 3.45% | 2/13/2026 | 8,650 | 8,807,274 | |||||||
| E*TRADE Financial Corp. | 4.625% | 9/15/2023 | 8,481 | 8,640,019 | |||||||
| Lazard Group LLC | 3.75% | 2/13/2025 | 11,965 | 11,060,362 | |||||||
| TD Ameritrade Holding Corp. | 2.95% | 4/1/2022 | 7,996 | 7,927,082 | |||||||
| TD Ameritrade Holding Corp. | 3.625% | 4/1/2025 | 12,835 | 13,003,447 | |||||||
| Total | 49,438,184 | ||||||||||
| Building & Construction 1.24% | |||||||||||
| Ashton Woods USA LLC/Ashton Woods Finance Co.† | 6.875% | 2/15/2021 | 11,740 | 10,037,700 | |||||||
| Brookfield Residential Properties, Inc. (Canada)†(b) | 6.50% | 12/15/2020 | 12,887 | 12,484,281 | |||||||
| DR Horton, Inc. | 4.75% | 2/15/2023 | 3,477 | 3,558,710 | |||||||
| K. Hovnanian Enterprises, Inc.† | 7.25% | 10/15/2020 | 9,600 | 8,304,000 | |||||||
| Lennar Corp. | 4.50% | 11/15/2019 | 10,000 | 10,218,750 | |||||||
| PulteGroup, Inc. | 6.375% | 5/15/2033 | 27,646 | 28,198,920 | |||||||
| Toll Brothers Finance Corp. | 5.625% | 1/15/2024 | 11,550 | 12,012,000 | |||||||
| William Lyon Homes, Inc. | 7.00% | 8/15/2022 | 21,500 | 21,661,250 | |||||||
| Total | 106,475,611 | ||||||||||
| Building Materials 1.01% | |||||||||||
| Builders FirstSource, Inc.† | 10.75% | 8/15/2023 | 18,165 | 18,119,588 | |||||||
| Building Materials Corp. of America† | 5.375% | 11/15/2024 | 15,526 | 15,564,815 | |||||||
| Hillman Group, Inc. (The)† | 6.375% | 7/15/2022 | 12,371 | 10,329,785 | |||||||
| Lafarge SA (France)(b) | 7.125% | 7/15/2036 | 6,771 | 7,788,173 | |||||||
| 20 | See Notes to Financial Statements. |
Schedule of Investments (continued)
December 31, 2015
| Principal | |||||||||||
| Interest | Maturity | Amount | Fair | ||||||||
| Investments | Rate | Date | (000) | Value | |||||||
| Building Materials (continued) | |||||||||||
| Masonite International Corp.† | 5.625% | 3/15/2023 | $ | 8,636 | $ | 8,959,850 | |||||
| Ply Gem Industries, Inc. | 6.50% | 2/1/2022 | 18,154 | 16,565,550 | |||||||
| Vulcan Materials Co. | 4.50% | 4/1/2025 | 8,960 | 8,915,200 | |||||||
| Total | 86,242,961 | ||||||||||
| Cable & Satellite Television 4.40% | |||||||||||
| Altice Financing SA (Luxembourg)†(b) | 6.625% | 2/15/2023 | 10,300 | 10,197,000 | |||||||
| Altice Finco SA (Luxembourg)†(b) | 9.875% | 12/15/2020 | 20,750 | 22,150,625 | |||||||
| Altice Luxembourg SA (Luxembourg)†(b) | 7.75% | 5/15/2022 | 19,000 | 17,195,000 | |||||||
| Cablevision Systems Corp. | 5.875% | 9/15/2022 | 28,000 | 23,870,000 | |||||||
| CCO Holdings LLC/CCO Holdings Capital Corp.† | 5.125% | 5/1/2023 | 8,900 | 8,922,250 | |||||||
| CCO Holdings LLC/CCO Holdings Capital Corp. | 6.625% | 1/31/2022 | 17,000 | 17,956,250 | |||||||
| CCO Safari II LLC† | 4.908% | 7/23/2025 | 15,825 | 15,833,498 | |||||||
| CCO Safari II LLC† | 6.384% | 10/23/2035 | 12,418 | 12,574,069 | |||||||
| DISH DBS Corp. | 5.00% | 3/15/2023 | 15,222 | 13,243,140 | |||||||
| DISH DBS Corp. | 5.875% | 7/15/2022 | 13,942 | 13,035,770 | |||||||
| DISH DBS Corp. | 6.75% | 6/1/2021 | 11,811 | 11,929,110 | |||||||
| Mediacom Broadband LLC/Mediacom Broadband Corp. | 6.375% | 4/1/2023 | 23,477 | 23,066,152 | |||||||
| Mediacom LLC/Mediacom Capital Corp. | 7.25% | 2/15/2022 | 4,401 | 4,461,514 | |||||||
| Neptune Finco Corp.† | 10.875% | 10/15/2025 | 47,846 | 50,238,300 | |||||||
| Numericable-SFR SAS (France)†(b) | 6.00% | 5/15/2022 | 17,825 | 17,334,812 | |||||||
| RCN Telecom Services LLC/RCN Capital Corp.† | 8.50% | 8/15/2020 | 8,186 | 8,298,558 | |||||||
| Time Warner Cable, Inc. | 5.875% | 11/15/2040 | 13,691 | 13,015,664 | |||||||
| Unitymedia Hessen GmbH & Co. KG/Unitymedia NRW GmbH (Germany)†(b) | 5.00% | 1/15/2025 | 7,282 | 6,981,618 | |||||||
| Unitymedia Hessen GmbH & Co. KG/Unitymedia NRW GmbH (Germany)†(b) | 5.50% | 1/15/2023 | 19,395 | 19,419,244 | |||||||
| Unitymedia KabelBW GmbH (Germany)†(b) | 6.125% | 1/15/2025 | 1,037 | 1,028,600 | |||||||
| UPCB Finance IV Ltd.† | 5.375% | 1/15/2025 | 16,100 | 15,254,750 | |||||||
| Virgin Media Finance plc (United Kingdom)†(b) | 6.00% | 10/15/2024 | 6,000 | 6,007,500 | |||||||
| Virgin Media Secured Finance plc (United Kingdom)†(b) | 5.375% | 4/15/2021 | 27,000 | 27,978,750 | |||||||
| VTR Finance BV (Netherlands)†(b) | 6.875% | 1/15/2024 | 12,315 | 11,360,588 | |||||||
| Wave Holdco LLC/Wave Holdco Corp. PIK† | 8.25% | 7/15/2019 | 6,642 | 6,442,740 | |||||||
| Total | 377,795,502 | ||||||||||
| See Notes to Financial Statements. | 21 |
Schedule of Investments (continued)
December 31, 2015
| Principal | |||||||||||
| Interest | Maturity | Amount | Fair | ||||||||
| Investments | Rate | Date | (000) | Value | |||||||
| Chemicals 0.77% | |||||||||||
| Celanese US Holdings LLC | 5.875% | 6/15/2021 | $ | 5,554 | $ | 5,887,240 | |||||
| Grupo Idesa SA de CV (Mexico)†(b) | 7.875% | 12/18/2020 | 13,600 | 13,532,000 | |||||||
| Huntsman International LLC† | 5.125% | 11/15/2022 | 10,107 | 9,146,835 | |||||||
| Israel Chemicals Ltd. (Israel)†(b) | 4.50% | 12/2/2024 | 17,775 | 17,856,765 | |||||||
| OCP SA (Morocco)†(b) | 6.875% | 4/25/2044 | 8,500 | 8,375,305 | |||||||
| Platform Specialty Products Corp.† | 6.50% | 2/1/2022 | 12,943 | 11,260,410 | |||||||
| Total | 66,058,555 | ||||||||||
| Consumer/Commercial/Lease Financing 1.79% | |||||||||||
| AerCap Ireland Capital Ltd./AerCap Global Aviation Trust (Ireland)(b) | 3.75% | 5/15/2019 | 9,525 | 9,536,906 | |||||||
| AerCap Ireland Capital Ltd./AerCap Global Aviation Trust (Ireland)(b) | 5.00% | 10/1/2021 | 14,135 | 14,594,387 | |||||||
| Air Lease Corp. | 3.875% | 4/1/2021 | 8,455 | 8,518,413 | |||||||
| Aircastle Ltd. | 5.50% | 2/15/2022 | 13,596 | 13,969,890 | |||||||
| Discover Bank | 7.00% | 4/15/2020 | 7,523 | 8,573,579 | |||||||
| Discover Financial Services | 3.75% | 3/4/2025 | 6,851 | 6,591,642 | |||||||
| International Lease Finance Corp. | 6.25% | 5/15/2019 | 21,350 | 22,924,562 | |||||||
| International Lease Finance Corp. | 8.25% | 12/15/2020 | 24,365 | 28,872,525 | |||||||
| Ladder Capital Finance Holdings LLLP/Ladder Capital Finance Corp.† | 5.875% | 8/1/2021 | 13,405 | 12,248,819 | |||||||
| National Financial Partners Corp.† | 9.00% | 7/15/2021 | 9,646 | 8,862,263 | |||||||
| Navient Corp. | 5.00% | 10/26/2020 | 8,744 | 7,694,720 | |||||||
| OneMain Financial Holdings, Inc.† | 6.75% | 12/15/2019 | 9,425 | 9,578,156 | |||||||
| Springleaf Finance Corp. | 5.25% | 12/15/2019 | 2,143 | 2,041,208 | |||||||
| Total | 154,007,070 | ||||||||||
| Department Stores 0.22% | |||||||||||
| El Puerto de Liverpool SAB de CV (Mexico)†(b) | 3.95% | 10/2/2024 | 9,613 | 9,360,659 | |||||||
| SACI Falabella (Chile)†(b) | 4.375% | 1/27/2025 | 9,450 | 9,390,814 | |||||||
| Total | 18,751,473 | ||||||||||
| Discount Stores 0.91% | |||||||||||
| Amazon.com, Inc. | 4.80% | 12/5/2034 | 55,934 | 59,073,352 | |||||||
| Dollar Tree, Inc.† | 5.75% | 3/1/2023 | 18,009 | 18,729,360 | |||||||
| Total | 77,802,712 | ||||||||||
| Diversified Capital Goods 1.49% | |||||||||||
| Artesyn Embedded Technologies, Inc.† | 9.75% | 10/15/2020 | 15,750 | 14,056,875 | |||||||
| General Cable Corp. | 5.75% | 10/1/2022 | 10,000 | 7,750,000 | |||||||
| 22 | See Notes to Financial Statements. |
Schedule of Investments (continued)
December 31, 2015
| Principal | |||||||||||
| Interest | Maturity | Amount | Fair | ||||||||
| Investments | Rate | Date | (000) | Value | |||||||
| Diversified Capital Goods (continued) | |||||||||||
| General Electric Co. | 4.00% | – | (e) | $ | 74,687 | $ | 74,780,609 | ||||
| Griffon Corp. | 5.25% | 3/1/2022 | 9,560 | 9,153,700 | |||||||
| Siemens Financieringsmaatschappij NV (Netherlands)†(b) | 3.25% | 5/27/2025 | 12,036 | 12,045,328 | |||||||
| Unifrax I LLC/Unifrax Holding Co.† | 7.50% | 2/15/2019 | 11,066 | 9,904,070 | |||||||
| Total | 127,690,582 | ||||||||||
| Electric: Distribution/Transportation 0.30% | |||||||||||
| Lamar Funding Ltd.† | 3.958% | �� | 5/7/2025 | 14,450 | 12,914,687 | ||||||
| Oncor Electric Delivery Co. LLC | 3.75% | 4/1/2045 | 15,095 | 12,597,638 | |||||||
| Total | 25,512,325 | ||||||||||
| Electric: Generation 0.50% | |||||||||||
| AES Gener SA (Chile)†(b) | 5.00% | 7/14/2025 | 6,150 | 5,897,592 | |||||||
| Dynegy, Inc. | 7.625% | 11/1/2024 | 7,625 | 6,555,975 | |||||||
| Illinois Power Generating Co. | 7.00% | 4/15/2018 | 16,899 | 11,406,825 | |||||||
| NSG Holdings LLC/NSG Holdings, Inc.† | 7.75% | 12/15/2025 | 17,517 | 19,006,138 | |||||||
| Total | 42,866,530 | ||||||||||
| Electric: Integrated 0.75% | |||||||||||
| AES El Salvador Trust II† | 6.75% | 3/28/2023 | 10,520 | 9,441,700 | |||||||
| AES Panama SRL (Panama)†(b) | 6.00% | 6/25/2022 | 9,623 | 9,598,943 | |||||||
| E.CL SA (Chile)†(b) | 4.50% | 1/29/2025 | 15,775 | 15,581,961 | |||||||
| El Paso Electric Co. | 5.00% | 12/1/2044 | 8,704 | 8,554,718 | |||||||
| Entergy Arkansas, Inc. | 4.95% | 12/15/2044 | 14,532 | 14,358,691 | |||||||
| IPALCO Enterprises, Inc. | 3.45% | 7/15/2020 | 801 | 788,985 | |||||||
| Louisville Gas & Electric Co. | 4.375% | 10/1/2045 | 5,575 | 5,709,987 | |||||||
| Total | 64,034,985 | ||||||||||
| Electronics 0.62% | |||||||||||
| Lam Research Corp. | 3.80% | 3/15/2025 | 8,289 | 7,816,958 | |||||||
| Qorvo, Inc.† | 7.00% | 12/1/2025 | 23,843 | 24,617,898 | |||||||
| Trimble Navigation Ltd. | 4.75% | 12/1/2024 | 21,096 | 20,999,106 | |||||||
| Total | 53,433,962 | ||||||||||
| Energy: Exploration & Production 5.54% | |||||||||||
| Antero Resources Corp. | 5.375% | 11/1/2021 | 16,594 | 13,358,170 | |||||||
| Bill Barrett Corp. | 7.00% | 10/15/2022 | 12,039 | 8,126,325 | |||||||
| Bonanza Creek Energy, Inc. | 6.75% | 4/15/2021 | 4,076 | 2,486,360 | |||||||
| Carrizo Oil & Gas, Inc. | 6.25% | 4/15/2023 | 12,317 | 10,038,355 | |||||||
| Carrizo Oil & Gas, Inc. | 7.50% | 9/15/2020 | 7,019 | 6,167,946 | |||||||
| See Notes to Financial Statements. | 23 |
Schedule of Investments (continued)
December 31, 2015
| Principal | |||||||||||
| Interest | Maturity | Amount | Fair | ||||||||
| Investments | Rate | Date | (000) | Value | |||||||
| Energy: Exploration & Production (continued) | |||||||||||
| Clayton Williams Energy, Inc. | 7.75% | 4/1/2019 | $ | 10,098 | $ | 7,838,572 | |||||
| Concho Resources, Inc. | 5.50% | 4/1/2023 | 35,710 | 33,210,300 | |||||||
| Continental Resources, Inc. | 5.00% | 9/15/2022 | 25,524 | 18,855,855 | |||||||
| CrownRock LP/CrownRock Finance, Inc.† | 7.125% | 4/15/2021 | 27,406 | 25,830,155 | |||||||
| Denbury Resources, Inc. | 5.50% | 5/1/2022 | 12,522 | 4,219,664 | |||||||
| Devon Energy Corp. | 5.85% | 12/15/2025 | 13,383 | 13,039,699 | |||||||
| Diamondback Energy, Inc. | 7.625% | 10/1/2021 | 24,675 | 25,045,125 | |||||||
| Eclipse Resources Corp.† | 8.875% | 7/15/2023 | 13,449 | 6,489,143 | |||||||
| Encana Corp. (Canada)(b) | 6.50% | 8/15/2034 | 19,530 | 15,834,651 | |||||||
| EOG Resources, Inc. | 3.15% | 4/1/2025 | 8,927 | 8,453,440 | |||||||
| EP Energy LLC/Everest Acquisition Finance, Inc. | 6.375% | 6/15/2023 | 6,606 | 3,336,030 | |||||||
| EXCO Resources, Inc. | 8.50% | 4/15/2022 | 16,501 | 3,052,685 | |||||||
| Gulfport Energy Corp. | 6.625% | 5/1/2023 | 1,957 | 1,643,880 | |||||||
| Gulfport Energy Corp. | 7.75% | 11/1/2020 | 13,725 | 12,352,500 | |||||||
| Hilcorp Energy I LP/Hilcorp Finance Co.† | 5.00% | 12/1/2024 | 19,105 | 15,952,675 | |||||||
| Kosmos Energy Ltd. † | 7.875% | 8/1/2021 | 17,460 | 14,142,600 | |||||||
| Kunlun Energy Co., Ltd. (Hong Kong)†(b) | 3.75% | 5/13/2025 | 16,080 | 15,695,045 | |||||||
| MEG Energy Corp. (Canada)†(b) | 6.375% | 1/30/2023 | 8,500 | 5,865,000 | |||||||
| MEG Energy Corp. (Canada)†(b) | 7.00% | 3/31/2024 | 38,462 | 27,500,330 | |||||||
| Memorial Resource Development Corp. | 5.875% | 7/1/2022 | 19,159 | 16,859,920 | |||||||
| Newfield Exploration Co. | 5.625% | 7/1/2024 | 18,026 | 15,457,295 | |||||||
| Oasis Petroleum, Inc. | 6.50% | 11/1/2021 | 2,002 | 1,336,335 | |||||||
| Oasis Petroleum, Inc. | 6.875% | 3/15/2022 | 9,243 | 5,961,735 | |||||||
| Oasis Petroleum, Inc. | 7.25% | 2/1/2019 | 9,112 | 6,583,420 | |||||||
| Occidental Petroleum Corp. | 3.50% | 6/15/2025 | 13,233 | 12,940,088 | |||||||
| OGX Austria GmbH (Austria)†(b)(c) | 8.50% | 6/1/2018 | 20,000 | 400 | |||||||
| Paramount Resources Ltd. (Canada)†(b) | 6.875% | 6/30/2023 | 15,168 | 12,058,560 | |||||||
| Parsley Energy LLC/Parsley Finance Corp.† | 7.50% | 2/15/2022 | 9,325 | 8,952,000 | |||||||
| PDC Energy, Inc. | 7.75% | 10/15/2022 | 22,734 | 21,938,310 | |||||||
| Range Resources Corp.† | 4.875% | 5/15/2025 | 19,965 | 15,248,269 | |||||||
| Rice Energy, Inc. | 6.25% | 5/1/2022 | 13,033 | 9,448,925 | |||||||
| RSP Permian, Inc. | 6.625% | 10/1/2022 | 9,860 | 9,120,500 | |||||||
| Seven Generations Energy Ltd. (Canada)†(b) | 6.75% | 5/1/2023 | 4,810 | 4,064,450 | |||||||
| Seven Generations Energy Ltd. (Canada)†(b) | 8.25% | 5/15/2020 | 15,155 | 13,715,275 | |||||||
| SM Energy Co. | 6.50% | 11/15/2021 | 8,925 | 6,693,750 | |||||||
| Ultra Petroleum Corp.† | 6.125% | 10/1/2024 | 10,900 | 2,534,250 | |||||||
| YPF SA (Argentina)†(b) | 8.50% | 7/28/2025 | 14,725 | 14,099,187 | |||||||
| Total | 475,547,174 | ||||||||||
| 24 | See Notes to Financial Statements. |
Schedule of Investments (continued)
December 31, 2015
| Principal | |||||||||||
| Interest | Maturity | Amount | Fair | ||||||||
| Investments | Rate | Date | (000) | Value | |||||||
| Environmental 0.11% | |||||||||||
| ADS Waste Holdings, Inc. | 8.25% | 10/1/2020 | $ | 9,502 | $ | 9,620,775 | |||||
| Food & Drug Retailers 1.24% | |||||||||||
| BI-LO LLC/BI-LO Finance Corp.† | 9.25% | 2/15/2019 | 8,975 | 9,087,188 | |||||||
| Ingles Markets, Inc. | 5.75% | 6/15/2023 | 9,393 | 9,416,482 | |||||||
| New Albertson’s, Inc. | 7.45% | 8/1/2029 | 7,200 | 6,408,000 | |||||||
| New Albertson’s, Inc. | 7.75% | 6/15/2026 | 17,080 | 15,799,000 | |||||||
| Rite Aid Corp.† | 6.125% | 4/1/2023 | 12,841 | 13,338,589 | |||||||
| Rite Aid Corp. | 7.70% | 2/15/2027 | 28,757 | 33,645,690 | |||||||
| Tops Holding LLC/Top Markets II Corp.† | 8.00% | 6/15/2022 | 18,950 | 18,760,500 | |||||||
| Total | 106,455,449 | ||||||||||
| Food: Wholesale 1.64% | |||||||||||
| B&G Foods, Inc. | 4.625% | 6/1/2021 | 20,000 | 19,875,000 | |||||||
| Diamond Foods, Inc.† | 7.00% | 3/15/2019 | 15,033 | 15,559,155 | |||||||
| JBS USA LLC/JBS USA Finance, Inc.† | 5.75% | 6/15/2025 | 6,413 | 5,611,375 | |||||||
| JBS USA LLC/JBS USA Finance, Inc.† | 5.875% | 7/15/2024 | 7,634 | 6,946,940 | |||||||
| JBS USA LLC/JBS USA Finance, Inc.† | 7.25% | 6/1/2021 | 3,287 | 3,278,783 | |||||||
| Land O’Lakes, Inc.† | 6.00% | 11/15/2022 | 12,700 | 13,335,000 | |||||||
| Mead Johnson Nutrition Co. | 4.125% | 11/15/2025 | 11,918 | 12,031,293 | |||||||
| Pinnacle Foods Finance LLC/Pinnacle Foods Finance Corp. | 4.875% | 5/1/2021 | 11,046 | 10,631,775 | |||||||
| Post Holdings, Inc.† | 7.75% | 3/15/2024 | 8,735 | 9,171,750 | |||||||
| Post Holdings, Inc.† | 8.00% | 7/15/2025 | 3,985 | 4,234,062 | |||||||
| WhiteWave Foods Co. (The) | 5.375% | 10/1/2022 | 37,580 | 39,834,800 | |||||||
| Total | 140,509,933 | ||||||||||
| Forestry/Paper 0.30% | |||||||||||
| Cascades, Inc. (Canada)†(b) | 5.50% | 7/15/2022 | 9,393 | 9,146,434 | |||||||
| Millar Western Forest Products Ltd. (Canada)(b) | 8.50% | 4/1/2021 | 13,500 | 7,020,000 | |||||||
| Norbord, Inc. (Canada)†(b) | 6.25% | 4/15/2023 | 9,460 | 9,389,050 | |||||||
| Total | 25,555,484 | ||||||||||
| Gaming 1.79% | |||||||||||
| Boyd Gaming Corp. | 6.875% | 5/15/2023 | 14,473 | 14,943,373 | |||||||
| Caesar’s Entertainment Resort Properties LLC/Caesar’s Entertainment Resort Properties Finance, Inc. | 11.00% | 10/1/2021 | 9,350 | 8,508,500 | |||||||
| Caesar’s Growth Properties Holdings LLC/Caesar’s Growth Properties Finance, Inc. | 9.375% | 5/1/2022 | 15,848 | 13,074,600 | |||||||
| See Notes to Financial Statements. | 25 |
Schedule of Investments (continued)
December 31, 2015
| Principal | |||||||||||
| Interest | Maturity | Amount | Fair | ||||||||
| Investments | Rate | Date | (000) | Value | |||||||
| Gaming (continued) | |||||||||||
| CCM Merger, Inc.† | 9.125% | 5/1/2019 | $ | 12,000 | $ | 12,585,000 | |||||
| MCE Finance Ltd. (Hong Kong)†(b) | 5.00% | 2/15/2021 | 17,080 | 15,628,200 | |||||||
| MGM Resorts International | 6.00% | 3/15/2023 | 19,473 | 19,375,635 | |||||||
| MGM Resorts International | 7.75% | 3/15/2022 | 6,873 | 7,328,336 | |||||||
| Mohegan Tribal Gaming Authority | 9.75% | 9/1/2021 | 13,708 | 13,742,270 | |||||||
| River Rock Entertainment Authority (The)(c) | 9.00% | 11/1/2018 | 10,368 | 816,480 | |||||||
| Rivers Pittsburgh Borrower LP/Rivers Pittsburgh Finance Corp.† | 9.50% | 6/15/2019 | 8,009 | 8,329,360 | |||||||
| Sugarhouse HSP Gaming Prop. Mezz. LP/Sugarhouse HSP Gaming Finance Corp.† | 6.375% | 6/1/2021 | 19,800 | 18,513,000 | |||||||
| Wynn Las Vegas LLC/Wynn Las Vegas Capital Corp. | 5.375% | 3/15/2022 | 9,527 | 9,064,750 | |||||||
| Wynn Macau Ltd. (Macau)†(b) | 5.25% | 10/15/2021 | 12,855 | 11,376,675 | |||||||
| Total | 153,286,179 | ||||||||||
| Gas Distribution 2.12% | |||||||||||
| Boardwalk Pipelines LP | 4.95% | 12/15/2024 | 7,462 | 6,499,723 | |||||||
| Dominion Gas Holdings LLC | 3.60% | 12/15/2024 | 12,050 | 11,938,320 | |||||||
| Energy Transfer Equity LP | 5.50% | 6/1/2027 | 9,977 | 7,632,405 | |||||||
| Energy Transfer Equity LP | 5.875% | 1/15/2024 | 11,850 | 9,717,000 | |||||||
| Florida Gas Transmission Co. LLC† | 4.35% | 7/15/2025 | 18,041 | 16,573,202 | |||||||
| Genesis Energy LP/Genesis Energy Finance Corp. | 6.75% | 8/1/2022 | 11,957 | 10,223,235 | |||||||
| IFM US Colonial Pipeline 2 LLC† | 6.45% | 5/1/2021 | 17,850 | 19,052,055 | |||||||
| LBC Tank Terminals Holding Netherlands BV (Belgium)†(b) | 6.875% | 5/15/2023 | 13,716 | 13,647,420 | |||||||
| Midcontinent Express Pipeline LLC† | 6.70% | 9/15/2019 | 1,100 | 1,031,250 | |||||||
| Rockies Express Pipeline LLC† | 6.875% | 4/15/2040 | 18,450 | 15,959,250 | |||||||
| Sabine Pass Liquefaction LLC | 5.75% | 5/15/2024 | 28,299 | 24,761,625 | |||||||
| SemGroup Corp. | 7.50% | 6/15/2021 | 3,870 | 3,483,000 | |||||||
| Southern Star Central Corp.† | 5.125% | 7/15/2022 | 9,225 | 7,656,750 | |||||||
| Tesoro Logistics LP/Tesoro Logistics Finance Corp.† | 5.50% | 10/15/2019 | 6,025 | 5,874,375 | |||||||
| Tesoro Logistics LP/Tesoro Logistics Finance Corp. | 5.875% | 10/1/2020 | 9,095 | 8,731,200 | |||||||
| Tesoro Logistics LP/Tesoro Logistics Finance Corp. | 6.125% | 10/15/2021 | 7,800 | 7,449,000 | |||||||
| Tesoro Logistics LP/Tesoro Logistics Finance Corp.† | 6.25% | 10/15/2022 | 12,150 | 11,572,875 | |||||||
| Total | 181,802,685 | ||||||||||
| Health Facilities 2.99% | |||||||||||
| Amsurg Corp. | 5.625% | 11/30/2020 | 12,436 | 12,684,720 | |||||||
| Amsurg Corp. | 5.625% | 7/15/2022 | 6,136 | 6,097,650 | |||||||
| CHS/Community Health Systems, Inc. | 6.875% | 2/1/2022 | 10,000 | 9,537,500 | |||||||
| 26 | See Notes to Financial Statements. |
Schedule of Investments (continued)
December 31, 2015
| Investments | Interest Rate | Maturity Date | Principal Amount (000) | Fair Value | |||||||
| Health Facilities (continued) | |||||||||||
| CHS/Community Health Systems, Inc. | 8.00% | 11/15/2019 | $ | 33,230 | $ | 33,645,375 | |||||
| DaVita HealthCare Partners, Inc. | 5.75% | 8/15/2022 | 27,000 | 27,911,250 | |||||||
| Dignity Health | 3.812% | 11/1/2024 | 7,500 | 7,630,058 | |||||||
| Dignity Health | 4.50% | 11/1/2042 | 8,811 | 8,320,536 | |||||||
| HCA, Inc. | 4.25% | 10/15/2019 | 7,955 | 8,124,044 | |||||||
| HCA, Inc. | 5.375% | 2/1/2025 | 10,595 | 10,475,806 | |||||||
| HCA, Inc. | 5.875% | 3/15/2022 | 8,139 | 8,606,992 | |||||||
| HCA, Inc. | 7.05% | 12/1/2027 | 1,907 | 1,940,373 | |||||||
| HCA, Inc. | 7.50% | 2/15/2022 | 30,093 | 33,478,462 | |||||||
| HCA, Inc. | 7.58% | 9/15/2025 | 4,073 | 4,429,388 | |||||||
| HCA, Inc. | 7.69% | 6/15/2025 | 12,111 | 13,110,157 | |||||||
| MEDNAX, Inc.† | 5.25% | 12/1/2023 | 5,959 | 6,003,693 | |||||||
| Memorial Sloan-Kettering Cancer Center | 4.20% | 7/1/2055 | 12,319 | 11,892,972 | |||||||
| MPT Operating Partnership LP/MPT Finance Corp. | 5.50% | 5/1/2024 | 7,930 | 7,930,000 | |||||||
| Tenet Healthcare Corp. | 6.75% | 6/15/2023 | 24,856 | 23,100,545 | |||||||
| Tenet Healthcare Corp. | 8.125% | 4/1/2022 | 21,945 | 21,999,862 | |||||||
| Total | 256,919,383 | ||||||||||
| Health Services 0.11% | |||||||||||
| ExamWorks Group, Inc. | 5.625% | 4/15/2023 | 9,357 | 9,345,304 | |||||||
| Hotels 0.54% | |||||||||||
| Hilton Worldwide Finance LLC/Hilton Worldwide Finance Corp. | 5.625% | 10/15/2021 | 15,725 | 16,373,656 | |||||||
| Playa Resorts Holding BV (Netherlands)†(b) | 8.00% | 8/15/2020 | 15,850 | 16,167,000 | |||||||
| RHP Hotel Properties LP/RHP Finance Corp. | 5.00% | 4/15/2021 | 10,400 | 10,634,000 | |||||||
| RHP Hotel Properties LP/RHP Finance Corp. | 5.00% | 4/15/2023 | 3,236 | 3,252,180 | |||||||
| Total | 46,426,836 | ||||||||||
| Insurance-Reinsurance 0.36% | |||||||||||
| Allied World Assurance Co. Holdings Ltd. | 4.35% | 10/29/2025 | 31,076 | 30,651,160 | |||||||
| Integrated Energy 0.66% | |||||||||||
| Alta Wind Holdings LLC† | 7.00% | 6/30/2035 | 9,136 | 9,804,118 | |||||||
| Rio Oil Finance Trust Series 2014-1 (Brazil)†(b) | 9.25% | 7/6/2024 | 26,059 | 19,316,234 | |||||||
| Shell International Finance BV (Netherlands)(b) | 3.25% | 5/11/2025 | 15,961 | 15,608,629 | |||||||
| Shell International Finance BV (Netherlands)(b) | 4.375% | 5/11/2045 | 7,154 | 6,781,019 | |||||||
| Shell International Finance BV (Netherlands)(b) | 4.55% | 8/12/2043 | 4,886 | 4,767,710 | |||||||
| Total | 56,277,710 | ||||||||||
| See Notes to Financial Statements. | 27 |
Schedule of Investments (continued)
December 31, 2015
| Investments | Interest Rate | Maturity Date | Principal Amount (000) | Fair Value | |||||||
| Investments & Miscellaneous Financial Services 0.56% | |||||||||||
| CME Group, Inc. | 3.00% | 3/15/2025 | $ | 16,017 | $ | 15,732,314 | |||||
| FMR LLC† | 5.35% | 11/15/2021 | 7,800 | 8,658,951 | |||||||
| Intercontinental Exchange, Inc. | 3.75% | 12/1/2025 | 17,312 | 17,380,573 | |||||||
| Neuberger Berman Group LLC/Neuberger Berman Finance Corp.† | 4.875% | 4/15/2045 | 6,969 | 5,897,133 | |||||||
| Total | 47,668,971 | ||||||||||
| Life Insurance 0.75% | |||||||||||
| American Equity Investment Life Holding Co. | 6.625% | 7/15/2021 | 12,202 | 12,751,090 | |||||||
| CNO Financial Group, Inc. | 5.25% | 5/30/2025 | 17,074 | 17,436,822 | |||||||
| Prudential Financial, Inc. | 5.375% | 5/15/2045 | 8,670 | 8,670,000 | |||||||
| Teachers Insurance & Annuity Association of America† | 4.90% | 9/15/2044 | 12,705 | 12,862,822 | |||||||
| TIAA Asset Management Finance Co. LLC† | 4.125% | 11/1/2024 | 12,927 | 12,994,725 | |||||||
| Total | 64,715,459 | ||||||||||
| Machinery 0.11% | |||||||||||
| Milacron LLC/Mcron Finance Corp.† | 7.75% | 2/15/2021 | 10,000 | 9,375,000 | |||||||
| Managed Care 0.28% | |||||||||||
| Centene Corp. | 4.75% | 5/15/2022 | 8,794 | 8,552,165 | |||||||
| MPH Acquisition Holdings LLC† | 6.625% | 4/1/2022 | 15,000 | 15,075,000 | |||||||
| Total | 23,627,165 | ||||||||||
| Media: Content 0.92% | |||||||||||
| AMC Networks, Inc. | 4.75% | 12/15/2022 | 19,200 | 19,272,000 | |||||||
| AMC Networks, Inc. | 7.75% | 7/15/2021 | 14,000 | 14,770,000 | |||||||
| Netflix, Inc. | 5.375% | 2/1/2021 | 23,500 | 24,792,500 | |||||||
| Sirius XM Radio, Inc.† | 6.00% | 7/15/2024 | 7,354 | 7,703,315 | |||||||
| Univision Communications, Inc.† | 5.125% | 2/15/2025 | 13,349 | 12,714,922 | |||||||
| Total | 79,252,737 | ||||||||||
| Media: Diversified 0.16% | |||||||||||
| Myriad International Holdings BV (Netherlands)†(b) | 5.50% | 7/21/2025 | 14,402 | 13,915,212 | |||||||
| Medical Products 1.57% | |||||||||||
| Fresenius Medical Care US Finance II, Inc.† | 4.75% | 10/15/2024 | 4,923 | 4,824,540 | |||||||
| Fresenius Medical Care US Finance II, Inc.† | 5.875% | 1/31/2022 | 22,545 | 24,235,875 | |||||||
| Grifols Worldwide Operations Ltd. (Ireland)(b) | 5.25% | 4/1/2022 | 21,375 | 21,535,313 | |||||||
| Hologic, Inc.† | 5.25% | 7/15/2022 | 8,552 | 8,755,110 | |||||||
| Kinetic Concepts, Inc./KCI USA, Inc. | 10.50% | 11/1/2018 | 7,500 | 7,331,250 | |||||||
| 28 | See Notes to Financial Statements. |
Schedule of Investments (continued)
December 31, 2015
| Investments | Interest Rate | Maturity Date | Principal Amount (000) | Fair Value | |||||||
| Medical Products (continued) | |||||||||||
| Kinetic Concepts, Inc./KCI USA, Inc. | 12.50% | 11/1/2019 | $ | 6,280 | $ | 5,730,500 | |||||
| Medtronic, Inc. | 3.15% | 3/15/2022 | 17,115 | 17,316,375 | |||||||
| Medtronic, Inc. | 4.375% | 3/15/2035 | 17,021 | 17,238,988 | |||||||
| St. Jude Medical, Inc. | 3.875% | 9/15/2025 | 7,968 | 8,058,158 | |||||||
| Sterigenics-Nordion Holdings LLC† | 6.50% | 5/15/2023 | 12,484 | 11,953,430 | |||||||
| Stryker Corp. | 3.375% | 11/1/2025 | 7,936 | 7,842,712 | |||||||
| Total | 134,822,251 | ||||||||||
| Metals/Mining (Excluding Steel) 1.80% | |||||||||||
| Aleris International, Inc. | 7.875% | 11/1/2020 | 7,694 | 5,901,298 | |||||||
| ALROSA Finance SA (Luxembourg)†(b) | 7.75% | 11/3/2020 | 12,100 | 12,776,087 | |||||||
| BHP Billiton Finance USA Ltd. (Australia)†(b) | 6.25% | 10/19/2075 | 18,003 | 17,665,444 | |||||||
| BHP Billiton Finance USA Ltd. (Australia)†(b) | 6.75% | 10/19/2075 | 17,923 | 17,340,502 | |||||||
| Coeur Mining, Inc. | 7.875% | 2/1/2021 | 11,200 | 6,748,000 | |||||||
| Freeport-McMoRan, Inc. | 3.875% | 3/15/2023 | 26,965 | 15,504,875 | |||||||
| HudBay Minerals, Inc. (Canada)(b) | 9.50% | 10/1/2020 | 10,215 | 7,533,563 | |||||||
| Imperial Metals Corp. (Canada)†(b) | 7.00% | 3/15/2019 | 10,455 | 9,357,225 | |||||||
| Kissner Milling Co. Ltd. (Canada)†(b) | 7.25% | 6/1/2019 | 7,080 | 6,672,900 | |||||||
| Lundin Mining Corp. (Canada)†(b) | 7.875% | 11/1/2022 | 10,330 | 9,529,425 | |||||||
| Mirabela Nickel Ltd. (Australia)(b) | 1.00% | 9/16/2044 | 183 | 18 | |||||||
| MMC Norilsk Nickel OJSC via MMC Finance Ltd. (Ireland)†(b) | 6.625% | 10/14/2022 | 12,000 | 12,247,680 | |||||||
| New Gold, Inc. (Canada)†(b) | 6.25% | 11/15/2022 | 9,226 | 7,380,800 | |||||||
| New Gold, Inc. (Canada)†(b) | 7.00% | 4/15/2020 | 8,952 | 8,090,370 | |||||||
| Newmont Mining Corp. | 4.875% | 3/15/2042 | 9,520 | 6,823,974 | |||||||
| Newmont Mining Corp. | 6.25% | 10/1/2039 | 4,765 | 3,817,018 | |||||||
| Thompson Creek Metals Co., Inc. | 7.375% | 6/1/2018 | 7,449 | 1,489,800 | |||||||
| Thompson Creek Metals Co., Inc. | 9.75% | 12/1/2017 | 432 | 373,680 | |||||||
| Volcan Cia Minera SAA (Peru)†(b) | 5.375% | 2/2/2022 | 8,300 | 5,312,000 | |||||||
| Total | 154,564,659 | ||||||||||
| Oil Field Equipment & Services 0.49% | |||||||||||
| Gulfmark Offshore, Inc. | 6.375% | 3/15/2022 | 5,904 | 3,202,920 | |||||||
| Hornbeck Offshore Services, Inc. | 5.875% | 4/1/2020 | 17,900 | 12,440,500 | |||||||
| Oceaneering International, Inc. | 4.65% | 11/15/2024 | 14,564 | 12,242,644 | |||||||
| Weatherford International Ltd. | 4.50% | 4/15/2022 | 17,161 | 12,377,371 | |||||||
| Weatherford International Ltd. | 5.125% | 9/15/2020 | 1,675 | 1,358,844 | |||||||
| Total | 41,622,279 | ||||||||||
| See Notes to Financial Statements. | 29 |
Schedule of Investments (continued)
December 31, 2015
| Investments | Interest Rate | Maturity Date | Principal Amount (000) | Fair Value | |||||||
| Oil Refining & Marketing 0.52% | |||||||||||
| Citgo Holding, Inc.† | 10.75% | 2/15/2020 | $ | 26,729 | $ | 25,960,541 | |||||
| Northern Tier Energy LLC/Northern Tier Finance Corp. | 7.125% | 11/15/2020 | 18,422 | 18,698,330 | |||||||
| Total | 44,658,871 | ||||||||||
| Packaging 1.49% | |||||||||||
| Ball Corp. | 4.00% | 11/15/2023 | 9,835 | 9,429,306 | |||||||
| Ball Corp. | 4.375% | 12/15/2020 | 9,929 | 10,102,757 | |||||||
| BWAY Holding Co.† | 9.125% | 8/15/2021 | 8,811 | 8,282,340 | |||||||
| Coveris Holdings SA (Luxembourg)†(b) | 7.875% | 11/1/2019 | 9,302 | 8,162,505 | |||||||
| Crown Cork & Seal Co., Inc. | 7.375% | 12/15/2026 | 11,810 | 12,754,800 | |||||||
| Graphic Packaging International, Inc. | 4.75% | 4/15/2021 | 9,100 | 9,327,500 | |||||||
| Graphic Packaging International, Inc. | 4.875% | 11/15/2022 | 9,420 | 9,561,300 | |||||||
| Pactiv LLC | 7.95% | 12/15/2025 | 8,500 | 7,947,500 | |||||||
| Reynolds Group Issuer, Inc./Reynolds Group Issuer LLC/Reynolds Group Issuer (Luxembourg) SA | 5.75% | 10/15/2020 | 10,000 | 10,196,900 | |||||||
| Reynolds Group Issuer, Inc./Reynolds Group Issuer LLC/Reynolds Group Issuer (Luxembourg) SA | 8.25% | 2/15/2021 | 11,750 | 11,368,125 | |||||||
| Sealed Air Corp.† | 4.875% | 12/1/2022 | 9,414 | 9,472,838 | |||||||
| Sealed Air Corp.† | 5.125% | 12/1/2024 | 4,978 | 5,002,890 | |||||||
| Sealed Air Corp.† | 6.875% | 7/15/2033 | 15,750 | 16,183,125 | |||||||
| Total | 127,791,886 | ||||||||||
| Personal & Household Products 0.99% | |||||||||||
| American Greetings Corp. | 7.375% | 12/1/2021 | 13,446 | 14,101,493 | |||||||
| Elizabeth Arden, Inc. | 7.375% | 3/15/2021 | 18,189 | 11,731,905 | |||||||
| FGI Operating Co. LLC/FGI Finance, Inc. | 7.875% | 5/1/2020 | 15,885 | 11,516,625 | |||||||
| Gibson Brands, Inc.† | 8.875% | 8/1/2018 | 19,905 | 11,644,425 | |||||||
| SC Johnson & Son, Inc.† | 4.75% | 10/15/2046 | 8,257 | 8,621,505 | |||||||
| Serta Simmons Bedding LLC† | 8.125% | 10/1/2020 | 8,897 | 9,341,850 | |||||||
| Spectrum Brands, Inc.† | 5.75% | 7/15/2025 | 7,621 | 7,849,630 | |||||||
| Springs Industries, Inc. | 6.25% | 6/1/2021 | 9,749 | 9,700,255 | |||||||
| Total | 84,507,688 | ||||||||||
| Pharmaceuticals 2.44% | |||||||||||
| AbbVie, Inc. | 3.20% | 11/6/2022 | 5,593 | 5,513,753 | |||||||
| AbbVie, Inc. | 4.50% | 5/14/2035 | 7,990 | 7,851,981 | |||||||
| AstraZeneca plc (United Kingdom)(b) | 3.375% | 11/16/2025 | 14,395 | 14,320,506 | |||||||
| Bayer US Finance LLC† | 3.375% | 10/8/2024 | 17,196 | 17,337,987 | |||||||
| Capsugel SA PIK (Luxembourg)†(b) | 7.00% | 5/15/2019 | 4,850 | 4,737,844 | |||||||
| 30 | See Notes to Financial Statements. |
Schedule of Investments (continued)
December 31, 2015
| Investments | Interest Rate | Maturity Date | Principal Amount (000) | Fair Value | |||||||
| Pharmaceuticals (continued) | |||||||||||
| Celgene Corp. | 5.00% | 8/15/2045 | $ | 12,695 | $ | 12,793,183 | |||||
| DPx Holdings BV (Netherlands)†(b) | 7.50% | 2/1/2022 | 13,230 | 12,948,862 | |||||||
| Gilead Sciences, Inc. | 2.55% | 9/1/2020 | 11,951 | 11,954,275 | |||||||
| Gilead Sciences, Inc. | 3.50% | 2/1/2025 | 17,075 | 17,236,888 | |||||||
| Gilead Sciences, Inc. | 4.75% | 3/1/2046 | 11,951 | 12,123,632 | |||||||
| Jaguar Holding Co. II/Pharmaceutical Product Development LLC† | 6.375% | 8/1/2023 | 9,484 | 9,270,610 | |||||||
| Mallinckrodt International Finance SA/Mallinckrodt CB LLC (Luxembourg)†(b) | 5.75% | 8/1/2022 | 20,808 | 20,079,720 | |||||||
| Merck & Co., Inc. | 3.70% | 2/10/2045 | 13,832 | 12,806,191 | |||||||
| Pfizer, Inc. | 5.60% | 9/15/2040 | 10,157 | 11,717,176 | |||||||
| Quintiles Transnational Corp.† | 4.875% | 5/15/2023 | 8,812 | 8,900,120 | |||||||
| Roche Holdings, Inc.† | 2.875% | 9/29/2021 | 17,050 | 17,288,734 | |||||||
| Zoetis, Inc. | 3.25% | 2/1/2023 | 13,400 | 12,814,889 | |||||||
| Total | 209,696,351 | ||||||||||
| Property & Casualty 0.19% | |||||||||||
| ACE INA Holdings, Inc. | 4.35% | 11/3/2045 | 7,946 | 8,094,320 | |||||||
| XLIT Ltd. (Ireland)(b) | 4.45% | 3/31/2025 | 8,778 | 8,611,973 | |||||||
| Total | 16,706,293 | ||||||||||
| Rail 0.65% | |||||||||||
| Central Japan Railway Co. (Japan)†(b) | 4.25% | 11/24/2045 | 12,013 | 12,280,373 | |||||||
| China Railway Resources Huitung Ltd. (Hong Kong)(b) | 3.85% | 2/5/2023 | 9,625 | 9,562,207 | |||||||
| Florida East Coast Holdings Corp.† | 6.75% | 5/1/2019 | 22,765 | 20,886,887 | |||||||
| Florida East Coast Holdings Corp.† | 9.75% | 5/1/2020 | 6,306 | 4,319,610 | |||||||
| Watco Cos. LLC/Watco Finance Corp.† | 6.375% | 4/1/2023 | 9,150 | 9,058,500 | |||||||
| Total | 56,107,577 | ||||||||||
| Real Estate Development & Management 0.44% | |||||||||||
| CBRE Services, Inc. | 4.875% | 3/1/2026 | 19,429 | 19,392,046 | |||||||
| CBRE Services, Inc. | 5.00% | 3/15/2023 | 9,645 | 9,705,069 | |||||||
| CBRE Services, Inc. | 5.25% | 3/15/2025 | 8,800 | 8,929,563 | |||||||
| Total | 38,026,678 | ||||||||||
| Real Estate Investment Trusts 1.16% | |||||||||||
| Alexandria Real Estate Equities, Inc. | 4.30% | 1/15/2026 | 7,943 | 7,848,026 | |||||||
| Brixmor Operating Partnership LP | 3.85% | 2/1/2025 | 17,098 | 16,643,552 | |||||||
| Brixmor Operating Partnership LP | 3.875% | 8/15/2022 | 17,218 | 17,163,677 | |||||||
| See Notes to Financial Statements. | 31 |
Schedule of Investments (continued)
December 31, 2015
| Investments | Interest Rate | Maturity Date | Principal Amount (000) | Fair Value | |||||||
| Real Estate Investment Trusts (continued) | |||||||||||
| CubeSmart LP | 4.00% | 11/15/2025 | $ | 7,942 | $ | 7,896,850 | |||||
| Digital Delta Holdings LLC† | 4.75% | 10/1/2025 | 12,013 | 12,142,404 | |||||||
| EPR Properties | 4.50% | 4/1/2025 | 13,507 | 12,863,864 | |||||||
| Goodman Funding Pty Ltd. (Australia)†(b) | 6.00% | 3/22/2022 | 7,850 | 8,734,326 | |||||||
| Jababeka International BV (Netherlands)†(b) | 7.50% | 9/24/2019 | 7,650 | 7,265,251 | |||||||
| Kilroy Realty LP | 3.80% | 1/15/2023 | 8,633 | 8,566,914 | |||||||
| Total | 99,124,864 | ||||||||||
| Recreation & Travel 0.61% | |||||||||||
| Cedar Fair LP/Canada’s Wonderland Co./Magnum Management Corp. | 5.25% | 3/15/2021 | 12,140 | 12,564,900 | |||||||
| NCL Corp. Ltd.† | 5.25% | 11/15/2019 | 4,825 | 4,954,696 | |||||||
| Royal Caribbean Cruises Ltd. | 7.50% | 10/15/2027 | 23,000 | 26,277,500 | |||||||
| Viking Cruises Ltd.† | 8.50% | 10/15/2022 | 9,205 | 8,767,763 | |||||||
| Total | 52,564,859 | ||||||||||
| Restaurants 0.83% | |||||||||||
| Arcos Dorados Holdings, Inc. (Argentina)†(b) | 6.625% | 9/27/2023 | 4,287 | 3,976,192 | |||||||
| McDonald’s Corp. | 2.75% | 12/9/2020 | 3,176 | 3,177,445 | |||||||
| McDonald’s Corp. | 3.70% | 1/30/2026 | 7,546 | 7,555,546 | |||||||
| McDonald’s Corp. | 4.60% | 5/26/2045 | 9,005 | 8,698,398 | |||||||
| McDonald’s Corp. | 4.875% | 12/9/2045 | 7,943 | 8,022,605 | |||||||
| New Red Finance, Inc. (Canada)†(b) | 6.00% | 4/1/2022 | 8,640 | 8,920,800 | |||||||
| PF Chang’s China Bistro, Inc.† | 10.25% | 6/30/2020 | 12,025 | 9,920,625 | |||||||
| Seminole Hard Rock Entertainment, Inc./Seminole Hard Rock International LLC† | 5.875% | 5/15/2021 | 10,150 | 10,175,375 | |||||||
| Yum! Brands, Inc. | 3.75% | 11/1/2021 | 5,506 | 5,071,791 | |||||||
| Yum! Brands, Inc. | 3.875% | 11/1/2023 | 6,871 | 6,095,340 | |||||||
| Total | 71,614,117 | ||||||||||
| Software/Services 3.56% | |||||||||||
| Adobe Systems, Inc. | 3.25% | 2/1/2025 | 11,646 | 11,388,390 | |||||||
| Alibaba Group Holding Ltd. (China)(b) | 3.125% | 11/28/2021 | 18,436 | 17,913,800 | |||||||
| Alibaba Group Holding Ltd. (China)(b) | 3.60% | 11/28/2024 | 16,375 | 15,701,038 | |||||||
| Alliance Data Systems Corp.† | 6.375% | 4/1/2020 | 46,850 | 47,494,187 | |||||||
| Blue Coat Holdings, Inc.† | 8.375% | 6/1/2023 | 9,975 | 10,074,750 | |||||||
| Fidelity National Information Services, Inc. | 5.00% | 10/15/2025 | 20,929 | 21,544,961 | |||||||
| First Data Corp.† | 5.75% | 1/15/2024 | 10,593 | 10,460,588 | |||||||
| First Data Corp.† | 7.00% | 12/1/2023 | 27,015 | 27,082,537 | |||||||
| 32 | See Notes to Financial Statements. |
Schedule of Investments (continued)
December 31, 2015
| Investments | Interest Rate | Maturity Date | Principal Amount (000) | Fair Value | |||||||
| Software/Services (continued) | |||||||||||
| Hewlett-Packard Enterprise Co.† | 4.90% | 10/15/2025 | $ | 13,522 | $ | 13,285,311 | |||||
| Informatica LLC† | 7.125% | 7/15/2023 | 11,195 | 10,187,450 | |||||||
| MasterCard, Inc. | 3.375% | 4/1/2024 | 12,720 | 13,013,069 | |||||||
| Microsoft Corp. | 2.375% | 2/12/2022 | 17,392 | 17,181,365 | |||||||
| Microsoft Corp. | 4.00% | 2/12/2055 | 18,919 | 17,042,027 | |||||||
| MSCI, Inc.† | 5.75% | 8/15/2025 | 9,469 | 9,729,398 | |||||||
| Oracle Corp. | 4.125% | 5/15/2045 | 13,848 | 13,163,161 | |||||||
| Oracle Corp. | 4.375% | 5/15/2055 | 18,518 | 16,986,247 | |||||||
| Priceline Group, Inc. (The) | 3.65% | 3/15/2025 | 18,012 | 17,564,258 | |||||||
| VeriSign, Inc. | 4.625% | 5/1/2023 | 8,760 | 8,525,670 | |||||||
| VeriSign, Inc. | 5.25% | 4/1/2025 | 7,411 | 7,466,583 | |||||||
| Total | 305,804,790 | ||||||||||
| Specialty Retail 0.95% | |||||||||||
| Argos Merger Sub, Inc.† | 7.125% | 3/15/2023 | 18,592 | 18,480,448 | |||||||
| AutoZone, Inc. | 2.50% | 4/15/2021 | 5,600 | 5,470,993 | |||||||
| Brookstone Holdings Corp. PIK | 10.00% | 7/7/2021 | 569 | 392,036 | |||||||
| CST Brands, Inc. | 5.00% | 5/1/2023 | 19,040 | 18,944,800 | |||||||
| Neiman Marcus Group Ltd. LLC† | 8.00% | 10/15/2021 | 22,426 | 16,707,370 | |||||||
| Sally Holdings LLC/Sally Capital, Inc. | 5.50% | 11/1/2023 | 5,050 | 5,188,875 | |||||||
| William Carter Co. (The) | 5.25% | 8/15/2021 | 15,917 | 16,434,302 | |||||||
| Total | 81,618,824 | ||||||||||
| Steel Producers/Products 0.34% | |||||||||||
| Allegheny Ludlum Corp. | 6.95% | 12/15/2025 | 9,977 | 6,036,085 | |||||||
| Allegheny Technologies, Inc. | 9.375% | 6/1/2019 | 3,744 | 3,013,920 | |||||||
| Steel Dynamics, Inc. | 5.125% | 10/1/2021 | 11,950 | 11,113,500 | |||||||
| Steel Dynamics, Inc. | 5.50% | 10/1/2024 | 9,550 | 8,738,250 | |||||||
| Total | 28,901,755 | ||||||||||
| Support: Services 1.46% | |||||||||||
| ADT Corp. (The) | 3.50% | 7/15/2022 | 10,825 | 9,742,500 | |||||||
| AECOM | 5.875% | 10/15/2024 | 9,059 | 9,274,151 | |||||||
| BlueLine Rental Finance Corp.† | 7.00% | 2/1/2019 | 9,273 | 8,392,065 | |||||||
| Compiler Finance Sub, Inc.† | 7.00% | 5/1/2021 | 6,063 | 2,667,720 | |||||||
| Expedia, Inc.† | 5.00% | 2/15/2026 | 27,151 | 26,549,551 | |||||||
| FTI Consulting, Inc. | 6.00% | 11/15/2022 | 10,500 | 11,038,125 | |||||||
| Iron Mountain, Inc.† | 6.00% | 10/1/2020 | 11,950 | 12,637,125 | |||||||
| Jurassic Holdings III, Inc.† | 6.875% | 2/15/2021 | 14,584 | 8,823,320 | |||||||
| See Notes to Financial Statements. | 33 |
Schedule of Investments (continued)
December 31, 2015
| Investments | Interest Rate | Maturity Date | Principal Amount (000) | Fair Value | |||||||
| Support: Services (continued) | |||||||||||
| Light Tower Rentals, Inc.† | 8.125% | 8/1/2019 | $ | 6,095 | $ | 3,138,925 | |||||
| Metropolitan Museum of Art (The) | 3.40% | 7/1/2045 | 13,518 | 12,324,780 | |||||||
| NES Rentals Holdings, Inc.† | 7.875% | 5/1/2018 | 7,800 | 7,137,000 | |||||||
| Sotheby’s† | 5.25% | 10/1/2022 | 14,595 | 13,354,425 | |||||||
| Total | 125,079,687 | ||||||||||
| Technology Hardware & Equipment 0.67% | |||||||||||
| CDW LLC/CDW Finance Corp. | 5.50% | 12/1/2024 | 15,000 | 15,750,000 | |||||||
| CommScope Technologies Finance LLC† | 6.00% | 6/15/2025 | 9,756 | 9,414,540 | |||||||
| CommScope, Inc.† | 5.50% | 6/15/2024 | 16,000 | 15,260,000 | |||||||
| Dell, Inc. | 7.10% | 4/15/2028 | 9,175 | 8,876,812 | |||||||
| Denali Borrower LLC/Denali Finance Corp.† | 5.625% | 10/15/2020 | 8,190 | 8,599,500 | |||||||
| Total | 57,900,852 | ||||||||||
| Telecommunications: Satellite 0.80% | |||||||||||
| Hughes Satellite Systems Corp. | 7.625% | 6/15/2021 | 24,500 | 26,061,875 | |||||||
| Inmarsat Finance plc (United Kingdom)†(b) | 4.875% | 5/15/2022 | 18,507 | 18,090,592 | |||||||
| Intelsat Luxembourg SA (Luxembourg)(b) | 6.75% | 6/1/2018 | 21,448 | 15,978,760 | |||||||
| Intelsat Luxembourg SA (Luxembourg)(b) | 7.75% | 6/1/2021 | 18,368 | 8,678,880 | |||||||
| Total | 68,810,107 | ||||||||||
| Telecommunications: Wireless 2.47% | |||||||||||
| Comcel Trust via Comunicaciones Celulares SA† | 6.875% | 2/6/2024 | 16,550 | 12,826,250 | |||||||
| Crown Castle International Corp. | 5.25% | 1/15/2023 | 14,465 | 15,260,575 | |||||||
| Digicel Group Ltd. (Jamaica)†(b) | 7.125% | 4/1/2022 | 8,500 | 6,417,500 | |||||||
| Digicel Group Ltd. (Jamaica)†(b) | 8.25% | 9/30/2020 | 9,600 | 7,968,000 | |||||||
| Digicel Ltd. (Jamaica)†(b) | 6.75% | 3/1/2023 | 9,966 | 8,371,440 | |||||||
| Digicel Ltd. (Jamaica)†(b) | 7.00% | 2/15/2020 | 16,441 | 15,043,515 | |||||||
| SBA Communications Corp. | 4.875% | 7/15/2022 | 15,080 | 14,910,350 | |||||||
| Sprint Capital Corp. | 6.90% | 5/1/2019 | 8,436 | 6,917,520 | |||||||
| Sprint Communications, Inc. | 7.00% | 8/15/2020 | 3,442 | 2,667,550 | |||||||
| Sprint Corp. | 7.875% | 9/15/2023 | 4,329 | 3,261,902 | |||||||
| T-Mobile USA, Inc. | 6.50% | 1/15/2024 | 42,921 | 43,886,722 | |||||||
| T-Mobile USA, Inc. | 6.50% | 1/15/2026 | 9,271 | 9,382,159 | |||||||
| T-Mobile USA, Inc. | 6.625% | 11/15/2020 | 10,500 | 10,940,895 | |||||||
| T-Mobile USA, Inc. | 6.633% | 4/28/2021 | 20,000 | 20,800,000 | |||||||
| T-Mobile USA, Inc. | 6.836% | 4/28/2023 | 2,192 | 2,274,200 | |||||||
| Telefonica Celular del Paraguay SA (Paraguay)†(b) | 6.75% | 12/13/2022 | 5,630 | 5,165,525 | |||||||
| Wind Acquisition Finance SA (Italy)†(b) | 7.375% | 4/23/2021 | 27,200 | 25,772,000 | |||||||
| Total | 211,866,103 | ||||||||||
| 34 | See Notes to Financial Statements. |
Schedule of Investments (continued)
December 31, 2015
| Investments | Interest Rate | Maturity Date | Principal Amount (000) | Fair Value | |||||||
| Telecommunications: Wireline Integrated & Services 2.08% | |||||||||||
| Columbus International, Inc. (Barbados)†(b) | 7.375% | 3/30/2021 | $ | 12,134 | $ | 12,058,163 | |||||
| Consolidated Communications, Inc. | 6.50% | 10/1/2022 | 8,667 | 7,323,615 | |||||||
| Equinix, Inc. | 5.375% | 4/1/2023 | 19,410 | 19,895,250 | |||||||
| Equinix, Inc. | 5.875% | 1/15/2026 | 8,772 | 9,057,090 | |||||||
| Frontier Communications Corp. | 6.875% | 1/15/2025 | 21,925 | 18,142,937 | |||||||
| Frontier Communications Corp. | 7.625% | 4/15/2024 | 7,800 | 6,591,000 | |||||||
| Frontier Communications Corp. | 9.25% | 7/1/2021 | 9,810 | 9,675,113 | |||||||
| Frontier Communications Corp.† | 10.50% | 9/15/2022 | 18,087 | 18,064,391 | |||||||
| Frontier Communications Corp.† | 11.00% | 9/15/2025 | 34,779 | 34,518,157 | |||||||
| GCI, Inc. | 6.875% | 4/15/2025 | 11,071 | 11,375,453 | |||||||
| Hellas Telecommunications Luxembourg II SCA (Luxembourg)†(b)(c) | Zero Coupon | 1/15/2015 | 15,000 | 1,500 | |||||||
| Sable International Finance Ltd.† | 6.875% | 8/1/2022 | 8,896 | 8,629,120 | |||||||
| Telecom Italia SpA (Italy)†(b) | 5.303% | 5/30/2024 | 9,565 | 9,481,306 | |||||||
| Zayo Group LLC/Zayo Capital, Inc. | 6.00% | 4/1/2023 | 14,062 | 13,358,900 | |||||||
| Total | 178,171,995 | ||||||||||
| Theaters & Entertainment 0.45% | |||||||||||
| Activision Blizzard, Inc.† | 5.625% | 9/15/2021 | 16,442 | 17,264,100 | |||||||
| Activision Blizzard, Inc.† | 6.125% | 9/15/2023 | 20,090 | 21,345,625 | |||||||
| Total | 38,609,725 | ||||||||||
| Tobacco 0.40% | |||||||||||
| Altria Group, Inc. | 5.375% | 1/31/2044 | 8,008 | 8,645,901 | |||||||
| Reynolds American, Inc. | 4.45% | 6/12/2025 | 12,514 | 13,112,207 | |||||||
| Reynolds American, Inc. | 5.85% | 8/15/2045 | 11,516 | 12,849,875 | |||||||
| Total | 34,607,983 | ||||||||||
| Transportation: Infrastructure/Services 0.26% | |||||||||||
| Autoridad del Canal de Panama (Panama)†(b) | 4.95% | 7/29/2035 | 8,750 | 9,056,250 | |||||||
| XPO Logistics, Inc.† | 6.50% | 6/15/2022 | 5,276 | 4,900,085 | |||||||
| XPO Logistics, Inc.† | 7.875% | 9/1/2019 | 8,251 | 8,420,311 | |||||||
| Total | 22,376,646 | ||||||||||
| Total High Yield Corporate Bonds (cost $6,555,846,765) | 6,220,814,990 | ||||||||||
| MUNICIPAL BOND 0.18% | |||||||||||
| Other Revenue | |||||||||||
| New York City Indus Dev Agy† (cost $11,675,000) | 11.00% | 3/1/2029 | 11,675 | 15,463,771 | |||||||
| See Notes to Financial Statements. | 35 |
Schedule of Investments (continued)
December 31, 2015
| Investments | Interest Rate | Maturity Date | Principal Amount (000) | Fair Value | |||||||
| NON-AGENCY COMMERCIAL MORTGAGE-BACKED SECURITIES 4.53% | |||||||||||
| Banc of America Commercial Mortgage Trust 2015-UBS7 D | 3.167% | 9/15/2048 | $ | 3,202 | $ | 2,361,872 | |||||
| BB-UBS Trust 2012-SHOW E† | 4.16% | # | 11/5/2036 | 18,583 | 17,904,403 | ||||||
| BBCMS Trust 2015-VFM A2† | 3.375% | 3/12/2036 | 4,025 | 4,040,194 | |||||||
| BBCMS Trust 2015-VFM D† | 3.483% | # | 3/12/2036 | 9,511 | 9,093,705 | ||||||
| Citigroup Commercial Mortgage Trust 2014-GC25 B | 4.345% | 10/10/2047 | 5,735 | 5,836,593 | |||||||
| Citigroup Commercial Mortgage Trust 2014-GC25 C | 4.533% | # | 10/10/2047 | 12,250 | 11,861,202 | ||||||
| Citigroup Commercial Mortgage Trust 2015-101A D† | 4.625% | # | 1/14/2043 | 8,025 | 7,626,569 | ||||||
| Citigroup Commercial Mortgage Trust 2015-101A F† | 4.625% | # | 1/14/2043 | 19,000 | 12,665,685 | ||||||
| Citigroup Commercial Mortgage Trust 2015-101A G† | 4.625% | # | 1/14/2043 | 4,000 | 2,531,100 | ||||||
| Commercial Mortgage Pass-Through Certificates 2013-WWP D† | 3.898% | 3/10/2031 | 11,825 | 11,747,400 | |||||||
| Commercial Mortgage Pass-Through Certificates 2014-CR20 C | 4.507% | # | 11/10/2047 | 8,297 | 8,122,011 | ||||||
| Commercial Mortgage Pass-Through Certificates 2014-CR20 XB IO† | 0.114% | # | 11/10/2047 | 109,074 | 1,140,598 | ||||||
| Commercial Mortgage Pass-Through Certificates 2014-CR20 XC IO† | 1.285% | # | 11/10/2047 | 8,108 | 810,250 | ||||||
| Commercial Mortgage Pass-Through Certificates 2014-CR21 XB IO† | 0.044% | # | 12/10/2047 | 66,866 | 414,837 | ||||||
| Commercial Mortgage Pass-Through Certificates 2014-CR21 XC IO† | 0.50% | 12/10/2047 | 32,211 | 1,133,183 | |||||||
| Commercial Mortgage Pass-Through Certificates 2014-UBS5 C | 4.612% | # | 9/10/2047 | 6,250 | 6,191,940 | ||||||
| Commercial Mortgage Pass-Through Certificates 2014-UBS6 B | 4.349% | 12/10/2047 | 6,725 | 6,833,798 | |||||||
| Commercial Mortgage Pass-Through Certificates 2014-UBS6 C | 4.466% | # | 12/10/2047 | 27,675 | 26,313,761 | ||||||
| Commercial Mortgage Pass-Through Certificates 2014-UBS6 XA IO | 1.073% | # | 12/10/2047 | 132,879 | 8,321,148 | ||||||
| Commercial Mortgage Pass-Through Certificates 2015-PC1 D | 4.443% | # | 7/10/2050 | 12,037 | 9,463,047 | ||||||
| Credit Suisse Mortgage Capital Certificates 2014-USA E† | 4.373% | 9/15/2037 | 4,400 | 4,001,659 | |||||||
| DBUBS Mortgage Trust 2011-LC2A D† | 5.453% | # | 7/10/2044 | 11,313 | 11,834,392 | ||||||
| Great Wolf Trust 2015-WFMZ M† | 7.319% | # | 5/15/2032 | 19,650 | 19,303,865 | ||||||
| 36 | See Notes to Financial Statements. |
Schedule of Investments (continued)
December 31, 2015
| Investments | Interest Rate | Maturity Date | Principal Amount (000) | Fair Value | |||||||
| NON-AGENCY COMMERCIAL MORTGAGE-BACKED SECURITIES (continued) | |||||||||||
| GS Mortgage Securities Trust 2014-GC26 D† | 4.511% | # | 11/10/2047 | $ | 12,825 | $ | 10,844,344 | ||||
| Impact Funding Affordable Multifamily Housing Mortgage Loan Trust 2010-1 B† | 6.00% | 1/25/2051 | 7,835 | 8,620,973 | |||||||
| Impact Funding Affordable Multifamily Housing Mortgage Loan Trust 2010-1 C† | 6.378% | # | 1/25/2051 | 7,457 | 7,792,492 | ||||||
| Impact Funding Affordable Multifamily Housing Mortgage Loan Trust 2014-1A XB IO† | 0.342% | # | 8/25/2047 | 20,727 | 702,010 | ||||||
| JPMorgan Chase Commercial Mortgage Securities Trust 2014-C24 XB1 IO | 0.311% | # | 11/15/2047 | 61,028 | 1,515,460 | ||||||
| JPMorgan Chase Commercial Mortgage Securities Trust 2014-C26 D† | 3.927% | # | 1/15/2048 | 12,000 | 9,108,836 | ||||||
| JPMorgan Chase Commercial Mortgage Securities Trust 2014-C26 XB IO | 0.476% | # | 1/15/2048 | 53,645 | 1,972,629 | ||||||
| JPMorgan Chase Commercial Mortgage Securities Trust 2014-C26 XD IO† | 0.50% | 1/15/2048 | 42,779 | 1,612,554 | |||||||
| JPMorgan Chase Commercial Mortgage Securities Trust 2014-DSTY D† | 3.805% | # | 6/10/2027 | 8,000 | 7,818,946 | ||||||
| JPMorgan Chase Commercial Mortgage Securities Trust 2014-FL4 D† | 3.431% | # | 12/15/2030 | 10,000 | 9,979,156 | ||||||
| JPMorgan Chase Commercial Mortgage Securities Trust 2015-C31 C | 4.619% | # | 8/15/2048 | 14,027 | 12,942,721 | ||||||
| JPMorgan Chase Commercial Mortgage Securities Trust 2015-CSMO E† | 4.281% | # | 1/15/2032 | 11,775 | 11,628,633 | ||||||
| Morgan Stanley Bank of America Merrill Lynch Trust 2013-C10 C | 4.081% | # | 7/15/2046 | 4,800 | 4,694,568 | ||||||
| Morgan Stanley Bank of America Merrill Lynch Trust 2013-C9 C | 4.073% | # | 5/15/2046 | 5,325 | 5,253,033 | ||||||
| Morgan Stanley Bank of America Merrill Lynch Trust 2014-C19 C | 4.00% | 12/15/2047 | 8,781 | 8,345,491 | |||||||
| Morgan Stanley Bank of America Merrill Lynch Trust 2014-C19 LNC1† | 3.989% | 12/15/2046 | 7,925 | 7,778,007 | |||||||
| Morgan Stanley Bank of America Merrill Lynch Trust 2014-C19 LNC2† | 4.384% | 12/15/2046 | 16,405 | 16,283,200 | |||||||
| Morgan Stanley Bank of America Merrill Lynch Trust 2014-C19 LNC4† | 4.75% | 12/15/2046 | 7,540 | 7,027,990 | |||||||
| Morgan Stanley Bank of America Merrill Lynch Trust 2014-C19 LNCX IO† | 0.602% | 12/15/2046 | 40,750 | 1,693,908 | |||||||
| Morgan Stanley Bank of America Merrill Lynch Trust 2014-C19 XC IO† | 0.442% | # | 12/15/2047 | 86,781 | 3,193,281 | ||||||
| Motel 6 Trust 2015-MTL6 D† | 4.532% | 2/5/2030 | 5,100 | 5,025,832 | |||||||
| See Notes to Financial Statements. | 37 |
Schedule of Investments (continued)
December 31, 2015
| Investments | Interest Rate | Maturity Date | Principal Amount (000) | Fair Value | |||||||
| NON-AGENCY COMMERCIAL MORTGAGE-BACKED SECURITIES (continued) | |||||||||||
| SFAVE Commercial Mortgage Securities Trust 2015-5AVE A1† | 3.872% | # | 1/5/2035 | $ | 4,012 | $ | 3,961,784 | ||||
| SFAVE Commercial Mortgage Securities Trust 2015-5AVE A2B† | 4.144% | # | 1/5/2035 | 8,350 | 7,993,838 | ||||||
| SFAVE Commercial Mortgage Securities Trust 2015-5AVE XA IO† | 0.599% | # | 1/5/2035 | 374,445 | 24,269,653 | ||||||
| Wells Fargo Commercial Mortgage Trust 2014-LC18 XB IO | 0.396% | # | 12/15/2047 | 66,701 | 2,146,476 | ||||||
| Wells Fargo Commercial Mortgage Trust 2015-C27 C | 3.894% | 2/15/2048 | 9,100 | 8,208,875 | |||||||
| Wells Fargo Commercial Mortgage Trust 2015-LC20 D† | 4.366% | # | 4/15/2050 | 3,550 | 2,876,799 | ||||||
| WFCG Commercial Mortgage Trust 2015-BXRP E† | 3.471% | # | 11/15/2029 | 6,051 | 5,982,898 | ||||||
| Total Non-Agency Commercial Mortgage-Backed Securities (cost $399,494,665) | 388,827,599 | ||||||||||
| Total Long-Term Investments (cost $8,736,049,581) | 8,375,337,338 | ||||||||||
| SHORT-TERM INVESTMENT 1.26% | |||||||||||
| REPURCHASE AGREEMENT | |||||||||||
| Repurchase Agreement dated 12/31/2015, 0.03% due 1/4/2016 with Fixed Income Clearing Corp. collateralized by $110,325,000 of U.S. Treasury Note at 1.75% due 12/31/2020; value: $110,187,094; proceeds: $108,025,859 (cost $108,025,499) | 108,025 | 108,025,499 | |||||||||
| Total Investments in Securities 98.86% (cost $8,844,075,080) | 8,483,362,837 | ||||||||||
| Cash and Other Assets in Excess of Liabilities(g) 1.14% | 97,960,985 | ||||||||||
| Net Assets 100.00% | $ | 8,581,323,822 | |||||||||
| AUD | Australian dollar. | |
| BRL | Brazilian real. | |
| CAD | Canadian dollar. | |
| EUR | euro. | |
| GBP | British pound. | |
| JPY | Japanese yen. | |
| MXN | Mexican peso. | |
| ADR | American Depositary Receipt. | |
| IO | Interest Only. | |
| PIK | Payment-in-kind. | |
| † | Security was purchased pursuant to Rule 144A under the Securities Act of 1933 and, unless registered under such Act or exempted from registration, may only be resold to qualified institutional buyers. | |
| # | Variable rate security. The interest rate represents the rate in effect at December 31, 2015. | |
| * | Non-income producing security. | |
| (a) | Investment in non-U.S. dollar denominated securities. | |
| (b) | Foreign security traded in U.S. dollars. |
| 38 | See Notes to Financial Statements. |
Schedule of Investments (continued)
December 31, 2015
| (c) | Defaulted (non-income producing security). | |
| (d) | Floating Rate Loans in which the Fund invests generally pay interest at rates which are periodically re-determined at a margin above the London Interbank Offered Rate (“LIBOR”) or the prime rate offered by major U.S. banks. The rate(s) shown is the rate(s) in effect at December 31, 2015. | |
| (e) | Security is perpetual in nature and has no stated maturity. | |
| (f) | Debenture pays interest at an annual fixed rate of 8.00% through June 15, 2020. Thereafter, interest will be paid at an annual floating rate of 3-month LIBOR plus 6.405% through December 29, 2049. This debenture is subject to full redemption at the option of the issuer any time prior to December 29, 2049. | |
| (g) | Cash and Other Assets in Excess of Liabilities include net unrealized appreciation/depreciation on forward foreign currency exchange contracts, futures contracts and swaps as follows: |
Open Forward Foreign Currency Exchange Contracts at December 31, 2015:
| Forward Foreign Currency Exchange Contracts | Transaction Type | Counterparty | Expiration Date | Foreign Currency | U.S. $ Cost on Origination Date | U.S. $ Current Value | Unrealized Appreciation | |||||||||||||||
| Australian dollar | Buy | State Street Bank and Trust | 1/12/2016 | 1,740,000 | $ | 1,255,925 | $ | 1,267,520 | $ | 11,595 | ||||||||||||
| Canadian dollar | Buy | Morgan Stanley | 2/19/2016 | 520,000 | 375,180 | 375,848 | 668 | |||||||||||||||
| Japanese yen | Buy | J.P. Morgan | 3/4/2016 | 26,300,000 | 217,974 | 219,076 | 1,102 | |||||||||||||||
| British pound | Sell | J.P. Morgan | 1/20/2016 | 410,000 | 609,839 | 604,448 | 5,391 | |||||||||||||||
| British pound | Sell | Standard Chartered Bank | 1/20/2016 | 14,200,000 | �� | 21,929,003 | 20,934,539 | 994,464 | ||||||||||||||
| Canadian dollar | Sell | J.P. Morgan | 2/19/2016 | 20,600,000 | 15,446,218 | 14,889,368 | 556,850 | |||||||||||||||
| euro | Sell | J.P. Morgan | 3/11/2016 | 36,600,000 | 40,194,940 | 39,840,705 | 354,235 | |||||||||||||||
| Unrealized Appreciation on Forward Foreign Currency Exchange Contracts | $ | 1,924,305 | ||||||||||||||||||||
| Forward | ||||||||||||||||||||||
| Foreign | U.S. $ | |||||||||||||||||||||
| Currency | Cost on | U.S. $ | ||||||||||||||||||||
| Exchange | Transaction | Expiration | Foreign | Origination | Current | Unrealized | ||||||||||||||||
| Contracts | Type | Counterparty | Date | Currency | Date | Value | Depreciation | |||||||||||||||
| euro | Buy | Morgan Stanley | 2/16/2016 | 1,470,000 | $ | 1,604,577 | $ | 1,599,180 | $ | (5,397) | ||||||||||||
| Australian dollar | Sell | J.P. Morgan | 1/12/2016 | 1,740,000 | 1,214,812 | 1,267,520 | (52,708) | |||||||||||||||
| euro | Sell | J.P. Morgan | 2/16/2016 | 26,000,000 | 27,991,106 | 28,284,821 | (293,715) | |||||||||||||||
| euro | Sell | Morgan Stanley | 2/16/2016 | 8,660,000 | 9,345,019 | 9,421,021 | (76,002) | |||||||||||||||
| Japanese yen | Sell | J.P. Morgan | 3/4/2016 | 553,195,000 | 4,488,454 | 4,608,040 | (119,586) | | ||||||||||||||
| Unrealized Depreciation on Forward Foreign Currency Exchange Contracts | $ | (547,408) | ||||||||||||||||||||
Open Futures Contracts at December 31, 2015:
| Type | Expiration | Contracts | Position | Fair Value | Unrealized Appreciation | |||||||||||
| U.S. 10-Year Treasury Note | �� | March 2016 | 9,324 | Short | $(1,173,949,875) | $ | 2,597,758 | |||||||||
| Type | Expiration | Contracts | Position | Fair Value | Unrealized Depreciation | |||||||||||
| U.S. 5-Year Treasury Note | March 2016 | 7,638 | Long | $ | 903,730,551 | $ | (2,161,630) | |||||||||
| Long U.S. Treasury Bond | March 2016 | 2,723 | Short | (418,661,250) | (472,814) | |||||||||||
| Totals | $ | 485,069,301 | $ | (2,634,444) | ||||||||||||
| See Notes to Financial Statements. | 39 |
Schedule of Investments (continued)
December 31, 2015
Credit Default Swaps—Sell Protection at December 31, 2015(1):
| Referenced Issuer | Fund Receives | Termination Date | Notional Amount | Fair Value(2) | Payments Upfront(3) | Unrealized Depreciation | Credit Default Swap Agreements Payable at Fair Value(4) | ||||||||
| JC Penney Co., Inc.(5) | 5.00% | 12/20/2020 | $12,809,000 | $10,652,386 | $(729,871) | $(1,426,743) | $(2,156,614) |
| (1) | If the Fund is a seller of protection and a credit event occurs, as defined under the terms of that particular swap agreement, the Fund will either (i) pay to the buyer of protection an amount equal to the notional amount of the swap and take delivery of the referenced obligation or underlying securities comprising the referenced index or (ii) pay a net settlement amount in the form of cash or securities equal to the notional amount of the swap less the recovery value of the referenced obligation or underlying securities. |
| (2) | Fair value serves as the indicator of the current status of payment/performance risk. |
| (3) | Upfront payments received are presented net of amortization (See Note 2(i)). |
| (4) | Includes upfront payments received. |
| (5) | Swap Counterparty: Barclays Bank plc. Moody’s Credit Rating: Caa2 |
| 40 | See Notes to Financial Statements. |
Schedule of Investments (continued)
December 31, 2015
The following is a summary of the inputs used as of December 31, 2015 in valuing the Fund’s investments carried at fair value(1):
| Investment Type(2)(3) | Level 1 | Level 2 | Level 3 | Total | ||||||||||||
| Asset-Backed Securities | $ | – | $ | 51,751,430 | $ | – | $ | 51,751,430 | ||||||||
| Common Stocks | ||||||||||||||||
| Auto Parts & Equipment | 8,950,830 | 17,372,672 | – | 26,323,502 | ||||||||||||
| Energy: Exploration & Production | 34,367,217 | 477,431 | – | 34,844,648 | ||||||||||||
| Media: Content | 28,748,143 | – | 1,135,895 | (4) | 29,884,038 | |||||||||||
| Metals/Mining (Excluding Steel) | – | – | 227,849 | (4) | 227,849 | |||||||||||
| Personal & Household Products | 21,762,592 | 4,335,863 | – | 26,098,455 | ||||||||||||
| Specialty Retail | 52,834,634 | 8,166,713 | – | 61,001,347 | ||||||||||||
| Remaining Industries | 975,629,783 | – | – | 975,629,783 | ||||||||||||
| Convertible Bonds | – | |||||||||||||||
| Energy: Exploration & Production | – | – | 796,783 | (4) | 796,783 | |||||||||||
| Remaining Industries | – | 63,460,531 | – | 63,460,531 | ||||||||||||
| Convertible Preferred Stocks | ||||||||||||||||
| Building & Construction | – | 9,387,360 | – | 9,387,360 | ||||||||||||
| Food: Wholesale | – | 9,075,537 | – | 9,075,537 | ||||||||||||
| Gas Distribution | 12,930,255 | – | – | 12,930,255 | ||||||||||||
| Floating Rate Loans(5) | ||||||||||||||||
| Auto Parts & Equipment | – | – | 8,137,590 | 8,137,590 | ||||||||||||
| Consumer/Commercial/Lease Financing | – | 8,551,710 | – | 8,551,710 | ||||||||||||
| Electronics | – | 24,322,106 | – | 24,322,106 | ||||||||||||
| Energy: Exploration & Production | – | 8,992,201 | – | 8,992,201 | ||||||||||||
| Gaming | – | 8,720,972 | 15,167,250 | 23,888,222 | ||||||||||||
| Health Facilities | – | 13,661,723 | – | 13,661,723 | ||||||||||||
| Metals/Mining (Excluding Steel) | – | 16,535,016 | – | 16,535,016 | ||||||||||||
| Packaging | – | 12,051,523 | – | 12,051,523 | ||||||||||||
| Personal & Household Products | – | 9,658,070 | – | 9,658,070 | ||||||||||||
| Pharmaceuticals | – | 8,643,005 | – | 8,643,005 | ||||||||||||
| Recreation & Travel | – | 8,523,765 | – | 8,523,765 | ||||||||||||
| Software/Services | – | 8,415,241 | – | 8,415,241 | ||||||||||||
| Specialty Retail | – | 11,943,288 | – | 11,943,288 | ||||||||||||
| Technology Hardware & Equipment | – | 607,027 | – | 607,027 | ||||||||||||
| Telecommunications: Wireline Integrated & Services | – | 9,511,031 | – | 9,511,031 | ||||||||||||
| Theaters & Entertainment | – | 16,489,827 | – | 16,489,827 | ||||||||||||
| Foreign Bonds | – | 62,036,611 | – | 62,036,611 | ||||||||||||
| Foreign Government Obligations | – | 196,851,504 | – | 196,851,504 | ||||||||||||
| High Yield Corporate Bonds | ||||||||||||||||
| Automakers | – | – | 1,500 | (4) | 1,500 | |||||||||||
| Banking | – | 636,488,673 | 2,250 | (4) | 636,490,923 | |||||||||||
| Metals/Mining (Excluding Steel) | – | 154,564,641 | 18 | (4) | 154,564,659 | |||||||||||
| Specialty Retail | – | 81,226,788 | 392,036 | (6) | 81,618,824 | |||||||||||
| Telecommunications: Wireline Integrated & Services | – | 178,170,495 | 1,500 | (4) | 178,171,995 | |||||||||||
| Remaining Industries | – | 5,169,967,089 | – | 5,169,967,089 | ||||||||||||
| Municipal Bond | – | 15,463,771 | – | 15,463,771 | ||||||||||||
| Non-Agency Commercial Mortgage-Backed Securities | – | 379,016,753 | 9,810,846 | (6) | 388,827,599 | |||||||||||
| Repurchase Agreement | – | 108,025,499 | – | 108,025,499 | ||||||||||||
| Total | $ | 1,135,223,454 | $ | 7,312,465,866 | $ | 35,673,517 | $ | 8,483,362,837 | ||||||||
| See Notes to Financial Statements. | 41 |
Schedule of Investments (concluded)
December 31, 2015
| Other Financial Instruments | Level 1 | Level 2 | Level 3 | Total | ||||||||||||
| Credit Default Swap | ||||||||||||||||
| Assets | $ | – | $ | – | $ | – | $ | – | ||||||||
| Liabilities | – | (2,156,614 | ) | – | (2,156,614 | ) | ||||||||||
| Forward Foreign Currency Exchange Contracts | ||||||||||||||||
| Assets | – | 1,924,305 | – | 1,924,305 | ||||||||||||
| Liabilities | – | (547,408 | ) | – | (547,408 | ) | ||||||||||
| Futures Contracts | ||||||||||||||||
| Assets | 2,597,758 | – | – | 2,597,758 | ||||||||||||
| Liabilities | (2,634,444 | ) | – | – | (2,634,444 | ) | ||||||||||
| Total | $ | (36,686 | ) | $ | (779,717 | ) | $ | – | $ | (816,403 | ) | |||||
| (1) | Refer to Note 2(n) for a description of fair value measurements and the three-tier hierarchy of inputs. | |
| (2) | See Schedule of Investments for fair values in each industry and identification of foreign issuers and/or geography. The table above is presented by Investment Type. Industries are presented within an Investment Type should such Investment Type include securities classified as two or more levels within the three-tier fair value hierarchy. | |
| (3) | There were no Level 1/Level 2 transfers during the fiscal year ended December 31, 2015. | |
| (4) | Level 3 securities fair valued by the Pricing Committee, as described in Note 2(a) in the Notes to Financial Statements. | |
| (5) | Floating Rate Loans categorized as Level 3 are valued based on a single quotation obtained from a dealer. | |
| Accounting principles generally accepted in the United States of America do not require the Fund to create quantitative unobservable inputs that were not developed by the Fund. Therefore, the Fund does not have access to unobservable inputs and cannot disclose such inputs in the valuation. | ||
| (6) | Includes securities (Brookstone Holdings Corp. PIK (High Yield Corporate Bonds), Impact Funding Affordable Multifamily Housing Mortgage Loan Trust 2014-1A XB IO (Non-Agency Commercial Mortgage-Backed Securities) and JPMorgan Chase Commercial Mortgage Securities Trust 2014-C26 D (Non-Agency Commercial Mortgage-Backed Securities)) valued utilizing third party pricing information without adjustment. Such valuations are based on unobservable inputs. A significant change in third party information could result in a significantly lower or higher value of such Level 3 investments. |
The following is a reconciliation of investments with unobservable inputs (Level 3) that were used in determining fair value:
| Investment Type | Common Stocks | Convertible Bonds | Floating Rate Loans | High Yield Corporate Bonds | Non-Agency Commercial Mortgage- Backed Securities | Total Return Swap | ||||||||||||||||||
| Balance as of January 1, 2015 | $ | 1,587,299 | $ | – | $ | 36,173,628 | $ | 558,144 | $ | – | $ | 908,278 | ||||||||||||
| Accrued discounts/premiums | – | – | 56,485 | – | (4,328) | – | ||||||||||||||||||
| Realized gain (loss) | – | – | (52,262) | 14,142 | 130,976 | (503,687) | ||||||||||||||||||
| Change in unrealized appreciation/depreciation | (223,555) | (631,489) | (256,930) | (179,249) | (1,188,659) | 992,207 | ||||||||||||||||||
| Purchases | – | 1,428,272 | 26,020,888 | 28,921 | – | – | ||||||||||||||||||
| Sales | – | – | (38,636,969) | (24,654) | (2,835,125) | (1,396,798) | ||||||||||||||||||
| Net transfers in or out of Level 3 | – | – | – | – | 13,707,982 | – | ||||||||||||||||||
| Balance as of December 31, 2015 | $ | 1,363,744 | $ | 796,783 | $ | 23,304,840 | $ | 397,304 | $ | 9,810,846 | $ | – | ||||||||||||
| 42 | See Notes to Financial Statements. |
Statement of Assets and Liabilities
December 31, 2015
| ASSETS: | ||||
| Investments in securities, at fair value (cost $8,844,075,080) | $ | 8,483,362,837 | ||
| Deposits with brokers for derivatives collateral | 20,834,796 | |||
| Cash | 4,674,966 | |||
| Receivables: | ||||
| Interest and dividends | 106,425,930 | |||
| Investment securities sold | 71,862,797 | |||
| Capital shares sold | 53,750,376 | |||
| Unrealized appreciation on forward foreign currency exchange contracts | 1,924,305 | |||
| Prepaid expenses and other assets | 185,045 | |||
| Total assets | 8,743,021,052 | |||
| LIABILITIES: | ||||
| Payables: | ||||
| Investment securities purchased | 78,172,720 | |||
| Capital shares reacquired | 34,186,373 | |||
| Management fee | 3,367,738 | |||
| Variation margin | 3,055,418 | |||
| 12b-1 distribution plan | 3,040,190 | |||
| Directors’ fees | 1,755,939 | |||
| Fund administration | 297,467 | |||
| Unrealized depreciation on forward foreign currency exchange contracts | 547,408 | |||
| Credit default swap agreements payable, at fair value (including upfront payments received of $729,871) | 2,156,614 | |||
| Distributions payable | 33,560,808 | |||
| Accrued expenses | 1,556,555 | |||
| Total liabilities | 161,697,230 | |||
| NET ASSETS | $ | 8,581,323,822 | ||
| COMPOSITION OF NET ASSETS: | ||||
| Paid-in capital | $ | 9,062,144,982 | ||
| Undistributed net investment income | 23,055,113 | |||
| Accumulated net realized loss on investments, futures contracts, swaps and foreign currency related transactions | (143,058,441 | ) | ||
| Net unrealized depreciation on investments, futures contracts, swaps and translation of assets and liabilities denominated in foreign currencies | (360,817,832 | ) | ||
| Net Assets | $ | 8,581,323,822 |
| See Notes to Financial Statements. | 43 |
Statement of Assets and Liabilities (concluded)
December 31, 2015
| Net assets by class: | ||||
| Class A Shares | $ | 4,183,669,097 | ||
| Class B Shares | $ | 80,073,460 | ||
| Class C Shares | $ | 1,882,588,837 | ||
| Class F Shares | $ | 1,893,641,824 | ||
| Class I Shares | $ | 382,853,591 | ||
| Class P Shares | $ | 35,631,640 | ||
| Class R2 Shares | $ | 4,074,665 | ||
| Class R3 Shares | $ | 107,580,546 | ||
| Class R4 Shares | $ | 206,728 | ||
| Class R5 Shares | $ | 9,556 | ||
| Class R6 Shares | $ | 10,993,878 | ||
| Outstanding shares by class: | ||||
| Class A Shares (1.14 billion shares of common stock authorized, $.001 par value) | 565,146,997 | |||
| Class B Shares (500 million shares of common stock authorized, $.001 par value) | 10,777,642 | |||
| Class C Shares (600 million shares of common stock authorized, $.001 par value) | 253,648,616 | |||
| Class F Shares (600 million shares of common stock authorized, $.001 par value) | 256,160,294 | |||
| Class I Shares (300 million shares of common stock authorized, $.001 par value) | 51,998,787 | |||
| Class P Shares (160 million shares of common stock authorized, $.001 par value) | 4,707,677 | |||
| Class R2 Shares (300 million shares of common stock authorized, $.001 par value) | 550,416 | |||
| Class R3 Shares (300 million shares of common stock authorized, $.001 par value) | 14,556,061 | |||
| Class R4 Shares (300 million shares of common stock authorized, $.001 par value) | 27,927 | |||
| Class R5 Shares (300 million shares of common stock authorized, $.001 par value) | 1,297.51 | |||
| Class R6 Shares (300 million shares of common stock authorized, $.001 par value) | 1,492,069 | |||
| Net asset value, offering and redemption price per share (Net assets divided by outstanding shares): | ||||
| Class A Shares-Net asset value | $7.40 | |||
| Class A Shares-Maximum offering price (Net asset value plus sales charge of 2.25%) | $7.57 | |||
| Class B Shares-Net asset value | $7.43 | |||
| Class C Shares-Net asset value | $7.42 | |||
| Class F Shares-Net asset value | $7.39 | |||
| Class I Shares-Net asset value | $7.36 | |||
| Class P Shares-Net asset value | $7.57 | |||
| Class R2 Shares-Net asset value | $7.40 | |||
| Class R3 Shares-Net asset value | $7.39 | |||
| Class R4 Shares-Net asset value | $7.40 | |||
| Class R5 Shares-Net asset value | $7.36 | |||
| Class R6 Shares-Net asset value | $7.37 |
| 44 | See Notes to Financial Statements. |
For the Year Ended December 31, 2015
| Investment income: | ||||
| Dividends (net of foreign withholding taxes of $65,844) | $ | 10,734,264 | ||
| Interest and other | 450,189,409 | |||
| Total investment income | 460,923,673 | |||
| Expenses: | ||||
| Management fee | 42,382,907 | |||
| 12b-1 distribution plan-Class A | 9,217,163 | |||
| 12b-1 distribution plan-Class B | 1,055,358 | |||
| 12b-1 distribution plan-Class C | 17,048,783 | |||
| 12b-1 distribution plan-Class F | 1,979,974 | |||
| 12b-1 distribution plan-Class P | 102,153 | |||
| 12b-1 distribution plan-Class R2 | 25,068 | |||
| 12b-1 distribution plan-Class R3 | 525,464 | |||
| 12b-1 distribution plan-Class R4 | 114 | |||
| Shareholder servicing | 9,169,940 | |||
| Fund administration | 3,745,147 | |||
| Reports to shareholders | 657,575 | |||
| Registration | 442,214 | |||
| Directors’ fees | 339,142 | |||
| Custody | 180,553 | |||
| Professional | 165,130 | |||
| Other | 1,070,838 | |||
| Gross expenses | 88,107,523 | |||
| Expense reductions (See Note 9) | (9,693 | ) | ||
| Net expenses | 88,097,830 | |||
| Net investment income | 372,825,843 | |||
| Net realized and unrealized loss: | ||||
| Net realized loss on investments | (93,934,668 | ) | ||
| Net realized loss on futures contracts, swaps and foreign currency related transactions | (4,440,524 | ) | ||
| Net change in unrealized appreciation/depreciation on investments | (429,696,583 | ) | ||
| Net change in unrealized appreciation/depreciation on futures contracts, swaps and translation of assets and liabilities denominated in foreign currencies | (1,640,370 | ) | ||
| Net realized and unrealized loss | (529,712,145 | ) | ||
| Net Decrease in Net Assets Resulting From Operations | $ | (156,886,302 | ) |
| See Notes to Financial Statements. | 45 |
Statements of Changes in Net Assets
| INCREASE (DECREASE) IN NET ASSETS | For the Year Ended December 31, 2015 | For the Year Ended December 31, 2014 | ||||||
| Operations: | ||||||||
| Net investment income | $ | 372,825,843 | $ | 400,699,151 | ||||
| Net realized gain (loss) on investments, futures contracts, swaps and foreign currency related transactions | (98,375,192 | ) | 301,392,405 | |||||
| Net change in unrealized appreciation/depreciation on investments, futures contracts, swaps and translation of assets and liabilities denominated in foreign currencies | (431,336,953 | ) | (333,811,406 | ) | ||||
| Net increase (decrease) in net assets resulting from operations | (156,886,302 | ) | 368,280,150 | |||||
| Distributions to shareholders from: | ||||||||
| Net investment income | ||||||||
| Class A | (203,135,407 | ) | (227,643,227 | ) | ||||
| Class B | (3,814,136 | ) | (5,902,759 | ) | ||||
| Class C | (77,242,195 | ) | (85,063,403 | ) | ||||
| Class F | (89,080,739 | ) | (72,907,390 | ) | ||||
| Class I | (21,509,682 | ) | (19,616,364 | ) | ||||
| Class P | (1,780,961 | ) | (3,483,623 | ) | ||||
| Class R2 | (167,864 | ) | (155,113 | ) | ||||
| Class R3 | (4,352,757 | ) | (4,569,414 | ) | ||||
| Class R4 | (2,155 | ) | – | |||||
| Class R5 | (230 | ) | – | |||||
| Class R6 | (136,375 | ) | – | |||||
| Net realized gain | ||||||||
| Class A | (34,162,619 | ) | (112,032,828 | ) | ||||
| Class B | (748,752 | ) | (3,184,715 | ) | ||||
| Class C | (15,199,755 | ) | (50,892,560 | ) | ||||
| Class F | (15,303,345 | ) | (43,708,769 | ) | ||||
| Class I | (2,989,643 | ) | (8,813,744 | ) | ||||
| Class P | (294,380 | ) | (1,164,888 | ) | ||||
| Class R2 | (27,899 | ) | (104,774 | ) | ||||
| Class R3 | (790,263 | ) | (2,693,680 | ) | ||||
| Class R4 | (74 | ) | – | |||||
| Class R5 | (74 | ) | – | |||||
| Class R6 | (74 | ) | – | |||||
| Total distributions to shareholders | (470,739,379 | ) | (641,937,251 | ) | ||||
| Capital share transactions (Net of share conversions) (See Note 13): | ||||||||
| Net proceeds from sales of shares | 2,964,164,404 | 3,046,998,317 | ||||||
| Reinvestment of distributions | 403,973,062 | 555,300,289 | ||||||
| Cost of shares reacquired | (3,264,686,299 | ) | (2,791,903,203 | ) | ||||
| Net increase in net assets resulting from capital share transactions | 103,451,167 | 810,395,403 | ||||||
| Net increase (decrease) in net assets | (524,174,514 | ) | 536,738,302 | |||||
| NET ASSETS: | ||||||||
| Beginning of year | $ | 9,105,498,336 | $ | 8,568,760,034 | ||||
| End of year | $ | 8,581,323,822 | $ | 9,105,498,336 | ||||
| Undistributed net investment income | $ | 23,055,113 | $ | 25,269,137 | ||||
| 46 | See Notes to Financial Statements. |
This page is intentionally left blank.
47
| Per Share Operating Performance: | ||||||||||||||||||||||||||||
| Investment operations: | Distributions to shareholders from: | |||||||||||||||||||||||||||
| Net asset value, beginning of period | Net invest- ment income(a) | Net realized and unrealized gain (loss) | Total from invest- ment oper- ations | Net investment income | Net realized gain | Total distri- butions | ||||||||||||||||||||||
| Class A | ||||||||||||||||||||||||||||
| 12/31/2015 | $7.93 | $0.32 | $(0.44 | ) | $(0.12 | ) | $(0.35 | ) | $(0.06 | ) | $(0.41 | ) | ||||||||||||||||
| 12/31/2014 | 8.15 | 0.37 | – | (c) | 0.37 | (0.39 | ) | (0.20 | ) | (0.59 | ) | |||||||||||||||||
| 12/31/2013 | 8.14 | 0.42 | 0.19 | 0.61 | (0.43 | ) | (0.17 | ) | (0.60 | ) | ||||||||||||||||||
| 12/31/2012 | 7.63 | 0.47 | 0.51 | 0.98 | (0.47 | ) | – | (0.47 | ) | |||||||||||||||||||
| 12/31/2011 | 7.81 | 0.47 | (0.17 | ) | 0.30 | (0.48 | ) | – | (0.48 | ) | ||||||||||||||||||
| Class B | ||||||||||||||||||||||||||||
| 12/31/2015 | 7.95 | 0.26 | (0.43 | ) | (0.17 | ) | (0.29 | ) | (0.06 | ) | (0.35 | ) | ||||||||||||||||
| 12/31/2014 | 8.18 | 0.31 | (0.01 | ) | 0.30 | (0.33 | ) | (0.20 | ) | (0.53 | ) | |||||||||||||||||
| 12/31/2013 | 8.17 | 0.37 | 0.19 | 0.56 | (0.38 | ) | (0.17 | ) | (0.55 | ) | ||||||||||||||||||
| 12/31/2012 | 7.66 | 0.42 | 0.51 | 0.93 | (0.42 | ) | – | (0.42 | ) | |||||||||||||||||||
| 12/31/2011 | 7.84 | 0.42 | (0.17 | ) | 0.25 | (0.43 | ) | – | (0.43 | ) | ||||||||||||||||||
| Class C | ||||||||||||||||||||||||||||
| 12/31/2015 | 7.95 | 0.27 | (0.44 | ) | (0.17 | ) | (0.30 | ) | (0.06 | ) | (0.36 | ) | ||||||||||||||||
| 12/31/2014 | 8.17 | 0.32 | – | (c) | 0.32 | (0.34 | ) | (0.20 | ) | (0.54 | ) | |||||||||||||||||
| 12/31/2013 | 8.16 | 0.37 | 0.19 | 0.56 | (0.38 | ) | (0.17 | ) | (0.55 | ) | ||||||||||||||||||
| 12/31/2012 | 7.65 | 0.42 | 0.51 | 0.93 | (0.42 | ) | – | (0.42 | ) | |||||||||||||||||||
| 12/31/2011 | 7.83 | 0.42 | (0.17 | ) | 0.25 | (0.43 | ) | – | (0.43 | ) | ||||||||||||||||||
| Class F | ||||||||||||||||||||||||||||
| 12/31/2015 | 7.91 | 0.33 | (0.44 | ) | (0.11 | ) | (0.35 | ) | (0.06 | ) | (0.41 | ) | ||||||||||||||||
| 12/31/2014 | 8.14 | 0.38 | (0.01 | ) | 0.37 | (0.40 | ) | (0.20 | ) | (0.60 | ) | |||||||||||||||||
| 12/31/2013 | 8.13 | 0.44 | 0.19 | 0.63 | (0.45 | ) | (0.17 | ) | (0.62 | ) | ||||||||||||||||||
| 12/31/2012 | 7.62 | 0.49 | 0.51 | 1.00 | (0.49 | ) | – | (0.49 | ) | |||||||||||||||||||
| 12/31/2011 | 7.80 | 0.49 | (0.17 | ) | 0.32 | (0.50 | ) | – | (0.50 | ) | ||||||||||||||||||
| Class I | ||||||||||||||||||||||||||||
| 12/31/2015 | 7.89 | 0.34 | (0.45 | ) | (0.11 | ) | (0.36 | ) | (0.06 | ) | (0.42 | ) | ||||||||||||||||
| 12/31/2014 | 8.11 | 0.38 | – | (c) | 0.38 | (0.40 | ) | (0.20 | ) | (0.60 | ) | |||||||||||||||||
| 12/31/2013 | 8.10 | 0.45 | 0.19 | 0.64 | (0.46 | ) | (0.17 | ) | (0.63 | ) | ||||||||||||||||||
| 12/31/2012 | 7.60 | 0.49 | 0.51 | 1.00 | (0.50 | ) | – | (0.50 | ) | |||||||||||||||||||
| 12/31/2011 | 7.77 | 0.50 | (0.16 | ) | 0.34 | (0.51 | ) | – | (0.51 | ) | ||||||||||||||||||
| Class P | ||||||||||||||||||||||||||||
| 12/31/2015 | 8.10 | 0.33 | (0.45 | ) | (0.12 | ) | (0.35 | ) | (0.06 | ) | (0.41 | ) | ||||||||||||||||
| 12/31/2014 | 8.33 | 0.38 | (0.01 | ) | 0.37 | (0.40 | ) | (0.20 | ) | (0.60 | ) | |||||||||||||||||
| 12/31/2013 | 8.31 | 0.44 | 0.20 | 0.64 | (0.45 | ) | (0.17 | ) | (0.62 | ) | ||||||||||||||||||
| 12/31/2012 | 7.79 | 0.48 | 0.52 | 1.00 | (0.48 | ) | – | (0.48 | ) | |||||||||||||||||||
| 12/31/2011 | 7.98 | 0.48 | (0.18 | ) | 0.30 | (0.49 | ) | – | (0.49 | ) | ||||||||||||||||||
| 48 | See Notes to Financial Statements. |
| Ratios to Average Net Assets: | Supplemental Data: | |||||||||||||||||||||
| Net asset value, end of period | Total return(b) (%) | Total expenses (%) | Net investment income (%) | Net assets, end of year (000) | Portfolio turnover rate (%) | |||||||||||||||||
| $7.40 | (1.74 | ) | 0.82 | 4.10 | $4,183,669 | 118.51 | ||||||||||||||||
| 7.93 | 4.51 | 0.86 | 4.50 | 4,524,711 | 87.69 | |||||||||||||||||
| 8.15 | 7.78 | 0.96 | 5.16 | 4,784,258 | 43.16 | |||||||||||||||||
| 8.14 | 13.22 | 0.96 | 5.88 | 4,850,567 | 45.87 | |||||||||||||||||
| 7.63 | 3.88 | 0.97 | 6.07 | 4,345,679 | 35.73 | |||||||||||||||||
| 7.43 | (2.38 | ) | 1.62 | 3.31 | 80,073 | 118.51 | ||||||||||||||||
| 7.95 | 3.61 | 1.62 | 3.78 | 126,256 | 87.69 | |||||||||||||||||
| 8.18 | 7.08 | 1.61 | 4.53 | 166,433 | 43.16 | |||||||||||||||||
| 8.17 | 12.47 | 1.61 | 5.25 | 225,154 | 45.87 | |||||||||||||||||
| 7.66 | 3.35 | 1.62 | 5.39 | 295,027 | 35.73 | |||||||||||||||||
| 7.42 | (2.35 | ) | 1.46 | 3.48 | 1,882,589 | 118.51 | ||||||||||||||||
| 7.95 | 3.85 | 1.50 | 3.86 | 2,082,896 | 87.69 | |||||||||||||||||
| 8.17 | 7.08 | 1.61 | 4.52 | 1,986,431 | 43.16 | |||||||||||||||||
| 8.16 | 12.47 | 1.61 | 5.23 | 2,051,198 | 45.87 | |||||||||||||||||
| 7.65 | 3.22 | 1.62 | 5.42 | 1,790,610 | 35.73 | |||||||||||||||||
| 7.39 | (1.53 | ) | 0.72 | 4.20 | 1,893,642 | 118.51 | ||||||||||||||||
| 7.91 | 4.53 | 0.72 | 4.59 | 1,817,781 | 87.69 | |||||||||||||||||
| 8.14 | 8.05 | 0.71 | 5.40 | 1,118,411 | 43.16 | |||||||||||||||||
| 8.13 | 13.50 | 0.71 | 6.11 | 1,047,325 | 45.87 | |||||||||||||||||
| 7.62 | 4.12 | 0.72 | 6.30 | 847,032 | 35.73 | |||||||||||||||||
| 7.36 | (1.59 | ) | 0.62 | 4.28 | 382,854 | 118.51 | ||||||||||||||||
| 7.89 | 4.76 | 0.62 | 4.68 | 393,851 | 87.69 | |||||||||||||||||
| 8.11 | 8.16 | 0.61 | 5.48 | 345,614 | 43.16 | |||||||||||||||||
| 8.10 | 13.49 | 0.62 | 6.25 | 230,006 | 45.87 | |||||||||||||||||
| 7.60 | 4.35 | 0.62 | 6.39 | 316,777 | 35.73 | |||||||||||||||||
| 7.57 | (1.66 | ) | 0.87 | 4.06 | 35,632 | 118.51 | ||||||||||||||||
| 8.10 | 4.39 | 0.87 | 4.51 | 44,078 | 87.69 | |||||||||||||||||
| 8.33 | 7.92 | 0.91 | 5.23 | 79,051 | 43.16 | |||||||||||||||||
| 8.31 | 13.21 | 0.96 | 5.88 | 99,968 | 45.87 | |||||||||||||||||
| 7.79 | 3.88 | 1.03 | 6.01 | 109,252 | 35.73 | |||||||||||||||||
| See Notes to Financial Statements. | 49 |
Financial Highlights (concluded)
| Per Share Operating Performance: | ||||||||||||||||||||||||||||
| Investment operations: | Distributions to shareholders from: | |||||||||||||||||||||||||||
| Net asset value, beginning of period | Net invest- ment income(a) | Net realized and unrealized gain (loss) | Total from invest- ment oper- ations | Net investment income | Net realized gain | Total distri- butions | ||||||||||||||||||||||
| Class R2 | ||||||||||||||||||||||||||||
| 12/31/2015 | $7.93 | $0.29 | $(0.44 | ) | $(0.15 | ) | $(0.32 | ) | $(0.06 | ) | $(0.38 | ) | ||||||||||||||||
| 12/31/2014 | 8.15 | 0.34 | – | (c) | 0.34 | (0.36 | ) | (0.20 | ) | (0.56 | ) | |||||||||||||||||
| 12/31/2013 | 8.14 | 0.40 | 0.19 | 0.59 | (0.41 | ) | (0.17 | ) | (0.58 | ) | ||||||||||||||||||
| 12/31/2012 | 7.63 | 0.45 | 0.52 | 0.97 | (0.46 | ) | – | (0.46 | ) | |||||||||||||||||||
| 12/31/2011 | 7.81 | 0.46 | (0.18 | ) | 0.28 | (0.46 | ) | – | (0.46 | ) | ||||||||||||||||||
| Class R3 | ||||||||||||||||||||||||||||
| 12/31/2015 | 7.91 | 0.30 | (0.44 | ) | (0.14 | ) | (0.32 | ) | (0.06 | ) | (0.38 | ) | ||||||||||||||||
| 12/31/2014 | 8.14 | 0.35 | (0.01 | ) | 0.34 | (0.37 | ) | (0.20 | ) | (0.57 | ) | |||||||||||||||||
| 12/31/2013 | 8.13 | 0.41 | 0.19 | 0.60 | (0.42 | ) | (0.17 | ) | (0.59 | ) | ||||||||||||||||||
| 12/31/2012 | 7.62 | 0.45 | 0.52 | 0.97 | (0.46 | ) | – | (0.46 | ) | |||||||||||||||||||
| 12/31/2011 | 7.80 | 0.46 | (0.17 | ) | 0.29 | (0.47 | ) | – | (0.47 | ) | ||||||||||||||||||
| Class R4 | ||||||||||||||||||||||||||||
| 6/30/2015 to 12/31/2015(d) | 7.99 | 0.16 | (0.52 | ) | (0.36 | ) | (0.17 | ) | (0.06 | ) | (0.23 | ) | ||||||||||||||||
| Class R5 | ||||||||||||||||||||||||||||
| 6/30/2015 to 12/31/2015(d) | 7.95 | 0.17 | (0.52 | ) | (0.35 | ) | (0.18 | ) | (0.06 | ) | (0.24 | ) | ||||||||||||||||
| Class R6 | ||||||||||||||||||||||||||||
| 6/30/2015 to 12/31/2015(d) | 7.95 | 0.17 | (0.51 | ) | (0.34 | ) | (0.18 | ) | (0.06 | ) | (0.24 | ) | ||||||||||||||||
| (a) | Calculated using average shares outstanding during the period. |
| (b) | Total return for Classes A, B and C does not consider the effects of sales loads and assumes the reinvestment of all distributions. Total return for all other classes assumes the reinvestment of all distributions. |
| (c) | Amount is less than $.01. |
| (d) | Commenced on June 30, 2015. |
| (e) | Not annualized. |
| (f) | Annualized. |
| 50 | See Notes to Financial Statements. |
| Ratios to Average Net Assets: | Supplemental Data: | |||||||||||||||||||||
| Net asset value, end of period | Total return(b) (%) | Total expenses (%) | Net investment income (%) | Net assets, end of year (000) | Portfolio turnover rate (%) | |||||||||||||||||
| $7.40 | (2.13 | ) | 1.22 | 3.71 | $ 4,075 | 118.51 | ||||||||||||||||
| 7.93 | 4.15 | 1.22 | 4.13 | 4,557 | 87.69 | |||||||||||||||||
| 8.15 | 7.52 | 1.21 | 4.92 | 3,442 | 43.16 | |||||||||||||||||
| 8.14 | 12.94 | 1.21 | 5.62 | 2,624 | 45.87 | |||||||||||||||||
| 7.63 | 3.62 | 1.22 | 5.84 | 1,629 | 35.73 | |||||||||||||||||
| 7.39 | (1.91 | ) | 1.12 | 3.82 | 107,581 | 118.51 | ||||||||||||||||
| 7.91 | 4.13 | 1.10 | 4.24 | 111,368 | 87.69 | |||||||||||||||||
| 8.14 | 7.63 | 1.11 | 5.01 | 85,119 | 43.16 | |||||||||||||||||
| 8.13 | 13.07 | 1.11 | 5.73 | 69,100 | 45.87 | |||||||||||||||||
| 7.62 | 3.73 | 1.12 | 5.94 | 47,338 | 35.73 | |||||||||||||||||
| 7.40 | (4.59 | )(e) | 0.87 | (f) | 4.27 | (f) | 207 | 118.51 | ||||||||||||||
| 7.36 | (4.50 | )(e) | 0.62 | (f) | 4.39 | (f) | 10 | 118.51 | ||||||||||||||
| 7.37 | (4.36 | )(e) | 0.54 | (f) | 4.49 | (f) | 10,994 | 118.51 | ||||||||||||||
| See Notes to Financial Statements. | 51 |
| 1. | ORGANIZATION |
Lord Abbett Bond-Debenture Fund, Inc. (the “Fund”) is registered under the Investment Company Act of 1940, as amended (the “Act”), as a diversified, open-end management investment company. The Fund was organized in 1970 and incorporated under Maryland law on January 23, 1976.
The Fund’s investment objective is to seek high current income and the opportunity for capital appreciation to produce a high total return. The Fund has eleven classes of shares: Class A, B, C, F, I, P, R2, R3, R4, R5, and R6, each with different expenses and dividends. A front-end sales charge is normally added to the net asset value (“NAV”) for Class A shares. Classes R4, R5 and R6 shares commenced on June 30, 2015. There is no front-end sales charge in the case of Class B, C, F, I, P, R2, R3, R4, R5, and R6 shares, although there may be a contingent deferred sales charge (“CDSC”) in certain cases as follows: Class A shares purchased without a sales charge and redeemed before the first day of the month in which the one-year anniversary of the purchase falls (subject to certain exceptions as set forth in the Fund’s prospectus); Class B shares redeemed before the sixth anniversary of purchase; and Class C shares redeemed before the first anniversary of purchase. Class B shares will automatically convert to Class A shares on the 25th day of the month (or, if the 25th day is not a business day, the next business day thereafter) following the eighth anniversary of the day on which the purchase order was accepted. The Fund no longer issues Class B shares for purchase. The Fund’s Class P shares are closed to substantially all investors, with certain exceptions as set forth in the Fund’s prospectus.
The preparation of the financial statements in conformity with accounting principles generally accepted in the United States of America (“U.S. GAAP”) requires management to make certain estimates and assumptions that affect the reported amounts of assets and liabilities and disclosure of contingent assets and liabilities at the date of the financial statements and the reported amounts of increases and decreases in net assets from operations during the reporting period. Actual results could differ from those estimates. The Fund is considered an investment company under U.S. GAAP and follows the accounting and reporting guidance applicable to investment companies.
| 2. | SIGNIFICANT ACCOUNTING POLICIES |
| (a) | Investment Valuation–Under procedures approved by the Fund’s Board of Directors (the “Board”), Lord, Abbett & Co. LLC (“Lord Abbett”), the Fund’s investment manager, has formed a Pricing Committee to administer the pricing and valuation of portfolio investments and to ensure that prices utilized reasonably reflect fair value. Among other things, these procedures allow the Fund to utilize independent pricing services, quotations from securities and financial instrument dealers and other market sources to determine fair value. |
| Securities actively traded on any recognized U.S. or non-U.S. exchange or on The NASDAQ Stock Market LLC are valued at the last sale price or official closing price on the exchange or system on which they are principally traded. Events occurring after the close of trading on non-U.S. exchanges may result in adjustments to the valuation of foreign securities to reflect their fair value as of the close of regular trading on the New York Stock Exchange. The Fund may utilize an independent fair valuation service in adjusting the valuations of foreign securities. Unlisted equity securities are valued at the last quoted sale price or, if no sale price is available, at the mean between the most recently quoted bid and asked prices. Fixed income securities are valued based on evaluated prices supplied by independent pricing services, which reflect broker/dealer supplied valuations and the independent pricing services’ own electronic data processing techniques. Floating rate loans are valued at the average of bid and ask |
52
Notes to Financial Statements (continued)
| quotations obtained from dealers in loans on the basis of prices supplied by independent pricing services. Exchange traded options and futures contracts are valued at the last sale price in the market where they are principally traded. If no sale has occurred, the mean between the most recently quoted bid and asked prices is used. Forward foreign currency exchange contracts are valued using daily forward exchange rates. Swaps are valued daily using independent pricing services or quotations from broker/dealers to the extent available. | |
| Securities for which prices are not readily available are valued at fair value as determined by the Pricing Committee. The Pricing Committee considers a number of factors, including observable and unobservable inputs, when arriving at fair value. The Pricing Committee may use related or comparable assets or liabilities, recent transactions, market multiples, book values, yield curves, broker quotes, observable trading activity, option adjusted spread models and other relevant information to determine the fair value of portfolio investments. The Board or a designated committee thereof regularly reviews fair value determinations made by the Pricing Committee and employs techniques such as reviewing related market activity, reviewing inputs and assumptions, and retrospectively comparing prices of subsequent purchases and sales transactions to fair value determinations made by the Pricing Committee. | |
| Short-term securities with 60 days or less remaining to maturity are valued using the amortized cost method, which approximates fair value. | |
| (b) | Security Transactions–Security transactions are recorded as of the date that the securities are purchased or sold (trade date). Realized gains and losses on sales of portfolio securities are calculated using the identified-cost method. Realized and unrealized gains (losses) are allocated to each class of shares based upon the relative proportion of net assets at the beginning of the day. |
| (c) | Investment Income–Dividend income is recorded on the ex-dividend date. Interest income is recorded on the accrual basis as earned. Discounts are accreted and premiums are amortized using the effective interest method and are included in Interest and other income on the Statement of Operations. Withholding taxes on foreign dividends have been provided for in accordance with the applicable country’s tax rules and rates. Investment income is allocated to each class of shares based upon the relative proportion of net assets at the beginning of the day. |
| (d) | Income Taxes–It is the policy of the Fund to meet the requirements of Subchapter M of the Internal Revenue Code applicable to regulated investment companies and to distribute substantially all taxable income and capital gains to its shareholders. Therefore, no income tax provision is required. |
| The Fund files U.S. federal and various state and local tax returns. No income tax returns are currently under examination. The statute of limitations on the Fund’s filed U.S. federal tax returns remains open for the fiscal years ended December 31, 2012 through December 31, 2015. The statutes of limitations on the Fund’s state and local tax returns may remain open for an additional year depending upon the jurisdiction. | |
| (e) | Expenses–Expenses, excluding class-specific expenses, are allocated to each class of shares based upon the relative proportion of net assets at the beginning of the day. Class A, B, C, F, P, R2, R3 and R4 shares bear their class-specific share of all expenses and fees relating to the Fund’s 12b-1 Distribution Plan. |
| (f) | Foreign Transactions–The books and records of the Fund are maintained in U.S. dollars and transactions denominated in foreign currencies are recorded in the Fund’s records at the rate |
53
Notes to Financial Statements (continued)
| prevailing when earned or recorded. Asset and liability accounts that are denominated in foreign currencies are adjusted daily to reflect current exchange rates and any unrealized gain (loss) is included in Net change in unrealized appreciation/depreciation on futures contracts, swaps and translation of assets and liabilities denominated in foreign currencies on the Fund’s Statement of Operations. The resultant exchange gains upon settlement of such transactions are included in Net realized loss on futures contracts, swaps and foreign currency related transactions on the Fund’s Statement of Operations. The Fund does not isolate that portion of the results of operations arising as a result of changes in the foreign exchange rates from the changes in market prices of the securities. | |
| The Fund uses foreign currency exchange contracts to facilitate transactions in foreign-denominated securities. Losses from these transactions may arise from changes in the value of the foreign currency or if the counterparties do not perform under the contracts’ terms. | |
| (g) | Forward Foreign Currency Exchange Contracts–The Fund may enter into forward foreign currency exchange contracts in order to reduce exposure to changes in foreign currency exchange rates on foreign portfolio holdings, or gain or reduce exposure to foreign currency solely for investment purposes. A forward foreign currency exchange contract is a commitment to purchase or sell a foreign currency at a future date at a negotiated rate. The contracts are valued daily at forward exchange rates and any unrealized gain (loss) is included in Net change in unrealized appreciation/depreciation on futures contracts, swaps and translation of assets and liabilities denominated in foreign currencies on the Fund’s Statement of Operations. The gain (loss) arising from the difference between the U.S. dollar cost of the original contract and the value of the foreign currency in U.S. dollars upon closing of such contracts is included in Net realized loss on futures contracts, swaps and foreign currency related transactions on the Fund’s Statement of Operations. |
| (h) | Futures Contracts–The Fund may purchase and sell futures contracts to enhance returns, to attempt to economically hedge some of its investment risk, or as a substitute position in lieu of holding the underlying asset on which the instrument is based. At the time of entering into a futures transaction, an investor is required to deposit and maintain a specified amount of cash or eligible securities called “initial margin.” Subsequent payments made or received by the Fund called “variation margin” are made on a daily basis as the market price of the futures contract fluctuates. The Fund will record an unrealized gain (loss) based on the amount of variation margin. When a contract is closed, a realized gain (loss) is recorded equal to the difference between the opening and closing value of the contract. |
| (i) | Credit Default Swaps–The Fund may enter into credit default swap contracts in order to hedge credit risk or for speculation purposes. As a seller of a credit default swap contract (“seller of protection”), the Fund is required to pay the notional amount or other agreed-upon value of a referenced debt obligation to the counterparty in the event of a default by or other credit event involving the referenced issuer, obligation or index. In return, the Fund receives from the counterparty a periodic stream of payments over the term of the contract. |
| As a purchaser of a credit default swap contract (“buyer of protection”), the Fund would receive the notional amount or other agreed upon value of a referenced debt obligation from the counterparty in the event of default by or other credit event involving the referenced issuer, obligation or index. In return, the Fund would make periodic payments to the counterparty over the term of the contracts, provided no event of default has occurred. |
54
Notes to Financial Statements (continued)
| These credit default swaps may have as a reference obligation corporate or sovereign issuers or credit indices. These credit indices are comprised of a basket of securities representing a particular sector of the market. During the period, the Fund entered into credit default swaps based on CMBX indices, which are comprised of commercial mortgage-backed securities. | |
| Credit default swaps are fair valued based upon quotations from counterparties, brokers or market-makers and the change in value, if any, is recorded as an unrealized appreciation or depreciation. For a credit default swap sold by the Fund, payment of the agreed-upon amount made by the Fund in the event of default of the referenced debt obligation is recorded as the cost of the referenced debt obligation purchased/received. For a credit default swap purchased by the Fund, the agreed-upon amount received by the Fund in the event of default of the referenced debt obligation is recorded as proceeds from sale/delivery of the referenced debt obligation and the resulting gain or loss realized on the referenced debt obligation is recorded as such by the Fund. | |
| Any upfront payments made or received upon entering a credit default swap contract would be amortized or accreted over the life of the swap and recorded as realized gains or losses. Collateral, in the form of cash or securities, may be required to be held in segregated accounts with the custodian bank or broker in accordance with the swap agreement. The value and credit rating of each credit default swap where the Fund is the seller of protection, are both measures of the current payment/performance risk of the swap. As the value of the swap changes as a positive or negative percentage of the total notional amount, the payment/performance risk may decrease or increase, respectively. The maximum potential amount of future payments (undiscounted) that the Fund as a seller of protection could be required to make under a credit default swap agreement would be an amount equal to the notional amount of the agreement. These potential amounts would be partially offset by any recovery values of the respective referenced obligations, upfront payments received upon entering into the agreement, or net amounts received from the settlement of buy protection credit default swap agreements entered into by the Fund for the same referenced entity or entities. | |
| Entering into credit default swaps involves credit and market risk. Such risks involve the possibility that there will be no liquid market for these agreements, that the counterparty to the agreements may default on its obligation to perform or disagree as to the meaning of the contractual terms in the agreements, and that there may be unfavorable changes in interest rates, and that Lord Abbett does not correctly predict the creditworthiness of the issuers of the reference obligation on which the credit default swap is based. | |
| (j) | Total Return Swaps–The Fund may enter into total return swap agreements to obtain exposure to a security or market without owning such security or investing directly in that market. The Fund may agree to make payments that are the equivalent of interest in exchange for the right to receive payments equivalent to any appreciation in the value of an underlying security, index or other asset, as well as receive payments equivalent to any distributions made on that asset, over the term of the swap. If the value of the asset underlying a total return swap declines over the term of the swap, the Fund also may be required to pay an amount equal to that decline in value to their counterparty. |
| (k) | When-Issued, Forward Transactions or To-Be-Announced (“TBA”) Transactions–The Fund may purchase portfolio securities on a when-issued or forward basis. When-issued, forward transactions or TBA transactions involve a commitment by a fund to purchase securities, with payment and delivery (“settlement”) to take place in the future, in order to |
55
Notes to Financial Statements (continued)
| secure what is considered to be an advantageous price or yield at the time of entering into the transaction. During the period between purchase and settlement, the fair value of the securities will fluctuate and assets consisting of cash and/or marketable securities (normally short-term U.S. Government or U.S. Government sponsored enterprise securities) marked to market daily in an amount sufficient to make payment at settlement will be segregated at the Fund’s custodian in order to pay for the commitment. At the time the Fund makes the commitment to purchase a security on a when-issued basis, it will record the transaction and reflect the liability for the purchase and fair value of the security in determining its NAV. The Fund, generally, has the ability to close out a purchase obligation on or before the settlement date rather than take delivery of the security. Under no circumstances will settlement for such securities take place more than 120 days after the purchase date. | |
| (l) | Repurchase Agreements–The Fund may enter into repurchase agreements with respect to securities. A repurchase agreement is a transaction in which a fund acquires a security and simultaneously commits to resell that security to the seller (a bank or securities dealer) at an agreed-upon price on an agreed-upon date. The Fund requires at all times that the repurchase agreement be collateralized by cash, or by securities of the U.S. Government, its agencies, its instrumentalities, or U.S. Government sponsored enterprises having a value equal to, or in excess of, the value of the repurchase agreement (including accrued interest). If the seller of the agreement defaults on its obligation to repurchase the underlying securities at a time when the fair value of these securities has declined, the Fund may incur a loss upon disposition of the securities. |
| (m) | Floating Rate Loans–The Fund may invest in floating rate loans, which usually take the form of loan participations and assignments. Loan participations and assignments are agreements to make money available to U.S. or foreign corporations, partnerships or other business entities (the “Borrower”) in a specified amount, at a specified rate and within a specified time. A loan is typically originated, negotiated and structured by a U.S. or foreign bank, insurance company or other financial institution (the “Agent”) for a group of loan investors (“Loan Investors”). The Agent typically administers and enforces the loan on behalf of the other Loan Investors in the syndicate and may hold any collateral on behalf of the Loan Investors. Such loan participations and assignments are typically senior, secured and collateralized in nature. A Fund records an investment when the Borrower withdraws money and records interest as earned. These loans pay interest at rates which are periodically reset by reference to a base lending rate plus a spread. These base lending rates are generally the prime rate offered by a designated U.S. bank or London InterBank Offered Rate (“LIBOR”). |
| The loans in which the Fund invests may be subject to some restrictions on resale. For example, the Fund may be contractually obligated to receive approval from the Agent and/or Borrower prior to the sale of these investments. The Fund generally has no right to enforce compliance with the terms of the loan agreement with the Borrower. As a result, the Fund assumes the credit risk of the Borrower, the selling participant and any other persons interpositioned between the Fund and the Borrower (“Intermediate Participants”). In the event that the Borrower, selling participant or Intermediate Participants become insolvent or enter into bankruptcy, the Fund may incur certain costs and delays in realizing payment or may suffer a loss of principal and/or interest. |
56
Notes to Financial Statements (continued)
| Unfunded commitments represent the remaining obligation of the Fund to the Borrower. At any point in time, up to the maturity date of the issue, the Borrower may demand the unfunded portion. As of December 31, 2015, the Fund had no unfunded loan commitments. | |
| (n) | Fair Value Measurements–Fair value is defined as the price that the Fund would receive upon selling an investment or transferring a liability in an orderly transaction to an independent buyer in the principal or most advantageous market of the investment. A three-tier hierarchy is used to maximize the use of observable market data and minimize the use of unobservable inputs and to establish classification of fair value measurements for disclosure purposes. Inputs refer broadly to the assumptions that market participants would use in pricing the asset or liability, including assumptions about risk—for example, the risk inherent in a particular valuation technique used to measure fair value (such as a pricing model) and/or the risk inherent in the inputs to the valuation technique. Inputs may be observable or unobservable. Observable inputs reflect the assumptions market participants would use in pricing the asset or liability. Observable inputs are based on market data obtained from sources independent of the reporting entity. Unobservable inputs reflect the reporting entity’s own assumptions about the assumptions market participants would use in pricing the asset or liability. Unobservable inputs are based on the best information available in the circumstances. The three-tier hierarchy of inputs is summarized in the three broad Levels listed below: |
| • | Level 1 – | unadjusted quoted prices in active markets for identical investments; | |
| • | Level 2 – | other significant observable inputs (including quoted prices for similar investments, interest rates, prepayment speeds, credit risk, etc.); and | |
| • | Level 3 – | significant unobservable inputs (including the Fund’s own assumptions in determining the fair value of investments). |
| A summary of inputs used in valuing the Fund’s investments and other financial instruments as of December 31, 2015 and, if applicable, Level 1/Level 2 transfers and Level 3 rollforwards for the fiscal year then ended is included in the Fund’s Schedule of Investments. | |
| Changes in valuation techniques may result in transfers into or out of an assigned level within the three-tier hierarchy. All transfers between different levels within the three-tier hierarchy are deemed to have occurred as of the beginning of the reporting period. The inputs or methodology used for valuing securities are not necessarily an indication of the risk associated with investing in those securities. |
| 3. | MANAGEMENT FEE AND OTHER TRANSACTIONS WITH AFFILIATES |
Management Fee
The Fund has a management agreement with Lord Abbett, pursuant to which Lord Abbett supplies the Fund with investment management services and executive and other personnel, provides office space and pays for ordinary and necessary office and clerical expenses relating to research and statistical work and supervision of the Fund’s investment portfolio.
The management fee is based on the Fund’s average daily net assets at the following annual rate:
| First $500 million | .50% |
| Next $9.5 billion | .45% |
| Over $10 billion | .40% |
57
Notes to Financial Statements (continued)
For the fiscal year ended December 31, 2015, the effective management fee was at an annualized rate of .45% of the Fund’s average daily net assets.
In addition, Lord Abbett provides certain administrative services to the Fund pursuant to an Administrative Services Agreement in return for a fee at an annual rate of .04% of the Fund’s average daily net assets.
12b-1 Distribution Plan
The Fund has adopted a distribution plan with respect to Class A, B, C, F, P, R2, R3, and R4 shares pursuant to Rule 12b-1 under the Act, which provides for the payment of ongoing distribution and service fees to Lord Abbett Distributor LLC (the “Distributor”), an affiliate of Lord Abbett. The following annual rates have been authorized by the Board pursuant to the plan:
| Fees* | Class A | Class B | Class C(1) | Class F | Class P | Class R2 | Class R3 | Class R4 |
| Service | .15% | .25% | .25% | – | .25% | .25% | .25% | .25% |
| Distribution | .05% | .75% | .75% | .10% | .20% | .35% | .25% | – |
| * | The Fund may designate a portion of the aggregate fee as attributable to service activities for purposes of calculating Financial Industry Regulatory Authority, Inc. (“FINRA”) sales charge limitations. |
| (1) | The Rule 12b-1 fee the Fund pays on Class C shares is a blended rate based on 1.00% of the Fund’s average daily net assets attributable to Class C shares held for less than one year and .80% (.25% service, .55% distribution) of the Fund’s average daily net assets attributable to Class C shares held for one year or more. All Class C shareholders of the Fund will bear Rule 12b-1 fees at the same rate. |
Classes I, R5 and R6 shares do not have a distribution plan.
Commissions
Distributor received the following commissions on sales of shares of the Fund, after concessions were paid to authorized dealers, for the fiscal year ended December 31, 2015:
| Distributor Commissions | Dealers’ Concessions | |
| $393,816 | $2,638,271 |
Distributor received CDSCs of $78,341 and $217,842 for Class A and Class C shares, respectively, for the fiscal year ended December 31, 2015.
A Director and certain of the Company’s officers have an interest in Lord Abbett.
| 4. | DISTRIBUTIONS AND CAPITAL LOSS CARRYFORWARDS |
Dividends from net investment income, if any, are declared daily and paid monthly. Taxable net realized gains from investment transactions, reduced by allowable capital loss carryforwards, if any, are declared and distributed to shareholders at least annually. The capital loss carryforward amount, if any, is available to offset future net capital gains. Dividends and distributions to shareholders are recorded on the ex-dividend date. The amounts of dividends and distributions from net investment income and net realized capital gains are determined in accordance with federal income tax regulations, which may differ from accounting principles generally accepted in the United States of America. These book/tax differences are either considered temporary or permanent in nature. To the extent these differences are permanent in nature, such amounts are reclassified within the components of net assets based on their federal tax basis treatment; temporary differences do not require reclassification. Dividends and distributions that exceed earnings and profits for tax purposes are reported as a tax return of capital.
58
Notes to Financial Statements (continued)
The tax character of distributions paid during the fiscal years ended December 31, 2015 and 2014 was as follows:
| Year Ended | Year Ended | ||||||
| 12/31/2015 | 12/31/2014 | ||||||
| Distributions paid from: | |||||||
| Ordinary income | $ | 404,420,206 | $ | 435,493,994 | |||
| Net long-term capital gains | 66,319,173 | 206,443,257 | |||||
| Total distributions paid | $ | 470,739,379 | $ | 641,937,251 | |||
As of December 31, 2015, the components of accumulated losses on a tax-basis were as follows:
| Undistributed ordinary income – net | $ | 24,790,279 | ||
| Total undistributed earnings | 24,790,279 | |||
| Capital loss carryforwards* | (23,997,060 | ) | ||
| Temporary differences | (93,256,683 | ) | ||
| Unrealized losses – net | (388,357,696 | ) | ||
| Total accumulated losses – net | $ | (480,821,160 | ) |
| * | The capital losses will caryforward indefintely. |
At the Fund’s election, certain losses incurred within the taxable year (Qualified Late-Year Losses) are deemed to arise on the first business day of the Fund’s next taxable year. The Fund incurred and will elect to defer post-October capital losses of $91,487,214 and late-year ordinary losses of $13,530 during fiscal 2015.
As of December 31, 2015, the aggregate unrealized security gains and losses based on cost for U.S. federal income tax purposes were as follows:
| Tax cost | $ | 8,870,274,733 | ||
| Gross unrealized gain | 156,592,350 | |||
| Gross unrealized loss | (543,504,246 | ) | ||
| Net unrealized security loss | $ | (386,911,896 | ) |
The difference between book-basis and tax-basis unrealized gains (losses) is attributable to the tax treatment of amortization of premium, certain securities, certain distributions received and wash sales.
Permanent items identified during the fiscal year ended December 31, 2015 have been reclassified among the components of net assets based on their tax basis treatment as follows:
| Undistributed | Accumulated | |||
| Net Investment | Net Realized | |||
| Income | Loss | |||
| $26,182,634 | $(26,182,634 | ) |
The permanent differences are attributable to the tax treatment of premium amortization, principal paydown gains and losses, certain securities, certain distributions and foreign currency transactions.
59
Notes to Financial Statements (continued)
| 5. | PORTFOLIO SECURITIES TRANSACTIONS |
Purchases and sales of investment securities (excluding short-term investments) for the fiscal year ended December 31, 2015 were as follows:
| U.S. | Non-U.S. | U.S. | Non-U.S. |
| Government | Government | Government | Government |
| Purchases* | Purchases | Sales* | Sales |
| $1,817,603,472 | $9,072,623,621 | $2,317,276,866 | $8,998,236,688 |
| * | Includes U.S. Government sponsored enterprises securities. |
The Fund is permitted to purchase and sell securities (“cross-trade”) from and to other Lord Abbett Funds or client accounts pursuant to procedures approved by the Board in compliance with Rule 17a-7 under the Act (the “Rule”). Each cross-trade is executed at a fair market price in compliance with provisions of the Rule. For the year ended December 31, 2015, the Fund engaged in cross-trade purchases of $28,452,092 and sales of $177,070,772, which resulted in net realized gains of $3,767,797.
| 6. | DISCLOSURES ABOUT DERIVATIVE INSTRUMENTS AND HEDGING ACTIVITIES |
The Fund entered into forward foreign currency exchange contracts for the fiscal year ended December 31, 2015 (as described in note 2(g)). A forward foreign currency exchange contract reduces the Fund’s exposure to changes in the value of the currency it will deliver (or settle in cash) and increases its exposure to changes in the value of the currency it will receive (or settle in cash) for the duration of the contract. The Fund’s use of forward foreign currency exchange contracts involves the risk that Lord Abbett will not accurately predict currency movements, and the Fund’s returns could be reduced as a result. Forward foreign currency exchange contracts are subject to the risk that those currencies will decline in value relative to the U.S. dollar, or, in the case of hedged positions, that the U.S. dollar will decline relative to the currency being hedged. Currency rates in foreign countries may fluctuate significantly over short periods of time. The Fund’s risk of loss from counterparty credit risk is the unrealized appreciation on forward foreign currency exchange contracts.
The Fund entered into U.S. Treasury futures contracts for the fiscal year ended December 31, 2015 (as described in note 2(h)) to economically hedge against changes in interest rates. The Fund bears the risk of interest rates moving unexpectedly, in which case the Fund may not achieve the anticipated benefits of the futures contracts and realize a loss. There is minimal counterparty credit risk to the Fund since futures are exchange traded and the exchange’s clearinghouse, as counterparty to all exchange traded futures, guarantees futures against default.
The Fund entered into a total return swap for the fiscal year ended December 31, 2015 (as described in note 2(j)) to obtain exposure to an issuer (the Reference Entity). The Fund’s use of total return swaps involve the risk that Lord Abbett will not accurately predict expectations of market value of the Reference Entity, and the Fund’s returns could be reduced as a result. The Fund’s risk of loss from counterparty credit risk is the notional value of the contract.
The Fund entered into credit default swaps for the fiscal year ended December 31, 2015 (as described in note 2(i)) to economically hedge credit risk. Credit default swaps involve the exchange of a fixed rate premium for protection against the loss in value of an underlying security within the index in the event of a defined credit event, such as payment default or bankruptcy. Under a credit default swap one party acts as a guarantor by receiving the fixed periodic payment in exchange for
60
Notes to Financial Statements (continued)
the commitment to purchase the underlying security at par if the defined credit event occurs. The Fund’s maximum risk of loss from counterparty risk, either as the protection seller or as the protection buyer, is the fair value of the contract.
As of December 31, 2015, the Fund had the following derivatives at fair value, grouped into appropriate risk categories that illustrate the Fund’s use of derivative instruments:
| Foreign | |||||||||||
| Interest Rate | Currency | Credit | |||||||||
| Asset Derivatives | Contracts | Contracts | Contracts | ||||||||
| Forward Foreign Currency Exchange Contracts(1) | – | $1,924,305 | – | ||||||||
| Futures Contracts(2) | $2,597,758 | – | – | ||||||||
| Liability Derivatives | |||||||||||
| Credit Default Swaps(3) | – | – | $2,156,614 | ||||||||
| Forward Foreign Currency Exchange Contracts(4) | – | $547,408 | – | ||||||||
| Futures Contracts(2) | $2,634,444 | – | – | ||||||||
| (1) | Statement of Assets and Liabilities location: Unrealized appreciation on forward foreign currency exchange contracts. |
| (2) | Statement of Assets and Liabilities location: Includes cumulative unrealized appreciation/depreciation of futures contracts as reported in the Schedule of Investments. Only current day’s variation margin is reported within the Statement of Assets and Liabilities. |
| (3) | Statements of Assets and Liabilities location: Credit default swap agreements payable, at fair value. |
| (4) | Statement of Assets and Liabilities location: Unrealized depreciation on forward foreign currency exchange contracts. |
Transactions in derivative instruments for the fiscal year ended December 31, 2015, were as follows:
| Foreign | ||||||||||||
| Interest Rate | Currency | Credit | ||||||||||
| Contracts | Contracts | Contracts | ||||||||||
| Net Realized Gain (Loss)(1) | ||||||||||||
| Credit Default Swaps | $ | – | $ | – | $ | (916,091 | ) | |||||
| Forward Foreign Currency Exchange Contracts | – | 6,780,056 | – | |||||||||
| Futures Contracts | (11,477,558 | ) | – | – | ||||||||
| Total Return Swap | – | – | (503,687 | ) | ||||||||
| Net Change in Unrealized Appreciation/Depreciation(2) | ||||||||||||
| Credit Default Swaps | $ | – | $ | – | $ | (1,426,743 | ) | |||||
| Forward Foreign Currency Exchange Contracts | – | (644,975 | ) | – | ||||||||
| Futures Contracts | (572,290 | ) | – | – | ||||||||
| Total Return Swap | – | – | 992,207 | |||||||||
| Average Number of Contracts/Notional Amounts* | ||||||||||||
| Credit Default Swaps(3) | – | – | $ | 26,968,154 | ||||||||
| Forward Foreign Currency Exchange Contracts(3) | – | $ | 141,005,479 | – | ||||||||
| Futures Contracts(4) | 9,580 | – | – | |||||||||
| Total Return Swap(3) | – | – | $ | 584,764 | ||||||||
| * | Calculated based on the number of contracts or notional amounts for the fiscal year ended December 31, 2015. |
| (1) | Statements of Operations location: Net realized loss on futures contracts, swaps and foreign currency related transactions. |
| (2) | Statements of Operations location: Net change in unrealized appreciation/depreciation on futures contracts, swaps and translation of assets and liabilities denominated in foreign currencies. |
| (3) | Amount represents notional amounts in U.S. dollars. |
| (4) | Amount represents number of contracts. |
| 7. | DISCLOSURES ABOUT OFFSETTING ASSETS AND LIABILITIES |
The Financial Accounting Standards Board (“FASB”) requires disclosure to help better assess the effect or potential effect of offsetting arrangements on a fund’s financial position. The following
61
Notes to Financial Statements (continued)
tables illustrate gross and net information about recognized assets and liabilities eligible for offset in the statement of assets and liabilities; and disclose such amounts subject to an enforceable master netting agreement or similar agreement, by counterparty. A master netting agreement is an agreement between the Fund and a counterparty which provides for the net settlement of amounts owed under all contracts traded under that agreement, as well as cash collateral, through a single payment by one party to the other in the event of default on or termination of any one contract. The Fund’s accounting policy with respect to balance sheet offsetting is that, absent an event of default by the counterparty or a termination of the agreement, the master netting agreement does not result in an offset of reported amounts of financial assets and liabilities in the statement of assets and liabilities across transactions between the Fund and the applicable counterparty:
| Gross Amounts | Net Amounts of | ||||||||||
| Offset in the | Assets Presented | ||||||||||
| Gross Amounts of | Statement of Assets | in the Statement of | |||||||||
| Description | Recognized Assets | and Liabilities | Assets and Liabilities | ||||||||
| Forward Foreign Currency Exchange Contracts | $ | 1,924,305 | $ | – | $ | 1,924,305 | |||||
| Repurchase Agreement | 108,025,499 | – | 108,025,499 | ||||||||
| Total | $ | 109,949,804 | $ | – | $ | 109,949,804 | |||||
| Net Amounts | |||||||||||||||||||
| of Assets | Amounts Not Offset in the | ||||||||||||||||||
| Presented in | Statement of Assets and Liabilities | ||||||||||||||||||
| the Statement | Cash | Securities | |||||||||||||||||
| of Assets and | Financial | Collateral | Collateral | Net | |||||||||||||||
| Counterparty | Liabilities | Instruments | Received(a) | Received(a) | Amount(b) | ||||||||||||||
| Fixed Income Clearing Corp. | $ | 108,025,499 | $ | – | $ | – | $ | (108,025,499 | ) | $ | – | ||||||||
| J.P. Morgan Chase | 917,578 | (466,009 | ) | – | – | 451,569 | |||||||||||||
| Morgan Stanley | 668 | (668 | ) | – | – | – | |||||||||||||
| Standard Chartered Bank | 994,464 | – | (780,000 | ) | – | 214,464 | |||||||||||||
| State Street Bank and Trust | 11,595 | – | – | – | 11,595 | ||||||||||||||
| Total | $ | 109,949,804 | $ | (466,677 | ) | $ | (780,000 | ) | $ | (108,025,499 | ) | $ | 677,628 | ||||||
| Gross Amounts | Net Amounts of | ||||||||||
| Offset in the | Liabilities Presented | ||||||||||
| Gross Amounts of | Statement of Assets | in the Statement of | |||||||||
| Description | Recognized Liabilities | and Liabilities | Assets and Liabilities | ||||||||
| Credit Default Swap Contracts | $ | 2,156,614 | $ | – | $ | 2,156,614 | |||||
| Forward Foreign Currency Exchange Contracts | 547,408 | – | 547,408 | ||||||||
| Total | $ | 2,704,022 | $ | – | $ | 2,704,022 | |||||
| Net Amounts | |||||||||||||||||||
| of Liabilities | Amounts Not Offset in the | ||||||||||||||||||
| Presented in | Statement of Assets and Liabilities | ||||||||||||||||||
| the Statement | Cash | Securities | |||||||||||||||||
| of Assets and | Financial | Collateral | Collateral | Net | |||||||||||||||
| Counterparty | Liabilities | Instruments | Pledged(a) | Pledged(a) | Amount(c) | ||||||||||||||
| Barclays Bank plc | $ | 2,156,614 | $ | – | $ | (2,010,000 | ) | $ | – | $ | 146,614 | ||||||||
| J.P. Morgan Chase | 466,009 | (466,009 | ) | – | – | – | |||||||||||||
| Morgan Stanley | 81,399 | (668 | ) | – | – | 80,731 | |||||||||||||
| Total | $ | 2,704,022 | $ | (466,677 | ) | $ | (2,010,000 | ) | $ | – | $ | 227,345 | |||||||
62
Notes to Financial Statements (continued)
| (a) | Collateral disclosed is limited to an amount not to exceed 100% of the net amount of assets (liabilities) presented in the Statement of Assets and Liabilities, for each respective counterparty. |
| (b) | Net amount represents the amount owed to the Fund by the counterparty as of December 31, 2015. |
| (c) | Net amount represents the amount owed by the Fund to the counterparty as of December 31, 2015. |
| 8. | DIRECTORS’ REMUNERATION |
The Fund’s officers and a Director, who are associated with Lord Abbett, do not receive any compensation from the Fund for serving in such capacities. Independent Directors’ fees are allocated among all Lord Abbett-sponsored funds based on the net assets of each fund. There is an equity-based plan available to all Independent Directors under which Independent Directors must defer receipt of a portion of, and may elect to defer receipt of an additional portion of Directors’ fees. The deferred amounts are treated as though equivalent dollar amounts had been invested in the funds. Such amounts and earnings accrued thereon are included in Directors’ fees on the Statement of Operations and in Directors’ fees payable on the Statement of Assets and Liabilities and are not deductible for U.S. federal income tax purposes until such amounts are paid.
| 9. | EXPENSE REDUCTIONS |
The Fund has entered into an arrangement with its transfer agent and custodian, whereby credits realized as a result of uninvested cash balances are used to reduce a portion of the Fund’s expenses.
| 10. | LINE OF CREDIT |
Effective August 31, 2015, the Fund and certain other funds managed by Lord Abbett (collectively, the “Participating Funds”) entered into a syndicated line of credit facility with various lenders for $550 million (the “Facility”), whereas State Street Bank and Trust Company (“SSB”) participates as a lender and as agent for the lenders. The Facility is to be used for temporary or emergency purposes as an additional source of: liquidity to satisfy redemptions. The Participating Funds are subject to graduated borrowing limits of one-third of Fund assets (if Fund assets are less than $750 million), $250 million, $300 million, or $350 million, based on past borrowings and likelihood of future borrowings. The Facility will continue through August 29, 2016.
Prior to August 31, 2015, the Fund and certain other funds managed by Lord Abbett participated in a $500 million unsecured revolving credit facility with SSB (the “SSB Facility”).
During the fiscal year ended December 31, 2015, the Fund did not utilize the Facility or the SSB Facility.
| 11. | CUSTODIAN AND ACCOUNTING AGENT |
SSB is the Fund’s custodian and accounting agent. SSB performs custodial, accounting and recordkeeping functions relating to portfolio transactions and calculating the Fund’s NAV.
| 12. | INVESTMENT RISKS |
The Fund is subject to the general risks and considerations associated with investing in debt securities. The value of an investment will change as interest rates fluctuate and in response to market movements. When interest rates rise, the prices of debt securities are likely to decline; when rates fall, such prices tend to rise. Longer-term debt securities are usually more sensitive to interest rate changes. There is also the risk that an issuer of a debt security will fail to make timely payments of principal or interest to the Fund, a risk that is greater with high-yield securities (sometimes called “junk bonds”), in which the Fund may substantially invest. Some issuers, particularly of high-yield securities, may default as to principal and/or interest payments after the Fund purchases its
63
Notes to Financial Statements (continued)
securities. A default, or concerns in the market about an increase in risk of default, may result in losses to the Fund. High-yield securities are subject to greater price fluctuations, as well as additional risks.
The mortgage-related securities in which the Fund may invest may be particularly sensitive to changes in prevailing interest rates, and economic conditions, including delinquencies and/or defaults. These changes can affect the value, income and/or liquidity of such positions. When interest rates are declining, the value of these securities with prepayment features may not increase as much as other fixed income securities. Early principal repayment may deprive the Fund of income payments above current market rates. Alternatively, rising interest rates may cause prepayments to occur at a slower-than-expected rate, extending the duration of a security and typically reducing its value. The payment rate will thus affect the price and volatility of a mortgage-related security. In addition, while securities of government sponsored enterprises are guaranteed with respect to the timely payment of interest and principal by the particular enterprise involved, they are not guaranteed by the U.S. Government. In addition, the Fund may invest in non-agency asset backed and mortgage related securities, which are issued by private institutions, not by government-sponsored enterprises.
The Fund may invest up to 20% of its net assets in equity securities, the value of which fluctuates in response to movements in the equity securities market in general and to the changing prospects of individual companies in which the Fund invests.
The Fund may invest in convertible securities, which have both equity and fixed income risk characteristics. Generally, convertible securities offer lower interest or dividend yields than non-convertible securities of similar quality and less potential for gains or capital appreciation in a rising equity securities market than equity securities. They tend to be more volatile than other fixed income securities and the market for convertible securities may be less liquid than markets for stocks or bonds. A significant portion of convertible securities have below investment grade credit ratings and are subject to increased credit and liquidity risks.
Due to the Fund’s investment exposure to foreign companies and American Depositary Receipts, the Fund may experience increased market, liquidity, currency, political, information, and other risks.
The Fund is subject to the risks associated with derivatives, which may be different from and greater than the risks associated with directly investing in securities. Derivatives may be subject to risks such as liquidity risk, leveraging risk, interest rate risk, market risk, and credit risk. Illiquid securities may lower the Fund’s returns since the Fund may be unable to sell these securities at their desired time or price. Derivatives also may involve the risk of mispricing or improper valuation and the risk that changes in the value of the derivative may not correlate perfectly with the value of the underlying asset, rate or index. Whether the Fund’s use of derivatives is successful will depend on, among other things, the Fund’s ability to correctly forecast market movements and other factors. If the Fund incorrectly forecasts these and other factors, the Fund’s performance could suffer. The Fund’s use of derivatives could result in a loss exceeding the amount of the Fund’s investment in these instruments.
The Fund may invest up to 15% of its net assets in floating rate or adjustable rate senior loans, including bridge loans, novations, assignments, and participations, which are subject to increased credit and liquidity risks. Senior loans are business loans made to borrowers that may be U.S. or foreign corporations, partnerships or other business entities.
These factors can affect the Fund’s performance.
64
Notes to Financial Statements (continued)
| 13. | SUMMARY OF CAPITAL TRANSACTIONS |
Transactions in shares of beneficial interest were as follows:
| Year Ended | Year Ended | |||||||||||||||
| December 31, 2015 | December 31, 2014 | |||||||||||||||
| Class A Shares | Shares | Amount | Shares | Amount | ||||||||||||
| Shares sold | 131,246,580 | $ | 1,038,999,088 | 111,423,602 | $ | 918,240,032 | ||||||||||
| Converted from Class B* | 2,265,807 | 17,923,620 | 2,142,810 | 17,618,759 | ||||||||||||
| Reinvestment of distributions | 27,702,794 | 217,958,808 | 38,648,796 | 314,579,217 | ||||||||||||
| Shares reacquired | (166,949,861 | ) | (1,311,217,496 | ) | (168,224,672 | ) | (1,381,835,358 | ) | ||||||||
| Decrease | (5,734,680 | ) | $ | (36,335,980 | ) | (16,009,464 | ) | $ | (131,397,350 | ) | ||||||
| Class B Shares | ||||||||||||||||
| Shares sold | 103,957 | $ | 828,858 | 259,140 | $ | 2,132,074 | ||||||||||
| Reinvestment of distributions | 490,984 | 3,885,718 | 951,988 | 7,772,967 | ||||||||||||
| Shares reacquired | (3,432,425 | ) | (27,164,015 | ) | (3,548,570 | ) | (29,301,431 | ) | ||||||||
| Converted to Class A* | (2,257,797 | ) | (17,923,620 | ) | (2,135,198 | ) | (17,618,759 | ) | ||||||||
| Decrease | (5,095,281 | ) | $ | (40,373,059 | ) | (4,472,640 | ) | $ | (37,015,149 | ) | ||||||
| Class C Shares | ||||||||||||||||
| Shares sold | 39,131,771 | $ | 309,149,708 | 48,845,002 | $ | 403,643,174 | ||||||||||
| Reinvestment of distributions | 9,311,374 | 73,428,118 | 13,254,542 | 107,967,916 | ||||||||||||
| Shares reacquired | (56,919,000 | ) | (447,972,142 | ) | (43,041,566 | ) | (354,442,454 | ) | ||||||||
| Increase (decrease) | (8,475,855 | ) | $ | (65,394,316 | ) | 19,057,978 | $ | 157,168,636 | ||||||||
| Class F Shares | ||||||||||||||||
| Shares sold | 133,374,158 | $ | 1,052,492,963 | 142,877,845 | $ | 1,176,107,584 | ||||||||||
| Reinvestment of distributions | 10,571,181 | 82,964,455 | 11,251,747 | 91,167,797 | ||||||||||||
| Shares reacquired | (117,453,182 | ) | (916,632,109 | ) | (61,839,426 | ) | (504,666,801 | ) | ||||||||
| Increase | 26,492,157 | $ | 218,825,309 | 92,290,166 | $ | 762,608,580 | ||||||||||
| Class I Shares | ||||||||||||||||
| Shares sold | 64,068,084 | $ | 504,809,661 | 59,997,674 | $ | 488,856,081 | ||||||||||
| Reinvestment of distributions | 2,340,442 | 18,322,999 | 2,697,413 | 21,835,532 | ||||||||||||
| Shares reacquired | (64,353,481 | ) | (505,547,445 | ) | (55,352,723 | ) | (449,121,726 | ) | ||||||||
| Increase | 2,055,045 | $ | 17,585,215 | 7,342,364 | $ | 61,569,887 | ||||||||||
| Class P Shares | ||||||||||||||||
| Shares sold | 416,652 | $ | 3,357,198 | 1,140,401 | $ | 9,603,269 | ||||||||||
| Reinvestment of distributions | 256,555 | 2,064,006 | 553,934 | 4,626,282 | ||||||||||||
| Shares reacquired | (1,405,736 | ) | (11,301,542 | ) | (5,745,354 | ) | (47,825,088 | ) | ||||||||
| Decrease | (732,529 | ) | $ | (5,880,338 | ) | (4,051,019 | ) | $ | (33,595,537 | ) | ||||||
| Class R2 Shares | ||||||||||||||||
| Shares sold | 229,663 | $ | 1,790,094 | 374,253 | $ | 3,049,250 | ||||||||||
| Reinvestment of distributions | 10,167 | 80,035 | 11,613 | 93,653 | ||||||||||||
| Shares reacquired | (264,402 | ) | (2,093,382 | ) | (233,027 | ) | (1,923,163 | ) | ||||||||
| Increase (decrease) | (24,572 | ) | $ | (223,253 | ) | 152,839 | $ | 1,219,740 | ||||||||
65
Notes to Financial Statements (concluded)
| Year Ended | Year Ended | |||||||||||||||
| December 31, 2015 | December 31, 2014 | |||||||||||||||
| Class R3 Shares | Shares | Amount | Shares | Amount | ||||||||||||
| Shares sold | 5,226,130 | $ | 40,863,223 | 5,507,881 | $ | 45,366,853 | ||||||||||
| Reinvestment of distributions | 654,437 | 5,129,497 | 894,567 | 7,256,925 | ||||||||||||
| Shares reacquired | (5,398,204 | ) | (42,243,230 | ) | (2,786,607 | ) | (22,787,182 | ) | ||||||||
| Increase | 482,363 | $ | 3,749,490 | 3,615,841 | $ | 29,836,596 | ||||||||||
| Class R4 Shares(a) | ||||||||||||||||
| Shares sold | 28,138 | $ | 215,663 | – | $ | – | ||||||||||
| Reinvestment of distributions | 295 | 2,229 | – | – | ||||||||||||
| Shares reacquired | (506 | ) | (3,829 | ) | – | – | ||||||||||
| Increase | 27,927 | $ | 214,063 | – | $ | – | ||||||||||
| Class R5 Shares(a) | ||||||||||||||||
| Shares sold | 1,258 | $ | 10,000 | – | $ | – | ||||||||||
| Reinvestment of distributions | 40 | 304 | – | – | ||||||||||||
| Increase | 1,298 | $ | 10,304 | – | $ | – | ||||||||||
| Class R6 Shares(a) | ||||||||||||||||
| Shares sold | 1,541,823 | $ | 11,647,948 | – | $ | – | ||||||||||
| Reinvestment of distributions | 18,201 | 136,893 | – | – | ||||||||||||
| Shares reacquired | (67,955 | ) | (511,109 | ) | – | – | ||||||||||
| Increase | 1,492,069 | $ | 11,273,732 | – | $ | – | ||||||||||
| * | Automatic conversion of Class B shares occurs on the 25th day of the month (or, if the 25th day is not a business day, the next business day thereafter) following the eighth anniversary of the day on which the purchase order was accepted. |
| (a) | Shares commenced on June 30, 2015. |
66
Report of Independent Registered Public Accounting Firm
To the Shareholders and Board of Directors of Lord Abbett Bond-Debenture Fund, Inc.:
We have audited the accompanying statement of assets and liabilities of Lord Abbett Bond-Debenture Fund, Inc. (the “Fund”), including the schedule of investments, as of December 31, 2015, and the related statement of operations for the year then ended, the statements of changes in net assets for each of the two years in the period then ended, and the financial highlights for each of the periods presented. These financial statements and financial highlights are the responsibility of the Fund’s management. Our responsibility is to express an opinion on these financial statements and financial highlights based on our audits.
We conducted our audits in accordance with the standards of the Public Company Accounting Oversight Board (United States). Those standards require that we plan and perform the audit to obtain reasonable assurance about whether the financial statements and financial highlights are free of material misstatement. The Fund is not required to have, nor were we engaged to perform, an audit of their internal control over financial reporting. Our audits included consideration of internal control over financial reporting as a basis for designing audit procedures that are appropriate in the circumstances, but not for the purpose of expressing an opinion on the effectiveness of the Fund’s internal control over financial reporting. Accordingly, we express no such opinion. An audit also includes examining, on a test basis, evidence supporting the amounts and disclosures in the financial statements, assessing the accounting principles used and significant estimates made by management, as well as evaluating the overall financial statement presentation. Our procedures included confirmation of securities owned as of December 31, 2015, by correspondence with the custodian, brokers and agent banks; where replies were not received from brokers and agent banks, we performed other auditing procedures. We believe that our audits provide a reasonable basis for our opinion.
In our opinion, such financial statements and financial highlights referred to above present fairly, in all material respects, the financial position of Lord Abbett Bond-Debenture Fund, Inc. as of December 31, 2015, the results of its operations for the year then ended, the changes in its net assets for each of the two years in the period then ended, and the financial highlights for each of the periods presented, in conformity with accounting principles generally accepted in the United States of America.
DELOITTE & TOUCHE LLP
New York, New York
February 26, 2016
67
Supplemental Proxy Information (unaudited)
A special meeting of shareholders of the Fund was held on November 5, 2015. The special meeting was held for shareholders of the Fund to vote on the following matters:
| 1. | To amend the Fund’s fundamental restrictions related to borrowing and lending to enable the Fund to participate in an interfund lending program; and | |
| 2. | To ratify the selection of Deloitte & Touche LLP as independent registered public accounting firm for the Fund’s current fiscal year. |
The results of the proxy solicitation on the preceding matter were as follows:
| 1. | To approve the amendment to the fundamental investment restrictions of the Fund as described in the proxy statement: |
| (a) | Amend the fundamental investment restriction with respect to Borrowing |
| Broker | ||||
| Votes For | Votes Against | Abstain | Non-Votes | |
| Bond Debenture Fund | 441,871,476 | 20,804,244 | 32,990,371 | 125,584,688 |
| 1. | To approve the amendment to the fundamental investment restrictions of the Fund as described in the proxy statement: |
| (b) | Amend the fundamental investment restriction with respect to Lending |
| Broker | ||||
| Votes For | Votes Against | Abstain | Non-Votes | |
| Bond Debenture Fund | 441,713,482 | 20,548,111 | 33,404,498 | 125,584,688 |
| 2. | To ratify the selection of Deloitte & Touche LLP as the Fund’s independent registered public accounting firm for the Fund’s current fiscal year |
| Broker | ||||
| Votes For | Votes Against | Abstain | Non-Votes | |
| Bond Debenture Fund | 578,572,281 | 9,975,570 | 32,702,928 | – |
68
Basic Information About Management
The Board is responsible for the management of the business and affairs of the Fund in accordance with the laws of the State of Maryland. The Board elects officers who are responsible for the day-to-day operations of the Fund and who execute policies authorized by the Board. The Board also approves an investment adviser to the Fund and continues to monitor the cost and quality of the services the investment adviser provides, and annually considers whether to renew the contract with the adviser. Generally, each Director holds office until his/her successor is elected and qualified or until his/her earlier resignation or removal, as provided in the Fund’s organizational documents.
Lord Abbett, a Delaware limited liability company, is the Fund’s investment adviser. Designated Lord Abbett personnel are responsible for the day-to-day management of the Fund.
Interested Director
Ms. Foster is affiliated with Lord Abbett and is an “interested person” of the Fund as defined in the Act. Ms. Foster is a director/trustee and officer of each of the 12 investment companies in the Lord Abbett Family of Funds, which consist of 58 portfolios or series.
| Name, Address and Year of Birth | Current Position and Length of Service with the Fund | Principal Occupation and Other Directorships During the Past Five Years | ||
| Daria L. Foster Lord, Abbett & Co. LLC 90 Hudson Street Jersey City, NJ 07302 (1954) | Director and President since 2006; Chief Executive Officer since 2012 | Principal Occupation: Managing Partner of Lord Abbett, joined Lord Abbett in 1990. Other Directorships: None. |
Independent Directors
The following Independent Directors also are directors/trustees of each of the 12 investment companies in the Lord Abbett Family of Funds, which consist of 58 portfolios or series.
| Name, Address and Year of Birth | Current Position and Length of Service with the Fund | Principal Occupation and Other Directorships During the Past Five Years | ||
| E. Thayer Bigelow Lord, Abbett & Co. LLC c/o Legal Dept. 90 Hudson Street Jersey City, NJ 07302 (1941) | Director since 1994; Chairman since 2013 | Principal Occupation: Managing General Partner, Bigelow Media, LLC (since 2000); Senior Adviser, Time Warner Inc. (1998–2000). Other Directorships: Currently serves as director of Crane Co. (since 1984) and Huttig Building Products Inc. (since 1998). Previously served as a director of R.H. Donnelley Inc. (2009–2010). | ||
| Robert B. Calhoun, Jr. Lord, Abbett & Co. LLC c/o Legal Dept. 90 Hudson Street Jersey City, NJ 07302 (1942) | Director since 1998 | Principal Occupation: Senior Advisor of Monitor Clipper Partners, a private equity investment fund (since 1997); President of Clipper Asset Management Corp. (1991–2009). Other Directorships: None. |
69
Basic Information About Management (continued)
| Name, Address and Year of Birth | Current Position and Length of Service with the Fund | Principal Occupation and Other Directorships During the Past Five Years | ||
| Eric C. Fast Lord, Abbett & Co. LLC c/o Legal Dept. 90 Hudson Street Jersey City, NJ 07302 (1949) | Director since 2014 | Principal Occupation: Chief Executive Officer of Crane Co., an industrial products company (2001–2014). Other Directorships: Currently serves as director of Automatic Data Processing, Inc. (since 2007) and Regions Financial Corporation (since 2010). Previously served as a director of Crane Co. (1999–2014). | ||
| Evelyn E. Guernsey Lord, Abbett & Co. LLC c/o Legal Dept. 90 Hudson Street Jersey City, NJ 07302 (1955) | Director since 2011 | Principal Occupation: CEO, Americas of J.P. Morgan Asset Management (2004–2010). Other Directorships: None. | ||
| Julie A. Hill Lord, Abbett & Co. LLC c/o Legal Dept. 90 Hudson Street Jersey City, NJ 07302 (1946) | Director since 2004 | Principal Occupation: Owner and CEO of The Hill Company, a business consulting firm (since 1998). Other Directorships: Currently serves as director of Anthem, Inc., a health benefits company (since 1994). | ||
| Franklin W. Hobbs Lord, Abbett & Co. LLC c/o Legal Dept. 90 Hudson Street Jersey City, NJ 07302 (1947) | Director since 2000 | Principal Occupation: Advisor of One Equity Partners, a private equity firm (since 2004). Other Directorships: Currently serves as director and Chairman of the Board of Ally Financial Inc., a financial services firm (since 2009), and as director of Molson Coors Brewing Company (since 2002). | ||
| James M. McTaggart Lord, Abbett & Co. LLC c/o Legal Dept. 90 Hudson Street Jersey City, NJ 07302 (1947) | Director since 2012 | Principal Occupation: Independent management advisor and consultant (since 2012); Vice President, CRA International, Inc. (doing business as Charles River Associates), a global management consulting firm (2009–2012); Founder and Chairman of Marakon Associates, Inc., a strategy consulting firm (1978– 2009); and Officer and Director of Trinsum Group, a holding company (2007–2009). Other Directorships: Currently serves as director of Blyth, Inc., a home products company (since 2004). | ||
| James L.L. Tullis Lord, Abbett & Co. LLC c/o Legal Dept. 90 Hudson Street Jersey City, NJ 07302 (1947) | Director since 2006 | Principal Occupation: CEO of Tullis-Dickerson and Co. Inc., a venture capital management firm (since 1990); CEO of Tullis Health Investors Inc. (since 2012). Other Directorships: Currently serves as director of Crane Co. (since 1998). |
70
Basic Information About Management (continued)
Officers
None of the officers listed below have received compensation from the Fund. All of the officers of the Fund also may be officers of the other Lord Abbett Funds and maintain offices at 90 Hudson Street, Jersey City, NJ 07302. Unless otherwise indicated, the position(s) and title(s) listed under the “Principal Occupation During the Past Five Years” column indicate each officer’s position(s) and title(s) with Lord Abbett. Each officer serves for an indefinite term (i.e., until his or her death, resignation, retirement, or removal).
| Name and Year of Birth | Current Position with the Fund | Length of Service of Current Position | Principal Occupation During the Past Five Years | |||
| Daria L. Foster (1954) | President and Chief Executive Officer | Elected as President in 2006 and Chief Executive Officer in 2012 | Managing Partner of Lord Abbett, joined Lord Abbett in 1990. | |||
| Robert I. Gerber (1954) | Executive Vice President | Elected in 2007 | Partner and Chief Investment, joined Lord Abbett in 1997. | |||
| Robert A. Lee (1969) | Executive Vice President | Elected in 2013 | Partner and Deputy Chief Investment Officer, joined Lord Abbett in 1997. | |||
| Steven F. Rocco (1979) | Executive Vice President | Elected in 2014 | Partner and Portfolio Manager, joined Lord Abbett in 2004. | |||
| John W. Ashbrook (1964) | Vice President and Assistant Secretary | Elected in 2014 | Assistant General Counsel, joined Lord Abbett in 2008. | |||
| Joan A. Binstock (1954) | Chief Financial Officer and Vice President | Elected in 1999 | Partner and Chief Financial and Operations Officer, joined Lord Abbett in 1999. | |||
| Brooke A. Fapohunda (1975) | Vice President and Assistant Secretary | Elected in 2014 | Deputy General Counsel, joined Lord Abbett in 2006. | |||
| John K. Forst (1960) | Vice President and Assistant Secretary | Elected in 2005 | Partner and Deputy General Counsel, joined Lord Abbett in 2004. | |||
| Lawrence H. Kaplan (1957) | Vice President and Secretary | Elected in 1997 | Partner and General Counsel, joined Lord Abbett in 1997. | |||
| Joseph M. McGill (1962) | Chief Compliance Officer | Elected in 2014 | Chief Compliance Officer, joined Lord Abbett in 2014 and was formerly Managing Director and the Chief Compliance Officer at UBS Global Asset Management (2003–2013). | |||
| A. Edward Oberhaus, III (1959) | Vice President | Elected in 1996 | Partner and Director, joined Lord Abbett in 1983. |
71
Basic Information About Management (concluded)
| Name and Year of Birth | Current Position with the Fund | Length of Service of Current Position | Principal Occupation During the Past Five Years | |||
| Lawrence B. Stoller (1963) | Vice President and Assistant Secretary | Elected in 2007 | Partner and Senior Deputy General Counsel, joined Lord Abbett in 2007. | |||
| Scott S. Wallner (1955) | AML Compliance Officer | Elected in 2011 | Assistant General Counsel, joined Lord Abbett in 2004. | |||
| Bernard J. Grzelak (1971) | Treasurer | Elected in 2003 | Partner and Director of Fund Administration, joined Lord Abbett in 2003. |
Please call 888-522-2388 for a copy of the statement of additional information, which contains further information about the Fund’s Directors. It is available free upon request.
72
Approval of Advisory Contract
The Board of Directors of the Fund, including all of the Directors who are not interested persons of the Fund or of Lord Abbett (the “Independent Board Members”), annually considers whether to approve the continuation of the existing management agreement between the Fund and Lord Abbett. In connection with its most recent approval, the Board reviewed materials relating specifically to the management agreement, as well as numerous materials received throughout the course of the year, including information about the Fund’s investment performance compared to the performance of its benchmark. Before making its decision as to the Fund, the Board had the opportunity to ask questions and request further information, taking into account its familiarity with Lord Abbett gained through its meetings and discussions. These meetings and discussions included the examination of the portfolio management team conducted by members of the Contract Committee, the deliberations of the Contract Committee, and discussions between the Contract Committee and Lord Abbett’s management. The Independent Board Members also discussed the materials described above with their independent legal counsel in a private session at which no representatives of management were present.
The materials received by the Board included, but were not limited to: (1) information provided by Morningstar Associates, LLC (“Morningstar”) regarding the investment performance of the Fund compared to the investment performance of a group of funds in the same Morningstar investment category (the “performance peer group”) and the investment performance of one or more appropriate benchmarks; (2) information provided by Morningstar regarding the expense ratios, contractual and effective management fee rates, and other expense components for the Fund and one or more groups of funds in the same Morningstar category, with the same share classes and operational characteristics, including asset size (the “expense peer group”); (3) certain supplemental investment performance information provided by Lord Abbett; (4) information provided by Lord Abbett on the projected expense ratios, management fee rates, and other expense components for the Fund; (5) sales and redemption information for the Fund; (6) information regarding Lord Abbett’s financial condition; (7) an analysis of the relative profitability of the management agreement to Lord Abbett; (8) information provided by Lord Abbett regarding the investment management fees Lord Abbett receives from its other advisory clients maintaining accounts with a similar investment strategy as the Fund; and (9) information regarding the personnel and other resources devoted by Lord Abbett to managing the Fund.
Investment Management Services Generally. The Board considered the investment management services provided by Lord Abbett to the Fund, including investment research, portfolio management, and trading, and Lord Abbett’s commitment to compliance with all applicable legal requirements. The Board also observed that Lord Abbett was solely engaged in the investment management business and accordingly did not experience the conflicts of interest that may result from being engaged in other lines of business. The Board considered the investment advisory services provided by Lord Abbett to other clients, the fees charged for the services, and the differences in the nature of the services provided to the Fund and other Lord Abbett Funds, on the one hand, and the services provided to other clients, on the other.
Investment Performance. The Board reviewed the Fund’s investment performance in relation to that of the performance peer group as of various periods ended August 31, 2015. The Board observed that the Fund’s investment performance was well above the median of the performance peer group for the one-year, three-year, five-year, and ten-year periods.
Lord Abbett’s Personnel and Methods. The Board considered the qualifications of the personnel providing investment management services to the Fund, in light of its investment objective and
73
Approval of Advisory Contract (continued)
discipline. Among other things, the Board considered the size, experience, and turnover of Lord Abbett’s investment management staff, Lord Abbett’s investment methodology and philosophy, and Lord Abbett’s approach to recruiting, training, and retaining investment management personnel.
Nature and Quality of Other Services. The Board considered the nature, quality, costs, and extent of compliance, administrative, and other services performed by Lord Abbett and the nature and extent of Lord Abbett’s supervision of third party service providers, including the Fund’s transfer agent and custodian.
Expenses. The Board considered the expense level of the Fund and the expense levels of the expense peer group. It also considered the projected expense levels and how those levels would relate to those of the expense peer group and the amount and nature of the fees paid by shareholders. The Board observed that the overall expense level of the Fund was well below the median of the expense peer group.
Profitability. The Board considered the level of Lord Abbett’s profits in managing the Fund, including a review of Lord Abbett’s methodology for allocating its costs to its management of the Fund. The Board concluded that the allocation methodology had a reasonable basis and was appropriate. It considered any profits realized by Lord Abbett in connection with the operation of the Fund, including the fee that Lord Abbett receives from the Fund for providing administrative services to the Fund, and whether the amount of profit was fair for the management of the Fund. The Board also considered the profits realized from other business segments of Lord Abbett, which may benefit from or be related to the Fund’s business. The Board considered Lord Abbett’s profit margins in comparison with available industry data, both accounting for and ignoring marketing and distribution expenses, and how those profit margins could affect Lord Abbett’s ability to recruit and retain investment personnel. The Board recognized that Lord Abbett’s profitability was a factor in enabling it to attract and retain qualified investment management personnel to provide services to the Fund. The Board concluded that Lord Abbett’s profitability as to the Fund was not excessive.
Economies of Scale. The Board considered the extent to which there had been economies of scale in managing the Fund, whether the Fund had appropriately benefited from such economies of scale, and whether there was potential for realization of any further economies of scale. The Board concluded that the existing management fee schedule, with its breakpoint or breakpoints in the level of the management fee, adequately addressed any economies of scale in managing the Fund.
Other Benefits to Lord Abbett. The Board considered the character and amount of fees paid by the Fund and the Fund’s shareholders to Lord Abbett and the Distributor for services other than investment advisory services. The Board also considered the revenues and profitability of Lord Abbett’s investment advisory business apart from its mutual fund business, and the intangible benefits enjoyed by Lord Abbett by virtue of its relationship with the Fund. The Board observed that the Distributor receives 12b-1 fees from certain of the Lord Abbett Funds as to shares held in accounts for which there is no other broker of record, may retain a portion of the 12b-1 fees it receives, and receives a portion of the sales charges on sales and redemptions of some classes of shares. In addition, the Board observed that Lord Abbett accrues certain benefits for its business of providing investment advice to clients other than the Lord Abbett Funds, but that business also benefits the Funds. The Board also noted that Lord Abbett, as disclosed in the prospectus of the Fund, has entered into revenue sharing arrangements with certain entities that distribute shares of the Fund.
74
Approval of Advisory Contract (concluded)
Alternative Arrangements. The Board considered whether, instead of approving continuation of the management agreement, it might be in the best interests of the Fund to implement one or more alternative arrangements, such as continuing to employ Lord Abbett, but on different terms. After considering all of the relevant factors, the Board unanimously found that continuation of the existing management agreement was in the best interests of the Fund and its shareholders and voted unanimously to approve the continuation of the management agreement. In considering whether to approve the continuation of the management agreement, the Board did not identify any single factor as paramount or controlling. This summary does not discuss in detail all matters considered.
75
Householding
The Fund has adopted a policy that allows it to send only one copy of the Fund’s prospectus, proxy material, annual report and semiannual report to certain shareholders residing at the same “household.” This reduces Fund expenses, which benefits you and other shareholders. If you need additional copies or do not want your mailings to be “householded,” please call Lord Abbett at 888-522-2388 or send a written request with your name, the name of your fund or funds and your account number or numbers to Lord Abbett Family of Funds, P.O. Box 219336, Kansas City, MO 64121.
Proxy Voting Policies, Procedures and Records
A description of the policies and procedures that Lord Abbett uses to vote proxies related to the Fund’s portfolio securities, and information on how Lord Abbett voted the Fund’s proxies during the 12-month period ended June 30 are available without charge, upon request, (i) by calling 888-522-2388; (ii) on Lord Abbett’s Website at www.lordabbett.com; and (iii) on the Securities and Exchange Commission’s (“SEC”) Website at www.sec.gov.
Shareholder Reports and Quarterly Portfolio Disclosure
The Fund is required to file its complete schedule of portfolio holdings with the SEC for its first and third fiscal quarters on Form N-Q. Copies of the filings are available without charge, upon request on the SEC’s Website at www.sec.gov and may be available by calling Lord Abbett at 888-522-2388. You can also obtain copies of Form N-Q by visiting the SEC’s Public Reference Room in Washington, DC (information on the operation of the Public Reference Room may be obtained by calling 800-SEC-0330).
Tax Information
2% of the ordinary income distributions paid by the Fund during the fiscal year December 31, 2015 is qualified dividend income. For corporate shareholders, 2% of the Fund’s ordinary income distributions qualified for the dividend received deduction.
For foreign shareholders, 99% of the net investment income distributions paid by the Fund during the fiscal year ended December 31, 2015 represents interest-related dividends.
Additionally, of the distributions paid to shareholders during the fiscal year ended December 31, 2015, $3,075,078 and $66,319,173 respectively, represent short-term capital gains and long-term capital gains. |
76

 | ||
| This report, when not used for the general information of shareholders of the Fund, is to be distributed only if preceded or accompanied by a current fund prospectus. | ||
| Lord Abbett mutual fund shares are distributed by | LABD-2 | |
| LORD ABBETT DISTRIBUTOR LLC. | Lord Abbett Bond-Debenture Fund, Inc. | (2/16) |
| Item 2: | Code of Ethics. |
| (a) | In accordance with applicable requirements, the Registrant adopted a Sarbanes-Oxley Code of Ethics on June 19, 2003 that applies to the principal executive officer and senior financial officers of the Registrant (“Code of Ethics”). The Code of Ethics was in effect during the fiscal year ended December 31, 2015 (the “Period”). |
| (b) | Not applicable. |
| (c) | The Registrant has not amended the Code of Ethics as described in Form N-CSR during the Period. |
| (d) | The Registrant has not granted any waiver, including an implicit waiver, from a provision of the Code of Ethics as described in Form N-CSR during the Period. |
| (e) | Not applicable. |
| (f) | See Item 12(a)(1) concerning the filing of the Code of Ethics. |
| Item 3: | Audit Committee Financial Expert. |
The Registrant’s board of directors has determined that each of the following independent directors who are members of the audit committee is an audit committee financial expert: E. Thayer Bigelow and Robert B. Calhoun, Jr. Each of these persons is independent within the meaning of the Form N-CSR.
| Item 4: | Principal Accountant Fees and Services. |
In response to sections (a), (b), (c) and (d) of Item 4, the aggregate fees billed to the Registrant for the fiscal years ended December 31, 2015 and 2014 by the Registrant’s principal accounting firm, Deloitte & Touche LLP, the member firms of Deloitte Touche Tohmatsu and their respective affiliates (collectively, “Deloitte”) were as follows:
| Fiscal year ended: | ||||||||
| 2015 | 2014 | |||||||
| Audit Fees {a} | $78,800 | $77,000 | ||||||
| Audit-Related Fees | - 0 - | - 0 - | ||||||
| Total audit and audit-related fees | 78,800 | 77,000 | ||||||
| Tax Fees {b} | 11,952 | 12,294 | ||||||
| All Other Fees | - 0 - | - 0 - | ||||||
| Total Fees | $90,752 | $89,294 | ||||||
{a} Consists of fees for audits of the Registrant’s annual financial statements.
{b} Fees for the fiscal year ended December 31, 2015 and 2014 consist of fees for preparing the U.S. Income Tax Return for Regulated Investment Companies, New Jersey Corporation Business Tax Return, New Jersey Annual Report Form, U.S. Return of Excise Tax on Undistributed Income of Investment Companies, IRS Forms 1099-MISC and 1096 Annual Summary and Transmittal of U.S. Information Returns.
(e) (1) Pursuant to Rule 2-01(c) (7) of Regulation S-X, the Registrant’s Audit Committee has adopted pre-approval policies and procedures. Such policies and procedures generally provide that the Audit Committee must pre-approve:
| · | any audit, audit-related, tax, and other services to be provided to the Lord Abbett Funds, including the Registrant, and |
| · | any audit-related, tax, and other services to be provided to the Registrant’s investment adviser and any entity controlling, controlled by or under common control with the investment adviser that provides ongoing services to one or more Funds comprising the Registrant if the engagement relates directly to operations and financial reporting of a Fund, by the independent auditor to assure that the provision of such services does not impair the auditor’s independence. |
The Audit Committee has delegated pre-approval authority to its Chairman, subject to a fee limit of $10,000 per event, and not to exceed $25,000 annually. The Chairman will report any pre-approval decisions to the Audit Committee at its next scheduled meeting. Unless a type of service to be provided by the independent auditor has received general pre-approval, it must be pre-approved by the Audit Committee. Any proposed services exceeding pre-approved cost levels will require specific pre-approval by the Audit Committee.
(e) (2) The Registrant’s Audit Committee has approved 100% of the services described in this Item 4 (b) through (d).
(f) Not applicable.
(g) The aggregate non-audit fees billed by Deloitte for services rendered to the Registrant are shown above in the response to Item 4 (a), (b), (c) and (d) as “All Other Fees”.
The aggregate non-audit fees billed by Deloitte for services rendered to the Registrant’s investment adviser, Lord, Abbett & Co. LLC (“Lord Abbett”), for the fiscal years ended December 31, 2015 and 2014 were:
| Fiscal year ended: | ||||||||
| 2015 | 2014 | |||||||
| All Other Fees {a} | $285,031 | $185,734 | ||||||
{a} Consist of fees for Independent Services Auditors’ Report on Controls Placed in Operation and Tests of Operating Effectiveness related to Lord Abbett’s Asset Management Services (“SOC-1 Report”).
The aggregate non-audit fees billed by Deloitte for services rendered to entities under the common control of Lord Abbett for the fiscal years ended December 31, 2015 and 2014 were:
| Fiscal year ended: | ||||||||
| 2015 | 2014 | |||||||
| All Other Fees | $ - 0 - | $ - 0 - | ||||||
(h) The Registrant’s Audit Committee has considered the provision of non-audit services that were rendered to the Registrant’s investment adviser, and any entity controlling, controlled by or under common control with the investment adviser that provides ongoing services to the Registrant, that were not pre-approved pursuant to Rule 2-01 (c)(7)(ii) of Regulation S-X and has determined that the provision of such services is compatible with maintaining Deloitte’s independence.
| Item 5: | Audit Committee of Listed Registrants. |
| Not applicable. | |
| Item 6: | Investments. |
| Not applicable. | |
| Item 7: | Disclosure of Proxy Voting Policies and Procedures for Closed-End Management Investment Companies. |
| Not applicable. | |
| Item 8: | Portfolio Managers of Closed-End Management Investment Companies. |
| Not applicable. | |
| Item 9: | Purchases of Equity Securities by Closed-End Management Investment Company and Affiliated Purchasers. |
| Not applicable. | |
| Item 10: | Submission of Matters to a Vote of Security Holders. |
| Not applicable. | |
| Item 11: | Controls and Procedures. |
| (a) | Based on their evaluation of the Registrant’s disclosure controls and procedures (as defined in Rule 30a-3(c) under the Investment Company Act of 1940) as of a date within 90 days prior to the filing date of this report, the Chief Executive |
| Officer and Chief Financial Officer of the Registrant have concluded that such disclosure controls and procedures are reasonably designed and effective to ensure that material information relating to the Registrant, including its consolidated subsidiaries, is made known to them by others within those entities. |
| (b) | There were no changes in the Registrant’s internal control over financial reporting (as defined in Rule 30a-3(d) under the Investment Company Act of 1940) that occurred during the second fiscal quarter of the period covered by this report that have materially affected, or are reasonably likely to materially affect, the Registrant’s internal control over financial reporting. |
| Item 12: | Exhibits. |
| (a)(1) | The Lord Abbett Family of Funds Sarbanes Oxley Code of Ethics for the Principal Executive Officer and Senior Financial Officers is attached hereto as part of Ex-99. CODEETH. | |
| (a)(2) | Certification of each Principal Executive Officer and Principal Financial Officer of the Registrant as required by Rule 30a-2 under the Investment Company Act of 1940 is attached hereto as a part of EX-99.CERT. |
| (b) | Certification of each Principal Executive Officer and Principal Financial Officer of the Registrant as required by Section 906 of the Sarbanes-Oxley Act of 2002 is provided as a part of EX-99.906CERT. |
SIGNATURES
Pursuant to the requirements of the Securities Exchange Act of 1934 and the Investment Company Act of 1940, the Registrant has duly caused this report to be signed on its behalf by the undersigned, thereunto duly authorized.
| LORD ABBETT BOND-DEBENTURE FUND, INC. |
| By: | /s/ Daria L. Foster | |
| Daria L. Foster | ||
| President and Chief Executive Officer |
Date: February 26, 2016
| By: | /s/ Joan A. Binstock | |
| Joan A. Binstock | ||
| Chief Financial Officer and Vice President |
Date: February 26, 2016
Pursuant to the requirements of the Securities Exchange Act of 1934 and the Investment Company Act of 1940, this report has been signed below by the following persons on behalf of the Registrant and in the capacities and on the dates indicated.
| By: | /s/ Daria L. Foster | |
| Daria L. Foster | ||
| President and Chief Executive Officer |
Date: February 26, 2016
| By: | /s/ Joan A. Binstock | |
| Joan A. Binstock | ||
| Chief Financial Officer and Vice President |
Date: February 26, 2016