UNITED STATES
SECURITIES AND EXCHANGE COMMISSION
Washington, D.C. 20549
FORM N-CSR
CERTIFIED SHAREHOLDER REPORT OF REGISTERED
MANAGEMENT INVESTMENT COMPANIES
Investment Company Act File Number: 811-02145
LORD ABBETT BOND-DEBENTURE FUND, INC.
(Exact name of Registrant as specified in charter)
90 Hudson Street, Jersey City, NJ 07302
(Address of principal executive offices) (Zip code)
Brooke A. Fapohunda, Esq., Vice President & Assistant Secretary
90 Hudson Street, Jersey City, NJ 07302
(Name and address of agent for service)
Registrant’s telephone number, including area code: (800) 201-6984
Date of fiscal year end: 12/31
Date of reporting period: 12/31/2016
| Item 1: | Report(s) to Shareholders. |
2016 LORD ABBETT
ANNUAL REPORT
Lord Abbett
Bond Debenture Fund
For the fiscal year ended December 31, 2016
Table of Contents
Lord Abbett Bond Debenture Fund
Annual Report
For the fiscal year ended December 31, 2016
From left to right: James L.L. Tullis, Chairman of the Lord Abbett Funds and Daria L. Foster Director, President, and Chief Executive Officer of the Lord Abbett Funds. | Dear Shareholders: We are pleased to provide you with this overview of the performance of Lord Abbett Bond Debenture Fund for the fiscal year ended December 31, 2016. On this page and the following pages, we discuss the major factors that influenced fiscal year performance. For detailed and more timely information about the Fund, please visit our website at www.lordabbett.com, where you also can access quarterly commentaries that provide updates on the Fund’s performance and other portfolio related updates. Thank you for investing in Lord Abbett mutual funds. We value the trust that you place in us and look forward to serving your investment needs in the years to come.
Best regards,
Daria L. Foster Director, President and Chief Executive Officer |


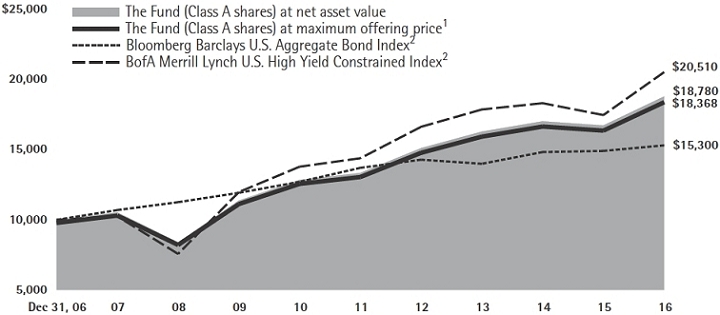
For the fiscal year ended December 31, 2016, the Fund returned 12.35%, reflecting performance at the net asset value (NAV) of Class A shares, with all distributions reinvested, compared to its benchmark, the Bloomberg Barclays U.S. Aggregate Bond Index,1 which returned 2.65% over the same period.
The high yield sector of the U.S. fixed income market experienced strong returns during the 12-month period, outperforming traditional government related and investment grade securities
within the fixed income market as well as the U.S. equity market. Leveraged loans also experienced strong returns, although not to the same extent as high yield bonds.
As it has in the past, the Fund maintained a significant allocation to high yield bonds, as we remained positive on the high yield market from a fundamental perspective. The Fund’s exposure to high yield bonds likely contributed to relative performance, as the high yield market significantly outperformed the Fund’s benchmark.
1
The Fund maintained a sizable allocation to equities throughout the period, as equities provided portfolio diversification, a high degree of liquidity, and a more diverse opportunity set to express certain investment themes than did certain fixed income securities. The Fund’s allocation to equities likely contributed to relative performance, as the asset class outperformed the Bloomberg Barclays U.S. Aggregate Bond Index1.
Within the Fund’s investment grade bond allocation, the Fund’s exposure to ‘AAA’ rated bonds likely detracted from performance, as ‘AAA’ rated bonds underperformed the benchmark during the period.
The Fund’s portfolio is actively managed and, therefore, its holdings and the weightings of a particular issuer or particular sector as a percentage of portfolio assets are subject to change. Sectors may include many industries.
1 The Bloomberg Barclays U.S. Aggregate Bond Index represents securities that are SEC registered, taxable, and dollar denominated. The index covers the U.S. investment grade fixed rate bond market, with index components for government and corporate securities, mortgage pass through securities, and asset backed securities. Total return comprises price appreciation/depreciation and income as a percentage of the original investment.
Unless otherwise specified, indexes reflect total return, with all dividends reinvested. Indexes are unmanaged, do not reflect the deduction of fees or expenses, and are not available for direct investment.
Important Performance and Other Information
Performance data quoted in the following pages reflect past performance and are no guarantee of future results. Current performance may be higher or lower than the performance quoted. The investment return and principal value of an investment in the Fund will fluctuate so that shares, on any given day or when redeemed, may be worth more or less than their original cost. You can obtain performance data current to the most recent month end by calling Lord Abbett at 888-522-2388 or referring to www.lordabbett.com.
Except where noted, comparative Fund performance does not account for the deduction of sales charges and would be different if sales charges were included. The Fund offers several classes of shares with distinct pricing options. For a full description of the differences in pricing alternatives, please see the Fund’s prospectus.
The annual commentary above discusses the views of the Fund’s management and various portfolio holdings of the Fund as of December 31, 2016. These views and portfolio holdings may have changed after this date. Information provided in the commentary is not a recommendation to buy or sell securities. Because the Fund’s portfolio is actively managed and may change significantly, the Fund may no longer own the securities described above or may have otherwise changed its positions in the securities. For more recent information about the Fund’s portfolio holdings, please visit www.lordabbett.com.
A Note about Risk: See Notes to Financial Statements for a discussion of investment risks. For a more detailed discussion of the risks associated with the Fund, please see the Fund’s prospectus.
Mutual funds are not insured by the FDIC, are not deposits or other obligations of, or guaranteed by, banks, and are subject to investment risks including possible loss of principal amount invested.
2
Below is a comparison of a $10,000 investment in Class A shares with the same investment in the Bloomberg Barclays U.S. Aggregate Bond Index and the BofA Merrill Lynch U.S. High Yield Constrained Index, assuming reinvestment of all dividends and distributions. The performance of other classes will be greater than or less than the performance shown in the graph below due to different sales loads and expenses applicable to such classes. The graph and performance table below do not reflect the deduction of taxes that a shareholder would pay on Fund distributions or the redemption of Fund shares. Past performance is no guarantee of future results.
Average Annual Total Returns at Maximum Applicable
Sales Charge for the Periods Ended December 31, 2016
| 1 Year | 5 Years | 10 Years | Life of Class | |||||
| Class A3 | 9.83% | 6.58% | 6.27% | – | ||||
| Class B4 | 6.44% | 5.99% | 5.93% | – | ||||
| Class C5 | 10.63% | 6.40% | 5.83% | – | ||||
| Class F6 | 12.46% | 7.26% | – | 6.60% | ||||
| Class I7 | 12.62% | 7.34% | 6.82% | – | ||||
| Class P7 | 12.27% | 7.08% | 6.46% | – | ||||
| Class R26 | 11.91% | 6.73% | – | 6.09% | ||||
| Class R36 | 12.03% | 6.85% | – | 6.20% | ||||
| Class R48 | 12.29% | – | – | 4.69% | ||||
| Class R58 | 12.62% | – | – | 4.96% | ||||
| Class R68 | 12.56% | – | – | 5.02% |
1 Reflects the deduction of the maximum initial sales charge of 2.25%.
2 Performance of each unmanaged index does not reflect any fees or expenses. The performance of each index is not necessarily representative of the Fund’s performance.
3 Total return, which is the percentage change in net asset value, after deduction of the maximum initial sales charge of 2.25% applicable to Class A shares, with all dividends and distributions reinvested for the periods shown ended December 31, 2016 is calculated using the SEC-required uniform method to compute such return.
4 Performance reflects the deduction of a CDSC of 5% for 1 year, 2% for 5 years and 0% for 10 years. Class B shares
automatically convert to Class A shares after approximately 8 years. (There is no initial sales charge for automatic conversions.) All returns for periods greater than 8 years reflect this conversion.
5 The 1% CDSC for Class C shares normally applies before the first anniversary of the purchase date. Performance for other periods is at net asset value.
6 Commenced operations on September 7, 2007 and performance for the Class began on September 28, 2007. Performance is at net asset value.
7 Performance is at net asset value.
8 Commenced operations and performance for the class began on June 30, 2015. Performance is at net asset value.
3
As a shareholder of the Fund, you incur two types of costs: (1) transaction costs, including sales charges (loads) on purchase payments (these charges vary among the share classes); and (2) ongoing costs, including management fees; distribution and service (12b-1) fees (these charges vary among the share classes); and other Fund expenses. This Example is intended to help you understand your ongoing costs (in dollars) of investing in the Fund and to compare these costs with the ongoing costs of investing in other mutual funds.
The Example is based on an investment of $1,000 invested at the beginning of the period and held for the entire period (July 1, 2016 through December 31, 2016).
Actual Expenses
For each class of the Fund, the first line of the table on the following page provides information about actual account values and actual expenses. You may use the information in this line, together with the amount you invested, to estimate the expenses that you paid over the period. Simply divide your account value by $1,000 (for example, an $8,600 account value divided by $1,000 = 8.6), then multiply the result by the number in the first line under the heading titled “Expenses Paid During Period 7/1/16 – 12/31/16” to estimate the expenses you paid on your account during this period.
Hypothetical Example for Comparison Purposes
For each class of the Fund, the second line of the table on the following page provides information about hypothetical account values and hypothetical expenses based on the Fund’s actual expense ratio and an assumed rate of return of 5% per year before expenses, which is not the Fund’s actual return. The hypothetical account values and expenses may not be used to estimate the actual ending account balance or expenses you paid for the period. You may use this information to compare the ongoing costs of investing in the Fund and other funds. To do so, compare this 5% hypothetical example with the 5% hypothetical examples that appear in the shareholder reports of the other funds.
| 4 | See Notes to Financial Statements. |
Please note that the expenses shown in the table are meant to highlight your ongoing costs only and do not reflect any transactional costs, such as sales charges (loads). Therefore, the second line of the table is useful in comparing ongoing costs only, and will not help you determine the relative total costs of owning different funds. In addition, if these transactional costs were included, your costs would have been higher.
| Beginning | Ending | Expenses | |||||
| Account | Account | Paid During | |||||
| Value | Value | Period† | |||||
| 7/1/16 - | |||||||
| 7/1/16 | 12/31/16 | 12/31/16 | |||||
| Class A | |||||||
| Actual | $1,000.00 | $1,059.70 | $4.19 | ||||
| Hypothetical (5% Return Before Expenses) | $1,000.00 | $1,021.06 | $4.12 | ||||
| Class B | |||||||
| Actual | $1,000.00 | $1,055.40 | $8.32 | ||||
| Hypothetical (5% Return Before Expenses) | $1,000.00 | $1,017.04 | $8.16 | ||||
| Class C | |||||||
| Actual | $1,000.00 | $1,056.30 | $7.44 | ||||
| Hypothetical (5% Return Before Expenses) | $1,000.00 | $1,017.90 | $7.30 | ||||
| Class F | |||||||
| Actual | $1,000.00 | $1,060.30 | $3.68 | ||||
| Hypothetical (5% Return Before Expenses) | $1,000.00 | $1,021.57 | $3.61 | ||||
| Class I | |||||||
| Actual | $1,000.00 | $1,061.00 | $3.16 | ||||
| Hypothetical (5% Return Before Expenses) | $1,000.00 | $1,022.07 | $3.10 | ||||
| Class P | |||||||
| Actual | $1,000.00 | $1,058.60 | $4.45 | ||||
| Hypothetical (5% Return Before Expenses) | $1,000.00 | $1,020.81 | $4.37 | ||||
| Class R2 | |||||||
| Actual | $1,000.00 | $1,057.60 | $6.26 | ||||
| Hypothetical (5% Return Before Expenses) | $1,000.00 | $1,019.05 | $6.14 | ||||
| Class R3 | |||||||
| Actual | $1,000.00 | $1,058.20 | $5.74 | ||||
| Hypothetical (5% Return Before Expenses) | $1,000.00 | $1,019.56 | $5.63 | ||||
| Class R4 | |||||||
| Actual | $1,000.00 | $1,059.40 | $4.45 | ||||
| Hypothetical (5% Return Before Expenses) | $1,000.00 | $1,020.81 | $4.37 | ||||
| Class R5 | |||||||
| Actual | $1,000.00 | $1,059.60 | $3.16 | ||||
| Hypothetical (5% Return Before Expenses) | $1,000.00 | $1,022.07 | $3.10 | ||||
| Class R6 | |||||||
| Actual | $1,000.00 | $1,060.10 | $2.74 | ||||
| Hypothetical (5% Return Before Expenses) | $1,000.00 | $1,022.47 | $2.69 |
| † | For each class of the Fund, net expenses are equal to the annualized expense ratio for such class (0.81% for Class A, 1.61% for Class B, 1.44% for Class C, 0.71% for Class F, 0.61% for Class I, 0.86% for Class P, 1.21% for Class R2, 1.11% for Class R3, 0.86% for Class R4, 0.61% for Class R5 and 0.53% for Class R6) multiplied by the average account value over the period, multiplied by 184/366 (to reflect one-half year period). |
| See Notes to Financial Statements. | 5 |
Portfolio Holdings Presented by Sector
December 31, 2016
| Sector* | %** | |
| Asset Backed | 1.99 | % |
| Automotive | 1.68 | % |
| Banking | 7.91 | % |
| Basic Industry | 13.68 | % |
| Capital Goods | 4.46 | % |
| Consumer Goods | 4.78 | % |
| Energy | 15.65 | % |
| Financial Services | 2.08 | % |
| Foreign Government | 4.27 | % |
| Healthcare | 5.19 | % |
| Insurance | 1.49 | % |
| Leisure | 4.36 | % |
| Media | 6.39 | % |
| Mortgage-Backed | 0.64 | % |
| Municipal | 0.33 | % |
| Real Estate | 1.26 | % |
| Retail | 4.37 | % |
| Services | 2.55 | % |
| Technology & Electronics | 5.44 | % |
| Telecommunications | 4.76 | % |
| Transportation | 2.60 | % |
| Utility | 2.84 | % |
| Repurchase Agreement | 1.28 | % |
| Total | 100.00 | % |
| * | A sector may comprise several industries. |
| ** | Represents percent of total investments. |
6
December 31, 2016
| Principal | ||||||||||||
| Interest | Maturity | Amount | Fair | |||||||||
| Investments | Rate | Date | (000) | Value | ||||||||
| LONG-TERM INVESTMENTS 97.19% | ||||||||||||
| ASSET-BACKED SECURITIES 1.97% | ||||||||||||
| Automobiles 0.37% | ||||||||||||
| Drive Auto Receivables Trust 2016-BA D† | 4.53% | 8/15/2023 | $ | 8,932 | $ | 8,989,074 | ||||||
| Ford Credit Auto Owner Trust 2016-C C | 1.93% | 4/15/2023 | 4,715 | 4,637,994 | ||||||||
| Hyundai Auto Receivables Trust 2016-B C | 2.19% | 11/15/2022 | 10,439 | 10,284,418 | ||||||||
| TCF Auto Receivables Owner Trust 2016-1A B† | 2.32% | 6/15/2022 | 8,695 | 8,586,088 | ||||||||
| Westlake Automobile Receivables Trust 2016-3A B† | 2.07% | 12/15/2021 | 2,457 | 2,447,370 | ||||||||
| Total | 34,944,944 | |||||||||||
| Other 1.60% | ||||||||||||
| ALM XIX Ltd. 2016-19A C† | 4.984% | # | 7/15/2028 | 4,038 | 4,097,921 | |||||||
| ALM XVIII Ltd. 2016-18A C† | 5.007% | # | 7/15/2027 | 4,500 | 4,541,283 | |||||||
| Anchorage Capital CLO 7 Ltd. 2015-7A D† | 4.53% | # | 10/15/2027 | 3,600 | 3,522,011 | |||||||
| Anchorage Capital CLO 8 Ltd. 2016-8A D† | 4.921% | # | 7/28/2028 | 1,750 | 1,771,459 | |||||||
| Anchorage Capital CLO 9 Ltd. 2016-9A D† | 4.951% | # | 1/15/2029 | 8,100 | 8,047,131 | |||||||
| Anchorage Capital CLO Ltd. 2013-1A C† | 4.378% | # | 7/13/2025 | 1,898 | 1,878,740 | |||||||
| Ascentium Equipment Receivables Trust 2016-2A B† | 2.50% | 9/12/2022 | 3,705 | 3,651,315 | ||||||||
| BlueMountain CLO Ltd. 2016-1A D† | 5.681% | # | 4/20/2027 | 4,200 | 4,250,901 | |||||||
| Engs Commercial Finance Trust 2016-1A A2† | 2.63% | 2/22/2022 | 9,447 | 9,397,324 | ||||||||
| Guggenheim 5180-2 CLO LP 2015-1A A2B† | 3.48% | # | 11/25/2027 | 22,500 | 22,706,041 | |||||||
| JFIN CLO II Ltd. 2015-2A B1† | 3.28% | # | 10/19/2026 | 13,500 | 13,553,037 | |||||||
| KKR Financial CLO Ltd. 2013-2A C† | 4.632% | # | 1/23/2026 | 3,500 | 3,406,412 | |||||||
| Leaf Receivables Funding 11 LLC 2016-1 A3† | 2.05% | 6/15/2019 | 4,308 | 4,300,167 | ||||||||
| Leaf Receivables Funding 11 LLC 2016-1 A4† | 2.49% | 4/15/2022 | 5,549 | 5,519,278 | ||||||||
| OHA Loan Funding Ltd. 2013-1A D† | 4.482% | # | 7/23/2025 | 4,350 | 4,318,009 | |||||||
| OZLM VIII Ltd. 2014-8A A2A† | 3.03% | # | 10/17/2026 | 11,750 | 11,770,218 | |||||||
| PFS Financing Corp. 2016-BA A† | 1.87% | 10/15/2021 | 4,984 | 4,940,390 | ||||||||
| Sonic Capital LLC 2016-1A A2† | 4.472% | 5/20/2046 | 4,434 | 4,389,448 | ||||||||
| Sound Point CLO XI Ltd. 2016-1A D† | 5.531% | # | 7/20/2028 | 13,000 | 13,058,890 | |||||||
| Taco Bell Funding LLC 2016-1A A23† | 4.97% | 5/25/2046 | 8,910 | 8,865,850 | ||||||||
| Voya CLO Ltd. 2016-2A C† | 4.932% | # | 7/19/2028 | 5,250 | 5,165,595 | |||||||
| Westcott Park CLO Ltd. 2016-1A D† | 5.231% | # | 7/20/2028 | 7,650 | 7,649,878 | |||||||
| Total | 150,801,298 | |||||||||||
| Total Asset-Backed Securities (cost $183,412,382) | 185,746,242 | |||||||||||
| See Notes to Financial Statements. | 7 |
Schedule of Investments (continued)
December 31, 2016
| Shares | Fair | |||||||
| Investments | (000) | Value | ||||||
| Common Stocks 13.28% | ||||||||
| Aerospace/Defense 0.21% | ||||||||
| Huntington Ingalls Industries, Inc. | 53 | $ | 9,686,737 | |||||
| Northrop Grumman Corp. | 45 | 10,398,419 | ||||||
| Total | 20,085,156 | |||||||
| Air Transportation 0.24% | ||||||||
| Hawaiian Holdings, Inc.* | 227 | 12,951,996 | ||||||
| Spirit Airlines, Inc.* | 161 | 9,314,014 | ||||||
| Total | 22,266,010 | |||||||
| Auto Parts & Equipment 0.38% | ||||||||
| BorgWarner, Inc. | 232 | 9,153,590 | ||||||
| Chassix Holdings, Inc. | 607 | 17,908,182 | ||||||
| LCI Industries | 86 | 9,319,082 | ||||||
| Total | 36,380,854 | |||||||
| Automakers 0.24% | ||||||||
| Oshkosh Corp. | 139 | 8,992,678 | ||||||
| Thor Industries, Inc. | 134 | 13,358,976 | ||||||
| Total | 22,351,654 | |||||||
| Banking 1.40% | ||||||||
| Comerica, Inc. | 234 | 15,965,120 | ||||||
| Cullen/Frost Bankers, Inc. | 131 | 11,553,719 | ||||||
| Great Western Bancorp, Inc. | 262 | 11,414,608 | ||||||
| Hilltop Holdings, Inc. | 325 | 9,676,298 | ||||||
| LegacyTexas Financial Group, Inc. | 253 | 10,909,165 | ||||||
| PacWest Bancorp | 175 | 9,527,000 | ||||||
| Regions Financial Corp. | 680 | 9,764,800 | ||||||
| Sberbank of Russia PJSC ADR | 842 | 9,746,150 | ||||||
| SVB Financial Group* | 108 | 18,624,595 | ||||||
| Texas Capital Bancshares, Inc.* | 171 | 13,367,200 | ||||||
| Zions Bancorporation | 268 | 11,551,893 | ||||||
| Total | 132,100,548 | |||||||
| Beverages 0.10% | ||||||||
| Boston Beer Co., Inc. (The) Class A* | 56 | 9,587,693 | ||||||
| Brokerage 0.12% | ||||||||
| E*TRADE Financial Corp.* | 325 | 11,270,536 | ||||||
| 8 | See Notes to Financial Statements. |
Schedule of Investments (continued)
December 31, 2016
| Shares | Fair | |||||||
| Investments | (000) | Value | ||||||
| Building & Construction 0.26% | ||||||||
| Granite Construction, Inc. | 299 | $ | 16,420,140 | |||||
| LGI Homes, Inc.* | 297 | 8,535,884 | ||||||
| Total | 24,956,024 | |||||||
| Building Materials 0.51% | ||||||||
| Beacon Roofing Supply, Inc.* | 202 | 9,296,511 | ||||||
| Gibraltar Industries, Inc.* | 207 | 8,611,138 | ||||||
| Martin Marietta Materials, Inc. | 53 | 11,686,815 | ||||||
| Simpson Manufacturing Co., Inc. | 206 | 9,021,250 | ||||||
| Vulcan Materials Co. | 73 | 9,166,361 | ||||||
| Total | 47,782,075 | |||||||
| Chemicals 0.54% | ||||||||
| Celanese Corp. Series A | 113 | 8,918,959 | ||||||
| CF Industries Holdings, Inc. | 321 | 10,101,932 | ||||||
| Scotts Miracle-Gro Co. (The) Class A | 107 | 10,186,872 | ||||||
| Trinseo SA | 181 | 10,713,731 | ||||||
| Versum Materials, Inc.* | 395 | 11,082,036 | ||||||
| Total | 51,003,530 | |||||||
| Diversified Capital Goods 0.50% | ||||||||
| A.O. Smith Corp. | 201 | 9,533,260 | ||||||
| AMETEK, Inc. | 192 | 9,327,458 | ||||||
| Belden, Inc. | 126 | 9,451,601 | ||||||
| MSC Industrial Direct Co., Inc. Class A | 106 | 9,834,453 | ||||||
| Rockwell Automation, Inc. | 69 | 9,267,686 | ||||||
| Total | 47,414,458 | |||||||
| Electric: Integrated 0.20% | ||||||||
| IDACORP, Inc. | 117 | 9,445,776 | ||||||
| Portland General Electric Co. | 227 | 9,842,366 | ||||||
| Total | 19,288,142 | |||||||
| Electronics 0.41% | ||||||||
| Cognex Corp. | 147 | 9,321,475 | ||||||
| Littelfuse, Inc. | 68 | 10,345,099 | ||||||
| MKS Instruments, Inc. | 162 | 9,605,396 | ||||||
| Trimble, Inc.* | 302 | 9,097,762 | ||||||
| Total | 38,369,732 | |||||||
| See Notes to Financial Statements. | 9 |
Schedule of Investments (continued)
December 31, 2016
| Shares | Fair | |||||||
| Investments | (000) | Value | ||||||
| Energy: Exploration & Production 0.53% | ||||||||
| Callon Petroleum Co.* | 695 | $ | 10,678,231 | |||||
| Concho Resources, Inc.* | 66 | 8,761,280 | ||||||
| Diamondback Energy, Inc.* | 89 | 9,026,578 | ||||||
| OGX Petroleo e Gas SA ADR | 315 | 214,666 | ||||||
| Parsley Energy, Inc. Class A* | 259 | 9,125,539 | ||||||
| Sanchez Energy Corp.* | 16 | 140,633 | ||||||
| Templar Energy LLC Class A | 417 | 3,126,168 | ||||||
| WPX Energy, Inc.* | 634 | 9,243,354 | ||||||
| Total | 50,316,449 | |||||||
| Environmental 0.10% | ||||||||
| Tetra Tech, Inc. | 217 | 9,354,920 | ||||||
| Food: Wholesale 0.19% | ||||||||
| Hershey Co. (The) | 92 | 9,470,465 | ||||||
| Mead Johnson Nutrition Co. | 126 | 8,894,532 | ||||||
| Total | 18,364,997 | |||||||
| Forestry/Paper 0.31% | ||||||||
| KapStone Paper and Packaging Corp. | 439 | 9,682,155 | ||||||
| Louisiana-Pacific Corp.* | 529 | 10,017,983 | ||||||
| Potlatch Corp. | 238 | 9,928,985 | ||||||
| Total | 29,629,123 | |||||||
| Gaming 0.10% | ||||||||
| Wynn Resorts Ltd. | 108 | 9,301,382 | ||||||
| Hotels 0.16% | ||||||||
| La Quinta Holdings, Inc.* | 346 | 4,920,923 | ||||||
| Marriott International, Inc. Class A | 118 | 9,764,508 | ||||||
| Total | 14,685,431 | |||||||
| Household Equipment/Products 0.07% | ||||||||
| Central Garden & Pet Co.* | 199 | 6,571,674 | ||||||
| Integrated Energy 0.09% | ||||||||
| NOW, Inc.* | 427 | 8,734,099 | ||||||
| Machinery 0.44% | ||||||||
| Middleby Corp. (The)* | 115 | 14,838,397 | ||||||
| Nordson Corp. | 142 | 15,877,597 | ||||||
| Toro Co. (The) | 200 | 11,198,504 | ||||||
| Total | 41,914,498 | |||||||
| 10 | See Notes to Financial Statements. |
Schedule of Investments (continued)
December 31, 2016
| Shares | Fair | |||||||
| Investments | (000) | Value | ||||||
| Managed Care 0.10% | ||||||||
| WellCare Health Plans, Inc.* | 69 | $ | 9,514,449 | |||||
| Media: Content 0.42% | ||||||||
| AMC Networks, Inc. Class* | 177 | 9,253,032 | ||||||
| ION Media Networks, Inc. | 4 | 362,120 | ||||||
| Netflix, Inc.* | 157 | 19,404,288 | ||||||
| Scripps Networks Interactive, Inc. Class A | 143 | 10,203,626 | ||||||
| Total | 39,223,066 | |||||||
| Medical Products 0.15% | ||||||||
| ABIOMED, Inc.* | 41 | 4,673,854 | ||||||
| ICU Medical, Inc.* | 66 | 9,754,570 | ||||||
| Total | 14,428,424 | |||||||
| Metals/Mining (Excluding Steel) 0.64% | ||||||||
| Anglo American plc*(a) | GBP | 1,035 | 14,795,877 | |||||
| First Majestic Silver Corp. (Canada)*(b) | 967 | 7,376,074 | ||||||
| Fresnillo plc(a) | GBP | 635 | 9,560,840 | |||||
| Mirabela Nickel Ltd.*(a) | AUD | 31,268 | 225,644 | |||||
| MMC Norilsk Nickel PJSC ADR | 623 | 10,465,761 | ||||||
| Silver Wheaton Corp. (Canada)(b) | 468 | 9,035,809 | ||||||
| Vale SA ADR | 1,151 | 8,772,274 | ||||||
| Total | 60,232,279 | |||||||
| Non-Electric Utilities 0.20% | ||||||||
| American Water Works Co., Inc. | 128 | 9,238,925 | ||||||
| Aqua America, Inc. | 313 | 9,412,673 | ||||||
| Total | 18,651,598 | |||||||
| Oil Field Equipment & Services 0.61% | ||||||||
| Halliburton Co. | 208 | 11,261,538 | ||||||
| MRC Global, Inc.* | 621 | 12,577,003 | ||||||
| National Oilwell Varco, Inc. | 258 | 9,644,282 | ||||||
| Patterson-UTI Energy, Inc. | 470 | 12,663,464 | ||||||
| U.S. Silica Holdings, Inc. | 202 | 11,442,728 | ||||||
| Total | 57,589,015 | |||||||
| Packaging 0.10% | ||||||||
| Packaging Corp. of America | 109 | 9,246,992 | ||||||
| See Notes to Financial Statements. | 11 |
Schedule of Investments (continued)
December 31, 2016
| Shares | Fair | |||||||
| Investments | (000) | Value | ||||||
| Personal & Household Products 0.34% | ||||||||
| Brunswick Corp. | 173 | $ | 9,408,150 | |||||
| Hasbro, Inc. | 116 | 9,035,386 | ||||||
| LVMH Moet Hennessy Louis Vuitton SE(a) | EUR | 25 | 4,754,674 | |||||
| Pool Corp. | 88 | 9,201,745 | ||||||
| Total | 32,399,955 | |||||||
| Pharmaceuticals 0.54% | ||||||||
| Blueprint Medicines Corp.* | 185 | 5,175,225 | ||||||
| Cantel Medical Corp. | 123 | 9,709,875 | ||||||
| Exelixis, Inc.* | 643 | 9,593,049 | ||||||
| Patheon NV (Netherlands)*(b) | 344 | 9,877,676 | ||||||
| Seattle Genetics, Inc.* | 139 | 7,317,616 | ||||||
| TESARO, Inc.* | 71 | 9,518,225 | ||||||
| Total | 51,191,666 | |||||||
| Rail 0.10% | ||||||||
| CSX Corp. | 255 | 9,158,557 | ||||||
| Real Estate Investment Trusts 0.20% | ||||||||
| DCT Industrial Trust, Inc. | 201 | 9,616,698 | ||||||
| EastGroup Properties, Inc. | 64 | 4,725,760 | ||||||
| Pebblebrook Hotel Trust | 153 | 4,536,875 | ||||||
| Total | 18,879,333 | |||||||
| Recreation & Travel 0.30% | ||||||||
| Camping World Holdings, Inc. Class A | 308 | 10,052,711 | ||||||
| Royal Caribbean Cruises Ltd. | 113 | 9,286,928 | ||||||
| Vail Resorts, Inc. | 59 | 9,442,281 | ||||||
| Total | 28,781,920 | |||||||
| Restaurants 0.31% | ||||||||
| Cheesecake Factory, Inc. (The) | 152 | 9,087,029 | ||||||
| Shake Shack, Inc. Class A* | 295 | 10,545,989 | ||||||
| Texas Roadhouse, Inc. | 203 | 9,787,414 | ||||||
| Total | 29,420,432 | |||||||
| Software/Services 0.31% | ||||||||
| Arista Networks, Inc.* | 98 | 9,487,234 | ||||||
| Proofpoint, Inc.* | 128 | 9,020,592 | ||||||
| Veeva Systems, Inc. Class A* | 259 | 10,531,125 | ||||||
| Total | 29,038,951 | |||||||
| 12 | See Notes to Financial Statements. |
Schedule of Investments (continued)
December 31, 2016
| Shares | Fair | |||||||
| Investments | (000) | Value | ||||||
| Specialty Retail 0.54% | ||||||||
| Kering(a) | EUR | 45 | $ | 10,024,830 | ||||
| Lithia Motors, Inc. Class A | 95 | 9,169,801 | ||||||
| Moncler SpA(a) | EUR | 586 | 10,188,474 | |||||
| Ritchie Bros Auctioneers, Inc. (Canada)(b) | 241 | 8,200,800 | ||||||
| Tiffany & Co. | 56 | 4,320,594 | ||||||
| Ulta Salon, Cosmetics & Fragrance, Inc.* | 36 | 9,242,085 | ||||||
| Total | 51,146,584 | |||||||
| Steel Producers/Products 0.12% | ||||||||
| Worthington Industries, Inc. | 236 | 11,207,700 | ||||||
| Support: Services 0.35% | ||||||||
| Ashtead Group plc(a) | GBP | 521 | 10,137,080 | |||||
| Neff Corp. Class A* | 315 | 4,442,177 | ||||||
| Science Applications International Corp. | 116 | 9,826,539 | ||||||
| Total System Services, Inc. | 184 | 9,033,973 | ||||||
| Total | 33,439,769 | |||||||
| Technology Hardware & Equipment 0.16% | ||||||||
| NVIDIA Corp. | 143 | 15,254,534 | ||||||
| Telecommunications: Wireless 0.12% | ||||||||
| T-Mobile US, Inc.* | 202 | 11,618,170 | ||||||
| Telecommunications: Wireline Integrated & Services 0.10% | ||||||||
| Zayo Group Holdings, Inc.* | 289 | 9,483,396 | ||||||
| Theaters & Entertainment 0.10% | ||||||||
| Live Nation Entertainment, Inc.* | 348 | 9,269,648 | ||||||
| Transportation: Infrastructure/Services 0.10% | ||||||||
| Landstar System, Inc. | 112 | 9,521,357 | ||||||
| Trucking & Delivery 0.27% | ||||||||
| Old Dominion Freight Line, Inc.* | 181 | 15,506,199 | ||||||
| Ryder System, Inc. | 132 | 9,824,368 | ||||||
| Total | 25,330,567 | |||||||
| Total Common Stocks (cost $1,127,096,732) | 1,255,757,347 | |||||||
| See Notes to Financial Statements. | 13 |
Schedule of Investments (continued)
December 31, 2016
| Principal | ||||||||||||
| Interest | Maturity | Amount | Fair | |||||||||
| Investments | Rate | Date | (000) | Value | ||||||||
| CONVERTIBLE BONDS 0.30% | ||||||||||||
| Energy: Exploration & Production 0.01% | ||||||||||||
| Oleo e Gas Participacoes SA(a)(c) | 10.00% | 1/1/2017 | BRL | 254 | $ | 444,547 | ||||||
| Oleo e Gas Participacoes SA(a)(c) | 10.00% | 1/1/2017 | BRL | 201 | 352,239 | |||||||
| Total | 796,786 | |||||||||||
| Oil Field Equipment & Services 0.19% | ||||||||||||
| Ensco Jersey Finance Ltd. (Jersey)†(b) | 3.00% | 1/31/2024 | $ | 17,952 | 18,355,920 | |||||||
| Support: Services 0.10% | ||||||||||||
| Priceline Group, Inc. (The) | 1.00% | 3/15/2018 | 5,745 | 9,073,509 | ||||||||
| Total Convertible Bonds (cost $28,892,799) | 28,226,215 | |||||||||||
| Dividend | Shares | |||||||||||
| Rate | (000) | |||||||||||
| CONVERTIBLE PREFERRED STOCKS 0.13% | ||||||||||||
| Building & Construction 0.08% | ||||||||||||
| William Lyon Homes Unit | Zero Coupon | 77 | 7,350,984 | |||||||||
| Energy: Exploration & Production 0.05% | ||||||||||||
| Sanchez Energy Corp. | 4.875% | 83 | 2,294,098 | |||||||||
| Sanchez Energy Corp. | 6.50% | 95 | 2,943,090 | |||||||||
| Total | 5,237,188 | |||||||||||
| Total Convertible Preferred Stocks (cost $11,946,395) | 12,588,172 | |||||||||||
| Principal | ||||||||||||
| Interest | Maturity | Amount | ||||||||||
| Rate | Date | (000) | ||||||||||
| FLOATING RATE LOANS(d) 4.30% | ||||||||||||
| Auto Parts & Equipment 0.09% | ||||||||||||
| Chassix, Inc. Initial Term Loan | 12.00% | 7/29/2019 | $ | 8,056 | 8,096,495 | |||||||
| Department Stores 0.10% | ||||||||||||
| Belk, Inc. 1st Lien Closing Date Term Loan | 5.75% | 12/12/2022 | 10,897 | 9,435,004 | ||||||||
| Diversified Capital Goods 0.10% | ||||||||||||
| Harsco Corp. Initial Term Loan | 6.00% | 11/2/2023 | 9,473 | 9,692,063 | ||||||||
| Electric: Generation 0.39% | ||||||||||||
| Dayton Power & Light Co. (The) Term Loan | 4.01% | 8/24/2022 | 9,433 | 9,580,622 | ||||||||
| Lightstone Holdco LLC Term Loan B | 6.54% | 1/30/2024 | 13,325 | 13,513,705 | ||||||||
| 14 | See Notes to Financial Statements. |
Schedule of Investments (continued)
December 31, 2016
| Principal | ||||||||||||
| Interest | Maturity | Amount | Fair | |||||||||
| Investments | Rate | Date | (000) | Value | ||||||||
| Electric: Generation (continued) | ||||||||||||
| Lightstone Holdco LLC Term Loan C | 6.54% | 1/30/2024 | $ | 1,269 | $ | 1,287,019 | ||||||
| Longview Power LLC Advance Term Loan B | 7.00% | 4/13/2021 | 8,948 | 7,930,454 | ||||||||
| Moxie Liberty LLC Advance Construction Term Loan B1 | 7.50% | 8/21/2020 | 4,634 | 4,582,172 | ||||||||
| Total | 36,893,972 | |||||||||||
| Energy: Exploration & Production 0.58% | ||||||||||||
| California Resources Corp. Term Loan | – | (e) | 9/24/2019 | 9,472 | 9,223,542 | |||||||
| California Resources Corp. Term Loan | 11.375% | 12/31/2021 | 13,103 | 14,582,896 | ||||||||
| Chesapeake Energy Corp. Class A Term Loan | 8.50% | 8/23/2021 | 6,574 | 7,174,381 | ||||||||
| Chief Exploration & Development LLC 2nd Lien Term Loan | 7.753% | 5/16/2021 | 14,217 | 13,968,096 | ||||||||
| Jonah Energy LLC 2nd Lien Initial Term Loan | 7.50% | 5/12/2021 | 10,543 | 10,015,614 | ||||||||
| Total | 54,964,529 | |||||||||||
| Food: Wholesale 0.25% | ||||||||||||
| Amplify Snack Brands, Inc. Term Loan | 6.50% | 9/2/2023 | 23,945 | 23,356,300 | ||||||||
| Gaming 0.44% | ||||||||||||
| Amaya Holdings B.V. 1st Lien Initial Term Loan B (Netherlands)(b) | 5.00% | 8/1/2021 | 9,116 | 9,168,143 | ||||||||
| Caesar’s Entertainment Resort Properties LLC Term Loan B | 7.00% | 10/11/2020 | 11,107 | 11,228,905 | ||||||||
| Cowlitz Tribal Gaming Authority Term Loan B | 11.50% | 12/6/2021 | 20,025 | 21,677,063 | ||||||||
| Total | 42,074,111 | |||||||||||
| Health Services 0.10% | ||||||||||||
| Genoa, a QoL Healthcare Co., LLC 1st Lien initial Term Loan | 4.75% | 10/30/2023 | 9,420 | 9,538,145 | ||||||||
| Media: Diversified 0.11% | ||||||||||||
| UFC Holdings, LLC 2nd Lien Term Loan | 8.50% | 8/18/2024 | 9,784 | 10,083,635 | ||||||||
| Metals/Mining (Excluding Steel) 0.30% | ||||||||||||
| Murray Energy Corp. Term Loan B2 | 8.25% | 4/16/2020 | 12,436 | 11,938,917 | ||||||||
| Oxbow Carbon LLC 2nd Lien Initial Term Loan | 8.00% | 1/17/2020 | 5,820 | 5,718,150 | ||||||||
| Peabody Energy Corp. Term Loan | 4.25% | 9/24/2020 | 10,965 | 10,734,735 | ||||||||
| Total | 28,391,802 | |||||||||||
| Oil Field Equipment & Services 0.23% | ||||||||||||
| Fairmount Santrol, Inc. Tranche B2 Term Loan | 4.50% | 9/5/2019 | 14,420 | 14,056,220 | ||||||||
| FTS International, Inc. Initial Term Loan | 5.75% | 4/16/2021 | 9,063 | 7,461,738 | ||||||||
| Total | 21,517,958 | |||||||||||
| See Notes to Financial Statements. | 15 |
Schedule of Investments (continued)
December 31, 2016
| Principal | ||||||||||||
| Interest | Maturity | Amount | Fair | |||||||||
| Investments | Rate | Date | (000) | Value | ||||||||
| Personal & Household Products 0.24% | ||||||||||||
| Britax US Holdings, Inc. Initial Dollar Term Loan | 4.50% | 10/15/2020 | $ | 20,805 | $ | 17,809,412 | ||||||
| FGI Operating Co. LLC Term Loan B | 5.50% | 4/19/2019 | 5,215 | 4,975,793 | ||||||||
| Total | 22,785,205 | |||||||||||
| Recreation & Travel 0.10% | ||||||||||||
| Delta 2 (Lux) S.A.R.L. 2nd Lien Facility Term Loan (Luxembourg)(b) | 8.068% | 7/29/2022 | 9,195 | 9,286,950 | ||||||||
| Specialty Retail 0.36% | ||||||||||||
| Bass Pro Group, LLC Term Loan B | 5.97% | 12/15/2023 | 18,831 | 18,679,693 | ||||||||
| Container Store, Inc. (The) Facility Term Loan | 4.25% | 4/6/2019 | 10,147 | 9,318,477 | ||||||||
| Gymboree Corp. (The) Term Loan | 5.00% | 2/23/2018 | 11,654 | 6,229,063 | ||||||||
| Total | 34,227,233 | |||||||||||
| Support: Services 0.71% | ||||||||||||
| BakerCorp International, Inc. Refinanced Term Loan | 4.25% | 2/7/2020 | 6,868 | 6,585,082 | ||||||||
| Monitronics International Inc. Term Loan B2 | 6.50% | 9/30/2022 | 10,759 | 10,883,463 | ||||||||
| Safway Group Holding LLC Initial Term Loan | 5.75% | 8/21/2023 | 16,481 | 16,745,045 | ||||||||
| University Support Services LLC Term Loan | 6.25% | 7/6/2022 | 18,970 | 19,262,296 | ||||||||
| Zodiac Pool Solutions LLC 1st Lien Term Loan (France)(b) | 5.50% | 12/20/2023 | 13,470 | 13,596,349 | ||||||||
| Total | 67,072,235 | |||||||||||
| Telecommunications: Wireline Integrated & Services 0.10% | ||||||||||||
| Fairpoint Communications, Inc. Term Loan | 7.50% | 2/14/2019 | 9,449 | 9,568,284 | ||||||||
| Trucking & Delivery 0.10% | ||||||||||||
| YRC Worldwide, Inc. Initial Term Loan | 8.00% | 2/13/2019 | 9,450 | 9,393,323 | ||||||||
| Total Floating Rate Loans (cost $389,706,022) | 406,377,244 | |||||||||||
| FOREIGN BONDS(a) 0.44% | ||||||||||||
| Mexico 0.09% | ||||||||||||
| Red de Carreteras de Occidente S.A.P.I.B. de CV† | 9.00% | 6/10/2028 | MXN | 194,760 | 8,701,700 | |||||||
| Netherlands 0.12% | ||||||||||||
| Hema Bondco I BV† | 6.25% | 6/15/2019 | EUR | 11,825 | 11,577,816 | |||||||
| Spain 0.13% | ||||||||||||
| Banco Popular Espanol SA | 11.50% | # | – | (f) | EUR | 11,800 | 12,558,406 | |||||
| United Kingdom 0.10% | ||||||||||||
| Premier Foods Finance plc† | 6.50% | 3/15/2021 | GBP | 7,171 | 9,129,178 | |||||||
| Total Foreign Bonds (cost $48,935,513) | 41,967,100 | |||||||||||
| 16 | See Notes to Financial Statements. |
Schedule of Investments (continued)
December 31, 2016
| Principal | ||||||||||||
| Interest | Maturity | Amount | Fair | |||||||||
| Investments | Rate | Date | (000) | Value | ||||||||
| FOREIGN GOVERNMENT OBLIGATIONS 4.32% | ||||||||||||
| Angola 0.11% | ||||||||||||
| Republic of Angola†(b) | 9.50% | 11/12/2025 | $ | 10,510 | $ | 10,204,947 | ||||||
| Argentina 0.84% | ||||||||||||
| City of Buenos Aires†(b) | 7.50% | 6/1/2027 | 5,475 | 5,611,875 | ||||||||
| City of Buenos Aires†(b) | 8.95% | 2/19/2021 | 8,675 | 9,716,000 | ||||||||
| Province of Santa Fe†(b) | 6.90% | 11/1/2027 | 9,721 | 9,162,043 | ||||||||
| Provincia de Mendoza†(b) | 8.375% | 5/19/2024 | 11,654 | 12,032,755 | ||||||||
| Provincia of Neuquen†(b) | 8.625% | 5/12/2028 | 8,675 | 9,000,313 | ||||||||
| Republic of Argentina†(b) | 7.50% | 4/22/2026 | 14,232 | 14,979,180 | ||||||||
| Republic of Argentina(b) | 8.75% | 5/7/2024 | 16,100 | 19,140,887 | ||||||||
| Total | 79,643,053 | |||||||||||
| Australia 0.41% | ||||||||||||
| Australian Government(a) | 4.25% | 4/21/2026 | AUD | 26,802 | 21,784,211 | |||||||
| Queensland Treasury Corp.†(a) | 4.00% | 6/21/2019 | AUD | 22,400 | 16,890,382 | |||||||
| Total | 38,674,593 | |||||||||||
| Bahamas 0.10% | ||||||||||||
| Commonwealth of Bahamas†(b) | 5.75% | 1/16/2024 | $ | 9,025 | 9,210,283 | |||||||
| Bermuda 0.23% | ||||||||||||
| Government of Bermuda† | 4.138% | 1/3/2023 | 11,720 | 12,076,288 | ||||||||
| Government of Bermuda† | 4.854% | 2/6/2024 | 9,225 | 9,632,468 | ||||||||
| Total | 21,708,756 | |||||||||||
| Brazil 0.14% | ||||||||||||
| Federal Republic of Brazil†(b) | 5.333% | 2/15/2028 | 14,375 | 13,476,563 | ||||||||
| Canada 0.37% | ||||||||||||
| Province of British Columbia Canada(a) | 2.85% | 6/18/2025 | CAD | 44,800 | 34,905,061 | |||||||
| Cayman Islands 0.05% | ||||||||||||
| Cayman Islands Government† | 5.95% | 11/24/2019 | $ | 4,375 | 4,828,906 | |||||||
| Dominican Republic 0.27% | ||||||||||||
| Dominican Republic†(b) | 6.85% | 1/27/2045 | 27,127 | 25,763,054 | ||||||||
| Ethiopia 0.10% | ||||||||||||
| Republic of Ethiopia†(b) | 6.625% | 12/11/2024 | 10,000 | 9,249,600 | ||||||||
| Gabon 0.11% | ||||||||||||
| Republic of Gabon†(b) | 6.375% | 12/12/2024 | 10,700 | 10,014,665 | ||||||||
| See Notes to Financial Statements. | 17 |
Schedule of Investments (continued)
December 31, 2016
| Principal | ||||||||||||
| Interest | Maturity | Amount | Fair | |||||||||
| Investments | Rate | Date | (000) | Value | ||||||||
| Ghana 0.11% | ||||||||||||
| Republic of Ghana†(b) | 9.25% | 9/15/2022 | $ | 10,000 | $ | 10,725,150 | ||||||
| Greece 0.10% | ||||||||||||
| Hellenic Republic†(a) | 4.75% | 4/17/2019 | EUR | 8,967 | 8,932,897 | |||||||
| Honduras 0.15% | ||||||||||||
| Honduras Government†(b) | 7.50% | 3/15/2024 | $ | 13,300 | 14,276,220 | |||||||
| Jamaica 0.51% | ||||||||||||
| Government of Jamaica(b) | 6.75% | 4/28/2028 | 13,650 | 14,980,875 | ||||||||
| Government of Jamaica(b) | 7.625% | 7/9/2025 | 9,550 | 10,941,531 | ||||||||
| Government of Jamaica(b) | 8.00% | 3/15/2039 | 19,790 | 22,073,172 | ||||||||
| Total | 47,995,578 | |||||||||||
| Jordan 0.10% | ||||||||||||
| Kingdom of Jordan†(b) | 5.75% | 1/31/2027 | 9,565 | 9,084,741 | ||||||||
| Qatar 0.14% | ||||||||||||
| State of Qatar†(b) | 4.625% | 6/2/2046 | 13,425 | 13,459,824 | ||||||||
| Russia 0.21% | ||||||||||||
| Russian Federal Bond—OFZ(a) | 7.60% | 4/14/2021 | RUB | 1,249,638 | 20,007,653 | |||||||
| United Arab Emirates 0.13% | ||||||||||||
| Abu Dhabi Government International†(b) | 3.125% | 5/3/2026 | $ | 12,745 | 12,531,101 | |||||||
| Zambia 0.14% | ||||||||||||
| Republic of Zambia†(b) | 8.97% | 7/30/2027 | 13,634 | 13,497,660 | ||||||||
| Total Foreign Government Obligations (cost $399,560,664) | 408,190,305 | |||||||||||
| HIGH YIELD CORPORATE BONDS 71.44% | ||||||||||||
| Advertising 0.33% | ||||||||||||
| Clear Channel Worldwide Holdings, Inc. | 6.50% | 11/15/2022 | 13,978 | 14,362,395 | ||||||||
| Lamar Media Corp. | 5.75% | 2/1/2026 | 4,938 | 5,215,763 | ||||||||
| Southern Graphics, Inc.† | 8.375% | 10/15/2020 | 11,075 | 11,296,500 | ||||||||
| Total | 30,874,658 | |||||||||||
| Aerospace/Defense 0.41% | ||||||||||||
| Huntington Ingalls Industries, Inc.† | 5.00% | 12/15/2021 | 7,725 | 8,062,969 | ||||||||
| Huntington Ingalls Industries, Inc.† | 5.00% | 11/15/2025 | 4,497 | 4,682,501 | ||||||||
| L-3 Communications Corp. | 3.85% | 12/15/2026 | 6,216 | 6,191,453 | ||||||||
| Lockheed Martin Corp. | 4.70% | 5/15/2046 | 7,948 | 8,680,535 | ||||||||
| TransDigm, Inc. | 6.50% | 7/15/2024 | 10,188 | 10,710,135 | ||||||||
| Total | 38,327,593 | |||||||||||
| 18 | See Notes to Financial Statements. |
Schedule of Investments (continued)
December 31, 2016
| Principal | ||||||||||||
| Interest | Maturity | Amount | Fair | |||||||||
| Investments | Rate | Date | (000) | Value | ||||||||
| Air Transportation 0.31% | ||||||||||||
| Air Canada (Canada)†(b) | 7.75% | 4/15/2021 | $ | 10,183 | $ | 11,430,418 | ||||||
| Air Canada 2015-2 Class A Pass-Through Trust (Canada)†(b) | 4.125% | 6/15/2029 | 7,793 | 7,998,008 | ||||||||
| Avianca Holdings SA/Avianca Leasing LLC/Grupo Taca Holdings Ltd. (Panama)†(b) | 8.375% | 5/10/2020 | 9,668 | 9,861,360 | ||||||||
| Total | 29,289,786 | |||||||||||
| Auto Parts & Equipment 0.68% | ||||||||||||
| Allison Transmission, Inc.† | 5.00% | 10/1/2024 | 11,116 | 11,254,950 | ||||||||
| Gates Global LLC/Gates Global Co.† | 6.00% | 7/15/2022 | 14,102 | 13,862,266 | ||||||||
| International Automotive Components Group SA (Luxembourg)†(b) | 9.125% | 6/1/2018 | 10,028 | 9,827,440 | ||||||||
| MPG Holdco I, Inc. | 7.375% | 10/15/2022 | 9,203 | 9,663,150 | ||||||||
| Nemak SA de CV (Mexico)†(b) | 5.50% | 2/28/2023 | 7,592 | 7,573,020 | ||||||||
| TI Group Automotive Systems LLC† | 8.75% | 7/15/2023 | 12,004 | 12,604,200 | ||||||||
| Total | 64,785,026 | |||||||||||
| Automakers 0.27% | ||||||||||||
| BMW US Capital LLC† | 2.80% | 4/11/2026 | 8,935 | 8,614,868 | ||||||||
| General Motors Co. | 6.25% | 10/2/2043 | 15,091 | 16,739,556 | ||||||||
| General Motors Co.(c) | 8.375% | – | (f) | 15,000 | 1,500 | |||||||
| Total | 25,355,924 | |||||||||||
| Banking 6.26% | ||||||||||||
| ABN AMRO Bank NV (Netherlands)†(b) | 4.75% | 7/28/2025 | 17,551 | 17,824,076 | ||||||||
| ANZ New Zealand Int’l Ltd. (United Kingdom)†(b) | 2.125% | 7/28/2021 | 13,090 | 12,744,044 | ||||||||
| Associated Banc-Corp. | 4.25% | 1/15/2025 | 8,885 | 8,819,997 | ||||||||
| Australia & New Zealand Banking Group Ltd. (United Kingdom)†(b) | 6.75% | # | – | (f) | 11,885 | 12,579,999 | ||||||
| Banco Bilbao Vizcaya Argentaria SA (Spain)(b) | 9.00% | # | – | (f) | 9,000 | 9,407,232 | ||||||
| Banco de Bogota SA (Colombia)†(b) | 6.25% | 5/12/2026 | 6,300 | 6,441,750 | ||||||||
| Banco de Galicia y Buenos Aires SA (Argentina)†(b) | 8.25% | # | 7/19/2026 | 8,525 | 8,929,938 | |||||||
| Bank of America Corp. | 4.25% | 10/22/2026 | 13,195 | 13,381,366 | ||||||||
| Bank of America Corp. | 4.45% | 3/3/2026 | 22,213 | 22,934,301 | ||||||||
| BankUnited, Inc. | 4.875% | 11/17/2025 | 22,890 | 22,706,056 | ||||||||
| BNP Paribas SA (France)†(b) | 6.75% | # | – | (f) | 13,399 | 13,248,261 | ||||||
| Citigroup, Inc. | 4.45% | 9/29/2027 | 13,296 | 13,535,381 | ||||||||
| Citizens Financial Group, Inc. | 4.35% | 8/1/2025 | 7,971 | 8,022,301 | ||||||||
| Citizens Financial Group, Inc. | 5.50% | # | – | (f) | 14,385 | 14,313,075 | ||||||
| Comerica, Inc. | 3.80% | 7/22/2026 | 11,098 | 10,949,098 | ||||||||
| Commonwealth Bank of Australia (Australia)†(b) | 4.50% | 12/9/2025 | 7,979 | 8,184,627 | ||||||||
| See Notes to Financial Statements. | 19 |
Schedule of Investments (continued)
December 31, 2016
| Principal | ||||||||||||
| Interest | Maturity | Amount | Fair | |||||||||
| Investments | Rate | Date | (000) | Value | ||||||||
| Banking (continued) | ||||||||||||
| Compass Bank | 3.875% | 4/10/2025 | $ | 9,400 | $ | 8,961,001 | ||||||
| Credit Suisse Group AG (Switzerland)†(b) | 7.50% | # | – | (f) | 8,994 | 9,443,025 | ||||||
| Fifth Third Bancorp | 8.25% | 3/1/2038 | 15,095 | 21,105,104 | ||||||||
| First Republic Bank | 4.375% | 8/1/2046 | 684 | 624,090 | ||||||||
| Global Bank Corp. (Panama)†(b) | 4.50% | 10/20/2021 | 13,300 | 12,983,460 | ||||||||
| Goldman Sachs Group, Inc. (The) | 3.50% | 1/23/2025 | 13,361 | 13,206,213 | ||||||||
| Goldman Sachs Group, Inc. (The) | 5.15% | 5/22/2045 | 16,857 | 17,795,294 | ||||||||
| HSBC Holdings plc (United Kingdom)(b) | 4.25% | 8/18/2025 | 15,276 | 15,443,394 | ||||||||
| Industrial & Commercial Bank of China Ltd. | 3.231% | 11/13/2019 | 14,050 | 14,413,094 | ||||||||
| Intesa Sanpaolo SpA (Italy)†(b) | 5.71% | 1/15/2026 | 9,600 | 9,176,918 | ||||||||
| Intesa Sanpaolo SpA (Italy)†(b) | 7.70% | # | – | (f) | 15,327 | 14,464,856 | ||||||
| JPMorgan Chase & Co. | 3.90% | 7/15/2025 | 17,386 | 17,896,575 | ||||||||
| JPMorgan Chase & Co. | 6.75% | # | – | (f) | 7,902 | 8,524,283 | ||||||
| KeyBank NA | 2.50% | 11/22/2021 | 12,992 | 12,917,933 | ||||||||
| Lloyds Banking Group plc (United Kingdom)(b) | 4.582% | 12/10/2025 | 10,464 | 10,533,711 | ||||||||
| Lloyds Banking Group plc (United Kingdom)(b) | 7.50% | # | – | (f) | 9,098 | 9,393,685 | ||||||
| M&T Bank Corp. | 5.125% | # | – | (f) | 10,121 | 9,804,719 | ||||||
| Macquarie Group Ltd. (Australia)†(b) | 6.00% | 1/14/2020 | 7,700 | 8,348,094 | ||||||||
| Morgan Stanley | 3.125% | 7/27/2026 | 18,976 | 18,166,218 | ||||||||
| Morgan Stanley | 4.00% | 7/23/2025 | 8,326 | 8,549,695 | ||||||||
| National Savings Bank (Sri Lanka)†(b) | 5.15% | 9/10/2019 | 9,585 | 9,462,504 | ||||||||
| People’s United Bank NA | 4.00% | 7/15/2024 | 9,400 | 9,274,388 | ||||||||
| Popular, Inc. | 7.00% | 7/1/2019 | 18,940 | 19,626,575 | ||||||||
| Royal Bank of Scotland Group plc (United Kingdom)(b) | 5.125% | 5/28/2024 | 5,151 | 5,143,794 | ||||||||
| Royal Bank of Scotland Group plc (United Kingdom)(b) | 6.10% | 6/10/2023 | 4,463 | 4,677,666 | ||||||||
| Royal Bank of Scotland Group plc (United Kingdom)(b) | 6.125% | 12/15/2022 | 4,464 | 4,752,638 | ||||||||
| Royal Bank of Scotland Group plc (United Kingdom)(b) | 7.50% | # | – | (f) | 20,522 | 19,495,900 | ||||||
| Royal Bank of Scotland Group plc (United Kingdom)(b) | 8.625% | # | – | (f) | 7,875 | 8,052,188 | ||||||
| Sberbank of Russia Via SB Capital SA (Luxembourg)†(b) | 5.50% | # | 2/26/2024 | 9,578 | 9,757,588 | |||||||
| Standard Chartered plc (United Kingdom)†(b) | 7.50% | # | – | (f) | 9,200 | 9,200,000 | ||||||
| SVB Financial Group | 3.50% | 1/29/2025 | 8,859 | 8,550,760 | ||||||||
| Toronto-Dominion Bank (The) (Canada)(b) | 3.625% | # | 9/15/2031 | 6,667 | 6,523,539 | |||||||
| UBS AG/Stamford CT | 7.625% | 8/17/2022 | 4,894 | 5,560,808 | ||||||||
| 20 | See Notes to Financial Statements. |
Schedule of Investments (continued)
December 31, 2016
| Principal | ||||||||||||
| Interest | Maturity | Amount | Fair | |||||||||
| Investments | Rate | Date | (000) | Value | ||||||||
| Banking (continued) | ||||||||||||
| UBS Group AG (Switzerland)(b) | 7.00% | # | – | (f) | $ | 8,600 | $ | 9,045,050 | ||||
| Washington Mutual Bank(c) | 6.875% | 6/15/2011 | 22,500 | 2,250 | ||||||||
| Wells Fargo & Co. | 4.90% | 11/17/2045 | 15,891 | 16,360,118 | ||||||||
| Wells Fargo Capital X | 5.95% | 12/1/2086 | 888 | 927,960 | ||||||||
| Total | 592,186,590 | |||||||||||
| Beverages 1.35% | ||||||||||||
| Anheuser-Busch InBev Finance, Inc. | 3.65% | 2/1/2026 | 36,560 | 37,185,030 | ||||||||
| Bacardi Ltd.† | 2.75% | 7/15/2026 | 8,801 | 8,230,009 | ||||||||
| Brown-Forman Corp. | 4.50% | 7/15/2045 | 15,274 | 16,005,518 | ||||||||
| Coca-Cola Bottling Co. Consolidated | 3.80% | 11/25/2025 | 7,947 | 7,995,008 | ||||||||
| Constellation Brands, Inc. | 4.25% | 5/1/2023 | 8,050 | 8,387,214 | ||||||||
| Constellation Brands, Inc. | 6.00% | 5/1/2022 | 11,651 | 13,198,719 | ||||||||
| Dr. Pepper Snapple Group, Inc. | 4.50% | 11/15/2045 | 7,946 | 8,094,010 | ||||||||
| PepsiCo, Inc. | 3.60% | 3/1/2024 | 14,292 | 14,919,890 | ||||||||
| PepsiCo, Inc. | 4.25% | 10/22/2044 | 4,605 | 4,767,349 | ||||||||
| PepsiCo, Inc. | 4.45% | 4/14/2046 | 8,417 | 8,987,067 | ||||||||
| Total | 127,769,814 | |||||||||||
| Brokerage 0.09% | ||||||||||||
| TD Ameritrade Holding Corp. | 2.95% | 4/1/2022 | 7,996 | 8,101,235 | ||||||||
| Building & Construction 1.51% | ||||||||||||
| Ashton Woods USA LLC/Ashton Woods Finance Co.† | 6.875% | 2/15/2021 | 11,740 | 11,358,450 | ||||||||
| Brookfield Residential Properties, Inc. (Canada)†(b) | 6.50% | 12/15/2020 | 6,140 | 6,308,850 | ||||||||
| Brookfield Residential Properties, Inc./Brookfield Residential U.S. Corp. (Canada)†(b) | 6.125% | 7/1/2022 | 9,237 | 9,329,370 | ||||||||
| DR Horton, Inc. | 4.75% | 2/15/2023 | 5,416 | 5,564,940 | ||||||||
| K. Hovnanian Enterprises, Inc.† | 7.25% | 10/15/2020 | 13,656 | 12,943,157 | ||||||||
| Lennar Corp. | 4.75% | 11/15/2022 | 15,303 | 15,762,090 | ||||||||
| Lennar Corp. | 4.75% | 5/30/2025 | 7,075 | 6,933,500 | ||||||||
| PulteGroup, Inc. | 5.00% | 1/15/2027 | 15,555 | 14,835,581 | ||||||||
| PulteGroup, Inc. | 6.375% | 5/15/2033 | 27,646 | 27,715,115 | ||||||||
| Toll Brothers Finance Corp. | 5.625% | 1/15/2024 | 11,550 | 12,040,875 | ||||||||
| William Lyon Homes, Inc. | 7.00% | 8/15/2022 | 19,481 | 20,260,240 | ||||||||
| Total | 143,052,168 | |||||||||||
| See Notes to Financial Statements. | 21 |
Schedule of Investments (continued)
December 31, 2016
| Principal | ||||||||||||
| Interest | Maturity | Amount | Fair | |||||||||
| Investments | Rate | Date | (000) | Value | ||||||||
| Building Materials 1.78% | ||||||||||||
| Allegion plc (Ireland)(b) | 5.875% | 9/15/2023 | $ | 3,725 | $ | 3,967,125 | ||||||
| Builders FirstSource, Inc.† | 5.625% | 9/1/2024 | 6,670 | 6,728,363 | ||||||||
| Builders FirstSource, Inc.† | 10.75% | 8/15/2023 | 9,553 | 11,009,832 | ||||||||
| Cemex SAB de CV (Mexico)†(b) | 7.75% | 4/16/2026 | 16,507 | 18,322,770 | ||||||||
| Eagle Materials, Inc. | 4.50% | 8/1/2026 | 6,783 | 6,799,957 | ||||||||
| FBM Finance, Inc.† | 8.25% | 8/15/2021 | 8,892 | 9,425,520 | ||||||||
| HD Supply, Inc.† | 5.75% | 4/15/2024 | 3,998 | 4,230,684 | ||||||||
| Hillman Group, Inc. (The)† | 6.375% | 7/15/2022 | 11,803 | 11,153,835 | ||||||||
| Lennox International, Inc. | 3.00% | 11/15/2023 | 8,884 | 8,638,695 | ||||||||
| Martin Marietta Materials, Inc. | 4.25% | 7/2/2024 | 9,986 | 10,161,604 | ||||||||
| Masco Corp. | 4.375% | 4/1/2026 | 5,532 | 5,614,980 | ||||||||
| Masonite International Corp.† | 5.625% | 3/15/2023 | 8,636 | 8,959,850 | ||||||||
| Ply Gem Industries, Inc. | 6.50% | 2/1/2022 | 8,720 | 8,994,850 | ||||||||
| Standard Industries, Inc.† | 5.375% | 11/15/2024 | 17,513 | 18,082,172 | ||||||||
| Standard Industries, Inc.† | 5.50% | 2/15/2023 | 8,239 | 8,569,384 | ||||||||
| Voto-Votorantim Overseas Trading Operations IV Ltd.† | 7.75% | 6/24/2020 | 16,800 | 18,228,000 | ||||||||
| Vulcan Materials Co. | 4.50% | 4/1/2025 | 8,960 | 9,408,000 | ||||||||
| Total | 168,295,621 | |||||||||||
| Cable & Satellite Television 4.17% | ||||||||||||
| Altice Financing SA (Luxembourg)†(b) | 6.625% | 2/15/2023 | 13,500 | 13,905,000 | ||||||||
| Altice Financing SA (Luxembourg)†(b) | 7.50% | 5/15/2026 | 4,130 | 4,305,525 | ||||||||
| Altice Finco SA (Luxembourg)†(b) | 8.125% | 1/15/2024 | 635 | 660,400 | ||||||||
| Cablevision SA (Argentina)†(b) | 6.50% | 6/15/2021 | 8,595 | 8,756,156 | ||||||||
| Cablevision Systems Corp. | 5.875% | 9/15/2022 | 28,000 | 27,370,000 | ||||||||
| CCO Holdings LLC/CCO Holdings Capital Corp.† | 5.125% | 5/1/2023 | 6,326 | 6,531,595 | ||||||||
| CCO Holdings LLC/CCO Holdings Capital Corp.† | 5.875% | 4/1/2024 | 15,739 | 16,840,730 | ||||||||
| Charter Communications Operating LLC/Charter Communications Operating Capital | 6.384% | 10/23/2035 | 22,001 | 25,192,223 | ||||||||
| Charter Communications Operating LLC/Charter Communications Operating Capital | 6.484% | 10/23/2045 | 7,403 | 8,588,309 | ||||||||
| CSC Holdings LLC† | 10.125% | 1/15/2023 | 8,050 | 9,317,875 | ||||||||
| CSC Holdings LLC† | 10.875% | 10/15/2025 | 47,846 | 57,056,355 | ||||||||
| DISH DBS Corp. | 7.75% | 7/1/2026 | 46,684 | 52,752,920 | ||||||||
| Mediacom Broadband LLC/Mediacom Broadband Corp. | 6.375% | 4/1/2023 | 23,477 | 24,768,235 | ||||||||
| Mediacom LLC/Mediacom Capital Corp. | 7.25% | 2/15/2022 | 4,401 | 4,549,534 | ||||||||
| SFR Group SA (France)†(b) | 6.00% | 5/15/2022 | 37,606 | 38,734,180 | ||||||||
| 22 | See Notes to Financial Statements. |
Schedule of Investments (continued)
December 31, 2016
| Principal | ||||||||||||
| Interest | Maturity | Amount | Fair | |||||||||
| Investments | Rate | Date | (000) | Value | ||||||||
| Cable & Satellite Television (continued) | ||||||||||||
| Time Warner Cable, Inc. | 5.875% | 11/15/2040 | $ | 13,691 | $ | 14,648,179 | ||||||
| Unitymedia GmbH (Germany)†(b) | 6.125% | 1/15/2025 | 4,246 | 4,383,995 | ||||||||
| Unitymedia Hessen GmbH & Co. KG/Unitymedia NRW GmbH (Germany)†(b) | 5.00% | 1/15/2025 | 11,798 | 11,798,000 | ||||||||
| Unitymedia Hessen GmbH & Co. KG/Unitymedia NRW GmbH (Germany)†(b) | 5.50% | 1/15/2023 | 19,395 | 20,267,775 | ||||||||
| UPCB Finance IV Ltd.† | 5.375% | 1/15/2025 | 16,988 | 17,200,350 | ||||||||
| Virgin Media Finance plc (United Kingdom)†(b) | 6.00% | 10/15/2024 | 8,740 | 9,034,975 | ||||||||
| VTR Finance BV (Netherlands)†(b) | 6.875% | 1/15/2024 | 10,065 | 10,417,275 | ||||||||
| Wave Holdco LLC/Wave Holdco Corp. PIK† | 8.25% | 7/15/2019 | 7,253 | 7,122,370 | ||||||||
| Total | 394,201,956 | |||||||||||
| Chemicals 1.66% | ||||||||||||
| Albemarle Corp. | 5.45% | 12/1/2044 | 13,345 | 14,386,991 | ||||||||
| Braskem Finance Ltd. | 6.45% | 2/3/2024 | 8,776 | 9,280,620 | ||||||||
| Celanese US Holdings LLC | 5.875% | 6/15/2021 | 5,554 | 6,173,860 | ||||||||
| CF Industries, Inc.† | 4.50% | 12/1/2026 | 9,694 | 9,547,000 | ||||||||
| Chemours Co. (The) | 7.00% | 5/15/2025 | 14,585 | 14,439,150 | ||||||||
| Equate Petrochemical BV (Netherlands)†(b) | 4.25% | 11/3/2026 | 12,150 | 11,634,111 | ||||||||
| GCP Applied Technologies, Inc.† | 9.50% | 2/1/2023 | 3,779 | 4,345,850 | ||||||||
| Grupo Idesa SA de CV (Mexico)†(b) | 7.875% | 12/18/2020 | 13,600 | 12,376,000 | ||||||||
| Hexion, Inc. | 6.625% | 4/15/2020 | 10,363 | 9,223,070 | ||||||||
| Kraton Polymers LLC/Kraton Polymers Capital Corp.† | 10.50% | 4/15/2023 | 9,050 | 10,249,125 | ||||||||
| Momentive Performance Materials, Inc. | 3.88% | 10/24/2021 | 11,339 | 10,715,355 | ||||||||
| NOVA Chemicals Corp. (Canada)†(b) | 5.25% | 8/1/2023 | 10,023 | 10,160,816 | ||||||||
| TPC Group, Inc.† | 8.75% | 12/15/2020 | 3,619 | 3,076,150 | ||||||||
| Trinseo Materials Operating SCA/Trinseo Materials Finance, Inc. (Luxembourg)†(b) | 6.75% | 5/1/2022 | 4,440 | 4,673,100 | ||||||||
| Tronox Finance LLC | 6.375% | 8/15/2020 | 1,759 | 1,653,460 | ||||||||
| Tronox Finance LLC† | 7.50% | 3/15/2022 | 16,265 | 15,248,437 | ||||||||
| Westlake Chemical Corp.† | 5.00% | 8/15/2046 | 9,828 | 9,744,826 | ||||||||
| Total | 156,927,921 | |||||||||||
| Consumer/Commercial/Lease Financing 0.98% | ||||||||||||
| Discover Bank/Greenwood DE | 3.45% | 7/27/2026 | 15,927 | 15,410,233 | ||||||||
| Nationstar Mortgage LLC/Nationstar Capital Corp. | 6.50% | 7/1/2021 | 15,814 | 16,090,745 | ||||||||
| Navient Corp. | 5.00% | 10/26/2020 | 8,744 | 8,940,740 | ||||||||
| Navient Corp. | 5.875% | 10/25/2024 | 3,763 | 3,593,665 | ||||||||
| Navient Corp. | 6.125% | 3/25/2024 | 6,832 | 6,669,740 | ||||||||
| See Notes to Financial Statements. | 23 |
Schedule of Investments (continued)
December 31, 2016
| Principal | ||||||||||||
| Interest | Maturity | Amount | Fair | |||||||||
| Investments | Rate | Date | (000) | Value | ||||||||
| Consumer/Commercial/Lease Financing (continued) | ||||||||||||
| Navient Corp. | 6.625% | 7/26/2021 | $ | 25,966 | $ | 27,523,960 | ||||||
| NFP Corp.† | 9.00% | 7/15/2021 | 13,646 | 14,447,702 | ||||||||
| Total | 92,676,785 | |||||||||||
| Discount Stores 0.65% | ||||||||||||
| Amazon.com, Inc. | 4.80% | 12/5/2034 | 55,934 | 61,749,961 | ||||||||
| Diversified Capital Goods 1.63% | ||||||||||||
| Accudyne Industries Borrower/Accudyne Industries LLC (Luxembourg)†(b) | 7.75% | 12/15/2020 | 11,165 | 9,350,688 | ||||||||
| Apex Tool Group LLC† | 7.00% | 2/1/2021 | 5,361 | 4,824,900 | ||||||||
| BCD Acquisition, Inc.† | 9.625% | 9/15/2023 | 8,980 | 9,653,500 | ||||||||
| Fortive Corp.† | 3.15% | 6/15/2026 | 8,935 | 8,822,964 | ||||||||
| Fortive Corp.† | 4.30% | 6/15/2046 | 4,468 | 4,442,331 | ||||||||
| General Cable Corp. | 5.75% | 10/1/2022 | 10,200 | 9,945,000 | ||||||||
| General Electric Co. | 5.00% | # | – | (f) | 23,262 | 24,168,055 | ||||||
| Griffon Corp. | 5.25% | 3/1/2022 | 10,928 | 11,113,776 | ||||||||
| Siemens Financieringsmaatschappij NV (Netherlands)†(b) | 3.25% | 5/27/2025 | 12,036 | 12,081,316 | ||||||||
| SPX FLOW, Inc.† | 5.625% | 8/15/2024 | 4,609 | 4,655,090 | ||||||||
| SPX FLOW, Inc.† | 5.875% | 8/15/2026 | 6,669 | 6,685,673 | ||||||||
| Unifrax I LLC/Unifrax Holding Co.† | 7.50% | 2/15/2019 | 11,066 | 11,066,000 | ||||||||
| Valmont Industries, Inc. | 5.25% | 10/1/2054 | 23,209 | 20,407,859 | ||||||||
| Wabtec Corp.† | 3.45% | 11/15/2026 | 17,774 | 17,120,734 | ||||||||
| Total | 154,337,886 | |||||||||||
| Electric: Generation 0.52% | ||||||||||||
| Energy Future Intermediate Holding Co. LLC/EFIH Finance, Inc.(c) | 10.00% | 12/1/2020 | 20,230 | 4,602,325 | ||||||||
| Illinois Power Generating Co.(c) | 7.00% | 4/15/2018 | 16,899 | 6,083,640 | ||||||||
| Listrindo Capital BV (Netherlands)†(b) | 4.95% | 9/14/2026 | 10,909 | 10,657,275 | ||||||||
| NSG Holdings LLC/NSG Holdings, Inc.† | 7.75% | 12/15/2025 | 16,777 | 18,181,785 | ||||||||
| Talen Energy Supply LLC | 6.50% | 6/1/2025 | 12,034 | 9,356,435 | ||||||||
| Total | 48,881,460 | |||||||||||
| Electric: Integrated 1.37% | ||||||||||||
| AES Panama SRL (Panama)†(b) | 6.00% | 6/25/2022 | 7,273 | 7,563,920 | ||||||||
| Black Hills Corp. | 4.20% | 9/15/2046 | 7,112 | 6,807,919 | ||||||||
| Cleco Corporate Holdings LLC† | 4.973% | 5/1/2046 | 10,726 | 10,899,879 | ||||||||
| El Paso Electric Co. | 5.00% | 12/1/2044 | 16,498 | 17,267,863 | ||||||||
| Emera, Inc. (Canada)(b) | 6.75% | # | 6/15/2076 | 15,025 | 16,151,875 | |||||||
| 24 | See Notes to Financial Statements. |
Schedule of Investments (continued)
December 31, 2016
| Principal | ||||||||||||
| Interest | Maturity | Amount | Fair | |||||||||
| Investments | Rate | Date | (000) | Value | ||||||||
| Electric: Integrated (continued) | ||||||||||||
| Entergy Arkansas, Inc. | 4.95% | 12/15/2044 | $ | 16,883 | $ | 17,264,809 | ||||||
| Entergy Mississippi, Inc. | 2.85% | 6/1/2028 | 13,321 | 12,667,338 | ||||||||
| Indianapolis Power & Light Co.† | 4.05% | 5/1/2046 | 17,868 | 16,934,558 | ||||||||
| IPALCO Enterprises, Inc. | 3.45% | 7/15/2020 | 1,564 | 1,599,190 | ||||||||
| Louisville Gas & Electric Co. | 4.375% | 10/1/2045 | 5,575 | 5,873,424 | ||||||||
| Puget Energy, Inc. | 3.65% | 5/15/2025 | 7,898 | 7,797,506 | ||||||||
| Southern California Edison Co. | 3.90% | 3/15/2043 | 8,688 | 8,564,952 | ||||||||
| Total | 129,393,233 | |||||||||||
| Electronics 1.59% | ||||||||||||
| Micron Technology, Inc.† | 7.50% | 9/15/2023 | 12,755 | 14,158,050 | ||||||||
| NVIDIA Corp. | 3.20% | 9/16/2026 | 32,159 | 30,983,235 | ||||||||
| NXP BV/NXP Funding LLC (Netherlands)†(b) | 3.875% | 9/1/2022 | 31,261 | 31,729,915 | ||||||||
| NXP BV/NXP Funding LLC (Netherlands)†(b) | 4.625% | 6/1/2023 | 7,581 | 7,979,003 | ||||||||
| Qorvo, Inc. | 7.00% | 12/1/2025 | 25,391 | 28,247,487 | ||||||||
| QUALCOMM, Inc. | 4.65% | 5/20/2035 | 4,443 | 4,705,426 | ||||||||
| QUALCOMM, Inc. | 4.80% | 5/20/2045 | 4,443 | 4,759,133 | ||||||||
| Trimble, Inc. | 4.75% | 12/1/2024 | 27,261 | 27,650,532 | ||||||||
| Total | 150,212,781 | |||||||||||
| Energy: Exploration & Production 6.06% | ||||||||||||
| Bill Barrett Corp. | 7.00% | 10/15/2022 | 10,942 | 10,504,320 | ||||||||
| Bonanza Creek Energy, Inc. | 6.75% | 4/15/2021 | 11,506 | 8,629,500 | ||||||||
| Carrizo Oil & Gas, Inc. | 6.25% | 4/15/2023 | 16,479 | 16,973,370 | ||||||||
| Chaparral Energy, Inc.(c) | 7.625% | 11/15/2022 | 7,583 | 6,824,700 | ||||||||
| Chaparral Energy, Inc.(c) | 8.25% | 9/1/2021 | 9,157 | 8,264,193 | ||||||||
| Chesapeake Energy Corp. | 4.875% | 4/15/2022 | 5,583 | 5,122,403 | ||||||||
| Chesapeake Energy Corp. | 6.625% | 8/15/2020 | 23,717 | 24,072,755 | ||||||||
| Clayton Williams Energy, Inc. | 7.75% | 4/1/2019 | 10,098 | 10,198,980 | ||||||||
| Concho Resources, Inc. | 5.50% | 4/1/2023 | 33,884 | 35,283,409 | ||||||||
| CONSOL Energy, Inc. | 5.875% | 4/15/2022 | 9,243 | 9,104,355 | ||||||||
| CONSOL Energy, Inc. | 8.00% | 4/1/2023 | 9,831 | 10,138,219 | ||||||||
| Continental Resources, Inc. | 4.50% | 4/15/2023 | 9,723 | 9,577,155 | ||||||||
| Continental Resources, Inc. | 3.80% | 6/1/2024 | 27,487 | 25,494,192 | ||||||||
| CrownRock LP/CrownRock Finance, Inc.† | 7.125% | 4/15/2021 | 27,406 | 28,639,270 | ||||||||
| Denbury Resources, Inc. | 4.625% | 7/15/2023 | 5,483 | 4,427,523 | ||||||||
| Denbury Resources, Inc. | 5.50% | 5/1/2022 | 24,011 | 21,069,652 | ||||||||
| Eclipse Resources Corp. | 8.875% | 7/15/2023 | 11,039 | 11,577,151 | ||||||||
| EP Energy LLC/Everest Acquisition Finance, Inc. | 9.375% | 5/1/2020 | 9,560 | 8,860,877 | ||||||||
| Gulfport Energy Corp. | 6.625% | 5/1/2023 | 1,950 | 2,047,500 | ||||||||
| See Notes to Financial Statements. | 25 |
Schedule of Investments (continued)
December 31, 2016
| Principal | ||||||||||||
| Interest | Maturity | Amount | Fair | |||||||||
| Investments | Rate | Date | (000) | Value | ||||||||
| Energy: Exploration & Production (continued) | ||||||||||||
| Hilcorp Energy I LP/Hilcorp Finance Co.† | 5.00% | 12/1/2024 | $ | 23,627 | $ | 23,567,932 | ||||||
| Kosmos Energy Ltd. † | 7.875% | 8/1/2021 | 19,780 | 19,780,000 | ||||||||
| Marathon Oil Corp. | 3.85% | 6/1/2025 | 4,935 | 4,794,111 | ||||||||
| MEG Energy Corp. (Canada)†(b) | 6.375% | 1/30/2023 | 12,484 | 11,173,180 | ||||||||
| MEG Energy Corp. (Canada)†(b) | 7.00% | 3/31/2024 | 35,567 | 32,365,970 | ||||||||
| Murphy Oil Corp. | 6.875% | 8/15/2024 | 5,221 | 5,573,418 | ||||||||
| Newfield Exploration Co. | 5.625% | 7/1/2024 | 18,026 | 18,882,235 | ||||||||
| Oasis Petroleum, Inc. | 6.875% | 3/15/2022 | 9,924 | 10,221,720 | ||||||||
| Occidental Petroleum Corp. | 4.40% | 4/15/2046 | 7,100 | 7,242,966 | ||||||||
| OGX Austria GmbH (Austria)†(b)(c) | 8.50% | 6/1/2018 | 20,000 | 400 | ||||||||
| PDC Energy, Inc.† | 6.125% | 9/15/2024 | 4,002 | 4,112,055 | ||||||||
| PDC Energy, Inc. | 7.75% | 10/15/2022 | 22,734 | 24,325,380 | ||||||||
| Petrobras Argentina SA (Argentina)†(b) | 7.375% | 7/21/2023 | 9,059 | 8,855,172 | ||||||||
| Range Resources Corp. | 4.875% | 5/15/2025 | 19,965 | 19,440,919 | ||||||||
| Range Resources Corp.† | 5.875% | 7/1/2022 | 18,283 | 19,105,735 | ||||||||
| Rice Energy, Inc. | 6.25% | 5/1/2022 | 13,461 | 13,898,482 | ||||||||
| RSP Permian, Inc. | 6.625% | 10/1/2022 | 13,207 | 14,032,437 | ||||||||
| Sanchez Energy Corp. | 6.125% | 1/15/2023 | 12,198 | 11,649,090 | ||||||||
| Sanchez Energy Corp. | 7.75% | 6/15/2021 | 7,587 | 7,757,708 | ||||||||
| Seven Generations Energy Ltd. (Canada)†(b) | 6.875% | 6/30/2023 | 16,451 | 17,520,315 | ||||||||
| SM Energy Co. | 5.625% | 6/1/2025 | 5,785 | 5,611,450 | ||||||||
| SM Energy Co. | 6.75% | 9/15/2026 | 7,437 | 7,697,295 | ||||||||
| Southwestern Energy Co. | 6.70% | 1/23/2025 | 9,550 | 9,812,625 | ||||||||
| Tullow Oil plc (United Kingdom)†(b) | 6.25% | 4/15/2022 | 10,194 | 9,531,390 | ||||||||
| WPX Energy, Inc. | 6.00% | 1/15/2022 | 8,780 | 9,043,400 | ||||||||
| Total | 572,804,909 | |||||||||||
| Food & Drug Retailers 0.86% | ||||||||||||
| BI-LO LLC/BI-LO Finance Corp.† | 9.25% | 2/15/2019 | 7,240 | 6,172,100 | ||||||||
| Ingles Markets, Inc. | 5.75% | 6/15/2023 | 8,533 | 8,810,323 | ||||||||
| New Albertson’s, Inc. | 7.45% | 8/1/2029 | 7,200 | 6,840,000 | ||||||||
| New Albertson’s, Inc. | 7.75% | 6/15/2026 | 17,080 | 16,994,600 | ||||||||
| Rite Aid Corp. | 7.70% | 2/15/2027 | 19,757 | 24,795,035 | ||||||||
| SMU SA (Chile)†(b) | 7.75% | 2/8/2020 | 4,969 | 4,844,775 | ||||||||
| Tops Holding LLC/Top Markets II Corp.† | 8.00% | 6/15/2022 | 14,545 | 12,581,425 | ||||||||
| Total | 81,038,258 | |||||||||||
| Food: Wholesale 1.20% | ||||||||||||
| Arcor SAIC (Argentina)†(b) | 6.00% | 7/6/2023 | 8,858 | 9,256,610 | ||||||||
| Bunge Ltd. Finance Corp. | 3.25% | 8/15/2026 | 10,668 | 10,265,112 | ||||||||
| 26 | See Notes to Financial Statements. |
Schedule of Investments (continued)
December 31, 2016
| Principal | ||||||||||||
| Interest | Maturity | Amount | Fair | |||||||||
| Investments | Rate | Date | (000) | Value | ||||||||
| Food: Wholesale (continued) | ||||||||||||
| Cosan Luxembourg SA (Luxembourg)†(b) | 7.00% | 1/20/2027 | $ | 10,400 | $ | 10,426,000 | ||||||
| Kellogg Co. | 4.50% | 4/1/2046 | 17,540 | 17,209,336 | ||||||||
| Lamb Weston Holdings, Inc.† | 4.625% | 11/1/2024 | 11,113 | 11,168,565 | ||||||||
| Land O’Lakes, Inc.† | 6.00% | 11/15/2022 | 12,700 | 13,906,500 | ||||||||
| Mead Johnson Nutrition Co. | 4.125% | 11/15/2025 | 11,918 | 12,206,845 | ||||||||
| Pinnacle Foods Finance LLC/Pinnacle Foods Finance Corp. | 4.875% | 5/1/2021 | 11,046 | 11,432,610 | ||||||||
| Post Holdings, Inc.† | 7.75% | 3/15/2024 | 12,118 | 13,511,570 | ||||||||
| Post Holdings, Inc.† | 8.00% | 7/15/2025 | 3,985 | 4,483,125 | ||||||||
| Total | 113,866,273 | |||||||||||
| Forestry/Paper 0.40% | ||||||||||||
| International Paper Co. | 4.40% | 8/15/2047 | 10,651 | 10,106,521 | ||||||||
| Millar Western Forest Products Ltd. (Canada)(b) | 8.50% | 4/1/2021 | 9,101 | 5,051,055 | ||||||||
| Norbord, Inc. (Canada)†(b) | 6.25% | 4/15/2023 | 12,930 | 13,447,200 | ||||||||
| Rayonier AM Products, Inc.† | 5.50% | 6/1/2024 | 10,115 | 9,508,100 | ||||||||
| Total | 38,112,876 | |||||||||||
| Gaming 2.25% | ||||||||||||
| Boyd Gaming Corp. | 6.875% | 5/15/2023 | 14,473 | 15,612,749 | ||||||||
| Caesar’s Entertainment Resort Properties LLC/Caesar’s Entertainment Resort Properties Finance, Inc. | 11.00% | 10/1/2021 | 9,350 | 10,261,625 | ||||||||
| Caesar’s Growth Properties Holdings LLC/Caesar’s Growth Properties Finance, Inc. | 9.375% | 5/1/2022 | 13,199 | 14,295,837 | ||||||||
| Carlson Travel, Inc.† | 6.75% | 12/15/2023 | 8,096 | 8,440,080 | ||||||||
| GLP Capital LP/GLP Financing II, Inc. | 5.375% | 4/15/2026 | 6,156 | 6,435,482 | ||||||||
| International Game Technology plc† | 6.50% | 2/15/2025 | 11,149 | 12,013,048 | ||||||||
| MCE Finance Ltd. (Hong Kong)†(b) | 5.00% | 2/15/2021 | 17,080 | 17,056,583 | ||||||||
| MGM Growth Properties Operating Partnership LP/MGP Finance Co-Issuer, Inc.† | 5.625% | 5/1/2024 | 4,760 | 4,998,000 | ||||||||
| MGM Resorts International | 6.00% | 3/15/2023 | 35,811 | 38,765,407 | ||||||||
| MGM Resorts International | 7.75% | 3/15/2022 | 6,873 | 7,921,133 | ||||||||
| Mohegan Tribal Gaming Authority† | 7.875% | 10/15/2024 | 18,341 | 18,776,599 | ||||||||
| River Rock Entertainment Authority(c) | 9.00% | 11/1/2018 | 10,368 | 2,151,360 | ||||||||
| Scientific Games International, Inc. | 10.00% | 12/1/2022 | 9,895 | 9,895,000 | ||||||||
| Sugarhouse HSP Gaming Prop. Mezz. LP/Sugarhouse HSP Gaming Finance Corp.† | 6.375% | 6/1/2021 | 21,725 | 21,779,313 | ||||||||
| Wynn Macau Ltd. (Macau)†(b) | 5.25% | 10/15/2021 | 24,295 | 24,598,687 | ||||||||
| Total | 213,000,903 | |||||||||||
| See Notes to Financial Statements. | 27 |
Schedule of Investments (continued)
December 31, 2016
| Principal | ||||||||||||
| Interest | Maturity | Amount | Fair | |||||||||
| Investments | Rate | Date | (000) | Value | ||||||||
| Gas Distribution 3.80% | ||||||||||||
| American Midstream Partners LP/American Midstream Finance Corp.† | 8.50% | 12/15/2021 | $ | 5,955 | $ | 5,925,225 | ||||||
| Boardwalk Pipelines LP | 5.95% | 6/1/2026 | 14,074 | 15,314,891 | ||||||||
| Cheniere Corpus Christi Holdings LLC† | 5.875% | 3/31/2025 | 9,338 | 9,562,672 | ||||||||
| Cheniere Corpus Christi Holdings LLC† | 7.00% | 6/30/2024 | 8,783 | 9,551,513 | ||||||||
| Columbia Pipeline Group, Inc. | 4.50% | 6/1/2025 | 8,935 | 9,402,863 | ||||||||
| Dominion Gas Holdings LLC | 3.60% | 12/15/2024 | 12,050 | 12,238,811 | ||||||||
| Enbridge, Inc. (Canada)(b) | 6.00% | # | 1/15/2077 | 10,083 | 10,083,000 | |||||||
| Energy Transfer Equity LP | 5.50% | 6/1/2027 | 9,977 | 9,777,460 | ||||||||
| Energy Transfer Equity LP | 5.875% | 1/15/2024 | 11,850 | 12,294,375 | ||||||||
| Florida Gas Transmission Co. LLC† | 4.35% | 7/15/2025 | 18,069 | 18,243,041 | ||||||||
| Genesis Energy LP/Genesis Energy Finance Corp. | 6.75% | 8/1/2022 | 9,907 | 10,342,908 | ||||||||
| IFM US Colonial Pipeline 2 LLC† | 6.45% | 5/1/2021 | 17,850 | 19,453,341 | ||||||||
| LBC Tank Terminals Holding Netherlands BV (Belgium)†(b) | 6.875% | 5/15/2023 | 13,716 | 14,093,190 | ||||||||
| Magellan Midstream Partners LP | 5.00% | 3/1/2026 | 11,839 | 13,005,804 | ||||||||
| MPLX LP | 5.50% | 2/15/2023 | 11,920 | 12,402,927 | ||||||||
| ONEOK, Inc. | 4.25% | 2/1/2022 | 7,495 | 7,569,950 | ||||||||
| Rockies Express Pipeline LLC† | 5.625% | 4/15/2020 | 9,471 | 10,015,583 | ||||||||
| Rockies Express Pipeline LLC† | 6.875% | 4/15/2040 | 18,450 | 18,450,000 | ||||||||
| Sabine Pass Liquefaction LLC | 5.75% | 5/15/2024 | 48,539 | 52,300,772 | ||||||||
| Southern Star Central Corp.† | 5.125% | 7/15/2022 | 10,145 | 10,322,537 | ||||||||
| Tesoro Logistics LP/Tesoro Logistics Finance Corp. | 5.25% | 1/15/2025 | 9,768 | 10,012,200 | ||||||||
| Tesoro Logistics LP/Tesoro Logistics Finance Corp. | 5.875% | 10/1/2020 | 9,095 | 9,390,588 | ||||||||
| Tesoro Logistics LP/Tesoro Logistics Finance Corp. | 6.25% | 10/15/2022 | 12,150 | 12,939,750 | ||||||||
| Transcanada Trust (Canada)(b) | 5.875% | # | 8/15/2076 | 22,048 | 22,985,040 | |||||||
| Williams Cos., Inc. (The) | 4.55% | 6/24/2024 | 8,555 | 8,533,613 | ||||||||
| Williams Cos., Inc. (The) | 5.75% | 6/24/2044 | 5,167 | 5,037,825 | ||||||||
| Williams Partners LP/ACMP Finance Corp. | 4.875% | 5/15/2023 | 10,105 | 10,302,805 | ||||||||
| Total | 359,552,684 | |||||||||||
| Health Facilities 1.88% | ||||||||||||
| Acadia Healthcare Co., Inc. | 6.50% | 3/1/2024 | 5,440 | 5,576,000 | ||||||||
| Ascension Health | 3.945% | 11/15/2046 | 8,881 | 8,501,577 | ||||||||
| Dignity Health | 3.812% | 11/1/2024 | 7,500 | 7,471,582 | ||||||||
| Dignity Health | 4.50% | 11/1/2042 | 8,811 | 8,171,771 | ||||||||
| Envision Healthcare Corp.† | 5.125% | 7/1/2022 | 5,347 | 5,353,684 | ||||||||
| Envision Healthcare Corp. | 5.625% | 7/15/2022 | 8,159 | 8,442,525 | ||||||||
| HCA, Inc. | 5.25% | 4/15/2025 | 11,873 | 12,422,126 | ||||||||
| 28 | See Notes to Financial Statements. |
Schedule of Investments (continued)
December 31, 2016
| Principal | ||||||||||||
| Interest | Maturity | Amount | Fair | |||||||||
| Investments | Rate | Date | (000) | Value | ||||||||
| Health Facilities (continued) | ||||||||||||
| HCA, Inc. | 5.875% | 3/15/2022 | $ | 8,139 | $ | 8,790,120 | ||||||
| HCA, Inc. | 7.05% | 12/1/2027 | 3,490 | 3,594,700 | ||||||||
| HCA, Inc. | 7.50% | 2/15/2022 | 39,234 | 44,628,675 | ||||||||
| HCA, Inc. | 7.58% | 9/15/2025 | 5,778 | 6,254,685 | ||||||||
| HCA, Inc. | 7.69% | 6/15/2025 | 12,776 | 13,957,780 | ||||||||
| HCA, Inc. | 8.36% | 4/15/2024 | 2,295 | 2,616,300 | ||||||||
| Memorial Sloan-Kettering Cancer Center | 4.20% | 7/1/2055 | 12,319 | 11,986,264 | ||||||||
| MPT Operating Partnership LP/MPT Finance Corp. | 5.25% | 8/1/2026 | 5,333 | 5,239,673 | ||||||||
| Northwell Healthcare, Inc. | 3.979% | 11/1/2046 | 26,668 | 24,612,617 | ||||||||
| Total | 177,620,079 | |||||||||||
| Health Services 0.30% | ||||||||||||
| inVentiv Group Holdings, Inc./inVentiv Health Inc/inVentiv Health Clinical, Inc.† | 7.50% | 10/1/2024 | 6,160 | 6,482,784 | ||||||||
| Sterigenics-Nordion Holdings LLC† | 6.50% | 5/15/2023 | 13,033 | 13,293,660 | ||||||||
| Sterigenics-Nordion Topco LLC PIK† | 8.125% | 11/1/2021 | 8,936 | 8,913,660 | ||||||||
| Total | 28,690,104 | |||||||||||
| Hotels 0.36% | ||||||||||||
| ESH Hospitality, Inc.† | 5.25% | 5/1/2025 | 6,527 | 6,510,683 | ||||||||
| Hilton Domestic Operating Co., Inc.† | 4.25% | 9/1/2024 | 11,114 | 10,836,150 | ||||||||
| Playa Resorts Holding BV (Netherlands)†(b) | 8.00% | 8/15/2020 | 8,404 | 8,803,190 | ||||||||
| Starwood Property Trust, Inc.† | 5.00% | 12/15/2021 | 7,397 | 7,514,612 | ||||||||
| Total | 33,664,635 | |||||||||||
| Insurance Brokerage 0.15% | ||||||||||||
| Alliant Holdings Intermediate LLC† | 8.25% | 8/1/2023 | 13,630 | 14,107,050 | ||||||||
| Insurance-Reinsurance 0.17% | ||||||||||||
| Berkshire Hathaway, Inc. | 2.75% | 3/15/2023 | 7,903 | 7,880,018 | ||||||||
| Berkshire Hathaway, Inc. | 3.125% | 3/15/2026 | 7,903 | 7,861,019 | ||||||||
| Total | 15,741,037 | |||||||||||
| Integrated Energy 0.56% | ||||||||||||
| Exxon Mobil Corp. | 4.114% | 3/1/2046 | 11,641 | 11,953,852 | ||||||||
| Petrobras Global Finance BV (Netherlands)(b) | 4.375% | 5/20/2023 | 11,283 | 9,886,164 | ||||||||
| Shell International Finance BV (Netherlands)(b) | 6.375% | 12/15/2038 | 23,912 | 30,896,839 | ||||||||
| Total | 52,736,855 | |||||||||||
| Investments & Miscellaneous Financial Services 0.86% | ||||||||||||
| CME Group, Inc. | 3.00% | 3/15/2025 | 16,017 | 16,026,210 | ||||||||
| FMR LLC† | 5.35% | 11/15/2021 | 7,800 | 8,623,126 | ||||||||
| See Notes to Financial Statements. | 29 |
Schedule of Investments (continued)
December 31, 2016
| Principal | ||||||||||||
| Interest | Maturity | Amount | Fair | |||||||||
| Investments | Rate | Date | (000) | Value | ||||||||
| Investments & Miscellaneous Financial Services (continued) | ||||||||||||
| GrupoSura Finance SA† | 5.50% | 4/29/2026 | $ | 8,785 | $ | 9,006,821 | ||||||
| Intercontinental Exchange, Inc. | 3.75% | 12/1/2025 | 17,312 | 17,758,520 | ||||||||
| Neuberger Berman Group LLC/Neuberger Berman Finance Corp.† | 4.875% | 4/15/2045 | 4,829 | 3,846,632 | ||||||||
| OM Asset Management plc (United Kingdom)(b) | 4.80% | 7/27/2026 | 13,913 | 13,206,929 | ||||||||
| Unifin Financiera SAB de CV SOFOM ENR (Mexico)†(b) | 7.25% | 9/27/2023 | 13,300 | 13,020,700 | ||||||||
| Total | 81,488,938 | |||||||||||
| Life Insurance 0.56% | ||||||||||||
| CNO Financial Group, Inc. | 5.25% | 5/30/2025 | 13,093 | 13,142,099 | ||||||||
| Lincoln National Corp. | 3.625% | 12/12/2026 | 10,359 | 10,356,296 | ||||||||
| Lincoln National Corp. | 6.30% | 10/9/2037 | 2,339 | 2,771,862 | ||||||||
| Teachers Insurance & Annuity Association of America† | 4.90% | 9/15/2044 | 12,705 | 13,775,892 | ||||||||
| TIAA Asset Management Finance Co. LLC† | 4.125% | 11/1/2024 | 12,927 | 13,078,414 | ||||||||
| Total | 53,124,563 | |||||||||||
| Machinery 0.20% | ||||||||||||
| Milacron LLC/Mcron Finance Corp.† | 7.75% | 2/15/2021 | 9,902 | 10,223,815 | ||||||||
| Xylem, Inc. | 4.375% | 11/1/2046 | 8,884 | 8,787,546 | ||||||||
| Total | 19,011,361 | |||||||||||
| Managed Care 0.30% | ||||||||||||
| Centene Corp. | 6.125% | 2/15/2024 | 16,908 | 17,859,075 | ||||||||
| MPH Acquisition Holdings LLC† | 7.125% | 6/1/2024 | 9,799 | 10,338,925 | ||||||||
| Total | 28,198,000 | |||||||||||
| Media: Content 1.29% | ||||||||||||
| Activision Blizzard, Inc.† | 3.40% | 9/15/2026 | 13,335 | 12,682,358 | ||||||||
| AMC Networks, Inc. | 4.75% | 12/15/2022 | 19,200 | 19,392,000 | ||||||||
| Discovery Communications LLC | 4.875% | 4/1/2043 | 9,335 | 8,657,176 | ||||||||
| Discovery Communications LLC | 4.95% | 5/15/2042 | 9,713 | 8,989,692 | ||||||||
| iHeartCommunications, Inc. | 9.00% | 3/1/2021 | 17,600 | 13,090,000 | ||||||||
| Netflix, Inc.† | 4.375% | 11/15/2026 | 9,680 | 9,401,700 | ||||||||
| Netflix, Inc. | 5.50% | 2/15/2022 | 10,623 | 11,499,398 | ||||||||
| Netflix, Inc. | 5.875% | 2/15/2025 | 13,966 | 15,100,738 | ||||||||
| Sirius XM Radio, Inc.† | 6.00% | 7/15/2024 | 9,524 | 9,976,390 | ||||||||
| Univision Communications, Inc.† | 5.125% | 2/15/2025 | 13,349 | 12,815,040 | ||||||||
| Total | 121,604,492 | |||||||||||
| 30 | See Notes to Financial Statements. |
Schedule of Investments (continued)
December 31, 2016
| Principal | ||||||||||||
| Interest | Maturity | Amount | Fair | |||||||||
| Investments | Rate | Date | (000) | Value | ||||||||
| Medical Products 1.43% | ||||||||||||
| Boston Scientific Corp. | 7.00% | 11/15/2035 | $ | 20,953 | $ | 25,682,197 | ||||||
| Edwards Lifesciences Corp. | 2.875% | 10/15/2018 | 4,813 | 4,887,404 | ||||||||
| Fresenius Medical Care US Finance II, Inc.† | 4.75% | 10/15/2024 | 4,923 | 4,996,845 | ||||||||
| Fresenius Medical Care US Finance II, Inc.† | 5.875% | 1/31/2022 | 22,545 | 24,799,500 | ||||||||
| Grifols Worldwide Operations Ltd. (Ireland)(b) | 5.25% | 4/1/2022 | 23,815 | 24,767,600 | ||||||||
| Hologic, Inc.† | 5.25% | 7/15/2022 | 9,174 | 9,690,038 | ||||||||
| Medtronic, Inc. | 4.375% | 3/15/2035 | 15,932 | 16,886,932 | ||||||||
| Ortho-Clinical Diagnostics, Inc./Ortho-Clinical Diagnostics SA† | 6.625% | 5/15/2022 | 10,875 | 9,678,750 | ||||||||
| Stryker Corp. | 3.50% | 3/15/2026 | 5,531 | 5,593,882 | ||||||||
| Stryker Corp. | 4.625% | 3/15/2046 | 8,476 | 8,677,313 | ||||||||
| Total | 135,660,461 | |||||||||||
| Metals/Mining (Excluding Steel) 4.43% | ||||||||||||
| Alcoa Nederland Holding BV (Netherlands)†(b) | 6.75% | 9/30/2024 | 12,747 | 13,862,362 | ||||||||
| Aleris International, Inc. | 7.875% | 11/1/2020 | 10,204 | 10,280,530 | ||||||||
| Aleris International, Inc.† | 9.50% | 4/1/2021 | 12,332 | 13,287,730 | ||||||||
| ALROSA Finance SA (Luxembourg)†(b) | 7.75% | 11/3/2020 | 8,000 | 9,053,680 | ||||||||
| Anglo American Capital plc (United Kingdom)†(b) | 3.625% | 5/14/2020 | 2,719 | 2,763,048 | ||||||||
| Anglo American Capital plc (United Kingdom)†(b) | 4.125% | 4/15/2021 | 551 | 563,398 | ||||||||
| Anglo American Capital plc (United Kingdom)†(b) | 4.875% | 5/14/2025 | 8,710 | 8,873,313 | ||||||||
| AngloGold Ashanti Holdings plc (Isle of Man)(b) | 6.50% | 4/15/2040 | 6,359 | 5,754,895 | ||||||||
| Coeur Mining, Inc. | 7.875% | 2/1/2021 | 7,581 | 7,903,193 | ||||||||
| First Quantum Minerals Ltd. (Canada)†(b) | 6.75% | 2/15/2020 | 7,120 | 7,137,800 | ||||||||
| First Quantum Minerals Ltd. (Canada)†(b) | 7.25% | 10/15/2019 | 1,780 | 1,806,700 | ||||||||
| FMG Resources (August 2006) Pty Ltd. (Australia)†(b) | 9.75% | 3/1/2022 | 15,715 | 18,309,075 | ||||||||
| Freeport-McMoRan, Inc. | 3.55% | 3/1/2022 | 22,837 | 21,352,595 | ||||||||
| Freeport-McMoRan, Inc. | 3.875% | 3/15/2023 | 39,623 | 36,552,217 | ||||||||
| Glencore Funding LLC† | 4.125% | 5/30/2023 | 9,950 | 10,027,073 | ||||||||
| Grinding Media, Inc./MC Grinding Media Canada, Inc.† | 7.375% | 12/15/2023 | 6,084 | 6,407,060 | ||||||||
| HudBay Minerals, Inc. (Canada)†(b) | 7.25% | 1/15/2023 | 2,637 | 2,735,888 | ||||||||
| HudBay Minerals, Inc. (Canada)†(b) | 7.625% | 1/15/2025 | 5,898 | 6,145,008 | ||||||||
| Imperial Metals Corp. (Canada)†(b) | 7.00% | 3/15/2019 | 10,455 | 10,036,800 | ||||||||
| Indo Energy Finance BV (Netherlands)†(b) | 7.00% | 5/7/2018 | 4,592 | 4,316,480 | ||||||||
| Indo Energy Finance II BV (Netherlands)†(b) | 6.375% | 1/24/2023 | 8,746 | 6,383,014 | ||||||||
| Kinross Gold Corp. (Canada)(b) | 5.125% | 9/1/2021 | 16,141 | 16,473,827 | ||||||||
| Kinross Gold Corp. (Canada)(b) | 5.95% | 3/15/2024 | 20,220 | 20,573,850 | ||||||||
| See Notes to Financial Statements. | 31 |
Schedule of Investments (continued)
December 31, 2016
| Principal | ||||||||||||
| Interest | Maturity | Amount | Fair | |||||||||
| Investments | Rate | Date | (000) | Value | ||||||||
| Metals/Mining (Excluding Steel) (continued) | ||||||||||||
| Lundin Mining Corp. (Canada)†(b) | 7.875% | 11/1/2022 | $ | 10,330 | $ | 11,285,525 | ||||||
| Mirabela Nickel Ltd. (Australia)(b)(c) | 1.00% | 9/10/2044 | 185 | 19 | ||||||||
| MMC Norilsk Nickel OJSC via MMC Finance DAC (Ireland)†(b) | 6.625% | 10/14/2022 | 12,000 | 13,404,000 | ||||||||
| New Gold, Inc. (Canada)†(b) | 6.25% | 11/15/2022 | 22,843 | 23,528,290 | ||||||||
| New Gold, Inc. (Canada)†(b) | 7.00% | 4/15/2020 | 7,146 | 7,360,380 | ||||||||
| Newmont Mining Corp. | 6.25% | 10/1/2039 | 21,154 | 23,346,020 | ||||||||
| Novelis Corp.† | 5.875% | 9/30/2026 | 8,892 | 9,003,150 | ||||||||
| Novelis Corp.† | 6.25% | 8/15/2024 | 8,652 | 9,192,750 | ||||||||
| Peabody Energy Corp.†(c) | 10.00% | 3/15/2022 | 11,660 | 10,406,550 | ||||||||
| Rain CII Carbon LLC/CII Carbon Corp.† | 8.00% | 12/1/2018 | 5,792 | 5,792,000 | ||||||||
| Rain CII Carbon LLC/CII Carbon Corp.† | 8.25% | 1/15/2021 | 1,427 | 1,419,865 | ||||||||
| Rain CII Carbon LLC/CII Carbon Corp.†(a) | 8.50% | 1/15/2021 | EUR | 4,045 | 4,247,326 | |||||||
| Teck Resources Ltd. (Canada)(b) | 4.75% | 1/15/2022 | $ | 22,962 | 23,134,215 | |||||||
| Teck Resources Ltd. (Canada)†(b) | 8.50% | 6/1/2024 | 10,314 | 11,912,670 | ||||||||
| Vale Overseas Ltd. (Brazil)(b) | 6.25% | 8/10/2026 | 13,031 | 13,584,817 | ||||||||
| Volcan Cia Minera SAA (Peru)†(b) | 5.375% | 2/2/2022 | 11,059 | 10,992,646 | ||||||||
| Total | 419,209,759 | |||||||||||
| Monoline Insurance 0.12% | ||||||||||||
| MGIC Investment Corp. | 5.75% | 8/15/2023 | 10,670 | 11,150,150 | ||||||||
| Non-Electric Utilities 0.13% | ||||||||||||
| Brooklyn Union Gas Co. (The)† | 3.407% | 3/10/2026 | 11,916 | 11,997,601 | ||||||||
| Oil Field Equipment & Services 2.34% | ||||||||||||
| Diamond Offshore Drilling, Inc. | 5.70% | 10/15/2039 | 3,705 | 2,926,950 | ||||||||
| Ensco plc (United kingdom)(b) | 4.50% | 10/1/2024 | 1,620 | 1,393,200 | ||||||||
| Ensco plc (United kingdom)(b) | 5.20% | 3/15/2025 | 15,684 | 13,624,220 | ||||||||
| Forum Energy Technologies, Inc. | 6.25% | 10/1/2021 | 11,835 | 11,894,175 | ||||||||
| FTS International, Inc. | 6.25% | 5/1/2022 | 2,596 | 2,167,660 | ||||||||
| FTS International, Inc.† | 8.463% | # | 6/15/2020 | 10,584 | 10,597,230 | |||||||
| Halliburton Co. | 3.80% | 11/15/2025 | 8,525 | 8,676,361 | ||||||||
| Halliburton Co. | 5.00% | 11/15/2045 | 4,443 | 4,810,250 | ||||||||
| Hornbeck Offshore Services, Inc. | 5.00% | 3/1/2021 | 8,306 | 5,606,550 | ||||||||
| Nabors Industries, Inc. | 4.625% | 9/15/2021 | 1,663 | 1,698,788 | ||||||||
| Nabors Industries, Inc.† | 5.50% | 1/15/2023 | 22,773 | 23,769,319 | ||||||||
| Noble Holding International Ltd. | 4.625% | 3/1/2021 | 4,257 | 4,097,363 | ||||||||
| Noble Holding International Ltd. | 7.20% | 4/1/2025 | 4,730 | 4,458,025 | ||||||||
| 32 | See Notes to Financial Statements. |
Schedule of Investments (continued)
December 31, 2016
| Principal | ||||||||||||
| Interest | Maturity | Amount | Fair | |||||||||
| Investments | Rate | Date | (000) | Value | ||||||||
| Oil Field Equipment & Services (continued) | ||||||||||||
| Noble Holding International Ltd. | 7.75% | 1/15/2024 | $ | 14,811 | $ | 13,968,254 | ||||||
| Oceaneering International, Inc. | 4.65% | 11/15/2024 | 14,235 | 14,063,639 | ||||||||
| Precision Drilling Corp. (Canada)(b) | 5.25% | 11/15/2024 | 16,282 | 15,305,080 | ||||||||
| Precision Drilling Corp. (Canada)(b) | 6.50% | 12/15/2021 | 3,208 | 3,272,160 | ||||||||
| Precision Drilling Corp. (Canada)†(b) | 7.75% | 12/15/2023 | 4,946 | 5,242,760 | ||||||||
| SESI LLC | 6.375% | 5/1/2019 | 4,926 | 4,950,630 | ||||||||
| SESI LLC | 7.125% | 12/15/2021 | 5,564 | 5,689,190 | ||||||||
| Transocean Phoenix 2 Ltd.† | 7.75% | 10/15/2024 | 9,353 | 9,914,180 | ||||||||
| Transocean Proteus Ltd.† | 6.25% | 12/1/2024 | 13,250 | 13,440,535 | ||||||||
| Unit Corp. | 6.625% | 5/15/2021 | 11,504 | 11,216,400 | ||||||||
| Weatherford International Ltd. | 7.75% | 6/15/2021 | 18,552 | 18,807,090 | ||||||||
| Weatherford International Ltd.† | 9.875% | 2/15/2024 | 8,887 | 9,492,382 | ||||||||
| Total | 221,082,391 | |||||||||||
| Oil Refining & Marketing 0.31% | ||||||||||||
| Citgo Holding, Inc.† | 10.75% | 2/15/2020 | 17,528 | 18,886,420 | ||||||||
| Valero Energy Partners LP | 4.375% | 12/15/2026 | 10,657 | 10,773,620 | ||||||||
| Total | 29,660,040 | |||||||||||
| Packaging 0.80% | ||||||||||||
| BWAY Holding Co.† | 9.125% | 8/15/2021 | 8,811 | 9,339,660 | ||||||||
| Coveris Holdings SA (Luxembourg)†(b) | 7.875% | 11/1/2019 | 8,901 | 8,878,748 | ||||||||
| Crown Cork & Seal Co., Inc. | 7.375% | 12/15/2026 | 11,810 | 13,286,250 | ||||||||
| Graphic Packaging International, Inc. | 4.875% | 11/15/2022 | 9,420 | 9,679,050 | ||||||||
| Pactiv LLC | 7.95% | 12/15/2025 | 8,500 | 9,052,500 | ||||||||
| Sealed Air Corp.† | 4.875% | 12/1/2022 | 9,414 | 9,708,187 | ||||||||
| Sealed Air Corp.† | 6.875% | 7/15/2033 | 15,750 | 16,104,375 | ||||||||
| Total | 76,048,770 | |||||||||||
| Personal & Household Products 0.86% | ||||||||||||
| Brunswick Corp.† | 4.625% | 5/15/2021 | 4,087 | 4,153,414 | ||||||||
| FGI Operating Co. LLC/FGI Finance, Inc. | 7.875% | 5/1/2020 | 15,934 | 13,623,570 | ||||||||
| Gibson Brands, Inc.† | 8.875% | 8/1/2018 | 19,905 | 18,511,650 | ||||||||
| Newell Brands, Inc. | 5.50% | 4/1/2046 | 15,807 | 18,188,625 | ||||||||
| SC Johnson & Son, Inc.† | 4.75% | 10/15/2046 | 8,257 | 8,904,638 | ||||||||
| Spectrum Brands, Inc. | 5.75% | 7/15/2025 | 7,621 | 7,944,892 | ||||||||
| Springs Industries, Inc. | 6.25% | 6/1/2021 | 9,749 | 10,138,960 | ||||||||
| Total | 81,465,749 | |||||||||||
| See Notes to Financial Statements. | 33 |
Schedule of Investments (continued)
December 31, 2016
| Principal | ||||||||||||
| Interest | Maturity | Amount | Fair | |||||||||
| Investments | Rate | Date | (000) | Value | ||||||||
| Pharmaceuticals 0.31% | ||||||||||||
| Jaguar Holding Co. II/Pharmaceutical Product Development LLC† | 6.375% | 8/1/2023 | $ | 10,774 | $ | 11,555,115 | ||||||
| Pfizer, Inc. | 5.60% | 9/15/2040 | 14,577 | 17,627,995 | ||||||||
| Total | 29,183,110 | |||||||||||
| Property & Casualty 0.47% | ||||||||||||
| Allstate Corp. (The) | 5.75% | # | 8/15/2053 | 8,670 | 8,980,169 | |||||||
| Arch Capital Finance LLC | 5.031% | 12/15/2046 | 13,319 | 13,996,205 | ||||||||
| Chubb INA Holdings, Inc. | 4.35% | 11/3/2045 | 7,946 | 8,414,258 | ||||||||
| Hanover Insurance Group, Inc. (The) | 4.50% | 4/15/2026 | 13,323 | 13,412,437 | ||||||||
| Total | 44,803,069 | |||||||||||
| Rail 0.77% | ||||||||||||
| Central Japan Railway Co. (Japan)†(b) | 4.25% | 11/24/2045 | 13,527 | 13,815,680 | ||||||||
| CSX Corp. | 4.25% | 11/1/2066 | 13,327 | 12,221,445 | ||||||||
| Florida East Coast Holdings Corp.† | 6.75% | 5/1/2019 | 17,142 | 17,784,825 | ||||||||
| Florida East Coast Holdings Corp.† | 9.75% | 5/1/2020 | 14,393 | 14,860,772 | ||||||||
| Kansas City Southern | 3.125% | 6/1/2026 | 4,440 | 4,237,190 | ||||||||
| Watco Cos. LLC/Watco Finance Corp.† | 6.375% | 4/1/2023 | 9,150 | 9,516,000 | ||||||||
| Total | 72,435,912 | |||||||||||
| Real Estate Investment Trusts 1.05% | ||||||||||||
| Brixmor Operating Partnership LP | 3.25% | 9/15/2023 | 13,337 | 12,949,280 | ||||||||
| Brixmor Operating Partnership LP | 3.85% | 2/1/2025 | 13,793 | 13,605,457 | ||||||||
| Brixmor Operating Partnership LP | 3.875% | 8/15/2022 | 13,193 | 13,465,963 | ||||||||
| CubeSmart LP | 4.00% | 11/15/2025 | 7,942 | 8,075,934 | ||||||||
| Digital Realty Trust LP | 4.75% | 10/1/2025 | 8,313 | 8,643,250 | ||||||||
| Healthcare Trust of America Holdings LP | 3.50% | 8/1/2026 | 8,883 | 8,505,899 | ||||||||
| Jababeka International BV (Netherlands)†(b) | 6.50% | 10/5/2023 | 8,150 | 8,003,113 | ||||||||
| Tanger Properties LP | 3.125% | 9/1/2026 | 10,667 | 10,040,548 | ||||||||
| VEREIT Operating Partnership LP | 4.60% | 2/6/2024 | 6,380 | 6,443,800 | ||||||||
| VEREIT Operating Partnership LP | 4.875% | 6/1/2026 | 9,007 | 9,156,516 | ||||||||
| Total | 98,889,760 | |||||||||||
| Recreation & Travel 0.32% | ||||||||||||
| Royal Caribbean Cruises Ltd. | 7.50% | 10/15/2027 | 25,318 | 30,001,830 | ||||||||
| Restaurants 0.68% | ||||||||||||
| Arcos Dorados Holdings, Inc. (Uruguay)†(b) | 6.625% | 9/27/2023 | 5,787 | 5,960,610 | ||||||||
| KFC Holding Co./Pizza Hut Holdings LLC/Taco Bell of America LLC† | 5.00% | 6/1/2024 | 13,280 | 13,595,400 | ||||||||
| 34 | See Notes to Financial Statements. |
Schedule of Investments (continued)
December 31, 2016
| Principal | ||||||||||||
| Interest | Maturity | Amount | Fair | |||||||||
| Investments | Rate | Date | (000) | Value | ||||||||
| Restaurants (continued) | ||||||||||||
| McDonald’s Corp. | 3.70% | 1/30/2026 | $ | 7,546 | $ | 7,696,958 | ||||||
| McDonald’s Corp. | 4.60% | 5/26/2045 | 9,005 | 9,335,105 | ||||||||
| McDonald’s Corp. | 4.875% | 12/9/2045 | 7,943 | 8,541,156 | ||||||||
| PF Chang’s China Bistro, Inc.† | 10.25% | 6/30/2020 | 9,741 | 9,570,532 | ||||||||
| Seminole Hard Rock Entertainment, Inc./Seminole Hard Rock International LLC† | 5.875% | 5/15/2021 | 9,430 | 9,382,850 | ||||||||
| Total | 64,082,611 | |||||||||||
| Software/Services 1.78% | ||||||||||||
| Alibaba Group Holding Ltd. (China)(b) | 3.125% | 11/28/2021 | 18,436 | 18,456,206 | ||||||||
| Camelot Finance SA (Luxembourg)†(b) | 7.875% | 10/15/2024 | 8,207 | 8,514,762 | ||||||||
| First Data Corp.† | 7.00% | 12/1/2023 | 27,015 | 28,838,512 | ||||||||
| Hewlett Packard Enterprise Co. | 6.35% | 10/15/2045 | 13,393 | 13,572,828 | ||||||||
| Microsoft Corp. | 3.70% | 8/8/2046 | 4,780 | 4,512,038 | ||||||||
| Microsoft Corp. | 4.00% | 2/12/2055 | 26,489 | 25,124,181 | ||||||||
| MSCI, Inc.† | 5.75% | 8/15/2025 | 9,469 | 10,108,157 | ||||||||
| Oracle Corp. | 4.375% | 5/15/2055 | 18,518 | 18,469,483 | ||||||||
| Priceline Group, Inc. (The) | 3.60% | 6/1/2026 | 8,882 | 8,801,716 | ||||||||
| Solera LLC/Solera Finance, Inc.† | 10.50% | 3/1/2024 | 8,930 | 10,090,900 | ||||||||
| VeriSign, Inc. | 4.625% | 5/1/2023 | 8,760 | 8,891,400 | ||||||||
| VeriSign, Inc. | 5.25% | 4/1/2025 | 7,411 | 7,633,330 | ||||||||
| Visa, Inc. | 4.30% | 12/14/2045 | 4,669 | 4,940,540 | ||||||||
| Total | 167,954,053 | |||||||||||
| Specialty Retail 0.68% | ||||||||||||
| Brookstone Holdings Corp. PIK | 10.00% | 7/7/2021 | 628 | 99,622 | ||||||||
| Hot Topic, Inc.† | 9.25% | 6/15/2021 | 8,934 | 9,447,705 | ||||||||
| Midas Intermediate Holdco II LLC/Midas Intermediate Holdco II Finance, Inc.† | 7.875% | 10/1/2022 | 12,902 | 13,385,825 | ||||||||
| Neiman Marcus Group Ltd. LLC† | 8.00% | 10/15/2021 | 12,738 | 9,521,655 | ||||||||
| PetSmart, Inc.† | 7.125% | 3/15/2023 | 26,082 | 26,668,845 | ||||||||
| Ritchie Bros Auctioneers, Inc. (Canada)†(b) | 5.375% | 1/15/2025 | 5,554 | 5,678,965 | ||||||||
| Total | 64,802,617 | |||||||||||
| Steel Producers/Products 0.80% | ||||||||||||
| ArcelorMittal (Luxembourg)(b) | 6.125% | 6/1/2025 | 13,332 | 14,665,200 | ||||||||
| Gerdau Trade, Inc.† | 4.75% | 4/15/2023 | 3,504 | 3,363,840 | ||||||||
| GTL Trade Finance, Inc.† | 5.893% | 4/29/2024 | 15,846 | 15,846,000 | ||||||||
| Joseph T Ryerson & Son, Inc.† | 11.00% | 5/15/2022 | 9,487 | 10,459,417 | ||||||||
| Steel Dynamics, Inc.† | 5.00% | 12/15/2026 | 4,445 | 4,439,444 | ||||||||
| See Notes to Financial Statements. | 35 |
Schedule of Investments (continued)
December 31, 2016
| Principal | ||||||||||||
| Interest | Maturity | Amount | Fair | |||||||||
| Investments | Rate | Date | (000) | Value | ||||||||
| Steel Producers/Products (continued) | ||||||||||||
| Steel Dynamics, Inc. | 5.50% | 10/1/2024 | $ | 6,245 | $ | 6,635,312 | ||||||
| U.S. Steel Corp. | 6.875% | 4/1/2021 | 1,203 | 1,221,045 | ||||||||
| U.S. Steel Corp. | 7.50% | 3/15/2022 | 2,627 | 2,725,513 | ||||||||
| U.S. Steel Corp.† | 8.375% | 7/1/2021 | 8,871 | 9,829,334 | ||||||||
| Zekelman Industries, Inc.† | 9.875% | 6/15/2023 | 5,553 | 6,233,243 | ||||||||
| Total | 75,418,348 | |||||||||||
| Support: Services 1.25% | ||||||||||||
| AECOM | 5.875% | 10/15/2024 | 9,059 | 9,716,774 | ||||||||
| BakerCorp International, Inc. | 8.25% | 6/1/2019 | 4,441 | 3,774,850 | ||||||||
| BlueLine Rental Finance Corp.† | 7.00% | 2/1/2019 | 9,679 | 9,485,420 | ||||||||
| Cleveland Clinic Foundation (The) | 4.858% | 1/1/2114 | 8,223 | 7,822,975 | ||||||||
| Jurassic Holdings III, Inc.† | 6.875% | 2/15/2021 | 14,584 | 12,031,800 | ||||||||
| Leidos Holdings, Inc. | 4.45% | 12/1/2020 | 4,650 | 4,813,215 | ||||||||
| Metropolitan Museum of Art (The) | 3.40% | 7/1/2045 | 13,518 | 12,361,684 | ||||||||
| Monitronics International, Inc. | 9.125% | 4/1/2020 | 10,520 | 9,967,700 | ||||||||
| NES Rentals Holdings, Inc.† | 7.875% | 5/1/2018 | 7,800 | 7,800,000 | ||||||||
| Sotheby’s† | 5.25% | 10/1/2022 | 7,404 | 7,311,450 | ||||||||
| Total System Services, Inc. | 4.80% | 4/1/2026 | 11,339 | 12,240,462 | ||||||||
| United Rentals North America, Inc. | 5.875% | 9/15/2026 | 6,713 | 6,939,564 | ||||||||
| United Rentals North America, Inc. | 6.125% | 6/15/2023 | 13,114 | 13,966,410 | ||||||||
| Total | 118,232,304 | |||||||||||
| Technology Hardware & Equipment 1.12% | ||||||||||||
| CDW LLC/CDW Finance Corp. | 5.50% | 12/1/2024 | 15,000 | 15,412,500 | ||||||||
| CommScope Technologies Finance LLC† | 6.00% | 6/15/2025 | 25,326 | 26,972,190 | ||||||||
| Diamond 1 Finance Corp./Diamond 2 Finance Corp.† | 4.42% | 6/15/2021 | 8,930 | 9,249,408 | ||||||||
| Diamond 1 Finance Corp./Diamond 2 Finance Corp.† | 5.875% | 6/15/2021 | 22,927 | 24,401,115 | ||||||||
| Diamond 1 Finance Corp./Diamond 2 Finance Corp.† | 7.125% | 6/15/2024 | 27,034 | 30,029,421 | ||||||||
| Total | 106,064,634 | |||||||||||
| Telecommunications: Satellite 0.05% | ||||||||||||
| Intelsat Connect Finance SA (Luxembourg)†(b) | 12.50% | 4/1/2022 | 6,041 | 3,745,203 | ||||||||
| Intelsat Jackson Holdings SA (Luxembourg)(b) | 7.25% | 4/1/2019 | 1,161 | 981,045 | ||||||||
| Total | 4,726,248 | |||||||||||
| Telecommunications: Wireless 2.33% | ||||||||||||
| Comcel Trust via Comunicaciones Celulares SA† | 6.875% | 2/6/2024 | 18,350 | 18,579,375 | ||||||||
| GTH Finance BV (Netherlands)†(b) | 7.25% | 4/26/2023 | 17,156 | 18,455,207 | ||||||||
| SBA Communications Corp. | 4.875% | 7/15/2022 | 8,259 | 8,403,532 | ||||||||
| 36 | See Notes to Financial Statements. |
Schedule of Investments (continued)
December 31, 2016
| Principal | ||||||||||||
| Interest | Maturity | Amount | Fair | |||||||||
| Investments | Rate | Date | (000) | Value | ||||||||
| Telecommunications: Wireless (continued) | ||||||||||||
| Sprint Corp. | 7.125% | 6/15/2024 | $ | 10,730 | $ | 11,078,725 | ||||||
| Sprint Corp. | 7.625% | 2/15/2025 | 29,848 | 31,452,330 | ||||||||
| Sprint Corp. | 7.875% | 9/15/2023 | 4,761 | 5,094,270 | ||||||||
| T-Mobile USA, Inc. | 6.50% | 1/15/2024 | 47,921 | 51,515,075 | ||||||||
| T-Mobile USA, Inc. | 6.50% | 1/15/2026 | 17,671 | 19,150,946 | ||||||||
| T-Mobile USA, Inc. | 6.625% | 4/1/2023 | 20,000 | 21,250,000 | ||||||||
| T-Mobile USA, Inc. | 6.836% | 4/28/2023 | 2,192 | 2,353,660 | ||||||||
| Telefonica Celular del Paraguay SA (Paraguay)†(b) | 6.75% | 12/13/2022 | 5,630 | 5,756,675 | ||||||||
| Wind Acquisition Finance SA (Italy)†(b) | 7.375% | 4/23/2021 | 26,564 | 27,692,970 | ||||||||
| Total | 220,782,765 | |||||||||||
| Telecommunications: Wireline Integrated & Services 1.98% | ||||||||||||
| Columbus Cable Barbados Ltd. (Barbados)†(b) | 7.375% | 3/30/2021 | 12,134 | 12,957,777 | ||||||||
| Communications Sales & Leasing, Inc./CSL Capital LLC | 8.25% | 10/15/2023 | 8,394 | 8,939,610 | ||||||||
| Consolidated Communications, Inc. | 6.50% | 10/1/2022 | 8,667 | 8,645,333 | ||||||||
| Equinix, Inc. | 5.375% | 4/1/2023 | 19,410 | 20,234,925 | ||||||||
| Equinix, Inc. | 5.875% | 1/15/2026 | 37,076 | 39,115,180 | ||||||||
| Frontier Communications Corp. | 9.25% | 7/1/2021 | 9,810 | 10,337,288 | ||||||||
| Frontier Communications Corp. | 11.00% | 9/15/2025 | 16,765 | 17,372,731 | ||||||||
| GCI, Inc. | 6.875% | 4/15/2025 | 13,026 | 13,286,520 | ||||||||
| Hellas Telecommunications Luxembourg II SCA (Luxembourg)†(b)(c) | Zero Coupon | 1/15/2049 | 15,000 | 1,500 | ||||||||
| IHS Netherlands Holdco BV (Netherlands)†(b) | 9.50% | 10/27/2021 | 21,060 | 21,610,129 | ||||||||
| Sable International Finance Ltd.† | 6.875% | 8/1/2022 | 13,196 | 13,789,820 | ||||||||
| Windstream Services LLC | 7.75% | 10/1/2021 | 4,820 | 4,979,060 | ||||||||
| Zayo Group LLC/Zayo Capital, Inc. | 6.00% | 4/1/2023 | 15,228 | 15,913,260 | ||||||||
| Total | 187,183,133 | |||||||||||
| Theaters & Entertainment 0.07% | ||||||||||||
| AMC Entertainment Holdings, Inc.† | 5.875% | 11/15/2026 | 6,669 | 6,835,725 | ||||||||
| Transportation: Infrastructure/Services 0.47% | ||||||||||||
| Autoridad del Canal de Panama (Panama)†(b) | 4.95% | 7/29/2035 | 8,750 | 9,275,000 | ||||||||
| Delhi International Airport Pvt Ltd. (India)†(b) | 6.125% | 10/31/2026 | 11,355 | 11,764,200 | ||||||||
| DP World Ltd. (United Arab Emirates)†(b) | 6.85% | 7/2/2037 | 8,970 | 9,606,655 | ||||||||
| Mexico City Airport Trust (Mexico)†(b) | 5.50% | 10/31/2046 | 10,400 | 9,386,000 | ||||||||
| Stena AB (Sweden)†(b) | 7.00% | 2/1/2024 | 4,836 | 4,307,183 | ||||||||
| Total | 44,339,038 | |||||||||||
| See Notes to Financial Statements. | 37 |
Schedule of Investments (continued)
December 31, 2016
| Principal | ||||||||||||
| Interest | Maturity | Amount | Fair | |||||||||
| Investments | Rate | Date | (000) | Value | ||||||||
| Trucking & Delivery 0.13% | ||||||||||||
| FedEx Corp. | 4.55% | 4/1/2046 | $ | 11,856 | $ | 11,995,332 | ||||||
| Total High Yield Corporate Bonds (cost $6,587,961,800) | 6,754,788,825 | |||||||||||
| MUNICIPAL BOND 0.32% | ||||||||||||
| Other Revenue | ||||||||||||
| New York City Indus Dev Agy† (cost $27,160,563) | 11.00% | 3/1/2029 | 22,134 | 30,409,903 | ||||||||
| NON-AGENCY COMMERCIAL MORTGAGE-BACKED SECURITIES 0.63% | ||||||||||||
| Citigroup Commercial Mortgage Trust 2015-101A D† | 4.625% | # | 1/14/2043 | 8,025 | 7,119,337 | |||||||
| Citigroup Commercial Mortgage Trust 2015-101A F† | 4.625% | # | 1/14/2043 | 19,000 | 12,741,305 | |||||||
| Citigroup Commercial Mortgage Trust 2015-101A G† | 4.625% | # | 1/14/2043 | 4,000 | 2,549,340 | |||||||
| Commercial Mortgage Pass-Through Certificates 2014-UBS5 C | 4.613% | # | 9/10/2047 | 6,250 | 6,235,232 | |||||||
| Commercial Mortgage Pass-Through Certificates 2015-PC1 D | 4.443% | # | 7/10/2050 | 12,037 | 8,794,968 | |||||||
| Impact Funding Affordable Multifamily Housing Mortgage Loan Trust 2010-1 B† | 6.00% | # | 1/25/2051 | 7,835 | 7,931,421 | |||||||
| Impact Funding Affordable Multifamily Housing Mortgage Loan Trust 2010-1 C† | 6.374% | # | 1/25/2051 | 7,457 | 7,148,400 | |||||||
| Impact Funding Affordable Multifamily Housing Mortgage Loan Trust 2014-1A XB IO† | 0.342% | # | 8/25/2047 | 20,727 | 652,952 | |||||||
| Morgan Stanley Bank of America Merrill Lynch Trust 2014-C19 LNC4† | 4.75% | 12/15/2046 | 7,540 | 6,755,535 | ||||||||
| Total Non-Agency Commercial Mortgage-Backed Securities (cost $65,856,471) | 59,928,490 | |||||||||||
| Dividend | Shares | |||||||||||
| Rate | (000) | |||||||||||
| PREFERRED STOCK 0.06% | ||||||||||||
| Energy: Exploration & Production | ||||||||||||
| Templar Energy LLC (cost $3,416,610) | Zero Coupon | 342 | 5,124,915 | |||||||||
| Total Long-Term Investments (cost $8,873,945,951) | 9,189,104,758 | |||||||||||
| 38 | See Notes to Financial Statements. |
Schedule of Investments (continued)
December 31, 2016
| Principal | ||||||||||||
| Interest | Maturity | Amount | Fair | |||||||||
| Investments | Rate | Date | (000) | Value | ||||||||
| SHORT-TERM INVESTMENTS 1.38% | ||||||||||||
| FOREIGN GOVERNMENT OBLIGATIONS 0.03% | ||||||||||||
| Argentina | ||||||||||||
| Letras del Banco Central de la Republica Argentina(a) (cost $3,356,464) | Zero Coupon | 1/11/2017 | ARS | 49,725 | $ | 3,118,388 | ||||||
| HIGH YIELD CORPORATE BOND 0.09% | ||||||||||||
| Gaming | ||||||||||||
| Caesars Entertainment Operating Co., Inc.(c) (cost $8,777,249) | 11.25% | 6/1/2017 | $ | 8,407 | 8,595,884 | |||||||
| REPURCHASE AGREEMENT 1.26% | ||||||||||||
| Repurchase Agreement dated 12/30/2016, 0.03% due 1/3/2017 with Fixed Income Clearing Corp. collateralized by $114,240,000 of U.S. Treasury Inflation Indexed Note at 0.125% due 4/15/2017; value: $121,834,332; proceeds: $119,443,169 (cost $119,442,771) | 119,443 | 119,442,771 | ||||||||||
| Total Short-Term Investments (cost $131,576,484) | 131,157,043 | |||||||||||
| Total Investments in Securities 98.57% (cost $9,005,522,435) | 9,320,261,801 | |||||||||||
| Cash, Foreign Cash and Other Assets in Excess of Liabilities(g) 1.43% | 134,829,125 | |||||||||||
| Net Assets 100.00% | $ | 9,455,090,926 | ||||||||||
| ARS | Argentine Peso | |
| AUD | Australian dollar. | |
| BRL | Brazilian real. | |
| CAD | Canadian dollar. | |
| EUR | euro. | |
| GBP | British pound. | |
| MXN | Mexican peso. | |
| RUB | Russian ruble. | |
| ADR | American Depositary Receipt. | |
| IO | Interest Only. | |
| PIK | Payment-in-kind. | |
| † | Security was purchased pursuant to Rule 144A under the Securities Act of 1933 and, unless registered under such Act or exempted from registration, may only be resold to qualified institutional buyers. | |
| # | Variable rate security. The interest rate represents the rate in effect at December 31, 2016. | |
| * | Non-income producing security. | |
| (a) | Investment in non-U.S. dollar denominated securities. | |
| (b) | Foreign security traded in U.S. dollars. | |
| (c) | Defaulted (non-income producing security). | |
| (d) | Floating Rate Loans in which the Fund invests generally pay interest at rates which are periodically re-determined at a margin above the London Interbank Offered Rate (“LIBOR”) or the prime rate offered by major U.S. banks. The rate(s) shown is the rate(s) in effect at December 31, 2016. | |
| (e) | Interest rate to be determined. |
| See Notes to Financial Statements. | 39 |
Schedule of Investments (continued)
December 31, 2016
| (f) | Security is perpetual in nature and has no stated maturity. | |
| (g) | Cash, Foreign Cash and Other Assets in Excess of Liabilities include net unrealized appreciation (depreciation) on open forward foreign currency exchange contracts, futures contracts and swaps as follows: |
Open Forward Foreign Currency Exchange Contracts at December 31, 2016:
| Forward | ||||||||||||||||||||
| Foreign | U.S. $ | |||||||||||||||||||
| Currency | Cost on | U.S. $ | ||||||||||||||||||
| Exchange | Transaction | Expiration | Foreign | Origination | Current | Unrealized | ||||||||||||||
| Contracts | Type | Counterparty | Date | Currency | Date | Value | Appreciation | |||||||||||||
| British pound | Buy | State Street Bank and Trust | 1/19/2017 | 2,000,000 | $ | 2,457,945 | $ | 2,465,921 | $ | 7,976 | ||||||||||
| British pound | Sell | J.P. Morgan | 1/19/2017 | 5,200,000 | 6,533,356 | 6,411,394 | 121,962 | |||||||||||||
| British pound | Sell | J.P. Morgan | 1/19/2017 | 900,000 | 1,120,372 | 1,109,664 | 10,708 | |||||||||||||
| British pound | Sell | State Street Bank and Trust | 1/19/2017 | 350,000 | 436,130 | 431,536 | 4,594 | |||||||||||||
| British pound | Sell | State Street Bank and Trust | 1/19/2017 | 3,200,000 | 4,006,269 | 3,945,473 | 60,796 | |||||||||||||
| euro | Sell | J.P. Morgan | 2/16/2017 | 6,800,000 | 7,195,284 | 7,173,131 | 22,153 | |||||||||||||
| euro | Sell | Morgan Stanley | 2/16/2017 | 9,120,000 | 9,747,316 | 9,620,434 | 126,882 | |||||||||||||
| euro | Sell | Standard Chartered Bank | 2/16/2017 | 62,900,000 | 67,729,525 | 66,351,459 | 1,378,066 | |||||||||||||
| euro | Sell | State Street Bank and Trust | 2/16/2017 | 965,000 | 1,026,623 | 1,017,952 | 8,671 | |||||||||||||
| Unrealized Appreciation on Forward Foreign Currency Exchange Contracts | $ | 1,741,808 | ||||||||||||||||||
| Forward | |||||||||||||||||||||
| Foreign | U.S. $ | ||||||||||||||||||||
| Currency | Cost on | U.S. $ | |||||||||||||||||||
| Exchange | Transaction | Expiration | Foreign | Origination | Current | Unrealized | |||||||||||||||
| Contracts | Type | Counterparty | Date | Currency | Date | Value | Depreciation | ||||||||||||||
| euro | Buy | Standard Chartered Bank | 2/16/2017 | 10,000,000 | $ | 10,697,950 | $ | 10,548,722 | $ | (149,228 | ) | ||||||||||
| euro | Buy | Standard Chartered Bank | 2/16/2017 | 6,950,000 | 7,419,877 | 7,331,362 | (88,515 | ) | |||||||||||||
| euro | Buy | State Street Bank and Trust | 2/16/2017 | 3,325,000 | 3,565,002 | 3,507,450 | (57,552 | ) | |||||||||||||
| British pound | Sell | J.P. Morgan | 1/19/2017 | 27,400,000 | 33,387,034 | 33,783,117 | (396,083 | ) | |||||||||||||
| Unrealized Depreciation on Forward Foreign Currency Exchange Contracts | $ | (691,378 | ) | ||||||||||||||||||
| 40 | See Notes to Financial Statements. |
Schedule of Investments (continued)
December 31, 2016
Open Futures Contracts at December 31, 2016:
| Unrealized | ||||||||||||||||
| Type | Expiration | Contracts | Position | Notional Value | Appreciation | |||||||||||
| Long U.S. Treasury Bond | March 2017 | 4,503 | Short | $ | (678,405,094 | ) | $ | 7,346,121 | ||||||||
| U.S. 10-Year Treasury Note | March 2017 | 7,687 | Short | (955,349,969 | ) | 5,135,399 | ||||||||||
| Totals | $ | (1,633,755,063 | ) | $ | 12,481,520 | |||||||||||
| Unrealized | ||||||||||||||||
| Type | Expiration | Contracts | Position | Notional Value | Depreciation | |||||||||||
| U.S. 5-Year Treasury Note | March 2017 | 9,428 | Long | $ | 1,109,336,786 | $ | (1,784,692) | |||||||||
Centrally Cleared Credit Default Swaps on Indexes—Buy Protection at December 31, 2016(1):
| Referenced | Fund | Termination | Notional | Fair | Payments | Unrealized | |||||||
| Index* | Pays | Date | Amount | Value(2) | Upfront(3) | Depreciation(4) | |||||||
| Markit CDX. NA.EM.26(5) | 1.00% | 12/20/2021 | $278,197,000 | $295,661,265 | $21,424,545 | $(3,960,280) |
| * | The Referenced Index is for the Credit Default Swaps on Indexes, which is comprised of a basket of emerging markets sovereign issuers. (See Note 2(i)). |
| (1) | If the Fund is a buyer of protection and a credit event occurs, as defined under the terms of that particular swap agreement, the Fund will either (i) receive from the seller of protection an amount equal to the notional amount of the swap and take delivery of the referenced obligation or underlying securities comprising the referenced index or (ii) pay a net settlement amount in the form of cash or securities equal to the notional amount of the swap less the recovery value of the referenced obligation or underlying securities. |
| (2) | Fair value serves as the indicator of the current status of payment/performance risk. |
| (3) | Upfront payments received by Cental Clearinghouse are presented net of amortization (See Note 2(i)). |
| (4) | Total unrealized appreciation on Credit Default Swaps on Indexes amounted to $0. Total unrealized depreciation on Credit Default Swaps on Indexes amounted to $3,960,280. |
| (5) | Central Clearinghouse: Credit Suisse. |
| See Notes to Financial Statements. | 41 |
Schedule of Investments (continued)
December 31, 2016
The following is a summary of the inputs used as of December 31, 2016 in valuing the Fund’s investments carried at fair value(1):
| Investment Type(2) | Level 1 | Level 2 | Level 3 | Total | ||||||||||||
| Asset-Backed Securities | ||||||||||||||||
| Other | $ | – | $ | 141,403,974 | $ | 9,397,324 | (3) | $ | 150,801,298 | |||||||
| Remaining Industries | – | 34,944,944 | – | 34,944,944 | ||||||||||||
| Common Stocks | ||||||||||||||||
| Auto Parts & Equipment | 18,472,672 | 17,908,182 | – | 36,380,854 | ||||||||||||
| Energy: Exploration & Production | 46,975,615 | 3,340,834 | – | 50,316,449 | ||||||||||||
| Media: Content | 38,860,946 | – | 362,120 | (4) | 39,223,066 | |||||||||||
| Metals/Mining (Excluding Steel) | 60,006,635 | – | 225,644 | (4) | 60,232,279 | |||||||||||
| Remaining Industries | 1,069,604,699 | (5) | – | – | 1,069,604,699 | |||||||||||
| Convertible Bonds | ||||||||||||||||
| Energy: Exploration & Production | – | – | 796,786 | (4) | 796,786 | |||||||||||
| Remaining Industries | – | 27,429,429 | – | 27,429,429 | ||||||||||||
| Convertible Preferred Stocks | – | 12,588,172 | – | 12,588,172 | ||||||||||||
| Floating Rate Loans(6) | ||||||||||||||||
| Auto Parts & Equipment | – | – | 8,096,495 | 8,096,495 | ||||||||||||
| Department Stores | – | 9,435,004 | – | 9,435,004 | ||||||||||||
| Diversified Capital Goods | – | 9,692,063 | – | 9,692,063 | ||||||||||||
| Electric: Generation | – | 36,893,972 | – | 36,893,972 | ||||||||||||
| Energy: Exploration & Production | – | 54,964,529 | – | 54,964,529 | ||||||||||||
| Food: Wholesale | – | 23,356,300 | – | 23,356,300 | ||||||||||||
| Gaming | – | 42,074,111 | – | 42,074,111 | ||||||||||||
| Health Services | – | 9,538,145 | – | 9,538,145 | ||||||||||||
| Media: Diversified | – | 10,083,635 | – | 10,083,635 | ||||||||||||
| Metals/Mining (Excluding Steel) | – | 28,391,802 | – | 28,391,802 | ||||||||||||
| Oil Field Equipment & Services | – | 21,517,958 | – | 21,517,958 | ||||||||||||
| Personal & Household Products | – | 22,785,205 | – | 22,785,205 | ||||||||||||
| Recreation & Travel | – | 9,286,950 | – | 9,286,950 | ||||||||||||
| Specialty Retail | – | 34,227,233 | – | 34,227,233 | ||||||||||||
| Support: Services | – | 67,072,235 | – | 67,072,235 | ||||||||||||
| Telecommunications: Wireline Integrated & Services | – | 9,568,284 | – | 9,568,284 | ||||||||||||
| Trucking & Delivery | – | 9,393,323 | – | 9,393,323 | ||||||||||||
| Foreign Bonds | – | 41,967,100 | – | 41,967,100 | ||||||||||||
| Foreign Government Obligations | – | 411,308,693 | – | 411,308,693 | ||||||||||||
| High Yield Corporate Bonds | ||||||||||||||||
| Automakers | – | 25,354,424 | 1,500 | (4) | 25,355,924 | |||||||||||
| Banking | – | 592,184,340 | 2,250 | (4) | 592,186,590 | |||||||||||
| Metals/Mining (Excluding Steel) | – | 419,209,740 | 19 | (4) | 419,209,759 | |||||||||||
| Specialty Retail | – | 64,702,995 | 99,622 | (3) | 64,802,617 | |||||||||||
| Telecommunications: Wireline Integrated & Services | – | 187,181,633 | 1,500 | (4) | 187,183,133 | |||||||||||
| Remaining Industries | – | 5,474,646,686 | – | 5,474,646,686 | ||||||||||||
| Municipal Bond | – | 30,409,903 | – | 30,409,903 | ||||||||||||
| Non-Agency Commercial Mortgage-Backed Securities | – | 59,275,538 | 652,952 | (3) | 59,928,490 | |||||||||||
| Preferred Stock | – | 5,124,915 | – | 5,124,915 | ||||||||||||
| Repurchase Agreement | – | 119,442,771 | – | 119,442,771 | ||||||||||||
| Total | $ | 1,233,920,567 | $ | 8,066,705,022 | $ | 19,636,212 | $ | 9,320,261,801 | ||||||||
| 42 | See Notes to Financial Statements. |
Schedule of Investments (concluded)
December 31, 2016
| Other Financial Instruments | Level 1 | Level 2 | Level 3 | Total | ||||||||||||
| Centrally Cleared Credit Default Swaps | ||||||||||||||||
| Assets | $ | – | $ | – | $ | – | $ | – | ||||||||
| Liabilities | – | (3,960,280 | ) | – | (3,960,280 | ) | ||||||||||
| Forward Foreign Currency Exchange Contracts | ||||||||||||||||
| Assets | – | 1,741,808 | – | 1,741,808 | ||||||||||||
| Liabilities | – | (691,378 | ) | – | (691,378 | ) | ||||||||||
| Futures Contracts | ||||||||||||||||
| Assets | 12,481,520 | – | – | 12,481,520 | ||||||||||||
| Liabilities | (1,784,692 | ) | – | – | (1,784,692 | ) | ||||||||||
| Total | $ | 10,696,828 | $ | (2,909,850 | ) | $ | – | $ | 7,786,978 | |||||||
| (1) | Refer to Note 2(n) for a description of fair value measurements and the three-tier hierarchy of inputs. | |
| (2) | See Schedule of Investments for fair values in each industry and identification of foreign issuers and/or geography. The table above is presented by Investment Type. Industries are presented within an Investment Type should such Investment Type include securities classified as two or more levels within the three-tier fair value hierarchy. | |
| (3) | Includes securities valued using third party pricing information without adjustment. Such valuations are based on unobservable inputs. A significant change in third party information could result in a significantly lower or higher value of such Level 3 investments. | |
| (4) | Level 3 security fair valued by the Pricing Committee, as described in Note 2(a) in the Notes to Financial Statements. | |
| (5) | As of December 31, 2016, Moncler SpA, inc. was categorized as level 1 due to an active market quoted price. For the period ended December 31, 2016, the total amount transferred from Level 2 to Level 1 was $8,166,713. | |
| (6) | Floating Rate Loans categorized as Level 3 are valued based on a single quotation obtained from a dealer. Accounting principles generally accepted in the United States of America do not require the Fund to create quantitative unobservable inputs that were not developed by the Fund. Therefore, the Fund does not have access to unobservable inputs and cannot disclose such inputs in the valuation. |
The following is a reconciliation of investments with unobservable inputs (Level 3) that were used in determining fair value:
| Investment Type | Asset-Backed Securities | Common Stocks | Convertible Bonds | Floating Rate Loans | High Yield Corporate Bonds | Non-Agency Commercial Mortgage- Backed Securities | ||||||||||||||||||
| Balance as of January 1, 2016 | $ | – | $ | 1,363,744 | $ | 796,783 | $ | 23,304,840 | $ | 397,304 | $ | 9,810,846 | ||||||||||||
| Accrued discounts/premiums | 38 | – | – | (32,730 | ) | – | (20,080 | ) | ||||||||||||||||
| Realized gain (loss) | – | – | – | (976 | ) | – | (1,128,889 | ) | ||||||||||||||||
| Change in unrealized appreciation/depreciation | (48,359 | ) | (775,980 | ) | 3 | 73,986 | (352,589 | ) | 1,028,575 | |||||||||||||||
| Purchases | 9,445,645 | – | – | – | 60,176 | – | ||||||||||||||||||
| Sales | – | – | – | (81,375 | ) | – | (9,037,500 | ) | ||||||||||||||||
| Net transfers in or out of Level 3 | – | – | – | (15,167,250 | ) | – | – | |||||||||||||||||
| Balance as of December 31, 2016 | $ | 9,397,324 | $ | 587,764 | $ | 796,786 | $ | 8,096,495 | $ | 104,891 | $ | 652,952 | ||||||||||||
| See Notes to Financial Statements. | 43 |
Statement of Assets and Liabilities
December 31, 2016
| ASSETS: | ||||
| Investments in securities, at fair value (cost $9,005,522,435) | $ | 9,320,261,801 | ||
| Cash | 9,321,376 | |||
| Deposits with brokers for derivatives collateral | 33,941,857 | |||
| Foreign cash, at value (cost $12,818,155) | 12,849,761 | |||
| Receivables: | ||||
| Interest and dividends | 112,186,936 | |||
| Capital shares sold | 68,182,900 | |||
| Investment securities sold | 37,471,699 | |||
| Variation margin for centrally cleared credit default swap agreements | 110,322 | |||
| Unrealized appreciation on forward foreign currency exchange contracts | 1,741,808 | |||
| Prepaid expenses and other assets | 144,729 | |||
| Total assets | 9,596,213,189 | |||
| LIABILITIES: | ||||
| Payables: | ||||
| Investment securities purchased | 48,535,150 | |||
| Capital shares reacquired | 40,626,708 | |||
| Variation margin | 4,458,094 | |||
| Management fee | 3,593,896 | |||
| 12b-1 distribution plan | 3,059,577 | |||
| Directors’ fees | 1,834,885 | |||
| Fund administration | 317,575 | |||
| Unrealized depreciation on forward foreign currency exchange contracts | 691,378 | |||
| Distributions payable | 36,419,422 | |||
| Accrued expenses | 1,585,578 | |||
| Total liabilities | 141,122,263 | |||
| NET ASSETS | $ | 9,455,090,926 | ||
| COMPOSITION OF NET ASSETS: | ||||
| Paid-in capital | $ | 9,324,523,254 | ||
| Undistributed net investment income | 22,184,610 | |||
| Accumulated net realized loss on investments, futures contracts, swaps and foreign currency related transactions | (214,082,415 | ) | ||
| Net unrealized appreciation on investments, futures contracts, swaps and translation of assets and liabilities denominated in foreign currencies | 322,465,477 | |||
| Net Assets | $ | 9,455,090,926 |
| 44 | See Notes to Financial Statements. |
Statement of Assets and Liabilities (concluded)
December 31, 2016
| Net assets by class: | ||||
| Class A Shares | $ | 4,263,801,410 | ||
| Class B Shares | $ | 51,641,666 | ||
| Class C Shares | $ | 1,892,904,901 | ||
| Class F Shares | $ | 2,607,811,362 | ||
| Class I Shares | $ | 450,661,112 | ||
| Class P Shares | $ | 36,825,274 | ||
| Class R2 Shares | $ | 5,323,708 | ||
| Class R3 Shares | $ | 128,317,294 | ||
| Class R4 Shares | $ | 2,072,274 | ||
| Class R5 Shares | $ | 385,700 | ||
| Class R6 Shares | $ | 15,346,225 | ||
| Outstanding shares by class: | ||||
| Class A Shares (1.14 billion shares of common stock authorized, $.001 par value) | 537,817,918 | |||
| Class B Shares (500 million shares of common stock authorized, $.001 par value) | 6,491,667 | |||
| Class C Shares (600 million shares of common stock authorized, $.001 par value) | 238,143,245 | |||
| Class F Shares (600 million shares of common stock authorized, $.001 par value) | 329,417,678 | |||
| Class I Shares (300 million shares of common stock authorized, $.001 par value) | 57,149,955 | |||
| Class P Shares (160 million shares of common stock authorized, $.001 par value) | 4,543,018 | |||
| Class R2 Shares (300 million shares of common stock authorized, $.001 par value) | 671,535 | |||
| Class R3 Shares (300 million shares of common stock authorized, $.001 par value) | 16,211,764 | |||
| Class R4 Shares (300 million shares of common stock authorized, $.001 par value) | 261,299 | |||
| Class R5 Shares (300 million shares of common stock authorized, $.001 par value) | 49,093 | |||
| Class R6 Shares (300 million shares of common stock authorized, $.001 par value) | 1,944,748 | |||
| Net asset value, offering and redemption price per share (Net assets divided by outstanding shares): | ||||
| Class A Shares-Net asset value | $7.93 | |||
| Class A Shares-Maximum offering price (Net asset value plus sales charge of 2.25%) | $8.11 | |||
| Class B Shares-Net asset value | $7.96 | |||
| Class C Shares-Net asset value | $7.95 | |||
| Class F Shares-Net asset value | $7.92 | |||
| Class I Shares-Net asset value | $7.89 | |||
| Class P Shares-Net asset value | $8.11 | |||
| Class R2 Shares-Net asset value | $7.93 | |||
| Class R3 Shares-Net asset value | $7.92 | |||
| Class R4 Shares-Net asset value | $7.93 | |||
| Class R5 Shares-Net asset value | $7.86 | |||
| Class R6 Shares-Net asset value | $7.89 |
| See Notes to Financial Statements. | 45 |
For the Year Ended December 31, 2016
| Investment income: | ||||
| Dividends (net of foreign withholding taxes of $134,925) | $ | 15,630,404 | ||
| Interest and other (net of foreign withholding taxes of $5,938) | 465,944,122 | |||
| Interest earned from Interfund Lending (See Note 11) | 909 | |||
| Total investment income | 481,575,435 | |||
| Expenses: | ||||
| Management fee | 40,495,771 | |||
| 12b-1 distribution plan-Class A | 8,536,709 | |||
| 12b-1 distribution plan-Class B | 672,508 | |||
| 12b-1 distribution plan-Class C | 15,708,295 | |||
| 12b-1 distribution plan-Class F | 2,089,358 | |||
| 12b-1 distribution plan-Class P | 89,293 | |||
| 12b-1 distribution plan-Class R2 | 26,521 | |||
| 12b-1 distribution plan-Class R3 | 574,798 | |||
| 12b-1 distribution plan-Class R4 | 2,098 | |||
| Shareholder servicing | 8,842,384 | |||
| Fund administration | 3,577,402 | |||
| Reports to shareholders | 609,942 | |||
| Registration | 396,072 | |||
| Directors’ fees | 310,533 | |||
| Professional | 199,617 | |||
| Custody | 177,951 | |||
| Other | 353,588 | |||
| Gross expenses | 82,662,840 | |||
| Expense reductions (See Note 9) | (34,205 | ) | ||
| Net expenses | 82,628,635 | |||
| Net investment income | 398,946,800 | |||
| Net realized and unrealized gain (loss): | ||||
| Net realized loss on investments | (26,133,307 | ) | ||
| Net realized loss on futures contracts, swaps and foreign currency related transactions | (29,777,227 | ) | ||
| Net change in unrealized appreciation/depreciation on investments | 675,693,503 | |||
| Net change in unrealized appreciation/depreciation on futures contracts, swaps and translation of assets and liabilities denominated in foreign currencies | 7,589,806 | |||
| Net realized and unrealized gain | 627,372,775 | |||
| Net Increase in Net Assets Resulting From Operations | $ | 1,026,319,575 |
| 46 | See Notes to Financial Statements. |
Statements of Changes in Net Assets
| INCREASE (DECREASE) IN NET ASSETS | For the Year Ended December 31, 2016 | For the Year Ended December 31, 2015 | ||||||
| Operations: | ||||||||
| Net investment income | $ | 398,946,800 | $ | 372,825,843 | ||||
| Net realized loss on investments, futures contracts,swaps and foreign currency related transactions | (55,910,534 | ) | (98,375,192 | ) | ||||
| Net change in unrealized appreciation/depreciation on investments, futures contracts, swaps and translation of assets and liabilities denominated in foreign currencies | 683,283,309 | (431,336,953 | ) | |||||
| Net increase (decrease) in net assets resulting from operations | 1,026,319,575 | (156,886,302 | ) | |||||
| Distributions to shareholders from: | ||||||||
| Net investment income | ||||||||
| Class A | (202,958,531 | ) | (203,135,407 | ) | ||||
| Class B | (2,669,102 | ) | (3,814,136 | ) | ||||
| Class C | (78,131,329 | ) | (77,242,195 | ) | ||||
| Class F | (100,963,267 | ) | (89,080,739 | ) | ||||
| Class I | (22,510,046 | ) | (21,509,682 | ) | ||||
| Class P | (1,680,830 | ) | (1,780,961 | ) | ||||
| Class R2 | (192,330 | ) | (167,864 | ) | ||||
| Class R3 | (5,148,892 | ) | (4,352,757 | ) | ||||
| Class R4 | (38,962 | ) | (2,155 | ) | ||||
| Class R5 | (4,507 | ) | (230 | ) | ||||
| Class R6 | (632,947 | ) | (136,375 | ) | ||||
| Net realized gain | ||||||||
| Class A | – | (34,162,619 | ) | |||||
| Class B | – | (748,752 | ) | |||||
| Class C | – | (15,199,755 | ) | |||||
| Class F | – | (15,303,345 | ) | |||||
| Class I | – | (2,989,643 | ) | |||||
| Class P | – | (294,380 | ) | |||||
| Class R2 | – | (27,899 | ) | |||||
| Class R3 | – | (790,263 | ) | |||||
| Class R4 | – | (74 | ) | |||||
| Class R5 | – | (74 | ) | |||||
| Class R6 | – | (74 | ) | |||||
| Total distributions to shareholders | (414,930,743 | ) | (470,739,379 | ) | ||||
| Capital share transactions (Net of share conversions) (See Note 14): | ||||||||
| Net proceeds from sales of shares | 2,510,035,667 | 2,964,164,404 | ||||||
| Reinvestment of distributions | 356,631,746 | 403,973,062 | ||||||
| Cost of shares reacquired | (2,604,289,141 | ) | (3,264,686,299 | ) | ||||
| Net increase in net assets resulting from capital share transactions | 262,378,272 | 103,451,167 | ||||||
| Net increase (decrease) in net assets | 873,767,104 | (524,174,514 | ) | |||||
| NET ASSETS: | ||||||||
| Beginning of year | $ | 8,581,323,822 | $ | 9,105,498,336 | ||||
| End of year | $ | 9,455,090,926 | $ | 8,581,323,822 | ||||
| Undistributed net investment income | $ | 22,184,610 | $ | 23,055,113 | ||||
| See Notes to Financial Statements. | 47 |
| Per Share Operating Performance: | ||||||||||||||||||||||||||||
| Investment operations: | Distributions to shareholders from: | |||||||||||||||||||||||||||
| Net asset value, beginning of period | Net invest- ment income(a) | Net realized and unrealized gain (loss) | Total from invest- ment oper- ations | Net investment income | Net realized gain | Total distri- butions | ||||||||||||||||||||||
| Class A | ||||||||||||||||||||||||||||
| 12/31/2016 | $ | 7.40 | $ | 0.35 | $ | 0.54 | $ | 0.89 | $ | (0.36 | ) | $ | – | $ | (0.36 | ) | ||||||||||||
| 12/31/2015 | 7.93 | 0.32 | (0.44 | ) | (0.12 | ) | (0.35 | ) | (0.06 | ) | (0.41 | ) | ||||||||||||||||
| 12/31/2014 | 8.15 | 0.37 | – | (c) | 0.37 | (0.39 | ) | (0.20 | ) | (0.59 | ) | |||||||||||||||||
| 12/31/2013 | 8.14 | 0.42 | 0.19 | 0.61 | (0.43 | ) | (0.17 | ) | (0.60 | ) | ||||||||||||||||||
| 12/31/2012 | 7.63 | 0.47 | 0.51 | 0.98 | (0.47 | ) | – | (0.47 | ) | |||||||||||||||||||
| Class B | ||||||||||||||||||||||||||||
| 12/31/2016 | 7.43 | 0.29 | 0.54 | 0.83 | (0.30 | ) | – | (0.30 | ) | |||||||||||||||||||
| 12/31/2015 | 7.95 | 0.26 | (0.43 | ) | (0.17 | ) | (0.29 | ) | (0.06 | ) | (0.35 | ) | ||||||||||||||||
| 12/31/2014 | 8.18 | 0.31 | (0.01 | ) | 0.30 | (0.33 | ) | (0.20 | ) | (0.53 | ) | |||||||||||||||||
| 12/31/2013 | 8.17 | 0.37 | 0.19 | 0.56 | (0.38 | ) | (0.17 | ) | (0.55 | ) | ||||||||||||||||||
| 12/31/2012 | 7.66 | 0.42 | 0.51 | 0.93 | (0.42 | ) | – | (0.42 | ) | |||||||||||||||||||
| Class C | ||||||||||||||||||||||||||||
| 12/31/2016 | 7.42 | 0.30 | 0.55 | 0.85 | (0.32 | ) | – | (0.32 | ) | |||||||||||||||||||
| 12/31/2015 | 7.95 | 0.27 | (0.44 | ) | (0.17 | ) | (0.30 | ) | (0.06 | ) | (0.36 | ) | ||||||||||||||||
| 12/31/2014 | 8.17 | 0.32 | – | (c) | 0.32 | (0.34 | ) | (0.20 | ) | (0.54 | ) | |||||||||||||||||
| 12/31/2013 | 8.16 | 0.37 | 0.19 | 0.56 | (0.38 | ) | (0.17 | ) | (0.55 | ) | ||||||||||||||||||
| 12/31/2012 | 7.65 | 0.42 | 0.51 | 0.93 | (0.42 | ) | – | (0.42 | ) | |||||||||||||||||||
| Class F | ||||||||||||||||||||||||||||
| 12/31/2016 | 7.39 | 0.36 | 0.54 | 0.90 | (0.37 | ) | – | (0.37 | ) | |||||||||||||||||||
| 12/31/2015 | 7.91 | 0.33 | (0.44 | ) | (0.11 | ) | (0.35 | ) | (0.06 | ) | (0.41 | ) | ||||||||||||||||
| 12/31/2014 | 8.14 | 0.38 | (0.01 | ) | 0.37 | (0.40 | ) | (0.20 | ) | (0.60 | ) | |||||||||||||||||
| 12/31/2013 | 8.13 | 0.44 | 0.19 | 0.63 | (0.45 | ) | (0.17 | ) | (0.62 | ) | ||||||||||||||||||
| 12/31/2012 | 7.62 | 0.49 | 0.51 | 1.00 | (0.49 | ) | – | (0.49 | ) | |||||||||||||||||||
| Class I | ||||||||||||||||||||||||||||
| 12/31/2016 | 7.36 | 0.36 | 0.55 | 0.91 | (0.38 | ) | – | (0.38 | ) | |||||||||||||||||||
| 12/31/2015 | 7.89 | 0.34 | (0.45 | ) | (0.11 | ) | (0.36 | ) | (0.06 | ) | (0.42 | ) | ||||||||||||||||
| 12/31/2014 | 8.11 | 0.38 | – | (c) | 0.38 | (0.40 | ) | (0.20 | ) | (0.60 | ) | |||||||||||||||||
| 12/31/2013 | 8.10 | 0.45 | 0.19 | 0.64 | (0.46 | ) | (0.17 | ) | (0.63 | ) | ||||||||||||||||||
| 12/31/2012 | 7.60 | 0.49 | 0.51 | 1.00 | (0.50 | ) | – | (0.50 | ) | |||||||||||||||||||
| Class P | ||||||||||||||||||||||||||||
| 12/31/2016 | 7.57 | 0.35 | 0.56 | 0.91 | (0.37 | ) | – | (0.37 | ) | |||||||||||||||||||
| 12/31/2015 | 8.10 | 0.33 | (0.45 | ) | (0.12 | ) | (0.35 | ) | (0.06 | ) | (0.41 | ) | ||||||||||||||||
| 12/31/2014 | 8.33 | 0.38 | (0.01 | ) | 0.37 | (0.40 | ) | (0.20 | ) | (0.60 | ) | |||||||||||||||||
| 12/31/2013 | 8.31 | 0.44 | 0.20 | 0.64 | (0.45 | ) | (0.17 | ) | (0.62 | ) | ||||||||||||||||||
| 12/31/2012 | 7.79 | 0.48 | 0.52 | 1.00 | (0.48 | ) | – | (0.48 | ) | |||||||||||||||||||
| 48 | See Notes to Financial Statements. |
| Ratios to Average Net Assets: | Supplemental Data: | |||||||||||||||||||||
| Net asset value, end of period | Total return(b) (%) | Total expenses (%) | Net investment income (%) | Net assets, end of period (000) | Portfolio turnover rate (%) | |||||||||||||||||
| $ | 7.93 | 12.35 | 0.81 | 4.57 | $ | 4,263,801 | 119.02 | |||||||||||||||
| 7.40 | (1.74 | ) | 0.82 | 4.10 | 4,183,669 | 118.51 | ||||||||||||||||
| 7.93 | 4.51 | 0.86 | 4.50 | 4,524,711 | 87.69 | |||||||||||||||||
| 8.15 | 7.78 | 0.96 | 5.16 | 4,784,258 | 43.16 | |||||||||||||||||
| 8.14 | 13.22 | 0.96 | 5.88 | 4,850,567 | 45.87 | |||||||||||||||||
| 7.96 | 11.44 | 1.62 | 3.79 | 51,642 | 119.02 | |||||||||||||||||
| 7.43 | (2.38 | ) | 1.62 | 3.31 | 80,073 | 118.51 | ||||||||||||||||
| 7.95 | 3.61 | 1.62 | 3.78 | 126,256 | 87.69 | |||||||||||||||||
| 8.18 | 7.08 | 1.61 | 4.53 | 166,433 | 43.16 | |||||||||||||||||
| 8.17 | 12.47 | 1.61 | 5.25 | 225,154 | 45.87 | |||||||||||||||||
| 7.95 | 11.63 | 1.44 | 3.95 | 1,892,905 | 119.02 | |||||||||||||||||
| 7.42 | (2.35 | ) | 1.46 | 3.48 | 1,882,589 | 118.51 | ||||||||||||||||
| 7.95 | 3.85 | 1.50 | 3.86 | 2,082,896 | 87.69 | |||||||||||||||||
| 8.17 | 7.08 | 1.61 | 4.52 | 1,986,431 | 43.16 | |||||||||||||||||
| 8.16 | 12.47 | 1.61 | 5.23 | 2,051,198 | 45.87 | |||||||||||||||||
| 7.92 | 12.46 | 0.71 | 4.65 | 2,607,811 | 119.02 | |||||||||||||||||
| 7.39 | (1.53 | ) | 0.72 | 4.20 | 1,893,642 | 118.51 | ||||||||||||||||
| 7.91 | 4.53 | 0.72 | 4.59 | 1,817,781 | 87.69 | |||||||||||||||||
| 8.14 | 8.05 | 0.71 | 5.40 | 1,118,411 | 43.16 | |||||||||||||||||
| 8.13 | 13.50 | 0.71 | 6.11 | 1,047,325 | 45.87 | |||||||||||||||||
| 7.89 | 12.62 | 0.61 | 4.77 | 450,661 | 119.02 | |||||||||||||||||
| 7.36 | (1.59 | ) | 0.62 | 4.28 | 382,854 | 118.51 | ||||||||||||||||
| 7.89 | 4.76 | 0.62 | 4.68 | 393,851 | 87.69 | |||||||||||||||||
| 8.11 | 8.16 | 0.61 | 5.48 | 345,614 | 43.16 | |||||||||||||||||
| 8.10 | 13.49 | 0.62 | 6.25 | 230,006 | 45.87 | |||||||||||||||||
| 8.11 | 12.27 | 0.87 | 4.53 | 36,825 | 119.02 | |||||||||||||||||
| 7.57 | (1.66 | ) | 0.87 | 4.06 | 35,632 | 118.51 | ||||||||||||||||
| 8.10 | 4.39 | 0.87 | 4.51 | 44,078 | 87.69 | |||||||||||||||||
| 8.33 | 7.92 | 0.91 | 5.23 | 79,051 | 43.16 | |||||||||||||||||
| 8.31 | 13.21 | 0.96 | 5.88 | 99,968 | 45.87 | |||||||||||||||||
| See Notes to Financial Statements. | 49 |
Financial Highlights (concluded)
| Per Share Operating Performance: | ||||||||||||||||||||||||||||
| Investment operations: | Distributions to shareholders from: | |||||||||||||||||||||||||||
| Net asset value, beginning of period | Net invest- ment income(a) | Net realized and unrealized gain (loss) | Total from invest- ment oper- ations | Net investment income | Net realized gain | Total distri- butions | ||||||||||||||||||||||
| Class R2 | ||||||||||||||||||||||||||||
| 12/31/2016 | $ | 7.40 | $ | 0.31 | $ | 0.55 | $ | 0.86 | $ | (0.33 | ) | $ | – | $ | (0.33 | ) | ||||||||||||
| 12/31/2015 | 7.93 | 0.29 | (0.44 | ) | (0.15 | ) | (0.32 | ) | (0.06 | ) | (0.38 | ) | ||||||||||||||||
| 12/31/2014 | 8.15 | 0.34 | – | (c) | 0.34 | (0.36 | ) | (0.20 | ) | (0.56 | ) | |||||||||||||||||
| 12/31/2013 | 8.14 | 0.40 | 0.19 | 0.59 | (0.41 | ) | (0.17 | ) | (0.58 | ) | ||||||||||||||||||
| 12/31/2012 | 7.63 | 0.45 | 0.52 | 0.97 | (0.46 | ) | – | (0.46 | ) | |||||||||||||||||||
| Class R3 | ||||||||||||||||||||||||||||
| 12/31/2016 | 7.39 | 0.32 | 0.55 | 0.87 | (0.34 | ) | – | (0.34 | ) | |||||||||||||||||||
| 12/31/2015 | 7.91 | 0.30 | (0.44 | ) | (0.14 | ) | (0.32 | ) | (0.06 | ) | (0.38 | ) | ||||||||||||||||
| 12/31/2014 | 8.14 | 0.35 | (0.01 | ) | 0.34 | (0.37 | ) | (0.20 | ) | (0.57 | ) | |||||||||||||||||
| 12/31/2013 | 8.13 | 0.41 | 0.19 | 0.60 | (0.42 | ) | (0.17 | ) | (0.59 | ) | ||||||||||||||||||
| 12/31/2012 | 7.62 | 0.45 | 0.52 | 0.97 | (0.46 | ) | – | (0.46 | ) | |||||||||||||||||||
| Class R4 | ||||||||||||||||||||||||||||
| 12/31/2016 | 7.40 | 0.34 | 0.55 | 0.89 | (0.36 | ) | – | (0.36 | ) | |||||||||||||||||||
| 6/30/2015 to 12/31/2015(d) | 7.99 | 0.16 | (0.52 | ) | (0.36 | ) | (0.17 | ) | (0.06 | ) | (0.23 | ) | ||||||||||||||||
| Class R5 | ||||||||||||||||||||||||||||
| 12/31/2016 | 7.36 | 0.21 | 0.67 | 0.88 | (0.38 | ) | – | (0.38 | ) | |||||||||||||||||||
| 6/30/2015 to 12/31/2015(d) | 7.95 | 0.17 | (0.52 | ) | (0.35 | ) | (0.18 | ) | (0.06 | ) | (0.24 | ) | ||||||||||||||||
| Class R6 | ||||||||||||||||||||||||||||
| 12/31/2016 | 7.37 | 0.37 | 0.53 | 0.90 | (0.38 | ) | – | (0.38 | ) | |||||||||||||||||||
| 6/30/2015 to 12/31/2015(d) | 7.95 | 0.17 | (0.51 | ) | (0.34 | ) | (0.18 | ) | (0.06 | ) | (0.24 | ) | ||||||||||||||||
| (a) | Calculated using average shares outstanding during the period. |
| (b) | Total return for classes A, B and C does not consider the effects of sales loads and assumes the reinvestment of all distributions. Total return for all other classes assumes the reinvestment of all distributions. |
| (c) | Amount is less than $0.01. |
| (d) | Commenced on June 30, 2015. |
| (e) | Not annualized. |
| (f) | Annualized. |
| 50 | See Notes to Financial Statements. |
| Ratios to Average Net Assets: | Supplemental Data: | |||||||||||||||||||||
| Net asset value, end of period | Total return(b) (%) | Total expenses (%) | Net investment income (%) | Net assets, end of period (000) | Portfolio turnover rate (%) | |||||||||||||||||
| $ | 7.93 | 11.91 | 1.21 | 4.05 | $ | 5,324 | 119.02 | |||||||||||||||
| 7.40 | (2.13 | ) | 1.22 | 3.71 | 4,075 | 118.51 | ||||||||||||||||
| 7.93 | 4.15 | 1.22 | 4.13 | 4,557 | 87.69 | |||||||||||||||||
| 8.15 | 7.52 | 1.21 | 4.92 | 3,442 | 43.16 | |||||||||||||||||
| 8.14 | 12.94 | 1.21 | 5.62 | 2,624 | 45.87 | |||||||||||||||||
| 7.92 | 12.03 | 1.11 | 4.19 | 128,317 | 119.02 | |||||||||||||||||
| 7.39 | (1.91 | ) | 1.12 | 3.82 | 107,581 | 118.51 | ||||||||||||||||
| 7.91 | 4.13 | 1.10 | 4.24 | 111,368 | 87.69 | |||||||||||||||||
| 8.14 | 7.63 | 1.11 | 5.01 | 85,119 | 43.16 | |||||||||||||||||
| 8.13 | 13.07 | 1.11 | 5.73 | 69,100 | 45.87 | |||||||||||||||||
| 7.93 | 12.29 | 0.86 | 4.40 | 2,072 | 119.02 | |||||||||||||||||
| 7.40 | (4.59 | )(e) | 0.87 | (f) | 4.27 | (f) | 207 | 118.51 | ||||||||||||||
| 7.86 | 12.62 | 0.61 | 2.70 | 386 | 119.02 | |||||||||||||||||
| 7.36 | (4.50 | )(e) | 0.62 | (f) | 4.39 | (f) | 10 | 118.51 | ||||||||||||||
| 7.89 | 12.56 | 0.53 | 4.83 | 15,346 | 119.02 | |||||||||||||||||
| 7.37 | (4.36 | )(e) | 0.54 | (f) | 4.49 | (f) | 10,994 | 118.51 | ||||||||||||||
| See Notes to Financial Statements. | 51 |
| 1. | ORGANIZATION |
Lord Abbett Bond-Debenture Fund, Inc. (the “Fund”) is registered under the Investment Company Act of 1940, as amended (the “Act”), as a diversified, open-end management investment company. The Fund was organized in 1970 and incorporated under Maryland law on January 23, 1976.
The Fund’s investment objective is to seek high current income and the opportunity for capital appreciation to produce a high total return. The Fund has eleven classes of shares: Class A, B, C, F, I, P, R2, R3, R4, R5 and R6, each with different expenses and dividends. A front-end sales charge is normally added to the net asset value (“NAV”) for Class A shares. There is no front-end sales charge in the case of Class B, C, F, I, P, R2, R3, R4, R5 and R6 shares, although there may be a contingent deferred sales charge (“CDSC”) in certain cases as follows: Class A shares purchased without a sales charge and redeemed before the first day of the month in which the one-year anniversary of the purchase falls (subject to certain exceptions as set forth in the Fund’s prospectus); Class B shares redeemed before the sixth anniversary of purchase; and Class C shares redeemed before the first anniversary of purchase. Class B shares will automatically convert to Class A shares on the 25th day of the month (or, if the 25th day is not a business day, the next business day thereafter) following the eighth anniversary of the day on which the purchase order was accepted. The Fund no longer issues Class B shares for purchase. The Fund’s Class P shares are closed to substantially all investors, with certain exceptions as set forth in the Fund’s prospectus.
The preparation of the financial statements in conformity with accounting principles generally accepted in the United States of America (“U.S. GAAP”) requires management to make certain estimates and assumptions that affect the reported amounts of assets and liabilities and disclosure of contingent assets and liabilities at the date of the financial statements and the reported amounts of increases and decreases in net assets from operations during the reporting period. Actual results could differ from those estimates. The Fund is considered an investment company under U.S. GAAP and follows the accounting and reporting guidance applicable to investment companies.
| 2. | SIGNIFICANT ACCOUNTING POLICIES |
| (a) | Investment Valuation–Under procedures approved by the Fund’s Board of Directors (the “Board”), Lord, Abbett & Co. LLC (“Lord Abbett”), the Fund’s investment manager, has formed a Pricing Committee to administer the pricing and valuation of portfolio investments and to ensure that prices utilized reasonably reflect fair value. Among other things, these procedures allow the Fund to utilize independent pricing services, quotations from securities and financial instrument dealers and other market sources to determine fair value. | |
| Securities actively traded on any recognized U.S. or non-U.S. exchange or on The NASDAQ Stock Market LLC are valued at the last sale price or official closing price on the exchange or system on which they are principally traded. Events occurring after the close of trading on non-U.S. exchanges may result in adjustments to the valuation of foreign securities to reflect their fair value as of the close of regular trading on the New York Stock Exchange. The Fund may utilize an independent fair valuation service in adjusting the valuations of foreign securities. Unlisted equity securities are valued at the last quoted sale price or, if no sale price is available, at the mean between the most recently quoted bid and asked prices. Fixed income securities are valued based on evaluated prices supplied by independent pricing services, which reflect broker/dealer supplied valuations and the independent pricing services’ own electronic data processing techniques. Floating rate loans are valued at the average of bid and ask quotations obtained from dealers in loans on the basis of prices supplied by independent | ||
| 52 |
Notes to Financial Statements (continued)
| pricing services. Exchange traded options and futures contracts are valued at the last sale price in the market where they are principally traded. If no sale has occurred, the mean between the most recently quoted bid and asked prices is used. Forward foreign currency exchange contracts are valued using daily forward exchange rates. Swaps are valued daily using independent pricing services or quotations from broker/dealers to the extent available. | |
| Securities for which prices are not readily available are valued at fair value as determined by the Pricing Committee. The Pricing Committee considers a number of factors, including observable and unobservable inputs, when arriving at fair value. The Pricing Committee may use related or comparable assets or liabilities, recent transactions, market multiples, book values, yield curves, broker quotes, observable trading activity, option adjusted spread models and other relevant information to determine the fair value of portfolio investments. The Board or a designated committee thereof regularly reviews fair value determinations made by the Pricing Committee and employs techniques such as reviewing related market activity, reviewing inputs and assumptions, and retrospectively comparing prices of subsequent purchases and sales transactions to fair value determinations made by the Pricing Committee. | |
| Short-term securities with 60 days or less remaining to maturity are valued using the amortized cost method, which approximates fair value. | |
| (b) | Security Transactions–Security transactions are recorded as of the date that the securities are purchased or sold (trade date). Realized gains and losses on sales of portfolio securities are calculated using the identified-cost method. Realized and unrealized gains (losses) are allocated to each class of shares based upon the relative proportion of net assets at the beginning of the day. |
| (c) | Investment Income–Dividend income is recorded on the ex-dividend date. Interest income is recorded on the accrual basis as earned. Discounts are accreted and premiums are amortized using the effective interest method and are included in Interest and other income on the Statement of Operations. Withholding taxes on foreign dividends and interest have been provided for in accordance with the applicable country’s tax rules and rates. Investment income is allocated to each class of shares based upon the relative proportion of net assets at the beginning of the day. |
| (d) | Income Taxes–It is the policy of the Fund to meet the requirements of Subchapter M of the Internal Revenue Code applicable to regulated investment companies and to distribute substantially all taxable income and capital gains to its shareholders. Therefore, no income tax provision is required. |
| The Fund files U.S. federal and various state and local tax returns. No income tax returns are currently under examination. The statute of limitations on the Fund’s filed U.S. federal tax returns remains open for the fiscal years ended December 31, 2013 through December 31, 2016. The statutes of limitations on the Fund’s state and local tax returns may remain open for an additional year depending upon the jurisdiction. | |
| (e) | Expenses–Expenses, excluding class-specific expenses, are allocated to each class of shares based upon the relative proportion of net assets at the beginning of the day. Class A, B, C, F, P, R2, R3 and R4 shares bear their class-specific share of all expenses and fees relating to the Fund’s 12b-1 Distribution Plan. |
| 53 |
Notes to Financial Statements (continued)
| (f) | Foreign Transactions–The books and records of the Fund are maintained in U.S. dollars and transactions denominated in foreign currencies are recorded in the Fund’s records at the rate prevailing when earned or recorded. Asset and liability accounts that are denominated in foreign currencies are adjusted daily to reflect current exchange rates and any unrealized gain (loss) is included in Net change in unrealized appreciation/depreciation on futures contracts, swaps and translation of assets and liabilities denominated in foreign currencies in the Fund’s Statement of Operations. The resultant exchange gains upon settlement of such transactions are included in Net realized loss on futures contracts, swaps and foreign currency related transactions in the Fund’s Statement of Operations. The Fund does not isolate that portion of the results of operations arising as a result of changes in the foreign exchange rates from the changes in market prices of the securities. |
| The Fund uses foreign currency exchange contracts to facilitate transactions in foreign-denominated securities. Losses from these transactions may arise from changes in the value of the foreign currency or if the counterparties do not perform under the contracts’ terms. | |
| (g) | Forward Foreign Currency Exchange Contracts-The Fund may enter into forward foreign currency exchange contracts in order to reduce exposure to changes in foreign currency exchange rates on foreign portfolio holdings, or gain or reduce exposure to foreign currency solely for investment purposes. A forward foreign currency exchange contract is a commitment to purchase or sell a foreign currency at a future date at a negotiated rate. The contracts are valued daily at forward exchange rates and any unrealized gain (loss) is included in Net change in unrealized appreciation/depreciation on futures contracts, swaps and translation of assets and liabilities denominated in foreign currencies in the Fund’s Statement of Operations. The gain (loss) arising from the difference between the U.S. dollar cost of the original contract and the value of the foreign currency in U.S. dollars upon closing of such contracts is included in Net realized loss on futures contracts, swaps and foreign currency related transactions in the Fund’s Statement of Operations. |
| (h) | Futures Contracts–The Fund may purchase and sell futures contracts to enhance returns, to attempt to economically hedge some of its investment risk, or as a substitute position in lieu of holding the underlying asset on which the instrument is based. At the time of entering into a futures transaction, an investor is required to deposit and maintain a specified amount of cash or eligible securities called “initial margin.” Subsequent payments made or received by the Fund called “variation margin” are made on a daily basis as the market price of the futures contract fluctuates. The Fund will record an unrealized gain (loss) based on the amount of variation margin. When a contract is closed, a realized gain (loss) is recorded equal to the difference between the opening and closing value of the contract. |
| (i) | Credit Default Swaps–The Fund may enter into credit default swap contracts in order to hedge credit risk or for speculation purposes. As a seller of a credit default swap contract (“seller of protection”), the Fund is required to pay the notional amount or other agreed-upon value of a referenced debt obligation to the counterparty in the event of a default by or other credit event involving the referenced issuer, obligation or index. In return, the Fund receives from the counterparty a periodic stream of payments over the term of the contract. |
| As a purchaser of a credit default swap contract (“buyer of protection”), the Fund would receive the notional amount or other agreed upon value of a referenced debt obligation from the counterparty in the event of default by or other credit event involving the referenced issuer, |
| 54 |
Notes to Financial Statements (continued)
| obligation or index. In return, the Fund would make periodic payments to the counterparty over the term of the contracts, provided no event of default has occurred. | |
| These credit default swaps may have as a reference obligation corporate or sovereign issuers or credit indexes. These credit indexes are comprised of a basket of securities representing a particular sector of the market. During the period, Bond Debenture Fund entered into credit default swaps based on CMBX indexes, CDX indexes and single issuers, which are comprised of a basket of commercial mortgage-backed securities, a basket of investment grade securities, a basket of emerging markets sovereign issuers and a corporate issuer, respectively. | |
| Credit default swaps are fair valued based upon quotations from counterparties, brokers or market-makers and the change in value, if any, is recorded as an unrealized appreciation or depreciation. For a credit default swap sold by the Fund, payment of the agreed-upon amount made by the Fund in the event of default of the referenced debt obligation is recorded as the cost of the referenced debt obligation purchased/received. For a credit default swap purchased by the Fund, the agreed-upon amount received by the Fund in the event of default of the referenced debt obligation is recorded as proceeds from sale/delivery of the referenced debt obligation and the resulting gain or loss realized on the referenced debt obligation is recorded as such by the Fund. | |
| Any upfront payments made or received upon entering a credit default swap contract would be amortized or accreted over the life of the swap and recorded as realized gains or losses. Collateral, in the form of cash or securities, may be required to be held in segregated accounts with the custodian bank or broker in accordance with the swap agreement. The value and credit rating of each credit default swap where the Fund is the seller of protection, are both measures of the current payment/performance risk of the swap. As the value of the swap changes as a positive or negative percentage of the total notional amount, the payment/performance risk may decrease or increase, respectively. The maximum potential amount of future payments (undiscounted) that the Fund as a seller of protection could be required to make under a credit default swap agreement would be an amount equal to the notional amount of the agreement. These potential amounts would be partially offset by any recovery values of the respective referenced obligations, upfront payments received upon entering into the agreement, or net amounts received from the settlement of buy protection credit default swap agreements entered into by the Fund for the same referenced entity or entities. | |
| Entering into credit default swaps involves credit and market risk. Such risks involve the possibility that there will be no liquid market for these agreements, that the counterparty to the agreements may default on its obligation to perform or disagree as to the meaning of the contractual terms in the agreements, and that there may be unfavorable changes in interest rates, and that Lord Abbett does not correctly predict the creditworthiness of the issuers of the reference obligation on which the credit default swap is based. There was minimal counterparty credit risk to the Fund during the fiscal year end December 31, 2016, since such credit default swaps enter into were traded through a central clearinghouse, which guarantees against default. | |
| (j) | Total Return Swaps–The Fund may enter into total return swap agreements to obtain exposure to a security or market without owning such security or investing directly in that market. The Fund may agree to make payments that are the equivalent of interest in exchange for the right to receive payments equivalent to any appreciation in the value of an underlying security, index or other asset, as well as receive payments equivalent to any distributions made |
| 55 |
Notes to Financial Statements (continued)
| on that asset, over the term of the swap. If the value of the asset underlying a total return swap declines over the term of the swap, the Fund also may be required to pay an amount equal to that decline in value to their counterparty. | |
| (k) | When-Issued, Forward Transactions or To-Be-Announced (“TBA”) Transactions–The Fund may purchase portfolio securities on a when-issued or forward basis. When-issued, forward transactions or TBA transactions involve a commitment by a fund to purchase securities, with payment and delivery (“settlement”) to take place in the future, in order to secure what is considered to be an advantageous price or yield at the time of entering into the transaction. During the period between purchase and settlement, the fair value of the securities will fluctuate and assets consisting of cash and/or marketable securities (normally short-term U.S. Government or U.S. Government sponsored enterprise securities) marked to market daily in an amount sufficient to make payment at settlement will be segregated at the Fund’s custodian in order to pay for the commitment. At the time the Fund makes the commitment to purchase a security on a when-issued basis, it will record the transaction and reflect the liability for the purchase and fair value of the security in determining its NAV. The Fund, generally, has the ability to close out a purchase obligation on or before the settlement date rather than take delivery of the security. Under no circumstances will settlement for such securities take place more than 120 days after the purchase date. |
| (l) | Repurchase Agreements– The Fund may enter into repurchase agreements with respect to securities. A repurchase agreement is a transaction in which a fund acquires a security and simultaneously commits to resell that security to the seller (a bank or securities dealer) at an agreed-upon price on an agreed-upon date. The Fund requires at all times that the repurchase agreement be collateralized by cash, or by securities of the U.S. Government, its agencies, its instrumentalities, or U.S. Government sponsored enterprises having a value equal to, or in excess of, the value of the repurchase agreement (including accrued interest). If the seller of the agreement defaults on its obligation to repurchase the underlying securities at a time when the fair value of these securities has declined, the Fund may incur a loss upon disposition of the securities. |
| (m) | Floating Rate Loans–The Fund may invest in floating rate loans, which usually take the form of loan participations and assignments. Loan participations and assignments are agreements to make money available to U.S. or foreign corporations, partnerships or other business entities (the “Borrower”) in a specified amount, at a specified rate and within a specified time. A loan is typically originated, negotiated and structured by a U.S. or foreign bank, insurance company or other financial institution (the “Agent”) for a group of loan investors (“Loan Investors”). The Agent typically administers and enforces the loan on behalf of the other Loan Investors in the syndicate and may hold any collateral on behalf of the Loan Investors. Such loan participations and assignments are typically senior, secured and collateralized in nature. The Fund records an investment when the Borrower withdraws money and records interest as earned. These loans pay interest at rates which are periodically reset by reference to a base lending rate plus a spread. These base lending rates are generally the prime rate offered by a designated U.S. bank or London InterBank Offered Rate (“LIBOR”). |
| The loans in which the Fund invests may be subject to some restrictions on resale. For example, the Fund may be contractually obligated to receive approval from the Agent and/or Borrower prior to the sale of these investments. The Fund generally has no right to enforce compliance with the terms of the loan agreement with the Borrower. As a result, the Fund assumes the |
| 56 |
Notes to Financial Statements (continued)
| credit risk of the Borrower, the selling participant and any other persons interpositioned between the Fund and the Borrower (“Intermediate Participants”). In the event that the Borrower, selling participant or Intermediate Participants become insolvent or enter into bankruptcy, the Fund may incur certain costs and delays in realizing payment or may suffer a loss of principal and/or interest. | |||
| Unfunded commitments represent the remaining obligation of the Fund to the Borrower. At any point in time, up to the maturity date of the issue, the Borrower may demand the unfunded portion. As of December 31, 2016, the Fund had no unfunded loan commitments. | |||
| (n) | Fair Value Measurements–Fair value is defined as the price that the Fund would receive upon selling an investment or transferring a liability in an orderly transaction to an independent buyer in the principal or most advantageous market of the investment. A three-tier hierarchy is used to maximize the use of observable market data and minimize the use of unobservable inputs and to establish classification of fair value measurements for disclosure purposes. Inputs refer broadly to the assumptions that market participants would use in pricing the asset or liability, including assumptions about risk – for example, the risk inherent in a particular valuation technique used to measure fair value (such as a pricing model) and/or the risk inherent in the inputs to the valuation technique. Inputs may be observable or unobservable. Observable inputs reflect the assumptions market participants would use in pricing the asset or liability. Observable inputs are based on market data obtained from sources independent of the reporting entity. Unobservable inputs reflect the reporting entity’s own assumptions about the assumptions market participants would use in pricing the asset or liability. Unobservable inputs are based on the best information available in the circumstances. The three-tier hierarchy classification is determined based on the lowest level of inputs that is significant to the fair value measurement, and is summarized in the three broad Levels listed below: | ||
| • | Level 1 – | unadjusted quoted prices in active markets for identical investments; | |
| • | Level 2 – | other significant observable inputs (including quoted prices for similar investments, interest rates, prepayment speeds, credit risk, etc.); and | |
| • | Level 3 – | significant unobservable inputs (including the Fund’s own assumptions in determining the fair value of investments). | |
| A summary of inputs used in valuing the Fund’s investments and other financial instruments as of December 31, 2016 and, if applicable, Level 1/Level 2 transfers and Level 3 rollforwards for the fiscal year then ended is included in the Fund’s Schedule of Investments. | |||
| Changes in valuation techniques may result in transfers into or out of an assigned level within the three-tier hierarchy. All transfers between different levels within the three-tier hierarchy are deemed to have occurred as of the beginning of the reporting period. The inputs or methodology used for valuing securities are not necessarily an indication of the risk associated with investing in those securities. | |||
| 3. | MANAGEMENT FEE AND OTHER TRANSACTIONS WITH AFFILIATES |
| Management Fee | ||
| The Fund has a management agreement with Lord Abbett, pursuant to which Lord Abbett supplies the Fund with investment management services and executive and other personnel, provides office space and pays for ordinary and necessary office and clerical expenses relating to research and statistical work and supervision of the Fund’s investment portfolio. | ||
| 57 |
Notes to Financial Statements (continued)
The management fee is based on the Fund’s average daily net assets at the following annual rate:
| First $500 million | .50% |
| Next $9.5 billion | .45% |
| Over $10 billion | .40% |
For the fiscal year ended December 31, 2016, the effective management fee was at an annualized rate of .45% of the Fund’s average daily net assets.
In addition, Lord Abbett provides certain administrative services to the Fund pursuant to an Administrative Services Agreement in return for a fee at an annual rate of .04% of the Fund’s average daily net assets.
12b-1 Distribution Plan
The Fund has adopted a distribution plan with respect to Class A, B, C, F, P, R2, R3, and R4 shares pursuant to Rule 12b-1 under the Act, which provides for the payment of ongoing distribution and service fees to Lord Abbett Distributor LLC (the “Distributor”), an affiliate of Lord Abbett. The following annual rates have been authorized by the Board pursuant to the plan:
| Fees* | Class A | Class B | Class C(1) | Class F(2) | Class P | Class R2 | Class R3 | Class R4 |
| Service | .15% | .25% | .25% | – | .25% | .25% | .25% | .25% |
| Distribution | .05% | .75% | .75% | .10% | .20% | .35% | .25% | – |
| * | The Fund may designate a portion of the aggregate fee as attributable to service activities for purposes of calculating Financial Industry Regulatory Authority, Inc. (“FINRA”) sales charge limitations. |
| (1) | The Rule 12b-1 fee the Fund pays on Class C shares is a blended rate based on 1.00% of the Fund’s average daily net assets attributable to Class C shares held for less than one year and .80% (.25% service, .55% distribution) of the Fund’s average daily net assets attributable to Class C shares held for one year or more. All Class C shareholders of the Fund will bear Rule 12b-1 fees at the same rate. |
| (2) | The Class F share Rule 12b-1 fee may be designated as a service fee in limited circumstances as described in the Fund’s prospectus. |
Class I, R5 and R6 shares do not have a distribution plan.
Commissions
Distributor received the following commissions on sales of shares of the Fund, after concessions were paid to authorized dealers, for the fiscal year ended December 31, 2016:
| Distributor | Dealers’ |
| Commissions | Concessions |
| $418,908 | $2,825,844 |
Distributor received CDSCs of $73,028 and $146,273 for Class A and Class C shares, respectively, for the fiscal year ended December 31, 2016.
Two Directors and certain of the Fund’s officers have an interest in Lord Abbett.
| 4. | DISTRIBUTIONS AND CAPITAL LOSS CARRYFORWARDS |
| Dividends from net investment income, if any, are declared daily and paid monthly. Taxable net realized gains from investment transactions, reduced by allowable capital loss carryforwards, if any, are declared and distributed to shareholders at least annually. The capital loss carryforward amount, if any, is available to offset future net capital gains. Dividends and distributions to shareholders are recorded on the ex-dividend date. The amounts of dividends and distributions from net investment income and net realized capital gains are determined in accordance with federal income tax regulations, which may differ from accounting principles generally accepted in the United States | |
| 58 |
Notes to Financial Statements (continued)
of America. These book/tax differences are either considered temporary or permanent in nature. To the extent these differences are permanent in nature, such amounts are reclassified within the components of net assets based on their federal tax basis treatment; temporary differences do not require reclassification. Dividends and distributions, which exceed earnings and profits for tax purposes, are reported as a tax return of capital.
The tax character of distributions paid during the fiscal years ended December 31, 2016 and 2015 was as follows:
| Year Ended | Year Ended | |||||||
| 12/31/2016 | 12/31/2015 | |||||||
| Distributions paid from: | ||||||||
| Ordinary income | $ | 414,930,743 | $ | 404,420,206 | ||||
| Net long-term capital gains | – | 66,319,173 | ||||||
| Total distributions paid | $ | 414,930,743 | $ | 470,739,379 | ||||
As of December 31, 2016, the components of accumulated gains on a tax-basis were as follows:
| Undistributed ordinary income – net | $ | 24,019,495 | ||
| Total undistributed earnings | 24,019,495 | |||
| Capital loss carryforwards* | (181,364,446 | ) | ||
| Temporary differences | (1,834,885 | ) | ||
| Unrealized gains – net | 289,747,508 | |||
| Total accumulated gains – net | $ | 130,567,672 |
| * | The capital losses will caryforward indefintely |
As of December 31, 2016, the aggregate unrealized security gains and losses based on cost for U.S. federal income tax purposes were as follows:
| Tax cost | $ | 9,026,493,146 | ||
| Gross unrealized gain | 472,832,459 | |||
| Gross unrealized loss | (179,063,804 | ) | ||
| Net unrealized security gain | $ | 293,768,655 |
The difference between book-basis and tax-basis unrealized gains (losses) is attributable to the tax treatment of amortization of premium, and wash sales.
Permanent items identified during the fiscal year ended December 31, 2016 have been reclassified among the components of net assets based on their tax basis treatment as follows:
| Undistributed | Accumulated | |||||
| Net Investment | Net Realized | |||||
| Income | Loss | |||||
| $15,113,440 | $(15,113,440 | ) | ||||
The permanent differences are attributable to the tax treatment of premium amortization, certain securities, certain distributions received and foreign currency transactions.
| 59 |
Notes to Financial Statements (continued)
| 5. | PORTFOLIO SECURITIES TRANSACTIONS |
Purchases and sales of investment securities (excluding short-term investments) for the fiscal year ended December 31, 2016 were as follows:
| U.S. | Non-U.S. | U.S. | Non-U.S. |
| Government | Government | Government | Government |
| Purchases | Purchases | Sales | Sales |
| $1,772,412,262 | $8,891,936,659 | $1,775,249,480 | $8,731,027,451 |
The Fund is permitted to purchase and sell securities (“cross-trade”) from and to other Lord Abbett funds or client accounts pursuant to procedures approved by the Board in compliance with Rule 17a-7 under the Act (the “Rule”). Each cross-trade is executed at a fair market price in compliance with provisions of the Rule. For the period ended December 31, 2016, the Fund engaged in cross-trade purchases of $4,312,125 and sales of $103,739,451, which resulted in net realized losses of $2,483,913.
| 6. | DISCLOSURES ABOUT DERIVATIVE INSTRUMENTS AND HEDGING ACTIVITIES |
The Fund entered into forward foreign currency exchange contracts for the fiscal year ended December 31, 2016 (as described in note 2(g)). A forward foreign currency exchange contract reduces the Fund’s exposure to changes in the value of the currency it will deliver (or settle in cash) and increases its exposure to changes in the value of the currency it will receive (or settle in cash) for the duration of the contract. The Fund’s use of forward foreign currency exchange contracts involves the risk that Lord Abbett will not accurately predict currency movements, and the Fund’s returns could be reduced as a result. Forward foreign currency exchange contracts are subject to the risk that those currencies will decline in value relative to the U.S. dollar, or, in the case of hedged positions, that the U.S. dollar will decline relative to the currency being hedged. Currency rates in foreign countries may fluctuate significantly over short periods of time. The Fund’s risk of loss from counterparty credit risk is the unrealized appreciation on forward foreign currency exchange contracts.
The Fund entered into E-Mini S&P 500 Index futures contracts for the year ended December 31, 2016 (as described in note 2(h)) to manage cash. The Fund bear the risk that the underlying index will move unexpectedly, in which case the Fund may realize a loss. There is minimal counterparty credit risk to the Fund since futures are exchange traded and the exchange’s clearinghouse, as counterparty to all exchange traded futures, guarantees futures against default.
The Fund entered into U.S. Treasury futures contracts for the fiscal year ended December 31, 2016 (as described in note 2(h)) to economically hedge against changes in interest rates. The Fund bears the risk of interest rates moving unexpectedly, in which case the Fund may not achieve the anticipated benefits of the futures contracts and realize a loss. There is minimal counterparty credit risk to the Fund since futures are exchange traded and the exchange’s clearinghouse, as counterparty to all exchange traded futures, guarantees futures against default.
The Fund entered into centrally cleared credit default swaps on indexes during the fiscal year ended December 31, 2016 (as described in note 2(i)) to economically hedge credit risk. Centrally cleared credit default swaps on indexes involve the exchange of a fixed rate premium for protection against the loss in value of underlying securities within an index in the event of a defined credit event, such as payment default or bankruptcy. Under a credit default swap one party acts as a guarantor by receiving the fixed periodic payment in exchange for the commitment to purchase the underlying security at par if the defined credit event occurs. Upon the occurrence of a defined credit event, the difference between the value of the reference obligation and the swap’s notional amount is recorded as realized gain or loss on swap transactions in the Statements of Operations. There is
| 60 |
Notes to Financial Statements (continued)
minimal counterparty credit risk to the Funds since these credit default swaps are traded through a central clearinghouse. As a counterparty to all centrally cleared credit default swaps, the clearinghouse guarantees credit default swaps against default.
As of December 31, 2016, the Fund had the following derivatives at fair value, grouped into appropriate risk categories that illustrate the Fund’s use of derivative instruments:
| Foreign | ||||||||||||
| Interest Rate | Currency | Credit | ||||||||||
| Asset Derivatives | Contracts | Contracts | Contracts | |||||||||
| Forward Foreign Currency Exchange Contracts(1) | – | $ | 1,741,808 | – | ||||||||
| Futures Contracts(2) | $ | 12,481,520 | – | – | ||||||||
| Liability Derivatives | ||||||||||||
| Centrally Cleared Credit Default Swaps(3) | – | – | $ | 3,960,280 | ||||||||
| Futures Contracts(2) | $ | 1,784,692 | – | – | ||||||||
| Forward Foreign Currency Exchange Contracts(4) | – | $ | 691,378 | – | ||||||||
| (1) | Statements of Assets and Liabilities location: Unrealized appreciation on forward foreign currency exchange contracts. |
| (2) | Statements of Assets and Liabilities location: Includes cumulative unrealized appreciation/depreciation of futures contracts as reported in the Schedule of Investments. Only current day’s variation margin is reported within the Statements of Assets and Liabilities. |
| (3) | Statements of Assets and Liabilities location: Includes cumulative unrealized appreciation/depreciation of centrally cleared credit default swap contracts as reported in the Schedule of Investments. Only current day’s variation margin is reported within the Statements of Assets and Liabilities. |
| (4) | Statements of Assets and Liabilities location: Unrealized depreciation on forward foreign currency exchange contracts. |
Transactions in derivative instruments for the year ended December 31, 2016, were as follows:
| Foreign | ||||||||||||||||
| Interest Rate | Currency | Credit | Equity | |||||||||||||
| Contracts | Contracts | Contracts | Contracts | |||||||||||||
| Net Realized Gain (Loss)(1) | ||||||||||||||||
| Credit Default Swaps | – | – | $ | (10,351,244 | ) | – | ||||||||||
| Forward Foreign Currency Exchange Contracts | – | $ | 8,084,152 | – | – | |||||||||||
| Futures Contracts | $ | (19,124,293 | ) | – | – | $ | (8,738,857 | ) | ||||||||
| Net Change in Unrealized Appreciation/Depreciation(2) | ||||||||||||||||
| Credit Default Swaps | – | – | $ | (2,533,537 | ) | – | ||||||||||
| Forward Foreign Currency Exchange Contracts | – | $ | (326,467 | ) | – | – | ||||||||||
| Futures Contracts | $ | 10,733,514 | – | – | – | |||||||||||
| Average Number of Contracts/Notional Amounts* | ||||||||||||||||
| Forward Foreign Currency Exchange Contracts(3) | – | $ | 114,285,135 | – | – | |||||||||||
| Credit Default Swaps(3) | – | – | $ | 107,588,308 | – | |||||||||||
| Futures Contracts(4) | 18,011 | – | – | 157 | ||||||||||||
| * | Calculated based on the number of contracts or notional amounts for the fiscal year ended December 31, 2016. |
| (1) | Statements of Operations location: Net realized loss on futures contracts, swaps and foreign currency related transactions. |
| (2) | Statements of Operations location: Net change in unrealized appreciation/depreciation on futures contracts, swaps and translation of assets and liabilities denominated in foreign currencies. |
| (3) | Amount represents notional amounts in U.S. dollars. |
| (4) | Amount represents number of contracts. |
| 61 |
Notes to Financial Statements (continued)
| 7. | DISCLOSURES ABOUT OFFSETTING ASSETS AND LIABILITIES |
The Financial Accounting Standards Board (“FASB”) requires disclosure to help better assess the effect or potential effect of offsetting arrangements on a fund’s financial position. The following tables illustrate gross and net information about recognized assets and liabilities eligible for offset in the statement of assets and liabilities; and disclose such amounts subject to an enforceable master netting agreement or similar agreement, by counterparty. A master netting agreement is an agreement between the Fund and a counterparty which provides for the net settlement of amounts owed under all contracts traded under that agreement, as well as cash collateral, through a single payment by one party to the other in the event of default on or termination of any one contract. The Fund’s accounting policy with respect to balance sheet offsetting is that, absent an event of default by the counterparty or a termination of the agreement, the master netting agreement does not result in an offset of reported amounts of financial assets and liabilities in the statement of assets and liabilities across transactions between the Fund and the applicable counterparty:
| Gross Amounts | Net Amounts of | |||||||||||
| Offset in the | Assets Presented | |||||||||||
| Gross Amounts of | Statement of Assets | in the Statement of | ||||||||||
| Description | Recognized Assets | and Liabilities | Assets and Liabilities | |||||||||
| Forward Foreign Currency Exchange Contracts | $ | 1,741,808 | $ | – | $ | 1,741,808 | ||||||
| Repurchase Agreement | 119,442,771 | – | 119,442,771 | |||||||||
| Total | $ | 121,184,579 | $ | – | $ | 121,184,579 | ||||||
| Net Amounts | ||||||||||||||||||||
| of Assets | Amounts Not Offset in the | |||||||||||||||||||
| Presented in | Statement of Assets and Liabilities | |||||||||||||||||||
| the Statement | Cash | Securities | ||||||||||||||||||
| of Assets and | Financial | Collateral | Collateral | Net | ||||||||||||||||
| Counterparty | Liabilities | Instruments | Received(a) | Received(a) | Amount(b) | |||||||||||||||
| Fixed Income Clearing Corp. | $ | 119,442,771 | $ | – | $ | – | $ | (119,442,771 | ) | $ | – | |||||||||
| J.P. Morgan Chase | 154,823 | (154,823 | ) | – | – | – | ||||||||||||||
| Morgan Stanley | 126,882 | – | – | – | 126,882 | |||||||||||||||
| Standard Chartered Bank | 1,378,066 | (237,743 | ) | (1,140,323 | ) | – | – | |||||||||||||
| State Street Bank and Trust | 82,037 | (57,552 | ) | – | – | 24,485 | ||||||||||||||
| Total | $ | 121,184,579 | $ | (450,118 | ) | $ | (1,140,323 | ) | $ | (119,442,771 | ) | $ | 151,367 | |||||||
| Gross Amounts | Net Amounts of | |||||||||||
| Offset in the | Liabilities Presented | |||||||||||
| Gross Amounts of | Statement of Assets | in the Statement of | ||||||||||
| Description | Recognized Liabilities | and Liabilities | Assets and Liabilities | |||||||||
| Forward Foreign Currency Exchange Contracts | $ | 691,378 | $ | – | $ | 691,378 | ||||||
| Total | $ | 691,378 | $ | – | $ | 691,378 | ||||||
62
Notes to Financial Statements (continued)
| Net Amounts | ||||||||||||||||||||
| of Liabilities | Amounts Not Offset in the | |||||||||||||||||||
| Presented in | Statement of Assets and Liabilities | |||||||||||||||||||
| the Statement | Cash | Securities | ||||||||||||||||||
| of Assets and | Financial | Collateral | Collateral | Net | ||||||||||||||||
| Counterparty | Liabilities | Instruments | Pledged(a) | Pledged(a) | Amount(c) | |||||||||||||||
| J.P. Morgan Chase | $ | 396,083 | $ | (154,823 | ) | $ | – | $ | – | $ | 241,260 | |||||||||
| Standard Chartered Bank | 237,743 | (237,743 | ) | – | – | – | ||||||||||||||
| State Street Bank and Trust | 57,552 | (57,552 | ) | – | – | – | ||||||||||||||
| Total | $ | 691,378 | $ | (450,118 | ) | $ | – | $ | – | $ | 241,260 | |||||||||
| (a) | Collateral disclosed is limited to an amount not to exceed 100% of the net amount of assets (liabilities) presented in the Statement of Assets and Liabilities, for each respective counterparty. |
| (b) | Net amount represents the amount owed to the Fund by the counterparty as of December 31, 2016. |
| (c) | Net amount represents the amount owed by the Fund to the counterparty as of December 31, 2016. |
| 8. | DIRECTORS’ REMUNERATION |
The Fund’s officers and two Directors, who are associated with Lord Abbett, do not receive any compensation from the Fund for serving in such capacities. Independent Directors’ fees are allocated among all Lord Abbett-sponsored funds based on the net assets of each fund. There is an equity-based plan available to all Independent Directors under which Independent Directors must defer receipt of a portion of, and may elect to defer receipt of an additional portion of Directors’ fees. The deferred amounts are treated as though equivalent dollar amounts had been invested in the funds. Such amounts and earnings accrued thereon are included in Directors’ fees on the Statement of Operations and in Directors’ fees payable on the Statement of Assets and Liabilities and are not deductible for U.S. federal income tax purposes until such amounts are paid.
| 9. | EXPENSE REDUCTIONS |
The Fund has entered into an arrangement with its transfer agent and custodian, whereby credits realized as a result of uninvested cash balances are used to reduce a portion of the Fund’s expenses.
| 10. | LINE OF CREDIT |
The Fund and certain other funds managed by Lord Abbett (collectively, the “Participating Funds”) entered into a syndicated line of credit facility with various lenders for $550 million (the “Facility”), whereas State Street Bank and Trust Company (“SSB”) participates as a lender and as agent for the lenders. The Facility is to be used for temporary or emergency purposes as an additional source of liquidity to satisfy redemptions. The Participating Funds are subject to graduated borrowing limits of one-third of Fund assets (if Fund assets are less than $750 million), $250 million, $300 million, or $350 million, based on past borrowings and likelihood of future borrowings. The Facility will continue through August 28, 2017.
During the fiscal year ended December 31, 2016, the Fund did not utilize the Facility.
| 11. | INTERFUND LENDING PROGRAM |
On July 26, 2016, the U.S. Securities and Exchange Commission issued an exemptive order (“SEC exemptive order”) which permits certain registered open-end management investment companies managed by Lord Abbett, including the Fund, to participate in a joint lending and borrowing program (the “Interfund Lending Program”). The SEC exemptive order allows the funds to borrow
63
Notes to Financial Statements (continued)
money from and lend money to each other for temporary or emergency purposes subject to the limitations and conditions.
During the fiscal year ended December 31, 2016, the Fund participated as a lender in the Interfund Lending Program. The average amount loaned and average interest rate were $22,877,428 and 0.725%, respectively. The Fund earned interest of $909, which is included in the Statement of Operations.
There were no interfund loans outstanding as of December 31, 2016.
| 12. | CUSTODIAN AND ACCOUNTING AGENT |
SSB is the Fund’s custodian and accounting agent. SSB performs custodial, accounting and recordkeeping functions relating to portfolio transactions and calculating the Fund’s NAV.
| 13. | INVESTMENT RISKS |
The Fund is subject to the general risks and considerations associated with investing in debt securities. The value of an investment will change as interest rates fluctuate and in response to market movements. When interest rates rise, the prices of debt securities are likely to decline; when rates fall, such prices tend to rise. Longer-term debt securities are usually more sensitive to interest rate changes. There is also the risk that an issuer of a debt security will fail to make timely payments of principal or interest to the Fund, a risk that is greater with high-yield securities (sometimes called “junk bonds”), in which the Fund may substantially invest. Some issuers, particularly of high-yield securities, may default as to principal and/or interest payments after the Fund purchases its securities. A default, or concerns in the market about an increase in risk of default, may result in losses to the Fund. High-yield securities are subject to greater price fluctuations, as well as additional risks.
The mortgage-related securities in which the Fund may invest may be particularly sensitive to changes in prevailing interest rates, and economic conditions, including delinquencies and/or defaults. These changes can affect the value, income and/or liquidity of such positions. When interest rates are declining, the value of these securities with prepayment features may not increase as much as other fixed income securities. Early principal repayment may deprive the Fund of income payments above current market rates. Alternatively, rising interest rates may cause prepayments to occur at a slower-than-expected rate, extending the duration of a security and typically reducing its value. The payment rate will thus affect the price and volatility of a mortgage-related security. In addition, while securities of government sponsored enterprises are guaranteed with respect to the timely payment of interest and principal by the particular enterprise involved, they are not guaranteed by the U.S. Government. In addition, the Fund may invest in non-agency asset backed and mortgage related securities, which are issued by private institutions, not by government-sponsored enterprises.
The Fund may invest a portion of its net assets in equity securities, the value of which fluctuates in response to movements in the equity securities market in general and to the changing prospects of individual companies in which the Fund invests.
The Fund may invest in convertible securities, which have both equity and fixed income risk characteristics. Generally, convertible securities offer lower interest or dividend yields than non-convertible securities of similar quality and less potential for gains or capital appreciation in a rising equity securities market than equity securities. They tend to be more volatile than other fixed income securities and the market for convertible securities may be less liquid than markets for stocks or bonds. A significant portion of convertible securities have below investment grade credit ratings and are subject to increased credit and liquidity risks.
64
Notes to Financial Statements (continued)
Due to the Fund’s investment exposure to foreign companies and American Depositary Receipts, the Fund may experience increased market, liquidity, currency, political, information, and other risks.
The Fund is subject to the risks associated with derivatives, which may be different from and greater than the risks associated with directly investing in securities. Derivatives may be subject to risks such as liquidity risk, leveraging risk, interest rate risk, market risk, and credit risk. Illiquid securities may lower the Fund’s returns since the Fund may be unable to sell these securities at their desired time or price. Derivatives also may involve the risk of mispricing or improper valuation and the risk that changes in the value of the derivative may not correlate perfectly with the value of the underlying asset, rate or index. Whether the Fund’s use of derivatives is successful will depend on, among other things, the Fund’s ability to correctly forecast market movements and other factors. If the Fund incorrectly forecasts these and other factors, the Fund’s performance could suffer. The Fund’s use of derivatives could result in a loss exceeding the amount of the Fund’s investment in these instruments.
The Fund may invest a portion of its net assets in floating rate or adjustable rate senior loans, including bridge loans, novations, assignments, and participations, which are subject to increased credit and liquidity risks. Senior loans are business loans made to borrowers that may be U.S. or foreign corporations, partnerships or other business entities.
These factors can affect the Fund’s performance.
| 14. | SUMMARY OF CAPITAL TRANSACTIONS |
Transactions in shares of beneficial interest were as follows:
| Year Ended | Year Ended | |||||||||||||||
| December 31, 2016 | December 31, 2015 | |||||||||||||||
| Class A Shares | Shares | Amount | Shares | Amount | ||||||||||||
| Shares sold | 96,554,562 | $ | 734,598,779 | 131,246,580 | $ | 1,038,999,088 | ||||||||||
| Converted from Class B* | 2,402,000 | 18,361,615 | 2,265,807 | 17,923,620 | ||||||||||||
| Reinvestment of distributions | 24,156,544 | 185,156,217 | 27,702,794 | 217,958,808 | ||||||||||||
| Shares reacquired | (150,442,185 | ) | (1,152,105,403 | ) | (166,949,861 | ) | (1,311,217,496 | ) | ||||||||
| Decrease | (27,329,079 | ) | $ | (213,988,792 | ) | (5,734,680 | ) | $ | (36,335,980 | ) | ||||||
| Class B Shares | ||||||||||||||||
| Shares sold | 84,284 | $ | 643,460 | 103,957 | $ | 828,858 | ||||||||||
| Reinvestment of distributions | 297,726 | 2,280,954 | 490,984 | 3,885,718 | ||||||||||||
| Shares reacquired | (2,275,205 | ) | (17,467,322 | ) | (3,432,425 | ) | (27,164,015 | ) | ||||||||
| Converted to Class A* | (2,392,780 | ) | (18,361,615 | ) | (2,257,797 | ) | (17,923,620 | ) | ||||||||
| Decrease | (4,285,975 | ) | $ | (32,904,523 | ) | (5,095,281 | ) | $ | (40,373,059 | ) | ||||||
| Class C Shares | ||||||||||||||||
| Shares sold | 30,436,191 | $ | 232,954,193 | 39,131,771 | $ | 309,149,708 | ||||||||||
| Reinvestment of distributions | 8,153,480 | 62,644,241 | 9,311,374 | 73,428,118 | ||||||||||||
| Shares reacquired | (54,095,042 | ) | (414,713,414 | ) | (56,919,000 | ) | (447,972,142 | ) | ||||||||
| Decrease | (15,505,371 | ) | $ | (119,114,980 | ) | (8,475,855 | ) | $ | (65,394,316 | ) | ||||||
| Class F Shares | ||||||||||||||||
| Shares sold | 167,349,652 | $ | 1,287,626,045 | 133,374,158 | $ | 1,052,492,963 | ||||||||||
| Reinvestment of distributions | 10,622,346 | 81,513,913 | 10,571,181 | 82,964,455 | ||||||||||||
| Shares reacquired | (104,714,614 | ) | (792,841,046 | ) | (117,453,182 | ) | (916,632,109 | ) | ||||||||
| Increase | 73,257,384 | $ | 576,298,912 | 26,492,157 | $ | 218,825,309 | ||||||||||
65
Notes to Financial Statements (concluded)
| Year Ended | Year Ended | |||||||||||||||
| December 31, 2016 | December 31, 2015 | |||||||||||||||
| Class I Shares | Shares | Amount | Shares | Amount | ||||||||||||
| Shares sold | 27,732,816 | $ | 205,663,306 | 64,068,084 | $ | 504,809,661 | ||||||||||
| Reinvestment of distributions | 2,288,416 | 17,488,859 | 2,340,442 | 18,322,999 | ||||||||||||
| Shares reacquired | (24,870,064 | ) | (189,440,579 | ) | (64,353,481 | ) | (505,547,445 | ) | ||||||||
| Increase | 5,151,168 | $ | 33,711,586 | 2,055,045 | $ | 17,585,215 | ||||||||||
| Class P Shares | ||||||||||||||||
| Shares sold | 607,662 | $ | 4,792,801 | 416,652 | $ | 3,357,198 | ||||||||||
| Reinvestment of distributions | 213,339 | 1,671,970 | 256,555 | 2,064,006 | ||||||||||||
| Shares reacquired | (985,660 | ) | (7,677,577 | ) | (1,405,736 | ) | (11,301,542 | ) | ||||||||
| Decrease | (164,659 | ) | $ | (1,212,806 | ) | (732,529 | ) | $ | (5,880,338 | ) | ||||||
| Class R2 Shares | ||||||||||||||||
| Shares sold | 311,523 | $ | 2,393,708 | 229,663 | $ | 1,790,094 | ||||||||||
| Reinvestment of distributions | 10,715 | 82,262 | 10,167 | 80,035 | ||||||||||||
| Shares reacquired | (201,119 | ) | (1,514,171 | ) | (264,402 | ) | (2,093,382 | ) | ||||||||
| Increase (decrease) | 121,119 | $ | 961,799 | (24,572 | ) | $ | (223,253 | ) | ||||||||
| Class R3 Shares | ||||||||||||||||
| Shares sold | 4,621,266 | $ | 35,400,805 | 5,226,130 | $ | 40,863,223 | ||||||||||
| Reinvestment of distributions | 670,499 | 5,136,424 | 654,437 | 5,129,497 | ||||||||||||
| Shares reacquired | (3,636,062 | ) | (27,625,886 | ) | (5,398,204 | ) | (42,243,230 | ) | ||||||||
| Increase | 1,655,703 | $ | 12,911,343 | 482,363 | $ | 3,749,490 | ||||||||||
| Class R4 Shares(a) | ||||||||||||||||
| Shares sold | 268,858 | $ | 2,113,597 | 28,138 | $ | 215,663 | ||||||||||
| Reinvestment of distributions | 2,494 | 19,367 | 295 | 2,229 | ||||||||||||
| Shares reacquired | (37,980 | ) | (300,483 | ) | (506 | ) | (3,829 | ) | ||||||||
| Increase | 233,372 | $ | 1,832,481 | 27,927 | $ | 214,063 | ||||||||||
| Class R5 Shares(a) | ||||||||||||||||
| Shares sold | 49,669 | $ | 386,617 | 1,258 | $ | 10,000 | ||||||||||
| Reinvestment of distributions | 578 | 4,507 | 40 | 304 | ||||||||||||
| Shares reacquired | (2,452.00 | ) | (19,220 | ) | – | – | ||||||||||
| Increase | 47,795 | $ | 371,904 | 1,298 | $ | 10,304 | ||||||||||
| Class R6 Shares(a) | ||||||||||||||||
| Shares sold | 447,311 | $ | 3,462,356 | 1,541,823 | $ | 11,647,948 | ||||||||||
| Reinvestment of distributions | 82,747 | 633,032 | 18,201 | 136,893 | ||||||||||||
| Shares reacquired | (77,379 | ) | (584,040 | ) | (67,955 | ) | (511,109 | ) | ||||||||
| Increase | 452,679 | $ | 3,511,348 | 1,492,069 | $ | 11,273,732 | ||||||||||
| * | Automatic conversion of Class B shares occurs on the 25th day of the month (or, if the 25th day is not a business day, the next business day thereafter) following the eighth anniversary of the day on which the purchase order was accepted. |
| (a) | Shares commenced on June 30, 2015. |
66
Report of Independent Registered Public Accounting Firm
To the Shareholders and Board of Directors of Lord Abbett Bond-Debenture Fund, Inc.:
We have audited the accompanying statement of assets and liabilities of Lord Abbett Bond-Debenture Fund, Inc. (the “Fund”), including the schedule of investments, as of December 31, 2016, and the related statement of operations for the year then ended, the statements of changes in net assets for each of the two years in the period then ended, and the financial highlights for each of the periods presented. These financial statements and financial highlights are the responsibility of the Fund’s management. Our responsibility is to express an opinion on these financial statements and financial highlights based on our audits.
We conducted our audits in accordance with the standards of the Public Company Accounting Oversight Board (United States). Those standards require that we plan and perform the audit to obtain reasonable assurance about whether the financial statements and financial highlights are free of material misstatement. The Fund is not required to have, nor were we engaged to perform, an audit of their internal control over financial reporting. Our audits included consideration of internal control over financial reporting as a basis for designing audit procedures that are appropriate in the circumstances, but not for the purpose of expressing an opinion on the effectiveness of the Fund’s internal control over financial reporting. Accordingly, we express no such opinion. An audit also includes examining, on a test basis, evidence supporting the amounts and disclosures in the financial statements, assessing the accounting principles used and significant estimates made by management, as well as evaluating the overall financial statement presentation. Our procedures included confirmation of securities owned as of December 31, 2016, by correspondence with the custodian, brokers and agent banks; when replies were not received from brokers and agent banks, we performed other auditing procedures. We believe that our audits provide a reasonable basis for our opinion.
In our opinion, such financial statements and financial highlights referred to above present fairly, in all material respects, the financial position of Lord Abbett Bond-Debenture Fund, Inc. as of December 31, 2016, the results of its operations for the year then ended, the changes in its net assets for each of the two years in the period then ended, and the financial highlights for each of the periods presented, in conformity with accounting principles generally accepted in the United States of America.
DELOITTE & TOUCHE LLP
New York, New York
February 24, 2017
67
Basic Information About Management
The Board is responsible for the management of the business and affairs of the Company in accordance with the laws of the State of Maryland. The Board elects officers who are responsible for the day-to-day operations of the Fund and who execute policies authorized by the Board. The Board also approves an investment adviser to the Fund and continues to monitor the cost and quality of the services the investment adviser provides, and annually considers whether to renew the contract with the adviser. Generally, each Director holds office until his/her successor is elected and qualified or until his/her earlier resignation or removal, as provided in the Company’s organizational documents.
Lord Abbett, a Delaware limited liability company, is the Fund’s investment adviser. Designated Lord Abbett personnel are responsible for the day-to-day management of the Fund.
Interested Directors
Ms. Foster and Mr. Sieg are affiliated with Lord Abbett and are “interested persons” of the Company as defined in the Act. Ms. Foster and Mr. Sieg are directors/trustees of each of the 12 investment companies in the Lord Abbett Family of Funds, which consist of 60 portfolios or series. Ms. Foster is an officer of the Lord Abbett Family of Funds.
| Current Position and | ||||
| Name, Address and | Length of Service | Principal Occupation and Other Directorships | ||
| Year of Birth | with the Company | During the Past Five Years | ||
| Daria L. Foster Lord, Abbett & Co. LLC 90 Hudson Street Jersey City, NJ 07302 (1954) | Director and President since 2006; Chief Executive Officer since 2012 | Principal Occupation: Managing Partner of Lord Abbett, joined Lord Abbett in 1990.
Other Directorships: None. | ||
| Douglas B. Sieg Lord, Abbett & Co. LLC 90 Hudson Street Jersey City, NJ 07302 (1969) | Director since 2016 | Principal Occupation: Partner (since 2001) and Head of Client Services (since 2013), formerly Director of Marketing and Relationship Management, joined Lord Abbett in 1994.
Other Directorships: None. |
Independent Directors
The following Independent Directors also are directors/trustees of each of the 12 investment companies in the Lord Abbett Family of Funds, which consist of 60 portfolios or series.
| Current Position and | ||||
| Name, Address and | Length of Service | Principal Occupation and Other Directorships | ||
| Year of Birth | with the Company | During the Past Five Years | ||
| Robert B. Calhoun, Jr. Lord, Abbett & Co. LLC c/o Legal Dept. 90 Hudson Street Jersey City, NJ 07302 (1942) | Director since 1998 | Principal Occupation: Senior Advisor of Monitor Clipper Partners, a private equity investment fund (since 1997); President of Clipper Asset Management Corp. (1991–2009).
Other Directorships: None. | ||
| Eric C. Fast Lord, Abbett & Co. LLC c/o Legal Dept. 90 Hudson Street Jersey City, NJ 07302 (1949) | Director since 2014 | Principal Occupation: Chief Executive Officer of Crane Co., an industrial products company (2001–2014).
Other Directorships: Currently serves as director of Automatic Data Processing, Inc. (since 2007) and Regions Financial Corporation (since 2010). Previously served as a director of Crane Co. (1999–2014). |
68
Basic Information About Management (continued)
| Current Position and | ||||
| Name, Address and | Length of Service | Principal Occupation and Other Directorships | ||
| Year of Birth | with the Company | During the Past Five Years | ||
| Evelyn E. Guernsey Lord, Abbett & Co. LLC c/o Legal Dept. 90 Hudson Street Jersey City, NJ 07302 (1955) | Director since 2011 | Principal Occupation: CEO, Americas of J.P. Morgan Asset Management (2004–2010).
Other Directorships: None. | ||
| Julie A. Hill Lord, Abbett & Co. LLC c/o Legal Dept. 90 Hudson Street Jersey City, NJ 07302 (1946) | Director since 2004 | Principal Occupation: Owner and CEO of The Hill Company, a business consulting firm (since 1998).
Other Directorships: Currently serves as director of Anthem, Inc., a health benefits company (since 1994). | ||
| Franklin W. Hobbs Lord, Abbett & Co. LLC c/o Legal Dept. 90 Hudson Street Jersey City, NJ 07302 (1947) | Director since 2000 | Principal Occupation: Advisor of One Equity Partners, a private equity firm (since 2004).
Other Directorships: Currently serves as director and Chairman of the Board of Ally Financial Inc., a financial services firm (since 2009), and as director of Molson Coors Brewing Company (since 2002). | ||
| James M. McTaggart Lord, Abbett & Co. LLC c/o Legal Dept. 90 Hudson Street Jersey City, NJ 07302 (1947) | Director since 2012 | Principal Occupation: Independent management advisor and consultant (since 2012); Vice President, CRA International, Inc. (doing business as Charles River Associates), a global management consulting firm (2009–2012); Founder and Chairman of Marakon Associates, Inc., a strategy consulting firm (1978–2009); and Officer and Director of Trinsum Group, a holding company (2007–2009).
Other Directorships: Currently serves as director of Blyth, Inc., a home products company (since 2004). | ||
| Mark A. Schmid Lord, Abbett & Co. LLC c/o Legal Dept. 90 Hudson Street Jersey City, NJ 07302 (1959) | Director since 2016 | Principal Occupation: Vice President and Chief Investment Officer of the University of Chicago (since 2009).
Other Directorships: None. | ||
| James L.L. Tullis Lord, Abbett & Co. LLC c/o Legal Dept. 90 Hudson Street Jersey City, NJ 07302 (1947) | Director since 2006; Chairman since 2017 | Principal Occupation: CEO of Tullis-Dickerson and Co. Inc., a venture capital management firm (since 1990); CEO of Tullis Health Investors Inc. (since 2012).
Other Directorships: Currently serves as director of Crane Co. (since 1998). |
69
Basic Information About Management (continued)
Officers
None of the officers listed below have received compensation from the Company. All of the officers of the Company also may be officers of the other Lord Abbett Funds and maintain offices at 90 Hudson Street, Jersey City, NJ 07302. Unless otherwise indicated, the position(s) and title(s) listed under the “Principal Occupation During the Past Five Years” column indicate each officer’s position(s) and title(s) with Lord Abbett. Each officer serves for an indefinite term (i.e., until his or her death, resignation, retirement, or removal).
| Length of Service | ||||||
| Name and | Current Position | of Current | Principal Occupation | |||
| Year of Birth | with the Company | Position | During the Past Five Years | |||
| Daria L. Foster (1954) | President and Chief Executive Officer | Elected as President in 2006 and Chief Executive Officer in 2012 | Managing Partner of Lord Abbett, joined Lord Abbett in 1990. | |||
| Robert A. Lee (1969) | Executive Vice President | Elected in 2013 | Partner and Chief Investment Officer, and was formerly Deputy Chief Investment Officer and Director of Taxable Fixed Income, joined Lord Abbett in 1997. | |||
| Steven F. Rocco (1979) | Executive Vice President | Elected in 2014 | Partner and Portfolio Manager, joined Lord Abbett in 2004. | |||
| John W. Ashbrook (1964) | Vice President and Assistant Secretary | Elected in 2014 | Assistant General Counsel, joined Lord Abbett in 2008. | |||
| Joan A. Binstock (1954) | Chief Financial Officer and Vice President | Elected in 1999 | Partner and Chief Financial Officer, and was formerly Chief Operations Officer, joined Lord Abbett in 1999. | |||
| Brooke A. Fapohunda (1975) | Vice President and Assistant Secretary | Elected in 2014 | Deputy General Counsel, joined Lord Abbett in 2006. | |||
| John K. Forst (1960) | Vice President and Assistant Secretary | Elected in 2005 | Partner and Deputy General Counsel, joined Lord Abbett in 2004. | |||
| Lawrence H. Kaplan (1957) | Vice President and Secretary | Elected in 1997 | Partner and General Counsel, joined Lord Abbett in 1997. | |||
| Linda Y. Kim (1980) | Vice President and Assistant Secretary | Elected in 2016 | Counsel, joined Lord Abbett in 2015 and was formerly an Associate at Stroock & Stroock & Lavan LLP (2007–2015). |
70
Basic Information About Management (concluded)
| Length of Service | ||||||
| Name and | Current Position | of Current | Principal Occupation | |||
| Year of Birth | with the Company | Position | During the Past Five Years | |||
| Joseph M. McGill (1962) | Chief Compliance Officer | Elected in 2014 | Partner and Chief Compliance Officer, joined Lord Abbett in 2014 and was formerly Managing Director and the Chief Compliance Officer at UBS Global Asset Management (2003–2013). | |||
| A. Edward Oberhaus, III (1959) | Vice President | Elected in 1996 | Partner and Director, joined Lord Abbett in 1983. | |||
| Andrew H. O’Brien (1973) | Vice President | Elected in 2016 | Partner and Portfolio Manager, joined Lord Abbett in 1998. | |||
| Lawrence B. Stoller (1963) | Vice President and Assistant Secretary | Elected in 2007 | Partner and Senior Deputy General Counsel, joined Lord Abbett in 2007. | |||
| Leah G. Traub (1979) | Vice President | Elected in 2016 | Partner and Portfolio Manager, joined Lord Abbett in 2007. | |||
| Kewjin Yuoh (1971) | Vice President | Elected in 2016 | Partner and Portfolio Manager, joined Lord Abbett in 2010. | |||
| Scott S. Wallner (1955) | AML Compliance Officer | Elected in 2011 | Assistant General Counsel, joined Lord Abbett in 2004. | |||
| Bernard J. Grzelak (1971) | Treasurer | Elected in 2003 | Partner and Chief Operations Officer, and was formerly Director of Fund Administration, joined Lord Abbett in 2003. |
Please call 888-522-2388 for a copy of the statement of additional information, which contains further information about the Company’s Directors. It is available free upon request.
71
Approval of Advisory Contract
The Board, including all of the Directors who are not interested persons of the Fund or of Lord Abbett (the “Independent Board Members”), annually considers whether to approve the continuation of the existing management agreement between the Fund and Lord Abbett (the “Agreement”). In connection with its most recent approval, the Board reviewed materials relating specifically to the Agreement, as well as numerous materials received throughout the course of the year, including information about the Fund’s investment performance compared to the performance of its benchmark. Before making its decision as to the Fund, the Board had the opportunity to ask questions and request further information, taking into account its familiarity with Lord Abbett gained through its meetings and discussions. These meetings and discussions included the review of the portfolio management team conducted by members of the Contract Committee, the deliberations of the Contract Committee, and discussions between the Contract Committee and Lord Abbett’s management. The Independent Board Members also met with their independent legal counsel in a private session at which no representatives of management were present.
The materials received by the Board included, but were not limited to: (1) information provided by Morningstar Associates, LLC (“Morningstar”) regarding the investment performance of the Fund compared to the investment performance of certain funds with similar investment styles as determined by Morningstar, based, in part, on the Fund’s Morningstar category (the “performance peer group”), and the investment performance of two appropriate benchmarks; (2) information provided by Morningstar regarding the expense ratios, contractual and effective management fee rates, and other expense components for the Fund and certain funds in the same Morningstar category, with generally the same or similar share classes and operational characteristics, including asset size (the “expense peer group”); (3) certain supplemental investment performance information provided by Lord Abbett; (4) information provided by Lord Abbett on the expense ratios, management fee rates, and other expense components for the Fund; (5) sales and redemption information for the Fund; (6) information regarding Lord Abbett’s financial condition; (7) an analysis of the relative profitability of the Agreement to Lord Abbett; (8) information provided by Lord Abbett regarding the investment management fee schedules for Lord Abbett’s other advisory clients maintaining accounts with a similar investment strategy as the Fund; and (9) information regarding the personnel and other resources devoted by Lord Abbett to managing the Fund.
Investment Management Services Generally. The Board considered the investment management services provided by Lord Abbett to the Fund, including investment research, portfolio management, and trading, and Lord Abbett’s commitment to compliance with all applicable legal requirements. The Board also observed that Lord Abbett was solely engaged in the investment management business and accordingly did not experience the conflicts of interest that may result from being engaged in other lines of business. The Board considered the investment advisory services provided by Lord Abbett to other clients, the fees charged for the services, and the differences in the nature of the services provided to the Fund and other Lord Abbett Funds, on the one hand, and the services provided to other clients, on the other. After reviewing these and related factors, the Board concluded that the Fund was likely to continue to benefit from the nature, extent and quality of the investment services provided by Lord Abbett under the Agreement.
Investment Performance. The Board reviewed the Fund’s investment performance in relation to that of the performance peer group and two appropriate benchmarks as of various periods ended August 31, 2016. The Board observed that the Fund’s investment performance was above the median of the performance peer group for the one-year, three-year, five-year and ten-year periods. The Board also considered Lord Abbett’s performance and reputation generally, the performance of
72
Approval of Advisory Contract (continued)
other Lord Abbett-managed funds overseen by the Board and the willingness of Lord Abbett to take steps intended to improve performance when necessary. After reviewing these and related factors, the Board concluded that the Fund’s investment performance was reasonable and supported the continuation of the Agreement.
Lord Abbett’s Personnel and Methods. The Board considered the qualifications of the personnel providing investment management services to the Fund, in light of its investment objective and discipline. Among other things, the Board considered the size, experience, and turnover of Lord Abbett’s investment management staff, Lord Abbett’s investment methodology and philosophy, and Lord Abbett’s approach to recruiting, training, and retaining investment management personnel.
Nature and Quality of Other Services. The Board considered the nature, quality, costs, and extent of compliance, administrative, and other services performed by Lord Abbett and the nature and extent of Lord Abbett’s supervision of third party service providers, including the Fund’s transfer agent and custodian.
Expenses. The Board considered the expense level of the Fund and the expense levels of the expense peer group as of the date of each fund’s most recent annual report. It also considered how the expense levels of the Fund related to those of the expense peer group and the amount and nature of the fees paid by shareholders. The Board observed that the overall expense level of the Fund was below the median of the expense peer group. After reviewing these and related factors, the Board concluded, within the context of its overall approval of the Agreement, that the expense level of the Fund was reasonable and supported the continuation of the Agreement.
Profitability. The Board considered the level of Lord Abbett’s operating margin in managing the Fund, including a review of Lord Abbett’s methodology for allocating its costs to its management of the Fund. It considered whether the Fund was profitable to Lord Abbett in connection with the operation of the Fund, including the fee that Lord Abbett receives from the Fund for providing administrative services to the Fund. The Board also considered the profits realized from other business segments of Lord Abbett, which may benefit from or be related to the Fund’s business. The Board considered Lord Abbett’s profit margins in comparison with available industry data, both accounting for and excluding marketing and distribution expenses, and how those profit margins could affect Lord Abbett’s ability to recruit and retain investment personnel. The Board recognized that Lord Abbett’s overall profitability was a factor in enabling it to attract and retain qualified investment management personnel to provide services to the Fund. After reviewing these and related factors, the Board concluded, within the context of its overall approval of the Agreement, that Lord Abbett’s profitability with respect to the Fund was not excessive.
Economies of Scale. The Board considered the extent to which there had been economies of scale in managing the Fund, whether the Fund’s shareholders had appropriately benefited from such economies of scale, and whether there was potential for realization of any further economies of scale. The Board concluded that the existing management fee schedule, with its breakpoints in the levels of the management fee, adequately addressed any economies of scale in managing the Fund.
Other Benefits to Lord Abbett. The Board considered the character and amount of fees paid by the Fund and the Fund’s shareholders to Lord Abbett and the Distributor for services other than investment advisory services. The Board also considered the revenues and profitability of Lord Abbett’s investment advisory business apart from its mutual fund business, and the intangible benefits enjoyed by Lord Abbett by virtue of its relationship with the Fund. The Board observed that the Distributor receives 12b-1 fees from certain of the Lord Abbett Funds as to shares held in
73
Approval of Advisory Contract (concluded)
accounts for which there is no other broker of record, may retain a portion of the 12b-1 fees it receives, and receives a portion of the sales charges on sales and redemptions of some classes of shares of the Lord Abbett Funds. In addition, the Board observed that Lord Abbett accrues certain benefits for its business of providing investment advice to clients other than the Lord Abbett Funds, but that business also benefits the Funds. The Board also noted that Lord Abbett, as disclosed in the prospectus of the Fund, has entered into revenue sharing arrangements with certain entities that distribute shares of the Fund. The Board also took into consideration the investment research that Lord Abbett receives as a result of Fund brokerage transactions.
Alternative Arrangements. The Board considered whether, instead of approving continuation of the Agreement, it might be in the best interests of the Fund to implement one or more alternative arrangements, such as continuing to employ Lord Abbett, but on different terms. After considering all of the relevant factors, the Board unanimously found that continuation of the Agreement was in the best interests of the Fund and its shareholders and voted unanimously to approve the continuation of the Agreement. In considering whether to approve the continuation of the Agreement, the Board did not identify any single factor as paramount or controlling. Individual Directors may have evaluated the information presented differently from one another, giving different weights to various factors. This summary does not discuss in detail all matters considered.
74
Householding
The Fund has adopted a policy that allows it to send only one copy of the Fund’s prospectus, proxy material, annual report and semiannual report to certain shareholders residing at the same “household.” This reduces Fund expenses, which benefits you and other shareholders. If you need additional copies or do not want your mailings to be “householded,” please call Lord Abbett at 888-522-2388 or send a written request with your name, the name of your fund or funds and your account number or numbers to Lord Abbett Family of Funds, P.O. Box 219336, Kansas City, MO 64121.
Proxy Voting Policies, Procedures and Records
A description of the policies and procedures that Lord Abbett uses to vote proxies related to the Fund’s portfolio securities, and information on how Lord Abbett voted the Fund’s proxies during the 12-month period ended June 30 are available without charge, upon request, (i) by calling 888-522-2388; (ii) on Lord Abbett’s Website at www.lordabbett.com; and (iii) on the Securities and Exchange Commission’s (“SEC”) Website at www.sec.gov.
Shareholder Reports and Quarterly Portfolio Disclosure
The Fund is required to file its complete schedule of portfolio holdings with the SEC for its first and third fiscal quarters on Form N-Q. Copies of the filings are available without charge, upon request on the SEC’s Website at www.sec.gov and may be available by calling Lord Abbett at 888-522-2388. You can also obtain copies of Form N-Q by visiting the SEC’s Public Reference Room in Washington, DC (information on the operation of the Public Reference Room may be obtained by calling 800-SEC-0330).
| Tax Information |
| 3% of the ordinary income distributions paid by the Fund during the fiscal year ended December 31, 2016 is qualified dividend income. For corporate shareholders, 3% of the Fund’s ordinary income distributions qualified for the dividend received deduction. |
| For foreign shareholders, 97% of the net investment income distributions paid by the Fund during the fiscal year ended December 31, 2016 represents interest-related dividends. |
75


| This report, when not used for the general information of shareholders of the Fund, is to be distributed only if preceded or accompanied by a current fund prospectus. | |||
| Lord Abbett mutual fund shares are distributed by LORD ABBETT DISTRIBUTOR LLC. | Lord Abbett Bond-Debenture Fund, Inc. | LABD-2 (2/17) |
| Item 2: | Code of Ethics. |
| (a) | In accordance with applicable requirements, the Registrant adopted a Sarbanes-Oxley Code of Ethics on June 19, 2003 that applies to the principal executive officer and senior financial officers of the Registrant (“Code of Ethics”). The Code of Ethics was in effect during the fiscal year ended December 31, 2016 (the “Period”). |
| (b) | Not applicable. |
| (c) | The Registrant has not amended the Code of Ethics as described in Form N-CSR during the Period. |
| (d) | The Registrant has not granted any waiver, including an implicit waiver, from a provision of the Code of Ethics as described in Form N-CSR during the Period. |
| (e) | Not applicable. |
| (f) | See Item 12(a)(1) concerning the filing of the Code of Ethics. |
| Item 3: | Audit Committee Financial Expert. |
The Registrant’s board of directors has determined that each of the following independent directors who are members of the audit committee is an audit committee financial expert: Robert B. Calhoun, Evelyn E. Guernsey, and Mark A. Schmid. Each of these persons is independent within the meaning of the Form N-CSR.
| Item 4: | Principal Accountant Fees and Services. |
In response to sections (a), (b), (c) and (d) of Item 4, the aggregate fees billed to the Registrant for the fiscal years ended December 31, 2016 and 2015 by the Registrant’s principal accounting firm, Deloitte & Touche LLP, the member firms of Deloitte Touche Tohmatsu and their respective affiliates (collectively, “Deloitte”) were as follows:
| Fiscal year ended: | ||||||||
| 2016 | 2015 | |||||||
| Audit Fees {a} | $ | 79,400 | $ | 78,800 | ||||
| Audit-Related Fees | - 0 - | - 0 - | ||||||
| Total audit and audit-related fees | 79,400 | 78,800 | ||||||
| Tax Fees {b} | 11,984 | 11,952 | ||||||
| All Other Fees | - 0 - | - 0 - | ||||||
| Total Fees | $ | 91,384 | $ | 90,752 | ||||
{a} Consists of fees for audits of the Registrant’s annual financial statements.
{b} Fees for the fiscal year ended December 31, 2016 and 2015 consist of fees for preparing the U.S. Income Tax Return for Regulated Investment Companies, New Jersey Corporation Business Tax Return, New Jersey Annual Report Form, U.S. Return of Excise Tax on Undistributed Income of Investment Companies, IRS Forms 1099-MISC and 1096 Annual Summary and Transmittal of U.S. Information Returns.
(e) (1) Pursuant to Rule 2-01(c) (7) of Regulation S-X, the Registrant’s Audit Committee has adopted pre-approval policies and procedures. Such policies and procedures generally provide that the Audit Committee must pre-approve:
| · | any audit, audit-related, tax, and other services to be provided to the Lord Abbett Funds, including the Registrant, and |
| · | any audit-related, tax, and other services to be provided to the Registrant’s investment adviser and any entity controlling, controlled by or under common control with the investment adviser that provides ongoing services to one or more Funds comprising the Registrant if the engagement relates directly to operations and financial reporting of a Fund, by the independent auditor to assure that the provision of such services does not impair the auditor’s independence. |
The Audit Committee has delegated pre-approval authority to its Chairman, subject to a fee limit of $10,000 per event, and not to exceed $25,000 annually. The Chairman will report any pre-approval decisions to the Audit Committee at its next scheduled meeting. Unless a type of service to be provided by the independent auditor has received general pre-approval, it must be pre-approved by the Audit Committee. Any proposed services exceeding pre-approved cost levels will require specific pre-approval by the Audit Committee.
(e) (2) The Registrant’s Audit Committee has approved 100% of the services described in this Item 4 (b) through (d).
(f) Not applicable.
(g) The aggregate non-audit fees billed by Deloitte for services rendered to the Registrant are shown above in the response to Item 4 (a), (b), (c) and (d) as “All Other Fees”.
The aggregate non-audit fees billed by Deloitte for services rendered to the Registrant’s investment adviser, Lord, Abbett & Co. LLC (“Lord Abbett”), for the fiscal years ended December 31, 2016 and 2015 were:
| Fiscal year ended: | ||||||||
| 2016 | 2015 | |||||||
| All Other Fees {a} | $ | 95,230 | $ | 285,031 | ||||
{a} Consist of fees for Independent Services Auditors’ Report on Controls Placed in Operation and Tests of Operating Effectiveness related to Lord Abbett’s Asset Management Services (“SOC-1 Report”).
The aggregate non-audit fees billed by Deloitte for services rendered to entities under the common control of Lord Abbett for the fiscal years ended December 31, 2016 and 2015 were:
| Fiscal year ended: | |||||||||
| 2016 | 2015 | ||||||||
| All Other Fees | $ - 0 - | $ - 0 - | |||||||
(h) The Registrant’s Audit Committee has considered the provision of non-audit services that were rendered to the Registrant’s investment adviser, and any entity controlling, controlled by or under common control with the investment adviser that provides ongoing services to the Registrant, that were not pre-approved pursuant to Rule 2-01 (c)(7)(ii) of Regulation S-X and has determined that the provision of such services is compatible with maintaining Deloitte’s independence.
| Item 5: | Audit Committee of Listed Registrants. |
Not applicable.
| Item 6: | Investments. |
Not applicable.
| Item 7: | Disclosure of Proxy Voting Policies and Procedures for Closed-End Management Investment Companies. |
Not applicable.
| Item 8: | Portfolio Managers of Closed-End Management Investment Companies. |
Not applicable.
| Item 9: | Purchases of Equity Securities by Closed-End Management Investment Company and Affiliated Purchasers. |
Not applicable.
| Item 10: | Submission of Matters to a Vote of Security Holders. |
Not applicable.
| Item 11: | Controls and Procedures. |
| (a) | Based on their evaluation of the Registrant’s disclosure controls and procedures (as defined in Rule 30a-3(c) under the Investment Company Act of 1940) as of a date within 90 days prior to the filing date of this report, the Chief Executive Officer and Chief Financial Officer of the Registrant have concluded that such |
disclosure controls and procedures are reasonably designed and effective to ensure that material information relating to the Registrant, including its consolidated subsidiaries, is made known to them by others within those entities.
| (b) | There were no changes in the Registrant’s internal control over financial reporting (as defined in Rule 30a-3(d) under the Investment Company Act of 1940) that occurred during the second fiscal quarter of the period covered by this report that have materially affected, or are reasonably likely to materially affect, the Registrant’s internal control over financial reporting. |
| Item 12: | Exhibits. |
| (a)(1) | The Lord Abbett Family of Funds Sarbanes Oxley Code of Ethics for the Principal Executive Officer and Senior Financial Officers is attached hereto as part of Ex-99. CODEETH. |
| (a)(2) | Certification of each Principal Executive Officer and Principal Financial Officer of the Registrant as required by Rule 30a-2 under the Investment Company Act of 1940 is attached hereto as a part of EX-99.CERT. |
| (b) | Certification of each Principal Executive Officer and Principal Financial Officer of the Registrant as required by Section 906 of the Sarbanes-Oxley Act of 2002 is provided as a part of EX-99.906CERT. |
SIGNATURES
Pursuant to the requirements of the Securities Exchange Act of 1934 and the Investment Company Act of 1940, the Registrant has duly caused this report to be signed on its behalf by the undersigned, thereunto duly authorized.
| LORD ABBETT BOND-DEBENTURE FUND, INC. |
| By: | /s/ Daria L. Foster | |
| Daria L. Foster | ||
| President and Chief Executive Officer | ||
| Date: February 24, 2017 | ||
| By: | /s/ Joan A. Binstock | |
| Joan A. Binstock | ||
| Chief Financial Officer and Vice President | ||
| Date: February 24, 2017 |
Pursuant to the requirements of the Securities Exchange Act of 1934 and the Investment Company Act of 1940, this report has been signed below by the following persons on behalf of the Registrant and in the capacities and on the dates indicated.
| By: | /s/ Daria L. Foster | |
| Daria L. Foster | ||
| President and Chief Executive Officer | ||
| Date: February 24, 2017 | ||
| By: | /s/ Joan A. Binstock | |
| Joan A. Binstock | ||
| Chief Financial Officer and Vice President | ||
| Date: February 24, 2017 |