UNITED STATES
SECURITIES AND EXCHANGE COMMISSION
Washington, D.C. 20549
FORM N-CSR
CERTIFIED SHAREHOLDER REPORT OF REGISTERED
MANAGEMENT INVESTMENT COMPANIES
Investment Company Act file number 811-1193
Fidelity Magellan Fund
(Exact name of registrant as specified in charter)
82 Devonshire St., Boston, Massachusetts 02109
(Address of principal executive offices) (Zip code)
Eric D. Roiter, Secretary
82 Devonshire St.
Boston, Massachusetts 02109
(Name and address of agent for service)
Registrant's telephone number, including area code: 617-563-7000
Date of fiscal year end: | March 31 |
Date of reporting period: | March 31, 2004 |
Item 1. Reports to Stockholders
Fidelity®
Magellan®
Fund
Annual Report
March 31, 2004
(2_fidelity_logos) (Registered_Trademark)
Contents
Chairman's Message | Ned Johnson's message to shareholders. | |
Performance | How the fund has done over time. | |
Management's Discussion | The manager's review of fund performance, strategy and outlook. | |
Investment Changes | A summary of major shifts in the fund's investments over the past six months. | |
Investments | A complete list of the fund's investments with their market values. | |
Financial Statements | Statements of assets and liabilities, operations, and changes in net assets, | |
Notes | Notes to the financial statements. | |
Auditors' Opinion | ||
Trustees and Officers | ||
Distributions | ||
Prospectus | P-1 |
Standard & Poor's, S&P and S&P 500 are registered service marks of The McGraw-Hill Companies, Inc. and have been licensed for use by Fidelity Distributors Corporation.
Other third party marks appearing herein are the property of their respective owners.
All other marks appearing herein are registered or unregistered trademarks or service marks of FMR Corp. or an affiliated company.
(Recycle graphic) This report is printed on recycled paper using soy-based inks.
This report and the financial statements contained herein are submitted for the general information of the shareholders of the fund. This report is not authorized for distribution to prospective investors in the fund unless preceded or accompanied by an effective prospectus.
Mutual fund shares are not deposits or obligations of, or guaranteed by, any depository institution. Shares are not insured by the FDIC, the Federal Reserve Board or any other agency, and are subject to investment risks, including the possible loss of principal amount invested.
Neither the fund nor Fidelity Distributors Corporation is a bank.
For more information on any Fidelity fund, including charges and expenses, call 1-800-544-6666 for a free prospectus. Read it carefully before you invest or send money.
Annual Report
Chairman's Message
(photo_of_Edward_C_Johnson_3d)
Dear Shareholder:
Many of you have read or heard news stories recently that were critical of mutual funds and made allegations that the mutual fund industry has been less than forthright. I find these reports unsettling and not necessarily an accurate picture of the overall industry, and I would like you to know where we at Fidelity stand.
With specific regard to allegations that certain mutual fund companies were violating the Securities and Exchange Commission's forward pricing rules or were involved in so-called "market timing" activities, I want to say two things:
First, Fidelity does not have agreements that permit customers who buy fund shares after 4 p.m. to obtain the 4 p.m. price. This is not to say that someone could not deceive the company through fraudulent acts. But I underscore that we have no so-called "agreements" which would permit this illegal practice.
Second, Fidelity has been on record for years opposing predatory short-term trading which adversely affects other shareholders in a mutual fund. In fact, in the 1980s, we began charging a fee - which is returned to the fund and, therefore, to investors - to discourage this activity. What's more, several years ago we took the industry lead in developing a Fair Value Pricing Policy to prevent market timing on foreign securities in our funds. It is reasonable to assume that another structure can be developed that would alter the system to make it much more difficult for predatory traders to operate. This, however, will only be achieved through close cooperation among regulators, legislators and the industry.
Certainly no industry is perfect, and there have been instances of unethical and illegal activity from time to time within the mutual fund industry. When this occurs, confessed or convicted offenders should be dealt with appropriately. Clearly, every system can be improved. We applaud well thought out improvements by regulators, legislators and industry representatives that achieve the common goal of building and protecting the value of investors' holdings. But we remain concerned about the risk of over-regulation and the quick application of simplistic solutions to intricate problems.
For more than 57 years, Fidelity Investments has worked very hard to improve its products and service to justify your trust. When our family founded this company in 1946, we had only a few hundred customers. Many of them were family and friends. Today, we serve more than 18 million customers including individual investors and participants in retirement plans across America.
Let me close by saying that we do not take your trust in us for granted, and we realize that we must always work to improve all aspects of our service to you. In turn, we urge you to continue your active participation with your financial matters, so that your interests can be well served.
Best regards,
/s/Edward C. Johnson 3d
Edward C. Johnson 3d
Annual Report
Performance: The Bottom Line
Average annual total return reflects the change in the value of an investment, assuming reinvestment of the fund's dividend income and capital gains (the profits earned upon the sale of securities that have grown in value) and assuming a constant rate of performance each year. The $10,000 table and the fund's returns do not reflect the deduction of taxes that a shareholder would pay on fund distributions or the redemption of fund shares. During periods of reimbursement by Fidelity, a fund's total return will be greater than it would be had the reimbursement not occurred. How a fund did yesterday is no guarantee of how it will do tomorrow.
Average Annual Total Returns
Periods ended March 31, 2004 | Past 1 | Past 5 | Past 10 |
Fidelity Magellan Fund | 30.35% | -2.20% | 9.50% |
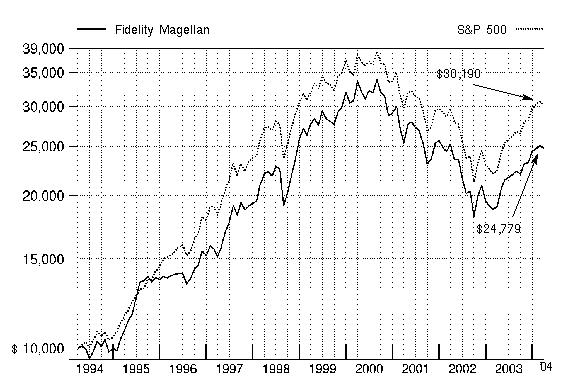
$10,000 Over 10 Years
Let's say hypothetically that $10,000 was invested in Fidelity ® Magellan® Fund on March 31, 1994. The chart shows how the value of your investment would have grown, and also shows how the S&P 500 Index did over the same period.
Annual Report
Management's Discussion of Fund Performance
Comments from Bob Stansky, Portfolio Manager of Fidelity® Magellan® Fund
Robust domestic economic growth and improved corporate profits helped fuel a broad-based rally in U.S. equity markets during the 12-month period ending March 31, 2004. The U.S. Commerce Department reported that the rate of economic growth - as represented by gross domestic product - was 8.2% in the third quarter of 2003, followed by a solid 4.1% annualized rate in the fourth quarter. Not since 1984 had the economy grown as fast in back-to-back quarters. As for corporate profitability, the government said after-tax corporate profits rose by 7.6% in the fourth quarter of 2003, following a 10.1% increase for the prior quarter. In response, major equity market benchmarks surged higher, most notably the Russell 2000® Index, a benchmark of small-cap stock performance, which returned 63.83% during the 12-month period. Elsewhere, the tech-heavy NASDAQ Composite® Index gained 49.38%, the large-cap-oriented Standard & Poor's 500SM Index rose 35.12%, and the blue-chips' Dow Jones Industrial AverageSM advanced 32.39%. As the period ended, geopolitical concerns, high energy prices and lackluster job growth combined to temper the market's advance.
Fidelity Magellan Fund posted a strong absolute return of 30.35% during the past year, but trailed both the S&P 500® and the LipperSM Growth Funds Average, the latter of which returned 35.87%. Underweighting the surging technology sector, including names such as Cisco Systems and Intel, was the primary reason for the fund's shortfall relative to the index. Weak results in health care also detracted from performance compared to the S&P 500. Merck suffered when it announced that two drugs were being dropped out of Phase III clinical trials. Thus, its earnings estimates were cut and the stock fell quickly. Media play Viacom also detracted significantly as advertising activity among radio and local TV networks failed to accelerate. On the plus side, the fund's positioning in financials was generally positive. An emphasis on brokerage firms and other companies tied to the capital markets worked out well. Citigroup, the fund's largest holding at period end, was its best absolute contributor and second-best relative performer. Morgan Stanley and Goldman Sachs also boosted returns in this space.
The views expressed in this statement reflect those of the portfolio manager only through the end of the period of the report as stated on the cover and do not necessarily represent the views of Fidelity or any other person in the Fidelity organization. Any such views are subject to change at any time based upon market or other conditions and Fidelity disclaims any responsibility to update such views. These views may not be relied on as investment advice and, because investment decisions for a Fidelity fund are based on numerous factors, may not be relied on as an indication of trading intent on behalf of any Fidelity fund.
Annual Report
Investment Changes
Top Ten Stocks as of March 31, 2004 | ||
% of fund's | % of fund's net assets | |
Citigroup, Inc. | 4.6 | 4.6 |
American International Group, Inc. | 3.6 | 3.2 |
General Electric Co. | 3.1 | 3.4 |
Viacom, Inc. Class B (non-vtg.) | 2.9 | 3.0 |
Pfizer, Inc. | 2.7 | 2.5 |
Microsoft Corp. | 2.7 | 3.2 |
Exxon Mobil Corp. | 2.1 | 2.1 |
Home Depot, Inc. | 1.9 | 1.7 |
Wal-Mart Stores, Inc. | 1.9 | 1.8 |
ChevronTexaco Corp. | 1.8 | 1.5 |
27.3 | ||
Top Five Market Sectors as of March 31, 2004 | ||
% of fund's | % of fund's net assets | |
Financials | 23.8 | 23.2 |
Consumer Discretionary | 16.8 | 16.7 |
Information Technology | 16.1 | 13.9 |
Health Care | 12.5 | 13.9 |
Consumer Staples | 8.9 | 8.6 |
Asset Allocation (% of fund's net assets) | |||||||
As of March 31, 2004* | As of September 30, 2003** | ||||||
 | Stocks 98.8% | | Stocks 95.6% | ||||
 | Short-Term | | Short-Term | ||||
* Foreign | 3.1% | ** Foreign investments | 2.2% | ||||

Annual Report
Investments March 31, 2004
Showing Percentage of Net Assets
Common Stocks - 98.8% | |||
Shares | Value (Note 1) (000s) | ||
CONSUMER DISCRETIONARY - 16.8% | |||
Hotels, Restaurants & Leisure - 0.6% | |||
Caesars Entertainment, Inc. (a) | 2,029,200 | $ 26,461 | |
Extended Stay America, Inc. | 1,897,200 | 36,749 | |
McDonald's Corp. | 6,947,400 | 198,487 | |
Starwood Hotels & Resorts Worldwide, Inc. unit | 4,023,827 | 162,965 | |
424,662 | |||
Household Durables - 0.4% | |||
Black & Decker Corp. | 1,100,000 | 62,634 | |
Centex Corp. | 1,200,000 | 64,872 | |
Leggett & Platt, Inc. | 5,300,000 | 125,663 | |
253,169 | |||
Internet & Catalog Retail - 0.2% | |||
eBay, Inc. (a) | 100,000 | 6,933 | |
InterActiveCorp (a) | 3,700,000 | 116,883 | |
123,816 | |||
Media - 8.2% | |||
Citadel Broadcasting Corp. | 145,000 | 2,530 | |
Clear Channel Communications, Inc. | 19,032,854 | 806,041 | |
Comcast Corp.: | |||
Class A (a) | 8,956,359 | 257,406 | |
Class A (special) (a) | 3,936,600 | 109,752 | |
Cox Communications, Inc. Class A (a) | 2,639,400 | 83,405 | |
EchoStar Communications Corp. Class A (a) | 2,400,000 | 78,600 | |
Fox Entertainment Group, Inc. Class A (a) | 4,000,000 | 108,400 | |
Gannett Co., Inc. | 1,492,300 | 131,531 | |
Liberty Media Corp. Class A (a) | 6,000,000 | 65,700 | |
McGraw-Hill Companies, Inc. | 666,000 | 50,709 | |
News Corp. Ltd. ADR | 4,600,000 | 165,508 | |
Omnicom Group, Inc. | 3,401,576 | 272,976 | |
Time Warner, Inc. (a) | 46,386,854 | 782,082 | |
Tribune Co. | 1,733,922 | 87,459 | |
Univision Communications, Inc. Class A (a) | 2,090,000 | 68,991 | |
Viacom, Inc. Class B (non-vtg.) | 49,259,937 | 1,931,482 | |
Walt Disney Co. | 20,001,500 | 499,837 | |
5,502,409 | |||
Multiline Retail - 0.9% | |||
Federated Department Stores, Inc. | 1,447,300 | 78,227 | |
JCPenney Co., Inc. | 800,000 | 27,824 | |
Common Stocks - continued | |||
Shares | Value (Note 1) (000s) | ||
CONSUMER DISCRETIONARY - continued | |||
Multiline Retail - continued | |||
Kohl's Corp. (a) | 2,400,000 | $ 115,992 | |
Target Corp. | 8,200,000 | 369,328 | |
591,371 | |||
Specialty Retail - 5.8% | |||
AutoNation, Inc. (a) | 6,830,427 | 116,459 | |
Best Buy Co., Inc. | 9,798,900 | 506,799 | |
Gap, Inc. | 3,369,300 | 73,855 | |
Home Depot, Inc. | 33,462,500 | 1,250,159 | |
Limited Brands, Inc. | 9,000,000 | 180,000 | |
Lowe's Companies, Inc. | 17,915,000 | 1,005,569 | |
Office Depot, Inc. (a) | 11,443,800 | 215,372 | |
PETsMART, Inc. | 207,000 | 5,643 | |
Staples, Inc. | 15,062,000 | 382,424 | |
TJX Companies, Inc. | 7,000,000 | 171,920 | |
3,908,200 | |||
Textiles Apparel & Luxury Goods - 0.7% | |||
Liz Claiborne, Inc. | 5,095,600 | 186,958 | |
NIKE, Inc. Class B | 3,198,500 | 249,067 | |
436,025 | |||
TOTAL CONSUMER DISCRETIONARY | 11,239,652 | ||
CONSUMER STAPLES - 8.9% | |||
Beverages - 2.5% | |||
PepsiCo, Inc. | 13,024,700 | 701,380 | |
The Coca-Cola Co. | 19,966,100 | 1,004,295 | |
1,705,675 | |||
Food & Staples Retailing - 2.6% | |||
CVS Corp. | 12,348,686 | 435,909 | |
Safeway, Inc. (a) | 914,000 | 18,810 | |
Sysco Corp. | 150,000 | 5,858 | |
Wal-Mart Stores, Inc. | 20,887,840 | 1,246,795 | |
1,707,372 | |||
Household Products - 2.1% | |||
Colgate-Palmolive Co. | 3,679,700 | 202,751 | |
Kimberly-Clark Corp. | 3,200,000 | 201,920 | |
Procter & Gamble Co. | 9,300,000 | 975,384 | |
1,380,055 | |||
Common Stocks - continued | |||
Shares | Value (Note 1) (000s) | ||
CONSUMER STAPLES - continued | |||
Personal Products - 0.8% | |||
Avon Products, Inc. | 1,300,000 | $ 98,631 | |
Gillette Co. | 11,806,200 | 461,622 | |
560,253 | |||
Tobacco - 0.9% | |||
Altria Group, Inc. | 10,766,400 | 586,230 | |
TOTAL CONSUMER STAPLES | 5,939,585 | ||
ENERGY - 8.5% | |||
Energy Equipment & Services - 2.4% | |||
Baker Hughes, Inc. | 8,321,000 | 303,550 | |
BJ Services Co. (a) | 700,000 | 30,289 | |
Cooper Cameron Corp. (a) | 1,795,500 | 79,092 | |
Diamond Offshore Drilling, Inc. | 1,000,000 | 24,190 | |
GlobalSantaFe Corp. | 700,000 | 19,439 | |
Halliburton Co. | 5,299,600 | 161,055 | |
Nabors Industries Ltd. (a) | 1,900,000 | 86,925 | |
Noble Corp. (a) | 300,000 | 11,526 | |
Pride International, Inc. (a) | 1,500,000 | 25,590 | |
Schlumberger Ltd. (NY Shares) | 9,688,100 | 618,585 | |
Smith International, Inc. (a) | 278,600 | 14,908 | |
Transocean, Inc. (a) | 3,812,563 | 106,332 | |
Weatherford International Ltd. (a) | 2,020,000 | 84,901 | |
1,566,382 | |||
Oil & Gas - 6.1% | |||
Anadarko Petroleum Corp. | 2,700,000 | 140,022 | |
Apache Corp. | 5,903,210 | 254,842 | |
BP PLC sponsored ADR | 5,068,842 | 259,525 | |
Burlington Resources, Inc. | 4,829,925 | 307,328 | |
ChevronTexaco Corp. | 13,400,000 | 1,176,252 | |
ConocoPhillips | 4,752,059 | 331,741 | |
Devon Energy Corp. | 721,600 | 41,961 | |
EnCana Corp. | 400,000 | 17,296 | |
Exxon Mobil Corp. | 34,010,336 | 1,414,490 | |
Occidental Petroleum Corp. | 3,021,400 | 139,135 | |
4,082,592 | |||
TOTAL ENERGY | 5,648,974 | ||
Common Stocks - continued | |||
Shares | Value (Note 1) (000s) | ||
FINANCIALS - 23.8% | |||
Capital Markets - 4.4% | |||
Bank of New York Co., Inc. | 4,604,400 | $ 145,039 | |
Charles Schwab Corp. | 5,425,000 | 62,984 | |
Goldman Sachs Group, Inc. | 5,548,500 | 578,986 | |
J.P. Morgan Chase & Co. | 10,883,100 | 456,546 | |
Lehman Brothers Holdings, Inc. | 1,500,000 | 124,305 | |
Merrill Lynch & Co., Inc. | 10,242,900 | 610,067 | |
Morgan Stanley | 16,350,970 | 936,911 | |
2,914,838 | |||
Commercial Banks - 5.6% | |||
Bank of America Corp. | 13,801,954 | 1,117,682 | |
Bank One Corp. | 11,826,900 | 644,803 | |
Fifth Third Bancorp | 2,050,000 | 113,509 | |
Synovus Financial Corp. | 3,959,775 | 96,816 | |
U.S. Bancorp, Delaware | 7,510,674 | 207,670 | |
Wachovia Corp. | 13,822,994 | 649,681 | |
Wells Fargo & Co. | 16,655,000 | 943,839 | |
3,774,000 | |||
Consumer Finance - 1.7% | |||
American Express Co. | 16,183,300 | 839,104 | |
MBNA Corp. | 10,399,950 | 287,351 | |
1,126,455 | |||
Diversified Financial Services - 4.6% | |||
Citigroup, Inc. | 59,755,653 | 3,089,366 | |
Insurance - 5.4% | |||
ACE Ltd. | 1,000,000 | 42,660 | |
AFLAC, Inc. | 4,047,000 | 162,447 | |
Allstate Corp. | 2,500,000 | 113,650 | |
American International Group, Inc. | 34,158,570 | 2,437,214 | |
Berkshire Hathaway, Inc. Class A (a) | 557 | 51,968 | |
Hartford Financial Services Group, Inc. | 3,000,000 | 191,100 | |
MetLife, Inc. | 6,000,000 | 214,080 | |
The Chubb Corp. | 300,000 | 20,862 | |
Travelers Property Casualty Corp.: | |||
Class A | 9,900,000 | 169,785 | |
Class B | 5,925,605 | 102,335 | |
W.R. Berkley Corp. | 825,000 | 32,901 | |
XL Capital Ltd. Class A | 600,000 | 45,624 | |
3,584,626 | |||
Common Stocks - continued | |||
Shares | Value (Note 1) (000s) | ||
FINANCIALS - continued | |||
Real Estate - 0.2% | |||
Capital Lease Funding, Inc. | 43,500 | $ 558 | |
Equity Office Properties Trust | 2,986,400 | 86,277 | |
Equity Residential (SBI) | 2,543,000 | 75,909 | |
162,744 | |||
Thrifts & Mortgage Finance - 1.9% | |||
Countrywide Financial Corp. | 267,880 | 25,690 | |
Fannie Mae | 14,551,900 | 1,081,934 | |
Freddie Mac | 466,400 | 27,546 | |
Golden West Financial Corp., Delaware | 1,100,000 | 123,145 | |
1,258,315 | |||
TOTAL FINANCIALS | 15,910,344 | ||
HEALTH CARE - 12.5% | |||
Biotechnology - 1.4% | |||
Amgen, Inc. (a) | 2,002,230 | 116,470 | |
Biogen Idec, Inc. (a) | 3,075,000 | 170,970 | |
Charles River Laboratories International, Inc. (a) | 1,354,700 | 58,049 | |
Genentech, Inc. (a) | 3,442,000 | 364,232 | |
Genzyme Corp. - General Division (a) | 1,300,000 | 61,152 | |
Gilead Sciences, Inc. (a) | 2,100,000 | 117,117 | |
MedImmune, Inc. (a) | 1,000,000 | 23,080 | |
Millennium Pharmaceuticals, Inc. (a) | 1,700,000 | 28,730 | |
939,800 | |||
Health Care Equipment & Supplies - 1.3% | |||
Baxter International, Inc. | 3,200,000 | 98,848 | |
Boston Scientific Corp. (a) | 3,088,500 | 130,891 | |
Guidant Corp. | 625,000 | 39,606 | |
Medtronic, Inc. | 10,200,000 | 487,050 | |
St. Jude Medical, Inc. (a) | 900,000 | 64,890 | |
821,285 | |||
Health Care Providers & Services - 1.9% | |||
Cardinal Health, Inc. | 12,540,336 | 864,029 | |
UnitedHealth Group, Inc. | 6,559,400 | 422,688 | |
1,286,717 | |||
Pharmaceuticals - 7.9% | |||
Abbott Laboratories | 9,346,500 | 384,141 | |
Allergan, Inc. | 250,000 | 21,040 | |
Common Stocks - continued | |||
Shares | Value (Note 1) (000s) | ||
HEALTH CARE - continued | |||
Pharmaceuticals - continued | |||
Bristol-Myers Squibb Co. | 7,150,900 | $ 173,266 | |
Eli Lilly & Co. | 1,200,000 | 80,280 | |
Forest Laboratories, Inc. (a) | 2,900,000 | 207,698 | |
Johnson & Johnson | 23,120,200 | 1,172,657 | |
Merck & Co., Inc. | 15,965,400 | 705,511 | |
Pfizer, Inc. | 51,986,495 | 1,822,127 | |
Schering-Plough Corp. | 10,332,700 | 167,596 | |
Teva Pharmaceutical Industries Ltd. sponsored ADR | 1,500,000 | 95,115 | |
Wyeth | 11,928,500 | 447,915 | |
5,277,346 | |||
TOTAL HEALTH CARE | 8,325,148 | ||
INDUSTRIALS - 8.1% | |||
Aerospace & Defense - 0.8% | |||
Honeywell International, Inc. | 4,295,400 | 145,399 | |
Lockheed Martin Corp. | 4,100,000 | 187,124 | |
Northrop Grumman Corp. | 300,000 | 29,526 | |
United Technologies Corp. | 2,100,000 | 181,230 | |
543,279 | |||
Air Freight & Logistics - 0.2% | |||
United Parcel Service, Inc. Class B | 1,400,000 | 97,776 | |
Building Products - 0.3% | |||
Masco Corp. | 5,665,200 | 172,449 | |
Commercial Services & Supplies - 0.7% | |||
Cendant Corp. | 11,100,000 | 270,729 | |
ChoicePoint, Inc. (a) | 1,139,066 | 43,319 | |
Ionics, Inc. (a) | 360,000 | 10,224 | |
Manpower, Inc. | 1,051,800 | 48,909 | |
Republic Services, Inc. | 1,600,000 | 43,312 | |
Robert Half International, Inc. (a) | 2,124,900 | 50,190 | |
466,683 | |||
Electrical Equipment - 0.2% | |||
Aura Systems, Inc. warrants 5/31/05 (a) | 37 | 0 | |
Emerson Electric Co. | 2,732,400 | 163,725 | |
163,725 | |||
Industrial Conglomerates - 5.2% | |||
3M Co. | 5,726,240 | 468,807 | |
Common Stocks - continued | |||
Shares | Value (Note 1) (000s) | ||
INDUSTRIALS - continued | |||
Industrial Conglomerates - continued | |||
General Electric Co. | 67,538,400 | $ 2,061,272 | |
Tyco International Ltd. | 33,369,755 | 956,043 | |
3,486,122 | |||
Machinery - 0.7% | |||
Caterpillar, Inc. | 800,000 | 63,256 | |
Dover Corp. | 1,000,000 | 38,770 | |
Illinois Tool Works, Inc. | 2,222,300 | 176,073 | |
Ingersoll-Rand Co. Ltd. Class A | 2,568,850 | 173,783 | |
Trivest 1992 Special Fund Ltd. (c) | 26,600,000 | 266 | |
452,148 | |||
Road & Rail - 0.0% | |||
CSX Corp. | 500,000 | 15,145 | |
TOTAL INDUSTRIALS | 5,397,327 | ||
INFORMATION TECHNOLOGY - 16.1% | |||
Communications Equipment - 3.4% | |||
Adtran, Inc. | 500,000 | 15,015 | |
Brocade Communications Systems, Inc. (a) | 2,600,000 | 17,316 | |
Cisco Systems, Inc. (a) | 44,700,000 | 1,051,344 | |
Juniper Networks, Inc. (a) | 2,000,000 | 52,020 | |
Motorola, Inc. | 22,700,000 | 399,520 | |
Nokia Corp. sponsored ADR | 7,891,200 | 160,034 | |
Nortel Networks Corp. (a) | 5,100,000 | 30,243 | |
QUALCOMM, Inc. | 5,195,700 | 345,098 | |
Research in Motion Ltd. (a) | 513,500 | 47,941 | |
Scientific-Atlanta, Inc. | 200,000 | 6,468 | |
Sonus Networks, Inc. (a) | 500,000 | 1,855 | |
Telefonaktiebolaget LM Ericsson ADR (a) | 6,500,000 | 180,375 | |
2,307,229 | |||
Computers & Peripherals - 3.3% | |||
Apple Computer, Inc. (a) | 800,000 | 21,640 | |
Dell, Inc. (a) | 20,500,000 | 689,210 | |
EMC Corp. (a) | 15,916,900 | 216,629 | |
Hewlett-Packard Co. | 14,800,000 | 338,032 | |
International Business Machines Corp. | 9,006,800 | 827,185 | |
Lexmark International, Inc. Class A (a) | 1,300,000 | 119,600 | |
Network Appliance, Inc. (a) | 500,000 | 10,725 | |
2,223,021 | |||
Common Stocks - continued | |||
Shares | Value (Note 1) (000s) | ||
INFORMATION TECHNOLOGY - continued | |||
Electronic Equipment & Instruments - 0.6% | |||
Agilent Technologies, Inc. (a) | 3,200,000 | $ 101,216 | |
Flextronics International Ltd. (a) | 3,125,000 | 53,813 | |
Thermo Electron Corp. (a) | 2,471,500 | 69,894 | |
Waters Corp. (a) | 3,898,600 | 159,219 | |
384,142 | |||
Internet Software & Services - 0.7% | |||
Yahoo!, Inc. (a) | 9,960,900 | 484,000 | |
IT Services - 0.5% | |||
First Data Corp. | 7,650,000 | 322,524 | |
Semiconductors & Semiconductor Equipment - 3.5% | |||
Altera Corp. (a) | 500,000 | 10,225 | |
Analog Devices, Inc. | 3,807,732 | 182,809 | |
Applied Materials, Inc. (a) | 8,800,000 | 188,144 | |
Intel Corp. | 39,245,200 | 1,067,469 | |
Intersil Corp. Class A | 1,069,700 | 23,844 | |
KLA-Tencor Corp. (a) | 3,200,000 | 161,120 | |
Lam Research Corp. (a) | 499,200 | 12,585 | |
Linear Technology Corp. | 1,078,200 | 39,915 | |
Semiconductor Manufacturing International Corp. | 302,520 | 4,568 | |
Taiwan Semiconductor Manufacturing Co. Ltd. | 3,000,000 | 31,320 | |
Texas Instruments, Inc. | 18,697,700 | 546,347 | |
Xilinx, Inc. (a) | 1,700,000 | 64,600 | |
2,332,946 | |||
Software - 4.1% | |||
Adobe Systems, Inc. | 3,338,600 | 131,641 | |
Amdocs Ltd. (a) | 500,000 | 13,895 | |
BEA Systems, Inc. (a) | 2,150,000 | 27,434 | |
Electronic Arts, Inc. (a) | 408,200 | 22,026 | |
FileNET Corp. (a) | 550,000 | 14,658 | |
Intuit, Inc. (a) | 800,000 | 35,904 | |
Microsoft Corp. | 71,604,200 | 1,787,957 | |
Network Associates, Inc. (a) | 2,000,000 | 36,000 | |
Oracle Corp. (a) | 19,095,000 | 229,331 | |
SAP AG sponsored ADR | 4,900,000 | 192,619 | |
Common Stocks - continued | |||
Shares | Value (Note 1) (000s) | ||
INFORMATION TECHNOLOGY - continued | |||
Software - continued | |||
Siebel Systems, Inc. (a) | 3,500,000 | $ 40,285 | |
VERITAS Software Corp. (a) | 7,675,000 | 206,534 | |
2,738,284 | |||
TOTAL INFORMATION TECHNOLOGY | 10,792,146 | ||
MATERIALS - 1.3% | |||
Chemicals - 0.5% | |||
Dow Chemical Co. | 4,400,000 | 177,232 | |
E.I. du Pont de Nemours & Co. | 1,900,000 | 80,218 | |
Lyondell Chemical Co. | 901,100 | 13,372 | |
Praxair, Inc. | 1,000,000 | 37,120 | |
307,942 | |||
Containers & Packaging - 0.0% | |||
Packaging Corp. of America | 400,000 | 9,024 | |
Smurfit-Stone Container Corp. (a) | 1,100,000 | 19,349 | |
28,373 | |||
Metals & Mining - 0.3% | |||
Alcoa, Inc. | 5,700,000 | 197,733 | |
Paper & Forest Products - 0.5% | |||
International Paper Co. | 5,850,000 | 247,221 | |
Weyerhaeuser Co. | 1,300,000 | 85,150 | |
332,371 | |||
TOTAL MATERIALS | 866,419 | ||
TELECOMMUNICATION SERVICES - 2.8% | |||
Diversified Telecommunication Services - 2.2% | |||
BellSouth Corp. | 13,003,100 | 360,056 | |
Qwest Communications International, Inc. (a) | 7,802,400 | 33,628 | |
SBC Communications, Inc. | 15,377,214 | 377,357 | |
Verizon Communications, Inc. | 18,933,004 | 691,812 | |
1,462,853 | |||
Common Stocks - continued | |||
Shares | Value (Note 1) (000s) | ||
TELECOMMUNICATION SERVICES - continued | |||
Wireless Telecommunication Services - 0.6% | |||
Nextel Communications, Inc. Class A (a) | 9,700,000 | $ 239,881 | |
Vodafone Group PLC sponsored ADR | 7,264,500 | 173,622 | |
413,503 | |||
TOTAL TELECOMMUNICATION SERVICES | 1,876,356 | ||
TOTAL COMMON STOCKS (Cost $44,455,482) | 65,995,951 | ||
Money Market Funds - 1.5% | |||
Fidelity Cash Central Fund, 1.08% (b) | 990,433,173 | 990,433 | |
TOTAL INVESTMENT PORTFOLIO - 100.3% (Cost $45,445,915) | 66,986,384 | |
NET OTHER ASSETS - (0.3)% | (189,392) | |
NET ASSETS - 100% | $ 66,796,992 | |
Legend |
(a) Non-income producing |
(b) Affiliated fund that is available only to investment companies and other accounts managed by Fidelity Investments. The rate quoted is the annualized seven-day yield of the fund at period end. A complete listing of the fund's holdings as of its most recent fiscal year end is available upon request. |
(c) Restricted securities - Investment in securities not registered under the Securities Act of 1933 (excluding 144A issues). At the end of the period, the value of restricted securities (excluding 144A issues) amounted to $266,000 or 0.0% of net assets. |
Additional information on each holding is as follows: |
Security | Acquisition | Cost |
Trivest 1992 Special Fund Ltd. | 7/2/92 | $ 0 |
Other Information |
Purchases and sales of securities, other than short-term securities, aggregated $7,690,600,000 and $9,553,798,000, respectively. |
The fund placed a portion of its portfolio transactions with brokerage firms which are affiliates of the investment adviser. The commissions paid to these affiliated firms were $702,000 for the period. |
Income Tax Information |
At March 31, 2004, the fund had a capital loss carryforward of approximately $4,395,821,000 of which $1,760,324,000, $2,372,897,000 and $262,600,000 will expire on March 31, 2010, 2011 and 2012, respectively. |
See accompanying notes which are an integral part of the financial statements.
Annual Report
Financial Statements
Statement of Assets and Liabilities
Amounts in thousands (except per-share amount) | March 31, 2004 | |
Assets | ||
Investment in securities, at value (including securities loaned of $301,349) (cost $45,445,915) - See accompanying schedule | $ 66,986,384 | |
Receivable for investments sold | 163,289 | |
Receivable for fund shares sold | 51,505 | |
Dividends receivable | 74,018 | |
Interest receivable | 847 | |
Prepaid expenses | 265 | |
Other affiliated receivables | 283 | |
Other receivables | 10,179 | |
Total assets | 67,286,770 | |
Liabilities | ||
Payable for fund shares redeemed | $ 144,843 | |
Accrued management fee | 26,948 | |
Other affiliated payables | 12,460 | |
Other payables and accrued expenses | 359 | |
Collateral on securities loaned, at value | 305,168 | |
Total liabilities | 489,778 | |
Net Assets | $ 66,796,992 | |
Net Assets consist of: | ||
Paid in capital | $ 49,822,926 | |
Undistributed net investment income | 142,824 | |
Accumulated undistributed net realized gain (loss) on investments and foreign currency transactions | (4,709,227) | |
Net unrealized appreciation (depreciation) on investments and assets and liabilities in foreign currencies | 21,540,469 | |
Net Assets, for 673,841 shares outstanding | $ 66,796,992 | |
Net Asset Value, offering price and redemption price per share ($66,796,992 ÷ 673,841 shares) | $ 99.13 | |
See accompanying notes which are an integral part of the financial statements.
Annual Report
Statement of Operations
Amounts in thousands | Year ended March 31, 2004 | |
Investment Income | ||
Dividends (including $465 received from affiliated issuers) | $ 948,454 | |
Interest | 30,731 | |
Security lending | 958 | |
Total income | 980,143 | |
Expenses | ||
Management fee | $ 370,557 | |
Performance adjustment | (49,137) | |
Transfer agent fees | 123,251 | |
Accounting and security lending fees | 2,099 | |
Non-interested trustees' compensation | 336 | |
Appreciation in deferred trustee compensation account | 280 | |
Custodian fees and expenses | 959 | |
Registration fees | 333 | |
Audit | 426 | |
Legal | 323 | |
Miscellaneous | 559 | |
Total expenses before reductions | 449,986 | |
Expense reductions | (3,142) | 446,844 |
Net investment income (loss) | 533,299 | |
Realized and Unrealized Gain (Loss) Net realized gain (loss) on: | ||
Investment securities (including realized gain (loss) of $11,638 on sales of investments in affiliated issuers) | 433,920 | |
Foreign currency transactions | 2 | |
Total net realized gain (loss) | 433,922 | |
Change in net unrealized appreciation (depreciation) on investment securities | 15,349,973 | |
Net gain (loss) | 15,783,895 | |
Net increase (decrease) in net assets resulting from operations | $ 16,317,194 | |
See accompanying notes which are an integral part of the financial statements.
Annual Report
Statement of Changes in Net Assets
Amounts in thousands | Year ended | Year ended |
Increase (Decrease) in Net Assets | ||
Operations | ||
Net investment income (loss) | $ 533,299 | $ 501,849 |
Net realized gain (loss) | 433,922 | (2,833,789) |
Change in net unrealized appreciation (depreciation) | 15,349,973 | (16,564,859) |
Net increase (decrease) in net assets resulting | 16,317,194 | (18,896,799) |
Distributions to shareholders from net investment income | (529,813) | (463,049) |
Share transactions | 8,286,655 | 7,979,720 |
Reinvestment of distributions | 517,381 | 451,374 |
Cost of shares redeemed | (11,958,810) | (12,724,727) |
Net increase (decrease) in net assets resulting from share transactions | (3,154,774) | (4,293,633) |
Total increase (decrease) in net assets | 12,632,607 | (23,653,481) |
Net Assets | ||
Beginning of period | 54,164,385 | 77,817,866 |
End of period (including undistributed net investment income of $142,824 and undistributed net investment income of $139,287, respectively) | $ 66,796,992 | $ 54,164,385 |
Other Information Shares | ||
Sold | 90,730 | 96,247 |
Issued in reinvestment of distributions | 5,704 | 5,327 |
Redeemed | (128,913) | (154,048) |
Net increase (decrease) | (32,479) | (52,474) |
See accompanying notes which are an integral part of the financial statements.
Annual Report
Financial Highlights
Years ended March 31, | 2004 | 2003 | 2002 | 2001 | 2000 |
Selected Per-Share Data | |||||
Net asset value, beginning of period | $ 76.69 | $ 102.55 | $ 104.50 | $ 143.26 | $ 129.75 |
Income from Investment Operations | |||||
Net investment income (loss) C | .76 | .69 | .45 | .37 | .59 |
Net realized and unrealized gain (loss) | 22.44 | (25.91) | (1.14) | (34.17) | 25.04 |
Total from investment operations | 23.20 | (25.22) | (.69) | (33.80) | 25.63 |
Distributions from net investment income | (.76) | (.64) | (.46) | (.27) | (.73) |
Distributions from net realized gain | - | - | (.80) | (4.69) | (11.39) |
Total distributions | (.76) | (.64) | (1.26) | (4.96) | (12.12) |
Net asset value, end of period | $ 99.13 | $ 76.69 | $ 102.55 | $ 104.50 | $ 143.26 |
Total Return A, B | 30.35% | (24.65)% | (.76)% | (24.22)% | 21.11% |
Ratios to Average Net Assets D | |||||
Expenses before expense reductions | .70% | .77% | .89% | .89% | .75% |
Expenses net of voluntary waivers, if any | .70% | .77% | .89% | .89% | .75% |
Expenses net of all reductions | .70% | .76% | .88% | .88% | .74% |
Net investment income (loss) | .83% | .82% | .43% | .29% | .46% |
Supplemental Data | |||||
Net assets, end of period | $ 66,797 | $ 54,164 | $ 77,818 | $ 80,190 | $ 109,095 |
Portfolio turnover rate | 13% | 21% | 15% | 24% | 28% |
A Total returns would have been lower had certain expenses not been reduced during the periods shown.
B Total returns do not include the effect of the former sales charges.
C Calculated based on average shares outstanding during the period.
D Expense ratios reflect operating expenses of the fund. Expenses before reductions do not reflect amounts reimbursed by the investment adviser or reductions from brokerage service arrangements or other expense offset arrangements and do not represent the amount paid by the fund during periods when reimbursements or reductions occur. Expenses net of any voluntary waivers reflect expenses after reimbursement by the investment adviser but prior to reductions from brokerage service arrangements or other expense offset arrangements. Expenses net of all reductions represent the net expenses paid by the fund.
See accompanying notes which are an integral part of the financial statements.
Annual Report
Notes to Financial Statements
For the period ended March 31, 2004
(Amounts in thousands except ratios)
1. Significant Accounting Policies.
Fidelity Magellan Fund (the fund) is registered under the Investment Company Act of 1940, as amended (the 1940 Act), as an open-end management investment company organized as a Massachusetts business trust and is authorized to issue an unlimited number of shares. The fund is currently closed to new accounts. The financial statements have been prepared in conformity with accounting principles generally accepted in the United States of America, which require management to make certain estimates and assumptions at the date of the financial statements. The following summarizes the significant accounting policies of the fund:
Security Valuation. Net asset value per share (NAV calculation) is calculated as of the close of business of the New York Stock Exchange, normally 4:00 p.m. Eastern time. Equity securities for which market quotations are available are valued at the last sale price or official closing price (closing bid price or last evaluated quote if no sale has occurred) on the primary market or exchange on which they trade. If prices are not readily available or do not accurately reflect fair value for a security, or if a security's value has been materially affected by events occurring after the close of the exchange or market on which the security is principally traded, that security may be valued by another method that the Board of Trustees believes accurately reflects fair value. A security's valuation may differ depending on the method used for determining value. Price movements in futures contracts and ADRs, market and trading trends, the bid/ask quotes of brokers and off-exchange institutional trading may be reviewed in the course of making a good faith determination of a security's fair value. Short-term securities with remaining maturities of sixty days or less for which quotations are not readily available are valued on the basis of amortized cost. Investments in open-end investment companies are valued at their net asset value each business day.
Foreign Currency. The fund uses foreign currency contracts to facilitate transactions in foreign-denominated securities. Losses from these transactions may arise from changes in the value of the foreign currency or if the counterparties do not perform under the contracts' terms.
Foreign-denominated assets, including investment securities, and liabilities are translated into U.S. dollars at the exchange rate at period end. Purchases and sales of investment securities, income and dividends received and expenses denominated in foreign currencies are translated into U.S. dollars at the exchange rate in effect on the transaction date.
The effects of exchange rate fluctuations on investments are included with the net realized and unrealized gain (loss) on investment securities. Other foreign currency transactions resulting in realized and unrealized gain (loss) are disclosed separately.
Annual Report
Notes to Financial Statements - continued
(Amounts in thousands except ratios)
1. Significant Accounting Policies - continued
Investment Transactions and Income. Security transactions are accounted for as of trade date. Gains and losses on securities sold are determined on the basis of identified cost. Dividend income is recorded on the ex-dividend date, except for certain dividends from foreign securities where the ex-dividend date may have passed, which are recorded as soon as the fund is informed of the ex-dividend date. Non-cash dividends included in dividend income, if any, are recorded at the fair market value of the securities received. The fund estimates the components of distributions received from Real Estate Investment Trusts (REITs). Distributions received in excess of income are recorded as a reduction of cost of investments and/or as a realized gain. Interest income is accrued as earned. Interest income includes coupon interest and amortization of premium and accretion of discount on debt securities, which is accrued using the interest method. Investment income is recorded net of foreign taxes withheld where recovery of such taxes is uncertain.
Expenses. Most expenses of the trust can be directly attributed to a fund. Expenses which cannot be directly attributed are apportioned among the funds in the trust.
Deferred Trustee Compensation. Under a Deferred Compensation Plan (the Plan), non-interested Trustees must defer receipt of a portion of, and may elect to defer receipt of an additional portion of, their annual compensation. Deferred amounts are treated as though equivalent dollar amounts had been invested in shares of the fund or are invested in a cross-section of other Fidelity funds, and are marked-to-market. Deferred amounts remain in the fund until distributed in accordance with the Plan.
Income Tax Information and Distributions to Shareholders. Each year, the fund intends to qualify as a regulated investment company by distributing all of its taxable income and realized gains under Subchapter M of the Internal Revenue Code. As a result, no provision for income taxes is required in the accompanying financial statements. Foreign taxes are provided for based on each fund's understanding of the tax rules and rates that exist in the foreign markets in which it invests. Distributions are recorded on the ex-dividend date.
Income and capital gain distributions are determined in accordance with income tax regulations, which may differ from generally accepted accounting principles. Capital accounts within the financial statements are adjusted for permanent and temporary book and tax differences. These adjustments have no impact on net assets or the results of operations. Temporary differences will reverse in a subsequent period. These differences are primarily due to foreign currency transactions, partnerships, capital loss carryforwards and losses deferred due to wash sales.
Annual Report
1. Significant Accounting Policies - continued
Income Tax Information and Distributions to Shareholders - continued
The tax-basis components of distributable earnings and the federal tax cost as of period end were as follows:
Unrealized appreciation | $ 23,285,015 | |
Unrealized depreciation | (2,046,358) | |
Net unrealized appreciation (depreciation) | 21,238,657 | |
Undistributed ordinary income | 132,842 | |
Capital loss carryforward | (4,395,821) | |
Cost for federal income tax purposes | $ 45,747,727 |
The tax character of distributions paid was as follows:
March 31, | March 31, | |
Ordinary Income | $ 529,813 | $ 463,049 |
2. Operating Policies.
Repurchase Agreements. Fidelity Management & Research Company (FMR) has received an Exemptive Order from the Securities and Exchange Commission (the SEC) which permits the fund and other affiliated entities of FMR to transfer uninvested cash balances into joint trading accounts. These accounts are then invested in repurchase agreements that are collateralized by U.S. Treasury or Government obligations. The fund may also invest directly with institutions, in repurchase agreements that are collateralized by commercial paper obligations and corporate obligations. Collateral is held in segregated accounts with custodian banks and may be obtained in the event of a default of the counterparty. Collateral is marked-to-market daily and maintained at a value at least equal to the principal amount of the repurchase agreement (including accrued interest).
Restricted Securities. The fund may invest in securities that are subject to legal or contractual restrictions on resale. These securities generally may be resold in transactions exempt from registration or to the public if the securities are registered. Disposal of these securities may involve time-consuming negotiations and expense, and prompt sale at an acceptable price may be difficult. Information regarding restricted securities is included at the end of the fund's Schedule of Investments.
3. Purchases and Sales of Investments.
Information regarding purchases and sales of securities is included under the caption "Other Information" at the end of the fund's Schedule of Investments.
Annual Report
Notes to Financial Statements - continued
(Amounts in thousands except ratios)
4. Fees and Other Transactions with Affiliates.
Management Fee. FMR and its affiliates provide the fund with investment management related services for which the fund pays a monthly management fee. The management fee is the sum of an individual fund fee rate that is based on an annual rate of .30% of the fund's average net assets and a group fee rate that averaged .28% during the period. The group fee rate is based upon the average net assets of all the mutual funds advised by FMR. The group fee rate decreases as assets under management increase and increases as assets under management decrease. In addition, the management fee is subject to a performance adjustment (up to a maximum of ±.20% of the fund's average net assets over a 36 month performance period). The upward or downward adjustment to the management fee is based on the fund's relative investment performance as compared to an appropriate benchmark index. For the period, the total annual management fee rate, including the performance adjustment, was .50% of the fund's average net assets.
Sales Load. For the period, Fidelity Distributors Corporation (FDC), an affiliate of FMR, received sales charges of $685 on sales of shares of the fund all of which was retained. Effective June 23, 2003, after 4:00 p.m. Eastern time, the fund's sales charge was eliminated.
Transfer Agent Fees. Fidelity Service Company, Inc. (FSC), an affiliate of FMR, is the fund's transfer, dividend disbursing and shareholder servicing agent. FSC receives account fees and asset-based fees that vary according to account size and type of account. FSC pays for typesetting, printing and mailing of shareholder reports, except proxy statements. For the period, the transfer agent fees were equivalent to an annual rate of .19% of average net assets.
Accounting and Security Lending Fees. FSC maintains the fund's accounting records. The accounting fee is based on the level of average net assets for the month. Under a separate contract, FSC administers the security lending program. The security lending fee is based on the number and duration of lending transactions.
Central Funds. The fund may invest in affiliated Central Funds managed by Fidelity Investments Money Management, Inc. (FIMM), an affiliate of FMR. The Central Funds are open-end investment companies available only to investment companies and other accounts managed by FMR and its affiliates. The Central Funds seek preservation of capital and current income and do not pay a management fee. Income distributions earned by the fund are recorded as income in the accompanying financial statements and totaled $32,196 for the period.
Brokerage Commissions. The fund placed a portion of its portfolio transactions with brokerage firms which are affiliates of the investment adviser. The commissions paid to these affiliated firms are shown under the caption "Other Information" at the end of the fund's Schedule of Investments.
Annual Report
5. Committed Line of Credit.
The fund participates with other funds managed by FMR in a $4.2 billion credit facility (the "line of credit") to be utilized for temporary or emergency purposes to fund shareholder redemptions or for other short-term liquidity purposes. The fund has agreed to pay commitment fees on its pro rata portion of the line of credit. During the period, there were no borrowings on this line of credit.
6. Security Lending.
The fund lends portfolio securities from time to time in order to earn additional income. The fund receives collateral (in the form of U.S. Treasury obligations, letters of credit and/or cash) against the loaned securities and maintains collateral in an amount not less than 100% of the market value of the loaned securities during the period of the loan. The market value of the loaned securities is determined at the close of business of the fund and any additional required collateral is delivered to the fund on the next business day. If the borrower defaults on its obligation to return the securities loaned because of insolvency or other reasons, a fund could experience delays and costs in recovering the securities loaned or in gaining access to the collateral. Cash collateral is invested in cash equivalents. The value of loaned securities and cash collateral at period end are disclosed on the fund's Statement of Assets and Liabilities.
7. Expense Reductions.
Many of the brokers with whom FMR places trades on behalf of the fund provided services to the fund in addition to trade execution. These services included payments of certain expenses on behalf of the fund totaling $2,574 for the period. In addition, through arrangements with the fund's transfer agent, credits realized as a result of uninvested cash balances were used to reduce the fund's expenses. During the period, these credits reduced the fund's transfer agent expenses by $568.
8. Transactions with Affiliated Companies.
An affiliated company is a company in which the fund has ownership of at least 5% of the voting securities. Companies which are affiliates of the fund at period-end are noted in the fund's Schedule of Investments. Transactions during the period with companies which are or were affiliates are as follows:
Affiliate | Value, beginning | Purchases | Sales | Dividend | Value, end |
Extended Stay America, Inc. | $ 59,182 | $ - | $ 75,843 | $ 465 | $ 36,749 |
Annual Report
Report of Independent Auditors
To the Trustees and Shareholders of Fidelity Magellan Fund:
In our opinion, the accompanying statement of assets and liabilities, including the schedule of investments, and the related statements of operations and of changes in net assets and the financial highlights present fairly, in all material respects, the financial position of Fidelity Magellan Fund at March 31, 2004 and the results of its operations, the changes in its net assets and the financial highlights for the periods indicated, in conformity with accounting principles generally accepted in the United States of America. These financial statements and financial highlights (hereafter referred to as "financial statements") are the responsibility of the Fidelity Magellan Fund's management; our responsibility is to express an opinion on these financial statements based on our audits. We conducted our audits of these financial statements in accordance with auditing standards generally accepted in the United States of America which require that we plan and perform the audit to obtain reasonable assurance about whether the financial statements are free of material misstatement. An audit includes examining, on a test basis, evidence supporting the amounts and disclosures in the financial statements, assessing the accounting principles used and significant estimates made by management, and evaluating the overall financial statement presentation. We believe that our audits, which included confirmation of securities at March 31, 2004 by correspondence with the custodian and brokers, provide a reasonable basis for our opinion.
/s/PricewaterhouseCoopers LLP
PricewaterhouseCoopers LLP
Boston, Massachusetts
May 13, 2004
Annual Report
Trustees and Officers
The Trustees, Members of the Advisory Board, and executive officers of the trust and fund, as applicable, are listed below. The Board of Trustees governs the fund and is responsible for protecting the interests of shareholders. The Trustees are experienced executives who meet periodically throughout the year to oversee the fund's activities, review contractual arrangements with companies that provide services to the fund, and review the fund's performance. Except for William O. McCoy, each of the Trustees oversees 292 funds advised by FMR or an affiliate. Mr. McCoy oversees 294 funds advised by FMR or an affiliate.
The Trustees hold office without limit in time except that (a) any Trustee may resign; (b) any Trustee may be removed by written instrument, signed by at least two-thirds of the number of Trustees prior to such removal; (c) any Trustee who requests to be retired or who has become incapacitated by illness or injury may be retired by written instrument signed by a majority of the other Trustees; and (d) any Trustee may be removed at any special meeting of shareholders by a two-thirds vote of the outstanding voting securities of the trust. In any event, each non-interested Trustee shall retire not later than the last day of the calendar year in which his or her 72nd birthday occurs. The executive officers and Advisory Board Members hold office without limit in time, except that any officer and Advisory Board Member may resign or may be removed by a vote of a majority of the Trustees at any regular meeting or any special meeting of the Trustees. Except as indicated, each individual has held the office shown or other offices in the same company for the past five years.
The fund's Statement of Additional Information (SAI) includes more information about the Trustees. To request a free copy, call Fidelity at 1-800-544-8544.
Interested Trustees*:
Correspondence intended for each Trustee who is an "interested person" (as defined in the 1940 Act) may be sent to Fidelity Investments, 82 Devonshire Street, Boston, Massachusetts 02109.
Name, Age; Principal Occupation | |
Edward C. Johnson 3d (73)** | |
Year of Election or Appointment: 1984 Mr. Johnson is Chairman of the Board of Trustees. Mr. Johnson serves as Chief Executive Officer, Chairman, and a Director of FMR Corp.; a Director and Chairman of the Board and of the Executive Committee of FMR; Chairman and a Director of Fidelity Management & Research (Far East) Inc.; Chairman (1998) and a Director of Fidelity Investments Money Management, Inc.; and Chairman (2001) and a Director (2000) of FMR Co., Inc. | |
Abigail P. Johnson (42)** | |
Year of Election or Appointment: 2001 Senior Vice President of Magellan. Ms. Johnson also serves as Senior Vice President of other Fidelity funds (2001). She is President and a Director of FMR (2001), Fidelity Investments Money Management, Inc. (2001), FMR Co., Inc. (2001), and a Director of FMR Corp. Previously, Ms. Johnson managed a number of Fidelity funds. | |
Laura B. Cronin (49) | |
Year of Election or Appointment: 2003 Ms. Cronin is an Executive Vice President (2002) and Chief Financial Officer (2002) of FMR Corp. and is a member of the Fidelity Management Committee (2003). Previously, Ms. Cronin served as Vice President of Finance of FMR (1997-1999), and Chief Financial Officer of FMR (1999-2001), Fidelity Personal Investments (2001), and Fidelity Brokerage Company (2001-2002). | |
Robert L. Reynolds (52) | |
Year of Election or Appointment: 2003 Mr. Reynolds is a Director (2003) and Chief Operating Officer (2002) of FMR Corp. and is the head of the Fidelity Management Committee (2003). He also serves on the Board at Fidelity Investments Canada, Ltd. (2000). Previously, Mr. Reynolds served as President of Fidelity Investments Institutional Retirement Group (1996-2000). | |
* Trustees have been determined to be "Interested Trustees" by virtue of, among other things, their affiliation with the trust or various entities under common control with FMR.
** Edward C. Johnson 3d, Trustee, is Abigail P. Johnson's father.
Annual Report
Non-Interested Trustees:
Correspondence intended for each non-interested Trustee (that is, the Trustees other than the Interested Trustees) may be sent to Fidelity Investments, P.O. Box 55235, Boston, Massachusetts 02205-5235.
Name, Age; Principal Occupation | |
J. Michael Cook (61) | |
Year of Election or Appointment: 2001 Prior to Mr. Cook's retirement in May 1999, he served as Chairman and Chief Executive Officer of Deloitte & Touche LLP (accounting/consulting), Chairman of the Deloitte & Touche Foundation, and a member of the Board of Deloitte Touche Tohmatsu. He currently serves as a Director of Comcast (telecommunications, 2002), International Flavors & Fragrances, Inc. (2000), The Dow Chemical Company (2000), and Northrop Grumman Corporation (global defense technology, 2003). He is a Member of the Diversity Advisory Council of Marakon (2003) and the Advisory Board of the Directorship Search Group, Chairman Emeritus of the Board of Catalyst (a leading organization for the advancement of women in business), and is Chairman of the Accountability Advisory Council to the Comptroller General of the United States. He also serves as a Member of the Advisory Board of the Graduate School of Business of the University of Florida, his alma mater. | |
Ralph F. Cox (71) | |
Year of Election or Appointment: 1991 Mr. Cox is President of RABAR Enterprises (management consulting for the petroleum industry). Prior to February 1994, he was President of Greenhill Petroleum Corporation (petroleum exploration and production). Until March 1990, Mr. Cox was President and Chief Operating Officer of Union Pacific Resources Company (exploration and production). He is a Director of CH2M Hill Companies (engineering), and Abraxas Petroleum (petroleum exploration and production, 1999). In addition, he is a member of advisory boards of Texas A&M University and the University of Texas at Austin. | |
Robert M. Gates (60) | |
Year of Election or Appointment: 1997 Dr. Gates is President of Texas A&M University (2002). He was Director of the Central Intelligence Agency (CIA) from 1991 to 1993. From 1989 to 1991, Dr. Gates served as Assistant to the President of the United States and Deputy National Security Advisor. Dr. Gates is a Director of NACCO Industries, Inc. (mining and manufacturing), Parker Drilling Co., Inc. (drilling and rental tools for the energy industry, 2001), and Brinker International (restaurant management, 2003). He also serves as a member of the Advisory Board of VoteHere.net (secure internet voting, 2001). Previously, Dr. Gates served as a Director of LucasVarity PLC (automotive components and diesel engines), a Director of TRW Inc. (automotive, space, defense, and information technology), and Dean of the George Bush School of Government and Public Service at Texas A&M University (1999-2001). Dr. Gates also is a Trustee of the Forum for International Policy. | |
George H. Heilmeier (67) | |
Year of Election or Appointment: 2004 Dr. Heilmeier is Chairman Emeritus of Telcordia Technologies (communication software and systems), where prior to his retirement, he served as company Chairman and Chief Executive Officer. He currently serves on the Boards of Directors of The Mitre Corporation (systems engineering and information technology support for the government), INET Technologies Inc. (telecommunications network surveillance, 2001) and Teletech Holdings (customer management services, 1998). He is Chairman of the General Motors Technology Advisory Committee and a Life Fellow of the IEEE (2000). Dr. Heilmeier is a member of the Defense Science Board and the National Security Agency Advisory Board. He is also a member of the National Academy of Engineering, the American Academy of Arts and Sciences and The Board of Overseers of the School of Engineering and Applied Science of the University of Pennsylvania. Previously, Dr. Heilmeier served as a Director of TRW Inc. (automotive, space, defense, and information technology, 1992-2002) and Compaq (1994-2002). | |
Donald J. Kirk (71) | |
Year of Election or Appointment: 1987 Mr. Kirk is a Governor of the American Stock Exchange (2001), a Trustee and former Chairman of the Board of Trustees of the Greenwich Hospital Association, a Director of the Yale-New Haven Health Services Corp. (1998), and a Director Emeritus and former Chairman of the Board of Directors of National Arts Strategies Inc. Mr. Kirk was an Executive-in-Residence (1995-2000) and a Professor (1987-1995) at Columbia University Graduate School of Business. Prior to 1987, he was Chairman of the Financial Accounting Standards Board. Previously, Mr. Kirk served as a Governor of the National Association of Securities Dealers, Inc. (1996-2002), a member and Vice Chairman of the Public Oversight Board of the American Institute of Certified Public Accountants' SEC Practice Section (1995-2002), a Director of General Re Corporation (reinsurance, 1987-1998) and as a Director of Valuation Research Corp. (appraisals and valuations). | |
Marie L. Knowles (57) | |
Year of Election or Appointment: 2001 Prior to Ms. Knowles' retirement in June 2000, she served as Executive Vice President and Chief Financial Officer of Atlantic Richfield Company (ARCO) (diversified energy, 1996-2000). From 1993 to 1996, she was a Senior Vice President of ARCO and President of ARCO Transportation Company. She served as a Director of ARCO from 1996 to 1998. She currently serves as a Director of Phelps Dodge Corporation (copper mining and manufacturing) and McKesson Corporation (healthcare service, 2002). Ms. Knowles is a Trustee of the Brookings Institution and the Catalina Island Conservancy and also serves as a member of the Advisory Board for the School of Engineering of the University of Southern California. | |
Ned C. Lautenbach (60) | |
Year of Election or Appointment: 2000 Mr. Lautenbach has been a partner of Clayton, Dubilier & Rice, Inc. (private equity investment firm) since September 1998. Previously, Mr. Lautenbach was with the International Business Machines Corporation (IBM) from 1968 until his retirement in 1998. He was most recently Senior Vice President and Group Executive of Worldwide Sales and Services. From 1993 to 1995, he was Chairman of IBM World Trade Corporation, and from 1994 to 1998 was a member of IBM's Corporate Executive Committee. Mr. Lautenbach serves as Co-Chairman and a Director of Covansys, Inc. (global provider of business and technology solutions, 2000). In addition, he is a Director of Eaton Corporation (diversified industrial) and the Philharmonic Center for the Arts in Naples, Florida (1999). He also is a member of the Council on Foreign Relations. | |
Marvin L. Mann (70) | |
Year of Election or Appointment: 1993 Mr. Mann is Chairman of the non-interested Trustees (2001). He is Chairman Emeritus of Lexmark International, Inc. (computer peripherals) where he served as CEO until April 1998 and retired as Chairman May 1999, and remains a member of the Board. Prior to 1991, he held the positions of Vice President of International Business Machines Corporation (IBM) and President and General Manager of various IBM divisions and subsidiaries. He is also a member of the Director Services Committee of the Investment Company Institute. In addition, Mr. Mann is a member of the President's Cabinet at the University of Alabama and the Board of Visitors of the Culverhouse College of Commerce and Business Administration at the University of Alabama. | |
William O. McCoy (70) | |
Year of Election or Appointment: 1997 Prior to his retirement in December 1994, Mr. McCoy was Vice Chairman of the Board of BellSouth Corporation (telecommunications) and President of BellSouth Enterprises. He is currently a Director of Liberty Corporation (holding company), Duke Realty Corporation (real estate), and Progress Energy, Inc. (electric utility). He is also a partner of Franklin Street Partners (private investment management firm) and a member of the Research Triangle Foundation Board. In addition, Mr. McCoy served as the Interim Chancellor (1999-2000) and a member of the Board of Visitors (1994-1998) for the University of North Carolina at Chapel Hill and currently serves on the Board of Directors of the University of North Carolina Health Care System and the Board of Visitors of the Kenan-Flagler Business School (University of North Carolina at Chapel Hill). He also served as Vice President of Finance for the University of North Carolina (16-school system, 1995-1998). | |
William S. Stavropoulos (64) | |
Year of Election or Appointment: 2001 Mr. Stavropoulos is Chairman of the Board (2000), CEO (2002), a position he previously held from 1995-2000, Chairman of the Executive Committee (2000), and a Member of the Board of Directors of The Dow Chemical Company. Since joining The Dow Chemical Company in 1967, Mr. Stavropoulos served in numerous senior management positions, including President (1993-2000; 2002-2003). Currently, he is a Director of NCR Corporation (data warehousing and technology solutions), BellSouth Corporation (telecommunications), Chemical Financial Corporation, and Maersk Inc. (industrial conglomerate, 2002). He also serves as a member of the Board of Trustees of the American Enterprise Institute for Public Policy Research. In addition, Mr. Stavropoulos is a member of The Business Council, J.P. Morgan International Council and the University of Notre Dame Advisory Council for the College of Science. | |
Advisory Board Members and Executive Officers:
Correspondence intended for Ms. Small may be sent to Fidelity Investments, P.O. Box 55235, Boston, Massachusetts 02205-5235. Correspondence intended for each executive officer and Mr. Lynch may be sent to Fidelity Investments, 82 Devonshire Street, Boston, Massachusetts 02109.
Name, Age; Principal Occupation | |
Peter S. Lynch (61) | |
Year of Election or Appointment: 2003 Member of the Advisory Board of Fidelity Magellan Fund. Vice Chairman and a Director of FMR, and Vice Chairman (2001) and a Director (2000) of FMR Co., Inc. Previously, Mr. Lynch served as a Trustee of the Fidelity funds (1990-2003). Prior to May 31, 1990, he was a Director of FMR and Executive Vice President of FMR (a position he held until March 31, 1991), Vice President of Fidelity Magellan Fund and FMR Growth Group Leader, and Managing Director of FMR Corp. Mr. Lynch was also Vice President of Fidelity Investments Corporate Services. In addition, he serves as a Trustee of Boston College, Massachusetts Eye & Ear Infirmary, Historic Deerfield, John F. Kennedy Library, and the Museum of Fine Arts of Boston. | |
Cornelia M. Small (59) | |
Year of Election or Appointment: 2004 Member of the Advisory Board of Fidelity Magellan Fund. Ms. Small is a member (2000) and Chairperson (2002) of the Investment Committee, and a member (2002) of the Board of Trustees of Smith College. Previously, she served as Chief Investment Officer (1999-2000), Director of Global Equity Investments (1996-1999), and a member of the Board of Directors of Scudder, Stevens & Clark (1990-1997) and Scudder Kemper Investments (1997-1998). In addition, Ms. Small served as Co-Chair (2000-2003) of the Annual Fund for the Fletcher School of Law and Diplomacy. | |
John B. McDowell (45) | |
Year of Election or Appointment: 2002 Vice President of Magellan. Mr. McDowell also serves as Vice President of certain Equity Funds (2002). He is Senior Vice President of FMR (1999), FMR Co., Inc. (2001), and Fidelity Management Trust Company (FMTC). Since joining Fidelity Investments in 1985, Mr. McDowell has worked as a research analyst and manager. | |
Robert E. Stansky (48) | |
Year of Election or Appointment: 1996 Vice President of Magellan. Mr. Stansky also serves as Senior Vice President of FMR and FMR Co., Inc. (2001). | |
Eric D. Roiter (55) | |
Year of Election or Appointment: 1998 Secretary of Magellan. He also serves as Secretary of other Fidelity funds (1998); Vice President, General Counsel, and Clerk of FMR Co., Inc. (2001) and FMR (1998); Vice President and Clerk of FDC (1998); Assistant Clerk of Fidelity Management & Research (U.K.) Inc. (2001) and Fidelity Management & Research (Far East) Inc. (2001); and Assistant Secretary of Fidelity Investments Money Management, Inc. (2001). Prior to joining Fidelity, Mr. Roiter was with the law firm of Debevoise & Plimpton, as an associate (1981-1984) and as a partner (1985-1997), and served as an Assistant General Counsel of the U.S. Securities and Exchange Commission (1979-1981). Mr. Roiter is an Adjunct Member, Faculty of Law, at Boston College Law School (2003). | |
Stuart Fross (44) | |
Year of Election or Appointment: 2003 Assistant Secretary of Magellan. Mr. Fross also serves as Assistant Secretary of other Fidelity funds (2003) and is an employee of FMR. | |
Christine Reynolds (45) | |
Year of Election or Appointment: 2004 President, Treasurer, and Anti-Money Laundering (AML) officer of Magellan. Ms. Reynolds also serves as President, Treasurer, and AML officer of other Fidelity funds (2004) and is a Vice President (2003) and an employee (2002) of FMR. Before joining Fidelity Investments, Ms. Reynolds worked at PricewaterhouseCoopers LLP (PwC) (1980-2002), where she was most recently an audit partner with PwC's investment management practice. | |
Timothy F. Hayes (53) | |
Year of Election or Appointment: 2002 Chief Financial Officer of Magellan. Mr. Hayes also serves as Chief Financial Officer of other Fidelity funds (2002). Recently he was appointed President of Fidelity Service Company (2003) where he also serves as a Director. Mr. Hayes also serves as President of Fidelity Investments Operations Group (FIOG, 2002), which includes Fidelity Pricing and Cash Management Services Group (FPCMS), where he was appointed President in 1998. Previously, Mr. Hayes served as Chief Financial Officer of Fidelity Investments Corporate Systems and Service Group (1998) and Fidelity Systems Company (1997-1998). | |
John R. Hebble (45) | |
Year of Election or Appointment: 2003 Deputy Treasurer of Magellan. Mr. Hebble also serves as Deputy Treasurer of other Fidelity funds (2003), and is an employee of FMR. Before joining Fidelity Investments, Mr. Hebble worked at Deutsche Asset Management where he served as Director of Fund Accounting (2002-2003) and Assistant Treasurer of the Scudder Funds (1998-2003). | |
Kimberley H. Monasterio (40) | |
Year of Election or Appointment: 2004 Deputy Treasurer of Magellan. Ms. Monasterio also serves as Deputy Treasurer of other Fidelity funds (2004) and is an employee of FMR (2004). Before joining Fidelity Investments, Ms. Monasterio served as Treasurer (2000-2004) and Chief Financial Officer (2002-2004) of the Franklin Templeton Funds and Senior Vice President of Franklin Templeton Services, LLC (2000-2004). | |
John H. Costello (57) | |
Year of Election or Appointment: 1986 Assistant Treasurer of Magellan. Mr. Costello also serves as Assistant Treasurer of other Fidelity funds and is an employee of FMR. | |
Francis V. Knox, Jr. (56) | |
Year of Election or Appointment: 2002 Assistant Treasurer of Magellan. Mr. Knox also serves as Assistant Treasurer of other Fidelity funds (2002), and is a Vice President and an employee of FMR. Previously, Mr. Knox served as Vice President of Investment & Advisor Compliance (1990-2001), and Compliance Officer of Fidelity Management & Research (U.K.) Inc. (1992-2002), Fidelity Management & Research (Far East) Inc. (1991-2002), and FMR Corp. (1995-2002). | |
Peter L. Lydecker (50) | |
Year of Election or Appointment: 2004 Assistant Treasurer of Magellan. Mr. Lydecker also serves as Assistant Treasurer of other Fidelity funds (2004) and is an employee of FMR. | |
Mark Osterheld (48) | |
Year of Election or Appointment: 2002 Assistant Treasurer of Magellan. Mr. Osterheld also serves as Assistant Treasurer of other Fidelity funds (2002) and is an employee of FMR. | |
Thomas J. Simpson (45) | |
Year of Election or Appointment: 2000 Assistant Treasurer of Magellan. Mr. Simpson is Assistant Treasurer of other Fidelity funds (2000) and an employee of FMR (1996). Prior to joining FMR, Mr. Simpson was Vice President and Fund Controller of Liberty Investment Services (1987-1995). | |
Annual Report
Distributions
The fund designates 100% of the dividends distributed during the fiscal year as qualifying for the dividends-received deduction for corporate shareholders.
The fund designates 100% of the dividends distributed during the fiscal year as amounts which may be taken into account as a dividend for purposes of the maximum rate under section 1(h)(11) of the Internal Revenue Code.
The fund will notify shareholders in January 2005 of amounts for use in preparing 2004 income tax returns.
Annual Report
Item 2. Code of Ethics
As of the end of the period, March 31, 2004, Fidelity Magellan Fund (the trust) has adopted a code of ethics, as defined in Item 2 of Form N-CSR, that applies to its President and Treasurer and its Chief Financial Officer. A copy of the code of ethics is filed as an exhibit to this Form N-CSR.
Item 3. Audit Committee Financial Expert
The Board of Trustees of the trust has determined that Marie L. Knowles and Donald J. Kirk are each audit committee financial experts, as defined in Item 3 of Form N-CSR. Ms. Knowles and Mr. Kirk are each independent for purposes of Item 3 of Form N-CSR.
Item 4. Principal Accountant Fees and Services
(a) Audit Fees.
For the fiscal years ended March 31, 2004 and March 31, 2003, the aggregate Audit Fees billed by PricewaterhouseCoopers LLP (PwC) for professional services rendered for the audits of the financial statements, or services that are normally provided in connection with statutory and regulatory filings or engagements for those fiscal years, for the Fidelity Magellan Fund (the fund) and for all funds in the Fidelity Group of Funds are shown in the table below.
Fund | 2004A | 2003A |
Fidelity Magellan Fund | $297,000 | $307,000 |
All funds in the Fidelity Group of Funds audited by PwC | $10,600,000 | $8,600,000 |
A | Aggregate amounts may reflect rounding. |
(b) Audit-Related Fees.
In each of the fiscal years ended March 31, 2004 and March 31, 2003 the aggregate Audit-Related Fees billed by PwC for services rendered for assurance and related services to the fund that are reasonably related to the performance of the audit or review of the fund's financial statements, but not reported as Audit Fees, are shown in the table below.
Fund | 2004A,B | 2003A,B |
Fidelity Magellan Fund | $0 | $0 |
A | Aggregate amounts may reflect rounding. |
B | Includes amounts related to non-audit services prior to May 6, 2003 that would have been subject to pre-approval if the SEC rules relating to the pre-approval of non-audit services had been in effect at that time. |
In each of the fiscal years ended March 31, 2004 and March 31, 2003, the aggregate Audit-Related Fees that were billed by PwC that were required to be approved by the Audit Committee for services rendered on behalf of Fidelity Management & Research Company (FMR) and entities controlling, controlled by, or under common control with FMR (not including any sub-adviser whose role is primarily portfolio management and is subcontracted with or overseen by another investment adviser) that provide ongoing services to the fund ("Fund Service Providers") for assurance and related services that relate directly to the operations and financial reporting of the fund that are reasonably related to the performance of the audit or review of the fund's financial statements, but not reported as Audit Fees, are shown in the table below.
Billed By | 2004A,B | 2003A,B |
PwC | $50,000 | $0 |
A | Aggregate amounts may reflect rounding. |
B | Includes amounts related to non-audit services prior to May 6, 2003 that would have been subject to pre-approval if the SEC rules relating to the pre-approval of non-audit services had been in effect at that time. |
Fees included in the audit-related category comprise assurance and related services (e.g., due diligence services) that are traditionally performed by the independent accountant. These audit-related services include due diligence related to mergers and acquisitions, accounting consultations and audits in connection with acquisitions, internal control reviews, attest services that are not required by statute or regulation and consultation concerning financial accounting and reporting standards.
(c) Tax Fees.
In each of the fiscal years ended March 31, 2004 and March 31, 2003, the aggregate Tax Fees billed by PwC for professional services rendered for tax compliance, tax advice, and tax planning for the fund is shown in the table below.
Fund | 2004A,B | 2003A,B |
Fidelity Magellan Fund | $3,800 | $3,500 |
A | Aggregate amounts may reflect rounding. |
B | Includes amounts related to non-audit services prior to May 6, 2003 that would have been subject to pre-approval if the SEC rules relating to the pre-approval of non-audit services had been in effect at that time. |
In each of the fiscal years ended March 31, 2004 and March 31, 2003, the aggregate Tax Fees billed by PwC that were required to be approved by the Audit Committee for professional services rendered on behalf of the Fund Service Providers for tax compliance, tax advice, and tax planning that relate directly to the operations and financial reporting of the fund is shown in the table below.
Billed By | 2004A,B | 2003A,B |
PwC | $0 | $0 |
A | Aggregate amounts may reflect rounding. |
B | Includes amounts related to non-audit services prior to May 6, 2003 that would have been subject to pre-approval if the SEC rules relating to the pre-approval of non-audit services had been in effect at that time. |
Fees included in the Tax Fees category comprise all services performed by professional staff in the independent accountant's tax division except those services related to the audit. Typically, this category would include fees for tax compliance, tax planning, and tax advice. Tax compliance, tax advice, and tax planning services include preparation of original and amended tax returns, claims for refund and tax payment-planning services, assistance with tax audits and appeals, tax advice related to mergers and acquisitions and requests for rulings or technical advice from taxing authorities.
(d) All Other Fees.
In each of the fiscal years ended March 31, 2004 and March 31, 2003, the aggregate Other Fees billed by PwC for all other non-audit services rendered to the fund is shown in the table below.
Fund | 2004A,B | 2003A,B |
Fidelity Magellan Fund | $56,600 | $68,100 |
A | Aggregate amounts may reflect rounding. |
B | Includes amounts related to non-audit services prior to May 6, 2003 that would have been subject to pre-approval if the SEC rules relating to the pre-approval of non-audit services had been in effect at that time. |
In each of the fiscal years ended March 31, 2004 and March 31, 2003, the aggregate Other Fees billed by PwC that were required to be approved by the Audit Committee for all other non-audit services rendered on behalf of the Fund Service Providers that relate directly to the operations and financial reporting of the fund is shown in the table below.
Billed By | 2004A,B | 2003A,B |
PwC | $210,000 | $210,000 |
A | Aggregate amounts may reflect rounding. |
B | Includes amounts related to non-audit services prior to May 6, 2003 that would have been subject to pre-approval if the SEC rules relating to the pre-approval of non-audit services had been in effect at that time. |
Fees included in the All Other Fees category include services related to internal control reviews, strategy and other consulting, financial information systems design and implementation, consulting on other information systems, and other tax services unrelated to the fund.
(e) (1) | Audit Committee Pre-Approval Policies and Procedures: |
The trust's Audit Committee must pre-approve all audit and non-audit services provided by the independent accountant relating to the operations or financial reporting of the fund. Prior to the commencement of any audit or non-audit services to a fund, the Audit Committee reviews the services to determine whether they are appropriate and permissible under applicable law.
The trust's Audit Committee has adopted policies and procedures to, among other purposes, provide a framework for the Committee's consideration of non-audit services by the audit firms that audit the Fidelity funds. The policies and procedures require that any non-audit service provided by a fund audit firm to a Fidelity Fund and any non-audit service provided by a fund auditor to a Fund Service Provider that relates directly to the operations and financial reporting of a Fidelity fund (Covered Service) are subject to approval by the Audit Committee before such service is provided. Non-audit services provided by a fund audit firm for a Fund Service Provider that do not relate directly to the operations and financial reporting of a Fidelity fund (Non-Covered Service) but that are expected to exceed $50,000 are also subject to pre-approval by the Audit Committee.
All Covered Services, as well as Non-Covered Services that are expected to exceed $50,000, must be approved in advance of provision of the service either: (i) by formal resolution of the Audit Committee, or (ii) by oral or written approval of the service by the Chair of the Audit Committee (or if the Chair is unavailable, such other member of the Audit Committee as may be designated by the Audit Committee to act in the Chair's absence). The approval contemplated by (ii) above is permitted where the Treasurer determines that action on such an engagement is necessary before the next meeting of the Audit Committee. Neither pre-approval nor advance notice of Non-Covered Service engagements for which fees are not expected to exceed $50,000 is required; such engagements are to be reported to the Audit Committee monthly.
(e) (2) | Services approved pursuant to paragraph (c)(7)(i)(C) of Rule 2-01 of Regulation S-X: |
Audit-Related Fees:
There were no amounts, including amounts related to non-audit services prior to May 6, 2003 that would have been subject to pre-approval if the SEC rules relating to the pre-approval of non-audit services had been in effect at that time, that were approved by the Audit Committee pursuant to the de minimis exception for the fiscal years ended March 31, 2004 and March 31, 2003 on behalf of the fund.
There were no amounts, including amounts related to non-audit services prior to May 6, 2003 that would have been subject to pre-approval if the SEC rules relating to the pre-approval of non-audit services had been in effect at that time, that were required to be approved by the Audit Committee pursuant to the de minimis exception for the fiscal years ended March 31, 2004 and March 31, 2003 on behalf of the Fund Service Providers that relate directly to the operations and financial reporting of the fund.
Tax Fees:
There were no amounts, including amounts related to non-audit services prior to May 6, 2003 that would have been subject to pre-approval if the SEC rules relating to the pre-approval of non-audit services had been in effect at that time, that were approved by the Audit Committee pursuant to the de minimis exception for the fiscal years ended March 31, 2004 and March 31, 2003 on behalf of the fund.
There were no amounts, including amounts related to non-audit services prior to May 6, 2003 that would have been subject to pre-approval if the SEC rules relating to the pre-approval of non-audit services had been in effect at that time, that were required to be approved by the Audit Committee pursuant to the de minimis exception for the fiscal years ended March 31, 2004 and March 31, 2003 on behalf of the Fund Service Providers that relate directly to the operations and financial reporting of the fund.
All Other Fees:
There were no amounts, including amounts related to non-audit services prior to May 6, 2003 that would have been subject to pre-approval if the SEC rules relating to the pre-approval of non-audit services had been in effect at that time, that were approved by the Audit Committee pursuant to the de minimis exception for the fiscal years ended March 31, 2004 and March 31, 2003 on behalf of the fund.
There were no amounts, including amounts related to non-audit services prior to May 6, 2003 that would have been subject to pre-approval if the SEC rules relating to the pre-approval of non-audit services had been in effect at that time, that were required to be approved by the Audit Committee pursuant to the de minimis exception for the fiscal years ended March 31, 2004 and March 31, 2003 on behalf of the Fund Service Providers that relate directly to the operations and financial reporting of the fund.
(f) According to PwC for the fiscal year ended March 31, 2004, the percentage of hours spent on the audit of the fund's financial statements for the most recent fiscal year that were attributed to work performed by persons who are not full-time, permanent employees of PwC is as follows:
Fund | 2004 |
Fidelity Magellan Fund | 0% |
(g) For the fiscal years ended March 31, 2004 and March 31, 2003, the aggregate fees billed by PwC of $2,200,000A,B and $1,600,000A,B for non-audit services rendered on behalf of the fund, FMR (not including any sub-adviser whose role is primarily portfolio management and is subcontracted with or overseen by another investment adviser) and Fund Service Providers relating to Covered Services and Non-Covered Services are shown in the table below.
2004A,B | 2003A,B | |
Covered Services | $300,000 | $250,000 |
Non-Covered Services | $1,900,000 | $1,350,000 |
A | Aggregate amounts may reflect rounding. |
B | Includes amounts related to non-audit services prior to May 6, 2003 that would have been subject to pre-approval if the SEC rules relating to the pre-approval of non-audit services had been in effect at that time. |
(h) The trust's Audit Committee has considered Non-Covered Services that were not pre-approved that were provided by PwC to Fund Service Providers to be compatible with maintaining the independence of PwC in its audit of the fund, taking into account representations from PwC, in accordance with Independence Standards Board Standard No.1, regarding its independence from the fund and its related entities.
Item 5. Audit Committee of Listed Registrants
Not applicable.
Item 6. Schedule of Investments
Not applicable.
Item 7. Disclosure of Proxy Voting Policies and Procedures for Closed-End Management Investment Companies
Not applicable.
Item 8. Purchase of Equity Securities by Closed-End Management Investment Company and Affiliated Purchasers
Not applicable.
Item 9. Submission of Matters to a Vote of Security Holders
There were no material changes to the procedures by which shareholders may recommend nominees to the trust's Board of Trustees.
Item 10. Controls and Procedures
(a)(i) The President and Treasurer and the Chief Financial Officer have concluded that the trust's disclosure controls and procedures (as defined in Rule 30a-3(c) under the Investment Company Act) provide reasonable assurances that material information relating to the trust is made known to them by the appropriate persons, based on their evaluation of these controls and procedures as of a date within 90 days of the filing date of this report.
(a)(ii) There was no change in the trust's internal control over financial reporting (as defined in Rule 30a-3(d) under the Investment Company Act) that occurred during the trust's second fiscal half-year that has materially affected, or is reasonably likely to materially affect, the trust's internal control over financial reporting.
Item 11. Exhibits
(a) | (1) | Code of Ethics pursuant to Item 2 of Form N-CSR is filed and attached hereto as EX-99.CODE ETH. |
(a) | (2) | Certification pursuant to Rule 30a-2(a) under the Investment Company Act of 1940 (17 CFR 270.30a-2(a)) is filed and attached hereto as Exhibit 99.CERT. |
(a) | (3) | Not applicable. |
(b) | Certification pursuant to Rule 30a-2(b) under the Investment Company Act of 1940 (17 CFR 270.30a-2(b)) is furnished and attached hereto as Exhibit 99.906CERT. |
SIGNATURES
Pursuant to the requirements of the Securities Exchange Act of 1934 and the Investment Company Act of 1940, the registrant has duly caused this report to be signed on its behalf by the undersigned, thereunto duly authorized.
Fidelity Magellan Fund
By: | /s/Christine Reynolds |
Christine Reynolds | |
President and Treasurer | |
Date: | May 24, 2004 |
Pursuant to the requirements of the Securities Exchange Act of 1934 and the Investment Company Act of 1940, this report has been signed below by the following persons on behalf of the registrant and in the capacities and on the dates indicated.
By: | /s/Christine Reynolds |
Christine Reynolds | |
President and Treasurer | |
Date: | May 24, 2004 |
By: | /s/Timothy F. Hayes |
Timothy F. Hayes | |
Chief Financial Officer | |
Date: | May 24, 2004 |