UNITED STATES
SECURITIES AND EXCHANGE COMMISSION
Washington, D.C. 20549
FORM N-CSR
CERTIFIED SHAREHOLDER REPORT OF REGISTERED
MANAGEMENT INVESTMENT COMPANIES
Investment Company Act file number 811-1193
Fidelity Magellan Fund
(Exact name of registrant as specified in charter)
82 Devonshire St., Boston, Massachusetts 02109
(Address of principal executive offices) (Zip code)
Eric D. Roiter, Secretary
82 Devonshire St.
Boston, Massachusetts 02109
(Name and address of agent for service)
Registrant's telephone number, including area code: 617-563-7000
Date of fiscal year end: | March 31 |
| |
Date of reporting period: | March 31, 2006 |
Item 1. Reports to Stockholders
| | Annual Report
March 31, 2006
|


| Contents | | | | | | |
| |
| Chairman’s Message | | A-4 | | Ned Johnson’s message to shareholders. |
| Performance | | A-5 | | How the fund has done over time. |
| Management’s Discussion | | A-6 | | The manager’s review of fund |
| | | | | | | performance, strategy and outlook. |
| Shareholder Expense | | A-7 | | An example of shareholder expenses. |
| Example | | | | | | |
| Investment Changes | | A-8 | | A summary of major shifts in the fund’s |
| | | | | | | investments over the past six months. |
| Investments | | A-9 | | A complete list of the fund’s investments |
| | | | | | | with their market values. |
| Financial Statements | | A-23 | | Statements of assets and liabilities, |
| | | | | | | operations, and changes in net assets, |
| | | | | | | as well as financial highlights. |
| Notes | | A-27 | | Notes to the financial statements. |
| Report of Independent | | A-34 | | |
| Registered Public | | | | | | |
| Accounting Firm | | | | | | |
| Trustees and Officers | | A-35 | | |
| Distributions | | A-46 | | |
| Proxy Voting Results | | A-47 | | |
| Board Approval of | | A-48 | | |
| Investment Advisory | | | | | | |
| Contracts and | | | | | | |
| Management Fees | | | | | | |
| Prospectus | | P-1 | | |
To view a fund’s proxy voting guidelines and proxy voting record for the 12 month period ended
June 30, visit www.fidelity.com/proxyvotingresults or visit the Securities and Exchange Commis
sion’s (SEC) website at www.sec.gov. You may also call 1-800-544-8544 to request a free copy of
the proxy voting guidelines.
Standard & Poor’s, S&P and S&P 500 are registered service marks of The McGraw Hill Companies,
Inc. and have been licensed for use by Fidelity Distributors Corporation.
Other third party marks appearing herein are the property of their respective owners.
All other marks appearing herein are registered or unregistered trademarks or service marks of
FMR Corp. or an affiliated company.
|
Annual Report A-2
This report and the financial statements contained herein are submitted for the general information
of the shareholders of the fund. This report is not authorized for distribution to prospective investors
in the fund unless preceded or accompanied by an effective prospectus.
A fund files its complete schedule of portfolio holdings with the SEC for the first and third quarters of
each fiscal year on Form N Q. Forms N Q are available on the SEC’s web site at http://www.sec.gov. A
fund’s Forms N Q may be reviewed and copied at the SEC’s Public Reference Room in Washington, DC.
Information regarding the operation of the SEC’s Public Reference Room may be obtained by calling
1-800-SEC-0330. For a complete list of a fund’s portfolio holdings, view the most recent quarterly
holdings report, semiannual report, or annual report on Fidelity’s web site at
http://www.fidelity.com/holdings.
NOT FDIC INSURED · MAY LOSE VALUE · NO BANK GUARANTEE
Neither the fund nor Fidelity Distributors Corporation is a bank.
|
Chairman’s Message
(photograph of Edward C. Johnson 3d)
Dear Shareholder:
Although many securities markets made gains in early 2006, there is only one certainty when it comes to investing: There is no sure thing. There are, however, a number of time tested, fundamental investment principles that can put the historical odds in your favor.
One of the basic tenets is to invest for the long term. Over time, riding out the markets’ inevitable ups and downs has proven much more effective than selling into panic or chasing the hottest trend. Even missing only a few of the markets’ best days can significantly diminish investor returns. Patience also affords the benefits of compounding of earning interest on additional income or reinvested dividends and capital gains. There are tax advantages and cost benefits to consider as well. The more you sell, the more taxes you pay, and the more you trade, the higher the costs. While staying the course doesn’t eliminate risk, it can considerably lessen the effect of short term declines.
You can further manage your investing risk through diversification. And today, more than ever, geographic diversification should be taken into account. Studies indicate that asset allocation is the single most important determinant of a portfolio’s long term success. The right mix of stocks, bonds and cash aligned to your particular risk tolerance and investment objective is very important. Age appropriate rebalancing is also an essential aspect of asset allocation. For younger investors, an emphasis on equities which historically have been the best performing asset class over time is encouraged. As investors near their specific goal, such as retirement or sending a child to college, consideration may be given to replacing volatile assets (e.g. common stocks) with more stable fixed investments (bonds or savings plans).
A third investment principle invest ing regularly can help lower the average cost of your purchases. Investing a certain amount of money each month or quarter helps ensure you won’t pay for all your shares at market highs. This strategy known as dollar cost averaging also reduces unconstructive “emotion” from investing, helping shareholders avoid selling weak performers just prior to an upswing, or chasing a hot performer just before a correction.
We invite you to contact us via the Internet, through our Investor Centers or over the phone. It is our privilege to provide you the information you need to make the investments that are right for you.
Sincerely,
/s/ Edward C. Johnson 3d
Edward C. Johnson 3d
Annual Report A-4
Performance: The Bottom Line
Average annual total return reflects the change in the value of an investment, assuming reinvestment of the fund’s dividend income and capital gains (the profits earned upon the sale of securities that have grown in value) and assuming a constant rate of perfor mance each year. The $10,000 table and the fund’s returns do not reflect the deduction of taxes that a shareholder would pay on fund distributions or the redemption of fund shares. During periods of reimbursement by Fidelity, a fund’s total return will be greater than it would be had the reimbursement not occurred. How a fund did yesterday is no guarantee of how it will do tomorrow.
| Average Annual Total Returns | | | | | | |
| Periods ended March 31, 2006 | | Past 1 | | Past 5 | | Past 10 |
| | | year | | years | | years |
| Fidelity® Magellan® Fund | | 15.89% | | 3.10% | | 7.86% |
| |
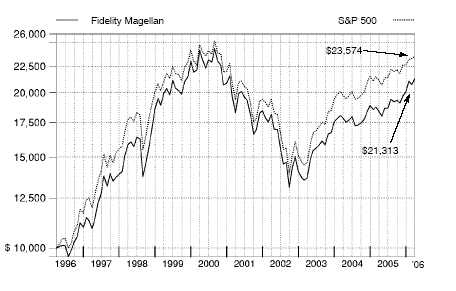
| $10,000 Over 10 Years | | | | | | |
Let’s say hypothetically that $10,000 was invested in Fidelity® Magellan® Fund on March 31, 1996. The chart shows how the value of your investment would have changed, and also shows how the S&P 500® Index performed over the same period.
A-5 Annual Report
A-5
Management’s Discussion of Fund Performance
Comments from Harry Lange, Portfolio Manager of Fidelity® Magellan® Fund
U.S. stocks registered widespread gains for the 12 months ending March 31, 2006, and most major market benchmarks turned in double digit returns. Strong corporate earnings and healthy economic growth helped fuel equities, despite concerns about inflation, a softening in the housing market and higher short term interest rates. Of the 10 broad market sectors measured by the Standard & Poor’s 500SM Index, energy had the best performance. Telecommunication services also did well, helped by an improved competitive environment a function of industry consolidation and less regulatory pressure. Financials had a similar but marginally higher return. Consumer discretionary had the weakest results, held back by poor performing automobile and traditional media stocks. For the 12 month period overall, the large cap oriented S&P 500® gained 11.73% . The NASDAQ Composite® Index, benefiting from more exposure to better performing mid and small cap stocks, was up 18.03% . The Dow Jones Industrial AverageSM one of the few market barometers not to break the double digit ceiling checked in with an 8.27% return.
Magellan had a strong 12 months, gaining 15.89% . In addition to beating the S&P 500 by a sizable margin, the fund also topped the 14.93% return of the LipperSM Growth Funds Average. Reducing the fund’s mega cap bias was a significant plus, but it was favorable stock selection, particularly in information technology and energy, that really drove the fund’s outperformance of its index. In energy, Schlumberger, which increases oil well output through pressure pumping and other processes, was a top contributor. Peabody Energy, the world’s largest coal producer, also did well. Tech stocks that outperformed included paid Internet search giant Google; Apple Computer, whose stock rose on the popularity of its iPod and Macintosh desktop and PowerBook computers; and Seagate Technology, which was boosted by new applications for its disk drives. However, several tech stocks were among the fund’s biggest detractors, including Symantec, an anti virus software provider for consumers and businesses that struggled with its acquisition of VERITAS. Underweighting Hewlett Packard hurt, and Juniper Networks also disappointed. In the capital goods segment, Tyco International continued to underperform, and I sold the stock from the portfolio.
The views expressed above reflect those of the portfolio manager(s) only through the end of the period as stated on the cover of this report and do not necessarily represent the views of Fidelity or any other person in the Fidelity organization. Any such views are subject to change at any time based upon market or other conditions and Fidelity disclaims any responsibility to update such views. These views may not be relied on as investment advice and, because investment decisions for a Fidelity fund are based on numerous factors, may not be relied on as an indication of trading intent on behalf of any Fidelity fund.
Shareholder Expense Example
As a shareholder of the Fund, you incur two types of costs: (1) transaction costs, and (2) ongoing costs, including management fees and other Fund expenses. This Example is intended to help you understand your ongoing costs (in dollars) of investing in the Fund and to compare these costs with the ongoing costs of investing in other mutual funds. The Example is based on an investment of $1,000 invested at the beginning of the period and held for the entire period (October 1, 2005 to March 31, 2006).
The first line of the table below provides information about actual account values and actual expenses. You may use the information in this line, together with the amount you invested, to estimate the expenses that you paid over the period. Simply divide your account value by $1,000.00 (for example, an $8,600 account value divided by $1,000.00 = 8.6), then multiply the result by the number in the first line under the heading entitled “Expenses Paid During Period” to estimate the expenses you paid on your account during this period. A small balance maintenance fee of $12.00 that is charged once a year may apply for certain accounts with a value of less than $2,000. This fee is not included in the table below. If it was, the estimate of expenses you paid during the period would be higher, and your ending account value lower, by this amount.
Hypothetical Example for Comparison Purposes
The second line of the table below provides information about hypothetical account values and hypothetical expenses based on the Fund’s actual expense ratio and an assumed rate of return of 5% per year before expenses, which is not the Fund’s actual return. The hypothetical account values and expenses may not be used to estimate the actual ending account balance or expenses you paid for the period. You may use this information to compare the ongoing costs of investing in the Fund and other funds. To do so, compare this 5% hypothetical example with the 5% hypothetical examples that appear in the shareholder reports of the other funds. A small balance maintenance fee of $12.00 that is charged once a year may apply for certain accounts with a value of less than $2,000. This fee is not included in the table below. If it was, the estimate of expenses you paid during the period would be higher, and your ending account value lower, by this amount.
Please note that the expenses shown in the table are meant to highlight your ongoing costs only and do not reflect any transaction costs. Therefore, the second line of the table is useful in comparing ongoing costs only, and will not help you determine the relative total costs of owning different funds.
| | | | | | | | | | | | | Expenses Paid |
| | | | | Beginning | | | | Ending | | | | During Period* |
| | | | | Account Value | | | | Account Value | | | | October 1, 2005 |
| | | | | October 1, 2005 | | | | March 31, 2006 | | | | to March 31, 2006 |
| Actual | | | | $ 1,000.00 | | | | $ 1,102.50 | | | | $ 3.15 |
| Hypothetical (5% return per year | | | | | | | | | | | | |
| before expenses) | | | | $ 1,000.00 | | | | $ 1,021.94 | | | | $ 3.02 |
* Expenses are equal to the Fund’s annualized expense ratio of .60%; multiplied by the average account value over the period, multiplied by 182/365 (to reflect the one half year period).
| Investment Changes | | | | |
| |
| |
| Top Ten Stocks as of March 31, 2006 | | | | |
| | | % of fund’s | | % of fund’s net assets |
| | | net assets | | 6 months ago |
| UnitedHealth Group, Inc. | | 4.0 | | 1.5 |
| Schlumberger Ltd. (NY Shares) | | 3.4 | | 1.4 |
| Nokia Corp. sponsored ADR | | 3.4 | | 0.1 |
| General Electric Co. | | 3.0 | | 4.2 |
| American International Group, Inc. | | 2.5 | | 2.9 |
| Google, Inc. Class A (sub. vtg.) | | 2.5 | | 1.7 |
| Johnson & Johnson | | 2.5 | | 2.0 |
| Nomura Holdings, Inc. | | 2.0 | | 0.0 |
| Genentech, Inc. | | 1.9 | | 1.3 |
| Peabody Energy Corp. | | 1.8 | | 0.0 |
| | | 27.0 | | |
Top Five Market Sectors as of March 31, 2006 | | |
| | | % of fund’s | | % of fund’s net assets |
| | | net assets | | 6 months ago |
| Information Technology | | 26.0 | | 20.6 |
| Financials | | 18.0 | | 16.8 |
| Health Care | | 15.8 | | 12.8 |
| Industrials | | 12.2 | | 10.0 |
| Consumer Discretionary | | 11.8 | | 16.0 |
Annual Report A-8
| Investments March 31, 2006 | | | | |
| Showing Percentage of Net Assets | | | | | | |
| |
| Common Stocks 98.8% | | | | | | |
| | | Shares | | Value (Note 1) |
| | | | | (000s) |
| |
| CONSUMER DISCRETIONARY – 11.8% | | | | | | |
| Hotels, Restaurants & Leisure 2.4% | | | | | | |
| Ctrip.com International Ltd. sponsored ADR | | 1,608,050 | | | | $ 132,986 |
| Royal Caribbean Cruises Ltd. | | 2,600,000 | | | | 109,252 |
| Starbucks Corp. (a) | | 5,112,616 | | | | 192,439 |
| Starwood Hotels & Resorts Worldwide, Inc. unit | | 4,973,827 | | | | 336,877 |
| Wynn Resorts Ltd. (a)(d)(e) | | 5,500,000 | | | | 422,675 |
| | | | | | | 1,194,229 |
| Household Durables – 1.6% | | | | | | |
| Cyrela Brazil Realty SA | | 1,000,000 | | | | 17,823 |
| Daito Trust Construction Co. | | 766,500 | | | | 39,981 |
| Garmin Ltd. (d) | | 1,714,460 | | | | 136,180 |
| KB Home | | 500,000 | | | | 32,490 |
| Lennar Corp. Class A | | 1,896,376 | | | | 114,503 |
| LG Electronics, Inc. | | 4,168,000 | | | | 338,039 |
| Sharp Corp. | | 5,954,000 | | | | 105,459 |
| | | | | | | 784,475 |
| Internet & Catalog Retail 0.1% | | | | | | |
| Expedia, Inc. (a) | | 1,800,000 | | | | 36,486 |
| Leisure Equipment & Products – 0.0% | | | | | | |
| MarineMax, Inc. (a) | | 772,800 | | | | 25,904 |
| Media – 1.9% | | | | | | |
| EchoStar Communications Corp. Class A (a) | | 2,400,000 | | | | 71,688 |
| Harris Interactive, Inc. (a) | | 872,800 | | | | 4,905 |
| Live Nation, Inc. (a) | | 1,782,864 | | | | 35,372 |
| McGraw Hill Companies, Inc. | | 1,332,000 | | | | 76,750 |
| News Corp.: | | | | | | |
| Class A | | 3,000,000 | | | | 49,830 |
| Class B (d) | | 7,000,000 | | | | 122,920 |
| Omnicom Group, Inc. | | 3,201,676 | | | | 266,540 |
| The Walt Disney Co. | | 12,301,500 | | | | 343,089 |
| | | | | | | 971,094 |
| Multiline Retail – 1.0% | | | | | | |
| Federated Department Stores, Inc. | | 1,247,300 | | | | 91,053 |
| JCPenney Co., Inc. | | 2,000,000 | | | | 120,820 |
| Target Corp. | | 6,041,700 | | | | 314,229 |
| | | | | | | 526,102 |
| Specialty Retail – 3.2% | | | | | | |
| Best Buy Co., Inc. | | 13,673,350 | | | | 764,750 |
| Circuit City Stores, Inc. | | 1,000,000 | | | | 24,480 |
See accompanying notes which are an integral part of the financial statements.
| Investments continued | | | | | | |
| |
| |
| Common Stocks continued | | | | | | |
| | | Shares | | Value (Note 1) |
| | | | | (000s) |
| |
| CONSUMER DISCRETIONARY – continued | | | | | | |
| Specialty Retail – continued | | | | | | |
| Staples, Inc. | | 21,918,000 | | | | $ 559,347 |
| Yamada Denki Co. Ltd. | | 2,509,100 | | | | 289,245 |
| | | | | | | 1,637,822 |
| Textiles, Apparel & Luxury Goods – 1.6% | | | | | | |
| Asics Corp. | | 2,500,000 | | | | 27,375 |
| Fossil, Inc. (a) | | 200,000 | | | | 3,716 |
| Liz Claiborne, Inc. | | 4,490,000 | | | | 184,000 |
| NIKE, Inc. Class B | | 6,798,500 | | | | 578,552 |
| | | | | | | 793,643 |
| |
| TOTAL CONSUMER DISCRETIONARY | | | | | | 5,969,755 |
| |
| CONSUMER STAPLES 1.6% | | | | | | |
| Food & Staples Retailing – 1.3% | | | | | | |
| CVS Corp. | | 6,841,972 | | | | 204,370 |
| United Natural Foods, Inc. (a)(e) | | 4,143,500 | | | | 144,898 |
| Walgreen Co. | | 2,645,900 | | | | 114,118 |
| Whole Foods Market, Inc. | | 3,242,400 | | | | 215,425 |
| | | | | | | 678,811 |
| Food Products 0.1% | | | | | | |
| Flowers Foods, Inc. | | 1,000,000 | | | | 29,700 |
| Nestle SA (Reg.) | | 36,600 | | | | 10,864 |
| | | | | | | 40,564 |
| Personal Products 0.2% | | | | | | |
| Avon Products, Inc. | | 2,543,147 | | | | 79,270 |
| |
| TOTAL CONSUMER STAPLES | | | | | | 798,645 |
| |
| ENERGY 9.1% | | | | | | |
| Energy Equipment & Services – 4.4% | | | | | | |
| Baker Hughes, Inc. | | 2,221,000 | | | | 151,916 |
| Cooper Cameron Corp. (a) | | 2,591,000 | | | | 114,211 |
| GlobalSantaFe Corp. | | 600,000 | | | | 36,450 |
| Schlumberger Ltd. (NY Shares) | | 13,699,997 | | | | 1,734,009 |
| Smith International, Inc. | | 557,200 | | | | 21,709 |
| Transocean, Inc. (a) | | 85,363 | | | | 6,855 |
| Weatherford International Ltd. (a) | | 4,040,000 | | | | 184,830 |
| | | | | | | 2,249,980 |
See accompanying notes which are an integral part of the financial statements.
| Common Stocks continued | | | | | | |
| | | Shares | | Value (Note 1) |
| | | | | (000s) |
| |
| ENERGY – continued | | | | | | |
| Oil, Gas & Consumable Fuels – 4.7% | | | | | | |
| Apache Corp. | | 1,953,610 | | | | $ 127,981 |
| Arch Coal, Inc. (e) | | 4,126,274 | | | | 313,349 |
| Cameco Corp. (d) | | 4,000,000 | | | | 143,873 |
| Canadian Natural Resources Ltd. | | 10,865,700 | | | | 603,908 |
| ConocoPhillips | | 804,118 | | | | 50,780 |
| CONSOL Energy, Inc. | | 2,000,000 | | | | 148,320 |
| Occidental Petroleum Corp. | | 521,400 | | | | 48,308 |
| Peabody Energy Corp. (e) | | 17,868,800 | | | | 900,766 |
| Plains Exploration & Production Co. (a) | | 295,000 | | | | 11,399 |
| Teekay Shipping Corp. | | 340,000 | | | | 12,604 |
| | | | | | | 2,361,288 |
| |
| TOTAL ENERGY | | | | | | 4,611,268 |
| |
| FINANCIALS – 18.0% | | | | | | |
| Capital Markets 5.6% | | | | | | |
| E*TRADE Financial Corp. (a) | | 9,761,555 | | | | 263,367 |
| E*TRADE Securities Co. Ltd. (d) | | 28,000 | | | | 64,461 |
| Goldman Sachs Group, Inc. | | 1,848,500 | | | | 290,141 |
| Indiabulls Financial Services Ltd. GDR (f) | | 3,433,108 | | | | 19,658 |
| JAFCO Co. Ltd. | | 82,100 | | | | 6,193 |
| MCF Corp. (a) | | 735,600 | | | | 1,030 |
| Merrill Lynch & Co., Inc. | | 8,342,900 | | | | 657,087 |
| Morgan Stanley | | 500,000 | | | | 31,410 |
| Nomura Holdings, Inc. | | 44,949,500 | | | | 996,530 |
| State Street Corp. | | 6,933,800 | | | | 419,010 |
| TD Ameritrade Holding Corp. | | 5,152,100 | | | | 107,524 |
| | | | | | | 2,856,411 |
| Commercial Banks – 3.5% | | | | | | |
| China Construction Bank Corp. (H Shares) | | 50,000,000 | | | | 23,360 |
| Mitsubishi UFJ Financial Group, Inc. | | 12,000 | | | | 182,520 |
| Mizuho Financial Group, Inc. | | 40,000 | | | | 327,231 |
| Shinsei Bank Ltd. | | 19,978,000 | | | | 139,845 |
| SVB Financial Group (a) | | 516,900 | | | | 27,422 |
| Wachovia Corp. | | 6,146,094 | | | | 344,489 |
| Wells Fargo & Co. | | 11,461,200 | | | | 732,027 |
| | | | | | | 1,776,894 |
See accompanying notes which are an integral part of the financial statements.
| Investments continued | | | | | | |
| |
| |
| Common Stocks continued | | | | | | |
| | | Shares | | Value (Note 1) |
| | | | | (000s) |
| |
| FINANCIALS – continued | | | | | | |
| Consumer Finance – 0.5% | | | | | | |
| American Express Co. | | 2,927,216 | | | | $ 153,825 |
| SLM Corp. | | 2,000,000 | | | | 103,880 |
| | | | | | | 257,705 |
| Diversified Financial Services – 0.1% | | | | | | |
| The Nasdaq Stock Market, Inc. (a) | | 1,000,000 | | | | 40,040 |
| Insurance – 6.4% | | | | | | |
| ACE Ltd. | | 1,270,860 | | | | 66,097 |
| AFLAC, Inc. | | 5,147,000 | | | | 232,284 |
| American International Group, Inc. | | 19,272,570 | | | | 1,273,724 |
| Berkshire Hathaway, Inc. Class A (a) | | 557 | | | | 50,325 |
| China Life Insurance Co. Ltd. (H Shares) (a) | | 170,000,000 | | | | 214,714 |
| Endurance Specialty Holdings Ltd. | | 555,800 | | | | 18,091 |
| Hartford Financial Services Group, Inc. | | 3,000,000 | | | | 241,650 |
| MetLife, Inc. | | 5,000,000 | | | | 241,850 |
| Millea Holdings, Inc. | | 2,500 | | | | 49,484 |
| Muenchener Rueckversicherungs Gesellschaft AG (Reg.) | | 2,360,000 | | | | 334,588 |
| Prudential Financial, Inc. | | 2,500,000 | | | | 189,525 |
| Samsung Fire & Marine Insurance Co. Ltd. | | 200,000 | | | | 26,451 |
| T&D Holdings, Inc. | | 1,000,000 | | | | 78,155 |
| W.R. Berkley Corp. | | 1,237,500 | | | | 71,849 |
| Willis Group Holdings Ltd. | | 1,000,000 | | | | 34,260 |
| XL Capital Ltd. Class A | | 1,512,400 | | | | 96,960 |
| | | | | | | 3,220,007 |
| Real Estate 1.5% | | | | | | |
| Apartment Investment & Management Co. Class A | | 667,700 | | | | 31,315 |
| Developers Diversified Realty Corp. | | 1,000,000 | | | | 54,750 |
| Equity Office Properties Trust | | 2,286,400 | | | | 76,777 |
| Equity Residential (SBI) | | 4,343,000 | | | | 203,209 |
| General Growth Properties, Inc. | | 2,000,000 | | | | 97,740 |
| Kimco Realty Corp. | | 679,800 | | | | 27,627 |
| Leopalace21 Corp. | | 2,324,000 | | | | 87,262 |
| Mitsui Fudosan Co. Ltd. | | 8,000,000 | | | | 183,834 |
| | | | | | | 762,514 |
| Thrifts & Mortgage Finance – 0.4% | | | | | | |
| Fannie Mae | | 3,557,454 | | | | 182,853 |
| |
| TOTAL FINANCIALS | | | | | | 9,096,424 |
See accompanying notes which are an integral part of the financial statements.
| Common Stocks continued | | | | | | |
| | | Shares | | Value (Note 1) |
| | | | | (000s) |
| |
| HEALTH CARE – 15.8% | | | | | | |
| Biotechnology – 3.8% | | | | | | |
| Affymetrix, Inc. (a) | | 28,700 | | | | $ 945 |
| Amgen, Inc. (a) | | 1,357,410 | | | | 98,752 |
| Biogen Idec, Inc. (a) | | 6,118,300 | | | | 288,172 |
| Charles River Laboratories International, Inc. (a) | | 1,804,700 | | | | 88,466 |
| Genentech, Inc. (a) | | 11,684,000 | | | | 987,415 |
| Gilead Sciences, Inc. (a) | | 3,977,600 | | | | 247,486 |
| Invitrogen Corp. (a) | | 500,000 | | | | 35,065 |
| MedImmune, Inc. (a) | | 1,000,000 | | | | 36,580 |
| Myogen, Inc. (a) | | 1,000,000 | | | | 36,230 |
| OSI Pharmaceuticals, Inc. (a)(e) | | 3,198,900 | | | | 102,685 |
| | | | | | | 1,921,796 |
| Health Care Equipment & Supplies – 2.9% | | | | | | |
| Alcon, Inc. | | 800,000 | | | | 83,408 |
| American Medical Systems Holdings, Inc. (a) | | 1,000,000 | | | | 22,500 |
| Baxter International, Inc. | | 3,200,000 | | | | 124,192 |
| Becton, Dickinson & Co. | | 4,000,000 | | | | 246,320 |
| Boston Scientific Corp. (a) | | 344,000 | | | | 7,929 |
| C.R. Bard, Inc. | | 1,069,300 | | | | 72,509 |
| Fisher Scientific International, Inc. (a) | | 4,900,000 | | | | 333,445 |
| Gen-Probe, Inc. (a) | | 500,000 | | | | 27,560 |
| Greatbatch, Inc. (a)(e) | | 2,164,500 | | | | 47,424 |
| Kinetic Concepts, Inc. (a) | | 700,000 | | | | 28,819 |
| Mentor Corp. | | 1,470,400 | | | | 66,624 |
| Millipore Corp. (a) | | 500,000 | | | | 36,530 |
| St. Jude Medical, Inc. (a) | | 4,800,000 | | | | 196,800 |
| Thermo Electron Corp. (a) | | 1,471,500 | | | | 54,578 |
| Waters Corp. (a) | | 3,198,600 | | | | 138,020 |
| | | | | | | 1,486,658 |
| Health Care Providers & Services – 4.5% | | | | | | |
| Aetna, Inc. | | 600,000 | | | | 29,484 |
| Cerner Corp. (a)(d) | | 200,000 | | | | 9,490 |
| Covance, Inc. (a) | | 1,000,000 | | | | 58,750 |
| Emdeon Corp. (a) | | 1,553,702 | | | | 16,780 |
| Henry Schein, Inc. (a) | | 600,000 | | | | 28,716 |
| Sunrise Senior Living, Inc. (a) | | 1,500,000 | | | | 58,455 |
| UnitedHealth Group, Inc. | | 36,232,835 | | | | 2,023,964 |
| VCA Antech, Inc. (a) | | 1,000,000 | | | | 28,480 |
See accompanying notes which are an integral part of the financial statements.
| Investments continued | | | | | | |
| |
| |
| Common Stocks continued | | | | | | |
| | | Shares | | Value (Note 1) |
| | | | | (000s) |
| |
| HEALTH CARE – continued | | | | | | |
| Health Care Providers & Services – continued | | | | | | |
| WebMD Health Corp. Class A (d) | | 95,700 | | | | $ 3,985 |
| WellPoint, Inc. (a) | | 300,000 | | | | 23,229 |
| | | | | | | 2,281,333 |
| Pharmaceuticals – 4.6% | | | | | | |
| Allergan, Inc. | | 5,248,626 | | | | 569,476 |
| Johnson & Johnson | | 20,932,400 | | | | 1,239,617 |
| Matrixx Initiatives, Inc. (a) | | 400,000 | | | | 9,320 |
| Medicis Pharmaceutical Corp. Class A | | 2,000,000 | | | | 65,200 |
| Roche Holding AG (participation certificate) | | 1,683,700 | | | | 250,657 |
| Teva Pharmaceutical Industries Ltd. sponsored ADR | | 3,000,000 | | | | 123,540 |
| Wyeth | | 1,021,300 | | | | 49,553 |
| | | | | | | 2,307,363 |
| |
| TOTAL HEALTH CARE | | | | | | 7,997,150 |
| |
| INDUSTRIALS – 12.2% | | | | | | |
| Aerospace & Defense – 2.0% | | | | | | |
| BE Aerospace, Inc. (a) | | 1,784,410 | | | | 44,824 |
| Honeywell International, Inc. | | 8,795,400 | | | | 376,179 |
| Rockwell Collins, Inc. | | 3,000,000 | | | | 169,050 |
| United Technologies Corp. | | 7,200,000 | | | | 417,384 |
| | | | | | | 1,007,437 |
| Air Freight & Logistics – 1.1% | | | | | | |
| C.H. Robinson Worldwide, Inc. | | 3,000,000 | | | | 147,270 |
| Expeditors International of Washington, Inc. | | 3,481,600 | | | | 300,775 |
| Forward Air Corp. | | 390,000 | | | | 14,543 |
| UTI Worldwide, Inc. | | 3,000,000 | | | | 94,800 |
| | | | | | | 557,388 |
| Airlines – 0.0% | | | | | | |
| JetBlue Airways Corp. (a)(d) | | 1,230,650 | | | | 13,193 |
| Commercial Services & Supplies – 1.6% | | | | | | |
| 51job, Inc. sponsored ADR (a) | | 2,932,000 | | | | 45,153 |
| Equifax, Inc. | | 3,000,000 | | | | 111,720 |
| Heidrick & Struggles International, Inc. (a) | | 476,228 | | | | 17,278 |
| Monster Worldwide, Inc. (a)(e) | | 9,235,665 | | | | 460,490 |
| Robert Half International, Inc. | | 4,124,900 | | | | 159,262 |
| | | | | | | 793,903 |
See accompanying notes which are an integral part of the financial statements.
| Common Stocks continued | | | | | | |
| | | Shares | | Value (Note 1) |
| | | | | (000s) |
| |
| INDUSTRIALS – continued | | | | | | |
| Construction & Engineering – 0.5% | | | | | | |
| Fluor Corp. | | 2,948,845 | | | | $ 253,011 |
| Electrical Equipment – 0.6% | | | | | | |
| Emerson Electric Co. | | 2,732,400 | | | | 228,511 |
| Suntech Power Holdings Co. Ltd. sponsored ADR | | 1,500,000 | | | | 55,485 |
| | | | | | | 283,996 |
| Industrial Conglomerates – 3.3% | | | | | | |
| 3M Co. | | 1,675,840 | | | | 126,844 |
| General Electric Co. | | 44,075,550 | | | | 1,532,948 |
| Raven Industries, Inc. | | 136,089 | | | | 5,322 |
| | | | | | | 1,665,114 |
| Machinery – 1.4% | | | | | | |
| Actuant Corp. Class A | | 500,000 | | | | 30,610 |
| Caterpillar, Inc. | | 4,000,000 | | | | 287,240 |
| Danaher Corp. | | 3,000,000 | | | | 190,650 |
| Dover Corp. | | 1,000,000 | | | | 48,560 |
| Hyundai Mipo Dockyard Co. Ltd. | | 460,000 | | | | 39,580 |
| IDEX Corp. | | 500,000 | | | | 26,085 |
| Joy Global, Inc. | | 700,000 | | | | 41,839 |
| Kawasaki Heavy Industries Ltd. (d) | | 10,000,000 | | | | 35,085 |
| Trivest 1992 Special Fund Ltd. (a)(h) | | 26,600,000 | | | | 133 |
| | | | | | | 699,782 |
| Marine – 0.1% | | | | | | |
| Alexander & Baldwin, Inc. | | 1,633,707 | | | | 77,895 |
| Road & Rail 1.4% | | | | | | |
| Burlington Northern Santa Fe Corp. | | 3,000,000 | | | | 249,990 |
| Canadian National Railway Co. | | 2,000,000 | | | | 90,640 |
| CNF, Inc. | | 1,000,000 | | | | 49,940 |
| Landstar System, Inc. | | 254,300 | | | | 11,220 |
| Norfolk Southern Corp. | | 2,000,000 | | | | 108,140 |
| Union Pacific Corp. | | 2,000,000 | | | | 186,700 |
| | | | | | | 696,630 |
| Trading Companies & Distributors – 0.2% | | | | | | |
| Fastenal Co. | | 2,000,000 | | | | 94,680 |
| |
| TOTAL INDUSTRIALS | | | | | | 6,143,029 |
See accompanying notes which are an integral part of the financial statements.
| Investments continued | | | | | | |
| |
| |
| Common Stocks continued | | | | | | |
| | | Shares | | Value (Note 1) |
| | | | | (000s) |
| |
| INFORMATION TECHNOLOGY – 26.0% | | | | | | |
| Communications Equipment – 5.1% | | | | | | |
| China Techfaith Wireless Communication Technology Ltd. | | | | | | |
| sponsored ADR (d) | | 1,331,765 | | | | $ 19,284 |
| Cisco Systems, Inc. (a) | | 7,950,300 | | | | 172,283 |
| Comverse Technology, Inc. (a) | | 500,000 | | | | 11,765 |
| Corning, Inc. (a) | | 12,000,000 | | | | 322,920 |
| Juniper Networks, Inc. (a) | | 5,675,000 | | | | 108,506 |
| Lucent Technologies, Inc. (a) | | 60,000,000 | | | | 183,000 |
| Lucent Technologies, Inc. warrants 12/10/07 (a) | | 1,201,054 | | | | 751 |
| Nokia Corp. sponsored ADR (d) | | 82,372,400 | | | | 1,706,756 |
| Nortel Networks Corp. (a) | | 5,000,000 | | | | 15,251 |
| Sonus Networks, Inc. (a) | | 1,000,000 | | | | 5,480 |
| | | | | | | 2,545,996 |
| Computers & Peripherals – 2.5% | | | | | | |
| Apple Computer, Inc. (a) | | 7,000,000 | | | | 439,040 |
| Avid Technology, Inc. (a) | | 200,000 | | | | 8,692 |
| NEC Corp. | | 10,000,000 | | | | 70,254 |
| Network Appliance, Inc. (a) | | 958,700 | | | | 34,542 |
| QLogic Corp. (a) | | 5,000,000 | | | | 96,750 |
| Rackable Systems, Inc. (e) | | 1,324,544 | | | | 70,002 |
| Seagate Technology | | 20,709,334 | | | | 545,277 |
| | | | | | | 1,264,557 |
| Electronic Equipment & Instruments – 1.6% | | | | | | |
| Amphenol Corp. Class A | | 1,942,050 | | | | 101,336 |
| Flextronics International Ltd. (a) | | 3,125,000 | | | | 32,344 |
| FLIR Systems, Inc. (a) | | 2,000,000 | | | | 56,820 |
| Hon Hai Precision Industry Co. Ltd. (Foxconn) | | 25,000,000 | | | | 154,813 |
| Ingram Micro, Inc. Class A (a) | | 2,500,000 | | | | 50,000 |
| Jabil Circuit, Inc. (a) | | 4,157,100 | | | | 178,173 |
| Kyocera Corp. | | 1,000,000 | | | | 88,130 |
| Molex, Inc. | | 3,000,000 | | | | 99,600 |
| Rofin-Sinar Technologies, Inc. (a) | | 600,000 | | | | 32,478 |
| Vishay Intertechnology, Inc. (a) | | 2,122,800 | | | | 30,229 |
| | | | | | | 823,923 |
| Internet Software & Services – 4.8% | | | | | | |
| aQuantive, Inc. (a) | | 2,142,315 | | | | 50,430 |
| Bankrate, Inc. (a)(d)(e) | | 800,000 | | | | 34,848 |
| Google, Inc. Class A (sub. vtg.) (a) | | 3,201,000 | | | | 1,248,390 |
| Homestore, Inc. (a) | | 1,000,000 | | | | 6,560 |
| Marchex, Inc. Class B (a)(d) | | 1,200,000 | | | | 25,800 |
See accompanying notes which are an integral part of the financial statements.
| Common Stocks continued | | | | | | |
| | | Shares | | Value (Note 1) |
| | | | | (000s) |
| |
| INFORMATION TECHNOLOGY – continued | | | | | | |
| Internet Software & Services – continued | | | | | | |
| Openwave Systems, Inc. (a) | | 1,657,000 | | | | $ 35,758 |
| VeriSign, Inc. (a) | | 1,000,000 | | | | 23,990 |
| Yahoo! Japan Corp | | 1,400,790 | | | | 854,409 |
| Yahoo!, Inc. (a) | | 4,986,600 | | | | 160,868 |
| | | | | | | 2,441,053 |
| IT Services – 0.2% | | | | | | |
| Infosys Technologies Ltd. sponsored ADR | | 500,000 | | | | 38,930 |
| TALX Corp. (e) | | 2,886,484 | | | | 82,207 |
| | | | | | | 121,137 |
| Office Electronics – 0.7% | | | | | | |
| Canon, Inc. | | 5,000,000 | | | | 330,250 |
| Zebra Technologies Corp. Class A (a) | | 200,000 | | | | 8,944 |
| | | | | | | 339,194 |
| Semiconductors & Semiconductor Equipment – 6.8% | | | | | | |
| Advanced Micro Devices, Inc. (a) | | 3,250,000 | | | | 107,770 |
| Altera Corp. (a) | | 2,672,700 | | | | 55,165 |
| Analog Devices, Inc. | | 7,119,732 | | | | 272,615 |
| ASML Holding NV (NY Shares) (a) | | 25,307,587 | | | | 515,516 |
| Cree, Inc. (a) | | 1,187,382 | | | | 38,958 |
| Ikanos Communications, Inc. | | 100,000 | | | | 1,971 |
| Intersil Corp. Class A | | 1,069,700 | | | | 30,936 |
| KLA Tencor Corp. (e) | | 16,800,000 | | | | 812,448 |
| Lam Research Corp. (a) | | 499,200 | | | | 21,466 |
| Marvell Technology Group Ltd. (a) | | 1,200,000 | | | | 64,920 |
| Maxim Integrated Products, Inc. | | 2,000,000 | | | | 74,300 |
| National Semiconductor Corp. | | 628,700 | | | | 17,503 |
| O2Micro International Ltd. sponsored ADR (a) | | 700,000 | | | | 7,441 |
| Omnivision Technologies, Inc. (a) | | 1,000,000 | | | | 30,200 |
| Q Cells AG | | 36,000 | | | | 3,363 |
| Samsung Electronics Co. Ltd. | | 963,711 | | | | 624,885 |
| Silicon Laboratories, Inc. (a) | | 1,987,501 | | | | 109,213 |
| SiRF Technology Holdings, Inc. (a) | | 1,000,000 | | | | 35,410 |
| Taiwan Semiconductor Manufacturing Co. Ltd. sponsored ADR | | 16,093,720 | | | | 161,903 |
| Teradyne, Inc. (a)(d)(e) | | 19,201,064 | | | | 297,809 |
| Texas Instruments, Inc. | | 4,697,700 | | | | 152,534 |
| | | | | | | 3,436,326 |
| Software 4.3% | | | | | | |
| Autodesk, Inc. | | 1,500,000 | | | | 57,780 |
| BEA Systems, Inc. (a)(e) | | 25,575,053 | | | | 335,800 |
See accompanying notes which are an integral part of the financial statements.
| Investments continued | | | | | | |
| |
| |
| Common Stocks continued | | | | | | |
| | | Shares | | Value (Note 1) |
| | | | | (000s) |
| |
| INFORMATION TECHNOLOGY – continued | | | | | | |
| Software – continued | | | | | | |
| Citrix Systems, Inc. (a) | | 1,440,000 | | | | $ 54,576 |
| FileNET Corp. (a) | | 550,000 | | | | 14,861 |
| Microsoft Corp. | | 29,608,900 | | | | 805,658 |
| NAVTEQ Corp. (a) | | 1,200,000 | | | | 60,780 |
| Oracle Corp. (a) | | 25,395,000 | | | | 347,658 |
| SAP AG sponsored ADR | | 1,450,000 | | | | 78,764 |
| Symantec Corp. (a) | | 18,049,168 | | | | 303,767 |
| Trend Micro, Inc. | | 2,500,000 | | | | 87,712 |
| | | | | | | 2,147,356 |
| |
| TOTAL INFORMATION TECHNOLOGY | | | | | | 13,119,542 |
| |
| MATERIALS 2.3% | | | | | | |
| Chemicals – 0.7% | | | | | | |
| Monsanto Co. | | 2,800,000 | | | | 237,300 |
| Praxair, Inc. | | 1,000,000 | | | | 55,150 |
| Tokuyama Corp. | | 1,700,400 | | | | 28,832 |
| | | | | | | 321,282 |
| Containers & Packaging – 0.0% | | | | | | |
| Smurfit-Stone Container Corp. (a) | | 1,300,000 | | | | 17,641 |
| Metals & Mining – 0.7% | | | | | | |
| Alcoa, Inc. | | 3,600,000 | | | | 110,016 |
| Allegheny Technologies, Inc. | | 1,000,000 | | | | 61,180 |
| Cleveland-Cliffs, Inc. (d) | | 295,649 | | | | 25,757 |
| Falconbridge Ltd. | | 1,500,000 | | | | 52,501 |
| Mittal Steel Co. NV Class A (NY Shares) | | 1,000,000 | | | | 37,750 |
| Toho Titanium Co. Ltd. (d) | | 600,000 | | | | 43,019 |
| | | | | | | 330,223 |
| Paper & Forest Products 0.9% | | | | | | |
| International Paper Co. | | 6,609,500 | | | | 228,490 |
| Weyerhaeuser Co. | | 3,358,800 | | | | 243,278 |
| | | | | | | 471,768 |
| |
| TOTAL MATERIALS | | | | | | 1,140,914 |
| |
| TELECOMMUNICATION SERVICES – 1.2% | | | | | | |
| Diversified Telecommunication Services – 0.1% | | | | | | |
| Qwest Communications International, Inc. (a) | | 10,000,000 | | | | 68,000 |
See accompanying notes which are an integral part of the financial statements.
| Common Stocks continued | | | | | | | | |
| | | | | Shares | | Value (Note 1) |
| | | | | | | (000s) |
| |
| TELECOMMUNICATION SERVICES – continued | | | | | | | | |
| Wireless Telecommunication Services – 1.1% | | | | | | | | |
| American Tower Corp. Class A (a) | | | | 5,500,000 | | | | $ 166,760 |
| Bharti Televentures Ltd. (a) | | | | 3,500,000 | | | | 33,394 |
| NII Holdings, Inc. (a) | | | | 2,585,300 | | | | 152,455 |
| Sprint Nextel Corp. | | | | 6,661,020 | | | | 172,121 |
| | | | | | | | | 524,730 |
| |
| TOTAL TELECOMMUNICATION SERVICES | | | | | | | | 592,730 |
| |
| UTILITIES – 0.8% | | | | | | | | |
| Electric Utilities – 0.7% | | | | | | | | |
| Exelon Corp. | | | | 4,000,000 | | | | 211,600 |
| Korea Electric Power Corp. sponsored ADR | | | | 6,000,000 | | | | 129,600 |
| | | | | | | | | 341,200 |
| Multi-Utilities – 0.1% | | | | | | | | |
| Public Service Enterprise Group, Inc. | | | | 1,000,000 | | | | 64,040 |
| |
| TOTAL UTILITIES | | | | | | | | 405,240 |
| |
| TOTAL COMMON STOCKS | | | | | | | | |
| (Cost $37,151,324) | | | | | | | | 49,874,697 |
| |
| U.S. Treasury Obligations 0.0% | | | | | | | | |
| | | | | Principal | | | | |
| | | | | Amount (000s) | | | | |
| U.S. Treasury Bills, yield at date of purchase 4.44% | | | | | | | | |
| 5/11/06 (g) | | | | | | | | |
| (Cost $19,602) | | | | $ 19,700 | | | | 19,607 |
See accompanying notes which are an integral part of the financial statements.
| Investments continued | | | | | | | | |
| |
| |
| Money Market Funds 4.7% | | | | | | | | |
| | | | | Shares | | Value (Note 1) |
| | | | | | | (000s) |
| Fidelity Cash Central Fund, 4.77% (b) | | | | 486,006,454 | | | | $ 486,006 |
| Fidelity Securities Lending Cash Central Fund, | | | | | | | | |
| 4.81% (b)(c) | | | | 1,857,734,095 | | | | 1,857,734 |
| TOTAL MONEY MARKET FUNDS | | | | | | | | |
| (Cost $2,343,740) | | | | | | | | 2,343,740 |
| TOTAL INVESTMENT PORTFOLIO 103.5% | | | | | | | | |
| (Cost $39,514,666) | | | | | | | | 52,238,044 |
| |
| NET OTHER ASSETS – (3.5)% | | | | | | | | (1,765,468) |
| NET ASSETS 100% | | | | | | | | $ 50,472,576 |
| |
| Futures Contracts | | | | | | | | |
| | | Expiration | | Underlying | | Unrealized |
| | | Date | | Face Amount | | Appreciation/ |
| | | | | at Value (000s) | | (Depreciation) |
| | | | | | | (000s) |
| Purchased | | | | | | | | |
| Equity Index Contracts | | | | | | | | |
| 820 S&P 500 Index Contracts | | June 2006 | | $ 267,177 | | | | $ 2,763 |
The face value of futures purchased as a percentage of net assets – 0.5%
Legend
(a) Non-income producing
(b) Affiliated fund that is available only to
investment companies and other
accounts managed by Fidelity
Investments. The rate quoted is the
annualized seven-day yield of the fund
at period end. A complete unaudited
listing of the fund’s holdings as of its
most recent quarter end is available
upon request.
|
(c) Investment made with cash collateral
received from securities on loan.
(d) Security or a portion of the security is on
loan at period end.
(e) Affiliated company
|
See accompanying notes which are an integral part of the financial statements.
Annual Report A-20
(f) Security exempt from registration under
Rule 144A of the Securities Act of 1933.
These securities may be resold in
transactions exempt from registration,
normally to qualified institutional buyers.
At the period end, the value of these
securities amounted to $19,658,000 or
0.0% of net assets.
(g) Security or a portion of the security was
pledged to cover margin requirements
for futures contracts. At the period end,
the value of securities pledged
amounted to $19,607,000.
(h) Restricted securities – Investment in
securities not registered under the
Securities Act of 1933 (excluding 144A
issues). At the end of the period, the
value of restricted securities (excluding
144A issues) amounted to $133,000 or
0.0% of net assets.
|
Additional information on each holding is as follows:
| | | Acquisition | | Acquisition |
| Security | | Date | | Cost (000s) |
| Trivest 1992 | | | | | | |
| Special Fund Ltd. | | 7/2/92 | | | | $ 0 |
Information regarding fiscal year to date income earned by the fund from the affiliated Central funds is as follows:
| | | | | Income earned |
| | | | | (Amounts in |
| Fund | | | | thousands) |
| Fidelity Cash Central Fund | | | | $ 28,713 |
| Fidelity Securities Lending Cash Central Fund | | | | 5,386 |
| Total | | | | $ 34,099 |
An affiliated company is a company in which the fund has ownership of at least 5% of the voting securities. Fiscal year to date transactions with companies which are or were affiliates are as follows:
| | | | | Value, | | | | | | | | | | | | Value, |
| Affiliate | | | | beginning | | | | | | Sales | | Dividend | | | | end of |
| (Amounts in thousands) | | | | of period | | Purchases | | | | Proceeds | | Income | | | | period |
| Arch Coal, Inc. | | | | $ — | | $ 318,715 | | | | $ — | | $ 580 | | | | $ 313,349 |
| Bankrate, Inc. | | | | — | | 24,702 | | | | — | | — | | | | 34,848 |
| BEA Systems, Inc. | | | | 25,106 | | 208,075 | | | | — | | — | | | | 335,800 |
| Greatbatch, Inc. | | | | — | | 60,528 | | | | — | | — | | | | 47,424 |
| KLA Tencor Corp. | | | | 188,641 | | 728,230 | | | | 98,210 | | 3,024 | | | | 812,448 |
| Monster Worldwide, | | | | | | | | | | | | | | | | |
| Inc. | | | | — | | 316,779 | | | | — | | — | | | | 460,490 |
See accompanying notes which are an integral part of the financial statements.
| Investments continued | | | | | | | | | | | | |
| |
| |
| | | Value, | | | | | | | | | | | | Value, |
| Affiliate | | beginning | | | | | | Sales | | | | Dividend | | end of |
| (Amounts in thousands) | | of period | | Purchases | | | | Proceeds | | | | Income | | period |
| OSI Pharmaceuticals, | | | | | | | | | | | | | | |
| Inc. | | $ 41,340 | | $ 75,166 | | | | $ 32,261 | | | | $ — | | $ 102,685 |
| Peabody Energy Corp. | | — | | 722,863 | | | | — | | | | — | | 900,766 |
| Rackable Systems, Inc. | | — | | 51,657 | | | | — | | | | — | | 70,002 |
| TALX Corp. | | — | | 75,702 | | | | — | | | | 212 | | 82,207 |
| Teradyne, Inc. | | — | | 273,749 | | | | — | | | | — | | 297,809 |
| United Natural Foods, | | | | | | | | | | | | | | |
| Inc. | | — | | 117,423 | | | | — | | | | — | | 144,898 |
| Wynn Resorts Ltd. | | — | | 318,753 | | | | — | | | | — | | 422,675 |
| Total | | $ 255,087 | | $ 3,292,342 | | | | $ 130,471 | | | | $ 3,816 | | $ 4,025,401 |
Other Information
Distribution of investments by country of issue, as a percentage of total net assets, is as follows:
| United States of America | | 73.6% |
| Japan | | 8.5% |
| Netherlands Antilles | | 3.4% |
| Finland | | 3.4% |
| Korea (South) | | 2.3% |
| Cayman Islands | | 1.9% |
| Canada | | 1.8% |
| Netherlands | | 1.1% |
| Others (individually less than 1%) . | | 4.0% |
| | | 100.0% |
See accompanying notes which are an integral part of the financial statements.
| Financial Statements | | | | | | | | |
| |
| Statement of Assets and Liabilities | | | | | | | | |
| Amounts in thousands (except per share amount) | | | | | | | | March 31, 2006 |
| |
| Assets | | | | | | | | |
| Investment in securities, at value (including securities | | | | | | | | |
| loaned of $1,776,974) See accompanying | | | | | | | | |
| schedule: | | | | | | | | |
| Unaffiliated issuers (cost $33,777,696) | | | | $ 45,868,903 | | | | |
| Affiliated Central Funds (cost $2,343,740) | | | | 2,343,740 | | | | |
| Other affiliated issuers (cost $3,393,230) | | | | 4,025,401 | | | | |
| Total Investments (cost $39,514,666) | | | | | | | | $ 52,238,044 |
| Foreign currency held at value (cost $2,708) | | | | | | | | 2,708 |
| Receivable for investments sold | | | | | | | | 1,183,245 |
| Receivable for fund shares sold | | | | | | | | 31,145 |
| Dividends receivable | | | | | | | | 94,672 |
| Interest receivable | | | | | | | | 2,117 |
| Prepaid expenses | | | | | | | | 193 |
| Other affiliated receivables | | | | | | | | 801 |
| Other receivables | | | | | | | | 4,123 |
| Total assets | | | | | | | | 53,557,048 |
| |
| Liabilities | | | | | | | | |
| Payable for investments purchased | | | | $ 869,954 | | | | |
| Payable for fund shares redeemed | | | | 325,641 | | | | |
| Accrued management fee | | | | 18,445 | | | | |
| Payable for daily variation on futures contracts | | | | 861 | | | | |
| Other affiliated payables | | | | 9,358 | | | | |
| Other payables and accrued expenses | | | | 2,479 | | | | |
| Collateral on securities loaned, at value | | | | 1,857,734 | | | | |
| Total liabilities | | | | | | | | 3,084,472 |
| |
| Net Assets | | | | | | | | $ 50,472,576 |
| Net Assets consist of: | | | | | | | | |
| Paid in capital | | | | | | | | $ 26,513,210 |
| Undistributed net investment income | | | | | | | | 115,642 |
| Accumulated undistributed net realized gain (loss) on | | | | | | | | |
| investments and foreign currency transactions | | | | | | | | 11,117,170 |
| Net unrealized appreciation (depreciation) on | | | | | | | | |
| investments and assets and liabilities in foreign | | | | | | | | |
| currencies | | | | | | | | 12,726,554 |
| Net Assets, for 447,451 shares outstanding | | | | | | | | $ 50,472,576 |
| Net Asset Value, offering price and redemption price per | | | | | | | | |
| share ($50,472,576 ÷ 447,451 shares) | | | | | | | | $ 112.80 |
See accompanying notes which are an integral part of the financial statements.
| Financial Statements continued | | | | | | |
| |
| |
| Statement of Operations | | | | | | |
| Amounts in thousands | | | | Year ended March 31, 2006 |
| |
| Investment Income | | | | | | |
| Dividends (including $3,816 received from other | | | | | | |
| affiliated issuers) | | | | | | $ 714,624 |
| Interest | | | | | | 773 |
| Income from affiliated Central Funds | | | | | | 34,099 |
| Total income | | | | | | 749,496 |
| |
| Expenses | | | | | | |
| Management fee | | | | | | |
| Basic fee | | | | $ 301,824 | | |
| Performance adjustment | | | | (96,334) | | |
| Transfer agent fees | | | | 96,295 | | |
| Accounting and security lending fees | | | | 2,419 | | |
| Independent trustees’ compensation | | | | 232 | | |
| Appreciation in deferred trustee compensation account | | | | 86 | | |
| Custodian fees and expenses | | | | 1,815 | | |
| Registration fees | | | | 70 | | |
| Audit | | | | 446 | | |
| Legal | | | | 377 | | |
| Interest | | | | 24 | | |
| Miscellaneous | | | | 3,154 | | |
| Total expenses before reductions | | | | 310,408 | | |
| Expense reductions | | | | (15,204) | | 295,204 |
| |
| Net investment income (loss) | | | | | | 454,292 |
| Realized and Unrealized Gain (Loss) | | | | | | |
| Net realized gain (loss) on: | | | | | | |
| Investment securities: | | | | | | |
| Unaffiliated issuers | | | | 16,184,051 | | |
| Other affiliated issuers | | | | (76,449) | | |
| Foreign currency transactions | | | | (5,599) | | |
| Futures contracts | | | | 29,526 | | |
| Total net realized gain (loss) | | | | | | 16,131,529 |
| Change in net unrealized appreciation (depreciation) on: | | | | | | |
| Investment securities (net of increase in deferred for- | | | | | | |
| eign taxes of $552) | | | | (8,884,123) | | |
| Assets and liabilities in foreign currencies | | | | 965 | | |
| Futures contracts | | | | 2,763 | | |
| Total change in net unrealized appreciation | | | | | | |
| (depreciation) | | | | | | (8,880,395) |
| Net gain (loss) | | | | | | 7,251,134 |
| Net increase (decrease) in net assets resulting from | | | | | | |
| operations | | | | | | $ 7,705,426 |
See accompanying notes which are an integral part of the financial statements.
| Statement of Changes in Net Assets | | | | | | | | |
| | | | | Year ended | | | | Year ended |
| | | | | March 31, | | | | March 31, |
| Amounts in thousands | | | | 2006 | | | | 2005 |
| Increase (Decrease) in Net Assets | | | | | | | | |
| Operations | | | | | | | | |
| Net investment income (loss) | | | | $ 454,292 | | | | $ 790,819 |
| Net realized gain (loss) | | | | 16,131,529 | | | | 1,094,209 |
| Change in net unrealized appreciation (depreciation) . | | | | (8,880,395) | | | | 66,480 |
| Net increase (decrease) in net assets resulting | | | | | | | | |
| from operations | | | | 7,705,426 | | | | 1,951,508 |
| Distributions to shareholders from net investment income . | | | | (484,145) | | | | (772,150) |
| Distributions to shareholders from net realized gain | | | | (1,415,207) | | | | — |
| Total distributions | | | | (1,899,352) | | | | (772,150) |
| Share transactions | | | | | | | | |
| Proceeds from sales of shares | | | | 3,154,300 | | | | 4,911,554 |
| Reinvestment of distributions | | | | 1,850,209 | | | | 753,651 |
| Cost of shares redeemed | | | | (17,229,221) | | | | (16,750,341) |
| Net increase (decrease) in net assets resulting from | | | | | | | | |
| share transactions | | | | (12,224,712) | | | | (11,085,136) |
| Total increase (decrease) in net assets | | | | (6,418,638) | | | | (9,905,778) |
| |
| Net Assets | | | | | | | | |
| Beginning of period | | | | 56,891,214 | | | | 66,796,992 |
| End of period (including undistributed net investment | | | | | | | | |
| income of $115,642 and undistributed net invest- | | | | | | | | |
| ment income of $161,826, respectively) | | | | $ 50,472,576 | | | | $ 56,891,214 |
| |
| Other Information | | | | | | | | |
| Shares | | | | | | | | |
| Sold | | | | 29,931 | | | | 49,445 |
| Issued in reinvestment of distributions | | | | 17,493 | | | | 7,451 |
| Redeemed | | | | (163,258) | | | | (167,452) |
| Net increase (decrease) | | | | (115,834) | | | | (110,556) |
See accompanying notes which are an integral part of the financial statements.
| Financial Highlights | | | | | | | | | | |
| |
| Years ended March 31, | | 2006 | | 2005 | | 2004 | | 2003 | | 2002 |
| Selected Per Share Data | | | | | | | | | | |
| Net asset value, beginning of | | | | | | | | | | |
| period | | $101.00 | | $ 99.13 | | $ 76.69 | | $102.55 | | $104.50 |
| Income from Investment | | | | | | | | | | |
| Operations | | | | | | | | | | |
| Net investment income (loss)B | | .91 | | 1.26C | | .76 | | .69 | | .45 |
| Net realized and unrealized | | | | | | | | | | |
| gain (loss) | | 14.87 | | 1.85 | | 22.44 | | (25.91) | | (1.14) |
| Total from investment operations | | 15.78 | | 3.11 | | 23.20 | | (25.22) | | (.69) |
| Distributions from net investment | | | | | | | | | | |
| income | | (.98) | | (1.24) | | (.76) | | (.64) | | (.46) |
| Distributions from net realized | | | | | | | | | | |
| gain | | (3.00) | | — | | — | | — | | (.80) |
| Total distributions | | (3.98) | | (1.24) | | (.76) | | (.64) | | (1.26) |
| Net asset value, end of period | | $112.80 | | $101.00 | | $ 99.13 | | $ 76.69 | | $102.55 |
| Total ReturnA | | 15.89% | | 3.14% | | 30.35% | | (24.65)% | | (.76)% |
| Ratios to Average Net AssetsD | | | | | | | | | | |
| Expenses before reductions | | 59% | | .63% | | .70% | | .77% | | .89% |
| Expenses net of fee waivers, if | | | | | | | | | | |
| any | | 59% | | .63% | | .70% | | .77% | | .89% |
| Expenses net of all reductions | | 56% | | .62% | | .70% | | .76% | | .88% |
| Net investment income (loss) | | 86% | | 1.26%C | | .83% | | .82% | | .43% |
| Supplemental Data | | | | | | | | | | |
| Net assets, end of period (in | | | | | | | | | | |
| millions) | | $50,473 | | $56,891 | | $66,797 | | $54,164 | | $77,818 |
| Portfolio turnover rate | | 74% | | 6% | | 13% | | 21% | | 15% |
A Total returns would have been lower had certain expenses not been reduced during the periods shown.
B Calculated based on average shares outstanding during the period.
C Investment income per share reflects a special dividend which amounted to $.35 per share. Excluding the special dividend, the ratio of net
investment income (loss) to average net assets would have been .91%.
D Expense ratios reflect operating expenses of the fund. Expenses before reductions do not reflect amounts reimbursed by the investment adviser or
reductions from brokerage service arrangements or other expense offset arrangements and do not represent the amount paid by the fund during
periods when reimbursements or reductions occur. Expenses net of fee waivers reflect expenses after reimbursement by the investment adviser but
prior to reductions from brokerage service arrangements or other expense offset arrangements. Expenses net of all reductions represent the net
expenses paid by the fund.
|
See accompanying notes which are an integral part of the financial statements.
Notes to Financial Statements
For the period ended March 31, 2006
(Amounts in thousands except ratios)
|
1. Significant Accounting Policies.
Fidelity Magellan Fund (the fund) is registered under the Investment Company Act of 1940, as amended (the 1940 Act), as open end management investment company organized as a Massachusetts business trust and is authorized to issue an unlimited number of shares. Shares of the fund are not currently available for purchase. The fund is closed to most new accounts. The fund may invest in affiliated money market central funds (Money Market Central Funds), which are open end investment companies available to investment companies and other accounts managed by Fidelity Management & Research Company (FMR) and its affiliates. The financial statements have been prepared in conformity with accounting principles generally accepted in the United States of America, which require management to make certain estimates and assumptions at the date of the financial statements. The following summarizes the significant accounting policies of the fund:
Security Valuation. Investments are valued and net asset value (NAV) per share is calculated (NAV calculation) as of the close of business of the New York Stock Exchange (NYSE), normally 4:00 p.m. Eastern time. Wherever possible, the fund uses independent pricing services approved by the Board of Trustees to value its investments.
Equity securities, including restricted securities, for which market quotations are readily available, are valued at the last reported sale price or official closing price as reported by an independent pricing service on the primary market or exchange on which they are traded. In the event there were no sales during the day or closing prices are not available, securities are valued at the last quoted bid price. Investments in open end mutual funds, are valued at their closing net asset value each business day. Short term securities with remaining maturities of sixty days or less for which quotations are not readily available are valued at amortized cost, which approximates value.
When current market prices or quotations are not readily available or do not accurately reflect fair value, valuations may be determined in accordance with procedures adopted by the Board of Trustees. For example, when developments occur between the close of a market and the close of the NYSE that may materially affect the value of some or all of the securities, or when trading in a security is halted, those securities may be fair valued. Factors used in the determination of fair value may include monitoring news to identify significant market or security specific events such as changes in the value of U.S. securi ties markets, reviewing developments in foreign markets and evaluating the perfor mance of ADRs, futures contracts and exchange traded funds. Because the fund’s utilization of fair value pricing depends on market activity, the frequency with which fair value pricing is used can not be predicted and may be utilized to a significant extent. The value of securities used for NAV calculation under fair value pricing may differ from published prices for the same securities.
| Notes to Financial Statements continued |
| (Amounts in thousands except ratios) |
| |
| |
| 1. Significant Accounting Policies continued |
Foreign Currency. The fund uses foreign currency contracts to facilitate transactions in foreign denominated securities. Losses from these transactions may arise from changes in the value of the foreign currency or if the counterparties do not perform under the contracts’ terms.
Foreign denominated assets, including investment securities, and liabilities are trans lated into U.S. dollars at the exchange rate at period end. Purchases and sales of investment securities, income and dividends received and expenses denominated in foreign currencies are translated into U.S. dollars at the exchange rate in effect on the transaction date.
The effects of exchange rate fluctuations on investments are included with the net realized and unrealized gain (loss) on investment securities. Other foreign currency transactions resulting in realized and unrealized gain (loss) are disclosed separately.
Investment Transactions and Income. Security transactions are accounted for as of trade date. Gains and losses on securities sold are determined on the basis of identified cost and may include proceeds received from litigation. Dividend income is recorded on the ex dividend date, except for certain dividends from foreign securities where the ex dividend date may have passed, which are recorded as soon as the fund is informed of the ex dividend date. Non cash dividends included in dividend income, if any, are recorded at the fair market value of the securities received. Distributions received on securities that represent a return of capital or capital gain are recorded as a reduction of cost of investments and/or as a realized gain. The fund estimates the components of distributions received that may be considered return of capital distributions or capital gain distributions. Interest income is accrued as earned. Interest income includes coupon interest and amortization of premium and accretion of discount on debt securi ties. Investment income is recorded net of foreign taxes withheld where recovery of such taxes is uncertain.
Expenses. Most expenses of the trust can be directly attributed to a fund. Expenses which cannot be directly attributed are apportioned among each fund in the trust.
Deferred Trustee Compensation. Under a Deferred Compensation Plan (the Plan), independent Trustees must defer receipt of a portion of, and may elect to defer receipt of an additional portion of, their annual compensation. Deferred amounts are treated as though equivalent dollar amounts had been invested in shares of the fund or are invested in a cross section of other Fidelity funds, and are marked to market. Deferred amounts remain in the fund until distributed in accordance with the Plan.
1. Significant Accounting Policies continued
Income Tax Information and Distributions to Shareholders. Each year, the fund intends to qualify as a regulated investment company by distributing all of its taxable income and realized gains under Subchapter M of the Internal Revenue Code. As a result, no provision for income taxes is required in the accompanying financial statements. Foreign taxes are provided for based on the fund’s understanding of the tax rules and rates that exist in the foreign markets in which it invests.
Distributions are recorded on the ex dividend date. Income and capital gain distribu tions are determined in accordance with income tax regulations, which may differ from generally accepted accounting principles. In addition, the fund will claim a portion of the payment made to redeeming shareholders as a distribution for income tax purposes.
Capital accounts within the financial statements are adjusted for permanent book tax differences. These adjustments have no impact on net assets or the results of operations. Temporary book tax differences will reverse in a subsequent period.
Book tax differences are primarily due to futures transactions, foreign currency transac tions, passive foreign investment companies (PFIC), partnerships, deferred trustees compensation and losses deferred due to wash sales.
The tax basis components of distributable earnings and the federal tax cost as of period end were as follows:
| Unrealized appreciation | | | | $ 13,279,537 | | | | |
| Unrealized depreciation | | | | (572,740) | | | | |
| Net unrealized appreciation (depreciation) | | | | 12,706,797 | | | | |
| Undistributed ordinary income | | | | 103,052 | | | | |
| Undistributed long term capital gain | | | | 9,780,301 | | | | |
| |
| Cost for federal income tax purposes | | | | $ 39,531,247 | | | | |
| |
The tax character of distributions paid was as follows:
| | | | |
| | | | | March 31, 2006 | | | | March 31, 2005 |
| Ordinary Income | | | | $ 484,145 | | | | $ 772,150 |
| Long term Capital Gains | | | | 1,415,207 | | | | — |
| Total | | | | $ 1,899,352 | | | | $ 772,150 |
| |
| |
| 2. Operating Policies. | | | | | | | | |
Repurchase Agreements. FMR has received an Exemptive Order from the Securities and Exchange Commission (the SEC) which permits the fund and other affiliated entities of FMR to transfer uninvested cash balances into joint trading accounts which are then invested in repurchase agreements. The fund may also invest directly with
Notes to Financial Statements continued
(Amounts in thousands except ratios)
|
2. Operating Policies continued
Repurchase Agreements continued
institutions in repurchase agreements. Repurchase agreements are collateralized by government or non government securities. Upon settlement date, collateral is held in segregated accounts with custodian banks and may be obtained in the event of a default of the counterparty. The fund monitors, on a daily basis, the value of the collateral to ensure it is at least equal to the principal amount of the repurchase agreement (includ ing accrued interest). In the event of a default by the counterparty, realization of the collateral proceeds could be delayed, during which time the value of the collateral may decline.
Futures Contracts. The fund may use futures contracts to manage its exposure to the stock market. Buying futures tends to increase a fund’s exposure to the underlying instrument, while selling futures tends to decrease a fund’s exposure to the underlying instrument or hedge other fund investments. Upon entering into a futures contract, a fund is required to deposit with a clearing broker, no later than the following business day, an amount (“initial margin”) equal to a certain percentage of the face value of the contract. The initial margin may be in the form of cash or securities and is transferred to a segregated account on settlement date. Subsequent payments (“variation margin”) are made or received by a fund depending on the daily fluctuations in the value of the futures contract and are accounted for as unrealized gains or losses. Realized gains (losses) are recorded upon the expiration or closing of the futures contract. Securities deposited to meet margin requirements are identified in the Schedule of Investments. Futures contracts involve, to varying degrees, risk of loss in excess of any futures variation margin reflected in the Statement of Assets and Liabilities. The underlying face amount at value of any open futures contracts at period end is shown in the Schedule of Investments under the caption “Futures Contracts.” This amount reflects each contract’s exposure to the underlying instrument at period end. Losses may arise from changes in the value of the underlying instruments or if the counterparties do not perform under the contract’s terms. Futures contracts are valued at the settlement price established each day by the board of trade or exchange on which they are traded.
Restricted Securities. The fund may invest in securities that are subject to legal or contractual restrictions on resale. These securities generally may be resold in transac tions exempt from registration or to the public if the securities are registered. Disposal of these securities may involve time consuming negotiations and expense, and prompt sale at an acceptable price may be difficult. Information regarding restricted securities is included at the end of the fund’s Schedule of Investments.
3. Purchases and Sales of Investments.
Purchases and sales of securities, other than short term securities, aggregated $38,318,021 and $52,303,045, respectively.
4. Fees and Other Transactions with Affiliates.
Management Fee. FMR and its affiliates provide the fund with investment manage ment related services for which the fund pays a monthly management fee. The manage ment fee is the sum of an individual fund fee rate that is based on an annual rate of .30% of the fund’s average net assets and a group fee rate that averaged .27% during the period. The group fee rate is based upon the average net assets of all the mutual funds advised by FMR. The group fee rate decreases as assets under management increase and increases as assets under management decrease. In addition, the management fee is subject to a performance adjustment (up to a maximum of .20% of the fund’s average net assets over a 36 month performance period). The upward or downward adjustment to the management fee is based on the fund’s relative investment performance as compared to an appropriate benchmark index. For the period, the total annual management fee rate, including the performance adjustment, was .39% of the fund’s average net assets.
Transfer Agent Fees. Fidelity Service Company, Inc. (FSC), an affiliate of FMR, is the fund’s transfer, dividend disbursing and shareholder servicing agent. FSC receives account fees and asset based fees that vary according to account size and type of ac count. FSC pays for typesetting, printing and mailing of shareholder reports, except proxy statements. For the period, the transfer agent fees were equivalent to an annual rate of .18% of average net assets.
Accounting and Security Lending Fees. FSC maintains the fund’s accounting records. The accounting fee is based on the level of average net assets for the month. Under a separate contract, FSC administers the security lending program. The security lending fee is based on the number and duration of lending transactions.
Affiliated Central Funds. The fund may invest in Money Market Central Funds which seek preservation of capital and current income and are managed by Fidelity Invest ments Money Management, Inc. (FIMM), an affiliate of FMR.
The Money Market Central Funds do not pay a management fee.
Brokerage Commissions. The fund placed a portion of its portfolio transactions with brokerage firms which are affiliates of the investment adviser. The commissions paid to these affiliated firms were $843 for the period.
| Notes to Financial Statements continued | | |
| (Amounts in thousands except ratios) | | |
| |
| |
| 4. Fees and Other Transactions with Affiliates continued |
Interfund Lending Program. Pursuant to an Exemptive Order issued by the SEC, the fund, along with other registered investment companies having management contracts with FMR, may participate in an interfund lending program. This program provides an alternative credit facility allowing the funds to borrow from, or lend money to, other participating affiliated funds. At period end, there were no interfund loans outstanding. The fund’s activity in this program during the period for which loans were outstanding was as follows:
| | | Average Daily Loan | | Weighted Average | | | | |
| Borrower or Lender | | Balance | | Interest Rate | | | | Interest Expense |
| Borrower | | | | $ 118,322 | | 3.70% | | | | $ 24 |
| |
| 5. Committed Line of Credit. | | | | | | |
The fund participates with other funds managed by FMR in a $4.2 billion credit facility (the “line of credit”) to be utilized for temporary or emergency purposes to fund share holder redemptions or for other short term liquidity purposes. The fund has agreed to pay commitment fees on its pro rata portion of the line of credit. During the period, there were no borrowings on this line of credit.
The fund lends portfolio securities from time to time in order to earn additional income. On the settlement date of the loan, the fund receives collateral (in the form of U.S. Treasury obligations, letters of credit and/or cash) against the loaned securities and maintains collateral in an amount not less than 100% of the market value of the loaned securities during the period of the loan. The market value of the loaned securities is determined at the close of business of the fund and any additional required collateral is delivered to the fund on the next business day. If the borrower defaults on its obligation to return the securities loaned because of insolvency or other reasons, a fund could experience delays and costs in recovering the securities loaned or in gaining access to the collateral. Any cash collateral received is invested in the Fidelity Securities Lending Cash Central Fund. The value of loaned securities and cash collateral at period end are disclosed on the fund’s Statement of Assets and Liabilities. Security lending income represents the income earned on investing cash collateral, less fees and expenses associated with the loan, plus any premium payments that may be received on the loan of certain types of securities. Security lending income is presented in the Statement of Operations as a component of income from affiliated central funds. Net income from lending portfolio securities during the period amounted to $5,386.
Many of the brokers with whom FMR places trades on behalf of the fund provided services to the fund in addition to trade execution. These services included payments of certain expenses on behalf of the fund totaling $12,815 for the period. In addition, through arrangements with the fund’s custodian and transfer agent, credits realized as a result of uninvested cash balances were used to reduce the fund’s expenses. During the period, these credits reduced the fund’s custody and transfer agent expenses by $3 and $2,386, respectively.
The fund’s organizational documents provide former and current trustees and officers with a limited indemnification against liabilities arising in connection with the performance of their duties to the fund. In the normal course of business, the fund may also enter into contracts that provide general indemnifications. The fund’s maximum exposure under these arrangements is unknown as this would be dependent on future claims that may be made against the fund. The risk of material loss from such claims is considered remote.
Report of Independent Registered Public Accounting Firm
To the Trustees and Shareholders of Fidelity Magellan Fund:
In our opinion, the accompanying statement of assets and liabilities, including the sched ule of investments, and the related statements of operations and of changes in net assets and the financial highlights present fairly, in all material respects, the financial position of Fidelity Magellan Fund at March 31, 2006 and the results of its operations, the changes in its net assets and the financial highlights for the periods indicated, in conformity with accounting principles generally accepted in the United States of America. These financial statements and financial highlights (hereafter referred to as “financial statements”) are the responsibility of the Fidelity Magellan Fund’s management; our responsibility is to express an opinion on these financial statements based on our audits. We conducted our audits of these financial statements in accordance with the standards of the Public Company Accounting Oversight Board (United States). Those standards require that we plan and perform the audit to obtain reasonable assurance about whether the financial statements are free of material misstatement. An audit includes examining, on a test basis, evidence supporting the amounts and disclosures in the financial statements, assessing the accounting principles used and significant estimates made by management, and evaluating the overall financial statement presentation. We believe that our audits, which included confirmation of securities at March 31, 2006 by correspondence with the custodian and brokers, provide a reasonable basis for our opinion.
/s/ PricewaterhouseCoopers LLP
PricewaterhouseCoopers LLP
Boston, Massachusetts
May 15, 2006
|
Trustees and Officers
The Trustees, Members of the Advisory Board, and executive officers of the trust and fund, as applicable, are listed below. The Board of Trustees governs the fund and is responsible for protecting the interests of shareholders. The Trustees are experienced executives who meet periodically throughout the year to oversee the fund’s activities, review contractual arrangements with companies that provide services to the fund, and review the fund’s performance. Except for William O. McCoy and Albert R. Gamper, Jr., each of the Trustees oversees 330 funds advised by FMR or an affiliate. Mr. McCoy oversees 332 funds advised by FMR or an affiliate. Mr. Gamper oversees 262 funds advised by FMR or an affiliate.
The Trustees hold office without limit in time except that (a) any Trustee may resign; (b) any Trustee may be removed by written instrument, signed by at least two thirds of the number of Trustees prior to such removal; (c) any Trustee who requests to be retired or who has become incapacitated by illness or injury may be retired by written instru ment signed by a majority of the other Trustees; and (d) any Trustee may be removed at any special meeting of shareholders by a two thirds vote of the outstanding voting securities of the trust. Each Trustee who is not an interested person (as defined in the 1940 Act) (Independent Trustee), shall retire not later than the last day of the calendar year in which his or her 72nd birthday occurs. The Independent Trustees may waive this mandatory retirement age policy with respect to individual Trustees. The executive officers and Advisory Board Members hold office without limit in time, except that any officer and Advisory Board Member may resign or may be removed by a vote of a majority of the Trustees at any regular meeting or any special meeting of the Trustees. Except as indicated, each individual has held the office shown or other offices in the same company for the past five years.
The fund’s Statement of Additional Information (SAI) includes more information about the Trustees. To request a free copy, call Fidelity at 1-800-544-8544.
Correspondence intended for each Trustee who is an interested person may be sent to Fidelity Investments, 82 Devonshire Street, Boston, Massachusetts 02109.
| | Name, Age; Principal Occupation
Edward C. Johnson 3d (75)
|
Year of Election or Appointment: 1984
Mr. Johnson is Chairman of the Board of Trustees. Mr. Johnson serves as Chief Executive Officer, Chairman, and a Director of FMR Corp.; a Director and Chairman of the Board and of the Executive Committee of FMR; Chairman and a Director of Fidelity Research & Analysis Company (FRAC); Chairman and a Director of Fidelity Investments Money Management, Inc.; and Chairman (2001 present) and a Director (2000 present) of FMR Co., Inc.
Trustees and Officers - continued
| | Name, Age; Principal Occupation
Stephen P. Jonas (53)
|
Year of Election or Appointment: 2005
Mr. Jonas is Senior Vice President of Magellan (2005 present). He also serves as Senior Vice President of other Fidelity funds (2005 present). Mr. Jonas is Executive Director of FMR (2005 present). Previously, Mr. Jonas served as President of Fidelity Enterprise Operations and Risk Services (2004 2005), Chief Administrative Officer (2002 2004), and Chief Financial Officer of FMR Co. (1998 2000). Mr. Jonas has been with Fidelity Investments since 1987 and has held various financial and management positions including Chief Financial Officer of FMR. In addition, he serves on the Boards of Boston Ballet (2003 present) and Simmons College (2003 present).
Year of Election or Appointment: 2003
Mr. Reynolds is a Director (2003 present) and Chief Operating Officer (2002 present) of FMR Corp. He also serves on the Board at Fidelity Investments Canada, Ltd. (2000 present). Previously, Mr. Reynolds served as President of Fidelity Investments Institutional Retirement Group (1996 2000).
* Trustees have been determined to be “Interested Trustees” by virtue of, among other things, their affiliation with the trust or various entities under common control with FMR.
Correspondence intended for each Independent Trustee (that is, the Trustees other than the Interested Trustees) may be sent to Fidelity Investments, P.O. Box 55235, Boston, Massachusetts 02205-5235.
| | Name, Age; Principal Occupation
Dennis J. Dirks (57)
|
Year of Election or Appointment: 2005
Prior to his retirement in May 2003, Mr. Dirks was Chief Operating Officer and a member of the Board of The Depository Trust & Clearing Corporation (DTCC) (1999 2003). He also served as President, Chief Operating Officer, and Board member of The Depository Trust Company (DTC) (1999 2003) and President and Board member of the National Securities Clearing Corporation (NSCC) (1999 2003). In addi tion, Mr. Dirks served as Chief Executive Officer and Board member of the Government Securities Clearing Corporation (2001 2003) and Chief Executive Officer and Board member of the Mortgage Backed Securities Clearing Corporation (2001 2003). Mr. Dirks also serves as a Trustee and a member of the Finance Committee of Manhattan College (2005 present) and a Trustee and a member of the Finance Committee of AHRC of Nassau County (2006 present).
| | Albert R. Gamper, Jr. (64)
|
Year of Election or Appointment: 2006
Mr. Gamper also serves as a Trustee (2006 present) or Member of the Advisory Board (2005 present) of other investment companies advised by FMR. Prior to his retirement in December 2004, Mr. Gamper served as Chairman of the Board of CIT Group Inc. (commercial finance). During his tenure with CIT Group Inc. Mr. Gamper served in numerous senior management positions, including Chairman (1987 1989; 1999 2001; 2002 2004), Chief Executive Officer (1987 2004), and President (1989 2002). He currently serves as a member of the Board of Directors of Public Service Enterprise Group (utilities, 2001 present), Chairman of the Board of Governors, Rutgers University (2004 present), and Chairman of the Board of Saint Barnabas Health Care System.
Trustees and Officers - continued
| | Name, Age; Principal Occupation
Robert M. Gates (62)
|
Year of Election or Appointment: 1997
Dr. Gates is Chairman of the Independent Trustees (2006 present). Dr. Gates is President of Texas A&M University (2002 present). He was Director of the Central Intelligence Agency (CIA) from 1991 to 1993. From 1989 to 1991, Dr. Gates served as Assistant to the President of the United States and Deputy National Security Advisor. Dr. Gates is a Director of NACCO Industries, Inc. (mining and manufacturing), Parker Drilling Co., Inc. (drilling and rental tools for the energy industry, 2001 present), and Brinker International (restaurant management, 2003 present). Previously, Dr. Gates served as a Director of LucasVarity PLC (automotive components and diesel engines), a Director of TRW Inc. (automotive, space, defense, and information technology), and Dean of the George Bush School of Government and Public Service at Texas A&M University (1999 2001).
Year of Election or Appointment: 2004
Dr. Heilmeier is Chairman Emeritus of Telcordia Technologies (commu nication software and systems), where prior to his retirement, he served as company Chairman and Chief Executive Officer. He currently serves on the Boards of Directors of The Mitre Corporation (systems engineer ing and information technology support for the government), and HRL Laboratories (private research and development, 2004 present). He is Chairman of the General Motors Science & Technology Advisory Board and a Life Fellow of the Institute of Electrical and Electronics Engineers (IEEE). Dr. Heilmeier is a member of the Defense Science Board and the National Security Agency Advisory Board. He is also a member of the National Academy of Engineering, the American Academy of Arts and Sciences, and the Board of Overseers of the School of Engineering and Applied Science of the University of Pennsylvania. Previously, Dr. Heilmeier served as a Director of TRW Inc. (automotive, space, defense, and information technology, 1992 2002), Compaq (1994 2002), Auto matic Data Processing, Inc. (ADP) (technology based business outsourcing, 1995 2002), INET Technologies Inc. (telecommunications network surveillance, 2001 2004), and Teletech Holdings (customer manage ment services). He is the recipient of the 2005 Kyoto Prize in Advanced Technology for his invention of the liquid crystal display.
Name, Age; Principal Occupation
Marie L. Knowles (59)
|
Year of Election or Appointment: 2001
Prior to Ms. Knowles’ retirement in June 2000, she served as Executive Vice President and Chief Financial Officer of Atlantic Richfield Company (ARCO) (diversified energy, 1996 2000). From 1993 to 1996, she was a Senior Vice President of ARCO and President of ARCO Transportation Company. She served as a Director of ARCO from 1996 to 1998. She currently serves as a Director of Phelps Dodge Corporation (copper mining and manufacturing) and McKesson Corporation (healthcare ser vice, 2002 present). Ms. Knowles is a Trustee of the Brookings Institution and the Catalina Island Conservancy and also serves as a member of the Advisory Board for the School of Engineering of the University of Southern California.
Year of Election or Appointment: 2000
Mr. Lautenbach has been a partner of Clayton, Dubilier & Rice, Inc. (private equity investment firm) since September 1998. Previously, Mr. Lautenbach was with the International Business Machines Corporation (IBM) from 1968 until his retirement in 1998. Mr. Lautenbach serves as a Director of Italtel Holding S.p.A. (telecommunications (Milan, Italy), 2004 present) and Eaton Corporation (diversified industrial) as well as the Philharmonic Center for the Arts in Naples, Florida. He also is a member of the Board of Trustees of Fairfield University (2005 present), as well as a member of the Council on Foreign Relations.
Year of Election or Appointment: 1997
Prior to his retirement in December 1994, Mr. McCoy was Vice Chairman of the Board of BellSouth Corporation (telecommunications) and President of BellSouth Enterprises. He is currently a Director of Duke Realty Corporation (real estate), and Progress Energy, Inc. (electric utility). He is also a partner of Franklin Street Partners (private investment management firm) and a member of the Research Triangle Foundation Board. In addition, Mr. McCoy served as the Interim Chancellor (1999 2000) and a member of the Board of Visitors for the University of North Carolina at Chapel Hill and currently serves as Chairman of the Board of Directors of the University of North Carolina Health Care System and the Board of Visitors of the Kenan Flagler Business School (University of North Carolina at Chapel Hill). He also served as Vice President of Finance for the University of North Carolina (16 school system).
Trustees and Officers - continued
| | Name, Age; Principal Occupation
Cornelia M. Small (61)
|
Year of Election or Appointment: 2005
Ms. Small is a member (2000 present) and Chairperson (2002 present) of the Investment Committee, and a member (2002 present) of the Board of Trustees of Smith College. Previously, she served as Chief In vestment Officer (1999 2000), Director of Global Equity Investments (1996 1999), and a member of the Board of Directors of Scudder, Ste vens & Clark (1990 1997) and Scudder Kemper Investments (1997 1999). In addition, Ms. Small served as Co Chair (2000 2003) of the Annual Fund for the Fletcher School of Law and Diplomacy.
| | William S. Stavropoulos (66)
|
Year of Election or Appointment: 2001
Mr. Stavropoulos is Chairman of the Board (2000 present) and a Mem ber of the Board of Directors of The Dow Chemical Company. Since joining The Dow Chemical Company in 1967, Mr. Stavropoulos served in numerous senior management positions, including President (1993 2000; 2002 2003), CEO (1995 2000; 2002 2004), and Chairman of the Executive Committee (2000 2004). Currently, he is a Director of NCR Corporation (data warehousing and technology solutions), BellSouth Corporation (telecommunications), Chemical Financial Corpo ration, Maersk Inc. (industrial conglomerate, 2002 present), and Metalmark Capital (private equity investment firm, 2005 present). He also serves as a member of the Board of Trustees of the American Enterprise Institute for Public Policy Research. In addition, Mr. Stavropoulos is a member of The Business Council, J.P. Morgan International Council and the University of Notre Dame Advisory Council for the College of Science.
Year of Election or Appointment: 2005
Prior to his retirement in 2001, Mr. Wolfe was Chairman and Chief Executive Officer of Hershey Foods Corporation (1993 2001). He currently serves as a member of the boards of Adelphia Communications Corporation (2003 present), Bausch & Lomb, Inc., and Revlon Inc. (2004 present).
Advisory Board Members and Executive Officers:
Correspondence intended for Mr. Keyes may be sent to Fidelity Investments, P.O. Box 55235, Boston, Massachusetts 022055235. Correspondence intended for each executive officer and Mr. Lynch may be sent to Fidelity Investments, 82 Devonshire Street, Boston, Massachusetts 02109.
| | Name, Age; Principal Occupation
James H. Keyes (65)
|
Year of Election or Appointment: 2006
Member of the Advisory Board of Fidelity Magellan Fund. Prior to his retirement in 2003, Mr. Keyes was Chairman, President, and Chief Executive Officer of Johnson Controls, Inc. (automotive supplier, 1993 2003). He currently serves as a member of the boards of LSI Logic Corporation (semiconductor technologies, 1984 present), Navistar International Corporation (manufacture and sale of trucks, buses, and diesel engines, 2002 present), and Pitney Bowes, Inc. (integrated mail, messaging, and document management solutions, 1998 present).
Year of Election or Appointment: 2003
Member of the Advisory Board of Fidelity Magellan Fund. Vice Chairman and a Director of FMR, and Vice Chairman (2001 present) and a Director (2000 present) of FMR Co., Inc. Previously, Mr. Lynch served as a Trustee of the Fidelity funds (1990 2003). In addition, he serves as a Trustee of Boston College, Massachusetts Eye & Ear Infirmary, Historic Deerfield, John F. Kennedy Library, and the Museum of Fine Arts of Boston.
Year of Election or Appointment: 2005
Vice President of Magellan. Mr. Churchill also serves as Vice President of certain Equity Funds (2005 present) and certain High Income Funds (2005 present). He is Executive Vice President of FMR (2005 present) and FMR Co., Inc. (2005 present), and Senior Vice President of Fidelity Investments Money Management, Inc. (2005 present). Previously, Mr. Churchill served as Head of Fidelity’s Fixed Income Division (2000 2005), Vice President of Fidelity’s Money Market Funds (2000 2005), Vice President of Fidelity’s Bond Funds, and Senior Vice President of FMR.
Trustees and Officers - continued
| | Name, Age; Principal Occupation
Harry Lange (54)
|
Year of Election or Appointment: 2005
Vice President of Magellan. Mr. Lange also serves as Vice President of another fund advised by FMR. Prior to assuming his current responsibilities, Mr. Lange worked as a research analyst, portfolio manager, and director of research. Mr. Lange also serves as Vice President of FMR (2000) and FMR Co., Inc. (2001).
Year of Election or Appointment: 1998
Secretary of Magellan. He also serves as Secretary of other Fidelity funds; Vice President, General Counsel, and Secretary of FMR Co., Inc. (2001 present) and FMR; Assistant Secretary of Fidelity Management & Research (U.K.) Inc. (2001 present), Fidelity Research & Analysis Company (2001 present), and Fidelity Investments Money Management, Inc. (2001 present). Mr. Roiter is an Adjunct Member, Faculty of Law, at Boston College Law School (2003 present). Previously, Mr. Roiter served as Vice President and Secretary of Fidelity Distributors Corporation (FDC) (1998 2005).
Year of Election or Appointment: 2003
Assistant Secretary of Magellan. Mr. Fross also serves as Assistant Secretary of other Fidelity funds (2003 present), Vice President and Secretary of FDC (2005 present), and is an employee of FMR.
Year of Election or Appointment: 2004
President and Treasurer of Magellan. Ms. Reynolds also serves as President and Treasurer of other Fidelity funds (2004 present) and is a Vice President (2003 present) and an employee (2002 present) of FMR. Before joining Fidelity Investments, Ms. Reynolds worked at PricewaterhouseCoopers LLP (PwC) (1980 2002), where she was most recently an audit partner with PwC’s investment management practice.
Year of Election or Appointment: 2006
Anti Money Laundering (AML) officer of Magellan. Mr. Ganis also serves as AML officer of other Fidelity funds (2006 present) and FMR Corp. (2003 present). Before joining Fidelity Investments, Mr. Ganis practiced law at Goodwin Procter, LLP (2000 2002).
Name, Age; Principal Occupation
Paul M. Murphy (59)
|
Year of Election or Appointment: 2005
Chief Financial Officer of Magellan. Mr. Murphy also serves as Chief Financial Officer of other Fidelity funds (2005 present). He also serves as Senior Vice President of Fidelity Pricing and Cash Management Services Group (FPCMS).
Kenneth A. Rathgeber (58)
|
Year of Election or Appointment: 2004
Chief Compliance Officer of Magellan. Mr. Rathgeber also serves as Chief Compliance Officer of other Fidelity funds (2004 present) and Executive Vice President of Risk Oversight for Fidelity Investments (2002 present). He is Chief Compliance Officer of FMR (2005 present), FMR Co., Inc. (2005 present), Fidelity Management & Research (U.K.) Inc. (2005 present), Fidelity Research & Analysis Company (2005 present), Fidelity Investments Money Management, Inc. (2005 present), and Strategic Advisers, Inc. (2005 present). Previously, Mr. Rathgeber served as Executive Vice President and Chief Operating Officer for Fidelity Investments Institutional Services Company, Inc. (1998 2002).
Year of Election or Appointment: 2005
Deputy Treasurer of Magellan. Mr. Mehrmann also serves as Deputy Treasurer of other Fidelity funds (2005 present) and is an employee of FMR. Previously, Mr. Mehrmann served as Vice President of Fidelity In vestments Institutional Services Group (FIIS)/Fidelity Investments Institutional Operations Corporation, Inc. (FIIOC) Client Services (1998 2004).
Kimberley H. Monasterio (42)
|
Year of Election or Appointment: 2004
Deputy Treasurer of Magellan. Ms. Monasterio also serves as Deputy Treasurer of other Fidelity funds (2004) and is an employee of FMR (2004). Before joining Fidelity Investments, Ms. Monasterio served as Treasurer (2000 2004) and Chief Financial Officer (2002 2004) of the Franklin Templeton Funds and Senior Vice President of Franklin Templeton Services, LLC (2000 2004).
Trustees and Officers - continued
| | Name, Age; Principal Occupation
Kenneth B. Robins (36)
|
Year of Election or Appointment: 2005
Deputy Treasurer of Magellan. Mr. Robins also serves as Deputy Treasurer of other Fidelity funds (2005 present) and is an employee of FMR (2004 present). Before joining Fidelity Investments, Mr. Robins worked at KPMG LLP, where he was a partner in KPMG’s department of professional practice (2002 2004) and a Senior Manager (1999 2000). In addition, Mr. Robins served as Assistant Chief Accountant, United States Securities and Exchange Commission (2000 2002).
Year of Election or Appointment: 2005
Assistant Treasurer of Magellan. Mr. Byrnes also serves as Assistant Treasurer of other Fidelity funds (2005 present) and is an employee of FMR (2005 present). Previously, Mr. Byrnes served as Vice President of FPCMS (2003 2005). Before joining Fidelity Investments, Mr. Byrnes worked at Deutsche Asset Management where he served as Vice President of the Investment Operations Group (2000 2003).
Year of Election or Appointment: 1986
Assistant Treasurer of Magellan. Mr. Costello also serves as Assistant Treasurer of other Fidelity funds and is an employee of FMR.
Year of Election or Appointment: 2004
Assistant Treasurer of Magellan. Mr. Lydecker also serves as Assistant Treasurer of other Fidelity funds (2004) and is an employee of FMR.
Year of Election or Appointment: 2002
Assistant Treasurer of Magellan. Mr. Osterheld also serves as Assistant Treasurer of other Fidelity funds (2002) and is an employee of FMR.
Year of Election or Appointment: 2005
Assistant Treasurer of Magellan. Mr. Ryan also serves as Assistant Treasurer of other Fidelity funds (2005 present) and is an employee of FMR (2005 present). Previously, Mr. Ryan served as Vice President of Fund Reporting in FPCMS (1999 2005).
Name, Age; Principal Occupation
Salvatore Schiavone (40)
|
Year of Election or Appointment: 2005
Assistant Treasurer of Magellan. Mr. Schiavone also serves as Assistant Treasurer of other Fidelity funds (2005 present) and is an employee of FMR (2005 present). Before joining Fidelity Investments, Mr. Schiavone worked at Deutsche Asset Management, where he most recently served as Assistant Treasurer (2003 2005) of the Scudder Funds and Vice President and Head of Fund Reporting (1996 2003).
The Board of Trustees of Magellan Fund voted to pay on May 8, 2006, to shareholders of record at the opening of business on May 5, 2005, a distribution of $22.11 per share derived from capital gains realized from sales of portfolio securities and a dividend of $.25 per share from net investment income.
The fund hereby designates as a capital gain dividend with respect to the taxable year ended March 31, 2006, $12,309,626,000 or, if subsequently determined to be different, the net capital gain of such year.
The fund designates 100% of the dividends distributed in May and December during the fiscal year as qualifying for the dividends received deduction for corporate shareholders.
The fund designates 100% of the dividends distributed in May and December during the fiscal year as amounts which may be taken into account as a dividend for the purposes of the maximum rate under section 1(h)(11) of the Internal Revenue Code.
The fund will notify shareholders in January 2007 of amounts for use in preparing 2006 income tax returns.
Proxy Voting Results
A special meeting of the fund’s shareholders was held on October 26, 2005. The results of votes taken among shareholders on proposals before them are reported below. Each vote reported represents one dollar of net asset value held on the record date for the meeting.
| PROPOSAL 1 | | |
| To elect a Board of Trustees.A | | |
| | | # of | | % of |
| | | Votes | | Votes |
| |
| Dennis J. Dirks | | |
| Affirmative | | 26,346,963,828.16 | | 95.405 |
| Withheld | | 1,269,029,749.54 | | 4.595 |
| TOTAL | | 27,615,993,577.70 | | 100.000 |
| Albert R. Gamper, Jr. B | | |
| Affirmative | | 26,321,406,104.59 | | 95.312 |
| Withheld | | 1,294,587,473.11 | | 4.688 |
| TOTAL | | 27,615,993,577.70 | | 100.000 |
| Robert M. Gates | | |
| Affirmative | | 26,231,411,892.70 | | 94.986 |
| Withheld | | 1,384,581,685.00 | | 5.014 |
| TOTAL | | 27,615,993,577.70 | | 100.000 |
| George H. Heilmeier | | |
| Affirmative | | 26,316,012,184.81 | | 95.293 |
| Withheld | | 1,299,981,392.89 | | 4.707 |
| TOTAL | | 27,615,993,577.70 | | 100.000 |
| Abigail P. Johnson | | |
| Affirmative | | 26,220,074,127.79 | | 94.945 |
| Withheld | | 1,395,919,449.91 | | 5.055 |
| TOTAL | | 27,615,993,577.70 | | 100.000 |
| Edward C. Johnson 3d | | |
| Affirmative | | 26,178,573,707.41 | | 94.795 |
| Withheld | | 1,437,419,870.29 | | 5.205 |
| TOTAL | | 27,615,993,577.70 | | 100.000 |
| Stephen P. Jonas | | |
| Affirmative | | 26,295,566,032.38 | | 95.219 |
| Withheld | | 1,320,427,545.32 | | 4.781 |
| TOTAL | | 27,615,993,577.70 | | 100.000 |
| Marie L. Knowles | | |
| Affirmative | | 26,342,939,596.60 | | 95.390 |
| Withheld | | 1,273,053,981.10 | | 4.610 |
| TOTAL | | 27,615,993,577.70 | | 100.000 |
| Ned C. Lautenbach | | |
| Affirmative | | 26,340,642,660.73 | | 95.382 |
| Withheld | | 1,275,350,916.97 | | 4.618 |
| TOTAL | | 27,615,993,577.70 | | 100.000 |
| |
| Marvin L. Mann | | |
| Affirmative | | 26,268,964,028.76 | | 95.122 |
| Withheld | | 1,347,029,548.94 | | 4.878 |
| TOTAL | | 27,615,993,577.70 | | 100.000 |
| |
| William O. McCoy | | |
| Affirmative | | 26,274,352,396.31 | | 95.142 |
| Withheld | | 1,341,641,181.39 | | 4.858 |
| TOTAL | | 27,615,993,577.70 | | 100.000 |
| |
| Robert L. Reynolds | | |
| Affirmative | | 26,317,937,962.57 | | 95.300 |
| Withheld | | 1,298,055,615.13 | | 4.700 |
| TOTAL | | 27,615,993,577.70 | | 100.000 |
| |
| Cornelia M. Small | | |
| Affirmative | | 26,333,310,436.19 | | 95.355 |
| Withheld | | 1,282,683,141.51 | | 4.645 |
| TOTAL | | 27,615,993,577.70 | | 100.000 |
| |
| William S. Stavropoulos | | |
| Affirmative | | 26,311,871,485.50 | | 95.278 |
| Withheld | | 1,304,122,092.20 | | 4.722 |
| TOTAL | | 27,615,993,577.70 | | 100.000 |
| |
| Kenneth L. Wolfe | | |
| Affirmative | | 26,311,161,516.68 | | 95.275 |
| Withheld | | 1,304,832,061.02 | | 4.725 |
| TOTAL | | 27,615,993,577.70 | | 100.000 |
A Denotes trust-wide proposals and voting results.
B Effective January 1, 2006.
|
A-47 Annual Report
Board Approval of Investment Advisory Contracts and Management Fees
Fidelity Magellan Fund
On January 19, 2006, the Board of Trustees, including the Independent Trustees (together, the Board), voted to approve a general research services agreement (the Agreement) between FMR, FMR Co., Inc. (FMRC), Fidelity Investments Money Manage ment, Inc. (FIMM), and Fidelity Research & Analysis Company (FRAC) (together, the Investment Advisers) for the fund, effective January 20, 2006, pursuant to which FRAC may provide general research and investment advisory support services to FMRC and FIMM. The Board considered that it has approved previously various sub advisory agreements for the fund with affiliates of FMR that allow FMR to obtain research, non discretionary advice, or discretionary portfolio management at no additional expense to the fund. The Board, assisted by the advice of fund counsel and independent Trustees’ counsel, considered a broad range of information and determined that it would be beneficial for the fund to access the research and investment advisory support services supplied by FRAC at no additional expense to the fund.
The Board reached this determination in part because the new arrangement will involve no changes in (i) the contractual terms of and fees payable under the fund’s manage ment contract or sub advisory agreements; (ii) the investment process or strategies employed in the management of the fund’s assets; (iii) the nature or level of services provided under the fund’s management contract or sub advisory agreements; (iv) the day to day management of the fund or the persons primarily responsible for such man agement; or (v) the ultimate control or beneficial ownership of FMR, FMRC, or FIMM. The Board also considered that the establishment of the Agreement would not necessi tate prior shareholder approval of the Agreement or result in an assignment and termination of the fund’s management contract or sub advisory agreements under the Investment Company Act of 1940.
Because the Board was approving an arrangement with FRAC under which the fund will not bear any additional management fees or expenses and under which the fund’s portfolio manager would not change, it did not consider the fund’s investment performance, competitiveness of management fee and total expenses, costs of services and profitability, or economies of scale to be significant factors in its decision.
In connection with its future renewal of the fund’s management contract and sub advisory agreements, the Board will consider: (i) the nature, extent, and quality of services provided to the fund, including shareholder and administrative services and investment performance; (ii) the competitiveness of the fund’s management fee and total expenses; (iii) the costs of the services and profitability, including the revenues earned and the expenses incurred by Fidelity in conducting the business of developing, marketing, distributing, managing, administering, and servicing the fund and its shareholders; and (iv) whether there have been economies of scale in respect of the management of the Fidelity funds, whether the Fidelity funds (including the fund) have
appropriately benefited from any such economies of scale, and whether there is potential for realization of any further economies.
Based on its evaluation of all of the conclusions noted above, and after considering all material factors, the Board ultimately concluded that the fund’s Agreement is fair and reasonable, and that the fund’s Agreement should be approved.
This page intentionally left blank.
Investment Adviser
Fidelity Management &
Research Company
Boston, MA
Investment Sub Advisers
FMR Co., Inc.
Fidelity management & Research
(U.K.) Inc.
Fidelity Research & Analysis Company
(formerly Fidelity Management &
Research (Far East) Inc.)
Fidelity Investments Japan Limited
Fidelity International Investment
Advisors
Fidelity International Investment
Advisors (U.K.) Limited
General Distributor
Fidelity Distributors Corporation
Boston, MA
Transfer and Service Agent
Fidelity Service Company, Inc.
Boston, MA
Custodian
State Street Bank and Trust Company
Quincy, MA
|
| The Fidelity Telephone Connection |
| Mutual Fund 24-Hour Service |
| Exchanges/Redemptions | | |
| and Account Assistance | | 1-800-544-6666 |
| Product Information | | 1-800-544-6666 |
| Retirement Accounts | | 1-800-544-4774 |
| (8 a.m. - 9 p.m.) | | |
| TDD Service | | 1-800-544-0118 |
| for the deaf and hearing impaired |
| (9 a.m. - 9 p.m. Eastern time) |
| Fidelity Automated Service | | |
| Telephone (FAST® ) (automated phone logo) | | 1-800-544-5555 |
| (automated phone logo) Automated line for quickest service |
MAG UANNPRO-0506
1.792133.102
|

Item 2. Code of Ethics
As of the end of the period, March 31, 2006, Fidelity Magellan Fund (the trust) has adopted a code of ethics, as defined in Item 2 of Form N-CSR, that applies to its President and Treasurer and its Chief Financial Officer. A copy of the code of ethics is filed as an exhibit to this Form N-CSR.
Item 3. Audit Committee Financial Expert
The Board of Trustees of the trust has determined that Marie L. Knowles is an audit committee financial expert, as defined in Item 3 of Form N-CSR. Ms. Knowles is independent for purposes of Item 3 of Form N-CSR.
Item 4. Principal Accountant Fees and Services
(a) Audit Fees.
For the fiscal years ended March 31, 2006 and March 31, 2005, the aggregate Audit Fees billed by PricewaterhouseCoopers LLP (PwC) for professional services rendered for the audits of the financial statements, or services that are normally provided in connection with statutory and regulatory filings or engagements for those fiscal years, for the Fidelity Magellan Fund (the fund) and for all funds in the Fidelity Group of Funds are shown in the table below.
Fund | 2006A | 2005A |
Fidelity Magellan Fund | $321,000 | $322,000 |
All funds in the Fidelity Group of Funds audited by PwC | $12,500,000 | $11,100,000 |
A | Aggregate amounts may reflect rounding. |
(b) Audit-Related Fees.
In each of the fiscal years ended March 31, 2006 and March 31, 2005 the aggregate Audit-Related Fees billed by PwC for services rendered for assurance and related services to the fund that are reasonably related to the performance of the audit or review of the fund's financial statements, but not reported as Audit Fees, are shown in the table below.
Fund | 2006A | 2005A |
Fidelity Magellan Fund | $0 | $0 |
A | Aggregate amounts may reflect rounding. |
In each of the fiscal years ended March 31, 2006 and March 31, 2005, the aggregate Audit-Related Fees that were billed by PwC that were required to be approved by the Audit Committee for services rendered on behalf of Fidelity Management & Research Company (FMR) and entities controlling, controlled by, or under common control with FMR (not including any sub-adviser whose role is primarily portfolio management and is subcontracted with or overseen by another investment adviser) that provide ongoing services to the fund ("Fund Service Providers") for assurance and related services that relate directly to the operations and financial reporting of the fund that are reasonably related to the performance of the audit or review of the fund's financial statements, but not reported as Audit Fees, are shown in the table below.
Billed By | 2006A | 2005A |
PwC | $0 | $0 |
A | Aggregate amounts may reflect rounding. |
Fees included in the audit-related category comprise assurance and related services (e.g., due diligence services) that are traditionally performed by the independent registered public accounting firm. These audit-related services include due diligence related to mergers and acquisitions, accounting consultations and audits in connection with acquisitions, internal control reviews, attest services that are not required by statute or regulation and consultation concerning financial accounting and reporting standards.
(c) Tax Fees.
In each of the fiscal years ended March 31, 2006 and March 31, 2005, the aggregate Tax Fees billed by PwC for professional services rendered for tax compliance, tax advice, and tax planning for the fund is shown in the table below.
Fund | 2006A | 2005A |
Fidelity Magellan Fund | $4,600 | $4,200 |
A | Aggregate amounts may reflect rounding. |
In each of the fiscal years ended March 31, 2006 and March 31, 2005, the aggregate Tax Fees billed by PwC that were required to be approved by the Audit Committee for professional services rendered on behalf of the Fund Service Providers for tax compliance, tax advice, and tax planning that relate directly to the operations and financial reporting of the fund is shown in the table below.
Billed By | 2006A | 2005A |
PwC | $0 | $0 |
A | Aggregate amounts may reflect rounding. |
Fees included in the Tax Fees category comprise all services performed by professional staff in the independent registered public accounting firm's tax division except those services related to the audit. Typically, this category would include fees for tax compliance, tax planning, and tax advice. Tax compliance, tax advice, and tax planning services include preparation of original and amended tax returns, claims for refund and tax payment-planning services, assistance with tax audits and appeals, tax advice related to mergers and acquisitions and requests for rulings or technical advice from taxing authorities.
(d) All Other Fees.
In each of the fiscal years ended March 31, 2006 and March 31, 2005, the aggregate Other Fees billed by PwC for all other non-audit services rendered to the fund is shown in the table below.
Fund | 2006A | 2005A |
Fidelity Magellan Fund | $46,900 | $56,800 |
A | Aggregate amounts may reflect rounding. |
In each of the fiscal years ended March 31, 2006 and March 31, 2005, the aggregate Other Fees billed by PwC that were required to be approved by the Audit Committee for all other non-audit services rendered on behalf of the Fund Service Providers that relate directly to the operations and financial reporting of the fund is shown in the table below.
Billed By | 2006A | 2005A |
PwC | $155,000 | $450,000 |
A | Aggregate amounts may reflect rounding. |
Fees included in the All Other Fees category include services related to internal control reviews, strategy and other consulting, financial information systems design and implementation, consulting on other information systems, and other tax services unrelated to the fund.
(e) (1) | Audit Committee Pre-Approval Policies and Procedures: |
The trust's Audit Committee must pre-approve all audit and non-audit services provided by the independent registered public accounting firm relating to the operations or financial reporting of the fund. Prior to the commencement of any audit or non-audit services to a fund, the Audit Committee reviews the services to determine whether they are appropriate and permissible under applicable law.
The trust's Audit Committee has adopted policies and procedures to, among other purposes, provide a framework for the Committee's consideration of non-audit services by the audit firms that audit the Fidelity funds. The policies and procedures require that any non-audit service provided by a fund audit firm to a Fidelity Fund and any non-audit service provided by a fund auditor to a Fund Service Provider that relates directly to the operations and financial reporting of a Fidelity fund (Covered Service) are subject to approval by the Audit Committee before such service is provided. Non-audit services provided by a fund audit firm for a Fund Service Provider that do not relate directly to the operations and financial reporting of a Fidelity fund (Non-Covered Service) but that are expected to exceed $50,000 are also subject to pre-approval by the Audit Committee.
All Covered Services, as well as Non-Covered Services that are expected to exceed $50,000, must be approved in advance of provision of the service either: (i) by formal resolution of the Audit Committee, or (ii) by oral or written approval of the service by the Chair of the Audit Committee (or if the Chair is unavailable, such other member of the Audit Committee as may be designated by the Chair to act in the Chair's absence). The approval contemplated by (ii) above is permitted where the Treasurer determines that action on such an engagement is necessary before the next meeting of the Audit Committee. Neither pre-approval nor advance notice of Non-Covered Service engagements for which fees are not expected to exceed $50,000 is required; such engagements are to be reported to the Audit Committee monthly.
(e) (2) | Services approved pursuant to paragraph (c)(7)(i)(C) of Rule 2-01 of Regulation S-X: |
Audit-Related Fees:
There were no amounts that were approved by the Audit Committee pursuant to the de minimis exception for the fiscal years ended March 31, 2006 and March 31, 2005 on behalf of the fund.
There were no amounts that were required to be approved by the Audit Committee pursuant to the de minimis exception for the fiscal years ended March 31, 2006 and March 31, 2005 on behalf of the Fund Service Providers that relate directly to the operations and financial reporting of the fund.
Tax Fees:
There were no amounts that were approved by the Audit Committee pursuant to the de minimis exception for the fiscal years ended March 31, 2006 and March 31, 2005 on behalf of the fund.
There were no amounts that were required to be approved by the Audit Committee pursuant to the de minimis exception for the fiscal years ended March 31, 2006 and March 31, 2005 on behalf of the Fund Service Providers that relate directly to the operations and financial reporting of the fund.
All Other Fees:
There were no amounts that were approved by the Audit Committee pursuant to the de minimis exception for the fiscal years ended March 31, 2006 and March 31, 2005 on behalf of the fund.
There were no amounts that were required to be approved by the Audit Committee pursuant to the de minimis exception for the fiscal years ended March 31, 2006 and March 31, 2005 on behalf of the Fund Service Providers that relate directly to the operations and financial reporting of the fund.
(f) Not applicable.
(g) For the fiscal years ended March 31, 2006 and March 31, 2005, the aggregate fees billed by PwC of $1,080,000A and $1,500,000A,B for non-audit services rendered on behalf of the fund, FMR (not including any sub-adviser whose role is primarily portfolio management and is subcontracted with or overseen by another investment adviser) and Fund Service Providers relating to Covered Services and Non-Covered Services are shown in the table below.
| 2006A | 2005A |
Covered Services | $205,000 | $500,000 |
Non-Covered Services | $875,000 | $1,000,000B |
A | Aggregate amounts may reflect rounding. |
B | Reflects current period presentation. |
(h) The trust's Audit Committee has considered Non-Covered Services that were not pre-approved that were provided by PwC to Fund Service Providers to be compatible with maintaining the independence of PwC in its audit of the fund, taking into account representations from PwC, in accordance with Independence Standards Board Standard No.1, regarding its independence from the fund and its related entities.
Item 5. Audit Committee of Listed Registrants
Not applicable.
Item 6. Schedule of Investments
Not applicable.
Item 7. Disclosure of Proxy Voting Policies and Procedures for Closed-End Management Investment Companies
Not applicable.
Item 8. Portfolio Managers of Closed-End Management Investment Companies
Not applicable.
Item 9. Purchase of Equity Securities by Closed-End Management Investment Company and Affiliated Purchasers
Not applicable.
Item 10. Submission of Matters to a Vote of Security Holders
There were no material changes to the procedures by which shareholders may recommend nominees to the trust's Board of Trustees.
Item 11. Controls and Procedures
(a)(i) The President and Treasurer and the Chief Financial Officer have concluded that the trust's disclosure controls and procedures (as defined in Rule 30a-3(c) under the Investment Company Act) provide reasonable assurances that material information relating to the trust is made known to them by the appropriate persons, based on their evaluation of these controls and procedures as of a date within 90 days of the filing date of this report.
(a)(ii) There was no change in the trust's internal control over financial reporting (as defined in Rule 30a-3(d) under the Investment Company Act) that occurred during the second fiscal quarter of the period covered by this report that has materially affected, or is reasonably likely to materially affect, the trust's internal control over financial reporting.
Item 12. Exhibits
(a) | (1) | Code of Ethics pursuant to Item 2 of Form N-CSR is filed and attached hereto as EX-99.CODE ETH. |
(a) | (2) | Certification pursuant to Rule 30a-2(a) under the Investment Company Act of 1940 (17 CFR 270.30a-2(a)) is filed and attached hereto as Exhibit 99.CERT. |
(a) | (3) | Not applicable. |
(b) | | Certification pursuant to Rule 30a-2(b) under the Investment Company Act of 1940 (17 CFR 270.30a-2(b)) is furnished and attached hereto as Exhibit 99.906CERT. |
SIGNATURES
Pursuant to the requirements of the Securities Exchange Act of 1934 and the Investment Company Act of 1940, the registrant has duly caused this report to be signed on its behalf by the undersigned, thereunto duly authorized.
Fidelity Magellan Fund
By: | /s/Christine Reynolds |
| Christine Reynolds |
| President and Treasurer |
| |
Date: | May 17, 2006 |
Pursuant to the requirements of the Securities Exchange Act of 1934 and the Investment Company Act of 1940, this report has been signed below by the following persons on behalf of the registrant and in the capacities and on the dates indicated.
By: | /s/Christine Reynolds |
| Christine Reynolds |
| President and Treasurer |
| |
Date: | May 17, 2006 |
By: | /s/Paul M. Murphy |
| Paul M. Murphy |
| Chief Financial Officer |
| |
Date: | May 17, 2006 |