UNITED STATES
SECURITIES AND EXCHANGE COMMISSION
Washington, D.C. 20549
FORM N-CSR
CERTIFIED SHAREHOLDER REPORT OF REGISTERED
MANAGEMENT INVESTMENT COMPANIES
Investment Company Act file number 811-1193
Fidelity Magellan Fund
(Exact name of registrant as specified in charter)
82 Devonshire St., Boston, Massachusetts 02109
(Address of principal executive offices) (Zip code)
Scott C. Goebel, Secretary
82 Devonshire St.
Boston, Massachusetts 02109
(Name and address of agent for service)
Registrant's telephone number, including area code: 617-563-7000
Date of fiscal year end: | March 31 |
| |
Date of reporting period: | March 31, 2011 |
Item 1. Reports to Stockholders
Fidelity®
Magellan®
Fund
Annual Report
March 31, 2011
(2_fidelity_logos) (Registered_Trademark)
Contents
Chairman's Message | <Click Here> | The Chairman's message to shareholders. |
Performance | <Click Here> | How the fund has done over time. |
Management's Discussion of Fund Performance | <Click Here> | The Portfolio Manager's review of fundperformance and strategy. |
Shareholder Expense Example | <Click Here> | An example of shareholder expenses. |
Investment Changes | <Click Here> | A summary of major shifts in the fund's investments over the past six months. |
Investments | <Click Here> | A complete list of the fund's investments with their market values. |
Financial Statements | <Click Here> | Statements of assets and liabilities, operations, and changes in net assets, as well as financial highlights. |
Notes | <Click Here> | Notes to the financial statements. |
Report of Independent Registered Public Accounting Firm | <Click Here> | |
Trustees and Officers | <Click Here> | |
Distributions | <Click Here> | |
To view a fund's proxy voting guidelines and proxy voting record for the 12-month period ended June 30, visit http://www.fidelity.com/proxyvotingresults or visit the Securities and Exchange Commission's (SEC) website at http://www.sec.gov. You may also call 1-800-544-8544 to request a free copy of the proxy voting guidelines.
Standard & Poor's, S&P and S&P 500 are registered service marks of The McGraw-Hill Companies, Inc. and have been licensed for use by Fidelity Distributors Corporation.
Other third party marks appearing herein are the property of their respective owners.
All other marks appearing herein are registered or unregistered trademarks or service marks of FMR LLC or an affiliated company.
Annual Report
This report and the financial statements contained herein are submitted for the general information of the shareholders of the fund. This report is not authorized for distribution to prospective investors in the fund unless preceded or accompanied by an effective prospectus.
A fund files its complete schedule of portfolio holdings with the SEC for the first and third quarters of each fiscal year on Form N-Q. Forms N-Q are available on the SEC's web site at http://www.sec.gov. A fund's Forms N-Q may be reviewed and copied at the SEC's Public Reference Room in Washington, DC. Information regarding the operation of the SEC's Public Reference Room may be obtained by calling 1-800-SEC-0330. For a complete list of a fund's portfolio holdings, view the most recent holdings listing, semiannual report, or annual report on Fidelity's web site at http://www.fidelity.com, http://www.advisor.fidelity.com, or http://www.401k.com, as applicable.
NOT FDIC INSURED • MAY LOSE VALUE • NO BANK GUARANTEE
Neither the fund nor Fidelity Distributors Corporation is a bank.
Annual Report
(photo_of_James_C_Curvey)
Dear Shareholder:
Amid indications the U.S. economy had turned a corner, U.S. equities continued their generally upward trend in early 2011, overcoming bouts of short-term volatility following unrest in North Africa and the disaster in Japan. Still, questions remained about the longer-term outlook, most notably persistently high unemployment. Financial markets are always unpredictable, of course, but there also are several time-tested investment principles that can help put the odds in your favor.
One of the basic tenets is to invest for the long term. Over time, riding out the markets' inevitable ups and downs has proven much more effective than selling into panic or chasing the hottest trend. Even missing only a few of the markets' best days can significantly diminish investor returns. Patience also affords the benefits of compounding - of earning interest on additional income or reinvested dividends and capital gains. There can be tax advantages and cost benefits to consider as well. While staying the course doesn't eliminate risk, it can considerably lessen the effect of short-term declines.
You can further manage your investing risk through diversification. And today, more than ever, geographic diversification should be taken into account. Studies indicate that asset allocation is the single most important determinant of a portfolio's long-term success. The right mix of stocks, bonds and cash - aligned to your particular risk tolerance and investment objective - is very important. Age-appropriate rebalancing is also an essential aspect of asset allocation. For younger investors, an emphasis on equities - which historically have been the best-performing asset class over time - is encouraged. As investors near their specific goal, such as retirement or sending a child to college, consideration may be given to replacing volatile assets (e.g. common stocks) with more-stable fixed investments (bonds or savings plans).
A third principle - investing regularly - can help lower the average cost of your purchases. Investing a certain amount of money each month or quarter helps ensure you won't pay for all your shares at market highs. This strategy - known as dollar cost averaging - also reduces "emotion" from investing, helping shareholders avoid selling weak performers just prior to an upswing, or chasing a hot performer just before a correction.
We invite you to contact us via the Internet, through our Investor Centers or by phone. It is our privilege to provide you the information you need to make the investments that are right for you.
Sincerely,
(The acting chairman's signature appears here.)
James C. Curvey
Acting Chairman
Annual Report
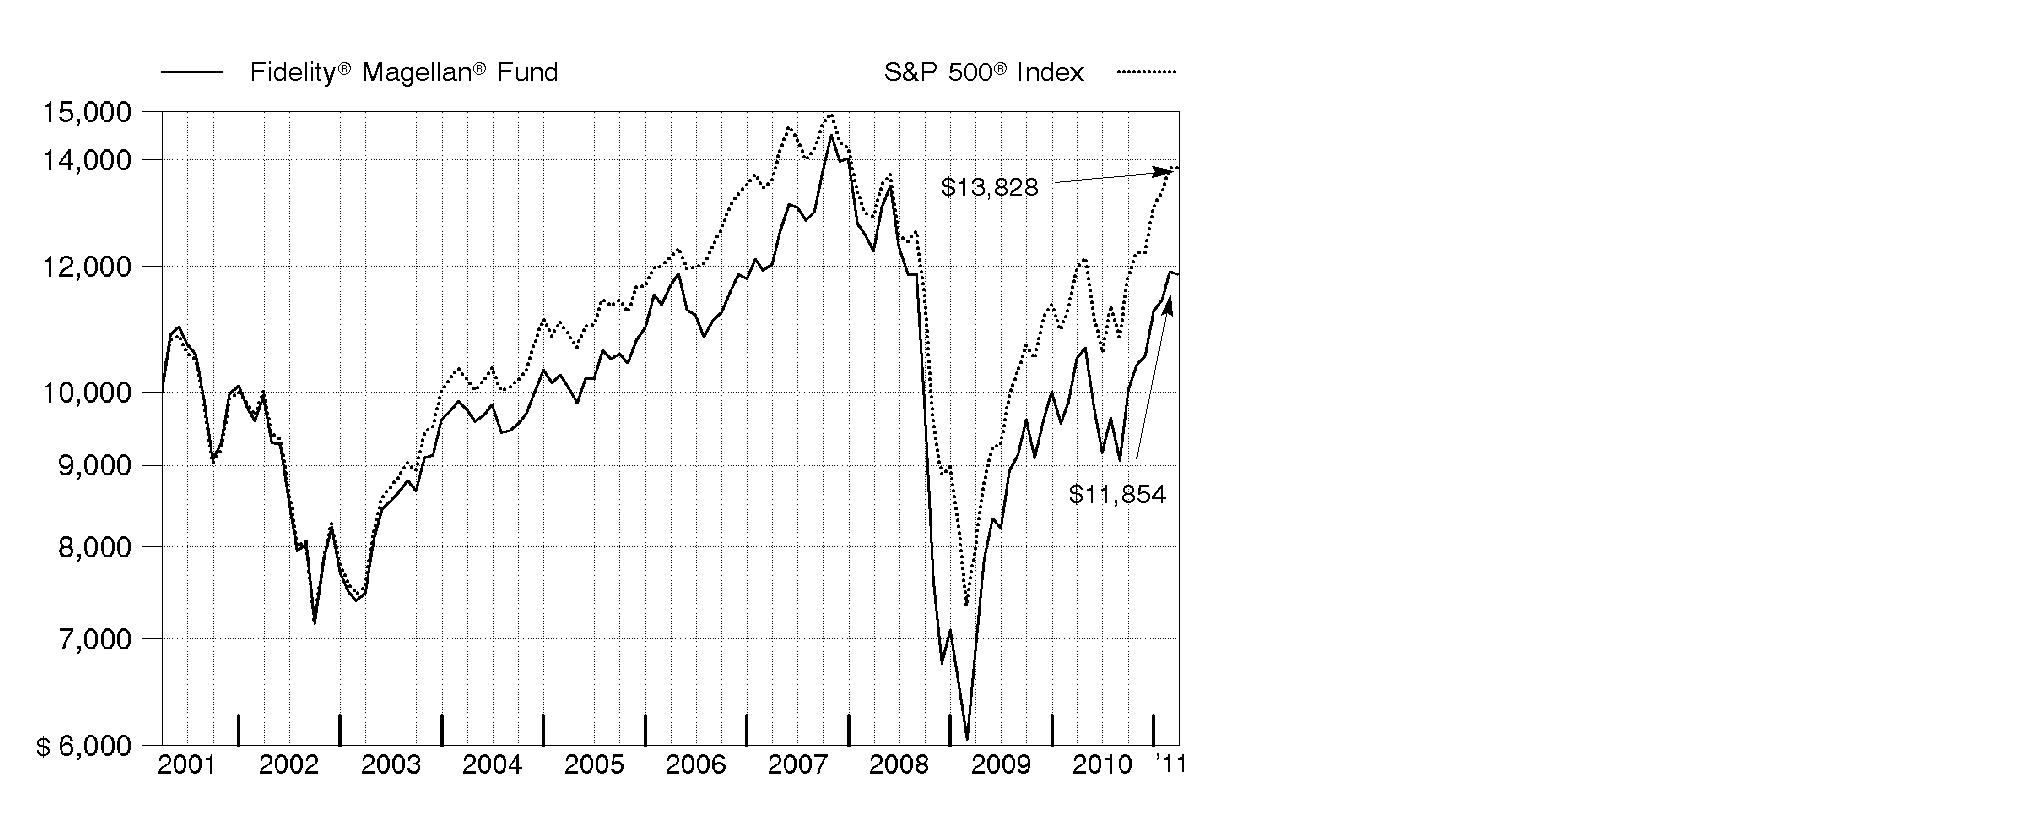
Average annual total return reflects the change in the value of an investment, assuming reinvestment of the class' distributions from dividend income and capital gains (the profits earned upon the sale of securities that have grown in value, if any) and assuming a constant rate of performance each year. The $10,000 table and the fund's returns do not reflect the deduction of taxes that a shareholder would pay on fund distributions or the redemption of fund shares. During periods of reimbursement by Fidelity, a fund's total return will be greater than it would be had the reimbursement not occurred. How a fund did yesterday is no guarantee of how it will do tomorrow.
Average Annual Total Returns
Periods ended March 31, 2011 | Past 1
year | Past 5
years | Past 10
years |
Fidelity Magellan Fund | 12.82% | 0.35% | 1.72% |
$10,000 Over 10 Years
Let's say hypothetically that $10,000 was invested in Fidelity® Magellan® Fund, a class of the fund, on March 31, 2001. The chart shows how the value of your investment would have changed, and also shows how the S&P 500® Index performed over the same period.
Annual Report
Market Recap: The 12-month period ending March 31, 2011, marked another good stretch for major equity markets, which continued a rally that began two years earlier. Despite early-period volatility brought on by the debt crisis in Europe and worries about a potential "double-dip" recession in the U.S., stocks regained strength in late summer and fall, fueled by better-than-expected corporate earnings, encouraging economic activity, stimulative tax policies and the Federal Reserve's second round of quantitative easing involving the purchase of $600 billion in U.S. Treasuries. For the full period, the broad-based, large-cap-oriented S&P 500® Index posted a 15.65% gain, while its blue-chip counterpart, the Dow Jones Industrial AverageSM, rose 16.51% and the technology-laden Nasdaq Composite® Index added 17.06%. Within the S&P 500®, economically sensitive sectors generally saw the biggest gains, led by energy, materials and consumer discretionary. Telecommunication services stocks also rose sharply. By contrast, the financials and health care sectors showed only modest advances. Although global markets were rocked later in the period by heightened unrest in the Arab world and a devastating earthquake in Japan, foreign developed-markets equities, as represented by the MSCI® EAFE® (Europe, Australasia, Far East) Index, finished the year up 10.55%, significantly boosted by a weaker dollar.
Comments from Harry Lange, Portfolio Manager of Fidelity® Magellan® Fund: The fund's Retail Class shares returned 12.82% for the year, trailing the S&P 500®. Weak stock and industry selection in consumer discretionary hampered performance, as did unfavorable positioning in energy. Stock picking in technology - due to a large out-of-benchmark position in poor-performing Finland-based Nokia, which I sold - also hurt. The fund's foreign holdings detracted overall, despite the tail wind from a weaker U.S. dollar. Other disappointments included pharmacy benefit manager Medco Health Solutions, an out-of-index position in China Life Insurance, office products supplier Staples and specialty glass maker Corning. I sold China Life and Staples by period end. Conversely, solid picks and a sizable underweighting in the pharmaceuticals/biotechnology/life science industry added value. Favorable positioning in consumer staples and financials, as well as a large overweighting in materials, further bolstered performance. At the stock level, underexposure to some lagging mega-caps in the benchmark was helpful. Among them were Microsoft, Hewlett-Packard and Johnson & Johnson, a trio I didn't own at all, and Bank of America, which I underweighted and sold prior to period end. Overweighting coffee purveyor Starbucks and an out-of-index stake in Canada-based Valeant Pharmaceuticals International also contributed.
The views expressed above reflect those of the portfolio manager(s) only through the end of the period as stated on the cover of this report and do not necessarily represent the views of Fidelity or any other person in the Fidelity organization. Any such views are subject to change at any time based upon market or other conditions and Fidelity disclaims any responsibility to update such views. These views may not be relied on as investment advice and, because investment decisions for a Fidelity fund are based on numerous factors, may not be relied on as an indication of trading intent on behalf of any Fidelity fund.
Annual Report
Shareholder Expense Example
As a shareholder of the Fund, you incur two types of costs: (1) transaction costs, and (2) ongoing costs, including management fees and other Fund expenses. This Example is intended to help you understand your ongoing costs (in dollars) of investing in the Fund and to compare these costs with the ongoing costs of investing in other mutual funds.
The Example is based on an investment of $1,000 invested at the beginning of the period and held for the entire period (October 1, 2010 to March 31, 2011).
Actual Expenses
The first line of the accompanying table for each class of the Fund provides information about actual account values and actual expenses. You may use the information in this line, together with the amount you invested, to estimate the expenses that you paid over the period. Simply divide your account value by $1,000.00 (for example, an $8,600 account value divided by $1,000.00 = 8.6), then multiply the result by the number in the first line for a class of the Fund under the heading entitled "Expenses Paid During Period" to estimate the expenses you paid on your account during this period. A small balance maintenance fee of $12.00 that is charged once a year may apply for certain accounts with a value of less than $2,000. This fee is not included in the table below. If it was, the estimate of expenses you paid during the period would be higher, and your ending account value lower, by this amount. In addition, the Fund, as a shareholder in the underlying Fidelity Central Funds, will indirectly bear its pro-rata share of the fees and expenses incurred by the underlying Fidelity Central Funds. These fees and expenses are not included in the Fund's annualized expense ratio used to calculate the expense estimate in the table below.
Hypothetical Example for Comparison Purposes
The second line of the accompanying table for each class of the Fund provides information about hypothetical account values and hypothetical expenses based on a Class' actual expense ratio and an assumed rate of return of 5% per year before expenses, which is not the Class' actual return. The hypothetical account values and expenses may not be used to estimate the actual ending account balance or expenses you paid for the period. You may use this information to compare the ongoing costs of investing in the Fund and other funds. To do so, compare this 5% hypothetical example with the 5% hypothetical examples that appear in the shareholder reports of the other funds. A small balance maintenance fee of $12.00 that is charged once a year may apply for certain accounts with a value of less than $2,000. This fee is not included in the table below. If it was, the estimate of expenses you paid during the period would be higher, and your ending account value lower, by this amount. In addition, the Fund, as a shareholder in the underlying Fidelity Central Funds, will indirectly bear its pro-rata share of the fees and expenses incurred by the underlying Fidelity Central Funds. These fees and expenses are not included in the Fund's annualized expense ratio used to calculate the expense estimate in the table below.
Please note that the expenses shown in the table are meant to highlight your ongoing costs only and do not reflect any transaction costs. Therefore, the second line of the table is useful in comparing ongoing costs only, and will not help you determine the relative total costs of owning different funds.
Annual Report
Shareholder Expense Example - continued
| Annualized
Expense Ratio | Beginning
Account Value
October 1, 2010 | Ending
Account Value
March 31, 2011 | Expenses Paid
During Period*
October 1, 2010 to
March 31, 2011 |
Magellan | .53% | | | |
Actual | | $ 1,000.00 | $ 1,181.20 | $ 2.88 |
HypotheticalA | | $ 1,000.00 | $ 1,022.29 | $ 2.67 |
Class K | .41% | | | |
Actual | | $ 1,000.00 | $ 1,181.90 | $ 2.23 |
HypotheticalA | | $ 1,000.00 | $ 1,022.89 | $ 2.07 |
A 5% return per year before expenses
* Expenses are equal to each Class' annualized expense ratio, multiplied by the average account value over the period, multiplied by 182/365 (to reflect the one-half year period).
Annual Report
Investment Changes (Unaudited)
Top Ten Stocks as of March 31, 2011 |
| % of fund's
net assets | % of fund's net assets
6 months ago |
Applied Materials, Inc. | 4.5 | 3.7 |
Apple, Inc. | 3.3 | 2.8 |
Corning, Inc. | 3.0 | 2.7 |
Occidental Petroleum Corp. | 2.9 | 1.8 |
Medco Health Solutions, Inc. | 2.9 | 2.8 |
Goldcorp, Inc. | 2.2 | 2.0 |
ASML Holding NV | 1.8 | 1.3 |
Google, Inc. Class A | 1.8 | 1.4 |
Ensco International Ltd. ADR | 1.6 | 0.4 |
Halliburton Co. | 1.6 | 0.0 |
| 25.6 | |
Top Five Market Sectors as of March 31, 2011 |
| % of fund's
net assets | % of fund's net assets
6 months ago |
Information Technology | 27.5 | 28.3 |
Energy | 13.4 | 8.2 |
Health Care | 13.4 | 11.4 |
Consumer Discretionary | 12.1 | 13.8 |
Financials | 10.6 | 11.1 |
Asset Allocation (% of fund's net assets) |
As of March 31, 2011 * | As of September 30, 2010 ** |
 | Stocks 98.9% | | | Stocks 99.5% | |
 | Convertible
Securities 0.1% | | | Convertible
Securities 0.4% | |
 | Short-Term
Investments and
Net Other Assets 1.0% | | | Short-Term
Investments and
Net Other Assets 0.1% | |
* Foreign investments | 23.4% | | ** Foreign investments | 23.0% | |

Annual Report
Investments March 31, 2011
Showing Percentage of Net Assets
Common Stocks - 98.9% |
| Shares | | Value (000s) |
CONSUMER DISCRETIONARY - 12.1% |
Auto Components - 0.3% |
BorgWarner, Inc. (a) | 1,000,000 | | $ 79,690 |
Hotels, Restaurants & Leisure - 2.0% |
China Lodging Group Ltd. ADR (d) | 500,000 | | 8,750 |
Ctrip.com International Ltd. sponsored ADR (a) | 500,000 | | 20,745 |
Las Vegas Sands Corp. (a) | 2,000,000 | | 84,440 |
Melco PBL Entertainment (Macau) Ltd. sponsored ADR (a)(d) | 274,700 | | 2,088 |
Starbucks Corp. | 9,562,616 | | 353,339 |
| | 469,362 |
Household Durables - 4.5% |
Beazer Homes USA, Inc. (a)(d) | 2,231,800 | | 10,199 |
D.R. Horton, Inc. (e) | 15,988,899 | | 186,271 |
KB Home (d)(e) | 4,088,000 | | 50,855 |
Lennar Corp. Class A (d) | 13,380,585 | | 242,456 |
M.D.C. Holdings, Inc. | 2,226,202 | | 56,434 |
PulteGroup, Inc. (a) | 18,708,638 | | 138,444 |
Ryland Group, Inc. | 1,896,860 | | 30,160 |
Tempur-Pedic International, Inc. (a) | 1,000,000 | | 50,660 |
Toll Brothers, Inc. (a)(e) | 12,853,054 | | 254,105 |
| | 1,019,584 |
Internet & Catalog Retail - 0.2% |
Amazon.com, Inc. (a) | 200,000 | | 36,026 |
Leisure Equipment & Products - 0.4% |
Brunswick Corp. | 3,503,353 | | 89,090 |
Media - 2.0% |
Ascent Media Corp. (a) | 144,656 | | 7,066 |
Cinemark Holdings, Inc. | 238,900 | | 4,623 |
Comcast Corp. Class A (special) (non-vtg.) | 4,000,000 | | 92,880 |
Informa PLC | 5,000,000 | | 33,411 |
Sun TV Ltd. | 504,521 | | 5,088 |
Time Warner Cable, Inc. | 1,500,000 | | 107,010 |
Viacom, Inc. Class B (non-vtg.) | 1,500,000 | | 69,780 |
Virgin Media, Inc. | 4,944,763 | | 137,415 |
| | 457,273 |
Multiline Retail - 0.0% |
Maoye International Holdings Ltd. | 22,713,000 | | 9,782 |
Pantaloon Retail India Ltd. | 194,608 | | 1,404 |
Pantaloon Retail India Ltd. Class B (a) | 19,460 | | 79 |
| | 11,265 |
Common Stocks - continued |
| Shares | | Value (000s) |
CONSUMER DISCRETIONARY - continued |
Specialty Retail - 0.8% |
Belle International Holdings Ltd. | 25,000,000 | | $ 45,831 |
Best Buy Co., Inc. | 3,000,000 | | 86,160 |
TJX Companies, Inc. | 1,000,000 | | 49,730 |
| | 181,721 |
Textiles, Apparel & Luxury Goods - 1.9% |
Arezzo Industria E Comercio SA | 2,005,400 | | 27,944 |
lululemon athletica, Inc. (a) | 674,500 | | 60,064 |
NIKE, Inc. Class B | 1,597,000 | | 120,893 |
Peak Sport Products Co. Ltd. (d) | 58,560,000 | | 40,201 |
Phillips-Van Heusen Corp. | 590,384 | | 38,393 |
Polo Ralph Lauren Corp. Class A | 1,150,000 | | 142,198 |
Vera Bradley, Inc. | 23,500 | | 992 |
| | 430,685 |
TOTAL CONSUMER DISCRETIONARY | | 2,774,696 |
CONSUMER STAPLES - 2.1% |
Food & Staples Retailing - 1.6% |
CVS Caremark Corp. | 2,341,972 | | 80,376 |
Drogasil SA | 1,500,000 | | 11,723 |
United Natural Foods, Inc. (a)(e) | 4,467,342 | | 200,226 |
Wal-Mart de Mexico SA de CV Series V | 10,000,000 | | 29,949 |
Wumart Stores, Inc. (H Shares) | 25,000,000 | | 54,509 |
| | 376,783 |
Food Products - 0.2% |
Shenguan Holdings Group Ltd. | 10,000,000 | | 11,699 |
The J.M. Smucker Co. | 500,000 | | 35,695 |
| | 47,394 |
Household Products - 0.1% |
Uni-Charm Corp. | 500,000 | | 18,187 |
Personal Products - 0.2% |
Estee Lauder Companies, Inc. Class A | 500,000 | | 48,180 |
TOTAL CONSUMER STAPLES | | 490,544 |
ENERGY - 13.4% |
Energy Equipment & Services - 5.8% |
Baker Hughes, Inc. | 1,300,000 | | 95,459 |
Ensco International Ltd. ADR (d) | 6,500,000 | | 375,960 |
Halliburton Co. | 7,300,000 | | 363,832 |
Common Stocks - continued |
| Shares | | Value (000s) |
ENERGY - continued |
Energy Equipment & Services - continued |
Noble Corp. | 1,500,000 | | $ 68,430 |
Schlumberger Ltd. | 3,452,462 | | 321,977 |
Transocean Ltd. (a) | 761,302 | | 59,343 |
Weatherford International Ltd. (a) | 2,000,000 | | 45,200 |
| | 1,330,201 |
Oil, Gas & Consumable Fuels - 7.6% |
Alpha Natural Resources, Inc. (a)(d) | 3,964,700 | | 235,384 |
Anadarko Petroleum Corp. | 1,300,000 | | 106,496 |
Chevron Corp. | 1,700,000 | | 182,631 |
Denbury Resources, Inc. (a) | 9,500,000 | | 231,800 |
Enterprise Products Partners LP | 700,000 | | 30,142 |
Marathon Oil Corp. | 2,262,188 | | 120,597 |
Massey Energy Co. | 1,435,679 | | 98,143 |
Occidental Petroleum Corp. | 6,415,300 | | 670,335 |
Westernzagros Resources Ltd. (a) | 1,000,000 | | 567 |
Williams Companies, Inc. | 2,000,000 | | 62,360 |
| | 1,738,455 |
TOTAL ENERGY | | 3,068,656 |
FINANCIALS - 10.6% |
Capital Markets - 2.1% |
Charles Schwab Corp. | 9,547,000 | | 172,132 |
Evercore Partners, Inc. Class A | 87,600 | | 3,004 |
Franklin Resources, Inc. | 810,800 | | 101,415 |
Invesco Ltd. | 7,000,000 | | 178,920 |
Merriman Holdings, Inc. (a) | 15,012 | | 48 |
TD Ameritrade Holding Corp. | 1,000,000 | | 20,870 |
| | 476,389 |
Commercial Banks - 1.6% |
Aozora Bank Ltd. (d) | 30,100,000 | | 68,043 |
China Merchants Bank Co. Ltd. (H Shares) | 20,000,000 | | 55,408 |
Lloyds Banking Group PLC (a) | 10,000,000 | | 9,289 |
Mitsubishi UFJ Financial Group, Inc. sponsored ADR | 600,000 | | 2,760 |
SVB Financial Group (a) | 1,741,010 | | 99,116 |
Wells Fargo & Co. | 3,917,204 | | 124,175 |
| | 358,791 |
Diversified Financial Services - 1.5% |
CME Group, Inc. | 270,200 | | 81,479 |
Common Stocks - continued |
| Shares | | Value (000s) |
FINANCIALS - continued |
Diversified Financial Services - continued |
JPMorgan Chase & Co. | 1,066,600 | | $ 49,170 |
ORIX Corp. | 2,261,600 | | 211,842 |
| | 342,491 |
Insurance - 0.7% |
Berkshire Hathaway, Inc. Class B (a) | 835,500 | | 69,873 |
Endurance Specialty Holdings Ltd. | 555,800 | | 27,134 |
Ping An Insurance Group Co. China Ltd. (H Shares) | 5,000,000 | | 50,684 |
Reinsurance Group of America, Inc. | 339,549 | | 21,317 |
| | 169,008 |
Real Estate Investment Trusts - 2.5% |
Boston Properties, Inc. | 1,000,000 | | 94,850 |
CBL & Associates Properties, Inc. | 5,513,363 | | 96,043 |
HCP, Inc. | 738,900 | | 28,034 |
Kimco Realty Corp. | 679,800 | | 12,468 |
Mori Hills REIT Investment Corp. | 5,000 | | 15,301 |
ORIX JREIT, Inc. | 3,000 | | 16,485 |
ProLogis Trust | 1,886,500 | | 30,146 |
Simon Property Group, Inc. | 1,000,000 | | 107,160 |
Terreno Realty Corp. (e) | 1,000,000 | | 17,230 |
Vornado Realty Trust | 530,114 | | 46,385 |
Weyerhaeuser Co. | 4,677,136 | | 115,058 |
| | 579,160 |
Real Estate Management & Development - 2.1% |
Agre Developers Ltd. | 10,703 | | 11 |
CB Richard Ellis Group, Inc. Class A (a) | 2,699,300 | | 72,071 |
China Resources Land Ltd. | 10,000,000 | | 18,718 |
Iguatemi Empresa de Shopping Centers SA | 2,189,500 | | 53,509 |
Indiabulls Real Estate Ltd. (a) | 19,800,000 | | 55,228 |
PT Ciputra Development Tbk (a) | 18,384,000 | | 781 |
PT Lippo Karawaci Tbk (e) | 1,227,975,625 | | 86,026 |
Rialto Real Estate Fund LP (a)(e)(g) | 500,000 | | 19,805 |
The St. Joe Co. (a)(d)(e) | 6,854,004 | | 171,830 |
| | 477,979 |
Thrifts & Mortgage Finance - 0.1% |
BankUnited, Inc. | 753,800 | | 21,642 |
TOTAL FINANCIALS | | 2,425,460 |
Common Stocks - continued |
| Shares | | Value (000s) |
HEALTH CARE - 13.4% |
Biotechnology - 2.2% |
Acorda Therapeutics, Inc. (a) | 750,000 | | $ 17,400 |
Amgen, Inc. (a) | 4,003,100 | | 213,966 |
BioMarin Pharmaceutical, Inc. (a) | 2,000,000 | | 50,260 |
Clinical Data, Inc. (a) | 988,714 | | 29,958 |
Incyte Corp. (a)(d) | 1,500,000 | | 23,775 |
Protalix BioTherapeutics, Inc. (a)(d) | 1,000,000 | | 6,080 |
United Therapeutics Corp. (a) | 1,478,560 | | 99,093 |
Vertex Pharmaceuticals, Inc. (a) | 1,000,000 | | 47,930 |
| | 488,462 |
Health Care Equipment & Supplies - 2.4% |
American Medical Systems Holdings, Inc. (a) | 600,000 | | 12,984 |
C. R. Bard, Inc. | 1,899,791 | | 188,668 |
Covidien PLC | 2,000,000 | | 103,880 |
Edwards Lifesciences Corp. (a) | 660,000 | | 57,420 |
Greatbatch, Inc. (a)(e) | 2,318,300 | | 61,342 |
HeartWare International, Inc. (a) | 119,900 | | 10,255 |
Integra LifeSciences Holdings Corp. (a)(e) | 1,500,000 | | 71,130 |
St. Jude Medical, Inc. | 1,000,000 | | 51,260 |
| | 556,939 |
Health Care Providers & Services - 6.7% |
Brookdale Senior Living, Inc. (a)(e) | 10,759,100 | | 301,255 |
Emeritus Corp. (a) | 1,101,160 | | 28,036 |
Express Scripts, Inc. (a) | 5,612,600 | | 312,117 |
HealthSouth Corp. (a) | 1,000,000 | | 24,980 |
Henry Schein, Inc. (a) | 1,403,653 | | 98,494 |
McKesson Corp. | 1,500,000 | | 118,575 |
Medco Health Solutions, Inc. (a) | 11,650,100 | | 654,270 |
| | 1,537,727 |
Life Sciences Tools & Services - 0.8% |
Illumina, Inc. (a) | 1,523,950 | | 106,783 |
QIAGEN NV (a) | 1,700,000 | | 34,085 |
Thermo Fisher Scientific, Inc. (a) | 500,000 | | 27,775 |
| | 168,643 |
Pharmaceuticals - 1.3% |
Auxilium Pharmaceuticals, Inc. (a) | 200,000 | | 4,294 |
Cardiome Pharma Corp. (a) | 2,500,000 | | 10,622 |
Elan Corp. PLC sponsored ADR (a) | 5,000,000 | | 34,400 |
Novo Nordisk AS Series B sponsored ADR | 500,000 | | 62,615 |
Perrigo Co. | 600,000 | | 47,712 |
Common Stocks - continued |
| Shares | | Value (000s) |
HEALTH CARE - continued |
Pharmaceuticals - continued |
Shire PLC sponsored ADR | 300,000 | | $ 26,130 |
Valeant Pharmaceuticals International, Inc. (Canada) | 2,390,450 | | 119,313 |
| | 305,086 |
TOTAL HEALTH CARE | | 3,056,857 |
INDUSTRIALS - 9.6% |
Aerospace & Defense - 1.4% |
BE Aerospace, Inc. (a) | 1,000,000 | | 35,530 |
DigitalGlobe, Inc. (a) | 500,000 | | 14,015 |
Raytheon Co. | 1,000,000 | | 50,870 |
Raytheon Co. warrants 6/16/11 (a) | 204,836 | | 2,737 |
Textron, Inc. | 500,000 | | 13,695 |
TransDigm Group, Inc. (a) | 250,000 | | 20,958 |
United Technologies Corp. | 2,000,000 | | 169,300 |
| | 307,105 |
Airlines - 0.2% |
JetBlue Airways Corp. (a)(d) | 8,829,552 | | 55,361 |
Building Products - 0.7% |
Masco Corp. | 7,100,000 | | 98,832 |
Owens Corning (a) | 1,716,400 | | 61,773 |
| | 160,605 |
Commercial Services & Supplies - 0.8% |
Clean Harbors, Inc. (a) | 400,000 | | 39,464 |
Republic Services, Inc. | 4,000,000 | | 120,160 |
Stericycle, Inc. (a) | 350,000 | | 31,035 |
| | 190,659 |
Construction & Engineering - 1.2% |
Fluor Corp. | 2,500,000 | | 184,150 |
MYR Group, Inc. (a)(e)(f) | 1,037,100 | | 24,807 |
Shaw Group, Inc. (a) | 1,480,000 | | 52,407 |
| | 261,364 |
Electrical Equipment - 1.5% |
Acuity Brands, Inc. | 1,000,000 | | 58,490 |
AMETEK, Inc. | 750,000 | | 32,903 |
Emerson Electric Co. | 1,700,000 | | 99,331 |
EnerSys (a)(e) | 2,696,300 | | 107,178 |
Regal-Beloit Corp. | 451,522 | | 33,336 |
| | 331,238 |
Common Stocks - continued |
| Shares | | Value (000s) |
INDUSTRIALS - continued |
Machinery - 2.0% |
Cummins, Inc. | 1,100,000 | | $ 120,582 |
Danaher Corp. | 6,000,000 | | 311,400 |
NACCO Industries, Inc. Class A | 262,001 | | 28,996 |
| | 460,978 |
Professional Services - 1.6% |
Equifax, Inc. (e) | 7,485,262 | | 290,802 |
Robert Half International, Inc. (d) | 1,624,900 | | 49,722 |
Towers Watson & Co. | 600,000 | | 33,276 |
| | 373,800 |
Road & Rail - 0.2% |
Localiza Rent A Car SA | 2,500,000 | | 40,119 |
Trading Companies & Distributors - 0.0% |
Essex Rental Corp. (a) | 266,666 | | 1,880 |
Transportation Infrastructure - 0.0% |
The Sumitomo Warehouse Co. Ltd. | 1,000,000 | | 4,834 |
TOTAL INDUSTRIALS | | 2,187,943 |
INFORMATION TECHNOLOGY - 27.5% |
Communications Equipment - 1.6% |
HTC Corp. | 2,100,000 | | 82,129 |
Juniper Networks, Inc. (a) | 6,662,110 | | 280,342 |
| | 362,471 |
Computers & Peripherals - 3.4% |
Apple, Inc. (a) | 2,156,200 | | 751,328 |
Seagate Technology (a) | 2,000,000 | | 28,800 |
| | 780,128 |
Electronic Equipment & Components - 4.9% |
Amphenol Corp. Class A | 4,736,900 | | 257,640 |
Corning, Inc. | 33,043,522 | | 681,688 |
Foxconn International Holdings Ltd. (a) | 5,000,000 | | 3,002 |
Hirose Electric Co. Ltd. | 200,000 | | 21,548 |
Ingram Micro, Inc. Class A (a) | 2,577,600 | | 54,207 |
Samsung SDI Co. Ltd. | 500,000 | | 76,607 |
TPK Holdings Co. | 1,000,000 | | 27,512 |
| | 1,122,204 |
Internet Software & Services - 3.9% |
eAccess Ltd. (d) | 160,000 | | 87,922 |
eBay, Inc. (a) | 5,000,000 | | 155,200 |
Common Stocks - continued |
| Shares | | Value (000s) |
INFORMATION TECHNOLOGY - continued |
Internet Software & Services - continued |
Google, Inc. Class A (a) | 701,000 | | $ 410,933 |
GREE, Inc. | 8,000,000 | | 134,191 |
Mail.ru Group Ltd. GDR (a)(f) | 40,300 | | 1,207 |
Yahoo! Japan Corp. | 300,000 | | 107,353 |
| | 896,806 |
IT Services - 2.6% |
Accenture PLC Class A | 3,500,000 | | 192,395 |
Cognizant Technology Solutions Corp. Class A (a) | 3,318,596 | | 270,134 |
Fidelity National Information Services, Inc. | 1,998,800 | | 65,341 |
Fiserv, Inc. (a) | 1,000,000 | | 62,720 |
Unisys Corp. (a) | 496,310 | | 15,495 |
| | 606,085 |
Semiconductors & Semiconductor Equipment - 9.7% |
Applied Materials, Inc. (e) | 66,189,916 | | 1,033,881 |
ASML Holding NV | 9,345,201 | | 415,861 |
Broadcom Corp. Class A | 2,000,000 | | 78,760 |
Himax Technologies, Inc. sponsored ADR | 4,000,000 | | 9,480 |
Lam Research Corp. (a) | 499,200 | | 28,285 |
Marvell Technology Group Ltd. (a) | 3,500,000 | | 54,425 |
Micron Technology, Inc. (a) | 12,969,444 | | 148,630 |
Novellus Systems, Inc. (a) | 3,000,000 | | 111,390 |
NVIDIA Corp. (a) | 1,996,318 | | 36,852 |
PMC-Sierra, Inc. (a) | 2,017,535 | | 15,132 |
Samsung Electronics Co. Ltd. | 165,233 | | 140,444 |
Skyworks Solutions, Inc. (a) | 4,500,000 | | 145,890 |
| | 2,219,030 |
Software - 1.4% |
Autodesk, Inc. (a) | 1,000,000 | | 44,110 |
BMC Software, Inc. (a) | 3,000,000 | | 149,220 |
Changyou.com Ltd. (A Shares) ADR (a) | 357,300 | | 11,505 |
Longtop Financial Technologies Ltd. ADR (a) | 29,200 | | 917 |
Nintendo Co. Ltd. | 400,000 | | 108,074 |
| | 313,826 |
TOTAL INFORMATION TECHNOLOGY | | 6,300,550 |
MATERIALS - 7.6% |
Chemicals - 2.4% |
Celanese Corp. Class A | 1,000,000 | | 44,370 |
Common Stocks - continued |
| Shares | | Value (000s) |
MATERIALS - continued |
Chemicals - continued |
CF Industries Holdings, Inc. | 300,000 | | $ 41,037 |
Ecolab, Inc. | 2,000,000 | | 102,040 |
Givaudan SA | 104,500 | | 105,069 |
Huabao International Holdings Ltd. | 10,000,000 | | 15,376 |
Minerals Technologies, Inc. | 500,000 | | 34,260 |
Praxair, Inc. | 1,000,000 | | 101,600 |
Symrise AG | 2,000,000 | | 58,621 |
Valspar Corp. | 1,000,000 | | 39,100 |
| | 541,473 |
Construction Materials - 0.3% |
Eagle Materials, Inc. (e) | 2,703,891 | | 81,820 |
Metals & Mining - 4.9% |
Barrick Gold Corp. | 1,000,000 | | 51,965 |
Eldorado Gold Corp. | 5,029,586 | | 82,002 |
Goldcorp, Inc. | 9,900,000 | | 493,520 |
Harry Winston Diamond Corp. (a) | 3,400,000 | | 54,767 |
Newcrest Mining Ltd. | 7,967,115 | | 328,116 |
Reliance Steel & Aluminum Co. | 549,300 | | 31,739 |
Royal Gold, Inc. | 500,000 | | 26,200 |
Silver Wheaton Corp. | 500,000 | | 21,718 |
United States Steel Corp. | 500,000 | | 26,970 |
| | 1,116,997 |
TOTAL MATERIALS | | 1,740,290 |
TELECOMMUNICATION SERVICES - 2.3% |
Diversified Telecommunication Services - 0.3% |
CenturyLink, Inc. | 956,279 | | 39,733 |
Iliad Group SA | 200,000 | | 23,970 |
Level 3 Communications, Inc. (a) | 1,331,971 | | 1,958 |
| | 65,661 |
Wireless Telecommunication Services - 2.0% |
American Tower Corp. Class A (a) | 4,500,000 | | 233,190 |
SOFTBANK CORP. | 4,500,000 | | 179,643 |
Sprint Nextel Corp. (a) | 8,000,000 | | 37,120 |
| | 449,953 |
TOTAL TELECOMMUNICATION SERVICES | | 515,614 |
Common Stocks - continued |
| Shares | | Value (000s) |
UTILITIES - 0.3% |
Electric Utilities - 0.2% |
PPL Corp. | 1,979,800 | | $ 50,089 |
Independent Power Producers & Energy Traders - 0.0% |
Indiabulls Power Ltd. (a) | 1,796,532 | | 913 |
Multi-Utilities - 0.1% |
Sempra Energy | 300,000 | | 16,050 |
TOTAL UTILITIES | | 67,052 |
TOTAL COMMON STOCKS (Cost $17,813,356) | 22,627,662 |
Convertible Bonds - 0.1% |
| Principal
Amount (000s) | | |
TELECOMMUNICATION SERVICES - 0.1% |
Diversified Telecommunication Services - 0.1% |
Level 3 Communications, Inc. 7% 3/15/15 (Cost $25,000) | | $ 25,000 | | 29,125 |
Money Market Funds - 2.8% |
| Shares | | |
Fidelity Cash Central Fund, 0.16% (b) | 134,283,226 | | 134,283 |
Fidelity Securities Lending Cash Central Fund, 0.18% (b)(c) | 501,707,588 | | 501,708 |
TOTAL MONEY MARKET FUNDS (Cost $635,991) | 635,991 |
TOTAL INVESTMENT PORTFOLIO - 101.8% (Cost $18,474,347) | | 23,292,778 |
NET OTHER ASSETS (LIABILITIES) - (1.8)% | | (411,499) |
NET ASSETS - 100% | $ 22,881,279 |
Legend |
(a) Non-income producing |
(b) Affiliated fund that is available only to investment companies and other accounts managed by Fidelity Investments. The rate quoted is the annualized seven-day yield of the fund at period end. A complete unaudited listing of the fund's holdings as of its most recent quarter end is available upon request. In addition, each Fidelity Central Fund's financial statements, which are not covered by the Fund's Report of Independent Registered Public Accounting Firm, are available on the SEC's website or upon request. |
(c) Investment made with cash collateral received from securities on loan. |
(d) Security or a portion of the security is on loan at period end. |
(e) Affiliated company |
(f) Security exempt from registration under Rule 144A of the Securities Act of 1933. These securities may be resold in transactions exempt from registration, normally to qualified institutional buyers. At the end of the period, the value of these securities amounted to $26,014,000 or 0.1% of net assets. |
(g) Restricted securities - Investment in securities not registered under the Securities Act of 1933 (excluding 144A issues). At the end of the period, the value of restricted securities (excluding 144A issues) amounted to $19,805,000 or 0.1% of net assets. |
Additional information on each restricted holding is as follows: |
Security | Acquisition
Date | Acquisition
Cost (000s) |
Rialto Real Estate Fund LP | 2/24/11-
3/23/11 | $ 20,528 |
Affiliated Central Funds |
Information regarding fiscal year to date income earned by the Fund from investments in Fidelity Central Funds is as follows: |
Fund | Income earned
(Amounts in thousands) |
Fidelity Cash Central Fund | $ 227 |
Fidelity Securities Lending Cash Central Fund | 13,506 |
Total | $ 13,733 |
Other Affiliated Issuers |
An affiliated company is a company in which the Fund has ownership of at least 5% of the voting securities. Fiscal year to date transactions with companies which are or were affiliates are as follows: |
Affiliate
(Amounts in thousands) | Value,
beginning of
period | Purchases | Sales
Proceeds | Dividend
Income | Value,
end of
period |
Applied Materials, Inc. | $ 1,098,001 | $ - | $ 195,266 | $ 20,139 | $ 1,033,881 |
Brookdale Senior Living, Inc. | 216,297 | 6,989 | - | - | 301,255 |
D.R. Horton, Inc. | 188,001 | 13,267 | - | 2,344 | 186,271 |
Dole Food Co., Inc. | 69,267 | - | 53,756 | - | - |
Eagle Materials, Inc. | 100,852 | - | 31,579 | 1,411 | 81,820 |
EnerSys | - | 79,697 | - | - | 107,178 |
Equifax, Inc. | 339,572 | - | 62,066 | 3,029 | 290,802 |
Greatbatch, Inc. | 49,125 | - | - | - | 61,342 |
Integra LifeSciences Holdings Corp. | 65,745 | - | - | - | 71,130 |
KB Home | 68,474 | - | - | 1,022 | 50,855 |
Monster Worldwide, Inc. | 136,400 | 13,752 | 169,793 | - | - |
MYR Group, Inc. | 16,915 | - | - | - | 24,807 |
PT Lippo Karawaci Tbk | - | 72,959 | - | 270 | 86,026 |
Rialto Real Estate Fund LP | - | 20,528 | - | - | 19,805 |
Staples, Inc. | 937,711 | - | 899,006 | 10,104 | - |
Terreno Realty Corp. | 19,730 | - | - | - | 17,230 |
The St. Joe Co. | 64,700 | 234,634 | 81,809 | - | 171,830 |
Toll Brothers, Inc. | 267,344 | - | - | - | 254,105 |
United Natural Foods, Inc. | 116,557 | 24,411 | 11,303 | - | 200,226 |
Total | $ 3,754,691 | $ 466,237 | $ 1,504,578 | $ 38,319 | $ 2,958,563 |
Other Information |
The following is a summary of the inputs used, as of March 31, 2011, involving the Fund's assets and liabilities carried at fair value. The inputs or methodology used for valuing securities may not be an indication of the risk associated with investing in those securities. For more information on valuation inputs, and their aggregation into the levels used in the tables below, please refer to the Security Valuation section in the accompanying Notes to Financial Statements. |
Valuation Inputs at Reporting Date: |
Description
(Amounts in thousands) | Total | Level 1 | Level 2 | Level 3 |
Investments in Securities: | | | | |
Equities: | | | | |
Consumer Discretionary | $ 2,774,696 | $ 2,773,292 | $ 1,404 | $ - |
Consumer Staples | 490,544 | 490,544 | - | - |
Energy | 3,068,656 | 3,068,656 | - | - |
Financials* | 2,425,460 | 2,396,366 | 9,289 | 19,805 |
Health Care | 3,056,857 | 3,056,857 | - | - |
Industrials | 2,187,943 | 2,187,943 | - | - |
Information Technology | 6,300,550 | 6,300,550 | - | - |
Materials | 1,740,290 | 1,740,290 | - | - |
Telecommunication Services | 515,614 | 515,614 | - | - |
Utilities | 67,052 | 67,052 | - | - |
Corporate Bonds | 29,125 | - | 29,125 | - |
Money Market Funds | 635,991 | 635,991 | - | - |
Total Investments in Securities: | $ 23,292,778 | $ 23,233,155 | $ 39,818 | $ 19,805 |
* The Fund has an unfunded commitment of $29,472 outstanding as of period end. |
The following is a reconciliation of Investments in Securities for which Level 3 inputs were used in determining value: |
(Amounts in thousands) | |
Investments in Securities: | |
Beginning Balance | $ - |
Total Realized Gain (Loss) | - |
Total Unrealized Gain (Loss) | (723) |
Cost of Purchases | 20,528 |
Proceeds of Sales | - |
Amortization/Accretion | - |
Transfers in to Level 3 | - |
Transfers out of Level 3 | - |
Ending Balance | $ 19,805 |
The change in unrealized gain (loss) for the period attributable to Level 3 securities held at March 31, 2011 | $ (723) |
The information used in the above reconciliation represents fiscal year to date activity for any Investments in Securities identified as using Level 3 inputs at either the beginning or the end of the current fiscal period. Transfers in or out of Level 3 represent the beginning value of any Security or Instrument where a change in the pricing level occurred from the beginning to the end of the period. The cost of purchases and the proceeds of sales may include securities received or delivered through corporate actions or exchanges. Realized and unrealized gains (losses) disclosed in the reconciliation are included in Net Gain (Loss) on the Fund's Statement of Operations. |
Distribution of investments by country of issue, as a percentage of total net assets, is as follows: (Unaudited) |
United States of America | 76.6% |
Japan | 4.3% |
Canada | 3.7% |
Netherlands | 2.0% |
United Kingdom | 1.6% |
Ireland | 1.6% |
Australia | 1.4% |
Netherlands Antilles | 1.4% |
Switzerland | 1.3% |
Bermuda | 1.2% |
Others (Individually Less Than 1%) | 4.9% |
| 100.0% |
Income Tax Information |
At March 31, 2011, the Fund had a capital loss carryforward of approximately $2,608,735,000 of which $1,147,795,000 and $1,460,940,000 will expire in fiscal 2017 and 2018, respectively. Capital loss carryforwards are only available to offset future capital gains of the Fund to the extent provided by regulations and may be limited. |
See accompanying notes which are an integral part of the financial statements.
Annual Report
Statement of Assets and Liabilities
Amounts in thousands (except per-share amounts) | March 31, 2011 |
| | |
Assets | | |
Investment in securities, at value (including securities loaned of $486,541) - See accompanying schedule: Unaffiliated issuers (cost $15,196,825) | $ 19,698,224 | |
Fidelity Central Funds (cost $635,991) | 635,991 | |
Other affiliated issuers (cost $2,641,531) | 2,958,563 | |
Total Investments (cost $18,474,347) | | $ 23,292,778 |
Cash | | 25 |
Receivable for investments sold | | 143,725 |
Receivable for fund shares sold | | 6,608 |
Dividends receivable | | 23,449 |
Interest receivable | | 73 |
Distributions receivable from Fidelity Central Funds | | 3,742 |
Prepaid expenses | | 33 |
Other receivables | | 1,911 |
Total assets | | 23,472,344 |
| | |
Liabilities | | |
Payable for investments purchased | $ 7,582 | |
Payable for fund shares redeemed | 67,937 | |
Accrued management fee | 6,404 | |
Other affiliated payables | 3,236 | |
Other payables and accrued expenses | 4,198 | |
Collateral on securities loaned, at value | 501,708 | |
Total liabilities | | 591,065 |
| | |
Net Assets | | $ 22,881,279 |
Net Assets consist of: | | |
Paid in capital | | $ 20,683,255 |
Undistributed net investment income | | 21,675 |
Accumulated undistributed net realized gain (loss) on investments and foreign currency transactions | | (2,639,740) |
Net unrealized appreciation (depreciation) on investments and assets and liabilities in foreign currencies | | 4,816,089 |
Net Assets | | $ 22,881,279 |
See accompanying notes which are an integral part of the financial statements.
Annual Report
Statement of Assets and Liabilities - continued
Amounts in thousands (except per-share amounts) | March 31, 2011 |
| | |
Magellan:
Net Asset Value, offering price and redemption price per share ($19,397,832 ÷ 256,736 shares) | | $ 75.56 |
| | |
Class K:
Net Asset Value, offering price and redemption price per share ($3,483,447 ÷ 46,133 shares) | | $ 75.51 |
See accompanying notes which are an integral part of the financial statements.
Annual Report
Financial Statements - continued
Statement of Operations
Amounts in thousands | Year ended March 31, 2011 |
| | |
Investment Income | | |
Dividends (including $38,319 earned from other affiliated issuers) | | $ 261,548 |
Special dividends | | 44,969 |
Interest | | 3,397 |
Income from Fidelity Central Funds | | 13,733 |
Total income | | 323,647 |
| | |
Expenses | | |
Management fee
Basic fee | $ 127,133 | |
Performance adjustment | (38,062) | |
Transfer agent fees | 39,150 | |
Accounting and security lending fees | 1,931 | |
Custodian fees and expenses | 1,265 | |
Independent trustees' compensation | 135 | |
Appreciation in deferred trustee compensation account | 6 | |
Registration fees | 113 | |
Audit | 242 | |
Legal | 102 | |
Interest | 7 | |
Miscellaneous | 298 | |
Total expenses before reductions | 132,320 | |
Expense reductions | (1,354) | 130,966 |
Net investment income (loss) | | 192,681 |
Realized and Unrealized Gain (Loss) Net realized gain (loss) on: | | |
Investment securities: | | |
Unaffiliated issuers | 74,860 | |
Other affiliated issuers | 90,137 | |
Foreign currency transactions | (1,108) | |
Total net realized gain (loss) | | 163,889 |
Change in net unrealized appreciation (depreciation) on: Investment securities | 2,240,124 | |
Assets and liabilities in foreign currencies | 62 | |
Total change in net unrealized appreciation (depreciation) | | 2,240,186 |
Net gain (loss) | | 2,404,075 |
Net increase (decrease) in net assets resulting from operations | | $ 2,596,756 |
See accompanying notes which are an integral part of the financial statements.
Annual Report
Statement of Changes in Net Assets
Amounts in thousands | Year ended
March 31,
2011 | Year ended
March 31,
2010 |
Increase (Decrease) in Net Assets | | |
Operations | | |
Net investment income (loss) | $ 192,681 | $ 118,442 |
Net realized gain (loss) | 163,889 | 1,072,338 |
Change in net unrealized appreciation (depreciation) | 2,240,186 | 8,226,579 |
Net increase (decrease) in net assets resulting
from operations | 2,596,756 | 9,417,359 |
Distributions to shareholders from net investment income | (183,103) | (144,477) |
Distributions to shareholders from net realized gain | (23,072) | (7,752) |
Total distributions | (206,175) | (152,229) |
Share transactions - net increase (decrease) | (4,632,398) | (2,782,524) |
Total increase (decrease) in net assets | (2,241,817) | 6,482,606 |
| | |
Net Assets | | |
Beginning of period | 25,123,096 | 18,640,490 |
End of period (including undistributed net investment income of $21,675 and undistributed net investment income of $5,945, respectively) | $ 22,881,279 | $ 25,123,096 |
See accompanying notes which are an integral part of the financial statements.
Annual Report
Financial Highlights - Magellan
Years ended March 31, | 2011 | 2010 | 2009 | 2008 | 2007 |
Selected Per-Share Data | | | | | |
Net asset value, beginning of period | $ 67.56 | $ 44.63 | $ 82.26 | $ 91.32 | $ 112.80 |
Income from Investment Operations | | | | | |
Net investment income (loss) B | .56 E | .29 | .32 | .34 | .37 |
Net realized and unrealized gain (loss) | 8.05 | 23.02 | (34.98) | 2.72 | 3.31 |
Total from investment operations | 8.61 | 23.31 | (34.66) | 3.06 | 3.68 |
Distributions from net investment income | (.54) | (.36) | (.11) | (.44) | (.50) |
Distributions from net realized gain | (.07) | (.02) | (2.86) | (11.68) | (24.66) |
Total distributions | (.61) | (.38) | (2.97) | (12.12) | (25.16) |
Net asset value, end of period | $ 75.56 | $ 67.56 | $ 44.63 | $ 82.26 | $ 91.32 |
Total Return A | 12.82% | 52.33% | (43.81)% | 2.08% | 3.21% |
Ratios to Average Net Assets C, F | | | | | |
Expenses before reductions | .60% | .75% | .71% | .73% | .54% |
Expenses net of fee waivers, if any | .60% | .75% | .71% | .73% | .54% |
Expenses net of all reductions | .59% | .74% | .71% | .72% | .53% |
Net investment income (loss) | .83% E | .49% | .51% | .37% | .41% |
Supplemental Data | | | | | |
Net assets, end of period (in millions) | $ 19,398 | $ 22,628 | $ 17,225 | $ 38,322 | $ 43,155 |
Portfolio turnover rate D | 42% | 39% | 67% | 57% | 41% |
A Total returns would have been lower had certain expenses not been reduced during the periods shown.
B Calculated based on average shares outstanding during the period.
C Fees and expenses of the underlying Fidelity Central Funds are not included in the Fund's expense ratio. The Fund indirectly bears its proportionate share of the expenses of any underlying Fidelity Central Funds.
D Amount does not include the portfolio activity of any underlying Fidelity Central Funds.
E Investment income per share reflects a special dividend which amounted to $.13 per share. Excluding the special dividend, the ratio of net investment income (loss) to average net assets would have been .63%.
F Expense ratios reflect operating expenses of the class. Expenses before reductions do not reflect amounts reimbursed by the investment adviser or reductions from brokerage service arrangements or reductions from other expense offset arrangements and do not represent the amount paid by the class during periods when reimbursements or reductions occur. Expenses net of fee waivers reflect expenses after reimbursement by the investment adviser but prior to reductions from brokerage service arrangements or other expense offset arrangements. Expenses net of all reductions represent the net expenses paid by the class.
See accompanying notes which are an integral part of the financial statements.
Annual Report
Financial Highlights - Class K
Years ended March 31, | 2011 | 2010 | 2009 H |
Selected Per-Share Data | | | |
Net asset value, beginning of period | $ 67.53 | $ 44.61 | $ 85.82 |
Income from Investment Operations | | | |
Net investment income (loss) D | .65 G | .38 | .30 |
Net realized and unrealized gain (loss) | 8.04 | 23.02 | (41.32) |
Total from investment operations | 8.69 | 23.40 | (41.02) |
Distributions from net investment income | (.64) | (.46) | (.19) |
Distributions from net realized gain | (.07) | (.02) | - |
Total distributions | (.71) | (.48) | (.19) |
Net asset value, end of period | $ 75.51 | $ 67.53 | $ 44.61 |
Total Return B, C | 12.97% | 52.59% | (47.79)% |
Ratios to Average Net Assets E, I | | | |
Expenses before reductions | .46% | .59% | .55% A |
Expenses net of fee waivers, if any | .46% | .59% | .55% A |
Expenses net of all reductions | .46% | .58% | .55% A |
Net investment income (loss) | .97% G | .65% | .79% A |
Supplemental Data | | | |
Net assets, end of period (in millions) | $ 3,483 | $ 2,495 | $ 1,415 |
Portfolio turnover rate F | 42% | 39% | 67% |
A Annualized
B Total returns for periods of less than one year are not annualized.
C Total returns would have been lower had certain expenses not been reduced during the periods shown.
D Calculated based on average shares outstanding during the period.
E Fees and expenses of the underlying Fidelity Central Funds are not included in the Fund's expense ratio. The Fund indirectly bears its proportionate share of the expenses of any underlying Fidelity Central Funds.
F Amount does not include the portfolio activity of any underlying Fidelity Central Funds.
G Investment income per share reflects a special dividend which amounted to $.13 per share. Excluding the special dividend, the ratio of net investment income (loss) to average net assets would have been .77%.
H For the period May 9, 2008 (commencement of sale of shares) to March 31, 2009.
I Expense ratios reflect operating expenses of the class. Expenses before reductions do not reflect amounts reimbursed by the investment adviser or reductions from brokerage service arrangements or reductions from other expense offset arrangements and do not represent the amount paid by the class during periods when reimbursements or reductions occur. Expense ratios before reductions for start-up periods may not be representative of longer-term operating periods. Expenses net of fee waivers reflect expenses after reimbursement by the investment adviser but prior to reductions from brokerage service arrangements or other expense offset arrangements. Expenses net of all reductions represent the net expenses paid by the class.
See accompanying notes which are an integral part of the financial statements.
Annual Report
Notes to Financial Statements
For the period ended March 31, 2011
(Amounts in thousands except ratios)
1. Organization.
Fidelity Magellan Fund (the Fund) is a fund of Fidelity Magellan Fund (the Trust) and is authorized to issue an unlimited number of shares. The Trust is registered under the Investment Company Act of 1940, as amended (the 1940 Act), as an open-end management investment company organized as a Massachusetts business trust. The Fund offers Magellan and Class K shares, each of which has equal rights as to assets and voting privileges. Each class has exclusive voting rights with respect to matters that affect that class. Investment income, realized and unrealized capital gains and losses, the common expenses of the Fund, and certain fund-level expense reductions, if any, are allocated on a pro-rata basis to each class based on the relative net assets of each class to the total net assets of the Fund. Each class differs with respect to transfer agent fees incurred. Certain expense reductions may also differ by class.
2. Investments in Fidelity Central Funds.
The Fund invests in Fidelity Central Funds, which are open-end investment companies available only to other investment companies and accounts managed by Fidelity Management & Research Company (FMR) and its affiliates. The Fund's Schedule of Investments lists each of the Fidelity Central Funds held as of period end, if any, as an investment of the Fund, but does not include the underlying holdings of each Fidelity Central Fund. As an Investing Fund, the Fund indirectly bears its proportionate share of the expenses of the underlying Fidelity Central Funds.
The Money Market Central Funds seek preservation of capital and current income and are managed by Fidelity Investments Money Management, Inc. (FIMM), an affiliate of FMR.
A complete unaudited list of holdings for each Fidelity Central Fund is available upon request or at the Securities and Exchange Commission (the SEC) web site at www.sec.gov. In addition, the financial statements of the Fidelity Central Funds, which are not covered by the Fund's Report of Independent Registered Public Accounting Firm, are available on the SEC web site or upon request.
3. Significant Accounting Policies.
The financial statements have been prepared in conformity with accounting principles generally accepted in the United States of America (GAAP), which require management to make certain estimates and assumptions at the date of the financial statements. Actual results could differ from those estimates. Subsequent events, if any, through the date that the financial statements were issued have been evaluated in the preparation of the financial statements. The following summarizes the significant accounting policies of the Fund:
Annual Report
Notes to Financial Statements - continued
(Amounts in thousands except ratios)
3. Significant Accounting Policies - continued
Security Valuation. Investments are valued as of 4:00 p.m. Eastern time on the last calendar day of the period. The Fund uses independent pricing services approved by the Board of Trustees to value its investments. When current market prices or quotations are not readily available or reliable, valuations may be determined in good faith in accordance with procedures adopted by the Board of Trustees. Factors used in determining value may include market or security specific events, changes in interest rates and credit quality. The frequency with which these procedures are used cannot be predicted and they may be utilized to a significant extent. The value used for net asset value (NAV) calculation under these procedures may differ from published prices for the same securities.
The Fund categorizes the inputs to valuation techniques used to value its investments into a disclosure hierarchy consisting of three levels as shown below.
Level 1 - quoted prices in active markets for identical investments
Level 2 - other significant observable inputs (including quoted prices for similar investments, interest rates, prepayment speeds, etc.)
Level 3 - unobservable inputs (including the Fund's own assumptions based on the best information available)
Changes in valuation techniques may result in transfers in or out of an assigned level within the disclosure hierarchy. The aggregate value of investments by input level, as of March 31, 2011, as well as a roll forward of Level 3 securities, is included at the end of the Fund's Schedule of Investments. Valuation techniques used to value the Fund's investments by major category are as follows.
Equity securities, including restricted securities, for which market quotations are readily available, are valued at the last reported sale price or official closing price as reported by an independent pricing service on the primary market or exchange on which they are traded and are categorized as Level 1 in the hierarchy. In the event there were no sales during the day or closing prices are not available, securities are valued at the last quoted bid price or may be valued using the last available price and are generally categorized as Level 2 in the hierarchy. For foreign equity securities, when significant market or security specific events arise, comparisons to the valuation of American Depositary Receipts (ADRs), futures contracts, Exchange-traded funds (ETFs) and certain indexes as well as quoted prices for similar securities are used and are categorized as Level 2 in the hierarchy in these circumstances. Utilizing these techniques may result in transfers between Level 1 and Level 2. For restricted equity securities and private placements where observable inputs are limited, assumptions about market activity and risk are used and are categorized as Level 3 in the hierarchy.
Annual Report
3. Significant Accounting Policies - continued
Security Valuation - continued
Debt securities, including restricted securities, are valued based on evaluated prices received from independent pricing services or from dealers who make markets in such securities. For corporate bonds, pricing services utilize matrix pricing which considers yield or price of bonds of comparable quality, coupon, maturity and type as well as dealer supplied prices and are generally categorized as Level 2 in the hierarchy.
When independent prices are unavailable or unreliable, debt securities may be valued utilizing pricing matrices which consider similar factors that would be used by independent pricing services. These are generally categorized as Level 2 in the hierarchy but may be Level 3 depending on the circumstances.
Investments in open-end mutual funds, including the Fidelity Central Funds, are valued at their closing net asset value each business day and are categorized as Level 1 in the hierarchy.
Foreign Currency. The Fund may use foreign currency contracts to facilitate transactions in foreign-denominated securities. Gains and losses from these transactions may arise from changes in the value of the foreign currency or if the counterparties do not perform under the contracts' terms.
Foreign-denominated assets, including investment securities, and liabilities are translated into U.S. dollars at the exchange rate at period end. Purchases and sales of investment securities, income and dividends received and expenses denominated in foreign currencies are translated into U.S. dollars at the exchange rate in effect on the transaction date.
The effects of exchange rate fluctuations on investments are included with the net realized and unrealized gain (loss) on investment securities. Other foreign currency transactions resulting in realized and unrealized gain (loss) are disclosed separately.
Investment Transactions and Income. For financial reporting purposes, the Fund's investment holdings and NAV include trades executed through the end of the last business day of the period. The NAV per share for processing shareholder transactions is calculated as of the close of business of the New York Stock Exchange (NYSE), normally 4:00 p.m. Eastern time and includes trades executed through the end of the prior business day. Gains and losses on securities sold are determined on the basis of identified cost and may include proceeds received from litigation. Dividend income is recorded on the ex-dividend date, except for certain dividends from foreign securities where the ex-dividend date may have passed, which are recorded as soon as the Fund is informed of the ex-dividend date. Non-cash dividends included in dividend income, if any, are recorded at the fair market value of the securities received. Distributions received on
Annual Report
Notes to Financial Statements - continued
(Amounts in thousands except ratios)
3. Significant Accounting Policies - continued
Investment Transactions and Income - continued
securities that represent a return of capital or capital gain are recorded as a reduction of cost of investments and/or as a realized gain. The Fund estimates the components of distributions received that may be considered return of capital distributions or capital gain distributions. Large, non-recurring dividends recognized by the Fund are presented separately on the Statement of Operations as "Special Dividends" and the impact of these dividends is presented in the Financial Highlights. Interest income and distributions from the Fidelity Central Funds are accrued as earned. Interest income includes coupon interest and amortization of premium and accretion of discount on debt securities. Investment income is recorded net of foreign taxes withheld where recovery of such taxes is uncertain.
Expenses. Expenses directly attributable to a fund are charged to that fund. Expenses attributable to more than one fund are allocated among the respective funds on the basis of relative net assets or other appropriate methods. Expense estimates are accrued in the period to which they relate and adjustments are made when actual amounts are known.
Deferred Trustee Compensation. Under a Deferred Compensation Plan (the Plan), independent Trustees may elect to defer receipt of a portion of their annual compensation. Deferred amounts are invested in a cross-section of Fidelity funds, are marked-to-market and remain in the Fund until distributed in accordance with the Plan. The investment of deferred amounts and the offsetting payable to the Trustees are included in the accompanying Statement of Assets and Liabilities.
Income Tax Information and Distributions to Shareholders. Each year the Fund intends to qualify as a regulated investment company, including distributing substantially all of its taxable income and realized gains under Subchapter M of the Internal Revenue Code and filing its U.S. federal tax return. As a result, no provision for income taxes is required. As of March 31, 2011, the Fund did not have any unrecognized tax benefits in the accompanying financial statements. A fund's federal tax return is subject to examination by the Internal Revenue Service (IRS) for a period of three years. Foreign taxes are provided for based on the Fund's understanding of the tax rules and rates that exist in the foreign markets in which it invests.
Distributions are declared and recorded on the ex-dividend date. Income dividends and capital gain distributions are declared separately for each class. Income and capital gain distributions are determined in accordance with income tax regulations, which may differ from GAAP.
Capital accounts within the financial statements are adjusted for permanent book-tax differences. These adjustments have no impact on net assets or the results of operations. Temporary book-tax differences will reverse in a subsequent period.
Annual Report
3. Significant Accounting Policies - continued
Income Tax Information and Distributions to Shareholders - continued
Book-tax differences are primarily due to foreign currency transactions, equity-debt classifications, passive foreign investment companies (PFIC), partnerships, deferred trustees compensation, capital loss carryforwards and losses deferred due to wash sales and excise tax regulations.
The federal tax cost of investment securities and unrealized appreciation (depreciation) as of period end were as follows:
Gross unrealized appreciation | $ 5,711,766 |
Gross unrealized depreciation | (930,295) |
Net unrealized appreciation (depreciation) on securities and other investments | $ 4,781,471 |
| |
Tax Cost | $ 18,511,307 |
The tax-based components of distributable earnings as of period end were as follows:
Undistributed ordinary income | $ 32,020 |
Capital loss carryforward | $ (2,608,735) |
Net unrealized appreciation (depreciation) | $ 4,781,573 |
The tax character of distributions paid was as follows:
| March 31, 2011 | March 31, 2010 |
Ordinary Income | $ 206,175 | $ 152,229 |
4. Operating Policies.
Restricted Securities. The Fund may invest in securities that are subject to legal or contractual restrictions on resale. These securities generally may be resold in transactions exempt from registration or to the public if the securities are registered. Disposal of these securities may involve time-consuming negotiations and expense, and prompt sale at an acceptable price may be difficult. Information regarding restricted securities is included at the end of the Fund's Schedule of Investments.
5. Purchases and Sales of Investments.
Purchases and sales of securities, other than short-term securities, aggregated $9,532,175 and $14,237,879, respectively.
Annual Report
Notes to Financial Statements - continued
(Amounts in thousands except ratios)
6. Fees and Other Transactions with Affiliates.
Management Fee. FMR and its affiliates provide the Fund with investment management related services for which the Fund pays a monthly management fee. The management fee is the sum of an individual fund fee rate that is based on an annual rate of .30% of the Fund's average net assets and a group fee rate that averaged .26% during the period. The group fee rate is based upon the average net assets of all the mutual funds advised by FMR. The group fee rate decreases as assets under management increase and increases as assets under management decrease. In addition, the management fee is subject to a performance adjustment (up to a maximum of ± .20% of the Fund's average net assets over a 36 month performance period). The upward or downward adjustment to the management fee is based on the relative investment performance of the retail class of the Fund, Magellan, as compared to an appropriate benchmark index. For the period, the total annual management fee rate, including the performance adjustment, was .39% of the Fund's average net assets.
Transfer Agent Fees. Fidelity Investments Institutional Operations Company, Inc. (FIIOC), an affiliate of FMR, is the transfer, dividend disbursing and shareholder servicing agent for each class of the Fund. FIIOC receives account fees and asset-based fees that vary according to the account size and type of account of the shareholders of Magellan. FIIOC receives an asset-based fee of Class K's average net assets. FIIOC pays for typesetting, printing and mailing of shareholder reports, except proxy statements. For the period, transfer agent fees for each class were as follows:
| Amount | % of
Average
Net Assets |
Magellan | $ 37,641 | .19 |
Class K | 1,509 | .05 |
| $ 39,150 | |
Accounting and Security Lending Fees. Fidelity Service Company, Inc. (FSC), an affiliate of FMR, maintains the Fund's accounting records. The accounting fee is based on the level of average net assets for the month. Under a separate contract, FSC administers the security lending program. The security lending fee is based on the number and duration of lending transactions.
Brokerage Commissions. The Fund placed a portion of its portfolio transactions with brokerage firms which are affiliates of the investment adviser. The commissions paid to these affiliated firms were $459 for the period.
Annual Report
6. Fees and Other Transactions with Affiliates - continued
Interfund Lending Program. Pursuant to an Exemptive Order issued by the SEC, the Fund, along with other registered investment companies having management contracts with FMR, may participate in an interfund lending program. This program provides an alternative credit facility allowing the funds to borrow from, or lend money to, other participating affiliated funds. At period end, there were no interfund loans outstanding.
The Fund's activity in this program during the period for which loans were outstanding was as follows:
Borrower or Lender | Average Daily
Loan Balance | Weighted Average
Interest Rate | Interest Expense |
Borrower | $ 19,176 | .44% | $ 7 |
7. Committed Line of Credit.
The Fund participates with other funds managed by FMR or an affiliate in a $4.0 billion credit facility (the "line of credit") to be utilized for temporary or emergency purposes to fund shareholder redemptions or for other short-term liquidity purposes. The Fund has agreed to pay commitment fees on its pro-rata portion of the line of credit, which amounted to $84 and is reflected in Miscellaneous expenses on the Statement of Operations. During the period, there were no borrowings on this line of credit.
8. Security Lending.
The Fund lends portfolio securities through a lending agent from time to time in order to earn additional income. The lending agent may loan securities to certain qualified borrowers, including Fidelity Capital Markets (FCM), a broker-dealer affiliated with the Fund. On the settlement date of the loan, the Fund receives collateral (in the form of U.S. Treasury obligations, letters of credit and/or cash) against the loaned securities and maintains collateral in an amount not less than 100% of the market value of the loaned securities during the period of the loan. The market value of the loaned securities is determined at the close of business of the Fund and any additional required collateral is delivered to the Fund on the next business day. If the borrower defaults on its obligation to return the securities loaned because of insolvency or other reasons, a fund could experience delays and costs in recovering the securities loaned or in gaining access to the collateral. Any cash collateral received is invested in the Fidelity Securities Lending Cash Central Fund. The value of loaned securities and cash collateral at period end are disclosed on the Fund's Statement of Assets and Liabilities. The value of securities
Annual Report
Notes to Financial Statements - continued
(Amounts in thousands except ratios)
8. Security Lending - continued
loaned to FCM at period end was $1,529. Security lending income represents the income earned on investing cash collateral, less rebates paid to borrowers and lending agent fees associated with the loan, plus any premium payments received for lending certain types of securities. Security lending income is presented in the Statement of Operations as a component of income from Fidelity Central Funds. Total security lending income during the period amounted to $13,506 (including $65 from securities loaned to FCM).
9. Expense Reductions.
Many of the brokers with whom FMR places trades on behalf of the Fund provided services to the Fund in addition to trade execution. These services included payments of certain expenses on behalf of the Fund totaling $1,354 for the period.
10. Distributions to Shareholders.
Distributions to shareholders of each class were as follows:
Years ended March 31, | 2011 | 2010 |
From net investment income | | |
Magellan | $ 155,880 | $ 129,094 |
Class K | 27,223 | 15,383 |
Total | $ 183,103 | $ 144,477 |
From net realized gain | | |
Magellan | $ 20,450 | $ 7,077 |
Class K | 2,622 | 675 |
Total | $ 23,072 | $ 7,752 |
11. Share Transactions.
Transactions for each class of shares were as follows:
| Shares | Dollars |
Years ended March 31, | 2011 | 2010 A | 2011 | 2010 A |
Magellan | | | | |
Shares sold | 13,052 | 26,864 | $ 874,215 | $ 1,552,256 |
Conversion to Class K | - | (1,822) | - | (100,116) |
Reinvestment of distributions | 2,460 | 2,192 | 169,801 | 131,844 |
Shares redeemed | (93,705) | (78,300) | (6,286,234) | (4,681,107) |
Net increase (decrease) | (78,193) | (51,066) | $ (5,242,218) | $ (3,097,123) |
Annual Report
11. Share Transactions - continued
| Shares | Dollars |
Years ended March 31, | 2011 | 2010 A | 2011 | 2010 A |
Class K | | | | |
Shares sold | 21,632 | 10,666 | $ 1,466,317 | $ 656,513 |
Conversion from Magellan | - | 1,823 | - | 100,116 |
Reinvestment of distributions | 432 | 266 | 29,845 | 16,058 |
Shares redeemed | (12,884) | (7,530) | (886,342) | (458,088) |
Net increase (decrease) | 9,180 | 5,225 | $ 609,820 | $ 314,599 |
A Conversion transactions for Class K and Magellan are presented for the period April 1, 2009 through August 31, 2009.
12. Other.
The Fund's organizational documents provide former and current trustees and officers with a limited indemnification against liabilities arising in connection with the performance of their duties to the Fund. In the normal course of business, the Fund may also enter into contracts that provide general indemnifications. The Fund's maximum exposure under these arrangements is unknown as this would be dependent on future claims that may be made against the Fund. The risk of material loss from such claims is considered remote.
Annual Report
To the Trustees and Shareholders of Fidelity Magellan Fund:
In our opinion, the accompanying statement of assets and liabilities, including the schedule of investments, and the related statements of operations and of changes in net assets and the financial highlights present fairly, in all material respects, the financial position of Fidelity Magellan Fund at March 31, 2011 the results of its operations for the year then ended, the changes in its net assets for each of the two years in the period then ended and the financial highlights for each of the periods indicated, in conformity with accounting principles generally accepted in the United States of America. These financial statements and financial highlights (hereafter referred to as "financial statements") are the responsibility of the Fidelity Magellan Fund's management. Our responsibility is to express an opinion on these financial statements based on our audits. We conducted our audits of these financial statements in accordance with the standards of the Public Company Accounting Oversight Board (United States). Those standards require that we plan and perform the audit to obtain reasonable assurance about whether the financial statements are free of material misstatement. An audit includes examining, on a test basis, evidence supporting the amounts and disclosures in the financial statements, assessing the accounting principles used and significant estimates made by management, and evaluating the overall financial statement presentation. We believe that our audits, which included confirmation of securities at March 31, 2011 by correspondence with the custodian and brokers, provide a reasonable basis for our opinion.
/s/ PricewaterhouseCoopers LLP
PricewaterhouseCoopers LLP
Boston, Massachusetts
May 12, 2011
Annual Report
The Trustees, Members of the Advisory Board, and executive officers of the trust and fund, as applicable, are listed below. The Board of Trustees governs the fund and is responsible for protecting the interests of shareholders. The Trustees are experienced executives who meet periodically throughout the year to oversee the fund's activities, review contractual arrangements with companies that provide services to the fund, oversee management of the risks associated with such activities and contractual arrangements, and review the fund's performance. Except for James C. Curvey, each of the Trustees oversees 219 funds advised by FMR or an affiliate. Mr. Curvey oversees 410 funds advised by FMR or an affiliate.
The Trustees hold office without limit in time except that (a) any Trustee may resign; (b) any Trustee may be removed by written instrument, signed by at least two-thirds of the number of Trustees prior to such removal; (c) any Trustee who requests to be retired or who has become incapacitated by illness or injury may be retired by written instrument signed by a majority of the other Trustees; and (d) any Trustee may be removed at any special meeting of shareholders by a two-thirds vote of the outstanding voting securities of the trust. Each Trustee who is not an interested person (as defined in the 1940 Act) (Independent Trustee), shall retire not later than the last day of the calendar year in which his or her 75th birthday occurs. The Independent Trustees may waive this mandatory retirement age policy with respect to individual Trustees. The executive officers and Advisory Board Members hold office without limit in time, except that any officer and Advisory Board Member may resign or may be removed by a vote of a majority of the Trustees at any regular meeting or any special meeting of the Trustees. Except as indicated, each individual has held the office shown or other offices in the same company for the past five years.
Experience, Skills, Attributes, and Qualifications of the Fund's Trustees. The Governance and Nominating Committee has adopted a statement of policy that describes the experience, qualifications, attributes, and skills that are necessary and desirable for potential Independent Trustee candidates (Statement of Policy). The Board believes that each Trustee satisfied at the time he or she was initially elected or appointed a Trustee, and continues to satisfy, the standards contemplated by the Statement of Policy. The Governance and Nominating Committee also engages professional search firms to help identify potential Independent Trustee candidates who have the experience, qualifications, attributes, and skills consistent with the Statement of Policy. From time to time, additional criteria based on the composition and skills of the current Independent Trustees, as well as experience or skills that may be appropriate in light of future changes to board composition, business conditions, and regulatory or other developments, have also been considered by the professional search firms and the Governance and Nominating Committee. In addition, the Board takes into account the Trustees' commitment and participation in Board and committee meetings, as well as their leadership of standing and ad hoc committees throughout their tenure.
In determining that a particular Trustee was and continues to be qualified to serve as a Trustee, the Board has considered a variety of criteria, none of which, in isolation, was controlling. The Board believes that, collectively, the Trustees have balanced and diverse experience, qualifications, attributes, and skills, which allow the Board to operate effectively in governing the fund and protecting the interests of shareholders. Information about the specific experience, skills, attributes, and qualifications of each Trustee, which in each case led to the Board's conclusion that the Trustee should serve (or continue to serve) as a trustee of the fund, is provided below.
Annual Report
Trustees and Officers - continued
Board Structure and Oversight Function. James C. Curvey is an interested person (as defined in the 1940 Act) and currently serves as Acting Chairman. The Trustees have determined that an interested Chairman is appropriate and benefits shareholders because an interested Chairman has a personal and professional stake in the quality and continuity of services provided to the fund. Independent Trustees exercise their informed business judgment to appoint an individual of their choosing to serve as Chairman, regardless of whether the Trustee happens to be independent or a member of management. The Independent Trustees have determined that they can act independently and effectively without having an Independent Trustee serve as Chairman and that a key structural component for assuring that they are in a position to do so is for the Independent Trustees to constitute a substantial majority for the Board. The Independent Trustees also regularly meet in executive session. Ned C. Lautenbach serves as Chairman of the Independent Trustees and as such (i) acts as a liaison between the Independent Trustees and management with respect to matters important to the Independent Trustees and (ii) with management prepares agendas for Board meetings.
Fidelity funds are overseen by different Boards of Trustees. The fund's Board oversees Fidelity's equity and high income funds and another Board oversees Fidelity's investment-grade bond, money market, and asset allocation funds. The asset allocation funds may invest in Fidelity funds overseen by the fund's Board. The use of separate Boards, each with its own committee structure, allows the Trustees of each group of Fidelity funds to focus on the unique issues of the funds they oversee, including common research, investment, and operational issues. On occasion, the separate Boards establish joint committees to address issues of overlapping consequences for the Fidelity funds overseen by each Board.
The Trustees operate using a system of committees to facilitate the timely and efficient consideration of all matters of importance to the Trustees, the fund, and fund shareholders and to facilitate compliance with legal and regulatory requirements and oversight of the fund's activities and associated risks. The Board, acting through its committees, has charged FMR and its affiliates with (i) identifying events or circumstances the occurrence of which could have demonstrably adverse effects on the fund's business and/or reputation; (ii) implementing processes and controls to lessen the possibility that such events or circumstances occur or to mitigate the effects of such events or circumstances if they do occur; and (iii) creating and maintaining a system designed to evaluate continuously business and market conditions in order to facilitate the identification and implementation processes described in (i) and (ii) above. Because the day-to-day operations and activities of the fund are carried out by or through FMR, its affiliates and other service providers, the fund's exposure to risks is mitigated but not eliminated by the processes overseen by the Trustees. While each of the Board's committees has responsibility for overseeing different aspects of the fund's activities, oversight is exercised primarily through the Operations, Audit, and Compliance Committees. Appropriate personnel, including but not limited to the fund's Chief Compliance Officer (CCO), FMR's internal auditor, the independent accountants, the fund's Treasurer and portfolio management personnel, make periodic reports to the Board's committees, as appropriate. The responsibilities of each committee, including their oversight responsibilities, are described further under "Standing Committees of the Fund's Trustees."
Annual Report
The fund's Statement of Additional Information (SAI) includes more information about the Trustees. To request a free copy, call Fidelity at 1-800-544-3455.
Interested Trustees*:
Correspondence intended for each Trustee who is an interested person may be sent to Fidelity Investments, 82 Devonshire Street, Boston, Massachusetts 02109.
Name, Age; Principal Occupations and Other Relevant Experience+ |
James C. Curvey (75) |
| Year of Election or Appointment: 2007
Mr. Curvey is Trustee and Acting Chairman of the Board of Trustees of certain Trusts. Mr. Curvey also serves as Trustee (2007-present) of other investment companies advised by FMR. Mr. Curvey is a Director of Fidelity Investments Money Management, Inc. (2009-present), Director of Fidelity Research & Analysis Co. (2009-present) and Director of FMR and FMR Co., Inc. (2007-present). Mr. Curvey is also Vice Chairman (2007-present) and Director of FMR LLC. In addition, Mr. Curvey serves as an Overseer for the Boston Symphony Orchestra and a member of the Trustees of Villanova University. Previously, Mr. Curvey was the Vice Chairman (2006-2007) and Director (2000-2007) of FMR Corp. |
Ronald P. O'Hanley (54) |
| Year of Election or Appointment: 2011
Mr. O'Hanley is President of Fidelity Asset Management and Corporate Services and a member of Fidelity's Executive Committee (2010-present). Previously, Mr. O'Hanley served as President and Chief Executive Officer of BNY Mellon Asset Management (2007-2010). Mr. O'Hanley also served as Vice Chairman of Bank New York Mellon Corp. and a member of that firm's Executive Committee. Prior to the 2007 merger of The Bank of New York and Mellon Financial Corporation, he was Vice Chairman of Mellon Financial Corporation and President and Chief Executive Officer of Mellon Asset Management. He joined Mellon in February 1997. Mr. O'Hanley currently serves as Chairman of the Boston Public Library Foundation Board of Directors and sits on the Board of Directors of Beth Israel Deaconess Medical Center, the Board of Trustees of the Marine Biological Laboratory and the Advisory Board of the Maxwell School of Citizenship and Public Administration at Syracuse University. Mr. O'Hanley also chairs the Council on Asset Management for the Financial Services Roundtable and is a member of the Board of Directors of Institutional Investor's U.S. Institute. |
* Trustees have been determined to be "Interested Trustees" by virtue of, among other things, their affiliation with the trust or various entities under common control with FMR.
+ The information above includes each Trustee's principal occupation during the last five years and other information relating to the experience, attributes, and skills relevant to each Trustee's qualifications to serve as a Trustee, which led to the conclusion that each Trustee should serve as a Trustee for the fund.
Annual Report
Independent Trustees:
Correspondence intended for each Independent Trustee (that is, the Trustees other than the Interested Trustees) may be sent to Fidelity Investments, P.O. Box 55235, Boston, Massachusetts 02205-5235.
Name, Age; Principal Occupations and Other Relevant Experience+ |
Dennis J. Dirks (62) |
| Year of Election or Appointment: 2005 Prior to his retirement in May 2003, Mr. Dirks was Chief Operating Officer and a member of the Board of The Depository Trust & Clearing Corporation (DTCC). He also served as President, Chief Operating Officer, and Board member of The Depository Trust Company (DTC) and President and Board member of the National Securities Clearing Corporation (NSCC). In addition, Mr. Dirks served as Chief Executive Officer and Board member of the Government Securities Clearing Corporation, Chief Executive Officer and Board member of the Mortgage-Backed Securities Clearing Corporation, as a Trustee and a member of the Finance Committee of Manhattan College (2005-2008), and as a Trustee and a member of the Finance Committee of AHRC of Nassau County (2006-2008). Mr. Dirks is a member of the Independent Directors Council (IDC) Governing Council (2010-Present) and Board of Directors for The Brookville Center for Children's Services, Inc. (2009-present). |
Alan J. Lacy (57) |
| Year of Election or Appointment: 2008 Mr. Lacy serves as Senior Adviser (2007-present) of Oak Hill Capital Partners, L.P. (private equity). Mr. Lacy also served as Chief Executive Officer (2000-2005) and Vice Chairman (2005-2006) of Sears Holdings Corporation and Sears, Roebuck and Co. (retail). In addition, Mr. Lacy serves as a member of the Board of Directors of Dave & Buster's, Inc. (restaurant and entertainment complexes, 2010-present), The Hillman Companies, Inc. (hardware wholesalers, 2010-present), and Bristol-Myers Squibb Company (global pharmaceuticals, 2007-present). Mr. Lacy is a member of the Board of Trustees of The National Parks Conservation Association (2006-present). Previously Mr. Lacy served as Chairman of the Board of Trustees of the National Parks Conservation Association (2008-2011) and as a member of the Board of Directors for the Western Union Company (global money transfer, 2006-2011). |
Ned C. Lautenbach (67) |
| Year of Election or Appointment: 2000 Mr. Lautenbach is Chairman of the Independent Trustees of the Equity and High Income Funds (2006-present). Mr. Lautenbach currently serves as the Lead Director of the Eaton Corporation Board of Directors (diversified industrial, 1997-present). Mr. Lautenbach is also a member of the Board of Directors of the Philharmonic Center for the Arts in Naples, Florida (1999-present); a member of the Board of Trustees of Fairfield University (2005-present); and a member of the Council on Foreign Relations (1994-present). Previously, Mr. Lautenbach was a Partner/Advisory Partner at Clayton, Dubilier & Rice, LLC (private equity investment, 1998-2010), as well as a Director of Sony Corporation (2006-2007). |
Joseph Mauriello (66) |
| Year of Election or Appointment: 2008 Prior to his retirement in January 2006, Mr. Mauriello served in numerous senior management positions including Deputy Chairman and Chief Operating Officer (2004-2005), and Vice Chairman of Financial Services (2002-2004) of KPMG LLP US (professional services, 1965-2005). Mr. Mauriello currently serves as a member of the Board of Directors of XL Group plc. (global insurance and re-insurance, 2006-present) and of Arcadia Resources Inc. (health care services and products, 2007-present). Previously, Mr. Mauriello served as a Director of the Hamilton Funds of the Bank of New York (2006-2007). |
Cornelia M. Small (66) |
| Year of Election or Appointment: 2005 Ms. Small is a member of the Board of Directors of the Teagle Foundation (2009-present). Ms. Small is also a member of the Investment Committee, and Chair (2008-present) and a member of the Board of Trustees of Smith College. In addition, Ms. Small serves on the Investment Committee of the Berkshire Taconic Community Foundation (2008-present). Previously, Ms. Small served as Chairperson of the Investment Committee (2002-2008) of Smith College. In addition, Ms. Small served as Chief Investment Officer, Director of Global Equity Investments, and a member of the Board of Directors of Scudder, Stevens & Clark and Scudder Kemper Investments. |
William S. Stavropoulos (71) |
| Year of Election or Appointment: 2001 Mr. Stavropoulos is Vice Chairman of the Independent Trustees of the Equity and High Income Funds (2006-present). Mr. Stavropoulos serves as President and Founder of the Michigan Baseball Foundation, the Great Lakes Loons (2007-present). Mr. Stavropoulos is Chairman Emeritus of the Board of Directors of The Dow Chemical Company, where he previously served in numerous senior management positions, including President, CEO (1995-2000; 2002-2004), Chairman of the Executive Committee (2000-2006), and as a member of the Board of Directors (1990-2006). Currently, Mr. Stavropoulos is Chairman of Univar (global distributor of commodity and specialty chemicals, 2010-present), a Director of Teradata Corporation (data warehousing and technology solutions, 2008-present), Chemical Financial Corporation, Maersk Inc. (industrial conglomerate), Tyco International, Inc. (multinational manufacturing and services, 2007-present), and a member of the Advisory Board for Metalmark Capital (private equity investment, 2005-present). Mr. Stavropoulos is a special advisor to Clayton, Dubilier & Rice, LLC (private equity investment). In addition, Mr. Stavropoulos is a member of the University of Notre Dame Advisory Council for the College of Science. |
David M. Thomas (61) |
| Year of Election or Appointment: 2008 Previously, Mr. Thomas served as Executive Chairman (2005-2006) and Chairman and Chief Executive Officer (2000-2005) of IMS Health, Inc. (pharmaceutical and healthcare information solutions). In addition, Mr. Thomas serves as a member of the Board of Directors of Fortune Brands, Inc. (consumer products), and Interpublic Group of Companies, Inc. (marketing communication, 2004-present). |
Michael E. Wiley (60) |
| Year of Election or Appointment: 2008 Mr. Wiley also serves as a Director of Asia Pacific Exploration Consolidated (international oil and gas exploration and production, 2008-present). Mr. Wiley serves as a Director of Tesoro Corporation (independent oil refiner and marketer, 2005-present), and a Director of Bill Barrett Corporation (exploration and production, 2005-present). In addition, Mr. Wiley also serves as a Director of Post Oak Bank (privately-held bank, 2004-present). Previously, Mr. Wiley served as a member of the Board of Trustees of the University of Tulsa (2000-2006; 2007-2010), as a Senior Energy Advisor of Katzenbach Partners, LLC (consulting, 2006-2007), as an Advisory Director of Riverstone Holdings (private investment), Chairman, President, and CEO of Baker Hughes, Inc. (oilfield services, 2000-2004), and as Director of Spinnaker Exploration Company (exploration and production, 2001-2005). |
Annual Report
Trustees and Officers - continued
+ The information above includes each Trustee's principal occupation during the last five years and other information relating to the experience, attributes, and skills relevant to each Trustee's qualifications to serve as a Trustee, which led to the conclusion that each Trustee should serve as a Trustee for the fund.
Advisory Board Members and Executive Officers:
Correspondence intended for each executive officer, Edward C. Johnson 3d, and Peter S. Lynch may be sent to Fidelity Investments, 82 Devonshire Street, Boston, Massachusetts 02109.
Name, Age; Principal Occupation |
Edward C. Johnson 3d (80) |
| Year of Election or Appointment: 2011 Member of the Advisory Board of Fidelity's Equity and High Income Funds. Formerly Trustee and Chairman of the Board of Trustees of certain Trusts, Mr. Johnson serves as Chief Executive Officer, Chairman, and a Director of FMR LLC; Chairman and a Director of FMR; and Chairman and a Director of FMR Co., Inc. In addition, Mr. Johnson serves as Chairman and Director of FIL Limited. Previously, Mr. Johnson served as President of FMR LLC (2006-2007). |
Peter S. Lynch (67) |
| Year of Election or Appointment: 2003 Member of the Advisory Board of Fidelity's Equity and High Income Funds. Mr. Lynch is Vice Chairman and a Director of FMR and FMR Co., Inc. In addition, Mr. Lynch serves as a Trustee of Boston College and as the Chairman of the Inner-City Scholarship Fund. Previously, Mr. Lynch served on the Special Olympics International Board of Directors (1997-2006). |
Robert W. Selander (60) |
| Year of Election or Appointment: 2011 Member of the Advisory Board of Fidelity's Equity and High Income Funds. Previously, Mr. Selander served as Executive Vice Chairman (2010), Chief Executive Officer (2009-2010), and President and Chief Executive Officer (1997-2009) of Mastercard, Inc. |
Kenneth B. Robins (41) |
| Year of Election or Appointment: 2008 President and Treasurer of Fidelity's Equity and High Income Funds. Mr. Robins also serves as President and Treasurer (2010-present) and Assistant Treasurer (2009-present) of other Fidelity funds and is an employee of Fidelity Investments (2004-present). Previously, Mr. Robins served as Deputy Treasurer of the Fidelity funds (2005-2008) and Treasurer and Chief Financial Officer of The North Carolina Capital Management Trust: Cash and Term Portfolios (2006-2008). |
Bruce T. Herring (45) |
| Year of Election or Appointment: 2006 Vice President of certain Equity Funds. Mr. Herring also serves as Chief Investment Officer and Director of Fidelity Management & Research (U.K.) Inc. (2010-present) and Group Chief Investments Officer of FMR. Previously, Mr. Herring served as Vice President (2005-2006) and Senior Vice President (2006-2007) of Fidelity Management & Research Company, Vice President of FMR Co., Inc. (2001-2007) and as a portfolio manager for Fidelity U.S. Equity Funds. |
Brian B. Hogan (46) |
| Year of Election or Appointment: 2009 Vice President of certain Equity Funds and Vice President of Sector Funds. Mr. Hogan also serves as President of FMR's Equity Division (2009-present). Previously, Mr. Hogan served as Senior Vice President, Equity Research of FMR (2006-2009) and as a portfolio manager. |
Scott C. Goebel (43) |
| Year of Election or Appointment: 2008 Secretary and Chief Legal Officer (CLO) of the Fidelity funds. Mr. Goebel also serves as Secretary and CLO of The North Carolina Capital Management Trust: Cash and Term Portfolios (2008-present); General Counsel, Secretary, and Senior Vice President of FMR (2008-present) and FMR Co., Inc. (2008-present); Deputy General Counsel of FMR LLC; Chief Legal Officer of Fidelity Management & Research (Hong Kong) Limited (2008-present) and Assistant Secretary of Fidelity Management & Research (Japan) Inc. (2008-present), Fidelity Investments Money Management, Inc. (2008-present), Fidelity Management & Research (U.K.) Inc. (2008-present), and Fidelity Research and Analysis Company (2008-present). Previously, Mr. Goebel served as Assistant Secretary of the Funds (2007-2008) and as Vice President and Secretary of Fidelity Distributors Corporation (FDC) (2005-2007). |
William C. Coffey (42) |
| Year of Election or Appointment: 2009 Assistant Secretary of Fidelity's Equity and High Income Funds. Mr. Coffey also serves as Senior Vice President and Deputy General Counsel of FMR LLC (2010-present), and is an employee of Fidelity Investments. Previously, Mr. Coffey served as Vice President and Associate General Counsel of FMR LLC (2005-2009). |
Holly C. Laurent (56) |
| Year of Election or Appointment: 2008 Anti-Money Laundering (AML) Officer of the Fidelity funds. Ms. Laurent also serves as AML Officer of The North Carolina Capital Management Trust: Cash and Term Portfolios (2008-present) and is an employee of Fidelity Investments. Previously, Ms. Laurent was Senior Vice President and Head of Legal for Fidelity Business Services India Pvt. Ltd. (2006-2008), and Senior Vice President, Deputy General Counsel and Group Head for FMR LLC (2005-2006). |
Christine Reynolds (52) |
| Year of Election or Appointment: 2008 Chief Financial Officer of the Fidelity funds. Ms. Reynolds became President of Fidelity Pricing and Cash Management Services (FPCMS) in August 2008. Ms. Reynolds served as Chief Operating Officer of FPCMS (2007-2008). Previously, Ms. Reynolds served as President, Treasurer, and Anti-Money Laundering officer of the Fidelity funds (2004-2007). |
Kenneth A. Rathgeber (63) |
| Year of Election or Appointment: 2004 Chief Compliance Officer of Fidelity's Equity and High Income Funds. Mr. Rathgeber is Chief Compliance Officer of Fidelity Management & Research (Hong Kong) Limited (2008-present), Fidelity Management & Research (Japan) Inc. (2008-present), FMR (2005-present), FMR Co., Inc. (2005-present), Fidelity Management & Research (U.K.) Inc. (2005-present), Fidelity Research & Analysis Company (2005-present), Fidelity Investments Money Management, Inc. (2005-present), Pyramis Global Advisors, LLC (2005-present), and Strategic Advisers, Inc. (2005-present). |
Jeffrey S. Christian (49) |
| Year of Election or Appointment: 2009 Deputy Treasurer of the Fidelity funds. Mr. Christian is an employee of Fidelity Investments. Previously, Mr. Christian served as Chief Financial Officer (2008-2009) of certain Fidelity funds and Senior Vice President of Fidelity Pricing and Cash Management Services (FPCMS) (2004-2009). |
Bryan A. Mehrmann (49) |
| Year of Election or Appointment: 2005 Deputy Treasurer of the Fidelity funds. Mr. Mehrmann is an employee of Fidelity Investments. |
Adrien E. Deberghes (43) |
| Year of Election or Appointment: 2008 Deputy Treasurer of Fidelity's Equity and High Income Funds. Mr. Deberghes also serves as Assistant Treasurer of other Fidelity funds (2010-present) and is an employee of Fidelity Investments (2008-present). Previously, Mr. Deberghes served as Senior Vice President of Mutual Fund Administration at State Street Corporation (2007-2008), Senior Director of Mutual Fund Administration at Investors Bank & Trust (2005-2007), and Director of Finance for Dunkin' Brands (2000-2005). |
Stephanie J. Dorsey (41) |
| Year of Election or Appointment: 2010 Assistant Treasurer of Fidelity's Equity and High Income Funds. Ms. Dorsey also serves as Deputy Treasurer of other Fidelity funds (2008-present) and is an employee of Fidelity Investments (2008-present). Previously, Ms. Dorsey served as Treasurer (2004-2008) of the JPMorgan Mutual Funds and Vice President (2004-2008) of JPMorgan Chase Bank. |
John R. Hebble (52) |
| Year of Election or Appointment: 2009 Assistant Treasurer of Fidelity's Equity and High Income Funds. Mr. Hebble also serves as Treasurer and Chief Financial Officer of The North Carolina Capital Management Trust: Cash and Term Portfolio (2008-present), President and Treasurer of other Fidelity funds (2008-present) and is an employee of Fidelity Investments. |
Gary W. Ryan (52) |
| Year of Election or Appointment: 2005 Assistant Treasurer of the Fidelity funds. Mr. Ryan is an employee of Fidelity Investments. Previously, Mr. Ryan served as Vice President of Fund Reporting in Fidelity Pricing and Cash Management Services (FPCMS) (1999-2005). |
Jonathan Davis (42) |
| Year of Election or Appointment: 2010 Assistant Treasurer of the Fidelity funds. Mr. Davis is an employee of Fidelity Investments. Previously, Mr. Davis served as Vice President and Associate General Counsel of FMR LLC (2003-2010). |
Annual Report
The Board of Trustees of Fidelity Magellan Fund voted to pay shareholders of record at the opening of business on record date, the following distributions per share derived from capital gains realized from sales of portfolio securities, and dividends derived from net investment income:
| Pay Date | Record Date | Dividends | Capital Gains |
Magellan | 05/09/11 | 05/06/11 | $0.084 | $0.022 |
Magellan designates 100% and 90% of the dividends distributed in May and December, respectively during the fiscal year as qualifying for the dividends-received deduction for corporate shareholders.
Magellan designates 100% of the dividends distributed during the fiscal year as amounts which may be taken into account as a dividend for the purposes of the maximum rate under section 1(h)(11) of the Internal Revenue Code.
The fund will notify shareholders in January 2012 of amounts for use in preparing 2011 income tax returns.
Annual Report
Managing Your Investments
Fidelity offers several ways to conveniently manage your personal investments via your telephone or PC. You can access your account information, conduct trades and research your investments 24 hours a day.
By Phone
Fidelity Automated Service Telephone provides a single toll-free number to access account balances, positions, quotes and trading. It's easy to navigate the service, and on your first call, the system will help you create a personal identification number (PIN) for security.
(phone_graphic)
Fidelity Automated
Service Telephone (FAST®)
1-800-544-5555
Press
 For mutual fund and brokerage trading.
 For quotes.*
 For account balances and holdings.
 To review orders and mutual
fund activity.
 To change your PIN.

 To speak to a Fidelity representative.
By PC
Fidelity's web site on the Internet provides a wide range of information, including daily financial news, fund performance, interactive planning tools and news about Fidelity products and services.
(computer_graphic)
Fidelity's Web Site
www.fidelity.com
* When you call the quotes line, please remember that a fund's yield and return will vary and, except for money market funds, share price will also vary. This means that you may have a gain or loss when you sell your shares. There is no assurance that money market funds will be able to maintain a stable $1 share price; an investment in a money market fund is not insured or guaranteed by the U.S. government. Total returns are historical and include changes in share price, reinvestment of dividends and capital gains distributions, and the effects of any sales charges.
Annual Report
To Visit Fidelity
For directions and hours,
please call 1-800-544-9797.
Arizona
7001 West Ray Road
Chandler, AZ
15445 N. Scottsdale Road
Scottsdale, AZ
17550 North 75th Avenue
Glendale, AZ
5330 E. Broadway Blvd
Tucson, AZ
California
815 East Birch Street
Brea, CA
1411 Chapin Avenue
Burlingame, CA
851 East Hamilton Avenue
Campbell, CA
601 Larkspur Landing Circle
Larkspur, CA
2000 Avenue of the Stars
Los Angeles, CA
27101 Puerta Real
Mission Viejo, CA
73575 El Paseo
Palm Desert, CA
251 University Avenue
Palo Alto, CA
123 South Lake Avenue
Pasadena, CA
16656 Bernardo Ctr. Drive
Rancho Bernardo, CA
1220 Roseville Parkway
Roseville, CA
1740 Arden Way
Sacramento, CA
7676 Hazard Center Drive
San Diego, CA
11943 El Camino Real
San Diego, CA
8 Montgomery Street
San Francisco, CA
3793 State Street
Santa Barbara, CA
1200 Wilshire Boulevard
Santa Monica, CA
398 West El Camino Real
Sunnyvale, CA
111 South Westlake Blvd
Thousand Oaks, CA
21701 Hawthorne Boulevard
Torrance, CA
2001 North Main Street
Walnut Creek, CA
6326 Canoga Avenue
Woodland Hills, CA
2211 Michelson Drive
Irvine, CA
Colorado
281 East Flatiron Circle
Broomfield, CO
1625 Broadway
Denver, CO
9185 Westview Road
Lone Tree, CO
Connecticut
48 West Putnam Avenue
Greenwich, CT
265 Church Street
New Haven, CT
300 Atlantic Street
Stamford, CT
29 South Main Street
West Hartford, CT
1261 Post Road
Fairfield, CT
Delaware
400 Delaware Avenue
Wilmington, DE
Florida
175 East Altamonte Drive
Altamonte Springs, FL
1400 Glades Road
Boca Raton, FL
121 Alhambra Plaza
Coral Gables, FL
2948 N. Federal Highway
Ft. Lauderdale, FL
4671 Town Center Parkway
Jacksonville, FL
8880 Tamiami Trail, North
Naples, FL
230 Royal Palm Way
Palm Beach, FL
3501 PGA Boulevard
Palm Beach Gardens, FL
3550 Tamiami Trail, South
Sarasota, FL
1502 N. Westshore Blvd.
Tampa, FL
2465 State Road 7
Wellington, FL
Georgia
3242 Peachtree Road
Atlanta, GA
1000 Abernathy Road
Atlanta, GA
Illinois
One North LaSalle Street
Chicago, IL
401 North Michigan Avenue
Chicago, IL
One Skokie Valley Road
Highland Park, IL
1415 West 22nd Street
Oak Brook, IL
15105 S LaGrange Road
Orland Park, IL
1572 East Golf Road
Schaumburg, IL
1823 Freedom Drive
Naperville, IL
Indiana
8480 Keystone Crossing
Indianapolis, IN
Kansas
5400 College Boulevard
Overland Park, KS
Maine
Three Canal Plaza
Portland, ME
Maryland
7315 Wisconsin Avenue
Bethesda, MD
610 York Road
Towson, MD
Massachusetts
801 Boylston Street
Boston, MA
155 Congress Street
Boston, MA
300 Granite Street
Braintree, MA
44 Mall Road
Burlington, MA
238 Main Street
Cambridge, MA
200 Endicott Street
Danvers, MA
Fidelity Brokerage Services, Inc., 100 Summer St., Boston, MA 02110 Member NYSE/SIPC
Annual Report
405 Cochituate Road
Framingham, MA
551 Boston Turnpike
Shrewsbury, MA
Michigan
500 E. Eisenhower Pkwy.
Ann Arbor, MI
280 N. Old Woodward Ave.
Birmingham, MI
30200 Northwestern Hwy.
Farmington Hills, MI
43420 Grand River Avenue
Novi, MI
3480 28th Street
Grand Rapids, MI
2425 S. Linden Road STE E
Flint, MI
Minnesota
7740 France Avenue South
Edina, MN
8342 3rd Street North
Oakdale, MN
Missouri
1524 South Lindbergh Blvd.
St. Louis, MO
Nevada
2225 Village Walk Drive
Henderson, NV
New Jersey
501 Route 73 South
Marlton, NJ
150 Essex Street
Millburn, NJ
35 Morris Street
Morristown, NJ
396 Route 17, North
Paramus, NJ
3518 Route 1 North
Princeton, NJ
530 Broad Street
Shrewsbury, NJ
New Mexico
2261 Q Street NE
Albuquerque, NM
New York
1130 Franklin Avenue
Garden City, NY
37 West Jericho Turnpike
Huntington Station, NY
1271 Avenue of the Americas
New York, NY
980 Madison Avenue
New York, NY
61 Broadway
New York, NY
350 Park Avenue
New York, NY
200 Fifth Avenue
New York, NY
733 Third Avenue
New York, NY
2070 Broadway
New York, NY
1075 Northern Blvd.
Roslyn, NY
799 Central Park Avenue
Scarsdale, NY
3349 Monroe Avenue
Rochester, NY
North Carolina
4611 Sharon Road
Charlotte, NC
7011 Fayetteville Road
Durham, NC
Ohio
3805 Edwards Road
Cincinnati, OH
1324 Polaris Parkway
Columbus, OH
1800 Crocker Road
Westlake, OH
28699 Chagrin Boulevard
Woodmere Village, OH
Oregon
7493 SW Bridgeport Road
Tigard, OR
Pennsylvania
600 West DeKalb Pike
King of Prussia, PA
1735 Market Street
Philadelphia, PA
12001 Perry Highway
Wexford, PA
Rhode Island
10 Memorial Boulevard
Providence, RI
Tennessee
3018 Peoples Street
Johnson City, TN
7628 West Farmington Blvd.
Germantown, TN
2035 Mallory Lane
Franklin, TN
Texas
10000 Research Boulevard
Austin, TX
4001 Northwest Parkway
Dallas, TX
12532 Memorial Drive
Houston, TX
2701 Drexel Drive
Houston, TX
6560 Fannin Street
Houston, TX
1701 Lake Robbins Drive
The Woodlands, TX
6500 N. MacArthur Blvd.
Irving, TX
6005 West Park Boulevard
Plano, TX
1576 East Southlake Blvd.
Southlake, TX
15600 Southwest Freeway
Sugar Land, TX
139 N. Loop 1604 East
San Antonio, TX
Utah
279 West South Temple
Salt Lake City, UT
Virginia
1861 International Drive
McLean, VA
11957 Democracy Drive
Reston, VA
Washington
10500 NE 8th Street
Bellevue, WA
1518 6th Avenue
Seattle, WA
304 Strander Blvd
Tukwila, WA
Washington, DC
1900 K Street, N.W.
Washington, DC
Wisconsin
16020 West Bluemound Road
Brookfield, WI
Annual Report
Investment Adviser
Fidelity Management &
Research Company
Boston, MA
Investment Sub-Advisers
FMR Co., Inc.
Fidelity Management & Research
(U.K.) Inc.
Fidelity Management & Research
(Japan) Inc.
Fidelity Management & Research
(Hong Kong) Limited
General Distributor
Fidelity Distributors Corporation
Boston, MA
Transfer and Service Agents
Fidelity Investments Institutional
Operations Company, Inc.
Boston, MA
Fidelity Service Company, Inc.
Boston, MA
Custodian
State Street Bank and Trust Company Quincy, MA
The Fidelity Telephone Connection
Mutual Fund 24-Hour Service
Exchanges/Redemptions
and Account Assistance 1-800-544-6666
Product Information 1-800-544-6666
Retirement Accounts 1-800-544-4774
(8 a.m. - 9 p.m.)
TDD Service 1-800-544-0118
for the deaf and hearing impaired
(9 a.m. - 9 p.m. Eastern time)
Fidelity Automated Service
Telephone (FAST®) 1-800-544-5555
Automated line for quickest service
MAG-UANN-0511
1.927080.100

Fidelity®
Magellan®
Fund -
Class K
Annual Report
March 31, 2011
(2_fidelity_logos) (Registered_Trademark)
Contents
Chairman's Message | <Click Here> | The Chairman's message to shareholders. |
Performance | <Click Here> | How the fund has done over time. |
Management's Discussion of Fund Performance | <Click Here> | The Portfolio Manager's review of fundperformance and strategy. |
Shareholder Expense Example | <Click Here> | An example of shareholder expenses. |
Investment Changes | <Click Here> | A summary of major shifts in the fund's investments over the past six months. |
Investments | <Click Here> | A complete list of the fund's investments with their market values. |
Financial Statements | <Click Here> | Statements of assets and liabilities, operations, and changes in net assets, as well as financial highlights. |
Notes | <Click Here> | Notes to the financial statements. |
Report of Independent Registered Public Accounting Firm | <Click Here> | |
Trustees and Officers | <Click Here> | |
Distributions | <Click Here> | |
To view a fund's proxy voting guidelines and proxy voting record for the 12-month period ended June 30, visit http://www.fidelity.com/proxyvotingresults or visit the Securities and Exchange Commission's (SEC) website at http://www.sec.gov. You may also call 1-800-835-5092 to request a free copy of the proxy voting guidelines.
Standard & Poor's, S&P and S&P 500 are registered service marks of The McGraw-Hill Companies, Inc. and have been licensed for use by Fidelity Distributors Corporation.
Other third party marks appearing herein are the property of their respective owners.
All other marks appearing herein are registered or unregistered trademarks or service marks of FMR LLC or an affiliated company.
Annual Report
This report and the financial statements contained herein are submitted for the general information of the shareholders of the fund. This report is not authorized for distribution to prospective investors in the fund unless preceded or accompanied by an effective prospectus.
A fund files its complete schedule of portfolio holdings with the SEC for the first and third quarters of each fiscal year on Form N-Q. Forms N-Q are available on the SEC's web site at http://www.sec.gov. A fund's Forms N-Q may be reviewed and copied at the SEC's Public Reference Room in Washington, DC. Information regarding the operation of the SEC's Public Reference Room may be obtained by calling 1-800-SEC-0330. For a complete list of a fund's portfolio holdings, view the most recent holdings listing, semiannual report, or annual report on Fidelity's web site at http://www.fidelity.com, http://www.advisor.fidelity.com, or http://www.401k.com, as applicable.
NOT FDIC INSURED • MAY LOSE VALUE • NO BANK GUARANTEE
Neither the fund nor Fidelity Distributors Corporation is a bank.
Annual Report
(photo_of_James_C_Curvey)
Dear Shareholder:
Amid indications the U.S. economy had turned a corner, U.S. equities continued their generally upward trend in early 2011, overcoming bouts of short-term volatility following unrest in North Africa and the disaster in Japan. Still, questions remained about the longer-term outlook, most notably persistently high unemployment. Financial markets are always unpredictable, of course, but there also are several time-tested investment principles that can help put the odds in your favor.
One of the basic tenets is to invest for the long term. Over time, riding out the markets' inevitable ups and downs has proven much more effective than selling into panic or chasing the hottest trend. Even missing only a few of the markets' best days can significantly diminish investor returns. Patience also affords the benefits of compounding - of earning interest on additional income or reinvested dividends and capital gains. There can be tax advantages and cost benefits to consider as well. While staying the course doesn't eliminate risk, it can considerably lessen the effect of short-term declines.
You can further manage your investing risk through diversification. And today, more than ever, geographic diversification should be taken into account. Studies indicate that asset allocation is the single most important determinant of a portfolio's long-term success. The right mix of stocks, bonds and cash - aligned to your particular risk tolerance and investment objective - is very important. Age-appropriate rebalancing is also an essential aspect of asset allocation. For younger investors, an emphasis on equities - which historically have been the best-performing asset class over time - is encouraged. As investors near their specific goal, such as retirement or sending a child to college, consideration may be given to replacing volatile assets (e.g. common stocks) with more-stable fixed investments (bonds or savings plans).
A third principle - investing regularly - can help lower the average cost of your purchases. Investing a certain amount of money each month or quarter helps ensure you won't pay for all your shares at market highs. This strategy - known as dollar cost averaging - also reduces "emotion" from investing, helping shareholders avoid selling weak performers just prior to an upswing, or chasing a hot performer just before a correction.
We invite you to contact us via the Internet, through our Investor Centers or by phone. It is our privilege to provide you the information you need to make the investments that are right for you.
Sincerely,
(The acting chairman's signature appears here.)
James C. Curvey
Acting Chairman
Annual Report
Average annual total return reflects the change in the value of an investment, assuming reinvestment of the class' distributions from dividend income and capital gains (the profits earned upon the sale of securities that have grown in value, if any) and assuming a constant rate of performance each year. The $10,000 table and the fund's returns do not reflect the deduction of taxes that a shareholder would pay on fund distributions or the redemption of fund shares. During periods of reimbursement by Fidelity, a fund's total return will be greater than it would be had the reimbursement not occurred. How a fund did yesterday is no guarantee of how it will do tomorrow.
Average Annual Total Returns
Periods ended March 31, 2011 | Past 1
year | Past 5
years | Past 10
years |
Class K A | 12.97% | 0.44% | 1.76% |
A The initial offering of Class K shares took place on May 9, 2008. Returns prior to May 9, 2008 are
those of Fidelity Magellan Fund, the original class of the fund.
$10,000 Over 10 Years
Let's say hypothetically that $10,000 was invested in Fidelity® Magellan® Fund - Class K on March 31, 2001. The chart shows how the value of your investment would have changed, and also shows how the S&P 500® Index performed over the same period. The initial offering of Class K took place on May 9, 2008. See above for additional information regarding the performance of Class K.
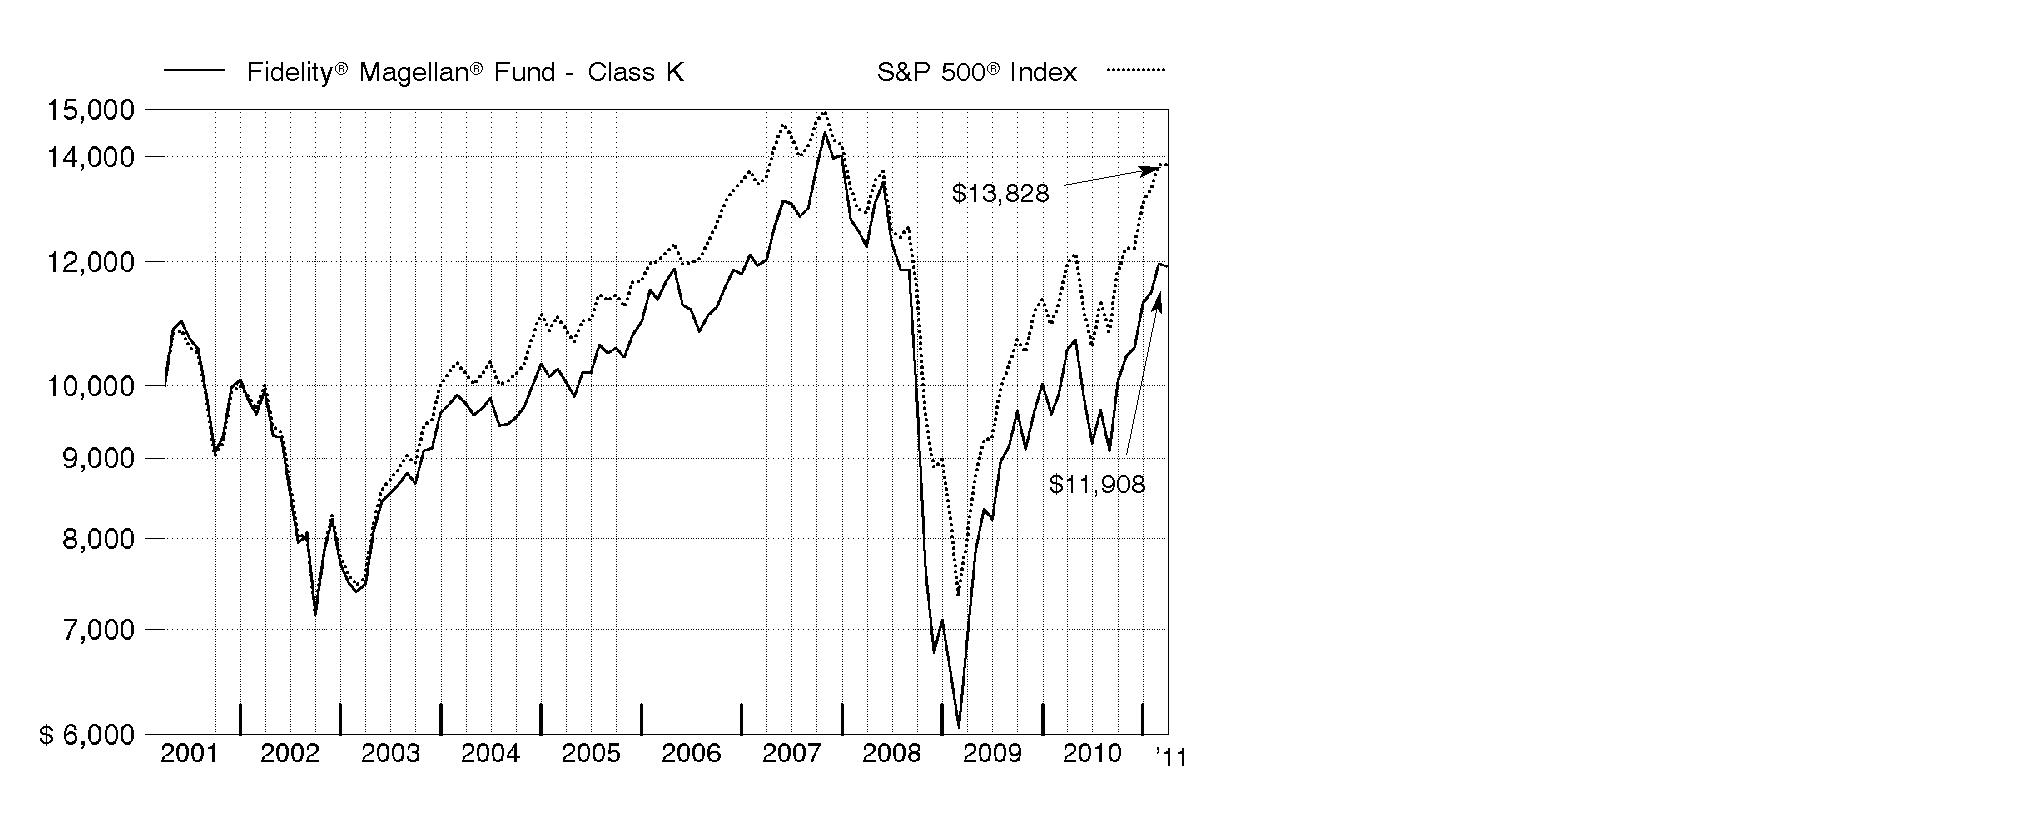
Annual Report
Market Recap: The 12-month period ending March 31, 2011, marked another good stretch for major equity markets, which continued a rally that began two years earlier. Despite early-period volatility brought on by the debt crisis in Europe and worries about a potential "double-dip" recession in the U.S., stocks regained strength in late summer and fall, fueled by better-than-expected corporate earnings, encouraging economic activity, stimulative tax policies and the Federal Reserve's second round of quantitative easing involving the purchase of $600 billion in U.S. Treasuries. For the full period, the broad-based, large-cap-oriented S&P 500® Index posted a 15.65% gain, while its blue-chip counterpart, the Dow Jones Industrial AverageSM, rose 16.51% and the technology-laden Nasdaq Composite® Index added 17.06%. Within the S&P 500®, economically sensitive sectors generally saw the biggest gains, led by energy, materials and consumer discretionary. Telecommunication services stocks also rose sharply. By contrast, the financials and health care sectors showed only modest advances. Although global markets were rocked later in the period by heightened unrest in the Arab world and a devastating earthquake in Japan, foreign developed-markets equities, as represented by the MSCI® EAFE® (Europe, Australasia, Far East) Index, finished the year up 10.55%, significantly boosted by a weaker dollar.
Comments from Harry Lange, Portfolio Manager of Fidelity® Magellan® Fund: The fund's Class K shares returned 12.97% for the year, trailing the S&P 500®. Weak stock and industry selection in consumer discretionary hampered performance, as did unfavorable positioning in energy. Stock picking in technology - due to a large out-of-benchmark position in poor-performing Finland-based Nokia, which I sold - also hurt. The fund's foreign holdings detracted overall, despite the tail wind from a weaker U.S. dollar. Other disappointments included pharmacy benefit manager Medco Health Solutions, an out-of-index position in China Life Insurance, office products supplier Staples and specialty glass maker Corning. I sold China Life and Staples by period end. Conversely, solid picks and a sizable underweighting in the pharmaceuticals/biotechnology/life science industry added value. Favorable positioning in consumer staples and financials, as well as a large overweighting in materials, further bolstered performance. At the stock level, underexposure to some lagging mega-caps in the benchmark was helpful. Among them were Microsoft, Hewlett-Packard and Johnson & Johnson, a trio I didn't own at all, and Bank of America, which I underweighted and sold prior to period end. Overweighting coffee purveyor Starbucks and an out-of-index stake in Canada-based Valeant Pharmaceuticals International also contributed.
The views expressed above reflect those of the portfolio manager(s) only through the end of the period as stated on the cover of this report and do not necessarily represent the views of Fidelity or any other person in the Fidelity organization. Any such views are subject to change at any time based upon market or other conditions and Fidelity disclaims any responsibility to update such views. These views may not be relied on as investment advice and, because investment decisions for a Fidelity fund are based on numerous factors, may not be relied on as an indication of trading intent on behalf of any Fidelity fund.
Annual Report
Shareholder Expense Example
As a shareholder of the Fund, you incur two types of costs: (1) transaction costs, and (2) ongoing costs, including management fees and other Fund expenses. This Example is intended to help you understand your ongoing costs (in dollars) of investing in the Fund and to compare these costs with the ongoing costs of investing in other mutual funds.
The Example is based on an investment of $1,000 invested at the beginning of the period and held for the entire period (October 1, 2010 to March 31, 2011).
Actual Expenses
The first line of the accompanying table for each class of the Fund provides information about actual account values and actual expenses. You may use the information in this line, together with the amount you invested, to estimate the expenses that you paid over the period. Simply divide your account value by $1,000.00 (for example, an $8,600 account value divided by $1,000.00 = 8.6), then multiply the result by the number in the first line for a class of the Fund under the heading entitled "Expenses Paid During Period" to estimate the expenses you paid on your account during this period. A small balance maintenance fee of $12.00 that is charged once a year may apply for certain accounts with a value of less than $2,000. This fee is not included in the table below. If it was, the estimate of expenses you paid during the period would be higher, and your ending account value lower, by this amount. In addition, the Fund, as a shareholder in the underlying Fidelity Central Funds, will indirectly bear its pro-rata share of the fees and expenses incurred by the underlying Fidelity Central Funds. These fees and expenses are not included in the Fund's annualized expense ratio used to calculate the expense estimate in the table below.
Hypothetical Example for Comparison Purposes
The second line of the accompanying table for each class of the Fund provides information about hypothetical account values and hypothetical expenses based on a Class' actual expense ratio and an assumed rate of return of 5% per year before expenses, which is not the Class' actual return. The hypothetical account values and expenses may not be used to estimate the actual ending account balance or expenses you paid for the period. You may use this information to compare the ongoing costs of investing in the Fund and other funds. To do so, compare this 5% hypothetical example with the 5% hypothetical examples that appear in the shareholder reports of the other funds. A small balance maintenance fee of $12.00 that is charged once a year may apply for certain accounts with a value of less than $2,000. This fee is not included in the table below. If it was, the estimate of expenses you paid during the period would be higher, and your ending account value lower, by this amount. In addition, the Fund, as a shareholder in the underlying Fidelity Central Funds, will indirectly bear its pro-rata share of the fees and expenses incurred by the underlying Fidelity Central Funds. These fees and expenses are not included in the Fund's annualized expense ratio used to calculate the expense estimate in the table below.
Please note that the expenses shown in the table are meant to highlight your ongoing costs only and do not reflect any transaction costs. Therefore, the second line of the table is useful in comparing ongoing costs only, and will not help you determine the relative total costs of owning different funds.
Annual Report
| Annualized
Expense Ratio | Beginning
Account Value
October 1, 2010 | Ending
Account Value
March 31, 2011 | Expenses Paid
During Period*
October 1, 2010 to
March 31, 2011 |
Magellan | .53% | | | |
Actual | | $ 1,000.00 | $ 1,181.20 | $ 2.88 |
HypotheticalA | | $ 1,000.00 | $ 1,022.29 | $ 2.67 |
Class K | .41% | | | |
Actual | | $ 1,000.00 | $ 1,181.90 | $ 2.23 |
HypotheticalA | | $ 1,000.00 | $ 1,022.89 | $ 2.07 |
A 5% return per year before expenses
* Expenses are equal to each Class' annualized expense ratio, multiplied by the average account value over the period, multiplied by 182/365 (to reflect the one-half year period).
Annual Report
Investment Changes (Unaudited)
Top Ten Stocks as of March 31, 2011 |
| % of fund's
net assets | % of fund's net assets
6 months ago |
Applied Materials, Inc. | 4.5 | 3.7 |
Apple, Inc. | 3.3 | 2.8 |
Corning, Inc. | 3.0 | 2.7 |
Occidental Petroleum Corp. | 2.9 | 1.8 |
Medco Health Solutions, Inc. | 2.9 | 2.8 |
Goldcorp, Inc. | 2.2 | 2.0 |
ASML Holding NV | 1.8 | 1.3 |
Google, Inc. Class A | 1.8 | 1.4 |
Ensco International Ltd. ADR | 1.6 | 0.4 |
Halliburton Co. | 1.6 | 0.0 |
| 25.6 | |
Top Five Market Sectors as of March 31, 2011 |
| % of fund's
net assets | % of fund's net assets
6 months ago |
Information Technology | 27.5 | 28.3 |
Energy | 13.4 | 8.2 |
Health Care | 13.4 | 11.4 |
Consumer Discretionary | 12.1 | 13.8 |
Financials | 10.6 | 11.1 |
Asset Allocation (% of fund's net assets) |
As of March 31, 2011 * | As of September 30, 2010 ** |
| Stocks 98.9% | | | Stocks 99.5% | |
| Convertible
Securities 0.1% | | | Convertible
Securities 0.4% | |
| Short-Term
Investments and
Net Other Assets 1.0% | | | Short-Term
Investments and
Net Other Assets 0.1% | |
* Foreign investments | 23.4% | | ** Foreign investments | 23.0% | |

Annual Report
Investments March 31, 2011
Showing Percentage of Net Assets
Common Stocks - 98.9% |
| Shares | | Value (000s) |
CONSUMER DISCRETIONARY - 12.1% |
Auto Components - 0.3% |
BorgWarner, Inc. (a) | 1,000,000 | | $ 79,690 |
Hotels, Restaurants & Leisure - 2.0% |
China Lodging Group Ltd. ADR (d) | 500,000 | | 8,750 |
Ctrip.com International Ltd. sponsored ADR (a) | 500,000 | | 20,745 |
Las Vegas Sands Corp. (a) | 2,000,000 | | 84,440 |
Melco PBL Entertainment (Macau) Ltd. sponsored ADR (a)(d) | 274,700 | | 2,088 |
Starbucks Corp. | 9,562,616 | | 353,339 |
| | 469,362 |
Household Durables - 4.5% |
Beazer Homes USA, Inc. (a)(d) | 2,231,800 | | 10,199 |
D.R. Horton, Inc. (e) | 15,988,899 | | 186,271 |
KB Home (d)(e) | 4,088,000 | | 50,855 |
Lennar Corp. Class A (d) | 13,380,585 | | 242,456 |
M.D.C. Holdings, Inc. | 2,226,202 | | 56,434 |
PulteGroup, Inc. (a) | 18,708,638 | | 138,444 |
Ryland Group, Inc. | 1,896,860 | | 30,160 |
Tempur-Pedic International, Inc. (a) | 1,000,000 | | 50,660 |
Toll Brothers, Inc. (a)(e) | 12,853,054 | | 254,105 |
| | 1,019,584 |
Internet & Catalog Retail - 0.2% |
Amazon.com, Inc. (a) | 200,000 | | 36,026 |
Leisure Equipment & Products - 0.4% |
Brunswick Corp. | 3,503,353 | | 89,090 |
Media - 2.0% |
Ascent Media Corp. (a) | 144,656 | | 7,066 |
Cinemark Holdings, Inc. | 238,900 | | 4,623 |
Comcast Corp. Class A (special) (non-vtg.) | 4,000,000 | | 92,880 |
Informa PLC | 5,000,000 | | 33,411 |
Sun TV Ltd. | 504,521 | | 5,088 |
Time Warner Cable, Inc. | 1,500,000 | | 107,010 |
Viacom, Inc. Class B (non-vtg.) | 1,500,000 | | 69,780 |
Virgin Media, Inc. | 4,944,763 | | 137,415 |
| | 457,273 |
Multiline Retail - 0.0% |
Maoye International Holdings Ltd. | 22,713,000 | | 9,782 |
Pantaloon Retail India Ltd. | 194,608 | | 1,404 |
Pantaloon Retail India Ltd. Class B (a) | 19,460 | | 79 |
| | 11,265 |
Common Stocks - continued |
| Shares | | Value (000s) |
CONSUMER DISCRETIONARY - continued |
Specialty Retail - 0.8% |
Belle International Holdings Ltd. | 25,000,000 | | $ 45,831 |
Best Buy Co., Inc. | 3,000,000 | | 86,160 |
TJX Companies, Inc. | 1,000,000 | | 49,730 |
| | 181,721 |
Textiles, Apparel & Luxury Goods - 1.9% |
Arezzo Industria E Comercio SA | 2,005,400 | | 27,944 |
lululemon athletica, Inc. (a) | 674,500 | | 60,064 |
NIKE, Inc. Class B | 1,597,000 | | 120,893 |
Peak Sport Products Co. Ltd. (d) | 58,560,000 | | 40,201 |
Phillips-Van Heusen Corp. | 590,384 | | 38,393 |
Polo Ralph Lauren Corp. Class A | 1,150,000 | | 142,198 |
Vera Bradley, Inc. | 23,500 | | 992 |
| | 430,685 |
TOTAL CONSUMER DISCRETIONARY | | 2,774,696 |
CONSUMER STAPLES - 2.1% |
Food & Staples Retailing - 1.6% |
CVS Caremark Corp. | 2,341,972 | | 80,376 |
Drogasil SA | 1,500,000 | | 11,723 |
United Natural Foods, Inc. (a)(e) | 4,467,342 | | 200,226 |
Wal-Mart de Mexico SA de CV Series V | 10,000,000 | | 29,949 |
Wumart Stores, Inc. (H Shares) | 25,000,000 | | 54,509 |
| | 376,783 |
Food Products - 0.2% |
Shenguan Holdings Group Ltd. | 10,000,000 | | 11,699 |
The J.M. Smucker Co. | 500,000 | | 35,695 |
| | 47,394 |
Household Products - 0.1% |
Uni-Charm Corp. | 500,000 | | 18,187 |
Personal Products - 0.2% |
Estee Lauder Companies, Inc. Class A | 500,000 | | 48,180 |
TOTAL CONSUMER STAPLES | | 490,544 |
ENERGY - 13.4% |
Energy Equipment & Services - 5.8% |
Baker Hughes, Inc. | 1,300,000 | | 95,459 |
Ensco International Ltd. ADR (d) | 6,500,000 | | 375,960 |
Halliburton Co. | 7,300,000 | | 363,832 |
Common Stocks - continued |
| Shares | | Value (000s) |
ENERGY - continued |
Energy Equipment & Services - continued |
Noble Corp. | 1,500,000 | | $ 68,430 |
Schlumberger Ltd. | 3,452,462 | | 321,977 |
Transocean Ltd. (a) | 761,302 | | 59,343 |
Weatherford International Ltd. (a) | 2,000,000 | | 45,200 |
| | 1,330,201 |
Oil, Gas & Consumable Fuels - 7.6% |
Alpha Natural Resources, Inc. (a)(d) | 3,964,700 | | 235,384 |
Anadarko Petroleum Corp. | 1,300,000 | | 106,496 |
Chevron Corp. | 1,700,000 | | 182,631 |
Denbury Resources, Inc. (a) | 9,500,000 | | 231,800 |
Enterprise Products Partners LP | 700,000 | | 30,142 |
Marathon Oil Corp. | 2,262,188 | | 120,597 |
Massey Energy Co. | 1,435,679 | | 98,143 |
Occidental Petroleum Corp. | 6,415,300 | | 670,335 |
Westernzagros Resources Ltd. (a) | 1,000,000 | | 567 |
Williams Companies, Inc. | 2,000,000 | | 62,360 |
| | 1,738,455 |
TOTAL ENERGY | | 3,068,656 |
FINANCIALS - 10.6% |
Capital Markets - 2.1% |
Charles Schwab Corp. | 9,547,000 | | 172,132 |
Evercore Partners, Inc. Class A | 87,600 | | 3,004 |
Franklin Resources, Inc. | 810,800 | | 101,415 |
Invesco Ltd. | 7,000,000 | | 178,920 |
Merriman Holdings, Inc. (a) | 15,012 | | 48 |
TD Ameritrade Holding Corp. | 1,000,000 | | 20,870 |
| | 476,389 |
Commercial Banks - 1.6% |
Aozora Bank Ltd. (d) | 30,100,000 | | 68,043 |
China Merchants Bank Co. Ltd. (H Shares) | 20,000,000 | | 55,408 |
Lloyds Banking Group PLC (a) | 10,000,000 | | 9,289 |
Mitsubishi UFJ Financial Group, Inc. sponsored ADR | 600,000 | | 2,760 |
SVB Financial Group (a) | 1,741,010 | | 99,116 |
Wells Fargo & Co. | 3,917,204 | | 124,175 |
| | 358,791 |
Diversified Financial Services - 1.5% |
CME Group, Inc. | 270,200 | | 81,479 |
Common Stocks - continued |
| Shares | | Value (000s) |
FINANCIALS - continued |
Diversified Financial Services - continued |
JPMorgan Chase & Co. | 1,066,600 | | $ 49,170 |
ORIX Corp. | 2,261,600 | | 211,842 |
| | 342,491 |
Insurance - 0.7% |
Berkshire Hathaway, Inc. Class B (a) | 835,500 | | 69,873 |
Endurance Specialty Holdings Ltd. | 555,800 | | 27,134 |
Ping An Insurance Group Co. China Ltd. (H Shares) | 5,000,000 | | 50,684 |
Reinsurance Group of America, Inc. | 339,549 | | 21,317 |
| | 169,008 |
Real Estate Investment Trusts - 2.5% |
Boston Properties, Inc. | 1,000,000 | | 94,850 |
CBL & Associates Properties, Inc. | 5,513,363 | | 96,043 |
HCP, Inc. | 738,900 | | 28,034 |
Kimco Realty Corp. | 679,800 | | 12,468 |
Mori Hills REIT Investment Corp. | 5,000 | | 15,301 |
ORIX JREIT, Inc. | 3,000 | | 16,485 |
ProLogis Trust | 1,886,500 | | 30,146 |
Simon Property Group, Inc. | 1,000,000 | | 107,160 |
Terreno Realty Corp. (e) | 1,000,000 | | 17,230 |
Vornado Realty Trust | 530,114 | | 46,385 |
Weyerhaeuser Co. | 4,677,136 | | 115,058 |
| | 579,160 |
Real Estate Management & Development - 2.1% |
Agre Developers Ltd. | 10,703 | | 11 |
CB Richard Ellis Group, Inc. Class A (a) | 2,699,300 | | 72,071 |
China Resources Land Ltd. | 10,000,000 | | 18,718 |
Iguatemi Empresa de Shopping Centers SA | 2,189,500 | | 53,509 |
Indiabulls Real Estate Ltd. (a) | 19,800,000 | | 55,228 |
PT Ciputra Development Tbk (a) | 18,384,000 | | 781 |
PT Lippo Karawaci Tbk (e) | 1,227,975,625 | | 86,026 |
Rialto Real Estate Fund LP (a)(e)(g) | 500,000 | | 19,805 |
The St. Joe Co. (a)(d)(e) | 6,854,004 | | 171,830 |
| | 477,979 |
Thrifts & Mortgage Finance - 0.1% |
BankUnited, Inc. | 753,800 | | 21,642 |
TOTAL FINANCIALS | | 2,425,460 |
Common Stocks - continued |
| Shares | | Value (000s) |
HEALTH CARE - 13.4% |
Biotechnology - 2.2% |
Acorda Therapeutics, Inc. (a) | 750,000 | | $ 17,400 |
Amgen, Inc. (a) | 4,003,100 | | 213,966 |
BioMarin Pharmaceutical, Inc. (a) | 2,000,000 | | 50,260 |
Clinical Data, Inc. (a) | 988,714 | | 29,958 |
Incyte Corp. (a)(d) | 1,500,000 | | 23,775 |
Protalix BioTherapeutics, Inc. (a)(d) | 1,000,000 | | 6,080 |
United Therapeutics Corp. (a) | 1,478,560 | | 99,093 |
Vertex Pharmaceuticals, Inc. (a) | 1,000,000 | | 47,930 |
| | 488,462 |
Health Care Equipment & Supplies - 2.4% |
American Medical Systems Holdings, Inc. (a) | 600,000 | | 12,984 |
C. R. Bard, Inc. | 1,899,791 | | 188,668 |
Covidien PLC | 2,000,000 | | 103,880 |
Edwards Lifesciences Corp. (a) | 660,000 | | 57,420 |
Greatbatch, Inc. (a)(e) | 2,318,300 | | 61,342 |
HeartWare International, Inc. (a) | 119,900 | | 10,255 |
Integra LifeSciences Holdings Corp. (a)(e) | 1,500,000 | | 71,130 |
St. Jude Medical, Inc. | 1,000,000 | | 51,260 |
| | 556,939 |
Health Care Providers & Services - 6.7% |
Brookdale Senior Living, Inc. (a)(e) | 10,759,100 | | 301,255 |
Emeritus Corp. (a) | 1,101,160 | | 28,036 |
Express Scripts, Inc. (a) | 5,612,600 | | 312,117 |
HealthSouth Corp. (a) | 1,000,000 | | 24,980 |
Henry Schein, Inc. (a) | 1,403,653 | | 98,494 |
McKesson Corp. | 1,500,000 | | 118,575 |
Medco Health Solutions, Inc. (a) | 11,650,100 | | 654,270 |
| | 1,537,727 |
Life Sciences Tools & Services - 0.8% |
Illumina, Inc. (a) | 1,523,950 | | 106,783 |
QIAGEN NV (a) | 1,700,000 | | 34,085 |
Thermo Fisher Scientific, Inc. (a) | 500,000 | | 27,775 |
| | 168,643 |
Pharmaceuticals - 1.3% |
Auxilium Pharmaceuticals, Inc. (a) | 200,000 | | 4,294 |
Cardiome Pharma Corp. (a) | 2,500,000 | | 10,622 |
Elan Corp. PLC sponsored ADR (a) | 5,000,000 | | 34,400 |
Novo Nordisk AS Series B sponsored ADR | 500,000 | | 62,615 |
Perrigo Co. | 600,000 | | 47,712 |
Common Stocks - continued |
| Shares | | Value (000s) |
HEALTH CARE - continued |
Pharmaceuticals - continued |
Shire PLC sponsored ADR | 300,000 | | $ 26,130 |
Valeant Pharmaceuticals International, Inc. (Canada) | 2,390,450 | | 119,313 |
| | 305,086 |
TOTAL HEALTH CARE | | 3,056,857 |
INDUSTRIALS - 9.6% |
Aerospace & Defense - 1.4% |
BE Aerospace, Inc. (a) | 1,000,000 | | 35,530 |
DigitalGlobe, Inc. (a) | 500,000 | | 14,015 |
Raytheon Co. | 1,000,000 | | 50,870 |
Raytheon Co. warrants 6/16/11 (a) | 204,836 | | 2,737 |
Textron, Inc. | 500,000 | | 13,695 |
TransDigm Group, Inc. (a) | 250,000 | | 20,958 |
United Technologies Corp. | 2,000,000 | | 169,300 |
| | 307,105 |
Airlines - 0.2% |
JetBlue Airways Corp. (a)(d) | 8,829,552 | | 55,361 |
Building Products - 0.7% |
Masco Corp. | 7,100,000 | | 98,832 |
Owens Corning (a) | 1,716,400 | | 61,773 |
| | 160,605 |
Commercial Services & Supplies - 0.8% |
Clean Harbors, Inc. (a) | 400,000 | | 39,464 |
Republic Services, Inc. | 4,000,000 | | 120,160 |
Stericycle, Inc. (a) | 350,000 | | 31,035 |
| | 190,659 |
Construction & Engineering - 1.2% |
Fluor Corp. | 2,500,000 | | 184,150 |
MYR Group, Inc. (a)(e)(f) | 1,037,100 | | 24,807 |
Shaw Group, Inc. (a) | 1,480,000 | | 52,407 |
| | 261,364 |
Electrical Equipment - 1.5% |
Acuity Brands, Inc. | 1,000,000 | | 58,490 |
AMETEK, Inc. | 750,000 | | 32,903 |
Emerson Electric Co. | 1,700,000 | | 99,331 |
EnerSys (a)(e) | 2,696,300 | | 107,178 |
Regal-Beloit Corp. | 451,522 | | 33,336 |
| | 331,238 |
Common Stocks - continued |
| Shares | | Value (000s) |
INDUSTRIALS - continued |
Machinery - 2.0% |
Cummins, Inc. | 1,100,000 | | $ 120,582 |
Danaher Corp. | 6,000,000 | | 311,400 |
NACCO Industries, Inc. Class A | 262,001 | | 28,996 |
| | 460,978 |
Professional Services - 1.6% |
Equifax, Inc. (e) | 7,485,262 | | 290,802 |
Robert Half International, Inc. (d) | 1,624,900 | | 49,722 |
Towers Watson & Co. | 600,000 | | 33,276 |
| | 373,800 |
Road & Rail - 0.2% |
Localiza Rent A Car SA | 2,500,000 | | 40,119 |
Trading Companies & Distributors - 0.0% |
Essex Rental Corp. (a) | 266,666 | | 1,880 |
Transportation Infrastructure - 0.0% |
The Sumitomo Warehouse Co. Ltd. | 1,000,000 | | 4,834 |
TOTAL INDUSTRIALS | | 2,187,943 |
INFORMATION TECHNOLOGY - 27.5% |
Communications Equipment - 1.6% |
HTC Corp. | 2,100,000 | | 82,129 |
Juniper Networks, Inc. (a) | 6,662,110 | | 280,342 |
| | 362,471 |
Computers & Peripherals - 3.4% |
Apple, Inc. (a) | 2,156,200 | | 751,328 |
Seagate Technology (a) | 2,000,000 | | 28,800 |
| | 780,128 |
Electronic Equipment & Components - 4.9% |
Amphenol Corp. Class A | 4,736,900 | | 257,640 |
Corning, Inc. | 33,043,522 | | 681,688 |
Foxconn International Holdings Ltd. (a) | 5,000,000 | | 3,002 |
Hirose Electric Co. Ltd. | 200,000 | | 21,548 |
Ingram Micro, Inc. Class A (a) | 2,577,600 | | 54,207 |
Samsung SDI Co. Ltd. | 500,000 | | 76,607 |
TPK Holdings Co. | 1,000,000 | | 27,512 |
| | 1,122,204 |
Internet Software & Services - 3.9% |
eAccess Ltd. (d) | 160,000 | | 87,922 |
eBay, Inc. (a) | 5,000,000 | | 155,200 |
Common Stocks - continued |
| Shares | | Value (000s) |
INFORMATION TECHNOLOGY - continued |
Internet Software & Services - continued |
Google, Inc. Class A (a) | 701,000 | | $ 410,933 |
GREE, Inc. | 8,000,000 | | 134,191 |
Mail.ru Group Ltd. GDR (a)(f) | 40,300 | | 1,207 |
Yahoo! Japan Corp. | 300,000 | | 107,353 |
| | 896,806 |
IT Services - 2.6% |
Accenture PLC Class A | 3,500,000 | | 192,395 |
Cognizant Technology Solutions Corp. Class A (a) | 3,318,596 | | 270,134 |
Fidelity National Information Services, Inc. | 1,998,800 | | 65,341 |
Fiserv, Inc. (a) | 1,000,000 | | 62,720 |
Unisys Corp. (a) | 496,310 | | 15,495 |
| | 606,085 |
Semiconductors & Semiconductor Equipment - 9.7% |
Applied Materials, Inc. (e) | 66,189,916 | | 1,033,881 |
ASML Holding NV | 9,345,201 | | 415,861 |
Broadcom Corp. Class A | 2,000,000 | | 78,760 |
Himax Technologies, Inc. sponsored ADR | 4,000,000 | | 9,480 |
Lam Research Corp. (a) | 499,200 | | 28,285 |
Marvell Technology Group Ltd. (a) | 3,500,000 | | 54,425 |
Micron Technology, Inc. (a) | 12,969,444 | | 148,630 |
Novellus Systems, Inc. (a) | 3,000,000 | | 111,390 |
NVIDIA Corp. (a) | 1,996,318 | | 36,852 |
PMC-Sierra, Inc. (a) | 2,017,535 | | 15,132 |
Samsung Electronics Co. Ltd. | 165,233 | | 140,444 |
Skyworks Solutions, Inc. (a) | 4,500,000 | | 145,890 |
| | 2,219,030 |
Software - 1.4% |
Autodesk, Inc. (a) | 1,000,000 | | 44,110 |
BMC Software, Inc. (a) | 3,000,000 | | 149,220 |
Changyou.com Ltd. (A Shares) ADR (a) | 357,300 | | 11,505 |
Longtop Financial Technologies Ltd. ADR (a) | 29,200 | | 917 |
Nintendo Co. Ltd. | 400,000 | | 108,074 |
| | 313,826 |
TOTAL INFORMATION TECHNOLOGY | | 6,300,550 |
MATERIALS - 7.6% |
Chemicals - 2.4% |
Celanese Corp. Class A | 1,000,000 | | 44,370 |
Common Stocks - continued |
| Shares | | Value (000s) |
MATERIALS - continued |
Chemicals - continued |
CF Industries Holdings, Inc. | 300,000 | | $ 41,037 |
Ecolab, Inc. | 2,000,000 | | 102,040 |
Givaudan SA | 104,500 | | 105,069 |
Huabao International Holdings Ltd. | 10,000,000 | | 15,376 |
Minerals Technologies, Inc. | 500,000 | | 34,260 |
Praxair, Inc. | 1,000,000 | | 101,600 |
Symrise AG | 2,000,000 | | 58,621 |
Valspar Corp. | 1,000,000 | | 39,100 |
| | 541,473 |
Construction Materials - 0.3% |
Eagle Materials, Inc. (e) | 2,703,891 | | 81,820 |
Metals & Mining - 4.9% |
Barrick Gold Corp. | 1,000,000 | | 51,965 |
Eldorado Gold Corp. | 5,029,586 | | 82,002 |
Goldcorp, Inc. | 9,900,000 | | 493,520 |
Harry Winston Diamond Corp. (a) | 3,400,000 | | 54,767 |
Newcrest Mining Ltd. | 7,967,115 | | 328,116 |
Reliance Steel & Aluminum Co. | 549,300 | | 31,739 |
Royal Gold, Inc. | 500,000 | | 26,200 |
Silver Wheaton Corp. | 500,000 | | 21,718 |
United States Steel Corp. | 500,000 | | 26,970 |
| | 1,116,997 |
TOTAL MATERIALS | | 1,740,290 |
TELECOMMUNICATION SERVICES - 2.3% |
Diversified Telecommunication Services - 0.3% |
CenturyLink, Inc. | 956,279 | | 39,733 |
Iliad Group SA | 200,000 | | 23,970 |
Level 3 Communications, Inc. (a) | 1,331,971 | | 1,958 |
| | 65,661 |
Wireless Telecommunication Services - 2.0% |
American Tower Corp. Class A (a) | 4,500,000 | | 233,190 |
SOFTBANK CORP. | 4,500,000 | | 179,643 |
Sprint Nextel Corp. (a) | 8,000,000 | | 37,120 |
| | 449,953 |
TOTAL TELECOMMUNICATION SERVICES | | 515,614 |
Common Stocks - continued |
| Shares | | Value (000s) |
UTILITIES - 0.3% |
Electric Utilities - 0.2% |
PPL Corp. | 1,979,800 | | $ 50,089 |
Independent Power Producers & Energy Traders - 0.0% |
Indiabulls Power Ltd. (a) | 1,796,532 | | 913 |
Multi-Utilities - 0.1% |
Sempra Energy | 300,000 | | 16,050 |
TOTAL UTILITIES | | 67,052 |
TOTAL COMMON STOCKS (Cost $17,813,356) | 22,627,662 |
Convertible Bonds - 0.1% |
| Principal
Amount (000s) | | |
TELECOMMUNICATION SERVICES - 0.1% |
Diversified Telecommunication Services - 0.1% |
Level 3 Communications, Inc. 7% 3/15/15 (Cost $25,000) | | $ 25,000 | | 29,125 |
Money Market Funds - 2.8% |
| Shares | | |
Fidelity Cash Central Fund, 0.16% (b) | 134,283,226 | | 134,283 |
Fidelity Securities Lending Cash Central Fund, 0.18% (b)(c) | 501,707,588 | | 501,708 |
TOTAL MONEY MARKET FUNDS (Cost $635,991) | 635,991 |
TOTAL INVESTMENT PORTFOLIO - 101.8% (Cost $18,474,347) | | 23,292,778 |
NET OTHER ASSETS (LIABILITIES) - (1.8)% | | (411,499) |
NET ASSETS - 100% | $ 22,881,279 |
Legend |
(a) Non-income producing |
(b) Affiliated fund that is available only to investment companies and other accounts managed by Fidelity Investments. The rate quoted is the annualized seven-day yield of the fund at period end. A complete unaudited listing of the fund's holdings as of its most recent quarter end is available upon request. In addition, each Fidelity Central Fund's financial statements, which are not covered by the Fund's Report of Independent Registered Public Accounting Firm, are available on the SEC's website or upon request. |
(c) Investment made with cash collateral received from securities on loan. |
(d) Security or a portion of the security is on loan at period end. |
(e) Affiliated company |
(f) Security exempt from registration under Rule 144A of the Securities Act of 1933. These securities may be resold in transactions exempt from registration, normally to qualified institutional buyers. At the end of the period, the value of these securities amounted to $26,014,000 or 0.1% of net assets. |
(g) Restricted securities - Investment in securities not registered under the Securities Act of 1933 (excluding 144A issues). At the end of the period, the value of restricted securities (excluding 144A issues) amounted to $19,805,000 or 0.1% of net assets. |
Additional information on each restricted holding is as follows: |
Security | Acquisition
Date | Acquisition
Cost (000s) |
Rialto Real Estate Fund LP | 2/24/11-
3/23/11 | $ 20,528 |
Affiliated Central Funds |
Information regarding fiscal year to date income earned by the Fund from investments in Fidelity Central Funds is as follows: |
Fund | Income earned
(Amounts in thousands) |
Fidelity Cash Central Fund | $ 227 |
Fidelity Securities Lending Cash Central Fund | 13,506 |
Total | $ 13,733 |
Other Affiliated Issuers |
An affiliated company is a company in which the Fund has ownership of at least 5% of the voting securities. Fiscal year to date transactions with companies which are or were affiliates are as follows: |
Affiliate
(Amounts in thousands) | Value,
beginning of
period | Purchases | Sales
Proceeds | Dividend
Income | Value,
end of
period |
Applied Materials, Inc. | $ 1,098,001 | $ - | $ 195,266 | $ 20,139 | $ 1,033,881 |
Brookdale Senior Living, Inc. | 216,297 | 6,989 | - | - | 301,255 |
D.R. Horton, Inc. | 188,001 | 13,267 | - | 2,344 | 186,271 |
Dole Food Co., Inc. | 69,267 | - | 53,756 | - | - |
Eagle Materials, Inc. | 100,852 | - | 31,579 | 1,411 | 81,820 |
EnerSys | - | 79,697 | - | - | 107,178 |
Equifax, Inc. | 339,572 | - | 62,066 | 3,029 | 290,802 |
Greatbatch, Inc. | 49,125 | - | - | - | 61,342 |
Integra LifeSciences Holdings Corp. | 65,745 | - | - | - | 71,130 |
KB Home | 68,474 | - | - | 1,022 | 50,855 |
Monster Worldwide, Inc. | 136,400 | 13,752 | 169,793 | - | - |
MYR Group, Inc. | 16,915 | - | - | - | 24,807 |
PT Lippo Karawaci Tbk | - | 72,959 | - | 270 | 86,026 |
Rialto Real Estate Fund LP | - | 20,528 | - | - | 19,805 |
Staples, Inc. | 937,711 | - | 899,006 | 10,104 | - |
Terreno Realty Corp. | 19,730 | - | - | - | 17,230 |
The St. Joe Co. | 64,700 | 234,634 | 81,809 | - | 171,830 |
Toll Brothers, Inc. | 267,344 | - | - | - | 254,105 |
United Natural Foods, Inc. | 116,557 | 24,411 | 11,303 | - | 200,226 |
Total | $ 3,754,691 | $ 466,237 | $ 1,504,578 | $ 38,319 | $ 2,958,563 |
Other Information |
The following is a summary of the inputs used, as of March 31, 2011, involving the Fund's assets and liabilities carried at fair value. The inputs or methodology used for valuing securities may not be an indication of the risk associated with investing in those securities. For more information on valuation inputs, and their aggregation into the levels used in the tables below, please refer to the Security Valuation section in the accompanying Notes to Financial Statements. |
Valuation Inputs at Reporting Date: |
Description
(Amounts in thousands) | Total | Level 1 | Level 2 | Level 3 |
Investments in Securities: | | | | |
Equities: | | | | |
Consumer Discretionary | $ 2,774,696 | $ 2,773,292 | $ 1,404 | $ - |
Consumer Staples | 490,544 | 490,544 | - | - |
Energy | 3,068,656 | 3,068,656 | - | - |
Financials* | 2,425,460 | 2,396,366 | 9,289 | 19,805 |
Health Care | 3,056,857 | 3,056,857 | - | - |
Industrials | 2,187,943 | 2,187,943 | - | - |
Information Technology | 6,300,550 | 6,300,550 | - | - |
Materials | 1,740,290 | 1,740,290 | - | - |
Telecommunication Services | 515,614 | 515,614 | - | - |
Utilities | 67,052 | 67,052 | - | - |
Corporate Bonds | 29,125 | - | 29,125 | - |
Money Market Funds | 635,991 | 635,991 | - | - |
Total Investments in Securities: | $ 23,292,778 | $ 23,233,155 | $ 39,818 | $ 19,805 |
* The Fund has an unfunded commitment of $29,472 outstanding as of period end. |
The following is a reconciliation of Investments in Securities for which Level 3 inputs were used in determining value: |
(Amounts in thousands) | |
Investments in Securities: | |
Beginning Balance | $ - |
Total Realized Gain (Loss) | - |
Total Unrealized Gain (Loss) | (723) |
Cost of Purchases | 20,528 |
Proceeds of Sales | - |
Amortization/Accretion | - |
Transfers in to Level 3 | - |
Transfers out of Level 3 | - |
Ending Balance | $ 19,805 |
The change in unrealized gain (loss) for the period attributable to Level 3 securities held at March 31, 2011 | $ (723) |
The information used in the above reconciliation represents fiscal year to date activity for any Investments in Securities identified as using Level 3 inputs at either the beginning or the end of the current fiscal period. Transfers in or out of Level 3 represent the beginning value of any Security or Instrument where a change in the pricing level occurred from the beginning to the end of the period. The cost of purchases and the proceeds of sales may include securities received or delivered through corporate actions or exchanges. Realized and unrealized gains (losses) disclosed in the reconciliation are included in Net Gain (Loss) on the Fund's Statement of Operations. |
Distribution of investments by country of issue, as a percentage of total net assets, is as follows: (Unaudited) |
United States of America | 76.6% |
Japan | 4.3% |
Canada | 3.7% |
Netherlands | 2.0% |
United Kingdom | 1.6% |
Ireland | 1.6% |
Australia | 1.4% |
Netherlands Antilles | 1.4% |
Switzerland | 1.3% |
Bermuda | 1.2% |
Others (Individually Less Than 1%) | 4.9% |
| 100.0% |
Income Tax Information |
At March 31, 2011, the Fund had a capital loss carryforward of approximately $2,608,735,000 of which $1,147,795,000 and $1,460,940,000 will expire in fiscal 2017 and 2018, respectively. Capital loss carryforwards are only available to offset future capital gains of the Fund to the extent provided by regulations and may be limited. |
See accompanying notes which are an integral part of the financial statements.
Annual Report
Statement of Assets and Liabilities
Amounts in thousands (except per-share amounts) | March 31, 2011 |
| | |
Assets | | |
Investment in securities, at value (including securities loaned of $486,541) - See accompanying schedule: Unaffiliated issuers (cost $15,196,825) | $ 19,698,224 | |
Fidelity Central Funds (cost $635,991) | 635,991 | |
Other affiliated issuers (cost $2,641,531) | 2,958,563 | |
Total Investments (cost $18,474,347) | | $ 23,292,778 |
Cash | | 25 |
Receivable for investments sold | | 143,725 |
Receivable for fund shares sold | | 6,608 |
Dividends receivable | | 23,449 |
Interest receivable | | 73 |
Distributions receivable from Fidelity Central Funds | | 3,742 |
Prepaid expenses | | 33 |
Other receivables | | 1,911 |
Total assets | | 23,472,344 |
| | |
Liabilities | | |
Payable for investments purchased | $ 7,582 | |
Payable for fund shares redeemed | 67,937 | |
Accrued management fee | 6,404 | |
Other affiliated payables | 3,236 | |
Other payables and accrued expenses | 4,198 | |
Collateral on securities loaned, at value | 501,708 | |
Total liabilities | | 591,065 |
| | |
Net Assets | | $ 22,881,279 |
Net Assets consist of: | | |
Paid in capital | | $ 20,683,255 |
Undistributed net investment income | | 21,675 |
Accumulated undistributed net realized gain (loss) on investments and foreign currency transactions | | (2,639,740) |
Net unrealized appreciation (depreciation) on investments and assets and liabilities in foreign currencies | | 4,816,089 |
Net Assets | | $ 22,881,279 |
See accompanying notes which are an integral part of the financial statements.
Annual Report
Financial Statements - continued
Statement of Assets and Liabilities - continued
Amounts in thousands (except per-share amounts) | March 31, 2011 |
| | |
Magellan:
Net Asset Value, offering price and redemption price per share ($19,397,832 ÷ 256,736 shares) | | $ 75.56 |
| | |
Class K:
Net Asset Value, offering price and redemption price per share ($3,483,447 ÷ 46,133 shares) | | $ 75.51 |
See accompanying notes which are an integral part of the financial statements.
Annual Report
Statement of Operations
Amounts in thousands | Year ended March 31, 2011 |
| | |
Investment Income | | |
Dividends (including $38,319 earned from other affiliated issuers) | | $ 261,548 |
Special dividends | | 44,969 |
Interest | | 3,397 |
Income from Fidelity Central Funds | | 13,733 |
Total income | | 323,647 |
| | |
Expenses | | |
Management fee
Basic fee | $ 127,133 | |
Performance adjustment | (38,062) | |
Transfer agent fees | 39,150 | |
Accounting and security lending fees | 1,931 | |
Custodian fees and expenses | 1,265 | |
Independent trustees' compensation | 135 | |
Appreciation in deferred trustee compensation account | 6 | |
Registration fees | 113 | |
Audit | 242 | |
Legal | 102 | |
Interest | 7 | |
Miscellaneous | 298 | |
Total expenses before reductions | 132,320 | |
Expense reductions | (1,354) | 130,966 |
Net investment income (loss) | | 192,681 |
Realized and Unrealized Gain (Loss) Net realized gain (loss) on: | | |
Investment securities: | | |
Unaffiliated issuers | 74,860 | |
Other affiliated issuers | 90,137 | |
Foreign currency transactions | (1,108) | |
Total net realized gain (loss) | | 163,889 |
Change in net unrealized appreciation (depreciation) on: Investment securities | 2,240,124 | |
Assets and liabilities in foreign currencies | 62 | |
Total change in net unrealized appreciation (depreciation) | | 2,240,186 |
Net gain (loss) | | 2,404,075 |
Net increase (decrease) in net assets resulting from operations | | $ 2,596,756 |
See accompanying notes which are an integral part of the financial statements.
Annual Report
Financial Statements - continued
Statement of Changes in Net Assets
Amounts in thousands | Year ended
March 31,
2011 | Year ended
March 31,
2010 |
Increase (Decrease) in Net Assets | | |
Operations | | |
Net investment income (loss) | $ 192,681 | $ 118,442 |
Net realized gain (loss) | 163,889 | 1,072,338 |
Change in net unrealized appreciation (depreciation) | 2,240,186 | 8,226,579 |
Net increase (decrease) in net assets resulting
from operations | 2,596,756 | 9,417,359 |
Distributions to shareholders from net investment income | (183,103) | (144,477) |
Distributions to shareholders from net realized gain | (23,072) | (7,752) |
Total distributions | (206,175) | (152,229) |
Share transactions - net increase (decrease) | (4,632,398) | (2,782,524) |
Total increase (decrease) in net assets | (2,241,817) | 6,482,606 |
| | |
Net Assets | | |
Beginning of period | 25,123,096 | 18,640,490 |
End of period (including undistributed net investment income of $21,675 and undistributed net investment income of $5,945, respectively) | $ 22,881,279 | $ 25,123,096 |
See accompanying notes which are an integral part of the financial statements.
Annual Report
Financial Highlights - Magellan
Years ended March 31, | 2011 | 2010 | 2009 | 2008 | 2007 |
Selected Per-Share Data | | | | | |
Net asset value, beginning of period | $ 67.56 | $ 44.63 | $ 82.26 | $ 91.32 | $ 112.80 |
Income from Investment Operations | | | | | |
Net investment income (loss) B | .56 E | .29 | .32 | .34 | .37 |
Net realized and unrealized gain (loss) | 8.05 | 23.02 | (34.98) | 2.72 | 3.31 |
Total from investment operations | 8.61 | 23.31 | (34.66) | 3.06 | 3.68 |
Distributions from net investment income | (.54) | (.36) | (.11) | (.44) | (.50) |
Distributions from net realized gain | (.07) | (.02) | (2.86) | (11.68) | (24.66) |
Total distributions | (.61) | (.38) | (2.97) | (12.12) | (25.16) |
Net asset value, end of period | $ 75.56 | $ 67.56 | $ 44.63 | $ 82.26 | $ 91.32 |
Total Return A | 12.82% | 52.33% | (43.81)% | 2.08% | 3.21% |
Ratios to Average Net Assets C, F | | | | | |
Expenses before reductions | .60% | .75% | .71% | .73% | .54% |
Expenses net of fee waivers, if any | .60% | .75% | .71% | .73% | .54% |
Expenses net of all reductions | .59% | .74% | .71% | .72% | .53% |
Net investment income (loss) | .83% E | .49% | .51% | .37% | .41% |
Supplemental Data | | | | | |
Net assets, end of period (in millions) | $ 19,398 | $ 22,628 | $ 17,225 | $ 38,322 | $ 43,155 |
Portfolio turnover rate D | 42% | 39% | 67% | 57% | 41% |
A Total returns would have been lower had certain expenses not been reduced during the periods shown.
B Calculated based on average shares outstanding during the period.
C Fees and expenses of the underlying Fidelity Central Funds are not included in the Fund's expense ratio. The Fund indirectly bears its proportionate share of the expenses of any underlying Fidelity Central Funds.
D Amount does not include the portfolio activity of any underlying Fidelity Central Funds.
E Investment income per share reflects a special dividend which amounted to $.13 per share. Excluding the special dividend, the ratio of net investment income (loss) to average net assets would have been .63%.
F Expense ratios reflect operating expenses of the class. Expenses before reductions do not reflect amounts reimbursed by the investment adviser or reductions from brokerage service arrangements or reductions from other expense offset arrangements and do not represent the amount paid by the class during periods when reimbursements or reductions occur. Expenses net of fee waivers reflect expenses after reimbursement by the investment adviser but prior to reductions from brokerage service arrangements or other expense offset arrangements. Expenses net of all reductions represent the net expenses paid by the class.
See accompanying notes which are an integral part of the financial statements.
Annual Report
Financial Highlights - Class K
Years ended March 31, | 2011 | 2010 | 2009 H |
Selected Per-Share Data | | | |
Net asset value, beginning of period | $ 67.53 | $ 44.61 | $ 85.82 |
Income from Investment Operations | | | |
Net investment income (loss) D | .65 G | .38 | .30 |
Net realized and unrealized gain (loss) | 8.04 | 23.02 | (41.32) |
Total from investment operations | 8.69 | 23.40 | (41.02) |
Distributions from net investment income | (.64) | (.46) | (.19) |
Distributions from net realized gain | (.07) | (.02) | - |
Total distributions | (.71) | (.48) | (.19) |
Net asset value, end of period | $ 75.51 | $ 67.53 | $ 44.61 |
Total Return B, C | 12.97% | 52.59% | (47.79)% |
Ratios to Average Net Assets E, I | | | |
Expenses before reductions | .46% | .59% | .55% A |
Expenses net of fee waivers, if any | .46% | .59% | .55% A |
Expenses net of all reductions | .46% | .58% | .55% A |
Net investment income (loss) | .97% G | .65% | .79% A |
Supplemental Data | | | |
Net assets, end of period (in millions) | $ 3,483 | $ 2,495 | $ 1,415 |
Portfolio turnover rate F | 42% | 39% | 67% |
A Annualized
B Total returns for periods of less than one year are not annualized.
C Total returns would have been lower had certain expenses not been reduced during the periods shown.
D Calculated based on average shares outstanding during the period.
E Fees and expenses of the underlying Fidelity Central Funds are not included in the Fund's expense ratio. The Fund indirectly bears its proportionate share of the expenses of any underlying Fidelity Central Funds.
F Amount does not include the portfolio activity of any underlying Fidelity Central Funds.
G Investment income per share reflects a special dividend which amounted to $.13 per share. Excluding the special dividend, the ratio of net investment income (loss) to average net assets would have been .77%.
H For the period May 9, 2008 (commencement of sale of shares) to March 31, 2009.
I Expense ratios reflect operating expenses of the class. Expenses before reductions do not reflect amounts reimbursed by the investment adviser or reductions from brokerage service arrangements or reductions from other expense offset arrangements and do not represent the amount paid by the class during periods when reimbursements or reductions occur. Expense ratios before reductions for start-up periods may not be representative of longer-term operating periods. Expenses net of fee waivers reflect expenses after reimbursement by the investment adviser but prior to reductions from brokerage service arrangements or other expense offset arrangements. Expenses net of all reductions represent the net expenses paid by the class.
See accompanying notes which are an integral part of the financial statements.
Annual Report
Notes to Financial Statements
For the period ended March 31, 2011
(Amounts in thousands except ratios)
1. Organization.
Fidelity Magellan Fund (the Fund) is a fund of Fidelity Magellan Fund (the Trust) and is authorized to issue an unlimited number of shares. The Trust is registered under the Investment Company Act of 1940, as amended (the 1940 Act), as an open-end management investment company organized as a Massachusetts business trust. The Fund offers Magellan and Class K shares, each of which has equal rights as to assets and voting privileges. Each class has exclusive voting rights with respect to matters that affect that class. Investment income, realized and unrealized capital gains and losses, the common expenses of the Fund, and certain fund-level expense reductions, if any, are allocated on a pro-rata basis to each class based on the relative net assets of each class to the total net assets of the Fund. Each class differs with respect to transfer agent fees incurred. Certain expense reductions may also differ by class.
2. Investments in Fidelity Central Funds.
The Fund invests in Fidelity Central Funds, which are open-end investment companies available only to other investment companies and accounts managed by Fidelity Management & Research Company (FMR) and its affiliates. The Fund's Schedule of Investments lists each of the Fidelity Central Funds held as of period end, if any, as an investment of the Fund, but does not include the underlying holdings of each Fidelity Central Fund. As an Investing Fund, the Fund indirectly bears its proportionate share of the expenses of the underlying Fidelity Central Funds.
The Money Market Central Funds seek preservation of capital and current income and are managed by Fidelity Investments Money Management, Inc. (FIMM), an affiliate of FMR.
A complete unaudited list of holdings for each Fidelity Central Fund is available upon request or at the Securities and Exchange Commission (the SEC) web site at www.sec.gov. In addition, the financial statements of the Fidelity Central Funds, which are not covered by the Fund's Report of Independent Registered Public Accounting Firm, are available on the SEC web site or upon request.
3. Significant Accounting Policies.
The financial statements have been prepared in conformity with accounting principles generally accepted in the United States of America (GAAP), which require management to make certain estimates and assumptions at the date of the financial statements. Actual results could differ from those estimates. Subsequent events, if any, through the date that the financial statements were issued have been evaluated in the preparation of the financial statements. The following summarizes the significant accounting policies of the Fund:
Annual Report
Notes to Financial Statements - continued
(Amounts in thousands except ratios)
3. Significant Accounting Policies - continued
Security Valuation. Investments are valued as of 4:00 p.m. Eastern time on the last calendar day of the period. The Fund uses independent pricing services approved by the Board of Trustees to value its investments. When current market prices or quotations are not readily available or reliable, valuations may be determined in good faith in accordance with procedures adopted by the Board of Trustees. Factors used in determining value may include market or security specific events, changes in interest rates and credit quality. The frequency with which these procedures are used cannot be predicted and they may be utilized to a significant extent. The value used for net asset value (NAV) calculation under these procedures may differ from published prices for the same securities.
The Fund categorizes the inputs to valuation techniques used to value its investments into a disclosure hierarchy consisting of three levels as shown below.
Level 1 - quoted prices in active markets for identical investments
Level 2 - other significant observable inputs (including quoted prices for similar investments, interest rates, prepayment speeds, etc.)
Level 3 - unobservable inputs (including the Fund's own assumptions based on the best information available)
Changes in valuation techniques may result in transfers in or out of an assigned level within the disclosure hierarchy. The aggregate value of investments by input level, as of March 31, 2011, as well as a roll forward of Level 3 securities, is included at the end of the Fund's Schedule of Investments. Valuation techniques used to value the Fund's investments by major category are as follows.
Equity securities, including restricted securities, for which market quotations are readily available, are valued at the last reported sale price or official closing price as reported by an independent pricing service on the primary market or exchange on which they are traded and are categorized as Level 1 in the hierarchy. In the event there were no sales during the day or closing prices are not available, securities are valued at the last quoted bid price or may be valued using the last available price and are generally categorized as Level 2 in the hierarchy. For foreign equity securities, when significant market or security specific events arise, comparisons to the valuation of American Depositary Receipts (ADRs), futures contracts, Exchange-traded funds (ETFs) and certain indexes as well as quoted prices for similar securities are used and are categorized as Level 2 in the hierarchy in these circumstances. Utilizing these techniques may result in transfers between Level 1 and Level 2. For restricted equity securities and private placements where observable inputs are limited, assumptions about market activity and risk are used and are categorized as Level 3 in the hierarchy.
Annual Report
3. Significant Accounting Policies - continued
Security Valuation - continued
Debt securities, including restricted securities, are valued based on evaluated prices received from independent pricing services or from dealers who make markets in such securities. For corporate bonds, pricing services utilize matrix pricing which considers yield or price of bonds of comparable quality, coupon, maturity and type as well as dealer supplied prices and are generally categorized as Level 2 in the hierarchy.
When independent prices are unavailable or unreliable, debt securities may be valued utilizing pricing matrices which consider similar factors that would be used by independent pricing services. These are generally categorized as Level 2 in the hierarchy but may be Level 3 depending on the circumstances.
Investments in open-end mutual funds, including the Fidelity Central Funds, are valued at their closing net asset value each business day and are categorized as Level 1 in the hierarchy.
Foreign Currency. The Fund may use foreign currency contracts to facilitate transactions in foreign-denominated securities. Gains and losses from these transactions may arise from changes in the value of the foreign currency or if the counterparties do not perform under the contracts' terms.
Foreign-denominated assets, including investment securities, and liabilities are translated into U.S. dollars at the exchange rate at period end. Purchases and sales of investment securities, income and dividends received and expenses denominated in foreign currencies are translated into U.S. dollars at the exchange rate in effect on the transaction date.
The effects of exchange rate fluctuations on investments are included with the net realized and unrealized gain (loss) on investment securities. Other foreign currency transactions resulting in realized and unrealized gain (loss) are disclosed separately.
Investment Transactions and Income. For financial reporting purposes, the Fund's investment holdings and NAV include trades executed through the end of the last business day of the period. The NAV per share for processing shareholder transactions is calculated as of the close of business of the New York Stock Exchange (NYSE), normally 4:00 p.m. Eastern time and includes trades executed through the end of the prior business day. Gains and losses on securities sold are determined on the basis of identified cost and may include proceeds received from litigation. Dividend income is recorded on the ex-dividend date, except for certain dividends from foreign securities where the ex-dividend date may have passed, which are recorded as soon as the Fund is informed of the ex-dividend date. Non-cash dividends included in dividend income, if any, are recorded at the fair market value of the securities received. Distributions received on
Annual Report
Notes to Financial Statements - continued
(Amounts in thousands except ratios)
3. Significant Accounting Policies - continued
Investment Transactions and Income - continued
securities that represent a return of capital or capital gain are recorded as a reduction of cost of investments and/or as a realized gain. The Fund estimates the components of distributions received that may be considered return of capital distributions or capital gain distributions. Large, non-recurring dividends recognized by the Fund are presented separately on the Statement of Operations as "Special Dividends" and the impact of these dividends is presented in the Financial Highlights. Interest income and distributions from the Fidelity Central Funds are accrued as earned. Interest income includes coupon interest and amortization of premium and accretion of discount on debt securities. Investment income is recorded net of foreign taxes withheld where recovery of such taxes is uncertain.
Expenses. Expenses directly attributable to a fund are charged to that fund. Expenses attributable to more than one fund are allocated among the respective funds on the basis of relative net assets or other appropriate methods. Expense estimates are accrued in the period to which they relate and adjustments are made when actual amounts are known.
Deferred Trustee Compensation. Under a Deferred Compensation Plan (the Plan), independent Trustees may elect to defer receipt of a portion of their annual compensation. Deferred amounts are invested in a cross-section of Fidelity funds, are marked-to-market and remain in the Fund until distributed in accordance with the Plan. The investment of deferred amounts and the offsetting payable to the Trustees are included in the accompanying Statement of Assets and Liabilities.
Income Tax Information and Distributions to Shareholders. Each year the Fund intends to qualify as a regulated investment company, including distributing substantially all of its taxable income and realized gains under Subchapter M of the Internal Revenue Code and filing its U.S. federal tax return. As a result, no provision for income taxes is required. As of March 31, 2011, the Fund did not have any unrecognized tax benefits in the accompanying financial statements. A fund's federal tax return is subject to examination by the Internal Revenue Service (IRS) for a period of three years. Foreign taxes are provided for based on the Fund's understanding of the tax rules and rates that exist in the foreign markets in which it invests.
Distributions are declared and recorded on the ex-dividend date. Income dividends and capital gain distributions are declared separately for each class. Income and capital gain distributions are determined in accordance with income tax regulations, which may differ from GAAP.
Capital accounts within the financial statements are adjusted for permanent book-tax differences. These adjustments have no impact on net assets or the results of operations. Temporary book-tax differences will reverse in a subsequent period.
Annual Report
3. Significant Accounting Policies - continued
Income Tax Information and Distributions to Shareholders - continued
Book-tax differences are primarily due to foreign currency transactions, equity-debt classifications, passive foreign investment companies (PFIC), partnerships, deferred trustees compensation, capital loss carryforwards and losses deferred due to wash sales and excise tax regulations.
The federal tax cost of investment securities and unrealized appreciation (depreciation) as of period end were as follows:
Gross unrealized appreciation | $ 5,711,766 |
Gross unrealized depreciation | (930,295) |
Net unrealized appreciation (depreciation) on securities and other investments | $ 4,781,471 |
| |
Tax Cost | $ 18,511,307 |
The tax-based components of distributable earnings as of period end were as follows:
Undistributed ordinary income | $ 32,020 |
Capital loss carryforward | $ (2,608,735) |
Net unrealized appreciation (depreciation) | $ 4,781,573 |
The tax character of distributions paid was as follows:
| March 31, 2011 | March 31, 2010 |
Ordinary Income | $ 206,175 | $ 152,229 |
4. Operating Policies.
Restricted Securities. The Fund may invest in securities that are subject to legal or contractual restrictions on resale. These securities generally may be resold in transactions exempt from registration or to the public if the securities are registered. Disposal of these securities may involve time-consuming negotiations and expense, and prompt sale at an acceptable price may be difficult. Information regarding restricted securities is included at the end of the Fund's Schedule of Investments.
5. Purchases and Sales of Investments.
Purchases and sales of securities, other than short-term securities, aggregated $9,532,175 and $14,237,879, respectively.
Annual Report
Notes to Financial Statements - continued
(Amounts in thousands except ratios)
6. Fees and Other Transactions with Affiliates.
Management Fee. FMR and its affiliates provide the Fund with investment management related services for which the Fund pays a monthly management fee. The management fee is the sum of an individual fund fee rate that is based on an annual rate of .30% of the Fund's average net assets and a group fee rate that averaged .26% during the period. The group fee rate is based upon the average net assets of all the mutual funds advised by FMR. The group fee rate decreases as assets under management increase and increases as assets under management decrease. In addition, the management fee is subject to a performance adjustment (up to a maximum of ± .20% of the Fund's average net assets over a 36 month performance period). The upward or downward adjustment to the management fee is based on the relative investment performance of the retail class of the Fund, Magellan, as compared to an appropriate benchmark index. For the period, the total annual management fee rate, including the performance adjustment, was .39% of the Fund's average net assets.
Transfer Agent Fees. Fidelity Investments Institutional Operations Company, Inc. (FIIOC), an affiliate of FMR, is the transfer, dividend disbursing and shareholder servicing agent for each class of the Fund. FIIOC receives account fees and asset-based fees that vary according to the account size and type of account of the shareholders of Magellan. FIIOC receives an asset-based fee of Class K's average net assets. FIIOC pays for typesetting, printing and mailing of shareholder reports, except proxy statements. For the period, transfer agent fees for each class were as follows:
| Amount | % of
Average
Net Assets |
Magellan | $ 37,641 | .19 |
Class K | 1,509 | .05 |
| $ 39,150 | |
Accounting and Security Lending Fees. Fidelity Service Company, Inc. (FSC), an affiliate of FMR, maintains the Fund's accounting records. The accounting fee is based on the level of average net assets for the month. Under a separate contract, FSC administers the security lending program. The security lending fee is based on the number and duration of lending transactions.
Brokerage Commissions. The Fund placed a portion of its portfolio transactions with brokerage firms which are affiliates of the investment adviser. The commissions paid to these affiliated firms were $459 for the period.
Annual Report
6. Fees and Other Transactions with Affiliates - continued
Interfund Lending Program. Pursuant to an Exemptive Order issued by the SEC, the Fund, along with other registered investment companies having management contracts with FMR, may participate in an interfund lending program. This program provides an alternative credit facility allowing the funds to borrow from, or lend money to, other participating affiliated funds. At period end, there were no interfund loans outstanding.
The Fund's activity in this program during the period for which loans were outstanding was as follows:
Borrower or Lender | Average Daily
Loan Balance | Weighted Average
Interest Rate | Interest Expense |
Borrower | $ 19,176 | .44% | $ 7 |
7. Committed Line of Credit.
The Fund participates with other funds managed by FMR or an affiliate in a $4.0 billion credit facility (the "line of credit") to be utilized for temporary or emergency purposes to fund shareholder redemptions or for other short-term liquidity purposes. The Fund has agreed to pay commitment fees on its pro-rata portion of the line of credit, which amounted to $84 and is reflected in Miscellaneous expenses on the Statement of Operations. During the period, there were no borrowings on this line of credit.
8. Security Lending.
The Fund lends portfolio securities through a lending agent from time to time in order to earn additional income. The lending agent may loan securities to certain qualified borrowers, including Fidelity Capital Markets (FCM), a broker-dealer affiliated with the Fund. On the settlement date of the loan, the Fund receives collateral (in the form of U.S. Treasury obligations, letters of credit and/or cash) against the loaned securities and maintains collateral in an amount not less than 100% of the market value of the loaned securities during the period of the loan. The market value of the loaned securities is determined at the close of business of the Fund and any additional required collateral is delivered to the Fund on the next business day. If the borrower defaults on its obligation to return the securities loaned because of insolvency or other reasons, a fund could experience delays and costs in recovering the securities loaned or in gaining access to the collateral. Any cash collateral received is invested in the Fidelity Securities Lending Cash Central Fund. The value of loaned securities and cash collateral at period end are disclosed on the Fund's Statement of Assets and Liabilities. The value of securities
Annual Report
Notes to Financial Statements - continued
(Amounts in thousands except ratios)
8. Security Lending - continued
loaned to FCM at period end was $1,529. Security lending income represents the income earned on investing cash collateral, less rebates paid to borrowers and lending agent fees associated with the loan, plus any premium payments received for lending certain types of securities. Security lending income is presented in the Statement of Operations as a component of income from Fidelity Central Funds. Total security lending income during the period amounted to $13,506 (including $65 from securities loaned to FCM).
9. Expense Reductions.
Many of the brokers with whom FMR places trades on behalf of the Fund provided services to the Fund in addition to trade execution. These services included payments of certain expenses on behalf of the Fund totaling $1,354 for the period.
10. Distributions to Shareholders.
Distributions to shareholders of each class were as follows:
Years ended March 31, | 2011 | 2010 |
From net investment income | | |
Magellan | $ 155,880 | $ 129,094 |
Class K | 27,223 | 15,383 |
Total | $ 183,103 | $ 144,477 |
From net realized gain | | |
Magellan | $ 20,450 | $ 7,077 |
Class K | 2,622 | 675 |
Total | $ 23,072 | $ 7,752 |
11. Share Transactions.
Transactions for each class of shares were as follows:
| Shares | Dollars |
Years ended March 31, | 2011 | 2010 A | 2011 | 2010 A |
Magellan | | | | |
Shares sold | 13,052 | 26,864 | $ 874,215 | $ 1,552,256 |
Conversion to Class K | - | (1,822) | - | (100,116) |
Reinvestment of distributions | 2,460 | 2,192 | 169,801 | 131,844 |
Shares redeemed | (93,705) | (78,300) | (6,286,234) | (4,681,107) |
Net increase (decrease) | (78,193) | (51,066) | $ (5,242,218) | $ (3,097,123) |
Annual Report
11. Share Transactions - continued
| Shares | Dollars |
Years ended March 31, | 2011 | 2010 A | 2011 | 2010 A |
Class K | | | | |
Shares sold | 21,632 | 10,666 | $ 1,466,317 | $ 656,513 |
Conversion from Magellan | - | 1,823 | - | 100,116 |
Reinvestment of distributions | 432 | 266 | 29,845 | 16,058 |
Shares redeemed | (12,884) | (7,530) | (886,342) | (458,088) |
Net increase (decrease) | 9,180 | 5,225 | $ 609,820 | $ 314,599 |
A Conversion transactions for Class K and Magellan are presented for the period April 1, 2009 through August 31, 2009.
12. Other.
The Fund's organizational documents provide former and current trustees and officers with a limited indemnification against liabilities arising in connection with the performance of their duties to the Fund. In the normal course of business, the Fund may also enter into contracts that provide general indemnifications. The Fund's maximum exposure under these arrangements is unknown as this would be dependent on future claims that may be made against the Fund. The risk of material loss from such claims is considered remote.
Annual Report
To the Trustees and Shareholders of Fidelity Magellan Fund:
In our opinion, the accompanying statement of assets and liabilities, including the schedule of investments, and the related statements of operations and of changes in net assets and the financial highlights present fairly, in all material respects, the financial position of Fidelity Magellan Fund at March 31, 2011 the results of its operations for the year then ended, the changes in its net assets for each of the two years in the period then ended and the financial highlights for each of the periods indicated, in conformity with accounting principles generally accepted in the United States of America. These financial statements and financial highlights (hereafter referred to as "financial statements") are the responsibility of the Fidelity Magellan Fund's management. Our responsibility is to express an opinion on these financial statements based on our audits. We conducted our audits of these financial statements in accordance with the standards of the Public Company Accounting Oversight Board (United States). Those standards require that we plan and perform the audit to obtain reasonable assurance about whether the financial statements are free of material misstatement. An audit includes examining, on a test basis, evidence supporting the amounts and disclosures in the financial statements, assessing the accounting principles used and significant estimates made by management, and evaluating the overall financial statement presentation. We believe that our audits, which included confirmation of securities at March 31, 2011 by correspondence with the custodian and brokers, provide a reasonable basis for our opinion.
/s/ PricewaterhouseCoopers LLP
PricewaterhouseCoopers LLP
Boston, Massachusetts
May 12, 2011
Annual Report
The Trustees, Members of the Advisory Board, and executive officers of the trust and fund, as applicable, are listed below. The Board of Trustees governs the fund and is responsible for protecting the interests of shareholders. The Trustees are experienced executives who meet periodically throughout the year to oversee the fund's activities, review contractual arrangements with companies that provide services to the fund, oversee management of the risks associated with such activities and contractual arrangements, and review the fund's performance. Except for James C. Curvey, each of the Trustees oversees 219 funds advised by FMR or an affiliate. Mr. Curvey oversees 410 funds advised by FMR or an affiliate.
The Trustees hold office without limit in time except that (a) any Trustee may resign; (b) any Trustee may be removed by written instrument, signed by at least two-thirds of the number of Trustees prior to such removal; (c) any Trustee who requests to be retired or who has become incapacitated by illness or injury may be retired by written instrument signed by a majority of the other Trustees; and (d) any Trustee may be removed at any special meeting of shareholders by a two-thirds vote of the outstanding voting securities of the trust. Each Trustee who is not an interested person (as defined in the 1940 Act) (Independent Trustee), shall retire not later than the last day of the calendar year in which his or her 75th birthday occurs. The Independent Trustees may waive this mandatory retirement age policy with respect to individual Trustees. The executive officers and Advisory Board Members hold office without limit in time, except that any officer and Advisory Board Member may resign or may be removed by a vote of a majority of the Trustees at any regular meeting or any special meeting of the Trustees. Except as indicated, each individual has held the office shown or other offices in the same company for the past five years.
Experience, Skills, Attributes, and Qualifications of the Fund's Trustees. The Governance and Nominating Committee has adopted a statement of policy that describes the experience, qualifications, attributes, and skills that are necessary and desirable for potential Independent Trustee candidates (Statement of Policy). The Board believes that each Trustee satisfied at the time he or she was initially elected or appointed a Trustee, and continues to satisfy, the standards contemplated by the Statement of Policy. The Governance and Nominating Committee also engages professional search firms to help identify potential Independent Trustee candidates who have the experience, qualifications, attributes, and skills consistent with the Statement of Policy. From time to time, additional criteria based on the composition and skills of the current Independent Trustees, as well as experience or skills that may be appropriate in light of future changes to board composition, business conditions, and regulatory or other developments, have also been considered by the professional search firms and the Governance and Nominating Committee. In addition, the Board takes into account the Trustees' commitment and participation in Board and committee meetings, as well as their leadership of standing and ad hoc committees throughout their tenure.
In determining that a particular Trustee was and continues to be qualified to serve as a Trustee, the Board has considered a variety of criteria, none of which, in isolation, was controlling. The Board believes that, collectively, the Trustees have balanced and diverse experience, qualifications, attributes, and skills, which allow the Board to operate effectively in governing the fund and protecting the interests of shareholders. Information about the specific experience, skills, attributes, and qualifications of each Trustee, which in each case led to the Board's conclusion that the Trustee should serve (or continue to serve) as a trustee of the fund, is provided below.
Annual Report
Trustees and Officers - continued
Board Structure and Oversight Function. James C. Curvey is an interested person (as defined in the 1940 Act) and currently serves as Acting Chairman. The Trustees have determined that an interested Chairman is appropriate and benefits shareholders because an interested Chairman has a personal and professional stake in the quality and continuity of services provided to the fund. Independent Trustees exercise their informed business judgment to appoint an individual of their choosing to serve as Chairman, regardless of whether the Trustee happens to be independent or a member of management. The Independent Trustees have determined that they can act independently and effectively without having an Independent Trustee serve as Chairman and that a key structural component for assuring that they are in a position to do so is for the Independent Trustees to constitute a substantial majority for the Board. The Independent Trustees also regularly meet in executive session. Ned C. Lautenbach serves as Chairman of the Independent Trustees and as such (i) acts as a liaison between the Independent Trustees and management with respect to matters important to the Independent Trustees and (ii) with management prepares agendas for Board meetings.
Fidelity funds are overseen by different Boards of Trustees. The fund's Board oversees Fidelity's equity and high income funds and another Board oversees Fidelity's investment-grade bond, money market, and asset allocation funds. The asset allocation funds may invest in Fidelity funds overseen by the fund's Board. The use of separate Boards, each with its own committee structure, allows the Trustees of each group of Fidelity funds to focus on the unique issues of the funds they oversee, including common research, investment, and operational issues. On occasion, the separate Boards establish joint committees to address issues of overlapping consequences for the Fidelity funds overseen by each Board.
The Trustees operate using a system of committees to facilitate the timely and efficient consideration of all matters of importance to the Trustees, the fund, and fund shareholders and to facilitate compliance with legal and regulatory requirements and oversight of the fund's activities and associated risks. The Board, acting through its committees, has charged FMR and its affiliates with (i) identifying events or circumstances the occurrence of which could have demonstrably adverse effects on the fund's business and/or reputation; (ii) implementing processes and controls to lessen the possibility that such events or circumstances occur or to mitigate the effects of such events or circumstances if they do occur; and (iii) creating and maintaining a system designed to evaluate continuously business and market conditions in order to facilitate the identification and implementation processes described in (i) and (ii) above. Because the day-to-day operations and activities of the fund are carried out by or through FMR, its affiliates and other service providers, the fund's exposure to risks is mitigated but not eliminated by the processes overseen by the Trustees. While each of the Board's committees has responsibility for overseeing different aspects of the fund's activities, oversight is exercised primarily through the Operations, Audit, and Compliance Committees. Appropriate personnel, including but not limited to the fund's Chief Compliance Officer (CCO), FMR's internal auditor, the independent accountants, the fund's Treasurer and portfolio management personnel, make periodic reports to the Board's committees, as appropriate. The responsibilities of each committee, including their oversight responsibilities, are described further under "Standing Committees of the Fund's Trustees."
Annual Report
The fund's Statement of Additional Information (SAI) includes more information about the Trustees. To request a free copy, call Fidelity at 1-800-835-5092.
Interested Trustees*:
Correspondence intended for each Trustee who is an interested person may be sent to Fidelity Investments, 82 Devonshire Street, Boston, Massachusetts 02109.
Name, Age; Principal Occupations and Other Relevant Experience+ |
James C. Curvey (75) |
| Year of Election or Appointment: 2007
Mr. Curvey is Trustee and Acting Chairman of the Board of Trustees of certain Trusts. Mr. Curvey also serves as Trustee (2007-present) of other investment companies advised by FMR. Mr. Curvey is a Director of Fidelity Investments Money Management, Inc. (2009-present), Director of Fidelity Research & Analysis Co. (2009-present) and Director of FMR and FMR Co., Inc. (2007-present). Mr. Curvey is also Vice Chairman (2007-present) and Director of FMR LLC. In addition, Mr. Curvey serves as an Overseer for the Boston Symphony Orchestra and a member of the Trustees of Villanova University. Previously, Mr. Curvey was the Vice Chairman (2006-2007) and Director (2000-2007) of FMR Corp. |
Ronald P. O'Hanley (54) |
| Year of Election or Appointment: 2011
Mr. O'Hanley is President of Fidelity Asset Management and Corporate Services and a member of Fidelity's Executive Committee (2010-present). Previously, Mr. O'Hanley served as President and Chief Executive Officer of BNY Mellon Asset Management (2007-2010). Mr. O'Hanley also served as Vice Chairman of Bank New York Mellon Corp. and a member of that firm's Executive Committee. Prior to the 2007 merger of The Bank of New York and Mellon Financial Corporation, he was Vice Chairman of Mellon Financial Corporation and President and Chief Executive Officer of Mellon Asset Management. He joined Mellon in February 1997. Mr. O'Hanley currently serves as Chairman of the Boston Public Library Foundation Board of Directors and sits on the Board of Directors of Beth Israel Deaconess Medical Center, the Board of Trustees of the Marine Biological Laboratory and the Advisory Board of the Maxwell School of Citizenship and Public Administration at Syracuse University. Mr. O'Hanley also chairs the Council on Asset Management for the Financial Services Roundtable and is a member of the Board of Directors of Institutional Investor's U.S. Institute. |
* Trustees have been determined to be "Interested Trustees" by virtue of, among other things, their affiliation with the trust or various entities under common control with FMR.
+ The information above includes each Trustee's principal occupation during the last five years and other information relating to the experience, attributes, and skills relevant to each Trustee's qualifications to serve as a Trustee, which led to the conclusion that each Trustee should serve as a Trustee for the fund.
Annual Report
Independent Trustees:
Correspondence intended for each Independent Trustee (that is, the Trustees other than the Interested Trustees) may be sent to Fidelity Investments, P.O. Box 55235, Boston, Massachusetts 02205-5235.
Name, Age; Principal Occupations and Other Relevant Experience+ |
Dennis J. Dirks (62) |
| Year of Election or Appointment: 2005 Prior to his retirement in May 2003, Mr. Dirks was Chief Operating Officer and a member of the Board of The Depository Trust & Clearing Corporation (DTCC). He also served as President, Chief Operating Officer, and Board member of The Depository Trust Company (DTC) and President and Board member of the National Securities Clearing Corporation (NSCC). In addition, Mr. Dirks served as Chief Executive Officer and Board member of the Government Securities Clearing Corporation, Chief Executive Officer and Board member of the Mortgage-Backed Securities Clearing Corporation, as a Trustee and a member of the Finance Committee of Manhattan College (2005-2008), and as a Trustee and a member of the Finance Committee of AHRC of Nassau County (2006-2008). Mr. Dirks is a member of the Independent Directors Council (IDC) Governing Council (2010-Present) and Board of Directors for The Brookville Center for Children's Services, Inc. (2009-present). |
Alan J. Lacy (57) |
| Year of Election or Appointment: 2008 Mr. Lacy serves as Senior Adviser (2007-present) of Oak Hill Capital Partners, L.P. (private equity). Mr. Lacy also served as Chief Executive Officer (2000-2005) and Vice Chairman (2005-2006) of Sears Holdings Corporation and Sears, Roebuck and Co. (retail). In addition, Mr. Lacy serves as a member of the Board of Directors of Dave & Buster's, Inc. (restaurant and entertainment complexes, 2010-present), The Hillman Companies, Inc. (hardware wholesalers, 2010-present), and Bristol-Myers Squibb Company (global pharmaceuticals, 2007-present). Mr. Lacy is a member of the Board of Trustees of The National Parks Conservation Association (2006-present). Previously, Mr. Lacy served as Chairman of the Board of Trustees of the National Parks Conservation Association (2008-2011) and as a member of the Board of Directors for the Western Union Company (global money transfer, 2006-2011). |
Ned C. Lautenbach (67) |
| Year of Election or Appointment: 2000 Mr. Lautenbach is Chairman of the Independent Trustees of the Equity and High Income Funds (2006-present). Mr. Lautenbach currently serves as the Lead Director of the Eaton Corporation Board of Directors (diversified industrial, 1997-present). Mr. Lautenbach is also a member of the Board of Directors of the Philharmonic Center for the Arts in Naples, Florida (1999-present); a member of the Board of Trustees of Fairfield University (2005-present); and a member of the Council on Foreign Relations (1994-present). Previously, Mr. Lautenbach was a Partner/Advisory Partner at Clayton, Dubilier & Rice, LLC (private equity investment, 1998-2010), as well as a Director of Sony Corporation (2006-2007). |
Joseph Mauriello (66) |
| Year of Election or Appointment: 2008 Prior to his retirement in January 2006, Mr. Mauriello served in numerous senior management positions including Deputy Chairman and Chief Operating Officer (2004-2005), and Vice Chairman of Financial Services (2002-2004) of KPMG LLP US (professional services, 1965-2005). Mr. Mauriello currently serves as a member of the Board of Directors of XL Group plc. (global insurance and re-insurance, 2006-present) and of Arcadia Resources Inc. (health care services and products, 2007-present). Previously, Mr. Mauriello served as a Director of the Hamilton Funds of the Bank of New York (2006-2007). |
Cornelia M. Small (66) |
| Year of Election or Appointment: 2005 Ms. Small is a member of the Board of Directors of the Teagle Foundation (2009-present). Ms. Small is also a member of the Investment Committee, and Chair (2008-present) and a member of the Board of Trustees of Smith College. In addition, Ms. Small serves on the Investment Committee of the Berkshire Taconic Community Foundation (2008-present). Previously, Ms. Small served as Chairperson of the Investment Committee (2002-2008) of Smith College. In addition, Ms. Small served as Chief Investment Officer, Director of Global Equity Investments, and a member of the Board of Directors of Scudder, Stevens & Clark and Scudder Kemper Investments. |
William S. Stavropoulos (71) |
| Year of Election or Appointment: 2001 Mr. Stavropoulos is Vice Chairman of the Independent Trustees of the Equity and High Income Funds (2006-present). Mr. Stavropoulos serves as President and Founder of the Michigan Baseball Foundation, the Great Lakes Loons (2007-present). Mr. Stavropoulos is Chairman Emeritus of the Board of Directors of The Dow Chemical Company, where he previously served in numerous senior management positions, including President, CEO (1995-2000; 2002-2004), Chairman of the Executive Committee (2000-2006), and as a member of the Board of Directors (1990-2006). Currently, Mr. Stavropoulos is Chairman of Univar (global distributor of commodity and specialty chemicals, 2010-present), a Director of Teradata Corporation (data warehousing and technology solutions, 2008-present), Chemical Financial Corporation, Maersk Inc. (industrial conglomerate), Tyco International, Inc. (multinational manufacturing and services, 2007-present), and a member of the Advisory Board for Metalmark Capital (private equity investment, 2005-present). Mr. Stavropoulos is a special advisor to Clayton, Dubilier & Rice, LLC (private equity investment). In addition, Mr. Stavropoulos is a member of the University of Notre Dame Advisory Council for the College of Science. |
David M. Thomas (61) |
| Year of Election or Appointment: 2008 Previously, Mr. Thomas served as Executive Chairman (2005-2006) and Chairman and Chief Executive Officer (2000-2005) of IMS Health, Inc. (pharmaceutical and healthcare information solutions). In addition, Mr. Thomas serves as a member of the Board of Directors of Fortune Brands, Inc. (consumer products), and Interpublic Group of Companies, Inc. (marketing communication, 2004-present). |
Michael E. Wiley (60) |
| Year of Election or Appointment: 2008 Mr. Wiley also serves as a Director of Asia Pacific Exploration Consolidated (international oil and gas exploration and production, 2008-present). Mr. Wiley serves as a Director of Tesoro Corporation (independent oil refiner and marketer, 2005-present), and a Director of Bill Barrett Corporation (exploration and production, 2005-present). In addition, Mr. Wiley also serves as a Director of Post Oak Bank (privately-held bank, 2004-present). Previously, Mr. Wiley served as a member of the Board of Trustees of the University of Tulsa (2000-2006; 2007-2010), as a Senior Energy Advisor of Katzenbach Partners, LLC (consulting, 2006-2007), as an Advisory Director of Riverstone Holdings (private investment), Chairman, President, and CEO of Baker Hughes, Inc. (oilfield services, 2000-2004), and as Director of Spinnaker Exploration Company (exploration and production, 2001-2005). |
Annual Report
Trustees and Officers - continued
+ The information above includes each Trustee's principal occupation during the last five years and other information relating to the experience, attributes, and skills relevant to each Trustee's qualifications to serve as a Trustee, which led to the conclusion that each Trustee should serve as a Trustee for the fund.
Advisory Board Members and Executive Officers:
Correspondence intended for each executive officer, Edward C. Johnson 3d, and Peter S. Lynch may be sent to Fidelity Investments, 82 Devonshire Street, Boston, Massachusetts 02109.
Name, Age; Principal Occupation |
Edward C. Johnson 3d (80) |
| Year of Election or Appointment: 2011 Member of the Advisory Board of Fidelity's Equity and High Income Funds. Formerly Trustee and Chairman of the Board of Trustees of certain Trusts, Mr. Johnson serves as Chief Executive Officer, Chairman, and a Director of FMR LLC; Chairman and a Director of FMR; and Chairman and a Director of FMR Co., Inc. In addition, Mr. Johnson serves as Chairman and Director of FIL Limited. Previously, Mr. Johnson served as President of FMR LLC (2006-2007). |
Peter S. Lynch (67) |
| Year of Election or Appointment: 2003 Member of the Advisory Board of Fidelity's Equity and High Income Funds. Mr. Lynch is Vice Chairman and a Director of FMR and FMR Co., Inc. In addition, Mr. Lynch serves as a Trustee of Boston College and as the Chairman of the Inner-City Scholarship Fund. Previously, Mr. Lynch served on the Special Olympics International Board of Directors (1997-2006). |
Robert W. Selander (60) |
| Year of Election or Appointment: 2011 Member of the Advisory Board of Fidelity's Equity and High Income Funds. Previously, Mr. Selander served as Executive Vice Chairman (2010), Chief Executive Officer (2009-2010), and President and Chief Executive Officer (1997-2009) of Mastercard, Inc. |
Kenneth B. Robins (41) |
| Year of Election or Appointment: 2008 President and Treasurer of Fidelity's Equity and High Income Funds. Mr. Robins also serves as President and Treasurer (2010-present) and Assistant Treasurer (2009-present) of other Fidelity funds and is an employee of Fidelity Investments (2004-present). Previously, Mr. Robins served as Deputy Treasurer of the Fidelity funds (2005-2008) and Treasurer and Chief Financial Officer of The North Carolina Capital Management Trust: Cash and Term Portfolios (2006-2008). |
Bruce T. Herring (45) |
| Year of Election or Appointment: 2006 Vice President of certain Equity Funds. Mr. Herring also serves as Chief Investment Officer and Director of Fidelity Management & Research (U.K.) Inc. (2010-present) and Group Chief Investments Officer of FMR. Previously, Mr. Herring served as Vice President (2005-2006) and Senior Vice President (2006-2007) of Fidelity Management & Research Company, Vice President of FMR Co., Inc. (2001-2007) and as a portfolio manager for Fidelity U.S. Equity Funds. |
Brian B. Hogan (46) |
| Year of Election or Appointment: 2009 Vice President of certain Equity Funds and Vice President of Sector Funds. Mr. Hogan also serves as President of FMR's Equity Division (2009-present). Previously, Mr. Hogan served as Senior Vice President, Equity Research of FMR (2006-2009) and as a portfolio manager. |
Scott C. Goebel (43) |
| Year of Election or Appointment: 2008 Secretary and Chief Legal Officer (CLO) of the Fidelity funds. Mr. Goebel also serves as Secretary and CLO of The North Carolina Capital Management Trust: Cash and Term Portfolios (2008-present); General Counsel, Secretary, and Senior Vice President of FMR (2008-present) and FMR Co., Inc. (2008-present); Deputy General Counsel of FMR LLC; Chief Legal Officer of Fidelity Management & Research (Hong Kong) Limited (2008-present) and Assistant Secretary of Fidelity Management & Research (Japan) Inc. (2008-present), Fidelity Investments Money Management, Inc. (2008-present), Fidelity Management & Research (U.K.) Inc. (2008-present), and Fidelity Research and Analysis Company (2008-present). Previously, Mr. Goebel served as Assistant Secretary of the Funds (2007-2008) and as Vice President and Secretary of Fidelity Distributors Corporation (FDC) (2005-2007). |
William C. Coffey (42) |
| Year of Election or Appointment: 2009 Assistant Secretary of Fidelity's Equity and High Income Funds. Mr. Coffey also serves as Senior Vice President and Deputy General Counsel of FMR LLC (2010-present), and is an employee of Fidelity Investments. Previously, Mr. Coffey served as Vice President and Associate General Counsel of FMR LLC (2005-2009). |
Holly C. Laurent (56) |
| Year of Election or Appointment: 2008 Anti-Money Laundering (AML) Officer of the Fidelity funds. Ms. Laurent also serves as AML Officer of The North Carolina Capital Management Trust: Cash and Term Portfolios (2008-present) and is an employee of Fidelity Investments. Previously, Ms. Laurent was Senior Vice President and Head of Legal for Fidelity Business Services India Pvt. Ltd. (2006-2008), and Senior Vice President, Deputy General Counsel and Group Head for FMR LLC (2005-2006). |
Christine Reynolds (52) |
| Year of Election or Appointment: 2008 Chief Financial Officer of the Fidelity funds. Ms. Reynolds became President of Fidelity Pricing and Cash Management Services (FPCMS) in August 2008. Ms. Reynolds served as Chief Operating Officer of FPCMS (2007-2008). Previously, Ms. Reynolds served as President, Treasurer, and Anti-Money Laundering officer of the Fidelity funds (2004-2007). |
Kenneth A. Rathgeber (63) |
| Year of Election or Appointment: 2004 Chief Compliance Officer of Fidelity's Equity and High Income Funds. Mr. Rathgeber is Chief Compliance Officer of Fidelity Management & Research (Hong Kong) Limited (2008-present), Fidelity Management & Research (Japan) Inc. (2008-present), FMR (2005-present), FMR Co., Inc. (2005-present), Fidelity Management & Research (U.K.) Inc. (2005-present), Fidelity Research & Analysis Company (2005-present), Fidelity Investments Money Management, Inc. (2005-present), Pyramis Global Advisors, LLC (2005-present), and Strategic Advisers, Inc. (2005-present). |
Jeffrey S. Christian (49) |
| Year of Election or Appointment: 2009 Deputy Treasurer of the Fidelity funds. Mr. Christian is an employee of Fidelity Investments. Previously, Mr. Christian served as Chief Financial Officer (2008-2009) of certain Fidelity funds and Senior Vice President of Fidelity Pricing and Cash Management Services (FPCMS) (2004-2009). |
Bryan A. Mehrmann (49) |
| Year of Election or Appointment: 2005 Deputy Treasurer of the Fidelity funds. Mr. Mehrmann is an employee of Fidelity Investments. |
Adrien E. Deberghes (43) |
| Year of Election or Appointment: 2008 Deputy Treasurer of Fidelity's Equity and High Income Funds. Mr. Deberghes also serves as Assistant Treasurer of other Fidelity funds (2010-present) and is an employee of Fidelity Investments (2008-present). Previously, Mr. Deberghes served as Senior Vice President of Mutual Fund Administration at State Street Corporation (2007-2008), Senior Director of Mutual Fund Administration at Investors Bank & Trust (2005-2007), and Director of Finance for Dunkin' Brands (2000-2005). |
Stephanie J. Dorsey (41) |
| Year of Election or Appointment: 2010 Assistant Treasurer of Fidelity's Equity and High Income Funds. Ms. Dorsey also serves as Deputy Treasurer of other Fidelity funds (2008-present) and is an employee of Fidelity Investments (2008-present). Previously, Ms. Dorsey served as Treasurer (2004-2008) of the JPMorgan Mutual Funds and Vice President (2004-2008) of JPMorgan Chase Bank. |
John R. Hebble (52) |
| Year of Election or Appointment: 2009 Assistant Treasurer of Fidelity's Equity and High Income Funds. Mr. Hebble also serves as Treasurer and Chief Financial Officer of The North Carolina Capital Management Trust: Cash and Term Portfolio (2008-present), President and Treasurer of other Fidelity funds (2008-present) and is an employee of Fidelity Investments. |
Gary W. Ryan (52) |
| Year of Election or Appointment: 2005 Assistant Treasurer of the Fidelity funds. Mr. Ryan is an employee of Fidelity Investments. Previously, Mr. Ryan served as Vice President of Fund Reporting in Fidelity Pricing and Cash Management Services (FPCMS) (1999-2005). |
Jonathan Davis (42) |
| Year of Election or Appointment: 2010 Assistant Treasurer of the Fidelity funds. Mr. Davis is an employee of Fidelity Investments. Previously, Mr. Davis served as Vice President and Associate General Counsel of FMR LLC (2003-2010). |
Annual Report
The Board of Trustees of Fidelity Magellan Fund voted to pay shareholders of record at the opening of business on record date, the following distributions per share derived from capital gains realized from sales of portfolio securities, and dividends derived from net investment income:
| Pay Date | Record Date | Dividends | Capital Gains |
Class K | 05/09/11 | 05/06/11 | $0.108 | $0.022 |
Class K designates 100% and 79% of the dividends distributed in May and December, respectively during the fiscal year as qualifying for the dividend-received deduction for corporate shareholders.
Class K designates 100% of the dividends distributed during the fiscal year as amounts which may be taken into account as a dividend for the purposes of the maximum rate under section 1(h)(11) of the Internal Revenue Code.
The fund will notify shareholders in January 2012 of amounts for use in preparing 2011 income tax returns.
Annual Report
Managing Your Investments
Fidelity offers several ways to conveniently manage your workplace benefits (including your workplace savings plan, investments, and additional services) via your telephone or PC. You can access your plan and account information and research your investments 24 hours a day.
By Phone
Fidelity provides a single toll-free number to access plan information, account balances, positions, and quotes*. It's easy to navigate the service, and on your first call, the system will help you create a personal identification number (PIN) for security.
(phone_graphic)
Fidelity Workplace
Investing
1-800-835-5092
By PC
Fidelity's web site on the Internet provides a wide range of information, including plan information, daily financial news, fund performance, interactive planning tools, and news about Fidelity products and services.
(computer_graphic)
Fidelity's Web Site
www.401k.com
* When you call the quotes line, please remember that a fund's yield and return will vary and, except for money market funds, share price will also vary. This means that you may have a gain or loss when you sell your shares. There is no assurance that money market funds will be able to maintain a stable $1 share price; an investment in a money market fund is not insured or guaranteed by the U.S. government. Total returns are historical and include changes in share price, reinvestment of dividends and capital gains distributions, and the effects of any sales charges.
Annual Report
To Write Fidelity
We'll give your correspondence immediate attention and send you written confirmation upon completion of your request.
(letter_graphic)
For Non-Retirement
Accounts
Buying shares
Fidelity Investments
P.O. Box 770001
Cincinnati, OH 45277-0003
Overnight Express
Fidelity Investments
Attn: Distribution Services
100 Crosby Parkway - KC1H
Covington, KY 41015
Selling shares
Fidelity Investments
P.O. Box 770001
Cincinnati, OH 45277-0035
Overnight Express
Fidelity Investments
Attn: Distribution Services
100 Crosby Parkway - KC1H
Covington, KY 41015
General Correspondence
Fidelity Investments
P.O. Box 500
Merrimack, NH 03054-0500
(letter_graphic)
For Retirement
Accounts
Buying shares
Fidelity Investments
P.O. Box 770001
Cincinnati, OH 45277-0003
Selling shares
Fidelity Investments
P.O. Box 770001
Cincinnati, OH 45277-0035
Overnight Express
Fidelity Investments
Attn: Distribution Services
100 Crosby Parkway - KC1H
Covington, KY 41015
General Correspondence
Fidelity Investments
P.O. Box 500
Merrimack, NH 03054-0500
Annual Report
Investment Adviser
Fidelity Management &
Research Company
Boston, MA
Investment Sub-Advisers
FMR Co., Inc.
Fidelity Management & Research
(U.K.) Inc.
Fidelity Management & Research
(Japan) Inc.
Fidelity Management & Research
(Hong Kong) Limited
General Distributor
Fidelity Distributors Corporation
Boston, MA
Transfer and Service Agents
Fidelity Investments Institutional
Operations Company, Inc.
Boston, MA
Fidelity Service Company, Inc.
Boston, MA
Custodian
State Street Bank and Trust Company Quincy, MA
MAG-K-UANN-0511
1.863176.102
Item 2. Code of Ethics
As of the end of the period, March 31, 2011, Fidelity Magellan Fund (the trust) has adopted a code of ethics, as defined in Item 2 of Form N-CSR, that applies to its President and Treasurer and its Chief Financial Officer. A copy of the code of ethics is filed as an exhibit to this Form N-CSR.
Item 3. Audit Committee Financial Expert
The Board of Trustees of the trust has determined that Joseph Mauriello is an audit committee financial expert, as defined in Item 3 of Form N-CSR. Mr. Mauriello is independent for purposes of Item 3 of Form N-CSR.
Item 4. Principal Accountant Fees and Services
Fees and Services
The following table presents fees billed by PricewaterhouseCoopers LLP ("PwC") in each of the last two fiscal years for services rendered to Fidelity Magellan Fund (the "Fund"):
Services Billed by PwC
March 31, 2011 FeesA
| Audit Fees | Audit-Related Fees | Tax Fees | All Other Fees |
Fidelity Magellan Fund | $204,000 | $- | $4,500 | $15,300 |
March 31, 2010 FeesA
| Audit Fees | Audit-Related Fees | Tax Fees | All Other Fees |
Fidelity Magellan Fund | $213,000 | $- | $4,300 | $17,500 |
A Amounts may reflect rounding.
The following table presents fees billed by PwC that were required to be approved by the Audit Committee for services that relate directly to the operations and financial reporting of the Fund and that are rendered on behalf of Fidelity Management & Research Company ("FMR") and entities controlling, controlled by, or under common control with FMR (not including any sub-adviser whose role is primarily portfolio management and is subcontracted with or overseen by another investment adviser) that provide ongoing services to the Fund ("Fund Service Providers"):
Services Billed by PwC
| March 31, 2011A | March 31, 2010A |
Audit-Related Fees | $2,550,000 | $1,595,000 |
Tax Fees | $- | $- |
All Other Fees | $510,000 | $- |
A Amounts may reflect rounding.
"Audit-Related Fees" represent fees billed for assurance and related services that are reasonably related to the performance of the fund audit or the review of the fund's financial statements and that are not reported under Audit Fees.
"Tax Fees" represent fees billed for tax compliance, tax advice or tax planning that relate directly to the operations and financial reporting of the fund.
"All Other Fees" represent fees billed for services provided to the fund or Fund Service Provider, a significant portion of which are assurance related, that relate directly to the operations and financial reporting of the fund, excluding those services that are reported under Audit Fees, Audit-Related Fees or Tax Fees.
Assurance services must be performed by an independent public accountant.
* * *
The aggregate non-audit fees billed by PwC for services rendered to the Fund, FMR (not including any sub-adviser whose role is primarily portfolio management and is subcontracted with or overseen by another investment adviser), and any Fund Service Provider for each of the last two fiscal years of the Fund are as follows:
Billed By | March 31, 2011 A | March 31, 2010 A |
PwC | $4,935,000 | $3,790,000 |
A Amounts may reflect rounding.
The trust's Audit Committee has considered non-audit services that were not pre-approved that were provided by PwC to Fund Service Providers to be compatible with maintaining the independence of PwC in its audit of the Fund, taking into account representations from PwC, in accordance with Public Company Accounting Oversight Board rules, regarding its independence from the Fund and its related entities and FMR's review of the appropriateness and permissibility under applicable law of such non-audit services prior to their provision to the Fund Service Providers.
Audit Committee Pre-Approval Policies and Procedures
The trust's Audit Committee must pre-approve all audit and non-audit services provided by a fund's independent registered public accounting firm relating to the operations or financial reporting of the fund. Prior to the commencement of any audit or non-audit services to a fund, the Audit Committee reviews the services to determine whether they are appropriate and permissible under applicable law.
The Audit Committee has adopted policies and procedures to, among other purposes, provide a framework for the Committee's consideration of non-audit services by the audit firms that audit the Fidelity funds. The policies and procedures require that any non-audit service provided by a fund audit firm to a Fidelity fund and any non-audit service provided by a fund auditor to a Fund Service Provider that relates directly to the operations and financial reporting of a Fidelity fund ("Covered Service") are subject to approval by the Audit Committee before such service is provided.
All Covered Services must be approved in advance of provision of the service either: (i) by formal resolution of the Audit Committee, or (ii) by oral or written approval of the service by the Chair of the Audit Committee (or if the Chair is unavailable, such other member of the Audit Committee as may be designated by the Chair to act in the Chair's absence). The approval contemplated by (ii) above is permitted where the Treasurer determines that action on such an engagement is necessary before the next meeting of the Audit Committee.
Non-audit services provided by a fund audit firm to a Fund Service Provider that do not relate directly to the operations and financial reporting of a Fidelity fund are reported to the Audit Committee on a periodic basis.
Non-Audit Services Approved Pursuant to Rule 2-01(c)(7)(i)(C) and (ii) of Regulation S-X ("De Minimis Exception")
There were no non-audit services approved or required to be approved by the Audit Committee pursuant to the De Minimis Exception during the Fund's last two fiscal years relating to services provided to (i) the Fund or (ii) any Fund Service Provider that relate directly to the operations and financial reporting of the Fund.
Item 5. Audit Committee of Listed Registrants
Not applicable.
Item 6. Investments
(a) Not applicable.
(b) Not applicable
Item 7. Disclosure of Proxy Voting Policies and Procedures for Closed-End Management Investment Companies
Not applicable.
Item 8. Portfolio Managers of Closed-End Management Investment Companies
Not applicable.
Item 9. Purchase of Equity Securities by Closed-End Management Investment Company and Affiliated Purchasers
Not applicable.
Item 10. Submission of Matters to a Vote of Security Holders
There were no material changes to the procedures by which shareholders may recommend nominees to the trust's Board of Trustees.
Item 11. Controls and Procedures
(a)(i) The President and Treasurer and the Chief Financial Officer have concluded that the trust's disclosure controls and procedures (as defined in Rule 30a-3(c) under the Investment Company Act) provide reasonable assurances that material information relating to the trust is made known to them by the appropriate persons, based on their evaluation of these controls and procedures as of a date within 90 days of the filing date of this report.
(a)(ii) There was no change in the trust's internal control over financial reporting (as defined in Rule 30a-3(d) under the Investment Company Act) that occurred during the second fiscal quarter of the period covered by this report that has materially affected, or is reasonably likely to materially affect, the trust's internal control over financial reporting.
Item 12. Exhibits
(a) | (1) | Code of Ethics pursuant to Item 2 of Form N-CSR is filed and attached hereto as EX-99.CODE ETH. |
(a) | (2) | Certification pursuant to Rule 30a-2(a) under the Investment Company Act of 1940 (17 CFR 270.30a-2(a)) is filed and attached hereto as Exhibit 99.CERT. |
(a) | (3) | Not applicable. |
(b) | | Certification pursuant to Rule 30a-2(b) under the Investment Company Act of 1940 (17 CFR 270.30a-2(b)) is furnished and attached hereto as Exhibit 99.906CERT. |
SIGNATURES
Pursuant to the requirements of the Securities Exchange Act of 1934 and the Investment Company Act of 1940, the registrant has duly caused this report to be signed on its behalf by the undersigned, thereunto duly authorized.
Fidelity Magellan Fund
By: | /s/Kenneth B. Robins |
| Kenneth B. Robins |
| President and Treasurer |
| |
Date: | May 26, 2011 |
Pursuant to the requirements of the Securities Exchange Act of 1934 and the Investment Company Act of 1940, this report has been signed below by the following persons on behalf of the registrant and in the capacities and on the dates indicated.
By: | /s/Kenneth B. Robins |
| Kenneth B. Robins |
| President and Treasurer |
| |
Date: | May 26, 2011 |
By: | /s/Christine Reynolds |
| Christine Reynolds |
| Chief Financial Officer |
| |
Date: | May 26, 2011 |