UNITED STATES
SECURITIES AND EXCHANGE COMMISSION
Washington, D.C. 20549
FORM N-CSR
CERTIFIED SHAREHOLDER REPORT OF REGISTERED
MANAGEMENT INVESTMENT COMPANIES
Investment Company Act file number 811-1193
Fidelity Magellan Fund
(Exact name of registrant as specified in charter)
245 Summer St., Boston, Massachusetts 02210
(Address of principal executive offices) (Zip code)
Scott C. Goebel, Secretary
245 Summer St.
Boston, Massachusetts 02210
(Name and address of agent for service)
Registrant's telephone number, including area code: 617-563-7000
Date of fiscal year end: | March 31 |
|
|
Date of reporting period: | March 31, 2014 |
Item 1. Reports to Stockholders
Fidelity®
Magellan®
Fund
Annual Report
March 31, 2014
(Fidelity Cover Art)
Contents
Performance | How the fund has done over time. | |
Management's Discussion of Fund Performance | The Portfolio Manager's review of fund performance and strategy. | |
Shareholder Expense Example | An example of shareholder expenses. | |
Investment Changes | A summary of major shifts in the fund's investments over the past six months. | |
Investments | A complete list of the fund's investments with their market values. | |
Financial Statements | Statements of assets and liabilities, operations, and changes in net assets, as well as financial highlights. | |
Notes | Notes to the financial statements. | |
Report of Independent Registered Public Accounting Firm |
| |
Trustees and Officers |
| |
Distributions |
|
To view a fund's proxy voting guidelines and proxy voting record for the 12-month period ended June 30, visit http://www.fidelity.com/proxyvotingresults or visit the Securities and Exchange Commission's (SEC) website at http://www.sec.gov. You may also call 1-800-544-8544 to request a free copy of the proxy voting guidelines.
Standard & Poor's, S&P and S&P 500 are registered service marks of The McGraw-Hill Companies, Inc. and have been licensed for use by Fidelity Distributors Corporation.
Other third-party marks appearing herein are the property of their respective owners.
All other marks appearing herein are registered or unregistered trademarks or service marks of FMR LLC or an affiliated company. © 2014 FMR LLC. All rights reserved.
Annual Report
This report and the financial statements contained herein are submitted for the general information of the shareholders of the fund. This report is not authorized for distribution to prospective investors in the fund unless preceded or accompanied by an effective prospectus.
A fund files its complete schedule of portfolio holdings with the SEC for the first and third quarters of each fiscal year on Form N-Q. Forms N-Q are available on the SEC's web site at http://www.sec.gov. A fund's Forms N-Q may be reviewed and copied at the SEC's Public Reference Room in Washington, DC. Information regarding the operation of the SEC's Public Reference Room may be obtained by calling 1-800-SEC-0330. For a complete list of a fund's portfolio holdings, view the most recent holdings listing, semiannual report, or annual report on Fidelity's web site at http://www.fidelity.com, http://www.advisor.fidelity.com, or http://www.401k.com, as applicable.
NOT FDIC INSURED • MAY LOSE VALUE • NO BANK GUARANTEE
Neither the fund nor Fidelity Distributors Corporation is a bank.
Annual Report
Performance: The Bottom Line
Average annual total return reflects the change in the value of an investment, assuming reinvestment of the class' distributions from dividend income and capital gains (the profits earned upon the sale of securities that have grown in value, if any) and assuming a constant rate of performance each year. The $10,000 table and the fund's returns do not reflect the deduction of taxes that a shareholder would pay on fund distributions or the redemption of fund shares. During periods of reimbursement by Fidelity, a fund's total return will be greater than it would be had the reimbursement not occurred. How a fund did yesterday is no guarantee of how it will do tomorrow.
Average Annual Total Returns
Periods ended March 31, 2014 | Past 1 | Past 5 | Past 10 |
Fidelity® Magellan® Fund | 26.50% | 18.62% | 5.21% |
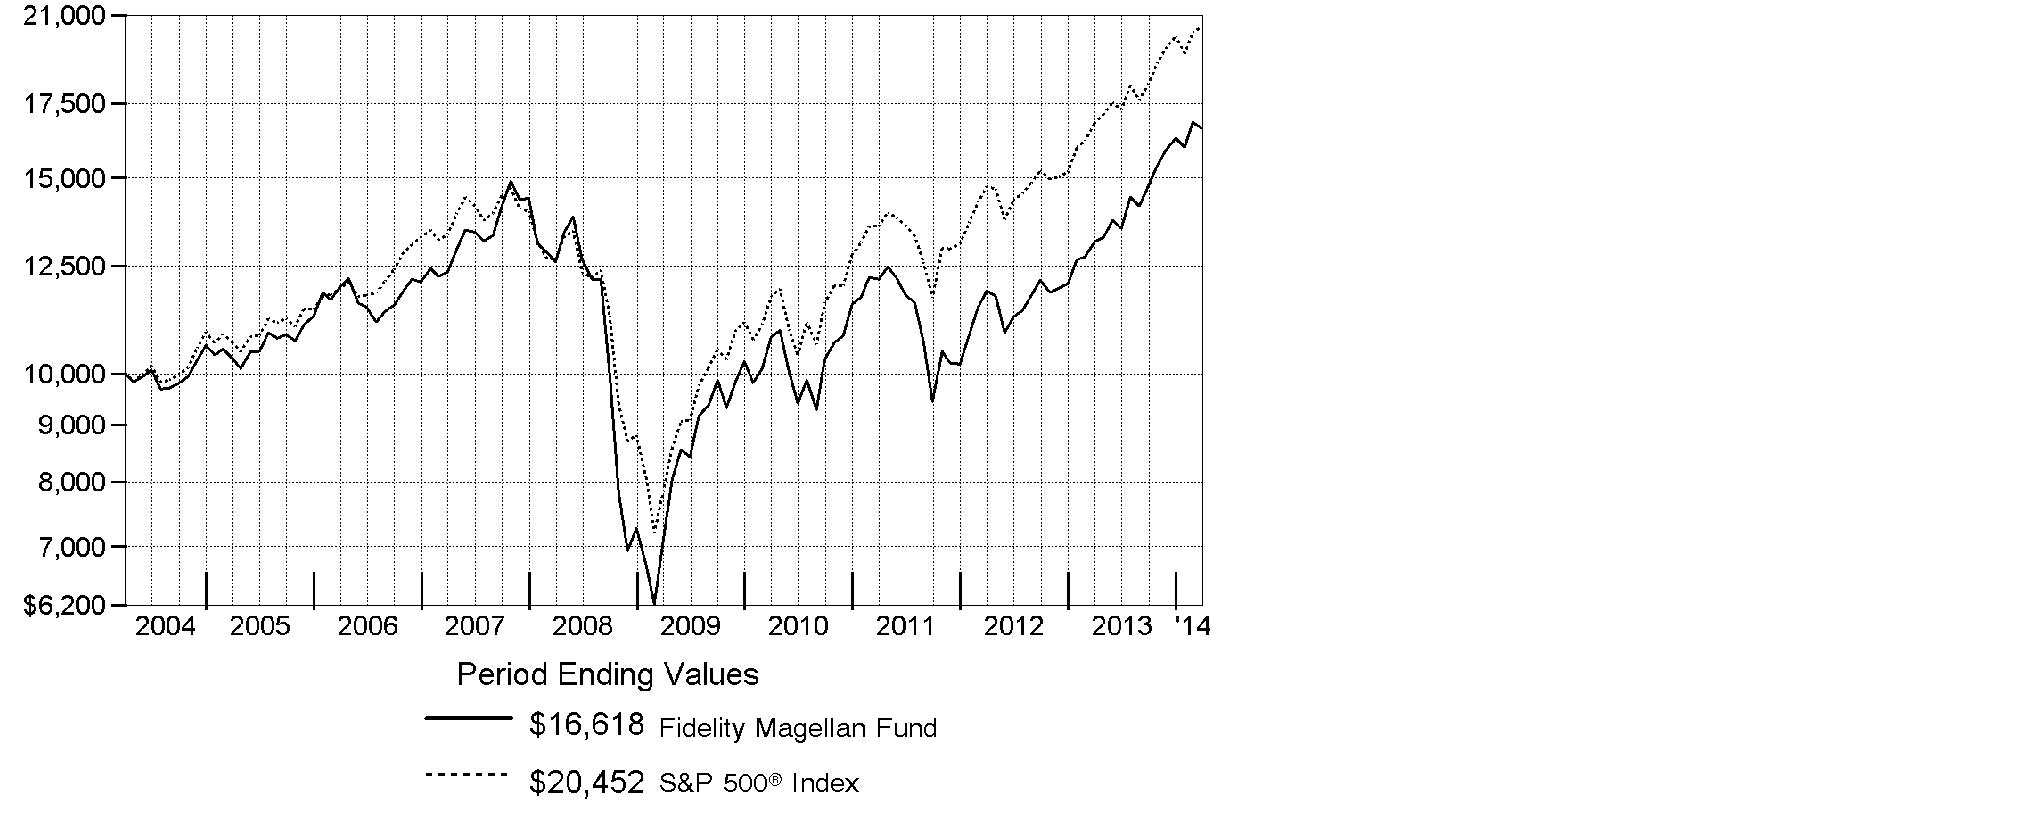
$10,000 Over 10 Years
Let's say hypothetically that $10,000 was invested in Fidelity® Magellan® Fund, a class of the fund, on March 31, 2004. The chart shows how the value of your investment would have changed, and also shows how the S&P 500® Index performed over the same period.
Annual Report
Management's Discussion of Fund Performance
Market Recap: U.S. stocks overcame fears of higher interest rates and a volatile January to post their strongest gain in four years. The S&P 500® Index returned 21.86% for the 12 months ending March 31, 2014, amid the lowest volatility since before the 2007-2008 financial crisis. The index ended the period near all-time highs, buoyed by U.S. Federal Reserve policies that balanced stimulus reductions with low interest rates. Stock valuations remained only slightly above long-term averages, supported by corporate profits that more than doubled in the past five years. Gains were broad, with nine of 10 sectors posting a double-digit percentage advance. Health care led all sectors over the 12-month stretch for the first time since the corresponding period in 2009, as new insurance programs and a favorable drug-approval environment raised earnings-growth expectations. Aerospace & defense achieved one of its strongest returns in more than two decades. Volatility rose in the first quarter of 2014, however, amid rising tension in Ukraine, fear of a slowing economy in China and a late-January decline for momentum stocks. Still, markets finished strongly. Reflecting economic optimism, the growth-oriented Nasdaq Composite Index® rose 30.18% for the full 12 months and the small-cap Russell 2000® Index returned 24.90%, the latter marking a record 7th-straight quarterly gain.
Comments from Jeffrey Feingold, Portfolio Manager of Fidelity® Magellan® Fund: For the year, the fund's Retail Class shares gained 26.50%, handily outpacing the S&P 500®. Relative to the index, my stock choices provided the biggest boost, with health care leading the way. Our top relative contributor was Tesla Motors, as the share price of the maker of electric cars rose five-fold, driven partly by sales and profitability that exceeded expectations. Facebook also was a top contributor. The social-media firm succeeded in monetizing its platform and massive user base when it started to get paid for mobile advertising. Conversely, I had weak picks in energy, including Anadarko Petroleum, the fund's largest relative detractor. Shares of the oil & gas exploration company plummeted after a judge ruled in December that it could be liable for at least $5 billion in environmental damages related to the former chemicals business of Kerr-McGee, which it acquired in 2006. The fund also was hurt by an investment in cloud-computing firm Rackspace Hosting, as the stock fell sharply in February following the web-hosting and cloud-computing firm's forecast for lower-than-expected revenue in 2014, as well as the unexpected retirement of its CEO.
The views expressed above reflect those of the portfolio manager(s) only through the end of the period as stated on the cover of this report and do not necessarily represent the views of Fidelity or any other person in the Fidelity organization. Any such views are subject to change at any time based upon market or other conditions and Fidelity disclaims any responsibility to update such views. These views may not be relied on as investment advice and, because investment decisions for a Fidelity fund are based on numerous factors, may not be relied on as an indication of trading intent on behalf of any Fidelity fund.
Annual Report
Shareholder Expense Example
As a shareholder of the Fund, you incur two types of costs: (1) transaction costs, and (2) ongoing costs, including management fees and other Fund expenses. This Example is intended to help you understand your ongoing costs (in dollars) of investing in the Fund and to compare these costs with the ongoing costs of investing in other mutual funds.
The Example is based on an investment of $1,000 invested at the beginning of the period and held for the entire period (October 1, 2013 to March 31, 2014).
Actual Expenses
The first line of the accompanying table for each class of the Fund provides information about actual account values and actual expenses. You may use the information in this line, together with the amount you invested, to estimate the expenses that you paid over the period. Simply divide your account value by $1,000.00 (for example, an $8,600 account value divided by $1,000.00 = 8.6), then multiply the result by the number in the first line for a class of the Fund under the heading entitled "Expenses Paid During Period" to estimate the expenses you paid on your account during this period. A small balance maintenance fee of $12.00 that is charged once a year may apply for certain accounts with a value of less than $2,000. This fee is not included in the table below. If it was, the estimate of expenses you paid during the period would be higher, and your ending account value lower, by this amount. In addition, the Fund, as a shareholder in the underlying Fidelity Central Funds, will indirectly bear its pro-rata share of the fees and expenses incurred by the underlying Fidelity Central Funds. These fees and expenses are not included in the Fund's annualized expense ratio used to calculate the expense estimate in the table below.
Hypothetical Example for Comparison Purposes
The second line of the accompanying table for each class of the Fund provides information about hypothetical account values and hypothetical expenses based on a Class' actual expense ratio and an assumed rate of return of 5% per year before expenses, which is not the Class' actual return. The hypothetical account values and expenses may not be used to estimate the actual ending account balance or expenses you paid for the period. You may use this information to compare the ongoing costs of investing in the Fund and other funds. To do so, compare this 5% hypothetical example with the 5% hypothetical examples that appear in the shareholder reports of the other funds. A small balance maintenance fee of $12.00 that is charged once a year may apply for certain accounts with a value of less than $2,000. This fee is not included in the table below. If it was, the estimate of expenses you paid during the period would be higher, and your ending account value lower, by this amount. In addition, the Fund, as a shareholder in the underlying Fidelity Central Funds, will indirectly bear its pro-rata share of the fees and expenses incurred by the underlying Fidelity Central Funds. These fees and expenses are not included in the Fund's annualized expense ratio used to calculate the expense estimate in the table below.
Please note that the expenses shown in the table are meant to highlight your ongoing costs only and do not reflect any transaction costs. Therefore, the second line of the table is useful in comparing ongoing costs only, and will not help you determine the relative total costs of owning different funds.
Annual Report
Shareholder Expense Example - continued
| Annualized | Beginning | Ending | Expenses Paid |
Magellan | .51% |
|
|
|
Actual |
| $ 1,000.00 | $ 1,127.90 | $ 2.71 |
HypotheticalA |
| $ 1,000.00 | $ 1,022.39 | $ 2.57 |
Class K | .40% |
|
|
|
Actual |
| $ 1,000.00 | $ 1,128.60 | $ 2.12 |
HypotheticalA |
| $ 1,000.00 | $ 1,022.94 | $ 2.02 |
A 5% return per year before expenses
B Annualized expense ratio reflects expenses net of applicable fee waivers.
* Expenses are equal to each Class' annualized expense ratio, multiplied by the average account value over the period, multiplied by 182/365 (to reflect the one-half year period). The fees and expenses of the underlying Fidelity Central Funds in which the Fund invests are not included in each Class' annualized expense ratio.
Annual Report
Investment Changes (Unaudited)
Top Ten Stocks as of March 31, 2014 | ||
| % of fund's | % of fund's net assets |
Google, Inc. Class A | 4.1 | 3.6 |
JPMorgan Chase & Co. | 3.0 | 2.0 |
Apple, Inc. | 2.7 | 3.4 |
Bank of America Corp. | 2.3 | 1.9 |
Wells Fargo & Co. | 2.1 | 2.1 |
Facebook, Inc. Class A | 2.0 | 1.2 |
Berkshire Hathaway, Inc. Class B | 1.9 | 2.3 |
Comcast Corp. Class A | 1.9 | 1.8 |
TJX Companies, Inc. | 1.8 | 1.4 |
Microsoft Corp. | 1.8 | 2.2 |
| 23.6 | |
Top Five Market Sectors as of March 31, 2014 | ||
| % of fund's | % of fund's net assets |
Information Technology | 21.3 | 20.7 |
Financials | 19.0 | 19.0 |
Health Care | 14.1 | 13.9 |
Consumer Discretionary | 13.8 | 14.8 |
Industrials | 9.7 | 8.7 |
Asset Allocation (% of fund's net assets) | |||||||
As of March 31, 2014 * | As of September 30, 2013 ** | ||||||
 | Stocks 98.8% |
| | Stocks 98.7% |
| ||
 | Convertible |
| | Convertible |
| ||
 | Short-Term |
| | Short-Term |
| ||
* Foreign investments | 6.3% |
| ** Foreign investments | 6.0% |
| ||

Annual Report
Investments March 31, 2014
Showing Percentage of Net Assets
Common Stocks - 98.8% | |||
Shares | Value (000s) | ||
CONSUMER DISCRETIONARY - 13.7% | |||
Auto Components - 0.4% | |||
Johnson Controls, Inc. | 1,322,100 | $ 62,562 | |
Automobiles - 0.3% | |||
Tesla Motors, Inc. (a)(d) | 258,500 | 53,884 | |
Diversified Consumer Services - 0.7% | |||
H&R Block, Inc. | 2,957,200 | 89,278 | |
Service Corp. International | 1,268,600 | 25,220 | |
| 114,498 | ||
Hotels, Restaurants & Leisure - 1.3% | |||
Brinker International, Inc. | 931,315 | 48,847 | |
Dunkin' Brands Group, Inc. | 664,698 | 33,355 | |
Las Vegas Sands Corp. | 312,900 | 25,276 | |
Starbucks Corp. | 1,370,900 | 100,597 | |
| 208,075 | ||
Household Durables - 0.3% | |||
Leggett & Platt, Inc. | 1,486,000 | 48,503 | |
Internet & Catalog Retail - 1.9% | |||
Amazon.com, Inc. (a) | 241,304 | 81,204 | |
Coupons.com, Inc. (a) | 31,700 | 781 | |
Groupon, Inc. Class A (a)(d) | 1,957,600 | 15,348 | |
Netflix, Inc. (a) | 114,800 | 40,413 | |
priceline.com, Inc. (a) | 138,900 | 165,554 | |
| 303,300 | ||
Leisure Products - 0.1% | |||
Brunswick Corp. | 330,400 | 14,964 | |
Media - 2.6% | |||
CBS Corp. Class B | 1,641,300 | 101,432 | |
Comcast Corp. Class A | 6,004,200 | 300,330 | |
Entravision Communication Corp. Class A | 1,480,626 | 9,920 | |
| 411,682 | ||
Multiline Retail - 0.6% | |||
Dollar General Corp. (a) | 833,600 | 46,248 | |
Dollar Tree, Inc. (a) | 814,600 | 42,506 | |
| 88,754 | ||
Specialty Retail - 3.6% | |||
Aarons, Inc. Class A | 521,400 | 15,767 | |
Best Buy Co., Inc. | 1,876,200 | 49,550 | |
Common Stocks - continued | |||
Shares | Value (000s) | ||
CONSUMER DISCRETIONARY - continued | |||
Specialty Retail - continued | |||
Home Depot, Inc. | 2,894,000 | $ 229,002 | |
TJX Companies, Inc. | 4,737,800 | 287,348 | |
| 581,667 | ||
Textiles, Apparel & Luxury Goods - 1.9% | |||
Hanesbrands, Inc. | 221,100 | 16,910 | |
NIKE, Inc. Class B | 433,800 | 32,040 | |
Ralph Lauren Corp. | 312,800 | 50,339 | |
VF Corp. | 1,640,420 | 101,509 | |
Wolverine World Wide, Inc. (d) | 3,931,063 | 112,232 | |
| 313,030 | ||
TOTAL CONSUMER DISCRETIONARY | 2,200,919 | ||
CONSUMER STAPLES - 8.6% | |||
Beverages - 1.5% | |||
Anheuser-Busch InBev SA NV | 275,960 | 29,063 | |
The Coca-Cola Co. | 5,700,202 | 220,370 | |
| 249,433 | ||
Food & Staples Retailing - 3.1% | |||
Costco Wholesale Corp. | 1,163,900 | 129,984 | |
CVS Caremark Corp. | 2,304,672 | 172,528 | |
Kroger Co. | 4,448,100 | 194,160 | |
| 496,672 | ||
Food Products - 2.0% | |||
Bunge Ltd. | 1,040,200 | 82,706 | |
Keurig Green Mountain, Inc. | 688,900 | 72,741 | |
Mead Johnson Nutrition Co. Class A | 1,171,100 | 97,365 | |
Mondelez International, Inc. | 1,814,300 | 62,684 | |
| 315,496 | ||
Household Products - 1.7% | |||
Colgate-Palmolive Co. | 2,108,132 | 136,755 | |
Procter & Gamble Co. | 1,653,200 | 133,248 | |
| 270,003 | ||
Common Stocks - continued | |||
Shares | Value (000s) | ||
CONSUMER STAPLES - continued | |||
Personal Products - 0.3% | |||
Herbalife Ltd. | 200,400 | $ 11,477 | |
Nu Skin Enterprises, Inc. Class A | 384,500 | 31,856 | |
| 43,333 | ||
TOTAL CONSUMER STAPLES | 1,374,937 | ||
ENERGY - 7.6% | |||
Energy Equipment & Services - 1.4% | |||
Ensco PLC Class A | 1,151,600 | 60,781 | |
Oceaneering International, Inc. | 1,490,600 | 107,115 | |
Schlumberger Ltd. | 618,900 | 60,343 | |
| 228,239 | ||
Oil, Gas & Consumable Fuels - 6.2% | |||
Anadarko Petroleum Corp. | 1,949,400 | 165,231 | |
Cabot Oil & Gas Corp. | 3,497,036 | 118,480 | |
Concho Resources, Inc. (a) | 172,700 | 21,156 | |
ConocoPhillips Co. | 3,569,500 | 251,114 | |
EOG Resources, Inc. | 681,300 | 133,651 | |
Exxon Mobil Corp. | 592,024 | 57,829 | |
Marathon Oil Corp. | 1,808,000 | 64,220 | |
Marathon Petroleum Corp. | 645,400 | 56,176 | |
Suncor Energy, Inc. | 3,737,300 | 130,527 | |
| 998,384 | ||
TOTAL ENERGY | 1,226,623 | ||
FINANCIALS - 19.0% | |||
Banks - 9.7% | |||
Bank of America Corp. | 21,819,900 | 375,302 | |
Citigroup, Inc. | 3,887,316 | 185,036 | |
Comerica, Inc. | 525,000 | 27,195 | |
JPMorgan Chase & Co. | 7,888,598 | 478,917 | |
U.S. Bancorp | 3,783,859 | 162,176 | |
Wells Fargo & Co. | 6,697,955 | 333,156 | |
| 1,561,782 | ||
Capital Markets - 3.9% | |||
BlackRock, Inc. Class A | 835,281 | 262,679 | |
Charles Schwab Corp. | 1,773,868 | 48,480 | |
Goldman Sachs Group, Inc. | 619,500 | 101,505 | |
KKR & Co. LP | 1,666,569 | 38,064 | |
Common Stocks - continued | |||
Shares | Value (000s) | ||
FINANCIALS - continued | |||
Capital Markets - continued | |||
Morgan Stanley | 2,819,168 | $ 87,873 | |
TD Ameritrade Holding Corp. | 498,176 | 16,913 | |
The Blackstone Group LP | 1,898,800 | 63,135 | |
Virtus Investment Partners, Inc. (a) | 39,500 | 6,840 | |
| 625,489 | ||
Consumer Finance - 0.5% | |||
Capital One Financial Corp. | 1,096,800 | 84,629 | |
Diversified Financial Services - 1.9% | |||
Berkshire Hathaway, Inc. Class B (a) | 2,486,966 | 310,796 | |
Insurance - 1.5% | |||
American International Group, Inc. | 2,278,300 | 113,938 | |
Genworth Financial, Inc. Class A (a) | 1,531,400 | 27,152 | |
MetLife, Inc. | 1,885,321 | 99,545 | |
| 240,635 | ||
Real Estate Investment Trusts - 1.2% | |||
American Tower Corp. | 2,363,661 | 193,513 | |
Real Estate Management & Development - 0.3% | |||
Rialto Real Estate Fund LP (a)(e)(f)(g) | 500,000 | 24,313 | |
RREF CMBS AIV, LP (e)(g)(i) | 500,000 | 20,125 | |
RREF Midtown Colony REIT, Inc (a)(e)(g)(h) | 500,000 | 1,447 | |
| 45,885 | ||
TOTAL FINANCIALS | 3,062,729 | ||
HEALTH CARE - 14.1% | |||
Biotechnology - 5.4% | |||
Acorda Therapeutics, Inc. (a) | 619,254 | 23,476 | |
Alexion Pharmaceuticals, Inc. (a) | 1,113,160 | 169,345 | |
Alkermes PLC (a) | 418,500 | 18,452 | |
Alnylam Pharmaceuticals, Inc. (a) | 291,171 | 19,549 | |
Amgen, Inc. | 1,393,277 | 171,847 | |
Amicus Therapeutics, Inc. (a) | 562,204 | 1,164 | |
Biogen Idec, Inc. (a) | 637,804 | 195,085 | |
Bluebird Bio, Inc. | 208,773 | 4,747 | |
Clinical Data, Inc. rights 4/4/18 (a) | 988,714 | 0 | |
Gilead Sciences, Inc. (a) | 2,571,300 | 182,202 | |
Medivation, Inc. (a) | 291,500 | 18,764 | |
Neurocrine Biosciences, Inc. (a) | 771,993 | 12,429 | |
Pharmacyclics, Inc. (a) | 116,200 | 11,646 | |
United Therapeutics Corp. (a) | 400,600 | 37,668 | |
| 866,374 | ||
Common Stocks - continued | |||
Shares | Value (000s) | ||
HEALTH CARE - continued | |||
Health Care Equipment & Supplies - 2.1% | |||
Boston Scientific Corp. (a) | 14,092,700 | $ 190,533 | |
Edwards Lifesciences Corp. (a) | 710,700 | 52,713 | |
Intuitive Surgical, Inc. (a) | 225,000 | 98,548 | |
| 341,794 | ||
Health Care Providers & Services - 1.1% | |||
DaVita HealthCare Partners, Inc. (a) | 810,000 | 55,769 | |
McKesson Corp. | 698,200 | 123,281 | |
| 179,050 | ||
Health Care Technology - 0.4% | |||
Castlight Health, Inc. Class B (a) | 104,454 | 2,217 | |
Cerner Corp. (a) | 947,100 | 53,274 | |
Veeva Systems, Inc. Class A (d) | 14,400 | 384 | |
| 55,875 | ||
Life Sciences Tools & Services - 0.2% | |||
Illumina, Inc. (a) | 251,800 | 37,433 | |
Pharmaceuticals - 4.9% | |||
Actavis PLC (a) | 912,440 | 187,826 | |
Bristol-Myers Squibb Co. | 3,503,800 | 182,022 | |
Jazz Pharmaceuticals PLC (a) | 432,700 | 60,007 | |
Merck & Co., Inc. | 4,342,800 | 246,541 | |
Perrigo Co. PLC | 205,600 | 31,798 | |
Salix Pharmaceuticals Ltd. (a) | 143,200 | 14,837 | |
Teva Pharmaceutical Industries Ltd. sponsored ADR | 488,100 | 25,791 | |
Valeant Pharmaceuticals International (Canada) (a) | 321,300 | 42,270 | |
| 791,092 | ||
TOTAL HEALTH CARE | 2,271,618 | ||
INDUSTRIALS - 9.7% | |||
Aerospace & Defense - 1.0% | |||
Esterline Technologies Corp. (a) | 273,360 | 29,124 | |
The Boeing Co. | 132,100 | 16,577 | |
United Technologies Corp. | 1,056,900 | 123,488 | |
| 169,189 | ||
Airlines - 1.5% | |||
American Airlines Group, Inc. (a) | 1,898,600 | 69,489 | |
Delta Air Lines, Inc. | 3,190,500 | 110,551 | |
Common Stocks - continued | |||
Shares | Value (000s) | ||
INDUSTRIALS - continued | |||
Airlines - continued | |||
Spirit Airlines, Inc. (a) | 694,800 | $ 41,271 | |
United Continental Holdings, Inc. (a) | 332,200 | 14,826 | |
| 236,137 | ||
Building Products - 0.2% | |||
A.O. Smith Corp. | 665,000 | 30,603 | |
Electrical Equipment - 0.4% | |||
EnerSys | 461,800 | 31,998 | |
Hubbell, Inc. Class B | 268,100 | 32,137 | |
| 64,135 | ||
Industrial Conglomerates - 1.3% | |||
Danaher Corp. | 2,740,400 | 205,530 | |
Machinery - 3.0% | |||
Caterpillar, Inc. | 1,534,500 | 152,483 | |
Cummins, Inc. | 524,970 | 78,215 | |
Illinois Tool Works, Inc. | 1,397,000 | 113,618 | |
Manitowoc Co., Inc. | 2,582,900 | 81,232 | |
Mueller Industries, Inc. | 124,281 | 3,727 | |
Valmont Industries, Inc. | 335,300 | 49,906 | |
| 479,181 | ||
Professional Services - 1.3% | |||
Towers Watson & Co. | 987,137 | 112,583 | |
Verisk Analytics, Inc. (a) | 1,726,700 | 103,533 | |
| 216,116 | ||
Road & Rail - 1.0% | |||
J.B. Hunt Transport Services, Inc. | 2,157,700 | 155,182 | |
TOTAL INDUSTRIALS | 1,556,073 | ||
INFORMATION TECHNOLOGY - 20.9% | |||
Communications Equipment - 0.8% | |||
Cisco Systems, Inc. | 1,739,500 | 38,982 | |
QUALCOMM, Inc. | 1,168,900 | 92,179 | |
| 131,161 | ||
Internet Software & Services - 7.9% | |||
Cornerstone OnDemand, Inc. (a) | 313,500 | 15,007 | |
CoStar Group, Inc. (a) | 88,700 | 16,564 | |
eBay, Inc. (a) | 295,900 | 16,346 | |
Facebook, Inc. Class A (a) | 5,414,800 | 326,188 | |
Google, Inc. Class A (a) | 592,700 | 660,572 | |
Common Stocks - continued | |||
Shares | Value (000s) | ||
INFORMATION TECHNOLOGY - continued | |||
Internet Software & Services - continued | |||
Marketo, Inc. | 436,167 | $ 14,250 | |
Naver Corp. | 46,031 | 33,457 | |
Rackspace Hosting, Inc. (a) | 3,006,000 | 98,657 | |
Rocket Fuel, Inc. (d) | 12,000 | 515 | |
Stamps.com, Inc. (a) | 124,681 | 4,184 | |
Tencent Holdings Ltd. | 277,300 | 19,287 | |
Yahoo!, Inc. (a) | 2,002,400 | 71,886 | |
| 1,276,913 | ||
IT Services - 3.9% | |||
Cognizant Technology Solutions Corp. Class A (a) | 4,856,218 | 245,773 | |
Computer Sciences Corp. | 548,900 | 33,384 | |
MasterCard, Inc. Class A | 1,064,900 | 79,548 | |
Visa, Inc. Class A | 1,228,400 | 265,162 | |
| 623,867 | ||
Semiconductors & Semiconductor Equipment - 0.7% | |||
Analog Devices, Inc. | 1,654,000 | 87,894 | |
Skyworks Solutions, Inc. (a) | 897,100 | 33,659 | |
| 121,553 | ||
Software - 4.7% | |||
DocuSign, Inc. (a)(g) | 16,185 | 217 | |
FireEye, Inc. | 31 | 2 | |
Guidewire Software, Inc. (a) | 480,078 | 23,548 | |
Interactive Intelligence Group, Inc. (a) | 221,500 | 16,059 | |
Intuit, Inc. | 1,399,800 | 108,806 | |
Microsoft Corp. | 6,936,200 | 284,315 | |
NetSuite, Inc. (a) | 384,100 | 36,424 | |
Oracle Corp. | 1,254,300 | 51,313 | |
Progress Software Corp. (a) | 982,447 | 21,417 | |
Rovi Corp. (a) | 662,800 | 15,099 | |
salesforce.com, Inc. (a) | 1,230,981 | 70,277 | |
SS&C Technologies Holdings, Inc. (a) | 392,900 | 15,724 | |
Synopsys, Inc. (a) | 1,261,700 | 48,462 | |
Ultimate Software Group, Inc. (a) | 149,500 | 20,482 | |
Workday, Inc. Class A (a) | 475,100 | 43,438 | |
| 755,583 | ||
Technology Hardware, Storage & Peripherals - 2.9% | |||
Apple, Inc. | 798,859 | 428,780 | |
EMC Corp. | 1,145,200 | 31,390 | |
| 460,170 | ||
TOTAL INFORMATION TECHNOLOGY | 3,369,247 | ||
Common Stocks - continued | |||
Shares | Value (000s) | ||
MATERIALS - 4.8% | |||
Chemicals - 4.0% | |||
CF Industries Holdings, Inc. | 378,900 | $ 98,756 | |
LyondellBasell Industries NV Class A | 943,719 | 83,934 | |
Monsanto Co. | 2,286,984 | 260,190 | |
Potash Corp. of Saskatchewan, Inc. (d) | 2,404,100 | 86,965 | |
Praxair, Inc. | 905,132 | 118,545 | |
| 648,390 | ||
Construction Materials - 0.6% | |||
Vulcan Materials Co. | 1,332,300 | 88,531 | |
Metals & Mining - 0.1% | |||
Franco-Nevada Corp. | 382,900 | 17,595 | |
Paper & Forest Products - 0.1% | |||
Boise Cascade Co. (a) | 675,800 | 19,355 | |
TOTAL MATERIALS | 773,871 | ||
TELECOMMUNICATION SERVICES - 0.4% | |||
Wireless Telecommunication Services - 0.4% | |||
SBA Communications Corp. Class A (a) | 595,163 | 54,136 | |
SoftBank Corp. | 190,400 | 14,389 | |
| 68,525 | ||
TOTAL COMMON STOCKS (Cost $12,099,138) |
| ||
Convertible Preferred Stocks - 0.5% | |||
|
|
|
|
CONSUMER DISCRETIONARY - 0.1% | |||
Household Durables - 0.1% | |||
Roku, Inc. 8.00% (g) | 12,145,838 | 11,000 | |
INFORMATION TECHNOLOGY - 0.4% | |||
Internet Software & Services - 0.2% | |||
HubSpot, Inc. (a)(g) | 2,670,845 | 27,162 | |
Convertible Preferred Stocks - continued | |||
Shares | Value (000s) | ||
INFORMATION TECHNOLOGY - continued | |||
Software - 0.2% | |||
DocuSign, Inc.: | |||
Series B (g) | 7,510 | $ 101 | |
Series B-1 (g) | 2,249 | 30 | |
Series D (a)(g) | 2,376,438 | 31,844 | |
Series E (g) | 139,427 | 1,868 | |
Mobileye NV Series F (g) | 254,387 | 8,878 | |
| 42,721 | ||
Technology Hardware, Storage & Peripherals - 0.0% | |||
Pure Storage, Inc. Series E (g) | 306,060 | 2,831 | |
TOTAL INFORMATION TECHNOLOGY | 72,714 | ||
TOTAL CONVERTIBLE PREFERRED STOCKS (Cost $50,030) |
| ||
Money Market Funds - 0.9% | |||
|
|
|
|
Fidelity Cash Central Fund, 0.10% (b) | 57,663,376 | 57,663 | |
Fidelity Securities Lending Cash Central Fund, 0.09% (b)(c) | 94,155,252 | 94,155 | |
TOTAL MONEY MARKET FUNDS (Cost $151,818) |
| ||
TOTAL INVESTMENT PORTFOLIO - 100.2% (Cost $12,300,986) | 16,140,074 | ||
NET OTHER ASSETS (LIABILITIES) - (0.2)% | (34,302) | ||
NET ASSETS - 100% | $ 16,105,772 | ||
Legend |
(a) Non-income producing |
(b) Affiliated fund that is generally available only to investment companies and other accounts managed by Fidelity Investments. The rate quoted is the annualized seven-day yield of the fund at period end. A complete unaudited listing of the fund's holdings as of its most recent quarter end is available upon request. In addition, each Fidelity Central Fund's financial statements, which are not covered by the Fund's Report of Independent Registered Public Accounting Firm, are available on the SEC's website or upon request. |
(c) Investment made with cash collateral received from securities on loan. |
(d) Security or a portion of the security is on loan at period end. |
(e) Affiliated company |
(f) Investment is owned by an entity that is treated as a corporation for U.S. tax purposes and is owned by the Fund. |
(g) Restricted securities - Investment in securities not registered under the Securities Act of 1933 (excluding 144A issues). At the end of the period, the value of restricted securities (excluding 144A issues) amounted to $129,816,000 or 0.8% of net assets. |
Additional information on each restricted holding is as follows: |
Security | Acquisition | Acquisition |
DocuSign, Inc. | 10/21/13 | $ 90 |
DocuSign, Inc. Series B | 3/3/14 | $ 99 |
DocuSign, Inc. Series B-1 | 3/3/14 | $ 30 |
DocuSign, Inc. Series D | 6/29/12 - 3/3/14 | $ 11,071 |
DocuSign, Inc. Series E | 3/3/14 | $ 1,831 |
HubSpot, Inc. | 10/25/12 | $ 15,000 |
Mobileye NV Series F | 8/15/13 | $ 8,878 |
Pure Storage, Inc. Series E | 8/22/13 | $ 2,121 |
Rialto Real Estate Fund LP | 2/24/11 - 8/17/12 | $ 33,049 |
RREF CMBS AIV, LP | 8/10/11 - 8/17/12 | $ 15,528 |
RREF Midtown Colony REIT, Inc. | 12/31/12 | $ 1,423 |
Roku, Inc. 8.00% | 5/7/13 | $ 11,000 |
(h) Investment represents the Fund's ownership interest in a real estate investment trust, which is under common ownership and management with Rialto Real Estate Fund, LP. |
(i) Investment represents the Fund's ownership interest in a limited partnership, which is under common ownership and management with Rialto Real Estate Fund, LP. |
Affiliated Central Funds |
Information regarding fiscal year to date income earned by the Fund from investments in Fidelity Central Funds is as follows: |
Fund | Income earned |
Fidelity Cash Central Fund | $ 141 |
Fidelity Securities Lending Cash Central Fund | 838 |
Total | $ 979 |
Other Affiliated Issuers |
An affiliated company is a company in which the Fund has ownership of at least 5% of the voting securities. Fiscal year to date transactions with companies which are or were affiliates are as follows: |
Affiliate | Value, | Purchases | Sales | Dividend | Value, |
Acorda Therapeutics, Inc. | $ 61,672 | $ 10,283 | $ 56,176 | $ - | $ - |
Brinker International, Inc. | 147,919 | 7,517 | 134,568 | 1,563 | - |
Rialto Real Estate Fund LP | 40,891 | - | - | - | 24,313 |
RREF CMBS AIV, LP | 18,361 | - | - | 6,907 | 20,125 |
RREF Midtown Colony REIT, Inc. | 1,397 | - | - | - | 1,447 |
Total | $ 270,240 | $ 17,800 | $ 190,744 | $ 8,470 | $ 45,885 |
Other Information |
The following is a summary of the inputs used, as of March 31, 2014, involving the Fund's assets and liabilities carried at fair value. The inputs or methodology used for valuing securities may not be an indication of the risk associated with investing in those securities. For more information on valuation inputs, and their aggregation into the levels used in the table below, please refer to the Investment Valuation section in the accompanying Notes to Financial Statements. |
Valuation Inputs at Reporting Date: | ||||
Description | Total | Level 1 | Level 2 | Level 3 |
Investments in Securities: | ||||
Equities: | ||||
Consumer Discretionary | $ 2,211,919 | $ 2,200,919 | $ - | $ 11,000 |
Consumer Staples | 1,374,937 | 1,345,874 | 29,063 | - |
Energy | 1,226,623 | 1,226,623 | - | - |
Financials | 3,062,729 | 3,016,844 | - | 45,885 |
Health Care | 2,271,618 | 2,271,618 | - | - |
Industrials | 1,556,073 | 1,556,073 | - | - |
Information Technology | 3,441,961 | 3,369,030 | - | 72,931 |
Materials | 773,871 | 773,871 | - | - |
Telecommunication Services | 68,525 | 68,525 | - | - |
Money Market Funds | 151,818 | 151,818 | - | - |
Total Investments in Securities: | $ 16,140,074 | $ 15,981,195 | $ 29,063 | $ 129,816 |
See accompanying notes which are an integral part of the financial statements.
Annual Report
Financial Statements
Statement of Assets and Liabilities
Amounts in thousands (except per-share amounts) | March 31, 2014 | |
|
|
|
Assets | ||
Investment in securities, at value (including securities loaned of $91,093) - See accompanying schedule: Unaffiliated issuers (cost $12,099,168) | $ 15,942,371 |
|
Fidelity Central Funds (cost $151,818) | 151,818 |
|
Other affiliated issuers (cost $50,000) | 45,885 |
|
Total Investments (cost $12,300,986) |
| $ 16,140,074 |
Receivable for investments sold | 292,113 | |
Receivable for fund shares sold | 5,284 | |
Dividends receivable | 11,082 | |
Distributions receivable from Fidelity Central Funds | 65 | |
Prepaid expenses | 17 | |
Other receivables | 1,780 | |
Total assets | 16,450,415 | |
|
|
|
Liabilities | ||
Payable for investments purchased | $ 225,212 | |
Payable for fund shares redeemed | 13,837 | |
Accrued management fee | 4,818 | |
Other affiliated payables | 1,954 | |
Other payables and accrued expenses | 1,806 | |
Deferred taxes | 2,861 | |
Collateral on securities loaned, at value | 94,155 | |
Total liabilities | 344,643 | |
|
|
|
Net Assets | $ 16,105,772 | |
Net Assets consist of: |
| |
Paid in capital | $ 11,322,994 | |
Undistributed net investment income | 29,022 | |
Accumulated undistributed net realized gain (loss) on investments and foreign currency transactions | 917,510 | |
Net unrealized appreciation (depreciation) on investments and assets and liabilities in foreign currencies | 3,836,246 | |
Net Assets | $ 16,105,772 | |
See accompanying notes which are an integral part of the financial statements.
Annual Report
Financial Statements - continued
Statement of Assets and Liabilities - continued
Amounts in thousands (except per-share amounts) | March 31, 2014 | |
|
|
|
Magellan: | $ 94.25 | |
|
|
|
Class K: | $ 94.16 | |
See accompanying notes which are an integral part of the financial statements.
Annual Report
Statement of Operations
Amounts in thousands | Year ended March 31, 2014 | |
|
|
|
Investment Income |
|
|
Dividends (including $8,470 earned from other affiliated issuers) |
| $ 216,298 |
Income from Fidelity Central Funds |
| 979 |
Total income |
| 217,277 |
|
|
|
Expenses | ||
Management fee | $ 84,973 | |
Performance adjustment | (34,174) | |
Transfer agent fees | 20,946 | |
Accounting and security lending fees | 1,523 | |
Custodian fees and expenses | 265 | |
Independent trustees' compensation | 78 | |
Appreciation in deferred trustee compensation account | 12 | |
Registration fees | 79 | |
Audit | 197 | |
Legal | 63 | |
Miscellaneous | 124 | |
Total expenses before reductions | 74,086 | |
Expense reductions | (315) | 73,771 |
Net investment income (loss) | 143,506 | |
Realized and Unrealized Gain (Loss) Net realized gain (loss) on: | ||
Investment securities: |
|
|
Unaffiliated issuers | 1,896,399 | |
Other affiliated issuers | 40,098 |
|
Foreign currency transactions | (521) | |
Futures contracts | 9,288 | |
Total net realized gain (loss) |
| 1,945,264 |
Change in net unrealized appreciation (depreciation) on: Investment securities | 1,520,168 | |
Assets and liabilities in foreign currencies | 45 | |
Total change in net unrealized appreciation (depreciation) |
| 1,520,213 |
Net gain (loss) | 3,465,477 | |
Net increase (decrease) in net assets resulting from operations | $ 3,608,983 | |
See accompanying notes which are an integral part of the financial statements.
Annual Report
Financial Statements - continued
Statement of Changes in Net Assets
Amounts in thousands | Year ended | Year ended |
Increase (Decrease) in Net Assets |
|
|
Operations |
|
|
Net investment income (loss) | $ 143,506 | $ 191,188 |
Net realized gain (loss) | 1,945,264 | 1,475,417 |
Change in net unrealized appreciation (depreciation) | 1,520,213 | (257,221) |
Net increase (decrease) in net assets resulting | 3,608,983 | 1,409,384 |
Distributions to shareholders from net investment income | (115,663) | (201,835) |
Distributions to shareholders from net realized gain | (976,496) | (4,097) |
Total distributions | (1,092,159) | (205,932) |
Share transactions - net increase (decrease) | (1,176,730) | (2,916,170) |
Total increase (decrease) in net assets | 1,340,094 | (1,712,718) |
|
|
|
Net Assets | ||
Beginning of period | 14,765,678 | 16,478,396 |
End of period (including undistributed net investment income of $29,022 and undistributed net investment income of $9,247, respectively) | $ 16,105,772 | $ 14,765,678 |
See accompanying notes which are an integral part of the financial statements.
Annual Report
Financial Highlights - Magellan
Years ended March 31, | 2014 | 2013 | 2012 | 2011 | 2010 |
Selected Per-Share Data |
|
|
|
| |
Net asset value, beginning of period | $ 79.96 | $ 73.30 | $ 75.56 | $ 67.56 | $ 44.63 |
Income from Investment Operations |
|
|
|
|
|
Net investment income (loss) B | .81 | .93 | .47 | .56 E | .29 |
Net realized and unrealized gain (loss) | 20.00 | 6.75 | (2.30) | 8.05 | 23.02 |
Total from investment operations | 20.81 | 7.68 | (1.83) | 8.61 | 23.31 |
Distributions from net investment income | (.67) | (1.00) | (.41) | (.54) | (.36) |
Distributions from net realized gain | (5.85) | (.02) | (.02) | (.07) | (.02) |
Total distributions | (6.52) | (1.02) | (.43) | (.61) | (.38) |
Net asset value, end of period | $ 94.25 | $ 79.96 | $ 73.30 | $ 75.56 | $ 67.56 |
Total Return A | 26.50% | 10.63% | (2.36)% | 12.82% | 52.33% |
Ratios to Average Net Assets C, F |
|
|
|
| |
Expenses before reductions | .50% | .47% | .54% | .60% | .75% |
Expenses net of fee waivers, if any | .50% | .47% | .54% | .60% | .75% |
Expenses net of all reductions | .50% | .46% | .53% | .59% | .74% |
Net investment income (loss) | .92% | 1.27% | .69% | .83% E | .49% |
Supplemental Data |
|
|
|
| |
Net assets, end of period (in millions) | $ 13,521 | $ 12,341 | $ 13,665 | $ 19,398 | $ 22,628 |
Portfolio turnover rate D | 77% | 88% | 99% | 42% | 39% |
A Total returns would have been lower if certain expenses had not been reduced during the applicable periods shown.
B Calculated based on average shares outstanding during the period.
C Fees and expenses of any underlying Fidelity Central Funds are not included in the Fund's expense ratio. The Fund indirectly bears its proportionate share of the expenses of any underlying Fidelity Central Funds.
D Amount does not include the portfolio activity of any underlying Fidelity Central Funds.
E Investment income per share reflects a large, non-recurring dividend which amounted to $.13 per share. Excluding this non-recurring dividend, the ratio of net investment income (loss) to average net assets would have been .63%.
F Expense ratios reflect operating expenses of the class. Expenses before reductions do not reflect amounts reimbursed by the investment adviser or reductions from brokerage service arrangements or reductions from other expense offset arrangements and do not represent the amount paid by the class during periods when reimbursements or reductions occur. Expenses net of fee waivers reflect expenses after reimbursement by the investment adviser but prior to reductions from brokerage service arrangements or other expense offset arrangements. Expenses net of all reductions represent the net expenses paid by the class.
See accompanying notes which are an integral part of the financial statements.
Annual Report
Financial Highlights - Class K
Years ended March 31, | 2014 | 2013 | 2012 | 2011 | 2010 |
Selected Per-Share Data |
|
|
|
| |
Net asset value, beginning of period | $ 79.89 | $ 73.24 | $ 75.51 | $ 67.53 | $ 44.61 |
Income from Investment Operations |
|
|
|
|
|
Net investment income (loss) B | .90 | 1.02 | .56 | .65 E | .38 |
Net realized and unrealized gain (loss) | 19.99 | 6.75 | (2.30) | 8.04 | 23.02 |
Total from investment operations | 20.89 | 7.77 | (1.74) | 8.69 | 23.40 |
Distributions from net investment income | (.77) | (1.10) | (.50) | (.64) | (.46) |
Distributions from net realized gain | (5.85) | (.02) | (.02) | (.07) | (.02) |
Total distributions | (6.62) | (1.12) | (.53) G | (.71) | (.48) |
Net asset value, end of period | $ 94.16 | $ 79.89 | $ 73.24 | $ 75.51 | $ 67.53 |
Total Return A | 26.63% | 10.77% | (2.23)% | 12.97% | 52.59% |
Ratios to Average Net Assets C, F |
|
|
|
| |
Expenses before reductions | .39% | .35% | .42% | .46% | .59% |
Expenses net of fee waivers, if any | .39% | .35% | .42% | .46% | .59% |
Expenses net of all reductions | .39% | .34% | .41% | .46% | .58% |
Net investment income (loss) | 1.02% | 1.40% | .82% | .97% E | .65% |
Supplemental Data |
|
|
|
|
|
Net assets, end of period (in millions) | $ 2,585 | $ 2,424 | $ 2,814 | $ 3,483 | $ 2,495 |
Portfolio turnover rate D | 77% | 88% | 99% | 42% | 39% |
A Total returns would have been lower if certain expenses had not been reduced during the applicable periods shown.
B Calculated based on average shares outstanding during the period.
C Fees and expenses of any underlying Fidelity Central Funds are not included in the Fund's expense ratio. The Fund indirectly bears its proportionate share of the expenses of any underlying Fidelity Central Funds.
D Amount does not include the portfolio activity of any underlying Fidelity Central Funds.
E Investment income per share reflects a large, non-recurring dividend which amounted to $.13 per share. Excluding this non-recurring dividend, the ratio of net investment income (loss) to average net assets would have been .77%.
F Expense ratios reflect operating expenses of the class. Expenses before reductions do not reflect amounts reimbursed by the investment adviser or reductions from brokerage service arrangements or reductions from other expense offset arrangements and do not represent the amount paid by the class during periods when reimbursements or reductions occur. Expenses net of fee waivers reflect expenses after reimbursement by the investment adviser but prior to reductions from brokerage service arrangements or other expense offset arrangements. Expenses net of all reductions represent the net expenses paid by the class.
G Total distributions of $.53 per share is comprised of distributions from net investment income of $.504 and distributions from net realized gain of $.022 per share.
See accompanying notes which are an integral part of the financial statements.
Annual Report
Notes to Financial Statements
For the period ended March 31, 2014
(Amounts in thousands except percentages)
1. Organization.
Fidelity Magellan Fund (the Fund) is a fund of Fidelity Magellan Fund (the Trust) and is authorized to issue an unlimited number of shares. The Trust is registered under the Investment Company Act of 1940, as amended (the 1940 Act), as an open-end management investment company organized as a Massachusetts business trust. The Fund offers Magellan and Class K shares, each of which has equal rights as to assets and voting privileges. Each class has exclusive voting rights with respect to matters that affect that class.
2. Investments in Fidelity Central Funds.
The Fund invests in Fidelity Central Funds, which are open-end investment companies generally available only to other investment companies and accounts managed by the investment adviser and its affiliates. The Fund's Schedule of Investments lists each of the Fidelity Central Funds held as of period end, if any, as an investment of the Fund, but does not include the underlying holdings of each Fidelity Central Fund. As an Investing Fund, the Fund indirectly bears its proportionate share of the expenses of the underlying Fidelity Central Funds.
The Money Market Central Funds seek preservation of capital and current income and are managed by Fidelity Investments Money Management, Inc. (FIMM), an affiliate of the investment adviser. Annualized expenses of the Money Market Central Funds as of their most recent shareholder report date are less than .01%.
A complete unaudited list of holdings for each Fidelity Central Fund is available upon request or at the Securities and Exchange Commission (the SEC) website at www.sec.gov. In addition, the financial statements of the Fidelity Central Funds which contain the significant accounting policies (including investment valuation policies) of those funds, which are not covered by the Fund's Report of Independent Registered Public Accounting Firm, are available on the SEC website or upon request.
3. Significant Accounting Policies.
The financial statements have been prepared in conformity with accounting principles generally accepted in the United States of America (GAAP), which require management to make certain estimates and assumptions at the date of the financial statements. Actual results could differ from those estimates. Subsequent events, if any, through the date that the financial statements were issued have been evaluated in the preparation of the financial statements. The following summarizes the significant accounting policies of the Fund:
Investment Valuation. Investments are valued as of 4:00 p.m. Eastern time on the last calendar day of the period. In accordance with valuation policies and procedures approved by the Board of Trustees (the Board), the Fund attempts to obtain prices from
Annual Report
3. Significant Accounting Policies - continued
Investment Valuation - continued
one or more third party pricing vendors or brokers to value its investments. When current market prices, quotations or currency exchange rates are not readily available or reliable, investments will be fair valued in good faith by the Fidelity Management & Research Company (FMR) Fair Value Committee (the Committee), in accordance with procedures adopted by the Board. Factors used in determining fair value vary by investment type and may include market or investment specific events. The frequency with which these procedures are used cannot be predicted and they may be utilized to a significant extent. The Committee oversees the Fund's valuation policies and procedures and is responsible for approving and reporting to the Board all fair value determinations.
The Fund categorizes the inputs to valuation techniques used to value its investments into a disclosure hierarchy consisting of three levels as shown below:
Level 1 - quoted prices in active markets for identical investments
Level 2 - other significant observable inputs (including quoted prices for similar investments, interest rates, prepayment speeds, etc.)
Level 3 - unobservable inputs (including the Fund's own assumptions based on the best information available)
Valuation techniques used to value the Fund's investments by major category are as follows:
Equity securities, including restricted securities, for which market quotations are readily available, are valued at the last reported sale price or official closing price as reported by a third party pricing vendor on the primary market or exchange on which they are traded and are categorized as Level 1 in the hierarchy. In the event there were no sales during the day or closing prices are not available, securities are valued at the last quoted bid price or may be valued using the last available price and are generally categorized as Level 2 in the hierarchy. For foreign equity securities, when market or security specific events arise, comparisons to the valuation of American Depositary Receipts (ADRs), futures contracts, Exchange-Traded Funds (ETFs) and certain indexes as well as quoted prices for similar securities may be used and would be categorized as Level 2 in the hierarchy. Utilizing these techniques may result in transfers between Level 1 and Level 2. For equity securities, including restricted securities, where observable inputs are limited, assumptions about market activity and risk are used and these securities may be categorized as Level 3 in the hierarchy.
Investments in open-end mutual funds, including the Fidelity Central Funds, are valued at their closing net asset value (NAV) each business day and are categorized as Level 1 in the hierarchy.
Annual Report
Notes to Financial Statements - continued
(Amounts in thousands except percentages)
3. Significant Accounting Policies - continued
Investment Valuation - continued
Changes in valuation techniques may result in transfers in or out of an assigned level within the disclosure hierarchy. The aggregate value of investments by input level, as of March 31, 2014 is included at the end of the Fund's Schedule of Investments.
Foreign Currency. The Fund may use foreign currency contracts to facilitate transactions in foreign-denominated securities. Gains and losses from these transactions may arise from changes in the value of the foreign currency or if the counterparties do not perform under the contracts' terms.
Foreign-denominated assets, including investment securities, and liabilities are translated into U.S. dollars at the exchange rates at period end. Purchases and sales of investment securities, income and dividends received and expenses denominated in foreign currencies are translated into U.S. dollars at the exchange rate in effect on the transaction date.
The effects of exchange rate fluctuations on investments are included with the net realized and unrealized gain (loss) on investment securities. Other foreign currency transactions resulting in realized and unrealized gain (loss) are disclosed separately.
Investment Transactions and Income. For financial reporting purposes, the Fund's investment holdings and NAV include trades executed through the end of the last business day of the period. The NAV per share for processing shareholder transactions is calculated as of the close of business of the New York Stock Exchange (NYSE), normally 4:00 p.m. Eastern time and includes trades executed through the end of the prior business day. Gains and losses on securities sold are determined on the basis of identified cost and may include proceeds received from litigation. Dividend income is recorded on the ex-dividend date, except for certain dividends from foreign securities where the ex-dividend date may have passed, which are recorded as soon as the Fund is informed of the ex-dividend date. Non-cash dividends included in dividend income, if any, are recorded at the fair market value of the securities received. Distributions received on securities that represent a return of capital or capital gain are recorded as a reduction of cost of investments and/or as a realized gain. Subsequent to ex-dividend date the Fund determines the components of these distributions, based upon receipt of tax filings or other correspondence relating to the underlying investment. Interest income and distributions from the Fidelity Central Funds are accrued as earned. Interest income includes coupon interest and amortization of premium and accretion of discount on debt securities as applicable. Investment income is recorded net of foreign taxes withheld where recovery of such taxes is uncertain.
Annual Report
3. Significant Accounting Policies - continued
Class Allocations and Expenses. Investment income, realized and unrealized capital gains and losses, common expenses of the Fund, and certain fund-level expense reductions, if any, are allocated daily on a pro-rata basis to each class based on the relative net assets of each class to the total net assets of the Fund. Each class differs with respect to transfer agent fees incurred. Certain expense reductions may also differ by class. For the reporting period, the allocated portion of income and expenses to each class as a percent of its average net assets may vary due to the timing of recording these transactions in relation to fluctuating net assets of the classes. Expenses directly attributable to a fund are charged to that fund. Expenses attributable to more than one fund are allocated among the respective funds on the basis of relative net assets or other appropriate methods. Expense estimates are accrued in the period to which they relate and adjustments are made when actual amounts are known.
Deferred Trustee Compensation. Under a Deferred Compensation Plan (the Plan), independent Trustees may elect to defer receipt of a portion of their annual compensation. Deferred amounts are invested in a cross-section of Fidelity funds, are marked-to-market and remain in the Fund until distributed in accordance with the Plan. The investment of deferred amounts and the offsetting payable to the Trustees are included in the accompanying Statement of Assets and Liabilities.
Income Tax Information and Distributions to Shareholders. Each year, the Fund intends to qualify as a regulated investment company under Subchapter M of the Internal Revenue Code, including distributing substantially all of its taxable income and realized gains. As a result, no provision for U.S. Federal income taxes is required. As of March 31, 2014, the Fund did not have any unrecognized tax benefits in the financial statements; nor is the Fund aware of any tax positions for which it is reasonably possible that the total amounts of unrecognized tax benefits will significantly change in the next twelve months. The Fund files a U.S. federal tax return, in addition to state and local tax returns as required. The Fund's federal income tax returns are subject to examination by the Internal Revenue Service (IRS) for a period of three fiscal years after they are filed. State and local tax returns may be subject to examination for an additional fiscal year depending on the jurisdiction. Foreign taxes are provided for based on the Fund's understanding of the tax rules and rates that exist in the foreign markets in which it invests. One of the Fund's investments, Rialto Real Estate Fund LP, is owned through an entity that is treated as a corporation for U.S. tax purposes and may be subject to federal and state taxes upon disposition. The tax liability may differ materially depending on conditions when the investment is disposed. At period end, the estimated tax liability for this investment is presented as "Deferred taxes" in the Statement of Assets and Liabilities and included in "Change in net unrealized appreciation (depreciation) on investment securities" in the Statement of Operations.
Annual Report
Notes to Financial Statements - continued
(Amounts in thousands except percentages)
3. Significant Accounting Policies - continued
Income Tax Information and Distributions to Shareholders - continued
Distributions are declared and recorded on the ex-dividend date. Income dividends and capital gain distributions are declared separately for each class. Income and capital gain distributions are determined in accordance with income tax regulations, which may differ from GAAP. In addition, the Fund claimed a portion of the payment made to redeeming shareholders as a distribution for income tax purposes.
Capital accounts within the financial statements are adjusted for permanent book-tax differences. These adjustments have no impact on net assets or the results of operations.
Capital accounts are not adjusted for temporary book-tax differences which will reverse in a subsequent period.
Book-tax differences are primarily due to futures contracts, foreign currency transactions, passive foreign investment companies (PFIC), market discount, partnerships, deferred trustee compensation, and losses deferred due to wash sales.
The federal tax cost of investment securities and unrealized appreciation (depreciation) as of period end were as follows:
Gross unrealized appreciation | $ 3,949,853 |
Gross unrealized depreciation | (143,126) |
Net unrealized appreciation (depreciation) on securities and other investments | $ 3,806,727 |
|
|
Tax Cost | $ 12,330,486 |
The tax-based components of distributable earnings as of period end were as follows:
Undistributed ordinary income | $ 326,972 |
Undistributed long-term capital gain | $ 650,758 |
Net unrealized appreciation (depreciation) | $ 3,806,746 |
The tax character of distributions paid was as follows:
| March 31, 2014 | March 31, 2013 |
|
|
|
Ordinary Income | $ 519,879 | $ 205,932 |
Long-term Capital Gains | 572,280 | - |
Total | $ 1,092,159 | $ 205,932 |
Restricted Securities. The Fund may invest in securities that are subject to legal or contractual restrictions on resale. These securities generally may be resold in transactions exempt from registration or to the public if the securities are registered. Disposal of these securities may involve time-consuming negotiations and expense, and prompt sale at an acceptable price may be difficult. Information regarding restricted securities is included at the end of the Fund's Schedule of Investments.
Annual Report
4. Derivative Instruments.
Risk Exposures and the Use of Derivative Instruments. The Fund's investment objective allows the Fund to enter into various types of derivative contracts, including futures contracts. Derivatives are investments whose value is primarily derived from underlying assets, indices or reference rates and may be transacted on an exchange or over-the-counter (OTC). Derivatives may involve a future commitment to buy or sell a specified asset based on specified terms, to exchange future cash flows at periodic intervals based on a notional principal amount, or for one party to make one or more payments upon the occurrence of specified events in exchange for periodic payments from the other party.
The Fund used derivatives to increase returns and to manage exposure to certain risks as defined below. The success of any strategy involving derivatives depends on analysis of numerous economic factors, and if the strategies for investment do not work as intended, the Fund may not achieve its objectives.
The Fund's use of derivatives increased or decreased its exposure to the following risk:
Equity Risk | Equity risk relates to the fluctuations in the value of financial instruments as a result of changes in market prices (other than those arising from interest rate risk or foreign exchange risk), whether caused by factors specific to an individual investment, its issuer, or all factors affecting all instruments traded in a market or market segment. |
The Fund is also exposed to additional risks from investing in derivatives, such as liquidity risk and counterparty credit risk. Liquidity risk is the risk that the Fund will be unable to close out the derivative in the open market in a timely manner. Counterparty credit risk is the risk that the counterparty will not be able to fulfill its obligation to the Fund. Counterparty credit risk related to exchange-traded futures contracts may be mitigated by the protection provided by the exchange on which they trade.
Investing in derivatives may involve greater risks than investing in the underlying assets directly and, to varying degrees, may involve risk of loss in excess of any initial investment and collateral received and amounts recognized in the Statement of Assets and Liabilities. In addition, there may be the risk that the change in value of the derivative contract does not correspond to the change in value of the underlying instrument.
Futures Contracts. A futures contract is an agreement between two parties to buy or sell a specified underlying instrument for a fixed price at a specified future date. The Fund used futures contracts to manage its exposure to the stock market.
Upon entering into a futures contract, a fund is required to deposit either cash or securities (initial margin) with a clearing broker in an amount equal to a certain percentage of the face value of the contract. Futures contracts are marked-to-market daily and subsequent daily payments (variation margin) are made or received by a fund depending on
Annual Report
Notes to Financial Statements - continued
(Amounts in thousands except percentages)
4. Derivative Instruments - continued
Futures Contracts - continued
the daily fluctuations in the value of the futures contracts and are recorded as unrealized appreciation or (depreciation). This receivable and/or payable, if any, is included in daily variation margin for derivative instruments in the Statement of Assets and Liabilities. Realized gain or (loss) is recorded upon the expiration or closing of a futures contract.
Any open futures contracts at period end are presented in the Schedule of Investments under the caption "Futures Contracts." The underlying face amount at value reflects each contract's exposure to the underlying instrument or index at period end.
During the period the Fund recognized net realized gain (loss) of $9,288 related to its investment in futures contracts. This amount is included in the Statement of Operations.
5. Purchases and Sales of Investments.
Purchases and sales of securities, other than short-term securities, aggregated $11,661,633 and $13,650,095, respectively.
6. Fees and Other Transactions with Affiliates.
Management Fee. Fidelity Management & Research Company (the investment adviser) and its affiliates provide the Fund with investment management related services for which the Fund pays a monthly management fee. The management fee is the sum of an individual fund fee rate that is based on an annual rate of .30% of the Fund's average net assets and an annualized group fee rate that averaged .25% during the period. The group fee rate is based upon the average net assets of all the mutual funds advised by the investment adviser, including any mutual funds previously advised by the investment adviser that are currently advised by Fidelity SelectCo, LLC, an affiliate of the investment adviser. The group fee rate decreases as assets under management increase and increases as assets under management decrease. In addition, the management fee is subject to a performance adjustment (up to a maximum of ± .20% of the Fund's average net assets over a 36 month performance period). The upward or downward adjustment to the management fee is based on the relative investment performance of Magellan as compared to its benchmark index, the S&P 500 Index, over the same 36 month performance period. For the reporting period, the total annual management fee rate, including the performance adjustment, was .33% of the Fund's average net assets. The performance adjustment included in the management fee rate may be higher or lower than the maximum performance adjustment rate due to the difference between the average net assets for the reporting and performance periods.
Transfer Agent Fees. Fidelity Investments Institutional Operations Company, Inc., (FIIOC), an affiliate of the investment adviser, is the transfer, dividend disbursing and
Annual Report
6. Fees and Other Transactions with Affiliates - continued
Transfer Agent Fees - continued
shareholder servicing agent for each class of the Fund. FIIOC receives account fees and asset-based fees that vary according to the account size and type of account of the shareholders of Magellan. FIIOC receives an asset-based fee of Class K's average net assets. FIIOC pays for typesetting, printing and mailing of shareholder reports, except proxy statements.
For the period, transfer agent fees for each class were as follows:
| Amount | % of |
Magellan | $ 19,746 | .15 |
Class K | 1,200 | .05 |
| $ 20,946 |
|
Accounting and Security Lending Fees. Fidelity Service Company, Inc. (FSC), an affiliate of the investment adviser, maintains the Fund's accounting records. The accounting fee is based on the level of average net assets for each month. Under a separate contract, FSC administers the security lending program. The security lending fee is based on the number and duration of lending transactions.
Brokerage Commissions. The Fund placed a portion of its portfolio transactions with brokerage firms which are affiliates of the investment adviser. Brokerage commissions are included in net realized gain (loss) and change in net unrealized appreciation (depreciation) in the Statement of Operations. The commissions paid to these affiliated firms were $300 for the period.
Other. During the period, the investment adviser reimbursed the Fund for certain losses in the amount of $54.
7. Committed Line of Credit.
The Fund participates with other funds managed by the investment adviser or an affiliate in a $4.25 billion credit facility (the "line of credit") to be utilized for temporary or emergency purposes to fund shareholder redemptions or for other short-term liquidity purposes. The Fund has agreed to pay commitment fees on its pro-rata portion of the line of credit, which amounted to $28 and is reflected in Miscellaneous expenses on the Statement of Operations. During the period, there were no borrowings on this line of credit.
8. Security Lending.
The Fund lends portfolio securities through a lending agent from time to time in order to earn additional income. For equity securities, a lending agent is used and may loan
Annual Report
Notes to Financial Statements - continued
(Amounts in thousands except percentages)
8. Security Lending - continued
securities to certain qualified borrowers, including Fidelity Capital Markets (FCM), a broker-dealer affiliated with the Fund. On the settlement date of the loan, the Fund receives collateral (in the form of U.S. Treasury obligations, letters of credit and/or cash) against the loaned securities and maintains collateral in an amount not less than 100% of the market value of the loaned securities during the period of the loan. The market value of the loaned securities is determined at the close of business of the Fund and any additional required collateral is delivered to the Fund on the next business day. If the borrower defaults on its obligation to return the securities loaned because of insolvency or other reasons, the Fund may apply collateral received from the borrower against the obligation. The Fund may experience delays and costs in recovering the securities loaned. Any cash collateral received is invested the Fidelity Securities Lending Cash Central Fund. The value of loaned securities and cash collateral at period end are disclosed on the Fund's Statement of Assets and Liabilities. At period end, there were no security loans outstanding with FCM. Security lending income represents the income earned on investing cash collateral, less rebates paid to borrowers and any lending agent fees associated with the loan, plus any premium payments received for lending certain types of securities. Security lending income is presented in the Statement of Operations as a component of income from Fidelity Central Funds. Total security lending income during the period amounted to $838, including $3 from securities loaned to FCM.
9. Expense Reductions.
Commissions paid to certain brokers with whom the investment adviser, or its affiliates, places trades on behalf of the Fund include an amount in addition to trade execution, which may be rebated back to the Fund to offset certain expenses. This amount totaled $191 for the period.
In addition, the investment adviser reimbursed a portion of the Fund's operating expenses during the period in the amount of $124.
10. Distributions to Shareholders.
Distributions to shareholders of each class were as follows:
Years ended March 31, | 2014 | 2013 |
From net investment income |
|
|
Magellan | $ 94,191 | $ 166,004 |
Class K | 21,472 | 35,831 |
Total | $ 115,663 | $ 201,835 |
Annual Report
10. Distributions to Shareholders - continued
Years ended March 31, | 2014 | 2013 |
From net realized gain |
|
|
Magellan | $ 814,542 | $ 3,417 |
Class K | 161,954 | 680 |
Total | $ 976,496 | $ 4,097 |
11. Share Transactions.
Transactions for each class of shares were as follows:
| Shares | Dollars | ||
Years ended March 31, | 2014 | 2013 | 2014 | 2013 |
Magellan |
|
|
|
|
Shares sold | 3,294 | 3,516 | $ 293,533 | $ 256,383 |
Reinvestment of distributions | 9,695 | 2,238 | 866,714 | 161,604 |
Shares redeemed | (23,873) | (37,834) | (2,081,525) | (2,743,347) |
Net increase (decrease) | (10,884) | (32,080) | $ (921,278) | $ (2,325,360) |
Class K |
|
|
|
|
Shares sold | 2,046 | 7,910 | $ 182,347 | $ 566,429 |
Reinvestment of distributions | 2,055 | 506 | 183,425 | 36,510 |
Shares redeemed | (6,998) | (16,489) | (621,224) | (1,193,749) |
Net increase (decrease) | (2,897) | (8,073) | $ (255,452) | $ (590,810) |
12. Other.
The Fund's organizational documents provide former and current trustees and officers with a limited indemnification against liabilities arising in connection with the performance of their duties to the Fund. In the normal course of business, the Fund may also enter into contracts that provide general indemnifications. The Fund's maximum exposure under these arrangements is unknown as this would be dependent on future claims that may be made against the Fund. The risk of material loss from such claims is considered remote.
Annual Report
Report of Independent Registered Public Accounting Firm
To the Trustees and Shareholders of Fidelity Magellan Fund:
In our opinion, the accompanying statement of assets and liabilities, including the schedule of investments, and the related statements of operations and of changes in net assets and the financial highlights present fairly, in all material respects, the financial position of Fidelity Magellan Fund at March 31, 2014 the results of its operations for the year then ended, the changes in its net assets for each of the two years in the period then ended and the financial highlights for each of the five years in the period then ended, in conformity with accounting principles generally accepted in the United States of America. These financial statements and financial highlights (hereafter referred to as "financial statements") are the responsibility of the Fidelity Magellan Fund's management. Our responsibility is to express an opinion on these financial statements based on our audits. We conducted our audits of these financial statements in accordance with the standards of the Public Company Accounting Oversight Board (United States). Those standards require that we plan and perform the audit to obtain reasonable assurance about whether the financial statements are free of material misstatement. An audit includes examining, on a test basis, evidence supporting the amounts and disclosures in the financial statements, assessing the accounting principles used and significant estimates made by management, and evaluating the overall financial statement presentation. We believe that our audits, which included confirmation of securities at March 31, 2014 by correspondence with the custodian and brokers, provide a reasonable basis for our opinion.
PricewaterhouseCoopers LLP
Boston, Massachusetts
May 14, 2014
Annual Report
Trustees and Officers
The Trustees, Member of the Advisory Board, and officers of the trust and fund, as applicable, are listed below. The Board of Trustees governs the fund and is responsible for protecting the interests of shareholders. The Trustees are experienced executives who meet periodically throughout the year to oversee the fund's activities, review contractual arrangements with companies that provide services to the fund, oversee management of the risks associated with such activities and contractual arrangements, and review the fund's performance. Except for James C. Curvey, Ned C. Lautenbach, and William S. Stavropoulos, each of the Trustees oversees 172 funds. Mr. Curvey oversees 395 funds. Mr. Lautenbach and Mr. Stavropoulos each oversees 246 funds.
The Trustees hold office without limit in time except that (a) any Trustee may resign; (b) any Trustee may be removed by written instrument, signed by at least two-thirds of the number of Trustees prior to such removal; (c) any Trustee who requests to be retired or who has become incapacitated by illness or injury may be retired by written instrument signed by a majority of the other Trustees; and (d) any Trustee may be removed at any special meeting of shareholders by a two-thirds vote of the outstanding voting securities of the trust. Each Trustee who is not an interested person (as defined in the 1940 Act) of the trust and the fund (Independent Trustee), shall retire not later than the last day of the calendar year in which his or her 75th birthday occurs. The Independent Trustees may waive this mandatory retirement age policy with respect to individual Trustees. The officers and Advisory Board Member hold office without limit in time, except that any officer and Advisory Board Member may resign or may be removed by a vote of a majority of the Trustees at any regular meeting or any special meeting of the Trustees. Except as indicated, each individual has held the office shown or other offices in the same company for the past five years.
Experience, Skills, Attributes, and Qualifications of the Fund's Trustees. The Governance and Nominating Committee has adopted a statement of policy that describes the experience, qualifications, attributes, and skills that are necessary and desirable for potential Independent Trustee candidates (Statement of Policy). The Board believes that each Trustee satisfied at the time he or she was initially elected or appointed a Trustee, and continues to satisfy, the standards contemplated by the Statement of Policy. The Governance and Nominating Committee also engages professional search firms to help identify potential Independent Trustee candidates who have the experience, qualifications, attributes, and skills consistent with the Statement of Policy. From time to time, additional criteria based on the composition and skills of the current Independent Trustees, as well as experience or skills that may be appropriate in light of future changes to board composition, business conditions, and regulatory or other developments, have also been considered by the professional search firms and the Governance and Nominating Committee. In addition, the Board takes into account the Trustees' commitment and participation in Board and committee meetings, as well as their leadership of standing and ad hoc committees throughout their tenure.
In determining that a particular Trustee was and continues to be qualified to serve as a Trustee, the Board has considered a variety of criteria, none of which, in isolation, was controlling. The Board believes that, collectively, the Trustees have balanced and diverse experience, qualifications, attributes, and skills, which allow the Board to operate effectively in governing the fund and protecting the interests of shareholders. Information about the specific experience, skills, attributes, and qualifications of each Trustee, which in each case led to the Board's conclusion that the Trustee should serve (or continue to serve) as a trustee of the fund, is provided below.
Annual Report
Board Structure and Oversight Function. James C. Curvey is an interested person (as defined in the 1940 Act) and currently serves as Chairman. The Trustees have determined that an interested Chairman is appropriate and benefits shareholders because an interested Chairman has a personal and professional stake in the quality and continuity of services provided to the fund. Independent Trustees exercise their informed business judgment to appoint an individual of their choosing to serve as Chairman, regardless of whether the Trustee happens to be independent or a member of management. The Independent Trustees have determined that they can act independently and effectively without having an Independent Trustee serve as Chairman and that a key structural component for assuring that they are in a position to do so is for the Independent Trustees to constitute a substantial majority for the Board. The Independent Trustees also regularly meet in executive session. Ned C. Lautenbach serves as Chairman of the Independent Trustees and as such (i) acts as a liaison between the Independent Trustees and management with respect to matters important to the Independent Trustees and (ii) with management prepares agendas for Board meetings.
Fidelity funds are overseen by different Boards of Trustees. The fund's Board oversees Fidelity's equity and high income funds and another Board oversees Fidelity's investment-grade bond, money market, and asset allocation funds. The asset allocation funds may invest in Fidelity funds overseen by the fund's Board. The use of separate Boards, each with its own committee structure, allows the Trustees of each group of Fidelity funds to focus on the unique issues of the funds they oversee, including common research, investment, and operational issues. On occasion, the separate Boards establish joint committees to address issues of overlapping consequences for the Fidelity funds overseen by each Board.
The Trustees operate using a system of committees to facilitate the timely and efficient consideration of all matters of importance to the Trustees, the fund, and fund shareholders and to facilitate compliance with legal and regulatory requirements and oversight of the fund's activities and associated risks. The Board, acting through its committees, has charged FMR and its affiliates with (i) identifying events or circumstances the occurrence of which could have demonstrably adverse effects on the fund's business and/or reputation; (ii) implementing processes and controls to lessen the possibility that such events or circumstances occur or to mitigate the effects of such events or circumstances if they do occur; and (iii) creating and maintaining a system designed to evaluate continuously business and market conditions in order to facilitate the identification and implementation processes described in (i) and (ii) above. Because the day-to-day operations and activities of the fund are carried out by or through FMR, its affiliates and other service providers, the fund's exposure to risks is mitigated but not eliminated by the processes overseen by the Trustees. While each of the Board's committees has responsibility for overseeing different aspects of the fund's activities, oversight is exercised primarily through the Operations, Audit, and Compliance Committees. In addition, the Independent Trustees have worked with FMR to enhance the Board's oversight of investment and financial risks, legal and regulatory risks, technology risks, and operational risks, including the development of additional risk reporting to the Board. For example, a working group comprised of Independent Trustees and FMR has worked and continues to work to review the Fidelity funds' valuation-related activities, reporting and risk management. Appropriate personnel, including but not limited to the fund's Chief Compliance Officer (CCO), FMR's internal auditor, the independent accountants, the fund's Treasurer and portfolio management personnel, make periodic reports to the Board's committees, as appropriate, including an annual review of FMR's risk management program for the Fidelity funds. The responsibilities of each standing committee, including their oversight responsibilities, are described further under "Standing Committees of the Fund's Trustees."
Annual Report
Trustees and Officers - continued
The fund's Statement of Additional Information (SAI) includes more information about the Trustees. To request a free copy, call Fidelity at 1-800-544-8544.
Interested Trustees*:
Correspondence intended for each Trustee who is an interested person may be sent to Fidelity Investments, 245 Summer Street, Boston, Massachusetts 02210.
Name, Year of Birth; Principal Occupations and Other Relevant Experience+ | |
James C. Curvey (1935) | |
Year of Election or Appointment: 2007 Trustee Chairman of the Board of Trustees | |
| Mr. Curvey also serves as Trustee of other Fidelity funds. Mr. Curvey is a Director of Fidelity Investments Money Management, Inc. (2009-present), Director of Fidelity Research & Analysis Co. (2009-present) and Director of FMR and FMR Co., Inc. (2007-present). Mr. Curvey is also Vice Chairman (2007-present) and Director of FMR LLC. In addition, Mr. Curvey serves as an Overseer for the Boston Symphony Orchestra and a member of the Trustees of Villanova University. Previously, Mr. Curvey was the Vice Chairman (2006-2007) and Director (2000-2007) of FMR Corp. |
Charles S. Morrison (1960) | |
Year of Election or Appointment: 2014 Trustee | |
| Mr. Morrison also serves as Trustee or Vice President of other funds. He serves as President, Asset Management (2014-present) and is an employee of Fidelity Investments. Previously, Mr. Morrison served as President, Fixed Income (2011-2014), Vice President of Fidelity's Money Market Funds (2005-2009), President, Money Market Group Leader of FMR (2009), and Senior Vice President, Money Market Group of FMR (2004-2009). Mr. Morrison also served as Vice President of Fidelity's Bond Funds (2002-2005), certain Balanced Funds (2002-2005), and certain Asset Allocation Funds (2002-2007), and as Senior Vice President (2002-2005) of Fidelity's Bond Division. |
* Trustees have been determined to be "Interested Trustees" by virtue of, among other things, their affiliation with the trust or various entities under common control with FMR.
+ The information above includes each Trustee's principal occupation during the last five years and other information relating to the experience, attributes, and skills relevant to each Trustee's qualifications to serve as a Trustee, which led to the conclusion that each Trustee should serve as a Trustee for the fund.
Annual Report
Trustees and Officers - continued
Independent Trustees:
Correspondence intended for each Independent Trustee (that is, the Trustees other than the Interested Trustees) may be sent to Fidelity Investments, P.O. Box 55235, Boston, Massachusetts 02205-5235.
Name, Year of Birth; Principal Occupations and Other Relevant Experience+ | |
Dennis J. Dirks (1948) | |
Year of Election or Appointment: 2005 Trustee | |
| Mr. Dirks also serves as Trustee of other Fidelity funds. Prior to his retirement in May 2003, Mr. Dirks was Chief Operating Officer and a member of the Board of The Depository Trust & Clearing Corporation (DTCC). He also served as President, Chief Operating Officer, and Board member of The Depository Trust Company (DTC) and President and Board member of the National Securities Clearing Corporation (NSCC). In addition, Mr. Dirks served as Chief Executive Officer and Board member of the Government Securities Clearing Corporation, Chief Executive Officer and Board member of the Mortgage-Backed Securities Clearing Corporation, as a Trustee and a member of the Finance Committee of Manhattan College (2005-2008), and as a Trustee and a member of the Finance Committee of AHRC of Nassau County (2006-2008). Mr. Dirks is a member of the Independent Directors Council (IDC) Governing Council (2010-present) and Board of Directors for The Brookville Center for Children's Services, Inc. (2009-present). |
Alan J. Lacy (1953) | |
Year of Election or Appointment: 2008 Trustee | |
| Mr. Lacy also serves as Trustee of other Fidelity funds. Mr. Lacy serves as Senior Adviser (2007-present) of Oak Hill Capital Partners, L.P. (private equity). Mr. Lacy also served as Chief Executive Officer (2000-2005) and Vice Chairman (2005-2006) of Sears Holdings Corporation and Sears, Roebuck and Co. (retail). In addition, Mr. Lacy serves as a member of the Board of Directors of Dave & Buster's Entertainment, Inc. (restaurant and entertainment complexes, 2010-present), Earth Fare, Inc. (retail grocery, 2012-present), The Hillman Companies, Inc. (hardware wholesalers, 2010-present), and Bristol-Myers Squibb Company (global pharmaceuticals, 2008-present). Mr. Lacy is a member of the Board of Trustees of The National Parks Conservation Association (2006-present). Previously, Mr. Lacy served as Chairman of the Board of Trustees of the National Parks Conservation Association (2008-2011) and as a member of the Board of Directors for the Western Union Company (global money transfer, 2006-2011). |
Ned C. Lautenbach (1944) | |
Year of Election or Appointment: 2000 Trustee Chairman of the Independent Trustees | |
| Mr. Lautenbach also serves as Trustee of other Fidelity funds. Mr. Lautenbach currently serves as the Lead Director of the Eaton Corporation Board of Directors (diversified industrial, 1997-present). Mr. Lautenbach is Chairman of the Board of Directors of the Philharmonic Center for the Arts in Naples, Florida (2012-present) and a member of the Council on Foreign Relations (1994-present). Previously, Mr. Lautenbach was a Partner/Advisory Partner at Clayton, Dubilier & Rice, LLC (private equity investment, 1998-2010), as well as a Director of Sony Corporation (2006-2007). |
Joseph Mauriello (1944) | |
Year of Election or Appointment: 2008 Trustee | |
| Mr. Mauriello also serves as Trustee of other Fidelity funds. Prior to his retirement in January 2006, Mr. Mauriello served in numerous senior management positions including Deputy Chairman and Chief Operating Officer (2004-2005), and Vice Chairman of Financial Services (2002-2004) of KPMG LLP US (professional services, 1965-2005). Mr. Mauriello currently serves as a member of the Board of Directors of XL Group plc. (global insurance and re-insurance, 2006-present). Previously, Mr. Mauriello served as a Director of the Hamilton Funds of the Bank of New York (2006-2007) and of Arcadia Resources Inc. (health care services and products, 2007-2012). |
Robert W. Selander (1950) | |
Year of Election or Appointment: 2011 Trustee | |
| Mr. Selander also serves as Trustee of other Fidelity funds. Previously, Mr. Selander served as a Member of the Advisory Board of other Fidelity funds (2011), and Executive Vice Chairman (2010), Chief Executive Officer (2009-2010), and President and Chief Executive Officer (1997-2009) of Mastercard, Inc. |
Cornelia M. Small (1944) | |
Year of Election or Appointment: 2005 Trustee | |
| Ms. Small also serves as Trustee of other Fidelity funds. Ms. Small is a member of the Board of Directors (2009-present) and Chair of the Investment Committee (2010-present) of the Teagle Foundation. Ms. Small also serves on the Investment Committee of the Berkshire Taconic Community Foundation (2008-present). Previously, Ms. Small served as Chairperson (2002-2008) and a member of the Investment Committee and Chairperson (2008-2012) and a member of the Board of Trustees of Smith College. In addition, Ms. Small served as Chief Investment Officer, Director of Global Equity Investments, and a member of the Board of Directors of Scudder, Stevens & Clark and Scudder Kemper Investments. |
William S. Stavropoulos (1939) | |
Year of Election or Appointment: 2001 Trustee Vice Chairman of the Independent Trustees | |
| Mr. Stavropoulos also serves as Trustee of other Fidelity funds. Mr. Stavropoulos serves as President and Founder of the Michigan Baseball Foundation, the Great Lakes Loons (2007-present). Mr. Stavropoulos is Chairman Emeritus of the Board of Directors of The Dow Chemical Company, where he previously served in numerous senior management positions, including President, CEO (1995-2000; 2002-2004), Chairman of the Executive Committee (2000-2006), and as a member of the Board of Directors (1990-2006). Currently, Mr. Stavropoulos is Chairman of the Board of Directors of Univar Inc. (global distributor of commodity and specialty chemicals), a Director of Teradata Corporation (data warehousing and technology solutions), and Maersk Inc. (industrial conglomerate), and a member of the Advisory Board for Metalmark Capital LLC (private equity investment, 2005-present). Mr. Stavropoulos is an operating advisor to Clayton, Dubilier & Rice, LLC (private equity investment). In addition, Mr. Stavropoulos is a member of the University of Notre Dame Advisory Council for the College of Science, a Trustee of the Rollin L. Gerstacker Foundation, and a Director of the Naples Philharmonic Center for the Arts. Previously, Mr. Stavropoulos served as a Director of Chemical Financial Corporation (bank holding company, 1993-2012) and Tyco International, Ltd. (multinational manufacturing and services, 2007-2012). |
David M. Thomas (1949) | |
Year of Election or Appointment: 2008 Trustee | |
| Mr. Thomas also serves as Trustee of other Fidelity funds. Mr. Thomas serves as Non-Executive Chairman of the Board of Directors of Fortune Brands Home and Security (home and security products, 2011-present), and as a member of the Board of Directors of Interpublic Group of Companies, Inc. (marketing communication, 2004-present). Previously, Mr. Thomas served as Executive Chairman (2005-2006) and Chairman and Chief Executive Officer (2000-2005) of IMS Health, Inc. (pharmaceutical and healthcare information solutions), and a Director of Fortune Brands, Inc. (consumer products, 2000-2011). |
+ The information above includes each Trustee's principal occupation during the last five years and other information relating to the experience, attributes, and skills relevant to each Trustee's qualifications to serve as a Trustee, which led to the conclusion that each Trustee should serve as a Trustee for the fund.
Advisory Board Member and Officers:
Correspondence intended for each officer and Peter S. Lynch may be sent to Fidelity Investments, 245 Summer Street, Boston, Massachusetts 02210. Officers appear below in alphabetical order.
Name, Year of Birth; Principal Occupation | |
Peter S. Lynch (1944) | |
Year of Election or Appointment: 2003 Member of the Advisory Board | |
| Mr. Lynch also serves as Member of the Advisory Board of other Fidelity funds. Mr. Lynch is Vice Chairman and a Director of FMR and FMR Co., Inc. In addition, Mr. Lynch serves as a Trustee of Boston College and as the Chairman of the Inner-City Scholarship Fund. Previously, Mr. Lynch served on the Special Olympics International Board of Directors (1997-2006). |
Elizabeth Paige Baumann (1968) | |
Year of Election or Appointment: 2012 Anti-Money Laundering (AML) Officer | |
| Ms. Baumann also serves as AML Officer of other funds. She is Chief AML Officer of FMR LLC (2012-present) and is an employee of Fidelity Investments. Previously, Ms. Baumann served as Vice President and Deputy Anti-Money Laundering Officer (2007-2012). |
William C. Coffey (1969) | |
Year of Election or Appointment: 2009 Assistant Secretary | |
| Mr. Coffey also serves as Assistant Secretary of other funds. He is Senior Vice President and Deputy General Counsel of FMR LLC (2010-present), and is an employee of Fidelity Investments. Previously, Mr. Coffey served as Vice President and Associate General Counsel of FMR LLC (2005-2009). |
Jonathan Davis (1968) | |
Year of Election or Appointment: 2010 Assistant Treasurer | |
| Mr. Davis also serves as Assistant Treasurer of other funds. Mr. Davis is an employee of Fidelity Investments. Previously, Mr. Davis served as Vice President and Associate General Counsel of FMR LLC (2003-2010). |
Adrien E. Deberghes (1967) | |
Year of Election or Appointment: 2008 Deputy Treasurer | |
| Mr. Deberghes also serves as an officer of other funds. He is an employee of Fidelity Investments (2008-present). Prior to joining Fidelity Investments, Mr. Deberghes was Senior Vice President of Mutual Fund Administration at State Street Corporation (2007-2008), Senior Director of Mutual Fund Administration at Investors Bank & Trust (2005-2007), and Director of Finance for Dunkin' Brands (2000-2005). |
Stephanie J. Dorsey (1969) | |
Year of Election or Appointment: 2010 Assistant Treasurer | |
| Ms. Dorsey also serves as an officer of other funds. She is an employee of Fidelity Investments (2008-present) and has served in other fund officer roles. Prior to joining Fidelity Investments, Ms. Dorsey served as Treasurer (2004-2008) of the JPMorgan Mutual Funds and Vice President (2004-2008) of JPMorgan Chase Bank. |
Scott C. Goebel (1968) | |
Year of Election or Appointment: 2008 Secretary and Chief Legal Officer (CLO) | |
| Mr. Goebel serves as Secretary and CLO of other funds. Mr. Goebel also serves as Secretary of Fidelity SelectCo, LLC (2013-present), Fidelity Investments Money Management, Inc. (FIMM) (2010-present) and Fidelity Research and Analysis Company (FRAC) (2010-present); General Counsel, Secretary, and Senior Vice President of FMR (2008-present) and FMR Co., Inc. (2008-present); Chief Legal Officer of Fidelity Management & Research (Hong Kong) Limited (2008-present); and Assistant Secretary of Fidelity Management & Research (Japan) Inc. (2008-present) and Fidelity Management & Research (U.K.) Inc. (2008-present). Previously, Mr. Goebel served as Secretary and CLO of other Fidelity funds (2008-2013), Assistant Secretary of FIMM (2008-2010), FRAC (2008-2010), and certain funds (2007-2008); and as Vice President and Secretary of Fidelity Distributors Corporation (FDC) (2005-2007). Mr. Goebel has been employed by FMR LLC or an affiliate since 2001. |
Joseph A. Hanlon (1968) | |
Year of Election or Appointment: 2012 Chief Compliance Officer | |
| Mr. Hanlon also serves as Chief Compliance Officer of other funds. Mr. Hanlon serves as Compliance Officer of FMR, FMR Co., Inc., Fidelity Investments Money Management, Inc. (FIMM), and Fidelity Research and Analysis Company (FRAC), as Senior Vice President of the Fidelity Asset Management Division (2009-present), and is an employee of Fidelity Investments. Previously, Mr. Hanlon served as Compliance Officer of Fidelity Management & Research (Hong Kong) (2009-2014), Fidelity Management & Research (Japan) Inc. (2009-2013), Strategic Advisers, Inc. (2009-2013), and Fidelity Management & Research (U.K.) Inc. (2009-2013). |
Bruce T. Herring (1965) | |
Year of Election or Appointment: 2006 Vice President of certain Equity Funds | |
| Mr. Herring also serves as Vice President of other funds. He serves as Chief Investment Officer of Fidelity Global Asset Allocation (GAA) (2013-present), Group Chief Investment Officer of FMR, and President of Fidelity Research & Analysis Company (2010-present). Previously, Mr. Herring served as Chief Investment Officer and Director of Fidelity Management & Research (U.K.) Inc. (2010-2013), Vice President (2005-2006) and Senior Vice President (2006-2007) of Fidelity Management & Research Company, Vice President of FMR Co., Inc. (2001-2007), and as a portfolio manager for Fidelity U.S. Equity Funds. |
Brian B. Hogan (1964) | |
Year of Election or Appointment: 2009 Vice President | |
| Mr. Hogan also serves as Trustee or Vice President of other funds. Mr. Hogan serves as President of FMR's Equity Division (2009-present). Previously, Mr. Hogan served as Senior Vice President, Equity Research of FMR (2006-2009) and as a portfolio manager. |
Chris Maher (1972) | |
Year of Election or Appointment: 2013 Assistant Treasurer | |
| Mr. Maher serves as Assistant Treasurer of other funds. Mr. Maher is Vice President of Valuation Oversight and is an employee of Fidelity Investments. Previously, Mr. Maher served as Vice President of Asset Management Compliance (2013), Vice President of FMR's Program Management Group (2010-2013), and Vice President of Valuation Oversight (2008-2010). |
Christine Reynolds (1958) | |
Year of Election or Appointment: 2008 Chief Financial Officer | |
| Ms. Reynolds also serves as Chief Financial Officer of other funds. Ms. Reynolds became President of Fidelity Pricing and Cash Management Services (FPCMS) in August 2008. Ms. Reynolds served as Chief Operating Officer of FPCMS (2007-2008). Previously, Ms. Reynolds served as President, Treasurer, and Anti-Money Laundering officer of the Fidelity funds (2004-2007). |
Kenneth B. Robins (1969) | |
Year of Election or Appointment: 2008 President and Treasurer | |
| Mr. Robins also serves as an officer of other funds. Mr. Robins serves as Executive Vice President of Fidelity Investments Money Management, Inc. (FIMM) (2013-present) and is an employee of Fidelity Investments (2004-present). Previously, Mr. Robins served in other fund officer roles. |
Stephen Sadoski (1971) | |
Year of Election or Appointment: 2012 Deputy Treasurer | |
| Mr. Sadoski also serves as Deputy Treasurer of other funds. He is an employee of Fidelity Investments (2012-present) and has served in another fund officer role. Prior to joining Fidelity Investments, Mr. Sadoski served as an assistant chief accountant in the Division of Investment Management of the Securities and Exchange Commission (SEC) (2009-2012) and as a senior manager at Deloitte & Touche LLP (1997-2009). |
Stacie M. Smith (1974) | |
Year of Election or Appointment: 2013 Deputy Treasurer | |
| Ms. Smith also serves as an officer of other funds. She is an employee of Fidelity Investments (2009-present) and has served in other fund officer roles. Prior to joining Fidelity Investments, Ms. Smith served as Senior Audit Manager of Ernst & Young LLP (1996-2009). |
Renee Stagnone (1975) | |
Year of Election or Appointment: 2013 Deputy Treasurer | |
| Ms. Stagnone also serves as Deputy Treasurer of other funds. Ms. Stagnone is an employee of Fidelity Investments. |
Joseph F. Zambello (1957) | |
Year of Election or Appointment: 2011 Deputy Treasurer | |
| Mr. Zambello also serves as Deputy Treasurer of other funds. Mr. Zambello is an employee of Fidelity Investments. Previously, Mr. Zambello served as Vice President of FMR's Program Management Group (2009-2011) and Vice President of the Transfer Agent Oversight Group (2005-2009). |
Annual Report
Distributions (Unaudited)
The Board of Trustees of Fidelity Magellan Fund voted to pay shareholders of record at the opening of business on record date, the following distributions per share derived from capital gains realized from sales of portfolio securities, and dividends derived from net investment income:
| Pay Date | Record Date | Dividends | Capital Gains |
Magellan | 05/05/14 | 05/02/14 | $0.177 | $5.586 |
The fund hereby designates as capital gain dividend with respect to the taxable year ended March 31, 2014, $1,164,345,693, or, if subsequently determined to be different, the net capital gain of such year.
Magellan designates 100% and 28% of the dividends distributed in May and December, respectively during the fiscal year as qualifying for the dividend-received deduction for corporate shareholders.
Magellan designates 100% and 30% of each dividend distributed in May and December, respectively during the fiscal year as amounts which may be taken into account as a dividend for purposes of the maximum rate under section 1(h)(11) of the Internal Revenue Code.
The fund will notify shareholders in January 2015 of amounts for use in preparing 2014 income tax returns.
Annual Report
Investment Adviser
Fidelity Management &
Research Company
Boston, MA
Investment Sub-Advisers
FMR Co., Inc.
Fidelity Management & Research
(U.K.) Inc.
Fidelity Management & Research
(Japan) Inc.
Fidelity Management & Research
(Hong Kong) Limited
General Distributor
Fidelity Distributors Corporation
Smithfield, RI
Transfer and Service Agents
Fidelity Investments Institutional
Operations Company, Inc.
Boston, MA
Fidelity Service Company, Inc.
Boston, MA
Custodian
State Street Bank and Trust Company Quincy, MA
The Fidelity Telephone Connection
Mutual Fund 24-Hour Service
Exchanges/Redemptions
and Account Assistance 1-800-544-6666
Product Information 1-800-544-6666
Retirement Accounts 1-800-544-4774
(8 a.m. - 9 p.m.)
TDD Service 1-800-544-0118
for the deaf and hearing impaired
(9 a.m. - 9 p.m. Eastern time)
Fidelity Automated Service
Telephone (FAST®)
1-800-544-5555
Automated line for quickest service
(Fidelity Investment logo)(registered trademark)
Corporate Headquarters
245 Summer St., Boston, MA 02210
www.fidelity.com
MAG-UANN-0514
1.927080.103
Fidelity®
Magellan®
Fund -
Class K
Annual Report
March 31, 2014
(Fidelity Cover Art)
Contents
Performance | How the fund has done over time. | |
Management's Discussion of Fund Performance | The Portfolio Manager's review of fund performance and strategy. | |
Shareholder Expense Example | An example of shareholder expenses. | |
Investment Changes | A summary of major shifts in the fund's investments over the past six months. | |
Investments | A complete list of the fund's investments with their market values. | |
Financial Statements | Statements of assets and liabilities, operations, and changes in net assets, as well as financial highlights. | |
Notes | Notes to the financial statements. | |
Report of Independent Registered Public Accounting Firm |
| |
Trustees and Officers |
| |
Distributions |
|
To view a fund's proxy voting guidelines and proxy voting record for the 12-month period ended June 30, visit http://www.fidelity.com/proxyvotingresults or visit the Securities and Exchange Commission's (SEC) website at http://www.sec.gov. You may also call 1-800-835-5092 to request a free copy of the proxy voting guidelines.
Standard & Poor's, S&P and S&P 500 are registered service marks of The McGraw-Hill Companies, Inc. and have been licensed for use by Fidelity Distributors Corporation.
Other third-party marks appearing herein are the property of their respective owners.
All other marks appearing herein are registered or unregistered trademarks or service marks of FMR LLC or an affiliated company. © 2014 FMR LLC. All rights reserved.
Annual Report
This report and the financial statements contained herein are submitted for the general information of the shareholders of the fund. This report is not authorized for distribution to prospective investors in the fund unless preceded or accompanied by an effective prospectus.
A fund files its complete schedule of portfolio holdings with the SEC for the first and third quarters of each fiscal year on Form N-Q. Forms N-Q are available on the SEC's web site at http://www.sec.gov. A fund's Forms N-Q may be reviewed and copied at the SEC's Public Reference Room in Washington, DC. Information regarding the operation of the SEC's Public Reference Room may be obtained by calling 1-800-SEC-0330. For a complete list of a fund's portfolio holdings, view the most recent holdings listing, semiannual report, or annual report on Fidelity's web site at http://www.fidelity.com, http://www.advisor.fidelity.com, or http://www.401k.com, as applicable.
NOT FDIC INSURED • MAY LOSE VALUE • NO BANK GUARANTEE
Neither the fund nor Fidelity Distributors Corporation is a bank.
Annual Report
Performance: The Bottom Line
Average annual total return reflects the change in the value of an investment, assuming reinvestment of the class' distributions from dividend income and capital gains (the profits earned upon the sale of securities that have grown in value, if any) and assuming a constant rate of performance each year. The $10,000 table and the fund's returns do not reflect the deduction of taxes that a shareholder would pay on fund distributions or the redemption of fund shares. During periods of reimbursement by Fidelity, a fund's total return will be greater than it would be had the reimbursement not occurred. How a fund did yesterday is no guarantee of how it will do tomorrow.
Average Annual Total Returns
Periods ended March 31, 2014 | Past 1 | Past 5 | Past 10 |
Class K A | 26.63% | 18.78% | 5.30% |
A The initial offering of Class K shares took place on May 9, 2008. Returns prior to May 9, 2008 are
those of Fidelity® Magellan® Fund, the original class of the fund.
$10,000 Over 10 Years
Let's say hypothetically that $10,000 was invested in Fidelity® Magellan® Fund - Class K on March 31, 2004. The chart shows how the value of your investment would have changed, and also shows how the S&P 500® Index performed over the same period. See footnote A above for additional information regarding the performance of Class K.
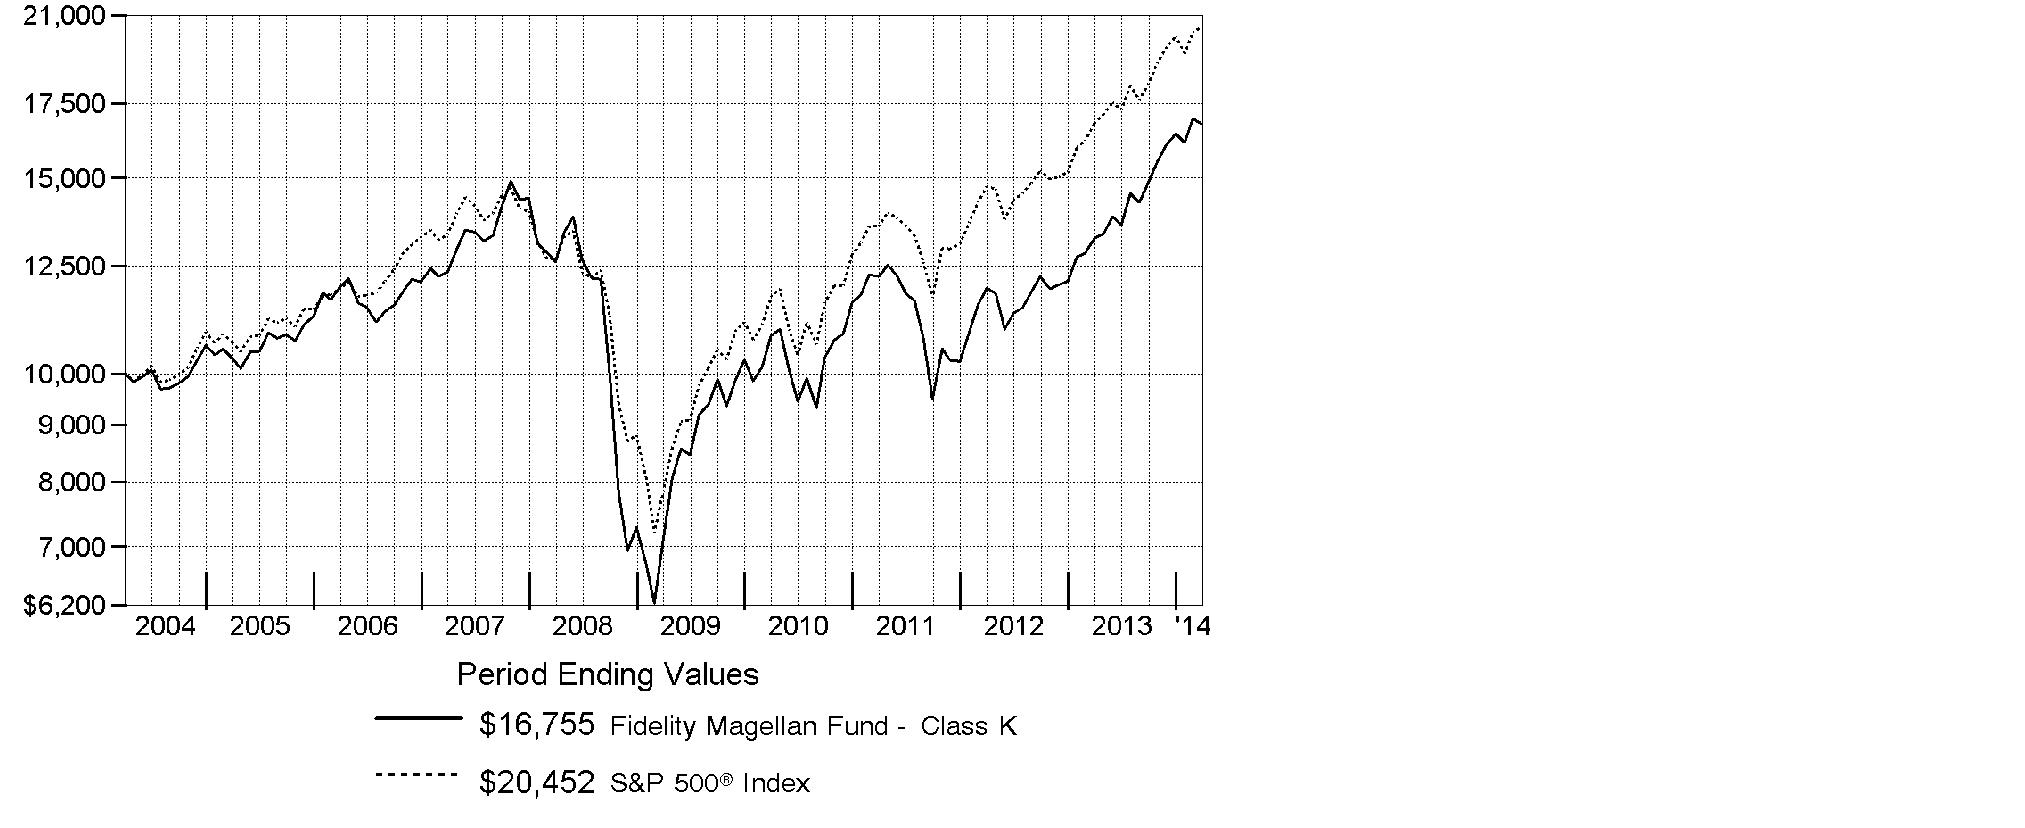
Annual Report
Management's Discussion of Fund Performance
Market Recap: U.S. stocks overcame fears of higher interest rates and a volatile January to post their strongest gain in four years. The S&P 500® Index returned 21.86% for the 12 months ending March 31, 2014, amid the lowest volatility since before the 2007-2008 financial crisis. The index ended the period near all-time highs, buoyed by U.S. Federal Reserve policies that balanced stimulus reductions with low interest rates. Stock valuations remained only slightly above long-term averages, supported by corporate profits that more than doubled in the past five years. Gains were broad, with nine of 10 sectors posting a double-digit percentage advance. Health care led all sectors over the 12-month stretch for the first time since the corresponding period in 2009, as new insurance programs and a favorable drug-approval environment raised earnings-growth expectations. Aerospace & defense achieved one of its strongest returns in more than two decades. Volatility rose in the first quarter of 2014, however, amid rising tension in Ukraine, fear of a slowing economy in China and a late-January decline for momentum stocks. Still, markets finished strongly. Reflecting economic optimism, the growth-oriented Nasdaq Composite Index® rose 30.18% for the full 12 months and the small-cap Russell 2000® Index returned 24.90%, the latter marking a record 7th-straight quarterly gain.
Comments from Jeffrey Feingold, Portfolio Manager of Fidelity® Magellan® Fund: For the year, the fund's Class K shares returned 26.63%, handily outpacing the S&P 500®. Relative to the index, my stock choices provided the biggest boost, with health care leading the way. Our top relative contributor was Tesla Motors, as the share price of the maker of electric cars rose five-fold, driven partly by sales and profitability that exceeded expectations. Facebook also was a top contributor. The social-media firm succeeded in monetizing its platform and massive user base when it started to get paid for mobile advertising. Conversely, I had weak picks in energy, including Anadarko Petroleum, the fund's largest relative detractor. Shares of the oil & gas exploration company plummeted after a judge ruled in December that it could be liable for at least $5 billion in environmental damages related to the former chemicals business of Kerr-McGee, which it acquired in 2006. The fund also was hurt by an investment in cloud-computing firm Rackspace Hosting, as the stock fell sharply in February following the web-hosting and cloud-computing firm's forecast for lower-than-expected revenue in 2014, as well as the unexpected retirement of its CEO.
The views expressed above reflect those of the portfolio manager(s) only through the end of the period as stated on the cover of this report and do not necessarily represent the views of Fidelity or any other person in the Fidelity organization. Any such views are subject to change at any time based upon market or other conditions and Fidelity disclaims any responsibility to update such views. These views may not be relied on as investment advice and, because investment decisions for a Fidelity fund are based on numerous factors, may not be relied on as an indication of trading intent on behalf of any Fidelity fund.
Annual Report
Shareholder Expense Example
As a shareholder of the Fund, you incur two types of costs: (1) transaction costs, and (2) ongoing costs, including management fees and other Fund expenses. This Example is intended to help you understand your ongoing costs (in dollars) of investing in the Fund and to compare these costs with the ongoing costs of investing in other mutual funds.
The Example is based on an investment of $1,000 invested at the beginning of the period and held for the entire period (October 1, 2013 to March 31, 2014).
Actual Expenses
The first line of the accompanying table for each class of the Fund provides information about actual account values and actual expenses. You may use the information in this line, together with the amount you invested, to estimate the expenses that you paid over the period. Simply divide your account value by $1,000.00 (for example, an $8,600 account value divided by $1,000.00 = 8.6), then multiply the result by the number in the first line for a class of the Fund under the heading entitled "Expenses Paid During Period" to estimate the expenses you paid on your account during this period. A small balance maintenance fee of $12.00 that is charged once a year may apply for certain accounts with a value of less than $2,000. This fee is not included in the table below. If it was, the estimate of expenses you paid during the period would be higher, and your ending account value lower, by this amount. In addition, the Fund, as a shareholder in the underlying Fidelity Central Funds, will indirectly bear its pro-rata share of the fees and expenses incurred by the underlying Fidelity Central Funds. These fees and expenses are not included in the Fund's annualized expense ratio used to calculate the expense estimate in the table below.
Hypothetical Example for Comparison Purposes
The second line of the accompanying table for each class of the Fund provides information about hypothetical account values and hypothetical expenses based on a Class' actual expense ratio and an assumed rate of return of 5% per year before expenses, which is not the Class' actual return. The hypothetical account values and expenses may not be used to estimate the actual ending account balance or expenses you paid for the period. You may use this information to compare the ongoing costs of investing in the Fund and other funds. To do so, compare this 5% hypothetical example with the 5% hypothetical examples that appear in the shareholder reports of the other funds. A small balance maintenance fee of $12.00 that is charged once a year may apply for certain accounts with a value of less than $2,000. This fee is not included in the table below. If it was, the estimate of expenses you paid during the period would be higher, and your ending account value lower, by this amount. In addition, the Fund, as a shareholder in the underlying Fidelity Central Funds, will indirectly bear its pro-rata share of the fees and expenses incurred by the underlying Fidelity Central Funds. These fees and expenses are not included in the Fund's annualized expense ratio used to calculate the expense estimate in the table below.
Please note that the expenses shown in the table are meant to highlight your ongoing costs only and do not reflect any transaction costs. Therefore, the second line of the table is useful in comparing ongoing costs only, and will not help you determine the relative total costs of owning different funds.
Annual Report
| Annualized | Beginning | Ending | Expenses Paid |
Magellan | .51% |
|
|
|
Actual |
| $ 1,000.00 | $ 1,127.90 | $ 2.71 |
HypotheticalA |
| $ 1,000.00 | $ 1,022.39 | $ 2.57 |
Class K | .40% |
|
|
|
Actual |
| $ 1,000.00 | $ 1,128.60 | $ 2.12 |
HypotheticalA |
| $ 1,000.00 | $ 1,022.94 | $ 2.02 |
A 5% return per year before expenses
B Annualized expense ratio reflects expenses net of applicable fee waivers.
* Expenses are equal to each Class' annualized expense ratio, multiplied by the average account value over the period, multiplied by 182/365 (to reflect the one-half year period). The fees and expenses of the underlying Fidelity Central Funds in which the Fund invests are not included in each Class' annualized expense ratio.
Annual Report
Investment Changes (Unaudited)
Top Ten Stocks as of March 31, 2014 | ||
| % of fund's | % of fund's net assets |
Google, Inc. Class A | 4.1 | 3.6 |
JPMorgan Chase & Co. | 3.0 | 2.0 |
Apple, Inc. | 2.7 | 3.4 |
Bank of America Corp. | 2.3 | 1.9 |
Wells Fargo & Co. | 2.1 | 2.1 |
Facebook, Inc. Class A | 2.0 | 1.2 |
Berkshire Hathaway, Inc. Class B | 1.9 | 2.3 |
Comcast Corp. Class A | 1.9 | 1.8 |
TJX Companies, Inc. | 1.8 | 1.4 |
Microsoft Corp. | 1.8 | 2.2 |
| 23.6 | |
Top Five Market Sectors as of March 31, 2014 | ||
| % of fund's | % of fund's net assets |
Information Technology | 21.3 | 20.7 |
Financials | 19.0 | 19.0 |
Health Care | 14.1 | 13.9 |
Consumer Discretionary | 13.8 | 14.8 |
Industrials | 9.7 | 8.7 |
Asset Allocation (% of fund's net assets) | |||||||
As of March 31, 2014 * | As of September 30, 2013 ** | ||||||
| Stocks 98.8% |
| | Stocks 98.7% |
| ||
| Convertible |
| | Convertible |
| ||
| Short-Term |
| | Short-Term |
| ||
* Foreign investments | 6.3% |
| ** Foreign investments | 6.0% |
| ||

Annual Report
Investments March 31, 2014
Showing Percentage of Net Assets
Common Stocks - 98.8% | |||
Shares | Value (000s) | ||
CONSUMER DISCRETIONARY - 13.7% | |||
Auto Components - 0.4% | |||
Johnson Controls, Inc. | 1,322,100 | $ 62,562 | |
Automobiles - 0.3% | |||
Tesla Motors, Inc. (a)(d) | 258,500 | 53,884 | |
Diversified Consumer Services - 0.7% | |||
H&R Block, Inc. | 2,957,200 | 89,278 | |
Service Corp. International | 1,268,600 | 25,220 | |
| 114,498 | ||
Hotels, Restaurants & Leisure - 1.3% | |||
Brinker International, Inc. | 931,315 | 48,847 | |
Dunkin' Brands Group, Inc. | 664,698 | 33,355 | |
Las Vegas Sands Corp. | 312,900 | 25,276 | |
Starbucks Corp. | 1,370,900 | 100,597 | |
| 208,075 | ||
Household Durables - 0.3% | |||
Leggett & Platt, Inc. | 1,486,000 | 48,503 | |
Internet & Catalog Retail - 1.9% | |||
Amazon.com, Inc. (a) | 241,304 | 81,204 | |
Coupons.com, Inc. (a) | 31,700 | 781 | |
Groupon, Inc. Class A (a)(d) | 1,957,600 | 15,348 | |
Netflix, Inc. (a) | 114,800 | 40,413 | |
priceline.com, Inc. (a) | 138,900 | 165,554 | |
| 303,300 | ||
Leisure Products - 0.1% | |||
Brunswick Corp. | 330,400 | 14,964 | |
Media - 2.6% | |||
CBS Corp. Class B | 1,641,300 | 101,432 | |
Comcast Corp. Class A | 6,004,200 | 300,330 | |
Entravision Communication Corp. Class A | 1,480,626 | 9,920 | |
| 411,682 | ||
Multiline Retail - 0.6% | |||
Dollar General Corp. (a) | 833,600 | 46,248 | |
Dollar Tree, Inc. (a) | 814,600 | 42,506 | |
| 88,754 | ||
Specialty Retail - 3.6% | |||
Aarons, Inc. Class A | 521,400 | 15,767 | |
Best Buy Co., Inc. | 1,876,200 | 49,550 | |
Common Stocks - continued | |||
Shares | Value (000s) | ||
CONSUMER DISCRETIONARY - continued | |||
Specialty Retail - continued | |||
Home Depot, Inc. | 2,894,000 | $ 229,002 | |
TJX Companies, Inc. | 4,737,800 | 287,348 | |
| 581,667 | ||
Textiles, Apparel & Luxury Goods - 1.9% | |||
Hanesbrands, Inc. | 221,100 | 16,910 | |
NIKE, Inc. Class B | 433,800 | 32,040 | |
Ralph Lauren Corp. | 312,800 | 50,339 | |
VF Corp. | 1,640,420 | 101,509 | |
Wolverine World Wide, Inc. (d) | 3,931,063 | 112,232 | |
| 313,030 | ||
TOTAL CONSUMER DISCRETIONARY | 2,200,919 | ||
CONSUMER STAPLES - 8.6% | |||
Beverages - 1.5% | |||
Anheuser-Busch InBev SA NV | 275,960 | 29,063 | |
The Coca-Cola Co. | 5,700,202 | 220,370 | |
| 249,433 | ||
Food & Staples Retailing - 3.1% | |||
Costco Wholesale Corp. | 1,163,900 | 129,984 | |
CVS Caremark Corp. | 2,304,672 | 172,528 | |
Kroger Co. | 4,448,100 | 194,160 | |
| 496,672 | ||
Food Products - 2.0% | |||
Bunge Ltd. | 1,040,200 | 82,706 | |
Keurig Green Mountain, Inc. | 688,900 | 72,741 | |
Mead Johnson Nutrition Co. Class A | 1,171,100 | 97,365 | |
Mondelez International, Inc. | 1,814,300 | 62,684 | |
| 315,496 | ||
Household Products - 1.7% | |||
Colgate-Palmolive Co. | 2,108,132 | 136,755 | |
Procter & Gamble Co. | 1,653,200 | 133,248 | |
| 270,003 | ||
Common Stocks - continued | |||
Shares | Value (000s) | ||
CONSUMER STAPLES - continued | |||
Personal Products - 0.3% | |||
Herbalife Ltd. | 200,400 | $ 11,477 | |
Nu Skin Enterprises, Inc. Class A | 384,500 | 31,856 | |
| 43,333 | ||
TOTAL CONSUMER STAPLES | 1,374,937 | ||
ENERGY - 7.6% | |||
Energy Equipment & Services - 1.4% | |||
Ensco PLC Class A | 1,151,600 | 60,781 | |
Oceaneering International, Inc. | 1,490,600 | 107,115 | |
Schlumberger Ltd. | 618,900 | 60,343 | |
| 228,239 | ||
Oil, Gas & Consumable Fuels - 6.2% | |||
Anadarko Petroleum Corp. | 1,949,400 | 165,231 | |
Cabot Oil & Gas Corp. | 3,497,036 | 118,480 | |
Concho Resources, Inc. (a) | 172,700 | 21,156 | |
ConocoPhillips Co. | 3,569,500 | 251,114 | |
EOG Resources, Inc. | 681,300 | 133,651 | |
Exxon Mobil Corp. | 592,024 | 57,829 | |
Marathon Oil Corp. | 1,808,000 | 64,220 | |
Marathon Petroleum Corp. | 645,400 | 56,176 | |
Suncor Energy, Inc. | 3,737,300 | 130,527 | |
| 998,384 | ||
TOTAL ENERGY | 1,226,623 | ||
FINANCIALS - 19.0% | |||
Banks - 9.7% | |||
Bank of America Corp. | 21,819,900 | 375,302 | |
Citigroup, Inc. | 3,887,316 | 185,036 | |
Comerica, Inc. | 525,000 | 27,195 | |
JPMorgan Chase & Co. | 7,888,598 | 478,917 | |
U.S. Bancorp | 3,783,859 | 162,176 | |
Wells Fargo & Co. | 6,697,955 | 333,156 | |
| 1,561,782 | ||
Capital Markets - 3.9% | |||
BlackRock, Inc. Class A | 835,281 | 262,679 | |
Charles Schwab Corp. | 1,773,868 | 48,480 | |
Goldman Sachs Group, Inc. | 619,500 | 101,505 | |
KKR & Co. LP | 1,666,569 | 38,064 | |
Common Stocks - continued | |||
Shares | Value (000s) | ||
FINANCIALS - continued | |||
Capital Markets - continued | |||
Morgan Stanley | 2,819,168 | $ 87,873 | |
TD Ameritrade Holding Corp. | 498,176 | 16,913 | |
The Blackstone Group LP | 1,898,800 | 63,135 | |
Virtus Investment Partners, Inc. (a) | 39,500 | 6,840 | |
| 625,489 | ||
Consumer Finance - 0.5% | |||
Capital One Financial Corp. | 1,096,800 | 84,629 | |
Diversified Financial Services - 1.9% | |||
Berkshire Hathaway, Inc. Class B (a) | 2,486,966 | 310,796 | |
Insurance - 1.5% | |||
American International Group, Inc. | 2,278,300 | 113,938 | |
Genworth Financial, Inc. Class A (a) | 1,531,400 | 27,152 | |
MetLife, Inc. | 1,885,321 | 99,545 | |
| 240,635 | ||
Real Estate Investment Trusts - 1.2% | |||
American Tower Corp. | 2,363,661 | 193,513 | |
Real Estate Management & Development - 0.3% | |||
Rialto Real Estate Fund LP (a)(e)(f)(g) | 500,000 | 24,313 | |
RREF CMBS AIV, LP (e)(g)(i) | 500,000 | 20,125 | |
RREF Midtown Colony REIT, Inc (a)(e)(g)(h) | 500,000 | 1,447 | |
| 45,885 | ||
TOTAL FINANCIALS | 3,062,729 | ||
HEALTH CARE - 14.1% | |||
Biotechnology - 5.4% | |||
Acorda Therapeutics, Inc. (a) | 619,254 | 23,476 | |
Alexion Pharmaceuticals, Inc. (a) | 1,113,160 | 169,345 | |
Alkermes PLC (a) | 418,500 | 18,452 | |
Alnylam Pharmaceuticals, Inc. (a) | 291,171 | 19,549 | |
Amgen, Inc. | 1,393,277 | 171,847 | |
Amicus Therapeutics, Inc. (a) | 562,204 | 1,164 | |
Biogen Idec, Inc. (a) | 637,804 | 195,085 | |
Bluebird Bio, Inc. | 208,773 | 4,747 | |
Clinical Data, Inc. rights 4/4/18 (a) | 988,714 | 0 | |
Gilead Sciences, Inc. (a) | 2,571,300 | 182,202 | |
Medivation, Inc. (a) | 291,500 | 18,764 | |
Neurocrine Biosciences, Inc. (a) | 771,993 | 12,429 | |
Pharmacyclics, Inc. (a) | 116,200 | 11,646 | |
United Therapeutics Corp. (a) | 400,600 | 37,668 | |
| 866,374 | ||
Common Stocks - continued | |||
Shares | Value (000s) | ||
HEALTH CARE - continued | |||
Health Care Equipment & Supplies - 2.1% | |||
Boston Scientific Corp. (a) | 14,092,700 | $ 190,533 | |
Edwards Lifesciences Corp. (a) | 710,700 | 52,713 | |
Intuitive Surgical, Inc. (a) | 225,000 | 98,548 | |
| 341,794 | ||
Health Care Providers & Services - 1.1% | |||
DaVita HealthCare Partners, Inc. (a) | 810,000 | 55,769 | |
McKesson Corp. | 698,200 | 123,281 | |
| 179,050 | ||
Health Care Technology - 0.4% | |||
Castlight Health, Inc. Class B (a) | 104,454 | 2,217 | |
Cerner Corp. (a) | 947,100 | 53,274 | |
Veeva Systems, Inc. Class A (d) | 14,400 | 384 | |
| 55,875 | ||
Life Sciences Tools & Services - 0.2% | |||
Illumina, Inc. (a) | 251,800 | 37,433 | |
Pharmaceuticals - 4.9% | |||
Actavis PLC (a) | 912,440 | 187,826 | |
Bristol-Myers Squibb Co. | 3,503,800 | 182,022 | |
Jazz Pharmaceuticals PLC (a) | 432,700 | 60,007 | |
Merck & Co., Inc. | 4,342,800 | 246,541 | |
Perrigo Co. PLC | 205,600 | 31,798 | |
Salix Pharmaceuticals Ltd. (a) | 143,200 | 14,837 | |
Teva Pharmaceutical Industries Ltd. sponsored ADR | 488,100 | 25,791 | |
Valeant Pharmaceuticals International (Canada) (a) | 321,300 | 42,270 | |
| 791,092 | ||
TOTAL HEALTH CARE | 2,271,618 | ||
INDUSTRIALS - 9.7% | |||
Aerospace & Defense - 1.0% | |||
Esterline Technologies Corp. (a) | 273,360 | 29,124 | |
The Boeing Co. | 132,100 | 16,577 | |
United Technologies Corp. | 1,056,900 | 123,488 | |
| 169,189 | ||
Airlines - 1.5% | |||
American Airlines Group, Inc. (a) | 1,898,600 | 69,489 | |
Delta Air Lines, Inc. | 3,190,500 | 110,551 | |
Common Stocks - continued | |||
Shares | Value (000s) | ||
INDUSTRIALS - continued | |||
Airlines - continued | |||
Spirit Airlines, Inc. (a) | 694,800 | $ 41,271 | |
United Continental Holdings, Inc. (a) | 332,200 | 14,826 | |
| 236,137 | ||
Building Products - 0.2% | |||
A.O. Smith Corp. | 665,000 | 30,603 | |
Electrical Equipment - 0.4% | |||
EnerSys | 461,800 | 31,998 | |
Hubbell, Inc. Class B | 268,100 | 32,137 | |
| 64,135 | ||
Industrial Conglomerates - 1.3% | |||
Danaher Corp. | 2,740,400 | 205,530 | |
Machinery - 3.0% | |||
Caterpillar, Inc. | 1,534,500 | 152,483 | |
Cummins, Inc. | 524,970 | 78,215 | |
Illinois Tool Works, Inc. | 1,397,000 | 113,618 | |
Manitowoc Co., Inc. | 2,582,900 | 81,232 | |
Mueller Industries, Inc. | 124,281 | 3,727 | |
Valmont Industries, Inc. | 335,300 | 49,906 | |
| 479,181 | ||
Professional Services - 1.3% | |||
Towers Watson & Co. | 987,137 | 112,583 | |
Verisk Analytics, Inc. (a) | 1,726,700 | 103,533 | |
| 216,116 | ||
Road & Rail - 1.0% | |||
J.B. Hunt Transport Services, Inc. | 2,157,700 | 155,182 | |
TOTAL INDUSTRIALS | 1,556,073 | ||
INFORMATION TECHNOLOGY - 20.9% | |||
Communications Equipment - 0.8% | |||
Cisco Systems, Inc. | 1,739,500 | 38,982 | |
QUALCOMM, Inc. | 1,168,900 | 92,179 | |
| 131,161 | ||
Internet Software & Services - 7.9% | |||
Cornerstone OnDemand, Inc. (a) | 313,500 | 15,007 | |
CoStar Group, Inc. (a) | 88,700 | 16,564 | |
eBay, Inc. (a) | 295,900 | 16,346 | |
Facebook, Inc. Class A (a) | 5,414,800 | 326,188 | |
Google, Inc. Class A (a) | 592,700 | 660,572 | |
Common Stocks - continued | |||
Shares | Value (000s) | ||
INFORMATION TECHNOLOGY - continued | |||
Internet Software & Services - continued | |||
Marketo, Inc. | 436,167 | $ 14,250 | |
Naver Corp. | 46,031 | 33,457 | |
Rackspace Hosting, Inc. (a) | 3,006,000 | 98,657 | |
Rocket Fuel, Inc. (d) | 12,000 | 515 | |
Stamps.com, Inc. (a) | 124,681 | 4,184 | |
Tencent Holdings Ltd. | 277,300 | 19,287 | |
Yahoo!, Inc. (a) | 2,002,400 | 71,886 | |
| 1,276,913 | ||
IT Services - 3.9% | |||
Cognizant Technology Solutions Corp. Class A (a) | 4,856,218 | 245,773 | |
Computer Sciences Corp. | 548,900 | 33,384 | |
MasterCard, Inc. Class A | 1,064,900 | 79,548 | |
Visa, Inc. Class A | 1,228,400 | 265,162 | |
| 623,867 | ||
Semiconductors & Semiconductor Equipment - 0.7% | |||
Analog Devices, Inc. | 1,654,000 | 87,894 | |
Skyworks Solutions, Inc. (a) | 897,100 | 33,659 | |
| 121,553 | ||
Software - 4.7% | |||
DocuSign, Inc. (a)(g) | 16,185 | 217 | |
FireEye, Inc. | 31 | 2 | |
Guidewire Software, Inc. (a) | 480,078 | 23,548 | |
Interactive Intelligence Group, Inc. (a) | 221,500 | 16,059 | |
Intuit, Inc. | 1,399,800 | 108,806 | |
Microsoft Corp. | 6,936,200 | 284,315 | |
NetSuite, Inc. (a) | 384,100 | 36,424 | |
Oracle Corp. | 1,254,300 | 51,313 | |
Progress Software Corp. (a) | 982,447 | 21,417 | |
Rovi Corp. (a) | 662,800 | 15,099 | |
salesforce.com, Inc. (a) | 1,230,981 | 70,277 | |
SS&C Technologies Holdings, Inc. (a) | 392,900 | 15,724 | |
Synopsys, Inc. (a) | 1,261,700 | 48,462 | |
Ultimate Software Group, Inc. (a) | 149,500 | 20,482 | |
Workday, Inc. Class A (a) | 475,100 | 43,438 | |
| 755,583 | ||
Technology Hardware, Storage & Peripherals - 2.9% | |||
Apple, Inc. | 798,859 | 428,780 | |
EMC Corp. | 1,145,200 | 31,390 | |
| 460,170 | ||
TOTAL INFORMATION TECHNOLOGY | 3,369,247 | ||
Common Stocks - continued | |||
Shares | Value (000s) | ||
MATERIALS - 4.8% | |||
Chemicals - 4.0% | |||
CF Industries Holdings, Inc. | 378,900 | $ 98,756 | |
LyondellBasell Industries NV Class A | 943,719 | 83,934 | |
Monsanto Co. | 2,286,984 | 260,190 | |
Potash Corp. of Saskatchewan, Inc. (d) | 2,404,100 | 86,965 | |
Praxair, Inc. | 905,132 | 118,545 | |
| 648,390 | ||
Construction Materials - 0.6% | |||
Vulcan Materials Co. | 1,332,300 | 88,531 | |
Metals & Mining - 0.1% | |||
Franco-Nevada Corp. | 382,900 | 17,595 | |
Paper & Forest Products - 0.1% | |||
Boise Cascade Co. (a) | 675,800 | 19,355 | |
TOTAL MATERIALS | 773,871 | ||
TELECOMMUNICATION SERVICES - 0.4% | |||
Wireless Telecommunication Services - 0.4% | |||
SBA Communications Corp. Class A (a) | 595,163 | 54,136 | |
SoftBank Corp. | 190,400 | 14,389 | |
| 68,525 | ||
TOTAL COMMON STOCKS (Cost $12,099,138) |
| ||
Convertible Preferred Stocks - 0.5% | |||
|
|
|
|
CONSUMER DISCRETIONARY - 0.1% | |||
Household Durables - 0.1% | |||
Roku, Inc. 8.00% (g) | 12,145,838 | 11,000 | |
INFORMATION TECHNOLOGY - 0.4% | |||
Internet Software & Services - 0.2% | |||
HubSpot, Inc. (a)(g) | 2,670,845 | 27,162 | |
Convertible Preferred Stocks - continued | |||
Shares | Value (000s) | ||
INFORMATION TECHNOLOGY - continued | |||
Software - 0.2% | |||
DocuSign, Inc.: | |||
Series B (g) | 7,510 | $ 101 | |
Series B-1 (g) | 2,249 | 30 | |
Series D (a)(g) | 2,376,438 | 31,844 | |
Series E (g) | 139,427 | 1,868 | |
Mobileye NV Series F (g) | 254,387 | 8,878 | |
| 42,721 | ||
Technology Hardware, Storage & Peripherals - 0.0% | |||
Pure Storage, Inc. Series E (g) | 306,060 | 2,831 | |
TOTAL INFORMATION TECHNOLOGY | 72,714 | ||
TOTAL CONVERTIBLE PREFERRED STOCKS (Cost $50,030) |
| ||
Money Market Funds - 0.9% | |||
|
|
|
|
Fidelity Cash Central Fund, 0.10% (b) | 57,663,376 | 57,663 | |
Fidelity Securities Lending Cash Central Fund, 0.09% (b)(c) | 94,155,252 | 94,155 | |
TOTAL MONEY MARKET FUNDS (Cost $151,818) |
| ||
TOTAL INVESTMENT PORTFOLIO - 100.2% (Cost $12,300,986) | 16,140,074 | ||
NET OTHER ASSETS (LIABILITIES) - (0.2)% | (34,302) | ||
NET ASSETS - 100% | $ 16,105,772 | ||
Legend |
(a) Non-income producing |
(b) Affiliated fund that is generally available only to investment companies and other accounts managed by Fidelity Investments. The rate quoted is the annualized seven-day yield of the fund at period end. A complete unaudited listing of the fund's holdings as of its most recent quarter end is available upon request. In addition, each Fidelity Central Fund's financial statements, which are not covered by the Fund's Report of Independent Registered Public Accounting Firm, are available on the SEC's website or upon request. |
(c) Investment made with cash collateral received from securities on loan. |
(d) Security or a portion of the security is on loan at period end. |
(e) Affiliated company |
(f) Investment is owned by an entity that is treated as a corporation for U.S. tax purposes and is owned by the Fund. |
(g) Restricted securities - Investment in securities not registered under the Securities Act of 1933 (excluding 144A issues). At the end of the period, the value of restricted securities (excluding 144A issues) amounted to $129,816,000 or 0.8% of net assets. |
Additional information on each restricted holding is as follows: |
Security | Acquisition | Acquisition |
DocuSign, Inc. | 10/21/13 | $ 90 |
DocuSign, Inc. Series B | 3/3/14 | $ 99 |
DocuSign, Inc. Series B-1 | 3/3/14 | $ 30 |
DocuSign, Inc. Series D | 6/29/12 - 3/3/14 | $ 11,071 |
DocuSign, Inc. Series E | 3/3/14 | $ 1,831 |
HubSpot, Inc. | 10/25/12 | $ 15,000 |
Mobileye NV Series F | 8/15/13 | $ 8,878 |
Pure Storage, Inc. Series E | 8/22/13 | $ 2,121 |
Rialto Real Estate Fund LP | 2/24/11 - 8/17/12 | $ 33,049 |
RREF CMBS AIV, LP | 8/10/11 - 8/17/12 | $ 15,528 |
RREF Midtown Colony REIT, Inc. | 12/31/12 | $ 1,423 |
Roku, Inc. 8.00% | 5/7/13 | $ 11,000 |
(h) Investment represents the Fund's ownership interest in a real estate investment trust, which is under common ownership and management with Rialto Real Estate Fund, LP. |
(i) Investment represents the Fund's ownership interest in a limited partnership, which is under common ownership and management with Rialto Real Estate Fund, LP. |
Affiliated Central Funds |
Information regarding fiscal year to date income earned by the Fund from investments in Fidelity Central Funds is as follows: |
Fund | Income earned |
Fidelity Cash Central Fund | $ 141 |
Fidelity Securities Lending Cash Central Fund | 838 |
Total | $ 979 |
Other Affiliated Issuers |
An affiliated company is a company in which the Fund has ownership of at least 5% of the voting securities. Fiscal year to date transactions with companies which are or were affiliates are as follows: |
Affiliate | Value, | Purchases | Sales | Dividend | Value, |
Acorda Therapeutics, Inc. | $ 61,672 | $ 10,283 | $ 56,176 | $ - | $ - |
Brinker International, Inc. | 147,919 | 7,517 | 134,568 | 1,563 | - |
Rialto Real Estate Fund LP | 40,891 | - | - | - | 24,313 |
RREF CMBS AIV, LP | 18,361 | - | - | 6,907 | 20,125 |
RREF Midtown Colony REIT, Inc. | 1,397 | - | - | - | 1,447 |
Total | $ 270,240 | $ 17,800 | $ 190,744 | $ 8,470 | $ 45,885 |
Other Information |
The following is a summary of the inputs used, as of March 31, 2014, involving the Fund's assets and liabilities carried at fair value. The inputs or methodology used for valuing securities may not be an indication of the risk associated with investing in those securities. For more information on valuation inputs, and their aggregation into the levels used in the table below, please refer to the Investment Valuation section in the accompanying Notes to Financial Statements. |
Valuation Inputs at Reporting Date: | ||||
Description | Total | Level 1 | Level 2 | Level 3 |
Investments in Securities: | ||||
Equities: | ||||
Consumer Discretionary | $ 2,211,919 | $ 2,200,919 | $ - | $ 11,000 |
Consumer Staples | 1,374,937 | 1,345,874 | 29,063 | - |
Energy | 1,226,623 | 1,226,623 | - | - |
Financials | 3,062,729 | 3,016,844 | - | 45,885 |
Health Care | 2,271,618 | 2,271,618 | - | - |
Industrials | 1,556,073 | 1,556,073 | - | - |
Information Technology | 3,441,961 | 3,369,030 | - | 72,931 |
Materials | 773,871 | 773,871 | - | - |
Telecommunication Services | 68,525 | 68,525 | - | - |
Money Market Funds | 151,818 | 151,818 | - | - |
Total Investments in Securities: | $ 16,140,074 | $ 15,981,195 | $ 29,063 | $ 129,816 |
See accompanying notes which are an integral part of the financial statements.
Annual Report
Financial Statements
Statement of Assets and Liabilities
Amounts in thousands (except per-share amounts) | March 31, 2014 | |
|
|
|
Assets | ||
Investment in securities, at value (including securities loaned of $91,093) - See accompanying schedule: Unaffiliated issuers (cost $12,099,168) | $ 15,942,371 |
|
Fidelity Central Funds (cost $151,818) | 151,818 |
|
Other affiliated issuers (cost $50,000) | 45,885 |
|
Total Investments (cost $12,300,986) |
| $ 16,140,074 |
Receivable for investments sold | 292,113 | |
Receivable for fund shares sold | 5,284 | |
Dividends receivable | 11,082 | |
Distributions receivable from Fidelity Central Funds | 65 | |
Prepaid expenses | 17 | |
Other receivables | 1,780 | |
Total assets | 16,450,415 | |
|
|
|
Liabilities | ||
Payable for investments purchased | $ 225,212 | |
Payable for fund shares redeemed | 13,837 | |
Accrued management fee | 4,818 | |
Other affiliated payables | 1,954 | |
Other payables and accrued expenses | 1,806 | |
Deferred taxes | 2,861 | |
Collateral on securities loaned, at value | 94,155 | |
Total liabilities | 344,643 | |
|
|
|
Net Assets | $ 16,105,772 | |
Net Assets consist of: |
| |
Paid in capital | $ 11,322,994 | |
Undistributed net investment income | 29,022 | |
Accumulated undistributed net realized gain (loss) on investments and foreign currency transactions | 917,510 | |
Net unrealized appreciation (depreciation) on investments and assets and liabilities in foreign currencies | 3,836,246 | |
Net Assets | $ 16,105,772 | |
See accompanying notes which are an integral part of the financial statements.
Annual Report
Statement of Assets and Liabilities - continued
Amounts in thousands (except per-share amounts) | March 31, 2014 | |
|
|
|
Magellan: | $ 94.25 | |
|
|
|
Class K: | $ 94.16 | |
See accompanying notes which are an integral part of the financial statements.
Annual Report
Financial Statements - continued
Statement of Operations
Amounts in thousands | Year ended March 31, 2014 | |
|
|
|
Investment Income |
|
|
Dividends (including $8,470 earned from other affiliated issuers) |
| $ 216,298 |
Income from Fidelity Central Funds |
| 979 |
Total income |
| 217,277 |
|
|
|
Expenses | ||
Management fee | $ 84,973 | |
Performance adjustment | (34,174) | |
Transfer agent fees | 20,946 | |
Accounting and security lending fees | 1,523 | |
Custodian fees and expenses | 265 | |
Independent trustees' compensation | 78 | |
Appreciation in deferred trustee compensation account | 12 | |
Registration fees | 79 | |
Audit | 197 | |
Legal | 63 | |
Miscellaneous | 124 | |
Total expenses before reductions | 74,086 | |
Expense reductions | (315) | 73,771 |
Net investment income (loss) | 143,506 | |
Realized and Unrealized Gain (Loss) Net realized gain (loss) on: | ||
Investment securities: |
|
|
Unaffiliated issuers | 1,896,399 | |
Other affiliated issuers | 40,098 |
|
Foreign currency transactions | (521) | |
Futures contracts | 9,288 | |
Total net realized gain (loss) |
| 1,945,264 |
Change in net unrealized appreciation (depreciation) on: Investment securities | 1,520,168 | |
Assets and liabilities in foreign currencies | 45 | |
Total change in net unrealized appreciation (depreciation) |
| 1,520,213 |
Net gain (loss) | 3,465,477 | |
Net increase (decrease) in net assets resulting from operations | $ 3,608,983 | |
See accompanying notes which are an integral part of the financial statements.
Annual Report
Statement of Changes in Net Assets
Amounts in thousands | Year ended | Year ended |
Increase (Decrease) in Net Assets |
|
|
Operations |
|
|
Net investment income (loss) | $ 143,506 | $ 191,188 |
Net realized gain (loss) | 1,945,264 | 1,475,417 |
Change in net unrealized appreciation (depreciation) | 1,520,213 | (257,221) |
Net increase (decrease) in net assets resulting | 3,608,983 | 1,409,384 |
Distributions to shareholders from net investment income | (115,663) | (201,835) |
Distributions to shareholders from net realized gain | (976,496) | (4,097) |
Total distributions | (1,092,159) | (205,932) |
Share transactions - net increase (decrease) | (1,176,730) | (2,916,170) |
Total increase (decrease) in net assets | 1,340,094 | (1,712,718) |
|
|
|
Net Assets | ||
Beginning of period | 14,765,678 | 16,478,396 |
End of period (including undistributed net investment income of $29,022 and undistributed net investment income of $9,247, respectively) | $ 16,105,772 | $ 14,765,678 |
See accompanying notes which are an integral part of the financial statements.
Annual Report
Financial Highlights - Magellan
Years ended March 31, | 2014 | 2013 | 2012 | 2011 | 2010 |
Selected Per-Share Data |
|
|
|
| |
Net asset value, beginning of period | $ 79.96 | $ 73.30 | $ 75.56 | $ 67.56 | $ 44.63 |
Income from Investment Operations |
|
|
|
|
|
Net investment income (loss) B | .81 | .93 | .47 | .56 E | .29 |
Net realized and unrealized gain (loss) | 20.00 | 6.75 | (2.30) | 8.05 | 23.02 |
Total from investment operations | 20.81 | 7.68 | (1.83) | 8.61 | 23.31 |
Distributions from net investment income | (.67) | (1.00) | (.41) | (.54) | (.36) |
Distributions from net realized gain | (5.85) | (.02) | (.02) | (.07) | (.02) |
Total distributions | (6.52) | (1.02) | (.43) | (.61) | (.38) |
Net asset value, end of period | $ 94.25 | $ 79.96 | $ 73.30 | $ 75.56 | $ 67.56 |
Total Return A | 26.50% | 10.63% | (2.36)% | 12.82% | 52.33% |
Ratios to Average Net Assets C, F |
|
|
|
| |
Expenses before reductions | .50% | .47% | .54% | .60% | .75% |
Expenses net of fee waivers, if any | .50% | .47% | .54% | .60% | .75% |
Expenses net of all reductions | .50% | .46% | .53% | .59% | .74% |
Net investment income (loss) | .92% | 1.27% | .69% | .83% E | .49% |
Supplemental Data |
|
|
|
| |
Net assets, end of period (in millions) | $ 13,521 | $ 12,341 | $ 13,665 | $ 19,398 | $ 22,628 |
Portfolio turnover rate D | 77% | 88% | 99% | 42% | 39% |
A Total returns would have been lower if certain expenses had not been reduced during the applicable periods shown.
B Calculated based on average shares outstanding during the period.
C Fees and expenses of any underlying Fidelity Central Funds are not included in the Fund's expense ratio. The Fund indirectly bears its proportionate share of the expenses of any underlying Fidelity Central Funds.
D Amount does not include the portfolio activity of any underlying Fidelity Central Funds.
E Investment income per share reflects a large, non-recurring dividend which amounted to $.13 per share. Excluding this non-recurring dividend, the ratio of net investment income (loss) to average net assets would have been .63%.
F Expense ratios reflect operating expenses of the class. Expenses before reductions do not reflect amounts reimbursed by the investment adviser or reductions from brokerage service arrangements or reductions from other expense offset arrangements and do not represent the amount paid by the class during periods when reimbursements or reductions occur. Expenses net of fee waivers reflect expenses after reimbursement by the investment adviser but prior to reductions from brokerage service arrangements or other expense offset arrangements. Expenses net of all reductions represent the net expenses paid by the class.
See accompanying notes which are an integral part of the financial statements.
Annual Report
Financial Highlights - Class K
Years ended March 31, | 2014 | 2013 | 2012 | 2011 | 2010 |
Selected Per-Share Data |
|
|
|
| |
Net asset value, beginning of period | $ 79.89 | $ 73.24 | $ 75.51 | $ 67.53 | $ 44.61 |
Income from Investment Operations |
|
|
|
|
|
Net investment income (loss) B | .90 | 1.02 | .56 | .65 E | .38 |
Net realized and unrealized gain (loss) | 19.99 | 6.75 | (2.30) | 8.04 | 23.02 |
Total from investment operations | 20.89 | 7.77 | (1.74) | 8.69 | 23.40 |
Distributions from net investment income | (.77) | (1.10) | (.50) | (.64) | (.46) |
Distributions from net realized gain | (5.85) | (.02) | (.02) | (.07) | (.02) |
Total distributions | (6.62) | (1.12) | (.53) G | (.71) | (.48) |
Net asset value, end of period | $ 94.16 | $ 79.89 | $ 73.24 | $ 75.51 | $ 67.53 |
Total Return A | 26.63% | 10.77% | (2.23)% | 12.97% | 52.59% |
Ratios to Average Net Assets C, F |
|
|
|
| |
Expenses before reductions | .39% | .35% | .42% | .46% | .59% |
Expenses net of fee waivers, if any | .39% | .35% | .42% | .46% | .59% |
Expenses net of all reductions | .39% | .34% | .41% | .46% | .58% |
Net investment income (loss) | 1.02% | 1.40% | .82% | .97% E | .65% |
Supplemental Data |
|
|
|
|
|
Net assets, end of period (in millions) | $ 2,585 | $ 2,424 | $ 2,814 | $ 3,483 | $ 2,495 |
Portfolio turnover rate D | 77% | 88% | 99% | 42% | 39% |
A Total returns would have been lower if certain expenses had not been reduced during the applicable periods shown.
B Calculated based on average shares outstanding during the period.
C Fees and expenses of any underlying Fidelity Central Funds are not included in the Fund's expense ratio. The Fund indirectly bears its proportionate share of the expenses of any underlying Fidelity Central Funds.
D Amount does not include the portfolio activity of any underlying Fidelity Central Funds.
E Investment income per share reflects a large, non-recurring dividend which amounted to $.13 per share. Excluding this non-recurring dividend, the ratio of net investment income (loss) to average net assets would have been .77%.
F Expense ratios reflect operating expenses of the class. Expenses before reductions do not reflect amounts reimbursed by the investment adviser or reductions from brokerage service arrangements or reductions from other expense offset arrangements and do not represent the amount paid by the class during periods when reimbursements or reductions occur. Expenses net of fee waivers reflect expenses after reimbursement by the investment adviser but prior to reductions from brokerage service arrangements or other expense offset arrangements. Expenses net of all reductions represent the net expenses paid by the class.
G Total distributions of $.53 per share is comprised of distributions from net investment income of $.504 and distributions from net realized gain of $.022 per share.
See accompanying notes which are an integral part of the financial statements.
Annual Report
Notes to Financial Statements
For the period ended March 31, 2014
(Amounts in thousands except percentages)
1. Organization.
Fidelity Magellan Fund (the Fund) is a fund of Fidelity Magellan Fund (the Trust) and is authorized to issue an unlimited number of shares. The Trust is registered under the Investment Company Act of 1940, as amended (the 1940 Act), as an open-end management investment company organized as a Massachusetts business trust. The Fund offers Magellan and Class K shares, each of which has equal rights as to assets and voting privileges. Each class has exclusive voting rights with respect to matters that affect that class.
2. Investments in Fidelity Central Funds.
The Fund invests in Fidelity Central Funds, which are open-end investment companies generally available only to other investment companies and accounts managed by the investment adviser and its affiliates. The Fund's Schedule of Investments lists each of the Fidelity Central Funds held as of period end, if any, as an investment of the Fund, but does not include the underlying holdings of each Fidelity Central Fund. As an Investing Fund, the Fund indirectly bears its proportionate share of the expenses of the underlying Fidelity Central Funds.
The Money Market Central Funds seek preservation of capital and current income and are managed by Fidelity Investments Money Management, Inc. (FIMM), an affiliate of the investment adviser. Annualized expenses of the Money Market Central Funds as of their most recent shareholder report date are less than .01%.
A complete unaudited list of holdings for each Fidelity Central Fund is available upon request or at the Securities and Exchange Commission (the SEC) website at www.sec.gov. In addition, the financial statements of the Fidelity Central Funds which contain the significant accounting policies (including investment valuation policies) of those funds, which are not covered by the Fund's Report of Independent Registered Public Accounting Firm, are available on the SEC website or upon request.
3. Significant Accounting Policies.
The financial statements have been prepared in conformity with accounting principles generally accepted in the United States of America (GAAP), which require management to make certain estimates and assumptions at the date of the financial statements. Actual results could differ from those estimates. Subsequent events, if any, through the date that the financial statements were issued have been evaluated in the preparation of the financial statements. The following summarizes the significant accounting policies of the Fund:
Investment Valuation. Investments are valued as of 4:00 p.m. Eastern time on the last calendar day of the period. In accordance with valuation policies and procedures approved by the Board of Trustees (the Board), the Fund attempts to obtain prices from
Annual Report
3. Significant Accounting Policies - continued
Investment Valuation - continued
one or more third party pricing vendors or brokers to value its investments. When current market prices, quotations or currency exchange rates are not readily available or reliable, investments will be fair valued in good faith by the Fidelity Management & Research Company (FMR) Fair Value Committee (the Committee), in accordance with procedures adopted by the Board. Factors used in determining fair value vary by investment type and may include market or investment specific events. The frequency with which these procedures are used cannot be predicted and they may be utilized to a significant extent. The Committee oversees the Fund's valuation policies and procedures and is responsible for approving and reporting to the Board all fair value determinations.
The Fund categorizes the inputs to valuation techniques used to value its investments into a disclosure hierarchy consisting of three levels as shown below:
Level 1 - quoted prices in active markets for identical investments
Level 2 - other significant observable inputs (including quoted prices for similar investments, interest rates, prepayment speeds, etc.)
Level 3 - unobservable inputs (including the Fund's own assumptions based on the best information available)
Valuation techniques used to value the Fund's investments by major category are as follows:
Equity securities, including restricted securities, for which market quotations are readily available, are valued at the last reported sale price or official closing price as reported by a third party pricing vendor on the primary market or exchange on which they are traded and are categorized as Level 1 in the hierarchy. In the event there were no sales during the day or closing prices are not available, securities are valued at the last quoted bid price or may be valued using the last available price and are generally categorized as Level 2 in the hierarchy. For foreign equity securities, when market or security specific events arise, comparisons to the valuation of American Depositary Receipts (ADRs), futures contracts, Exchange-Traded Funds (ETFs) and certain indexes as well as quoted prices for similar securities may be used and would be categorized as Level 2 in the hierarchy. Utilizing these techniques may result in transfers between Level 1 and Level 2. For equity securities, including restricted securities, where observable inputs are limited, assumptions about market activity and risk are used and these securities may be categorized as Level 3 in the hierarchy.
Investments in open-end mutual funds, including the Fidelity Central Funds, are valued at their closing net asset value (NAV) each business day and are categorized as Level 1 in the hierarchy.
Annual Report
Notes to Financial Statements - continued
(Amounts in thousands except percentages)
3. Significant Accounting Policies - continued
Investment Valuation - continued
Changes in valuation techniques may result in transfers in or out of an assigned level within the disclosure hierarchy. The aggregate value of investments by input level, as of March 31, 2014 is included at the end of the Fund's Schedule of Investments.
Foreign Currency. The Fund may use foreign currency contracts to facilitate transactions in foreign-denominated securities. Gains and losses from these transactions may arise from changes in the value of the foreign currency or if the counterparties do not perform under the contracts' terms.
Foreign-denominated assets, including investment securities, and liabilities are translated into U.S. dollars at the exchange rates at period end. Purchases and sales of investment securities, income and dividends received and expenses denominated in foreign currencies are translated into U.S. dollars at the exchange rate in effect on the transaction date.
The effects of exchange rate fluctuations on investments are included with the net realized and unrealized gain (loss) on investment securities. Other foreign currency transactions resulting in realized and unrealized gain (loss) are disclosed separately.
Investment Transactions and Income. For financial reporting purposes, the Fund's investment holdings and NAV include trades executed through the end of the last business day of the period. The NAV per share for processing shareholder transactions is calculated as of the close of business of the New York Stock Exchange (NYSE), normally 4:00 p.m. Eastern time and includes trades executed through the end of the prior business day. Gains and losses on securities sold are determined on the basis of identified cost and may include proceeds received from litigation. Dividend income is recorded on the ex-dividend date, except for certain dividends from foreign securities where the ex-dividend date may have passed, which are recorded as soon as the Fund is informed of the ex-dividend date. Non-cash dividends included in dividend income, if any, are recorded at the fair market value of the securities received. Distributions received on securities that represent a return of capital or capital gain are recorded as a reduction of cost of investments and/or as a realized gain. Subsequent to ex-dividend date the Fund determines the components of these distributions, based upon receipt of tax filings or other correspondence relating to the underlying investment. Interest income and distributions from the Fidelity Central Funds are accrued as earned. Interest income includes coupon interest and amortization of premium and accretion of discount on debt securities as applicable. Investment income is recorded net of foreign taxes withheld where recovery of such taxes is uncertain.
Annual Report
3. Significant Accounting Policies - continued
Class Allocations and Expenses. Investment income, realized and unrealized capital gains and losses, common expenses of the Fund, and certain fund-level expense reductions, if any, are allocated daily on a pro-rata basis to each class based on the relative net assets of each class to the total net assets of the Fund. Each class differs with respect to transfer agent fees incurred. Certain expense reductions may also differ by class. For the reporting period, the allocated portion of income and expenses to each class as a percent of its average net assets may vary due to the timing of recording these transactions in relation to fluctuating net assets of the classes. Expenses directly attributable to a fund are charged to that fund. Expenses attributable to more than one fund are allocated among the respective funds on the basis of relative net assets or other appropriate methods. Expense estimates are accrued in the period to which they relate and adjustments are made when actual amounts are known.
Deferred Trustee Compensation. Under a Deferred Compensation Plan (the Plan), independent Trustees may elect to defer receipt of a portion of their annual compensation. Deferred amounts are invested in a cross-section of Fidelity funds, are marked-to-market and remain in the Fund until distributed in accordance with the Plan. The investment of deferred amounts and the offsetting payable to the Trustees are included in the accompanying Statement of Assets and Liabilities.
Income Tax Information and Distributions to Shareholders. Each year, the Fund intends to qualify as a regulated investment company under Subchapter M of the Internal Revenue Code, including distributing substantially all of its taxable income and realized gains. As a result, no provision for U.S. Federal income taxes is required. As of March 31, 2014, the Fund did not have any unrecognized tax benefits in the financial statements; nor is the Fund aware of any tax positions for which it is reasonably possible that the total amounts of unrecognized tax benefits will significantly change in the next twelve months. The Fund files a U.S. federal tax return, in addition to state and local tax returns as required. The Fund's federal income tax returns are subject to examination by the Internal Revenue Service (IRS) for a period of three fiscal years after they are filed. State and local tax returns may be subject to examination for an additional fiscal year depending on the jurisdiction. Foreign taxes are provided for based on the Fund's understanding of the tax rules and rates that exist in the foreign markets in which it invests. One of the Fund's investments, Rialto Real Estate Fund LP, is owned through an entity that is treated as a corporation for U.S. tax purposes and may be subject to federal and state taxes upon disposition. The tax liability may differ materially depending on conditions when the investment is disposed. At period end, the estimated tax liability for this investment is presented as "Deferred taxes" in the Statement of Assets and Liabilities and included in "Change in net unrealized appreciation (depreciation) on investment securities" in the Statement of Operations.
Annual Report
Notes to Financial Statements - continued
(Amounts in thousands except percentages)
3. Significant Accounting Policies - continued
Income Tax Information and Distributions to Shareholders - continued
Distributions are declared and recorded on the ex-dividend date. Income dividends and capital gain distributions are declared separately for each class. Income and capital gain distributions are determined in accordance with income tax regulations, which may differ from GAAP. In addition, the Fund claimed a portion of the payment made to redeeming shareholders as a distribution for income tax purposes.
Capital accounts within the financial statements are adjusted for permanent book-tax differences. These adjustments have no impact on net assets or the results of operations.
Capital accounts are not adjusted for temporary book-tax differences which will reverse in a subsequent period.
Book-tax differences are primarily due to futures contracts, foreign currency transactions, passive foreign investment companies (PFIC), market discount, partnerships, deferred trustee compensation, and losses deferred due to wash sales.
The federal tax cost of investment securities and unrealized appreciation (depreciation) as of period end were as follows:
Gross unrealized appreciation | $ 3,949,853 |
Gross unrealized depreciation | (143,126) |
Net unrealized appreciation (depreciation) on securities and other investments | $ 3,806,727 |
|
|
Tax Cost | $ 12,330,486 |
The tax-based components of distributable earnings as of period end were as follows:
Undistributed ordinary income | $ 326,972 |
Undistributed long-term capital gain | $ 650,758 |
Net unrealized appreciation (depreciation) | $ 3,806,746 |
The tax character of distributions paid was as follows:
| March 31, 2014 | March 31, 2013 |
|
|
|
Ordinary Income | $ 519,879 | $ 205,932 |
Long-term Capital Gains | 572,280 | - |
Total | $ 1,092,159 | $ 205,932 |
Restricted Securities. The Fund may invest in securities that are subject to legal or contractual restrictions on resale. These securities generally may be resold in transactions exempt from registration or to the public if the securities are registered. Disposal of these securities may involve time-consuming negotiations and expense, and prompt sale at an acceptable price may be difficult. Information regarding restricted securities is included at the end of the Fund's Schedule of Investments.
Annual Report
4. Derivative Instruments.
Risk Exposures and the Use of Derivative Instruments. The Fund's investment objective allows the Fund to enter into various types of derivative contracts, including futures contracts. Derivatives are investments whose value is primarily derived from underlying assets, indices or reference rates and may be transacted on an exchange or over-the-counter (OTC). Derivatives may involve a future commitment to buy or sell a specified asset based on specified terms, to exchange future cash flows at periodic intervals based on a notional principal amount, or for one party to make one or more payments upon the occurrence of specified events in exchange for periodic payments from the other party.
The Fund used derivatives to increase returns and to manage exposure to certain risks as defined below. The success of any strategy involving derivatives depends on analysis of numerous economic factors, and if the strategies for investment do not work as intended, the Fund may not achieve its objectives.
The Fund's use of derivatives increased or decreased its exposure to the following risk:
Equity Risk | Equity risk relates to the fluctuations in the value of financial instruments as a result of changes in market prices (other than those arising from interest rate risk or foreign exchange risk), whether caused by factors specific to an individual investment, its issuer, or all factors affecting all instruments traded in a market or market segment. |
The Fund is also exposed to additional risks from investing in derivatives, such as liquidity risk and counterparty credit risk. Liquidity risk is the risk that the Fund will be unable to close out the derivative in the open market in a timely manner. Counterparty credit risk is the risk that the counterparty will not be able to fulfill its obligation to the Fund. Counterparty credit risk related to exchange-traded futures contracts may be mitigated by the protection provided by the exchange on which they trade.
Investing in derivatives may involve greater risks than investing in the underlying assets directly and, to varying degrees, may involve risk of loss in excess of any initial investment and collateral received and amounts recognized in the Statement of Assets and Liabilities. In addition, there may be the risk that the change in value of the derivative contract does not correspond to the change in value of the underlying instrument.
Futures Contracts. A futures contract is an agreement between two parties to buy or sell a specified underlying instrument for a fixed price at a specified future date. The Fund used futures contracts to manage its exposure to the stock market.
Upon entering into a futures contract, a fund is required to deposit either cash or securities (initial margin) with a clearing broker in an amount equal to a certain percentage of the face value of the contract. Futures contracts are marked-to-market daily and subsequent daily payments (variation margin) are made or received by a fund depending on
Annual Report
Notes to Financial Statements - continued
(Amounts in thousands except percentages)
4. Derivative Instruments - continued
Futures Contracts - continued
the daily fluctuations in the value of the futures contracts and are recorded as unrealized appreciation or (depreciation). This receivable and/or payable, if any, is included in daily variation margin for derivative instruments in the Statement of Assets and Liabilities. Realized gain or (loss) is recorded upon the expiration or closing of a futures contract.
Any open futures contracts at period end are presented in the Schedule of Investments under the caption "Futures Contracts." The underlying face amount at value reflects each contract's exposure to the underlying instrument or index at period end.
During the period the Fund recognized net realized gain (loss) of $9,288 related to its investment in futures contracts. This amount is included in the Statement of Operations.
5. Purchases and Sales of Investments.
Purchases and sales of securities, other than short-term securities, aggregated $11,661,633 and $13,650,095, respectively.
6. Fees and Other Transactions with Affiliates.
Management Fee. Fidelity Management & Research Company (the investment adviser) and its affiliates provide the Fund with investment management related services for which the Fund pays a monthly management fee. The management fee is the sum of an individual fund fee rate that is based on an annual rate of .30% of the Fund's average net assets and an annualized group fee rate that averaged .25% during the period. The group fee rate is based upon the average net assets of all the mutual funds advised by the investment adviser, including any mutual funds previously advised by the investment adviser that are currently advised by Fidelity SelectCo, LLC, an affiliate of the investment adviser. The group fee rate decreases as assets under management increase and increases as assets under management decrease. In addition, the management fee is subject to a performance adjustment (up to a maximum of ± .20% of the Fund's average net assets over a 36 month performance period). The upward or downward adjustment to the management fee is based on the relative investment performance of Magellan as compared to its benchmark index, the S&P 500 Index, over the same 36 month performance period. For the reporting period, the total annual management fee rate, including the performance adjustment, was .33% of the Fund's average net assets. The performance adjustment included in the management fee rate may be higher or lower than the maximum performance adjustment rate due to the difference between the average net assets for the reporting and performance periods.
Transfer Agent Fees. Fidelity Investments Institutional Operations Company, Inc., (FIIOC), an affiliate of the investment adviser, is the transfer, dividend disbursing and
Annual Report
6. Fees and Other Transactions with Affiliates - continued
Transfer Agent Fees - continued
shareholder servicing agent for each class of the Fund. FIIOC receives account fees and asset-based fees that vary according to the account size and type of account of the shareholders of Magellan. FIIOC receives an asset-based fee of Class K's average net assets. FIIOC pays for typesetting, printing and mailing of shareholder reports, except proxy statements.
For the period, transfer agent fees for each class were as follows:
| Amount | % of |
Magellan | $ 19,746 | .15 |
Class K | 1,200 | .05 |
| $ 20,946 |
|
Accounting and Security Lending Fees. Fidelity Service Company, Inc. (FSC), an affiliate of the investment adviser, maintains the Fund's accounting records. The accounting fee is based on the level of average net assets for each month. Under a separate contract, FSC administers the security lending program. The security lending fee is based on the number and duration of lending transactions.
Brokerage Commissions. The Fund placed a portion of its portfolio transactions with brokerage firms which are affiliates of the investment adviser. Brokerage commissions are included in net realized gain (loss) and change in net unrealized appreciation (depreciation) in the Statement of Operations. The commissions paid to these affiliated firms were $300 for the period.
Other. During the period, the investment adviser reimbursed the Fund for certain losses in the amount of $54.
7. Committed Line of Credit.
The Fund participates with other funds managed by the investment adviser or an affiliate in a $4.25 billion credit facility (the "line of credit") to be utilized for temporary or emergency purposes to fund shareholder redemptions or for other short-term liquidity purposes. The Fund has agreed to pay commitment fees on its pro-rata portion of the line of credit, which amounted to $28 and is reflected in Miscellaneous expenses on the Statement of Operations. During the period, there were no borrowings on this line of credit.
8. Security Lending.
The Fund lends portfolio securities through a lending agent from time to time in order to earn additional income. For equity securities, a lending agent is used and may loan
Annual Report
Notes to Financial Statements - continued
(Amounts in thousands except percentages)
8. Security Lending - continued
securities to certain qualified borrowers, including Fidelity Capital Markets (FCM), a broker-dealer affiliated with the Fund. On the settlement date of the loan, the Fund receives collateral (in the form of U.S. Treasury obligations, letters of credit and/or cash) against the loaned securities and maintains collateral in an amount not less than 100% of the market value of the loaned securities during the period of the loan. The market value of the loaned securities is determined at the close of business of the Fund and any additional required collateral is delivered to the Fund on the next business day. If the borrower defaults on its obligation to return the securities loaned because of insolvency or other reasons, the Fund may apply collateral received from the borrower against the obligation. The Fund may experience delays and costs in recovering the securities loaned. Any cash collateral received is invested the Fidelity Securities Lending Cash Central Fund. The value of loaned securities and cash collateral at period end are disclosed on the Fund's Statement of Assets and Liabilities. At period end, there were no security loans outstanding with FCM. Security lending income represents the income earned on investing cash collateral, less rebates paid to borrowers and any lending agent fees associated with the loan, plus any premium payments received for lending certain types of securities. Security lending income is presented in the Statement of Operations as a component of income from Fidelity Central Funds. Total security lending income during the period amounted to $838, including $3 from securities loaned to FCM.
9. Expense Reductions.
Commissions paid to certain brokers with whom the investment adviser, or its affiliates, places trades on behalf of the Fund include an amount in addition to trade execution, which may be rebated back to the Fund to offset certain expenses. This amount totaled $191 for the period.
In addition, the investment adviser reimbursed a portion of the Fund's operating expenses during the period in the amount of $124.
10. Distributions to Shareholders.
Distributions to shareholders of each class were as follows:
Years ended March 31, | 2014 | 2013 |
From net investment income |
|
|
Magellan | $ 94,191 | $ 166,004 |
Class K | 21,472 | 35,831 |
Total | $ 115,663 | $ 201,835 |
Annual Report
10. Distributions to Shareholders - continued
Years ended March 31, | 2014 | 2013 |
From net realized gain |
|
|
Magellan | $ 814,542 | $ 3,417 |
Class K | 161,954 | 680 |
Total | $ 976,496 | $ 4,097 |
11. Share Transactions.
Transactions for each class of shares were as follows:
| Shares | Dollars | ||
Years ended March 31, | 2014 | 2013 | 2014 | 2013 |
Magellan |
|
|
|
|
Shares sold | 3,294 | 3,516 | $ 293,533 | $ 256,383 |
Reinvestment of distributions | 9,695 | 2,238 | 866,714 | 161,604 |
Shares redeemed | (23,873) | (37,834) | (2,081,525) | (2,743,347) |
Net increase (decrease) | (10,884) | (32,080) | $ (921,278) | $ (2,325,360) |
Class K |
|
|
|
|
Shares sold | 2,046 | 7,910 | $ 182,347 | $ 566,429 |
Reinvestment of distributions | 2,055 | 506 | 183,425 | 36,510 |
Shares redeemed | (6,998) | (16,489) | (621,224) | (1,193,749) |
Net increase (decrease) | (2,897) | (8,073) | $ (255,452) | $ (590,810) |
12. Other.
The Fund's organizational documents provide former and current trustees and officers with a limited indemnification against liabilities arising in connection with the performance of their duties to the Fund. In the normal course of business, the Fund may also enter into contracts that provide general indemnifications. The Fund's maximum exposure under these arrangements is unknown as this would be dependent on future claims that may be made against the Fund. The risk of material loss from such claims is considered remote.
Annual Report
Report of Independent Registered Public Accounting Firm
To the Trustees and Shareholders of Fidelity Magellan Fund:
In our opinion, the accompanying statement of assets and liabilities, including the schedule of investments, and the related statements of operations and of changes in net assets and the financial highlights present fairly, in all material respects, the financial position of Fidelity Magellan Fund at March 31, 2014 the results of its operations for the year then ended, the changes in its net assets for each of the two years in the period then ended and the financial highlights for each of the five years in the period then ended, in conformity with accounting principles generally accepted in the United States of America. These financial statements and financial highlights (hereafter referred to as "financial statements") are the responsibility of the Fidelity Magellan Fund's management. Our responsibility is to express an opinion on these financial statements based on our audits. We conducted our audits of these financial statements in accordance with the standards of the Public Company Accounting Oversight Board (United States). Those standards require that we plan and perform the audit to obtain reasonable assurance about whether the financial statements are free of material misstatement. An audit includes examining, on a test basis, evidence supporting the amounts and disclosures in the financial statements, assessing the accounting principles used and significant estimates made by management, and evaluating the overall financial statement presentation. We believe that our audits, which included confirmation of securities at March 31, 2014 by correspondence with the custodian and brokers, provide a reasonable basis for our opinion.
PricewaterhouseCoopers LLP
Boston, Massachusetts
May 14, 2014
Annual Report
Trustees and Officers
The Trustees, Member of the Advisory Board, and officers of the trust and fund, as applicable, are listed below. The Board of Trustees governs the fund and is responsible for protecting the interests of shareholders. The Trustees are experienced executives who meet periodically throughout the year to oversee the fund's activities, review contractual arrangements with companies that provide services to the fund, oversee management of the risks associated with such activities and contractual arrangements, and review the fund's performance. Except for James C. Curvey, Ned C. Lautenbach, and William S. Stavropoulos, each of the Trustees oversees 172 funds. Mr. Curvey oversees 395 funds. Mr. Lautenbach and Mr. Stavropoulos each oversees 246 funds.
The Trustees hold office without limit in time except that (a) any Trustee may resign; (b) any Trustee may be removed by written instrument, signed by at least two-thirds of the number of Trustees prior to such removal; (c) any Trustee who requests to be retired or who has become incapacitated by illness or injury may be retired by written instrument signed by a majority of the other Trustees; and (d) any Trustee may be removed at any special meeting of shareholders by a two-thirds vote of the outstanding voting securities of the trust. Each Trustee who is not an interested person (as defined in the 1940 Act) of the trust and the fund (Independent Trustee), shall retire not later than the last day of the calendar year in which his or her 75th birthday occurs. The Independent Trustees may waive this mandatory retirement age policy with respect to individual Trustees. The officers and Advisory Board Member hold office without limit in time, except that any officer and Advisory Board Member may resign or may be removed by a vote of a majority of the Trustees at any regular meeting or any special meeting of the Trustees. Except as indicated, each individual has held the office shown or other offices in the same company for the past five years.
Experience, Skills, Attributes, and Qualifications of the Fund's Trustees. The Governance and Nominating Committee has adopted a statement of policy that describes the experience, qualifications, attributes, and skills that are necessary and desirable for potential Independent Trustee candidates (Statement of Policy). The Board believes that each Trustee satisfied at the time he or she was initially elected or appointed a Trustee, and continues to satisfy, the standards contemplated by the Statement of Policy. The Governance and Nominating Committee also engages professional search firms to help identify potential Independent Trustee candidates who have the experience, qualifications, attributes, and skills consistent with the Statement of Policy. From time to time, additional criteria based on the composition and skills of the current Independent Trustees, as well as experience or skills that may be appropriate in light of future changes to board composition, business conditions, and regulatory or other developments, have also been considered by the professional search firms and the Governance and Nominating Committee. In addition, the Board takes into account the Trustees' commitment and participation in Board and committee meetings, as well as their leadership of standing and ad hoc committees throughout their tenure.
In determining that a particular Trustee was and continues to be qualified to serve as a Trustee, the Board has considered a variety of criteria, none of which, in isolation, was controlling. The Board believes that, collectively, the Trustees have balanced and diverse experience, qualifications, attributes, and skills, which allow the Board to operate effectively in governing the fund and protecting the interests of shareholders. Information about the specific experience, skills, attributes, and qualifications of each Trustee, which in each case led to the Board's conclusion that the Trustee should serve (or continue to serve) as a trustee of the fund, is provided below.
Annual Report
Board Structure and Oversight Function. James C. Curvey is an interested person (as defined in the 1940 Act) and currently serves as Chairman. The Trustees have determined that an interested Chairman is appropriate and benefits shareholders because an interested Chairman has a personal and professional stake in the quality and continuity of services provided to the fund. Independent Trustees exercise their informed business judgment to appoint an individual of their choosing to serve as Chairman, regardless of whether the Trustee happens to be independent or a member of management. The Independent Trustees have determined that they can act independently and effectively without having an Independent Trustee serve as Chairman and that a key structural component for assuring that they are in a position to do so is for the Independent Trustees to constitute a substantial majority for the Board. The Independent Trustees also regularly meet in executive session. Ned C. Lautenbach serves as Chairman of the Independent Trustees and as such (i) acts as a liaison between the Independent Trustees and management with respect to matters important to the Independent Trustees and (ii) with management prepares agendas for Board meetings.
Fidelity funds are overseen by different Boards of Trustees. The fund's Board oversees Fidelity's equity and high income funds and another Board oversees Fidelity's investment-grade bond, money market, and asset allocation funds. The asset allocation funds may invest in Fidelity funds overseen by the fund's Board. The use of separate Boards, each with its own committee structure, allows the Trustees of each group of Fidelity funds to focus on the unique issues of the funds they oversee, including common research, investment, and operational issues. On occasion, the separate Boards establish joint committees to address issues of overlapping consequences for the Fidelity funds overseen by each Board.
The Trustees operate using a system of committees to facilitate the timely and efficient consideration of all matters of importance to the Trustees, the fund, and fund shareholders and to facilitate compliance with legal and regulatory requirements and oversight of the fund's activities and associated risks. The Board, acting through its committees, has charged FMR and its affiliates with (i) identifying events or circumstances the occurrence of which could have demonstrably adverse effects on the fund's business and/or reputation; (ii) implementing processes and controls to lessen the possibility that such events or circumstances occur or to mitigate the effects of such events or circumstances if they do occur; and (iii) creating and maintaining a system designed to evaluate continuously business and market conditions in order to facilitate the identification and implementation processes described in (i) and (ii) above. Because the day-to-day operations and activities of the fund are carried out by or through FMR, its affiliates and other service providers, the fund's exposure to risks is mitigated but not eliminated by the processes overseen by the Trustees. While each of the Board's committees has responsibility for overseeing different aspects of the fund's activities, oversight is exercised primarily through the Operations, Audit, and Compliance Committees. In addition, the Independent Trustees have worked with FMR to enhance the Board's oversight of investment and financial risks, legal and regulatory risks, technology risks, and operational risks, including the development of additional risk reporting to the Board. For example, a working group comprised of Independent Trustees and FMR has worked and continues to work to review the Fidelity funds' valuation-related activities, reporting and risk management. Appropriate personnel, including but not limited to the fund's Chief Compliance Officer (CCO), FMR's internal auditor, the independent accountants, the fund's Treasurer and portfolio management personnel, make periodic reports to the Board's committees, as appropriate, including an annual review of FMR's risk management program for the Fidelity funds. The responsibilities of each standing committee, including their oversight responsibilities, are described further under "Standing Committees of the Fund's Trustees."
Annual Report
Trustees and Officers - continued
The fund's Statement of Additional Information (SAI) includes more information about the Trustees. To request a free copy, call Fidelity at 1-800-835-5092.
Interested Trustees*:
Correspondence intended for each Trustee who is an interested person may be sent to Fidelity Investments, 245 Summer Street, Boston, Massachusetts 02210.
Name, Year of Birth; Principal Occupations and Other Relevant Experience+ | |
James C. Curvey (1935) | |
Year of Election or Appointment: 2007 Trustee Chairman of the Board of Trustees | |
| Mr. Curvey also serves as Trustee of other Fidelity funds. Mr. Curvey is a Director of Fidelity Investments Money Management, Inc. (2009-present), Director of Fidelity Research & Analysis Co. (2009-present) and Director of FMR and FMR Co., Inc. (2007-present). Mr. Curvey is also Vice Chairman (2007-present) and Director of FMR LLC. In addition, Mr. Curvey serves as an Overseer for the Boston Symphony Orchestra and a member of the Trustees of Villanova University. Previously, Mr. Curvey was the Vice Chairman (2006-2007) and Director (2000-2007) of FMR Corp. |
Charles S. Morrison (1960) | |
Year of Election or Appointment: 2014 Trustee | |
| Mr. Morrison also serves as Trustee or Vice President of other funds. He serves as President, Asset Management (2014-present) and is an employee of Fidelity Investments. Previously, Mr. Morrison served as President, Fixed Income (2011-2014), Vice President of Fidelity's Money Market Funds (2005-2009), President, Money Market Group Leader of FMR (2009), and Senior Vice President, Money Market Group of FMR (2004-2009). Mr. Morrison also served as Vice President of Fidelity's Bond Funds (2002-2005), certain Balanced Funds (2002-2005), and certain Asset Allocation Funds (2002-2007), and as Senior Vice President (2002-2005) of Fidelity's Bond Division. |
* Trustees have been determined to be "Interested Trustees" by virtue of, among other things, their affiliation with the trust or various entities under common control with FMR.
+ The information above includes each Trustee's principal occupation during the last five years and other information relating to the experience, attributes, and skills relevant to each Trustee's qualifications to serve as a Trustee, which led to the conclusion that each Trustee should serve as a Trustee for the fund.
Annual Report
Trustees and Officers - continued
Independent Trustees:
Correspondence intended for each Independent Trustee (that is, the Trustees other than the Interested Trustees) may be sent to Fidelity Investments, P.O. Box 55235, Boston, Massachusetts 02205-5235.
Name, Year of Birth; Principal Occupations and Other Relevant Experience+ | |
Dennis J. Dirks (1948) | |
Year of Election or Appointment: 2005 Trustee | |
| Mr. Dirks also serves as Trustee of other Fidelity funds. Prior to his retirement in May 2003, Mr. Dirks was Chief Operating Officer and a member of the Board of The Depository Trust & Clearing Corporation (DTCC). He also served as President, Chief Operating Officer, and Board member of The Depository Trust Company (DTC) and President and Board member of the National Securities Clearing Corporation (NSCC). In addition, Mr. Dirks served as Chief Executive Officer and Board member of the Government Securities Clearing Corporation, Chief Executive Officer and Board member of the Mortgage-Backed Securities Clearing Corporation, as a Trustee and a member of the Finance Committee of Manhattan College (2005-2008), and as a Trustee and a member of the Finance Committee of AHRC of Nassau County (2006-2008). Mr. Dirks is a member of the Independent Directors Council (IDC) Governing Council (2010-present) and Board of Directors for The Brookville Center for Children's Services, Inc. (2009-present). |
Alan J. Lacy (1953) | |
Year of Election or Appointment: 2008 Trustee | |
| Mr. Lacy also serves as Trustee of other Fidelity funds. Mr. Lacy serves as Senior Adviser (2007-present) of Oak Hill Capital Partners, L.P. (private equity). Mr. Lacy also served as Chief Executive Officer (2000-2005) and Vice Chairman (2005-2006) of Sears Holdings Corporation and Sears, Roebuck and Co. (retail). In addition, Mr. Lacy serves as a member of the Board of Directors of Dave & Buster's Entertainment, Inc. (restaurant and entertainment complexes, 2010-present), Earth Fare, Inc. (retail grocery, 2012-present), The Hillman Companies, Inc. (hardware wholesalers, 2010-present), and Bristol-Myers Squibb Company (global pharmaceuticals, 2008-present). Mr. Lacy is a member of the Board of Trustees of The National Parks Conservation Association (2006-present). Previously, Mr. Lacy served as Chairman of the Board of Trustees of the National Parks Conservation Association (2008-2011) and as a member of the Board of Directors for the Western Union Company (global money transfer, 2006-2011). |
Ned C. Lautenbach (1944) | |
Year of Election or Appointment: 2000 Trustee Chairman of the Independent Trustees | |
| Mr. Lautenbach also serves as Trustee of other Fidelity funds. Mr. Lautenbach currently serves as the Lead Director of the Eaton Corporation Board of Directors (diversified industrial, 1997-present). Mr. Lautenbach is Chairman of the Board of Directors of the Philharmonic Center for the Arts in Naples, Florida (2012-present) and a member of the Council on Foreign Relations (1994-present). Previously, Mr. Lautenbach was a Partner/Advisory Partner at Clayton, Dubilier & Rice, LLC (private equity investment, 1998-2010), as well as a Director of Sony Corporation (2006-2007). |
Joseph Mauriello (1944) | |
Year of Election or Appointment: 2008 Trustee | |
| Mr. Mauriello also serves as Trustee of other Fidelity funds. Prior to his retirement in January 2006, Mr. Mauriello served in numerous senior management positions including Deputy Chairman and Chief Operating Officer (2004-2005), and Vice Chairman of Financial Services (2002-2004) of KPMG LLP US (professional services, 1965-2005). Mr. Mauriello currently serves as a member of the Board of Directors of XL Group plc. (global insurance and re-insurance, 2006-present). Previously, Mr. Mauriello served as a Director of the Hamilton Funds of the Bank of New York (2006-2007) and of Arcadia Resources Inc. (health care services and products, 2007-2012). |
Robert W. Selander (1950) | |
Year of Election or Appointment: 2011 Trustee | |
| Mr. Selander also serves as Trustee of other Fidelity funds. Previously, Mr. Selander served as a Member of the Advisory Board of other Fidelity funds (2011), and Executive Vice Chairman (2010), Chief Executive Officer (2009-2010), and President and Chief Executive Officer (1997-2009) of Mastercard, Inc. |
Cornelia M. Small (1944) | |
Year of Election or Appointment: 2005 Trustee | |
| Ms. Small also serves as Trustee of other Fidelity funds. Ms. Small is a member of the Board of Directors (2009-present) and Chair of the Investment Committee (2010-present) of the Teagle Foundation. Ms. Small also serves on the Investment Committee of the Berkshire Taconic Community Foundation (2008-present). Previously, Ms. Small served as Chairperson (2002-2008) and a member of the Investment Committee and Chairperson (2008-2012) and a member of the Board of Trustees of Smith College. In addition, Ms. Small served as Chief Investment Officer, Director of Global Equity Investments, and a member of the Board of Directors of Scudder, Stevens & Clark and Scudder Kemper Investments. |
William S. Stavropoulos (1939) | |
Year of Election or Appointment: 2001 Trustee Vice Chairman of the Independent Trustees | |
| Mr. Stavropoulos also serves as Trustee of other Fidelity funds. Mr. Stavropoulos serves as President and Founder of the Michigan Baseball Foundation, the Great Lakes Loons (2007-present). Mr. Stavropoulos is Chairman Emeritus of the Board of Directors of The Dow Chemical Company, where he previously served in numerous senior management positions, including President, CEO (1995-2000; 2002-2004), Chairman of the Executive Committee (2000-2006), and as a member of the Board of Directors (1990-2006). Currently, Mr. Stavropoulos is Chairman of the Board of Directors of Univar Inc. (global distributor of commodity and specialty chemicals), a Director of Teradata Corporation (data warehousing and technology solutions), and Maersk Inc. (industrial conglomerate), and a member of the Advisory Board for Metalmark Capital LLC (private equity investment, 2005-present). Mr. Stavropoulos is an operating advisor to Clayton, Dubilier & Rice, LLC (private equity investment). In addition, Mr. Stavropoulos is a member of the University of Notre Dame Advisory Council for the College of Science, a Trustee of the Rollin L. Gerstacker Foundation, and a Director of the Naples Philharmonic Center for the Arts. Previously, Mr. Stavropoulos served as a Director of Chemical Financial Corporation (bank holding company, 1993-2012) and Tyco International, Ltd. (multinational manufacturing and services, 2007-2012). |
David M. Thomas (1949) | |
Year of Election or Appointment: 2008 Trustee | |
| Mr. Thomas also serves as Trustee of other Fidelity funds. Mr. Thomas serves as Non-Executive Chairman of the Board of Directors of Fortune Brands Home and Security (home and security products, 2011-present), and as a member of the Board of Directors of Interpublic Group of Companies, Inc. (marketing communication, 2004-present). Previously, Mr. Thomas served as Executive Chairman (2005-2006) and Chairman and Chief Executive Officer (2000-2005) of IMS Health, Inc. (pharmaceutical and healthcare information solutions), and a Director of Fortune Brands, Inc. (consumer products, 2000-2011). |
+ The information above includes each Trustee's principal occupation during the last five years and other information relating to the experience, attributes, and skills relevant to each Trustee's qualifications to serve as a Trustee, which led to the conclusion that each Trustee should serve as a Trustee for the fund.
Advisory Board Member and Officers:
Correspondence intended for each officer and Peter S. Lynch may be sent to Fidelity Investments, 245 Summer Street, Boston, Massachusetts 02210. Officers appear below in alphabetical order.
Name, Year of Birth; Principal Occupation | |
Peter S. Lynch (1944) | |
Year of Election or Appointment: 2003 Member of the Advisory Board | |
| Mr. Lynch also serves as Member of the Advisory Board of other Fidelity funds. Mr. Lynch is Vice Chairman and a Director of FMR and FMR Co., Inc. In addition, Mr. Lynch serves as a Trustee of Boston College and as the Chairman of the Inner-City Scholarship Fund. Previously, Mr. Lynch served on the Special Olympics International Board of Directors (1997-2006). |
Elizabeth Paige Baumann (1968) | |
Year of Election or Appointment: 2012 Anti-Money Laundering (AML) Officer | |
| Ms. Baumann also serves as AML Officer of other funds. She is Chief AML Officer of FMR LLC (2012-present) and is an employee of Fidelity Investments. Previously, Ms. Baumann served as Vice President and Deputy Anti-Money Laundering Officer (2007-2012). |
William C. Coffey (1969) | |
Year of Election or Appointment: 2009 Assistant Secretary | |
| Mr. Coffey also serves as Assistant Secretary of other funds. He is Senior Vice President and Deputy General Counsel of FMR LLC (2010-present), and is an employee of Fidelity Investments. Previously, Mr. Coffey served as Vice President and Associate General Counsel of FMR LLC (2005-2009). |
Jonathan Davis (1968) | |
Year of Election or Appointment: 2010 Assistant Treasurer | |
| Mr. Davis also serves as Assistant Treasurer of other funds. Mr. Davis is an employee of Fidelity Investments. Previously, Mr. Davis served as Vice President and Associate General Counsel of FMR LLC (2003-2010). |
Adrien E. Deberghes (1967) | |
Year of Election or Appointment: 2008 Deputy Treasurer | |
| Mr. Deberghes also serves as an officer of other funds. He is an employee of Fidelity Investments (2008-present). Prior to joining Fidelity Investments, Mr. Deberghes was Senior Vice President of Mutual Fund Administration at State Street Corporation (2007-2008), Senior Director of Mutual Fund Administration at Investors Bank & Trust (2005-2007), and Director of Finance for Dunkin' Brands (2000-2005). |
Stephanie J. Dorsey (1969) | |
Year of Election or Appointment: 2010 Assistant Treasurer | |
| Ms. Dorsey also serves as an officer of other funds. She is an employee of Fidelity Investments (2008-present) and has served in other fund officer roles. Prior to joining Fidelity Investments, Ms. Dorsey served as Treasurer (2004-2008) of the JPMorgan Mutual Funds and Vice President (2004-2008) of JPMorgan Chase Bank. |
Scott C. Goebel (1968) | |
Year of Election or Appointment: 2008 Secretary and Chief Legal Officer (CLO) | |
| Mr. Goebel serves as Secretary and CLO of other funds. Mr. Goebel also serves as Secretary of Fidelity SelectCo, LLC (2013-present), Fidelity Investments Money Management, Inc. (FIMM) (2010-present) and Fidelity Research and Analysis Company (FRAC) (2010-present); General Counsel, Secretary, and Senior Vice President of FMR (2008-present) and FMR Co., Inc. (2008-present); Chief Legal Officer of Fidelity Management & Research (Hong Kong) Limited (2008-present); and Assistant Secretary of Fidelity Management & Research (Japan) Inc. (2008- |
Joseph A. Hanlon (1968) | |
Year of Election or Appointment: 2012 Chief Compliance Officer | |
| Mr. Hanlon also serves as Chief Compliance Officer of other funds. Mr. Hanlon serves as Compliance Officer of FMR, FMR Co., Inc., Fidelity Investments Money Management, Inc. (FIMM), and Fidelity Research and Analysis Company (FRAC), as Senior Vice President of the Fidelity Asset Management Division (2009-present), and is an employee of Fidelity Investments. Previously, Mr. Hanlon served as Compliance Officer of Fidelity Management & Research (Hong Kong) (2009-2014), Fidelity Management & Research (Japan) Inc. (2009-2013), Strategic Advisers, Inc. (2009-2013), and Fidelity Management & Research (U.K.) Inc. (2009-2013). |
Bruce T. Herring (1965) | |
Year of Election or Appointment: 2006 Vice President of certain Equity Funds | |
| Mr. Herring also serves as Vice President of other funds. He serves as Chief Investment Officer of Fidelity Global Asset Allocation (GAA) (2013-present), Group Chief Investment Officer of FMR, and President of Fidelity Research & Analysis Company (2010-present). Previously, Mr. Herring served as Chief Investment Officer and Director of Fidelity Management & Research (U.K.) Inc. (2010-2013), Vice President (2005-2006) and Senior Vice President (2006-2007) of Fidelity Management & Research Company, Vice President of FMR Co., Inc. (2001-2007), and as a portfolio manager for Fidelity U.S. Equity Funds. |
Brian B. Hogan (1964) | |
Year of Election or Appointment: 2009 Vice President | |
| Mr. Hogan also serves as Trustee or Vice President of other funds. Mr. Hogan serves as President of FMR's Equity Division (2009-present). Previously, Mr. Hogan served as Senior Vice President, Equity Research of FMR (2006-2009) and as a portfolio manager. |
Chris Maher (1972) | |
Year of Election or Appointment: 2013 Assistant Treasurer | |
| Mr. Maher serves as Assistant Treasurer of other funds. Mr. Maher is Vice President of Valuation Oversight and is an employee of Fidelity Investments. Previously, Mr. Maher served as Vice President of Asset Management Compliance (2013), Vice President of FMR's Program Management Group (2010-2013), and Vice President of Valuation Oversight (2008-2010). |
Christine Reynolds (1958) | |
Year of Election or Appointment: 2008 Chief Financial Officer | |
| Ms. Reynolds also serves as Chief Financial Officer of other funds. Ms. Reynolds became President of Fidelity Pricing and Cash Management Services (FPCMS) in August 2008. Ms. Reynolds served as Chief Operating Officer of FPCMS (2007-2008). Previously, Ms. Reynolds served as President, Treasurer, and Anti-Money Laundering officer of the Fidelity funds (2004-2007). |
Kenneth B. Robins (1969) | |
Year of Election or Appointment: 2008 President and Treasurer | |
| Mr. Robins also serves as an officer of other funds. Mr. Robins serves as Executive Vice President of Fidelity Investments Money Management, Inc. (FIMM) (2013-present) and is an employee of Fidelity Investments (2004-present). Previously, Mr. Robins served in other fund officer roles. |
Stephen Sadoski (1971) | |
Year of Election or Appointment: 2012 Deputy Treasurer | |
| Mr. Sadoski also serves as Deputy Treasurer of other funds. He is an employee of Fidelity Investments (2012-present) and has served in another fund officer role. Prior to joining Fidelity Investments, Mr. Sadoski served as an assistant chief accountant in the Division of Investment Management of the Securities and Exchange Commission (SEC) (2009-2012) and as a senior manager at Deloitte & Touche LLP (1997-2009). |
Stacie M. Smith (1974) | |
Year of Election or Appointment: 2013 Deputy Treasurer | |
| Ms. Smith also serves as an officer of other funds. She is an employee of Fidelity Investments (2009-present) and has served in other fund officer roles. Prior to joining Fidelity Investments, Ms. Smith served as Senior Audit Manager of Ernst & Young LLP (1996-2009). |
Renee Stagnone (1975) | |
Year of Election or Appointment: 2013 Deputy Treasurer | |
| Ms. Stagnone also serves as Deputy Treasurer of other funds. Ms. Stagnone is an employee of Fidelity Investments. |
Joseph F. Zambello (1957) | |
Year of Election or Appointment: 2011 Deputy Treasurer | |
| Mr. Zambello also serves as Deputy Treasurer of other funds. Mr. Zambello is an employee of Fidelity Investments. Previously, Mr. Zambello served as Vice President of FMR's Program Management Group (2009-2011) and Vice President of the Transfer Agent Oversight Group (2005-2009). |
Annual Report
Distributions (Unaudited)
The Board of Trustees of Fidelity Magellan Fund voted to pay shareholders of record at the opening of business on record date, the following distributions per share derived from capital gains realized from sales of portfolio securities, and dividends derived from net investment income:
| Pay Date | Record Date | Dividends | Capital Gains |
Class K | 05/05/14 | 05/02/14 | $0.202 | $5.586 |
The fund hereby designates as capital gain dividend with respect to the taxable year ended March 31, 2014, $1,164,345,693, or, if subsequently determined to be different, the net capital gain of such year.
Class K designates 74% and 27% of the dividends distributed in May and December, respectively during the fiscal year as qualifying for the dividend-received deduction for corporate shareholders.
Class K designates 75% and 30% of each dividend distributed in May and December, respectively during the fiscal year as amounts which may be taken into account as a dividend for purposes of the maximum rate under section 1(h)(11) of the Internal Revenue Code.
The fund will notify shareholders in January 2015 of amounts for use in preparing 2014 income tax returns.
Annual Report
Investment Adviser
Fidelity Management &
Research Company
Boston, MA
Investment Sub-Advisers
FMR Co., Inc.
Fidelity Management & Research
(U.K.) Inc.
Fidelity Management & Research
(Japan) Inc.
Fidelity Management & Research
(Hong Kong) Limited
General Distributor
Fidelity Distributors Corporation
Smithfield, RI
Transfer and Service Agents
Fidelity Investments Institutional
Operations Company, Inc.
Boston, MA
Fidelity Service Company, Inc.
Boston, MA
Custodian
State Street Bank and Trust Company Quincy, MA
(Fidelity Investment logo)(registered trademark)
Corporate Headquarters
245 Summer St., Boston, MA 02210
www.fidelity.com
MAG-K-UANN-0514
1.863176.105
Item 2. Code of Ethics
As of the end of the period, March 31, 2014, Fidelity Magellan Fund (the trust) has adopted a code of ethics, as defined in Item 2 of Form N-CSR, that applies to its President and Treasurer and its Chief Financial Officer. A copy of the code of ethics is filed as an exhibit to this Form N-CSR.
Item 3. Audit Committee Financial Expert
The Board of Trustees of the trust has determined that Joseph Mauriello is an audit committee financial expert, as defined in Item 3 of Form N-CSR. Mr. Mauriello is independent for purposes of Item 3 of Form N-CSR.
Item 4. Principal Accountant Fees and Services
Fees and Services
The following table presents fees billed by PricewaterhouseCoopers LLP ("PwC") in each of the last two fiscal years for services rendered to Fidelity Magellan Fund (the "Fund"):
Services Billed by PwC
March 31, 2014 FeesA
| Audit Fees | Audit-Related Fees | Tax Fees | All Other Fees |
Fidelity Magellan Fund | $179,000 | $- | $4,600 | $7,000 |
March 31, 2013 FeesA
| Audit Fees | Audit-Related Fees | Tax Fees | All Other Fees |
Fidelity Magellan Fund | $191,000 | $- | $4,600 | $7,500 |
A Amounts may reflect rounding.
The following table presents fees billed by PwC that were required to be approved by the Audit Committee for services that relate directly to the operations and financial reporting of the Fund and that are rendered on behalf of Fidelity Management & Research Company ("FMR") and entities controlling, controlled by, or under common control with FMR (not including any sub-adviser whose role is primarily portfolio management and is subcontracted with or overseen by another investment adviser) that provide ongoing services to the Fund ("Fund Service Providers"):
Services Billed by PwC
| March 31, 2014A | March 31, 2013A |
Audit-Related Fees | $4,970,000 | $4,755,000 |
Tax Fees | $- | $- |
All Other Fees | $50,000 | $- |
A Amounts may reflect rounding.
"Audit-Related Fees" represent fees billed for assurance and related services that are reasonably related to the performance of the fund audit or the review of the fund's financial statements and that are not reported under Audit Fees.
"Tax Fees" represent fees billed for tax compliance, tax advice or tax planning that relate directly to the operations and financial reporting of the fund.
"All Other Fees" represent fees billed for services provided to the fund or Fund Service Provider, a significant portion of which are assurance related, that relate directly to the operations and financial reporting of the fund, excluding those services that are reported under Audit Fees, Audit-Related Fees or Tax Fees.
Assurance services must be performed by an independent public accountant.
* * *
The aggregate non-audit fees billed by PwC for services rendered to the Fund, FMR (not including any sub-adviser whose role is primarily portfolio management and is subcontracted with or overseen by another investment adviser), and any Fund Service Provider for each of the last two fiscal years of the Fund are as follows:
Billed By | March 31, 2014 A | March 31, 2013 A |
PwC | $5,500,000 | $5,415,000 |
A Amounts may reflect rounding.
The trust's Audit Committee has considered non-audit services that were not pre-approved that were provided by PwC to Fund Service Providers to be compatible with maintaining the independence of PwC in its audit of the Fund, taking into account representations from PwC, in accordance with Public Company Accounting Oversight Board rules, regarding its independence from the Fund and its related entities and FMR's review of the appropriateness and permissibility under applicable law of such non-audit services prior to their provision to the Fund Service Providers.
Audit Committee Pre-Approval Policies and Procedures
The trust's Audit Committee must pre-approve all audit and non-audit services provided by a fund's independent registered public accounting firm relating to the operations or financial reporting of the fund. Prior to the commencement of any audit or non-audit services to a fund, the Audit Committee reviews the services to determine whether they are appropriate and permissible under applicable law.
The Audit Committee has adopted policies and procedures to, among other purposes, provide a framework for the Committee's consideration of non-audit services by the audit firms that audit the Fidelity funds. The policies and procedures require that any non-audit service provided by a fund audit firm to a Fidelity fund and any non-audit service provided by a fund auditor to a Fund Service Provider that relates directly to the operations and financial reporting of a Fidelity fund ("Covered Service") are subject to approval by the Audit Committee before such service is provided.
All Covered Services must be approved in advance of provision of the service either: (i) by formal resolution of the Audit Committee, or (ii) by oral or written approval of the service by the Chair of the Audit Committee (or if the Chair is unavailable, such other member of the Audit Committee as may be designated by the Chair to act in the Chair's absence). The approval contemplated by (ii) above is permitted where the Treasurer determines that action on such an engagement is necessary before the next meeting of the Audit Committee.
Non-audit services provided by a fund audit firm to a Fund Service Provider that do not relate directly to the operations and financial reporting of a Fidelity fund are reported to the Audit Committee on a periodic basis.
Non-Audit Services Approved Pursuant to Rule 2-01(c)(7)(i)(C) and (ii) of Regulation S-X ("De Minimis Exception")
There were no non-audit services approved or required to be approved by the Audit Committee pursuant to the De Minimis Exception during the Fund's last two fiscal years relating to services provided to (i) the Fund or (ii) any Fund Service Provider that relate directly to the operations and financial reporting of the Fund.
Item 5. Audit Committee of Listed Registrants
Not applicable.
Item 6. Investments
(a) Not applicable.
(b) Not applicable
Item 7. Disclosure of Proxy Voting Policies and Procedures for Closed-End Management Investment Companies
Not applicable.
Item 8. Portfolio Managers of Closed-End Management Investment Companies
Not applicable.
Item 9. Purchase of Equity Securities by Closed-End Management Investment Company and Affiliated Purchasers
Not applicable.
Item 10. Submission of Matters to a Vote of Security Holders
There were no material changes to the procedures by which shareholders may recommend nominees to the trust's Board of Trustees.
Item 11. Controls and Procedures
(a)(i) The President and Treasurer and the Chief Financial Officer have concluded that the trust's disclosure controls and procedures (as defined in Rule 30a-3(c) under the Investment Company Act) provide reasonable assurances that material information relating to the trust is made known to them by the appropriate persons, based on their evaluation of these controls and procedures as of a date within 90 days of the filing date of this report.
(a)(ii) There was no change in the trust's internal control over financial reporting (as defined in Rule 30a-3(d) under the Investment Company Act) that occurred during the second fiscal quarter of the period covered by this report that has materially affected, or is reasonably likely to materially affect, the trust's internal control over financial reporting.
Item 12. Exhibits
(a) | (1) | Code of Ethics pursuant to Item 2 of Form N-CSR is filed and attached hereto as EX-99.CODE ETH. |
(a) | (2) | Certification pursuant to Rule 30a-2(a) under the Investment Company Act of 1940 (17 CFR 270.30a-2(a)) is filed and attached hereto as Exhibit 99.CERT. |
(a) | (3) | Not applicable. |
(b) |
| Certification pursuant to Rule 30a-2(b) under the Investment Company Act of 1940 (17 CFR 270.30a-2(b)) is furnished and attached hereto as Exhibit 99.906CERT. |
SIGNATURES
Pursuant to the requirements of the Securities Exchange Act of 1934 and the Investment Company Act of 1940, the registrant has duly caused this report to be signed on its behalf by the undersigned, thereunto duly authorized.
Fidelity Magellan Fund
By: | /s/Kenneth B. Robins |
| Kenneth B. Robins |
| President and Treasurer |
|
|
Date: | May 28, 2014 |
Pursuant to the requirements of the Securities Exchange Act of 1934 and the Investment Company Act of 1940, this report has been signed below by the following persons on behalf of the registrant and in the capacities and on the dates indicated.
By: | /s/Kenneth B. Robins |
| Kenneth B. Robins |
| President and Treasurer |
|
|
Date: | May 28, 2014 |
By: | /s/Christine Reynolds |
| Christine Reynolds |
| Chief Financial Officer |
|
|
Date: | May 28, 2014 |