UNITED STATES
SECURITIES AND EXCHANGE COMMISSION
Washington, D.C. 20549
FORM N-CSR
CERTIFIED SHAREHOLDER REPORT OF REGISTERED
MANAGEMENT INVESTMENT COMPANIES
Investment Company Act file number 811-1193
Fidelity Magellan Fund
(Exact name of registrant as specified in charter)
82 Devonshire St., Boston, Massachusetts 02109
(Address of principal executive offices) (Zip code)
Scott C. Goebel, Secretary
82 Devonshire St.
Boston, Massachusetts 02109
(Name and address of agent for service)
Registrant's telephone number, including area code: 617-563-7000
Date of fiscal year end: | March 31 |
| |
Date of reporting period: | September 30, 2011 |
Item 1. Reports to Stockholders
Fidelity®
Magellan®
Fund
Semiannual Report
September 30, 2011

Contents
Chairman's Message | (Click Here) | The Chairman's message to shareholders. |
Shareholder Expense Example | (Click Here) | An example of shareholder expenses. |
Investment Changes | (Click Here) | A summary of major shifts in the fund's investments over the past six months. |
Investments | (Click Here) | A complete list of the fund's investments with their market values. |
Financial Statements | (Click Here) | Statements of assets and liabilities, operations, and changes in net assets, as well as financial highlights. |
Notes | (Click Here) | Notes to the financial statements. |
Report of Independent Registered Public Accounting Firm | (Click Here) | |
Board Approval of Investment Advisory Contracts and Management Fees | (Click Here) | |
To view a fund's proxy voting guidelines and proxy voting record for the 12-month period ended June 30, visit http://www.fidelity.com/proxyvotingresults or visit the Securities and Exchange Commission's (SEC) website at http://www.sec.gov. You may also call 1-800-544-8544 to request a free copy of the proxy voting guidelines.
Standard & Poor's, S&P and S&P 500 are registered service marks of The McGraw-Hill Companies, Inc. and have been licensed for use by Fidelity Distributors Corporation.
Other third party marks appearing herein are the property of their respective owners.
All other marks appearing herein are registered or unregistered trademarks or service marks of FMR LLC or an affiliated company.
This report and the financial statements contained herein are submitted for the general information of the shareholders of the fund. This report is not authorized for distribution to prospective investors in the fund unless preceded or accompanied by an effective prospectus.
A fund files its complete schedule of portfolio holdings with the SEC for the first and third quarters of each fiscal year on Form N-Q. Forms N-Q are available on the SEC's web site at http://www.sec.gov. A fund's Forms N-Q may be reviewed and copied at the SEC's Public Reference Room in Washington, DC. Information regarding the operation of the SEC's Public Reference Room may be obtained by calling 1-800-SEC-0330. For a complete list of a fund's portfolio holdings, view the most recent holdings listing, semiannual report, or annual report on Fidelity's web site at http://www.fidelity.com, http://www.advisor.fidelity.com, or http://www.401k.com, as applicable.
NOT FDIC INSURED • MAY LOSE VALUE • NO BANK GUARANTEE
Neither the fund nor Fidelity Distributors Corporation is a bank.
Semiannual Report
(photo_of_James_C_Curvey)
Dear Shareholder:
Global equity markets finished the third quarter in a significant downturn that intensified in late July and early August, as Congress struggled to raise the debt ceiling and Standard & Poor's announced it was lowering its long-term sovereign credit rating of the United States. The historic downgrade, along with continued evidence of a slowing global economy, heightened investor anxiety and set off a wave of volatility that hampered most major asset classes through the end of September. Financial markets are always unpredictable, of course, but there are several time-tested investment principles that can help put the odds in your favor.
One of the basic tenets is to invest for the long term. Over time, riding out the markets' inevitable ups and downs has proven much more effective than selling into panic or chasing the hottest trend. Even missing only a few of the markets' best days can significantly diminish investor returns. Patience also affords the benefits of compounding - of earning interest on additional income or reinvested dividends and capital gains. There can be tax advantages and cost benefits to consider as well. While staying the course doesn't eliminate risk, it can considerably lessen the effect of short-term declines.
You can further manage your investing risk through diversification. And today, more than ever, geographic diversification should be taken into account. Studies indicate that asset allocation is the single most important determinant of a portfolio's long-term success. The right mix of stocks, bonds and cash - aligned to your particular risk tolerance and investment objective - is very important. Age-appropriate rebalancing is also an essential aspect of asset allocation. For younger investors, an emphasis on equities - which historically have been the best-performing asset class over time - is encouraged. As investors near their specific goal, such as retirement or sending a child to college, consideration may be given to replacing volatile assets (e.g. common stocks) with more-stable fixed investments (bonds or savings plans).
A third principle - investing regularly - can help lower the average cost of your purchases. Investing a certain amount of money each month or quarter helps ensure you won't pay for all your shares at market highs. This strategy - known as dollar cost averaging - also reduces "emotion" from investing, helping shareholders avoid selling weak performers just prior to an upswing, or chasing a hot performer just before a correction.
We invite you to contact us via the Internet, through our Investor Centers or by phone. It is our privilege to provide you the information you need to make the investments that are right for you.
Sincerely,
(The acting chairman's signature appears here.)
James C. Curvey
Acting Chairman
Semiannual Report
Shareholder Expense Example
As a shareholder of the Fund, you incur two types of costs: (1) transaction costs, and (2) ongoing costs, including management fees and other Fund expenses. This Example is intended to help you understand your ongoing costs (in dollars) of investing in the Fund and to compare these costs with the ongoing costs of investing in other mutual funds.
The Example is based on an investment of $1,000 invested at the beginning of the period and held for the entire period (April 1, 2011 to September 30, 2011).
Actual Expenses
The first line of the accompanying table for each class of the Fund provides information about actual account values and actual expenses. You may use the information in this line, together with the amount you invested, to estimate the expenses that you paid over the period. Simply divide your account value by $1,000.00 (for example, an $8,600 account value divided by $1,000.00 = 8.6), then multiply the result by the number in the first line for a class of the Fund under the heading entitled "Expenses Paid During Period" to estimate the expenses you paid on your account during this period. A small balance maintenance fee of $12.00 that is charged once a year may apply for certain accounts with a value of less than $2,000. This fee is not included in the table below. If it was, the estimate of expenses you paid during the period would be higher, and your ending account value lower, by this amount. In addition, the Fund, as a shareholder in the underlying Fidelity Central Funds, will indirectly bear its pro-rata share of the fees and expenses incurred by the underlying Fidelity Central Funds. These fees and expenses are not included in the Fund's annualized expense ratio used to calculate the expense estimate in the table below.
Hypothetical Example for Comparison Purposes
The second line of the accompanying table for each class of the Fund provides information about hypothetical account values and hypothetical expenses based on a Class' actual expense ratio and an assumed rate of return of 5% per year before expenses, which is not the Class' actual return. The hypothetical account values and expenses may not be used to estimate the actual ending account balance or expenses you paid for the period. You may use this information to compare the ongoing costs of investing in the Fund and other funds. To do so, compare this 5% hypothetical example with the 5% hypothetical examples that appear in the shareholder reports of the other funds. A small balance maintenance fee of $12.00 that is charged once a year may apply for certain accounts with a value of less than $2,000. This fee is not included in the table below. If it was, the estimate of expenses you paid during the period would be higher, and your ending account value lower, by this amount. In addition, the Fund, as a shareholder in the underlying Fidelity Central Funds, will indirectly bear its pro-rata share of the fees and expenses incurred by the underlying Fidelity Central Funds. These fees and expenses are not included in the Fund's annualized expense ratio used to calculate the expense estimate in the table below.
Please note that the expenses shown in the table are meant to highlight your ongoing costs only and do not reflect any transaction costs. Therefore, the second line of the table is useful in comparing ongoing costs only, and will not help you determine the relative total costs of owning different funds.
Semiannual Report
| Annualized
Expense Ratio | Beginning
Account Value
April 1, 2011 | Ending
Account Value
September 30, 2011 | Expenses Paid
During Period*
April 1, 2011 to September 30, 2011 |
Magellan | .53% | | | |
Actual | | $ 1,000.00 | $ 776.40 | $ 2.35 |
Hypothetical A | | $ 1,000.00 | $ 1,022.35 | $ 2.68 |
Class K | .40% | | | |
Actual | | $ 1,000.00 | $ 776.90 | $ 1.78 |
Hypothetical A | | $ 1,000.00 | $ 1,023.00 | $ 2.02 |
A 5% return per year before expenses
* Expenses are equal to each Class' annualized expense ratio, multiplied by the average account value over the period, multiplied by 183/366 (to reflect the one-half year period).
Semiannual Report
Investment Changes (Unaudited)
Top Ten Stocks as of September 30, 2011 |
| % of fund's
net assets | % of fund's net assets
6 months ago |
Apple, Inc. | 6.6 | 3.3 |
Google, Inc. Class A | 2.9 | 1.8 |
Amazon.com, Inc. | 2.8 | 0.2 |
Wells Fargo & Co. | 2.3 | 0.6 |
Cognizant Technology Solutions Corp. Class A | 2.1 | 1.2 |
Chevron Corp. | 1.8 | 0.8 |
Exxon Mobil Corp. | 1.6 | 0.0 |
Procter & Gamble Co. | 1.5 | 0.0 |
Green Mountain Coffee Roasters, Inc. | 1.4 | 0.0 |
Citigroup, Inc. | 1.4 | 0.0 |
| 24.4 | |
Top Five Market Sectors as of September 30, 2011 |
| % of fund's
net assets | % of fund's net assets
6 months ago |
Information Technology | 22.9 | 27.5 |
Financials | 12.5 | 10.6 |
Consumer Discretionary | 12.4 | 12.1 |
Energy | 11.3 | 13.4 |
Industrials | 10.8 | 9.6 |
Asset Allocation (% of fund's net assets) |
As of September 30, 2011* | As of March 31, 2011** |
 | Stocks 96.3% | | | Stocks 98.9% | |
 | Convertible
Securities 0.1% | | | Convertible
Securities 0.1% | |
 | Short-Term
Investments and
Net Other Assets 3.6% | | | Short-Term
Investments and
Net Other Assets 1.0% | |
* Foreign investments | 16.2% | | ** Foreign investments | 23.4% | |

Semiannual Report
Investments September 30, 2011
Showing Percentage of Net Assets
Common Stocks - 96.1% |
| Shares | | Value (000s) |
CONSUMER DISCRETIONARY - 12.2% |
Auto Components - 0.0% |
BorgWarner, Inc. (a) | 26,389 | | $ 1,597 |
Diversified Consumer Services - 0.1% |
Ascent Capital Group, Inc. (a) | 119,604 | | 4,703 |
New Oriental Education & Technology Group, Inc. sponsored ADR (a) | 503,200 | | 11,559 |
| | 16,262 |
Hotels, Restaurants & Leisure - 1.4% |
Arcos Dorados Holdings, Inc. | 1,000,000 | | 23,190 |
China Lodging Group Ltd. ADR (a)(d) | 441,278 | | 6,041 |
Ctrip.com International Ltd. sponsored ADR (a) | 500,000 | | 16,080 |
Las Vegas Sands Corp. (a) | 1,000,000 | | 38,340 |
Starbucks Corp. | 3,297,712 | | 122,972 |
Yum! Brands, Inc. | 44,827 | | 2,214 |
| | 208,837 |
Household Durables - 3.2% |
D.R. Horton, Inc. | 12,066,177 | | 109,078 |
Lennar Corp. Class A (d) | 7,892,985 | | 106,871 |
M.D.C. Holdings, Inc. (d) | 318,825 | | 5,401 |
PulteGroup, Inc. (a) | 160,056 | | 632 |
Ryland Group, Inc. | 1,896,860 | | 20,202 |
Tempur-Pedic International, Inc. (a) | 2,008,776 | | 105,682 |
Toll Brothers, Inc. (a) | 6,966,454 | | 100,526 |
Tupperware Brands Corp. | 844,848 | | 45,402 |
| | 493,794 |
Internet & Catalog Retail - 3.4% |
Amazon.com, Inc. (a) | 1,953,704 | | 422,449 |
Priceline.com, Inc. (a) | 192,986 | | 86,739 |
| | 509,188 |
Leisure Equipment & Products - 0.1% |
Brunswick Corp. | 835,447 | | 11,730 |
Media - 0.1% |
Comcast Corp. Class A (special) (non-vtg.) | 382,262 | | 7,909 |
Informa PLC | 2,200,000 | | 11,241 |
Sun TV Ltd. | 45,174 | | 214 |
| | 19,364 |
Multiline Retail - 0.6% |
Dollar General Corp. (a) | 1,215,800 | | 45,909 |
Common Stocks - continued |
| Shares | | Value (000s) |
CONSUMER DISCRETIONARY - continued |
Multiline Retail - continued |
Dollar Tree, Inc. (a) | 547,044 | | $ 41,088 |
Pantaloon Retail India Ltd. Class B | 17,200 | | 58 |
| | 87,055 |
Specialty Retail - 1.8% |
Best Buy Co., Inc. | 500,000 | | 11,650 |
Limited Brands, Inc. | 1,268,348 | | 48,844 |
TJX Companies, Inc. | 3,735,400 | | 207,203 |
| | 267,697 |
Textiles, Apparel & Luxury Goods - 1.5% |
Arezzo Industria e Comercio SA | 289,800 | | 2,927 |
lululemon athletica, Inc. (a) | 1,321,100 | | 64,272 |
Peak Sport Products Co. Ltd. (e) | 117,218,000 | | 32,077 |
PVH Corp. | 588,384 | | 34,267 |
Ralph Lauren Corp. | 762,087 | | 98,843 |
| | 232,386 |
TOTAL CONSUMER DISCRETIONARY | | 1,847,910 |
CONSUMER STAPLES - 8.7% |
Beverages - 0.8% |
Anheuser-Busch InBev SA NV | 770,260 | | 40,886 |
Pernod-Ricard SA | 496,500 | | 39,134 |
SABMiller PLC | 1,240,200 | | 40,768 |
| | 120,788 |
Food & Staples Retailing - 2.2% |
CVS Caremark Corp. | 2,462,472 | | 82,690 |
Drogasil SA | 1,500,000 | | 8,971 |
United Natural Foods, Inc. (a)(e) | 3,513,951 | | 130,157 |
Wal-Mart de Mexico SA de CV Series V | 11,656,500 | | 26,861 |
Whole Foods Market, Inc. | 1,110,213 | | 72,508 |
Wumart Stores, Inc. (H Shares) | 7,077,000 | | 13,986 |
| | 335,173 |
Food Products - 1.9% |
Darling International, Inc. (a) | 561,503 | | 7,069 |
Green Mountain Coffee Roasters, Inc. (a) | 2,237,200 | | 207,925 |
Nestle SA | 816,600 | | 45,136 |
Shenguan Holdings Group Ltd. | 8,032,000 | | 4,078 |
The J.M. Smucker Co. | 211,525 | | 15,418 |
| | 279,626 |
Common Stocks - continued |
| Shares | | Value (000s) |
CONSUMER STAPLES - continued |
Household Products - 3.1% |
Colgate-Palmolive Co. | 1,654,848 | | $ 146,752 |
Kimberly-Clark Corp. | 1,397,644 | | 99,247 |
Procter & Gamble Co. | 3,652,021 | | 230,735 |
| | 476,734 |
Personal Products - 0.7% |
Herbalife Ltd. | 1,335,300 | | 71,572 |
Nu Skin Enterprises, Inc. Class A | 790,981 | | 32,051 |
| | 103,623 |
TOTAL CONSUMER STAPLES | | 1,315,944 |
ENERGY - 11.3% |
Energy Equipment & Services - 3.2% |
Baker Hughes, Inc. | 1,415,000 | | 65,316 |
Dresser-Rand Group, Inc. (a) | 285,136 | | 11,557 |
Ensco International Ltd. ADR | 2,965,912 | | 119,912 |
Halliburton Co. | 2,020,866 | | 61,677 |
Noble Corp. | 600,521 | | 17,625 |
Schlumberger Ltd. | 1,259,796 | | 75,248 |
Transocean Ltd. (United States) | 2,987,902 | | 142,642 |
| | 493,977 |
Oil, Gas & Consumable Fuels - 8.1% |
Alpha Natural Resources, Inc. (a) | 4,765,570 | | 84,303 |
Amyris, Inc. | 193,938 | | 3,925 |
Anadarko Petroleum Corp. | 1,293,000 | | 81,524 |
Cabot Oil & Gas Corp. | 741,576 | | 45,911 |
Chesapeake Energy Corp. | 682,383 | | 17,435 |
Chevron Corp. | 3,032,277 | | 280,546 |
Denbury Resources, Inc. (a) | 3,415,737 | | 39,281 |
Enterprise Products Partners LP | 307,994 | | 12,366 |
Exxon Mobil Corp. | 3,310,552 | | 240,445 |
Hess Corp. | 1,135,800 | | 59,584 |
HollyFrontier Corp. | 1,576,373 | | 41,333 |
Marathon Oil Corp. | 1,328,467 | | 28,668 |
Occidental Petroleum Corp. | 2,826,548 | | 202,098 |
Royal Dutch Shell PLC Class A sponsored ADR | 1,186,211 | | 72,976 |
Common Stocks - continued |
| Shares | | Value (000s) |
ENERGY - continued |
Oil, Gas & Consumable Fuels - continued |
Westernzagros Resources Ltd. (a) | 527,616 | | $ 229 |
Williams Companies, Inc. | 736,676 | | 17,931 |
| | 1,228,555 |
TOTAL ENERGY | | 1,722,532 |
FINANCIALS - 12.5% |
Capital Markets - 1.5% |
Charles Schwab Corp. | 3,843,476 | | 43,316 |
Franklin Resources, Inc. | 51,985 | | 4,972 |
Morgan Stanley | 9,582,966 | | 129,370 |
TD Ameritrade Holding Corp. | 3,654,476 | | 53,739 |
| | 231,397 |
Commercial Banks - 4.3% |
Aozora Bank Ltd. | 14,603,000 | | 33,624 |
Barclays PLC | 3,122,579 | | 7,659 |
BNP Paribas SA | 202,600 | | 8,157 |
CIT Group, Inc. (a) | 1,231,400 | | 37,398 |
Mitsubishi UFJ Financial Group, Inc. sponsored ADR | 184,086 | | 819 |
SVB Financial Group (a) | 1,142,548 | | 42,274 |
U.S. Bancorp | 7,166,703 | | 168,704 |
Wells Fargo & Co. | 14,459,515 | | 348,764 |
| | 647,399 |
Consumer Finance - 0.2% |
SLM Corp. | 2,202,353 | | 27,419 |
Diversified Financial Services - 2.1% |
Citigroup, Inc. | 8,109,323 | | 207,761 |
CME Group, Inc. | 261,500 | | 64,434 |
ORIX Corp. | 507,600 | | 39,843 |
| | 312,038 |
Insurance - 1.6% |
Berkshire Hathaway, Inc. Class B (a) | 2,798,003 | | 198,770 |
Endurance Specialty Holdings Ltd. | 310,432 | | 10,601 |
MetLife, Inc. | 1,436,307 | | 40,231 |
| | 249,602 |
Real Estate Investment Trusts - 1.0% |
Boston Properties, Inc. | 350,720 | | 31,249 |
CBL & Associates Properties, Inc. | 5,513,363 | | 62,632 |
Common Stocks - continued |
| Shares | | Value (000s) |
FINANCIALS - continued |
Real Estate Investment Trusts - continued |
Simon Property Group, Inc. | 428,353 | | $ 47,110 |
Terreno Realty Corp. (e) | 839,001 | | 10,764 |
| | 151,755 |
Real Estate Management & Development - 1.7% |
Agre Developers Ltd. | 5,564 | | 5 |
Iguatemi Empresa de Shopping Centers SA | 1,010,000 | | 16,914 |
PT Lippo Karawaci Tbk (e) | 1,328,501,625 | | 101,817 |
Rialto Real Estate Fund LP (e)(g)(h) | 500,000 | | 41,465 |
The St. Joe Co. (a)(d)(e) | 6,858,391 | | 102,807 |
| | 263,008 |
Thrifts & Mortgage Finance - 0.1% |
BankUnited, Inc. | 590,083 | | 12,250 |
TOTAL FINANCIALS | | 1,894,868 |
HEALTH CARE - 10.5% |
Biotechnology - 2.5% |
Acorda Therapeutics, Inc. (a) | 750,000 | | 14,970 |
Alexion Pharmaceuticals, Inc. (a) | 1,051,760 | | 67,376 |
Amarin Corp. PLC ADR (a) | 90,590 | | 833 |
Amgen, Inc. | 1,536,493 | | 84,430 |
ARIAD Pharmaceuticals, Inc. (a) | 215,000 | | 1,890 |
ArQule, Inc. (a) | 1,404,466 | | 7,093 |
Biogen Idec, Inc. (a) | 443,204 | | 41,284 |
BioMarin Pharmaceutical, Inc. (a) | 2,851,839 | | 90,888 |
Clinical Data, Inc. rights 4/4/18 (a) | 988,714 | | 0 |
Incyte Corp. (a)(d) | 650,829 | | 9,092 |
Protalix BioTherapeutics, Inc. (a)(d) | 618,863 | | 2,847 |
Theravance, Inc. (a) | 813,900 | | 16,392 |
United Therapeutics Corp. (a) | 849,183 | | 31,836 |
Vertex Pharmaceuticals, Inc. (a) | 319,100 | | 14,213 |
| | 383,144 |
Health Care Equipment & Supplies - 3.6% |
Baxter International, Inc. | 2,112,837 | | 118,615 |
C. R. Bard, Inc. | 836,639 | | 73,239 |
Covidien PLC | 3,377,490 | | 148,947 |
Edwards Lifesciences Corp. (a) | 667,100 | | 47,551 |
Greatbatch, Inc. (a) | 843,669 | | 16,882 |
HeartWare International, Inc. (a) | 307,700 | | 19,819 |
Common Stocks - continued |
| Shares | | Value (000s) |
HEALTH CARE - continued |
Health Care Equipment & Supplies - continued |
Integra LifeSciences Holdings Corp. (a)(e) | 1,408,807 | | $ 50,393 |
Sirona Dental Systems, Inc. (a) | 1,262,812 | | 53,556 |
Volcano Corp. (a) | 469,520 | | 13,912 |
| | 542,914 |
Health Care Providers & Services - 2.2% |
Aetna, Inc. | 59,000 | | 2,145 |
Brookdale Senior Living, Inc. (a) | 2,707,644 | | 33,954 |
Express Scripts, Inc. (a) | 1,860,861 | | 68,982 |
HealthSouth Corp. (a) | 141,777 | | 2,117 |
Henry Schein, Inc. (a) | 1,402,253 | | 86,954 |
McKesson Corp. | 1,071,412 | | 77,892 |
Medco Health Solutions, Inc. (a) | 418,405 | | 19,619 |
Universal Health Services, Inc. Class B | 49,500 | | 1,683 |
WellPoint, Inc. | 551,237 | | 35,985 |
| | 329,331 |
Health Care Technology - 0.2% |
Cerner Corp. (a) | 384,583 | | 26,352 |
Life Sciences Tools & Services - 0.3% |
Thermo Fisher Scientific, Inc. (a) | 1,000,000 | | 50,640 |
Pharmaceuticals - 1.7% |
Auxilium Pharmaceuticals, Inc. (a) | 400,000 | | 5,996 |
Cardiome Pharma Corp. (a)(d) | 2,500,000 | | 8,538 |
Elan Corp. PLC sponsored ADR (a) | 5,000,000 | | 52,650 |
Eli Lilly & Co. | 1,313,576 | | 48,563 |
GlaxoSmithKline PLC sponsored ADR | 487,852 | | 20,143 |
Perrigo Co. | 13,500 | | 1,311 |
Sanofi-aventis sponsored ADR | 2,389,016 | | 78,360 |
Shire PLC sponsored ADR | 447,200 | | 42,005 |
XenoPort, Inc. (a) | 254,100 | | 1,499 |
| | 259,065 |
TOTAL HEALTH CARE | | 1,591,446 |
INDUSTRIALS - 10.8% |
Aerospace & Defense - 2.2% |
BE Aerospace, Inc. (a) | 976,800 | | 32,342 |
DigitalGlobe, Inc. (a) | 405,178 | | 7,873 |
Precision Castparts Corp. | 314,327 | | 48,865 |
Rockwell Collins, Inc. | 477,688 | | 25,203 |
Textron, Inc. | 3,096,446 | | 54,621 |
Common Stocks - continued |
| Shares | | Value (000s) |
INDUSTRIALS - continued |
Aerospace & Defense - continued |
TransDigm Group, Inc. (a) | 82,686 | | $ 6,753 |
United Technologies Corp. | 2,240,300 | | 157,628 |
| | 333,285 |
Airlines - 0.3% |
Copa Holdings SA Class A | 247,700 | | 15,177 |
JetBlue Airways Corp. (a)(d) | 6,235,355 | | 25,565 |
| | 40,742 |
Building Products - 0.5% |
Masco Corp. | 4,409,140 | | 31,393 |
Owens Corning (a) | 2,463,952 | | 53,418 |
| | 84,811 |
Commercial Services & Supplies - 0.4% |
Republic Services, Inc. | 2,009,701 | | 56,392 |
Construction & Engineering - 0.7% |
Fluor Corp. | 1,134,883 | | 52,829 |
KBR, Inc. | 636,981 | | 15,052 |
MYR Group, Inc. (a)(e) | 1,037,100 | | 18,294 |
Shaw Group, Inc. (a) | 1,063,090 | | 23,112 |
SNC-Lavalin Group, Inc. | 83,515 | | 3,508 |
| | 112,795 |
Electrical Equipment - 1.5% |
Alstom SA | 1,255,809 | | 41,853 |
AMETEK, Inc. | 1,063,683 | | 35,070 |
Emerson Electric Co. | 2,168,077 | | 89,563 |
EnerSys (a) | 2,152,807 | | 43,099 |
Regal-Beloit Corp. | 451,522 | | 20,490 |
| | 230,075 |
Industrial Conglomerates - 2.0% |
Danaher Corp. | 3,381,669 | | 141,827 |
General Electric Co. | 11,120,966 | | 169,484 |
| | 311,311 |
Machinery - 2.3% |
Cummins, Inc. | 2,191,771 | | 178,980 |
Ingersoll-Rand Co. Ltd. | 5,388,111 | | 151,352 |
NACCO Industries, Inc. Class A | 232,430 | | 14,736 |
| | 345,068 |
Professional Services - 0.7% |
Manpower, Inc. | 895,842 | | 30,118 |
Common Stocks - continued |
| Shares | | Value (000s) |
INDUSTRIALS - continued |
Professional Services - continued |
Qualicorp SA | 1,025,400 | | $ 7,632 |
Robert Half International, Inc. | 1,713,751 | | 36,366 |
Towers Watson & Co. | 480,052 | | 28,698 |
| | 102,814 |
Road & Rail - 0.2% |
Localiza Rent A Car SA | 1,935,128 | | 25,617 |
Trading Companies & Distributors - 0.0% |
Essex Rental Corp. (a)(d) | 262,602 | | 646 |
Transportation Infrastructure - 0.0% |
The Sumitomo Warehouse Co. Ltd. | 202,000 | | 932 |
TOTAL INDUSTRIALS | | 1,644,488 |
INFORMATION TECHNOLOGY - 22.9% |
Communications Equipment - 1.7% |
Cisco Systems, Inc. | 9,673,061 | | 149,836 |
Juniper Networks, Inc. (a) | 1,515,482 | | 26,157 |
Motorola Solutions, Inc. | 1,580,241 | | 66,212 |
Polycom, Inc. (a) | 1,147,469 | | 21,079 |
| | 263,284 |
Computers & Peripherals - 7.9% |
Apple, Inc. (a) | 2,611,059 | | 995,280 |
EMC Corp. (a) | 3,782,134 | | 79,387 |
SanDisk Corp. (a) | 2,266,400 | | 91,449 |
Seagate Technology | 3,233,082 | | 33,236 |
| | 1,199,352 |
Electronic Equipment & Components - 1.0% |
Amphenol Corp. Class A | 2,607,618 | | 106,313 |
Corning, Inc. | 2,456,214 | | 30,359 |
Ingram Micro, Inc. Class A (a) | 1,041,370 | | 16,797 |
| | 153,469 |
Internet Software & Services - 4.5% |
Active Network, Inc. (d) | 554,141 | | 8,174 |
AOL, Inc. (a)(d) | 1,032,274 | | 12,387 |
Baidu.com, Inc. sponsored ADR (a) | 568,700 | | 60,800 |
eBay, Inc. (a) | 4,102,300 | | 120,977 |
Google, Inc. Class A (a) | 853,500 | | 439,023 |
GREE, Inc. (d) | 522,500 | | 15,936 |
Common Stocks - continued |
| Shares | | Value (000s) |
INFORMATION TECHNOLOGY - continued |
Internet Software & Services - continued |
Mail.ru Group Ltd.: | | | |
GDR (a)(f) | 40,300 | | $ 1,179 |
GDR (Reg. S) | 473,600 | | 13,853 |
Rackspace Hosting, Inc. (a) | 800 | | 27 |
Yandex NV | 542,606 | | 11,075 |
| | 683,431 |
IT Services - 2.9% |
Cognizant Technology Solutions Corp. Class A (a) | 5,094,275 | | 319,411 |
Fidelity National Information Services, Inc. | 1,577,578 | | 38,367 |
Fiserv, Inc. (a) | 589,557 | | 29,932 |
MasterCard, Inc. Class A | 130,200 | | 41,294 |
ServiceSource International, Inc. | 259,106 | | 3,423 |
| | 432,427 |
Semiconductors & Semiconductor Equipment - 2.7% |
Applied Materials, Inc. | 6,349,294 | | 65,715 |
ASML Holding NV | 1,658,701 | | 57,292 |
Avago Technologies Ltd. | 1,132,788 | | 37,121 |
Broadcom Corp. Class A | 713,970 | | 23,768 |
First Solar, Inc. (a)(d) | 251,749 | | 15,913 |
GT Advanced Technologies, Inc. (a) | 2,148,999 | | 15,086 |
Himax Technologies, Inc. sponsored ADR | 3,463,203 | | 3,844 |
JA Solar Holdings Co. Ltd. ADR (a)(d) | 972,024 | | 1,730 |
KLA-Tencor Corp. | 466,741 | | 17,867 |
Marvell Technology Group Ltd. (a) | 6,200,000 | | 90,086 |
NVIDIA Corp. (a) | 4,534,918 | | 56,686 |
Taiwan Semiconductor Manufacturing Co. Ltd. sponsored ADR | 1,801,643 | | 20,593 |
Trina Solar Ltd. (a)(d) | 1,644,635 | | 9,999 |
| | 415,700 |
Software - 2.2% |
Autodesk, Inc. (a) | 1,893,900 | | 52,613 |
Changyou.com Ltd. (A Shares) ADR (a)(d) | 207,724 | | 5,255 |
Citrix Systems, Inc. (a) | 1,035,100 | | 56,444 |
Red Hat, Inc. (a) | 819,881 | | 34,648 |
Rovi Corp. (a) | 654,330 | | 28,123 |
salesforce.com, Inc. (a) | 1,264,679 | | 144,528 |
VMware, Inc. Class A (a) | 211,655 | | 17,013 |
| | 338,624 |
TOTAL INFORMATION TECHNOLOGY | | 3,486,287 |
Common Stocks - continued |
| Shares | | Value (000s) |
MATERIALS - 5.1% |
Chemicals - 1.8% |
Albemarle Corp. | 797,607 | | $ 32,223 |
Celanese Corp. Class A | 960,900 | | 31,258 |
CF Industries Holdings, Inc. | 353,200 | | 43,581 |
LyondellBasell Industries NV Class A | 2,043,400 | | 49,920 |
Minerals Technologies, Inc. | 409,006 | | 20,152 |
Praxair, Inc. | 347,532 | | 32,487 |
Symrise AG | 1,299,359 | | 30,378 |
Valspar Corp. | 359,246 | | 11,212 |
W.R. Grace & Co. (a) | 835,605 | | 27,826 |
| | 279,037 |
Construction Materials - 0.2% |
Eagle Materials, Inc. | 1,589,360 | | 26,463 |
Metals & Mining - 3.1% |
AngloGold Ashanti Ltd. sponsored ADR | 547,779 | | 22,656 |
Barrick Gold Corp. | 831,300 | | 38,944 |
Centamin Egypt Ltd. (United Kingdom) (a) | 6,218,475 | | 9,137 |
Goldcorp, Inc. | 1,657,101 | | 75,987 |
Harry Winston Diamond Corp. (a) | 1,000,000 | | 10,169 |
Ivanhoe Mines Ltd. (a) | 4,034,780 | | 55,616 |
Kinross Gold Corp. | 2,783,875 | | 41,348 |
Newcrest Mining Ltd. | 1,038,953 | | 34,261 |
Newmont Mining Corp. | 2,045,200 | | 128,643 |
Reliance Steel & Aluminum Co. | 549,300 | | 18,682 |
Royal Gold, Inc. | 500,000 | | 32,030 |
| | 467,473 |
TOTAL MATERIALS | | 772,973 |
TELECOMMUNICATION SERVICES - 1.4% |
Diversified Telecommunication Services - 0.1% |
Iliad SA | 15,693 | | 1,766 |
Telenor ASA | 1,036,200 | | 16,117 |
| | 17,883 |
Wireless Telecommunication Services - 1.3% |
American Tower Corp. Class A (a) | 3,376,561 | | 181,659 |
NII Holdings, Inc. (a) | 467,600 | | 12,602 |
| | 194,261 |
TOTAL TELECOMMUNICATION SERVICES | | 212,144 |
Common Stocks - continued |
| Shares | | Value (000s) |
UTILITIES - 0.7% |
Electric Utilities - 0.7% |
Edison International | 933,147 | | $ 35,693 |
NextEra Energy, Inc. | 1,435,400 | | 77,540 |
| | 113,233 |
Independent Power Producers & Energy Traders - 0.0% |
Indiabulls Power Ltd. (a) | 1,513,614 | | 389 |
TOTAL UTILITIES | | 113,622 |
TOTAL COMMON STOCKS (Cost $15,290,368) |
14,602,214
|
Nonconvertible Preferred Stocks - 0.2% |
| | | |
CONSUMER DISCRETIONARY - 0.2% |
Automobiles - 0.2% |
Volkswagen AG (Cost $51,934) | 278,400 | |
37,319
|
Convertible Bonds - 0.1% |
| Principal Amount (000s) | | |
TELECOMMUNICATION SERVICES - 0.1% |
Diversified Telecommunication Services - 0.1% |
Level 3 Communications, Inc. 7% 3/15/15 (Cost $17,000) | | $ 17,000 | |
20,145
|
Money Market Funds - 5.0% |
| Shares | | Value (000s) |
Fidelity Cash Central Fund, 0.12% (b) | 568,837,112 | | $ 568,837 |
Fidelity Securities Lending Cash Central Fund, 0.12% (b)(c) | 190,470,963 | | 190,471 |
TOTAL MONEY MARKET FUNDS (Cost $759,308) |
759,308
|
TOTAL INVESTMENT PORTFOLIO - 101.4% (Cost $16,118,610) | | 15,418,986 |
NET OTHER ASSETS (LIABILITIES) - (1.4)% | | (220,149) |
NET ASSETS - 100% | $ 15,198,837 |
Legend |
(a) Non-income producing |
(b) Affiliated fund that is available only to investment companies and other accounts managed by Fidelity Investments. The rate quoted is the annualized seven-day yield of the fund at period end. A complete unaudited listing of the fund's holdings as of its most recent quarter end is available upon request. In addition, each Fidelity Central Fund's financial statements, which are not covered by the Fund's Report of Independent Registered Public Accounting Firm, are available on the SEC's website or upon request. |
(c) Investment made with cash collateral received from securities on loan. |
(d) Security or a portion of the security is on loan at period end. |
(e) Affiliated company |
(f) Security exempt from registration under Rule 144A of the Securities Act of 1933. These securities may be resold in transactions exempt from registration, normally to qualified institutional buyers. At the end of the period, the value of these securities amounted to $1,179,000 or 0.0% of net assets. |
(g) Investment is owned by an entity that is treated as a corporation for U.S. tax purposes which is owned by the Fund. |
(h) Restricted securities - Investment in securities not registered under the Securities Act of 1933 (excluding 144A issues). At the end of the period, the value of restricted securities (excluding 144A issues) amounted to $41,465,000 or 0.3% of net assets. |
Additional information on each restricted holding is as follows: |
Security | Acquisition Date | Acquisition Cost (000s) |
Rialto Real Estate Fund LP | 2/24/11 - 6/22/11 | $ 41,200 |
Affiliated Central Funds |
Information regarding fiscal year to date income earned by the Fund from investments in Fidelity Central Funds is as follows: |
Fund | Income earned
(Amount in thousands) |
Fidelity Cash Central Fund | $ 136 |
Fidelity Securities Lending Cash Central Fund | 8,781 |
Total | $ 8,917 |
Other Affiliated Issuers |
An affiliated company is a company in which the Fund has ownership of at least 5% of the voting securities. Fiscal year to date transactions with companies which are or were affiliates are as follows: |
Affiliate
(Amount in thousands) | Value, beginning of period | Purchases | Sales Proceeds | Dividend Income | Value,
end of
period |
Applied Materials, Inc. | $ 1,033,881 | $ - | $ 743,268 | $ 6,755 | $ - |
Brookdale Senior Living, Inc. | 301,255 | - | 135,567 | - | - |
D.R. Horton, Inc. | 186,271 | - | 36,880 | 1,199 | - |
eAccess Ltd. | 87,922 | 37,724 | 63,273 | 552 | - |
Eagle Materials, Inc. | 81,820 | - | 19,401 | 457 | - |
EnerSys | 107,178 | - | 11,425 | - | - |
Equifax, Inc. | 290,802 | - | 262,158 | 1,038 | - |
Greatbatch, Inc. | 61,342 | - | 29,936 | - | - |
Integra LifeSciences Holdings Corp. | 71,130 | - | 3,339 | - | 50,393 |
KB Home | 50,855 | - | 25,102 | 511 | - |
MYR Group, Inc. | 24,807 | - | - | - | 18,294 |
Peak Sport Products Co. Ltd. | 40,201 | 52,998 | 2,976 | 2,127 | 32,077 |
PT Lippo Karawaci Tbk | 86,026 | 10,081 | 2,256 | - | 101,817 |
Rialto Real Estate Fund LP | 19,805 | 20,672 | - | 297 | 41,465 |
Terreno Realty Corp. | 17,230 | - | 2,496 | 190 | 10,764 |
The St. Joe Co. | 171,830 | 37,508 | 24,885 | - | 102,807 |
Toll Brothers, Inc. | 254,105 | - | 91,716 | - | - |
United Natural Foods, Inc. | 200,226 | - | 36,847 | - | 130,157 |
Total | $ 3,086,686 | $ 158,983 | $ 1,491,525 | $ 13,126 | $ 487,774 |
Other Information |
The following is a summary of the inputs used, as of September 30, 2011, involving the Fund's assets and liabilities carried at fair value. The inputs or methodology used for valuing securities may not be an indication of the risk associated with investing in those securities. For more information on valuation inputs, and their aggregation into the levels used in the tables below, please refer to the Security Valuation section in the accompanying Notes to Financial Statements. |
Valuation Inputs at Reporting Date: |
Description
(Amounts in thousands) | Total | Level 1 | Level 2 | Level 3 |
Investments in Securities: | | | | |
Equities: | | | | |
Consumer Discretionary | $ 1,885,229 | $ 1,852,880 | $ 32,349 | $ - |
Consumer Staples | 1,315,944 | 1,256,994 | 58,950 | - |
Energy | 1,722,532 | 1,722,532 | - | - |
Financials* | 1,894,868 | 1,670,455 | 182,948 | 41,465 |
Health Care | 1,591,446 | 1,591,446 | - | - |
Industrials | 1,644,488 | 1,643,556 | 932 | - |
Information Technology | 3,486,287 | 3,470,351 | 15,936 | - |
Materials | 772,973 | 738,712 | 34,261 | - |
Telecommunication Services | 212,144 | 212,144 | - | - |
Utilities | 113,622 | 113,233 | 389 | - |
Corporate Bonds | 20,145 | - | 20,145 | - |
Money Market Funds | 759,308 | 759,308 | - | - |
Total Investments in Securities: | $ 15,418,986 | $ 15,031,611 | $ 345,910 | $ 41,465 |
* The fund has an unfunded commitment of $8,799 outstanding as of period end. |
The following is a reconciliation of Investments in Securities for which Level 3 inputs were used in determining value: |
(Amounts in thousands) | |
Investments in Securities: | |
Beginning Balance | $ 19,805 |
Total Realized Gain (Loss) | - |
Total Unrealized Gain (Loss) | 988 |
Cost of Purchases | 20,672 |
Proceeds of Sales | - |
Amortization/Accretion | - |
Transfers in to Level 3 | - |
Transfers out of Level 3 | - |
Ending Balance | $ 41,465 |
The change in unrealized gain (loss) for the period attributable to Level 3 securities held at September 30, 2011 | $ 988 |
The information used in the above reconciliation represents fiscal year to date activity for any Investments in Securities identified as using Level 3 inputs at either the beginning or the end of the current fiscal period. Transfers in or out of Level 3 represent the beginning value of any Security or Instrument where a change in the pricing level occurred from the beginning to the end of the period. The cost of purchases and the proceeds of sales may include securities received or delivered through corporate actions or exchanges. Realized and unrealized gains (losses) disclosed in the reconciliation are included in Net Gain (Loss) on the Fund's Statement of Operations. |
Distribution of investments by country of issue, as a percentage of total net assets, is as follows: (Unaudited) |
United States of America | 83.8% |
Ireland | 2.6% |
United Kingdom | 1.8% |
Canada | 1.7% |
Switzerland | 1.3% |
France | 1.1% |
Cayman Islands | 1.0% |
Others (Individually Less Than 1%) | 6.7% |
| 100.0% |
Income Tax Information |
At March 31, 2011, the Fund had a capital loss carryforward of approximately $2,608,735,000 of which $1,147,795,000 and $1,460,940,000 will expire in fiscal 2017 and 2018, respectively. Capital loss carryforwards are only available to offset future capital gains of the Fund to the extent provided by regulations and may be limited. |
See accompanying notes which are an integral part of the financial statements.
Semiannual Report
Statement of Assets and Liabilities
Amounts in thousands (except per-share amounts) | September 30, 2011 |
| | |
Assets | | |
Investment in securities, at value (including securities loaned of $178,381) - See accompanying schedule: Unaffiliated issuers (cost $14,770,399) | $ 14,171,904 | |
Fidelity Central Funds (cost $759,308) | 759,308 | |
Other affiliated issuers (cost $588,903) | 487,774 | |
Total Investments (cost $16,118,610) | | $ 15,418,986 |
Cash | | 1,717 |
Foreign currency held at value (cost $2,401) | | 2,403 |
Receivable for investments sold | | 1,059,267 |
Receivable for fund shares sold | | 5,751 |
Dividends receivable | | 11,223 |
Interest receivable | | 49 |
Distributions receivable from Fidelity Central Funds | | 1,325 |
Other receivables | | 1,946 |
Total assets | | 16,502,667 |
| | |
Liabilities | | |
Payable for investments purchased | $ 1,083,669 | |
Payable for fund shares redeemed | 21,207 | |
Accrued management fee | 4,425 | |
Other affiliated payables | 2,509 | |
Other payables and accrued expenses | 1,549 | |
Collateral on securities loaned, at value | 190,471 | |
Total liabilities | | 1,303,830 |
| | |
Net Assets | | $ 15,198,837 |
Net Assets consist of: | | |
Paid in capital | | $ 17,604,503 |
Undistributed net investment income | | 59,624 |
Accumulated undistributed net realized gain (loss) on investments and foreign currency transactions | | (1,765,593) |
Net unrealized appreciation (depreciation) on investments and assets and liabilities in foreign currencies | | (699,697) |
Net Assets | | $ 15,198,837 |
See accompanying notes which are an integral part of the financial statements.
Semiannual Report
Financial Statements - continued
Statement of Assets and Liabilities - continued
Amounts in thousands (except per-share amounts) | September 30, 2011 |
| | |
Magellan:
Net Asset Value, offering price and redemption price per share ($12,750,569 ÷ 217,654 shares) | | $ 58.58 |
| | |
Class K:
Net Asset Value, offering price and redemption price per share ($2,448,268 ÷ 41,805 shares) | | $ 58.56 |
See accompanying notes which are an integral part of the financial statements.
Semiannual Report
Statement of Operations
Amounts in thousands | Six months ended September 30, 2011 |
| | |
Investment Income | | |
Dividends (including $13,126 earned from other affiliated issuers) | | $ 102,835 |
Interest | | 868 |
Income from Fidelity Central Funds (including $8,781 from security lending) | | 8,917 |
Total income | | 112,620 |
| | |
Expenses | | |
Management fee
Basic fee | $ 55,165 | |
Performance adjustment | (22,669) | |
Transfer agent fees | 15,792 | |
Accounting and security lending fees | 887 | |
Custodian fees and expenses | 375 | |
Independent trustees' compensation | 61 | |
Depreciation in deferred trustee compensation account | (4) | |
Registration fees | 60 | |
Audit | 108 | |
Legal | 62 | |
Interest | 3 | |
Miscellaneous | 118 | |
Total expenses before reductions | 49,958 | |
Expense reductions | (1,232) | 48,726 |
Net investment income (loss) | | 63,894 |
Realized and Unrealized Gain (Loss) Net realized gain (loss) on: | | |
Investment securities: | | |
Unaffiliated issuers | 1,119,003 | |
Other affiliated issuers | (233,278) | |
Foreign currency transactions | (5,066) | |
Total net realized gain (loss) | | 880,659 |
Change in net unrealized appreciation (depreciation) on: Investment securities | (5,515,612) | |
Assets and liabilities in foreign currencies | (174) | |
Total change in net unrealized appreciation (depreciation) | | (5,515,786) |
Net gain (loss) | | (4,635,127) |
Net increase (decrease) in net assets resulting from operations | | $ (4,571,233) |
See accompanying notes which are an integral part of the financial statements.
Semiannual Report
Financial Statements - continued
Statement of Changes in Net Assets
Amounts in thousands | Six months ended September 30, 2011 | Year ended
March 31,
2011 |
Increase (Decrease) in Net Assets | | |
Operations | | |
Net investment income (loss) | $ 63,894 | $ 192,681 |
Net realized gain (loss) | 880,659 | 163,889 |
Change in net unrealized appreciation (depreciation) | (5,515,786) | 2,240,186 |
Net increase (decrease) in net assets resulting
from operations | (4,571,233) | 2,596,756 |
Distributions to shareholders from net investment income | (25,945) | (183,103) |
Distributions to shareholders from net realized gain | (6,512) | (23,072) |
Total distributions | (32,457) | (206,175) |
Share transactions - net increase (decrease) | (3,078,752) | (4,632,398) |
Total increase (decrease) in net assets | (7,682,442) | (2,241,817) |
| | |
Net Assets | | |
Beginning of period | 22,881,279 | 25,123,096 |
End of period (including undistributed net investment income of $59,624 and undistributed net investment income of $21,675, respectively) | $ 15,198,837 | $ 22,881,279 |
See accompanying notes which are an integral part of the financial statements.
Semiannual Report
Financial Highlights - Magellan
| Six months ended September 30, | Years ended March 31, |
| 2011 | 2011 | 2010 | 2009 | 2008 | 2007 |
Selected Per-Share Data | | | | | | |
Net asset value, beginning of period | $ 75.56 | $ 67.56 | $ 44.63 | $ 82.26 | $ 91.32 | $ 112.80 |
Income from Investment Operations | | | | | | |
Net investment income (loss) D | .22 | .56 G | .29 | .32 | .34 | .37 |
Net realized and unrealized gain (loss) | (17.09) | 8.05 | 23.02 | (34.98) | 2.72 | 3.31 |
Total from investment operations | (16.87) | 8.61 | 23.31 | (34.66) | 3.06 | 3.68 |
Distributions from net investment income | (.08) | (.54) | (.36) | (.11) | (.44) | (.50) |
Distributions from net realized gain | (.02) | (.07) | (.02) | (2.86) | (11.68) | (24.66) |
Total distributions | (.11) I | (.61) | (.38) | (2.97) | (12.12) | (25.16) |
Net asset value, end of period | $ 58.58 | $ 75.56 | $ 67.56 | $ 44.63 | $ 82.26 | $ 91.32 |
Total Return B,C | (22.36)% | 12.82% | 52.33% | (43.81)% | 2.08% | 3.21% |
Ratios to Average Net Assets E,H | | | | | |
Expenses before reductions | .53% A | .60% | .75% | .71% | .73% | .54% |
Expenses net of fee waivers, if any | .53% A | .60% | .75% | .71% | .73% | .54% |
Expenses net of all reductions | .51% A | .59% | .74% | .71% | .72% | .53% |
Net investment income (loss) | .63% A | .83% G | .49% | .51% | .37% | .41% |
Supplemental Data | | | | | | |
Net assets, end of period (in millions) | $ 12,751 | $ 19,398 | $ 22,628 | $ 17,225 | $ 38,322 | $ 43,155 |
Portfolio turnover rate F | 102% A | 42% | 39% | 67% | 57% | 41% |
A Annualized
B Total returns for periods of less than one year are not annualized.
C Total returns would have been lower if certain expenses had not been reduced during the applicable periods shown.
D Calculated based on average shares outstanding during the period.
E Fees and expenses of any underlying Fidelity Central Funds are not included in the Fund's expense ratio. The Fund indirectly bears its proportionate share of the expenses of any underlying Fidelity Central Funds.
F Amount does not include the portfolio activity of any underlying Fidelity Central Funds.
G Investment income per share reflects a special dividend which amounted to $.13 per share. Excluding the special dividend, the ratio of net investment income (loss) to average net assets would have been .63%.
H Expense ratios reflect operating expenses of the class. Expenses before reductions do not reflect amounts reimbursed by the investment adviser or reductions from brokerage service arrangements or reductions from other expense offset arrangements and do not represent the amount paid by the class during periods when reimbursements or reductions occur. Expenses net of fee waivers reflect expenses after reimbursement by the investment adviser but prior to reductions from brokerage service arrangements or other expense offset arrangements. Expenses net of all reductions represent the net expenses paid by the class.
I Total distributions of $.11 per share is comprised of distributions from net investment income of $.084 and distributions from net realized gain of $.022 per share.
See accompanying notes which are an integral part of the financial statements.
Semiannual Report
Financial Highlights - Class K
| Six months ended September 30, | Years ended March 31, |
| 2011 | 2011 | 2010 | 2009 H |
Selected Per-Share Data | | | | |
Net asset value, beginning of period | $ 75.51 | $ 67.53 | $ 44.61 | $ 85.82 |
Income from Investment Operations | | | | |
Net investment income (loss) D | .27 | .65 G | .38 | .30 |
Net realized and unrealized gain (loss) | (17.09) | 8.04 | 23.02 | (41.32) |
Total from investment operations | (16.82) | 8.69 | 23.40 | (41.02) |
Distributions from net investment income | (.11) | (.64) | (.46) | (.19) |
Distributions from net realized gain | (.02) | (.07) | (.02) | - |
Total distributions | (.13) | (.71) | (.48) | (.19) |
Net asset value, end of period | $ 58.56 | $ 75.51 | $ 67.53 | $ 44.61 |
Total Return B,C | (22.31)% | 12.97% | 52.59% | (47.79)% |
Ratios to Average Net Assets E,I | | | | |
Expenses before reductions | .40% A | .46% | .59% | .55% A |
Expenses net of fee waivers, if any | .40% A | .46% | .59% | .55% A |
Expenses net of all reductions | .39% A | .46% | .58% | .55% A |
Net investment income (loss) | .76% A | .97% G | .65% | .79% A |
Supplemental Data | | | | |
Net assets, end of period (in millions) | $ 2,448 | $ 3,483 | $ 2,495 | $ 1,415 |
Portfolio turnover rate F | 102% A | 42% | 39% | 67% |
A Annualized
B Total returns for periods of less than one year are not annualized.
C Total returns would have been lower if certain expenses had not been reduced during the applicable periods shown.
D Calculated based on average shares outstanding during the period.
E Fees and expenses of any underlying Fidelity Central Funds are not included in the Fund's expense ratio. The Fund indirectly bears its proportionate share of the expenses of any underlying Fidelity Central Funds.
F Amount does not include the portfolio activity of any underlying Fidelity Central Funds.
G Investment income per share reflects a special dividend which amounted to $.13 per share. Excluding the special dividend, the ratio of net investment income (loss) to average net assets would have been .77%.
H For the period May 9, 2008 (commencement of sale of shares) to March 31, 2009.
I Expense ratios reflect operating expenses of the class. Expenses before reductions do not reflect amounts reimbursed by the investment adviser or reductions from brokerage service arrangements or reductions from other expense offset arrangements and do not represent the amount paid by the class during periods when reimbursements or reductions occur. Expense ratios before reductions for start-up periods may not be representative of longer-term operating periods. Expenses net of fee waivers reflect expenses after reimbursement by the investment adviser but prior to reductions from brokerage service arrangements or other expense offset arrangements. Expenses net of all reductions represent the net expenses paid by the class.
See accompanying notes which are an integral part of the financial statements.
Semiannual Report
Notes to Financial Statements
For the period ended September 30, 2011
(Amounts in thousands except percentages)
1. Organization.
Fidelity® Magellan® Fund (the Fund) is a fund of Fidelity Magellan Fund (the Trust) and is authorized to issue an unlimited number of shares. The Trust is registered under the Investment Company Act of 1940, as amended (the 1940 Act), as an open-end management investment company organized as a Massachusetts business trust. The Fund offers Magellan and Class K, shares, each of which has equal rights as to assets and voting privileges. Each class has exclusive voting rights with respect to matters that affect that class. Investment income, realized and unrealized capital gains and losses, the common expenses of the Fund, and certain fund-level expense reductions, if any, are allocated on a pro-rata basis to each class based on the relative net assets of each class to the total net assets of the Fund. Each class differs with respect to transfer agent fees incurred. Certain expense reductions may also differ by class.
2. Investments in Fidelity Central Funds.
The Fund invests in Fidelity Central Funds, which are open-end investment companies available only to other investment companies and accounts managed by Fidelity Management & Research Company (FMR) and its affiliates. The Fund's Schedule of Investments lists each of the Fidelity Central Funds held as of period end, if any, as an investment of the Fund, but does not include the underlying holdings of each Fidelity Central Fund. As an Investing Fund, the Fund indirectly bears its proportionate share of the expenses of the underlying Fidelity Central Funds.
The Money Market Central Funds seek preservation of capital and current income and are managed by Fidelity Investments Money Management, Inc. (FIMM), an affiliate of FMR.
A complete unaudited list of holdings for each Fidelity Central Fund is available upon request or at the Securities and Exchange Commission (the SEC) web site at www.sec.gov. In addition, the financial statements of the Fidelity Central Funds, which are not covered by the Fund's Report of Independent Registered Public Accounting Firm are available on the SEC web site or upon request.
3. Significant Accounting Policies.
The financial statements have been prepared in conformity with accounting principles generally accepted in the United States of America (GAAP), which require management to make certain estimates and assumptions at the date of the financial statements. Actual results could differ from those estimates. Subsequent events, if any, through the date that the financial statements were issued have been evaluated in the preparation of the financial statements. The following summarizes the significant accounting policies of the Fund:
Semiannual Report
Notes to Financial Statements - continued
(Amounts in thousands except percentages)
3. Significant Accounting Policies - continued
Security Valuation. Investments are valued as of 4:00 p.m. Eastern time on the last calendar day of the period. The Fund uses independent pricing services approved by the Board of Trustees to value its investments. When current market prices or quotations are not readily available or reliable, valuations may be determined in good faith in accordance with procedures adopted by the Board of Trustees. Factors used in determining value may include market or security specific events, changes in interest rates and credit quality. The frequency with which these procedures are used cannot be predicted and they may be utilized to a significant extent. The value used for net asset value (NAV) calculation under these procedures may differ from published prices for the same securities.
The Fund categorizes the inputs to valuation techniques used to value its investments into a disclosure hierarchy consisting of three levels as shown below:
Level 1 - quoted prices in active markets for identical investments
Level 2 - other significant observable inputs (including quoted prices for similar investments, interest rates, prepayment speeds, etc.)
Level 3 - unobservable inputs (including the Fund's own assumptions based on the best information available)
Changes in valuation techniques may result in transfers in or out of an assigned level within the disclosure hierarchy. The aggregate value of investments by input level, as of September 30, 2011, as well as a roll forward of Level 3 securities, is included at the end of the Fund's Schedule of Investments. Valuation techniques used to value the Fund's investments by major category are as follows:
Equity securities, including restricted securities, for which market quotations are readily available, are valued at the last reported sale price or official closing price as reported by an independent pricing service on the primary market or exchange on which they are traded and are categorized as Level 1 in the hierarchy. In the event there were no sales during the day or closing prices are not available, securities are valued at the last quoted bid price or may be valued using the last available price and are generally categorized as Level 2 in the hierarchy. For foreign equity securities, when significant market or security specific events arise, comparisons to the valuation of American Depositary Receipts (ADRs), futures contracts, Exchange-traded funds (ETFs) and certain indexes as well as quoted prices for similar securities are used and are categorized as Level 2 in the hierarchy in these circumstances. Utilizing these techniques may result in transfers between Level 1 and Level 2. For restricted equity securities and private placements where observable inputs are limited, assumptions about market activity and risk are used and are categorized as Level 3 in the hierarchy.
Semiannual Report
3. Significant Accounting Policies - continued
Security Valuation - continued
Debt securities, including restricted securities, are valued based on evaluated prices received from independent pricing services or from dealers who make markets in such securities. For corporate bonds, pricing services utilize matrix pricing which considers yield or price of bonds of comparable quality, coupon, maturity and type as well as dealer supplied prices and are generally categorized as Level 2 in the hierarchy. When independent prices are unavailable or unreliable, debt securities may be valued utilizing pricing matrices which consider similar factors that would be used by independent pricing services. These are generally categorized as Level 2 in the hierarchy but may be Level 3 depending on the circumstances.
Investments in open-end mutual funds, including the Fidelity Central Funds, are valued at their closing net asset value each business day and are categorized as Level 1 in the hierarchy.
Foreign Currency. The Fund may use foreign currency contracts to facilitate transactions in foreign-denominated securities. Gains and losses from these transactions may arise from changes in the value of the foreign currency or if the counterparties do not perform under the contracts' terms.
Foreign-denominated assets, including investment securities, and liabilities are translated into U.S. dollars at the exchange rate at period end. Purchases and sales of investment securities, income and dividends received and expenses denominated in foreign currencies are translated into U.S. dollars at the exchange rate in effect on the transaction date.
The effects of exchange rate fluctuations on investments are included with the net realized and unrealized gain (loss) on investment securities. Other foreign currency transactions resulting in realized and unrealized gain (loss) are disclosed separately.
Investment Transactions and Income. For financial reporting purposes, the Fund's investment holdings and NAV include trades executed through the end of the last business day of the period. The NAV per share for processing shareholder transactions is calculated as of the close of business of the New York Stock Exchange (NYSE), normally 4:00 p.m. Eastern time and includes trades executed through the end of the prior business day. Gains and losses on securities sold are determined on the basis of identified cost and may include proceeds received from litigation. Dividend income is recorded on the ex-dividend date, except for certain dividends from foreign securities where the ex-dividend date may have passed, which are recorded as soon as the Fund is informed of the ex-dividend date. Non-cash dividends included in dividend income, if any, are recorded at the fair market value of the securities received. Distributions received on securities that represent a return of capital or capital gain are recorded as a reduction of
Semiannual Report
Notes to Financial Statements - continued
(Amounts in thousands except percentages)
3. Significant Accounting Policies - continued
Investment Transactions and Income - continued
cost of investments and/or as a realized gain. The Fund estimates the components of distributions received that may be considered return of capital distributions or capital gain distributions. Interest income and distributions from the Fidelity Central Funds are accrued as earned. Interest income includes coupon interest and amortization of premium and accretion of discount on debt securities. Investment income is recorded net of foreign taxes withheld where recovery of such taxes is uncertain.
Expenses. Expenses directly attributable to a fund are charged to that fund. Expenses attributable to more than one fund are allocated among the respective funds on the basis of relative net assets or other appropriate methods. Expense estimates are accrued in the period to which they relate and adjustments are made when actual amounts are known.
Deferred Trustee Compensation. Under a Deferred Compensation Plan (the Plan), independent Trustees may elect to defer receipt of a portion of their annual compensation. Deferred amounts are invested in a cross-section of Fidelity funds, are marked-to-market and remain in the Fund until distributed in accordance with the Plan. The investment of deferred amounts and the offsetting payable to the Trustees are included in the accompanying Statement of Assets and Liabilities.
Income Tax Information and Distributions to Shareholders. Each year, the Fund intends to qualify as a regulated investment company, including distributing substantially all of its taxable income and realized gains under Subchapter M of the Internal Revenue Code and filing its U.S. federal tax return. As a result, no provision for income taxes is required. A fund's federal tax return is subject to examination by the Internal Revenue Service (IRS) for a period of three years. Foreign taxes are provided for based on the Fund's understanding of the tax rules and rates that exist in the foreign markets in which it invests.
Distributions are declared and recorded on the ex-dividend date. Income dividends and capital gain distributions are declared separately for each class. Income and capital gain distributions are determined in accordance with income tax regulations, which may differ from GAAP.
Capital accounts within the financial statements are adjusted for permanent book-tax differences. These adjustments have no impact on net assets or the results of operations. Temporary book-tax differences will reverse in a subsequent period.
Book-tax differences are primarily due to foreign currency transactions, equity-debt classifications, passive foreign investment companies (PFIC), partnerships, deferred trustees compensation, capital loss carryforwards and losses due to wash sales and excise tax regulations.
Semiannual Report
3. Significant Accounting Policies - continued
Income Tax Information and Distributions to Shareholders - continued
The federal tax cost of investment securities and unrealized appreciation (depreciation) as of period end.
Gross unrealized appreciation | $ 1,460,073 |
Gross unrealized depreciation | (2,161,676) |
Net unrealized appreciation (depreciation) on securities and other investments | $ (701,603) |
| |
Tax cost | $ 16,120,589 |
Under the recently enacted Regulated Investment Company Modernization Act of 2010 (the Act), the Fund will be permitted to carry forward capital losses incurred in taxable years beginning after December 22, 2010 for an unlimited period. However, any losses incurred during those future taxable years will be required to be utilized prior to any losses incurred in pre-enactment taxable years, which generally expire after eight years from when they are incurred. Additionally, post-enactment capital losses that are carried forward will retain their character as either short-term or long-term capital losses rather than being considered all short-term as under previous law. The Fund's first fiscal year end subject to the Act will be March 31, 2012.
New Accounting Pronouncement. In May 2011, the Financial Accounting Standards Board issued Accounting Standard Update No. 2011-04, Fair Value Measurement (Topic 820) - Amendments to Achieve Common Fair Value Measurement and Disclosure Requirements in U.S. GAAP and IFRSs. The update changes the wording used to describe the requirements in GAAP for measuring fair value and for disclosing information about fair value measurements. The update is effective during interim and annual periods beginning after December 15, 2011. Management is currently evaluating the impact of the update's adoption on the Fund's financial statement disclosures.
4. Operating Policies.
Restricted Securities. The Fund may invest in securities that are subject to legal or contractual restrictions on resale. These securities generally may be resold in transactions exempt from registration or to the public if the securities are registered. Disposal of these securities may involve time-consuming negotiations and expense, and prompt sale at an acceptable price may be difficult. Information regarding restricted securities is included at the end of the Fund's Schedule of Investments.
Semiannual Report
Notes to Financial Statements - continued
(Amounts in thousands except percentages)
5. Purchases and Sales of Investments.
Purchases and sales of securities, other than short-term securities, aggregated $10,153,618 and $13,513,025, respectively.
6. Fees and Other Transactions with Affiliates.
Management Fee. FMR and its affiliates provide the Fund with investment management related services for which the Fund pays a monthly management fee. The management fee is the sum of an individual fund fee rate that is based on an annual rate of .30% of the Fund's average net assets and a group fee rate that averaged .26% during the period. The group fee rate is based upon the average net assets of all the mutual funds advised by FMR. The group fee rate decreases as assets under management increase and increases as assets under management decrease. In addition, the management fee is subject to a performance adjustment (up to a maximum of ± .20% of the Fund's average net assets over a 36 month performance period). The upward or downward adjustment to the management fee is based on the relative investment performance of the retail class of the Fund, Magellan, as compared to an appropriate benchmark index. For the period, the total annualized management fee rate, including the performance adjustment, was .33% of the Fund's average net assets.
Transfer Agent Fees. Fidelity Investments Institutional Operations Company, Inc. (FIIOC), an affiliate of FMR, is the transfer, dividend disbursing and shareholder servicing agent for each class of the Fund. FIIOC receives account fees and asset-based fees that vary according to the account size and type of account of the shareholders of Magellan. FIIOC receives an asset-based fee of Class K's average net assets. FIIOC pays for typesetting, printing and mailing of shareholder reports, except proxy statements. For the period, transfer agent fees for each class were as follows:
| Amount | % of
Average
Net Assets* |
Magellan | 14,984 | .18 |
Class K | 808 | .05 |
| $ 15,792 | |
* Annualized
Accounting and Security Lending Fees. Fidelity Service Company, Inc. (FSC), an affiliate of FMR, maintains the Fund's accounting records. The accounting fee is based on the level of average net assets for the month. Under a separate contract, FSC administers the security lending program. The security lending fee is based on the number and duration of lending transactions.
Semiannual Report
6. Fees and Other Transactions with Affiliates - continued
Brokerage Commissions. The Fund placed a portion of its portfolio transactions with brokerage firms which are affiliates of the investment adviser. The commissions paid to these affiliated firms were $503 for the period.
Interfund Lending Program. Pursuant to an Exemptive Order issued by the SEC, the Fund, along with other registered investment companies having management contracts with FMR, may participate in an interfund lending program. This program provides an alternative credit facility allowing the funds to borrow from, or lend money to, other participating affiliated funds. At period end, there were no interfund loans outstanding. The Fund's activity in this program during the period for which loans were outstanding was as follows:
Borrower or Lender | Average Daily
Loan Balance | Weighted Average Interest Rate | Interest
Expense |
Borrower | $ 37,329 | .35% | $ 3 |
7. Committed Line of Credit.
The Fund participates with other funds managed by FMR or an affiliate in a $4.0 billion credit facility (the "line of credit") to be utilized for temporary or emergency purposes to fund shareholder redemptions or for other short-term liquidity purposes. The Fund has agreed to pay commitment fees on its pro-rata portion of the line of credit, which amounted to $15 and is reflected in Miscellaneous expenses on the Statement of Operations. During the period, there were no borrowings on this line of credit.
8. Security Lending.
The Fund lends portfolio securities through a lending agent from time to time in order to earn additional income. The lending agent may loan securities to certain qualified borrowers, including Fidelity Capital Markets (FCM), a broker-dealer affiliated with the Fund. On the settlement date of the loan, the Fund receives collateral (in the form of U.S. Treasury obligations, letters of credit and/or cash) against the loaned securities and maintains collateral in an amount not less than 100% of the market value of the loaned securities during the period of the loan. The market value of the loaned securities is determined at the close of business of the Fund and any additional required collateral is delivered to the Fund on the next business day. If the borrower defaults on its obligation to return the securities loaned because of insolvency or other reasons, a fund could experience delays and costs in recovering the securities loaned or in gaining access to the collateral. Any cash collateral received is invested in the Fidelity Securities Lending Cash Central Fund. The value of loaned securities and cash collateral at period end are disclosed on the Fund's Statement of Assets and Liabilities. The value of securities loaned to FCM at period end was $1,525. Security lending income represents the income
Semiannual Report
Notes to Financial Statements - continued
(Amounts in thousands except percentages)
8. Security Lending - continued
earned on investing cash collateral, less rebates paid to borrowers and lending agent fees associated with the loan, plus any premium payments received for lending certain types of securities. Security lending income is presented in the Statement of Operations as a component of income from Fidelity Central Funds and includes $159 from securities loaned to FCM.
9. Expense Reductions.
Many of the brokers with whom FMR places trades on behalf of the Fund provided services to the Fund in addition to trade execution. These services included payments of certain expenses on behalf of the Fund totaling $1,232 for the period. In addition, through arrangements with the Fund's custodian and each class' transfer agent, credits realized as a result of uninvested cash balances were used to reduce the Fund's expenses. During the period, these credits reduced the Fund's custody and Class K's transfer agent expenses by eighty-four dollars and two hundred eighty-five dollars, respectively.
10. Distributions to Shareholders.
Distributions to shareholders of each class were as follows:
| Six months ended
September 30,
2011 | Year ended
March 31,
2011 |
From net investment income | | |
Magellan | $ 21,075 | $ 155,880 |
Class K | 4,870 | 27,223 |
Total | $ 25,945 | $ 183,103 |
From net realized gain | | |
Magellan | $ 5,520 | $ 20,450 |
Class K | 992 | 2,622 |
Total | $ 6,512 | $ 23,072 |
11. Share Transactions.
Transactions for each class of shares were as follows:
| Shares | Dollars |
| Six months ended September 30,
2011 | Year ended
March 31,
2011 | Six months ended September 30,
2011 | Year ended
March 31,
2011 |
Magellan | | | | |
Shares sold | 3,599 | 13,052 | $ 253,578 | $ 874,215 |
Reinvestment of distributions | 340 | 2,460 | 25,553 | 169,801 |
Shares redeemed | (43,021) | (93,705) | (3,047,575) | (6,286,234) |
Net increase (decrease) | (39,082) | (78,193) | $ (2,768,444) | $ (5,242,218) |
Semiannual Report
11. Share Transactions - continued
| Shares | Dollars |
| Six months ended September 30,
2011 | Year ended
March 31,
2011 | Six months ended September 30,
2011 | Year ended
March 31,
2011 |
Class K | | | | |
Shares sold | 5,282 | 21,632 | $ 367,768 | $ 1,466,317 |
Reinvestment of distributions | 78 | 432 | 5,862 | 29,845 |
Shares redeemed | (9,688) | (12,884) | (683,938) | (886,342) |
Net increase (decrease) | (4,328) | 9,180 | $ (310,308) | $ 609,820 |
12. Other.
The Fund's organizational documents provide former and current trustees and officers with a limited indemnification against liabilities arising in connection with the performance of their duties to the Fund. In the normal course of business, the Fund may also enter into contracts that provide general indemnifications. The Fund's maximum exposure under these arrangements is unknown as this would be dependent on future claims that may be made against the Fund. The risk of material loss from such claims is considered remote.
Semiannual Report
To the Trustees and Shareholders of Fidelity Magellan Fund:
In our opinion, the accompanying statement of assets and liabilities, including the schedule of investments, and the related statements of operations and of changes in net assets and the financial highlights present fairly, in all material respects, the financial position of Fidelity Magellan Fund at September 30, 2011, the results of its operations, the changes in its net assets and the financial highlights for each of the periods indicated, in conformity with accounting principles generally accepted in the United States of America. These financial statements and financial highlights (hereafter referred to as "financial statements") are the responsibility of the Fidelity Magellan Fund's management. Our responsibility is to express an opinion on these financial statements based on our audits. We conducted our audits of these financial statements in accordance with the standards of the Public Company Accounting Oversight Board (United States). Those standards require that we plan and perform the audit to obtain reasonable assurance about whether the financial statements are free of material misstatement. An audit includes examining, on a test basis, evidence supporting the amounts and disclosures in the financial statements, assessing the accounting principles used and significant estimates made by management, and evaluating the overall financial statement presentation. We believe that our audits, which included confirmation of securities at September 30, 2011 by correspondence with the custodian and brokers, provide a reasonable basis for our opinion.
/s/ PricewaterhouseCoopers LLP
PricewaterhouseCoopers LLP
Boston, Massachusetts
November 10, 2011
Semiannual Report
Board Approval of Investment Advisory Contracts and Management Fees
Fidelity Magellan Fund
Each year, the Board of Trustees, including the Independent Trustees (together, the Board), votes on the renewal of the management contract and sub-advisory agreements (together, the Advisory Contracts) for the fund. The Board, assisted by the advice of fund counsel and Independent Trustees' counsel, requests and considers a broad range of information relevant to the renewal of the Advisory Contracts throughout the year.
The Board meets regularly and considers at each of its meetings factors that are relevant to its annual consideration of the renewal of the fund's Advisory Contracts, including the services and support provided to the fund and its shareholders. The Board has established various standing committees, each composed of Independent Trustees with varying backgrounds, to which the Board has assigned specific subject matter responsibilities in order to enhance effective decision-making by the Board. The Board, acting directly and through its Committees, requests and receives information concerning the annual consideration of the renewal of the fund's Advisory Contracts. The Board also meets as needed to consider matters specifically related to the Board's annual consideration of the renewal of Advisory Contracts. Members of the Board may also meet with trustees of other Fidelity funds through ad hoc joint committees to discuss certain matters relevant to the Fidelity funds.
At its July 2011 meeting, the Board of Trustees, including the Independent Trustees, unanimously determined to renew the fund's Advisory Contracts. In reaching its determination, the Board considered all factors it believed relevant, including (i) the nature, extent, and quality of the services to be provided to the fund and its shareholders (including the investment performance of the fund); (ii) the competitiveness of the fund's management fee and total expense ratio; (iii) the total costs of the services to be provided by and the profits to be realized by Fidelity from its relationship with the fund; (iv) the extent to which economies of scale would be realized as the fund grows; and (v) whether fee levels reflect these economies of scale, if any, for the benefit of fund shareholders.
In considering whether to renew the Advisory Contracts for the fund, the Board reached a determination, with the assistance of fund counsel and Independent Trustees' counsel and through the exercise of its business judgment, that the renewal of the Advisory Contracts is in the best interests of the fund and its shareholders and that the compensation payable under the Advisory Contracts is fair and reasonable. The Board's decision to renew the Advisory Contracts was not based on any single factor, but rather was based on a comprehensive consideration of all the information provided to the Board at its meetings throughout the year. The Board, in reaching its determination to renew the Advisory Contracts, is aware that shareholders in the fund have a broad range of investment choices available to them, including a wide choice among mutual funds offered by Fidelity's competitors, and that the fund's shareholders, who have the opportunity to review and weigh the disclosure provided by the fund in its prospectus and other public disclosures, have chosen to invest in this fund, managed by Fidelity.
Semiannual Report
Nature, Extent, and Quality of Services Provided. The Board considered the staffing within the investment adviser, FMR, and the sub-advisers (together, the Investment Advisers), including the backgrounds of the fund's investment personnel and the fund's investment objective and discipline. The Independent Trustees also had discussions with senior management of Fidelity's investment operations and investment groups. The Board considered the structure of the portfolio manager compensation program and whether this structure provides appropriate incentives to act in the best interests of the fund.
Resources Dedicated to Investment Management and Support Services. The Board and the Fund Oversight and Research Committees reviewed the general qualifications and capabilities of the Investment Advisers' investment staff, including its size, education, experience, and resources, as well as the Investment Advisers' approach to recruiting, training, managing, and compensating investment personnel. The Board also noted that FMR has devoted increased resources to non-U.S. offices. The Board noted that Fidelity's analysts have extensive resources, tools and capabilities which allow them to conduct sophisticated quantitative and fundamental analysis, as well as credit analysis of issuers, counterparties and enhancers. The Board also believes that Fidelity's investment professionals have sufficient access to global information and data so as to provide competitive investment results over time, and that those professionals also have access to sophisticated tools which permit them to assess portfolio construction and risk and performance attribution characteristics continuously, as well as to transmit new information and research conclusions rapidly around the world. Additionally, in their deliberations, the Board considered the Investment Advisers' trading capabilities and resources which are an integral part of the investment management process.
Shareholder and Administrative Services. The Board considered (i) the nature, extent, quality, and cost of advisory, administrative, and shareholder services performed by the Investment Advisers and their affiliates under the Advisory Contracts and under separate agreements covering transfer agency, pricing and bookkeeping, and securities lending services for the fund; (ii) the nature and extent of the investment adviser's supervision of third party service providers, principally custodians and subcustodians; and (iii) the resources devoted to, and the record of compliance with, the fund's compliance policies and procedures. The Board also reviewed the allocation of fund brokerage, including allocations to brokers affiliated with the Investment Advisers, the use of brokerage commissions to pay fund expenses, and the use of "soft" commission dollars to pay for research services.
The Board noted that the growth of fund assets over time across the complex allows Fidelity to reinvest in the development of services designed to enhance the value or convenience of the Fidelity funds as investment vehicles. These services include 24-hour access to account information and market information through telephone representatives and over the Internet, investor education materials and asset allocation tools, and the expanded availability of Fidelity Investor Centers, with 35 new branches opening since 2010.
Semiannual Report
Board Approval of Investment Advisory Contracts and
Management Fees - continued
Investment in a Large Fund Family. The Board considered the benefits to shareholders of investing in a Fidelity fund, including the benefits of investing in a fund that is part of a large family of funds offering a variety of investment disciplines and providing a large variety of mutual fund investor services. The Board noted that Fidelity had taken, or had made recommendations that resulted in the Fidelity funds taking, a number of actions over the previous year that benefited particular funds, including (i) continuing to dedicate additional resources to investment research and support of the senior management team that oversees asset management; (ii) rationalizing product lines through the mergers of six funds into other funds; (iii) continuing to migrate the Freedom Funds to dedicated lower cost underlying funds; (iv) obtaining shareholder approval to broaden the investment strategies for Fidelity Consumer Finance Portfolio, Fidelity Emerging Asia Fund, and Fidelity Environment and Alternative Energy Portfolio; (v) contractually agreeing to reduce the management fees and impose other expense limitations on Spartan 500 Index Fund and U.S. Bond Index Fund in connection with launching new institutional classes of these funds; (vi) changing the name, primary and supplemental benchmarks, and investment policies of Fidelity Global Strategies Fund to support the fund's flexible investment mandate and global orientation; and (vii) reducing the transfer agency account fee rates on certain accounts.
Investment Performance. The Board considered whether the fund has operated in accordance with its investment objective, as well as its record of compliance with its investment restrictions. It also reviewed the fund's absolute investment performance for each class, as well as the fund's relative investment performance for each class measured over multiple periods against (i) a broad-based securities market index, and (ii) a custom peer group of mutual funds deemed appropriate by Fidelity and reviewed by the Board. The following charts considered by the Board show, over the one-, three-, and five-year periods ended December 31, 2010, as available, the cumulative total returns of Class K and the retail class of the fund, the cumulative total returns of a broad-based securities market index ("benchmark"), and a range of cumulative total returns of a custom peer group of mutual funds defined by FMR based on categories assigned by Morningstar, Inc. The box within each chart shows the 25th percentile return (bottom of box) and the 75th percentile return (top of box) of the peer group. Returns shown above the box are in the first quartile and returns shown below the box are in the fourth quartile. The percentage beaten numbers noted below each chart correspond to the percentile box and represent the percentage of funds in the peer group whose performance was equal to or lower than that of the class indicated. The fund's custom peer group, defined by FMR, is a peer group that FMR believes provides a more meaningful performance comparison than the peer group assigned by Morningstar, Inc., which assigns mutual funds to categories based on their investment styles as measured by their underlying portfolio holdings.
Semiannual Report
Fidelity Magellan Fund

The Board reviewed the fund's relative investment performance against its peer group and noted that the performance of the retail class of the fund (the class with the longer performance record) was in the fourth quartile for all the periods shown. The Board also noted that the investment performance of the fund was lower than its benchmark for all the periods shown. The Board considered that the variations in performance between the fund's classes reflect the variations in class expenses, which result in lower performance for the higher expense class. The Board discussed with FMR actions that have been taken by FMR to improve the fund's disappointing performance relative to its peer group and benchmark. The Board also reviewed the fund's performance since inception as well as performance in the current year. The Board will continue to closely monitor the performance of the fund in the coming year and discuss with FMR other appropriate actions to address the performance of the fund.
The Board also considered that the fund's management fee is subject to upward or downward adjustment depending upon whether, and to what extent, the fund's investment performance for the performance period exceeds, or is exceeded by, the record (over the same period) of a Board-approved performance adjustment index. The Board noted that the performance adjustment provides FMR with a strong economic incentive to seek to achieve superior performance for the fund's shareholders and helps to more closely align the interests of FMR and the fund's shareholders.
Semiannual Report
Board Approval of Investment Advisory Contracts and
Management Fees - continued
Based on its review, the Board concluded that the nature, extent, and quality of services provided to the fund under the Advisory Contracts should benefit the fund's shareholders.
Competitiveness of Management Fee and Total Expense Ratio. The Board considered the fund's management fee and total expense ratio compared to "mapped groups" of competitive funds and classes. Fidelity creates "mapped groups" by combining similar Lipper investment objective categories that have comparable management fee characteristics. Combining Lipper investment objective categories aids the Board's management fee and total expense ratio comparisons by broadening the competitive group used for comparison and by reducing the number of universes to which various Fidelity funds are compared.
Management Fee. The Board considered two proprietary management fee comparisons for the 12-month periods shown in the chart below. The group of Lipper funds used by the Board for management fee comparisons is referred to below as the "Total Mapped Group." The Total Mapped Group comparison focuses on a fund's standing relative to the total universe of comparable funds available to investors in terms of gross management fees before expense reimbursements or caps, and without giving effect to the fund's performance adjustment. "TMG %" represents the percentage of funds in the Total Mapped Group that had management fees that were lower than the fund's. For example, a TMG % of 10% means that 90% of the funds in the Total Mapped Group had higher management fees than the fund. The "Asset-Size Peer Group" (ASPG) comparison focuses on a fund's standing relative to non-Fidelity funds similar in size to the fund within the Total Mapped Group. The ASPG represents at least 15% of the funds in the Total Mapped Group with comparable asset size and management fee characteristics, subject to a minimum of 50 funds (or all funds in the Total Mapped Group if fewer than 50). Additional information, such as the ASPG quartile in which the fund's management fee ranked and the impact of the fund's performance adjustment, is also included in the chart and considered by the Board.
Semiannual Report
Fidelity Magellan Fund
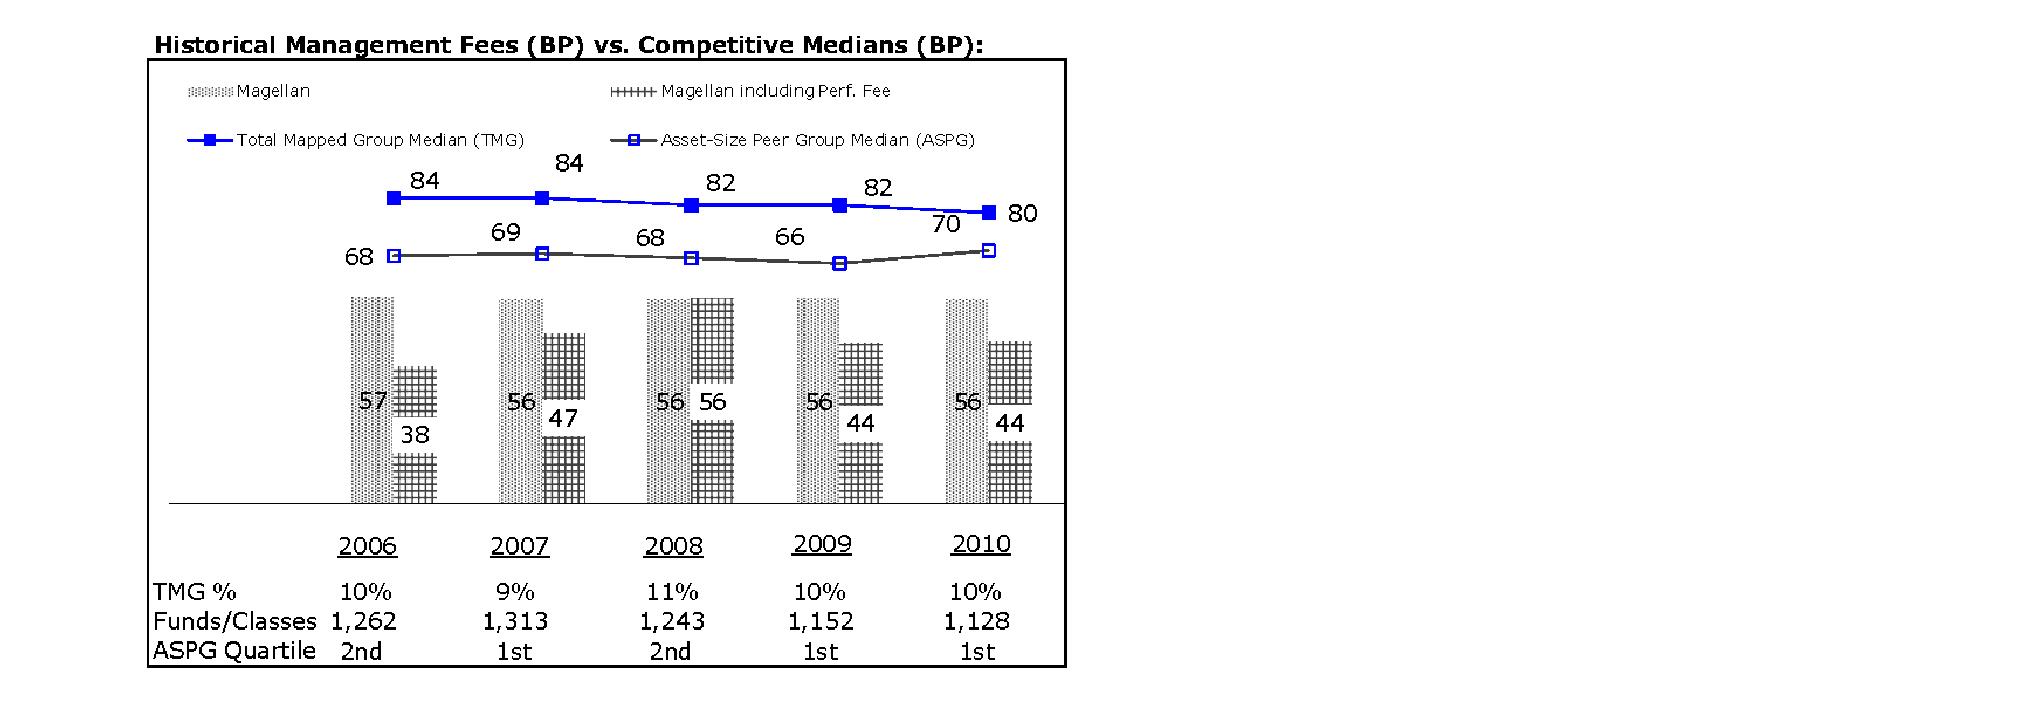
The Board noted that the fund's management fee ranked below the median of its Total Mapped Group and below the median of its ASPG for 2010. The Board also noted the effect of the fund's negative performance adjustment on the fund's management fee ranking. The Board noted that the performance adjustment for each year represents calculations for performance periods that differ from the periods shown in the performance charts above.
Based on its review, the Board concluded that the fund's management fee is fair and reasonable in light of the services that the fund receives and the other factors considered.
Total Expense Ratio. In its review of each class's total expense ratio, the Board considered the fund's management fee as well as other fund or class expenses, as applicable, such as transfer agent fees, pricing and bookkeeping fees, and custodial, legal, and audit fees. The Board also noted the effects of any waivers and reimbursements on fees and expenses, as well as the impact of the fund's performance adjustment. As part of its review, the Board also considered the current and historical total expense ratios of each class of the fund compared to competitive fund median expenses. Each class of the fund is compared to those funds and classes in the Total Mapped Group (used by the Board for management fee comparisons) that have a similar sales load structure.
The Board noted that the total expense ratio of each class ranked below its competitive median for 2010. The Board considered that various factors, including 12b-1 fees, positive or negative performance adjustments, and relatively higher other expenses in the case of small fund size, can affect total expense ratios.
Semiannual Report
Board Approval of Investment Advisory Contracts and
Management Fees - continued
Fees Charged to Other Fidelity Clients. The Board also considered Fidelity fee structures and other information with respect to clients of FMR and its affiliates, such as other mutual funds advised or subadvised by FMR or its affiliates, pension plan clients, and other institutional clients. In March 2010, the Board created an ad hoc joint committee with the board of other Fidelity funds (the Committee) to review and compare Fidelity's institutional investment advisory business with its business of providing services to the Fidelity funds, including the differences in services provided, fees charged, and costs incurred, as well as competition in their respective marketplaces.
Based on its review of total expense ratios and fees charged to other Fidelity clients, the Board concluded that the total expense ratio of each class of the fund was reasonable in light of the services that the fund and its shareholders receive and the other factors considered, including the findings of the Committee.
Costs of the Services and Profitability. The Board considered the revenues earned and the expenses incurred by Fidelity in conducting the business of developing, marketing, distributing, managing, administering and servicing the fund and its shareholders. The Board also considered the level of Fidelity's profits in respect of all the Fidelity funds.
On an annual basis, FMR presents to the Board Fidelity's profitability for the fund. Fidelity calculates the profitability for each fund, as well as aggregate profitability for groups of Fidelity funds and all Fidelity funds, using a series of detailed revenue and cost allocation methodologies which originate with the books and records of Fidelity on which Fidelity's audited financial statements are based. The Audit Committee of the Board reviews any significant changes from the prior year's methodologies.
PricewaterhouseCoopers LLP (PwC), independent registered public accounting firm and auditor to Fidelity and certain Fidelity funds, has been engaged annually by the Board as part of the Board's assessment of Fidelity's profitability analysis. PwC's engagement includes the review and assessment of Fidelity's methodologies used in determining the revenues and expenses attributable to Fidelity's mutual fund business, and completion of agreed-upon procedures surrounding the mathematical accuracy of fund profitability and its conformity to allocation methodologies. After considering PwC's reports issued under the engagement and information provided by Fidelity, the Board concluded that while other allocation methods may also be reasonable, Fidelity's profitability methodologies are reasonable in all material respects.
The Board also reviewed Fidelity's non-fund businesses and fall-out benefits related to the mutual fund business as well as cases where Fidelity's affiliates may benefit from or be related to the fund's business.
Semiannual Report
The Board considered the costs of the services provided by and the profits realized by Fidelity in connection with the operation of the fund and was satisfied that the profitability was not excessive in the circumstances.
Economies of Scale. The Board considered whether there have been economies of scale in respect of the management of the Fidelity funds, whether the Fidelity funds (including the fund) have appropriately benefited from any such economies of scale, and whether there is potential for realization of any further economies of scale. The Board considered the extent to which the fund will benefit from economies of scale through increased services to the fund, through waivers or reimbursements, or through fee or expense reductions. The Board also noted that in 2009, it and the board of other Fidelity funds created an ad hoc committee (the Economies of Scale Committee) to analyze whether FMR attains economies of scale in respect of the management and servicing of the Fidelity funds, whether the Fidelity funds have appropriately benefited from such economies of scale, and whether there is potential for realization of any further economies of scale.
The Board recognized that the fund's management contract incorporates a "group fee" structure, which provides for lower group fee rates as total fund assets under FMR's management increase, and for higher group fee rates as total fund assets under FMR's management decrease. FMR calculates the group fee rates based on a tiered asset "breakpoint" schedule that varies based on asset class. The Board considered that the group fee is designed to deliver the benefits of economies of scale to fund shareholders when total Fidelity fund assets increase, even if assets of any particular fund are unchanged or have declined, because some portion of Fidelity's costs are attributable to services provided to all Fidelity funds, and all funds benefit if those costs can be allocated among more assets. The Board concluded that, given the group fee structure, fund shareholders will benefit from lower management fees as assets under FMR's management increase at the fund complex level, regardless of whether Fidelity achieves any such economies of scale.
The Board concluded, taking into account the analysis of the Economies of Scale Committee, that any potential economies of scale are being appropriately shared between fund shareholders and Fidelity.
Additional Information Requested by the Board. In order to develop fully the factual basis for consideration of the Fidelity funds' Advisory Contracts, the Board requested and received additional information on certain topics, including (i) fund performance trends, actions to be taken by FMR to improve certain funds' overall performance, and Fidelity's long-term strategies for certain funds; (ii) portfolio manager changes that have occurred during the past year and length of portfolio manager tenure for different categories of funds over time; (iii) Fidelity's compensation structure for portfolio managers and other key personnel and strategies for attracting and retaining non-investment personnel; (iv) the amount of the investment that each portfolio manager has made in the Fidelity fund(s) that he or she manages; (v) historical trends in Fidelity's realization of fall-out benefits; (vi) Fidelity's group fee structures and the rationale for the individual fee rates of certain funds; (vii) fund profitability methodology and the impact of certain factors on fund profitability results; (viii) trends regarding industry use of performance fee structures and Fidelity's compliance practices with respect to performance adjustment calculations; (ix) the fee structures in place for certain other Fidelity clients; and (x) explanations regarding the relative total expense ratios of certain funds and classes, total expense competitive trends, and actions that might be taken by FMR to reduce total expense ratios for certain funds and classes.
Semiannual Report
Board Approval of Investment Advisory Contracts and
Management Fees - continued
Based on its evaluation of all of the conclusions noted above, and after considering all factors it believed relevant, the Board ultimately concluded that the advisory fee structures are fair and reasonable, and that the fund's Advisory Contracts should be renewed.
Semiannual Report
Managing Your Investments
Fidelity offers several ways to conveniently manage your personal investments via your telephone or PC. You can access your account information, conduct trades and research your investments 24 hours a day.
By Phone
Fidelity Automated Service Telephone provides a single toll-free number to access account balances, positions, quotes and trading. It's easy to navigate the service, and on your first call, the system will help you create a personal identification number (PIN) for security.
 Fidelity Automated
Service Telephone (FAST®)
1-800-544-5555
Press
 For mutual fund and brokerage trading.
 For quotes.*
 For account balances and holdings.
 To review orders and mutual
fund activity.
 To change your PIN.

 To speak to a Fidelity representative.
By PC
Fidelity's web site on the Internet provides a wide range of information, including daily financial news, fund performance, interactive planning tools and news about Fidelity products and services.
 Fidelity's Web Site
www.fidelity.com
* When you call the quotes line, please remember that a fund's yield and return will vary and, except for money market funds, share price will also vary. This means that you may have a gain or loss when you sell your shares. There is no assurance that money market funds will be able to maintain a stable $1 share price; an investment in a money market fund is not insured or guaranteed by the U.S. government. Total returns are historical and include changes in share price, reinvestment of dividends and capital gains distributions, and the effects of any sales charges.
Semiannual Report
Investment Adviser
Fidelity Management &
Research Company
Boston, MA
Investment Sub-Advisers
FMR Co., Inc.
Fidelity Management & Research
(U.K.) Inc.
Fidelity Management & Research
(Japan) Inc.
Fidelity Management & Research
(Hong Kong) Limited
General Distributor
Fidelity Distributors Corporation
Boston, MA
Transfer and Service Agents
Fidelity Investments Institutional
Operations Company, Inc.
Boston, MA
Fidelity Service Company, Inc.
Boston, MA
Custodian
State Street Bank and Trust Company Quincy, MA
The Fidelity Telephone Connection
Mutual Fund 24-Hour Service
Exchanges/Redemptions
and Account Assistance 1-800-544-6666
Product Information 1-800-544-6666
Retirement Accounts 1-800-544-4774
(8 a.m. - 9 p.m.)
TDD Service 1-800-544-0118
for the deaf and hearing impaired
(9 a.m. - 9 p.m. Eastern time)
Fidelity Automated Service
Telephone (FAST®)
1-800-544-5555
Automated line for quickest service
MAG-USAN-1111
1.792157.108

Fidelity®
Magellan®
Fund -
Class K
Semiannual Report
September 30, 2011

Contents
Chairman's Message | (Click Here) | The Chairman's message to shareholders. |
Shareholder Expense Example | (Click Here) | An example of shareholder expenses. |
Investment Changes | (Click Here) | A summary of major shifts in the fund's investments over the past six months. |
Investments | (Click Here) | A complete list of the fund's investments with their market values. |
Financial Statements | (Click Here) | Statements of assets and liabilities, operations, and changes in net assets, as well as financial highlights. |
Notes | (Click Here) | Notes to the financial statements. |
Report of Independent Registered Public Accounting Firm | (Click Here) | |
Board Approval of Investment Advisory Contracts and Management Fees | (Click Here) | |
To view a fund's proxy voting guidelines and proxy voting record for the 12-month period ended June 30, visit http://www.fidelity.com/proxyvotingresults or visit the Securities and Exchange Commission's (SEC) website at http://www.sec.gov. You may also call 1-800-835-5092 to request a free copy of the proxy voting guidelines.
Standard & Poor's, S&P and S&P 500 are registered service marks of The McGraw-Hill Companies, Inc. and have been licensed for use by Fidelity Distributors Corporation.
Other third party marks appearing herein are the property of their respective owners.
All other marks appearing herein are registered or unregistered trademarks or service marks of FMR LLC or an affiliated company.
This report and the financial statements contained herein are submitted for the general information of the shareholders of the fund. This report is not authorized for distribution to prospective investors in the fund unless preceded or accompanied by an effective prospectus.
A fund files its complete schedule of portfolio holdings with the SEC for the first and third quarters of each fiscal year on Form N-Q. Forms N-Q are available on the SEC's web site at http://www.sec.gov. A fund's Forms N-Q may be reviewed and copied at the SEC's Public Reference Room in Washington, DC. Information regarding the operation of the SEC's Public Reference Room may be obtained by calling 1-800-SEC-0330. For a complete list of a fund's portfolio holdings, view the most recent holdings listing, semiannual report, or annual report on Fidelity's web site at http://www.fidelity.com, http://www.advisor.fidelity.com, or http://www.401k.com, as applicable.
NOT FDIC INSURED • MAY LOSE VALUE • NO BANK GUARANTEE
Neither the fund nor Fidelity Distributors Corporation is a bank.
Semiannual Report
(photo_of_James_C_Curvey)
Dear Shareholder:
Global equity markets finished the third quarter in a significant downturn that intensified in late July and early August, as Congress struggled to raise the debt ceiling and Standard & Poor's announced it was lowering its long-term sovereign credit rating of the United States. The historic downgrade, along with continued evidence of a slowing global economy, heightened investor anxiety and set off a wave of volatility that hampered most major asset classes through the end of September. Financial markets are always unpredictable, of course, but there are several time-tested investment principles that can help put the odds in your favor.
One of the basic tenets is to invest for the long term. Over time, riding out the markets' inevitable ups and downs has proven much more effective than selling into panic or chasing the hottest trend. Even missing only a few of the markets' best days can significantly diminish investor returns. Patience also affords the benefits of compounding - of earning interest on additional income or reinvested dividends and capital gains. There can be tax advantages and cost benefits to consider as well. While staying the course doesn't eliminate risk, it can considerably lessen the effect of short-term declines.
You can further manage your investing risk through diversification. And today, more than ever, geographic diversification should be taken into account. Studies indicate that asset allocation is the single most important determinant of a portfolio's long-term success. The right mix of stocks, bonds and cash - aligned to your particular risk tolerance and investment objective - is very important. Age-appropriate rebalancing is also an essential aspect of asset allocation. For younger investors, an emphasis on equities - which historically have been the best-performing asset class over time - is encouraged. As investors near their specific goal, such as retirement or sending a child to college, consideration may be given to replacing volatile assets (e.g. common stocks) with more-stable fixed investments (bonds or savings plans).
A third principle - investing regularly - can help lower the average cost of your purchases. Investing a certain amount of money each month or quarter helps ensure you won't pay for all your shares at market highs. This strategy - known as dollar cost averaging - also reduces "emotion" from investing, helping shareholders avoid selling weak performers just prior to an upswing, or chasing a hot performer just before a correction.
We invite you to contact us via the Internet, through our Investor Centers or by phone. It is our privilege to provide you the information you need to make the investments that are right for you.
Sincerely,
(The acting chairman's signature appears here.)
James C. Curvey
Acting Chairman
Semiannual Report
Shareholder Expense Example
As a shareholder of the Fund, you incur two types of costs: (1) transaction costs, and (2) ongoing costs, including management fees and other Fund expenses. This Example is intended to help you understand your ongoing costs (in dollars) of investing in the Fund and to compare these costs with the ongoing costs of investing in other mutual funds.
The Example is based on an investment of $1,000 invested at the beginning of the period and held for the entire period (April 1, 2011 to September 30, 2011).
Actual Expenses
The first line of the accompanying table for each class of the Fund provides information about actual account values and actual expenses. You may use the information in this line, together with the amount you invested, to estimate the expenses that you paid over the period. Simply divide your account value by $1,000.00 (for example, an $8,600 account value divided by $1,000.00 = 8.6), then multiply the result by the number in the first line for a class of the Fund under the heading entitled "Expenses Paid During Period" to estimate the expenses you paid on your account during this period. A small balance maintenance fee of $12.00 that is charged once a year may apply for certain accounts with a value of less than $2,000. This fee is not included in the table below. If it was, the estimate of expenses you paid during the period would be higher, and your ending account value lower, by this amount. In addition, the Fund, as a shareholder in the underlying Fidelity Central Funds, will indirectly bear its pro-rata share of the fees and expenses incurred by the underlying Fidelity Central Funds. These fees and expenses are not included in the Fund's annualized expense ratio used to calculate the expense estimate in the table below.
Hypothetical Example for Comparison Purposes
The second line of the accompanying table for each class of the Fund provides information about hypothetical account values and hypothetical expenses based on a Class' actual expense ratio and an assumed rate of return of 5% per year before expenses, which is not the Class' actual return. The hypothetical account values and expenses may not be used to estimate the actual ending account balance or expenses you paid for the period. You may use this information to compare the ongoing costs of investing in the Fund and other funds. To do so, compare this 5% hypothetical example with the 5% hypothetical examples that appear in the shareholder reports of the other funds. A small balance maintenance fee of $12.00 that is charged once a year may apply for certain accounts with a value of less than $2,000. This fee is not included in the table below. If it was, the estimate of expenses you paid during the period would be higher, and your ending account value lower, by this amount. In addition, the Fund, as a shareholder in the underlying Fidelity Central Funds, will indirectly bear its pro-rata share of the fees and expenses incurred by the underlying Fidelity Central Funds. These fees and expenses are not included in the Fund's annualized expense ratio used to calculate the expense estimate in the table below.
Please note that the expenses shown in the table are meant to highlight your ongoing costs only and do not reflect any transaction costs. Therefore, the second line of the table is useful in comparing ongoing costs only, and will not help you determine the relative total costs of owning different funds.
Semiannual Report
| Annualized
Expense Ratio | Beginning
Account Value
April 1, 2011 | Ending
Account Value
September 30, 2011 | Expenses Paid
During Period*
April 1, 2011 to September 30, 2011 |
Magellan | .53% | | | |
Actual | | $ 1,000.00 | $ 776.40 | $ 2.35 |
Hypothetical A | | $ 1,000.00 | $ 1,022.35 | $ 2.68 |
Class K | .40% | | | |
Actual | | $ 1,000.00 | $ 776.90 | $ 1.78 |
Hypothetical A | | $ 1,000.00 | $ 1,023.00 | $ 2.02 |
A 5% return per year before expenses
* Expenses are equal to each Class' annualized expense ratio, multiplied by the average account value over the period, multiplied by 183/366 (to reflect the one-half year period).
Semiannual Report
Investment Changes (Unaudited)
Top Ten Stocks as of September 30, 2011 |
| % of fund's
net assets | % of fund's net assets
6 months ago |
Apple, Inc. | 6.6 | 3.3 |
Google, Inc. Class A | 2.9 | 1.8 |
Amazon.com, Inc. | 2.8 | 0.2 |
Wells Fargo & Co. | 2.3 | 0.6 |
Cognizant Technology Solutions Corp. Class A | 2.1 | 1.2 |
Chevron Corp. | 1.8 | 0.8 |
Exxon Mobil Corp. | 1.6 | 0.0 |
Procter & Gamble Co. | 1.5 | 0.0 |
Green Mountain Coffee Roasters, Inc. | 1.4 | 0.0 |
Citigroup, Inc. | 1.4 | 0.0 |
| 24.4 | |
Top Five Market Sectors as of September 30, 2011 |
| % of fund's
net assets | % of fund's net assets
6 months ago |
Information Technology | 22.9 | 27.5 |
Financials | 12.5 | 10.6 |
Consumer Discretionary | 12.4 | 12.1 |
Energy | 11.3 | 13.4 |
Industrials | 10.8 | 9.6 |
Asset Allocation (% of fund's net assets) |
As of September 30, 2011* | As of March 31, 2011** |
 | Stocks 96.3% | | | Stocks 98.9% | |
 | Convertible
Securities 0.1% | | | Convertible
Securities 0.1% | |
 | Short-Term
Investments and
Net Other Assets 3.6% | | | Short-Term
Investments and
Net Other Assets 1.0% | |
* Foreign investments | 16.2% | | ** Foreign investments | 23.4% | |

Semiannual Report
Investments September 30, 2011
Showing Percentage of Net Assets
Common Stocks - 96.1% |
| Shares | | Value (000s) |
CONSUMER DISCRETIONARY - 12.2% |
Auto Components - 0.0% |
BorgWarner, Inc. (a) | 26,389 | | $ 1,597 |
Diversified Consumer Services - 0.1% |
Ascent Capital Group, Inc. (a) | 119,604 | | 4,703 |
New Oriental Education & Technology Group, Inc. sponsored ADR (a) | 503,200 | | 11,559 |
| | 16,262 |
Hotels, Restaurants & Leisure - 1.4% |
Arcos Dorados Holdings, Inc. | 1,000,000 | | 23,190 |
China Lodging Group Ltd. ADR (a)(d) | 441,278 | | 6,041 |
Ctrip.com International Ltd. sponsored ADR (a) | 500,000 | | 16,080 |
Las Vegas Sands Corp. (a) | 1,000,000 | | 38,340 |
Starbucks Corp. | 3,297,712 | | 122,972 |
Yum! Brands, Inc. | 44,827 | | 2,214 |
| | 208,837 |
Household Durables - 3.2% |
D.R. Horton, Inc. | 12,066,177 | | 109,078 |
Lennar Corp. Class A (d) | 7,892,985 | | 106,871 |
M.D.C. Holdings, Inc. (d) | 318,825 | | 5,401 |
PulteGroup, Inc. (a) | 160,056 | | 632 |
Ryland Group, Inc. | 1,896,860 | | 20,202 |
Tempur-Pedic International, Inc. (a) | 2,008,776 | | 105,682 |
Toll Brothers, Inc. (a) | 6,966,454 | | 100,526 |
Tupperware Brands Corp. | 844,848 | | 45,402 |
| | 493,794 |
Internet & Catalog Retail - 3.4% |
Amazon.com, Inc. (a) | 1,953,704 | | 422,449 |
Priceline.com, Inc. (a) | 192,986 | | 86,739 |
| | 509,188 |
Leisure Equipment & Products - 0.1% |
Brunswick Corp. | 835,447 | | 11,730 |
Media - 0.1% |
Comcast Corp. Class A (special) (non-vtg.) | 382,262 | | 7,909 |
Informa PLC | 2,200,000 | | 11,241 |
Sun TV Ltd. | 45,174 | | 214 |
| | 19,364 |
Multiline Retail - 0.6% |
Dollar General Corp. (a) | 1,215,800 | | 45,909 |
Common Stocks - continued |
| Shares | | Value (000s) |
CONSUMER DISCRETIONARY - continued |
Multiline Retail - continued |
Dollar Tree, Inc. (a) | 547,044 | | $ 41,088 |
Pantaloon Retail India Ltd. Class B | 17,200 | | 58 |
| | 87,055 |
Specialty Retail - 1.8% |
Best Buy Co., Inc. | 500,000 | | 11,650 |
Limited Brands, Inc. | 1,268,348 | | 48,844 |
TJX Companies, Inc. | 3,735,400 | | 207,203 |
| | 267,697 |
Textiles, Apparel & Luxury Goods - 1.5% |
Arezzo Industria e Comercio SA | 289,800 | | 2,927 |
lululemon athletica, Inc. (a) | 1,321,100 | | 64,272 |
Peak Sport Products Co. Ltd. (e) | 117,218,000 | | 32,077 |
PVH Corp. | 588,384 | | 34,267 |
Ralph Lauren Corp. | 762,087 | | 98,843 |
| | 232,386 |
TOTAL CONSUMER DISCRETIONARY | | 1,847,910 |
CONSUMER STAPLES - 8.7% |
Beverages - 0.8% |
Anheuser-Busch InBev SA NV | 770,260 | | 40,886 |
Pernod-Ricard SA | 496,500 | | 39,134 |
SABMiller PLC | 1,240,200 | | 40,768 |
| | 120,788 |
Food & Staples Retailing - 2.2% |
CVS Caremark Corp. | 2,462,472 | | 82,690 |
Drogasil SA | 1,500,000 | | 8,971 |
United Natural Foods, Inc. (a)(e) | 3,513,951 | | 130,157 |
Wal-Mart de Mexico SA de CV Series V | 11,656,500 | | 26,861 |
Whole Foods Market, Inc. | 1,110,213 | | 72,508 |
Wumart Stores, Inc. (H Shares) | 7,077,000 | | 13,986 |
| | 335,173 |
Food Products - 1.9% |
Darling International, Inc. (a) | 561,503 | | 7,069 |
Green Mountain Coffee Roasters, Inc. (a) | 2,237,200 | | 207,925 |
Nestle SA | 816,600 | | 45,136 |
Shenguan Holdings Group Ltd. | 8,032,000 | | 4,078 |
The J.M. Smucker Co. | 211,525 | | 15,418 |
| | 279,626 |
Common Stocks - continued |
| Shares | | Value (000s) |
CONSUMER STAPLES - continued |
Household Products - 3.1% |
Colgate-Palmolive Co. | 1,654,848 | | $ 146,752 |
Kimberly-Clark Corp. | 1,397,644 | | 99,247 |
Procter & Gamble Co. | 3,652,021 | | 230,735 |
| | 476,734 |
Personal Products - 0.7% |
Herbalife Ltd. | 1,335,300 | | 71,572 |
Nu Skin Enterprises, Inc. Class A | 790,981 | | 32,051 |
| | 103,623 |
TOTAL CONSUMER STAPLES | | 1,315,944 |
ENERGY - 11.3% |
Energy Equipment & Services - 3.2% |
Baker Hughes, Inc. | 1,415,000 | | 65,316 |
Dresser-Rand Group, Inc. (a) | 285,136 | | 11,557 |
Ensco International Ltd. ADR | 2,965,912 | | 119,912 |
Halliburton Co. | 2,020,866 | | 61,677 |
Noble Corp. | 600,521 | | 17,625 |
Schlumberger Ltd. | 1,259,796 | | 75,248 |
Transocean Ltd. (United States) | 2,987,902 | | 142,642 |
| | 493,977 |
Oil, Gas & Consumable Fuels - 8.1% |
Alpha Natural Resources, Inc. (a) | 4,765,570 | | 84,303 |
Amyris, Inc. | 193,938 | | 3,925 |
Anadarko Petroleum Corp. | 1,293,000 | | 81,524 |
Cabot Oil & Gas Corp. | 741,576 | | 45,911 |
Chesapeake Energy Corp. | 682,383 | | 17,435 |
Chevron Corp. | 3,032,277 | | 280,546 |
Denbury Resources, Inc. (a) | 3,415,737 | | 39,281 |
Enterprise Products Partners LP | 307,994 | | 12,366 |
Exxon Mobil Corp. | 3,310,552 | | 240,445 |
Hess Corp. | 1,135,800 | | 59,584 |
HollyFrontier Corp. | 1,576,373 | | 41,333 |
Marathon Oil Corp. | 1,328,467 | | 28,668 |
Occidental Petroleum Corp. | 2,826,548 | | 202,098 |
Royal Dutch Shell PLC Class A sponsored ADR | 1,186,211 | | 72,976 |
Common Stocks - continued |
| Shares | | Value (000s) |
ENERGY - continued |
Oil, Gas & Consumable Fuels - continued |
Westernzagros Resources Ltd. (a) | 527,616 | | $ 229 |
Williams Companies, Inc. | 736,676 | | 17,931 |
| | 1,228,555 |
TOTAL ENERGY | | 1,722,532 |
FINANCIALS - 12.5% |
Capital Markets - 1.5% |
Charles Schwab Corp. | 3,843,476 | | 43,316 |
Franklin Resources, Inc. | 51,985 | | 4,972 |
Morgan Stanley | 9,582,966 | | 129,370 |
TD Ameritrade Holding Corp. | 3,654,476 | | 53,739 |
| | 231,397 |
Commercial Banks - 4.3% |
Aozora Bank Ltd. | 14,603,000 | | 33,624 |
Barclays PLC | 3,122,579 | | 7,659 |
BNP Paribas SA | 202,600 | | 8,157 |
CIT Group, Inc. (a) | 1,231,400 | | 37,398 |
Mitsubishi UFJ Financial Group, Inc. sponsored ADR | 184,086 | | 819 |
SVB Financial Group (a) | 1,142,548 | | 42,274 |
U.S. Bancorp | 7,166,703 | | 168,704 |
Wells Fargo & Co. | 14,459,515 | | 348,764 |
| | 647,399 |
Consumer Finance - 0.2% |
SLM Corp. | 2,202,353 | | 27,419 |
Diversified Financial Services - 2.1% |
Citigroup, Inc. | 8,109,323 | | 207,761 |
CME Group, Inc. | 261,500 | | 64,434 |
ORIX Corp. | 507,600 | | 39,843 |
| | 312,038 |
Insurance - 1.6% |
Berkshire Hathaway, Inc. Class B (a) | 2,798,003 | | 198,770 |
Endurance Specialty Holdings Ltd. | 310,432 | | 10,601 |
MetLife, Inc. | 1,436,307 | | 40,231 |
| | 249,602 |
Real Estate Investment Trusts - 1.0% |
Boston Properties, Inc. | 350,720 | | 31,249 |
CBL & Associates Properties, Inc. | 5,513,363 | | 62,632 |
Common Stocks - continued |
| Shares | | Value (000s) |
FINANCIALS - continued |
Real Estate Investment Trusts - continued |
Simon Property Group, Inc. | 428,353 | | $ 47,110 |
Terreno Realty Corp. (e) | 839,001 | | 10,764 |
| | 151,755 |
Real Estate Management & Development - 1.7% |
Agre Developers Ltd. | 5,564 | | 5 |
Iguatemi Empresa de Shopping Centers SA | 1,010,000 | | 16,914 |
PT Lippo Karawaci Tbk (e) | 1,328,501,625 | | 101,817 |
Rialto Real Estate Fund LP (e)(g)(h) | 500,000 | | 41,465 |
The St. Joe Co. (a)(d)(e) | 6,858,391 | | 102,807 |
| | 263,008 |
Thrifts & Mortgage Finance - 0.1% |
BankUnited, Inc. | 590,083 | | 12,250 |
TOTAL FINANCIALS | | 1,894,868 |
HEALTH CARE - 10.5% |
Biotechnology - 2.5% |
Acorda Therapeutics, Inc. (a) | 750,000 | | 14,970 |
Alexion Pharmaceuticals, Inc. (a) | 1,051,760 | | 67,376 |
Amarin Corp. PLC ADR (a) | 90,590 | | 833 |
Amgen, Inc. | 1,536,493 | | 84,430 |
ARIAD Pharmaceuticals, Inc. (a) | 215,000 | | 1,890 |
ArQule, Inc. (a) | 1,404,466 | | 7,093 |
Biogen Idec, Inc. (a) | 443,204 | | 41,284 |
BioMarin Pharmaceutical, Inc. (a) | 2,851,839 | | 90,888 |
Clinical Data, Inc. rights 4/4/18 (a) | 988,714 | | 0 |
Incyte Corp. (a)(d) | 650,829 | | 9,092 |
Protalix BioTherapeutics, Inc. (a)(d) | 618,863 | | 2,847 |
Theravance, Inc. (a) | 813,900 | | 16,392 |
United Therapeutics Corp. (a) | 849,183 | | 31,836 |
Vertex Pharmaceuticals, Inc. (a) | 319,100 | | 14,213 |
| | 383,144 |
Health Care Equipment & Supplies - 3.6% |
Baxter International, Inc. | 2,112,837 | | 118,615 |
C. R. Bard, Inc. | 836,639 | | 73,239 |
Covidien PLC | 3,377,490 | | 148,947 |
Edwards Lifesciences Corp. (a) | 667,100 | | 47,551 |
Greatbatch, Inc. (a) | 843,669 | | 16,882 |
HeartWare International, Inc. (a) | 307,700 | | 19,819 |
Common Stocks - continued |
| Shares | | Value (000s) |
HEALTH CARE - continued |
Health Care Equipment & Supplies - continued |
Integra LifeSciences Holdings Corp. (a)(e) | 1,408,807 | | $ 50,393 |
Sirona Dental Systems, Inc. (a) | 1,262,812 | | 53,556 |
Volcano Corp. (a) | 469,520 | | 13,912 |
| | 542,914 |
Health Care Providers & Services - 2.2% |
Aetna, Inc. | 59,000 | | 2,145 |
Brookdale Senior Living, Inc. (a) | 2,707,644 | | 33,954 |
Express Scripts, Inc. (a) | 1,860,861 | | 68,982 |
HealthSouth Corp. (a) | 141,777 | | 2,117 |
Henry Schein, Inc. (a) | 1,402,253 | | 86,954 |
McKesson Corp. | 1,071,412 | | 77,892 |
Medco Health Solutions, Inc. (a) | 418,405 | | 19,619 |
Universal Health Services, Inc. Class B | 49,500 | | 1,683 |
WellPoint, Inc. | 551,237 | | 35,985 |
| | 329,331 |
Health Care Technology - 0.2% |
Cerner Corp. (a) | 384,583 | | 26,352 |
Life Sciences Tools & Services - 0.3% |
Thermo Fisher Scientific, Inc. (a) | 1,000,000 | | 50,640 |
Pharmaceuticals - 1.7% |
Auxilium Pharmaceuticals, Inc. (a) | 400,000 | | 5,996 |
Cardiome Pharma Corp. (a)(d) | 2,500,000 | | 8,538 |
Elan Corp. PLC sponsored ADR (a) | 5,000,000 | | 52,650 |
Eli Lilly & Co. | 1,313,576 | | 48,563 |
GlaxoSmithKline PLC sponsored ADR | 487,852 | | 20,143 |
Perrigo Co. | 13,500 | | 1,311 |
Sanofi-aventis sponsored ADR | 2,389,016 | | 78,360 |
Shire PLC sponsored ADR | 447,200 | | 42,005 |
XenoPort, Inc. (a) | 254,100 | | 1,499 |
| | 259,065 |
TOTAL HEALTH CARE | | 1,591,446 |
INDUSTRIALS - 10.8% |
Aerospace & Defense - 2.2% |
BE Aerospace, Inc. (a) | 976,800 | | 32,342 |
DigitalGlobe, Inc. (a) | 405,178 | | 7,873 |
Precision Castparts Corp. | 314,327 | | 48,865 |
Rockwell Collins, Inc. | 477,688 | | 25,203 |
Textron, Inc. | 3,096,446 | | 54,621 |
Common Stocks - continued |
| Shares | | Value (000s) |
INDUSTRIALS - continued |
Aerospace & Defense - continued |
TransDigm Group, Inc. (a) | 82,686 | | $ 6,753 |
United Technologies Corp. | 2,240,300 | | 157,628 |
| | 333,285 |
Airlines - 0.3% |
Copa Holdings SA Class A | 247,700 | | 15,177 |
JetBlue Airways Corp. (a)(d) | 6,235,355 | | 25,565 |
| | 40,742 |
Building Products - 0.5% |
Masco Corp. | 4,409,140 | | 31,393 |
Owens Corning (a) | 2,463,952 | | 53,418 |
| | 84,811 |
Commercial Services & Supplies - 0.4% |
Republic Services, Inc. | 2,009,701 | | 56,392 |
Construction & Engineering - 0.7% |
Fluor Corp. | 1,134,883 | | 52,829 |
KBR, Inc. | 636,981 | | 15,052 |
MYR Group, Inc. (a)(e) | 1,037,100 | | 18,294 |
Shaw Group, Inc. (a) | 1,063,090 | | 23,112 |
SNC-Lavalin Group, Inc. | 83,515 | | 3,508 |
| | 112,795 |
Electrical Equipment - 1.5% |
Alstom SA | 1,255,809 | | 41,853 |
AMETEK, Inc. | 1,063,683 | | 35,070 |
Emerson Electric Co. | 2,168,077 | | 89,563 |
EnerSys (a) | 2,152,807 | | 43,099 |
Regal-Beloit Corp. | 451,522 | | 20,490 |
| | 230,075 |
Industrial Conglomerates - 2.0% |
Danaher Corp. | 3,381,669 | | 141,827 |
General Electric Co. | 11,120,966 | | 169,484 |
| | 311,311 |
Machinery - 2.3% |
Cummins, Inc. | 2,191,771 | | 178,980 |
Ingersoll-Rand Co. Ltd. | 5,388,111 | | 151,352 |
NACCO Industries, Inc. Class A | 232,430 | | 14,736 |
| | 345,068 |
Professional Services - 0.7% |
Manpower, Inc. | 895,842 | | 30,118 |
Common Stocks - continued |
| Shares | | Value (000s) |
INDUSTRIALS - continued |
Professional Services - continued |
Qualicorp SA | 1,025,400 | | $ 7,632 |
Robert Half International, Inc. | 1,713,751 | | 36,366 |
Towers Watson & Co. | 480,052 | | 28,698 |
| | 102,814 |
Road & Rail - 0.2% |
Localiza Rent A Car SA | 1,935,128 | | 25,617 |
Trading Companies & Distributors - 0.0% |
Essex Rental Corp. (a)(d) | 262,602 | | 646 |
Transportation Infrastructure - 0.0% |
The Sumitomo Warehouse Co. Ltd. | 202,000 | | 932 |
TOTAL INDUSTRIALS | | 1,644,488 |
INFORMATION TECHNOLOGY - 22.9% |
Communications Equipment - 1.7% |
Cisco Systems, Inc. | 9,673,061 | | 149,836 |
Juniper Networks, Inc. (a) | 1,515,482 | | 26,157 |
Motorola Solutions, Inc. | 1,580,241 | | 66,212 |
Polycom, Inc. (a) | 1,147,469 | | 21,079 |
| | 263,284 |
Computers & Peripherals - 7.9% |
Apple, Inc. (a) | 2,611,059 | | 995,280 |
EMC Corp. (a) | 3,782,134 | | 79,387 |
SanDisk Corp. (a) | 2,266,400 | | 91,449 |
Seagate Technology | 3,233,082 | | 33,236 |
| | 1,199,352 |
Electronic Equipment & Components - 1.0% |
Amphenol Corp. Class A | 2,607,618 | | 106,313 |
Corning, Inc. | 2,456,214 | | 30,359 |
Ingram Micro, Inc. Class A (a) | 1,041,370 | | 16,797 |
| | 153,469 |
Internet Software & Services - 4.5% |
Active Network, Inc. (d) | 554,141 | | 8,174 |
AOL, Inc. (a)(d) | 1,032,274 | | 12,387 |
Baidu.com, Inc. sponsored ADR (a) | 568,700 | | 60,800 |
eBay, Inc. (a) | 4,102,300 | | 120,977 |
Google, Inc. Class A (a) | 853,500 | | 439,023 |
GREE, Inc. (d) | 522,500 | | 15,936 |
Common Stocks - continued |
| Shares | | Value (000s) |
INFORMATION TECHNOLOGY - continued |
Internet Software & Services - continued |
Mail.ru Group Ltd.: | | | |
GDR (a)(f) | 40,300 | | $ 1,179 |
GDR (Reg. S) | 473,600 | | 13,853 |
Rackspace Hosting, Inc. (a) | 800 | | 27 |
Yandex NV | 542,606 | | 11,075 |
| | 683,431 |
IT Services - 2.9% |
Cognizant Technology Solutions Corp. Class A (a) | 5,094,275 | | 319,411 |
Fidelity National Information Services, Inc. | 1,577,578 | | 38,367 |
Fiserv, Inc. (a) | 589,557 | | 29,932 |
MasterCard, Inc. Class A | 130,200 | | 41,294 |
ServiceSource International, Inc. | 259,106 | | 3,423 |
| | 432,427 |
Semiconductors & Semiconductor Equipment - 2.7% |
Applied Materials, Inc. | 6,349,294 | | 65,715 |
ASML Holding NV | 1,658,701 | | 57,292 |
Avago Technologies Ltd. | 1,132,788 | | 37,121 |
Broadcom Corp. Class A | 713,970 | | 23,768 |
First Solar, Inc. (a)(d) | 251,749 | | 15,913 |
GT Advanced Technologies, Inc. (a) | 2,148,999 | | 15,086 |
Himax Technologies, Inc. sponsored ADR | 3,463,203 | | 3,844 |
JA Solar Holdings Co. Ltd. ADR (a)(d) | 972,024 | | 1,730 |
KLA-Tencor Corp. | 466,741 | | 17,867 |
Marvell Technology Group Ltd. (a) | 6,200,000 | | 90,086 |
NVIDIA Corp. (a) | 4,534,918 | | 56,686 |
Taiwan Semiconductor Manufacturing Co. Ltd. sponsored ADR | 1,801,643 | | 20,593 |
Trina Solar Ltd. (a)(d) | 1,644,635 | | 9,999 |
| | 415,700 |
Software - 2.2% |
Autodesk, Inc. (a) | 1,893,900 | | 52,613 |
Changyou.com Ltd. (A Shares) ADR (a)(d) | 207,724 | | 5,255 |
Citrix Systems, Inc. (a) | 1,035,100 | | 56,444 |
Red Hat, Inc. (a) | 819,881 | | 34,648 |
Rovi Corp. (a) | 654,330 | | 28,123 |
salesforce.com, Inc. (a) | 1,264,679 | | 144,528 |
VMware, Inc. Class A (a) | 211,655 | | 17,013 |
| | 338,624 |
TOTAL INFORMATION TECHNOLOGY | | 3,486,287 |
Common Stocks - continued |
| Shares | | Value (000s) |
MATERIALS - 5.1% |
Chemicals - 1.8% |
Albemarle Corp. | 797,607 | | $ 32,223 |
Celanese Corp. Class A | 960,900 | | 31,258 |
CF Industries Holdings, Inc. | 353,200 | | 43,581 |
LyondellBasell Industries NV Class A | 2,043,400 | | 49,920 |
Minerals Technologies, Inc. | 409,006 | | 20,152 |
Praxair, Inc. | 347,532 | | 32,487 |
Symrise AG | 1,299,359 | | 30,378 |
Valspar Corp. | 359,246 | | 11,212 |
W.R. Grace & Co. (a) | 835,605 | | 27,826 |
| | 279,037 |
Construction Materials - 0.2% |
Eagle Materials, Inc. | 1,589,360 | | 26,463 |
Metals & Mining - 3.1% |
AngloGold Ashanti Ltd. sponsored ADR | 547,779 | | 22,656 |
Barrick Gold Corp. | 831,300 | | 38,944 |
Centamin Egypt Ltd. (United Kingdom) (a) | 6,218,475 | | 9,137 |
Goldcorp, Inc. | 1,657,101 | | 75,987 |
Harry Winston Diamond Corp. (a) | 1,000,000 | | 10,169 |
Ivanhoe Mines Ltd. (a) | 4,034,780 | | 55,616 |
Kinross Gold Corp. | 2,783,875 | | 41,348 |
Newcrest Mining Ltd. | 1,038,953 | | 34,261 |
Newmont Mining Corp. | 2,045,200 | | 128,643 |
Reliance Steel & Aluminum Co. | 549,300 | | 18,682 |
Royal Gold, Inc. | 500,000 | | 32,030 |
| | 467,473 |
TOTAL MATERIALS | | 772,973 |
TELECOMMUNICATION SERVICES - 1.4% |
Diversified Telecommunication Services - 0.1% |
Iliad SA | 15,693 | | 1,766 |
Telenor ASA | 1,036,200 | | 16,117 |
| | 17,883 |
Wireless Telecommunication Services - 1.3% |
American Tower Corp. Class A (a) | 3,376,561 | | 181,659 |
NII Holdings, Inc. (a) | 467,600 | | 12,602 |
| | 194,261 |
TOTAL TELECOMMUNICATION SERVICES | | 212,144 |
Common Stocks - continued |
| Shares | | Value (000s) |
UTILITIES - 0.7% |
Electric Utilities - 0.7% |
Edison International | 933,147 | | $ 35,693 |
NextEra Energy, Inc. | 1,435,400 | | 77,540 |
| | 113,233 |
Independent Power Producers & Energy Traders - 0.0% |
Indiabulls Power Ltd. (a) | 1,513,614 | | 389 |
TOTAL UTILITIES | | 113,622 |
TOTAL COMMON STOCKS (Cost $15,290,368) |
14,602,214
|
Nonconvertible Preferred Stocks - 0.2% |
| | | |
CONSUMER DISCRETIONARY - 0.2% |
Automobiles - 0.2% |
Volkswagen AG (Cost $51,934) | 278,400 | |
37,319
|
Convertible Bonds - 0.1% |
| Principal Amount (000s) | | |
TELECOMMUNICATION SERVICES - 0.1% |
Diversified Telecommunication Services - 0.1% |
Level 3 Communications, Inc. 7% 3/15/15 (Cost $17,000) | | $ 17,000 | |
20,145
|
Money Market Funds - 5.0% |
| Shares | | Value (000s) |
Fidelity Cash Central Fund, 0.12% (b) | 568,837,112 | | $ 568,837 |
Fidelity Securities Lending Cash Central Fund, 0.12% (b)(c) | 190,470,963 | | 190,471 |
TOTAL MONEY MARKET FUNDS (Cost $759,308) |
759,308
|
TOTAL INVESTMENT PORTFOLIO - 101.4% (Cost $16,118,610) | | 15,418,986 |
NET OTHER ASSETS (LIABILITIES) - (1.4)% | | (220,149) |
NET ASSETS - 100% | $ 15,198,837 |
Legend |
(a) Non-income producing |
(b) Affiliated fund that is available only to investment companies and other accounts managed by Fidelity Investments. The rate quoted is the annualized seven-day yield of the fund at period end. A complete unaudited listing of the fund's holdings as of its most recent quarter end is available upon request. In addition, each Fidelity Central Fund's financial statements, which are not covered by the Fund's Report of Independent Registered Public Accounting Firm, are available on the SEC's website or upon request. |
(c) Investment made with cash collateral received from securities on loan. |
(d) Security or a portion of the security is on loan at period end. |
(e) Affiliated company |
(f) Security exempt from registration under Rule 144A of the Securities Act of 1933. These securities may be resold in transactions exempt from registration, normally to qualified institutional buyers. At the end of the period, the value of these securities amounted to $1,179,000 or 0.0% of net assets. |
(g) Investment is owned by an entity that is treated as a corporation for U.S. tax purposes which is owned by the Fund. |
(h) Restricted securities - Investment in securities not registered under the Securities Act of 1933 (excluding 144A issues). At the end of the period, the value of restricted securities (excluding 144A issues) amounted to $41,465,000 or 0.3% of net assets. |
Additional information on each restricted holding is as follows: |
Security | Acquisition Date | Acquisition Cost (000s) |
Rialto Real Estate Fund LP | 2/24/11 - 6/22/11 | $ 41,200 |
Affiliated Central Funds |
Information regarding fiscal year to date income earned by the Fund from investments in Fidelity Central Funds is as follows: |
Fund | Income earned
(Amount in thousands) |
Fidelity Cash Central Fund | $ 136 |
Fidelity Securities Lending Cash Central Fund | 8,781 |
Total | $ 8,917 |
Other Affiliated Issuers |
An affiliated company is a company in which the Fund has ownership of at least 5% of the voting securities. Fiscal year to date transactions with companies which are or were affiliates are as follows: |
Affiliate
(Amount in thousands) | Value, beginning of period | Purchases | Sales Proceeds | Dividend Income | Value,
end of
period |
Applied Materials, Inc. | $ 1,033,881 | $ - | $ 743,268 | $ 6,755 | $ - |
Brookdale Senior Living, Inc. | 301,255 | - | 135,567 | - | - |
D.R. Horton, Inc. | 186,271 | - | 36,880 | 1,199 | - |
eAccess Ltd. | 87,922 | 37,724 | 63,273 | 552 | - |
Eagle Materials, Inc. | 81,820 | - | 19,401 | 457 | - |
EnerSys | 107,178 | - | 11,425 | - | - |
Equifax, Inc. | 290,802 | - | 262,158 | 1,038 | - |
Greatbatch, Inc. | 61,342 | - | 29,936 | - | - |
Integra LifeSciences Holdings Corp. | 71,130 | - | 3,339 | - | 50,393 |
KB Home | 50,855 | - | 25,102 | 511 | - |
MYR Group, Inc. | 24,807 | - | - | - | 18,294 |
Peak Sport Products Co. Ltd. | 40,201 | 52,998 | 2,976 | 2,127 | 32,077 |
PT Lippo Karawaci Tbk | 86,026 | 10,081 | 2,256 | - | 101,817 |
Rialto Real Estate Fund LP | 19,805 | 20,672 | - | 297 | 41,465 |
Terreno Realty Corp. | 17,230 | - | 2,496 | 190 | 10,764 |
The St. Joe Co. | 171,830 | 37,508 | 24,885 | - | 102,807 |
Toll Brothers, Inc. | 254,105 | - | 91,716 | - | - |
United Natural Foods, Inc. | 200,226 | - | 36,847 | - | 130,157 |
Total | $ 3,086,686 | $ 158,983 | $ 1,491,525 | $ 13,126 | $ 487,774 |
Other Information |
The following is a summary of the inputs used, as of September 30, 2011, involving the Fund's assets and liabilities carried at fair value. The inputs or methodology used for valuing securities may not be an indication of the risk associated with investing in those securities. For more information on valuation inputs, and their aggregation into the levels used in the tables below, please refer to the Security Valuation section in the accompanying Notes to Financial Statements. |
Valuation Inputs at Reporting Date: |
Description
(Amounts in thousands) | Total | Level 1 | Level 2 | Level 3 |
Investments in Securities: | | | | |
Equities: | | | | |
Consumer Discretionary | $ 1,885,229 | $ 1,852,880 | $ 32,349 | $ - |
Consumer Staples | 1,315,944 | 1,256,994 | 58,950 | - |
Energy | 1,722,532 | 1,722,532 | - | - |
Financials* | 1,894,868 | 1,670,455 | 182,948 | 41,465 |
Health Care | 1,591,446 | 1,591,446 | - | - |
Industrials | 1,644,488 | 1,643,556 | 932 | - |
Information Technology | 3,486,287 | 3,470,351 | 15,936 | - |
Materials | 772,973 | 738,712 | 34,261 | - |
Telecommunication Services | 212,144 | 212,144 | - | - |
Utilities | 113,622 | 113,233 | 389 | - |
Corporate Bonds | 20,145 | - | 20,145 | - |
Money Market Funds | 759,308 | 759,308 | - | - |
Total Investments in Securities: | $ 15,418,986 | $ 15,031,611 | $ 345,910 | $ 41,465 |
* The fund has an unfunded commitment of $8,799 outstanding as of period end. |
The following is a reconciliation of Investments in Securities for which Level 3 inputs were used in determining value: |
(Amounts in thousands) | |
Investments in Securities: | |
Beginning Balance | $ 19,805 |
Total Realized Gain (Loss) | - |
Total Unrealized Gain (Loss) | 988 |
Cost of Purchases | 20,672 |
Proceeds of Sales | - |
Amortization/Accretion | - |
Transfers in to Level 3 | - |
Transfers out of Level 3 | - |
Ending Balance | $ 41,465 |
The change in unrealized gain (loss) for the period attributable to Level 3 securities held at September 30, 2011 | $ 988 |
The information used in the above reconciliation represents fiscal year to date activity for any Investments in Securities identified as using Level 3 inputs at either the beginning or the end of the current fiscal period. Transfers in or out of Level 3 represent the beginning value of any Security or Instrument where a change in the pricing level occurred from the beginning to the end of the period. The cost of purchases and the proceeds of sales may include securities received or delivered through corporate actions or exchanges. Realized and unrealized gains (losses) disclosed in the reconciliation are included in Net Gain (Loss) on the Fund's Statement of Operations. |
Distribution of investments by country of issue, as a percentage of total net assets, is as follows: (Unaudited) |
United States of America | 83.8% |
Ireland | 2.6% |
United Kingdom | 1.8% |
Canada | 1.7% |
Switzerland | 1.3% |
France | 1.1% |
Cayman Islands | 1.0% |
Others (Individually Less Than 1%) | 6.7% |
| 100.0% |
Income Tax Information |
At March 31, 2011, the Fund had a capital loss carryforward of approximately $2,608,735,000 of which $1,147,795,000 and $1,460,940,000 will expire in fiscal 2017 and 2018, respectively. Capital loss carryforwards are only available to offset future capital gains of the Fund to the extent provided by regulations and may be limited. |
See accompanying notes which are an integral part of the financial statements.
Semiannual Report
Statement of Assets and Liabilities
Amounts in thousands (except per-share amounts) | September 30, 2011 |
| | |
Assets | | |
Investment in securities, at value (including securities loaned of $178,381) - See accompanying schedule: Unaffiliated issuers (cost $14,770,399) | $ 14,171,904 | |
Fidelity Central Funds (cost $759,308) | 759,308 | |
Other affiliated issuers (cost $588,903) | 487,774 | |
Total Investments (cost $16,118,610) | | $ 15,418,986 |
Cash | | 1,717 |
Foreign currency held at value (cost $2,401) | | 2,403 |
Receivable for investments sold | | 1,059,267 |
Receivable for fund shares sold | | 5,751 |
Dividends receivable | | 11,223 |
Interest receivable | | 49 |
Distributions receivable from Fidelity Central Funds | | 1,325 |
Other receivables | | 1,946 |
Total assets | | 16,502,667 |
| | |
Liabilities | | |
Payable for investments purchased | $ 1,083,669 | |
Payable for fund shares redeemed | 21,207 | |
Accrued management fee | 4,425 | |
Other affiliated payables | 2,509 | |
Other payables and accrued expenses | 1,549 | |
Collateral on securities loaned, at value | 190,471 | |
Total liabilities | | 1,303,830 |
| | |
Net Assets | | $ 15,198,837 |
Net Assets consist of: | | |
Paid in capital | | $ 17,604,503 |
Undistributed net investment income | | 59,624 |
Accumulated undistributed net realized gain (loss) on investments and foreign currency transactions | | (1,765,593) |
Net unrealized appreciation (depreciation) on investments and assets and liabilities in foreign currencies | | (699,697) |
Net Assets | | $ 15,198,837 |
See accompanying notes which are an integral part of the financial statements.
Semiannual Report
Financial Statements - continued
Statement of Assets and Liabilities - continued
Amounts in thousands (except per-share amounts) | September 30, 2011 |
| | |
Magellan:
Net Asset Value, offering price and redemption price per share ($12,750,569 ÷ 217,654 shares) | | $ 58.58 |
| | |
Class K:
Net Asset Value, offering price and redemption price per share ($2,448,268 ÷ 41,805 shares) | | $ 58.56 |
See accompanying notes which are an integral part of the financial statements.
Semiannual Report
Statement of Operations
Amounts in thousands | Six months ended September 30, 2011 |
| | |
Investment Income | | |
Dividends (including $13,126 earned from other affiliated issuers) | | $ 102,835 |
Interest | | 868 |
Income from Fidelity Central Funds (including $8,781 from security lending) | | 8,917 |
Total income | | 112,620 |
| | |
Expenses | | |
Management fee
Basic fee | $ 55,165 | |
Performance adjustment | (22,669) | |
Transfer agent fees | 15,792 | |
Accounting and security lending fees | 887 | |
Custodian fees and expenses | 375 | |
Independent trustees' compensation | 61 | |
Depreciation in deferred trustee compensation account | (4) | |
Registration fees | 60 | |
Audit | 108 | |
Legal | 62 | |
Interest | 3 | |
Miscellaneous | 118 | |
Total expenses before reductions | 49,958 | |
Expense reductions | (1,232) | 48,726 |
Net investment income (loss) | | 63,894 |
Realized and Unrealized Gain (Loss) Net realized gain (loss) on: | | |
Investment securities: | | |
Unaffiliated issuers | 1,119,003 | |
Other affiliated issuers | (233,278) | |
Foreign currency transactions | (5,066) | |
Total net realized gain (loss) | | 880,659 |
Change in net unrealized appreciation (depreciation) on: Investment securities | (5,515,612) | |
Assets and liabilities in foreign currencies | (174) | |
Total change in net unrealized appreciation (depreciation) | | (5,515,786) |
Net gain (loss) | | (4,635,127) |
Net increase (decrease) in net assets resulting from operations | | $ (4,571,233) |
See accompanying notes which are an integral part of the financial statements.
Semiannual Report
Financial Statements - continued
Statement of Changes in Net Assets
Amounts in thousands | Six months ended September 30, 2011 | Year ended
March 31,
2011 |
Increase (Decrease) in Net Assets | | |
Operations | | |
Net investment income (loss) | $ 63,894 | $ 192,681 |
Net realized gain (loss) | 880,659 | 163,889 |
Change in net unrealized appreciation (depreciation) | (5,515,786) | 2,240,186 |
Net increase (decrease) in net assets resulting
from operations | (4,571,233) | 2,596,756 |
Distributions to shareholders from net investment income | (25,945) | (183,103) |
Distributions to shareholders from net realized gain | (6,512) | (23,072) |
Total distributions | (32,457) | (206,175) |
Share transactions - net increase (decrease) | (3,078,752) | (4,632,398) |
Total increase (decrease) in net assets | (7,682,442) | (2,241,817) |
| | |
Net Assets | | |
Beginning of period | 22,881,279 | 25,123,096 |
End of period (including undistributed net investment income of $59,624 and undistributed net investment income of $21,675, respectively) | $ 15,198,837 | $ 22,881,279 |
See accompanying notes which are an integral part of the financial statements.
Semiannual Report
Financial Highlights - Magellan
| Six months ended September 30, | Years ended March 31, |
| 2011 | 2011 | 2010 | 2009 | 2008 | 2007 |
Selected Per-Share Data | | | | | | |
Net asset value, beginning of period | $ 75.56 | $ 67.56 | $ 44.63 | $ 82.26 | $ 91.32 | $ 112.80 |
Income from Investment Operations | | | | | | |
Net investment income (loss) D | .22 | .56 G | .29 | .32 | .34 | .37 |
Net realized and unrealized gain (loss) | (17.09) | 8.05 | 23.02 | (34.98) | 2.72 | 3.31 |
Total from investment operations | (16.87) | 8.61 | 23.31 | (34.66) | 3.06 | 3.68 |
Distributions from net investment income | (.08) | (.54) | (.36) | (.11) | (.44) | (.50) |
Distributions from net realized gain | (.02) | (.07) | (.02) | (2.86) | (11.68) | (24.66) |
Total distributions | (.11) I | (.61) | (.38) | (2.97) | (12.12) | (25.16) |
Net asset value, end of period | $ 58.58 | $ 75.56 | $ 67.56 | $ 44.63 | $ 82.26 | $ 91.32 |
Total Return B,C | (22.36)% | 12.82% | 52.33% | (43.81)% | 2.08% | 3.21% |
Ratios to Average Net Assets E,H | | | | | |
Expenses before reductions | .53% A | .60% | .75% | .71% | .73% | .54% |
Expenses net of fee waivers, if any | .53% A | .60% | .75% | .71% | .73% | .54% |
Expenses net of all reductions | .51% A | .59% | .74% | .71% | .72% | .53% |
Net investment income (loss) | .63% A | .83% G | .49% | .51% | .37% | .41% |
Supplemental Data | | | | | | |
Net assets, end of period (in millions) | $ 12,751 | $ 19,398 | $ 22,628 | $ 17,225 | $ 38,322 | $ 43,155 |
Portfolio turnover rate F | 102% A | 42% | 39% | 67% | 57% | 41% |
A Annualized
B Total returns for periods of less than one year are not annualized.
C Total returns would have been lower if certain expenses had not been reduced during the applicable periods shown.
D Calculated based on average shares outstanding during the period.
E Fees and expenses of any underlying Fidelity Central Funds are not included in the Fund's expense ratio. The Fund indirectly bears its proportionate share of the expenses of any underlying Fidelity Central Funds.
F Amount does not include the portfolio activity of any underlying Fidelity Central Funds.
G Investment income per share reflects a special dividend which amounted to $.13 per share. Excluding the special dividend, the ratio of net investment income (loss) to average net assets would have been .63%.
H Expense ratios reflect operating expenses of the class. Expenses before reductions do not reflect amounts reimbursed by the investment adviser or reductions from brokerage service arrangements or reductions from other expense offset arrangements and do not represent the amount paid by the class during periods when reimbursements or reductions occur. Expenses net of fee waivers reflect expenses after reimbursement by the investment adviser but prior to reductions from brokerage service arrangements or other expense offset arrangements. Expenses net of all reductions represent the net expenses paid by the class.
I Total distributions of $.11 per share is comprised of distributions from net investment income of $.084 and distributions from net realized gain of $.022 per share.
See accompanying notes which are an integral part of the financial statements.
Semiannual Report
Financial Highlights - Class K
| Six months ended September 30, | Years ended March 31, |
| 2011 | 2011 | 2010 | 2009 H |
Selected Per-Share Data | | | | |
Net asset value, beginning of period | $ 75.51 | $ 67.53 | $ 44.61 | $ 85.82 |
Income from Investment Operations | | | | |
Net investment income (loss) D | .27 | .65 G | .38 | .30 |
Net realized and unrealized gain (loss) | (17.09) | 8.04 | 23.02 | (41.32) |
Total from investment operations | (16.82) | 8.69 | 23.40 | (41.02) |
Distributions from net investment income | (.11) | (.64) | (.46) | (.19) |
Distributions from net realized gain | (.02) | (.07) | (.02) | - |
Total distributions | (.13) | (.71) | (.48) | (.19) |
Net asset value, end of period | $ 58.56 | $ 75.51 | $ 67.53 | $ 44.61 |
Total Return B,C | (22.31)% | 12.97% | 52.59% | (47.79)% |
Ratios to Average Net Assets E,I | | | | |
Expenses before reductions | .40% A | .46% | .59% | .55% A |
Expenses net of fee waivers, if any | .40% A | .46% | .59% | .55% A |
Expenses net of all reductions | .39% A | .46% | .58% | .55% A |
Net investment income (loss) | .76% A | .97% G | .65% | .79% A |
Supplemental Data | | | | |
Net assets, end of period (in millions) | $ 2,448 | $ 3,483 | $ 2,495 | $ 1,415 |
Portfolio turnover rate F | 102% A | 42% | 39% | 67% |
A Annualized
B Total returns for periods of less than one year are not annualized.
C Total returns would have been lower if certain expenses had not been reduced during the applicable periods shown.
D Calculated based on average shares outstanding during the period.
E Fees and expenses of any underlying Fidelity Central Funds are not included in the Fund's expense ratio. The Fund indirectly bears its proportionate share of the expenses of any underlying Fidelity Central Funds.
F Amount does not include the portfolio activity of any underlying Fidelity Central Funds.
G Investment income per share reflects a special dividend which amounted to $.13 per share. Excluding the special dividend, the ratio of net investment income (loss) to average net assets would have been .77%.
H For the period May 9, 2008 (commencement of sale of shares) to March 31, 2009.
I Expense ratios reflect operating expenses of the class. Expenses before reductions do not reflect amounts reimbursed by the investment adviser or reductions from brokerage service arrangements or reductions from other expense offset arrangements and do not represent the amount paid by the class during periods when reimbursements or reductions occur. Expense ratios before reductions for start-up periods may not be representative of longer-term operating periods. Expenses net of fee waivers reflect expenses after reimbursement by the investment adviser but prior to reductions from brokerage service arrangements or other expense offset arrangements. Expenses net of all reductions represent the net expenses paid by the class.
See accompanying notes which are an integral part of the financial statements.
Semiannual Report
Notes to Financial Statements
For the period ended September 30, 2011
(Amounts in thousands except percentages)
1. Organization.
Fidelity® Magellan® Fund (the Fund) is a fund of Fidelity Magellan Fund (the Trust) and is authorized to issue an unlimited number of shares. The Trust is registered under the Investment Company Act of 1940, as amended (the 1940 Act), as an open-end management investment company organized as a Massachusetts business trust. The Fund offers Magellan and Class K, shares, each of which has equal rights as to assets and voting privileges. Each class has exclusive voting rights with respect to matters that affect that class. Investment income, realized and unrealized capital gains and losses, the common expenses of the Fund, and certain fund-level expense reductions, if any, are allocated on a pro-rata basis to each class based on the relative net assets of each class to the total net assets of the Fund. Each class differs with respect to transfer agent fees incurred. Certain expense reductions may also differ by class.
2. Investments in Fidelity Central Funds.
The Fund invests in Fidelity Central Funds, which are open-end investment companies available only to other investment companies and accounts managed by Fidelity Management & Research Company (FMR) and its affiliates. The Fund's Schedule of Investments lists each of the Fidelity Central Funds held as of period end, if any, as an investment of the Fund, but does not include the underlying holdings of each Fidelity Central Fund. As an Investing Fund, the Fund indirectly bears its proportionate share of the expenses of the underlying Fidelity Central Funds.
The Money Market Central Funds seek preservation of capital and current income and are managed by Fidelity Investments Money Management, Inc. (FIMM), an affiliate of FMR.
A complete unaudited list of holdings for each Fidelity Central Fund is available upon request or at the Securities and Exchange Commission (the SEC) web site at www.sec.gov. In addition, the financial statements of the Fidelity Central Funds, which are not covered by the Fund's Report of Independent Registered Public Accounting Firm are available on the SEC web site or upon request.
3. Significant Accounting Policies.
The financial statements have been prepared in conformity with accounting principles generally accepted in the United States of America (GAAP), which require management to make certain estimates and assumptions at the date of the financial statements. Actual results could differ from those estimates. Subsequent events, if any, through the date that the financial statements were issued have been evaluated in the preparation of the financial statements. The following summarizes the significant accounting policies of the Fund:
Semiannual Report
Notes to Financial Statements - continued
(Amounts in thousands except percentages)
3. Significant Accounting Policies - continued
Security Valuation. Investments are valued as of 4:00 p.m. Eastern time on the last calendar day of the period. The Fund uses independent pricing services approved by the Board of Trustees to value its investments. When current market prices or quotations are not readily available or reliable, valuations may be determined in good faith in accordance with procedures adopted by the Board of Trustees. Factors used in determining value may include market or security specific events, changes in interest rates and credit quality. The frequency with which these procedures are used cannot be predicted and they may be utilized to a significant extent. The value used for net asset value (NAV) calculation under these procedures may differ from published prices for the same securities.
The Fund categorizes the inputs to valuation techniques used to value its investments into a disclosure hierarchy consisting of three levels as shown below:
Level 1 - quoted prices in active markets for identical investments
Level 2 - other significant observable inputs (including quoted prices for similar investments, interest rates, prepayment speeds, etc.)
Level 3 - unobservable inputs (including the Fund's own assumptions based on the best information available)
Changes in valuation techniques may result in transfers in or out of an assigned level within the disclosure hierarchy. The aggregate value of investments by input level, as of September 30, 2011, as well as a roll forward of Level 3 securities, is included at the end of the Fund's Schedule of Investments. Valuation techniques used to value the Fund's investments by major category are as follows:
Equity securities, including restricted securities, for which market quotations are readily available, are valued at the last reported sale price or official closing price as reported by an independent pricing service on the primary market or exchange on which they are traded and are categorized as Level 1 in the hierarchy. In the event there were no sales during the day or closing prices are not available, securities are valued at the last quoted bid price or may be valued using the last available price and are generally categorized as Level 2 in the hierarchy. For foreign equity securities, when significant market or security specific events arise, comparisons to the valuation of American Depositary Receipts (ADRs), futures contracts, Exchange-traded funds (ETFs) and certain indexes as well as quoted prices for similar securities are used and are categorized as Level 2 in the hierarchy in these circumstances. Utilizing these techniques may result in transfers between Level 1 and Level 2. For restricted equity securities and private placements where observable inputs are limited, assumptions about market activity and risk are used and are categorized as Level 3 in the hierarchy.
Semiannual Report
3. Significant Accounting Policies - continued
Security Valuation - continued
Debt securities, including restricted securities, are valued based on evaluated prices received from independent pricing services or from dealers who make markets in such securities. For corporate bonds, pricing services utilize matrix pricing which considers yield or price of bonds of comparable quality, coupon, maturity and type as well as dealer supplied prices and are generally categorized as Level 2 in the hierarchy. When independent prices are unavailable or unreliable, debt securities may be valued utilizing pricing matrices which consider similar factors that would be used by independent pricing services. These are generally categorized as Level 2 in the hierarchy but may be Level 3 depending on the circumstances.
Investments in open-end mutual funds, including the Fidelity Central Funds, are valued at their closing net asset value each business day and are categorized as Level 1 in the hierarchy.
Foreign Currency. The Fund may use foreign currency contracts to facilitate transactions in foreign-denominated securities. Gains and losses from these transactions may arise from changes in the value of the foreign currency or if the counterparties do not perform under the contracts' terms.
Foreign-denominated assets, including investment securities, and liabilities are translated into U.S. dollars at the exchange rate at period end. Purchases and sales of investment securities, income and dividends received and expenses denominated in foreign currencies are translated into U.S. dollars at the exchange rate in effect on the transaction date.
The effects of exchange rate fluctuations on investments are included with the net realized and unrealized gain (loss) on investment securities. Other foreign currency transactions resulting in realized and unrealized gain (loss) are disclosed separately.
Investment Transactions and Income. For financial reporting purposes, the Fund's investment holdings and NAV include trades executed through the end of the last business day of the period. The NAV per share for processing shareholder transactions is calculated as of the close of business of the New York Stock Exchange (NYSE), normally 4:00 p.m. Eastern time and includes trades executed through the end of the prior business day. Gains and losses on securities sold are determined on the basis of identified cost and may include proceeds received from litigation. Dividend income is recorded on the ex-dividend date, except for certain dividends from foreign securities where the ex-dividend date may have passed, which are recorded as soon as the Fund is informed of the ex-dividend date. Non-cash dividends included in dividend income, if any, are recorded at the fair market value of the securities received. Distributions received on securities that represent a return of capital or capital gain are recorded as a reduction of
Semiannual Report
Notes to Financial Statements - continued
(Amounts in thousands except percentages)
3. Significant Accounting Policies - continued
Investment Transactions and Income - continued
cost of investments and/or as a realized gain. The Fund estimates the components of distributions received that may be considered return of capital distributions or capital gain distributions. Interest income and distributions from the Fidelity Central Funds are accrued as earned. Interest income includes coupon interest and amortization of premium and accretion of discount on debt securities. Investment income is recorded net of foreign taxes withheld where recovery of such taxes is uncertain.
Expenses. Expenses directly attributable to a fund are charged to that fund. Expenses attributable to more than one fund are allocated among the respective funds on the basis of relative net assets or other appropriate methods. Expense estimates are accrued in the period to which they relate and adjustments are made when actual amounts are known.
Deferred Trustee Compensation. Under a Deferred Compensation Plan (the Plan), independent Trustees may elect to defer receipt of a portion of their annual compensation. Deferred amounts are invested in a cross-section of Fidelity funds, are marked-to-market and remain in the Fund until distributed in accordance with the Plan. The investment of deferred amounts and the offsetting payable to the Trustees are included in the accompanying Statement of Assets and Liabilities.
Income Tax Information and Distributions to Shareholders. Each year, the Fund intends to qualify as a regulated investment company, including distributing substantially all of its taxable income and realized gains under Subchapter M of the Internal Revenue Code and filing its U.S. federal tax return. As a result, no provision for income taxes is required. A fund's federal tax return is subject to examination by the Internal Revenue Service (IRS) for a period of three years. Foreign taxes are provided for based on the Fund's understanding of the tax rules and rates that exist in the foreign markets in which it invests.
Distributions are declared and recorded on the ex-dividend date. Income dividends and capital gain distributions are declared separately for each class. Income and capital gain distributions are determined in accordance with income tax regulations, which may differ from GAAP.
Capital accounts within the financial statements are adjusted for permanent book-tax differences. These adjustments have no impact on net assets or the results of operations. Temporary book-tax differences will reverse in a subsequent period.
Book-tax differences are primarily due to foreign currency transactions, equity-debt classifications, passive foreign investment companies (PFIC), partnerships, deferred trustees compensation, capital loss carryforwards and losses due to wash sales and excise tax regulations.
Semiannual Report
3. Significant Accounting Policies - continued
Income Tax Information and Distributions to Shareholders - continued
The federal tax cost of investment securities and unrealized appreciation (depreciation) as of period end.
Gross unrealized appreciation | $ 1,460,073 |
Gross unrealized depreciation | (2,161,676) |
Net unrealized appreciation (depreciation) on securities and other investments | $ (701,603) |
| |
Tax cost | $ 16,120,589 |
Under the recently enacted Regulated Investment Company Modernization Act of 2010 (the Act), the Fund will be permitted to carry forward capital losses incurred in taxable years beginning after December 22, 2010 for an unlimited period. However, any losses incurred during those future taxable years will be required to be utilized prior to any losses incurred in pre-enactment taxable years, which generally expire after eight years from when they are incurred. Additionally, post-enactment capital losses that are carried forward will retain their character as either short-term or long-term capital losses rather than being considered all short-term as under previous law. The Fund's first fiscal year end subject to the Act will be March 31, 2012.
New Accounting Pronouncement. In May 2011, the Financial Accounting Standards Board issued Accounting Standard Update No. 2011-04, Fair Value Measurement (Topic 820) - Amendments to Achieve Common Fair Value Measurement and Disclosure Requirements in U.S. GAAP and IFRSs. The update changes the wording used to describe the requirements in GAAP for measuring fair value and for disclosing information about fair value measurements. The update is effective during interim and annual periods beginning after December 15, 2011. Management is currently evaluating the impact of the update's adoption on the Fund's financial statement disclosures.
4. Operating Policies.
Restricted Securities. The Fund may invest in securities that are subject to legal or contractual restrictions on resale. These securities generally may be resold in transactions exempt from registration or to the public if the securities are registered. Disposal of these securities may involve time-consuming negotiations and expense, and prompt sale at an acceptable price may be difficult. Information regarding restricted securities is included at the end of the Fund's Schedule of Investments.
Semiannual Report
Notes to Financial Statements - continued
(Amounts in thousands except percentages)
5. Purchases and Sales of Investments.
Purchases and sales of securities, other than short-term securities, aggregated $10,153,618 and $13,513,025, respectively.
6. Fees and Other Transactions with Affiliates.
Management Fee. FMR and its affiliates provide the Fund with investment management related services for which the Fund pays a monthly management fee. The management fee is the sum of an individual fund fee rate that is based on an annual rate of .30% of the Fund's average net assets and a group fee rate that averaged .26% during the period. The group fee rate is based upon the average net assets of all the mutual funds advised by FMR. The group fee rate decreases as assets under management increase and increases as assets under management decrease. In addition, the management fee is subject to a performance adjustment (up to a maximum of ± .20% of the Fund's average net assets over a 36 month performance period). The upward or downward adjustment to the management fee is based on the relative investment performance of the retail class of the Fund, Magellan, as compared to an appropriate benchmark index. For the period, the total annualized management fee rate, including the performance adjustment, was .33% of the Fund's average net assets.
Transfer Agent Fees. Fidelity Investments Institutional Operations Company, Inc. (FIIOC), an affiliate of FMR, is the transfer, dividend disbursing and shareholder servicing agent for each class of the Fund. FIIOC receives account fees and asset-based fees that vary according to the account size and type of account of the shareholders of Magellan. FIIOC receives an asset-based fee of Class K's average net assets. FIIOC pays for typesetting, printing and mailing of shareholder reports, except proxy statements. For the period, transfer agent fees for each class were as follows:
| Amount | % of
Average
Net Assets* |
Magellan | 14,984 | .18 |
Class K | 808 | .05 |
| $ 15,792 | |
* Annualized
Accounting and Security Lending Fees. Fidelity Service Company, Inc. (FSC), an affiliate of FMR, maintains the Fund's accounting records. The accounting fee is based on the level of average net assets for the month. Under a separate contract, FSC administers the security lending program. The security lending fee is based on the number and duration of lending transactions.
Semiannual Report
6. Fees and Other Transactions with Affiliates - continued
Brokerage Commissions. The Fund placed a portion of its portfolio transactions with brokerage firms which are affiliates of the investment adviser. The commissions paid to these affiliated firms were $503 for the period.
Interfund Lending Program. Pursuant to an Exemptive Order issued by the SEC, the Fund, along with other registered investment companies having management contracts with FMR, may participate in an interfund lending program. This program provides an alternative credit facility allowing the funds to borrow from, or lend money to, other participating affiliated funds. At period end, there were no interfund loans outstanding. The Fund's activity in this program during the period for which loans were outstanding was as follows:
Borrower or Lender | Average Daily
Loan Balance | Weighted Average Interest Rate | Interest
Expense |
Borrower | $ 37,329 | .35% | $ 3 |
7. Committed Line of Credit.
The Fund participates with other funds managed by FMR or an affiliate in a $4.0 billion credit facility (the "line of credit") to be utilized for temporary or emergency purposes to fund shareholder redemptions or for other short-term liquidity purposes. The Fund has agreed to pay commitment fees on its pro-rata portion of the line of credit, which amounted to $15 and is reflected in Miscellaneous expenses on the Statement of Operations. During the period, there were no borrowings on this line of credit.
8. Security Lending.
The Fund lends portfolio securities through a lending agent from time to time in order to earn additional income. The lending agent may loan securities to certain qualified borrowers, including Fidelity Capital Markets (FCM), a broker-dealer affiliated with the Fund. On the settlement date of the loan, the Fund receives collateral (in the form of U.S. Treasury obligations, letters of credit and/or cash) against the loaned securities and maintains collateral in an amount not less than 100% of the market value of the loaned securities during the period of the loan. The market value of the loaned securities is determined at the close of business of the Fund and any additional required collateral is delivered to the Fund on the next business day. If the borrower defaults on its obligation to return the securities loaned because of insolvency or other reasons, a fund could experience delays and costs in recovering the securities loaned or in gaining access to the collateral. Any cash collateral received is invested in the Fidelity Securities Lending Cash Central Fund. The value of loaned securities and cash collateral at period end are disclosed on the Fund's Statement of Assets and Liabilities. The value of securities loaned to FCM at period end was $1,525. Security lending income represents the income
Semiannual Report
Notes to Financial Statements - continued
(Amounts in thousands except percentages)
8. Security Lending - continued
earned on investing cash collateral, less rebates paid to borrowers and lending agent fees associated with the loan, plus any premium payments received for lending certain types of securities. Security lending income is presented in the Statement of Operations as a component of income from Fidelity Central Funds and includes $159 from securities loaned to FCM.
9. Expense Reductions.
Many of the brokers with whom FMR places trades on behalf of the Fund provided services to the Fund in addition to trade execution. These services included payments of certain expenses on behalf of the Fund totaling $1,232 for the period. In addition, through arrangements with the Fund's custodian and each class' transfer agent, credits realized as a result of uninvested cash balances were used to reduce the Fund's expenses. During the period, these credits reduced the Fund's custody and Class K's transfer agent expenses by eighty-four dollars and two hundred eighty-five dollars, respectively.
10. Distributions to Shareholders.
Distributions to shareholders of each class were as follows:
| Six months ended
September 30,
2011 | Year ended
March 31,
2011 |
From net investment income | | |
Magellan | $ 21,075 | $ 155,880 |
Class K | 4,870 | 27,223 |
Total | $ 25,945 | $ 183,103 |
From net realized gain | | |
Magellan | $ 5,520 | $ 20,450 |
Class K | 992 | 2,622 |
Total | $ 6,512 | $ 23,072 |
11. Share Transactions.
Transactions for each class of shares were as follows:
| Shares | Dollars |
| Six months ended September 30,
2011 | Year ended
March 31,
2011 | Six months ended September 30,
2011 | Year ended
March 31,
2011 |
Magellan | | | | |
Shares sold | 3,599 | 13,052 | $ 253,578 | $ 874,215 |
Reinvestment of distributions | 340 | 2,460 | 25,553 | 169,801 |
Shares redeemed | (43,021) | (93,705) | (3,047,575) | (6,286,234) |
Net increase (decrease) | (39,082) | (78,193) | $ (2,768,444) | $ (5,242,218) |
Semiannual Report
11. Share Transactions - continued
| Shares | Dollars |
| Six months ended September 30,
2011 | Year ended
March 31,
2011 | Six months ended September 30,
2011 | Year ended
March 31,
2011 |
Class K | | | | |
Shares sold | 5,282 | 21,632 | $ 367,768 | $ 1,466,317 |
Reinvestment of distributions | 78 | 432 | 5,862 | 29,845 |
Shares redeemed | (9,688) | (12,884) | (683,938) | (886,342) |
Net increase (decrease) | (4,328) | 9,180 | $ (310,308) | $ 609,820 |
12. Other.
The Fund's organizational documents provide former and current trustees and officers with a limited indemnification against liabilities arising in connection with the performance of their duties to the Fund. In the normal course of business, the Fund may also enter into contracts that provide general indemnifications. The Fund's maximum exposure under these arrangements is unknown as this would be dependent on future claims that may be made against the Fund. The risk of material loss from such claims is considered remote.
Semiannual Report
To the Trustees and Shareholders of Fidelity Magellan Fund:
In our opinion, the accompanying statement of assets and liabilities, including the schedule of investments, and the related statements of operations and of changes in net assets and the financial highlights present fairly, in all material respects, the financial position of Fidelity Magellan Fund at September 30, 2011, the results of its operations, the changes in its net assets and the financial highlights for each of the periods indicated, in conformity with accounting principles generally accepted in the United States of America. These financial statements and financial highlights (hereafter referred to as "financial statements") are the responsibility of the Fidelity Magellan Fund's management. Our responsibility is to express an opinion on these financial statements based on our audits. We conducted our audits of these financial statements in accordance with the standards of the Public Company Accounting Oversight Board (United States). Those standards require that we plan and perform the audit to obtain reasonable assurance about whether the financial statements are free of material misstatement. An audit includes examining, on a test basis, evidence supporting the amounts and disclosures in the financial statements, assessing the accounting principles used and significant estimates made by management, and evaluating the overall financial statement presentation. We believe that our audits, which included confirmation of securities at September 30, 2011 by correspondence with the custodian and brokers, provide a reasonable basis for our opinion.
/s/ PricewaterhouseCoopers LLP
PricewaterhouseCoopers LLP
Boston, Massachusetts
November 10, 2011
Semiannual Report
Board Approval of Investment Advisory Contracts and Management Fees
Fidelity Magellan Fund
Each year, the Board of Trustees, including the Independent Trustees (together, the Board), votes on the renewal of the management contract and sub-advisory agreements (together, the Advisory Contracts) for the fund. The Board, assisted by the advice of fund counsel and Independent Trustees' counsel, requests and considers a broad range of information relevant to the renewal of the Advisory Contracts throughout the year.
The Board meets regularly and considers at each of its meetings factors that are relevant to its annual consideration of the renewal of the fund's Advisory Contracts, including the services and support provided to the fund and its shareholders. The Board has established various standing committees, each composed of Independent Trustees with varying backgrounds, to which the Board has assigned specific subject matter responsibilities in order to enhance effective decision-making by the Board. The Board, acting directly and through its Committees, requests and receives information concerning the annual consideration of the renewal of the fund's Advisory Contracts. The Board also meets as needed to consider matters specifically related to the Board's annual consideration of the renewal of Advisory Contracts. Members of the Board may also meet with trustees of other Fidelity funds through ad hoc joint committees to discuss certain matters relevant to the Fidelity funds.
At its July 2011 meeting, the Board of Trustees, including the Independent Trustees, unanimously determined to renew the fund's Advisory Contracts. In reaching its determination, the Board considered all factors it believed relevant, including (i) the nature, extent, and quality of the services to be provided to the fund and its shareholders (including the investment performance of the fund); (ii) the competitiveness of the fund's management fee and total expense ratio; (iii) the total costs of the services to be provided by and the profits to be realized by Fidelity from its relationship with the fund; (iv) the extent to which economies of scale would be realized as the fund grows; and (v) whether fee levels reflect these economies of scale, if any, for the benefit of fund shareholders.
In considering whether to renew the Advisory Contracts for the fund, the Board reached a determination, with the assistance of fund counsel and Independent Trustees' counsel and through the exercise of its business judgment, that the renewal of the Advisory Contracts is in the best interests of the fund and its shareholders and that the compensation payable under the Advisory Contracts is fair and reasonable. The Board's decision to renew the Advisory Contracts was not based on any single factor, but rather was based on a comprehensive consideration of all the information provided to the Board at its meetings throughout the year. The Board, in reaching its determination to renew the Advisory Contracts, is aware that shareholders in the fund have a broad range of investment choices available to them, including a wide choice among mutual funds offered by Fidelity's competitors, and that the fund's shareholders, who have the opportunity to review and weigh the disclosure provided by the fund in its prospectus and other public disclosures, have chosen to invest in this fund, managed by Fidelity.
Semiannual Report
Nature, Extent, and Quality of Services Provided. The Board considered the staffing within the investment adviser, FMR, and the sub-advisers (together, the Investment Advisers), including the backgrounds of the fund's investment personnel and the fund's investment objective and discipline. The Independent Trustees also had discussions with senior management of Fidelity's investment operations and investment groups. The Board considered the structure of the portfolio manager compensation program and whether this structure provides appropriate incentives to act in the best interests of the fund.
Resources Dedicated to Investment Management and Support Services. The Board and the Fund Oversight and Research Committees reviewed the general qualifications and capabilities of the Investment Advisers' investment staff, including its size, education, experience, and resources, as well as the Investment Advisers' approach to recruiting, training, managing, and compensating investment personnel. The Board also noted that FMR has devoted increased resources to non-U.S. offices. The Board noted that Fidelity's analysts have extensive resources, tools and capabilities which allow them to conduct sophisticated quantitative and fundamental analysis, as well as credit analysis of issuers, counterparties and enhancers. The Board also believes that Fidelity's investment professionals have sufficient access to global information and data so as to provide competitive investment results over time, and that those professionals also have access to sophisticated tools which permit them to assess portfolio construction and risk and performance attribution characteristics continuously, as well as to transmit new information and research conclusions rapidly around the world. Additionally, in their deliberations, the Board considered the Investment Advisers' trading capabilities and resources which are an integral part of the investment management process.
Shareholder and Administrative Services. The Board considered (i) the nature, extent, quality, and cost of advisory, administrative, and shareholder services performed by the Investment Advisers and their affiliates under the Advisory Contracts and under separate agreements covering transfer agency, pricing and bookkeeping, and securities lending services for the fund; (ii) the nature and extent of the investment adviser's supervision of third party service providers, principally custodians and subcustodians; and (iii) the resources devoted to, and the record of compliance with, the fund's compliance policies and procedures. The Board also reviewed the allocation of fund brokerage, including allocations to brokers affiliated with the Investment Advisers, the use of brokerage commissions to pay fund expenses, and the use of "soft" commission dollars to pay for research services.
The Board noted that the growth of fund assets over time across the complex allows Fidelity to reinvest in the development of services designed to enhance the value or convenience of the Fidelity funds as investment vehicles. These services include 24-hour access to account information and market information through telephone representatives and over the Internet, investor education materials and asset allocation tools, and the expanded availability of Fidelity Investor Centers, with 35 new branches opening since 2010.
Semiannual Report
Board Approval of Investment Advisory Contracts and
Management Fees - continued
Investment in a Large Fund Family. The Board considered the benefits to shareholders of investing in a Fidelity fund, including the benefits of investing in a fund that is part of a large family of funds offering a variety of investment disciplines and providing a large variety of mutual fund investor services. The Board noted that Fidelity had taken, or had made recommendations that resulted in the Fidelity funds taking, a number of actions over the previous year that benefited particular funds, including (i) continuing to dedicate additional resources to investment research and support of the senior management team that oversees asset management; (ii) rationalizing product lines through the mergers of six funds into other funds; (iii) continuing to migrate the Freedom Funds to dedicated lower cost underlying funds; (iv) obtaining shareholder approval to broaden the investment strategies for Fidelity Consumer Finance Portfolio, Fidelity Emerging Asia Fund, and Fidelity Environment and Alternative Energy Portfolio; (v) contractually agreeing to reduce the management fees and impose other expense limitations on Spartan 500 Index Fund and U.S. Bond Index Fund in connection with launching new institutional classes of these funds; (vi) changing the name, primary and supplemental benchmarks, and investment policies of Fidelity Global Strategies Fund to support the fund's flexible investment mandate and global orientation; and (vii) reducing the transfer agency account fee rates on certain accounts.
Investment Performance. The Board considered whether the fund has operated in accordance with its investment objective, as well as its record of compliance with its investment restrictions. It also reviewed the fund's absolute investment performance for each class, as well as the fund's relative investment performance for each class measured over multiple periods against (i) a broad-based securities market index, and (ii) a custom peer group of mutual funds deemed appropriate by Fidelity and reviewed by the Board. The following charts considered by the Board show, over the one-, three-, and five-year periods ended December 31, 2010, as available, the cumulative total returns of Class K and the retail class of the fund, the cumulative total returns of a broad-based securities market index ("benchmark"), and a range of cumulative total returns of a custom peer group of mutual funds defined by FMR based on categories assigned by Morningstar, Inc. The box within each chart shows the 25th percentile return (bottom of box) and the 75th percentile return (top of box) of the peer group. Returns shown above the box are in the first quartile and returns shown below the box are in the fourth quartile. The percentage beaten numbers noted below each chart correspond to the percentile box and represent the percentage of funds in the peer group whose performance was equal to or lower than that of the class indicated. The fund's custom peer group, defined by FMR, is a peer group that FMR believes provides a more meaningful performance comparison than the peer group assigned by Morningstar, Inc., which assigns mutual funds to categories based on their investment styles as measured by their underlying portfolio holdings.
Semiannual Report
Fidelity Magellan Fund
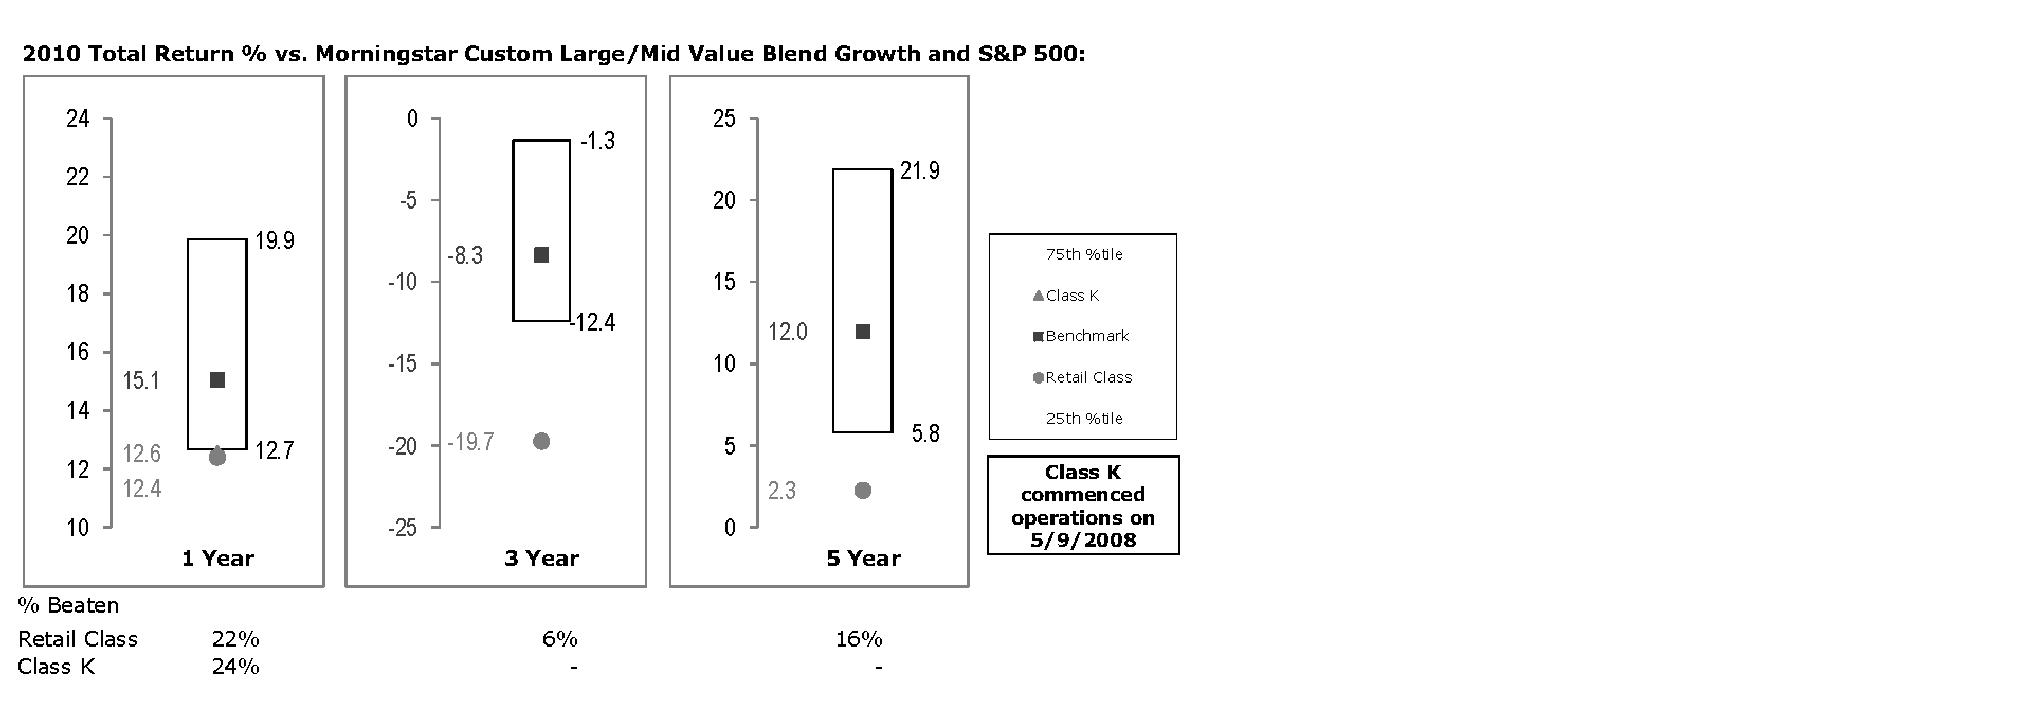
The Board reviewed the fund's relative investment performance against its peer group and noted that the performance of the retail class of the fund (the class with the longer performance record) was in the fourth quartile for all the periods shown. The Board also noted that the investment performance of the fund was lower than its benchmark for all the periods shown. The Board considered that the variations in performance between the fund's classes reflect the variations in class expenses, which result in lower performance for the higher expense class. The Board discussed with FMR actions that have been taken by FMR to improve the fund's disappointing performance relative to its peer group and benchmark. The Board also reviewed the fund's performance since inception as well as performance in the current year. The Board will continue to closely monitor the performance of the fund in the coming year and discuss with FMR other appropriate actions to address the performance of the fund.
The Board also considered that the fund's management fee is subject to upward or downward adjustment depending upon whether, and to what extent, the fund's investment performance for the performance period exceeds, or is exceeded by, the record (over the same period) of a Board-approved performance adjustment index. The Board noted that the performance adjustment provides FMR with a strong economic incentive to seek to achieve superior performance for the fund's shareholders and helps to more closely align the interests of FMR and the fund's shareholders.
Semiannual Report
Board Approval of Investment Advisory Contracts and
Management Fees - continued
Based on its review, the Board concluded that the nature, extent, and quality of services provided to the fund under the Advisory Contracts should benefit the fund's shareholders.
Competitiveness of Management Fee and Total Expense Ratio. The Board considered the fund's management fee and total expense ratio compared to "mapped groups" of competitive funds and classes. Fidelity creates "mapped groups" by combining similar Lipper investment objective categories that have comparable management fee characteristics. Combining Lipper investment objective categories aids the Board's management fee and total expense ratio comparisons by broadening the competitive group used for comparison and by reducing the number of universes to which various Fidelity funds are compared.
Management Fee. The Board considered two proprietary management fee comparisons for the 12-month periods shown in the chart below. The group of Lipper funds used by the Board for management fee comparisons is referred to below as the "Total Mapped Group." The Total Mapped Group comparison focuses on a fund's standing relative to the total universe of comparable funds available to investors in terms of gross management fees before expense reimbursements or caps, and without giving effect to the fund's performance adjustment. "TMG %" represents the percentage of funds in the Total Mapped Group that had management fees that were lower than the fund's. For example, a TMG % of 10% means that 90% of the funds in the Total Mapped Group had higher management fees than the fund. The "Asset-Size Peer Group" (ASPG) comparison focuses on a fund's standing relative to non-Fidelity funds similar in size to the fund within the Total Mapped Group. The ASPG represents at least 15% of the funds in the Total Mapped Group with comparable asset size and management fee characteristics, subject to a minimum of 50 funds (or all funds in the Total Mapped Group if fewer than 50). Additional information, such as the ASPG quartile in which the fund's management fee ranked and the impact of the fund's performance adjustment, is also included in the chart and considered by the Board.
Semiannual Report
Fidelity Magellan Fund

The Board noted that the fund's management fee ranked below the median of its Total Mapped Group and below the median of its ASPG for 2010. The Board also noted the effect of the fund's negative performance adjustment on the fund's management fee ranking. The Board noted that the performance adjustment for each year represents calculations for performance periods that differ from the periods shown in the performance charts above.
Based on its review, the Board concluded that the fund's management fee is fair and reasonable in light of the services that the fund receives and the other factors considered.
Total Expense Ratio. In its review of each class's total expense ratio, the Board considered the fund's management fee as well as other fund or class expenses, as applicable, such as transfer agent fees, pricing and bookkeeping fees, and custodial, legal, and audit fees. The Board also noted the effects of any waivers and reimbursements on fees and expenses, as well as the impact of the fund's performance adjustment. As part of its review, the Board also considered the current and historical total expense ratios of each class of the fund compared to competitive fund median expenses. Each class of the fund is compared to those funds and classes in the Total Mapped Group (used by the Board for management fee comparisons) that have a similar sales load structure.
The Board noted that the total expense ratio of each class ranked below its competitive median for 2010. The Board considered that various factors, including 12b-1 fees, positive or negative performance adjustments, and relatively higher other expenses in the case of small fund size, can affect total expense ratios.
Semiannual Report
Board Approval of Investment Advisory Contracts and
Management Fees - continued
Fees Charged to Other Fidelity Clients. The Board also considered Fidelity fee structures and other information with respect to clients of FMR and its affiliates, such as other mutual funds advised or subadvised by FMR or its affiliates, pension plan clients, and other institutional clients. In March 2010, the Board created an ad hoc joint committee with the board of other Fidelity funds (the Committee) to review and compare Fidelity's institutional investment advisory business with its business of providing services to the Fidelity funds, including the differences in services provided, fees charged, and costs incurred, as well as competition in their respective marketplaces.
Based on its review of total expense ratios and fees charged to other Fidelity clients, the Board concluded that the total expense ratio of each class of the fund was reasonable in light of the services that the fund and its shareholders receive and the other factors considered, including the findings of the Committee.
Costs of the Services and Profitability. The Board considered the revenues earned and the expenses incurred by Fidelity in conducting the business of developing, marketing, distributing, managing, administering and servicing the fund and its shareholders. The Board also considered the level of Fidelity's profits in respect of all the Fidelity funds.
On an annual basis, FMR presents to the Board Fidelity's profitability for the fund. Fidelity calculates the profitability for each fund, as well as aggregate profitability for groups of Fidelity funds and all Fidelity funds, using a series of detailed revenue and cost allocation methodologies which originate with the books and records of Fidelity on which Fidelity's audited financial statements are based. The Audit Committee of the Board reviews any significant changes from the prior year's methodologies.
PricewaterhouseCoopers LLP (PwC), independent registered public accounting firm and auditor to Fidelity and certain Fidelity funds, has been engaged annually by the Board as part of the Board's assessment of Fidelity's profitability analysis. PwC's engagement includes the review and assessment of Fidelity's methodologies used in determining the revenues and expenses attributable to Fidelity's mutual fund business, and completion of agreed-upon procedures surrounding the mathematical accuracy of fund profitability and its conformity to allocation methodologies. After considering PwC's reports issued under the engagement and information provided by Fidelity, the Board concluded that while other allocation methods may also be reasonable, Fidelity's profitability methodologies are reasonable in all material respects.
The Board also reviewed Fidelity's non-fund businesses and fall-out benefits related to the mutual fund business as well as cases where Fidelity's affiliates may benefit from or be related to the fund's business.
Semiannual Report
The Board considered the costs of the services provided by and the profits realized by Fidelity in connection with the operation of the fund and was satisfied that the profitability was not excessive in the circumstances.
Economies of Scale. The Board considered whether there have been economies of scale in respect of the management of the Fidelity funds, whether the Fidelity funds (including the fund) have appropriately benefited from any such economies of scale, and whether there is potential for realization of any further economies of scale. The Board considered the extent to which the fund will benefit from economies of scale through increased services to the fund, through waivers or reimbursements, or through fee or expense reductions. The Board also noted that in 2009, it and the board of other Fidelity funds created an ad hoc committee (the Economies of Scale Committee) to analyze whether FMR attains economies of scale in respect of the management and servicing of the Fidelity funds, whether the Fidelity funds have appropriately benefited from such economies of scale, and whether there is potential for realization of any further economies of scale.
The Board recognized that the fund's management contract incorporates a "group fee" structure, which provides for lower group fee rates as total fund assets under FMR's management increase, and for higher group fee rates as total fund assets under FMR's management decrease. FMR calculates the group fee rates based on a tiered asset "breakpoint" schedule that varies based on asset class. The Board considered that the group fee is designed to deliver the benefits of economies of scale to fund shareholders when total Fidelity fund assets increase, even if assets of any particular fund are unchanged or have declined, because some portion of Fidelity's costs are attributable to services provided to all Fidelity funds, and all funds benefit if those costs can be allocated among more assets. The Board concluded that, given the group fee structure, fund shareholders will benefit from lower management fees as assets under FMR's management increase at the fund complex level, regardless of whether Fidelity achieves any such economies of scale.
The Board concluded, taking into account the analysis of the Economies of Scale Committee, that any potential economies of scale are being appropriately shared between fund shareholders and Fidelity.
Additional Information Requested by the Board. In order to develop fully the factual basis for consideration of the Fidelity funds' Advisory Contracts, the Board requested and received additional information on certain topics, including (i) fund performance trends, actions to be taken by FMR to improve certain funds' overall performance, and Fidelity's long-term strategies for certain funds; (ii) portfolio manager changes that have occurred during the past year and length of portfolio manager tenure for different categories of funds over time; (iii) Fidelity's compensation structure for portfolio managers and other key personnel and strategies for attracting and retaining non-investment personnel; (iv) the amount of the investment that each portfolio manager has made in the Fidelity fund(s) that he or she manages; (v) historical trends in Fidelity's realization of fall-out benefits; (vi) Fidelity's group fee structures and the rationale for the individual fee rates of certain funds; (vii) fund profitability methodology and the impact of certain factors on fund profitability results; (viii) trends regarding industry use of performance fee structures and Fidelity's compliance practices with respect to performance adjustment calculations; (ix) the fee structures in place for certain other Fidelity clients; and (x) explanations regarding the relative total expense ratios of certain funds and classes, total expense competitive trends, and actions that might be taken by FMR to reduce total expense ratios for certain funds and classes.
Semiannual Report
Board Approval of Investment Advisory Contracts and
Management Fees - continued
Based on its evaluation of all of the conclusions noted above, and after considering all factors it believed relevant, the Board ultimately concluded that the advisory fee structures are fair and reasonable, and that the fund's Advisory Contracts should be renewed.
Semiannual Report
Managing Your Investments
Fidelity offers several ways to conveniently manage your workplace benefits (including your workplace savings plan, investments, and additional services) via your telephone or PC. You can access your plan and account information and research your investments 24 hours a day.
By Phone
Fidelity provides a single toll-free number to access plan information, account balances, positions, and quotes*. It's easy to navigate the service, and on your first call, the system will help you create a personal identification number (PIN) for security.
 Fidelity Workplace
Investing
1-800-835-5092
By PC
Fidelity's web site on the Internet provides a wide range of information, including plan information, daily financial news, fund performance, interactive planning tools, and news about Fidelity products and services.
 Fidelity's Web Site
www.401k.com
* When you call the quotes line, please remember that a fund's yield and return will vary and, except for money market funds, share price will also vary. This means that you may have a gain or loss when you sell your shares. There is no assurance that money market funds will be able to maintain a stable $1 share price; an investment in a money market fund is not insured or guaranteed by the U.S. government. Total returns are historical and include changes in share price, reinvestment of dividends and capital gains distributions, and the effects of any sales charges.
Semiannual Report
Investment Adviser
Fidelity Management &
Research Company
Boston, MA
Investment Sub-Advisers
FMR Co., Inc.
Fidelity Management & Research
(U.K.) Inc.
Fidelity Management & Research
(Japan) Inc.
Fidelity Management & Research
(Hong Kong) Limited
General Distributor
Fidelity Distributors Corporation
Boston, MA
Transfer and Service Agents
Fidelity Investments Institutional
Operations Company, Inc.
Boston, MA
Fidelity Service Company, Inc.
Boston, MA
Custodian
State Street Bank and Trust Company Quincy, MA
MAG-K-USAN-1111
1.863179.102

Item 2. Code of Ethics
Not applicable.
Item 3. Audit Committee Financial Expert
Not applicable.
Item 4. Principal Accountant Fees and Services
Not applicable.
Item 5. Audit Committee of Listed Registrants
Not applicable.
Item 6. Investments
(a) Not applicable.
(b) Not applicable
Item 7. Disclosure of Proxy Voting Policies and Procedures for Closed-End Management Investment Companies
Not applicable.
Item 8. Portfolio Managers of Closed-End Management Investment Companies
Not applicable.
Item 9. Purchase of Equity Securities by Closed-End Management Investment Company and Affiliated Purchasers
Not applicable.
Item 10. Submission of Matters to a Vote of Security Holders
There were no material changes to the procedures by which shareholders may recommend nominees to the Fidelity Magellan Fund's Board of Trustees.
Item 11. Controls and Procedures
(a)(i) The President and Treasurer and the Chief Financial Officer have concluded that the Fidelity Magellan Fund's (the "Trust") disclosure controls and procedures (as defined in Rule 30a-3(c) under the Investment Company Act) provide reasonable assurances that material information relating to the Trust is made known to them by the appropriate persons, based on their evaluation of these controls and procedures as of a date within 90 days of the filing date of this report.
(a)(ii) There was no change in the Trust's internal control over financial reporting (as defined in Rule 30a-3(d) under the Investment Company Act) that occurred during the second fiscal quarter of the period covered by this report that has materially affected, or is reasonably likely to materially affect, the Trust's internal control over financial reporting.
Item 12. Exhibits
(a) | (1) | Not applicable. |
(a) | (2) | Certification pursuant to Rule 30a-2(a) under the Investment Company Act of 1940 (17 CFR 270.30a-2(a)) is filed and attached hereto as Exhibit 99.CERT. |
(a) | (3) | Not applicable. |
(b) | | Certification pursuant to Rule 30a-2(b) under the Investment Company Act of 1940 (17 CFR 270.30a-2(b)) is furnished and attached hereto as Exhibit 99.906CERT. |
SIGNATURES
Pursuant to the requirements of the Securities Exchange Act of 1934 and the Investment Company Act of 1940, the registrant has duly caused this report to be signed on its behalf by the undersigned, thereunto duly authorized.
Fidelity Magellan Fund
By: | /s/ Kenneth B. Robins |
| Kenneth B. Robins |
| President and Treasurer |
| |
Date: | November 22, 2011 |
Pursuant to the requirements of the Securities Exchange Act of 1934 and the Investment Company Act of 1940, this report has been signed below by the following persons on behalf of the registrant and in the capacities and on the dates indicated.
By: | /s/ Kenneth B. Robins |
| Kenneth B. Robins |
| President and Treasurer |
| |
Date: | November 22, 2011 |
By: | /s/ Christine Reynolds |
| Christine Reynolds |
| Chief Financial Officer |
| |
Date: | November 22, 2011 |