UNITED STATES
SECURITIES AND EXCHANGE COMMISSION
Washington, D.C. 20549
FORM N-CSR
CERTIFIED SHAREHOLDER REPORT OF REGISTERED
MANAGEMENT INVESTMENT COMPANIES
Investment Company Act file number 811-1193
Fidelity Magellan Fund
(Exact name of registrant as specified in charter)
245 Summer St., Boston, Massachusetts 02210
(Address of principal executive offices) (Zip code)
Scott C. Goebel, Secretary
245 Summer St.
Boston, Massachusetts 02210
(Name and address of agent for service)
Registrant's telephone number, including area code: 617-563-7000
Date of fiscal year end: | March 31 |
| |
Date of reporting period: | September 30, 2013 |
Item 1. Reports to Stockholders
Fidelity®
Magellan®
Fund
Semiannual Report
September 30, 2013
(Fidelity Cover Art)
Contents
Shareholder Expense Example | (Click Here) | An example of shareholder expenses. |
Investment Changes | (Click Here) | A summary of major shifts in the fund's investments over the past six months. |
Investments | (Click Here) | A complete list of the fund's investments with their market values. |
Financial Statements | (Click Here) | Statements of assets and liabilities, operations, and changes in net assets, as well as financial highlights. |
Notes | (Click Here) | Notes to the financial statements. |
Report of Independent Registered Public Accounting Firm | (Click Here) | |
Board Approval of Investment Advisory Contracts and Management Fees | (Click Here) | |
To view a fund's proxy voting guidelines and proxy voting record for the 12-month period ended June 30, visit http://www.fidelity.com/proxyvotingresults or visit the Securities and Exchange Commission's (SEC) website at http://www.sec.gov. You may also call 1-800-544-8544 to request a free copy of the proxy voting guidelines.
Standard & Poor's, S&P and S&P 500 are registered service marks of The McGraw-Hill Companies, Inc. and have been licensed for use by Fidelity Distributors Corporation.
Other third-party marks appearing herein are the property of their respective owners.
All other marks appearing herein are registered or unregistered trademarks or service marks of FMR LLC or an affiliated company. © 2013 FMR LLC. All rights reserved.
This report and the financial statements contained herein are submitted for the general information of the shareholders of the fund. This report is not authorized for distribution to prospective investors in the fund unless preceded or accompanied by an effective prospectus.
A fund files its complete schedule of portfolio holdings with the SEC for the first and third quarters of each fiscal year on Form N-Q. Forms N-Q are available on the SEC's web site at http://www.sec.gov. A fund's Forms N-Q may be reviewed and copied at the SEC's Public Reference Room in Washington, DC. Information regarding the operation of the SEC's Public Reference Room may be obtained by calling 1-800-SEC-0330. For a complete list of a fund's portfolio holdings, view the most recent holdings listing, semiannual report, or annual report on Fidelity's web site at http://www.fidelity.com, http://www.advisor.fidelity.com, or http://www.401k.com, as applicable.
NOT FDIC INSURED • MAY LOSE VALUE • NO BANK GUARANTEE
Neither the fund nor Fidelity Distributors Corporation is a bank.
Semiannual Report
Shareholder Expense Example
As a shareholder of the Fund, you incur two types of costs: (1) transaction costs, and (2) ongoing costs, including management fees and other Fund expenses. This Example is intended to help you understand your ongoing costs (in dollars) of investing in the Fund and to compare these costs with the ongoing costs of investing in other mutual funds.
The Example is based on an investment of $1,000 invested at the beginning of the period and held for the entire period (April 1, 2013 to September 30, 2013).
Actual Expenses
The first line of the accompanying table for each class of the Fund provides information about actual account values and actual expenses. You may use the information in this line, together with the amount you invested, to estimate the expenses that you paid over the period. Simply divide your account value by $1,000.00 (for example, an $8,600 account value divided by $1,000.00 = 8.6), then multiply the result by the number in the first line for a class of the Fund under the heading entitled "Expenses Paid During Period" to estimate the expenses you paid on your account during this period. A small balance maintenance fee of $12.00 that is charged once a year may apply for certain accounts with a value of less than $2,000. This fee is not included in the table below. If it was, the estimate of expenses you paid during the period would be higher, and your ending account value lower, by this amount. In addition, the Fund, as a shareholder in the underlying Fidelity Central Funds, will indirectly bear its pro-rata share of the fees and expenses incurred by the underlying Fidelity Central Funds. These fees and expenses are not included in the Fund's annualized expense ratio used to calculate the expense estimate in the table below.
Hypothetical Example for Comparison Purposes
The second line of the accompanying table for each class of the Fund provides information about hypothetical account values and hypothetical expenses based on a Class' actual expense ratio and an assumed rate of return of 5% per year before expenses, which is not the Class' actual return. The hypothetical account values and expenses may not be used to estimate the actual ending account balance or expenses you paid for the period. You may use this information to compare the ongoing costs of investing in the Fund and other funds. To do so, compare this 5% hypothetical example with the 5% hypothetical examples that appear in the shareholder reports of the other funds. A small balance maintenance fee of $12.00 that is charged once a year may apply for certain accounts with a value of less than $2,000. This fee is not included in the table below. If it was, the estimate of expenses you paid during the period would be higher, and your ending account value lower, by this amount. In addition, the Fund, as a shareholder in the underlying Fidelity Central Funds, will indirectly bear its pro-rata share of the fees and expenses incurred by the underlying Fidelity Central Funds. These fees and expenses are not included in the Fund's annualized expense ratio used to calculate the expense estimate in the table below.
Please note that the expenses shown in the table are meant to highlight your ongoing costs only and do not reflect any transaction costs. Therefore, the second line of the table is useful in comparing ongoing costs only, and will not help you determine the relative total costs of owning different funds.
Semiannual Report
Shareholder Expense Example - continued
| Annualized
Expense RatioB | Beginning
Account Value
April 1, 2013 | Ending
Account Value
September 30, 2013 | Expenses Paid
During Period*
April 1, 2013
to September 30, 2013 |
Magellan | .49% | | | |
Actual | | $ 1,000.00 | $ 1,121.50 | $ 2.61 |
HypotheticalA | | $ 1,000.00 | $ 1,022.61 | $ 2.48 |
Class K | .38% | | | |
Actual | | $ 1,000.00 | $ 1,122.10 | $ 2.02 |
HypotheticalA | | $ 1,000.00 | $ 1,023.16 | $ 1.93 |
A 5% return per year before expenses
B Annualized expense ratio reflects expenses net of applicable fee waivers.
* Expenses are equal to each Class' annualized expense ratio, multiplied by the average account value over the period, multiplied by 183/365 (to reflect the one-half year period).
Semiannual Report
Investment Changes (Unaudited)
Top Ten Stocks as of September 30, 2013 |
| % of fund's
net assets | % of fund's net assets
6 months ago |
Google, Inc. Class A | 3.6 | 3.3 |
Apple, Inc. | 3.4 | 2.0 |
Berkshire Hathaway, Inc. Class B | 2.3 | 2.4 |
Microsoft Corp. | 2.2 | 0.0 |
General Electric Co. | 2.2 | 2.1 |
Wells Fargo & Co. | 2.1 | 2.3 |
JPMorgan Chase & Co. | 2.0 | 1.3 |
Anadarko Petroleum Corp. | 2.0 | 1.5 |
Citigroup, Inc. | 2.0 | 2.0 |
Bank of America Corp. | 1.9 | 1.5 |
| 23.7 | |
Top Five Market Sectors as of September 30, 2013 |
| % of fund's
net assets | % of fund's net assets
6 months ago |
Information Technology | 20.7 | 19.5 |
Financials | 19.0 | 18.4 |
Consumer Discretionary | 14.8 | 14.3 |
Health Care | 13.9 | 12.3 |
Consumer Staples | 8.9 | 9.1 |
Asset Allocation (% of fund's net assets) |
As of September 30, 2013 * | As of March 31, 2013 ** |
 | Stocks 98.7% | | | Stocks 98.4% | |
 | Convertible
Securities 0.3% | | | Convertible
Securities 0.2% | |
 | Short-Term
Investments and
Net Other Assets (Liabilities) 1.0% | | | Short-Term
Investments and
Net Other Assets (Liabilities) 1.4% | |
* Foreign investments | 6.0% | | ** Foreign investments | 8.9% | |

Semiannual Report
Investments September 30, 2013
Showing Percentage of Net Assets
Common Stocks - 98.7% |
| Shares | | Value (000s) |
CONSUMER DISCRETIONARY - 14.7% |
Automobiles - 0.6% |
Honda Motor Co. Ltd. | 373,500 | | $ 14,276 |
Tesla Motors, Inc. (a) | 393,700 | | 76,149 |
| | 90,425 |
Diversified Consumer Services - 0.6% |
H&R Block, Inc. | 3,121,000 | | 83,206 |
Kroton Educacional SA | 1,006,500 | | 14,310 |
| | 97,516 |
Hotels, Restaurants & Leisure - 1.2% |
Bloomin' Brands, Inc. (a) | 482,360 | | 11,389 |
Brinker International, Inc. | 1,680,815 | | 68,123 |
Dunkin' Brands Group, Inc. | 664,698 | | 30,084 |
Yum! Brands, Inc. | 1,005,000 | | 71,747 |
| | 181,343 |
Household Durables - 0.9% |
D.R. Horton, Inc. | 1,177,111 | | 22,871 |
Leggett & Platt, Inc. | 1,413,000 | | 42,602 |
Lennar Corp. Class A | 746,985 | | 26,443 |
PulteGroup, Inc. | 1,017,300 | | 16,785 |
Ryland Group, Inc. | 311,960 | | 12,647 |
Toll Brothers, Inc. (a) | 674,454 | | 21,873 |
| | 143,221 |
Internet & Catalog Retail - 2.0% |
Amazon.com, Inc. (a) | 438,504 | | 137,094 |
Liberty Media Corp. Interactive Series A (a) | 1,276,000 | | 29,948 |
priceline.com, Inc. (a) | 128,500 | | 129,907 |
| | 296,949 |
Media - 2.4% |
CBS Corp. Class B | 1,559,900 | | 86,044 |
Comcast Corp. Class A | 6,062,400 | | 273,717 |
Entravision Communication Corp. Class A | 20,867 | | 123 |
| | 359,884 |
Specialty Retail - 5.7% |
Aarons, Inc. Class A | 555,300 | | 15,382 |
Best Buy Co., Inc. | 4,601,900 | | 172,571 |
Home Depot, Inc. | 3,577,000 | | 271,315 |
L Brands, Inc. | 1,492,948 | | 91,219 |
Common Stocks - continued |
| Shares | | Value (000s) |
CONSUMER DISCRETIONARY - continued |
Specialty Retail - continued |
Ross Stores, Inc. | 1,294,803 | | $ 94,262 |
TJX Companies, Inc. | 3,733,200 | | 210,515 |
| | 855,264 |
Textiles, Apparel & Luxury Goods - 1.3% |
Hanesbrands, Inc. | 245,000 | | 15,266 |
lululemon athletica, Inc. (a) | 197,999 | | 14,472 |
Michael Kors Holdings Ltd. (a) | 450,300 | | 33,556 |
Ralph Lauren Corp. | 282,200 | | 46,487 |
VF Corp. | 475,430 | | 94,634 |
| | 204,415 |
TOTAL CONSUMER DISCRETIONARY | | 2,229,017 |
CONSUMER STAPLES - 8.9% |
Beverages - 2.3% |
Anheuser-Busch InBev SA NV | 275,960 | | 27,375 |
Beam, Inc. | 631,500 | | 40,826 |
Dr. Pepper Snapple Group, Inc. | 712,373 | | 31,929 |
The Coca-Cola Co. | 6,456,902 | | 244,587 |
| | 344,717 |
Food & Staples Retailing - 2.7% |
CVS Caremark Corp. | 3,882,672 | | 220,342 |
Kroger Co. | 2,705,600 | | 109,144 |
Rite Aid Corp. (a) | 1,579,300 | | 7,517 |
Walgreen Co. | 696,500 | | 37,472 |
Whole Foods Market, Inc. | 626,426 | | 36,646 |
| | 411,121 |
Food Products - 1.0% |
Bunge Ltd. | 190,600 | | 14,468 |
Green Mountain Coffee Roasters, Inc. (a) | 611,600 | | 46,072 |
Mead Johnson Nutrition Co. Class A | 621,500 | | 46,153 |
Unilever NV (Certificaten Van Aandelen) (Bearer) | 979,200 | | 37,373 |
| | 144,066 |
Household Products - 2.7% |
Colgate-Palmolive Co. | 2,157,132 | | 127,918 |
Energizer Holdings, Inc. | 414,000 | | 37,736 |
Procter & Gamble Co. | 3,262,800 | | 246,635 |
| | 412,289 |
Common Stocks - continued |
| Shares | | Value (000s) |
CONSUMER STAPLES - continued |
Personal Products - 0.2% |
Herbalife Ltd. | 446,500 | | $ 31,152 |
TOTAL CONSUMER STAPLES | | 1,343,345 |
ENERGY - 8.0% |
Energy Equipment & Services - 1.1% |
Cameron International Corp. (a) | 504,300 | | 29,436 |
Ensco PLC Class A | 935,100 | | 50,262 |
National Oilwell Varco, Inc. | 938,400 | | 73,298 |
Oceaneering International, Inc. | 94,900 | | 7,710 |
| | 160,706 |
Oil, Gas & Consumable Fuels - 6.9% |
Anadarko Petroleum Corp. | 3,227,800 | | 300,153 |
Cabot Oil & Gas Corp. | 1,289,336 | | 48,118 |
Canadian Natural Resources Ltd. (d) | 1,382,000 | | 43,430 |
Chevron Corp. | 173,400 | | 21,068 |
Concho Resources, Inc. (a) | 172,700 | | 18,791 |
ConocoPhillips Co. | 3,079,400 | | 214,049 |
Exxon Mobil Corp. | 1,025,524 | | 88,236 |
Marathon Oil Corp. | 1,398,800 | | 48,790 |
Marathon Petroleum Corp. | 292,400 | | 18,807 |
Occidental Petroleum Corp. | 393,100 | | 36,771 |
Suncor Energy, Inc. | 4,205,900 | | 150,384 |
The Williams Companies, Inc. | 1,737,400 | | 63,172 |
| | 1,051,769 |
TOTAL ENERGY | | 1,212,475 |
FINANCIALS - 19.0% |
Capital Markets - 3.0% |
BlackRock, Inc. Class A | 262,900 | | 71,146 |
Charles Schwab Corp. | 2,844,968 | | 60,143 |
Goldman Sachs Group, Inc. | 619,500 | | 98,011 |
KKR & Co. LP | 1,762,469 | | 36,272 |
Morgan Stanley | 2,819,168 | | 75,977 |
TD Ameritrade Holding Corp. | 845,576 | | 22,137 |
The Blackstone Group LP | 1,898,800 | | 47,261 |
UBS AG (NY Shares) | 1,931,600 | | 39,636 |
Virtus Investment Partners, Inc. (a) | 22,900 | | 3,724 |
| | 454,307 |
Common Stocks - continued |
| Shares | | Value (000s) |
FINANCIALS - continued |
Commercial Banks - 3.3% |
Comerica, Inc. | 1,087,700 | | $ 42,757 |
U.S. Bancorp | 3,783,859 | | 138,414 |
Wells Fargo & Co. | 7,541,255 | | 311,605 |
| | 492,776 |
Consumer Finance - 0.6% |
Capital One Financial Corp. | 934,100 | | 64,210 |
SLM Corp. | 1,357,400 | | 33,799 |
| | 98,009 |
Diversified Financial Services - 8.3% |
Bank of America Corp. | 21,055,500 | | 290,566 |
Berkshire Hathaway, Inc. Class B (a) | 3,059,066 | | 347,235 |
Citigroup, Inc. | 6,064,916 | | 294,209 |
JPMorgan Chase & Co. | 5,887,998 | | 304,351 |
ORIX Corp. | 1,039,100 | | 16,987 |
| | 1,253,348 |
Insurance - 1.8% |
American International Group, Inc. | 3,006,700 | | 146,216 |
Genworth Financial, Inc. Class A (a) | 1,763,300 | | 22,553 |
MetLife, Inc. | 2,327,021 | | 109,254 |
| | 278,023 |
Real Estate Investment Trusts - 1.2% |
American Tower Corp. | 2,458,261 | | 182,231 |
Real Estate Management & Development - 0.3% |
Rialto Real Estate Fund LP (a)(e)(g)(h) | 500,000 | | 26,080 |
RREF CMBS AIV, LP (e)(h)(i) | 500,000 | | 16,576 |
RREF Midtown Colony REIT, Inc. (e)(h)(j) | 500,000 | | 1,473 |
| | 44,129 |
Thrifts & Mortgage Finance - 0.5% |
MGIC Investment Corp. (a) | 1,987,400 | | 14,468 |
Nationstar Mortgage Holdings, Inc. (a)(d) | 1,096,900 | | 61,679 |
| | 76,147 |
TOTAL FINANCIALS | | 2,878,970 |
HEALTH CARE - 13.9% |
Biotechnology - 6.4% |
Acorda Therapeutics, Inc. (a) | 1,761,454 | | 60,383 |
Alexion Pharmaceuticals, Inc. (a) | 1,195,760 | | 138,899 |
Alkermes PLC (a) | 711,100 | | 23,907 |
Common Stocks - continued |
| Shares | | Value (000s) |
HEALTH CARE - continued |
Biotechnology - continued |
Alnylam Pharmaceuticals, Inc. (a) | 340,171 | | $ 21,774 |
Amgen, Inc. | 2,079,577 | | 232,788 |
Amicus Therapeutics, Inc. (a)(d) | 782,383 | | 1,815 |
Biogen Idec, Inc. (a) | 469,304 | | 112,990 |
BioMarin Pharmaceutical, Inc. (a) | 93,739 | | 6,770 |
Bluebird Bio, Inc. | 27,700 | | 747 |
Bluebird Bio, Inc. | 181,073 | | 4,394 |
Clinical Data, Inc. rights 4/4/18 (a) | 988,714 | | 0 |
Enzymotec Ltd. | 392,900 | | 6,502 |
Exelixis, Inc. (a) | 1,225,184 | | 7,131 |
Gilead Sciences, Inc. (a) | 3,953,200 | | 248,419 |
KaloBios Pharmaceuticals, Inc. | 366,900 | | 1,658 |
KaloBios Pharmaceuticals, Inc. (f) | 762,146 | | 3,445 |
Medivation, Inc. (a) | 215,400 | | 12,911 |
Neurocrine Biosciences, Inc. (a) | 975,093 | | 11,038 |
Prothena Corp. PLC (a) | 85,929 | | 1,738 |
Regeneron Pharmaceuticals, Inc. (a) | 128,900 | | 40,329 |
Theravance, Inc. (a) | 449,581 | | 18,383 |
Threshold Pharmaceuticals, Inc. (a) | 2,613,700 | | 12,154 |
| | 968,175 |
Health Care Equipment & Supplies - 1.6% |
Alere, Inc. (a) | 722,311 | | 22,081 |
Boston Scientific Corp. (a) | 18,950,200 | | 222,475 |
| | 244,556 |
Health Care Technology - 1.0% |
athenahealth, Inc. (a)(d) | 299,700 | | 32,535 |
Cerner Corp. (a) | 2,040,900 | | 107,249 |
| | 139,784 |
Life Sciences Tools & Services - 0.3% |
Illumina, Inc. (a) | 566,000 | | 45,750 |
Pharmaceuticals - 4.6% |
AbbVie, Inc. | 719,400 | | 32,179 |
Actavis, Inc. | 956,900 | | 137,794 |
Bristol-Myers Squibb Co. | 786,400 | | 36,395 |
Eli Lilly & Co. | 597,779 | | 30,086 |
Merck & Co., Inc. | 3,986,200 | | 189,783 |
Perrigo Co. | 56,500 | | 6,971 |
Pfizer, Inc. | 5,074,400 | | 145,686 |
Valeant Pharmaceuticals International, Inc. (Canada) (a) | 431,000 | | 44,939 |
Common Stocks - continued |
| Shares | | Value (000s) |
HEALTH CARE - continued |
Pharmaceuticals - continued |
ViroPharma, Inc. (a) | 389,300 | | $ 15,299 |
Warner Chilcott PLC | 2,501,500 | | 57,159 |
| | 696,291 |
TOTAL HEALTH CARE | | 2,094,556 |
INDUSTRIALS - 8.7% |
Aerospace & Defense - 0.4% |
Esterline Technologies Corp. (a) | 348,760 | | 27,862 |
Textron, Inc. | 1,336,210 | | 36,893 |
| | 64,755 |
Airlines - 1.2% |
Delta Air Lines, Inc. | 5,150,000 | | 121,489 |
Spirit Airlines, Inc. (a) | 928,200 | | 31,809 |
United Continental Holdings, Inc. (a) | 781,000 | | 23,985 |
| | 177,283 |
Construction & Engineering - 0.3% |
EMCOR Group, Inc. | 693,600 | | 27,141 |
Quanta Services, Inc. (a) | 657,200 | | 18,080 |
| | 45,221 |
Electrical Equipment - 0.5% |
AMETEK, Inc. | 659,778 | | 30,363 |
EnerSys | 261,500 | | 15,855 |
Hubbell, Inc. Class B | 281,700 | | 29,505 |
| | 75,723 |
Industrial Conglomerates - 3.0% |
Danaher Corp. | 1,790,000 | | 124,083 |
General Electric Co. | 13,729,878 | | 328,007 |
| | 452,090 |
Machinery - 1.9% |
Cummins, Inc. | 503,070 | | 66,843 |
Illinois Tool Works, Inc. | 1,602,200 | | 122,200 |
Manitowoc Co., Inc. | 4,484,400 | | 87,805 |
Timken Co. | 68,345 | | 4,128 |
| | 280,976 |
Common Stocks - continued |
| Shares | | Value (000s) |
INDUSTRIALS - continued |
Professional Services - 0.6% |
Manpower, Inc. | 459,420 | | $ 33,418 |
Towers Watson & Co. | 610,781 | | 65,329 |
| | 98,747 |
Road & Rail - 0.6% |
CSX Corp. | 3,409,500 | | 87,761 |
Trading Companies & Distributors - 0.2% |
MRC Global, Inc. (a) | 1,175,400 | | 31,501 |
TOTAL INDUSTRIALS | | 1,314,057 |
INFORMATION TECHNOLOGY - 20.5% |
Communications Equipment - 2.1% |
Cisco Systems, Inc. | 6,228,900 | | 145,881 |
Juniper Networks, Inc. (a) | 4,301,600 | | 85,430 |
QUALCOMM, Inc. | 1,172,000 | | 78,946 |
| | 310,257 |
Computers & Peripherals - 3.5% |
Apple, Inc. | 1,087,159 | | 518,303 |
Stratasys Ltd. (a) | 135,400 | | 13,711 |
| | 532,014 |
Internet Software & Services - 6.9% |
Cornerstone OnDemand, Inc. (a) | 486,500 | | 25,026 |
CoStar Group, Inc. (a) | 92,000 | | 15,447 |
eBay, Inc. (a) | 1,170,600 | | 65,308 |
Facebook, Inc. Class A (a) | 3,542,800 | | 177,990 |
Google, Inc. Class A (a) | 621,200 | | 544,113 |
LinkedIn Corp. (a) | 147,800 | | 36,368 |
Marketo, Inc. | 440,917 | | 14,056 |
Rackspace Hosting, Inc. (a) | 1,419,300 | | 74,882 |
Responsys, Inc. (a) | 1,396,779 | | 23,047 |
Rocket Fuel, Inc. | 6,000 | | 322 |
Sohu.com, Inc. (a) | 211,200 | | 16,649 |
Yahoo!, Inc. (a) | 861,500 | | 28,567 |
Yelp, Inc. (a) | 375,500 | | 24,851 |
| | 1,046,626 |
IT Services - 2.6% |
Accenture PLC Class A | 850,873 | | 62,658 |
Cognizant Technology Solutions Corp. Class A (a) | 771,359 | | 63,344 |
Computer Sciences Corp. | 406,700 | | 21,043 |
Common Stocks - continued |
| Shares | | Value (000s) |
INFORMATION TECHNOLOGY - continued |
IT Services - continued |
Total System Services, Inc. | 1,849,940 | | $ 54,425 |
Visa, Inc. Class A | 1,024,800 | | 195,839 |
| | 397,309 |
Semiconductors & Semiconductor Equipment - 0.6% |
Applied Materials, Inc. | 2,144,700 | | 37,618 |
ASML Holding NV | 249,103 | | 24,601 |
Skyworks Solutions, Inc. (a) | 905,800 | | 22,500 |
| | 84,719 |
Software - 4.8% |
FireEye, Inc. | 24,131 | | 1,002 |
Guidewire Software, Inc. (a) | 520,417 | | 24,517 |
Microsoft Corp. | 9,928,400 | | 330,715 |
NetSuite, Inc. (a) | 104,040 | | 11,230 |
Oracle Corp. | 2,115,400 | | 70,168 |
salesforce.com, Inc. (a) | 1,968,481 | | 102,184 |
SS&C Technologies Holdings, Inc. (a) | 392,900 | | 14,969 |
Ultimate Software Group, Inc. (a) | 210,400 | | 31,013 |
Workday, Inc. Class A | 1,726,700 | | 139,742 |
| | 725,540 |
TOTAL INFORMATION TECHNOLOGY | | 3,096,465 |
MATERIALS - 4.2% |
Chemicals - 3.5% |
CF Industries Holdings, Inc. | 134,700 | | 28,399 |
LyondellBasell Industries NV Class A | 1,751,019 | | 128,227 |
Monsanto Co. | 2,357,884 | | 246,092 |
Potash Corp. of Saskatchewan, Inc. | 465,100 | | 14,544 |
Praxair, Inc. | 905,632 | | 108,866 |
| | 526,128 |
Construction Materials - 0.5% |
Vulcan Materials Co. | 1,597,000 | | 82,741 |
Metals & Mining - 0.2% |
Goldcorp, Inc. | 905,401 | | 23,557 |
Paper & Forest Products - 0.0% |
Boise Cascade Co. | 232,723 | | 6,272 |
TOTAL MATERIALS | | 638,698 |
Common Stocks - continued |
| Shares | | Value (000s) |
TELECOMMUNICATION SERVICES - 0.4% |
Wireless Telecommunication Services - 0.4% |
SBA Communications Corp. Class A (a) | 670,663 | | $ 53,962 |
UTILITIES - 0.4% |
Multi-Utilities - 0.4% |
Sempra Energy | 670,000 | | 57,352 |
TOTAL COMMON STOCKS (Cost $11,770,328) |
14,918,897
|
Convertible Preferred Stocks - 0.3% |
| | | |
CONSUMER DISCRETIONARY - 0.1% |
Household Durables - 0.1% |
Roku, Inc. 8.00% (h) | 12,145,838 | | 11,000 |
INFORMATION TECHNOLOGY - 0.2% |
Computers & Peripherals - 0.0% |
Pure Storage, Inc. Series E (a)(h) | 153,030 | | 2,121 |
Internet Software & Services - 0.1% |
HubSpot, Inc. (h) | 2,670,845 | | 15,000 |
Software - 0.1% |
DocuSign, Inc. Series D (a)(h) | 2,371,047 | | 11,000 |
Mobileye N.V. Series F (a)(h) | 254,387 | | 8,878 |
| | 19,878 |
TOTAL INFORMATION TECHNOLOGY | | 36,999 |
TOTAL CONVERTIBLE PREFERRED STOCKS (Cost $47,999) |
47,999
|
Money Market Funds - 0.9% |
| Shares | | Value (000s) |
Fidelity Cash Central Fund, 0.10% (b) | 81,412,542 | | $ 81,413 |
Fidelity Securities Lending Cash Central Fund, 0.09% (b)(c) | 58,371,650 | | 58,372 |
TOTAL MONEY MARKET FUNDS (Cost $139,785) |
139,785
|
TOTAL INVESTMENT PORTFOLIO - 99.9% (Cost $11,958,112) | | 15,106,681 |
NET OTHER ASSETS (LIABILITIES) - 0.1% | | 13,629 |
NET ASSETS - 100% | $ 15,120,310 |
Legend |
(a) Non-income producing |
(b) Affiliated fund that is generally available only to investment companies and other accounts managed by Fidelity Investments. The rate quoted is the annualized seven-day yield of the fund at period end. A complete unaudited listing of the fund's holdings as of its most recent quarter end is available upon request. In addition, each Fidelity Central Fund's financial statements, which are not covered by the Fund's Report of Independent Registered Public Accounting Firm, are available on the SEC's website or upon request. |
(c) Investment made with cash collateral received from securities on loan. |
(d) Security or a portion of the security is on loan at period end. |
(e) Affiliated company |
(f) Security exempt from registration under Rule 144A of the Securities Act of 1933. These securities may be resold in transactions exempt from registration, normally to qualified institutional buyers. At the end of the period, the value of these securities amounted to $3,445,000 or 0.0% of net assets. |
(g) Investment is owned by an entity that is treated as a corporation for U.S. tax purposes and is owned by the Fund. |
(h) Restricted securities - Investment in securities not registered under the Securities Act of 1933 (excluding 144A issues). At the end of the period, the value of restricted securities (excluding 144A issues) amounted to $92,128,000 or 0.6% of net assets. |
Additional information on each restricted holding is as follows: |
Security | Acquisition Date | Acquisition Cost (000s) |
DocuSign, Inc. Series D | 6/29/12 | $ 11,000 |
HubSpot, Inc. | 10/25/12 | $ 15,000 |
Mobileye N.V. Series F | 8/15/13 | $ 8,878 |
Pure Storage, Inc. Series E | 8/22/13 | $ 2,121 |
Rialto Real Estate Fund LP | 2/24/11-
8/17/12 | $ 33,049 |
RREF CMBS AIV, LP | 8/10/11-
8/17/12 | $ 15,528 |
Security | Acquisition Date | Acquisition Cost (000s) |
RREF Midtown Colony REIT, Inc. | 12/31/12 | $ 1,423 |
Roku, Inc. 8.00% | 5/7/13 | $ 11,000 |
(i) Investment represents the Fund's ownership interest in a limited partnership, which is under common ownership and management with Rialto Real Estate Fund, LP. |
(j) Investment represents the Fund's ownership interest in a real estate investment trust, which is under common ownership and management with Rialto Real Estate Fund, LP. |
Affiliated Central Funds |
Information regarding fiscal year to date income earned by the Fund from investments in Fidelity Central Funds is as follows: |
Fund | Income earned
(Amounts in thousands) |
Fidelity Cash Central Fund | $ 70 |
Fidelity Securities Lending Cash Central Fund | 542 |
Total | $ 612 |
Other Affiliated Issuers |
An affiliated company is a company in which the Fund has ownership of at least 5% of the voting securities. Fiscal year to date transactions with companies which are or were affiliates are as follows: |
Affiliate
(Amounts in thousands) | Value,
beginning of
period | Purchases | Sales
Proceeds | Dividend
Income | Value,
end of
period |
Acorda Therapeutics, Inc. | $ 61,672 | $ 10,283 | $ 16,110 | $ - | $ - |
Brinker International, Inc. | 147,919 | - | 89,426 | 959 | - |
Rialto Real Estate Fund LP | 40,891 | - | - | - | 26,080 |
RREF CMBS AIV, LP | 18,361 | - | - | 5,008 | 16,576 |
RREF Midtown Colony REIT, Inc. | 1,397 | - | - | - | 1,473 |
Total | $ 270,240 | $ 10,283 | $ 105,536 | $ 5,967 | $ 44,129 |
Other Information |
The following is a summary of the inputs used, as of September 30, 2013, involving the Fund's assets and liabilities carried at fair value. The inputs or methodology used for valuing securities may not be an indication of the risk associated with investing in those securities. For more information on valuation inputs, and their aggregation into the levels used in the table below, please refer to the Investment Valuation section in the accompanying Notes to Financial Statements. |
Valuation Inputs at Reporting Date: |
Description
(Amounts in thousands) | Total | Level 1 | Level 2 | Level 3 |
Investments in Securities: | | | | |
Equities: | | | | |
Consumer Discretionary | $ 2,240,017 | $ 2,214,741 | $ 14,276 | $ 11,000 |
Consumer Staples | 1,343,345 | 1,278,597 | 64,748 | - |
Energy | 1,212,475 | 1,212,475 | - | - |
Financials | 2,878,970 | 2,817,854 | 16,987 | 44,129 |
Health Care | 2,094,556 | 2,090,162 | 4,394 | - |
Industrials | 1,314,057 | 1,314,057 | - | - |
Information Technology | 3,133,464 | 3,096,465 | - | 36,999 |
Materials | 638,698 | 638,698 | - | - |
Telecommunication Services | 53,962 | 53,962 | - | - |
Utilities | 57,352 | 57,352 | - | - |
Money Market Funds | 139,785 | 139,785 | - | - |
Total Investments in Securities: | $ 15,106,681 | $ 14,914,148 | $ 100,405 | $ 92,128 |
See accompanying notes which are an integral part of the financial statements.
Semiannual Report
Statement of Assets and Liabilities
Amounts in thousands (except per-share amounts) | September 30, 2013 |
| | |
Assets | | |
Investment in securities, at value (including securities loaned of $56,396) - See accompanying schedule: Unaffiliated issuers (cost $11,781,629) | $ 14,922,767 | |
Fidelity Central Funds (cost $139,785) | 139,785 | |
Other affiliated issuers (cost $36,698) | 44,129 | |
Total Investments (cost $11,958,112) | | $ 15,106,681 |
Receivable for investments sold | | 225,566 |
Receivable for fund shares sold | | 2,347 |
Dividends receivable | | 14,976 |
Distributions receivable from Fidelity Central Funds | | 60 |
Receivable from investment adviser for expense reductions | | 66 |
Other receivables | | 2,061 |
Total assets | | 15,351,757 |
| | |
Liabilities | | |
Payable for investments purchased | $ 148,160 | |
Payable for fund shares redeemed | 17,142 | |
Accrued management fee | 4,136 | |
Other affiliated payables | 1,908 | |
Other payables and accrued expenses | 1,729 | |
Collateral on securities loaned, at value | 58,372 | |
Total liabilities | | 231,447 |
| | |
Net Assets | | $ 15,120,310 |
Net Assets consist of: | | |
Paid in capital | | $ 11,133,321 |
Undistributed net investment income | | 75,609 |
Accumulated undistributed net realized gain (loss) on investments and foreign currency transactions | | 762,805 |
Net unrealized appreciation (depreciation) on investments and assets and liabilities in foreign currencies | | 3,148,575 |
Net Assets | | $ 15,120,310 |
See accompanying notes which are an integral part of the financial statements.
Semiannual Report
Financial Statements - continued
Statement of Assets and Liabilities - continued
Amounts in thousands (except per-share amounts) | September 30, 2013 |
| | |
Magellan:
Net Asset Value, offering price and redemption price per share ($12,596,181 ÷ 141,118 shares) | | $ 89.26 |
| | |
Class K:
Net Asset Value, offering price and redemption price per share ($2,524,129 ÷ 28,296 shares) | | $ 89.20 |
See accompanying notes which are an integral part of the financial statements.
Semiannual Report
Statement of Operations
Amounts in thousands | Six months ended September 30, 2013 |
| | |
Investment Income | | |
Dividends (including $5,967 earned from other affiliated issuers) | | $ 111,904 |
Income from Fidelity Central Funds | | 612 |
Total income | | 112,516 |
| | |
Expenses | | |
Management fee
Basic fee | $ 41,107 | |
Performance adjustment | (17,663) | |
Transfer agent fees | 10,564 | |
Accounting and security lending fees | 748 | |
Custodian fees and expenses | 133 | |
Independent trustees' compensation | 43 | |
Appreciation in deferred trustee compensation account | 4 | |
Registration fees | 50 | |
Audit | 102 | |
Legal | 16 | |
Miscellaneous | 64 | |
Total expenses before reductions | 35,168 | |
Expense reductions | (86) | 35,082 |
Net investment income (loss) | | 77,434 |
Realized and Unrealized Gain (Loss) Net realized gain (loss) on: | | |
Investment securities: | | |
Unaffiliated issuers | 771,769 | |
Other affiliated issuers | 20,254 | |
Foreign currency transactions | (238) | |
Futures contracts | 9,288 | |
Total net realized gain (loss) | | 801,073 |
Change in net unrealized appreciation (depreciation) on: Investment securities | 832,510 | |
Assets and liabilities in foreign currencies | 32 | |
Total change in net unrealized appreciation (depreciation) | | 832,542 |
Net gain (loss) | | 1,633,615 |
Net increase (decrease) in net assets resulting from operations | | $ 1,711,049 |
See accompanying notes which are an integral part of the financial statements.
Semiannual Report
Financial Statements - continued
Statement of Changes in Net Assets
Amounts in thousands | Six months ended September 30,
2013 | Year ended
March 31,
2013 |
Increase (Decrease) in Net Assets | | |
Operations | | |
Net investment income (loss) | $ 77,434 | $ 191,188 |
Net realized gain (loss) | 801,073 | 1,475,417 |
Change in net unrealized appreciation (depreciation) | 832,542 | (257,221) |
Net increase (decrease) in net assets resulting
from operations | 1,711,049 | 1,409,384 |
Distributions to shareholders from net investment income | (11,072) | (201,835) |
Distributions to shareholders from net realized gain | (58,700) | (4,097) |
Total distributions | (69,772) | (205,932) |
Share transactions - net increase (decrease) | (1,286,645) | (2,916,170) |
Total increase (decrease) in net assets | 354,632 | (1,712,718) |
| | |
Net Assets | | |
Beginning of period | 14,765,678 | 16,478,396 |
End of period (including undistributed net investment income of $75,609 and undistributed net investment income of $9,247, respectively) | $ 15,120,310 | $ 14,765,678 |
See accompanying notes which are an integral part of the financial statements.
Semiannual Report
Financial Highlights - Magellan
| Six months ended September 30, | Years ended March 31, |
| 2013 | 2013 | 2012 | 2011 | 2010 | 2009 |
Selected Per-Share Data | | | | | |
Net asset value, beginning of period | $ 79.96 | $ 73.30 | $ 75.56 | $ 67.56 | $ 44.63 | $ 82.26 |
Income from Investment Operations | | | | | | |
Net investment income (loss) D | .43 | .93 | .47 | .56 G | .29 | .32 |
Net realized and unrealized gain (loss) | 9.25 | 6.75 | (2.30) | 8.05 | 23.02 | (34.98) |
Total from investment operations | 9.68 | 7.68 | (1.83) | 8.61 | 23.31 | (34.66) |
Distributions from net investment income | (.06) | (1.00) | (.41) | (.54) | (.36) | (.11) |
Distributions from net realized gain | (.32) | (.02) | (.02) | (.07) | (.02) | (2.86) |
Total distributions | (.38) | (1.02) | (.43) | (.61) | (.38) | (2.97) |
Net asset value, end of period | $ 89.26 | $ 79.96 | $ 73.30 | $ 75.56 | $ 67.56 | $ 44.63 |
Total Return B, C | 12.15% | 10.63% | (2.36)% | 12.82% | 52.33% | (43.81)% |
Ratios to Average Net Assets E, H | | | | | |
Expenses before reductions | .49% A | .47% | .54% | .60% | .75% | .71% |
Expenses net of fee waivers, if any | .49% A | .47% | .54% | .60% | .75% | .71% |
Expenses net of all reductions | .49% A | .46% | .53% | .59% | .74% | .71% |
Net investment income (loss) | 1.02% A | 1.27% | .69% | .83% G | .49% | .51% |
Supplemental Data | | | | | | |
Net assets, end of period (in millions) | $ 12,596 | $ 12,341 | $ 13,665 | $ 19,398 | $ 22,628 | $ 17,225 |
Portfolio turnover rate F | 70% A | 88% | 99% | 42% | 39% | 67% |
A Annualized
B Total returns for periods of less than one year are not annualized.
C Total returns would have been lower if certain expenses had not been reduced during the applicable periods shown.
D Calculated based on average shares outstanding during the period.
E Fees and expenses of any underlying Fidelity Central Funds are not included in the Fund's expense ratio. The Fund indirectly bears its proportionate share of the expenses of any underlying Fidelity Central Funds.
F Amount does not include the portfolio activity of any underlying Fidelity Central Funds.
G Investment income per share reflects a large, non-recurring dividend which amounted to $.13 per share. Excluding this non-recurring dividend, the ratio of net investment income (loss) to average net assets would have been .63%.
H Expense ratios reflect operating expenses of the class. Expenses before reductions do not reflect amounts reimbursed by the investment adviser or reductions from brokerage service arrangements or reductions from other expense offset arrangements and do not represent the amount paid by the class during periods when reimbursements or reductions occur. Expenses net of fee waivers reflect expenses after reimbursement by the investment adviser but prior to reductions from brokerage service arrangements or other expense offset arrangements. Expenses net of all reductions represent the net expenses paid by the class.
See accompanying notes which are an integral part of the financial statements.
Semiannual Report
Financial Highlights - Class K
| Six months ended September 30, | Years ended March 31, |
| 2013 | 2013 | 2012 | 2011 | 2010 | 2009 H |
Selected Per-Share Data | | | | | |
Net asset value, beginning of period | $ 79.89 | $ 73.24 | $ 75.51 | $ 67.53 | $ 44.61 | $ 85.82 |
Income from Investment Operations | | | | | | |
Net investment income (loss) D | .48 | 1.02 | .56 | .65 G | .38 | .30 |
Net realized and unrealized gain (loss) | 9.23 | 6.75 | (2.30) | 8.04 | 23.02 | (41.32) |
Total from investment operations | 9.71 | 7.77 | (1.74) | 8.69 | 23.40 | (41.02) |
Distributions from net investment income | (.08) | (1.10) | (.50) | (.64) | (.46) | (.19) |
Distributions from net realized gain | (.32) | (.02) | (.02) | (.07) | (.02) | - |
Total distributions | (.40) | (1.12) | (.53) J | (.71) | (.48) | (.19) |
Net asset value, end of period | $ 89.20 | $ 79.89 | $ 73.24 | $ 75.51 | $ 67.53 | $ 44.61 |
Total Return B, C | 12.21% | 10.77% | (2.23)% | 12.97% | 52.59% | (47.79)% |
Ratios to Average Net Assets E, I | | | | | |
Expenses before reductions | .38% A | .35% | .42% | .46% | .59% | .55% A |
Expenses net of fee waivers, if any | .38% A | .35% | .42% | .46% | .59% | .55% A |
Expenses net of all reductions | .38% A | .34% | .41% | .46% | .58% | .55% A |
Net investment income (loss) | 1.14% A | 1.40% | .82% | .97% G | .65% | .79% A |
Supplemental Data | | | | | | |
Net assets, end of period (in millions) | $ 2,524 | $ 2,424 | $ 2,814 | $ 3,483 | $ 2,495 | $ 1,415 |
Portfolio turnover rate F | 70% A | 88% | 99% | 42% | 39% | 67% |
A Annualized
B Total returns for periods of less than one year are not annualized.
C Total returns would have been lower if certain expenses had not been reduced during the applicable periods shown.
D Calculated based on average shares outstanding during the period.
E Fees and expenses of any underlying Fidelity Central Funds are not included in the Fund's expense ratio. The Fund indirectly bears its proportionate share of the expenses of any underlying Fidelity Central Funds.
F Amount does not include the portfolio activity of any underlying Fidelity Central Funds.
G Investment income per share reflects a large, non-recurring dividend which amounted to $.13 per share. Excluding this non-recurring dividend, the ratio of net investment income (loss) to average net assets would have been .77%.
H For the period May 9, 2008 (commencement of sale of shares) to March 31, 2009.
I Expense ratios reflect operating expenses of the class. Expenses before reductions do not reflect amounts reimbursed by the investment adviser or reductions from brokerage service arrangements or reductions from other expense offset arrangements and do not represent the amount paid by the class during periods when reimbursements or reductions occur. Expense ratios before reductions for start-up periods may not be representative of longer-term operating periods. Expenses net of fee waivers reflect expenses after reimbursement by the investment adviser but prior to reductions from brokerage service arrangements or other expense offset arrangements. Expenses net of all reductions represent the net expenses paid by the class.
J Total distributions of $.53 per share is comprised of distributions from net investment income of $.504 and distributions from net realized gain of $.022 per share.
See accompanying notes which are an integral part of the financial statements.
Semiannual Report
Notes to Financial Statements
For the period ended September 30, 2013
(Amounts in thousands except percentages)
1. Organization.
Fidelity® Magellan Fund (the Fund) is a fund of Fidelity Magellan Fund (the Trust) and is authorized to issue an unlimited number of shares. The Trust is registered under the Investment Company Act of 1940, as amended (the 1940 Act), as an open-end management investment company organized as a Massachusetts business trust. The Fund offers Magellan and Class K shares, each of which has equal rights as to assets and voting privileges. Each class has exclusive voting rights with respect to matters that affect that class.
2. Investments in Fidelity Central Funds.
The Fund invests in Fidelity Central Funds, which are open-end investment companies generally available only to other investment companies and accounts managed by Fidelity Management & Research Company (FMR) and its affiliates. The Fund's Schedule of Investments lists each of the Fidelity Central Funds held as of period end, if any, as an investment of the Fund, but does not include the underlying holdings of each Fidelity Central Fund. As an Investing Fund, the Fund indirectly bears its proportionate share of the expenses of the underlying Fidelity Central Funds.
The Money Market Central Funds seek preservation of capital and current income and are managed by Fidelity Investments Money Management, Inc. (FIMM), an affiliate of FMR.
A complete unaudited list of holdings for each Fidelity Central Fund is available upon request or at the Securities and Exchange Commission (the SEC) website at www.sec.gov. In addition, the financial statements of the Fidelity Central Funds, which are not covered by the Fund's Report of Independent Registered Public Accounting Firm, are available on the SEC website or upon request.
3. Significant Accounting Policies.
The financial statements have been prepared in conformity with accounting principles generally accepted in the United States of America (GAAP), which require management to make certain estimates and assumptions at the date of the financial statements. Actual results could differ from those estimates. Subsequent events, if any, through the date that the financial statements were issued have been evaluated in the preparation of the financial statements. The following summarizes the significant accounting policies of the Fund:
Investment Valuation. Investments are valued as of 4:00 p.m. Eastern time on the last calendar day of the period. In accordance with valuation policies and procedures approved by the Board of Trustees (the Board), the Fund attempts to obtain prices from one or more third party pricing vendors or brokers to value its investments. When
Semiannual Report
3. Significant Accounting Policies - continued
Investment Valuation - continued
current market prices, quotations or currency exchange rates are not readily available or reliable, investments will be fair valued in good faith by the FMR Fair Value Committee (the Committee), in accordance with procedures adopted by the Board. Factors used in determining fair value vary by investment type and may include market or investment specific events. The frequency with which these procedures are used cannot be predicted and they may be utilized to a significant extent. The Committee oversees the Fund's valuation policies and procedures and is responsible for approving and reporting to the Board all fair value determinations.
The Fund categorizes the inputs to valuation techniques used to value its investments into a disclosure hierarchy consisting of three levels as shown below:
Level 1 - quoted prices in active markets for identical investments
Level 2 - other significant observable inputs (including quoted prices for similar investments, interest rates, prepayment speeds, etc.)
Level 3 - unobservable inputs (including the Fund's own assumptions based on the best information available)
Valuation techniques used to value the Fund's investments by major category are as follows:
Equity securities, including restricted securities, for which market quotations are readily available, are valued at the last reported sale price or official closing price as reported by a third party pricing vendor on the primary market or exchange on which they are traded and are categorized as Level 1 in the hierarchy. In the event there were no sales during the day or closing prices are not available, securities are valued at the last quoted bid price or may be valued using the last available price and are generally categorized as Level 2 in the hierarchy. For foreign equity securities, when market or security specific events arise, comparisons to the valuation of American Depositary Receipts (ADRs), futures contracts, Exchange-Traded Funds (ETFs) and certain indexes as well as quoted prices for similar securities may be used and would be categorized as Level 2 in the hierarchy. Utilizing these techniques may result in transfers between Level 1 and Level 2. For restricted equity securities and private placements where observable inputs are limited, assumptions about market activity and risk are used and these securities are generally categorized as Level 3 in the hierarchy.
Investments in open-end mutual funds, including the Fidelity Central Funds, are valued at their closing net asset value (NAV) each business day and are categorized as Level 1 in the hierarchy.
Semiannual Report
Notes to Financial Statements - continued
(Amounts in thousands except percentages)
3. Significant Accounting Policies - continued
Investment Valuation - continued
Changes in valuation techniques may result in transfers in or out of an assigned level within the disclosure hierarchy. The aggregate value of investments by input level, as of September 30, 2013 is included at the end of the Fund's Schedule of Investments.
Foreign Currency. The Fund may use foreign currency contracts to facilitate transactions in foreign-denominated securities. Gains and losses from these transactions may arise from changes in the value of the foreign currency or if the counterparties do not perform under the contracts' terms.
Foreign-denominated assets, including investment securities, and liabilities are translated into U.S. dollars at the exchange rates at period end. Purchases and sales of investment securities, income and dividends received and expenses denominated in foreign currencies are translated into U.S. dollars at the exchange rate in effect on the transaction date.
The effects of exchange rate fluctuations on investments are included with the net realized and unrealized gain (loss) on investment securities. Other foreign currency transactions resulting in realized and unrealized gain (loss) are disclosed separately.
Investment Transactions and Income. For financial reporting purposes, the Fund's investment holdings and NAV include trades executed through the end of the last business day of the period. The NAV per share for processing shareholder transactions is calculated as of the close of business of the New York Stock Exchange (NYSE), normally 4:00 p.m. Eastern time and includes trades executed through the end of the prior business day. Gains and losses on securities sold are determined on the basis of identified cost and may include proceeds received from litigation. Dividend income is recorded on the ex-dividend date, except for certain dividends from foreign securities where the ex-dividend date may have passed, which are recorded as soon as the Fund is informed of the ex-dividend date. Non-cash dividends included in dividend income, if any, are recorded at the fair market value of the securities received. Distributions received on securities that represent a return of capital or capital gain are recorded as a reduction of cost of investments and/or as a realized gain. Subsequent to ex-dividend date the Fund determines the components of these distributions, based upon receipt of tax filings or other correspondence relating to the underlying investment. Interest income and distributions from the Fidelity Central Funds are accrued as earned. Interest income includes coupon interest and amortization of premium and accretion of discount on debt securities. Investment income is recorded net of foreign taxes withheld where recovery of such taxes is uncertain.
Semiannual Report
3. Significant Accounting Policies - continued
Class Allocations and Expenses. Investment income, realized and unrealized capital gains and losses, common expenses of the Fund, and certain fund-level expense reductions, if any, are allocated daily on a pro-rata basis to each class based on the relative net assets of each class to the total net assets of the Fund. Each class differs with respect to transfer agent fees incurred. Certain expense reductions may also differ by class. For the reporting period, the allocated portion of income and expenses to each class as a percent of its average net assets may vary due to the timing of recording these transactions in relation to fluctuating net assets of the classes. Expenses directly attributable to a fund are charged to that fund. Expenses attributable to more than one fund are allocated among the respective funds on the basis of relative net assets or other appropriate methods. Expense estimates are accrued in the period to which they relate and adjustments are made when actual amounts are known.
Deferred Trustee Compensation. Under a Deferred Compensation Plan (the Plan), independent Trustees may elect to defer receipt of a portion of their annual compensation. Deferred amounts are invested in a cross-section of Fidelity funds, are marked-to-market and remain in the Fund until distributed in accordance with the Plan. The investment of deferred amounts and the offsetting payable to the Trustees are included in the accompanying Statement of Assets and Liabilities.
Income Tax Information and Distributions to Shareholders. Each year, the Fund intends to qualify as a regulated investment company under Subchapter M of the Internal Revenue Code, including distributing substantially all of its taxable income and realized gains. As a result, no provision for U.S. Federal income taxes is required. The Fund files a U.S. federal tax return, in addition to state and local tax returns as required. The Fund's federal income tax returns are subject to examination by the Internal Revenue Service (IRS) for a period of three fiscal years after they are filed. State and local tax returns may be subject to examination for an additional fiscal year depending on the jurisdiction. Foreign taxes are provided for based on the Fund's understanding of the tax rules and rates that exist in the foreign markets in which it invests.
Distributions are declared and recorded on the ex-dividend date. Income dividends and capital gain distributions are declared separately for each class. Income and capital gain distributions are determined in accordance with income tax regulations, which may differ from GAAP.
Capital accounts within the financial statements are adjusted for permanent book-tax differences. These adjustments have no impact on net assets or the results of operations. Temporary book-tax differences will reverse in a subsequent period.
Semiannual Report
Notes to Financial Statements - continued
(Amounts in thousands except percentages)
3. Significant Accounting Policies - continued
Income Tax Information and Distributions to Shareholders - continued
Book-tax differences are primarily due to futures contracts, foreign currency transactions, passive foreign investment companies (PFIC), contingent interest, partnerships, deferred trustees compensation, capital loss carryforwards and losses deferred due to wash sales and excise tax regulations.
The federal tax cost of investment securities and unrealized appreciation (depreciation) as of period end were as follows:
Gross unrealized appreciation | $ 3,251,696 |
Gross unrealized depreciation | (131,579) |
Net unrealized appreciation (depreciation) on securities and other investments | $ 3,120,117 |
| |
Tax cost | $ 11,986,564 |
Restricted Securities. The Fund may invest in securities that are subject to legal or contractual restrictions on resale. These securities generally may be resold in transactions exempt from registration or to the public if the securities are registered. Disposal of these securities may involve time-consuming negotiations and expense, and prompt sale at an acceptable price may be difficult. Information regarding restricted securities is included at the end of the Fund's Schedule of Investments.
4. Derivative Instruments.
Risk Exposures and the Use of Derivative Instruments. The Fund's investment objective allows the Fund to enter into various types of derivative contracts, including futures contracts. Derivatives are investments whose value is primarily derived from underlying assets, indices or reference rates and may be transacted on an exchange or over-the-counter (OTC). Derivatives may involve a future commitment to buy or sell a specified asset based on specified terms, to exchange future cash flows at periodic intervals based on a notional principal amount, or for one party to make one or more payments upon the occurrence of specified events in exchange for periodic payments from the other party.
The Fund used derivatives to increase returns and to manage exposure to certain risks as defined below. The success of any strategy involving derivatives depends on analysis of numerous economic factors, and if the strategies for investment do not work as intended, the Fund may not achieve its objectives.
Semiannual Report
4. Derivative Instruments - continued
Risk Exposures and the Use of Derivative Instruments - continued
The Fund's use of derivatives increased or decreased its exposure to the following risk:
Equity Risk | Equity risk relates to the fluctuations in the value of financial instruments as a result of changes in market prices (other than those arising from interest rate risk or foreign exchange risk), whether caused by factors specific to an individual investment, its issuer, or all factors affecting all instruments traded in a market or market segment. |
The Fund is also exposed to additional risks from investing in derivatives, such as liquidity risk and counterparty credit risk. Liquidity risk is the risk that the Fund will be unable to close out the derivative in the open market in a timely manner. Counterparty credit risk is the risk that the counterparty will not be able to fulfill its obligation to the Fund. Counterparty credit risk related to exchange-traded futures contracts may be mitigated by the protection provided by the exchange on which they trade.
Investing in derivatives may involve greater risks than investing in the underlying assets directly and, to varying degrees, may involve risk of loss in excess of any initial investment and collateral received and amounts recognized in the Statement of Assets and Liabilities. In addition, there may be the risk that the change in value of the derivative contract does not correspond to the change in value of the underlying instrument.
Futures Contracts. A futures contract is an agreement between two parties to buy or sell a specified underlying instrument for a fixed price at a specified future date. The Fund used futures contracts to manage its exposure to the stock market.
Upon entering into a futures contract, a fund is required to deposit either cash or securities (initial margin) with a clearing broker in an amount equal to a certain percentage of the face value of the contract. Futures contracts are marked-to-market daily and subsequent daily payments (variation margin) are made or received by a fund depending on the daily fluctuations in the value of the futures contracts and are recorded as unrealized appreciation or (depreciation). This receivable and/or payable, if any, is included in daily variation margin for derivative instruments in the Statement of Assets and Liabilities. Realized gain or (loss) is recorded upon the expiration or closing of a futures contract.
Any open futures contracts at period end are presented in the Schedule of Investments under the caption "Futures Contracts." The underlying face amount at value reflects each contract's exposure to the underlying instrument or index at period end.
During the period the Fund recognized net realized gain (loss) of $9,288 related to its investment in futures contracts. This amount is included in the Statement of Operations.
Semiannual Report
Notes to Financial Statements - continued
(Amounts in thousands except percentages)
5. Purchases and Sales of Investments.
Purchases and sales of securities, other than short-term securities, aggregated $5,091,156 and $6,279,465, respectively.
6. Fees and Other Transactions with Affiliates.
Management Fee. FMR and its affiliates provide the Fund with investment management related services for which the Fund pays a monthly management fee. The management fee is the sum of an individual fund fee rate that is based on an annual rate of .30% of the Fund's average net assets and an annualized group fee rate that averaged .25% during the period. The group fee rate is based upon the average net assets of all the mutual funds advised by FMR, including any mutual funds previously advised by FMR that are currently advised by Fidelity SelectCo, LLC, an affiliate of FMR. The group fee rate decreases as assets under management increase and increases as assets under management decrease. In addition, the management fee is subject to a performance adjustment (up to a maximum of ±.20% of the Fund's average net assets over a 36 month performance period). The upward or downward adjustment to the management fee is based on the relative investment performance of Magellan as compared to an appropriate benchmark index over the same 36 month performance period. For the reporting period, the total annualized management fee rate, including the performance adjustment, was .32% of the Fund's average net assets. The performance adjustment included in the management fee rate may be higher or lower than the maximum performance adjustment rate due to the difference between the average net assets for the reporting and performance periods.
Transfer Agent Fees. Fidelity Investments Institutional Operations Company, Inc., (FIIOC), an affiliate of FMR, is the transfer, dividend disbursing and shareholder servicing agent for each class of the Fund. FIIOC receives account fees and asset-based fees that vary according to the account size and type of account of the shareholders of Magellan. FIIOC receives an asset-based fee of Class K's average net assets. FIIOC pays for typesetting, printing and mailing of shareholder reports, except proxy statements.
For the period, transfer agent fees for each class were as follows:
| Amount | % of
Average
Net Assets* |
Magellan | $ 9,953 | .16 |
Class K | 611 | .05 |
| $ 10,564 | |
* Annualized
Semiannual Report
6. Fees and Other Transactions with Affiliates - continued
Accounting and Security Lending Fees. Fidelity Service Company, Inc. (FSC), an affiliate of FMR, maintains the Fund's accounting records. The accounting fee is based on the level of average net assets for each month. Under a separate contract, FSC administers the security lending program. The security lending fee is based on the number and duration of lending transactions.
Brokerage Commissions. The Fund placed a portion of its portfolio transactions with brokerage firms which are affiliates of the investment adviser. Brokerage commissions are included in net realized gain (loss) and change in net unrealized appreciation (depreciation) in the Statement of Operations. The commissions paid to these affiliated firms were $164 for the period.
Other. During the period, FMR reimbursed the Fund for certain losses in the amount of $54.
7. Committed Line of Credit.
The Fund participates with other funds managed by FMR or an affiliate in a $4.25 billion credit facility (the "line of credit") to be utilized for temporary or emergency purposes to fund shareholder redemptions or for other short-term liquidity purposes. The Fund has agreed to pay commitment fees on its pro-rata portion of the line of credit, which amounted to $7 and is reflected in Miscellaneous expenses on the Statement of Operations. During the period, there were no borrowings on this line of credit.
8. Security Lending.
The Fund lends portfolio securities through a lending agent from time to time in order to earn additional income. For equity securities, a lending agent is used and may loan securities to certain qualified borrowers, including Fidelity Capital Markets (FCM), a broker-dealer affiliated with the Fund. On the settlement date of the loan, the Fund receives collateral (in the form of U.S. Treasury obligations, letters of credit and/or cash) against the loaned securities and maintains collateral in an amount not less than 100% of the market value of the loaned securities during the period of the loan. The market value of the loaned securities is determined at the close of business of the Fund and any additional required collateral is delivered to the Fund on the next business day. If the borrower defaults on its obligation to return the securities loaned because of insolvency or other reasons, the Fund may apply collateral received from the borrower against the obligation. The Fund may experience delays and costs in recovering the securities loaned. Any cash collateral received is invested in the Fidelity Securities Lending Cash Central Fund. The value of loaned securities and cash collateral at period end are disclosed on the Fund's Statement of Assets and Liabilities. The value of securities loaned to FCM at period end was $255. Security lending income represents the income
Semiannual Report
Notes to Financial Statements - continued
(Amounts in thousands except percentages)
8. Security Lending - continued
earned on investing cash collateral, less rebates paid to borrowers and any lending agent fees associated with the loan, plus any premium payments received for lending certain types of securities. Security lending income is presented in the Statement of Operations as a component of income from Fidelity Central Funds. Total security lending income during the period amounted to $542, including $1 from securities loaned to FCM.
9. Expense Reductions.
Commissions paid to certain brokers with whom FMR, or its affiliates, places trades on behalf of the Fund include an amount in addition to trade execution, which may be rebated back to the Fund to offset certain expenses. This amount totaled $9 for the period.
In addition, FMR reimbursed a portion of the Fund's operating expenses during the period in the amount of $77.
10. Distributions to Shareholders.
Distributions to shareholders of each class were as follows:
| Six months ended
September 30, 2013 | Year ended
March 31, 2013 |
From net investment income | | |
Magellan | $ 8,666 | $ 166,004 |
Class K | 2,406 | 35,831 |
Total | $ 11,072 | $ 201,835 |
From net realized gain | | |
Magellan | $ 49,105 | $ 3,417 |
Class K | 9,595 | 680 |
Total | $ 58,700 | $ 4,097 |
11. Share Transactions.
Transactions for each class of shares were as follows:
| Shares | Dollars |
| Six months ended September 30, 2013 | Year ended
March 31,
2013 | Six months ended September 30, 2013 | Year ended
March 31,
2013 |
Magellan | | | | |
Shares sold | 1,405 | 3,516 | $ 118,366 | $ 256,383 |
Reinvestment of distributions | 678 | 2,238 | 55,145 | 161,604 |
Shares redeemed | (15,311) | (37,834) | (1,286,803) | (2,743,347) |
Net increase (decrease) | (13,228) | (32,080) | $ (1,113,292) | $ (2,325,360) |
Semiannual Report
11. Share Transactions - continued
| Shares | Dollars |
| Six months ended September 30, 2013 | Year ended
March 31,
2013 | Six months ended September 30, 2013 | Year ended
March 31,
2013 |
Class K | | | | |
Shares sold | 998 | 7,910 | $ 84,530 | $ 566,429 |
Reinvestment of distributions | 148 | 506 | 12,001 | 36,510 |
Shares redeemed | (3,198) | (16,489) | (269,884) | (1,193,749) |
Net increase (decrease) | (2,052) | (8,073) | $ (173,353) | $ (590,810) |
12. Other.
The Fund's organizational documents provide former and current trustees and officers with a limited indemnification against liabilities arising in connection with the performance of their duties to the Fund. In the normal course of business, the Fund may also enter into contracts that provide general indemnifications. The Fund's maximum exposure under these arrangements is unknown as this would be dependent on future claims that may be made against the Fund. The risk of material loss from such claims is considered remote.
Semiannual Report
To the Trustees and Shareholders of Fidelity Magellan Fund:
In our opinion, the accompanying statement of assets and liabilities, including the schedule of investments, and the related statements of operations and of changes in net assets and the financial highlights present fairly, in all material respects, the financial position of Fidelity Magellan Fund at September 30, 2013, the results of its operations for the period then ended, the changes in its net assets for each of the two periods then ended and the financial highlights for the periods indicated, in conformity with accounting principles generally accepted in the United States of America. These financial statements and financial highlights (hereafter referred to as "financial statements") are the responsibility of the Fidelity Magellan Fund's management. Our responsibility is to express an opinion on these financial statements based on our audits. We conducted our audits of these financial statements in accordance with the standards of the Public Company Accounting Oversight Board (United States). Those standards require that we plan and perform the audit to obtain reasonable assurance about whether the financial statements are free of material misstatement. An audit includes examining, on a test basis, evidence supporting the amounts and disclosures in the financial statements, assessing the accounting principles used and significant estimates made by management, and evaluating the overall financial statement presentation. We believe that our audits, which included confirmation of securities at September 30, 2013 by correspondence with the custodian and brokers, provide a reasonable basis for our opinion.
PricewaterhouseCoopers LLP
Boston, Massachusetts
November 8, 2013
Semiannual Report
Board Approval of Investment Advisory Contracts and Management Fees
Fidelity Magellan Fund
Each year, the Board of Trustees, including the Independent Trustees (together, the Board), votes on the renewal of the management contract and sub-advisory agreements (together, the Advisory Contracts) for the fund. The Board, assisted by the advice of fund counsel and Independent Trustees' counsel, requests and considers a broad range of information relevant to the renewal of the Advisory Contracts throughout the year.
The Board meets regularly and, at each of its meetings, covers an extensive agenda of topics and materials and considers factors that are relevant to its annual consideration of the renewal of the fund's Advisory Contracts, including the services and support provided to the fund and its shareholders. The Board has established various standing committees, each composed of and chaired by Independent Trustees with varying backgrounds, to which the Board has assigned specific subject matter responsibilities in order to enhance effective decision-making by the Board. The Board, acting directly and through its Committees, requests and receives information concerning the annual consideration of the renewal of the fund's Advisory Contracts. The Board also meets as needed to consider matters specifically related to the Board's annual consideration of the renewal of Advisory Contracts. Members of the Board may also meet with trustees of other Fidelity funds through ad hoc joint committees to discuss certain matters relevant to the Fidelity funds.
At its July 2013 meeting, the Board, including the Independent Trustees, unanimously determined to renew the fund's Advisory Contracts. In reaching its determination, the Board considered all factors it believed relevant, including (i) the nature, extent, and quality of the services to be provided to the fund and its shareholders (including the investment performance of the fund); (ii) the competitiveness of the fund's management fee and total expense ratio relative to peer funds; (iii) the total costs of the services to be provided by and the profits to be realized by Fidelity from its relationship with the fund; (iv) the extent to which economies of scale exist and would be realized as the fund grows; and (v) whether fee levels reflect these economies of scale, if any, for the benefit of fund shareholders.
In considering whether to renew the Advisory Contracts for the fund, the Board reached a determination, with the assistance of fund counsel and Independent Trustees' counsel and through the exercise of its business judgment, that the renewal of the Advisory Contracts was in the best interests of the fund and its shareholders and that the compensation payable under the Advisory Contracts was fair and reasonable. The Board's decision to renew the Advisory Contracts was not based on any single factor, but rather was based on a comprehensive consideration of all the information provided to the Board at its meetings throughout the year. The Board, in reaching its determination to renew the Advisory Contracts, was aware that shareholders in the fund have a broad range of investment choices available to them, including a wide choice among mutual funds offered by Fidelity's competitors, and that the fund's shareholders, who have the opportunity to review and weigh the disclosure provided by the fund in its prospectus and other public disclosures, have chosen to invest in this fund, which is a part of the Fidelity family of funds.
Semiannual Report
Nature, Extent, and Quality of Services Provided. The Board considered the staffing within the investment adviser, Fidelity Management & Research Company (FMR), and the sub-advisers (together, the Investment Advisers) as it relates to the fund, including the backgrounds of the fund's investment personnel, and also considered the fund's investment objective, strategies, and related investment philosophy. The Independent Trustees also had discussions with senior management of Fidelity's investment operations and investment groups. The Board considered the structure of the portfolio manager compensation program and whether this structure provides appropriate incentives to act in the best interests of the fund.
Resources Dedicated to Investment Management and Support Services. The Board and the Fund Oversight and Research Committees reviewed the general qualifications and capabilities of the Investment Advisers' investment staff, including its size, education, experience, and resources, as well as the Investment Advisers' approach to recruiting, training, managing, and compensating investment personnel. The Board noted that FMR has continued to increase the resources devoted to non-U.S. offices, including expansion of Fidelity's global investment organization. The Board also noted that Fidelity's analysts have extensive resources, tools and capabilities that allow them to conduct sophisticated quantitative and fundamental analysis, as well as credit analysis of issuers, counterparties and guarantors. Further, the Board believes that Fidelity's investment professionals have sufficient access to global information and data so as to provide competitive investment results over time, and that those professionals also have access to sophisticated tools that permit them to assess portfolio construction and risk and performance attribution characteristics continuously, as well as to transmit new information and research conclusions rapidly around the world. Additionally, in its deliberations, the Board considered the Investment Advisers' trading and risk management capabilities and resources, which are an integral part of the investment management process.
Shareholder and Administrative Services. The Board considered (i) the nature, extent, quality, and cost of advisory, administrative, and shareholder services performed by the Investment Advisers and their affiliates under the Advisory Contracts and under separate agreements covering transfer agency, pricing and bookkeeping, and securities lending services for the fund; (ii) the nature and extent of the supervision of third party service providers, principally custodians and subcustodians; and (iii) the resources devoted to, and the record of compliance with, the fund's compliance policies and procedures. The Board also reviewed the allocation of fund brokerage, including allocations to brokers affiliated with the Investment Advisers, the use of brokerage commissions to pay fund expenses, and the use of "soft" commission dollars to pay for research services.
Semiannual Report
Board Approval of Investment Advisory Contracts and
Management Fees - continued
The Board noted that the growth of fund assets over time across the complex allows Fidelity to reinvest in the development of services designed to enhance the value or convenience of the Fidelity funds as investment vehicles. These services include 24-hour access to account information and market information through telephone representatives and over the Internet, investor education materials and asset allocation tools, and the expanded availability of Fidelity Investor Centers.
Investment in a Large Fund Family. The Board considered the benefits to shareholders of investing in a Fidelity fund, including the benefits of investing in a fund that is part of a large family of funds offering a variety of investment disciplines and providing a large variety of mutual fund investor services. The Board noted that Fidelity had taken, or had made recommendations that resulted in the Fidelity funds taking, a number of actions over the previous year that benefited particular funds, including (i) continuing to dedicate additional resources to investment research and to the support of the senior management team that oversees asset management; (ii) persisting in efforts to enhance Fidelity's global research capabilities; (iii) launching new funds and making other enhancements to meet client needs for global and income-oriented solutions; (iv) continuing to launch dedicated lower cost underlying funds to meet portfolio construction needs related to expanding underlying fund options for Fidelity funds of funds, specifically for the Freedom Fund product lines; (v) rationalizing product lines and gaining increased efficiencies through the mergers of several funds into other funds; (vi) strengthening Fidelity's index fund offerings by reducing investment minimums and adopting or lowering existing expense caps for certain funds and classes; (vii) enhancing Global Asset Allocation product offerings by launching new funds and strategies, including "open architecture" target date funds that utilize affiliated and unaffiliated sub-advisers; (viii) modifying the eligibility criteria for Institutional Class shares of Advisor funds to increase their marketability to a portion of the defined contribution plan market; (ix) creating a new low-cost retirement share class for certain Advisor funds to appeal to large retirement plans; (x) transitioning the management of certain Fidelity commodity funds to Geode Capital Management LLC, a registered commodity pool operator, while retaining administrative responsibilities for the funds; (xi) reorganizing a number of funds; and (xii) taking steps toward establishing a new Fidelity adviser to manage sector-based funds and products.
Investment Performance. The Board considered whether the fund has operated in accordance with its investment objective, as well as its record of compliance with its investment restrictions and its performance history. The Board noted that there was a portfolio management change for the fund in September 2011.
Semiannual Report
The Board took into account discussions with the Investment Advisers about fund investment performance that occur at Board meetings throughout the year. In this regard the Board noted that as part of regularly scheduled fund reviews and other reports to the Board on fund performance, the Board periodically considers annualized return information for the fund, for different time periods, measured against a securities market index ("benchmark index") and a peer group of mutual funds with similar objectives ("peer group"). In its evaluation of fund investment performance, the Board gave particular attention to information indicating changes in performance of certain Fidelity funds for specific time periods and the Investment Advisers' explanations for any overperformance or, in the case of the fund, underperformance.
In addition to reviewing absolute and relative fund performance, the Independent Trustees periodically consider the appropriateness of fund performance metrics in evaluating the results achieved. In general, the Independent Trustees believe that fund performance should be evaluated based on net performance (after fees and expenses) of both the highest performing and lowest performing classes, where applicable, compared to appropriate benchmark indices, over appropriate time periods which may include full market cycles, and compared to peer groups, as applicable, over the same periods, taking into account relevant factors including the following: general market conditions; issuer-specific information; tactical opportunities for investment; and fund cash flows and other factors.
The Independent Trustees recognize that shareholders evaluate performance on a net basis over their own holding periods, for which one-, three-, and five-year periods are used as a proxy. For this reason, the performance information reviewed by the Board also included net cumulative calendar year total return information for the fund and an appropriate benchmark index and peer group for the most recent one-, three-, and five-year periods, as shown below. Returns are shown compared to the 25th percentile (top of box) and 75th percentile (bottom of box) of the peer universe.
Semiannual Report
Board Approval of Investment Advisory Contracts and
Management Fees - continued
Fidelity Magellan Fund

The Board has discussed the fund's performance with FMR, including the fund's underperformance based on more recent periods ended after 2012 (which periods are not shown in the chart above) but prior to the date of the Board's approval of the renewal of the Advisory Contracts, and has engaged with FMR to consider what steps might be taken to remediate the fund's more recent underperformance.
The Board also considered that the fund's management fee is subject to upward or downward adjustment depending upon whether, and to what extent, the fund's investment performance for the performance period exceeds, or is exceeded by, a securities index, thus leading to a performance adjustment for the same period. The Board noted that the performance adjustment provides FMR with a strong economic incentive to seek to achieve superior performance for the fund's shareholders and helps to more closely align the interests of FMR and the fund's shareholders.
Based on its review, the Board concluded that the nature, extent, and quality of services provided to the fund under the Advisory Contracts should benefit the fund's shareholders.
Competitiveness of Management Fee and Total Expense Ratio. The Board considered the fund's management fee and total expense ratio compared to "mapped groups" of competitive funds and classes. Fidelity creates "mapped groups" by combining similar Lipper investment objective categories that have comparable management fee characteristics. Combining Lipper investment objective categories aids the Board's management fee and total expense ratio comparisons by broadening the competitive group used for comparison and by reducing the number of universes to which various Fidelity funds are compared.
Semiannual Report
Management Fee. The Board considered two proprietary management fee comparisons for the 12-month periods shown in the chart below. The group of Lipper funds used by the Board for management fee comparisons is referred to below as the "Total Mapped Group." The Total Mapped Group comparison focuses on a fund's standing in terms of gross management fees before expense reimbursements or caps, and without giving effect to the fund's performance adjustment, relative to the total universe of funds with comparable investment mandates, regardless of whether their management fee structures also are comparable. Funds with comparable investment mandates offer exposure to similar types of securities. Funds with comparable management fee structures have similar management fee contractual arrangements (e.g., flat rate charged for advisory services, all-inclusive fee rate, etc.). "TMG %" represents the percentage of funds in the Total Mapped Group that had management fees that were lower than the fund's. For example, a TMG % of 11% means that 89% of the funds in the Total Mapped Group had higher management fees than the fund. The "Asset-Size Peer Group" (ASPG) comparison focuses on a fund's standing relative to a subset of non-Fidelity funds within the Total Mapped Group that are similar in size and management fee structure. The ASPG represents at least 15% of the funds in the Total Mapped Group with comparable asset size and management fee structures, subject to a minimum of 50 funds (or all funds in the Total Mapped Group if fewer than 50). Additional information, such as the ASPG quartile in which the fund's management fee ranked and the impact of the fund's performance adjustment, is also included in the chart and considered by the Board.
Fidelity Magellan Fund

Semiannual Report
Board Approval of Investment Advisory Contracts and
Management Fees - continued
The Board noted that the fund's management fee ranked below the median of its Total Mapped Group and below the median of its ASPG for 2012. The Board also noted the effect of the fund's negative performance adjustment on the fund's management fee ranking.
Based on its review, the Board concluded that the fund's management fee is fair and reasonable in light of the services that the fund receives and the other factors considered.
Total Expense Ratio. In its review of each class's total expense ratio, the Board considered the fund's management fee as well as other fund or class expenses, as applicable, such as transfer agent fees, pricing and bookkeeping fees, and custodial, legal, and audit fees. The Board also noted the effects of any waivers and reimbursements on fees and expenses, as well as the impact of the fund's performance adjustment. As part of its review, the Board also considered the current and historical total expense ratios of each class of the fund compared to competitive fund median expenses. Each class of the fund is compared to those funds and classes in the Total Mapped Group (used by the Board for management fee comparisons) that have a similar sales load structure.
The Board noted that the total expense ratio of each class ranked below its competitive median for 2012.
Fees Charged to Other Fidelity Clients. The Board also considered Fidelity fee structures and other information with respect to clients of FMR and its affiliates, such as other mutual funds advised or subadvised by FMR or its affiliates, pension plan clients, and other institutional clients. The Board noted the findings of the 2013 ad hoc joint committee (created with the board of other Fidelity funds), which reviewed and compared Fidelity's institutional investment advisory business with its business of providing services to the Fidelity funds, including the differences in services provided, fees charged, and costs incurred, as well as competition in their respective marketplaces.
Based on its review of total expense ratios and fees charged to other Fidelity clients, the Board concluded that the total expense ratio of each class of the fund was reasonable in light of the services that the fund and its shareholders receive and the other factors considered.
Costs of the Services and Profitability. The Board considered the revenues earned and the expenses incurred by Fidelity in conducting the business of developing, marketing, distributing, managing, administering and servicing the fund and servicing the fund's shareholders. The Board also considered the level of Fidelity's profits in respect of all the Fidelity funds.
On an annual basis, FMR presents to the Board Fidelity's profitability for the fund. Fidelity calculates the profitability for each fund, as well as aggregate profitability for groups of Fidelity funds and all Fidelity funds, using a series of detailed revenue and cost allocation methodologies which originate with the books and records of Fidelity on which Fidelity's audited financial statements are based. The Audit Committee of the Board reviews any significant changes from the prior year's methodologies.
Semiannual Report
PricewaterhouseCoopers LLP (PwC), independent registered public accounting firm and auditor to Fidelity and certain Fidelity funds, has been engaged annually by the Board as part of the Board's assessment of Fidelity's profitability analysis. PwC's engagement includes the review and assessment of the methodologies used by Fidelity in determining the revenues and expenses attributable to Fidelity's mutual fund business, and completion of agreed-upon procedures surrounding the mathematical accuracy of fund profitability and its conformity to allocation methodologies. After considering PwC's reports issued under the engagement and information provided by Fidelity, the Board concluded that while other allocation methods may also be reasonable, Fidelity's profitability methodologies are reasonable in all material respects.
The Board also reviewed Fidelity's non-fund businesses and fall-out benefits related to the mutual fund business as well as cases where Fidelity's affiliates may benefit from or be related to the fund's business.
The Board considered the costs of the services provided by and the profits realized by Fidelity in connection with the operation of the fund and was satisfied that the profitability was not excessive in the circumstances.
Economies of Scale. The Board considered whether there have been economies of scale in respect of the management of the Fidelity funds, whether the Fidelity funds (including the fund) have appropriately benefited from any such economies of scale, and whether there is potential for realization of any further economies of scale. The Board considered the extent to which the fund will benefit from economies of scale through increased services to the fund, through waivers or reimbursements, or through fee or expense reductions. The Board also noted that in 2009, it and the board of other Fidelity funds created an ad hoc committee (the Economies of Scale Committee) to analyze whether FMR attains economies of scale in respect of the management and servicing of the Fidelity funds, whether the Fidelity funds have appropriately benefited from such economies of scale, and whether there is potential for realization of any further economies of scale.
The Board recognized that the fund's management contract incorporates a "group fee" structure, which provides for lower group fee rates as total fund assets under FMR's management increase, and for higher group fee rates as total fund assets under FMR's management decrease. FMR calculates the group fee rates based on a tiered asset "breakpoint" schedule that varies based on asset class. The Board considered that the group fee is designed to deliver the benefits of economies of scale to fund shareholders when total Fidelity fund assets increase, even if assets of any particular fund are unchanged or have declined, because some portion of Fidelity's costs are attributable to services provided to all Fidelity funds, and all funds benefit if those costs can be allocated among more assets. The Board concluded that, given the group fee structure, fund shareholders will benefit from lower management fees as assets under FMR's management increase at the fund complex level, regardless of whether Fidelity achieves any such economies of scale.
Semiannual Report
Board Approval of Investment Advisory Contracts and
Management Fees - continued
The Board concluded, taking into account the analysis of the Economies of Scale Committee, that economies of scale, if any, are being appropriately shared between fund shareholders and Fidelity.
Amendment to Description of Group Fee Rate. At its July 2013 meeting, the Board voted to approve an amendment to the fund's management contract to modify the description of the "group fee rate" effective August 1, 2013. The Board noted that under the prior description in the contract, the group fee rate was based on the average net assets of all registered investment companies with which FMR has management contracts. Under the contract's tiered asset breakpoint schedule, the group fee rate is lower as total fund assets under FMR's management increase, and higher as total fund assets under FMR's management decrease. The Board considered that the prior description would have excluded the assets of 64 Fidelity sector funds from the group fee rate calculation once Fidelity SelectCo, LLC, an affiliate of FMR, assumed management responsibilities for those funds. The Board noted that modifying the description of the group fee rate to continue to include the assets of those 64 funds for purposes of determining group fee rate breakpoints would avoid an immediate adverse impact on the group fee rate for any fund.
Additional Information Requested by the Board. In order to develop fully the factual basis for consideration of the Fidelity funds' Advisory Contracts, the Board requested and received additional information on certain topics, including: (i) fund performance trends and Fidelity's long-term strategies for certain funds; (ii) the potential to further rationalize the Fidelity fund lineup with the possibility of achieving savings for the funds and Fidelity; (iii) the methodology with respect to competitive fund data and peer group classifications; (iv) the arrangements with, and performance of, certain sub-advisers on behalf of the Fidelity funds, as well as certain proposed participating affiliate arrangements; (v) the realization of fall-out benefits in certain Fidelity business units; (vi) Fidelity's group fee structures, including the rationale for the individual fee rates of certain categories of funds and the definition of group assets; (vii) trends regarding industry use of performance fee structures and the performance adjustment methodologies applicable to the Fidelity funds; (viii) additional competitive analysis regarding the total expenses for certain classes; and (ix) fund profitability methodology, including Fidelity's cost allocation methodology, and the impact of certain factors on fund profitability results.
Semiannual Report
Based on its evaluation of all of the conclusions noted above, and after considering all factors it believed relevant, the Board ultimately concluded that the advisory fee structures are fair and reasonable, and that the fund's Advisory Contracts should be renewed.
Semiannual Report
Investment Adviser
Fidelity Management &
Research Company
Boston, MA
Investment Sub-Advisers
FMR Co., Inc.
Fidelity Management & Research
(U.K.) Inc.
Fidelity Management & Research
(Japan) Inc.
Fidelity Management & Research
(Hong Kong) Limited
General Distributor
Fidelity Distributors Corporation
Smithfield, RI
Transfer and Service Agents
Fidelity Investments Institutional
Operations Company, Inc.
Boston, MA
Fidelity Service Company, Inc.
Boston, MA
Custodian
State Street Bank and Trust Company Quincy, MA
The Fidelity Telephone Connection
Mutual Fund 24-Hour Service
Exchanges/Redemptions
and Account Assistance 1-800-544-6666
Product Information 1-800-544-6666
Retirement Accounts 1-800-544-4774
(8 a.m. - 9 p.m.)
TDD Service 1-800-544-0118
for the deaf and hearing impaired
(9 a.m. - 9 p.m. Eastern time)
Fidelity Automated Service
Telephone (FAST®)
1-800-544-5555
Automated line for quickest service
(Fidelity Investment logo)(registered trademark)
Corporate Headquarters
245 Summer St., Boston, MA 02210
www.fidelity.com
MAG-USAN-1113
1.792157.110
Fidelity®
Magellan®
Fund -
Class K
Semiannual Report
September 30, 2013
(Fidelity Cover Art)
Contents
Shareholder Expense Example | (Click Here) | An example of shareholder expenses. |
Investment Changes | (Click Here) | A summary of major shifts in the fund's investments over the past six months. |
Investments | (Click Here) | A complete list of the fund's investments with their market values. |
Financial Statements | (Click Here) | Statements of assets and liabilities, operations, and changes in net assets, as well as financial highlights. |
Notes | (Click Here) | Notes to the financial statements. |
Report of Independent Registered Public Accounting Firm | (Click Here) | |
Board Approval of Investment Advisory Contracts and Management Fees | (Click Here) | |
To view a fund's proxy voting guidelines and proxy voting record for the 12-month period ended June 30, visit http://www.fidelity.com/proxyvotingresults or visit the Securities and Exchange Commission's (SEC) website at http://www.sec.gov. You may also call 1-800-835-5092 to request a free copy of the proxy voting guidelines.
Standard & Poor's, S&P and S&P 500 are registered service marks of The McGraw-Hill Companies, Inc. and have been licensed for use by Fidelity Distributors Corporation.
Other third-party marks appearing herein are the property of their respective owners.
All other marks appearing herein are registered or unregistered trademarks or service marks of FMR LLC or an affiliated company. © 2013 FMR LLC. All rights reserved.
This report and the financial statements contained herein are submitted for the general information of the shareholders of the fund. This report is not authorized for distribution to prospective investors in the fund unless preceded or accompanied by an effective prospectus.
A fund files its complete schedule of portfolio holdings with the SEC for the first and third quarters of each fiscal year on Form N-Q. Forms N-Q are available on the SEC's web site at http://www.sec.gov. A fund's Forms N-Q may be reviewed and copied at the SEC's Public Reference Room in Washington, DC. Information regarding the operation of the SEC's Public Reference Room may be obtained by calling 1-800-SEC-0330. For a complete list of a fund's portfolio holdings, view the most recent holdings listing, semiannual report, or annual report on Fidelity's web site at http://www.fidelity.com, http://www.advisor.fidelity.com, or http://www.401k.com, as applicable.
NOT FDIC INSURED • MAY LOSE VALUE • NO BANK GUARANTEE
Neither the fund nor Fidelity Distributors Corporation is a bank.
Semiannual Report
Shareholder Expense Example
As a shareholder of the Fund, you incur two types of costs: (1) transaction costs, and (2) ongoing costs, including management fees and other Fund expenses. This Example is intended to help you understand your ongoing costs (in dollars) of investing in the Fund and to compare these costs with the ongoing costs of investing in other mutual funds.
The Example is based on an investment of $1,000 invested at the beginning of the period and held for the entire period (April 1, 2013 to September 30, 2013).
Actual Expenses
The first line of the accompanying table for each class of the Fund provides information about actual account values and actual expenses. You may use the information in this line, together with the amount you invested, to estimate the expenses that you paid over the period. Simply divide your account value by $1,000.00 (for example, an $8,600 account value divided by $1,000.00 = 8.6), then multiply the result by the number in the first line for a class of the Fund under the heading entitled "Expenses Paid During Period" to estimate the expenses you paid on your account during this period. A small balance maintenance fee of $12.00 that is charged once a year may apply for certain accounts with a value of less than $2,000. This fee is not included in the table below. If it was, the estimate of expenses you paid during the period would be higher, and your ending account value lower, by this amount. In addition, the Fund, as a shareholder in the underlying Fidelity Central Funds, will indirectly bear its pro-rata share of the fees and expenses incurred by the underlying Fidelity Central Funds. These fees and expenses are not included in the Fund's annualized expense ratio used to calculate the expense estimate in the table below.
Hypothetical Example for Comparison Purposes
The second line of the accompanying table for each class of the Fund provides information about hypothetical account values and hypothetical expenses based on a Class' actual expense ratio and an assumed rate of return of 5% per year before expenses, which is not the Class' actual return. The hypothetical account values and expenses may not be used to estimate the actual ending account balance or expenses you paid for the period. You may use this information to compare the ongoing costs of investing in the Fund and other funds. To do so, compare this 5% hypothetical example with the 5% hypothetical examples that appear in the shareholder reports of the other funds. A small balance maintenance fee of $12.00 that is charged once a year may apply for certain accounts with a value of less than $2,000. This fee is not included in the table below. If it was, the estimate of expenses you paid during the period would be higher, and your ending account value lower, by this amount. In addition, the Fund, as a shareholder in the underlying Fidelity Central Funds, will indirectly bear its pro-rata share of the fees and expenses incurred by the underlying Fidelity Central Funds. These fees and expenses are not included in the Fund's annualized expense ratio used to calculate the expense estimate in the table below.
Please note that the expenses shown in the table are meant to highlight your ongoing costs only and do not reflect any transaction costs. Therefore, the second line of the table is useful in comparing ongoing costs only, and will not help you determine the relative total costs of owning different funds.
Semiannual Report
Shareholder Expense Example - continued
| Annualized
Expense RatioB | Beginning
Account Value
April 1, 2013 | Ending
Account Value
September 30, 2013 | Expenses Paid
During Period*
April 1, 2013
to September 30, 2013 |
Magellan | .49% | | | |
Actual | | $ 1,000.00 | $ 1,121.50 | $ 2.61 |
HypotheticalA | | $ 1,000.00 | $ 1,022.61 | $ 2.48 |
Class K | .38% | | | |
Actual | | $ 1,000.00 | $ 1,122.10 | $ 2.02 |
HypotheticalA | | $ 1,000.00 | $ 1,023.16 | $ 1.93 |
A 5% return per year before expenses
B Annualized expense ratio reflects expenses net of applicable fee waivers.
* Expenses are equal to each Class' annualized expense ratio, multiplied by the average account value over the period, multiplied by 183/365 (to reflect the one-half year period).
Semiannual Report
Investment Changes (Unaudited)
Top Ten Stocks as of September 30, 2013 |
| % of fund's
net assets | % of fund's net assets
6 months ago |
Google, Inc. Class A | 3.6 | 3.3 |
Apple, Inc. | 3.4 | 2.0 |
Berkshire Hathaway, Inc. Class B | 2.3 | 2.4 |
Microsoft Corp. | 2.2 | 0.0 |
General Electric Co. | 2.2 | 2.1 |
Wells Fargo & Co. | 2.1 | 2.3 |
JPMorgan Chase & Co. | 2.0 | 1.3 |
Anadarko Petroleum Corp. | 2.0 | 1.5 |
Citigroup, Inc. | 2.0 | 2.0 |
Bank of America Corp. | 1.9 | 1.5 |
| 23.7 | |
Top Five Market Sectors as of September 30, 2013 |
| % of fund's
net assets | % of fund's net assets
6 months ago |
Information Technology | 20.7 | 19.5 |
Financials | 19.0 | 18.4 |
Consumer Discretionary | 14.8 | 14.3 |
Health Care | 13.9 | 12.3 |
Consumer Staples | 8.9 | 9.1 |
Asset Allocation (% of fund's net assets) |
As of September 30, 2013 * | As of March 31, 2013 ** |
 | Stocks 98.7% | | | Stocks 98.4% | |
 | Convertible
Securities 0.3% | | | Convertible
Securities 0.2% | |
 | Short-Term
Investments and
Net Other Assets (Liabilities) 1.0% | | | Short-Term
Investments and
Net Other Assets (Liabilities) 1.4% | |
* Foreign investments | 6.0% | | ** Foreign investments | 8.9% | |

Semiannual Report
Investments September 30, 2013
Showing Percentage of Net Assets
Common Stocks - 98.7% |
| Shares | | Value (000s) |
CONSUMER DISCRETIONARY - 14.7% |
Automobiles - 0.6% |
Honda Motor Co. Ltd. | 373,500 | | $ 14,276 |
Tesla Motors, Inc. (a) | 393,700 | | 76,149 |
| | 90,425 |
Diversified Consumer Services - 0.6% |
H&R Block, Inc. | 3,121,000 | | 83,206 |
Kroton Educacional SA | 1,006,500 | | 14,310 |
| | 97,516 |
Hotels, Restaurants & Leisure - 1.2% |
Bloomin' Brands, Inc. (a) | 482,360 | | 11,389 |
Brinker International, Inc. | 1,680,815 | | 68,123 |
Dunkin' Brands Group, Inc. | 664,698 | | 30,084 |
Yum! Brands, Inc. | 1,005,000 | | 71,747 |
| | 181,343 |
Household Durables - 0.9% |
D.R. Horton, Inc. | 1,177,111 | | 22,871 |
Leggett & Platt, Inc. | 1,413,000 | | 42,602 |
Lennar Corp. Class A | 746,985 | | 26,443 |
PulteGroup, Inc. | 1,017,300 | | 16,785 |
Ryland Group, Inc. | 311,960 | | 12,647 |
Toll Brothers, Inc. (a) | 674,454 | | 21,873 |
| | 143,221 |
Internet & Catalog Retail - 2.0% |
Amazon.com, Inc. (a) | 438,504 | | 137,094 |
Liberty Media Corp. Interactive Series A (a) | 1,276,000 | | 29,948 |
priceline.com, Inc. (a) | 128,500 | | 129,907 |
| | 296,949 |
Media - 2.4% |
CBS Corp. Class B | 1,559,900 | | 86,044 |
Comcast Corp. Class A | 6,062,400 | | 273,717 |
Entravision Communication Corp. Class A | 20,867 | | 123 |
| | 359,884 |
Specialty Retail - 5.7% |
Aarons, Inc. Class A | 555,300 | | 15,382 |
Best Buy Co., Inc. | 4,601,900 | | 172,571 |
Home Depot, Inc. | 3,577,000 | | 271,315 |
L Brands, Inc. | 1,492,948 | | 91,219 |
Common Stocks - continued |
| Shares | | Value (000s) |
CONSUMER DISCRETIONARY - continued |
Specialty Retail - continued |
Ross Stores, Inc. | 1,294,803 | | $ 94,262 |
TJX Companies, Inc. | 3,733,200 | | 210,515 |
| | 855,264 |
Textiles, Apparel & Luxury Goods - 1.3% |
Hanesbrands, Inc. | 245,000 | | 15,266 |
lululemon athletica, Inc. (a) | 197,999 | | 14,472 |
Michael Kors Holdings Ltd. (a) | 450,300 | | 33,556 |
Ralph Lauren Corp. | 282,200 | | 46,487 |
VF Corp. | 475,430 | | 94,634 |
| | 204,415 |
TOTAL CONSUMER DISCRETIONARY | | 2,229,017 |
CONSUMER STAPLES - 8.9% |
Beverages - 2.3% |
Anheuser-Busch InBev SA NV | 275,960 | | 27,375 |
Beam, Inc. | 631,500 | | 40,826 |
Dr. Pepper Snapple Group, Inc. | 712,373 | | 31,929 |
The Coca-Cola Co. | 6,456,902 | | 244,587 |
| | 344,717 |
Food & Staples Retailing - 2.7% |
CVS Caremark Corp. | 3,882,672 | | 220,342 |
Kroger Co. | 2,705,600 | | 109,144 |
Rite Aid Corp. (a) | 1,579,300 | | 7,517 |
Walgreen Co. | 696,500 | | 37,472 |
Whole Foods Market, Inc. | 626,426 | | 36,646 |
| | 411,121 |
Food Products - 1.0% |
Bunge Ltd. | 190,600 | | 14,468 |
Green Mountain Coffee Roasters, Inc. (a) | 611,600 | | 46,072 |
Mead Johnson Nutrition Co. Class A | 621,500 | | 46,153 |
Unilever NV (Certificaten Van Aandelen) (Bearer) | 979,200 | | 37,373 |
| | 144,066 |
Household Products - 2.7% |
Colgate-Palmolive Co. | 2,157,132 | | 127,918 |
Energizer Holdings, Inc. | 414,000 | | 37,736 |
Procter & Gamble Co. | 3,262,800 | | 246,635 |
| | 412,289 |
Common Stocks - continued |
| Shares | | Value (000s) |
CONSUMER STAPLES - continued |
Personal Products - 0.2% |
Herbalife Ltd. | 446,500 | | $ 31,152 |
TOTAL CONSUMER STAPLES | | 1,343,345 |
ENERGY - 8.0% |
Energy Equipment & Services - 1.1% |
Cameron International Corp. (a) | 504,300 | | 29,436 |
Ensco PLC Class A | 935,100 | | 50,262 |
National Oilwell Varco, Inc. | 938,400 | | 73,298 |
Oceaneering International, Inc. | 94,900 | | 7,710 |
| | 160,706 |
Oil, Gas & Consumable Fuels - 6.9% |
Anadarko Petroleum Corp. | 3,227,800 | | 300,153 |
Cabot Oil & Gas Corp. | 1,289,336 | | 48,118 |
Canadian Natural Resources Ltd. (d) | 1,382,000 | | 43,430 |
Chevron Corp. | 173,400 | | 21,068 |
Concho Resources, Inc. (a) | 172,700 | | 18,791 |
ConocoPhillips Co. | 3,079,400 | | 214,049 |
Exxon Mobil Corp. | 1,025,524 | | 88,236 |
Marathon Oil Corp. | 1,398,800 | | 48,790 |
Marathon Petroleum Corp. | 292,400 | | 18,807 |
Occidental Petroleum Corp. | 393,100 | | 36,771 |
Suncor Energy, Inc. | 4,205,900 | | 150,384 |
The Williams Companies, Inc. | 1,737,400 | | 63,172 |
| | 1,051,769 |
TOTAL ENERGY | | 1,212,475 |
FINANCIALS - 19.0% |
Capital Markets - 3.0% |
BlackRock, Inc. Class A | 262,900 | | 71,146 |
Charles Schwab Corp. | 2,844,968 | | 60,143 |
Goldman Sachs Group, Inc. | 619,500 | | 98,011 |
KKR & Co. LP | 1,762,469 | | 36,272 |
Morgan Stanley | 2,819,168 | | 75,977 |
TD Ameritrade Holding Corp. | 845,576 | | 22,137 |
The Blackstone Group LP | 1,898,800 | | 47,261 |
UBS AG (NY Shares) | 1,931,600 | | 39,636 |
Virtus Investment Partners, Inc. (a) | 22,900 | | 3,724 |
| | 454,307 |
Common Stocks - continued |
| Shares | | Value (000s) |
FINANCIALS - continued |
Commercial Banks - 3.3% |
Comerica, Inc. | 1,087,700 | | $ 42,757 |
U.S. Bancorp | 3,783,859 | | 138,414 |
Wells Fargo & Co. | 7,541,255 | | 311,605 |
| | 492,776 |
Consumer Finance - 0.6% |
Capital One Financial Corp. | 934,100 | | 64,210 |
SLM Corp. | 1,357,400 | | 33,799 |
| | 98,009 |
Diversified Financial Services - 8.3% |
Bank of America Corp. | 21,055,500 | | 290,566 |
Berkshire Hathaway, Inc. Class B (a) | 3,059,066 | | 347,235 |
Citigroup, Inc. | 6,064,916 | | 294,209 |
JPMorgan Chase & Co. | 5,887,998 | | 304,351 |
ORIX Corp. | 1,039,100 | | 16,987 |
| | 1,253,348 |
Insurance - 1.8% |
American International Group, Inc. | 3,006,700 | | 146,216 |
Genworth Financial, Inc. Class A (a) | 1,763,300 | | 22,553 |
MetLife, Inc. | 2,327,021 | | 109,254 |
| | 278,023 |
Real Estate Investment Trusts - 1.2% |
American Tower Corp. | 2,458,261 | | 182,231 |
Real Estate Management & Development - 0.3% |
Rialto Real Estate Fund LP (a)(e)(g)(h) | 500,000 | | 26,080 |
RREF CMBS AIV, LP (e)(h)(i) | 500,000 | | 16,576 |
RREF Midtown Colony REIT, Inc. (e)(h)(j) | 500,000 | | 1,473 |
| | 44,129 |
Thrifts & Mortgage Finance - 0.5% |
MGIC Investment Corp. (a) | 1,987,400 | | 14,468 |
Nationstar Mortgage Holdings, Inc. (a)(d) | 1,096,900 | | 61,679 |
| | 76,147 |
TOTAL FINANCIALS | | 2,878,970 |
HEALTH CARE - 13.9% |
Biotechnology - 6.4% |
Acorda Therapeutics, Inc. (a) | 1,761,454 | | 60,383 |
Alexion Pharmaceuticals, Inc. (a) | 1,195,760 | | 138,899 |
Alkermes PLC (a) | 711,100 | | 23,907 |
Common Stocks - continued |
| Shares | | Value (000s) |
HEALTH CARE - continued |
Biotechnology - continued |
Alnylam Pharmaceuticals, Inc. (a) | 340,171 | | $ 21,774 |
Amgen, Inc. | 2,079,577 | | 232,788 |
Amicus Therapeutics, Inc. (a)(d) | 782,383 | | 1,815 |
Biogen Idec, Inc. (a) | 469,304 | | 112,990 |
BioMarin Pharmaceutical, Inc. (a) | 93,739 | | 6,770 |
Bluebird Bio, Inc. | 27,700 | | 747 |
Bluebird Bio, Inc. | 181,073 | | 4,394 |
Clinical Data, Inc. rights 4/4/18 (a) | 988,714 | | 0 |
Enzymotec Ltd. | 392,900 | | 6,502 |
Exelixis, Inc. (a) | 1,225,184 | | 7,131 |
Gilead Sciences, Inc. (a) | 3,953,200 | | 248,419 |
KaloBios Pharmaceuticals, Inc. | 366,900 | | 1,658 |
KaloBios Pharmaceuticals, Inc. (f) | 762,146 | | 3,445 |
Medivation, Inc. (a) | 215,400 | | 12,911 |
Neurocrine Biosciences, Inc. (a) | 975,093 | | 11,038 |
Prothena Corp. PLC (a) | 85,929 | | 1,738 |
Regeneron Pharmaceuticals, Inc. (a) | 128,900 | | 40,329 |
Theravance, Inc. (a) | 449,581 | | 18,383 |
Threshold Pharmaceuticals, Inc. (a) | 2,613,700 | | 12,154 |
| | 968,175 |
Health Care Equipment & Supplies - 1.6% |
Alere, Inc. (a) | 722,311 | | 22,081 |
Boston Scientific Corp. (a) | 18,950,200 | | 222,475 |
| | 244,556 |
Health Care Technology - 1.0% |
athenahealth, Inc. (a)(d) | 299,700 | | 32,535 |
Cerner Corp. (a) | 2,040,900 | | 107,249 |
| | 139,784 |
Life Sciences Tools & Services - 0.3% |
Illumina, Inc. (a) | 566,000 | | 45,750 |
Pharmaceuticals - 4.6% |
AbbVie, Inc. | 719,400 | | 32,179 |
Actavis, Inc. | 956,900 | | 137,794 |
Bristol-Myers Squibb Co. | 786,400 | | 36,395 |
Eli Lilly & Co. | 597,779 | | 30,086 |
Merck & Co., Inc. | 3,986,200 | | 189,783 |
Perrigo Co. | 56,500 | | 6,971 |
Pfizer, Inc. | 5,074,400 | | 145,686 |
Valeant Pharmaceuticals International, Inc. (Canada) (a) | 431,000 | | 44,939 |
Common Stocks - continued |
| Shares | | Value (000s) |
HEALTH CARE - continued |
Pharmaceuticals - continued |
ViroPharma, Inc. (a) | 389,300 | | $ 15,299 |
Warner Chilcott PLC | 2,501,500 | | 57,159 |
| | 696,291 |
TOTAL HEALTH CARE | | 2,094,556 |
INDUSTRIALS - 8.7% |
Aerospace & Defense - 0.4% |
Esterline Technologies Corp. (a) | 348,760 | | 27,862 |
Textron, Inc. | 1,336,210 | | 36,893 |
| | 64,755 |
Airlines - 1.2% |
Delta Air Lines, Inc. | 5,150,000 | | 121,489 |
Spirit Airlines, Inc. (a) | 928,200 | | 31,809 |
United Continental Holdings, Inc. (a) | 781,000 | | 23,985 |
| | 177,283 |
Construction & Engineering - 0.3% |
EMCOR Group, Inc. | 693,600 | | 27,141 |
Quanta Services, Inc. (a) | 657,200 | | 18,080 |
| | 45,221 |
Electrical Equipment - 0.5% |
AMETEK, Inc. | 659,778 | | 30,363 |
EnerSys | 261,500 | | 15,855 |
Hubbell, Inc. Class B | 281,700 | | 29,505 |
| | 75,723 |
Industrial Conglomerates - 3.0% |
Danaher Corp. | 1,790,000 | | 124,083 |
General Electric Co. | 13,729,878 | | 328,007 |
| | 452,090 |
Machinery - 1.9% |
Cummins, Inc. | 503,070 | | 66,843 |
Illinois Tool Works, Inc. | 1,602,200 | | 122,200 |
Manitowoc Co., Inc. | 4,484,400 | | 87,805 |
Timken Co. | 68,345 | | 4,128 |
| | 280,976 |
Common Stocks - continued |
| Shares | | Value (000s) |
INDUSTRIALS - continued |
Professional Services - 0.6% |
Manpower, Inc. | 459,420 | | $ 33,418 |
Towers Watson & Co. | 610,781 | | 65,329 |
| | 98,747 |
Road & Rail - 0.6% |
CSX Corp. | 3,409,500 | | 87,761 |
Trading Companies & Distributors - 0.2% |
MRC Global, Inc. (a) | 1,175,400 | | 31,501 |
TOTAL INDUSTRIALS | | 1,314,057 |
INFORMATION TECHNOLOGY - 20.5% |
Communications Equipment - 2.1% |
Cisco Systems, Inc. | 6,228,900 | | 145,881 |
Juniper Networks, Inc. (a) | 4,301,600 | | 85,430 |
QUALCOMM, Inc. | 1,172,000 | | 78,946 |
| | 310,257 |
Computers & Peripherals - 3.5% |
Apple, Inc. | 1,087,159 | | 518,303 |
Stratasys Ltd. (a) | 135,400 | | 13,711 |
| | 532,014 |
Internet Software & Services - 6.9% |
Cornerstone OnDemand, Inc. (a) | 486,500 | | 25,026 |
CoStar Group, Inc. (a) | 92,000 | | 15,447 |
eBay, Inc. (a) | 1,170,600 | | 65,308 |
Facebook, Inc. Class A (a) | 3,542,800 | | 177,990 |
Google, Inc. Class A (a) | 621,200 | | 544,113 |
LinkedIn Corp. (a) | 147,800 | | 36,368 |
Marketo, Inc. | 440,917 | | 14,056 |
Rackspace Hosting, Inc. (a) | 1,419,300 | | 74,882 |
Responsys, Inc. (a) | 1,396,779 | | 23,047 |
Rocket Fuel, Inc. | 6,000 | | 322 |
Sohu.com, Inc. (a) | 211,200 | | 16,649 |
Yahoo!, Inc. (a) | 861,500 | | 28,567 |
Yelp, Inc. (a) | 375,500 | | 24,851 |
| | 1,046,626 |
IT Services - 2.6% |
Accenture PLC Class A | 850,873 | | 62,658 |
Cognizant Technology Solutions Corp. Class A (a) | 771,359 | | 63,344 |
Computer Sciences Corp. | 406,700 | | 21,043 |
Common Stocks - continued |
| Shares | | Value (000s) |
INFORMATION TECHNOLOGY - continued |
IT Services - continued |
Total System Services, Inc. | 1,849,940 | | $ 54,425 |
Visa, Inc. Class A | 1,024,800 | | 195,839 |
| | 397,309 |
Semiconductors & Semiconductor Equipment - 0.6% |
Applied Materials, Inc. | 2,144,700 | | 37,618 |
ASML Holding NV | 249,103 | | 24,601 |
Skyworks Solutions, Inc. (a) | 905,800 | | 22,500 |
| | 84,719 |
Software - 4.8% |
FireEye, Inc. | 24,131 | | 1,002 |
Guidewire Software, Inc. (a) | 520,417 | | 24,517 |
Microsoft Corp. | 9,928,400 | | 330,715 |
NetSuite, Inc. (a) | 104,040 | | 11,230 |
Oracle Corp. | 2,115,400 | | 70,168 |
salesforce.com, Inc. (a) | 1,968,481 | | 102,184 |
SS&C Technologies Holdings, Inc. (a) | 392,900 | | 14,969 |
Ultimate Software Group, Inc. (a) | 210,400 | | 31,013 |
Workday, Inc. Class A | 1,726,700 | | 139,742 |
| | 725,540 |
TOTAL INFORMATION TECHNOLOGY | | 3,096,465 |
MATERIALS - 4.2% |
Chemicals - 3.5% |
CF Industries Holdings, Inc. | 134,700 | | 28,399 |
LyondellBasell Industries NV Class A | 1,751,019 | | 128,227 |
Monsanto Co. | 2,357,884 | | 246,092 |
Potash Corp. of Saskatchewan, Inc. | 465,100 | | 14,544 |
Praxair, Inc. | 905,632 | | 108,866 |
| | 526,128 |
Construction Materials - 0.5% |
Vulcan Materials Co. | 1,597,000 | | 82,741 |
Metals & Mining - 0.2% |
Goldcorp, Inc. | 905,401 | | 23,557 |
Paper & Forest Products - 0.0% |
Boise Cascade Co. | 232,723 | | 6,272 |
TOTAL MATERIALS | | 638,698 |
Common Stocks - continued |
| Shares | | Value (000s) |
TELECOMMUNICATION SERVICES - 0.4% |
Wireless Telecommunication Services - 0.4% |
SBA Communications Corp. Class A (a) | 670,663 | | $ 53,962 |
UTILITIES - 0.4% |
Multi-Utilities - 0.4% |
Sempra Energy | 670,000 | | 57,352 |
TOTAL COMMON STOCKS (Cost $11,770,328) |
14,918,897
|
Convertible Preferred Stocks - 0.3% |
| | | |
CONSUMER DISCRETIONARY - 0.1% |
Household Durables - 0.1% |
Roku, Inc. 8.00% (h) | 12,145,838 | | 11,000 |
INFORMATION TECHNOLOGY - 0.2% |
Computers & Peripherals - 0.0% |
Pure Storage, Inc. Series E (a)(h) | 153,030 | | 2,121 |
Internet Software & Services - 0.1% |
HubSpot, Inc. (h) | 2,670,845 | | 15,000 |
Software - 0.1% |
DocuSign, Inc. Series D (a)(h) | 2,371,047 | | 11,000 |
Mobileye N.V. Series F (a)(h) | 254,387 | | 8,878 |
| | 19,878 |
TOTAL INFORMATION TECHNOLOGY | | 36,999 |
TOTAL CONVERTIBLE PREFERRED STOCKS (Cost $47,999) |
47,999
|
Money Market Funds - 0.9% |
| Shares | | Value (000s) |
Fidelity Cash Central Fund, 0.10% (b) | 81,412,542 | | $ 81,413 |
Fidelity Securities Lending Cash Central Fund, 0.09% (b)(c) | 58,371,650 | | 58,372 |
TOTAL MONEY MARKET FUNDS (Cost $139,785) |
139,785
|
TOTAL INVESTMENT PORTFOLIO - 99.9% (Cost $11,958,112) | | 15,106,681 |
NET OTHER ASSETS (LIABILITIES) - 0.1% | | 13,629 |
NET ASSETS - 100% | $ 15,120,310 |
Legend |
(a) Non-income producing |
(b) Affiliated fund that is generally available only to investment companies and other accounts managed by Fidelity Investments. The rate quoted is the annualized seven-day yield of the fund at period end. A complete unaudited listing of the fund's holdings as of its most recent quarter end is available upon request. In addition, each Fidelity Central Fund's financial statements, which are not covered by the Fund's Report of Independent Registered Public Accounting Firm, are available on the SEC's website or upon request. |
(c) Investment made with cash collateral received from securities on loan. |
(d) Security or a portion of the security is on loan at period end. |
(e) Affiliated company |
(f) Security exempt from registration under Rule 144A of the Securities Act of 1933. These securities may be resold in transactions exempt from registration, normally to qualified institutional buyers. At the end of the period, the value of these securities amounted to $3,445,000 or 0.0% of net assets. |
(g) Investment is owned by an entity that is treated as a corporation for U.S. tax purposes and is owned by the Fund. |
(h) Restricted securities - Investment in securities not registered under the Securities Act of 1933 (excluding 144A issues). At the end of the period, the value of restricted securities (excluding 144A issues) amounted to $92,128,000 or 0.6% of net assets. |
Additional information on each restricted holding is as follows: |
Security | Acquisition Date | Acquisition Cost (000s) |
DocuSign, Inc. Series D | 6/29/12 | $ 11,000 |
HubSpot, Inc. | 10/25/12 | $ 15,000 |
Mobileye N.V. Series F | 8/15/13 | $ 8,878 |
Pure Storage, Inc. Series E | 8/22/13 | $ 2,121 |
Rialto Real Estate Fund LP | 2/24/11-
8/17/12 | $ 33,049 |
RREF CMBS AIV, LP | 8/10/11-
8/17/12 | $ 15,528 |
Security | Acquisition Date | Acquisition Cost (000s) |
RREF Midtown Colony REIT, Inc. | 12/31/12 | $ 1,423 |
Roku, Inc. 8.00% | 5/7/13 | $ 11,000 |
(i) Investment represents the Fund's ownership interest in a limited partnership, which is under common ownership and management with Rialto Real Estate Fund, LP. |
(j) Investment represents the Fund's ownership interest in a real estate investment trust, which is under common ownership and management with Rialto Real Estate Fund, LP. |
Affiliated Central Funds |
Information regarding fiscal year to date income earned by the Fund from investments in Fidelity Central Funds is as follows: |
Fund | Income earned
(Amounts in thousands) |
Fidelity Cash Central Fund | $ 70 |
Fidelity Securities Lending Cash Central Fund | 542 |
Total | $ 612 |
Other Affiliated Issuers |
An affiliated company is a company in which the Fund has ownership of at least 5% of the voting securities. Fiscal year to date transactions with companies which are or were affiliates are as follows: |
Affiliate
(Amounts in thousands) | Value,
beginning of
period | Purchases | Sales
Proceeds | Dividend
Income | Value,
end of
period |
Acorda Therapeutics, Inc. | $ 61,672 | $ 10,283 | $ 16,110 | $ - | $ - |
Brinker International, Inc. | 147,919 | - | 89,426 | 959 | - |
Rialto Real Estate Fund LP | 40,891 | - | - | - | 26,080 |
RREF CMBS AIV, LP | 18,361 | - | - | 5,008 | 16,576 |
RREF Midtown Colony REIT, Inc. | 1,397 | - | - | - | 1,473 |
Total | $ 270,240 | $ 10,283 | $ 105,536 | $ 5,967 | $ 44,129 |
Other Information |
The following is a summary of the inputs used, as of September 30, 2013, involving the Fund's assets and liabilities carried at fair value. The inputs or methodology used for valuing securities may not be an indication of the risk associated with investing in those securities. For more information on valuation inputs, and their aggregation into the levels used in the table below, please refer to the Investment Valuation section in the accompanying Notes to Financial Statements. |
Valuation Inputs at Reporting Date: |
Description
(Amounts in thousands) | Total | Level 1 | Level 2 | Level 3 |
Investments in Securities: | | | | |
Equities: | | | | |
Consumer Discretionary | $ 2,240,017 | $ 2,214,741 | $ 14,276 | $ 11,000 |
Consumer Staples | 1,343,345 | 1,278,597 | 64,748 | - |
Energy | 1,212,475 | 1,212,475 | - | - |
Financials | 2,878,970 | 2,817,854 | 16,987 | 44,129 |
Health Care | 2,094,556 | 2,090,162 | 4,394 | - |
Industrials | 1,314,057 | 1,314,057 | - | - |
Information Technology | 3,133,464 | 3,096,465 | - | 36,999 |
Materials | 638,698 | 638,698 | - | - |
Telecommunication Services | 53,962 | 53,962 | - | - |
Utilities | 57,352 | 57,352 | - | - |
Money Market Funds | 139,785 | 139,785 | - | - |
Total Investments in Securities: | $ 15,106,681 | $ 14,914,148 | $ 100,405 | $ 92,128 |
See accompanying notes which are an integral part of the financial statements.
Semiannual Report
Statement of Assets and Liabilities
Amounts in thousands (except per-share amounts) | September 30, 2013 |
| | |
Assets | | |
Investment in securities, at value (including securities loaned of $56,396) - See accompanying schedule: Unaffiliated issuers (cost $11,781,629) | $ 14,922,767 | |
Fidelity Central Funds (cost $139,785) | 139,785 | |
Other affiliated issuers (cost $36,698) | 44,129 | |
Total Investments (cost $11,958,112) | | $ 15,106,681 |
Receivable for investments sold | | 225,566 |
Receivable for fund shares sold | | 2,347 |
Dividends receivable | | 14,976 |
Distributions receivable from Fidelity Central Funds | | 60 |
Receivable from investment adviser for expense reductions | | 66 |
Other receivables | | 2,061 |
Total assets | | 15,351,757 |
| | |
Liabilities | | |
Payable for investments purchased | $ 148,160 | |
Payable for fund shares redeemed | 17,142 | |
Accrued management fee | 4,136 | |
Other affiliated payables | 1,908 | |
Other payables and accrued expenses | 1,729 | |
Collateral on securities loaned, at value | 58,372 | |
Total liabilities | | 231,447 |
| | |
Net Assets | | $ 15,120,310 |
Net Assets consist of: | | |
Paid in capital | | $ 11,133,321 |
Undistributed net investment income | | 75,609 |
Accumulated undistributed net realized gain (loss) on investments and foreign currency transactions | | 762,805 |
Net unrealized appreciation (depreciation) on investments and assets and liabilities in foreign currencies | | 3,148,575 |
Net Assets | | $ 15,120,310 |
See accompanying notes which are an integral part of the financial statements.
Semiannual Report
Financial Statements - continued
Statement of Assets and Liabilities - continued
Amounts in thousands (except per-share amounts) | September 30, 2013 |
| | |
Magellan:
Net Asset Value, offering price and redemption price per share ($12,596,181 ÷ 141,118 shares) | | $ 89.26 |
| | |
Class K:
Net Asset Value, offering price and redemption price per share ($2,524,129 ÷ 28,296 shares) | | $ 89.20 |
See accompanying notes which are an integral part of the financial statements.
Semiannual Report
Statement of Operations
Amounts in thousands | Six months ended September 30, 2013 |
| | |
Investment Income | | |
Dividends (including $5,967 earned from other affiliated issuers) | | $ 111,904 |
Income from Fidelity Central Funds | | 612 |
Total income | | 112,516 |
| | |
Expenses | | |
Management fee
Basic fee | $ 41,107 | |
Performance adjustment | (17,663) | |
Transfer agent fees | 10,564 | |
Accounting and security lending fees | 748 | |
Custodian fees and expenses | 133 | |
Independent trustees' compensation | 43 | |
Appreciation in deferred trustee compensation account | 4 | |
Registration fees | 50 | |
Audit | 102 | |
Legal | 16 | |
Miscellaneous | 64 | |
Total expenses before reductions | 35,168 | |
Expense reductions | (86) | 35,082 |
Net investment income (loss) | | 77,434 |
Realized and Unrealized Gain (Loss) Net realized gain (loss) on: | | |
Investment securities: | | |
Unaffiliated issuers | 771,769 | |
Other affiliated issuers | 20,254 | |
Foreign currency transactions | (238) | |
Futures contracts | 9,288 | |
Total net realized gain (loss) | | 801,073 |
Change in net unrealized appreciation (depreciation) on: Investment securities | 832,510 | |
Assets and liabilities in foreign currencies | 32 | |
Total change in net unrealized appreciation (depreciation) | | 832,542 |
Net gain (loss) | | 1,633,615 |
Net increase (decrease) in net assets resulting from operations | | $ 1,711,049 |
See accompanying notes which are an integral part of the financial statements.
Semiannual Report
Financial Statements - continued
Statement of Changes in Net Assets
Amounts in thousands | Six months ended September 30,
2013 | Year ended
March 31,
2013 |
Increase (Decrease) in Net Assets | | |
Operations | | |
Net investment income (loss) | $ 77,434 | $ 191,188 |
Net realized gain (loss) | 801,073 | 1,475,417 |
Change in net unrealized appreciation (depreciation) | 832,542 | (257,221) |
Net increase (decrease) in net assets resulting
from operations | 1,711,049 | 1,409,384 |
Distributions to shareholders from net investment income | (11,072) | (201,835) |
Distributions to shareholders from net realized gain | (58,700) | (4,097) |
Total distributions | (69,772) | (205,932) |
Share transactions - net increase (decrease) | (1,286,645) | (2,916,170) |
Total increase (decrease) in net assets | 354,632 | (1,712,718) |
| | |
Net Assets | | |
Beginning of period | 14,765,678 | 16,478,396 |
End of period (including undistributed net investment income of $75,609 and undistributed net investment income of $9,247, respectively) | $ 15,120,310 | $ 14,765,678 |
See accompanying notes which are an integral part of the financial statements.
Semiannual Report
Financial Highlights - Magellan
| Six months ended September 30, | Years ended March 31, |
| 2013 | 2013 | 2012 | 2011 | 2010 | 2009 |
Selected Per-Share Data | | | | | |
Net asset value, beginning of period | $ 79.96 | $ 73.30 | $ 75.56 | $ 67.56 | $ 44.63 | $ 82.26 |
Income from Investment Operations | | | | | | |
Net investment income (loss) D | .43 | .93 | .47 | .56 G | .29 | .32 |
Net realized and unrealized gain (loss) | 9.25 | 6.75 | (2.30) | 8.05 | 23.02 | (34.98) |
Total from investment operations | 9.68 | 7.68 | (1.83) | 8.61 | 23.31 | (34.66) |
Distributions from net investment income | (.06) | (1.00) | (.41) | (.54) | (.36) | (.11) |
Distributions from net realized gain | (.32) | (.02) | (.02) | (.07) | (.02) | (2.86) |
Total distributions | (.38) | (1.02) | (.43) | (.61) | (.38) | (2.97) |
Net asset value, end of period | $ 89.26 | $ 79.96 | $ 73.30 | $ 75.56 | $ 67.56 | $ 44.63 |
Total Return B, C | 12.15% | 10.63% | (2.36)% | 12.82% | 52.33% | (43.81)% |
Ratios to Average Net Assets E, H | | | | | |
Expenses before reductions | .49% A | .47% | .54% | .60% | .75% | .71% |
Expenses net of fee waivers, if any | .49% A | .47% | .54% | .60% | .75% | .71% |
Expenses net of all reductions | .49% A | .46% | .53% | .59% | .74% | .71% |
Net investment income (loss) | 1.02% A | 1.27% | .69% | .83% G | .49% | .51% |
Supplemental Data | | | | | | |
Net assets, end of period (in millions) | $ 12,596 | $ 12,341 | $ 13,665 | $ 19,398 | $ 22,628 | $ 17,225 |
Portfolio turnover rate F | 70% A | 88% | 99% | 42% | 39% | 67% |
A Annualized
B Total returns for periods of less than one year are not annualized.
C Total returns would have been lower if certain expenses had not been reduced during the applicable periods shown.
D Calculated based on average shares outstanding during the period.
E Fees and expenses of any underlying Fidelity Central Funds are not included in the Fund's expense ratio. The Fund indirectly bears its proportionate share of the expenses of any underlying Fidelity Central Funds.
F Amount does not include the portfolio activity of any underlying Fidelity Central Funds.
G Investment income per share reflects a large, non-recurring dividend which amounted to $.13 per share. Excluding this non-recurring dividend, the ratio of net investment income (loss) to average net assets would have been .63%.
H Expense ratios reflect operating expenses of the class. Expenses before reductions do not reflect amounts reimbursed by the investment adviser or reductions from brokerage service arrangements or reductions from other expense offset arrangements and do not represent the amount paid by the class during periods when reimbursements or reductions occur. Expenses net of fee waivers reflect expenses after reimbursement by the investment adviser but prior to reductions from brokerage service arrangements or other expense offset arrangements. Expenses net of all reductions represent the net expenses paid by the class.
See accompanying notes which are an integral part of the financial statements.
Semiannual Report
Financial Highlights - Class K
| Six months ended September 30, | Years ended March 31, |
| 2013 | 2013 | 2012 | 2011 | 2010 | 2009 H |
Selected Per-Share Data | | | | | |
Net asset value, beginning of period | $ 79.89 | $ 73.24 | $ 75.51 | $ 67.53 | $ 44.61 | $ 85.82 |
Income from Investment Operations | | | | | | |
Net investment income (loss) D | .48 | 1.02 | .56 | .65 G | .38 | .30 |
Net realized and unrealized gain (loss) | 9.23 | 6.75 | (2.30) | 8.04 | 23.02 | (41.32) |
Total from investment operations | 9.71 | 7.77 | (1.74) | 8.69 | 23.40 | (41.02) |
Distributions from net investment income | (.08) | (1.10) | (.50) | (.64) | (.46) | (.19) |
Distributions from net realized gain | (.32) | (.02) | (.02) | (.07) | (.02) | - |
Total distributions | (.40) | (1.12) | (.53) J | (.71) | (.48) | (.19) |
Net asset value, end of period | $ 89.20 | $ 79.89 | $ 73.24 | $ 75.51 | $ 67.53 | $ 44.61 |
Total Return B, C | 12.21% | 10.77% | (2.23)% | 12.97% | 52.59% | (47.79)% |
Ratios to Average Net Assets E, I | | | | | |
Expenses before reductions | .38% A | .35% | .42% | .46% | .59% | .55% A |
Expenses net of fee waivers, if any | .38% A | .35% | .42% | .46% | .59% | .55% A |
Expenses net of all reductions | .38% A | .34% | .41% | .46% | .58% | .55% A |
Net investment income (loss) | 1.14% A | 1.40% | .82% | .97% G | .65% | .79% A |
Supplemental Data | | | | | | |
Net assets, end of period (in millions) | $ 2,524 | $ 2,424 | $ 2,814 | $ 3,483 | $ 2,495 | $ 1,415 |
Portfolio turnover rate F | 70% A | 88% | 99% | 42% | 39% | 67% |
A Annualized
B Total returns for periods of less than one year are not annualized.
C Total returns would have been lower if certain expenses had not been reduced during the applicable periods shown.
D Calculated based on average shares outstanding during the period.
E Fees and expenses of any underlying Fidelity Central Funds are not included in the Fund's expense ratio. The Fund indirectly bears its proportionate share of the expenses of any underlying Fidelity Central Funds.
F Amount does not include the portfolio activity of any underlying Fidelity Central Funds.
G Investment income per share reflects a large, non-recurring dividend which amounted to $.13 per share. Excluding this non-recurring dividend, the ratio of net investment income (loss) to average net assets would have been .77%.
H For the period May 9, 2008 (commencement of sale of shares) to March 31, 2009.
I Expense ratios reflect operating expenses of the class. Expenses before reductions do not reflect amounts reimbursed by the investment adviser or reductions from brokerage service arrangements or reductions from other expense offset arrangements and do not represent the amount paid by the class during periods when reimbursements or reductions occur. Expense ratios before reductions for start-up periods may not be representative of longer-term operating periods. Expenses net of fee waivers reflect expenses after reimbursement by the investment adviser but prior to reductions from brokerage service arrangements or other expense offset arrangements. Expenses net of all reductions represent the net expenses paid by the class.
J Total distributions of $.53 per share is comprised of distributions from net investment income of $.504 and distributions from net realized gain of $.022 per share.
See accompanying notes which are an integral part of the financial statements.
Semiannual Report
Notes to Financial Statements
For the period ended September 30, 2013
(Amounts in thousands except percentages)
1. Organization.
Fidelity® Magellan Fund (the Fund) is a fund of Fidelity Magellan Fund (the Trust) and is authorized to issue an unlimited number of shares. The Trust is registered under the Investment Company Act of 1940, as amended (the 1940 Act), as an open-end management investment company organized as a Massachusetts business trust. The Fund offers Magellan and Class K shares, each of which has equal rights as to assets and voting privileges. Each class has exclusive voting rights with respect to matters that affect that class.
2. Investments in Fidelity Central Funds.
The Fund invests in Fidelity Central Funds, which are open-end investment companies generally available only to other investment companies and accounts managed by Fidelity Management & Research Company (FMR) and its affiliates. The Fund's Schedule of Investments lists each of the Fidelity Central Funds held as of period end, if any, as an investment of the Fund, but does not include the underlying holdings of each Fidelity Central Fund. As an Investing Fund, the Fund indirectly bears its proportionate share of the expenses of the underlying Fidelity Central Funds.
The Money Market Central Funds seek preservation of capital and current income and are managed by Fidelity Investments Money Management, Inc. (FIMM), an affiliate of FMR.
A complete unaudited list of holdings for each Fidelity Central Fund is available upon request or at the Securities and Exchange Commission (the SEC) website at www.sec.gov. In addition, the financial statements of the Fidelity Central Funds, which are not covered by the Fund's Report of Independent Registered Public Accounting Firm, are available on the SEC website or upon request.
3. Significant Accounting Policies.
The financial statements have been prepared in conformity with accounting principles generally accepted in the United States of America (GAAP), which require management to make certain estimates and assumptions at the date of the financial statements. Actual results could differ from those estimates. Subsequent events, if any, through the date that the financial statements were issued have been evaluated in the preparation of the financial statements. The following summarizes the significant accounting policies of the Fund:
Investment Valuation. Investments are valued as of 4:00 p.m. Eastern time on the last calendar day of the period. In accordance with valuation policies and procedures approved by the Board of Trustees (the Board), the Fund attempts to obtain prices from one or more third party pricing vendors or brokers to value its investments. When
Semiannual Report
3. Significant Accounting Policies - continued
Investment Valuation - continued
current market prices, quotations or currency exchange rates are not readily available or reliable, investments will be fair valued in good faith by the FMR Fair Value Committee (the Committee), in accordance with procedures adopted by the Board. Factors used in determining fair value vary by investment type and may include market or investment specific events. The frequency with which these procedures are used cannot be predicted and they may be utilized to a significant extent. The Committee oversees the Fund's valuation policies and procedures and is responsible for approving and reporting to the Board all fair value determinations.
The Fund categorizes the inputs to valuation techniques used to value its investments into a disclosure hierarchy consisting of three levels as shown below:
Level 1 - quoted prices in active markets for identical investments
Level 2 - other significant observable inputs (including quoted prices for similar investments, interest rates, prepayment speeds, etc.)
Level 3 - unobservable inputs (including the Fund's own assumptions based on the best information available)
Valuation techniques used to value the Fund's investments by major category are as follows:
Equity securities, including restricted securities, for which market quotations are readily available, are valued at the last reported sale price or official closing price as reported by a third party pricing vendor on the primary market or exchange on which they are traded and are categorized as Level 1 in the hierarchy. In the event there were no sales during the day or closing prices are not available, securities are valued at the last quoted bid price or may be valued using the last available price and are generally categorized as Level 2 in the hierarchy. For foreign equity securities, when market or security specific events arise, comparisons to the valuation of American Depositary Receipts (ADRs), futures contracts, Exchange-Traded Funds (ETFs) and certain indexes as well as quoted prices for similar securities may be used and would be categorized as Level 2 in the hierarchy. Utilizing these techniques may result in transfers between Level 1 and Level 2. For restricted equity securities and private placements where observable inputs are limited, assumptions about market activity and risk are used and these securities are generally categorized as Level 3 in the hierarchy.
Investments in open-end mutual funds, including the Fidelity Central Funds, are valued at their closing net asset value (NAV) each business day and are categorized as Level 1 in the hierarchy.
Semiannual Report
Notes to Financial Statements - continued
(Amounts in thousands except percentages)
3. Significant Accounting Policies - continued
Investment Valuation - continued
Changes in valuation techniques may result in transfers in or out of an assigned level within the disclosure hierarchy. The aggregate value of investments by input level, as of September 30, 2013 is included at the end of the Fund's Schedule of Investments.
Foreign Currency. The Fund may use foreign currency contracts to facilitate transactions in foreign-denominated securities. Gains and losses from these transactions may arise from changes in the value of the foreign currency or if the counterparties do not perform under the contracts' terms.
Foreign-denominated assets, including investment securities, and liabilities are translated into U.S. dollars at the exchange rates at period end. Purchases and sales of investment securities, income and dividends received and expenses denominated in foreign currencies are translated into U.S. dollars at the exchange rate in effect on the transaction date.
The effects of exchange rate fluctuations on investments are included with the net realized and unrealized gain (loss) on investment securities. Other foreign currency transactions resulting in realized and unrealized gain (loss) are disclosed separately.
Investment Transactions and Income. For financial reporting purposes, the Fund's investment holdings and NAV include trades executed through the end of the last business day of the period. The NAV per share for processing shareholder transactions is calculated as of the close of business of the New York Stock Exchange (NYSE), normally 4:00 p.m. Eastern time and includes trades executed through the end of the prior business day. Gains and losses on securities sold are determined on the basis of identified cost and may include proceeds received from litigation. Dividend income is recorded on the ex-dividend date, except for certain dividends from foreign securities where the ex-dividend date may have passed, which are recorded as soon as the Fund is informed of the ex-dividend date. Non-cash dividends included in dividend income, if any, are recorded at the fair market value of the securities received. Distributions received on securities that represent a return of capital or capital gain are recorded as a reduction of cost of investments and/or as a realized gain. Subsequent to ex-dividend date the Fund determines the components of these distributions, based upon receipt of tax filings or other correspondence relating to the underlying investment. Interest income and distributions from the Fidelity Central Funds are accrued as earned. Interest income includes coupon interest and amortization of premium and accretion of discount on debt securities. Investment income is recorded net of foreign taxes withheld where recovery of such taxes is uncertain.
Semiannual Report
3. Significant Accounting Policies - continued
Class Allocations and Expenses. Investment income, realized and unrealized capital gains and losses, common expenses of the Fund, and certain fund-level expense reductions, if any, are allocated daily on a pro-rata basis to each class based on the relative net assets of each class to the total net assets of the Fund. Each class differs with respect to transfer agent fees incurred. Certain expense reductions may also differ by class. For the reporting period, the allocated portion of income and expenses to each class as a percent of its average net assets may vary due to the timing of recording these transactions in relation to fluctuating net assets of the classes. Expenses directly attributable to a fund are charged to that fund. Expenses attributable to more than one fund are allocated among the respective funds on the basis of relative net assets or other appropriate methods. Expense estimates are accrued in the period to which they relate and adjustments are made when actual amounts are known.
Deferred Trustee Compensation. Under a Deferred Compensation Plan (the Plan), independent Trustees may elect to defer receipt of a portion of their annual compensation. Deferred amounts are invested in a cross-section of Fidelity funds, are marked-to-market and remain in the Fund until distributed in accordance with the Plan. The investment of deferred amounts and the offsetting payable to the Trustees are included in the accompanying Statement of Assets and Liabilities.
Income Tax Information and Distributions to Shareholders. Each year, the Fund intends to qualify as a regulated investment company under Subchapter M of the Internal Revenue Code, including distributing substantially all of its taxable income and realized gains. As a result, no provision for U.S. Federal income taxes is required. The Fund files a U.S. federal tax return, in addition to state and local tax returns as required. The Fund's federal income tax returns are subject to examination by the Internal Revenue Service (IRS) for a period of three fiscal years after they are filed. State and local tax returns may be subject to examination for an additional fiscal year depending on the jurisdiction. Foreign taxes are provided for based on the Fund's understanding of the tax rules and rates that exist in the foreign markets in which it invests.
Distributions are declared and recorded on the ex-dividend date. Income dividends and capital gain distributions are declared separately for each class. Income and capital gain distributions are determined in accordance with income tax regulations, which may differ from GAAP.
Capital accounts within the financial statements are adjusted for permanent book-tax differences. These adjustments have no impact on net assets or the results of operations. Temporary book-tax differences will reverse in a subsequent period.
Semiannual Report
Notes to Financial Statements - continued
(Amounts in thousands except percentages)
3. Significant Accounting Policies - continued
Income Tax Information and Distributions to Shareholders - continued
Book-tax differences are primarily due to futures contracts, foreign currency transactions, passive foreign investment companies (PFIC), contingent interest, partnerships, deferred trustees compensation, capital loss carryforwards and losses deferred due to wash sales and excise tax regulations.
The federal tax cost of investment securities and unrealized appreciation (depreciation) as of period end were as follows:
Gross unrealized appreciation | $ 3,251,696 |
Gross unrealized depreciation | (131,579) |
Net unrealized appreciation (depreciation) on securities and other investments | $ 3,120,117 |
| |
Tax cost | $ 11,986,564 |
Restricted Securities. The Fund may invest in securities that are subject to legal or contractual restrictions on resale. These securities generally may be resold in transactions exempt from registration or to the public if the securities are registered. Disposal of these securities may involve time-consuming negotiations and expense, and prompt sale at an acceptable price may be difficult. Information regarding restricted securities is included at the end of the Fund's Schedule of Investments.
4. Derivative Instruments.
Risk Exposures and the Use of Derivative Instruments. The Fund's investment objective allows the Fund to enter into various types of derivative contracts, including futures contracts. Derivatives are investments whose value is primarily derived from underlying assets, indices or reference rates and may be transacted on an exchange or over-the-counter (OTC). Derivatives may involve a future commitment to buy or sell a specified asset based on specified terms, to exchange future cash flows at periodic intervals based on a notional principal amount, or for one party to make one or more payments upon the occurrence of specified events in exchange for periodic payments from the other party.
The Fund used derivatives to increase returns and to manage exposure to certain risks as defined below. The success of any strategy involving derivatives depends on analysis of numerous economic factors, and if the strategies for investment do not work as intended, the Fund may not achieve its objectives.
Semiannual Report
4. Derivative Instruments - continued
Risk Exposures and the Use of Derivative Instruments - continued
The Fund's use of derivatives increased or decreased its exposure to the following risk:
Equity Risk | Equity risk relates to the fluctuations in the value of financial instruments as a result of changes in market prices (other than those arising from interest rate risk or foreign exchange risk), whether caused by factors specific to an individual investment, its issuer, or all factors affecting all instruments traded in a market or market segment. |
The Fund is also exposed to additional risks from investing in derivatives, such as liquidity risk and counterparty credit risk. Liquidity risk is the risk that the Fund will be unable to close out the derivative in the open market in a timely manner. Counterparty credit risk is the risk that the counterparty will not be able to fulfill its obligation to the Fund. Counterparty credit risk related to exchange-traded futures contracts may be mitigated by the protection provided by the exchange on which they trade.
Investing in derivatives may involve greater risks than investing in the underlying assets directly and, to varying degrees, may involve risk of loss in excess of any initial investment and collateral received and amounts recognized in the Statement of Assets and Liabilities. In addition, there may be the risk that the change in value of the derivative contract does not correspond to the change in value of the underlying instrument.
Futures Contracts. A futures contract is an agreement between two parties to buy or sell a specified underlying instrument for a fixed price at a specified future date. The Fund used futures contracts to manage its exposure to the stock market.
Upon entering into a futures contract, a fund is required to deposit either cash or securities (initial margin) with a clearing broker in an amount equal to a certain percentage of the face value of the contract. Futures contracts are marked-to-market daily and subsequent daily payments (variation margin) are made or received by a fund depending on the daily fluctuations in the value of the futures contracts and are recorded as unrealized appreciation or (depreciation). This receivable and/or payable, if any, is included in daily variation margin for derivative instruments in the Statement of Assets and Liabilities. Realized gain or (loss) is recorded upon the expiration or closing of a futures contract.
Any open futures contracts at period end are presented in the Schedule of Investments under the caption "Futures Contracts." The underlying face amount at value reflects each contract's exposure to the underlying instrument or index at period end.
During the period the Fund recognized net realized gain (loss) of $9,288 related to its investment in futures contracts. This amount is included in the Statement of Operations.
Semiannual Report
Notes to Financial Statements - continued
(Amounts in thousands except percentages)
5. Purchases and Sales of Investments.
Purchases and sales of securities, other than short-term securities, aggregated $5,091,156 and $6,279,465, respectively.
6. Fees and Other Transactions with Affiliates.
Management Fee. FMR and its affiliates provide the Fund with investment management related services for which the Fund pays a monthly management fee. The management fee is the sum of an individual fund fee rate that is based on an annual rate of .30% of the Fund's average net assets and an annualized group fee rate that averaged .25% during the period. The group fee rate is based upon the average net assets of all the mutual funds advised by FMR, including any mutual funds previously advised by FMR that are currently advised by Fidelity SelectCo, LLC, an affiliate of FMR. The group fee rate decreases as assets under management increase and increases as assets under management decrease. In addition, the management fee is subject to a performance adjustment (up to a maximum of ±.20% of the Fund's average net assets over a 36 month performance period). The upward or downward adjustment to the management fee is based on the relative investment performance of Magellan as compared to an appropriate benchmark index over the same 36 month performance period. For the reporting period, the total annualized management fee rate, including the performance adjustment, was .32% of the Fund's average net assets. The performance adjustment included in the management fee rate may be higher or lower than the maximum performance adjustment rate due to the difference between the average net assets for the reporting and performance periods.
Transfer Agent Fees. Fidelity Investments Institutional Operations Company, Inc., (FIIOC), an affiliate of FMR, is the transfer, dividend disbursing and shareholder servicing agent for each class of the Fund. FIIOC receives account fees and asset-based fees that vary according to the account size and type of account of the shareholders of Magellan. FIIOC receives an asset-based fee of Class K's average net assets. FIIOC pays for typesetting, printing and mailing of shareholder reports, except proxy statements.
For the period, transfer agent fees for each class were as follows:
| Amount | % of
Average
Net Assets* |
Magellan | $ 9,953 | .16 |
Class K | 611 | .05 |
| $ 10,564 | |
* Annualized
Semiannual Report
6. Fees and Other Transactions with Affiliates - continued
Accounting and Security Lending Fees. Fidelity Service Company, Inc. (FSC), an affiliate of FMR, maintains the Fund's accounting records. The accounting fee is based on the level of average net assets for each month. Under a separate contract, FSC administers the security lending program. The security lending fee is based on the number and duration of lending transactions.
Brokerage Commissions. The Fund placed a portion of its portfolio transactions with brokerage firms which are affiliates of the investment adviser. Brokerage commissions are included in net realized gain (loss) and change in net unrealized appreciation (depreciation) in the Statement of Operations. The commissions paid to these affiliated firms were $164 for the period.
Other. During the period, FMR reimbursed the Fund for certain losses in the amount of $54.
7. Committed Line of Credit.
The Fund participates with other funds managed by FMR or an affiliate in a $4.25 billion credit facility (the "line of credit") to be utilized for temporary or emergency purposes to fund shareholder redemptions or for other short-term liquidity purposes. The Fund has agreed to pay commitment fees on its pro-rata portion of the line of credit, which amounted to $7 and is reflected in Miscellaneous expenses on the Statement of Operations. During the period, there were no borrowings on this line of credit.
8. Security Lending.
The Fund lends portfolio securities through a lending agent from time to time in order to earn additional income. For equity securities, a lending agent is used and may loan securities to certain qualified borrowers, including Fidelity Capital Markets (FCM), a broker-dealer affiliated with the Fund. On the settlement date of the loan, the Fund receives collateral (in the form of U.S. Treasury obligations, letters of credit and/or cash) against the loaned securities and maintains collateral in an amount not less than 100% of the market value of the loaned securities during the period of the loan. The market value of the loaned securities is determined at the close of business of the Fund and any additional required collateral is delivered to the Fund on the next business day. If the borrower defaults on its obligation to return the securities loaned because of insolvency or other reasons, the Fund may apply collateral received from the borrower against the obligation. The Fund may experience delays and costs in recovering the securities loaned. Any cash collateral received is invested in the Fidelity Securities Lending Cash Central Fund. The value of loaned securities and cash collateral at period end are disclosed on the Fund's Statement of Assets and Liabilities. The value of securities loaned to FCM at period end was $255. Security lending income represents the income
Semiannual Report
Notes to Financial Statements - continued
(Amounts in thousands except percentages)
8. Security Lending - continued
earned on investing cash collateral, less rebates paid to borrowers and any lending agent fees associated with the loan, plus any premium payments received for lending certain types of securities. Security lending income is presented in the Statement of Operations as a component of income from Fidelity Central Funds. Total security lending income during the period amounted to $542, including $1 from securities loaned to FCM.
9. Expense Reductions.
Commissions paid to certain brokers with whom FMR, or its affiliates, places trades on behalf of the Fund include an amount in addition to trade execution, which may be rebated back to the Fund to offset certain expenses. This amount totaled $9 for the period.
In addition, FMR reimbursed a portion of the Fund's operating expenses during the period in the amount of $77.
10. Distributions to Shareholders.
Distributions to shareholders of each class were as follows:
| Six months ended
September 30, 2013 | Year ended
March 31, 2013 |
From net investment income | | |
Magellan | $ 8,666 | $ 166,004 |
Class K | 2,406 | 35,831 |
Total | $ 11,072 | $ 201,835 |
From net realized gain | | |
Magellan | $ 49,105 | $ 3,417 |
Class K | 9,595 | 680 |
Total | $ 58,700 | $ 4,097 |
11. Share Transactions.
Transactions for each class of shares were as follows:
| Shares | Dollars |
| Six months ended September 30, 2013 | Year ended
March 31,
2013 | Six months ended September 30, 2013 | Year ended
March 31,
2013 |
Magellan | | | | |
Shares sold | 1,405 | 3,516 | $ 118,366 | $ 256,383 |
Reinvestment of distributions | 678 | 2,238 | 55,145 | 161,604 |
Shares redeemed | (15,311) | (37,834) | (1,286,803) | (2,743,347) |
Net increase (decrease) | (13,228) | (32,080) | $ (1,113,292) | $ (2,325,360) |
Semiannual Report
11. Share Transactions - continued
| Shares | Dollars |
| Six months ended September 30, 2013 | Year ended
March 31,
2013 | Six months ended September 30, 2013 | Year ended
March 31,
2013 |
Class K | | | | |
Shares sold | 998 | 7,910 | $ 84,530 | $ 566,429 |
Reinvestment of distributions | 148 | 506 | 12,001 | 36,510 |
Shares redeemed | (3,198) | (16,489) | (269,884) | (1,193,749) |
Net increase (decrease) | (2,052) | (8,073) | $ (173,353) | $ (590,810) |
12. Other.
The Fund's organizational documents provide former and current trustees and officers with a limited indemnification against liabilities arising in connection with the performance of their duties to the Fund. In the normal course of business, the Fund may also enter into contracts that provide general indemnifications. The Fund's maximum exposure under these arrangements is unknown as this would be dependent on future claims that may be made against the Fund. The risk of material loss from such claims is considered remote.
Semiannual Report
To the Trustees and Shareholders of Fidelity Magellan Fund:
In our opinion, the accompanying statement of assets and liabilities, including the schedule of investments, and the related statements of operations and of changes in net assets and the financial highlights present fairly, in all material respects, the financial position of Fidelity Magellan Fund at September 30, 2013, the results of its operations for the period then ended, the changes in its net assets for each of the two periods then ended and the financial highlights for the periods indicated, in conformity with accounting principles generally accepted in the United States of America. These financial statements and financial highlights (hereafter referred to as "financial statements") are the responsibility of the Fidelity Magellan Fund's management. Our responsibility is to express an opinion on these financial statements based on our audits. We conducted our audits of these financial statements in accordance with the standards of the Public Company Accounting Oversight Board (United States). Those standards require that we plan and perform the audit to obtain reasonable assurance about whether the financial statements are free of material misstatement. An audit includes examining, on a test basis, evidence supporting the amounts and disclosures in the financial statements, assessing the accounting principles used and significant estimates made by management, and evaluating the overall financial statement presentation. We believe that our audits, which included confirmation of securities at September 30, 2013 by correspondence with the custodian and brokers, provide a reasonable basis for our opinion.
PricewaterhouseCoopers LLP
Boston, Massachusetts
November 8, 2013
Semiannual Report
Board Approval of Investment Advisory Contracts and Management Fees
Fidelity Magellan Fund
Each year, the Board of Trustees, including the Independent Trustees (together, the Board), votes on the renewal of the management contract and sub-advisory agreements (together, the Advisory Contracts) for the fund. The Board, assisted by the advice of fund counsel and Independent Trustees' counsel, requests and considers a broad range of information relevant to the renewal of the Advisory Contracts throughout the year.
The Board meets regularly and, at each of its meetings, covers an extensive agenda of topics and materials and considers factors that are relevant to its annual consideration of the renewal of the fund's Advisory Contracts, including the services and support provided to the fund and its shareholders. The Board has established various standing committees, each composed of and chaired by Independent Trustees with varying backgrounds, to which the Board has assigned specific subject matter responsibilities in order to enhance effective decision-making by the Board. The Board, acting directly and through its Committees, requests and receives information concerning the annual consideration of the renewal of the fund's Advisory Contracts. The Board also meets as needed to consider matters specifically related to the Board's annual consideration of the renewal of Advisory Contracts. Members of the Board may also meet with trustees of other Fidelity funds through ad hoc joint committees to discuss certain matters relevant to the Fidelity funds.
At its July 2013 meeting, the Board, including the Independent Trustees, unanimously determined to renew the fund's Advisory Contracts. In reaching its determination, the Board considered all factors it believed relevant, including (i) the nature, extent, and quality of the services to be provided to the fund and its shareholders (including the investment performance of the fund); (ii) the competitiveness of the fund's management fee and total expense ratio relative to peer funds; (iii) the total costs of the services to be provided by and the profits to be realized by Fidelity from its relationship with the fund; (iv) the extent to which economies of scale exist and would be realized as the fund grows; and (v) whether fee levels reflect these economies of scale, if any, for the benefit of fund shareholders.
In considering whether to renew the Advisory Contracts for the fund, the Board reached a determination, with the assistance of fund counsel and Independent Trustees' counsel and through the exercise of its business judgment, that the renewal of the Advisory Contracts was in the best interests of the fund and its shareholders and that the compensation payable under the Advisory Contracts was fair and reasonable. The Board's decision to renew the Advisory Contracts was not based on any single factor, but rather was based on a comprehensive consideration of all the information provided to the Board at its meetings throughout the year. The Board, in reaching its determination to renew the Advisory Contracts, was aware that shareholders in the fund have a broad range of investment choices available to them, including a wide choice among mutual funds offered by Fidelity's competitors, and that the fund's shareholders, who have the opportunity to review and weigh the disclosure provided by the fund in its prospectus and other public disclosures, have chosen to invest in this fund, which is a part of the Fidelity family of funds.
Semiannual Report
Nature, Extent, and Quality of Services Provided. The Board considered the staffing within the investment adviser, Fidelity Management & Research Company (FMR), and the sub-advisers (together, the Investment Advisers) as it relates to the fund, including the backgrounds of the fund's investment personnel, and also considered the fund's investment objective, strategies, and related investment philosophy. The Independent Trustees also had discussions with senior management of Fidelity's investment operations and investment groups. The Board considered the structure of the portfolio manager compensation program and whether this structure provides appropriate incentives to act in the best interests of the fund.
Resources Dedicated to Investment Management and Support Services. The Board and the Fund Oversight and Research Committees reviewed the general qualifications and capabilities of the Investment Advisers' investment staff, including its size, education, experience, and resources, as well as the Investment Advisers' approach to recruiting, training, managing, and compensating investment personnel. The Board noted that FMR has continued to increase the resources devoted to non-U.S. offices, including expansion of Fidelity's global investment organization. The Board also noted that Fidelity's analysts have extensive resources, tools and capabilities that allow them to conduct sophisticated quantitative and fundamental analysis, as well as credit analysis of issuers, counterparties and guarantors. Further, the Board believes that Fidelity's investment professionals have sufficient access to global information and data so as to provide competitive investment results over time, and that those professionals also have access to sophisticated tools that permit them to assess portfolio construction and risk and performance attribution characteristics continuously, as well as to transmit new information and research conclusions rapidly around the world. Additionally, in its deliberations, the Board considered the Investment Advisers' trading and risk management capabilities and resources, which are an integral part of the investment management process.
Shareholder and Administrative Services. The Board considered (i) the nature, extent, quality, and cost of advisory, administrative, and shareholder services performed by the Investment Advisers and their affiliates under the Advisory Contracts and under separate agreements covering transfer agency, pricing and bookkeeping, and securities lending services for the fund; (ii) the nature and extent of the supervision of third party service providers, principally custodians and subcustodians; and (iii) the resources devoted to, and the record of compliance with, the fund's compliance policies and procedures. The Board also reviewed the allocation of fund brokerage, including allocations to brokers affiliated with the Investment Advisers, the use of brokerage commissions to pay fund expenses, and the use of "soft" commission dollars to pay for research services.
Semiannual Report
Board Approval of Investment Advisory Contracts and
Management Fees - continued
The Board noted that the growth of fund assets over time across the complex allows Fidelity to reinvest in the development of services designed to enhance the value or convenience of the Fidelity funds as investment vehicles. These services include 24-hour access to account information and market information through telephone representatives and over the Internet, investor education materials and asset allocation tools, and the expanded availability of Fidelity Investor Centers.
Investment in a Large Fund Family. The Board considered the benefits to shareholders of investing in a Fidelity fund, including the benefits of investing in a fund that is part of a large family of funds offering a variety of investment disciplines and providing a large variety of mutual fund investor services. The Board noted that Fidelity had taken, or had made recommendations that resulted in the Fidelity funds taking, a number of actions over the previous year that benefited particular funds, including (i) continuing to dedicate additional resources to investment research and to the support of the senior management team that oversees asset management; (ii) persisting in efforts to enhance Fidelity's global research capabilities; (iii) launching new funds and making other enhancements to meet client needs for global and income-oriented solutions; (iv) continuing to launch dedicated lower cost underlying funds to meet portfolio construction needs related to expanding underlying fund options for Fidelity funds of funds, specifically for the Freedom Fund product lines; (v) rationalizing product lines and gaining increased efficiencies through the mergers of several funds into other funds; (vi) strengthening Fidelity's index fund offerings by reducing investment minimums and adopting or lowering existing expense caps for certain funds and classes; (vii) enhancing Global Asset Allocation product offerings by launching new funds and strategies, including "open architecture" target date funds that utilize affiliated and unaffiliated sub-advisers; (viii) modifying the eligibility criteria for Institutional Class shares of Advisor funds to increase their marketability to a portion of the defined contribution plan market; (ix) creating a new low-cost retirement share class for certain Advisor funds to appeal to large retirement plans; (x) transitioning the management of certain Fidelity commodity funds to Geode Capital Management LLC, a registered commodity pool operator, while retaining administrative responsibilities for the funds; (xi) reorganizing a number of funds; and (xii) taking steps toward establishing a new Fidelity adviser to manage sector-based funds and products.
Investment Performance. The Board considered whether the fund has operated in accordance with its investment objective, as well as its record of compliance with its investment restrictions and its performance history. The Board noted that there was a portfolio management change for the fund in September 2011.
Semiannual Report
The Board took into account discussions with the Investment Advisers about fund investment performance that occur at Board meetings throughout the year. In this regard the Board noted that as part of regularly scheduled fund reviews and other reports to the Board on fund performance, the Board periodically considers annualized return information for the fund, for different time periods, measured against a securities market index ("benchmark index") and a peer group of mutual funds with similar objectives ("peer group"). In its evaluation of fund investment performance, the Board gave particular attention to information indicating changes in performance of certain Fidelity funds for specific time periods and the Investment Advisers' explanations for any overperformance or, in the case of the fund, underperformance.
In addition to reviewing absolute and relative fund performance, the Independent Trustees periodically consider the appropriateness of fund performance metrics in evaluating the results achieved. In general, the Independent Trustees believe that fund performance should be evaluated based on net performance (after fees and expenses) of both the highest performing and lowest performing classes, where applicable, compared to appropriate benchmark indices, over appropriate time periods which may include full market cycles, and compared to peer groups, as applicable, over the same periods, taking into account relevant factors including the following: general market conditions; issuer-specific information; tactical opportunities for investment; and fund cash flows and other factors.
The Independent Trustees recognize that shareholders evaluate performance on a net basis over their own holding periods, for which one-, three-, and five-year periods are used as a proxy. For this reason, the performance information reviewed by the Board also included net cumulative calendar year total return information for the fund and an appropriate benchmark index and peer group for the most recent one-, three-, and five-year periods, as shown below. Returns are shown compared to the 25th percentile (top of box) and 75th percentile (bottom of box) of the peer universe.
Semiannual Report
Board Approval of Investment Advisory Contracts and
Management Fees - continued
Fidelity Magellan Fund

The Board has discussed the fund's performance with FMR, including the fund's underperformance based on more recent periods ended after 2012 (which periods are not shown in the chart above) but prior to the date of the Board's approval of the renewal of the Advisory Contracts, and has engaged with FMR to consider what steps might be taken to remediate the fund's more recent underperformance.
The Board also considered that the fund's management fee is subject to upward or downward adjustment depending upon whether, and to what extent, the fund's investment performance for the performance period exceeds, or is exceeded by, a securities index, thus leading to a performance adjustment for the same period. The Board noted that the performance adjustment provides FMR with a strong economic incentive to seek to achieve superior performance for the fund's shareholders and helps to more closely align the interests of FMR and the fund's shareholders.
Based on its review, the Board concluded that the nature, extent, and quality of services provided to the fund under the Advisory Contracts should benefit the fund's shareholders.
Competitiveness of Management Fee and Total Expense Ratio. The Board considered the fund's management fee and total expense ratio compared to "mapped groups" of competitive funds and classes. Fidelity creates "mapped groups" by combining similar Lipper investment objective categories that have comparable management fee characteristics. Combining Lipper investment objective categories aids the Board's management fee and total expense ratio comparisons by broadening the competitive group used for comparison and by reducing the number of universes to which various Fidelity funds are compared.
Semiannual Report
Management Fee. The Board considered two proprietary management fee comparisons for the 12-month periods shown in the chart below. The group of Lipper funds used by the Board for management fee comparisons is referred to below as the "Total Mapped Group." The Total Mapped Group comparison focuses on a fund's standing in terms of gross management fees before expense reimbursements or caps, and without giving effect to the fund's performance adjustment, relative to the total universe of funds with comparable investment mandates, regardless of whether their management fee structures also are comparable. Funds with comparable investment mandates offer exposure to similar types of securities. Funds with comparable management fee structures have similar management fee contractual arrangements (e.g., flat rate charged for advisory services, all-inclusive fee rate, etc.). "TMG %" represents the percentage of funds in the Total Mapped Group that had management fees that were lower than the fund's. For example, a TMG % of 11% means that 89% of the funds in the Total Mapped Group had higher management fees than the fund. The "Asset-Size Peer Group" (ASPG) comparison focuses on a fund's standing relative to a subset of non-Fidelity funds within the Total Mapped Group that are similar in size and management fee structure. The ASPG represents at least 15% of the funds in the Total Mapped Group with comparable asset size and management fee structures, subject to a minimum of 50 funds (or all funds in the Total Mapped Group if fewer than 50). Additional information, such as the ASPG quartile in which the fund's management fee ranked and the impact of the fund's performance adjustment, is also included in the chart and considered by the Board.
Fidelity Magellan Fund
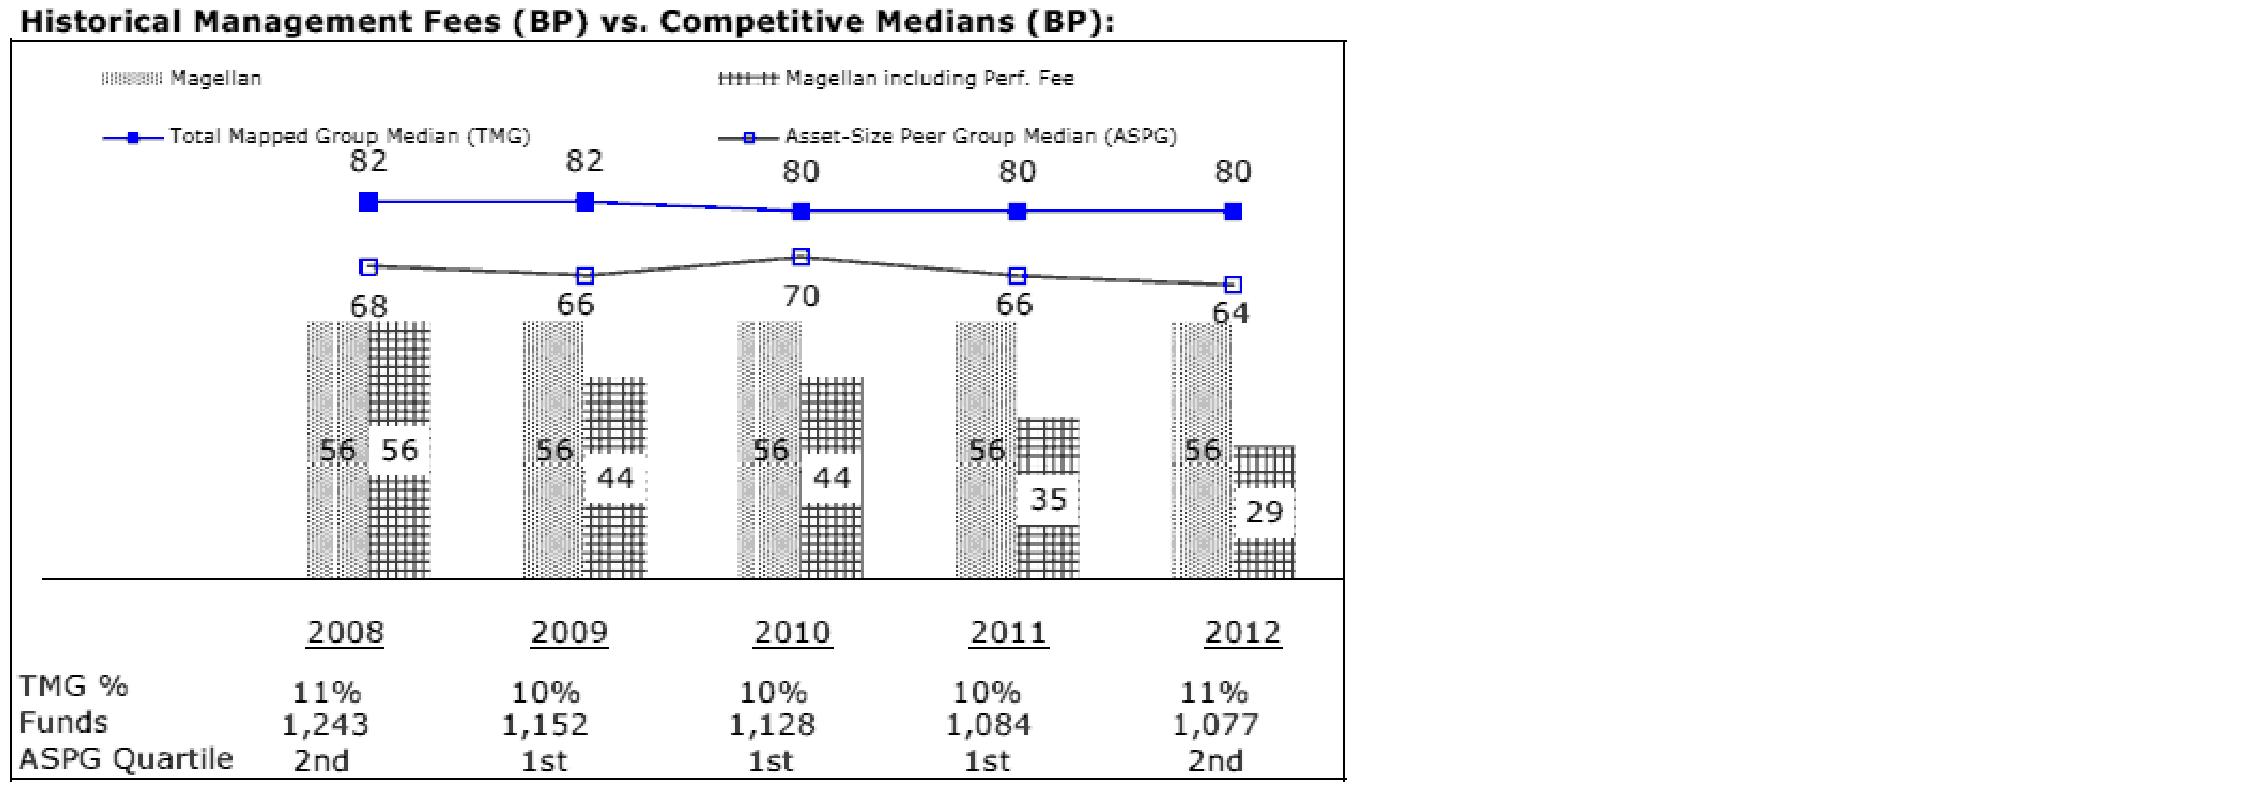
Semiannual Report
Board Approval of Investment Advisory Contracts and
Management Fees - continued
The Board noted that the fund's management fee ranked below the median of its Total Mapped Group and below the median of its ASPG for 2012. The Board also noted the effect of the fund's negative performance adjustment on the fund's management fee ranking.
Based on its review, the Board concluded that the fund's management fee is fair and reasonable in light of the services that the fund receives and the other factors considered.
Total Expense Ratio. In its review of each class's total expense ratio, the Board considered the fund's management fee as well as other fund or class expenses, as applicable, such as transfer agent fees, pricing and bookkeeping fees, and custodial, legal, and audit fees. The Board also noted the effects of any waivers and reimbursements on fees and expenses, as well as the impact of the fund's performance adjustment. As part of its review, the Board also considered the current and historical total expense ratios of each class of the fund compared to competitive fund median expenses. Each class of the fund is compared to those funds and classes in the Total Mapped Group (used by the Board for management fee comparisons) that have a similar sales load structure.
The Board noted that the total expense ratio of each class ranked below its competitive median for 2012.
Fees Charged to Other Fidelity Clients. The Board also considered Fidelity fee structures and other information with respect to clients of FMR and its affiliates, such as other mutual funds advised or subadvised by FMR or its affiliates, pension plan clients, and other institutional clients. The Board noted the findings of the 2013 ad hoc joint committee (created with the board of other Fidelity funds), which reviewed and compared Fidelity's institutional investment advisory business with its business of providing services to the Fidelity funds, including the differences in services provided, fees charged, and costs incurred, as well as competition in their respective marketplaces.
Based on its review of total expense ratios and fees charged to other Fidelity clients, the Board concluded that the total expense ratio of each class of the fund was reasonable in light of the services that the fund and its shareholders receive and the other factors considered.
Costs of the Services and Profitability. The Board considered the revenues earned and the expenses incurred by Fidelity in conducting the business of developing, marketing, distributing, managing, administering and servicing the fund and servicing the fund's shareholders. The Board also considered the level of Fidelity's profits in respect of all the Fidelity funds.
On an annual basis, FMR presents to the Board Fidelity's profitability for the fund. Fidelity calculates the profitability for each fund, as well as aggregate profitability for groups of Fidelity funds and all Fidelity funds, using a series of detailed revenue and cost allocation methodologies which originate with the books and records of Fidelity on which Fidelity's audited financial statements are based. The Audit Committee of the Board reviews any significant changes from the prior year's methodologies.
Semiannual Report
PricewaterhouseCoopers LLP (PwC), independent registered public accounting firm and auditor to Fidelity and certain Fidelity funds, has been engaged annually by the Board as part of the Board's assessment of Fidelity's profitability analysis. PwC's engagement includes the review and assessment of the methodologies used by Fidelity in determining the revenues and expenses attributable to Fidelity's mutual fund business, and completion of agreed-upon procedures surrounding the mathematical accuracy of fund profitability and its conformity to allocation methodologies. After considering PwC's reports issued under the engagement and information provided by Fidelity, the Board concluded that while other allocation methods may also be reasonable, Fidelity's profitability methodologies are reasonable in all material respects.
The Board also reviewed Fidelity's non-fund businesses and fall-out benefits related to the mutual fund business as well as cases where Fidelity's affiliates may benefit from or be related to the fund's business.
The Board considered the costs of the services provided by and the profits realized by Fidelity in connection with the operation of the fund and was satisfied that the profitability was not excessive in the circumstances.
Economies of Scale. The Board considered whether there have been economies of scale in respect of the management of the Fidelity funds, whether the Fidelity funds (including the fund) have appropriately benefited from any such economies of scale, and whether there is potential for realization of any further economies of scale. The Board considered the extent to which the fund will benefit from economies of scale through increased services to the fund, through waivers or reimbursements, or through fee or expense reductions. The Board also noted that in 2009, it and the board of other Fidelity funds created an ad hoc committee (the Economies of Scale Committee) to analyze whether FMR attains economies of scale in respect of the management and servicing of the Fidelity funds, whether the Fidelity funds have appropriately benefited from such economies of scale, and whether there is potential for realization of any further economies of scale.
The Board recognized that the fund's management contract incorporates a "group fee" structure, which provides for lower group fee rates as total fund assets under FMR's management increase, and for higher group fee rates as total fund assets under FMR's management decrease. FMR calculates the group fee rates based on a tiered asset "breakpoint" schedule that varies based on asset class. The Board considered that the group fee is designed to deliver the benefits of economies of scale to fund shareholders when total Fidelity fund assets increase, even if assets of any particular fund are unchanged or have declined, because some portion of Fidelity's costs are attributable to services provided to all Fidelity funds, and all funds benefit if those costs can be allocated among more assets. The Board concluded that, given the group fee structure, fund shareholders will benefit from lower management fees as assets under FMR's management increase at the fund complex level, regardless of whether Fidelity achieves any such economies of scale.
Semiannual Report
Board Approval of Investment Advisory Contracts and
Management Fees - continued
The Board concluded, taking into account the analysis of the Economies of Scale Committee, that economies of scale, if any, are being appropriately shared between fund shareholders and Fidelity.
Amendment to Description of Group Fee Rate. At its July 2013 meeting, the Board voted to approve an amendment to the fund's management contract to modify the description of the "group fee rate" effective August 1, 2013. The Board noted that under the prior description in the contract, the group fee rate was based on the average net assets of all registered investment companies with which FMR has management contracts. Under the contract's tiered asset breakpoint schedule, the group fee rate is lower as total fund assets under FMR's management increase, and higher as total fund assets under FMR's management decrease. The Board considered that the prior description would have excluded the assets of 64 Fidelity sector funds from the group fee rate calculation once Fidelity SelectCo, LLC, an affiliate of FMR, assumed management responsibilities for those funds. The Board noted that modifying the description of the group fee rate to continue to include the assets of those 64 funds for purposes of determining group fee rate breakpoints would avoid an immediate adverse impact on the group fee rate for any fund.
Additional Information Requested by the Board. In order to develop fully the factual basis for consideration of the Fidelity funds' Advisory Contracts, the Board requested and received additional information on certain topics, including: (i) fund performance trends and Fidelity's long-term strategies for certain funds; (ii) the potential to further rationalize the Fidelity fund lineup with the possibility of achieving savings for the funds and Fidelity; (iii) the methodology with respect to competitive fund data and peer group classifications; (iv) the arrangements with, and performance of, certain sub-advisers on behalf of the Fidelity funds, as well as certain proposed participating affiliate arrangements; (v) the realization of fall-out benefits in certain Fidelity business units; (vi) Fidelity's group fee structures, including the rationale for the individual fee rates of certain categories of funds and the definition of group assets; (vii) trends regarding industry use of performance fee structures and the performance adjustment methodologies applicable to the Fidelity funds; (viii) additional competitive analysis regarding the total expenses for certain classes; and (ix) fund profitability methodology, including Fidelity's cost allocation methodology, and the impact of certain factors on fund profitability results.
Semiannual Report
Based on its evaluation of all of the conclusions noted above, and after considering all factors it believed relevant, the Board ultimately concluded that the advisory fee structures are fair and reasonable, and that the fund's Advisory Contracts should be renewed.
Semiannual Report
Investment Adviser
Fidelity Management &
Research Company
Boston, MA
Investment Sub-Advisers
FMR Co., Inc.
Fidelity Management & Research
(U.K.) Inc.
Fidelity Management & Research
(Japan) Inc.
Fidelity Management & Research
(Hong Kong) Limited
General Distributor
Fidelity Distributors Corporation
Smithfield, RI
Transfer and Service Agents
Fidelity Investments Institutional
Operations Company, Inc.
Boston, MA
Fidelity Service Company, Inc.
Boston, MA
Custodian
State Street Bank and Trust Company Quincy, MA
(Fidelity Investment logo)(registered trademark)
Corporate Headquarters
245 Summer St., Boston, MA 02210
www.fidelity.com
MAG-K-USAN-1113
1.863179.104
Item 2. Code of Ethics
Not applicable.
Item 3. Audit Committee Financial Expert
Not applicable.
Item 4. Principal Accountant Fees and Services
Not applicable.
Item 5. Audit Committee of Listed Registrants
Not applicable.
Item 6. Investments
(a) Not applicable.
(b) Not applicable
Item 7. Disclosure of Proxy Voting Policies and Procedures for Closed-End Management Investment Companies
Not applicable.
Item 8. Portfolio Managers of Closed-End Management Investment Companies
Not applicable.
Item 9. Purchase of Equity Securities by Closed-End Management Investment Company and Affiliated Purchasers
Not applicable.
Item 10. Submission of Matters to a Vote of Security Holders
There were no material changes to the procedures by which shareholders may recommend nominees to the Fidelity Magellan Fund's Board of Trustees.
Item 11. Controls and Procedures
(a)(i) The President and Treasurer and the Chief Financial Officer have concluded that the Fidelity Magellan Fund's (the "Trust") disclosure controls and procedures (as defined in Rule 30a-3(c) under the Investment Company Act) provide reasonable assurances that material information relating to the Trust is made known to them by the appropriate persons, based on their evaluation of these controls and procedures as of a date within 90 days of the filing date of this report.
(a)(ii) There was no change in the Trust's internal control over financial reporting (as defined in Rule 30a-3(d) under the Investment Company Act) that occurred during the second fiscal quarter of the period covered by this report that has materially affected, or is reasonably likely to materially affect, the Trust's internal control over financial reporting.
Item 12. Exhibits
(a) | (1) | Not applicable. |
(a) | (2) | Certification pursuant to Rule 30a-2(a) under the Investment Company Act of 1940 (17 CFR 270.30a-2(a)) is filed and attached hereto as Exhibit 99.CERT. |
(a) | (3) | Not applicable. |
(b) | | Certification pursuant to Rule 30a-2(b) under the Investment Company Act of 1940 (17 CFR 270.30a-2(b)) is furnished and attached hereto as Exhibit 99.906CERT. |
SIGNATURES
Pursuant to the requirements of the Securities Exchange Act of 1934 and the Investment Company Act of 1940, the registrant has duly caused this report to be signed on its behalf by the undersigned, thereunto duly authorized.
Fidelity Magellan Fund
By: | /s/Kenneth B. Robins |
| Kenneth B. Robins |
| President and Treasurer |
| |
Date: | November 20, 2013 |
Pursuant to the requirements of the Securities Exchange Act of 1934 and the Investment Company Act of 1940, this report has been signed below by the following persons on behalf of the registrant and in the capacities and on the dates indicated.
By: | /s/Kenneth B. Robins |
| Kenneth B. Robins |
| President and Treasurer |
| |
Date: | November 20, 2013 |
By: | /s/Christine Reynolds |
| Christine Reynolds |
| Chief Financial Officer |
| |
Date: | November 20, 2013 |