UNITED STATES
SECURITIES AND EXCHANGE COMMISSION
Washington, D.C. 20549
FORM N-CSR
CERTIFIED SHAREHOLDER REPORT OF
REGISTERED MANAGEMENT INVESTMENT COMPANIES
Investment Company Act file number 811-2594
MFS SERIES TRUST IV
(Exact name of registrant as specified in charter)
500 Boylston Street, Boston, Massachusetts 02116
(Address of principal executive offices) (Zip code)
Susan S. Newton
Massachusetts Financial Services Company
500 Boylston Street
Boston, Massachusetts 02116
(Name and address of agents for service)
Registrant’s telephone number, including area code: (617) 954-5000
Date of fiscal year end: August 31
Date of reporting period: February 28, 2010
| ITEM 1. | REPORTS TO STOCKHOLDERS. |

MFS® Mid Cap Growth Fund
The report is prepared for the general information of shareholders. It is authorized for distribution to prospective investors only when preceded or accompanied by a current prospectus.
NOT FDIC INSURED Ÿ MAY LOSE VALUE Ÿ
NO BANK GUARANTEE
2/28/10
OTC-SEM

LETTER FROM THE CEO
Dear Shareholders:
After having suffered their biggest declines since the Great Depression, most global markets experienced an impressive resurgence during the latter months of 2009 and the first quarter of 2010. The global economy was able to reap the benefits of two major trends. The first of these was the massive efforts of governments and central banks to increase liquidity in the financial system as they sought to prevent the credit crisis from further affecting the banking system. The second was the move by companies around the world to cut costs and operations to prepare for rapidly changing market conditions. We believe that these moves not only shortened the length of the downturn but also set the stage for the recovery we are seeing today.
Even with the significant market gains of 2009 and the early part of 2010, the recovery is unrolling at a moderate pace, with rebounds in the manufacturing sector and corporate America leading the way. Central bankers are proceeding with caution and have held benchmark interest rates unchanged as they debate the best way to withdraw stimulus measures without disrupting the fragile growth process.
While hurdles remain, we believe that the global economy is on the road to recovery. As always, we continue to be mindful of the many challenges faced at the individual, national, and international levels. It is at times such as these that we want to remind investors of the merits of maintaining a long-term view, adhering to basic investing principles such as asset allocation and diversification, and working closely with advisors to identify and research investment opportunities. At MFS®, we take particular pride in how well mutual funds can help investors by providing the diversification that is important in any type of market climate.
Respectfully,

Robert J. Manning
Chief Executive Officer and Chief Investment Officer
MFS Investment Management®
April 15, 2010
The opinions expressed in this letter are subject to change, may not be relied upon for investment advice, and no forecasts can be guaranteed.
1
PORTFOLIO COMPOSITION
Portfolio structure
| | |
| Top ten holdings | | |
| American Tower Corp., “A” | | 1.7% |
| Adobe Systems, Inc. | | 1.6% |
| MasterCard, Inc., “A” | | 1.5% |
| AMETEK, Inc. | | 1.5% |
| MICROS Systems, Inc. | | 1.4% |
| Goodrich Corp. | | 1.4% |
| Mead Johnson Nutrition Co., “A” | | 1.4% |
| Strayer Education, Inc. | | 1.4% |
| J.M. Smucker Co. | | 1.3% |
| Discovery Communications, Inc., “A” | | 1.3% |
| | |
| Equity sectors | | |
| Technology | | 15.0% |
| Health Care | | 13.8% |
| Special Products & Services | | 12.8% |
| Leisure | | 10.6% |
| Industrial Goods & Services | | 9.0% |
| Retailing | | 7.2% |
| Financial Services | | 6.6% |
| Energy | | 6.5% |
| Consumer Staples | | 4.8% |
| Transportation | | 3.8% |
| Utilities & Communications | | 2.7% |
| Basic Materials | | 2.4% |
| Autos & Housing | | 1.9% |
| Percentages | are based on net assets as of 2/28/10. |
The portfolio is actively managed and current holdings may be different.
2
MARKET ENVIRONMENT
After having suffered through one of the largest and most concentrated downturns since the 1930s, most asset markets staged a remarkable rebound during 2009. This recovery in global activity, which covers this reporting period, has been led importantly by emerging Asian economies, but broadening to include most of the global economy to varying degrees. Primary drivers of the recovery included an unwinding of the inventory destocking that took place earlier, as well as massive fiscal and monetary stimulus.
During the worst of the credit crisis, policy makers globally loosened monetary and fiscal policy on a massive scale. Having reached their lower bound on policy rates prior to the beginning of the reporting period, several central banks were implementing quantitative easing as a means to further loosen monetary policy to offset the continuing fall in global economic activity. However, by the beginning of the period, there were ever-broadening signs that the global macroeconomic deterioration had passed, which caused the subsequent rise in asset valuations. As most asset prices rebounded during the period and the demand for liquidity waned, the debate concerning the existence of asset bubbles and the need for monetary exit strategies had begun, creating added uncertainty regarding the forward path of policy rates. This changing dynamic caused asset valuations to move broadly sideways during the latter part of the period.
3
EXPENSE TABLE
Fund expenses borne by the shareholders during the period,
September 1, 2009 through February 28, 2010
As a shareholder of the fund, you incur two types of costs: (1) transaction costs, including sales charges (loads) on certain purchase or redemption payments, and (2) ongoing costs, including management fees; distribution and service (12b-1) fees; and other fund expenses. This example is intended to help you understand your ongoing costs (in dollars) of investing in the fund and to compare these costs with the ongoing costs of investing in other mutual funds.
The example is based on an investment of $1,000 invested at the beginning of the period and held for the entire period September 1, 2009 through February 28, 2010.
The expenses include the payment of a portion of the transfer-agent-related expenses of MFS funds that invest in the fund. For further information, please see the Notes to the Financial Statements.
Actual Expenses
The first line for each share class in the following table provides information about actual account values and actual expenses. You may use the information in this line, together with the amount you invested, to estimate the expenses that you paid over the period. Simply divide your account value by $1,000 (for example, an $8,600 account value divided by $1,000 = 8.6), then multiply the result by the number in the first line under the heading entitled “Expenses Paid During Period” to estimate the expenses you paid on your account during this period.
Hypothetical Example for Comparison Purposes
The second line for each share class in the following table provides information about hypothetical account values and hypothetical expenses based on the fund’s actual expense ratio and an assumed rate of return of 5% per year before expenses, which is not the fund’s actual return. The hypothetical account values and expenses may not be used to estimate the actual ending account balance or expenses you paid for the period. You may use this information to compare the ongoing costs of investing in the fund and other funds. To do so, compare this 5% hypothetical example with the 5% hypothetical examples that appear in the shareholder reports of the other funds.
Please note that the expenses shown in the table are meant to highlight your ongoing costs only and do not reflect any transactional costs, such as sales charges (loads). Therefore, the second line for each share class in the table is useful in comparing ongoing costs only, and will not help you determine the relative total costs of owning different funds. In addition, if these transactional costs were included, your costs would have been higher.
4
Expense Table – continued
| | | | | | | | | | |
Share
Class | | | | Annualized
Expense
Ratio | | Beginning
Account Value
9/01/09 | | Ending
Account Value
2/28/10 | | Expenses
Paid During
Period (p)
9/01/09-2/28/10 |
| A | | Actual | | 1.36% | | $1,000.00 | | $1,147.39 | | $7.24 |
| | Hypothetical (h) | | 1.36% | | $1,000.00 | | $1,018.05 | | $6.80 |
| B | | Actual | | 2.11% | | $1,000.00 | | $1,144.33 | | $11.22 |
| | Hypothetical (h) | | 2.11% | | $1,000.00 | | $1,014.33 | | $10.54 |
| C | | Actual | | 2.11% | | $1,000.00 | | $1,144.11 | | $11.22 |
| | Hypothetical (h) | | 2.11% | | $1,000.00 | | $1,014.33 | | $10.54 |
| I | | Actual | | 1.11% | | $1,000.00 | | $1,150.16 | | $5.92 |
| | Hypothetical (h) | | 1.11% | | $1,000.00 | | $1,019.29 | | $5.56 |
| R1 | | Actual | | 2.11% | | $1,000.00 | | $1,144.83 | | $11.22 |
| | Hypothetical (h) | | 2.11% | | $1,000.00 | | $1,014.33 | | $10.54 |
| R2 | | Actual | | 1.61% | | $1,000.00 | | $1,146.10 | | $8.57 |
| | Hypothetical (h) | | 1.61% | | $1,000.00 | | $1,016.81 | | $8.05 |
| R3 | | Actual | | 1.36% | | $1,000.00 | | $1,148.09 | | $7.24 |
| | Hypothetical (h) | | 1.36% | | $1,000.00 | | $1,018.05 | | $6.80 |
| R4 | | Actual | | 1.11% | | $1,000.00 | | $1,149.84 | | $5.92 |
| | Hypothetical (h) | | 1.11% | | $1,000.00 | | $1,019.29 | | $5.56 |
| 529A | | Actual | | 1.46% | | $1,000.00 | | $1,148.87 | | $7.78 |
| | Hypothetical (h) | | 1.46% | | $1,000.00 | | $1,017.55 | | $7.30 |
| 529B | | Actual | | 2.21% | | $1,000.00 | | $1,144.85 | | $11.75 |
| | Hypothetical (h) | | 2.21% | | $1,000.00 | | $1,013.84 | | $11.04 |
| 529C | | Actual | | 2.21% | | $1,000.00 | | $1,144.39 | | $11.75 |
| | Hypothetical (h) | | 2.21% | | $1,000.00 | | $1,013.84 | | $11.04 |
| (h) | 5% class return per year before expenses. |
| (p) | Expenses paid is equal to each class’ annualized expense ratio, as shown above, multiplied by the average account value over the period, multiplied by the number of days in the period, divided by the number of days in the year. Expenses paid do not include any applicable sales charges (loads). If these transaction costs had been included, your costs would have been higher. |
5
PORTFOLIO OF INVESTMENTS
2/28/10 (unaudited)
The Portfolio of Investments is a complete list of all securities owned by your fund. It is categorized by broad-based asset classes.
| | | | | |
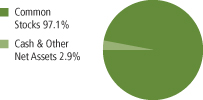
| Common Stocks - 97.1% | | | | | |
| Issuer | | Shares/Par | | Value ($) |
| | | | | |
| Aerospace - 1.4% | | | | | |
| Goodrich Corp. | | 163,160 | | $ | 10,708,190 |
| | |
| Airlines - 0.6% | | | | | |
| Copa Holdings S.A., “A” | | 86,800 | | $ | 4,721,052 |
| | |
| Automotive - 0.2% | | | | | |
| Harman International Industries, Inc. | | 35,500 | | $ | 1,531,470 |
| | |
| Biotechnology - 1.8% | | | | | |
| Alexion Pharmaceuticals, Inc. (a) | | 137,260 | | $ | 6,797,115 |
| Human Genome Sciences, Inc. (a) | | 69,500 | | | 1,956,425 |
| Millipore Corp. (a) | | 50,200 | | | 4,739,382 |
| | | | | |
| | | | | $ | 13,492,922 |
| Broadcasting - 1.5% | | | | | |
| Discovery Communications, Inc., “A” (a) | | 317,070 | | $ | 9,876,731 |
| Scripps Networks Interactive Inc., ‘A” | | 28,800 | | | 1,139,904 |
| | | | | |
| | | | | $ | 11,016,635 |
| Brokerage & Asset Managers - 2.5% | | | | | |
| Affiliated Managers Group, Inc. (a) | | 116,670 | | $ | 8,298,737 |
| BM&F Bovespa S.A. | | 531,800 | | | 3,484,222 |
| Evercore Partners, Inc. | | 92,400 | | | 2,782,164 |
| GFI Group, Inc. | | 323,600 | | | 1,783,036 |
| Lazard Ltd. | | 58,840 | | | 2,114,121 |
| | | | | |
| | | | | $ | 18,462,280 |
| Business Services - 6.1% | | | | | |
| Amdocs Ltd. (a) | | 175,430 | | $ | 5,101,504 |
| Cognizant Technology Solutions Corp., “A” (a) | | 175,660 | | | 8,454,516 |
| Concur Technologies, Inc. (a) | | 160,950 | | | 6,331,773 |
| Constant Contact, Inc. (a) | | 99,800 | | | 1,863,266 |
| CoStar Group, Inc. (a) | | 143,370 | | | 5,641,610 |
| Fidelity National Information Services, Inc. | | 158,520 | | | 3,573,041 |
| MasterCard, Inc., “A” | | 48,810 | | | 10,951,500 |
| Visa, Inc., “A” | | 47,180 | | | 4,023,510 |
| | | | | |
| | | | | $ | 45,940,720 |
6
Portfolio of Investments (unaudited) – continued
| | | | | |
| Issuer | | Shares/Par | | Value ($) |
| | | | | |
| Common Stocks - continued | | | | | |
| Computer Software - 8.2% | | | | | |
| Adobe Systems, Inc. (a) | | 351,440 | | $ | 12,177,396 |
| Akamai Technologies, Inc. (a) | | 302,100 | | | 7,945,230 |
| Autodesk, Inc. (a) | | 152,740 | | | 4,258,391 |
| Autonomy Corp. PLC (a) | | 116,000 | | | 2,706,215 |
| Citrix Systems, Inc. (a) | | 222,220 | | | 9,557,682 |
| MicroStrategy, Inc., “A” (a) | | 66,690 | | | 5,914,736 |
| Parametric Technology Corp. (a) | | 559,860 | | | 9,747,163 |
| SuccessFactors, Inc. (a) | | 97,800 | | | 1,771,158 |
| VeriSign, Inc. (a) | | 299,760 | | | 7,470,019 |
| | | | | |
| | | | | $ | 61,547,990 |
| Computer Software - Systems - 1.5% | | | | | |
| MICROS Systems, Inc. (a) | | 361,120 | | $ | 10,848,045 |
| | |
| Construction - 1.7% | | | | | |
| Black & Decker Corp. | | 52,130 | | $ | 3,777,861 |
| NVR, Inc. (a) | | 3,920 | | | 2,776,536 |
| Sherwin-Williams Co. | | 99,400 | | | 6,299,972 |
| | | | | |
| | | | | $ | 12,854,369 |
| Consumer Products - 1.7% | | | | | |
| Church & Dwight Co., Inc. | | 127,200 | | $ | 8,545,296 |
| Natura Cosméticos S.A. | | 212,260 | | | 3,911,274 |
| | | | | |
| | | | | $ | 12,456,570 |
| Consumer Services - 6.7% | | | | | |
| Anhanguera Educacional Participacoes S.A., IEU (a) | | 134,900 | | $ | 1,975,184 |
| Capella Education Co. (a) | | 85,046 | | | 7,064,771 |
| Ctrip.com International Ltd., ADR (a) | | 162,260 | | | 6,203,200 |
| DeVry, Inc. | | 146,630 | | | 9,259,685 |
| Monster Worldwide, Inc. (a) | | 280,040 | | | 3,906,558 |
| Priceline.com, Inc. (a) | | 26,490 | | | 6,006,872 |
| Sotheby’s | | 218,400 | | | 5,307,120 |
| Strayer Education, Inc. | | 44,630 | | | 10,123,423 |
| | | | | |
| | | | | $ | 49,846,813 |
| Electrical Equipment - 4.9% | | | | | |
| AMETEK, Inc. | | 280,140 | | $ | 10,936,666 |
| Baldor Electric Co. | | 160,660 | | | 5,047,937 |
| Danaher Corp. | | 109,940 | | | 8,132,262 |
| Mettler-Toledo International, Inc. (a) | | 35,210 | | | 3,500,226 |
| Rockwell Automation, Inc. | | 82,420 | | | 4,458,098 |
| Tyco Electronics Ltd. | | 179,950 | | | 4,612,119 |
| | | | | |
| | | | | $ | 36,687,308 |
7
Portfolio of Investments (unaudited) – continued
| | | | | |
| Issuer | | Shares/Par | | Value ($) |
| | | | | |
| Common Stocks - continued | | | | | |
| Electronics - 4.6% | | | | | |
| Dolby Laboratories, Inc., “A” (a) | | 91,530 | | $ | 4,875,803 |
| Hittite Microwave Corp. (a) | | 130,810 | | | 5,460,009 |
| Linear Technology Corp. | | 281,730 | | | 7,654,604 |
| National Semiconductor Corp. | | 489,780 | | | 7,092,014 |
| PMC-Sierra, Inc. (a) | | 261,700 | | | 2,172,110 |
| Silicon Laboratories, Inc. (a) | | 88,470 | | | 4,020,077 |
| Tessera Technologies, Inc. (a) | | 163,800 | | | 2,941,848 |
| | | | | |
| | | | | $ | 34,216,465 |
| Energy - Independent - 2.3% | | | | | |
| Newfield Exploration Co. (a) | | 120,800 | | $ | 6,169,256 |
| Plains Exploration & Production Co. (a) | | 94,718 | | | 3,107,698 |
| Ultra Petroleum Corp. (a) | | 178,480 | | | 8,161,890 |
| | | | | |
| | | | | $ | 17,438,844 |
| Entertainment - 1.6% | | | | | |
| DreamWorks Animation, Inc., “A” (a) | | 212,730 | | $ | 9,245,246 |
| TiVo, Inc. (a) | | 323,130 | | | 3,063,272 |
| | | | | |
| | | | | $ | 12,308,518 |
| Food & Beverages - 3.1% | | | | | |
| Flowers Foods, Inc. | | 117,610 | | $ | 2,997,879 |
| J.M. Smucker Co. | | 168,440 | | | 10,052,499 |
| Mead Johnson Nutrition Co., “A” | | 221,360 | | | 10,470,328 |
| | | | | |
| | | | | $ | 23,520,706 |
| Gaming & Lodging - 3.8% | | | | | |
| International Game Technology | | 476,230 | | $ | 8,357,837 |
| Las Vegas Sands Corp. (a) | | 175,900 | | | 2,925,217 |
| Royal Caribbean Cruises Ltd. (a) | | 298,290 | | | 8,432,658 |
| Starwood Hotels & Resorts Worldwide, Inc. | | 220,470 | | | 8,532,189 |
| | | | | |
| | | | | $ | 28,247,901 |
| General Merchandise - 0.8% | | | | | |
| Dollar General Corp. (a) | | 260,300 | | $ | 6,218,567 |
| | |
| Insurance - 2.0% | | | | | |
| Allied World Assurance Co. Holdings Ltd. | | 52,360 | | $ | 2,413,796 |
| Aspen Insurance Holdings Ltd. | | 144,290 | | | 4,077,635 |
| Verisk Analytics, Inc., “A” (a) | | 286,490 | | | 8,107,667 |
| | | | | |
| | | | | $ | 14,599,098 |
| Leisure & Toys - 0.3% | | | | | |
| THQ, Inc. (a) | | 423,940 | | $ | 2,569,076 |
8
Portfolio of Investments (unaudited) – continued
| | | | | |
| Issuer | | Shares/Par | | Value ($) |
| | | | | |
| Common Stocks - continued | | | | | |
| Machinery & Tools - 2.7% | | | | | |
| Bucyrus International, Inc. | | 69,900 | | $ | 4,372,944 |
| Flowserve Corp. | | 55,400 | | | 5,544,986 |
| Kennametal, Inc. | | 273,320 | | | 7,119,986 |
| Ritchie Bros. Auctioneers, Inc. (l) | | 138,300 | | | 2,900,151 |
| | | | | |
| | | | | $ | 19,938,067 |
| Major Banks - 0.5% | | | | | |
| KeyCorp | | 101,200 | | $ | 723,580 |
| Regions Financial Corp. | | 410,400 | | | 2,770,200 |
| | | | | |
| | | | | $ | 3,493,780 |
| Medical & Health Technology & Services - 8.3% | | | | | |
| athenahealth, Inc. (a) | | 105,510 | | $ | 3,886,988 |
| Cerner Corp. (a) | | 82,000 | | | 6,801,900 |
| DaVita, Inc. (a) | | 87,100 | | | 5,366,231 |
| Diagnosticos da America S.A. | | 438,300 | | | 3,589,542 |
| Express Scripts, Inc. (a) | | 80,230 | | | 7,702,882 |
| IDEXX Laboratories, Inc. (a) | | 136,270 | | | 7,196,419 |
| Lincare Holdings, Inc. (a) | | 121,300 | | | 4,871,408 |
| MedAssets, Inc. (a) | | 284,090 | | | 6,150,549 |
| Medco Health Solutions, Inc. (a) | | 101,800 | | | 6,437,832 |
| MEDNAX, Inc. (a) | | 55,770 | | | 2,983,695 |
| Patterson Cos., Inc. (a) | | 231,600 | | | 6,873,888 |
| | | | | |
| | | | | $ | 61,861,334 |
| Medical Equipment - 3.5% | | | | | |
| C.R. Bard, Inc. | | 65,570 | | $ | 5,493,455 |
| DENTSPLY International, Inc. | | 214,140 | | | 7,085,893 |
| Edwards Lifesciences Corp. (a) | | 54,530 | | | 5,007,490 |
| Intuitive Surgical, Inc. (a) | | 12,320 | | | 4,276,765 |
| Synthes, Inc. | | 38,100 | | | 4,543,272 |
| | | | | |
| | | | | $ | 26,406,875 |
| Metals & Mining - 0.3% | | | | | |
| Steel Dynamics, Inc. | | 119,280 | | $ | 1,947,842 |
| | |
| Natural Gas - Distribution - 0.8% | | | | | |
| EQT Corp. | | 93,220 | | $ | 4,079,307 |
| Questar Corp. | | 52,080 | | | 2,186,839 |
| | | | | |
| | | | | $ | 6,266,146 |
9
Portfolio of Investments (unaudited) – continued
| | | | | |
| Issuer | | Shares/Par | | Value ($) |
| | | | | |
| Common Stocks - continued | | | | | |
| Network & Telecom - 0.7% | | | | | |
| Fortinet, Inc. (a) | | 105,300 | | $ | 1,809,054 |
| Palm, Inc. (a)(l) | | 146,400 | | | 893,040 |
| Tellabs, Inc. | | 384,500 | | | 2,656,895 |
| | | | | |
| | | | | $ | 5,358,989 |
| Oil Services - 4.2% | | | | | |
| Cameron International Corp. (a) | | 221,540 | | $ | 9,111,940 |
| Dresser-Rand Group, Inc. (a) | | 197,100 | | | 6,092,361 |
| Dril-Quip, Inc. (a) | | 34,600 | | | 1,893,312 |
| Oceaneering International, Inc. (a) | | 145,700 | | | 8,807,565 |
| Smith International, Inc. | | 137,641 | | | 5,641,905 |
| | | | | |
| | | | | $ | 31,547,083 |
| Other Banks & Diversified Financials - 1.6% | | | | | |
| Associated Banc-Corp. | | 227,320 | | $ | 2,934,701 |
| Marshall & Ilsley Corp. | | 179,000 | | | 1,267,320 |
| Ocwen Financial Corp. (a) | | 147,800 | | | 1,597,718 |
| People’s United Financial, Inc. | | 103,510 | | | 1,632,353 |
| SVB Financial Group (a) | | 63,520 | | | 2,830,451 |
| TCF Financial Corp. | | 133,600 | | | 1,929,184 |
| | | | | |
| | | | | $ | 12,191,727 |
| Pharmaceuticals - 0.2% | | | | | |
| Inverness Medical Innovations, Inc. (a) | | 29,900 | | $ | 1,166,698 |
| | |
| Precious Metals & Minerals - 1.0% | | | | | |
| Teck Resources Ltd., “B” (a) | | 199,410 | | $ | 7,366,205 |
| | |
| Printing & Publishing - 2.7% | | | | | |
| Lamar Advertising Co., “A” (a) | | 29,600 | | $ | 890,368 |
| Moody’s Corp. | | 199,020 | | | 5,297,912 |
| MSCI, Inc., “A” (a) | | 284,460 | | | 8,528,111 |
| VistaPrint Ltd. (a) | | 99,550 | | | 5,746,026 |
| | | | | |
| | | | | $ | 20,462,417 |
| Restaurants - 0.7% | | | | | |
| P.F. Chang’s China Bistro, Inc. (a) | | 122,670 | | $ | 5,206,115 |
| | |
| Specialty Chemicals - 1.1% | | | | | |
| Airgas, Inc. | | 95,560 | | $ | 6,129,218 |
| Albemarle Corp. | | 60,700 | | | 2,275,643 |
| | | | | |
| | | | | $ | 8,404,861 |
10
Portfolio of Investments (unaudited) – continued
| | | | | | |
| Issuer | | Shares/Par | | Value ($) | |
| | | | | | |
| Common Stocks - continued | | | | | | |
| Specialty Stores - 6.4% | | | | | | |
| Abercrombie & Fitch Co., “A” | | 253,040 | | $ | 9,215,717 | |
| Advance Auto Parts, Inc. | | 97,250 | | | 3,967,800 | |
| Dick’s Sporting Goods, Inc. (a) | | 261,400 | | | 6,359,862 | |
| Limited Brands, Inc. | | 360,900 | | | 7,979,499 | |
| Ross Stores, Inc. | | 121,410 | | | 5,938,163 | |
| Staples, Inc. | | 319,530 | | | 8,231,093 | |
| Tiffany & Co. | | 142,680 | | | 6,333,565 | |
| | | | | | |
| | | | | $ | 48,025,699 | |
| Telephone Services - 1.7% | | | | | | |
| American Tower Corp., “A” (a) | | 302,130 | | $ | 12,888,866 | |
| | |
| Trucking - 3.2% | | | | | | |
| Atlas Air Worldwide Holdings, Inc. (a) | | 81,000 | | $ | 3,651,480 | |
| Expeditors International of Washington, Inc. | | 189,650 | | | 6,916,536 | |
| J.B. Hunt Transport Services, Inc. | | 79,510 | | | 2,821,015 | |
| Landstar System, Inc. | | 222,440 | | | 8,873,132 | |
| Old Dominion Freight Lines, Inc. (a) | | 43,895 | | | 1,349,332 | |
| | | | | | |
| | | | | $ | 23,611,495 | |
| Utilities - Electric Power - 0.2% | | | | | | |
| AES Corp. (a) | | 133,020 | | $ | 1,555,004 | |
| Total Common Stocks (Identified Cost, $606,115,484) | | | | $ | 726,932,742 | |
| | |
| Collateral for Securities Loaned - 0.3% | | | | | | |
| Morgan Stanley, Repurchase Agreement, 0.11%, dated 2/26/10, due 3/01/10, total to be received $2,750,125 (secured by various U.S. Treasury and Federal Agency obligations and Mortgage Backed securities valued at $2,805,111 in an individually traded account), at Cost and Net Asset Value | | 2,750,100 | | $ | 2,750,100 | |
| | |
| Money Market Funds (v) - 3.1% | | | | | | |
MFS Institutional Money Market Portfolio, 0.14%,
at Cost and Net Asset Value | | 23,078,064 | | $ | 23,078,064 | |
| Total Investments (Identified Cost, $631,943,648) | | | | $ | 752,760,906 | |
| | |
| Other Assets, Less Liabilities - (0.5)% | | | | | (4,057,184 | ) |
| Net Assets - 100.0% | | | | $ | 748,703,722 | |
| (a) | Non-income producing security. |
| (l) | All or a portion of this security is on loan. |
| (v) | Underlying fund that is available only to investment companies managed by MFS. The rate quoted is the annualized seven-day yield of the fund at period end. |
11
Portfolio of Investments (unaudited) – continued
The following abbreviations are used in this report and are defined:
| ADR | | American Depository Receipt |
| IEU | | International Equity Unit |
| PLC | | Public Limited Company |
See Notes to Financial Statements
12
Financial Statements
STATEMENT OF ASSETS AND LIABILITIES
At 2/28/10 (unaudited)
This statement represents your fund’s balance sheet, which details the assets and liabilities comprising the total value of the fund.
| | | |
| Assets | | | |
Investments- | | | |
Non-affiliated issuers, at value (identified cost, $608,865,584) | | $729,682,842 | |
Underlying funds, at cost and value | | 23,078,064 | |
Total investments, at value, including $2,631,663 of securities on loan (identified cost, $631,943,648) | | $752,760,906 | |
Receivables for | | | |
Fund shares sold | | 127,704 | |
Dividends | | 461,734 | |
Other assets | | 8,145 | |
Total assets | | $753,358,489 | |
| Liabilities | | | |
Payables for | | | |
Fund shares reacquired | | $1,342,941 | |
Collateral for securities loaned, at value | | 2,750,100 | |
Payable to affiliates | | | |
Investment adviser | | 61,440 | |
Shareholder servicing costs | | 371,302 | |
Distribution and service fees | | 12,930 | |
Administrative services fee | | 1,338 | |
Program manager fees | | 13 | |
Payable for independent Trustees’ compensation | | 42,563 | |
Accrued expenses and other liabilities | | 72,140 | |
Total liabilities | | $4,654,767 | |
Net assets | | $748,703,722 | |
| Net assets consist of | | | |
Paid-in capital | | $2,044,165,650 | |
Unrealized appreciation (depreciation) on investments | | 120,817,258 | |
Accumulated net realized gain (loss) on investments and foreign currency transactions | | (1,413,885,533 | ) |
Accumulated net investment loss | | (2,393,653 | ) |
Net assets | | $748,703,722 | |
Shares of beneficial interest outstanding | | 102,662,834 | |
| | | | | | |
| | | Net assets | | Shares
outstanding | | Net asset value
per share (a) |
Class A | | $173,977,847 | | 24,017,844 | | $7.24 |
Class B | | 40,838,902 | | 6,133,553 | | 6.66 |
Class C | | 28,608,048 | | 4,395,168 | | 6.51 |
Class I | | 496,059,973 | | 66,792,254 | | 7.43 |
Class R1 | | 1,950,743 | | 293,941 | | 6.64 |
Class R2 | | 4,431,716 | | 627,465 | | 7.06 |
Class R3 | | 1,517,574 | | 210,538 | | 7.21 |
Class R4 | | 158,949 | | 21,792 | | 7.29 |
Class 529A | | 641,330 | | 90,392 | | 7.10 |
Class 529B | | 276,371 | | 42,129 | | 6.56 |
Class 529C | | 242,269 | | 37,758 | | 6.42 |
| Shares | outstanding are rounded for presentation purposes. |
| (a) | Maximum offering price per share was equal to the net asset value per share for all share classes, except for Classes A and 529A, for which the maximum offering prices per share were $7.68 [100 / 94.25 x $7.24] and $7.53 [100 / 94.25 x $7.10], respectively. On sales of $50,000 or more, the maximum offering prices of Class A and Class 529A shares are reduced. A contingent deferred sales charge may be imposed on redemptions of Class A, Class B, Class C, Class 529B, and Class 529C shares. Redemption price per share was equal to the net asset value per share for Classes I, R1, R2, R3, R4, and 529A. |
See Notes to Financial Statements
13
Financial Statements
STATEMENT OF OPERATIONS
Six months ended 2/28/10 (unaudited)
This statement describes how much your fund earned in investment income and accrued in expenses. It also describes any gains and/or losses generated by fund operations.
| | | |
| Net investment loss | | | |
Income | | | |
Dividends | | $2,171,384 | |
Interest | | 62,804 | |
Dividends from underlying funds | | 16,239 | |
Total investment income | | $2,250,427 | |
Expenses | | | |
Management fee | | $2,708,061 | |
Distribution and service fees | | 593,900 | |
Program manager fees | | 512 | |
Shareholder servicing costs | | 1,011,406 | |
Administrative services fee | | 59,180 | |
Independent Trustees’ compensation | | 16,815 | |
Custodian fee | | 51,434 | |
Shareholder communications | | 46,368 | |
Auditing fees | | 22,427 | |
Legal fees | | 9,878 | |
Miscellaneous | | 82,807 | |
Total expenses | | $4,602,788 | |
Reduction of expenses by investment adviser | | (1,458 | ) |
Net expenses | | $4,601,330 | |
Net investment loss | | $(2,350,903 | ) |
Realized and unrealized gain (loss) on investments
and foreign currency transactions | | | |
Realized gain (loss) (identified cost basis) | | | |
Investment transactions | | $30,996,654 | |
Foreign currency transactions | | (629,912 | ) |
Net realized gain (loss) on investments
and foreign currency transactions | | $30,366,742 | |
Change in unrealized appreciation (depreciation) | | | |
Investments | | $72,856,537 | |
Net realized and unrealized gain (loss) on investments | | $103,223,279 | |
Change in net assets from operations | | $100,872,376 | |
See Notes to Financial Statements
14
Financial Statements
STATEMENTS OF CHANGES IN NET ASSETS
These statements describe the increases and/or decreases in net assets resulting from operations, any distributions, and any shareholder transactions.
| | | | | | |
| Change in net assets | | Six months ended
2/28/10
(unaudited) | | | Year ended
8/31/09 | |
| From operations | | | | | | |
Net investment loss | | $(2,350,903 | ) | | $(2,175,292 | ) |
Net realized gain (loss) on investments and foreign currency transactions | | 30,366,742 | | | (411,284,853 | ) |
Net unrealized gain (loss) on investments | | 72,856,537 | | | 89,882,954 | |
Change in net assets from operations | | $100,872,376 | | | $(323,577,191 | ) |
Change in net assets from fund share transactions | | $(48,074,578 | ) | | $(22,481,387 | ) |
Total change in net assets | | $52,797,798 | | | $(346,058,578 | ) |
| Net assets | | | | | | |
At beginning of period | | 695,905,924 | | | 1,041,964,502 | |
At end of period (including accumulated net investment loss of $2,393,653 and $42,750, respectively) | | $748,703,722 | | | $695,905,924 | |
See Notes to Financial Statements
15
Financial Statements
FINANCIAL HIGHLIGHTS
The financial highlights table is intended to help you understand the fund’s financial performance for the semiannual period and the past 5 fiscal years (or life of a particular share class, if shorter). Certain information reflects financial results for a single fund share. The total returns in the table represent the rate by which an investor would have earned (or lost) on an investment in the fund share class (assuming reinvestment of all distributions) held for the entire period.
| | | | | | | | | | | | | | | | | | |
| Class A | | Six months
ended
2/28/10 (unaudited) | | | Years ended 8/31 | |
| | | 2009 | | | 2008 | | | 2007 | | | 2006 | | | 2005 | |
| | | | | | | | | | | | | | | | | |
Net asset value, beginning of period | | $6.31 | | | $9.21 | | | $10.20 | | | $8.59 | | | $8.88 | | | $7.58 | |
| Income (loss) from investment operations | | | | | | | | | | | | | | | | | | |
Net investment income (loss) (d) | | $(0.03 | ) | | $(0.02 | ) | | $(0.04 | ) | | $0.00 | (w) | | $(0.07 | ) | | $(0.07 | ) |
Net realized and unrealized gain (loss) on investments and foreign currency | | 0.96 | | | (2.88 | ) | | (0.95 | ) | | 1.61 | | | (0.22 | ) | | 1.37 | |
Total from investment operations | | $0.93 | | | $(2.90 | ) | | $(0.99 | ) | | $1.61 | | | $(0.29 | ) | | $1.30 | |
Net asset value, end of period | | $7.24 | | | $6.31 | | | $9.21 | | | $10.20 | | | $8.59 | | | $8.88 | |
Total return (%) (r)(s)(t) | | 14.74 | (n) | | (31.49 | ) | | (9.71 | ) | | 18.74 | | | (3.27 | ) | | 17.15 | |
| Ratios (%) (to average net assets) and Supplemental data: | | | | | | | | | | | | | | | | | | |
Expenses before expense reductions (f) | | 1.36 | (a) | | 1.42 | | | 1.31 | | | 1.24 | | | 1.29 | | | 1.29 | |
Expenses after expense reductions (f) | | 1.36 | (a) | | 1.42 | | | 1.31 | | | 1.24 | | | 1.29 | | | 1.29 | |
Net investment income (loss) | | (0.74 | )(a) | | (0.38 | ) | | (0.39 | ) | | 0.00 | (w) | | (0.73 | ) | | (0.84 | ) |
Portfolio turnover | | 35 | | | 141 | | | 86 | | | 91 | | | 122 | | | 67 | |
Net assets at end of period (000 omitted) | | $173,978 | | | $155,565 | | | $295,672 | | | $386,013 | | | $515,048 | | | $931,140 | |
See Notes to Financial Statements
16
Financial Highlights – continued
| | | | | | | | | | | | | | | | | | |
| | | Six months
ended
2/28/10 (unaudited) | | | Years ended 8/31 | |
| Class B | | | 2009 | | | 2008 | | | 2007 | | | 2006 | | | 2005 | |
| | | | | | | | | | | | | | | | | |
Net asset value, beginning of period | | $5.82 | | | $8.56 | | | $9.56 | | | $8.10 | | | $8.45 | | | $7.26 | |
| Income (loss) from investment operations | | | | | | | | | | | | | | | | | | |
Net investment loss (d) | | $(0.05 | ) | | $(0.06 | ) | | $(0.11 | ) | | $(0.07 | ) | | $(0.13 | ) | | $(0.13 | ) |
Net realized and unrealized gain (loss) on investments and foreign currency | | 0.89 | | | (2.68 | ) | | (0.89 | ) | | 1.53 | | | (0.22 | ) | | 1.32 | |
Total from investment operations | | $0.84 | | | $(2.74 | ) | | $(1.00 | ) | | $1.46 | | | $(0.35 | ) | | $1.19 | |
Net asset value, end of period | | $6.66 | | | $5.82 | | | $8.56 | | | $9.56 | | | $8.10 | | | $8.45 | |
Total return (%) (r)(s)(t) | | 14.43 | (n) | | (32.01 | ) | | (10.46 | ) | | 18.02 | | | (4.14 | ) | | 16.39 | |
| Ratios (%) (to average net assets) and Supplemental data: | | | | | | | | | | | | | | | | | | |
Expenses before expense reductions (f) | | 2.11 | (a) | | 2.18 | | | 2.06 | | | 1.99 | | | 2.04 | | | 2.04 | |
Expenses after expense reductions (f) | | 2.11 | (a) | | 2.18 | | | 2.06 | | | 1.99 | | | 2.04 | | | 2.04 | |
Net investment loss | | (1.49 | )(a) | | (1.11 | ) | | (1.14 | ) | | (0.75 | ) | | (1.48 | ) | | (1.59 | ) |
Portfolio turnover | | 35 | | | 141 | | | 86 | | | 91 | | | 122 | | | 67 | |
Net assets at end of period (000 omitted) | | $40,839 | | | $46,214 | | | $124,124 | | | $213,884 | | | $271,832 | | | $384,712 | |
See Notes to Financial Statements
17
Financial Highlights – continued
| | | | | | | | | | | | | | | | | | |
| | | Six months
ended
2/28/10 (unaudited) | | | Years ended 8/31 | |
| Class C | | | 2009 | | | 2008 | | | 2007 | | | 2006 | | | 2005 | |
| | | | | | | | | | | | | | | | | |
Net asset value, beginning
of period | | $5.69 | | | $8.36 | | | $9.34 | | | $7.92 | | | $8.26 | | | $7.10 | |
| Income (loss) from investment operations | | | | | | | | | | | | | | | | | | |
Net investment loss (d) | | $(0.05 | ) | | $(0.06 | ) | | $(0.10 | ) | | $(0.07 | ) | | $(0.12 | ) | | $(0.13 | ) |
Net realized and unrealized gain (loss) on investments and foreign currency | | 0.87 | | | (2.61 | ) | | (0.88 | ) | | 1.49 | | | (0.22 | ) | | 1.29 | |
Total from investment operations | | $0.82 | | | $(2.67 | ) | | $(0.98 | ) | | $1.42 | | | $(0.34 | ) | | $1.16 | |
Net asset value, end of period | | $6.51 | | | $5.69 | | | $8.36 | | | $9.34 | | | $7.92 | | | $8.26 | |
Total return (%) (r)(s)(t) | | 14.41 | (n) | | (31.94 | ) | | (10.49 | ) | | 17.93 | | | (4.12 | ) | | 16.34 | |
| Ratios (%) (to average net assets) and Supplemental data: | | | | | | | | | | | | | | | | | | |
Expenses before expense reductions (f) | | 2.11 | (a) | | 2.17 | | | 2.06 | | | 1.99 | | | 2.04 | | | 2.04 | |
Expenses after expense
reductions (f) | | 2.11 | (a) | | 2.17 | | | 2.06 | | | 1.99 | | | 2.04 | | | 2.04 | |
Net investment loss | | (1.49 | )(a) | | (1.12 | ) | | (1.14 | ) | | (0.76 | ) | | (1.48 | ) | | (1.59 | ) |
Portfolio turnover | | 35 | | | 141 | | | 86 | | | 91 | | | 122 | | | 67 | |
Net assets at end of period (000 omitted) | | $28,608 | | | $26,786 | | | $47,725 | | | $66,281 | | | $80,563 | | | $115,894 | |
See Notes to Financial Statements
18
Financial Highlights – continued
| | | | | | | | | | | | | | | | | |
| | | Six months
ended
2/28/10
(unaudited) | | | Years ended 8/31 | |
| Class I | | | 2009 | | | 2008 | | | 2007 | | 2006 | | | 2005 | |
| | | | | | | | | | | | | | | | |
Net asset value, beginning of period | | $6.46 | | | $9.40 | | | $10.40 | | | $8.73 | | $9.01 | | | $7.67 | |
| Income (loss) from investment operations | | | | | | | | | | | | | | | | | |
Net investment income (loss) (d) | | $(0.02 | ) | | $(0.01 | ) | | $(0.01 | ) | | $0.02 | | $(0.04 | ) | | $(0.05 | ) |
Net realized and unrealized gain (loss) on investments and foreign currency | | 0.99 | | | (2.93 | ) | | (0.99 | ) | | 1.65 | | (0.24 | ) | | 1.39 | |
Total from investment operations | | $0.97 | | | $(2.94 | ) | | $(1.00 | ) | | $1.67 | | $(0.28 | ) | | $1.34 | |
Net asset value, end of period | | $7.43 | | | $6.46 | | | $9.40 | | | $10.40 | | $8.73 | | | $9.01 | |
Total return (%) (r)(s) | | 15.02 | (n) | | (31.28 | ) | | (9.62 | ) | | 19.13 | | (3.11 | ) | | 17.47 | |
| Ratios (%) (to average net assets) and Supplemental data: | | | | | | | | | | | | | | | | | |
Expenses before expense reductions (f) | | 1.11 | (a) | | 1.17 | | | 1.06 | | | 0.99 | | 1.04 | | | 1.04 | |
Expenses after expense reductions (f) | | 1.11 | (a) | | 1.17 | | | 1.06 | | | 0.99 | | 1.04 | | | 1.04 | |
Net investment income (loss) | | (0.49 | )(a) | | (0.13 | ) | | (0.13 | ) | | 0.19 | | (0.46 | ) | | (0.58 | ) |
Portfolio turnover | | 35 | | | 141 | | | 86 | | | 91 | | 122 | | | 67 | |
Net assets at end of period (000 omitted) | | $496,060 | | | $458,652 | | | $546,398 | | | $602,429 | | $485,841 | | | $399,423 | |
See Notes to Financial Statements
19
Financial Highlights – continued
| | | | | | | | | | | | | | | | | | |
| | | Six months
ended
2/28/10 (unaudited) | | | Years ended 8/31 | |
| Class R1 | | | 2009 | | | 2008 | | | 2007 | | | 2006 | | | 2005 (i) | |
| | | | | | | | | | | | | | | | | |
Net asset value, beginning
of period | | $5.80 | | | $8.53 | | | $9.53 | | | $8.09 | | | $8.44 | | | $7.93 | |
| Income (loss) from investment operations | | | | | | | | | | | | | | | | | | |
Net investment loss (d) | | $(0.05 | ) | | $(0.06 | ) | | $(0.11 | ) | | $(0.08 | ) | | $(0.14 | ) | | $(0.06 | ) |
Net realized and unrealized gain (loss) on investments and foreign currency | | 0.89 | | | (2.67 | ) | | (0.89 | ) | | 1.52 | | | (0.21 | ) | | 0.57 | (g) |
Total from investment operations | | $0.84 | | | $(2.73 | ) | | $(1.00 | ) | | $1.44 | | | $(0.35 | ) | | $0.51 | |
Net asset value, end of period | | $6.64 | | | $5.80 | | | $8.53 | | | $9.53 | | | $8.09 | | | $8.44 | |
Total return (%) (r)(s) | | 14.48 | (n) | | (32.00 | ) | | (10.49 | ) | | 17.80 | | | (4.15 | ) | | 6.43 | (n) |
Ratios (%) (to average net
assets) and Supplemental data: | | | | | | | | | | | | | | | | | | |
Expenses before expense
reductions (f) | | 2.11 | (a) | | 2.17 | | | 2.11 | | | 2.13 | | | 2.24 | | | 2.27 | (a) |
Expenses after expense
reductions (f) | | 2.11 | (a) | | 2.17 | | | 2.11 | | | 2.08 | | | 2.14 | | | 2.27 | (a) |
Net investment loss | | (1.48 | )(a) | | (1.13 | ) | | (1.17 | ) | | (0.94 | ) | | (1.57 | ) | | (1.77 | )(a) |
Portfolio turnover | | 35 | | | 141 | | | 86 | | | 91 | | | 122 | | | 67 | |
Net assets at end of period
(000 omitted) | | $1,951 | | | $1,844 | | | $2,632 | | | $1,366 | | | $430 | | | $210 | |
See Notes to Financial Statements
20
Financial Highlights – continued
| | | | | | | | | | | | | | | | | | |
| | | Six months
ended
2/28/10 (unaudited) | | | Years ended 8/31 | |
| Class R2 | | | 2009 | | | 2008 | | | 2007 | | | 2006 | | | 2005 | |
| | | | | | | | | | | | | | | | | |
Net asset value, beginning
of period | | $6.16 | | | $9.01 | | | $10.02 | | | $8.46 | | | $8.79 | | | $7.54 | |
| Income (loss) from investment operations | | | | | | | | | | | | | | | | | | |
Net investment loss (d) | | $(0.03 | ) | | $(0.03 | ) | | $(0.06 | ) | | $(0.05 | ) | | $(0.10 | ) | | $(0.11 | ) |
Net realized and unrealized gain (loss) on investments and foreign currency | | 0.93 | | | (2.82 | ) | | (0.95 | ) | | 1.61 | | | (0.23 | ) | | 1.36 | |
Total from investment operations | | $0.90 | | | $(2.85 | ) | | $(1.01 | ) | | $1.56 | | | $(0.33 | ) | | $1.25 | |
Net asset value, end of period | | $7.06 | | | $6.16 | | | $9.01 | | | $10.02 | | | $8.46 | | | $8.79 | |
Total return (%) (r)(s) | | 14.61 | (n) | | (31.63 | ) | | (10.08 | ) | | 18.44 | | | (3.75 | ) | | 16.58 | |
Ratios (%) (to average net
assets) and Supplemental data: | | | | | | | | | | | | | | | | | | |
Expenses before expense reductions (f) | | 1.61 | (a) | | 1.67 | | | 1.60 | | | 1.69 | | | 1.79 | | | 1.80 | |
Expenses after expense
reductions (f) | | 1.61 | (a) | | 1.67 | | | 1.60 | | | 1.63 | | | 1.69 | | | 1.80 | |
Net investment loss | | (0.99 | )(a) | | (0.61 | ) | | (0.65 | ) | | (0.47 | ) | | (1.10 | ) | | (1.33 | ) |
Portfolio turnover | | 35 | | | 141 | | | 86 | | | 91 | | | 122 | | | 67 | |
Net assets at end of period (000 omitted) | | $4,432 | | | $4,233 | | | $7,216 | | | $3,594 | | | $2,185 | | | $1,126 | |
See Notes to Financial Statements
21
Financial Highlights – continued
| | | | | | | | | | | | | | | | | | |
| | | Six months
ended
2/28/10 (unaudited) | | | Years ended 8/31 | |
| Class R3 | | | 2009 | | | 2008 | | | 2007 | | | 2006 | | | 2005 (i) | |
| | | | | | | | | | | | | | | | | |
Net asset value, beginning
of period | | $6.28 | | | $9.17 | | | $10.17 | | | $8.57 | | | $8.87 | | | $8.31 | |
| Income (loss) from investment operations | | | | | | | | | | | | | | | | | | |
Net investment loss (d) | | $(0.03 | ) | | $(0.02 | ) | | $(0.04 | ) | | $(0.02 | ) | | $(0.07 | ) | | $(0.03 | ) |
Net realized and unrealized gain (loss) on investments and foreign currency | | 0.96 | | | (2.87 | ) | | (0.96 | ) | | 1.62 | | | (0.23 | ) | | 0.59 | (g) |
Total from investment operations | | $0.93 | | | $(2.89 | ) | | $(1.00 | ) | | $1.60 | | | $(0.30 | ) | | $0.56 | |
Net asset value, end of period | | $7.21 | | | $6.28 | | | $9.17 | | | $10.17 | | | $8.57 | | | $8.87 | |
Total return (%) (r)(s) | | 14.81 | (n) | | (31.52 | ) | | (9.83 | ) | | 18.67 | | | (3.38 | ) | | 6.74 | (n) |
Ratios (%) (to average net
assets) and Supplemental data: | | | | | | | | | | | | | | | | | | |
Expenses before expense reductions (f) | | 1.36 | (a) | | 1.43 | | | 1.36 | | | 1.39 | | | 1.43 | | | 1.45 | (a) |
Expenses after expense reductions (f) | | 1.36 | (a) | | 1.42 | | | 1.36 | | | 1.39 | | | 1.43 | | | 1.45 | (a) |
Net investment loss | | (0.74 | )(a) | | (0.39 | ) | | (0.44 | ) | | (0.16 | ) | | (0.79 | ) | | (0.93 | )(a) |
Portfolio turnover | | 35 | | | 141 | | | 86 | | | 91 | | | 122 | | | 67 | |
Net assets at end of period (000 omitted) | | $1,518 | | | $1,544 | | | $2,732 | | | $1,929 | | | $1,899 | | | $53 | |
See Notes to Financial Statements
22
Financial Highlights – continued
| | | | | | | | | | | | | | | | | |
| | | Six months
ended
2/28/10 (unaudited) | | | Years ended 8/31 | |
| Class R4 | | | 2009 | | | 2008 | | | 2007 | | 2006 | | | 2005 (i) | |
| | | | | | | | | | | | | | | | |
Net asset value, beginning of period | | $6.34 | | | $9.24 | | | $10.24 | | | $8.60 | | $8.88 | | | $8.31 | |
| Income (loss) from investment operations | | | | | | | | | | | | | | | | | |
Net investment income
(loss) (d) | | $(0.02 | ) | | $(0.01 | ) | | $(0.02 | ) | | $0.02 | | $(0.05 | ) | | $(0.02 | ) |
Net realized and unrealized gain (loss) on investments and foreign currency | | 0.97 | | | (2.89 | ) | | (0.98 | ) | | 1.62 | | (0.23 | ) | | 0.59 | (g) |
Total from investment operations | | $0.95 | | | $(2.90 | ) | | $(1.00 | ) | | $1.64 | | $(0.28 | ) | | $0.57 | |
Net asset value, end of period | | $7.29 | | | $6.34 | | | $9.24 | | | $10.24 | | $8.60 | | | $8.88 | |
Total return (%) (r)(s) | | 14.98 | (n) | | (31.39 | ) | | (9.77 | ) | | 19.07 | | (3.15 | ) | | 6.86 | (n) |
Ratios (%) (to average net
assets) and Supplemental data: | | | | | | | | | | | | | | | | | |
Expenses before expense reductions (f) | | 1.11 | (a) | | 1.12 | | | 1.10 | | | 1.09 | | 1.14 | | | 1.15 | (a) |
Expenses after expense reductions (f) | | 1.11 | (a) | | 1.11 | | | 1.10 | | | 1.09 | | 1.14 | | | 1.15 | (a) |
Net investment income (loss) | | (0.49 | )(a) | | (0.07 | ) | | (0.19 | ) | | 0.16 | | (0.54 | ) | | (0.63 | )(a) |
Portfolio turnover | | 35 | | | 141 | | | 86 | | | 91 | | 122 | | | 67 | |
Net assets at end of period (000 omitted) | | $159 | | | $136 | | | $14,351 | | | $30,102 | | $38,641 | | | $53 | |
See Notes to Financial Statements
23
Financial Highlights – continued
| | | | | | | | | | | | | | | | | | |
| | | Six months
ended
2/28/10 (unaudited) | | | Years ended 8/31 | |
| Class 529A | | | 2009 | | | 2008 | | | 2007 | | | 2006 | | | 2005 | |
| | | | | | | | | | | | | | | | | |
Net asset value, beginning
of period | | $6.18 | | | $9.04 | | | $10.05 | | | $8.49 | | | $8.81 | | | $7.54 | |
| Income (loss) from investment operations | | | | | | | | | | | | | | | | | | |
Net investment loss (d) | | $(0.03 | ) | | $(0.03 | ) | | $(0.06 | ) | | $(0.04 | ) | | $(0.10 | ) | | $(0.10 | ) |
Net realized and unrealized gain (loss) on investments and foreign currency | | 0.95 | | | (2.83 | ) | | (0.95 | ) | | 1.60 | | | (0.22 | ) | | 1.37 | |
Total from investment operations | | $0.92 | | | $(2.86 | ) | | $(1.01 | ) | | $1.56 | | | $(0.32 | ) | | $1.27 | |
Net asset value, end of period | | $7.10 | | | $6.18 | | | $9.04 | | | $10.05 | | | $8.49 | | | $8.81 | |
Total return (%) (r)(s)(t) | | 14.89 | (n) | | (31.64 | ) | | (10.05 | ) | | 18.37 | | | (3.63 | ) | | 16.84 | |
Ratios (%) (to average net
assets) and Supplemental data: | | | | | | | | | | | | | | | | | | |
Expenses before expense
reductions (f) | | 1.46 | (a) | | 1.57 | | | 1.60 | | | 1.59 | | | 1.64 | | | 1.64 | |
Expenses after expense
reductions (f) | | 1.46 | (a) | | 1.56 | | | 1.60 | | | 1.59 | | | 1.64 | | | 1.64 | |
Net investment loss | | (0.83 | )(a) | | (0.52 | ) | | (0.67 | ) | | (0.40 | ) | | (1.06 | ) | | (1.18 | ) |
Portfolio turnover | | 35 | | | 141 | | | 86 | | | 91 | | | 122 | | | 67 | |
Net assets at end of period (000 omitted) | | $641 | | | $507 | | | $665 | | | $771 | | | $667 | | | $591 | |
See Notes to Financial Statements
24
Financial Highlights – continued
| | | | | | | | | | | | | | | | | | |
| | | Six months
ended
2/28/10 (unaudited) | | | Years ended 8/31 | |
| Class 529B | | | 2009 | | | 2008 | | | 2007 | | | 2006 | | | 2005 | |
| | | | | | | | | | | | | | | | | |
Net asset value, beginning
of period | | $5.73 | | | $8.45 | | | $9.45 | | | $8.03 | | | $8.39 | | | $7.23 | |
| Income (loss) from investment operations | | | | | | | | | | | | | | | | | | |
Net investment loss (d) | | $(0.05 | ) | | $(0.07 | ) | | $(0.12 | ) | | $(0.09 | ) | | $(0.15 | ) | | $(0.15 | ) |
Net realized and unrealized gain (loss) on investments and foreign currency | | 0.88 | | | (2.65 | ) | | (0.88 | ) | | 1.51 | | | (0.21 | ) | | 1.31 | |
Total from investment operations | | $0.83 | | | $(2.72 | ) | | $(1.00 | ) | | $1.42 | | | $(0.36 | ) | | $1.16 | |
Net asset value, end of period | | $6.56 | | | $5.73 | | | $8.45 | | | $9.45 | | | $8.03 | | | $8.39 | |
Total return (%) (r)(s)(t) | | 14.49 | (n) | | (32.19 | ) | | (10.58 | ) | | 17.68 | | | (4.29 | ) | | 16.04 | |
Ratios (%) (to average net
assets) and Supplemental data: | | | | | | | | | | | | | | | | | | |
Expenses before expense
reductions (f) | | 2.21 | (a) | | 2.25 | | | 2.25 | | | 2.23 | | | 2.29 | | | 2.29 | |
Expenses after expense
reductions (f) | | 2.21 | (a) | | 2.25 | | | 2.25 | | | 2.23 | | | 2.28 | | | 2.29 | |
Net investment loss | | (1.59 | )(a) | | (1.27 | ) | | (1.32 | ) | | (1.03 | ) | | (1.71 | ) | | (1.83 | ) |
Portfolio turnover | | 35 | | | 141 | | | 86 | | | 91 | | | 122 | | | 67 | |
Net assets at end of period (000 omitted) | | $276 | | | $219 | | | $170 | | | $199 | | | $185 | | | $158 | |
See Notes to Financial Statements
25
Financial Highlights – continued
| | | | | | | | | | | | | | | | | | |
| | | Six months
ended
2/28/10
(unaudited) | | | Years ended 8/31 | |
| Class 529C | | | 2009 | | | 2008 | | | 2007 | | | 2006 | | | 2005 | |
| | | | | | | | | | | | | | | | | |
Net asset value, beginning
of period | | $5.61 | | | $8.26 | | | $9.24 | | | $7.85 | | | $8.21 | | | $7.07 | |
| Income (loss) from investment operations | | | | | | | | | | | | | | | | | | |
Net investment loss (d) | | $(0.05 | ) | | $(0.06 | ) | | $(0.12 | ) | | $(0.08 | ) | | $(0.14 | ) | | $(0.14 | ) |
Net realized and unrealized gain (loss) on investments and foreign currency | | 0.86 | | | (2.59 | ) | | (0.86 | ) | | 1.47 | | | (0.22 | ) | | 1.28 | |
Total from investment operations | | $0.81 | | | $(2.65 | ) | | $(0.98 | ) | | $1.39 | | | $(0.36 | ) | | $1.14 | |
Net asset value, end of period | | $6.42 | | | $5.61 | | | $8.26 | | | $9.24 | | | $7.85 | | | $8.21 | |
Total return (%) (r)(s)(t) | | 14.44 | (n) | | (32.08 | ) | | (10.61 | ) | | 17.71 | | | (4.38 | ) | | 16.12 | |
Ratios (%) (to average net
assets) and Supplemental data: | | | | | | | | | | | | | | | | | | |
Expenses before expense
reductions (f) | | 2.21 | (a) | | 2.27 | | | 2.25 | | | 2.24 | | | 2.29 | | | 2.29 | |
Expenses after expense
reductions (f) | | 2.21 | (a) | | 2.27 | | | 2.25 | | | 2.24 | | | 2.29 | | | 2.29 | |
Net investment loss | | (1.58 | )(a) | | (1.24 | ) | | (1.32 | ) | | (0.94 | ) | | (1.71 | ) | | (1.82 | ) |
Portfolio turnover | | 35 | | | 141 | | | 86 | | | 91 | | | 122 | | | 67 | |
Net assets at end of period (000 omitted) | | $242 | | | $205 | | | $281 | | | $257 | | | $350 | | | $329 | |
Any redemption fees charged by the fund during the 2005 fiscal year resulted in a per share impact of less than $0.01.
| (d) | Per share data is based on average shares outstanding. |
| (f) | Ratios do not reflect reductions from fees paid indirectly, if applicable. |
| (g) | The per share amount is not in accordance with the net realized and unrealized gain/loss for the period because of the timing of sales of fund shares and the per share amount of realized and unrealized gains and losses at such time. |
| (i) | For the period from the class’ inception, April 1, 2005 (Classes R1, R3, and R4) through the stated period end. |
| (r) | Certain expenses have been reduced without which performance would have been lower. |
| (s) | From time to time the fund may receive proceeds from litigation settlements, without which performance would be lower. |
| (t) | Total returns do not include any applicable sales charges. |
| (w) | Per share amount was less than $0.01 and 0.01%, respectively. |
See Notes to Financial Statements
26
NOTES TO FINANCIAL STATEMENTS
(unaudited)
| (1) | | Business and Organization |
MFS Mid Cap Growth Fund (the fund) is a series of MFS Series Trust IV (the trust). The trust is organized as a Massachusetts business trust and is registered under the Investment Company Act of 1940, as amended, as an open-end management investment company.
| (2) | | Significant Accounting Policies |
General – The preparation of financial statements in conformity with U.S. generally accepted accounting principles requires management to make estimates and assumptions that affect the reported amounts of assets and liabilities, and disclosure of contingent assets and liabilities at the date of the financial statements and the reported amounts of revenues and expenses during the reporting period. Actual results could differ from those estimates. In the preparation of these financial statements, management has evaluated subsequent events occurring after the date of the fund’s Statement of Assets and Liabilities through the date that the financial statements were issued. The fund can invest in foreign securities. Investments in foreign securities are vulnerable to the effects of changes in the relative values of the local currency and the U.S. dollar and to the effects of changes in each country’s legal, political, and economic environment.
Investment Valuations – Equity securities, including restricted equity securities, are generally valued at the last sale or official closing price as provided by a third-party pricing service on the market or exchange on which they are primarily traded. Equity securities, for which there were no sales reported that day, are generally valued at the last quoted daily bid quotation as provided by a third-party pricing service on the market or exchange on which such securities are primarily traded. Equity securities held short, for which there were no sales reported for that day, are generally valued at the last quoted daily ask quotation as provided by a third-party pricing service on the market or exchange on which such securities are primarily traded. Short-term instruments with a maturity at issuance of 60 days or less generally are valued at amortized cost, which approximates market value. Open-end investment companies are generally valued at net asset value per share. Securities and other assets generally valued on the basis of information from a third-party pricing service may also be valued at a broker/dealer bid quotation. Values obtained from third-party pricing services can utilize both transaction data and market information such as yield, quality, coupon rate, maturity, type of issue, trading characteristics, and other market data. The values of foreign securities and other assets and liabilities expressed in foreign currencies are converted to U.S. dollars using the mean of bid and asked prices for rates provided by a third-party pricing service.
27
Notes to Financial Statements (unaudited) – continued
The Board of Trustees has delegated primary responsibility for determining or causing to be determined the value of the fund’s investments (including any fair valuation) to the adviser pursuant to valuation policies and procedures approved by the Board. If the adviser determines that reliable market quotations are not readily available, investments are valued at fair value as determined in good faith by the adviser in accordance with such procedures under the oversight of the Board of Trustees. Under the fund’s valuation policies and procedures, market quotations are not considered to be readily available for most types of debt instruments and floating rate loans and many types of derivatives. These investments are generally valued at fair value based on information from third-party pricing services. In addition, investments may be valued at fair value if the adviser determines that an investment’s value has been materially affected by events occurring after the close of the exchange or market on which the investment is principally traded (such as foreign exchange or market) and prior to the determination of the fund’s net asset value, or after the halting of trading of a specific security where trading does not resume prior to the close of the exchange or market on which the security is principally traded. Events that occur on a frequent basis after foreign markets close (such as developments in foreign markets and significant movements in the U.S. markets) and prior to the determination of the fund’s net asset value may be deemed to have a material effect on the value of securities traded in foreign markets. Accordingly, the fund’s foreign equity securities may often be valued at fair value. The adviser generally relies on third-party pricing services or other information (such as the correlation with price movements of similar securities in the same or other markets; the type, cost and investment characteristics of the security; the business and financial condition of the issuer; and trading and other market data) to assist in determining whether to fair value and at what value to fair value an investment. The value of an investment for purposes of calculating the fund’s net asset value can differ depending on the source and method used to determine value. When fair valuation is used, the value of an investment used to determine the fund’s net asset value may differ from quoted or published prices for the same investment. There can be no assurance that the fund could obtain the fair value assigned to an investment if it were to sell the investment at the same time at which the fund determines its net asset value per share.
Various inputs are used in determining the value of the fund’s assets or liabilities. These inputs are categorized into three broad levels. In certain cases, the inputs used to measure fair value may fall into different levels of the fair value hierarchy. In such cases, an investment’s level within the fair value hierarchy is based on the lowest level of input that is significant to the fair value measurement. The fund’s assessment of the significance of a particular input to the fair value measurement in its entirety requires judgment, and
28
Notes to Financial Statements (unaudited) – continued
considers factors specific to the investment. Level 1 includes unadjusted quoted prices in active markets for identical assets or liabilities. Level 2 includes other significant observable market-based inputs (including quoted prices for similar securities, interest rates, prepayment speed, and credit risk). Level 3 includes unobservable inputs, which may include the adviser’s own assumptions in determining the fair value of investments. Other financial instruments are derivative instruments not reflected in total investments, such as futures, forwards, swap contracts, and written options. The following is a summary of the levels used as of February 28, 2010 in valuing the fund’s assets or liabilities:
| | | | | | | | |
| Investments at Value | | Level 1 | | Level 2 | | Level 3 | | Total |
| Equity Securities | | $726,932,742 | | $— | | $— | | $726,932,742 |
| Short Term Securities | | — | | 2,750,100 | | — | | 2,750,100 |
| Mutual Funds | | 23,078,064 | | — | | — | | 23,078,064 |
| Total Investments | | $750,010,806 | | $2,750,100 | | $— | | $752,760,906 |
For further information regarding security characteristics, see the Portfolio of Investments.
In January 2010, Accounting Standards Update (ASU) No. 2010-06, Improving Disclosures about Fair Value Measurements (the “Update”) was issued, and is effective for interim and annual reporting periods beginning after December 15, 2009. This Update provides for expanded disclosures about fair value measurements. Management has evaluated the application of the Update to the fund, and believes the impact is limited to expanded disclosures resulting from the adoption of this Update in the fund’s financial statements.
Repurchase Agreements – The fund may enter into repurchase agreements with approved counterparties. Each repurchase agreement is recorded at cost. The fund requires that the securities collateral in a repurchase transaction be transferred to a custodian. The fund monitors, on a daily basis, the value of the collateral to ensure that its value, including accrued interest, is greater than amounts owed to the fund under each such repurchase agreement.
Foreign Currency Translation – Purchases and sales of foreign investments, income, and expenses are converted into U.S. dollars based upon currency exchange rates prevailing on the respective dates of such transactions or on the reporting date for foreign denominated receivables and payables. Gains and losses attributable to foreign currency exchange rates on sales of securities are recorded for financial statement purposes as net realized gains and losses on investments. Gains and losses attributable to foreign exchange rate movements on receivables, payables, income and expenses are recorded for financial statement purposes as foreign currency transaction gains and losses. That portion of both realized and unrealized gains and losses on investments that results from fluctuations in foreign currency exchange rates is not separately disclosed.
29
Notes to Financial Statements (unaudited) – continued
Derivatives – The fund may use derivatives for different purposes, including to earn income and enhance returns, to increase or decrease exposure to a particular market, to manage or adjust the risk profile of the fund, or as alternatives to direct investments. Derivatives may be used for hedging or non-hedging purposes. While hedging can reduce or eliminate losses, it can also reduce or eliminate gains. When the fund uses derivatives as an investment to increase market exposure, or for hedging purposes, gains and losses from derivative instruments may be substantially greater than the derivative’s original cost.
Derivative instruments include written options, purchased options, futures contracts, forward foreign currency exchange contracts, and swap agreements. For the six months ended February 28, 2010, the fund did not invest in any derivative instruments.
Security Loans – JPMorgan Chase and Co. (“Chase”), as lending agent, may loan the securities of the fund to certain qualified institutions (the “Borrowers”) approved by the fund. The loans are collateralized by cash and/or U.S. Treasury and federal agency obligations in an amount typically at least equal to the market value of the securities loaned. The market value of the loaned securities is determined at the close of business of the fund and any additional required collateral is delivered to the fund on the next business day. Chase provides the fund with indemnification against Borrower default. The fund bears the risk of loss with respect to the investment of cash collateral. On loans collateralized by cash, the cash collateral is invested in short-term securities. A portion of the income generated upon investment of the collateral is remitted to the Borrowers, and the remainder is allocated between the fund and the lending agent. On loans collateralized by U.S. Treasury and/or federal agency obligations, a fee is received from the Borrower, and is allocated between the fund and the lending agent. Income from securities lending is included in interest income on the Statement of Operations. The dividend and interest income earned on the securities loaned is accounted for in the same manner as other dividend and interest income.
Indemnifications – Under the fund’s organizational documents, its officers and Trustees may be indemnified against certain liabilities and expenses arising out of the performance of their duties to the fund. Additionally, in the normal course of business, the fund enters into agreements with service providers that may contain indemnification clauses. The fund’s maximum exposure under these agreements is unknown as this would involve future claims that may be made against the fund that have not yet occurred.
Investment Transactions and Income – Investment transactions are recorded on the trade date. Interest income is recorded on the accrual basis. All premium and discount is amortized or accreted for financial statement
30
Notes to Financial Statements (unaudited) – continued
purposes in accordance with U.S. generally accepted accounting principles. Dividends received in cash are recorded on the ex-dividend date. Certain dividends from foreign securities will be recorded when the fund is informed of the dividend if such information is obtained subsequent to the ex-dividend date. Dividend and interest payments received in additional securities are recorded on the ex-dividend or ex-interest date in an amount equal to the value of the security on such date. The fund may receive proceeds from litigation settlements. Any proceeds received from litigation involving portfolio holdings are reflected in the Statement of Operations in realized gain/loss if the security has been disposed of by the fund or in unrealized gain/loss if the security is still held by the fund. Any other proceeds from litigation not related to portfolio holdings are reflected as other income in the Statement of Operations.
Fees Paid Indirectly – The fund’s custody fee may be reduced according to an arrangement that measures the value of cash deposited with the custodian by the fund. For the six months ended February 28, 2010, custody fees were not reduced.
Tax Matters and Distributions – The fund intends to qualify as a regulated investment company, as defined under Subchapter M of the Internal Revenue Code, and to distribute all of its taxable income, including realized capital gains. As a result, no provision for federal income tax is required. The fund’s federal tax returns for the prior three fiscal years remain subject to examination by the Internal Revenue Service. Foreign taxes, if any, have been accrued by the fund in the accompanying financial statements.
Distributions to shareholders are recorded on the ex-dividend date. Income and capital gain distributions are determined in accordance with income tax regulations, which may differ from U.S. generally accepted accounting principles. Certain capital accounts in the financial statements are periodically adjusted for permanent differences in order to reflect their tax character. These adjustments have no impact on net assets or net asset value per share. Temporary differences which arise from recognizing certain items of income, expense, gain or loss in different periods for financial statement and tax purposes will reverse at some time in the future. Distributions in excess of net investment income or net realized gains are temporary overdistributions for financial statement purposes resulting from differences in the recognition or classification of income or distributions for financial statement and tax purposes.
Book/tax differences primarily relate to net operating losses.
The fund declared no distributions for the year ended August 31, 2009.
31
Notes to Financial Statements (unaudited) – continued
The federal tax cost and the tax basis components of distributable earnings were as follows:
| | | |
| As of 2/28/10 | | | |
| Cost of investments | | $632,077,604 | |
| Gross appreciation | | 141,271,378 | |
| Gross depreciation | | (20,588,076 | ) |
| Net unrealized appreciation (depreciation) | | $120,683,302 | |
| |
| As of 8/31/09 | | | |
| Capital loss carryforwards | | (1,120,795,421 | ) |
| Post-October capital loss deferral | | (323,322,898 | ) |
| Other temporary differences | | (42,750 | ) |
| Net unrealized appreciation (depreciation) | | 47,826,765 | |
The aggregate cost above includes prior fiscal year end tax adjustments.
As of August 31, 2009, the fund had capital loss carryforwards available to offset future realized gains. Such losses expire as follows:
| | | |
| 8/31/11 | | $(1,032,909,538 | ) |
| 8/31/17 | | (87,885,883 | ) |
| | $(1,120,795,421 | ) |
Multiple Classes of Shares of Beneficial Interest – The fund offers multiple classes of shares, which differ in their respective distribution, service, and program manager fees. The fund’s income, realized and unrealized gain (loss), and common expenses are allocated to shareholders based on the daily net assets of each class. Dividends are declared separately for each class. Differences in per share dividend rates are generally due to differences in separate class expenses. Class B and Class 529B shares will convert to Class A and Class 529A shares, respectively, approximately eight years after purchase.
| (3) | | Transactions with Affiliates |
Investment Adviser – The fund has an investment advisory agreement with MFS to provide overall investment management and related administrative services and facilities to the fund. The management fee is computed daily and paid monthly at the following annual rates:
| | | |
| First $3 billion of average daily net assets | | 0.75 | % |
| Average daily net assets in excess of $3 billion | | 0.70 | % |
The management fee incurred for the six months ended February 28, 2010 was equivalent to an annual effective rate of 0.75% of the fund’s average daily net assets.
Distributor – MFS Fund Distributors, Inc. (MFD), a wholly-owned subsidiary of MFS, as distributor, received $8,698 and $480 for the six months ended
32
Notes to Financial Statements (unaudited) – continued
February 28, 2010, as its portion of the initial sales charge on sales of Class A and Class 529A shares of the fund, respectively.
The Board of Trustees has adopted a distribution plan for certain class shares pursuant to Rule 12b-1 of the Investment Company Act of 1940.
The fund’s distribution plan provides that the fund will pay MFD for services provided by MFD and financial intermediaries in connection with the distribution and servicing of certain share classes. One component of the plan is a distribution fee paid to MFD and another component of the plan is a service fee paid to MFD. MFD may subsequently pay all, or a portion, of the distribution and/or service fees to financial intermediaries.
Distribution Plan Fee Table:
| | | | | | | | | | |
| | | Distribution
Fee Rate (d) | | Service
Fee Rate (d) | | Total
Distribution
Plan (d) | | Annual
Effective
Rate (e) | | Distribution
and Service
Fee |
| Class A | | — | | 0.25% | | 0.25% | | 0.25% | | $206,290 |
| Class B | | 0.75% | | 0.25% | | 1.00% | | 1.00% | | 221,887 |
| Class C | | 0.75% | | 0.25% | | 1.00% | | 1.00% | | 140,028 |
| Class R1 | | 0.75% | | 0.25% | | 1.00% | | 1.00% | | 9,660 |
| Class R2 | | 0.25% | | 0.25% | | 0.50% | | 0.50% | | 10,974 |
| Class R3 | | — | | 0.25% | | 0.25% | | 0.25% | | 2,034 |
| Class 529A | | — | | 0.25% | | 0.25% | | 0.25% | | 697 |
| Class 529B | | 0.75% | | 0.25% | | 1.00% | | 1.00% | | 1,241 |
| Class 529C | | 0.75% | | 0.25% | | 1.00% | | 1.00% | | 1,089 |
| Total Distribution and Service Fees | | $593,900 |
| (d) | In accordance with the distribution plan for certain classes, the fund pays distribution and/or service fees equal to these annual percentage rates of each class’ average daily net assets. The distribution and service fee rates disclosed by class represent the current rates in effect at the end of the reporting period. Any rate changes, if applicable, are detailed below. |
| (e) | The annual effective rates represent actual fees incurred under the distribution plan for the six months ended February 28, 2010 based on each class’ average daily net assets. |
Certain Class A shares purchased on or subsequent to September 1, 2008 are subject to a CDSC in the event of a shareholder redemption within 24 months of purchase. Class C and Class 529C shares are subject to a CDSC in the event of a shareholder redemption within 12 months of purchase. Class B and Class 529B shares are subject to a CDSC in the event of a shareholder redemption within six years of purchase. All contingent deferred sales charges are paid to MFD and during the six months ended February 28, 2010, were as follows:
| | |
| | | Amount |
| Class A | | $15,344 |
| Class B | | 18,738 |
| Class C | | 619 |
| Class 529B | | — |
| Class 529C | | — |
33
Notes to Financial Statements (unaudited) – continued
The fund has entered into and may from time to time enter into contracts with program managers and other parties which administer the tuition programs through which an investment in the fund’s 529 share classes is made. The fund has entered into an agreement with MFD pursuant to which MFD receives an annual fee of up to 0.10% of the average daily net assets attributable to each 529 share class. The services provided by MFD, or a third party with which MFD contracts, include recordkeeping and tax reporting and account services, as well as services designed to maintain the program’s compliance with the Internal Revenue Code and other regulatory requirements. Program manager fees for the six months ended February 28, 2010, were as follows:
| | |
| | | Amount |
| Class 529A | | $279 |
| Class 529B | | 124 |
| Class 529C | | 109 |
| Total Program Manager Fees | | $512 |
Shareholder Servicing Agent – MFS Service Center, Inc. (MFSC), a wholly-owned subsidiary of MFS, receives a fee from the fund for its services as shareholder servicing agent calculated as a percentage of the average daily net assets of the fund as determined periodically under the supervision of the fund’s Board of Trustees. For the six months ended February 28, 2010, the fee was $282,453, which equated to 0.0782% annually of the fund’s average daily net assets. MFSC also receives payment from the fund for out-of-pocket expenses, sub-accounting and other shareholder servicing costs which may be paid to affiliated and unaffiliated service providers. For the six months ended February 28, 2010, these out-of-pocket expenses, sub-accounting and other shareholder servicing costs amounted to $371,125.
Under a Special Servicing Agreement among MFS, each MFS fund which invests in other MFS funds (“MFS fund-of-funds”) and certain underlying funds in which a MFS fund-of-funds invests (“underlying funds”), each underlying fund may pay a portion of each MFS fund-of-fund’s transfer agent-related expenses, including sub-accounting fees payable to financial intermediaries, to the extent such payments do not exceed the benefits realized or expected to be realized by the underlying fund from the investment in the underlying fund by the MFS fund-of-fund. For the six months ended February 28, 2010, these costs for the fund amounted to $357,828 and are reflected in the shareholder servicing costs on the Statement of Operations.
Administrator – MFS provides certain financial, legal, shareholder communications, compliance, and other administrative services to the fund. Under an administrative services agreement, the fund partially reimburses MFS the costs incurred to provide these services. The fund pays an annual fixed amount of $17,500. The administrative services fee incurred for the six
34
Notes to Financial Statements (unaudited) – continued
months ended February 28, 2010 was equivalent to an annual effective rate of 0.0164% of the fund’s average daily net assets.
Trustees’ and Officers’ Compensation – The fund pays compensation to independent Trustees in the form of a retainer, attendance fees, and additional compensation to Board and Committee chairpersons. The fund does not pay compensation directly to Trustees or officers of the fund who are also officers of the investment adviser, all of whom receive remuneration for their services to the fund from MFS. Certain officers and Trustees of the fund are officers or directors of MFS, MFD, and MFSC.
Prior to December 31, 2001, the fund had an unfunded defined benefit plan (“DB plan”) for independent Trustees. As of December 31, 2001, the Board took action to terminate the DB plan with respect to then-current and any future independent Trustees, such that the DB Plan covers only certain of those former independent Trustees who retired on or before December 31, 2001. Effective January 1, 2002, accrued benefits under the DB Plan for then current independent Trustees who continued were credited to an unfunded retirement deferral plan (the “Retirement Deferral plan”), which was established for and exists solely with respect to these credited amounts, and is not available for other deferrals by these or other independent Trustees. Although the Retirement Deferral plan is unfunded, amounts deferred under the plan are periodically adjusted for investment experience as if they had been invested in shares of the fund. The DB Plan resulted in a pension expense of $1,005 and the Retirement Deferral plan resulted in a net decrease in expense of $3,896. Both amounts are included in independent Trustees’ compensation for the six months ended February 28, 2010. The liability for deferred retirement benefits payable to certain independent Trustees under both Plans amounted to $39,909 at February 28, 2010, and is included in payable for independent Trustees’ compensation on the Statement of Assets and Liabilities.
Other – This fund and certain other funds managed by MFS (the funds) have entered into services agreements (the Agreements) which provide for payment of fees by the funds to Tarantino LLC and Griffin Compliance LLC in return for the provision of services of an Independent Chief Compliance Officer (ICCO) and Assistant ICCO, respectively, for the funds. The ICCO and Assistant ICCO are officers of the funds and the sole members of Tarantino LLC and Griffin Compliance LLC, respectively. The funds can terminate the Agreements with Tarantino LLC and Griffin Compliance LLC at any time under the terms of the Agreements. For the six months ended February 28, 2010, the aggregate fees paid by the fund to Tarantino LLC and Griffin Compliance LLC were $4,507 and are included in miscellaneous expense on the Statement of Operations. MFS has agreed to reimburse the fund for a portion of the payments made by the fund in the amount of $1,458, which is shown as a reduction of total
35
Notes to Financial Statements (unaudited) – continued
expenses in the Statement of Operations. Additionally, MFS has agreed to bear all expenses associated with office space, other administrative support, and supplies provided to the ICCO and Assistant ICCO.
The fund may invest in the MFS Institutional Money Market Portfolio which is managed by MFS and seeks a high level of current income consistent with preservation of capital and liquidity. Income earned on this investment is included in dividends from underlying funds on the Statement of Operations. This money market fund does not pay a management fee to MFS.
Purchases and sales of investments, other than U.S. Government securities, purchased option transactions, and short-term obligations, aggregated $245,275,346 and $295,033,396, respectively.
| (5) | | Shares of Beneficial Interest |
The fund’s Declaration of Trust permits the Trustees to issue an unlimited number of full and fractional shares of beneficial interest. Transactions in fund shares were as follows:
| | | | | | | | |
| | | Six months ended
2/28/10 | | Year ended
8/31/09 |
| | | Shares | | Amount | | Shares | | Amount |
| Shares sold | | | | | | | | |
Class A | | 2,299,033 | | $16,061,069 | | 10,421,531 | | $55,818,209 |
Class B | | 243,582 | | 1,545,476 | | 730,791 | | 3,677,819 |
Class C | | 161,978 | | 1,005,729 | | 472,239 | | 2,361,325 |
Class I | | 1,036,451 | | 7,188,933 | | 32,596,788 | | 170,904,957 |
Class R1 | | 26,719 | | 167,580 | | 91,594 | | 462,779 |
Class R2 | | 72,155 | | 485,252 | | 195,483 | | 1,053,648 |
Class R3 | | 28,790 | | 197,295 | | 172,733 | | 839,035 |
Class R4 | | 326 | | 2,253 | | 16,569 | | 80,091 |
Class 529A | | 12,333 | | 83,168 | | 18,215 | | 94,639 |
Class 529B | | 3,982 | | 25,478 | | 21,267 | | 108,725 |
Class 529C | | 2,943 | | 18,293 | | 5,035 | | 23,132 |
| | 3,888,292 | | $26,780,526 | | 44,742,245 | | $235,424,359 |
36
Notes to Financial Statements (unaudited) – continued
| | | | | | | | | | | | |
| | | Six months ended
2/28/10 | | | Year ended
8/31/09 | |
| | | Shares | | | Amount | | | Shares | | | Amount | |
| Shares reacquired | | | | | | | | | | | | |
Class A | | (2,950,470 | ) | | $(20,102,321 | ) | | (17,871,376 | ) | | $(103,134,250 | ) |
Class B | | (2,053,397 | ) | | (13,218,029 | ) | | (7,290,824 | ) | | (37,194,641 | ) |
Class C | | (476,566 | ) | | (2,964,394 | ) | | (1,467,842 | ) | | (7,350,122 | ) |
Class I | | (5,270,768 | ) | | (36,874,865 | ) | | (19,682,846 | ) | | (94,861,695 | ) |
Class R1 | | (50,803 | ) | | (323,797 | ) | | (82,180 | ) | | (416,556 | ) |
Class R2 | | (132,228 | ) | | (894,262 | ) | | (308,919 | ) | | (1,667,839 | ) |
Class R3 | | (64,282 | ) | | (439,200 | ) | | (224,727 | ) | | (1,217,190 | ) |
Class R4 | | (32 | ) | | (218 | ) | | (1,548,385 | ) | | (11,981,847 | ) |
Class 529A | | (3,999 | ) | | (27,062 | ) | | (9,686 | ) | | (53,151 | ) |
Class 529B | | (120 | ) | | (780 | ) | | (3,132 | ) | | (16,820 | ) |
Class 529C | | (1,817 | ) | | (10,176 | ) | | (2,433 | ) | | (11,635 | ) |
| | (11,004,482 | ) | | $(74,855,104 | ) | | (48,492,350 | ) | | $(257,905,746 | ) |
| Net change | | | | | | | | | | | | |
Class A | | (651,437 | ) | | $(4,041,252 | ) | | (7,449,845 | ) | | $(47,316,041 | ) |
Class B | | (1,809,815 | ) | | (11,672,553 | ) | | (6,560,033 | ) | | (33,516,822 | ) |
Class C | | (314,588 | ) | | (1,958,665 | ) | | (995,603 | ) | | (4,988,797 | ) |
Class I | | (4,234,317 | ) | | (29,685,932 | ) | | 12,913,942 | | | 76,043,262 | |
Class R1 | | (24,084 | ) | | (156,217 | ) | | 9,414 | | | 46,223 | |
Class R2 | | (60,073 | ) | | (409,010 | ) | | (113,436 | ) | | (614,191 | ) |
Class R3 | | (35,492 | ) | | (241,905 | ) | | (51,994 | ) | | (378,155 | ) |
Class R4 | | 294 | | | 2,035 | | | (1,531,816 | ) | | (11,901,756 | ) |
Class 529A | | 8,334 | | | 56,106 | | | 8,529 | | | 41,488 | |
Class 529B | | 3,862 | | | 24,698 | | | 18,135 | | | 91,905 | |
Class 529C | | 1,126 | | | 8,117 | | | 2,602 | | | 11,497 | |
| | (7,116,190 | ) | | $(48,074,578 | ) | | (3,750,105 | ) | | $(22,481,387 | ) |
The fund is one of several mutual funds in which the MFS funds-of-funds may invest. The MFS funds-of-funds do not invest in the underlying MFS funds for the purpose of exercising management or control. At the end of the period, the MFS Conservative Allocation Fund, the MFS Aggressive Growth Allocation Fund, the MFS Moderate Allocation Fund and the MFS Growth Allocation Fund were the owners of record of approximately 5%, 14%, 18% and 26%, respectively, of the value of outstanding voting shares of the fund. In addition, the MFS Lifetime Retirement Income Fund, the MFS Lifetime 2010 Fund, the MFS Lifetime 2020 Fund, the MFS Lifetime 2030 Fund and the MFS Lifetime 2040 Fund were each the owners of record of less than 1% of the value of outstanding voting shares of the fund.
The fund and certain other funds managed by MFS participate in a $1.1 billion unsecured committed line of credit, subject to a $1 billion sublimit, provided by a syndication of banks under a credit agreement. Borrowings may be made
37
Notes to Financial Statements (unaudited) – continued
for temporary financing needs. Interest is charged to each fund, based on its borrowings, generally at a rate equal to the higher of the Federal Reserve funds rate or one month LIBOR plus an agreed upon spread. A commitment fee, based on the average daily, unused portion of the committed line of credit, is allocated among the participating funds at the end of each calendar quarter. In addition, the fund and other funds managed by MFS have established unsecured uncommitted borrowing arrangements with certain banks for temporary financing needs. Interest is charged to each fund, based on its borrowings, at a rate equal to the Federal Reserve funds rate plus an agreed upon spread. For the six months ended February 28, 2010, the fund’s commitment fee and interest expense were $6,073 and $0, respectively, and are included in miscellaneous expense on the Statement of Operations.
| (7) | | Transactions in Underlying Funds-Affiliated Issuers |
An affiliated issuer may be considered one in which the fund owns 5% or more of the outstanding voting securities, or a company which is under common control. For the purposes of this report, the fund assumes the following to be affiliated issuers:
| | | | | | | | | |
| Underlying Funds | | Beginning
Shares/Par
Amount | | Acquisitions
Shares/Par
Amount | | Dispositions
Shares/Par
Amount | | | Ending
Shares/Par
Amount |
MFS Institutional Money
Market Portfolio | | 19,504,002 | | 83,472,446 | | (79,898,384 | ) | | 23,078,064 |
| | | | |
| Underlying Funds | | Realized
Gain (Loss) | | Capital Gain
Distributions | | Dividend
Income | | | Ending
Value |
MFS Institutional Money
Market Portfolio | | $— | | $— | | $16,239 | | | $23,078,064 |
38
RESULTS OF SHAREHOLDER MEETING
(unaudited)
At a special meeting of shareholders of Series Trust IV, which was held on January 28, 2010, the following actions were taken:
Item 1. To elect the following individuals as Trustees:
| | | | |
| | | Number of Dollars |
Nominee | | For | | Withheld Authority |
| Robert E. Butler | | 727,591,133.281 | | 14,546,011.742 |
| Lawrence H. Cohn, M.D. | | 727,410,455.217 | | 14,726,689.806 |
| Maureen R. Goldfarb | | 727,406,304.384 | | 14,730,840.639 |
| David H. Gunning | | 727,643,702.534 | | 14,493,442.489 |
| William R. Gutow | | 727,323,852.724 | | 14,813,292.300 |
| Michael Hegarty | | 727,682,647.295 | | 14,454,497.729 |
| John P. Kavanaugh | | 727,647,706.623 | | 14,489,438.400 |
| Robert J. Manning | | 727,694,557.263 | | 14,442,587.760 |
| Robert C. Pozen | | 727,676,556.767 | | 14,460,588.256 |
| J. Dale Sherratt | | 727,520,127.693 | | 14,617,017.330 |
| Laurie J. Thomsen | | 727,607,583.854 | | 14,529,561.170 |
| Robert W. Uek | | 727,658,134.159 | | 14,479,010.865 |
39
BOARD REVIEW OF INVESTMENT ADVISORY AGREEMENT
A discussion regarding the Board’s most recent review and renewal of the fund’s Investment Advisory Agreement with MFS is available by clicking on the fund’s name under “Mutual Funds” in the “Products and Performance” section of the MFS Web site (mfs.com).
PROXY VOTING POLICIES AND INFORMATION
A general description of the MFS funds’ proxy voting policies and procedures is available without charge, upon request, by calling 1-800-225-2606, by visiting the Proxy Voting section of mfs.com or by visiting the SEC’s Web site at http://www.sec.gov.
Information regarding how the fund voted proxies relating to portfolio securities during the most recent twelve-month period ended June 30 is available without charge by visiting the Proxy Voting section of mfs.com or by visiting the SEC’s Web site at http://www.sec.gov.
QUARTERLY PORTFOLIO DISCLOSURE
The fund will file a complete schedule of portfolio holdings with the Securities and Exchange Commission (the Commission) for the first and third quarters of each fiscal year on Form N-Q. The fund’s Form N-Q may be reviewed and copied at the:
Public Reference Room
Securities and Exchange Commission
100 F Street, NE, Room 1580
Washington, D.C. 20549
Information on the operation of the Public Reference Room may be obtained by calling the Commission at 1-800-SEC-0330. The fund’s Form N-Q is available on the EDGAR database on the Commission’s Internet Web site at http://www.sec.gov, and copies of this information may be obtained, upon payment of a duplicating fee, by electronic request at the following e-mail address: publicinfo@sec.gov or by writing the Public Reference Section at the above address.
A shareholder can also obtain the quarterly portfolio holdings report at mfs.com.
FURTHER INFORMATION
From time to time, MFS may post important information about the fund or the MFS funds on the MFS web site (mfs.com). This information is available by visiting the “News & Commentary” section of mfs.com or by clicking on the fund’s name under “Mutual Funds” in the “Products and Performance” section of mfs.com.
40
CONTACT US
Web site
mfs.com
MFS TALK
1-800-637-8255
24 hours a day
Account service and literature
Shareholders
1-800-225-2606
Investment professionals
1-800-343-2829
Retirement plan services
1-800-637-1255
Mailing address
MFS Service Center, Inc.
P.O. Box 55824
Boston, MA 02205-5824
Overnight mail
MFS Service Center, Inc.
c/o Boston Financial Data Services
30 Dan Road
Canton, MA 02021-2809

Save paper with eDelivery. MFS® will send you prospectuses, reports, and proxies directly via e-mail so you will get information faster with less mailbox clutter. To sign up: 1. go to mfs.com. 2. log in via MFS® Access. 3. select eDelivery. If you own your MFS fund shares through a financial institution or a retirement plan, MFS® TALK, MFS Access, and eDelivery may not be available to you.


MFS® Money Market Fund
MFS® Government Money Market Fund
The report is prepared for the general information of shareholders. It is authorized for distribution to prospective investors only when preceded or accompanied by a current prospectus.
NOT FDIC INSURED Ÿ MAY LOSE VALUE Ÿ
NO BANK GUARANTEE
2/28/10
MCM-SEM

LETTER FROM THE CEO
Dear Shareholders:
After having suffered their biggest declines since the Great Depression, most global markets experienced an impressive resurgence during the latter months of 2009 and the first quarter of 2010. The global economy was able to reap the benefits of two major trends. The first of these was the massive efforts of governments and central banks to increase liquidity in the financial system as they sought to prevent the credit crisis from further affecting the banking system. The second was the move by companies around the world to cut costs and operations to prepare for rapidly changing market conditions. We believe that these moves not only shortened the length of the downturn but also set the stage for the recovery we are seeing today.
Even with the significant market gains of 2009 and the early part of 2010, the recovery is unrolling at a moderate pace, with rebounds in the manufacturing sector and corporate America leading the way. Central bankers are proceeding with caution and have held benchmark interest rates unchanged as they debate the best way to withdraw stimulus measures without disrupting the fragile growth process.
While hurdles remain, we believe that the global economy is on the road to recovery. As always, we continue to be mindful of the many challenges faced at the individual, national, and international levels. It is at times such as these that we want to remind investors of the merits of maintaining a long-term view, adhering to basic investing principles such as asset allocation and diversification, and working closely with advisors to identify and research investment opportunities. At MFS®, we take particular pride in how well mutual funds can help investors by providing the diversification that is important in any type of market climate.
Respectfully,

Robert J. Manning
Chief Executive Officer and Chief Investment Officer
MFS Investment Management®
April 15, 2010
The opinions expressed in this letter are subject to change, may not be relied upon for investment advice, and no forecasts can be guaranteed.
1
PORTFOLIO COMPOSITION
MFS MONEY MARKET FUND
Portfolio structure (u)
| | |
| Credit quality (a) |
| A-1+ | | 3.5% |
| A-1 | | 96.7% |
| Non Rated | | 0.0% |
Other | | (0.2)% |
|
| Maturity breakdown (u) |
| 0 - 7 days | | 25.8% |
| 8 - 29 days | | 19.3% |
| 30 - 59 days | | 29.4% |
| 60 - 89 days | | 11.6% |
| 90 - 366 days | | 14.1% |
| Other Assets Less Liabilities | | (0.2)% |
MFS GOVERNMENT MONEY MARKET FUND
Portfolio structure (u)
| | |
| Credit quality (a) |
| A-1 | | 100.2% |
| Non Rated | | 0.0% |
Other | | (0.2)% |
|
| Maturity breakdown (u) |
| 0 - 7 days | | 44.2% |
| 8 - 29 days | | 19.3% |
| 30 - 59 days | | 6.1% |
| 60 - 89 days | | 11.7% |
| 90 - 366 days | | 18.9% |
| Other Assets Less Liabilities | | (0.2)% |
| (a) | The Credit Quality table shows the percentage of portfolio assets falling within each rating category. Included in each rating category are short-term debt securities, the ratings of which are based on the short-term credit quality ratings of the securities’ issuers. For repurchase agreements, the credit quality is based on the short-term rating of the counterparty with which MFS trades the repurchase agreement. Each short-term debt security is assigned a rating in accordance with the following ratings hierarchy: If the issuer is rated by Moody’s, then that rating is used; if not rated by Moody’s, then a Standard & Poor’s rating is used; if not rated by S&P, then a Fitch rating is used. Cash and other portfolio assets that are not securities are not included in the categories mentioned above. Ratings are converted to the S&P scale and are subject to change. |
| (u) | For purposes of this presentation, accrued interest, where applicable, is included. |
From time to time “Other Assets Less Liabilities” may be negative due to timing of cash receipts.
Percentages are based on net assets as of 2/28/10, unless otherwise noted.
The portfolio is actively managed and current holdings may be different.
2
MARKET ENVIRONMENT
After having suffered through one of the largest and most concentrated downturns since the 1930s, most asset markets staged a remarkable rebound during 2009. This recovery in global activity, which covers this reporting period, has been led importantly by emerging Asian economies, but broadening to include most of the global economy to varying degrees. Primary drivers of the recovery included an unwinding of the inventory destocking that took place earlier, as well as massive fiscal and monetary stimulus.
During the worst of the credit crisis, policy makers globally loosened monetary and fiscal policy on a massive scale. Having reached their lower bound on policy rates prior to the beginning of the reporting period, several central banks were implementing quantitative easing as a means to further loosen monetary policy to offset the continuing fall in global economic activity. However, by the beginning of the period, there were ever-broadening signs that the global macroeconomic deterioration had passed, which caused the subsequent rise in asset valuations. As most asset prices rebounded during the period and the demand for liquidity waned, the debate concerning the existence of asset bubbles and the need for monetary exit strategies had begun, creating added uncertainty regarding the forward path of policy rates. This changing dynamic caused asset valuations to move broadly sideways during the latter part of the period.
3
EXPENSE TABLE
Fund expenses borne by the shareholders during the period,
September 1, 2009 through February 28, 2010
As a shareholder of the funds, you incur two types of costs: (1) transaction costs, including sales charges (loads) on certain purchase or redemption payments, and (2) ongoing costs, including management fees; distribution and service (12b-1) fees; and other fund expenses. These examples are intended to help you understand your ongoing costs (in dollars) of investing in the funds and to compare these costs with the ongoing costs of investing in other mutual funds.
The examples are based on an investment of $1,000 invested at the beginning of the period and held for the entire period September 1, 2009 through February 28, 2010.
Actual Expenses
The first line in the following tables provides information about actual account values and actual expenses. You may use the information in this line, together with the amount you invested, to estimate the expenses that you paid over the period. Simply divide your account value by $1,000 (for example, an $8,600 account value divided by $1,000 = 8.6), then multiply the result by the number in the first line under the heading entitled “Expenses Paid During Period” to estimate the expenses you paid on your account during this period.
Hypothetical Example for Comparison Purposes
The second line in the following tables provides information about hypothetical account values and hypothetical expenses based on the fund’s actual expense ratio and an assumed rate of return of 5% per year before expenses, which is not the fund’s actual return. The hypothetical account values and expenses may not be used to estimate the actual ending account balance or expenses you paid for the period. You may use this information to compare the ongoing costs of investing in the funds and other funds. To do so, compare this 5% hypothetical example with the 5% hypothetical examples that appear in the shareholder reports of the other funds.
Please note that the expenses shown in the tables are meant to highlight your ongoing costs only and do not reflect any transactional costs, such as sales charges (loads). Therefore, the second line in the following tables is useful in comparing ongoing costs only, and will not help you determine the relative total costs of owning different funds. In addition, if these transactional costs were included, your costs would have been higher.
4
Expense Table – continued
| | | | | | | | |
| MFS Money Market Fund | | Annualized
Expense
Ratio | | Beginning
Account Value
9/01/09 | | Ending
Account Value
2/28/10 | | Expenses
Paid During
Period (p)
9/01/09-2/28/10 |
| Actual | | 0.26% | | $1,000.00 | | $1,000.05 | | $1.29 |
| Hypothetical (h) | | 0.26% | | $1,000.00 | | $1,023.51 | | $1.30 |
| | | | | | | | |
MFS Government
Money Market Fund | | Annualized
Expense
Ratio | | Beginning
Account Value
9/01/09 | | Ending
Account Value
2/28/10 | | Expenses
Paid During
Period (p)
9/01/09-2/28/10 |
| Actual | | 0.20% | | $1,000.00 | | $1,000.15 | | $0.99 |
| Hypothetical (h) | | 0.20% | | $1,000.00 | | $1,023.80 | | $1.00 |
| (h) | 5% class return per year before expenses. |
| (p) | Expenses paid is equal to each class’ annualized expense ratio, as shown above, multiplied by the average account value over the period, multiplied by the number of days in the period, divided by the number of days in the year. Expenses paid do not include any applicable sales charges (loads). If these transaction costs had been included, your costs would have been higher. |
Expense Changes Impacting the Table
As more fully disclosed in footnote 3 to the financial statements, the expense ratios reported above include additional expense reductions to avoid a negative yield.
5
PORTFOLIO OF INVESTMENTS
2/28/10 (unaudited)
The Portfolio of Investments is a complete list of all securities owned by your fund. It is categorized by broad-based asset classes.
MFS MONEY MARKET FUND
| | | | | | |
| Certificates of Deposit - 14.5% | | | | | | |
| Issuer | | Shares/Par | | Value ($) |
| | | | | | |
| Major Banks - 12.7% | | | | | | |
Abbey National Treasury Services PLC (US Branch)
0.16%, due 4/23/10 | | $ | 17,320,000 | | $ | 17,320,000 |
| BNP Paribas/New York Branch, 0.19%, due 3/24/10 | | | 3,900,000 | | | 3,900,000 |
| Credit Agricole, 0.6%, due 5/18/10 | | | 20,100,000 | | | 20,100,000 |
| Credit Suisse, New York, 0.82%, due 8/02/10 | | | 19,600,000 | | | 19,600,000 |
| Royal Bank of Canada/New York Branch, 0.24%, due 4/26/10 | | | 12,000,000 | | | 12,000,000 |
| | | | | | |
| | | | | | $ | 72,920,000 |
| Other Banks & Diversified Financials - 1.8% | | | | | | |
| Nordea Bank Finland PLC (New York), 0.83%, due 7/15/10 | | $ | 10,100,000 | | $ | 10,100,000 |
| Total Certificates of Deposit, at Amortized Cost and Value | | | | | $ | 83,020,000 |
| | |
| Commercial Paper (y) - 51.1% | | | | | | |
| Consumer Products - 0.4% | | | | | | |
| Colgate-Palmolive Co., 0.07%, due 3/03/10 (t) | | $ | 2,093,000 | | $ | 2,092,992 |
| | |
| Electronics - 1.3% | | | | | | |
| Emerson Electric Co., 0.11%, due 3/29/10 (t) | | $ | 5,000,000 | | $ | 4,999,572 |
| Emerson Electric Co., 0.12%, due 4/13/10 (t) | | | 2,458,000 | | | 2,457,648 |
| | | | | | |
| | | | | | $ | 7,457,220 |
| Financial Institutions - 2.0% | | | | | | |
| General Electric Capital Corp., 0.13%, due 3/19/10 | | $ | 11,594,000 | | $ | 11,593,246 |
| | |
| Food & Beverages - 3.0% | | | | | | |
| Coca-Cola Co., 0.12%, due 4/06/10 (t) | | $ | 14,214,000 | | $ | 14,212,294 |
| Coca-Cola Co., 0.22%, due 5/17/10 (t) | | | 2,750,000 | | | 2,748,706 |
| | | | | | |
| | | | | | $ | 16,961,000 |
| Major Banks - 24.1% | | | | | | |
| ANZ National (International) LTD., 0.84%, due 6/25/10 | | $ | 22,610,000 | | $ | 22,548,802 |
| Bank of America Corp., 0.2%, due 3/23/10 | | | 17,657,000 | | | 17,654,842 |
| CBA (Delaware) Finance, Inc., 0.31%, due 3/25/10 | | | 19,550,000 | | | 19,545,960 |
| Goldman Sachs Group, Inc., 0.11%, due 3/19/10 | | | 6,500,000 | | | 6,499,643 |
| Goldman Sachs Group, Inc., 0.13%, due 4/01/10 | | | 10,469,000 | | | 10,467,828 |
| JPMorgan Chase & Co., 0.12%, due 3/10/10 | | | 3,666,000 | | | 3,665,890 |
| JPMorgan Chase & Co., 0.15%, due 4/20/10 | | | 4,218,000 | | | 4,217,121 |
6
Portfolio of Investments (unaudited) – continued
| | | | | | |
| Issuer | | Shares/Par | | Value ($) |
| | | | | | |
| Commercial Paper (y) - continued | | | | | | |
| Major Banks - continued | | | | | | |
| JPMorgan Chase & Co., 0.25%, due 4/19/10 | | $ | 9,070,000 | | $ | 9,066,914 |
| Societe Generale North America, Inc., 0.18%, due 3/18/10 | | | 17,392,000 | | | 17,390,522 |
| Toronto Dominion HDG USA, 0.4%, due 3/15/10 | | | 10,770,000 | | | 10,768,325 |
| Toronto Dominion HDG USA, 0.6%, due 4/09/10 | | | 9,420,000 | | | 9,413,877 |
| Westpac Banking Corp., 0.14%, due 4/28/10 (t) | | | 6,970,000 | | | 6,968,428 |
| | | | | | |
| | | | | | $ | 138,208,152 |
| Medical Equipment - 1.7% | | | | | | |
| Merck & Co., Inc., 0.1%, due 3/15/10 (t) | | $ | 9,928,000 | | $ | 9,927,614 |
| | |
| Network & Telecom - 1.4% | | | | | | |
| AT&T, Inc., 0.12%, due 4/05/10 (t) | | $ | 7,997,000 | | $ | 7,996,067 |
| | |
| Other Banks & Diversified Financials - 11.3% | | | | | | |
| Bank of Nova Scotia, 0.16%, due 4/20/10 | | $ | 17,220,000 | | $ | 17,216,173 |
| Citigroup Funding, Inc., 0.17%, due 3/08/10 | | | 361,000 | | | 360,988 |
| Citigroup Funding, Inc., 0.19%, due 4/05/10 | | | 16,969,000 | | | 16,965,865 |
| HSBC USA, Inc., 0.15%, due 4/09/10 | | | 16,952,000 | | | 16,949,245 |
| Lloyds TSB Bank PLC, 0.14%, due 3/01/10 | | | 1,594,000 | | | 1,594,000 |
| Nordea North America, Inc., 0.23%, due 3/08/10 | | | 9,100,000 | | | 9,099,593 |
| Rabobank USA Financial Corp., 0.17%, due 4/21/10 | | | 2,934,000 | | | 2,933,293 |
| | | | | | |
| | | | | | $ | 65,119,157 |
| Pharmaceuticals - 3.9% | | | | | | |
| Abbott Laboratories, 0.11%, due 4/12/10 (t) | | $ | 22,700,000 | | $ | 22,697,087 |
| | |
| Tobacco - 2.0% | | | | | | |
| Philip Morris International, Inc., 0.25%, due 7/29/10 (t) | | $ | 11,470,000 | | $ | 11,458,052 |
| Total Commercial Paper, at Amortized Cost and Value | | | | | $ | 293,510,587 |
| | |
| U.S. Government Agencies and Equivalents (y) - 12.5% | | | | | | |
| Fannie Mae, 0.05%, due 3/01/10 | | $ | 16,457,000 | | $ | 16,457,000 |
| Fannie Mae, 0.145%, due 5/26/10 | | | 18,200,000 | | | 18,193,696 |
| Federal Home Loan Bank, 0.08%, due 3/05/10 | | | 1,250,000 | | | 1,249,989 |
| Federal Home Loan Bank, 0.05%, due 3/08/10 | | | 256,000 | | | 255,998 |
| Federal Home Loan Bank, 0.145%, due 5/26/10 | | | 18,200,000 | | | 18,193,696 |
| Freddie Mac, 0.23%, due 9/01/10 | | | 17,200,000 | | | 17,179,780 |
Total U.S. Government Agencies and Equivalents,
at Amortized Cost and Value | | | | | $ | 71,530,159 |
7
Portfolio of Investments (unaudited) – continued
| | | | | | | |
| Issuer | | Shares/Par | | Value ($) | |
| | | | | | | |
| Floating Rate Demand Notes - 3.0% | | | | | | | |
| East Baton Rouge, LA, Pollution Control Rev. (Exxon Mobil Corp.), 0.12%, due 3/1/10 | | | 8,700,000 | | $ | 8,700,000 | |
| Lincoln County, WY, Pollution Control Rev. (Exxon Mobil Corp.), 0.07%, due 3/1/10 | | | 8,400,000 | | | 8,400,000 | |
| Total Floating Rate Demand Notes, at Amortized Cost and Value | | | | | $ | 17,100,000 | |
| | |
| Repurchase Agreements - 19.1% | | | | | | | |
| Bank of America Corp., 0.11%, dated 2/28/10, due 3/1/10, total to be received $57,346,526 (secured by U.S. Treasury and Federal Agency obligations and Mortgage Backed securities valued at $58,492,988 in a jointly traded account) | | $ | 57,346,000 | | $ | 57,346,000 | |
| Morgan Stanley, 0.1%, dated 2/28/10, due 3/1/10, total to be received $52,225,435 (secured by various U.S. Treasury and Federal Agency obligations and Mortgage Backed securities valued at $53,443,416 in a jointly traded account) | | | 52,225,000 | | | 52,225,000 | |
| Total Repurchase Agreements, at Cost and Value | | | | | $ | 109,571,000 | |
| Total Investments, at Amortized Cost and Value | | | | | $ | 574,731,746 | |
| | |
| Other Assets, Less Liabilities - (0.2)% | | | | | | (880,640 | ) |
| Net Assets - 100.0% | | | | | $ | 573,851,106 | |
See Portfolio Footnotes and Notes to Financial Statements
8
Portfolio of Investments (unaudited) – continued
MFS GOVERNMENT MONEY MARKET FUND
| | | | | | | |
| U.S. Government Agencies and Equivalents (y) - 64.4% | | | | | | | |
| Issuer | | Shares/Par | | Value ($) | |
| Fannie Mae, 0.05%, due 3/01/10 | | $ | 1,382,000 | | $ | 1,382,000 | |
| Fannie Mae, 0.12%, due 4/07/10 | | | 900,000 | | | 899,889 | |
| Fannie Mae, 0.125%, due 4/22/10 | | | 910,000 | | | 909,835 | |
| Fannie Mae, 0.21%, due 7/01/10 | | | 1,000,000 | | | 999,288 | |
| Fannie Mae, 0.17%, due 7/14/10 | | | 1,000,000 | | | 999,363 | |
| Federal Home Loan Bank, 0.14%, due 5/11/10 | | | 900,000 | | | 899,752 | |
| Federal Home Loan Bank, 0.16%, due 5/21/10 | | | 1,040,000 | | | 1,039,626 | |
| Federal Home Loan Bank, 0.145%, due 5/26/10 | | | 1,000,000 | | | 999,654 | |
| Freddie Mac, 0.08%, due 3/01/10 | | | 1,100,000 | | | 1,100,000 | |
| Freddie Mac, 0.2%, due 3/15/10 | | | 1,500,000 | | | 1,499,883 | |
| Freddie Mac, 0.25%, due 3/22/10 | | | 1,200,000 | | | 1,199,825 | |
| Freddie Mac, 0.12%, due 3/24/10 | | | 1,000,000 | | | 999,923 | |
| Freddie Mac, 0.21%, due 5/10/10 | | | 500,000 | | | 499,796 | |
| Freddie Mac, 0.2%, due 6/07/10 | | | 1,000,000 | | | 999,456 | |
| Freddie Mac, 0.23%, due 9/01/10 | | | 900,000 | | | 898,942 | |
| Freddie Mac, 0.225%, due 9/02/10 | | | 900,000 | | | 898,959 | |
| Freddie Mac, 0.25%, due 9/14/10 | | | 800,000 | | | 798,906 | |
| Tennessee Valley Authority Discount Notes, 0.05%, due 3/25/10 | | | 2,000,000 | | | 1,999,933 | |
Total U.S. Government Agencies and Equivalents,
at Amortized Cost and Value | | | | | $ | 19,025,030 | |
| | |
| Repurchase Agreements - 35.8% | | | | | | | |
| Bank of America Corp., 0.11%, dated 2/28/10, due 3/1/10, total to be received $5,918,054 (secured by U.S. Treasury and Federal Agency obligations and Mortgage Backed securities valued at $6,036,367 in a jointly traded account) | | $ | 5,918,000 | | $ | 5,918,000 | |
| Morgan Stanley, 0.1%, dated 2/28/10, due 3/1/10, total to be received $4,665,039 (secured by various U.S. Treasury and Federal Agency obligations and Mortgage Backed securities valued at $4,773,835 in a jointly traded account) | | | 4,665,000 | | | 4,665,000 | |
| Total Repurchase Agreements, at Cost and Value | | | | | $ | 10,583,000 | |
| Total Investments, at Amortized Cost and Value | | | | | $ | 29,608,030 | |
| | |
| Other Assets, Less Liabilities - (0.2)% | | | | | | (56,831 | ) |
| Net Assets - 100.0% | | | | | $ | 29,551,199 | |
| (t) | Security exempt from registration with the U.S. Securities and Exchange Commission under Section 4(2) of the Securities Act of 1933. |
| (y) | The rate shown represents an annualized yield at time of purchase. |
The following abbreviations are used in this report and are defined:
| PLC | | Public Limited Company |
See Notes to Financial Statements
9
Financial Statements
STATEMENTS OF ASSETS AND LIABILITIES
At 2/28/10 (unaudited)
These statements represents your funds’ balance sheet, which details the assets and liabilities comprising the total value of each fund.
MFS MONEY MARKET FUND
| | | |
| Assets | | | |
Investments, at amortized cost and value | | $465,160,746 | |
Repurchase agreements, at cost and value | | 109,571,000 | |
Total investments, at amortized cost and value | | $574,731,746 | |
Cash | | 539 | |
Receivables for | | | |
Fund shares sold | | 574,748 | |
Interest | | 223,126 | |
Receivable from investment adviser | | 1,096 | |
Other assets | | 5,544 | |
Total assets | | $575,536,799 | |
| Liabilities | | | |
Payables for | | | |
Fund shares reacquired | | 1,377,547 | |
Payable to affiliates | | | |
Investment adviser | | 1,571 | |
Shareholder servicing costs | | 224,961 | |
Administrative services fee | | 1,054 | |
Payable for independent Trustees’ compensation | | 31,345 | |
Accrued expenses and other liabilities | | 49,215 | |
Total liabilities | | $1,685,693 | |
Net assets | | $573,851,106 | |
| Net assets consist of | | | |
Paid-in capital | | $574,435,541 | |
Accumulated net realized gain (loss) on investments | | (554,335 | ) |
Accumulated distributions in excess of net investment income | | (30,100 | ) |
Net assets | | $573,851,106 | |
Shares of beneficial interest outstanding | | 574,433,247 | |
Net asset value per share (net assets of $573,851,106 / 574,433,247 shares of beneficial interest outstanding) | | $1.00 | |
A contingent deferred sales charge may be imposed on redemptions.
See Notes to Financial Statements
10
Statements of Assets and Liabilities (unaudited) – continued
MFS GOVERNMENT MONEY MARKET FUND
| | | |
| Assets | | | |
Investments, at amortized cost and value | | $19,025,030 | |
Repurchase agreements, at cost and value | | 10,583,000 | |
Total investments, at amortized cost and value | | $29,608,030 | |
Cash | | 801 | |
Receivables for | | | |
Interest | | 93 | |
Receivable from investment adviser | | 9,961 | |
Other assets | | 417 | |
Total assets | | $29,619,302 | |
| Liabilities | | | |
Payables for | | | |
Fund shares reacquired | | 39,873 | |
Payable to affiliates | | | |
Shareholder servicing costs | | 6,858 | |
Administrative services fee | | 192 | |
Payable for independent Trustees’ compensation | | 4,955 | |
Accrued expenses and other liabilities | | 16,225 | |
Total liabilities | | $68,103 | |
Net assets | | $29,551,199 | |
| Net assets consist of | | | |
Paid-in capital | | $29,556,199 | |
Accumulated distributions in excess of net investment income | | (5,000 | ) |
Net assets | | $29,551,199 | |
| Shares of beneficial interest outstanding | | 29,556,197 | |
Net asset value per share (net assets of $29,551,199 / 29,556,197 shares of beneficial interest outstanding) | | $1.00 | |
A contingent deferred sales charge may be imposed on redemptions.
See Notes to Financial Statements
11
Financial Statements
STATEMENTS OF OPERATIONS
Six months ended 2/28/10 (unaudited)
These statements describe how much each fund earned in investment income and accrued in expenses. It also describes any gains and/or losses generated by each fund’s operations.
MFS MONEY MARKET FUND
| | | |
| Net investment income | | | |
Interest income | | $762,276 | |
Expenses | | | |
Management fee | | $1,205,305 | |
Shareholder servicing costs | | 529,633 | |
Administrative services fee | | 49,703 | |
Independent Trustees’ compensation | | 18,699 | |
Custodian fee | | 36,504 | |
Shareholder communications | | 19,068 | |
Auditing fees | | 15,521 | |
Legal fees | | 12,565 | |
Miscellaneous | | 56,647 | |
Total expenses | | $1,943,645 | |
Fees paid indirectly | | (26,543 | ) |
Reduction of expenses by investment adviser | | (1,154,826 | ) |
Net expenses | | $762,276 | |
Net investment income | | $0 | |
Net realized gain (loss) on investment transactions | | $1,093 | |
Change in net assets from operations | | $1,093 | |
See Notes to Financial Statements
12
Statements of Operations (unaudited) – continued
MFS GOVERNMENT MONEY MARKET FUND
| | | |
| Net investment income | | | |
Interest income | | $31,867 | |
Expenses | | | |
Management fee | | $67,700 | |
Shareholder servicing costs | | 12,967 | |
Administrative services fee | | 8,679 | |
Independent Trustees’ compensation | | 3,195 | |
Custodian fee | | 5,253 | |
Shareholder communications | | 2,610 | |
Auditing fees | | 13,085 | |
Legal fees | | 847 | |
Registration fees | | 9,899 | |
Miscellaneous | | 4,707 | |
Total expenses | | $128,942 | |
Fees paid indirectly | | (1,762 | ) |
Reduction of expenses by investment adviser | | (95,313 | ) |
Net expenses | | $31,867 | |
Net investment income | | $0 | |
See Notes to Financial Statements
13
Financial Statements
STATEMENTS OF CHANGES IN NET ASSETS
These statements describe the increases and/or decreases in net assets resulting from operations, any distributions, and any shareholder transactions.
MFS MONEY MARKET FUND
| | | | | | |
| Change in net assets | | Six months ended
2/28/10
(unaudited) | | | Year ended
8/31/09 | |
| From operations | | | | | | |
Net investment income | | $0 | | | $4,910,954 | |
Net realized gain (loss) on investments | | 1,093 | | | (422,794 | ) |
Change in net assets from operations | | $1,093 | | | $4,488,160 | |
| Distributions declared to shareholders | | | | | | |
From net investment income | | $(30,100 | ) | | $(4,910,954 | ) |
| Fund share (principal) transactions at net asset value of $1 per share | | | | | | |
Net proceeds from sale of shares | | 117,006,417 | | | 607,124,517 | |
Net asset value of shares issued to shareholders in reinvestment of distributions | | 28,886 | | | 4,608,923 | |
Cost of shares reacquired | | (207,138,881 | ) | | (1,207,395,601 | ) |
Change in net assets from fund share transactions | | $(90,103,578 | ) | | $(595,662,161 | ) |
Total change in net assets | | $(90,132,585 | ) | | $(596,084,955 | ) |
| Net assets | | | | | | |
At beginning of period | | 663,983,691 | | | 1,260,068,646 | |
At end of period | | $573,851,106 | | | $663,983,691 | |
See Notes to Financial Statements
14
Statements of Changes in Net Assets – continued
MFS GOVERNMENT MONEY MARKET FUND
| | | | | | |
| Change in net assets | | Six months ended
2/28/10
(unaudited) | | | Year ended
8/31/09 | |
| From operations | | | | | | |
Net investment income | | $0 | | | $221,249 | |
| Distributions declared to shareholders | | | | | | |
From net investment income | | $(5,000 | ) | | $(221,249 | ) |
| Fund share (principal) transactions at net asset value of $1 per share | | | | | | |
Net proceeds from sale of shares | | 500 | | | 136,536,888 | |
Net asset value of shares issued to shareholders in reinvestment of distributions | | 4,451 | | | 185,897 | |
Cost of shares reacquired | | (9,861,783 | ) | | (152,693,290 | ) |
Change in net assets from fund share transactions | | $(9,856,832 | ) | | $(15,970,505 | ) |
Total change in net assets | | $(9,861,832 | ) | | $(15,970,505 | ) |
| Net assets | | | | | | |
At beginning of period | | 39,413,031 | | | 55,383,536 | |
At end of period | | $29,551,199 | | | $39,413,031 | |
See Notes to Financial Statements
15
Financial Statements
FINANCIAL HIGHLIGHTS
The financial highlights table is intended to help you understand the fund’s financial performance for the semiannual period and the past 5 fiscal years. Certain information reflects financial results for a single fund share. The total returns in the table represent the rate by which an investor would have earned (or lost) on an investment in the fund share class (assuming reinvestment of all distributions) held for the entire period.
MFS MONEY MARKET FUND
| | | | | | | | | | | | | | | | | | |
| | | Six months
ended
2/28/10 (unaudited) | | | Years ended 8/31 | |
| | | 2009 | | | 2008 | | | 2007 | | | 2006 | | | 2005 | |
Net asset value, beginning of period | | $1.00 | | | $1.00 | | | $1.00 | | | $1.00 | | | $1.00 | | | $1.00 | |
| Income (loss) from investment operations | | | | | | | | | | | | | | | | | | |
Net investment income (d) | | $0.00 | | | $0.01 | | | $0.04 | | | $0.05 | | | $0.04 | | | $0.02 | |
Net realized gain (loss) on investments | | 0.00 | (w) | | (0.01 | ) | | — | | | (0.00 | )(w) | | (0.00 | )(w) | | (0.00 | )(w) |
Total from investment operations | | $0.00 | (w) | | $(0.00 | )(w) | | $0.04 | | | $0.05 | | | $0.04 | | | $0.02 | |
| Less distributions declared to shareholders | | | | | | | | | | | | | | | | | | |
From net investment income | | $(0.00 | )(w) | | $(0.00 | )(w) | | $(0.04 | ) | | $(0.05 | ) | | $(0.04 | ) | | $(0.02 | ) |
Net asset value, end of period | | $1.00 | | | $1.00 | | | $1.00 | | | $1.00 | | | $1.00 | | | $1.00 | |
Total return (%) (r)(s)(t) | | 0.00 | (n)(w) | | 0.41 | | | 3.57 | | | 5.16 | | | 4.36 | | | 2.16 | |
| Ratios (%) (to average net assets) and Supplemental data: | | | | | | | | | | | | | | | | | | |
Expenses before expense reductions (f) | | 0.65 | (a) | | 0.68 | | | 0.63 | | | 0.61 | | | 0.68 | | | 0.75 | |
Expenses after expense reductions (f) | | 0.26 | (a) | | 0.40 | | | 0.35 | | | 0.32 | | | 0.37 | | | 0.44 | |
Net investment income | | 0.00 | (a) | | 0.50 | | | 3.51 | | | 5.03 | | | 4.28 | | | 2.17 | |
Net assets at end of period (000 omitted) | | $573,851 | | | $663,984 | | | $1,260,069 | | | $1,239,472 | | | $941,685 | | | $768,871 | |
| (d) | Per share data is based on average shares outstanding. |
| (f) | Ratios do not reflect reductions from fees paid indirectly, if applicable. |
| (r) | Certain expenses have been reduced without which performance would have been lower. |
| (s) | From time to time the fund may receive proceeds from litigation settlements, without which performance would be lower. |
| (t) | Total returns do not include any applicable sales charges. |
| (w) | Per share amount was less than $0.01 or 0.00%. |
See Notes to Financial Statements
16
Financial Highlights – continued
MFS GOVERNMENT MONEY MARKET FUND
| | | | | | | | | | | | | | | | | | |
| | | Six months
ended
2/28/10
(unaudited) | | | Years ended 8/31 | |
| | | | 2009 | | | 2008 | | | 2007 | | | 2006 | | | 2005 | |
Net asset value, beginning of period | | $1.00 | | | $1.00 | | | $1.00 | | | $1.00 | | | $1.00 | | | $1.00 | |
| Income (loss) from investment operations | | | | | | | | | | | | | | | | | | |
Net investment income (d) | | $0.00 | | | $0.00 | (w) | | $0.03 | | | $0.05 | | | $0.04 | | | $0.02 | |
| Less distributions declared to shareholders | | | | | | | | | | | | | | | | | | |
From net investment income | | $(0.00 | )(w) | | $(0.00 | )(w) | | $(0.03 | ) | | $(0.05 | ) | | $(0.04 | ) | | $(0.02 | ) |
Net asset value, end of period | | $1.00 | | | $1.00 | | | $1.00 | | | $1.00 | | | $1.00 | | | $1.00 | |
Total return (%) (r)(s)(t) | | 0.01 | (n) | | 0.26 | | | 2.87 | | | 4.79 | | | 3.89 | | | 2.02 | |
Ratios (%) (to average net
assets) and Supplemental
data: | | | | | | | | | | | | | | | | | | |
Expenses before expense
reductions (f) | | 0.76 | (a) | | 0.69 | | | 0.94 | | | 0.94 | | | 1.10 | | | 0.87 | |
Expenses after expense
reductions (f) | | 0.20 | (a) | | 0.33 | | | 0.59 | | | 0.59 | | | 0.75 | | | 0.52 | |
Net investment income | | 0.00 | (a) | | 0.27 | | | 2.59 | | | 4.68 | | | 3.78 | | | 1.96 | |
Net assets at end of period
(000 omitted) | | $29,551 | | | $39,413 | | | $55,384 | | | $27,279 | | | $22,057 | | | $24,414 | |
| (d) | Per share data is based on average shares outstanding. |
| (f) | Ratios do not reflect reductions from fees paid indirectly, if applicable. |
| (r) | Certain expenses have been reduced without which performance would have been lower. |
| (s) | From time to time the fund may receive proceeds from litigation settlements, without which performance would be lower. |
| (t) | Total returns do not include any applicable sales charges. |
| (w) | Per share amount was less than $0.01 or 0.00%. |
See Notes to Financial Statements
17
NOTES TO FINANCIAL STATEMENTS
(unaudited)
| (1) | | Business and Organization |
MFS Money Market Fund and MFS Government Money Market Fund (the funds) are each a series of MFS Series Trust IV (the trust). The trust is organized as a Massachusetts business trust and is registered under the Investment Company Act of 1940, as amended, as an open-end management investment company.
| (2) | | Significant Accounting Policies |
General – The preparation of financial statements in conformity with U.S. generally accepted accounting principles requires management to make estimates and assumptions that affect the reported amounts of assets and liabilities, and disclosure of contingent assets and liabilities at the date of the financial statements and the reported amounts of revenues and expenses during the reporting period. Actual results could differ from those estimates. In the preparation of these financial statements, management has evaluated subsequent events occurring after the date of the fund’s Statements of Assets and Liabilities through the date that the financial statements were issued.
Investment Valuations – Pursuant to procedures approved by the Board of Trustees, investments held by the fund are generally valued at amortized cost, which approximates market value. Amortized cost involves valuing an instrument at its cost as adjusted for amortization of premium or accretion of discount rather than its current market value. The amortized cost value of an instrument can be different from the market value of an instrument.
Various inputs are used in determining the value of the funds’ assets or liabilities. These inputs are categorized into three broad levels. In certain cases, the inputs used to measure fair value may fall into different levels of the fair value hierarchy. In such cases, an investment’s level within the fair value hierarchy is based on the lowest level of input that is significant to the fair value measurement. The funds’ assessment of the significance of a particular input to the fair value measurement in its entirety requires judgment, and considers factors specific to the investment. Level 1 includes unadjusted quoted prices in active markets for identical assets or liabilities. Level 2 includes other significant observable market-based inputs (including quoted prices for similar securities, interest rates, prepayment speed, and credit risk). Level 3 includes unobservable inputs, which may include the adviser’s own assumptions in determining the fair value of investments. Other financial instruments are derivative instruments not reflected in total investments, such
18
Notes to Financial Statements (unaudited) – continued
as futures, forwards, swap contracts, and written options. The following is a summary of the levels used as of February 28, 2010 in valuing the funds’ assets or liabilities:
| | | | | | | | |
Investments at Value –
Short Term Securities | | Level 1 | | Level 2 | | Level 3 | | Total |
| MFS Money Market Fund | | $— | | $574,731,746 | | $— | | $574,731,746 |
| MFS Government Money Market Fund | | $— | | $29,608,030 | | $— | | $29,608,030 |
For further information regarding security characteristics, see the Portfolios of Investments.
In January 2010, Accounting Standards Update (ASU) No. 2010-06, Improving Disclosures about Fair Value Measurements (the “Update”) was issued, and is effective for interim and annual reporting periods beginning after December 15, 2009. This Update provides for expanded disclosures about fair value measurements. Management has evaluated the application of the Update to each fund, and believes the impact is limited to expanded disclosures resulting from the adoption of this Update in the funds’ financial statements.
Repurchase Agreements – Each fund may enter into repurchase agreements with approved counterparties. Each repurchase agreement is recorded at cost. Each fund requires that the securities collateral in a repurchase transaction be transferred to a custodian. The funds monitor, on a daily basis, the value of the collateral to ensure that its value, including accrued interest, is greater than amounts owed to the funds under each such repurchase agreement. The funds and other funds managed by MFS may utilize a joint trading account for the purpose of entering into one or more repurchase agreements.
Indemnifications – Under each fund’s organizational documents, its officers and Trustees may be indemnified against certain liabilities and expenses arising out of the performance of their duties to the funds. Additionally, in the normal course of business, each fund enters into agreements with service providers that may contain indemnification clauses. Each fund’s maximum exposure under these agreements is unknown as this would involve future claims that may be made against the funds that have not yet occurred.
Investment Transactions and Income – Investment transactions are recorded on the trade date. Interest income is recorded on the accrual basis. All premium and discount is amortized or accreted for financial statement purposes in accordance with U.S. generally accepted accounting principles.
The funds may receive proceeds from litigation settlements. Any proceeds received from litigation involving portfolio holdings are reflected in the Statements of Operations in realized gain/loss if the security has been disposed of by the funds or in unrealized gain/loss if the security is still held by the funds. Any other proceeds from litigation not related to portfolio holdings are reflected as other income in the Statements of Operations.
19
Notes to Financial Statements (unaudited) – continued
Fees Paid Indirectly – Each fund’s custody fee may be reduced according to an arrangement that measures the value of cash deposited with the custodian by the funds. This amount, for the six months ended February 28, 2010, is shown as a reduction of total expenses on the Statements of Operations.
Tax Matters and Distributions – Each fund intends to qualify as a regulated investment company, as defined under Subchapter M of the Internal Revenue Code, and to distribute all of its taxable income, including realized capital gains. As a result, no provision for federal income tax is required. Each of the fund’s federal tax returns for the prior three fiscal years remain subject to examination by the Internal Revenue Service. Foreign taxes, if any, have been accrued by each fund in the accompanying financial statements.
Distributions to shareholders are recorded on the ex-dividend date. Income and capital gain distributions are determined in accordance with income tax regulations, which may differ from U.S. generally accepted accounting principles. Certain capital accounts in the financial statements are periodically adjusted for permanent differences in order to reflect their tax character. These adjustments have no impact on net assets or net asset value per share. Temporary differences which arise from recognizing certain items of income, expense, gain or loss in different periods for financial statement and tax purposes will reverse at some time in the future. Distributions in excess of net investment income or net realized gains are temporary overdistributions for financial statement purposes resulting from differences in the recognition or classification of income, expenses or distributions for financial statement and tax purposes.
During the year ended August 31, 2009, there were no significant adjustments due to differences between book and tax accounting for either the MFS Money Market Fund or the MFS Government Money Market Fund.
The tax character of distributions made during the current period will be determined at fiscal year end. The tax character of distributions declared to shareholders for the last fiscal year is as follows:
| | | | |
| | | MFS Money
Market Fund | | MFS Government
Money Market Fund |
| | | 8/31/09 | | 8/31/09 |
| Ordinary income (including any short-term capital gains) | | $4,910,954 | | $221,249 |
20
Notes to Financial Statements (unaudited) – continued
The federal tax cost and the tax basis components of distributable earnings were as follows:
| | | | | | |
| As of 2/28/10 | | MFS Money
Market Fund | | | MFS Government
Money Market Fund | |
| Cost of investments | | $574,731,746 | | | $29,608,030 | |
| | |
| As of 8/31/09 | | | | | | |
| Undistributed ordinary income | | $29,740 | | | $4,890 | |
| Capital loss carryforwards | | (555,428 | ) | | — | |
| Other temporary differences | | (29,740 | ) | | (4,890 | ) |
The aggregate cost above includes prior fiscal year end tax adjustments, if any.
As of August 31, 2009, the MFS Money Market Fund had capital loss carryforwards available to offset future realized gains. Such losses expire as follows:
| | | |
| 8/31/11 | | $(8,329 | ) |
| 8/31/13 | | (151 | ) |
| 8/31/15 | | (35 | ) |
| 8/31/16 | | (124,119 | ) |
| 8/31/17 | | (422,794 | ) |
| | $(555,428 | ) |
| (3) | | Transactions with Affiliates |
Investment Adviser – Each fund has an investment advisory agreement with MFS to provide overall investment management and related administrative services and facilities to the funds.
Each fund’s management fee is computed daily and paid monthly at the following annual rates:
| | | |
| First $1 billion of average daily net assets | | 0.40 | % |
| Average daily net assets in excess of $1 billion | | 0.35 | % |
During the six months ended February 28, 2010, MFS voluntarily waived receipt of $1,153,579 and $67,700 of MFS Money Market Fund’s and MFS Government Money Market Fund’s management fees, respectively, in order to avoid a negative yield. These amounts are reflected as a reduction of the total expenses in the Statements of Operations. The management fees incurred for the six months ended February 28, 2010 were equivalent to an annual effective rate of 0.02% and 0.00% of average daily net assets for the MFS Money Market Fund and MFS Government Money Market Fund, respectively.
To avoid a negative yield for the six months ended February 28, 2010, MFS voluntarily agreed to reduce certain other expenses for MFS Government Money Market Fund in the amount of $27,542, which is shown as a reduction of total expenses in the Statement of Operations.
21
Notes to Financial Statements (unaudited) – continued
Distributor – Certain shares acquired through an exchange may be subject to a contingent deferred sales charge (CDSC) upon redemption depending on when the shares exchanged were originally purchased. CDSC imposed during the six months ended February 28, 2010 for the MFS Money Market Fund and MFS Government Money Market Fund were $1,137 and $0, respectively.
Shareholder Servicing Agent – MFS Service Center, Inc. (MFSC), a wholly-owned subsidiary of MFS, receives a fee from each fund for its services as shareholder servicing agent calculated as a percentage of the average daily net assets of each fund as determined periodically under the supervision of the funds’ Board of Trustees. For the six months ended February 28, 2010, the fees were $185,937 and $4,323, which equated to 0.0617% and 0.0255% annually of each fund’s average daily net assets for the MFS Money Market Fund and MFS Government Money Market Fund, respectively. MFSC also receives payment from each fund for out-of-pocket expenses, sub-accounting and other shareholder servicing costs which may be paid to affiliated and unaffiliated service providers. For the six months ended February 28, 2010, these out-of-pocket expenses, sub-accounting and other shareholder servicing costs amounted to $343,696 and $8,644 for the MFS Money Market Fund and MFS Government Money Market Fund, respectively.
Administrator – MFS provides certain financial, legal, shareholder communications, compliance, and other administrative services to each fund. Under an administrative services agreement, each fund partially reimburses MFS the costs incurred to provide these services. Each fund is charged an annual fixed amount of $17,500 plus a fee based on average daily net assets. The administrative services fees incurred for the six months ended February 28, 2010 were equivalent to an annual effective rate of 0.0165% and 0.0513% of each fund’s average daily net assets for the MFS Money Market Fund and MFS Government Money Market Fund, respectively.
Trustees’ and Officers’ Compensation – Each fund pays compensation to independent Trustees in the form of a retainer, attendance fees, and additional compensation to Board and Committee chairpersons. The funds do not pay compensation directly to Trustees or officers of the funds who are also officers of the investment adviser, all of whom receive remuneration for their services to the funds from MFS. Certain officers and Trustees of the funds are officers or directors of MFS, MFD, and MFSC.
Prior to December 31, 2001, the funds had an unfunded defined benefit plan (“DB plan”) for independent Trustees. As of December 31, 2001, the Board took action to terminate the DB plan with respect to then-current and any future independent Trustees, such that the DB Plan covers only certain of those former independent Trustees who retired on or before December 31, 2001. The DB Plan resulted in a pension expense of $2,542 and $553 for the MFS Money Market
22
Notes to Financial Statements (unaudited) – continued
Fund and MFS Government Money Market Fund, respectively, and is included in independent Trustees’ compensation for the six months ended February 28, 2010. The liability for deferred retirement benefits payable to certain independent Trustees under the DB plan amounted to $27,813 and $4,563 for the MFS Money Market Fund and MFS Government Money Market Fund, respectively, at February 28, 2010, and is included in payable for independent Trustees’ compensation on the Statements of Assets and Liabilities.
Other – These funds and certain other funds managed by MFS (the funds) have entered into services agreements (the Agreements) which provide for payment of fees by the funds to Tarantino LLC and Griffin Compliance LLC in return for the provision of services of an Independent Chief Compliance Officer (ICCO) and Assistant ICCO, respectively, for the funds. The ICCO and Assistant ICCO are officers of the funds and the sole members of Tarantino LLC and Griffin Compliance LLC, respectively. The funds can terminate the Agreements with Tarantino LLC and Griffin Compliance LLC at any time under the terms of the Agreements. For the six months ended February 28, 2010, the aggregate fees paid by the funds to Tarantino LLC and Griffin Compliance LLC were $4,372 and $273 for the MFS Money Market Fund and MFS Government Money Market Fund, respectively, and are included in miscellaneous expense on the Statements of Operations. MFS has agreed to reimburse the funds for a portion of the payments made by the funds in the amount of $1,247 and $71 for the MFS Money Market Fund and MFS Government Money Market Fund, respectively, which is shown as a reduction of total expenses in the Statements of Operations. Additionally, MFS has agreed to bear all expenses associated with office space, other administrative support, and supplies provided to the ICCO and Assistant ICCO.
Purchases and sales of money market securities, exclusive of securities subject to repurchase agreements, were as follows:
| | | | |
| | | Purchases | | Sales |
| MFS Money Market Fund | | $12,729,994,074 | | $12,778,190,503 |
| MFS Government Money Market Fund | | $541,697,426 | | $548,674,000 |
| (5) | | Shares of Beneficial Interest |
Each fund’s Declaration of Trust permits the Trustees to issue an unlimited number of full and fractional shares of beneficial interest.
Effective at the close of business on February 27, 2009, the sale of MFS Money Market Fund shares has been suspended except in certain circumstances. Please see the fund’s prospectus for details.
23
Notes to Financial Statements (unaudited) – continued
Effective at the close of business on January 16, 2009, the sale of MFS Government Money Market Fund shares has been suspended except in certain circumstances. Please see the fund’s prospectus for details.
Each fund and certain other funds managed by MFS participate in a $1.1 billion unsecured committed line of credit, subject to a $1 billion sublimit, provided by a syndication of banks under a credit agreement. Borrowings may be made for temporary financing needs. Interest is charged to each fund, based on its borrowings, generally at a rate equal to the higher of the Federal Reserve funds rate or one month LIBOR plus an agreed upon spread. A commitment fee, based on the average daily, unused portion of the committed line of credit, is allocated among the participating funds at the end of each calendar quarter. In addition, each fund and other funds managed by MFS have established unsecured uncommitted borrowing arrangements with certain banks for temporary financing needs. Interest is charged to each fund, based on its borrowings, at a rate equal to the Federal Reserve funds rate plus an agreed upon spread. For the six months ended February 28, 2010, the funds’ commitment fees were $7,210 and $435 and interest expense was $0 and $0 for the MFS Money Market Fund and MFS Government Money Market Fund, respectively, and are included in miscellaneous expense on the Statements of Operations.
24
BOARD REVIEW OF INVESTMENT ADVISORY AGREEMENT
A discussion regarding the Board’s most recent review and renewal of the fund’s Investment Advisory Agreement with MFS is available by clicking on the fund’s name under “Mutual Funds” in the “Products and Performance” section of the MFS Web site (mfs.com).
PROXY VOTING POLICIES AND INFORMATION
A general description of the MFS funds’ proxy voting policies and procedures is available without charge, upon request, by calling 1-800-225-2606, by visiting the Proxy Voting section of mfs.com or by visiting the SEC’s Web site at http://www.sec.gov.
Information regarding how the fund voted proxies relating to portfolio securities during the most recent twelve-month period ended June 30 is available without charge by visiting the Proxy Voting section of mfs.com or by visiting the SEC’s Web site at http://www.sec.gov.
QUARTERLY PORTFOLIO DISCLOSURE
The fund will file a complete schedule of portfolio holdings with the Securities and Exchange Commission (the Commission) for the first and third quarters of each fiscal year on Form N-Q. The fund’s Form N-Q may be reviewed and copied at the:
Public Reference Room
Securities and Exchange Commission
100 F Street, NE, Room 1580
Washington, D.C. 20549
Information on the operation of the Public Reference Room may be obtained by calling the Commission at 1-800-SEC-0330. The fund’s Form N-Q is available on the EDGAR database on the Commission’s Internet Web site at http://www.sec.gov, and copies of this information may be obtained, upon payment of a duplicating fee, by electronic request at the following e-mail address: publicinfo@sec.gov or by writing the Public Reference Section at the above address.
A shareholder can also obtain the quarterly portfolio holdings report at mfs.com.
FURTHER INFORMATION
From time to time, MFS may post important information about the fund or the MFS funds on the MFS web site (mfs.com). This information is available by visiting the “News & Commentary” section of mfs.com or by clicking on the fund’s name under “Mutual Funds” in the “Products and Performance” section of mfs.com.
25
CONTACT US
Web site
mfs.com
MFS TALK
1-800-637-8255
24 hours a day
Account service and literature
Shareholders
1-800-225-2606
Investment professionals
1-800-343-2829
Retirement plan services
1-800-637-1255
Mailing address
MFS Service Center, Inc.
P.O. Box 55824
Boston, MA 02205-5824
Overnight mail
MFS Service Center, Inc.
c/o Boston Financial Data Services
30 Dan Road
Canton, MA 02021-2809

Save paper with eDelivery. MFS® will send you prospectuses, reports, and proxies directly via e-mail so you will get information faster with less mailbox clutter. To sign up: 1. go to mfs.com. 2. log in via MFS® Access. 3. select eDelivery. If you own your MFS fund shares through a financial institution or a retirement plan, MFS® TALK, MFS Access, and eDelivery may not be available to you.

The Registrant has not amended any provision in its Code of Ethics (the “Code”) that relates to any element of the Code’s definition enumerated in paragraph (b) of Item 2 of this Form N-CSR.
| ITEM 3. | AUDIT COMMITTEE FINANCIAL EXPERT. |
Not applicable for semi-annual reports.
| ITEM 4. | PRINCIPAL ACCOUNTANT FEES AND SERVICES. |
Not applicable for semi-annual reports.
| ITEM 5. | AUDIT COMMITTEE OF LISTED REGISTRANTS. |
Not applicable to the Registrant.
A schedule of investments for each series of the Registrant is included as part of the report to shareholders of such series under Item 1 of this Form N-CSR.
| ITEM 7. | DISCLOSURE OF PROXY VOTING POLICIES AND PROCEDURES FOR CLOSED-END MANAGEMENT INVESTMENT COMPANIES. |
Not applicable to the Registrant.
| ITEM 8. | PORTFOLIO MANAGERS OF CLOSED-END MANAGEMENT INVESTMENT COMPANIES. |
Not applicable to the Registrant.
| ITEM 9. | PURCHASES OF EQUITY SECURITIES BY CLOSED-END MANAGEMENT INVESTMENT COMPANY AND AFFILIATED PURCHASERS. |
Not applicable to the Registrant.
| ITEM 10. | SUBMISSION OF MATTERS TO A VOTE OF SECURITY HOLDERS. |
There were no material changes to the procedures by which shareholders may send recommendations to the Board for nominees to the Registrant’s Board since the Registrant last provided disclosure as to such procedures in response to the requirements of Item 407 (c)(2)(iv) of Regulation S-K or this Item.
| ITEM 11. | CONTROLS AND PROCEDURES. |
| (a) | Based upon their evaluation of the effectiveness of the registrant’s disclosure controls and procedures (as defined in Rule 30a-3(c) under the Investment Company Act of 1940 (the “Act”)) as conducted within 90 days of the filing date of this report on Form N-CSR, the registrant’s principal financial officer and principal executive officer have concluded that those disclosure controls and procedures provide reasonable assurance that the material information required to be disclosed by the registrant on this report is recorded, processed, summarized and reported within the time periods specified in the Securities and Exchange Commission’s rules and forms. |
| (b) | There were no changes in the registrant’s internal controls over financial reporting (as defined in Rule 30a-3(d) under the Act) that occurred during the second fiscal quarter of the period covered by the report that have materially affected, or are reasonably likely to materially affect, the registrant’s internal control over financial reporting. |
| (a) | File the exhibits listed below as part of this form. Letter or number the exhibits in the sequence indicated. |
| | (1) | Any code of ethics, or amendment thereto, that is the subject of the disclosure required by Item 2, to the extent that the registrant intends to satisfy the Item 2 requirements through filing of an exhibit. |
| | (2) | A separate certification for each principal executive officer and principal financial officer of the registrant as required by Rule 30a-2 under the Act (17 CFR 270.30a-2): Attached hereto. |
| (b) | If the report is filed under Section 13(a) or 15(d) of the Exchange Act, provide the certifications required by Rule 30a-2(b) under the Act (17 CFR 270.30a-2(b)), Rule 13a-14(b) or Rule 15d-14(b) under the Exchange Act (17 CFR 240.13a-14(b) or 240.15d-14(b)) and Section 1350 of Chapter 63 of Title 18 of the United States Code (18 U.S.C. 1350) as an exhibit. A certification furnished pursuant to this paragraph will not be deemed “filed” for the purposes of Section 18 of the Exchange Act (15 U.S.C. 78r), or otherwise subject to the liability of that section. Such certification will not be deemed to be incorporated by reference into any filing under the Securities Act of 1933 or the Exchange Act, except to the extent that the registrant specifically incorporates it by reference: Attached hereto. |
Notice
A copy of the Amended and Restated Declaration of Trust, as amended, of the Registrant is on file with the Secretary of State of The Commonwealth of Massachusetts and notice is hereby given that this instrument is executed on behalf of the Registrant by an officer of the Registrant as an officer and not individually and the obligations of or arising out of this instrument are not binding upon any of the Trustees or shareholders individually, but are binding only upon the assets and property of the respective constituent series of the Registrant.
SIGNATURES
Pursuant to the requirements of the Securities Exchange Act of 1934 and the Investment Company Act of 1940, the registrant has duly caused this report to be signed on its behalf by the undersigned, thereunto duly authorized.
(Registrant) MFS SERIES TRUST IV
| | |
| By (Signature and Title)* | | MARIA F. DWYER |
| | Maria F. Dwyer, President |
Date: April 16, 2010
Pursuant to the requirements of the Securities Exchange Act of 1934 and the Investment Company Act of 1940, this report has been signed below by the following persons on behalf of the registrant and in the capacities and on the dates indicated.
| | |
| By (Signature and Title)* | | MARIA F. DWYER |
| | Maria F. Dwyer, President (Principal Executive Officer) |
Date: April 16, 2010
| | |
| By (Signature and Title)* | | JOHN M. CORCORAN |
| | John M. Corcoran, Treasurer (Principal Financial Officer and Accounting Officer) |
Date: April 16, 2010
| * | Print name and title of each signing officer under his or her signature. |