UNITED STATES
SECURITIES AND EXCHANGE COMMISSION
Washington, D.C. 20549
FORM N-CSR
CERTIFIED SHAREHOLDER REPORT OF
REGISTERED MANAGEMENT INVESTMENT COMPANIES
Investment Company Act file number 811-02594
MFS SERIES TRUST IV
(Exact name of registrant as specified in charter)
500 Boylston Street, Boston, Massachusetts 02116
(Address of principal executive offices) (Zip code)
Susan S. Newton
Massachusetts Financial Services Company
500 Boylston Street
Boston, Massachusetts 02116
(Name and address of agents for service)
Registrant’s telephone number, including area code: (617) 954-5000
Date of fiscal year end: August 31
Date of reporting period: February 28, 2011
| ITEM 1. | REPORTS TO STOCKHOLDERS. |

MFS® Mid Cap Growth Fund

SEMIANNUAL REPORT
February 28, 2011
OTC-SEM
MFS® MID CAP GROWTH FUND
The report is prepared for the general information of shareholders.
It is authorized for distribution to prospective investors only when preceded or accompanied by a current prospectus.
NOT FDIC INSURED Ÿ MAY LOSE VALUE Ÿ NO BANK GUARANTEE

LETTER FROM THE CEO
Dear Shareholders:
After an extended rebound in the financial markets, uncertainty returned in 2010 as investors began to question the durability of the recovery for global economies and markets. That uncertainty led to increased risk aversion, especially as investors saw the eurozone struggle with the debt woes of many of its members. Last September, the U.S. Federal Reserve Board’s promises to further loosen monetary policy helped assuage market fears and drive asset prices off their recent lows. A combination of solid earnings and improving economic data gave an additional boost to investor sentiment. For 2011, we are cautiously optimistic that economic growth will continue to improve and that the global economies will recover from the shocks of the past few years. We expect the pace of
recovery worldwide will be uneven and volatile and acknowledge the elevated uncertainty created by events in Japan, Europe, and the Middle East.
As always, we continue to be mindful of the many economic challenges faced at the local, national, and international levels. It is in times such as these that we want to remind investors of the merits of maintaining a long-term view, adhering to basic investing principles such as asset allocation and diversification, and working closely with their advisors to research and identify appropriate investment opportunities.
Respectfully,

Robert J. Manning
Chairman and Chief Executive Officer
MFS Investment Management®
April 15, 2011
The opinions expressed in this letter are subject to change, may not be relied upon for investment advice, and no forecasts can be guaranteed.
1
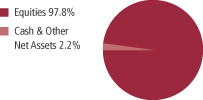
PORTFOLIO COMPOSITION
Portfolio structure
| | | | |
| Top ten holdings | | | | |
| Newfield Exploration Co. | | | 1.8% | |
| American Tower Corp., “A” | | | 1.8% | |
| Dresser-Rand Group, Inc. | | | 1.7% | |
| AMETEK, Inc. | | | 1.7% | |
| Danaher Corp. | | | 1.7% | |
| Affiliated Managers Group, Inc. | | | 1.7% | |
| Alexion Pharmaceuticals, Inc. | | | 1.6% | |
| Autodesk, Inc. | | | 1.4% | |
| Cameron International Corp. | | | 1.4% | |
| Mead Johnson Nutrition Co., “A” | | | 1.4% | |
| | | | |
| Equity sectors | | | | |
| Technology | | | 22.4% | |
| Industrial Goods & Services | | | 11.8% | |
| Energy | | | 9.7% | |
| Health Care | | | 8.8% | |
| Special Products & Services | | | 8.0% | |
| Financial Services | | | 7.9% | |
| Leisure | | | 7.5% | |
| Retailing | | | 6.5% | |
| Basic Materials | | | 4.1% | |
| Autos & Housing | | | 3.4% | |
| Transportation | | | 3.0% | |
| Utilities & Communications | | | 2.9% | |
| Consumer Staples | | | 1.8% | |
Percentages are based on net assets as of 2/28/11.
The portfolio is actively managed and current holdings may be different.
2
EXPENSE TABLE
Fund expenses borne by the shareholders during the period,
September 1, 2010 through February 28, 2011
As a shareholder of the fund, you incur two types of costs: (1) transaction costs, including sales charges (loads) on certain purchase or redemption payments, and (2) ongoing costs, including management fees; distribution and service (12b-1) fees; and other fund expenses. This example is intended to help you understand your ongoing costs (in dollars) of investing in the fund and to compare these costs with the ongoing costs of investing in other mutual funds.
The example is based on an investment of $1,000 invested at the beginning of the period and held for the entire period September 1, 2010 through February 28, 2011.
The expenses include the payment of a portion of the transfer-agent-related expenses of MFS funds that invest in the fund. For further information, please see the Notes to the Financial Statements.
Actual Expenses
The first line for each share class in the following table provides information about actual account values and actual expenses. You may use the information in this line, together with the amount you invested, to estimate the expenses that you paid over the period. Simply divide your account value by $1,000 (for example, an $8,600 account value divided by $1,000 = 8.6), then multiply the result by the number in the first line under the heading entitled “Expenses Paid During Period” to estimate the expenses you paid on your account during this period.
Hypothetical Example for Comparison Purposes
The second line for each share class in the following table provides information about hypothetical account values and hypothetical expenses based on the fund’s actual expense ratio and an assumed rate of return of 5% per year before expenses, which is not the fund’s actual return. The hypothetical account values and expenses may not be used to estimate the actual ending account balance or expenses you paid for the period. You may use this information to compare the ongoing costs of investing in the fund and other funds. To do so, compare this 5% hypothetical example with the 5% hypothetical examples that appear in the shareholder reports of the other funds.
Please note that the expenses shown in the table are meant to highlight your ongoing costs only and do not reflect any transactional costs, such as sales charges (loads). Therefore, the second line for each share class in the table is useful in comparing ongoing costs only, and will not help you determine the
3
Expense Table – continued
relative total costs of owning different funds. In addition, if these transactional costs were included, your costs would have been higher.
| | | | | | | | | | | | | | | | | | |
Share Class | | | | Annualized Expense Ratio | | | Beginning Account Value 9/01/10 | | | Ending Account Value 2/28/11 | | | Expenses Paid During Period (p) 9/01/10-2/28/11 | |
| A | | Actual | | | 1.29% | | | | $1,000.00 | | | | $1,344.10 | | | | $7.50 | |
| | Hypothetical (h) | | | 1.29% | | | | $1,000.00 | | | | $1,018.40 | | | | $6.46 | |
| B | | Actual | | | 2.04% | | | | $1,000.00 | | | | $1,338.96 | | | | $11.83 | |
| | Hypothetical (h) | | | 2.04% | | | | $1,000.00 | | | | $1,014.68 | | | | $10.19 | |
| C | | Actual | | | 2.04% | | | | $1,000.00 | | | | $1,338.56 | | | | $11.83 | |
| | Hypothetical (h) | | | 2.04% | | | | $1,000.00 | | | | $1,014.68 | | | | $10.19 | |
| I | | Actual | | | 1.04% | | | | $1,000.00 | | | | $1,346.10 | | | | $6.05 | |
| | Hypothetical (h) | | | 1.04% | | | | $1,000.00 | | | | $1,019.64 | | | | $5.21 | |
| R1 | | Actual | | | 2.04% | | | | $1,000.00 | | | | $1,338.46 | | | | $11.83 | |
| | Hypothetical (h) | | | 2.04% | | | | $1,000.00 | | | | $1,014.68 | | | | $10.19 | |
| R2 | | Actual | | | 1.54% | | | | $1,000.00 | | | | $1,341.50 | | | | $8.94 | |
| | Hypothetical (h) | | | 1.54% | | | | $1,000.00 | | | | $1,017.16 | | | | $7.70 | |
| R3 | | Actual | | | 1.29% | | | | $1,000.00 | | | | $1,344.15 | | | | $7.50 | |
| | Hypothetical (h) | | | 1.29% | | | | $1,000.00 | | | | $1,018.40 | | | | $6.46 | |
| R4 | | Actual | | | 1.04% | | | | $1,000.00 | | | | $1,345.40 | | | | $6.05 | |
| | Hypothetical (h) | | | 1.04% | | | | $1,000.00 | | | | $1,019.64 | | | | $5.21 | |
| 529A | | Actual | | | 1.39% | | | | $1,000.00 | | | | $1,344.33 | | | | $8.08 | |
| | Hypothetical (h) | | | 1.39% | | | | $1,000.00 | | | | $1,017.90 | | | | $6.95 | |
| 529B | | Actual | | | 2.14% | | | | $1,000.00 | | | | $1,339.56 | | | | $12.41 | |
| | Hypothetical (h) | | | 2.14% | | | | $1,000.00 | | | | $1,014.18 | | | | $10.69 | |
| 529C | | Actual | | | 2.14% | | | | $1,000.00 | | | | $1,337.58 | | | | $12.40 | |
| | Hypothetical (h) | | | 2.14% | | | | $1,000.00 | | | | $1,014.18 | | | | $10.69 | |
| (h) | 5% class return per year before expenses. |
| (p) | Expenses paid is equal to each class’ annualized expense ratio, as shown above, multiplied by the average account value over the period, multiplied by the number of days in the period, divided by the number of days in the year. Expenses paid do not include any applicable sales charges (loads). If these transaction costs had been included, your costs would have been higher. |
4
PORTFOLIO OF INVESTMENTS
2/28/11 (unaudited)
The Portfolio of Investments is a complete list of all securities owned by your fund. It is categorized by broad-based asset classes.
| | | | | | | | |
| Common Stocks - 97.8% | | | | | | | | |
| Issuer | | Shares/Par | | | Value ($) | |
| | | | | | | | |
| Aerospace - 1.5% | | | | | | | | |
| BE Aerospace, Inc. (a) | | | 39,720 | | | $ | 1,339,350 | |
| Goodrich Corp. | | | 126,710 | | | | 10,926,203 | |
| Moog, Inc., “A” (a) | | | 46,210 | | | | 2,098,396 | |
| | | | | | | | |
| | | | | | | $ | 14,363,949 | |
| Apparel Manufacturers - 0.7% | | | | | | | | |
| Li & Fung Ltd. | | | 190,000 | | | $ | 1,159,913 | |
| Phillips-Van Heusen Corp. | | | 93,240 | | | | 5,595,332 | |
| | | | | | | | |
| | | | | | | $ | 6,755,245 | |
| Automotive - 0.2% | | | | | | | | |
| BorgWarner Transmission Systems, Inc. (a) | | | 27,500 | | | $ | 2,134,275 | |
| | |
| Biotechnology - 2.3% | | | | | | | | |
| Alexion Pharmaceuticals, Inc. (a) | | | 158,690 | | | $ | 15,278,673 | |
| Gen-Probe, Inc. (a) | | | 94,920 | | | | 5,968,570 | |
| | | | | | | | |
| | | | | | | $ | 21,247,243 | |
| Broadcasting - 1.8% | | | | | | | | |
| Discovery Communications, Inc., “A” (a) | | | 194,180 | | | $ | 8,371,100 | |
| Interpublic Group of Cos., Inc. | | | 633,570 | | | | 8,363,124 | |
| | | | | | | | |
| | | | | | | $ | 16,734,224 | |
| Brokerage & Asset Managers - 3.4% | | | | | | | | |
| Affiliated Managers Group, Inc. (a) | | | 146,510 | | | $ | 15,639,943 | |
| Evercore Partners, Inc. | | | 59,900 | | | | 2,065,352 | |
| GFI Group, Inc. | | | 445,590 | | | | 2,227,950 | |
| IntercontinentalExchange, Inc. (a) | | | 45,360 | | | | 5,815,152 | |
| Lazard Ltd. | | | 135,390 | | | | 5,957,160 | |
| | | | | | | | |
| | | | | | | $ | 31,705,557 | |
| Business Services - 5.9% | | | | | | | | |
| Cognizant Technology Solutions Corp., “A” (a) | | | 132,490 | | | $ | 10,184,506 | |
| Concur Technologies, Inc. (a) | | | 167,930 | | | | 8,737,398 | |
| Constant Contact, Inc. (a) | | | 128,900 | | | | 3,729,077 | |
| CoStar Group, Inc. (a) | | | 41,490 | | | | 2,351,238 | |
| FleetCor Technologies, Inc. (a) | | | 115,410 | | | | 3,691,966 | |
| Gartner, Inc. (a) | | | 208,560 | | | | 7,866,883 | |
5
Portfolio of Investments (unaudited) – continued
| | | | | | | | |
| Issuer | | Shares/Par | | | Value ($) | |
| | | | | | | | |
| Common Stocks - continued | | | | | | | | |
| Business Services - continued | | | | | | | | |
| MSCI, Inc., “A” (a) | | | 193,080 | | | $ | 6,854,340 | |
| Ultimate Software Group, Inc. (a) | | | 15,790 | | | | 843,818 | |
| Verisk Analytics, Inc., “A” (a) | | | 336,130 | | | | 10,873,806 | |
| | | | | | | | |
| | | | | | | $ | 55,133,032 | |
| Chemicals - 1.4% | | | | | | | | |
| Celanese Corp. | | | 194,580 | | | $ | 8,065,341 | |
| Ecolab, Inc. | | | 107,760 | | | | 5,241,446 | |
| | | | | | | | |
| | | | | | | $ | 13,306,787 | |
| Computer Software - 7.5% | | | | | | | | |
| Ariba, Inc. (a) | | | 63,390 | | | $ | 1,961,921 | |
| Autodesk, Inc. (a) | | | 324,050 | | | | 13,626,303 | |
| Autonomy Corp. PLC (a) | | | 271,355 | | | | 7,247,737 | |
| Blackboard, Inc. (a)(l) | | | 115,060 | | | | 4,028,251 | |
| Check Point Software Technologies Ltd. (a) | | | 215,430 | | | | 10,737,031 | |
| Intuit, Inc. (a) | | | 142,220 | | | | 7,477,928 | |
| Parametric Technology Corp. (a) | | | 474,830 | | | | 11,253,471 | |
| SuccessFactors, Inc. (a) | | | 170,580 | | | | 6,125,528 | |
| VeriSign, Inc. | | | 220,880 | | | | 7,794,855 | |
| | | | | | | | |
| | | | | | | $ | 70,253,025 | |
| Computer Software - Systems - 2.7% | | | | | | | | |
| MICROS Systems, Inc. (a) | | | 219,360 | | | $ | 10,450,310 | |
| NICE Systems Ltd., ADR (a) | | | 128,700 | | | | 4,458,812 | |
| Verifone Systems, Inc. (a) | | | 239,520 | | | | 10,883,789 | |
| | | | | | | | |
| | | | | | | $ | 25,792,911 | |
| Construction - 3.2% | | | | | | | | |
| Beacon Roofing Supply, Inc. (a) | | | 126,920 | | | $ | 2,691,973 | |
| NVR, Inc. (a) | | | 7,980 | | | �� | 5,808,323 | |
| Owens Corning (a) | | | 201,160 | | | | 7,187,447 | |
| Sherwin-Williams Co. | | | 79,820 | | | | 6,554,818 | |
| Stanley Black & Decker, Inc. | | | 100,425 | | | | 7,615,228 | |
| | | | | | | | |
| | | | | | | $ | 29,857,789 | |
| Consumer Products - 0.4% | | | | | | | | |
| Avon Products, Inc. | | | 134,690 | | | $ | 3,745,729 | |
| | |
| Consumer Services - 2.1% | | | | | | | | |
| Anhanguera Educacional Participacoes S.A. | | | 297,500 | | | $ | 6,651,641 | |
| Monster Worldwide, Inc. (a) | | | 290,700 | | | | 4,985,505 | |
6
Portfolio of Investments (unaudited) – continued
| | | | | | | | |
| Issuer | | Shares/Par | | | Value ($) | |
| | | | | | | | |
| Common Stocks - continued | | | | | | | | |
| Consumer Services - continued | | | | | | | | |
| Sotheby’s | | | 172,980 | | | $ | 8,514,076 | |
| | | | | | | | |
| | | | | | | $ | 20,151,222 | |
| Containers - 1.3% | | | | | | | | |
| Ball Corp. | | | 260,180 | | | $ | 9,392,498 | |
| Graham Packaging Co., Inc. (a) | | | 192,370 | | | | 3,268,366 | |
| | | | | | | | |
| | | | | | | $ | 12,660,864 | |
| Electrical Equipment - 3.9% | | | | | | | | |
| AMETEK, Inc. | | | 386,605 | | | $ | 16,218,080 | |
| Danaher Corp. | | | 315,080 | | | | 15,943,048 | |
| Mettler-Toledo International, Inc. (a) | | | 24,850 | | | | 4,258,545 | |
| | | | | | | | |
| | | | | | | $ | 36,419,673 | |
| Electronics - 7.5% | | | | | | | | |
| Advanced Micro Devices, Inc. (a) | | | 455,654 | | | $ | 4,196,573 | |
| ARM Holdings PLC | | | 694,812 | | | | 6,969,145 | |
| First Solar, Inc. (a) | | | 14,250 | | | | 2,100,308 | |
| Hittite Microwave Corp. (a) | | | 79,574 | | | | 4,884,252 | |
| JDS Uniphase Corp. (a) | | | 174,900 | | | | 4,314,783 | |
| KLA-Tencor Corp. | | | 77,790 | | | | 3,797,708 | |
| Lam Research Corp. (a) | | | 99,450 | | | | 5,459,805 | |
| Linear Technology Corp. | | | 231,610 | | | | 8,004,442 | |
| Microchip Technology, Inc. | | | 200,150 | | | | 7,387,537 | |
| NetLogic Microsystems, Inc. (a) | | | 125,360 | | | | 5,188,650 | |
| PMC-Sierra, Inc. (a) | | | 686,720 | | | | 5,425,088 | |
| Teradyne, Inc. (a) | | | 493,770 | | | | 9,198,935 | |
| Varian Semiconductor Equipment Associates, Inc. (a) | | | 82,320 | | | | 3,927,487 | |
| | | | | | | | |
| | | | | | | $ | 70,854,713 | |
| Energy - Independent - 5.2% | | | | | | | | |
| Concho Resources, Inc. (a) | | | 79,620 | | | $ | 8,481,122 | |
| Denbury Resources, Inc. (a) | | | 73,400 | | | | 1,778,482 | |
| MEG Energy Corp. (a) | | | 97,909 | | | | 4,938,028 | |
| Newfield Exploration Co. (a) | | | 235,690 | | | | 17,155,875 | |
| QEP Resources, Inc. | | | 101,120 | | | | 3,999,296 | |
| Whiting Petroleum Corp. (a) | | | 195,420 | | | | 12,768,743 | |
| | | | | | | | |
| | | | | | | $ | 49,121,546 | |
| Engineering - Construction - 1.1% | | | | | | | | |
| Fluor Corp. | | | 151,920 | | | $ | 10,749,859 | |
7
Portfolio of Investments (unaudited) – continued
| | | | | | | | |
| Issuer | | Shares/Par | | | Value ($) | |
| | | | | | | | |
| Common Stocks - continued | | | | | | | | |
| Food & Beverages - 1.4% | | | | | | | | �� |
| Mead Johnson Nutrition Co., “A” | | | 216,100 | | | $ | 12,933,585 | |
| | |
| Food & Drug Stores - 0.3% | | | | | | | | |
| Whole Foods Market, Inc. | | | 52,910 | | | $ | 3,098,410 | |
| | |
| Gaming & Lodging - 2.3% | | | | | | | | |
| Las Vegas Sands Corp. (a) | | | 178,520 | | | $ | 8,326,173 | |
| Pinnacle Entertainment, Inc. (a) | | | 178,320 | | | | 2,341,342 | |
| Royal Caribbean Cruises Ltd. (a) | | | 257,898 | | | | 11,293,353 | |
| | | | | | | | |
| | | | | | | $ | 21,960,868 | |
| General Merchandise - 0.5% | | | | | | | | |
| Dollar General Corp. (a) | | | 154,350 | | | $ | 4,360,388 | |
| | |
| Insurance - 0.3% | | | | | | | | |
| Allied World Assurance Co. | | | 53,160 | | | $ | 3,280,504 | |
| | |
| Internet - 0.7% | | | | | | | | |
| OpenTable, Inc. (a) | | | 34,530 | | | $ | 3,068,681 | |
| Shutterfly, Inc. (a) | | | 73,030 | | | | 3,118,381 | |
| | | | | | | | |
| | | | | | | $ | 6,187,062 | |
| Leisure & Toys - 0.8% | | | | | | | | |
| Hasbro, Inc. | | | 161,340 | | | $ | 7,244,166 | |
| | |
| Machinery & Tools - 4.8% | | | | | | | | |
| Finning International, Inc. | | | 290,660 | | | $ | 8,272,090 | |
| Flowserve Corp. | | | 98,750 | | | | 12,340,788 | |
| Kennametal, Inc. | | | 134,120 | | | | 5,158,255 | |
| Polypore International, Inc. (a) | | | 118,640 | | | | 6,933,322 | |
| Regal Beloit Corp. | | | 61,340 | | | | 4,474,753 | |
| United Rentals, Inc. (a) | | | 70,690 | | | | 2,189,976 | |
| WABCO Holdings, Inc. (a) | | | 104,070 | | | | 6,080,810 | |
| | | | | | | | |
| | | | | | | $ | 45,449,994 | |
| Medical & Health Technology & Services - 4.7% | | | | | | | | |
| Cerner Corp. (a) | | | 78,670 | | | $ | 7,902,402 | |
| DaVita, Inc. (a) | | | 41,610 | | | | 3,302,586 | |
| Diagnosticos da America S.A. | | | 535,900 | | | | 6,474,089 | |
| IDEXX Laboratories, Inc. (a) | | | 101,150 | | | | 7,859,355 | |
| Medco Health Solutions, Inc. (a) | | | 71,480 | | | | 4,406,027 | |
| Patterson Cos., Inc. | | | 232,990 | | | | 7,777,206 | |
8
Portfolio of Investments (unaudited) – continued
| | | | | | | | |
| Issuer | | Shares/Par | | | Value ($) | |
| | | | | | | | |
| Common Stocks - continued | | | | | | | | |
| Medical & Health Technology & Services - continued | | | | | | | | |
| Stericycle, Inc. (a) | | | 75,240 | | | $ | 6,502,241 | |
| | | | | | | | |
| | | | | | | $ | 44,223,906 | |
| Medical Equipment - 1.0% | | | | | | | | |
| C.R. Bard, Inc. | | | 16,600 | | | $ | 1,622,816 | |
| Edwards Lifesciences Corp. (a) | | | 70,720 | | | | 6,014,029 | |
| Sonova Holding AG | | | 13,937 | | | | 1,854,067 | |
| | | | | | | | |
| | | | | | | $ | 9,490,912 | |
| Metals & Mining - 0.9% | | | | | | | | |
| Teck Resources Ltd., “B” | | | 157,730 | | | $ | 8,741,397 | |
| | |
| Network & Telecom - 4.0% | | | | | | | | |
| Acme Packet, Inc. (a) | | | 105,710 | | | $ | 7,953,620 | |
| Ciena Corp. (a) | | | 253,740 | | | | 6,995,612 | |
| F5 Networks, Inc. (a) | | | 67,320 | | | | 7,944,433 | |
| Finisar Corp. (a) | | | 59,700 | | | | 2,448,894 | |
| Fortinet, Inc. (a) | | | 138,570 | | | | 5,659,199 | |
| Polycom, Inc. (a) | | | 110,630 | | | | 5,288,114 | |
| Trimble Navigation Ltd. (a) | | | 33,080 | | | | 1,625,882 | |
| | | | | | | | |
| | | | | | | $ | 37,915,754 | |
| Oil Services - 4.5% | | | | | | | | |
| Cameron International Corp. (a) | | | 225,974 | | | $ | 13,361,843 | |
| Dresser-Rand Group, Inc. (a) | | | 331,560 | | | | 16,339,277 | |
| Lufkin Industries, Inc. | | | 30,950 | | | | 2,418,743 | |
| Weatherford International Ltd. (a) | | | 416,850 | | | | 10,079,433 | |
| | | | | | | | |
| | | | | | | $ | 42,199,296 | |
| Other Banks & Diversified Financials - 3.2% | | | | | | | | |
| Associated Banc-Corp. | | | 128,690 | | | $ | 1,862,144 | |
| BankUnited, Inc. (a) | | | 77,560 | | | | 2,198,826 | |
| Canadian Western Bank | | | 65,960 | | | | 2,099,206 | |
| Cathay General Bancorp, Inc. | | | 235,490 | | | | 4,172,883 | |
| MasterCard, Inc., “A” | | | 47,770 | | | | 11,491,551 | |
| TCF Financial Corp. | | | 193,830 | | | | 3,145,861 | |
| Zions Bancorporation | | | 214,840 | | | | 5,018,662 | |
| | | | | | | | |
| | | | | | | $ | 29,989,133 | |
| Pharmaceuticals - 0.8% | | | | | | | | |
| Genomma Lab Internacional S.A., “B” (a) | | | 2,252,400 | | | $ | 4,978,451 | |
| Hospira, Inc. (a) | | | 52,930 | | | | 2,797,351 | |
| | | | | | | | |
| | | | | | | $ | 7,775,802 | |
9
Portfolio of Investments (unaudited) – continued
| | | | | | | | |
| Issuer | | Shares/Par | | | Value ($) | |
| | | | | | | | |
| Common Stocks - continued | | | | | | | | |
| Pollution Control - 0.5% | | | | | | | | |
| Waste Connections, Inc. | | | 166,295 | | | $ | 4,820,892 | |
| | |
| Printing & Publishing - 1.7% | | | | | | | | |
| Lamar Advertising Co., “A” (a) | | | 228,510 | | | $ | 8,859,333 | |
| Moody’s Corp. | | | 238,260 | | | | 7,600,494 | |
| | | | | | | | |
| | | | | | | $ | 16,459,827 | |
| Railroad & Shipping - 0.8% | | | | | | | | |
| Kansas City Southern Co. (a) | | | 141,170 | | | $ | 7,600,593 | |
| | |
| Real Estate - 1.0% | | | | | | | | |
| Jones Lang LaSalle, Inc. | | | 99,210 | | | $ | 9,764,248 | |
| | |
| Restaurants - 0.9% | | | | | | | | |
| P.F. Chang’s China Bistro, Inc. | | | 182,350 | | | $ | 8,468,334 | |
| | |
| Specialty Chemicals - 0.5% | | | | | | | | |
| Airgas, Inc. | | | 69,930 | | | $ | 4,376,219 | |
| | |
| Specialty Stores - 5.0% | | | | | | | | |
| Abercrombie & Fitch Co., “A” | | | 169,050 | | | $ | 9,698,399 | |
| Dick’s Sporting Goods, Inc. (a) | | | 245,950 | | | | 9,134,583 | |
| Ross Stores, Inc. | | | 144,960 | | | | 10,442,918 | |
| Staples, Inc. | | | 76,310 | | | | 1,625,403 | |
| Tiffany & Co. | | | 100,470 | | | | 6,183,929 | |
| Tractor Supply Co. | | | 70,080 | | | | 3,649,066 | |
| Urban Outfitters, Inc. (a) | | | 163,070 | | | | 6,258,627 | |
| | | | | | | | |
| | | | | | | $ | 46,992,925 | |
| Telecommunications - Wireless - 0.7% | | | | | | | | |
| NII Holdings, Inc. (a) | | | 64,320 | | | $ | 2,634,547 | |
| SBA Communications Corp. (a) | | | 94,410 | | | | 3,973,717 | |
| | | | | | | | |
| | | | | | | $ | 6,608,264 | |
| Telephone Services - 1.8% | | | | | | | | |
| American Tower Corp., “A” (a) | | | 308,530 | | | $ | 16,648,279 | |
| | |
| Trucking - 2.2% | | | | | | | | |
| Atlas Air Worldwide Holdings, Inc. (a) | | | 34,670 | | | $ | 2,367,268 | |
| Expeditors International of Washington, Inc. | | | 173,220 | | | | 8,279,916 | |
| Landstar System, Inc. | | | 227,390 | | | | 10,112,033 | |
| | | | | | | | |
| | | | | | | $ | 20,759,217 | |
10
Portfolio of Investments (unaudited) – continued
| | | | | | | | |
| Issuer | | Shares/Par | | | Value ($) | |
| | | | | | | | |
| Common Stocks - continued | | | | | | | | |
| Utilities - Electric Power - 0.4% | | | | | | | | |
| CMS Energy Corp. | | | 181,330 | | | $ | 3,492,416 | |
| Total Common Stocks (Identified Cost, $690,791,316) | | | | | | $ | 921,830,034 | |
| | |
| Collateral for Securities Loaned - 0.3% | | | | | | | | |
| Goldman Sachs Repurchase Agreement, 0.2%, dated 2/28/11, due 3/01/11, total to be received $2,924,356 (secured by U.S. Treasury and Federal Agency obligations valued at $2,982,831 in an individually traded account), at Cost | | $ | 2,924,340 | | | $ | 2,924,340 | |
| | |
| Money Market Funds (v) - 1.9% | | | | | | | | |
MFS Institutional Money Market Portfolio, 0.2%,
at Cost and Net Asset Value | | | 17,883,881 | | | $ | 17,883,881 | |
| Total Investments (Identified Cost, $711,599,537) | | | | | | $ | 942,638,255 | |
| | |
| Other Assets, Less Liabilities - (0.0)% | | | | | | | (239,473 | ) |
| Net Assets - 100.0% | | | | | | $ | 942,398,782 | |
| (a) | Non-income producing security. |
| (l) | A portion of this security is on loan. |
| (v) | Underlying affiliated fund that is available only to investment companies managed by MFS. The rate quoted is the annualized seven-day yield of the fund at period end. |
The following abbreviations are used in this report and are defined:
| ADR | | American Depository Receipt |
| PLC | | Public Limited Company |
See Notes to Financial Statements
11
Financial Statements
STATEMENT OF ASSETS AND LIABILITIES
At 2/28/11 (unaudited)
This statement represents your fund’s balance sheet, which details the assets and liabilities comprising the total value of the fund.
| | | | |
| Assets | | | | |
Investments- | | | | |
Non-affiliated issuers, at value (identified cost, $693,715,656) | | | $924,754,374 | |
Underlying affiliated funds, at cost and value | | | 17,883,881 | |
Total investments, at value, including $2,904,430 of securities on loan
(identified cost, $711,599,537) | | | $942,638,255 | |
Receivables for | | | | |
Investments sold | | | 4,619,302 | |
Fund shares sold | | | 641,595 | |
Interest and dividends | | | 480,965 | |
Other assets | | | 7,630 | |
Total assets | | | $948,387,747 | |
| Liabilities | | | | |
Payables for | | | | |
Investments purchased | | | $1,328,424 | |
Fund shares reacquired | | | 1,249,378 | |
Collateral for securities loaned, at value | | | 2,924,340 | |
Payable to affiliates | | | | |
Investment adviser | | | 78,660 | |
Shareholder servicing costs | | | 300,420 | |
Distribution and service fees | | | 14,506 | |
Program manager fees | | | 18 | |
Payable for independent Trustees’ compensation | | | 45,791 | |
Accrued expenses and other liabilities | | | 47,428 | |
Total liabilities | | | $5,988,965 | |
Net assets | | | $942,398,782 | |
| Net assets consist of | | | | |
Paid-in capital | | | $1,998,161,417 | |
Unrealized appreciation (depreciation) on investments and translation of assets and liabilities in foreign currencies | | | 231,039,656 | |
Accumulated net realized gain (loss) on investments and foreign currency transactions | | | (1,286,115,760 | ) |
Accumulated net investment loss | | | (686,531 | ) |
Net assets | | | $942,398,782 | |
Shares of beneficial interest outstanding | | | 97,492,426 | |
See Notes to Financial Statements
12
Statement of Assets and Liabilities (unaudited) – continued
| | | | | | | | | | | | |
| | | Net assets | | | Shares
outstanding | | | Net asset value
per share (a) | |
Class A | | | $234,820,242 | | | | 24,530,287 | | | | $9.57 | |
Class B | | | 32,912,703 | | | | 3,768,404 | | | | 8.73 | |
Class C | | | 34,853,107 | | | | 4,082,281 | | | | 8.54 | |
Class I | | | 628,119,467 | | | | 63,836,237 | | | | 9.84 | |
Class R1 | | | 2,380,846 | | | | 273,507 | | | | 8.70 | |
Class R2 | | | 5,751,186 | | | | 617,722 | | | | 9.31 | |
Class R3 | | | 1,657,187 | | | | 173,961 | | | | 9.53 | |
Class R4 | | | 218,542 | | | | 22,616 | | | | 9.66 | |
Class 529A | | | 1,002,271 | | | | 106,992 | | | | 9.37 | |
Class 529B | | | 328,929 | | | | 38,264 | | | | 8.60 | |
Class 529C | | | 354,302 | | | | 42,155 | | | | 8.40 | |
| (a) | Maximum offering price per share was equal to the net asset value per share for all share classes, except for Classes A and 529A, for which the maximum offering prices per share were $10.15 [100 / 94.25 x $9.57] and $9.94 [100 / 94.25 x $9.37], respectively. On sales of $50,000 or more, the maximum offering prices of Class A and Class 529A shares are reduced. A contingent deferred sales charge may be imposed on redemptions of Class A, Class B, Class C, Class 529B, and Class 529C shares. Redemption price per share was equal to the net asset value per share for Classes I, R1, R2, R3, R4, and 529A. |
See Notes to Financial Statements
13
Financial Statements
STATEMENT OF OPERATIONS
Six months ended 2/28/11 (unaudited)
This statement describes how much your fund earned in investment income and accrued in expenses. It also describes any gains and/or losses generated by fund operations.
| | | | |
| Net investment loss | | | | |
Income | | | | |
Dividends | | | $4,387,169 | |
Interest | | | 13,348 | |
Dividends from underlying affiliated funds | | | 21,160 | |
Foreign taxes withheld | | | (13,060 | ) |
Total investment income | | | $4,408,617 | |
Expenses | | | | |
Management fee | | | $3,199,408 | |
Distribution and service fees | | | 605,107 | |
Program manager fees | | | 745 | |
Shareholder servicing costs | | | 960,426 | |
Administrative services fee | | | 60,656 | |
Independent Trustees’ compensation | | | 18,718 | |
Custodian fee | | | 70,800 | |
Shareholder communications | | | 34,186 | |
Auditing fees | | | 23,045 | |
Legal fees | | | 6,965 | |
Miscellaneous | | | 75,917 | |
Total expenses | | | $5,055,973 | |
Reduction of expenses by investment adviser | | | (1,310 | ) |
Net expenses | | | $5,054,663 | |
Net investment loss | | | $(646,046 | ) |
Realized and unrealized gain (loss) on investments
and foreign currency transactions | | | | |
Realized gain (loss) (identified cost basis) | | | | |
Investment transactions | | | $74,983,070 | |
Foreign currency transactions | | | (143,103 | ) |
Net realized gain (loss) on investments
and foreign currency transactions | | | $74,839,967 | |
Change in unrealized appreciation (depreciation) | | | | |
Investments | | | $171,270,632 | |
Translation of assets and liabilities in foreign currencies | | | 3,277 | |
Net unrealized gain (loss) on investments
and foreign currency translation | | | $171,273,909 | |
Net realized and unrealized gain (loss) on investments
and foreign currency | | | $246,113,876 | |
Change in net assets from operations | | | $245,467,830 | |
See Notes to Financial Statements
14
Financial Statements
STATEMENTS OF CHANGES IN NET ASSETS
These statements describe the increases and/or decreases in net assets resulting from operations, any distributions, and any shareholder transactions.
| | | | | | | | |
| Change in net assets | | Six months ended
2/28/11
(unaudited) | | | Year ended
8/31/10 | |
| From operations | | | | | | | | |
Net investment loss | | | $(646,046 | ) | | | $(3,789,384 | ) |
Net realized gain (loss) on investments and foreign
currency transactions | | | 74,839,967 | | | | 82,423,767 | |
Net unrealized gain (loss) on investments and foreign currency translation | | | 171,273,909 | | | | 11,805,026 | |
Change in net assets from operations | | | $245,467,830 | | | | $90,439,409 | |
Change in net assets from fund share transactions | | | $(21,950,505 | ) | | | $(67,463,876 | ) |
Total change in net assets | | | $223,517,325 | | | | $22,975,533 | |
| Net assets | | | | | | | | |
At beginning of period | | | 718,881,457 | | | | 695,905,924 | |
At end of period (including accumulated net investment
loss of $686,531 and $40,485, respectively) | | | $942,398,782 | | | | $718,881,457 | |
See Notes to Financial Statements
15
Financial Statements
FINANCIAL HIGHLIGHTS
The financial highlights table is intended to help you understand the fund’s financial performance for the semiannual period and the past 5 fiscal years . Certain information reflects financial results for a single fund share. The total returns in the table represent the rate by which an investor would have earned (or lost) on an investment in the fund share class (assuming reinvestment of all distributions) held for the entire period.
| | | | | | | | | | | | | | | | | | | | | | | | |
| | | Six months
ended
2/28/11 (unaudited) | | | Years ended 8/31 | |
| Class A | | | 2010 | | | 2009 | | | 2008 | | | 2007 | | | 2006 | |
| | | | | | | | | | | | | | | | | |
Net asset value, beginning of period | | | $7.12 | | | | $6.31 | | | | $9.21 | | | | $10.20 | | | | $8.59 | | | | $8.88 | |
Income (loss) from investment
operations | | | | | | | | | | | | | |
Net investment income (loss) (d) | | | $(0.01 | ) | | | $(0.04 | ) | | | $(0.02 | ) | | | $(0.04 | ) | | | $0.00 | (w) | | | $(0.07 | ) |
Net realized and unrealized gain
(loss) on investments and
foreign currency | | | 2.46 | | | | 0.85 | | | | (2.88 | ) | | | (0.95 | ) | | | 1.61 | | | | (0.22 | ) |
Total from investment operations | | | $2.45 | | | | $0.81 | | | | $(2.90 | ) | | | $(0.99 | ) | | | $1.61 | | | | $(0.29 | ) |
Net asset value, end of period | | | $9.57 | | | | $7.12 | | | | $6.31 | | | | $9.21 | | | | $10.20 | | | | $8.59 | |
Total return (%) (r)(s)(t) | | | 34.41 | (n) | | | 12.84 | | | | (31.49 | ) | | | (9.71 | ) | | | 18.74 | | | | (3.27 | ) |
Ratios (%) (to average net assets)
and Supplemental data: | | | | | | | | | | | | | |
Expenses before expense reductions (f) | | | 1.29 | (a) | | | 1.34 | | | | 1.42 | | | | 1.31 | | | | 1.24 | | | | 1.29 | |
Expenses after expense reductions (f) | | | 1.29 | (a) | | | 1.34 | | | | 1.42 | | | | 1.31 | | | | 1.24 | | | | 1.29 | |
Net investment income (loss) | | | (0.28 | )(a) | | | (0.60 | ) | | | (0.38 | ) | | | (0.39 | ) | | | 0.00 | (w) | | | (0.73 | ) |
Portfolio turnover | | | 46 | | | | 78 | | | | 141 | | | | 86 | | | | 91 | | | | 122 | |
Net assets at end of period
(000 omitted) | | | $234,820 | | | | $167,816 | | | | $155,565 | | | | $295,672 | | | | $386,013 | | | | $515,048 | |
See Notes to Financial Statements
16
Financial Highlights – continued
| | | | | | | | | | | | | | | | | | | | | | | | |
| | | Six months
ended
2/28/11 (unaudited) | | | Years ended 8/31 | |
| Class B | | | 2010 | | | 2009 | | | 2008 | | | 2007 | | | 2006 | |
| | | | | | | | | | | | | | | | | |
Net asset value, beginning of period | | | $6.52 | | | | $5.82 | | | | $8.56 | | | | $9.56 | | | | $8.10 | | | | $8.45 | |
Income (loss) from investment
operations | | | | | | | | | | | | | |
Net investment loss (d) | | | $(0.04 | ) | | | $(0.09 | ) | | | $(0.06 | ) | | | $(0.11 | ) | | | $(0.07 | ) | | | $(0.13 | ) |
Net realized and unrealized gain
(loss) on investments and
foreign currency | | | 2.25 | | | | 0.79 | | | | (2.68 | ) | | | (0.89 | ) | | | 1.53 | | | | (0.22 | ) |
Total from investment operations | | | $2.21 | | | | $0.70 | | | | $(2.74 | ) | | | $(1.00 | ) | | | $1.46 | | | | $(0.35 | ) |
Net asset value, end of period | | | $8.73 | | | | $6.52 | | | | $5.82 | | | | $8.56 | | | | $9.56 | | | | $8.10 | |
Total return (%) (r)(s)(t) | | | 33.90 | (n) | | | 12.03 | | | | (32.01 | ) | | | (10.46 | ) | | | 18.02 | | | | (4.14 | ) |
Ratios (%) (to average net assets)
and Supplemental data: | | | | | | | | | | | | | |
Expenses before expense reductions (f) | | | 2.04 | (a) | | | 2.09 | | | | 2.18 | | | | 2.06 | | | | 1.99 | | | | 2.04 | |
Expenses after expense reductions (f) | | | 2.04 | (a) | | | 2.09 | | | | 2.18 | | | | 2.06 | | | | 1.99 | | | | 2.04 | |
Net investment loss | | | (1.02 | )(a) | | | (1.37 | ) | | | (1.11 | ) | | | (1.14 | ) | | | (0.75 | ) | | | (1.48 | ) |
Portfolio turnover | | | 46 | | | | 78 | | | | 141 | | | | 86 | | | | 91 | | | | 122 | |
Net assets at end of period
(000 omitted) | | | $32,913 | | | | $29,392 | | | | $46,214 | | | | $124,124 | | | | $213,884 | | | | $271,832 | |
| | |
| | | Six months
ended
2/28/11 (unaudited) | | | Years ended 8/31 | |
| Class C | | | 2010 | | | 2009 | | | 2008 | | | 2007 | | | 2006 | |
| | | | | | | | | | | | | | | | | |
Net asset value, beginning of period | | | $6.38 | | | | $5.69 | | | | $8.36 | | | | $9.34 | | | | $7.92 | | | | $8.26 | |
Income (loss) from investment
operations | | | | | | | | | | | | | |
Net investment loss (d) | | | $(0.04 | ) | | | $(0.09 | ) | | | $(0.06 | ) | | | $(0.10 | ) | | | $(0.07 | ) | | | $(0.12 | ) |
Net realized and unrealized gain
(loss) on investments and
foreign currency | | | 2.20 | | | | 0.78 | | | | (2.61 | ) | | | (0.88 | ) | | | 1.49 | | | | (0.22 | ) |
Total from investment operations | | | $2.16 | | | | $0.69 | | | | $(2.67 | ) | | | $(0.98 | ) | | | $1.42 | | | | $(0.34 | ) |
Net asset value, end of period | | | $8.54 | | | | $6.38 | | | | $5.69 | | | | $8.36 | | | | $9.34 | | | | $7.92 | |
Total return (%) (r)(s)(t) | | | 33.86 | (n) | | | 12.13 | | | | (31.94 | ) | | | (10.49 | ) | | | 17.93 | | | | (4.12 | ) |
Ratios (%) (to average net assets)
and Supplemental data: | | | | | | | | | | | | | |
Expenses before expense reductions (f) | | | 2.04 | (a) | | | 2.09 | | | | 2.17 | | | | 2.06 | | | | 1.99 | | | | 2.04 | |
Expenses after expense reductions (f) | | | 2.04 | (a) | | | 2.09 | | | | 2.17 | | | | 2.06 | | | | 1.99 | | | | 2.04 | |
Net investment loss | | | (1.01 | )(a) | | | (1.35 | ) | | | (1.12 | ) | | | (1.14 | ) | | | (0.76 | ) | | | (1.48 | ) |
Portfolio turnover | | | 46 | | | | 78 | | | | 141 | | | | 86 | | | | 91 | | | | 122 | |
Net assets at end of period
(000 omitted) | | | $34,853 | | | | $26,724 | | | | $26,786 | | | | $47,725 | | | | $66,281 | | | | $80,563 | |
See Notes to Financial Statements
17
Financial Highlights – continued
| | | | | | | | | | | | | | | | | | | | | | | | |
| | | Six months
ended
2/28/11 (unaudited) | | | Years ended 8/31 | |
| Class I | | | 2010 | | | 2009 | | | 2008 | | | 2007 | | | 2006 | |
| | | | | | | | | | | | | | | | | |
Net asset value, beginning of period | | | $7.31 | | | | $6.46 | | | | $9.40 | | | | $10.40 | | | | $8.73 | | | | $9.01 | |
Income (loss) from investment
operations | | | | | | | | | | | | | |
Net investment income (loss) (d) | | | $(0.00 | )(w) | | | $(0.03 | ) | | | $(0.01 | ) | | | $(0.01 | ) | | | $0.02 | | | | $(0.04 | ) |
Net realized and unrealized gain
(loss) on investments and
foreign currency | | | 2.53 | | | | 0.88 | | | | (2.93 | ) | | | (0.99 | ) | | | 1.65 | | | | (0.24 | ) |
Total from investment operations | | | $2.53 | | | | $0.85 | | | | $(2.94 | ) | | | $(1.00 | ) | | | $1.67 | | | | $(0.28 | ) |
Net asset value, end of period | | | $9.84 | | | | $7.31 | | | | $6.46 | | | | $9.40 | | | | $10.40 | | | | $8.73 | |
Total return (%) (r)(s) | | | 34.61 | (n) | | | 13.16 | | | | (31.28 | ) | | | (9.62 | ) | | | 19.13 | | | | (3.11 | ) |
Ratios (%) (to average net assets)
and Supplemental data: | | | | | | | | | | | | | |
Expenses before expense reductions (f) | | | 1.04 | (a) | | | 1.09 | | | | 1.17 | | | | 1.06 | | | | 0.99 | | | | 1.04 | |
Expenses after expense reductions (f) | | | 1.04 | (a) | | | 1.09 | | | | 1.17 | | | | 1.06 | | | | 0.99 | | | | 1.04 | |
Net investment income (loss) | | | (0.00 | )(a)(w) | | | (0.35 | ) | | | (0.13 | ) | | | (0.13 | ) | | | 0.19 | | | | (0.46 | ) |
Portfolio turnover | | | 46 | | | | 78 | | | | 141 | | | | 86 | | | | 91 | | | | 122 | |
Net assets at end of period
(000 omitted) | | | $628,119 | | | | $486,162 | | | | $458,652 | | | | $546,398 | | | | $602,429 | | | | $485,841 | |
| | |
| | | Six months
ended
2/28/11 (unaudited) | | | Years ended 8/31 | |
| Class R1 | | | 2010 | | | 2009 | | | 2008 | | | 2007 | | | 2006 | |
| | | | | | | | | | | | | | | | | |
Net asset value, beginning of period | | | $6.50 | | | | $5.80 | | | | $8.53 | | | | $9.53 | | | | $8.09 | | | | $8.44 | |
Income (loss) from investment
operations | | | | | | | | | | | | | |
Net investment loss (d) | | | $(0.04 | ) | | | $(0.09 | ) | | | $(0.06 | ) | | | $(0.11 | ) | | | $(0.08 | ) | | | $(0.14 | ) |
Net realized and unrealized gain
(loss) on investments and
foreign currency | | | 2.24 | | | | 0.79 | | | | (2.67 | ) | | | (0.89 | ) | | | 1.52 | | | | (0.21 | ) |
Total from investment operations | | | $2.20 | | | | $0.70 | | | | $(2.73 | ) | | | $(1.00 | ) | | | $1.44 | | | | $(0.35 | ) |
Net asset value, end of period | | | $8.70 | | | | $6.50 | | | | $5.80 | | | | $8.53 | | | | $9.53 | | | | $8.09 | |
Total return (%) (r)(s) | | | 33.85 | (n) | | | 12.07 | | | | (32.00 | ) | | | (10.49 | ) | | | 17.80 | | | | (4.15 | ) |
Ratios (%) (to average net assets)
and Supplemental data: | | | | | | | | | | | | | |
Expenses before expense reductions (f) | | | 2.04 | (a) | | | 2.09 | | | | 2.17 | | | | 2.11 | | | | 2.13 | | | | 2.24 | |
Expenses after expense reductions (f) | | | 2.04 | (a) | | | 2.09 | | | | 2.17 | | | | 2.11 | | | | 2.08 | | | | 2.14 | |
Net investment loss | | | (1.01 | )(a) | | | (1.35 | ) | | | (1.13 | ) | | | (1.17 | ) | | | (0.94 | ) | | | (1.57 | ) |
Portfolio turnover | | | 46 | | | | 78 | | | | 141 | | | | 86 | | | | 91 | | | | 122 | |
Net assets at end of period
(000 omitted) | | | $2,381 | | | | $1,811 | | | | $1,844 | | | | $2,632 | | | | $1,366 | | | | $430 | |
See Notes to Financial Statements
18
Financial Highlights – continued
| | | | | | | | | | | | | | | | | | | | | | | | |
| | | Six months
ended
2/28/11 (unaudited) | | | Years ended 8/31 | |
| Class R2 | | | 2010 | | | 2009 | | | 2008 | | | 2007 | | | 2006 | |
| | | | | | | | | | | | | | | | | |
Net asset value, beginning of period | | | $6.94 | | | | $6.16 | | | | $9.01 | | | | $10.02 | | | | $8.46 | | | | $8.79 | |
Income (loss) from investment
operations | | | | | | | | | | | | | |
Net investment loss (d) | | | $(0.02 | ) | | | $(0.06 | ) | | | $(0.03 | ) | | | $(0.06 | ) | | | $(0.05 | ) | | | $(0.10 | ) |
Net realized and unrealized gain
(loss) on investments and
foreign currency | | | 2.39 | | | | 0.84 | | | | (2.82 | ) | | | (0.95 | ) | | | 1.61 | | | | (0.23 | ) |
Total from investment operations | | | $2.37 | | | | $0.78 | | | | $(2.85 | ) | | | $(1.01 | ) | | | $1.56 | | | | $(0.33 | ) |
Net asset value, end of period | | | $9.31 | | | | $6.94 | | | | $6.16 | | | | $9.01 | | | | $10.02 | | | | $8.46 | |
Total return (%) (r)(s) | | | 34.15 | (n) | | | 12.66 | | | | (31.63 | ) | | | (10.08 | ) | | | 18.44 | | | | (3.75 | ) |
Ratios (%) (to average net assets)
and Supplemental data: | | | | | | | | | | | | | |
Expenses before expense reductions (f) | | | 1.54 | (a) | | | 1.59 | | | | 1.67 | | | | 1.60 | | | | 1.69 | | | | 1.79 | |
Expenses after expense reductions (f) | | | 1.54 | (a) | | | 1.59 | | | | 1.67 | | | | 1.60 | | | | 1.63 | | | | 1.69 | |
Net investment loss | | | (0.51 | )(a) | | | (0.85 | ) | | | (0.61 | ) | | | (0.65 | ) | | | (0.47 | ) | | | (1.10 | ) |
Portfolio turnover | | | 46 | | | | 78 | | | | 141 | | | | 86 | | | | 91 | | | | 122 | |
Net assets at end of period
(000 omitted) | | | $5,751 | | | | $4,143 | | | | $4,233 | | | | $7,216 | | | | $3,594 | | | | $2,185 | |
| | |
| | | Six months
ended
2/28/11 (unaudited) | | | Years ended 8/31 | |
| Class R3 | | | 2010 | | | 2009 | | | 2008 | | | 2007 | | | 2006 | |
| | | | | | | | | | | | | | | | | |
Net asset value, beginning of period | | | $7.09 | | | | $6.28 | | | | $9.17 | | | | $10.17 | | | | $8.57 | | | | $8.87 | |
Income (loss) from investment
operations | | | | | | | | | | | | | |
Net investment loss (d) | | | $(0.01 | ) | | | $(0.04 | ) | | | $(0.02 | ) | | | $(0.04 | ) | | | $(0.02 | ) | | | $(0.07 | ) |
Net realized and unrealized gain
(loss) on investments and
foreign currency | | | 2.45 | | | | 0.85 | | | | (2.87 | ) | | | (0.96 | ) | | | 1.62 | | | | (0.23 | ) |
Total from investment operations | | | $2.44 | | | | $0.81 | | | | $(2.89 | ) | | | $(1.00 | ) | | | $1.60 | | | | $(0.30 | ) |
Net asset value, end of period | | | $9.53 | | | | $7.09 | | | | $6.28 | | | | $9.17 | | | | $10.17 | | | | $8.57 | |
Total return (%) (r)(s) | | | 34.41 | (n) | | | 12.90 | | | | (31.52 | ) | | | (9.83 | ) | | | 18.67 | | | | (3.38 | ) |
Ratios (%) (to average net assets)
and Supplemental data: | | | | | | | | | | | | | |
Expenses before expense reductions (f) | | | 1.29 | (a) | | | 1.34 | | | | 1.43 | | | | 1.36 | | | | 1.39 | | | | 1.43 | |
Expenses after expense reductions (f) | | | 1.29 | (a) | | | 1.34 | | | | 1.42 | | | | 1.36 | | | | 1.39 | | | | 1.43 | |
Net investment loss | | | (0.24 | )(a) | | | (0.61 | ) | | | (0.39 | ) | | | (0.44 | ) | | | (0.16 | ) | | | (0.79 | ) |
Portfolio turnover | | | 46 | | | | 78 | | | | 141 | | | | 86 | | | | 91 | | | | 122 | |
Net assets at end of period
(000 omitted) | | | $1,657 | | | | $1,478 | | | | $1,544 | | | | $2,732 | | | | $1,929 | | | | $1,899 | |
See Notes to Financial Statements
19
Financial Highlights – continued
| | | | | | | | | | | | | | | | | | | | | | | | |
| | | Six months
ended
2/28/11 (unaudited) | | | Years ended 8/31 | |
| Class R4 | | | 2010 | | | 2009 | | | 2008 | | | 2007 | | | 2006 | |
| | | | | | | | | | | | | | | | | |
Net asset value, beginning of period | | | $7.18 | | | | $6.34 | | | | $9.24 | | | | $10.24 | | | | $8.60 | | | | $8.88 | |
Income (loss) from investment
operations | | | | | | | | | | | | | |
Net investment income (loss) (d) | | | $(0.00 | )(w) | | | $(0.03 | ) | | | $(0.01 | ) | | | $(0.02 | ) | | | $0.02 | | | | $(0.05 | ) |
Net realized and unrealized gain
(loss) on investments and
foreign currency | | | 2.48 | | | | 0.87 | | | | (2.89 | ) | | | (0.98 | ) | | | 1.62 | | | | (0.23 | ) |
Total from investment operations | | | $2.48 | | | | $0.84 | | | | $(2.90 | ) | | | $(1.00 | ) | | | $1.64 | | | | $(0.28 | ) |
Net asset value, end of period | | | $9.66 | | | | $7.18 | | | | $6.34 | | | | $9.24 | | | | $10.24 | | | | $8.60 | |
Total return (%) (r)(s) | | | 34.54 | (n) | | | 13.25 | | | | (31.39 | ) | | | (9.77 | ) | | | 19.07 | | | | (3.15 | ) |
Ratios (%) (to average net assets)
and Supplemental data: | | | | | | | | | | | | | |
Expenses before expense reductions (f) | | | 1.04 | (a) | | | 1.09 | | | | 1.12 | | | | 1.10 | | | | 1.09 | | | | 1.14 | |
Expenses after expense reductions (f) | | | 1.04 | (a) | | | 1.09 | | | | 1.11 | | | | 1.10 | | | | 1.09 | | | | 1.14 | |
Net investment income (loss) | | | (0.01 | )(a) | | | (0.35 | ) | | | (0.07 | ) | | | (0.19 | ) | | | 0.16 | | | | (0.54 | ) |
Portfolio turnover | | | 46 | | | | 78 | | | | 141 | | | | 86 | | | | 91 | | | | 122 | |
Net assets at end of period
(000 omitted) | | | $219 | | | | $159 | | | | $136 | | | | $14,351 | | | | $30,102 | | | | $38,641 | |
| | |
| | | Six months
ended
2/28/11 (unaudited) | | | Years ended 8/31 | |
| Class 529A | | | 2010 | | | 2009 | | | 2008 | | | 2007 | | | 2006 | |
| | | | | | | | | | | | | | | | | |
Net asset value, beginning of period | | | $6.97 | | | | $6.18 | | | | $9.04 | | | | $10.05 | | | | $8.49 | | | | $8.81 | |
Income (loss) from investment
operations | | | | | | | | | | | | | |
Net investment loss (d) | | | $(0.01 | ) | | | $(0.05 | ) | | | $(0.03 | ) | | | $(0.06 | ) | | | $(0.04 | ) | | | $(0.10 | ) |
Net realized and unrealized gain
(loss) on investments and
foreign currency | | | 2.41 | | | | 0.84 | | | | (2.83 | ) | | | (0.95 | ) | | | 1.60 | | | | (0.22 | ) |
Total from investment operations | | | $2.40 | | | | $0.79 | | | | $(2.86 | ) | | | $(1.01 | ) | | | $1.56 | | | | $(0.32 | ) |
Net asset value, end of period | | | $9.37 | | | | $6.97 | | | | $6.18 | | | | $9.04 | | | | $10.05 | | | | $8.49 | |
Total return (%) (r)(s)(t) | | | 34.43 | (n) | | | 12.78 | | | | (31.64 | ) | | | (10.05 | ) | | | 18.37 | | | | (3.63 | ) |
Ratios (%) (to average net assets)
and Supplemental data: | | | | | | | | | | | | | |
Expenses before expense reductions (f) | | | 1.39 | (a) | | | 1.44 | | | | 1.57 | | | | 1.60 | | | | 1.59 | | | | 1.64 | |
Expenses after expense reductions (f) | | | 1.39 | (a) | | | 1.44 | | | | 1.56 | | | | 1.60 | | | | 1.59 | | | | 1.64 | |
Net investment loss | | | (0.35 | )(a) | | | (0.69 | ) | | | (0.52 | ) | | | (0.67 | ) | | | (0.40 | ) | | | (1.06 | ) |
Portfolio turnover | | | 46 | | | | 78 | | | | 141 | | | | 86 | | | | 91 | | | | 122 | |
Net assets at end of period
(000 omitted) | | | $1,002 | | | | $685 | | | | $507 | | | | $665 | | | | $771 | | | | $667 | |
See Notes to Financial Statements
20
Financial Highlights – continued
| | | | | | | | | | | | | | | | | | | | | | | | |
| | | Six months
ended
2/28/11 (unaudited) | | | Years ended 8/31 | |
| Class 529B | | | 2010 | | | 2009 | | | 2008 | | | 2007 | | | 2006 | |
| | | | | | | | | | | | | | | | | |
Net asset value, beginning of period | | | $6.42 | | | | $5.73 | | | | $8.45 | | | | $9.45 | | | | $8.03 | | | | $8.39 | |
Income (loss) from investment
operations | | | | | | | | | | | | | |
Net investment loss (d) | | | $(0.04 | ) | | | $(0.09 | ) | | | $(0.07 | ) | | | $(0.12 | ) | | | $(0.09 | ) | | | $(0.15 | ) |
Net realized and unrealized gain
(loss) on investments and
foreign currency | | | 2.22 | | | | 0.78 | | | | (2.65 | ) | | | (0.88 | ) | | | 1.51 | | | | (0.21 | ) |
Total from investment operations | | | $2.18 | | | | $0.69 | | | | $(2.72 | ) | | | $(1.00 | ) | | | $1.42 | | | | $(0.36 | ) |
Net asset value, end of period | | | $8.60 | | | | $6.42 | | | | $5.73 | | | | $8.45 | | | | $9.45 | | | | $8.03 | |
Total return (%) (r)(s)(t) | | | 33.96 | (n) | | | 12.04 | | | | (32.19 | ) | | | (10.58 | ) | | | 17.68 | | | | (4.29 | ) |
Ratios (%) (to average net assets)
and Supplemental data: | | | | | | | | | | | | | |
Expenses before expense reductions (f) | | | 2.14 | (a) | | | 2.19 | | | | 2.25 | | | | 2.25 | | | | 2.23 | | | | 2.29 | |
Expenses after expense reductions (f) | | | 2.14 | (a) | | | 2.19 | | | | 2.25 | | | | 2.25 | | | | 2.23 | | | | 2.28 | |
Net investment loss | | | (1.11 | )(a) | | | (1.44 | ) | | | (1.27 | ) | | | (1.32 | ) | | | (1.03 | ) | | | (1.71 | ) |
Portfolio turnover | | | 46 | | | | 78 | | | | 141 | | | | 86 | | | | 91 | | | | 122 | |
Net assets at end of period
(000 omitted) | | | $329 | | | | $271 | | | | $219 | | | | $170 | | | | $199 | | | | $185 | |
| | |
| | | Six months
ended
2/28/11 (unaudited) | | | Years ended 8/31 | |
| Class 529C | | | 2010 | | | 2009 | | | 2008 | | | 2007 | | | 2006 | |
| | | | | | | | | | | | | | | | | |
Net asset value, beginning of period | | | $6.28 | | | | $5.61 | | | | $8.26 | | | | $9.24 | | | | $7.85 | | | | $8.21 | |
Income (loss) from investment
operations | | | | | | | | | | | | | |
Net investment loss (d) | | | $(0.04 | ) | | | $(0.09 | ) | | | $(0.06 | ) | | | $(0.12 | ) | | | $(0.08 | ) | | | $(0.14 | ) |
Net realized and unrealized gain
(loss) on investments and
foreign currency | | | 2.16 | | | | 0.76 | | | | (2.59 | ) | | | (0.86 | ) | | | 1.47 | | | | (0.22 | ) |
Total from investment operations | | | $2.12 | | | | $0.67 | | | | $(2.65 | ) | | | $(0.98 | ) | | | $1.39 | | | | $(0.36 | ) |
Net asset value, end of period | | | $8.40 | | | | $6.28 | | | | $5.61 | | | | $8.26 | | | | $9.24 | | | | $7.85 | |
Total return (%) (r)(s)(t) | | | 33.76 | (n) | | | 11.94 | | | | (32.08 | ) | | | (10.61 | ) | | | 17.71 | | | | (4.38 | ) |
Ratios (%) (to average net assets)
and Supplemental data: | | | | | | | | | | | | | |
Expenses before expense reductions (f) | | | 2.14 | (a) | | | 2.19 | | | | 2.27 | | | | 2.25 | | | | 2.24 | | | | 2.29 | |
Expenses after expense reductions (f) | | | 2.14 | (a) | | | 2.19 | | | | 2.27 | | | | 2.25 | | | | 2.24 | | | | 2.29 | |
Net investment loss | | | (1.12 | )(a) | | | (1.45 | ) | | | (1.24 | ) | | | (1.32 | ) | | | (0.94 | ) | | | (1.71 | ) |
Portfolio turnover | | | 46 | | | | 78 | | | | 141 | | | | 86 | | | | 91 | | | | 122 | |
Net assets at end of period
(000 omitted) | | | $354 | | | | $239 | | | | $205 | | | | $281 | | | | $257 | | | | $350 | |
See Notes to Financial Statements
21
Financial Highlights – continued
| (d) | Per share data is based on average shares outstanding. |
| (f) | Ratios do not reflect reductions from fees paid indirectly, if applicable. |
| (r) | Certain expenses have been reduced without which performance would have been lower. |
| (s) | From time to time the fund may receive proceeds from litigation settlements, without which performance would be lower. |
| (t) | Total returns do not include any applicable sales charges. |
| (w) | Per share amount was less than $0.01 and 0.01%, respectively. |
See Notes to Financial Statements
22
NOTES TO FINANCIAL STATEMENTS
(unaudited)
| (1) | | Business and Organization |
MFS Mid Cap Growth Fund (the fund) is a series of MFS Series Trust IV (the trust). The trust is organized as a Massachusetts business trust and is registered under the Investment Company Act of 1940, as amended, as an open-end management investment company.
| (2) | | Significant Accounting Policies |
General – The preparation of financial statements in conformity with U.S. generally accepted accounting principles requires management to make estimates and assumptions that affect the reported amounts of assets and liabilities, and disclosure of contingent assets and liabilities at the date of the financial statements and the reported amounts of revenues and expenses during the reporting period. Actual results could differ from those estimates. In the preparation of these financial statements, management has evaluated subsequent events occurring after the date of the fund’s Statement of Assets and Liabilities through the date that the financial statements were issued. The fund invests in foreign securities. Investments in foreign securities are vulnerable to the effects of changes in the relative values of the local currency and the U.S. dollar and to the effects of changes in each country’s legal, political, and economic environment.
Investment Valuations – Equity securities, including restricted equity securities, are generally valued at the last sale or official closing price as provided by a third-party pricing service on the market or exchange on which they are primarily traded. Equity securities, for which there were no sales reported that day, are generally valued at the last quoted daily bid quotation as provided by a third-party pricing service on the market or exchange on which such securities are primarily traded. Equity securities held short, for which there were no sales reported for that day, are generally valued at the last quoted daily ask quotation as provided by a third-party pricing service on the market or exchange on which such securities are primarily traded. Short-term instruments with a maturity at issuance of 60 days or less generally are valued at amortized cost, which approximates market value. Open-end investment companies are generally valued at net asset value per share. Securities and other assets generally valued on the basis of information from a third-party pricing service may also be valued at a broker/dealer bid quotation. Values obtained from third-party pricing services can utilize both transaction data and market information such as yield, quality, coupon rate, maturity, type of issue, trading characteristics, and other market data. The values of foreign securities and other assets and liabilities expressed in foreign currencies are converted to U.S. dollars using the mean of bid and asked prices for rates provided by a third-party pricing service.
23
Notes to Financial Statements (unaudited) – continued
The Board of Trustees has delegated primary responsibility for determining or causing to be determined the value of the fund’s investments (including any fair valuation) to the adviser pursuant to valuation policies and procedures approved by the Board. If the adviser determines that reliable market quotations are not readily available, investments are valued at fair value as determined in good faith by the adviser in accordance with such procedures under the oversight of the Board of Trustees. Under the fund’s valuation policies and procedures, market quotations are not considered to be readily available for most types of debt instruments and floating rate loans and many types of derivatives. These investments are generally valued at fair value based on information from third-party pricing services. In addition, investments may be valued at fair value if the adviser determines that an investment’s value has been materially effected by events occurring after the close of the exchange or market on which the investment is principally traded (such as foreign exchange or market) and prior to the determination of the fund’s net asset value, or after the halting of trading of a specific security where trading does not resume prior to the close of the exchange or market on which the security is principally traded. Events that occur on a frequent basis after foreign markets close (such as developments in foreign markets and significant movements in the U.S. markets) and prior to the determination of the fund’s net asset value may be deemed to have a material effect on the value of securities traded in foreign markets. Accordingly, the fund’s foreign equity securities may often be valued at fair value. The adviser generally relies on third-party pricing services or other information (such as the correlation with price movements of similar securities in the same or other markets; the type, cost and investment characteristics of the security; the business and financial condition of the issuer; and trading and other market data) to assist in determining whether to fair value and at what value to fair value an investment. The value of an investment for purposes of calculating the fund’s net asset value can differ depending on the source and method used to determine value. When fair valuation is used, the value of an investment used to determine the fund’s net asset value may differ from quoted or published prices for the same investment. There can be no assurance that the fund could obtain the fair value assigned to an investment if it were to sell the investment at the same time at which the fund determines its net asset value per share.
Various inputs are used in determining the value of the fund’s assets or liabilities. These inputs are categorized into three broad levels. In certain cases, the inputs used to measure fair value may fall into different levels of the fair value hierarchy. In such cases, an investment’s level within the fair value hierarchy is based on the lowest level of input that is significant to the fair value measurement. The fund’s assessment of the significance of a particular input to the fair value measurement in its entirety requires judgment, and
24
Notes to Financial Statements (unaudited) – continued
considers factors specific to the investment. Level 1 includes unadjusted quoted prices in active markets for identical assets or liabilities. Level 2 includes other significant observable market-based inputs (including quoted prices for similar securities, interest rates, prepayment speed, and credit risk). Level 3 includes unobservable inputs, which may include the adviser’s own assumptions in determining the fair value of investments. The following is a summary of the levels used as of February 28, 2011 in valuing the fund’s assets or liabilities:
| | | | | | | | | | | | | | | | |
| Investments at Value | | Level 1 | | | Level 2 | | | Level 3 | | | Total | |
| Equity Securities: | | | | | | | | | | | | | | | | |
United States | | | $841,291,267 | | | | $— | | | | $— | | | | $841,291,267 | |
Canada | | | 24,050,720 | | | | — | | | | — | | | | 24,050,720 | |
Israel | | | 15,195,843 | | | | — | | | | — | | | | 15,195,843 | |
United Kingdom | | | 14,216,883 | | | | — | | | | — | | | | 14,216,883 | |
Brazil | | | 13,125,730 | | | | — | | | | — | | | | 13,125,730 | |
Bermuda | | | 5,957,160 | | | | — | | | | — | | | | 5,957,160 | |
Mexico | | | 4,978,451 | | | | — | | | | — | | | | 4,978,451 | |
Switzerland | | | 1,854,067 | | | | — | | | | — | | | | 1,854,067 | |
Hong Kong | | | — | | | | 1,159,913 | | | | | | | | 1,159,913 | |
| Short Term Securities | | | — | | | | 2,924,340 | | | | — | | | | 2,924,340 | |
| Mutual Funds | | | 17,883,881 | | | | — | | | | — | | | | 17,883,881 | |
| Total Investments | | | $938,554,002 | | | | $4,084,253 | | | | $— | | | | $942,638,255 | |
For further information regarding security characteristics, see the Portfolio of Investments.
Repurchase Agreements – The fund entered into repurchase agreements with approved counterparties. Each repurchase agreement is recorded at cost. The fund requires that the securities collateral in a repurchase transaction be transferred to a custodian. The fund monitors, on a daily basis, the value of the collateral to ensure that its value, including accrued interest, is greater than amounts owed to the fund under each such repurchase agreement.
Foreign Currency Translation – Purchases and sales of foreign investments, income, and expenses are converted into U.S. dollars based upon currency exchange rates prevailing on the respective dates of such transactions or on the reporting date for foreign denominated receivables and payables. Gains and losses attributable to foreign currency exchange rates on sales of securities are recorded for financial statement purposes as net realized gains and losses on investments. Gains and losses attributable to foreign exchange rate movements on receivables, payables, income and expenses are recorded for financial statement purposes as foreign currency transaction gains and losses. That portion of both realized and unrealized gains and losses on investments that results from fluctuations in foreign currency exchange rates is not separately disclosed.
25
Notes to Financial Statements (unaudited) – continued
Security Loans – JPMorgan Chase and Co. (“Chase”), as lending agent, loans the securities of the fund to certain qualified institutions (the “Borrowers”) approved by the fund. The loans are collateralized by cash and/or U.S. Treasury and federal agency obligations in an amount typically at least equal to the market value of the securities loaned. The market value of the loaned securities is determined at the close of business of the fund and any additional required collateral is delivered to the fund on the next business day. Chase provides the fund with indemnification against Borrower default. The fund bears the risk of loss with respect to the investment of cash collateral. On loans collateralized by cash, the cash collateral is invested in short-term securities. A portion of the income generated upon investment of the collateral is remitted to the Borrowers, and the remainder is allocated between the fund and the lending agent. On loans collateralized by U.S. Treasury and/or federal agency obligations, a fee is received from the Borrower, and is allocated between the fund and the lending agent. Income from securities lending is included in interest income on the Statement of Operations. The dividend and interest income earned on the securities loaned is accounted for in the same manner as other dividend and interest income.
Indemnifications – Under the fund’s organizational documents, its officers and Trustees may be indemnified against certain liabilities and expenses arising out of the performance of their duties to the fund. Additionally, in the normal course of business, the fund enters into agreements with service providers that may contain indemnification clauses. The fund’s maximum exposure under these agreements is unknown as this would involve future claims that may be made against the fund that have not yet occurred.
Investment Transactions and Income – Investment transactions are recorded on the trade date. Interest income is recorded on the accrual basis. Dividends received in cash are recorded on the ex-dividend date. Certain dividends from foreign securities will be recorded when the fund is informed of the dividend if such information is obtained subsequent to the ex-dividend date. Dividend and interest payments received in additional securities are recorded on the ex-dividend or ex-interest date in an amount equal to the value of the security on such date.
The fund may receive proceeds from litigation settlements. Any proceeds received from litigation involving portfolio holdings are reflected in the Statement of Operations in realized gain/loss if the security has been disposed of by the fund or in unrealized gain/loss if the security is still held by the fund. Any other proceeds from litigation not related to portfolio holdings are reflected as other income in the Statement of Operations.
26
Notes to Financial Statements (unaudited) – continued
Fees Paid Indirectly – The fund’s custody fee may be reduced according to an arrangement that measures the value of cash deposited with the custodian by the fund. For the six months ended February 28, 2011, custody fees were not reduced.
Tax Matters and Distributions – The fund intends to qualify as a regulated investment company, as defined under Subchapter M of the Internal Revenue Code, and to distribute all of its taxable income, including realized capital gains. As a result, no provision for federal income tax is required. The fund’s federal tax returns for the prior three fiscal years remain subject to examination by the Internal Revenue Service. Foreign taxes, if any, have been accrued by the fund in the accompanying financial statements.
Distributions to shareholders are recorded on the ex-dividend date. Income and capital gain distributions are determined in accordance with income tax regulations, which may differ from U.S. generally accepted accounting principles. Certain capital accounts in the financial statements are periodically adjusted for permanent differences in order to reflect their tax character. These adjustments have no impact on net assets or net asset value per share. Temporary differences which arise from recognizing certain items of income, expense, gain or loss in different periods for financial statement and tax purposes will reverse at some time in the future. Distributions in excess of net investment income or net realized gains are temporary overdistributions for financial statement purposes resulting from differences in the recognition or classification of income or distributions for financial statement and tax purposes.
Book/tax differences primarily relate to net operating losses.
The fund declared no distributions for the current period or for the year ended August 31, 2010.
The federal tax cost and the tax basis components of distributable earnings were as follows:
| | | | |
| As of 2/28/11 | | | |
| Cost of investments | | | $711,695,592 | |
| Gross appreciation | | | 233,883,619 | |
| Gross depreciation | | | (2,940,956 | ) |
| Net unrealized appreciation (depreciation) | | | $230,942,663 | |
| |
| As of 8/31/10 | | | |
| Capital loss carryforwards | | | (1,360,859,672 | ) |
| Other temporary differences | | | (42,824 | ) |
| Net unrealized appreciation (depreciation) | | | 59,672,031 | |
The aggregate cost above includes prior fiscal year end tax adjustments, if applicable.
27
Notes to Financial Statements (unaudited) – continued
As of August 31, 2010, the fund had capital loss carryforwards available to offset future realized gains. Such losses expire as follows:
| | | | |
| 8/31/11 | | | $(1,032,909,538 | ) |
| 8/31/17 | | | (87,885,883 | ) |
| 8/31/18 | | | (240,064,251 | ) |
| | | $(1,360,859,672 | ) |
Multiple Classes of Shares of Beneficial Interest – The fund offers multiple classes of shares, which differ in their respective distribution, service, and program manager fees. The fund’s income, realized and unrealized gain (loss), and common expenses are allocated to shareholders based on the daily net assets of each class. Dividends are declared separately for each class. Differences in per share dividend rates are generally due to differences in separate class expenses. Class B and Class 529B shares will convert to Class A and Class 529A shares, respectively, approximately eight years after purchase.
| (3) | | Transactions with Affiliates |
Investment Adviser – The fund has an investment advisory agreement with MFS to provide overall investment management and related administrative services and facilities to the fund. The management fee is computed daily and paid monthly at the following annual rates:
| | | | |
| First $3 billion of average daily net assets | | | 0.75 | % |
| Average daily net assets in excess of $3 billion | | | 0.70 | % |
Effective January 1, 2011, the investment adviser has agreed in writing to reduce its management fee to 0.70% of average daily net assets in excess of $1 billion. This written agreement will continue until modified by the fund’s Board of Trustees, but such agreement will continue at least until December 31, 2011. For the six months ended February 28, 2011, the fund’s average daily net assets did not exceed $1 billion and therefore, the management fee was not reduced. The management fee incurred for the six months ended February 28, 2011 was equivalent to an annual effective rate of 0.75% of the fund’s average daily net assets.
Distributor – MFS Fund Distributors, Inc. (MFD), a wholly-owned subsidiary of MFS, as distributor, received $12,793 and $695 for the six months ended February 28, 2011, as its portion of the initial sales charge on sales of Class A and Class 529A shares of the fund, respectively.
The Board of Trustees has adopted a distribution plan for certain class shares pursuant to Rule 12b-1 of the Investment Company Act of 1940.
The fund’s distribution plan provides that the fund will pay MFD for services provided by MFD and financial intermediaries in connection with the distribution and servicing of certain share classes. One component of the plan is a distribution fee paid to MFD and another component of the plan is a
28
Notes to Financial Statements (unaudited) – continued
service fee paid to MFD. MFD may subsequently pay all, or a portion, of the distribution and/or service fees to financial intermediaries.
Distribution Plan Fee Table:
| | | | | | | | | | | | | | | | | | | | |
| | | Distribution
Fee Rate (d) | | | Service
Fee Rate (d) | | | Total
Distribution
Plan (d) | | | Annual
Effective
Rate (e) | | | Distribution
and Service
Fee | |
| Class A | | | — | | | | 0.25% | | | | 0.25% | | | | 0.25% | | | | $254,423 | |
| Class B | | | 0.75% | | | | 0.25% | | | | 1.00% | | | | 1.00% | | | | 162,294 | |
| Class C | | | 0.75% | | | | 0.25% | | | | 1.00% | | | | 1.00% | | | | 158,564 | |
| Class R1 | | | 0.75% | | | | 0.25% | | | | 1.00% | | | | 1.00% | | | | 10,749 | |
| Class R2 | | | 0.25% | | | | 0.25% | | | | 0.50% | | | | 0.50% | | | | 12,866 | |
| Class R3 | | | — | | | | 0.25% | | | | 0.25% | | | | 0.25% | | | | 2,024 | |
| Class 529A | | | — | | | | 0.25% | | | | 0.25% | | | | 0.25% | | | | 1,086 | |
| Class 529B | | | 0.75% | | | | 0.25% | | | | 1.00% | | | | 1.00% | | | | 1,592 | |
| Class 529C | | | 0.75% | | | | 0.25% | | | | 1.00% | | | | 1.00% | | | | 1,509 | |
| Total Distribution and Service Fees | | | | $605,107 | |
| (d) | In accordance with the distribution plan for certain classes, the fund pays distribution and/or service fees equal to these annual percentage rates of each class’ average daily net assets. The distribution and service fee rates disclosed by class represent the current rates in effect at the end of the reporting period. Any rate changes, if applicable, are detailed below. |
| (e) | The annual effective rates represent actual fees incurred under the distribution plan for the six months ended February 28, 2011 based on each class’ average daily net assets. |
Certain Class A shares are subject to a contingent deferred sales charge (CDSC) in the event of a shareholder redemption within 24 months of purchase. Class C and Class 529C shares are subject to a CDSC in the event of a shareholder redemption within 12 months of purchase. Class B and Class 529B shares are subject to a CDSC in the event of a shareholder redemption within six years of purchase. All contingent deferred sales charges are paid to MFD and during the six months ended February 28, 2011, were as follows:
| | | | |
| Class A | | | $6 | |
| Class B | | | 18,371 | |
| Class C | | | 555 | |
| Class 529B | | | 458 | |
| Class 529C | | | — | |
The fund has entered into and may from time to time enter into contracts with program managers and other parties which administer the tuition programs through which an investment in the fund’s 529 share classes is made. The fund has entered into an agreement with MFD pursuant to which MFD receives an annual fee of up to 0.10% of the average daily net assets attributable to each 529 share class. The services provided by MFD, or a third party with which MFD contracts, include recordkeeping and tax reporting and account services, as well as services designed to maintain the program’s compliance with the
29
Notes to Financial Statements (unaudited) – continued
Internal Revenue Code and other regulatory requirements. Program manager fees for the six months ended February 28, 2011, were as follows:
| | | | |
| | | Amount | |
| Class 529A | | | $435 | |
| Class 529B | | | 159 | |
| Class 529C | | | 151 | |
| Total Program Manager Fees | | | $745 | |
Shareholder Servicing Agent – MFS Service Center, Inc. (MFSC), a wholly-owned subsidiary of MFS, receives a fee from the fund for its services as shareholder servicing agent calculated as a percentage of the average daily net assets of the fund as determined periodically under the supervision of the fund’s Board of Trustees. For the six months ended February 28, 2011, the fee was $287,556, which equated to 0.0673% annually of the fund’s average daily net assets. MFSC also receives payment from the fund for out-of-pocket expenses, sub-accounting and other shareholder servicing costs which may be paid to affiliated and unaffiliated service providers. For the six months ended February 28, 2011, these out-of-pocket expenses, sub-accounting and other shareholder servicing costs amounted to $305,427.
Under a Special Servicing Agreement among MFS, each MFS fund which invests in other MFS funds (“MFS fund-of-funds”) and certain underlying funds in which a MFS fund-of-funds invests (“underlying funds”), each underlying fund may pay a portion of each MFS fund-of-fund’s transfer agent-related expenses, including sub-accounting fees payable to financial intermediaries, to the extent such payments do not exceed the benefits realized or expected to be realized by the underlying fund from the investment in the underlying fund by the MFS fund-of-fund. For the six months ended February 28, 2011, these costs for the fund amounted to $367,443 and are reflected in the shareholder servicing costs on the Statement of Operations.
Administrator – MFS provides certain financial, legal, shareholder communications, compliance, and other administrative services to the fund. Under an administrative services agreement, the fund partially reimburses MFS the costs incurred to provide these services. The fund is charged an annual fixed amount of $17,500 plus a fee based on average daily net assets. The administrative services fee incurred for the six months ended February 28, 2011 was equivalent to an annual effective rate of 0.0142% of the fund’s average daily net assets.
Trustees’ and Officers’ Compensation – The fund pays compensation to independent Trustees in the form of a retainer, attendance fees, and additional compensation to Board and Committee chairpersons. The fund does not pay compensation directly to Trustees or officers of the fund who are also officers of the investment adviser, all of whom receive remuneration for their services
30
Notes to Financial Statements (unaudited) – continued
to the fund from MFS. Certain officers and Trustees of the fund are officers or directors of MFS, MFD, and MFSC.
Prior to December 31, 2001, the fund had an unfunded defined benefit plan (“DB plan”) for independent Trustees. As of December 31, 2001, the Board took action to terminate the DB plan with respect to then-current and any future independent Trustees, such that the DB Plan covers only certain of those former independent Trustees who retired on or before December 31, 2001. Effective January 1, 2002, accrued benefits under the DB Plan for then-current independent Trustees who continued were credited to an unfunded retirement deferral plan (the “Retirement Deferral plan”), which was established for and exists solely with respect to these credited amounts, and is not available for other deferrals by these or other independent Trustees. Although the Retirement Deferral plan is unfunded, amounts deferred under the plan are periodically adjusted for investment experience as if they had been invested in shares of the fund. The DB Plan resulted in a pension expense of $738 and the Retirement Deferral plan resulted in an expense of $7,191. Both amounts are included in independent Trustees’ compensation for the six months ended February 28, 2011. The liability for deferred retirement benefits payable to certain independent Trustees under both plans amounted to $43,134 at February 28, 2011, and is included in payable for independent Trustees’ compensation on the Statement of Assets and Liabilities.
Other – This fund and certain other funds managed by MFS (the funds) have entered into services agreements (the Agreements) which provide for payment of fees by the funds to Tarantino LLC and Griffin Compliance LLC in return for the provision of services of an Independent Chief Compliance Officer (ICCO) and Assistant ICCO, respectively, for the funds. The ICCO and Assistant ICCO are officers of the funds and the sole members of Tarantino LLC and Griffin Compliance LLC, respectively. The funds can terminate the Agreements with Tarantino LLC and Griffin Compliance LLC at any time under the terms of the Agreements. For the six months ended February 28, 2011, the aggregate fees paid by the fund to Tarantino LLC and Griffin Compliance LLC were $4,674 and are included in miscellaneous expense on the Statement of Operations. MFS has agreed to reimburse the fund for a portion of the payments made by the fund in the amount of $1,310, which is shown as a reduction of total expenses in the Statement of Operations. Additionally, MFS has agreed to bear all expenses associated with office space, other administrative support, and supplies provided to the ICCO and Assistant ICCO.
The fund invests in the MFS Institutional Money Market Portfolio which is managed by MFS and seeks a high level of current income consistent with preservation of capital and liquidity. Income earned on this investment is included in dividends from underlying affiliated funds on the Statement of Operations. This money market fund does not pay a management fee to MFS.
31
Notes to Financial Statements (unaudited) – continued
Purchases and sales of investments, other than U.S. Government securities, purchased option transactions, and short-term obligations, aggregated $381,286,497 and $396,069,270, respectively.
| (5) | | Shares of Beneficial Interest |
The fund’s Declaration of Trust permits the Trustees to issue an unlimited number of full and fractional shares of beneficial interest. Transactions in fund shares were as follows:
| | | | | | | | | | | | | | | | |
| | | Six months ended
2/28/11 | | | Year ended
8/31/10 | |
| | | Shares | | | Amount | | | Shares | | | Amount | |
| Shares sold | | | | | | | | | | | | | | | | |
Class A | | | 3,668,008 | | | | $32,942,311 | | | | 4,935,111 | | | | $36,087,083 | |
Class B | | | 203,842 | | | | 1,633,471 | | | | 477,274 | | | | 3,175,575 | |
Class C | | | 293,622 | | | | 2,327,309 | | | | 395,197 | | | | 2,585,255 | |
Class I | | | 2,295,349 | | | | 20,998,178 | | | | 4,838,526 | | | | 36,045,698 | |
Class R1 | | | 23,065 | | | | 181,226 | | | | 55,842 | | | | 365,134 | |
Class R2 | | | 75,366 | | | | 648,747 | | | | 135,746 | | | | 951,768 | |
Class R3 | | | 14,694 | | | | 128,063 | | | | 60,178 | | | | 434,406 | |
Class R4 | | | 482 | | | | 4,341 | | | | 670 | | | | 4,856 | |
Class 529A | | | 15,877 | | | | 133,459 | | | | 26,975 | | | | 192,023 | |
Class 529B | | | 365 | | | | 2,830 | | | | 4,896 | | | | 31,761 | |
Class 529C | | | 5,450 | | | | 42,681 | | | | 8,376 | | | | 53,949 | |
| | | 6,596,120 | | | | $59,042,616 | | | | 10,938,791 | | | | $79,927,508 | |
| Shares reacquired | | | | | | | | | | | | | | | | |
Class A | | | (2,700,551 | ) | | | $(23,459,445 | ) | | | (6,041,562 | ) | | | $(43,465,528 | ) |
Class B | | | (942,281 | ) | | | (7,484,649 | ) | | | (3,913,799 | ) | | | (26,166,093 | ) |
Class C | | | (403,072 | ) | | | (3,140,422 | ) | | | (913,222 | ) | | | (5,917,174 | ) |
Class I | | | (4,952,317 | ) | | | (45,671,185 | ) | | | (9,371,892 | ) | | | (68,800,238 | ) |
Class R1 | | | (28,204 | ) | | | (216,722 | ) | | | (95,221 | ) | | | (639,642 | ) |
Class R2 | | | (55,010 | ) | | | (484,936 | ) | | | (225,918 | ) | | | (1,575,325 | ) |
Class R3 | | | (49,308 | ) | | | (429,110 | ) | | | (97,633 | ) | | | (698,234 | ) |
Class R4 | | | — | | | | — | | | | (34 | ) | | | (239 | ) |
Class 529A | | | (7,154 | ) | | | (60,431 | ) | | | (10,764 | ) | | | (77,740 | ) |
Class 529B | | | (4,372 | ) | | | (35,531 | ) | | | (892 | ) | | | (5,870 | ) |
Class 529C | | | (1,346 | ) | | | (10,690 | ) | | | (6,957 | ) | | | (45,301 | ) |
| | | (9,143,615 | ) | | | $(80,993,121 | ) | | | (20,677,894 | ) | | | $(147,391,384 | ) |
32
Notes to Financial Statements (unaudited) – continued
| | | | | | | | | | | | | | | | |
| | | Six months ended
2/28/11 | | | Year ended
8/31/10 | |
| | | Shares | | | Amount | | | Shares | | | Amount | |
| Net change | | | | | | | | | | | | | | | | |
Class A | | | 967,457 | | | | $9,482,866 | | | | (1,106,451 | ) | | | $(7,378,445 | ) |
Class B | | | (738,439 | ) | | | (5,851,178 | ) | | | (3,436,525 | ) | | | (22,990,518 | ) |
Class C | | | (109,450 | ) | | | (813,113 | ) | | | (518,025 | ) | | | (3,331,919 | ) |
Class I | | | (2,656,968 | ) | | | (24,673,007 | ) | | | (4,533,366 | ) | | | (32,754,540 | ) |
Class R1 | | | (5,139 | ) | | | (35,496 | ) | | | (39,379 | ) | | | (274,508 | ) |
Class R2 | | | 20,356 | | | | 163,811 | | | | (90,172 | ) | | | (623,557 | ) |
Class R3 | | | (34,614 | ) | | | (301,047 | ) | | | (37,455 | ) | | | (263,828 | ) |
Class R4 | | | 482 | | | | 4,341 | | | | 636 | | | | 4,617 | |
Class 529A | | | 8,723 | | | | 73,028 | | | | 16,211 | | | | 114,283 | |
Class 529B | | | (4,007 | ) | | | (32,701 | ) | | | 4,004 | | | | 25,891 | |
Class 529C | | | 4,104 | | | | 31,991 | | | | 1,419 | | | | 8,648 | |
| | | (2,547,495 | ) | | | $(21,950,505 | ) | | | (9,739,103 | ) | | | $(67,463,876 | ) |
The fund is one of several mutual funds in which the MFS funds-of-funds may invest. The MFS funds-of-funds do not invest in the underlying MFS funds for the purpose of exercising management or control. At the end of the period, the MFS Conservative Allocation Fund, the MFS Aggressive Growth Allocation Fund, the MFS Moderate Allocation Fund, and the MFS Growth Allocation Fund were the owners of record of approximately 5%, 12%, 19%, and 26%, respectively, of the value of outstanding voting shares of the fund. In addition, the MFS Lifetime Retirement Income Fund, the MFS Lifetime 2010 Fund, the MFS Lifetime 2020 Fund, the MFS Lifetime 2030 Fund, the MFS Lifetime 2040 Fund and the MFS Lifetime 2050 Fund were each the owners of record of less than 1% of the value of outstanding voting shares of the fund.
The fund and certain other funds managed by MFS participate in a $1.1 billion unsecured committed line of credit, subject to a $1 billion sublimit, provided by a syndication of banks under a credit agreement. Borrowings may be made for temporary financing needs. Interest is charged to each fund, based on its borrowings, generally at a rate equal to the higher of the Federal Reserve funds rate or one month LIBOR plus an agreed upon spread. A commitment fee, based on the average daily, unused portion of the committed line of credit, is allocated among the participating funds at the end of each calendar quarter. In addition, the fund and other funds managed by MFS have established unsecured uncommitted borrowing arrangements with certain banks for temporary financing needs. Interest is charged to each fund, based on its borrowings, at a rate equal to the Federal Reserve funds rate plus an agreed upon spread. For the six months ended February 28, 2011, the fund’s commitment fee and interest expense were $4,063 and $0, respectively, and are included in miscellaneous expense on the Statement of Operations.
33
Notes to Financial Statements (unaudited) – continued
| (7) | | Transactions in Underlying Affiliated Funds-Affiliated Issuers |
An affiliated issuer may be considered one in which the fund owns 5% or more of the outstanding voting securities, or a company which is under common control. For the purposes of this report, the fund assumes the following to be affiliated issuers:
| | | | | | | | | | | | | | | | |
| Underlying Affiliated Funds | | Beginning
Shares/Par
Amount | | | Acquisitions
Shares/Par
Amount | | | Dispositions
Shares/Par
Amount | | | Ending
Shares/Par
Amount | |
MFS Institutional Money
Market Portfolio | | | 28,789,387 | | | | 114,137,975 | | | | (125,043,481 | ) | | | 17,883,881 | |
| | | | |
| Underlying Affiliated Funds | | Realized
Gain (Loss) | | | Capital Gain
Distributions | | | Dividend
Income | | | Ending
Value | |
MFS Institutional Money
Market Portfolio | | | $— | | | | $— | | | | $21,160 | | | | $17,883,881 | |
34
BOARD REVIEW OF INVESTMENT ADVISORY AGREEMENT
A discussion regarding the Board’s most recent review and renewal of the fund’s Investment Advisory Agreement with MFS is available by clicking on the fund’s name under “Mutual Funds” in the “Products and Performance” section of the MFS Web site (mfs.com).
PROXY VOTING POLICIES AND INFORMATION
A general description of the MFS funds’ proxy voting policies and procedures is available without charge, upon request, by calling
1-800-225-2606, by visiting the Proxy Voting section of mfs.com or by visiting the SEC’s Web site at http://www.sec.gov.
Information regarding how the fund voted proxies relating to portfolio securities during the most recent twelve-month period ended June 30 is available without charge by visiting the Proxy Voting section of mfs.com or by visiting the SEC’s Web site at http://www.sec.gov.
QUARTERLY PORTFOLIO DISCLOSURE
The fund will file a complete schedule of portfolio holdings with the Securities and Exchange Commission (the Commission) for the first and third quarters of each fiscal year on Form N-Q. The fund’s Form N-Q may be reviewed and copied at the:
Public Reference Room
Securities and Exchange Commission
100 F Street, NE, Room 1580
Washington, D.C. 20549
Information on the operation of the Public Reference Room may be obtained by calling the Commission at 1-800-SEC-0330. The fund’s Form N-Q is available on the EDGAR database on the Commission’s Internet Web site at http://www.sec.gov, and copies of this information may be obtained, upon payment of a duplicating fee, by electronic request at the following e-mail address: publicinfo@sec.gov or by writing the Public Reference Section at the above address.
A shareholder can also obtain the quarterly portfolio holdings report at mfs.com.
FURTHER INFORMATION
From time to time, MFS may post important information about the fund or the MFS funds on the MFS web site (mfs.com). This information is available by visiting the “News & Commentary” section of mfs.com or by clicking on the fund’s name under “Mutual Funds” in the “Products and Performance” section of mfs.com.
35
rev. 3/11
| | | | |
| FACTS | | WHAT DOES MFS DO WITH YOUR PERSONAL INFORMATION? | |  |
| | |
| Why? | | Financial companies choose how they share your personal information. Federal law gives consumers the right to limit some but not all sharing. Federal law also requires us to tell you how we collect, share, and protect your personal information. Please read this notice carefully to understand what we do. |
| | |
| What? | | The types of personal information we collect and share depend on the product or service you have with us. This information can include: •Social Security number and account balances •Account transactions and transaction history •Checking account information and wire transfer instructions When you are no longer our customer, we continue to share your information as described in this notice. |
| | |
| How? | | All financial companies need to share customers’ personal information to run their everyday business. In the section below, we list the reasons financial companies can share their customers’ personal information; the reasons MFS chooses to share; and whether you can limit this sharing. |
| | | | |
| Reasons we can share your personal information | | Does MFS share? | | Can you limit
this sharing? |
For our everyday business purposes – such as to process your transactions, maintain your account(s), respond to court orders and legal investigations, or report to credit bureaus | | Yes | | No |
For our marketing purposes – to offer our products and services to you | | No | | We don’t share |
| For joint marketing with other financial companies | | No | | We don’t share |
For our affiliates’ everyday business purposes – information about your transactions and experiences | | No | | We don’t share |
For our affiliates’ everyday business purposes – information about your creditworthiness | | No | | We don’t share |
| For nonaffiliates to market to you | | No | | We don’t share |
| | |
| Questions? | | Call 800-225-2606 or go to mfs.com. |
36
| | |
| Who we are |
| Who is providing this notice? | | MFS Funds, MFS Investment Management, MFS Institutional Advisors, Inc., MFS Fund Distributors, Inc., MFS Heritage Trust Company, and MFS Service Center, Inc. |
| | |
| What we do |
| How does MFS protect my personal information? | | To protect your personal information from unauthorized access and use, we use security measures that comply with federal law. These measures include procedural, electronic, and physical safeguards for the protection of the personal information we collect about you. |
How does MFS
collect my personal information? | | We collect your personal information, for example, when you •open an account or provide account information •direct us to buy securities or direct us to sell your securities •make a wire transfer We also collect your personal information from others, such as credit bureaus, affiliates and other companies. |
| Why can’t I limit all sharing? | | Federal law gives you the right to limit only •sharing for affiliates’ everyday business purposes – information about your creditworthiness •affiliates from using your information to market to you •sharing for nonaffiliates to market to you State laws and individual companies may give you additional rights to limit sharing. |
| | |
| Definitions |
| Affiliates | | Companies related by common ownership or control. They can be financial and nonfinancial companies. •MFS does not share personal information with affiliates, except for everyday business purposes as described on page one of this notice. |
| Nonaffiliates | | Companies not related by common ownership or control. They can be financial and nonfinancial companies. •MFS does not share with nonaffiliates so they can market to you. |
| Joint Marketing | | A formal agreement between nonaffiliated financial companies that together market financial products or services to you. •MFS doesn’t jointly market. |
| | |
| Other important information |
| If you own an MFS product or receive an MFS service in the name of a third party such as a bank or broker-dealer, their privacy policy may apply to you instead of ours. |
37
Save paper with eDelivery.
MFS® will send you prospectuses, reports, and proxies directly via e-mail so you will get information faster with less mailbox clutter.
To sign up:
1. Go to mfs.com.
2. Log in via MFS® Access.
3. Select eDelivery.
If you own your MFS fund shares through a financial institution or a retirement plan, MFS® TALK, MFS® Access, or eDelivery may not be available to you.

Web site
mfs.com
MFS TALK
1-800-637-8255
24 hours a day
Account service and literature
Shareholders
1-800-225-2606
Financial advisors
1-800-343-2829
Retirement plan services
1-800-637-1255
Mailing address
MFS Service Center, Inc.
P.O. Box 55824
Boston, MA 02205-5824
Overnight mail
MFS Service Center, Inc.
c/o Boston Financial Data Services
30 Dan Road
Canton, MA 02021-2809

MFS® Money Market Fund
MFS® Government Money Market Fund

SEMIANNUAL REPORT
February 28, 2011
MCM-SEM
MFS® MONEY MARKET FUND
MFS® GOVERNMENT MONEY MARKET FUND
The report is prepared for the general information of shareholders.
It is authorized for distribution to prospective investors only when preceded or accompanied by a current prospectus.
NOT FDIC INSURED Ÿ MAY LOSE VALUE Ÿ NO BANK GUARANTEE

LETTER FROM THE CEO
Dear Shareholders:
After an extended rebound in the financial markets, uncertainty returned in 2010 as investors began to question the durability of the recovery for global economies and markets. That uncertainty led to increased risk aversion, especially as investors saw the eurozone struggle with the debt woes of many of its members. Last September, the U.S. Federal Reserve Board’s promises to further loosen monetary policy helped assuage market fears and drive asset prices off their recent lows. A combination of solid earnings and improving economic data gave an additional boost to investor sentiment. For 2011, we are cautiously optimistic that economic growth will continue to improve and that the global economies will recover from the shocks of the past few years. We expect the pace of recovery worldwide will be uneven and volatile and acknowledge the elevated uncertainty created by events in Japan, Europe, and the Middle East.
As always, we continue to be mindful of the many economic challenges faced at the local, national, and international levels. It is in times such as these that we want to remind investors of the merits of maintaining a long-term view, adhering to basic investing principles such as asset allocation and diversification, and working closely with their advisors to research and identify appropriate investment opportunities.
Respectfully,

Robert J. Manning
Chairman and Chief Executive Officer
MFS Investment Management®
April 15, 2011
The opinions expressed in this letter are subject to change, may not be relied upon for investment advice, and no forecasts can be guaranteed.
1
PORTFOLIO COMPOSITION
MFS MONEY MARKET FUND
Portfolio structure (u)
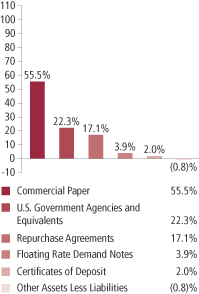
| | | | |
| Composition including fixed income credit quality (a)(u) | | | | |
| A-1+ | | | 2.4% | |
| A-1 | | | 98.4% | |
| Not Rated | | | 0.0% | |
| Cash & Other | | | (0.8)% | |
| |
| Maturity breakdown (u) | | | | |
| 0 - 7 days | | | 26.3% | |
| 8 - 29 days | | | 19.5% | |
| 30 - 59 days | | | 29.8% | |
| 60 - 89 days | | | 15.1% | |
| 90 - 366 days | | | 10.1% | |
| Other Assets Less Liabilities | | | (0.8)% | |
MFS GOVERNMENT MONEY MARKET FUND
Portfolio structure (u)
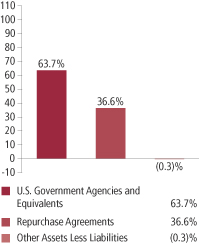
| | | | |
| Composition including fixed income credit quality (a)(u) | | | | |
| A-1 | | | 100.3% | |
| Not Rated | | | 0.0% | |
| Cash & Other | | | (0.3)% | |
| |
| Maturity breakdown (u) | | | | |
| 0 - 7 days | | | 45.0% | |
| 8 - 29 days | | | 6.7% | |
| 30 - 59 days | | | 18.9% | |
| 60 - 89 days | | | 11.1% | |
| 90 - 366 days | | | 18.6% | |
| Other Assets Less Liabilities | | | (0.3)% | |
2
Portfolio Composition – continued
| (a) | The composition table shows the percentage of portfolio assets falling within each rating category. Included in each rating category are short-term debt securities, the ratings of which are based on the short-term credit quality ratings of the securities’ issuers. For repurchase agreements, the credit quality is based on the short-term rating of the counterparty with which MFS trades the repurchase agreement. Each short-term debt security is assigned a rating in accordance with the following ratings hierarchy; If the issuer is rated by Moody’s, then that rating is used; if not rated by Moody’s, then a Standard & Poor’s rating is used; if not rated by S&P, then a Fitch rating is used. Cash and other portfolio assets that are not securities are not included in the categories mentioned above. Ratings are converted to the S&P scale and are subject to change. |
| (u) | For purposes of this presentation, accrued interest, where applicable, is included. |
From time to time “Other Assets Less Liabilities” may be negative due to timing of cash receipts.
Percentages are based on net assets as of 2/28/11, unless otherwise noted.
The portfolio is actively managed and current holdings may be different.
3
EXPENSE TABLES
Fund expenses borne by the shareholders during the period,
September 1, 2010 through February 28, 2011
As a shareholder of the funds, you incur two types of costs: (1) transaction costs, including sales charges (loads) on certain purchase or redemption payments, and (2) ongoing costs, including management fees; and other fund expenses. These examples are intended to help you understand your ongoing costs (in dollars) of investing in the funds and to compare these costs with the ongoing costs of investing in other mutual funds.
The examples are based on an investment of $1,000 invested at the beginning of the period and held for the entire period September 1, 2010 through February 28, 2011.
Actual Expenses
The first line in the following tables provides information about actual account values and actual expenses. You may use the information in this line, together with the amount you invested, to estimate the expenses that you paid over the period. Simply divide your account value by $1,000 (for example, an $8,600 account value divided by $1,000 = 8.6), then multiply the result by the number in the first line under the heading entitled “Expenses Paid During Period” to estimate the expenses you paid on your account during this period.
Hypothetical Example for Comparison Purposes
The second line in the following tables provides information about hypothetical account values and hypothetical expenses based on the fund’s actual expense ratio and an assumed rate of return of 5% per year before expenses, which is not the fund’s actual return. The hypothetical account values and expenses may not be used to estimate the actual ending account balance or expenses you paid for the period. You may use this information to compare the ongoing costs of investing in the funds and other funds. To do so, compare this 5% hypothetical example with the 5% hypothetical examples that appear in the shareholder reports of the other funds.
Please note that the expenses shown in the tables are meant to highlight your ongoing costs only and do not reflect any transactional costs, such as sales charges (loads). Therefore, the second line in the following tables is useful in comparing ongoing costs only, and will not help you determine the relative total costs of owning different funds. In addition, if these transactional costs were included, your costs would have been higher.
4
Expense Tables – continued
| | | | | | | | |
| MFS Money Market Fund | | Annualized
Expense
Ratio | | Beginning
Account Value
9/01/10 | | Ending
Account Value
2/28/11 | | Expenses
Paid During
Period (p)
9/01/10-2/28/11 |
| Actual | | 0.24% | | $1,000.00 | | $1,000.00 | | $1.19 |
| Hypothetical (h) | | 0.24% | | $1,000.00 | | $1,023.60 | | $1.20 |
| | | | | | | | |
MFS Government
Money Market Fund | | Annualized
Expense
Ratio | | Beginning
Account Value
9/01/10 | | Ending
Account Value
2/28/11 | | Expenses
Paid During
Period (p)
9/01/10-2/28/11 |
| Actual | | 0.19% | | $1,000.00 | | $1,000.00 | | $0.94 |
| Hypothetical (h) | | 0.19% | | $1,000.00 | | $1,023.85 | | $0.95 |
| (h) | 5% class return per year before expenses. |
| (p) | Expenses paid is equal to each class’ annualized expense ratio, as shown above, multiplied by the average account value over the period, multiplied by the number of days in the period, divided by the number of days in the year. Expenses paid do not include any applicable sales charges (loads). If these transaction costs had been included, your costs would have been higher. |
Expense Changes Impacting the Table
As more fully disclosed in footnote 3 to the financial statements, the expense ratios reported above include additional expense reductions to avoid a negative yield.
5
PORTFOLIOS OF INVESTMENTS
2/28/11 (unaudited)
These Portfolios of Investments are a complete list of all securities owned by your fund. They are categorized by broad-based asset classes.
MFS MONEY MARKET FUND
| | | | | | | | |
| Certificates of Deposit - 2.0% | | | | | | | | |
| Issuer | | Shares/Par | | | Value ($) | |
| | | | | | | | |
| Major Banks - 2.0% | | | | | | | | |
| BNP Paribas/New York Branch, 0.52%, due 8/22/11 | | $ | 4,780,000 | | | $ | 4,780,000 | |
| Royal Bank of Canada/Chicago Branch, 0.33%, due 6/07/11 | | | 4,220,000 | | | | 4,220,000 | |
| Total Certificates of Deposit, at Cost and Value | | | | | | $ | 9,000,000 | |
| | |
| Commercial Paper (y) - 55.5% | | | | | | | | |
| Consumer Products - 2.2% | | | | | | | | |
| Proctor Gamble And Co., 0.21%, due 4/12/11 (t) | | $ | 9,500,000 | | | $ | 9,497,670 | |
| | |
| Electrical Equipment - 0.4% | | | | | | | | |
| General Electric Co., 0.2%, due 3/10/11 | | $ | 1,843,000 | | | $ | 1,842,908 | |
| | |
| Food & Beverages - 4.5% | | | | | | | | |
| Coca-Cola Co., 0.23%, due 3/16/11 (t) | | $ | 1,901,000 | | | $ | 1,900,818 | |
| Coca-Cola Co., 0.23%, due 4/05/11 (t) | | | 12,259,000 | | | | 12,256,259 | |
| Nestle Capital Corp., 0.19%, due 3/07/11 (t) | | | 5,596,000 | | | | 5,595,823 | |
| | | | | | | | |
| | | | | | | $ | 19,752,900 | |
| Machinery & Tools - 3.0% | | | | | | | | |
| Deere and Co., 0.19%, due 3/24/11 (t) | | $ | 13,342,000 | | | $ | 13,340,380 | |
| | |
| Major Banks - 20.6% | | | | | | | | |
| Abbey National North America LLC, 0.19%, due 3/01/11 | | $ | 273,000 | | | $ | 273,000 | |
| Abbey National North America LLC, 0.32%, due 3/22/11 | | | 5,761,000 | | | | 5,759,925 | |
| Abbey National North America LLC, 0.33%, due 3/15/11 | | | 7,294,000 | | | | 7,293,064 | |
| Bank of America Corp., 0.24%, due 4/26/11 | | | 13,283,000 | | | | 13,278,041 | |
| BNP Paribas Finance, Inc., 0.36%, due 4/14/11 | | | 1,242,000 | | | | 1,241,454 | |
| Credit Suisse First Boston, Inc., 0.26%, due 5/18/11 | | | 13,240,000 | | | | 13,232,541 | |
| HSBC USA, Inc., 0.24%, due 3/28/11 | | | 3,238,000 | | | | 3,237,417 | |
| HSBC USA, Inc., 0.24%, due 4/15/11 | | | 8,251,000 | | | | 8,248,525 | |
| JPMorgan Chase & Co., 0.23%, due 5/16/11 | | | 14,228,000 | | | | 14,221,092 | |
| Toronto Dominion Holdings (USA), Inc., 0.24%, due 4/20/11 (t) | | | 10,731,000 | | | | 10,727,423 | |
| Westpac Banking Corp., 0.22%, due 5/24/11 (t) | | | 13,200,000 | | | | 13,193,224 | |
| | | | | | | | |
| | | | | | | $ | 90,705,706 | |
| Medical Equipment - 0.9% | | | | | | | | |
| Merck & Co., Inc., 0.19%, due 3/28/11 (t) | | $ | 3,734,000 | | | $ | 3,733,468 | |
6
Portfolios of Investments (unaudited) – continued
| | | | | | | | |
| Issuer | | Shares/Par | | | Value ($) | |
| | | | | | | | |
| Commercial Paper (y) - continued | | | | | | | | |
| Network & Telecom - 3.1% | | | | | | | | |
| AT&T, Inc., 0.26%, due 3/01/11 (t) | | $ | 2,530,000 | | | $ | 2,530,000 | |
| AT&T, Inc., 0.26%, due 3/11/11 (t) | | | 10,927,000 | | | | 10,926,211 | |
| | | | | | | | |
| | | | | | | $ | 13,456,211 | |
| Other Banks & Diversified Financials - 12.4% | | | | | | | | |
| Bank of Nova Scotia, 0.235%, due 4/08/11 | | $ | 10,943,000 | | | $ | 10,940,286 | |
| Bank of Nova Scotia, 0.255%, due 5/18/11 | | | 2,300,000 | | | | 2,298,729 | |
| Citigroup Funding, Inc., 0.3%, due 3/28/11 | | | 11,428,000 | | | | 11,425,429 | |
| Citigroup Funding, Inc., 0.3%, due 4/20/11 | | | 2,024,000 | | | | 2,023,157 | |
| Rabobank USA Financial Corp., 0.29%, due 5/10/11 | | | 4,009,000 | | | | 4,006,739 | |
| Rabobank USA Financial Corp., 0.3%, due 5/10/11 | | | 10,223,000 | | | | 10,217,037 | |
| UBS Finance (Delaware) LLC, 0.255%, due 4/20/11 | | | 11,084,000 | | | | 11,080,074 | |
| UBS Finance (Delaware) LLC, 0.285%, due 3/14/11 | | | 2,555,000 | | | | 2,554,737 | |
| | | | | | | | |
| | | | | | | $ | 54,546,188 | |
| Pharmaceuticals - 6.4% | | | | | | | | |
| Abbott Laboratories, 0.2%, due 3/08/11 (t) | | $ | 14,044,000 | | | $ | 14,043,454 | |
| Johnson & Johnson, 0.2%, due 3/09/11 (t) | | | 14,268,000 | | | | 14,267,366 | |
| | | | | | | | |
| | | | | | | $ | 28,310,820 | |
| Tobacco - 2.0% | | | | | | | | |
| Philip Morris International, Inc., 0.21%, due 3/14/11 (t) | | $ | 8,971,000 | | | $ | 8,970,320 | |
| Total Commercial Paper, at Amortized Cost and Value | | | | | | $ | 244,156,571 | |
| |
| U.S. Government Agencies and Equivalents (y) - 22.3% | | | | | |
| Fannie Mae, 0.175%, due 4/20/11 | | $ | 5,025,000 | | | $ | 5,023,779 | |
| Federal Home Loan Bank, 0.12%, due 4/15/11 | | | 12,000,000 | | | | 11,998,200 | |
| Federal Home Loan Bank, 0.12%, due 4/20/11 | | | 13,225,000 | | | | 13,222,796 | |
| Federal Home Loan Bank, 0.23%, due 6/01/11 | | | 14,300,000 | | | | 14,291,595 | |
| Federal Home Loan Bank, 0.2%, due 6/03/11 | | | 5,135,000 | | | | 5,132,318 | |
| Freddie Mac, 0.18%, due 3/07/11 | | | 620,000 | | | | 619,981 | |
| Freddie Mac, 0.17%, due 3/14/11 | | | 485,000 | | | | 484,970 | |
| Freddie Mac, 0.175%, due 4/25/11 | | | 7,435,000 | | | | 7,433,012 | |
| Freddie Mac, 0.3%, due 4/26/11 | | | 14,400,000 | | | | 14,393,280 | |
| Freddie Mac, 0.17%, due 5/02/11 | | | 9,550,000 | | | | 9,547,204 | |
| Freddie Mac, 0.2%, due 7/06/11 | | | 9,975,000 | | | | 9,967,962 | |
| Freddie Mac, 0.24%, due 8/16/11 | | | 6,000,000 | | | | 5,993,280 | |
Total U.S. Government Agencies and Equivalents,
at Amortized Cost and Value | | | $ | 98,108,377 | |
| | |
| Floating Rate Demand Notes - 3.9% | | | | | | | | |
| East Baton Rouge, LA, Pollution Control Rev. (Exxon Mobil Corp.), 0.14%, due 3/01/11 | | $ | 8,700,000 | | | $ | 8,700,000 | |
7
Portfolios of Investments (unaudited) – continued
| | | | | | | | |
| Issuer | | Shares/Par | | | Value ($) | |
| | | | | | | | |
| Floating Rate Demand Notes - continued | | | | | | | | |
| Lincoln County, WY, Pollution Control Rev. (Exxon Mobil Corp.), 0.14%, due 3/01/11 | | $ | 8,400,000 | | | $ | 8,400,000 | |
| Total Floating Rate Demand Notes, at Cost and Value | | | | | | $ | 17,100,000 | |
| | |
| Repurchase Agreements - 17.1% | | | | | | | | |
| Bank of America Corp., 0.17%, dated 2/28/11, due 3/01/11, total to be received $31,110,147 (secured by U.S. Treasury and Federal Agency obligations valued at $31,732,304 in a jointly traded account) | | $ | 31,110,000 | | | $ | 31,110,000 | |
| Goldman Sachs, 0.19%, dated 2/28/11, due 3/01/11, total to be received $44,420,234 (secured by U.S. Treasury and Federal Agency obligations valued at $45,479,961 in a jointly traded account) | | | 44,420,000 | | | | 44,420,000 | |
| Total Repurchase Agreements, at Cost and Value | | | | | | $ | 75,530,000 | |
| Total Investments, at Amortized Cost and Value | | | | | | $ | 443,894,948 | |
| | |
| Other Assets, Less Liabilities - (0.8)% | | | | | | | (3,723,967 | ) |
| Net Assets - 100.0% | | | | | | $ | 440,170,981 | |
See Portfolio Footnotes and Notes to Financial Statements
8
Portfolios of Investments (unaudited) – continued
MFS GOVERNMENT MONEY MARKET FUND
| | | | | | | | |
| Issuer | | Shares/Par | | | Value ($) | |
| U.S. Government Agencies and Equivalents (y) - 63.7% | | | | | |
| Fannie Mae, 0.13%, due 4/26/11 | | $ | 200,000 | | | $ | 199,959 | |
| Fannie Mae, 0.175%, due 4/26/11 | | | 350,000 | | | | 349,905 | |
| Fannie Mae, 0.2%, due 6/20/11 | | | 200,000 | | | | 199,877 | |
| Fannie Mae, 0.17%, due 7/01/11 | | | 285,000 | | | | 284,836 | |
| Fannie Mae, 0.2%, due 7/11/11 | | | 250,000 | | | | 249,817 | |
| Fannie Mae, 0.24%, due 8/01/11 | | | 650,000 | | | | 649,337 | |
| Federal Farm Credit Bank, 0.14%, due 5/24/11 | | | 574,000 | | | | 573,813 | |
| Federal Home Loan Bank, 0.16%, due 3/02/11 | | | 633,000 | | | | 632,997 | |
| Federal Home Loan Bank, 0.12%, due 4/15/11 | | | 550,000 | | | | 549,918 | |
| Federal Home Loan Bank, 0.12%, due 4/20/11 | | | 570,000 | | | | 569,905 | |
| Federal Home Loan Bank, 0.175%, due 4/25/11 | | | 590,000 | | | | 589,842 | |
| Federal Home Loan Bank, 0.18%, due 5/11/11 | | | 425,000 | | | | 424,849 | |
| Federal Home Loan Bank, 0.15%, due 5/16/11 | | | 500,000 | | | | 499,842 | |
| Federal Home Loan Bank, 0.23%, due 6/01/11 | | | 650,000 | | | | 649,618 | |
| Freddie Mac, 0.18%, due 3/07/11 | | | 660,000 | | | | 659,980 | |
| Freddie Mac, 0.19%, due 3/07/11 | | | 301,000 | | | | 300,990 | |
| Freddie Mac, 0.165%, due 3/14/11 | | | 634,000 | | | | 633,962 | |
| Freddie Mac, 0.18%, due 3/30/11 | | | 630,000 | | | | 629,909 | |
| Freddie Mac, 0.175%, due 4/25/11 | | | 590,000 | | | | 589,842 | |
| Freddie Mac, 0.3%, due 4/26/11 | | | 720,000 | | | | 719,664 | |
| Freddie Mac, 0.17%, due 5/02/11 | | | 585,000 | | | | 584,829 | |
| Freddie Mac, 0.21%, due 6/21/11 | | | 630,000 | | | | 629,588 | |
| Freddie Mac, 0.21%, due 7/26/11 | | | 595,000 | | | | 594,490 | |
| Freddie Mac, 0.24%, due 8/16/11 | | | 240,000 | | | | 239,731 | |
Total U.S. Government Agencies and Equivalents,
at Amortized Cost and Value | | | $ | 12,007,500 | |
| | |
| Repurchase Agreements - 36.6% | | | | | | | | |
| Bank of America Corp., 0.17%, dated 2/28/11, due 3/01/11, total to be received $3,120,015 (secured by U.S. Treasury and Federal Agency obligations valued at $3,182,410 in a jointly traded account) | | $ | 3,120,000 | | | $ | 3,120,000 | |
| Goldman Sachs, 0.19%, dated 2/28/11, due 3/01/11, total to be received $3,777,020 (secured by U.S. Treasury and Federal Agency obligations valued at $3,867,128 in a jointly traded account) | | | 3,777,000 | | | | 3,777,000 | |
| Total Repurchase Agreements, at Cost and Value | | | | | | $ | 6,897,000 | |
| Total Investments, at Amortized Cost and Value | | | | | | $ | 18,904,500 | |
| | |
| Other Assets, Less Liabilities - (0.3)% | | | | | | | (55,901 | ) |
| Net Assets - 100.0% | | | | | | $ | 18,848,599 | |
| (t) | Security exempt from registration with the U.S. Securities and Exchange Commission under Section 4(2) of the Securities Act of 1933. |
| (y) | The rate shown represents an annualized yield at time of purchase. |
See Notes to Financial Statements
9
Financial Statements
STATEMENTS OF ASSETS AND LIABILITIES
At 2/28/11 (unaudited)
These statements represent your fund’s balance sheet, which details the assets and liabilities comprising the total value of each fund.
MFS MONEY MARKET FUND
| | | | |
| Assets | | | | |
Investments, at amortized cost and value | | | $368,364,948 | |
Repurchase agreements, at cost and value | | | 75,530,000 | |
Total investments, at amortized cost and value | | | $443,894,948 | |
Cash | | | 194 | |
Receivables for | | | | |
Fund shares sold | | | 618,222 | |
Interest | | | 5,993 | |
Receivable from investment adviser | | | 11,481 | |
Other assets | | | 4,643 | |
Total assets | | | $444,535,481 | |
| Liabilities | | | | |
Payables for | | | | |
Fund shares reacquired | | | $4,168,293 | |
Payable to affiliates | | | | |
Shareholder servicing costs | | | 144,435 | |
Payable for independent Trustees’ compensation | | | 26,349 | |
Accrued expenses and other liabilities | | | 25,423 | |
Total liabilities | | | $4,364,500 | |
Net assets | | | $440,170,981 | |
| Net assets consist of | | | | |
Paid-in capital | | | $440,751,311 | |
Accumulated net realized gain (loss) on investments | | | (554,330 | ) |
Accumulated net investment loss | | | (26,000 | ) |
Net assets | | | $440,170,981 | |
Shares of beneficial interest outstanding | | | 440,753,117 | |
Net asset value per share (net assets of $440,170,981 / 440,753,117 shares of beneficial interest outstanding) | | | $1.00 | |
A contingent deferred sales charge may be imposed on redemptions.
See Notes to Financial Statements
10
Statements of Assets And Liabilities (unaudited) – continued
MFS GOVERNMENT MONEY MARKET FUND
| | | | |
| Assets | | | | |
Investments, at amortized cost and value | | | $12,007,500 | |
Repurchase agreements, at cost and value | | | 6,897,000 | |
Total investments, at amortized cost and value | | | $18,904,500 | |
Cash | | | 16 | |
Receivables for | | | | |
Interest | | | 35 | |
Receivable from investment adviser | | | 10,007 | |
Other assets | | | 415 | |
Total assets | | | $18,914,973 | |
| Liabilities | | | | |
Payables for | | | | |
Fund shares reacquired | | | $40,515 | |
Payable to affiliates | | | | |
Shareholder servicing costs | | | 8,229 | |
Payable for independent Trustees’ compensation | | | 4,060 | |
Accrued expenses and other liabilities | | | 13,570 | |
Total liabilities | | | $66,374 | |
Net assets | | | $18,848,599 | |
| Net assets consist of | | | | |
Paid-in capital | | | $18,852,858 | |
Accumulated net investment loss | | | (4,259 | ) |
Net assets | | | $18,848,599 | |
Shares of beneficial interest outstanding | | | 18,853,597 | |
Net asset value per share (net assets of $18,848,599 / 18,853,597 shares of beneficial interest outstanding) | | | $1.00 | |
A contingent deferred sales charge may be imposed on redemptions.
See Notes to Financial Statements
11
Financial Statements
STATEMENTS OF OPERATIONS
Six months ended 2/28/11 (unaudited)
These statements describe how much each fund earned in investment income and accrued in expenses. They also describe any gains and/or losses generated by each fund’s operations.
MFS MONEY MARKET FUND
| | | | |
| Net investment income | | | | |
Interest income | | | $ 546,026 | |
Expenses | | | | |
Management fee | | | $941,341 | |
Shareholder servicing costs | | | 442,882 | |
Administrative services fee | | | 35,882 | |
Independent Trustees’ compensation | | | 12,371 | |
Custodian fee | | | 22,077 | |
Shareholder communications | | | 13,541 | |
Auditing fees | | | 15,961 | |
Legal fees | | | 4,853 | |
Miscellaneous | | | 45,809 | |
Total expenses | | | $1,534,717 | |
Fees paid indirectly | | | (23,762 | ) |
Reduction of expenses by investment adviser | | | (964,929 | ) |
Net expenses | | | $546,026 | |
Net investment income | | | $0 | |
MFS GOVERNMENT MONEY MARKET FUND
| | | | |
| Net investment income | | | | |
Interest income | | | $19,968 | |
Expenses | | | | |
Management fee | | | $42,069 | |
Shareholder servicing costs | | | 13,385 | |
Administrative services fee | | | 8,679 | |
Independent Trustees’ compensation | | | 1,245 | |
Custodian fee | | | 3,308 | |
Shareholder communications | | | 2,498 | |
Auditing fees | | | 13,483 | |
Legal fees | | | 290 | |
Registration fees | | | 8,881 | |
Miscellaneous | | | 3,502 | |
Total expenses | | | $97,340 | |
Fees paid indirectly | | | (376 | ) |
Reduction of expenses by investment adviser | | | (76,996 | ) |
Net expenses | | | $19,968 | |
Net investment income | | | $0 | |
See Notes to Financial Statements
12
Financial Statements
STATEMENTS OF CHANGES IN NET ASSETS
These statements describe the increases and/or decreases in net assets resulting from operations, any distributions, and any shareholder transactions.
MFS MONEY MARKET FUND
| | | | | | | | |
| Change in net assets | | Six months ended 2/28/11 (unaudited) | | | Year ended 8/31/10 | |
| From operations | | | | | | | | |
Net investment income | | | $0 | | | | $0 | |
Net realized gain (loss) on investments | | | — | | | | 1,098 | |
Change in net assets from operations | | | $0 | | | | $1,098 | |
| Distributions declared to shareholders | | | | | | | | |
From net investment income | | | $— | | | | $(29,740 | ) |
From tax return of capital | | | — | | | | (360 | ) |
Total distributions declared to shareholders | | | $— | | | | $(30,100 | ) |
| Fund share (principal) transactions at net asset value of $1 per share | | | | | | | | |
Net proceeds from sale of shares | | | $103,342,761 | | | | $242,579,073 | |
Net asset value of shares issued to shareholders in reinvestment of distributions | | | — | | | | 28,886 | |
Cost of shares reacquired | | | (171,737,933 | ) | | | (397,996,495 | ) |
Change in net assets from fund share transactions | | | $(68,395,172 | ) | | | $(155,388,536 | ) |
Total change in net assets | | | $(68,395,172 | ) | | | $(155,417,538 | ) |
| Net assets | | | | | | | | |
At beginning of period | | | 508,566,153 | | | | 663,983,691 | |
At end of period (including accumulated distributions in excess of net investment income of $26,000 and $26,000, respectively) | | | $440,170,981 | | | | $508,566,153 | |
See Notes to Financial Statements
13
Statements of Changes In Net Assets – continued
MFS GOVERNMENT MONEY MARKET FUND
| | | | | | | | |
| Change in net assets | | Six months ended
2/28/11
(unaudited) | | | Year ended
8/31/10 | |
| From operations | | | | | | | | |
Net investment income | | | $0 | | | | $0 | |
| Distributions declared to shareholders | | | | | | | | |
From net investment income | | | $— | | | | $(4,890 | ) |
From tax return of capital | | | — | | | | (110 | ) |
Total distributions declared to shareholders | | | $— | | | | $(5,000 | ) |
Fund share (principal) transactions at net asset value
of $1 per share | | | | | | | | |
Net proceeds from sale of shares | | | $15 | | | | $500 | |
Net asset value of shares issued to shareholders in reinvestment of distributions | | | — | | | | 4,451 | |
Cost of shares reacquired | | | (4,556,731 | ) | | | (16,007,667 | ) |
Change in net assets from fund share transactions | | | $(4,556,716 | ) | | | $(16,002,716 | ) |
Total change in net assets | | | $(4,556,716 | ) | | | $(16,007,716 | ) |
| Net assets | | | | | | | | |
At beginning of period | | | 23,405,315 | | | | 39,413,031 | |
At end of period (including accumulated distributions in excess of net investment income of $4,259 and $4,259, respectively) | | | $18,848,599 | | | | $23,405,315 | |
See Notes to Financial Statements
14
Financial Statements
FINANCIAL HIGHLIGHTS
The financial highlights table is intended to help you understand the fund’s financial performance for the semiannual period and the past 5 fiscal years. Certain information reflects financial results for a single fund share. The total returns in the table represent the rate by which an investor would have earned (or lost) on an investment in the fund share class (assuming reinvestment of all distributions) held for the entire period.
MFS MONEY MARKET FUND
| | | | | | | | | | | | | | | | | | | | | | | | |
| | | Six months
ended
2/28/11 (unaudited) | | | Years ended 8/31 | |
| | | | 2010 | | | 2009 | | | 2008 | | | 2007 | | | 2006 | |
| | | | | | | | | | | | | | | | | |
Net asset value, beginning
of period | | | $1.00 | | | | $1.00 | | | | $1.00 | | | | $1.00 | | | | $1.00 | | | | $1.00 | |
| Income (loss) from investment operations | | | | | | | | | | | | | | | | | | | | | | | | |
Net investment income (d) | | | $0.00 | | | | $0.00 | | | | $0.01 | | | | $0.04 | | | | $0.05 | | | | $0.04 | |
Net realized and unrealized gain (loss) on investments | | | — | | | | 0.00 | (w) | | | (0.01 | ) | | | — | | | | (0.00 | )(w) | | | (0.00 | )(w) |
Total from investment
operations | | | $0.00 | | | | $0.00 | (w) | | | $(0.00 | )(w) | | | $0.04 | | | | $0.05 | | | | $0.04 | |
Less distributions declared
to shareholders | | | | | | | | | | | | | | | | | | | | | | | | |
From net investment income | | | $— | | | | $(0.00 | )(w) | | | $(0.00 | )(w) | | | $(0.04 | ) | | | $(0.05 | ) | | | $(0.04 | ) |
From tax return of capital | | | — | | | | (0.00 | )(w) | | | — | | | | — | | | | — | | | | — | |
Total distributions declared to
shareholders | | | — | | | | (0.00 | )(w) | | | (0.00 | )(w) | | | (0.04 | ) | | | (0.05 | ) | | | (0.04 | ) |
Net asset value, end of period | | | $1.00 | | | | $1.00 | | | | $1.00 | | | | $1.00 | | | | $1.00 | | | | $1.00 | |
Total return (%) (r)(t) | | | 0.00 | (n)(w) | | | 0.00 | (w) | | | 0.41 | | | | 3.57 | | | | 5.16 | | | | 4.36 | |
Ratios (%) (to average net
assets) and Supplemental data: | | | | | | | | | | | | | | | | | | | | | |
Expenses before expense
reductions (f) | | | 0.65 | (a) | | | 0.63 | | | | 0.68 | | | | 0.63 | | | | 0.61 | | | | 0.68 | |
Expenses after expense
reductions (f) | | | 0.24 | (a) | | | 0.28 | | | | 0.40 | | | | 0.35 | | | | 0.32 | | | | 0.37 | |
Net investment income | | | 0.00 | (a) | | | 0.00 | | | | 0.50 | | | | 3.51 | | | | 5.03 | | | | 4.28 | |
Net assets at end of period
(000 omitted) | | | $440,171 | | | | $508,566 | | | | $663,984 | | | | $1,260,069 | | | | $1,239,472 | | | | $941,685 | |
| (d) | Per share data is based on average shares outstanding. |
| (f) | Ratios do not reflect reductions from fees paid indirectly, if applicable. |
| (r) | Certain expenses have been reduced without which performance would have been lower. |
| (t) | Total returns do not include any applicable sales charges. |
| (w) | Per share amount was less than $0.01 and 0.01%, respectively. |
See Notes to Financial Statements
15
Financial Highlights – continued
MFS GOVERNMENT MONEY MARKET FUND
| | | | | | | | | | | | | | | | | | | | | | | | |
| | | Six months
ended
2/28/11 (unaudited) | | | Years ended 8/31 | |
| | | | 2010 | | | 2009 | | | 2008 | | | 2007 | | | 2006 | |
| | | | | | | | | | | | | | | | | |
Net asset value, beginning
of period | | | $1.00 | | | | $1.00 | | | | $1.00 | | | | $1.00 | | | | $1.00 | | | | $1.00 | |
Income (loss) from
investment operations | | | | | | | | | | | | | | | | | | | | | | | | |
Net investment income (d) | | | $0.00 | | | | $0.00 | | | | $(0.00 | )(w) | | | $0.03 | | | | $0.05 | | | | $0.04 | |
Less distributions declared
to shareholders | | | | | | | | | | | | | | | | | | | | | | | | |
From net investment income | | | $— | | | | $(0.00 | )(w) | | | $(0.00 | )(w) | | | $(0.03 | ) | | | $(0.05 | ) | | | $(0.04 | ) |
From tax return of capital | | | — | | | | (0.00 | )(w) | | | — | | | | — | | | | — | | | | — | |
Total distributions declared to
shareholders | | | $— | | | | $(0.00 | )(w) | | | $(0.00 | )(w) | | | $(0.03 | ) | | | $(0.05 | ) | | | $(0.04 | ) |
Net asset value, end of period | | | $1.00 | | | | $1.00 | | | | $1.00 | | | | $1.00 | | | | $1.00 | | | | $1.00 | |
Total return (%) (r)(t) | | | 0.00 | (n)(w) | | | 0.01 | | | | 0.26 | | | | 2.87 | | | | 4.79 | | | | 3.89 | |
Ratios (%) (to average net
assets) and Supplemental data: | | | | | | | | | | | | | | | | | | | | | | | | |
Expenses before expense
reductions (f) | | | 0.93 | (a) | | | 0.79 | | | | 0.69 | | | | 0.94 | | | | 0.94 | | | | 1.10 | |
Expenses after expense
reductions (f) | | | 0.19 | (a) | | | 0.20 | | | | 0.33 | | | | 0.59 | | | | 0.59 | | | | 0.75 | |
Net investment income | | | 0.00 | (a) | | | 0.00 | | | | 0.27 | | | | 2.59 | | | | 4.68 | | | | 3.78 | |
Net assets at end of period
(000 omitted) | | | $18,849 | | | | $23,405 | | | | $39,413 | | | | $55,384 | | | | $27,279 | | | | $22,057 | |
| (d) | Per share data is based on average shares outstanding. |
| (f) | Ratios do not reflect reductions from fees paid indirectly, if applicable. |
| (r) | Certain expenses have been reduced without which performance would have been lower. |
| (t) | Total returns do not include any applicable sales charges. |
| (w) | Per share amount was less than $0.01 or percentage amount was less than 0.01%. |
See Notes to Financial Statements
16
NOTES TO FINANCIAL STATEMENTS
(unaudited)
| (1) | | Business and Organization |
MFS Money Market Fund and MFS Government Money Market Fund (the funds) are each a series of MFS Series Trust IV (the trust). The trust is organized as a Massachusetts business trust and is registered under the Investment Company Act of 1940, as amended, as an open-end management investment company.
| (2) | | Significant Accounting Policies |
General – The preparation of financial statements in conformity with U.S. generally accepted accounting principles requires management to make estimates and assumptions that affect the reported amounts of assets and liabilities, and disclosure of contingent assets and liabilities at the date of the financial statements and the reported amounts of revenues and expenses during the reporting period. Actual results could differ from those estimates. In the preparation of these financial statements, management has evaluated subsequent events occurring after the date of the funds’ Statements of Assets and Liabilities through the date that the financial statements were issued.
Investment Valuations – Pursuant to procedures approved by the Board of Trustees, investments held by the funds are generally valued at amortized cost, which approximates market value. Amortized cost involves valuing an instrument at its cost as adjusted for amortization of premium or accretion of discount rather than its current market value. The amortized cost value of an instrument can be different from the market value of an instrument.
Various inputs are used in determining the value of the funds’ assets or liabilities. These inputs are categorized into three broad levels. In certain cases, the inputs used to measure fair value may fall into different levels of the fair value hierarchy. In such cases, an investment’s level within the fair value hierarchy is based on the lowest level of input that is significant to the fair value measurement. The funds’ assessment of the significance of a particular input to the fair value measurement in its entirety requires judgment, and considers factors specific to the investment. Level 1 includes unadjusted quoted prices in active markets for identical assets or liabilities. Level 2 includes other significant observable market-based inputs (including quoted prices for similar securities, interest rates, prepayment speed, and credit risk). Level 3 includes unobservable inputs, which may include the adviser’s own assumptions in determining the fair value of investments. The following is a summary of the levels used as of February 28, 2011 in valuing the funds’ assets or liabilities:
| | | | | | | | | | | | | | | | |
| Investments at Value – Short Term Securities | | Level 1 | | | Level 2 | | | Level 3 | | | Total | |
| MFS Money Market Fund | | | $— | | | | $443,894,948 | | | | $— | | | | $443,894,948 | |
| MFS Government Money Market Fund | | | $— | | | | $18,904,500 | | | | $— | | | | $18,904,500 | |
17
Notes to Financial Statements (unaudited) – continued
For further information regarding security characteristics, see the Portfolio of Investments.
Repurchase Agreements – Each fund entered into repurchase agreements with approved counterparties. Each repurchase agreement is recorded at cost. Each fund requires that the securities collateral in a repurchase transaction be transferred to a custodian. The funds monitor, on a daily basis, the value of the collateral to ensure that its value, including accrued interest, is greater than amounts owed to the funds under each such repurchase agreement. The funds and other funds managed by MFS may utilize a joint trading account for the purpose of entering into one or more repurchase agreements.
Indemnifications – Under each fund’s organizational documents, its officers and Trustees may be indemnified against certain liabilities and expenses arising out of the performance of their duties to the fund. Additionally, in the normal course of business, each fund enters into agreements with service providers that may contain indemnification clauses. Each fund’s maximum exposure under these agreements is unknown as this would involve future claims that may be made against the funds that have not yet occurred.
Investment Transactions and Income – Investment transactions are recorded on the trade date. Interest income is recorded on the accrual basis. All premium and discount is amortized or accreted for financial statement purposes in accordance with U.S. generally accepted accounting principles.
Fees Paid Indirectly – Each fund’s custody fee may be reduced according to an arrangement that measures the value of cash deposited with the custodian by the funds. This amount, for the six months ended February 28, 2011, is shown as a reduction of total expenses on the Statements of Operations.
Tax Matters and Distributions – Each fund intends to qualify as a regulated investment company, as defined under Subchapter M of the Internal Revenue Code, and to distribute all of its taxable income, including realized capital gains. As a result, no provision for federal income tax is required. Each of the fund’s federal tax returns for the prior three fiscal years remain subject to examination by the Internal Revenue Service. Foreign taxes, if any, have been accrued by each fund in the accompanying financial statements.
Distributions to shareholders are recorded on the ex-dividend date. Income and capital gain distributions are determined in accordance with income tax regulations, which may differ from U.S. generally accepted accounting principles. Certain capital accounts in the financial statements are periodically adjusted for permanent differences in order to reflect their tax character. These adjustments have no impact on net assets or net asset value per share. Temporary differences which arise from recognizing certain items of income, expense, gain or loss in different periods for financial statement and tax
18
Notes to Financial Statements (unaudited) – continued
purposes will reverse at some time in the future. Distributions in excess of net investment income or net realized gains are temporary overdistributions for financial statement purposes resulting from differences in the recognition or classification of income, expenses, or distributions for financial statement and tax purposes.
Book/tax differences primarily relate to the timing of recognition of certain expenses.
The tax character of distributions made during the current period will be determined at fiscal year end. The tax character of distributions declared to shareholders for the last fiscal year is as follows:
| | | | | | | | |
| | | MFS Money
Market Fund | | | MFS Government
Money Market Fund | |
| | | 8/31/10 | | | 8/31/10 | |
| Ordinary income (including any short-term capital gains) | | | $29,740 | | | | $4,890 | |
| Tax return of capital (b) | | | 360 | | | | 110 | |
| Total distributions | | | $30,100 | | | | $5,000 | |
| (b) | Distributions in excess of tax basis earnings and profits are reported in the financial statements as a tax return of capital. |
The federal tax cost and the tax basis components of distributable earnings were as follows:
| | | | | | | | |
| As of 2/28/11 | | MFS Money
Market Fund | | | MFS Government
Money Market Fund | |
| Cost of investments | | | $443,894,948 | | | | $18,904,500 | |
| | |
| As of 8/31/10 | | | | | | |
| Capital loss carryforwards | | | $(554,330 | ) | | | $— | |
| Other temporary differences | | | (26,000 | ) | | | (4,259 | ) |
The aggregate cost above includes prior fiscal year end tax adjustments, if any.
As of August 31, 2010, MFS Money Market Fund had capital loss carryforwards available to offset future realized gains. Such losses expire as follows:
| | | | |
| 8/31/11 | | | $ (7,231 | ) |
| 8/31/13 | | | (151 | ) |
| 8/31/15 | | | (35 | ) |
| 8/31/16 | | | (124,119 | ) |
| 8/31/17 | | | (422,794 | ) |
| Total | | | $(554,330 | ) |
| (3) | | Transactions with Affiliates |
Investment Adviser – Each fund has an investment advisory agreement with MFS to provide overall investment management and related administrative services and facilities to the funds.
19
Notes to Financial Statements (unaudited) – continued
Each fund’s management fee is computed daily and paid monthly at the following annual rates:
| | | | |
| First $1 billion of average daily net assets | | | 0.40 | % |
| Average daily net assets in excess of $1 billion | | | 0.35 | % |
During the six months ended February 28, 2011, MFS voluntarily waived receipt of $941,341 and $42,069 of MFS Money Market Fund’s and MFS Government Money Market Fund’s management fees, respectively, to ensure that the funds avoid a negative yield. For the six months ended February 28, 2011, this voluntary waiver had the effect of reducing the management fees by 0.40% and 0.40% of average daily net assets on an annualized basis for MFS Money Market Fund and MFS Government Money Market Fund, respectively. The management fees incurred for the six months ended February 28, 2011 were equivalent to an annual effective rate of 0.00% and 0.00% of average daily net assets for MFS Money Market Fund and MFS Government Money Market Fund, respectively.
To ensure that the funds avoid a negative yield for the six months ended February 28, 2011, MFS voluntarily agreed to reduce certain other expenses in the amount of $22,836 and $34,893 for MFS Money Market Fund and MFS Government Money Market Fund, respectively, which is shown as a reduction of total expenses in the Statements of Operations.
Distributor – Certain shares acquired through an exchange may be subject to a contingent deferred sales charge upon redemption depending on when the shares exchanged were originally purchased. Contingent deferred sales charges imposed during the six months ended February 28, 2011 for MFS Money Market Fund and MFS Government Money Market Fund were $6,347 and $0, respectively.
Shareholder Servicing Agent – MFS Service Center, Inc. (MFSC), a wholly-owned subsidiary of MFS, receives a fee from each fund for its services as shareholder servicing agent calculated as a percentage of the average daily net assets of each fund as determined periodically under the supervision of the funds’ Board of Trustees. For the six months ended February 28, 2011, the fees were $202,026 and $5,971, which equated to 0.0858% and 0.0568% annually of each fund’s average daily net assets for MFS Money Market Fund and MFS Government Money Market Fund, respectively. MFSC also receives payment from each fund for out-of-pocket expenses, sub-accounting and other shareholder servicing costs which may be paid to affiliated and unaffiliated service providers. For the six months ended February 28, 2011, these out-of-pocket expenses, sub-accounting and other shareholder servicing costs amounted to $240,856 and $7,414 for MFS Money Market Fund and MFS Government Money Market Fund, respectively.
Administrator – MFS provides certain financial, legal, shareholder communications, compliance, and other administrative services to each fund.
20
Notes to Financial Statements (unaudited) – continued
Under an administrative services agreement, each fund partially reimburses MFS the costs incurred to provide these services. Each fund is charged an annual fixed amount of $17,500 plus a fee based on average daily net assets. The administrative services fee incurred for the six months ended February 28, 2011 was equivalent to an annual effective rate of 0.0152% and 0.0825% of each fund’s average daily net assets for MFS Money Market Fund and MFS Government Money Market Fund, respectively.
Trustees’ and Officers’ Compensation – Each fund pays compensation to independent Trustees in the form of a retainer, attendance fees, and additional compensation to Board and Committee chairpersons. The funds do not pay compensation directly to Trustees or officers of the funds who are also officers of the investment adviser, all of whom receive remuneration for their services to the funds from MFS. Certain officers and Trustees of the funds are officers or directors of MFS, MFD, and MFSC.
Prior to December 31, 2001, the funds had an unfunded defined benefit plan (“DB plan”) for independent Trustees. As of December 31, 2001, the Board took action to terminate the DB plan with respect to then-current and any future independent Trustees, such that the DB Plan covers only certain of those former independent Trustees who retired on or before December 31, 2001. The DB Plan resulted in a pension expense of $2,139 and $483 for MFS Money Market Fund and MFS Government Money Market Fund, respectively, and is included in independent Trustees’ compensation for the six months ended February 28, 2011. The liability for deferred retirement benefits payable to certain independent Trustees under the DB plan amounted to $23,670 and $3,864 for MFS Money Market Fund and MFS Government Money Market Fund, respectively, at February 28, 2011, and is included in payable for independent Trustees’ compensation on the Statements of Assets and Liabilities.
Other – These funds and certain other funds managed by MFS (the funds) have entered into services agreements (the Agreements) which provide for payment of fees by the funds to Tarantino LLC and Griffin Compliance LLC in return for the provision of services of an Independent Chief Compliance Officer (ICCO) and Assistant ICCO, respectively, for the funds. The ICCO and Assistant ICCO are officers of the funds and the sole members of Tarantino LLC and Griffin Compliance LLC, respectively. The funds can terminate the Agreements with Tarantino LLC and Griffin Compliance LLC at any time under the terms of the Agreements. For the six months ended February 28, 2011, the aggregate fees paid by the funds to Tarantino LLC and Griffin Compliance LLC were $2,859 and $132 for MFS Money Market Fund and MFS Government Money Market Fund, respectively, and are included in miscellaneous expense on the Statements of Operations. MFS has agreed to reimburse the funds for a portion of the payments made by the funds in the amount of $752 and $34 for
21
Notes to Financial Statements (unaudited) – continued
MFS Money Market Fund and MFS Government Money Market Fund, respectively, which is shown as a reduction of total expenses in the Statements of Operations. Additionally, MFS has agreed to bear all expenses associated with office space, other administrative support, and supplies provided to the ICCO and Assistant ICCO.
Purchases and sales of money market securities, exclusive of securities subject to repurchase agreements, were as follows:
| | | | | | | | |
| | | Purchases | | | Sales | |
| MFS Money Market Fund | | | $1,830,636,051 | | | | $1,889,011,000 | |
| MFS Government Money Market Fund | | | $35,570,524 | | | | $39,009,000 | |
| (5) | | Shares of Beneficial Interest |
Each fund’s Declaration of Trust permits the Trustees to issue an unlimited number of full and fractional shares of beneficial interest.
Effective at the close of business on February 27, 2009, the sale of MFS Money Market Fund shares has been suspended except in certain circumstances. Please see the fund’s prospectus for details.
Effective at the close of business on January 16, 2009, the sale of MFS Government Money Market Fund shares has been suspended except in certain circumstances. Please see the fund’s prospectus for details.
Each fund and certain other funds managed by MFS participate in a $1.1 billion unsecured committed line of credit, subject to a $1 billion sublimit, provided by a syndication of banks under a credit agreement. Borrowings may be made for temporary financing needs. Interest is charged to each fund, based on its borrowings, generally at a rate equal to the higher of the Federal Reserve funds rate or one month LIBOR plus an agreed upon spread. A commitment fee, based on the average daily, unused portion of the committed line of credit, is allocated among the participating funds at the end of each calendar quarter. In addition, each fund and other funds managed by MFS have established unsecured uncommitted borrowing arrangements with certain banks for temporary financing needs. Interest is charged to each fund, based on its borrowings, at a rate equal to the Federal Reserve funds rate plus an agreed upon spread. For the six months ended February 28, 2011, the funds’ commitment fees were $2,792 and $124 and interest expenses were $0 and $0 for MFS Money Market Fund and MFS Government Money Market Fund, respectively, and are included in miscellaneous expense on the Statements of Operations.
22
BOARD REVIEW OF INVESTMENT ADVISORY AGREEMENT
A discussion regarding the Board’s most recent review and renewal of the fund’s Investment Advisory Agreement with MFS is available by clicking on the fund’s name under “Mutual Funds” in the “Products and Performance” section of the MFS Web site (mfs.com).
PROXY VOTING POLICIES AND INFORMATION
A general description of the MFS funds’ proxy voting policies and procedures is available without charge, upon request, by calling 1-800-225-2606, by visiting the Proxy Voting section of mfs.com or by visiting the SEC’s Web site at http://www.sec.gov.
Information regarding how the fund voted proxies relating to portfolio securities during the most recent twelve-month period ended June 30 is available without charge by visiting the Proxy Voting section of mfs.com or by visiting the SEC’s Web site at http://www.sec.gov.
QUARTERLY PORTFOLIO DISCLOSURE
The fund will file a complete schedule of portfolio holdings with the Securities and Exchange Commission (the Commission) for the first and third quarters of each fiscal year on Form N-Q. The fund’s Form N-Q may be reviewed and copied at the:
Public Reference Room
Securities and Exchange Commission
100 F Street, NE, Room 1580
Washington, D.C. 20549
Information on the operation of the Public Reference Room may be obtained by calling the Commission at 1-800-SEC-0330. The fund’s Form N-Q is available on the EDGAR database on the Commission’s Internet Web site at http://www.sec.gov, and copies of this information may be obtained, upon payment of a duplicating fee, by electronic request at the following e-mail address: publicinfo@sec.gov or by writing the Public Reference Section at the above address.
A shareholder can also obtain the quarterly portfolio holdings report at mfs.com.
FURTHER INFORMATION
From time to time, MFS may post important information about the fund or the MFS funds on the MFS web site (mfs.com). This information is available by visiting the “News & Commentary” section of mfs.com or by clicking on the fund’s name under “Mutual Funds” in the “Products and Performance” section of mfs.com.
23
rev. 3/11
| | | | |
| FACTS | | WHAT DOES MFS DO WITH YOUR PERSONAL INFORMATION? | |  |
| | |
| Why? | | Financial companies choose how they share your personal information. Federal law gives consumers the right to limit some but not all sharing. Federal law also requires us to tell you how we collect, share, and protect your personal information. Please read this notice carefully to understand what we do. |
| | |
| What? | | The types of personal information we collect and share depend on the product or service you have with us. This information can include: •Social Security number and account balances •Account transactions and transaction history •Checking account information and wire transfer instructions When you are no longer our customer, we continue to share your information as described in this notice. |
| | |
| How? | | All financial companies need to share customers’ personal information to run their everyday business. In the section below, we list the reasons financial companies can share their customers’ personal information; the reasons MFS chooses to share; and whether you can limit this sharing. |
| | | | |
| Reasons we can share your personal information | | Does MFS share? | | Can you limit
this sharing? |
For our everyday business purposes – such as to process your transactions, maintain your account(s), respond to court orders and legal investigations, or report to credit bureaus | | Yes | | No |
For our marketing purposes – to offer our products and services to you | | No | | We don’t share |
| For joint marketing with other financial companies | | No | | We don’t share |
For our affiliates’ everyday business purposes – information about your transactions and experiences | | No | | We don’t share |
For our affiliates’ everyday business purposes – information about your creditworthiness | | No | | We don’t share |
| For nonaffiliates to market to you | | No | | We don’t share |
| | |
| Questions? | | Call 800-225-2606 or go to mfs.com. |
24
| | |
| Who we are |
| Who is providing this notice? | | MFS Funds, MFS Investment Management, MFS Institutional Advisors, Inc., MFS Fund Distributors, Inc., MFS Heritage Trust Company, and MFS Service Center, Inc. |
| | |
| What we do |
| How does MFS protect my personal information? | | To protect your personal information from unauthorized access and use, we use security measures that comply with federal law. These measures include procedural, electronic, and physical safeguards for the protection of the personal information we collect about you. |
How does MFS
collect my personal information? | | We collect your personal information, for example, when you •open an account or provide account information •direct us to buy securities or direct us to sell your securities •make a wire transfer We also collect your personal information from others, such as credit bureaus, affiliates and other companies. |
| Why can’t I limit all sharing? | | Federal law gives you the right to limit only •sharing for affiliates’ everyday business purposes – information about your creditworthiness •affiliates from using your information to market to you •sharing for nonaffiliates to market to you State laws and individual companies may give you additional rights to limit sharing. |
| | |
| Definitions |
| Affiliates | | Companies related by common ownership or control. They can be financial and nonfinancial companies. •MFS does not share personal information with affiliates, except for everyday business purposes as described on page one of this notice. |
| Nonaffiliates | | Companies not related by common ownership or control. They can be financial and nonfinancial companies. •MFS does not share with nonaffiliates so they can market to you. |
| Joint Marketing | | A formal agreement between nonaffiliated financial companies that together market financial products or services to you. •MFS doesn’t jointly market. |
| | |
| Other important information |
| If you own an MFS product or receive an MFS service in the name of a third party such as a bank or broker-dealer, their privacy policy may apply to you instead of ours. |
25
Save paper with eDelivery.
MFS® will send you prospectuses, reports, and proxies directly via e-mail so you will get information faster with less mailbox clutter.
To sign up:
1. Go to mfs.com.
2. Log in via MFS® Access.
3. Select eDelivery.
If you own your MFS fund shares through a financial institution or a retirement plan, MFS® TALK, MFS® Access, or eDelivery may not be available to you.

Web site
mfs.com
MFS TALK
1-800-637-8255
24 hours a day
Account service and literature
Shareholders
1-800-225-2606
Financial advisors
1-800-343-2829
Retirement plan services
1-800-637-1255
Mailing address
MFS Service Center, Inc.
P.O. Box 55824
Boston, MA 02205-5824
Overnight mail
MFS Service Center, Inc.
c/o Boston Financial Data Services
30 Dan Road
Canton, MA 02021-2809
During the period covered by this report, the Registrant has not amended any provision in its Code of Ethics (the “Code”) that relates to an element of the Code’s definitions enumerated in paragraph (b) of Item 2 of this Form N-CSR. During the period covered by this report, the Registrant did not grant a waiver, including an implicit waiver, from any provision of the Code.
| ITEM 3. | AUDIT COMMITTEE FINANCIAL EXPERT. |
Not applicable for semi-annual reports.
| ITEM 4. | PRINCIPAL ACCOUNTANT FEES AND SERVICES. |
Not applicable for semi-annual reports.
| ITEM 5. | AUDIT COMMITTEE OF LISTED REGISTRANTS. |
Not applicable to the Registrant.
A schedule of investments for each series of the Registrant is included as part of the report to shareholders of such series under Item 1 of this Form N-CSR.
| ITEM 7. | DISCLOSURE OF PROXY VOTING POLICIES AND PROCEDURES FOR CLOSED-END MANAGEMENT INVESTMENT COMPANIES. |
Not applicable to the Registrant.
| ITEM 8. | PORTFOLIO MANAGERS OF CLOSED-END MANAGEMENT INVESTMENT COMPANIES. |
Not applicable to the Registrant.
| ITEM 9. | PURCHASES OF EQUITY SECURITIES BY CLOSED-END MANAGEMENT INVESTMENT COMPANY AND AFFILIATED PURCHASERS. |
Not applicable to the Registrant.
| ITEM 10. | SUBMISSION OF MATTERS TO A VOTE OF SECURITY HOLDERS. |
There were no material changes to the procedures by which shareholders may send recommendations to the Board for nominees to the Registrant’s Board since the Registrant last provided disclosure as to such procedures in response to the requirements of Item 407 (c)(2)(iv) of Regulation S-K or this Item.
| ITEM 11. | CONTROLS AND PROCEDURES. |
| (a) | Based upon their evaluation of the effectiveness of the registrant’s disclosure controls and procedures (as defined in Rule 30a-3(c) under the Investment Company Act of 1940 (the “Act”)) as conducted within 90 days of the filing date of this report on Form N-CSR, the registrant’s principal financial officer and principal executive officer have concluded that those disclosure controls and procedures provide reasonable assurance that the material information required to be disclosed by the registrant on this report is recorded, processed, summarized and reported within the time periods specified in the Securities and Exchange Commission’s rules and forms. |
| (b) | There were no changes in the registrant’s internal controls over financial reporting (as defined in Rule 30a-3(d) under the Act) that occurred during the second fiscal quarter of the period covered by the report that have materially affected, or are reasonably likely to materially affect, the registrant’s internal control over financial reporting. |
| (a) | File the exhibits listed below as part of this form. Letter or number the exhibits in the sequence indicated. |
| | (1) | Any code of ethics, or amendment thereto, that is the subject of the disclosure required by Item 2, to the extent that the registrant intends to satisfy the Item 2 requirements through filing of an exhibit. |
| | (2) | A separate certification for each principal executive officer and principal financial officer of the registrant as required by Rule 30a-2(a) under the Act (17 CFR 270.30a-2): Attached hereto. |
| (b) | If the report is filed under Section 13(a) or 15(d) of the Exchange Act, provide the certifications required by Rule 30a-2(b) under the Act (17 CFR 270.30a-2(b)), Rule 13a-14(b) or Rule 15d-14(b) under the Exchange Act (17 CFR 240.13a-14(b) or 240.15d-14(b)) and Section 1350 of Chapter 63 of Title 18 of the United States Code (18 U.S.C. 1350) as an exhibit. A certification furnished pursuant to this paragraph will not be deemed “filed” for the purposes of Section 18 of the Exchange Act (15 U.S.C. 78r), or otherwise subject to the liability of that section. Such certification will not be deemed to be incorporated by reference into any filing under the Securities Act of 1933 or the Exchange Act, except to the extent that the registrant specifically incorporates it by reference: Attached hereto. |
Notice
A copy of the Amended and Restated Declaration of Trust, as amended, of the Registrant is on file with the Secretary of State of The Commonwealth of Massachusetts and notice is hereby given that this instrument is executed on behalf of the Registrant by an officer of the Registrant as an officer and not individually and the obligations of or arising out of this instrument are not binding upon any of the Trustees or shareholders individually, but are binding only upon the assets and property of the respective constituent series of the Registrant.
SIGNATURES
Pursuant to the requirements of the Securities Exchange Act of 1934 and the Investment Company Act of 1940, the registrant has duly caused this report to be signed on its behalf by the undersigned, thereunto duly authorized.
(Registrant) MFS SERIES TRUST IV
| | |
| By (Signature and Title)* | | MARIA F. DIORIODWYER |
| | Maria F. DiOrioDwyer, President |
Date: April 15, 2011
Pursuant to the requirements of the Securities Exchange Act of 1934 and the Investment Company Act of 1940, this report has been signed below by the following persons on behalf of the registrant and in the capacities and on the dates indicated.
| | |
| By (Signature and Title)* | | MARIA F. DIORIODWYER |
| | Maria F. DiOrioDwyer, President (Principal Executive Officer) |
Date: April 15, 2011
| | |
| By (Signature and Title)* | | JOHN M. CORCORAN |
| | John M. Corcoran, Treasurer (Principal Financial Officer and Accounting Officer) |
Date: April 15, 2011
| * | Print name and title of each signing officer under his or her signature. |