UNITED STATES
SECURITIES AND EXCHANGE COMMISSION
Washington, D.C. 20549
FORM N-CSR
CERTIFIED SHAREHOLDER REPORT OF
REGISTERED MANAGEMENT INVESTMENT COMPANIES
Investment Company Act file number 811-2594
MFS SERIES TRUST IV
(Exact name of registrant as specified in charter)
111 Huntington Avenue, Boston, Massachusetts 02199
(Address of principal executive offices) (Zip code)
Kristin V. Collins
Massachusetts Financial Services Company
111 Huntington Avenue
Boston, Massachusetts 02199
(Name and address of agents for service)
Registrant’s telephone number, including area code: (617) 954-5000
Date of fiscal year end: August 31
Date of reporting period: August 31, 2016
| ITEM 1. | REPORTS TO STOCKHOLDERS. |
ANNUAL REPORT
August 31, 2016

MFS® BLENDED RESEARCH® EMERGING MARKETS EQUITY FUND

BRK-ANN
MFS® BLENDED RESEARCH® EMERGING MARKETS EQUITY FUND
CONTENTS
The report is prepared for the general information of shareholders.
It is authorized for distribution to prospective investors only when preceded or accompanied by a current prospectus.
NOT FDIC INSURED • MAY LOSE VALUE • NO BANK GUARANTEE

LETTER FROM THE CHAIRMAN
Dear Shareholders:
Despite the unexpected vote by the United Kingdom to leave the European Union, most markets proved resilient, with U.S. shares rallying to record highs during August.
Global interest rates remain very low, with most central banks maintaining extremely accommodative monetary policies to reinvigorate slow-growing economies against a backdrop of low inflation. This environment has favored risky assets such as equities, as investors are forced to accept greater risks in search of acceptable returns in a low-return environment. U.S. investment-grade and high-yield bonds have also benefited from low, and even negative, yields overseas.
China remains a source of concern for investors, as overcapacity in its manufacturing sector inhibits the government’s attempt to
change its domestic economy from one driven by exports to a consumer-driven model. Despite the slow-growth environment, emerging market equities have held up well, withstanding geopolitical shocks like an attempted coup in Turkey and impeachment proceedings against Brazil’s president. The U.S. Federal Reserve’s go-slow approach to rate hikes has also helped.
At MFS®, we believe it is best to view markets through a long lens and not react to short-term swings. That makes it possible to filter out market noise and focus on long-term fundamentals.
In our view, the professional guidance of a financial advisor, along with a patient, long-term approach, will help you reach your investment objectives.
Respectfully,

Robert J. Manning
Chairman
MFS Investment Management
October 17, 2016
The opinions expressed in this letter are subject to change and may not be relied upon for investment advice. No forecasts can be guaranteed.
1
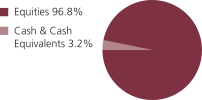
PORTFOLIO COMPOSITION
Portfolio structure
| | | | |
| Top ten holdings | | | | |
| Samsung Electronics Co. Ltd. | | | 5.2% | |
| Taiwan Semiconductor Manufacturing Co. Ltd. | | | 4.8% | |
| Alibaba Group Holding Ltd., ADR | | | 3.5% | |
| Tencent Holdings Ltd. | | | 2.9% | |
| China Construction Bank | | | 2.6% | |
| Industrial & Commercial Bank of China, “H” | | | 1.9% | |
| Hon Hai Precision Industry Co. Ltd. | | | 1.8% | |
| LUKOIL PJSC, ADR | | | 1.8% | |
| Sberbank of Russia, ADR | | | 1.7% | |
| Hyundai Motor Co. Ltd. | | | 1.5% | |
| | | | |
| Equity sectors | | | | |
| Financial Services | | | 25.6% | |
| Technology | | | 21.4% | |
| Utilities & Communications | | | 8.9% | |
| Energy | | | 6.3% | |
| Basic Materials | | | 5.9% | |
| Consumer Staples | | | 5.7% | |
| Autos & Housing | | | 5.2% | |
| Industrial Goods & Services | | | 4.4% | |
| Retailing | | | 3.9% | |
| Special Products & Services | | | 3.0% | |
| Health Care | | | 2.9% | |
| Transportation | | | 1.8% | |
| Leisure | | | 1.8% | |
|
| Issuer country weightings (x) | |
| China | | | 24.5% | |
| South Korea | | | 17.4% | |
| Taiwan | | | 11.3% | |
| Brazil | | | 7.6% | |
| South Africa | | | 5.2% | |
| India | | | 4.6% | |
| Russia | | | 4.4% | |
| Mexico | | | 3.8% | |
| United States | | | 3.6% | |
| Other Countries | | | 17.6% | |
2
Portfolio Composition – continued
| | | | |
| Currency exposure weightings (y) | |
| Hong Kong Dollar | | | 21.9% | |
| South Korean Won | | | 17.4% | |
| Taiwan Dollar | | | 11.3% | |
| Brazilian Real | | | 7.6% | |
| South African Rand | | | 5.2% | |
| Indian Rupee | | | 4.6% | |
| Russian Ruble | | | 4.4% | |
| United States Dollar | | | 4.4% | |
| Mexican Peso | | | 3.8% | |
| Other Currencies | | | 19.4% | |
| (x) | Represents the portfolio’s exposure to issuer countries as a percentage of a portfolio’s net assets. For purposes of this presentation, United States includes Cash & Cash Equivalents. |
| (y) | Represents the portfolio’s exposure to a particular currency as a percentage of a portfolio’s net assets. For purposes of this presentation, United States Dollar includes Cash & Cash Equivalents. |
Cash & Cash Equivalents includes any cash, investments in money market funds, short-term securities, and other assets less liabilities. Please see the Statement of Assets and Liabilities for additional information related to the fund’s cash position and other assets and liabilities.
Percentages are based on net assets as of 8/31/16.
The portfolio is actively managed and current holdings may be different.
3
MANAGEMENT REVIEW
Summary of Results
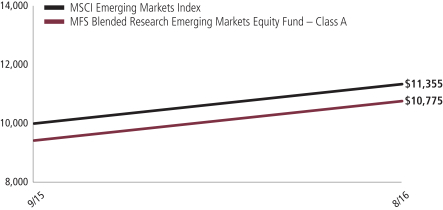
For the period September 15, 2015 through August 31, 2016, Class A shares of the MFS Blended Research Emerging Markets Equity Fund (“fund”) provided a total return of 14.33%, at net asset value. This compares with a return of 13.55% for the fund’s benchmark, the MSCI Emerging Markets Index.
Market Environment
Sluggish global growth weighed on both developed and emerging market (“EM”) economies during the reporting period. The US Federal Reserve began its long-anticipated monetary tightening cycle in the middle of the period, but the tightening cycle has proved to be more gradual than initially anticipated. Globally, central bank policy remained highly accommodative, which forced many government, and even some corporate, bond yields into negative territory. Near the end of the period, the United Kingdom voted to leave the European Union (“EU”), beginning a multi-year process of negotiation in order to achieve “Brexit”. While markets initially reacted to the vote with alarm, the spillover to European and EM was relatively short-lived (although risks of further hits to EU cohesiveness could re-emerge).
During the second half of the reporting period, US earnings headwinds expanded beyond the energy, materials and industrial sectors, to include most sectors of the market. The sharp rise in the US dollar also weighed on earnings early in the period, though dollar strength ebbed somewhat late in the period. US consumer spending held up well during the second half of the period amid a modest increase in real wages and falling gasoline prices. Demand for autos reached near-record territory before receding modestly late in the period, while the housing market continued its recovery. Slow global trade continued to mirror slow global growth, particularly for many EM countries. That said, EM countries began to show signs of a modest upturn in activity along with adjustment in their external accounts. These improved conditions appeared to have reassured investors and contributed to record inflows into the asset class during July and August as negative yields for an increasing share of developed market bonds drove yield-hungry investors further out on the risk spectrum. Similar investor inflows were experienced in the high grade and high yield corporate markets.
Contributors to Performance
Stock selection in the financial services sector was a major contributor to performance relative to the MSCI Emerging Markets Index. Within this sector, overweight positions in commercial banking firm Sberbank of Russia (Russia) and banking and financial services provider Banco do Brasil (Brazil), and not holding shares of poor-performing life insurance provider China Life Insurance (China), all aided relative returns. Shares of Sberbank appreciated during the reporting period as earnings convincingly beat market expectations driven mostly by a one-off gain on asset disposal and quarter-over-quarter margin improvement.
Favorable security selection in the technology sector also supported relative returns. An overweight position in contract semiconductor manufacturer Taiwan Semiconductor Manufacturing (Taiwan), and an underweight position in Chinese language internet
4
Management Review – continued
search provider Baidu.com, aided relative results. Shares of Taiwan Semiconductor Manufacturing rose as the company experienced robust demand from top customers.
Elsewhere, the fund’s out-of-benchmark holding of Chinese supermarket chain Wumart Stores, overweight positions in energy-based holding company Equatorial Energia (Brazil) and Brazilian steel producer Gerdau, and underweight positions in network information technology services provider MTN Group (h) (South Africa) and Latin American wireless communications company America Movil (h) (Mexico), strengthened relative performance. Shares of Equatorial Energia aided relative returns as the company reported solid operational figures and demand growth ahead of market estimates.
Detractors from Performance
Weak stock selection in the autos & housing sector hampered relative returns. Here, an overweight position in motor vehicles and parts manufacturer and distributor Hyundai Motor (South Korea) detracted value from relative performance. During the first half of the reporting period, the share price for Hyundai Motor came under pressure due to adverse sales conditions.
Elsewhere, overweight positions in telecommunications company XL Axiata (Indonesia), pulp and paper producer Fibria Celulose (Brazil), South Africa-based bank controlling company FirstRand, and mobile operator Advanced Info Service PCL (Thailand) weakened relative performance. An underweight position in internet gaming company Tencent Holdings (China), and not holding shares of strong-performing banking firm Banco Bradesco (Brazil) and oil and gas exploration and production company Petroleo Brasileiro (Brazil), also held back relative returns. Additionally, owning shares of marketing holding company ITC (b) (India) weighed on relative performance as the stock underperformed the benchmark over the reporting period.
The fund’s cash and/or cash equivalents position during the period was another detractor from relative performance. Under normal market conditions, the fund strives to be fully invested and generally holds cash to buy new holdings and to provide liquidity. In a period when equity markets rose, as measured by the fund’s benchmark, holding cash hindered performance versus the benchmark, which has no cash position.
Respectfully,
| | | | | | |
| James Fallon | | Matthew Krummell | | Jonathan Sage | | John Stocks |
| Portfolio Manager | | Portfolio Manager | | Portfolio Manager | | Portfolio Manager |
| (b) | Security is not a benchmark constituent. |
| (h) | Security was not held in the portfolio at period end. |
The views expressed in this report are those of the portfolio managers only through the end of the period of the report as stated on the cover and do not necessarily reflect the views of MFS or any other person in the MFS organization. These views are subject to change at any time based on market or other conditions, and MFS disclaims any responsibility to update such views. These views may not be relied upon as investment advice or an indication of trading intent on behalf of any MFS portfolio. References to specific securities are not recommendations of such securities, and may not be representative of any MFS portfolio’s current or future investments.
5
PERFORMANCE SUMMARY THROUGH 8/31/16
The following chart illustrates a representative class of the fund’s historical performance in comparison to its benchmark(s). Performance results include the deduction of the maximum applicable sales charge and reflect the percentage change in net asset value, including reinvestment of dividends and capital gains distributions. The performance of other share classes will be greater than or less than that of the class depicted below. Benchmarks are unmanaged and may not be invested in directly. Benchmark returns do not reflect sales charges, commissions or expenses. (See Notes to Performance Summary.)
Performance data shown represents past performance and is no guarantee of future results. Investment return and principal value fluctuate so your shares, when sold, may be worth more or less than the original cost; current performance may be lower or higher than quoted. The performance shown does not reflect the deduction of taxes, if any, that a shareholder would pay on fund distributions or the redemption of fund shares.
Growth of a Hypothetical $10,000 Investment (t)
6
Performance Summary – continued
Total Returns through 8/31/16
Average annual without sales charge
| | | | | | | | |
| | | Share Class | | Class Inception Date | | Life (t) | | |
| | | A | | 9/15/15 | | 14.33% | | |
| | | B | | 9/15/15 | | 13.46% | | |
| | | C | | 9/15/15 | | 13.48% | | |
| | | I | | 9/15/15 | | 14.51% | | |
| | | R1 | | 9/15/15 | | 13.46% | | |
| | | R2 | | 9/15/15 | | 14.04% | | |
| | | R3 | | 9/15/15 | | 14.22% | | |
| | | R4 | | 9/15/15 | | 14.51% | | |
| | | R6 (formerly Class R5) | | 9/15/15 | | 14.62% | | |
| Comparative benchmark | | | | |
| | | MSCI Emerging Markets Index (f) | | 13.55% | | |
| Average annual with sales charge | | | | |
| | | A
With Initial Sales Charge (5.75%) | | 7.75% | | |
| | | B
With CDSC (Declining over six years from 4% to 0%) (v) | | 9.46% | | |
| | | C
With CDSC (1% for 12 months) (v) | | 12.48% | | |
CDSC – Contingent Deferred Sales Charge.
Class I, R1, R2, R3, R4, and R6 shares do not have a sales charge.
Effective August 26, 2016, Class R5 shares were renamed Class R6 shares.
| (f) | Source: FactSet Research Systems Inc. |
| (t) | For the period from the class inception date through the stated period end. (See Notes to Performance Summary.) |
| (v) | Assuming redemption at the end of the applicable period. |
Benchmark Definition
MSCI Emerging Markets Index – a market capitalization-weighted index that is designed to measure equity market performance in the global emerging markets.
It is not possible to invest directly in an index.
Notes to Performance Summary
Average annual total return represents the average annual change in value for each share class for the periods presented. Life returns are presented where the share class has less than 10 years of performance history and represent the average annual total return from the class inception date to the stated period end date.
7
Performance Summary – continued
Performance results reflect any applicable expense subsidies and waivers in effect during the periods shown. Without such subsidies and waivers the fund’s performance results would be less favorable. Please see the prospectus and financial statements for complete details.
Performance results do not include adjustments made for financial reporting purposes in accordance with U.S. generally accepted accounting principles and may differ from amounts reported in the financial highlights.
From time to time the fund may receive proceeds from litigation settlements, without which performance would be lower.
8
EXPENSE TABLE
Fund expenses borne by the shareholders during the period, March 1, 2016 through August 31, 2016
As a shareholder of the fund, you incur two types of costs: (1) transaction costs, including sales charges (loads) on certain purchase or redemption payments, and (2) ongoing costs, including management fees; distribution and service (12b-1) fees; and other fund expenses. This example is intended to help you understand your ongoing costs (in dollars) of investing in the fund and to compare these costs with the ongoing costs of investing in other mutual funds.
The example is based on an investment of $1,000 invested at the beginning of the period and held for the entire period March 1, 2016 through August 31, 2016.
Actual Expenses
The first line for each share class in the following table provides information about actual account values and actual expenses. You may use the information in this line, together with the amount you invested, to estimate the expenses that you paid over the period. Simply divide your account value by $1,000 (for example, an $8,600 account value divided by $1,000 = 8.6), then multiply the result by the number in the first line under the heading entitled “Expenses Paid During Period” to estimate the expenses you paid on your account during this period.
Hypothetical Example for Comparison Purposes
The second line for each share class in the following table provides information about hypothetical account values and hypothetical expenses based on the fund’s actual expense ratio and an assumed rate of return of 5% per year before expenses, which is not the fund’s actual return. The hypothetical account values and expenses may not be used to estimate the actual ending account balance or expenses you paid for the period. You may use this information to compare the ongoing costs of investing in the fund and other funds. To do so, compare this 5% hypothetical example with the 5% hypothetical examples that appear in the shareholder reports of the other funds.
Please note that the expenses shown in the table are meant to highlight your ongoing costs only and do not reflect any transactional costs, such as sales charges (loads). Therefore, the second line for each share class in the table is useful in comparing ongoing costs only, and will not help you determine the relative total costs of owning different funds. In addition, if these transactional costs were included, your costs would have been higher.
9
Expense Table – continued
| | | | | | | | | | | | | | | | | | |
Share
Class | | | | Annualized
Expense Ratio | | | Beginning
Account Value
3/01/16 | | | Ending Account Value
8/31/16 | | | Expenses Paid During Period (p) 3/01/16-8/31/16 | |
| A | | Actual | | | 1.25% | | | | $1,000.00 | | | | $1,243.98 | | | | $7.05 | |
| | Hypothetical (h) | | | 1.25% | | | | $1,000.00 | | | | $1,018.85 | | | | $6.34 | |
| B | | Actual | | | 1.99% | | | | $1,000.00 | | | | $1,238.77 | | | | $11.20 | |
| | Hypothetical (h) | | | 1.99% | | | | $1,000.00 | | | | $1,015.13 | | | | $10.08 | |
| C | | Actual | | | 1.99% | | | | $1,000.00 | | | | $1,238.77 | | | | $11.20 | |
| | Hypothetical (h) | | | 1.99% | | | | $1,000.00 | | | | $1,015.13 | | | | $10.08 | |
| I | | Actual | | | 0.99% | | | | $1,000.00 | | | | $1,243.72 | | | | $5.58 | |
| | Hypothetical (h) | | | 0.99% | | | | $1,000.00 | | | | $1,020.16 | | | | $5.03 | |
| R1 | | Actual | | | 1.98% | | | | $1,000.00 | | | | $1,238.77 | | | | $11.14 | |
| | Hypothetical (h) | | | 1.98% | | | | $1,000.00 | | | | $1,015.18 | | | | $10.03 | |
| R2 | | Actual | | | 1.48% | | | | $1,000.00 | | | | $1,241.79 | | | | $8.34 | |
| | Hypothetical (h) | | | 1.48% | | | | $1,000.00 | | | | $1,017.70 | | | | $7.51 | |
| R3 | | Actual | | | 1.23% | | | | $1,000.00 | | | | $1,242.89 | | | | $6.93 | |
| | Hypothetical (h) | | | 1.23% | | | | $1,000.00 | | | | $1,018.95 | | | | $6.24 | |
| R4 | | Actual | | | 0.98% | | | | $1,000.00 | | | | $1,243.72 | | | | $5.53 | |
| | Hypothetical (h) | | | 0.98% | | | | $1,000.00 | | | | $1,020.21 | | | | $4.98 | |
| R6 (formerly Class R5) | | Actual | | | 0.93% | | | | $1,000.00 | | | | $1,244.81 | | | | $5.25 | |
| | Hypothetical (h) | | | 0.93% | | | | $1,000.00 | | | | $1,020.46 | | | | $4.72 | |
| (h) | 5% class return per year before expenses. |
| (p) | “Expenses Paid During Period” are equal to each class’s annualized expense ratio, as shown above, multiplied by the average account value over the period, multiplied by 184/366 (to reflect the one-half year period). Expenses paid do not include any applicable sales charges (loads). If these transaction costs had been included, your costs would have been higher. |
10
PORTFOLIO OF INVESTMENTS
8/31/16
The Portfolio of Investments is a complete list of all securities owned by your fund. It is categorized by broad-based asset classes.
| | | | | | | | |
| Common Stocks - 93.0% | | | | | | | | |
| Issuer | | Shares/Par | | | Value ($) | |
| Airlines - 0.8% | | | | | | | | |
| AirAsia Berhad | | | 89,900 | | | $ | 66,500 | |
| China Southern Airlines Co. Ltd., “H” | | | 48,000 | | | | 28,463 | |
| Zhejiang Expressway Co. Ltd., “H” | | | 18,000 | | | | 20,071 | |
| | | | | | | | |
| | | | $ | 115,034 | |
| Alcoholic Beverages - 1.1% | | | | | | | | |
| China Resources Enterprise Ltd. | | | 54,000 | | | $ | 124,601 | |
| Thai Beverage PLC | | | 39,700 | | | | 28,993 | |
| | | | | | | | |
| | | | $ | 153,594 | |
| Apparel Manufacturers - 1.4% | | | | | | | | |
| Arezzo Industria e Comercio S.A. | | | 6,200 | | | $ | 49,919 | |
| Formosa Taffeta Co. Ltd. | | | 30,000 | | | | 28,978 | |
| Li & Fung Ltd. | | | 84,000 | | | | 43,204 | |
| Pou Chen Corp. | | | 48,000 | | | | 69,586 | |
| | | | | | | | |
| | | | $ | 191,687 | |
| Automotive - 4.0% | | | | | | | | |
| Geely Automobile Holdings Ltd. | | | 60,000 | | | $ | 48,108 | |
| Great Wall Motor Co. Ltd. | | | 42,000 | | | | 40,768 | |
| Hyundai Mobis | | | 215 | | | | 50,231 | |
| Hyundai Motor Co. Ltd. | | | 1,754 | | | | 209,222 | |
| Kia Motors Corp. | | | 5,243 | | | | 197,259 | |
| | | | | | | | |
| | | | $ | 545,588 | |
| Business Services - 1.5% | | | | | | | | |
| Cognizant Technology Solutions Corp., “A” (a) | | | 891 | | | $ | 51,179 | |
| Infosys Technologies Ltd., ADR | | | 3,354 | | | | 53,194 | |
| TravelSky Technology Ltd. | | | 24,000 | | | | 52,223 | |
| WNS (Holdings) Ltd., ADR (a) | | | 1,611 | | | | 47,251 | |
| | | | | | | | |
| | | | $ | 203,847 | |
| Cable TV - 1.3% | | | | | | | | |
| Naspers Ltd. | | | 1,073 | | | $ | 175,598 | |
| | |
| Computer Software - Systems - 2.5% | | | | | | | | |
| Asustek Computer, Inc. | | | 12,000 | | | $ | 101,543 | |
| Hon Hai Precision Industry Co. Ltd. | | | 90,000 | | | | 249,602 | |
| | | | | | | | |
| | | | $ | 351,145 | |
11
Portfolio of Investments – continued
| | | | | | | | |
| Issuer | | Shares/Par | | | Value ($) | |
| Common Stocks - continued | | | | | | | | |
| Conglomerates - 0.3% | | | | | | | | |
| Alfa S.A de C.V., “A” | | | 26,275 | | | $ | 42,738 | |
| | |
| Construction - 1.1% | | | | | | | | |
| CEMEX S.A.B. de C.V. (a) | | | 119,560 | | | $ | 98,984 | |
| MRV Engenharia e Participacoes S.A. | | | 13,341 | | | | 50,816 | |
| | | | | | | | |
| | | | $ | 149,800 | |
| Consumer Products - 0.8% | | | | | | | | |
| LG Household & Health Care Ltd. | | | 137 | | | $ | 116,849 | |
| | |
| Consumer Services - 1.2% | | | | | | | | |
| China Maple Leaf Educational Systems | | | 48,000 | | | $ | 36,073 | |
| Kroton Educacional S.A. | | | 29,800 | | | | 127,350 | |
| | | | | | | | |
| | | | $ | 163,423 | |
| Electrical Equipment - 0.5% | | | | | | | | |
| Shanghai Electric Group Co. Ltd., “H” (a) | | | 168,000 | | | $ | 74,714 | |
| | |
| Electronics - 10.8% | | | | | | | | |
| Realtek Semiconductor Corp. | | | 9,000 | | | $ | 36,022 | |
| Samsung Electronics Co. Ltd. | | | 496 | | | | 720,646 | |
| SK Hynix, Inc. | | | 1,249 | | | | 40,831 | |
| Taiwan Semiconductor Manufacturing Co. Ltd. | | | 119,000 | | | | 660,059 | |
| Vanguard International Semiconductor Corp. | | | 18,000 | | | | 33,753 | |
| | | | | | | | |
| | | | $ | 1,491,311 | |
| Energy - Independent - 1.1% | | | | | | | | |
| CNOOC Ltd. | | | 96,000 | | | $ | 117,934 | |
| PTT Exploration & Production Ltd. | | | 17,000 | | | | 39,903 | |
| | | | | | | | |
| | | | $ | 157,837 | |
| Energy - Integrated - 4.1% | | | | | | | | |
| China Petroleum & Chemical Corp. | | | 268,000 | | | $ | 194,500 | |
| LUKOIL PJSC, ADR | | | 5,501 | | | | 246,720 | |
| OAO Gazprom, ADR | | | 31,318 | | | | 126,681 | |
| | | | | | | | |
| | | | $ | 567,901 | |
| Engineering - Construction - 2.4% | | | | | | | | |
| China Communications Construction Co. Ltd. | | | 57,000 | | | $ | 62,161 | |
| Hyundai Heavy Industries Co. Ltd. | | | 1,778 | | | | 74,389 | |
| Promotora y Operadora de Infraestructura S.A.B. de C.V. | | | 12,974 | | | | 155,826 | |
| Sinopec Engineering (Group) Co. Ltd. “H” | | | 54,000 | | | | 44,759 | |
| | | | | | | | |
| | | | $ | 337,135 | |
12
Portfolio of Investments – continued
| | | | | | | | |
| Issuer | | Shares/Par | | | Value ($) | |
| Common Stocks - continued | | | | | | | | |
| Food & Beverages - 1.2% | | | | | | | | |
| AVI Ltd. | | | 12,664 | | | $ | 76,663 | |
| Uni-President Enterprises Corp. | | | 45,000 | | | | 85,092 | |
| | | | | | | | |
| | | | $ | 161,755 | |
| Food & Drug Stores - 1.8% | | | | | | | | |
| Almacenes Exito S.A. | | | 6,214 | | | $ | 30,523 | |
| CP All PLC | | | 44,500 | | | | 80,026 | |
| Dairy Farm International Holdings Ltd. | | | 8,100 | | | | 58,077 | |
| Sun Art Retail Group Ltd. | | | 113,500 | | | | 73,008 | |
| | | | | | | | |
| | | | $ | 241,634 | |
| Forest & Paper Products - 0.8% | | | | | | | | |
| Fibria Celulose S.A. | | | 16,600 | | | $ | 113,144 | |
| | |
| Furniture & Appliances - 0.2% | | | | | | | | |
| Coway Co. Ltd. | | | 397 | | | $ | 29,695 | |
| | |
| Gaming & Lodging - 0.3% | | | | | | | | |
| Genting Berhad | | | 24,500 | | | $ | 47,121 | |
| | |
| Insurance - 4.0% | | | | | | | | |
| Cathay Financial Holding Co. Ltd. | | | 111,000 | | | $ | 140,278 | |
| Fubon Financial Holding Co. Ltd. | | | 36,000 | | | | 50,942 | |
| Korean Reinsurance Co. | | | 4,514 | | | | 48,379 | |
| Liberty Holdings Ltd. | | | 5,252 | | | | 40,285 | |
| PICC Property & Casualty Co. Ltd. | | | 72,000 | | | | 118,986 | |
| Samsung Fire & Marine Insurance Co. Ltd. | | | 445 | | | | 107,758 | |
| Shin Kong Financial Holding Co. Ltd. (a) | | | 206,000 | | | | 45,186 | |
| | | | | | | | |
| | | | $ | 551,814 | |
| Internet - 8.1% | | | | | | | | |
| Alibaba Group Holding Ltd., ADR (a) | | | 4,944 | | | $ | 480,507 | |
| Baidu, Inc., ADR (a) | | | 166 | | | | 28,398 | |
| NAVER Corp. | | | 275 | | | | 208,408 | |
| Tencent Holdings Ltd. | | | 15,500 | | | | 403,207 | |
| | | | | | | | |
| | | | $ | 1,120,520 | |
| Machinery & Tools - 1.4% | | | | | | | | |
| China Infrastructure Machinery Holdings Ltd. | | | 185,000 | | | $ | 30,048 | |
| Far Eastern New Century Corp. | | | 87,000 | | | | 64,159 | |
| Hyundai Mipo Dockyard Co. Ltd. (a) | | | 595 | | | | 40,663 | |
| Weichai Power Co. Ltd., “H” | | | 51,000 | | | | 64,362 | |
| | | | | | | | |
| | | | $ | 199,232 | |
13
Portfolio of Investments – continued
| | | | | | | | |
| Issuer | | Shares/Par | | | Value ($) | |
| Common Stocks - continued | | | | | | | | |
| Major Banks - 4.6% | | | | | | | | |
| Banco do Brasil S.A. | | | 17,200 | | | $ | 123,626 | |
| Bank of China Ltd. | | | 326,000 | | | | 146,662 | |
| BOC Hong Kong Holdings Ltd. | | | 27,000 | | | | 94,495 | |
| Industrial & Commercial Bank of China, “H” | | | 421,000 | | | | 267,550 | |
| | | | | | | | |
| | | | $ | 632,333 | |
| Medical & Health Technology & Services - 0.4% | | | | | | | | |
| Sinopharm Group Co. Ltd., “H” | | | 12,000 | | | $ | 61,488 | |
| | |
| Medical Equipment - 0.5% | | | | | | | | |
| Top Glove Corp. | | | 61,200 | | | $ | 64,135 | |
| | |
| Metals & Mining - 1.9% | | | | | | | | |
| Gerdau S.A., ADR | | | 36,089 | | | $ | 99,606 | |
| Grupo Mexico S.A.B. de C.V., “B” | | | 28,627 | | | | 71,634 | |
| POSCO | | | 436 | | | | 90,328 | |
| | | | | | | | |
| | | | $ | 261,568 | |
| Other Banks & Diversified Financials - 12.8% | | | | | | | | |
| Agricultural Bank of China Ltd., “H” | | | 140,000 | | | $ | 57,570 | |
| Banco Santander S.A., IEU | | | 12,996 | | | | 91,276 | |
| Bangkok Bank Public Co. Ltd. | | | 9,000 | | | | 44,070 | |
| Bank of Communications Co. Ltd. | | | 48,000 | | | | 37,063 | |
| China Construction Bank | | | 484,000 | | | | 361,867 | |
| China Merchants Bank Co. Ltd. | | | 15,000 | | | | 36,506 | |
| China Minsheng Banking Corp. Ltd. | | | 46,500 | | | | 49,991 | |
| Chongqing Rural Commercial Bank Co. Ltd., “H” | | | 39,000 | | | | 22,623 | |
| Credicorp Ltd. | | | 375 | | | | 58,755 | |
| First Gulf Bank PJSC | | | 12,440 | | | | 39,625 | |
| FirstRand Ltd. | | | 38,232 | | | | 114,602 | |
| Hana Financial Group, Inc. | | | 1,792 | | | | 47,090 | |
| Itau Unibanco Holding S.A., ADR | | | 13,719 | | | | 152,007 | |
| OTP Bank PLC | | | 2,051 | | | | 53,577 | |
| Sberbank of Russia, ADR | | | 25,783 | | | | 236,430 | |
| Shinhan Financial Group Co. Ltd. | | | 1,996 | | | | 73,396 | |
| Turkiye Garanti Bankasi A.S. | | | 27,898 | | | | 71,975 | |
| Turkiye Is Bankasi A.S., “C” | | | 98,709 | | | | 160,540 | |
| Turkiye Sinai Kalkinma Bankasi A.S. | | | 76,827 | | | | 35,329 | |
| Union National Bank | | | 27,996 | | | | 31,936 | |
| | | | | | | | |
| | | | $ | 1,776,228 | |
| Pharmaceuticals - 2.0% | | | | | | | | |
| Gedeon Richter PLC | | | 4,559 | | | $ | 93,524 | |
| Genomma Lab Internacional S.A., “B” (a) | | | 107,044 | | | | 120,097 | |
14
Portfolio of Investments – continued
| | | | | | | | |
| Issuer | | Shares/Par | | | Value ($) | |
| Common Stocks - continued | | | | | | | | |
| Pharmaceuticals - continued | | | | | | | | |
| Shanghai Pharmaceuticals Holding Co. Ltd., “H” | | | 21,500 | | | $ | 59,033 | |
| | | | | | | | |
| | | | $ | 272,654 | |
| Precious Metals & Minerals - 0.6% | | | | | | | | |
| Anglogold Ashanti Ltd. (a) | | | 3,815 | | | $ | 62,220 | |
| Gold Fields Ltd., ADR | | | 3,609 | | | | 18,153 | |
| | | | | | | | |
| | | | $ | 80,373 | |
| Real Estate - 3.7% | | | | | | | | |
| Aldar Properties PJSC | | | 169,528 | | | $ | 127,385 | |
| Atrium European Real Estate Ltd. | | | 18,731 | | | | 81,903 | |
| Fibra Uno Administracion S.A. | | | 20,708 | | | | 40,036 | |
| Guangzhou R&F Properties Co. Ltd., “H” | | | 47,600 | | | | 80,381 | |
| Metro Pacific Investments Corp. | | | 480,400 | | | | 71,346 | |
| Resilient REIT Ltd. | | | 7,711 | | | | 61,889 | |
| SM Prime Holdings, Inc. | | | 80,728 | | | | 51,717 | |
| | | | | | | | |
| | | | $ | 514,657 | |
| Specialty Chemicals - 2.6% | | | | | | | | |
| Cosan S.A. Industria e Comercio | | | 5,795 | | | $ | 67,511 | |
| LG Chem Ltd. | | | 499 | | | | 121,058 | |
| PTT Global Chemical PLC | | | 98,300 | | | | 173,226 | |
| | | | | | | | |
| | | | $ | 361,795 | |
| Specialty Stores - 0.8% | | | | | | | | |
| Cencosud S.A. | | | 24,258 | | | $ | 71,192 | |
| CJ Home Shopping | | | 272 | | | | 38,641 | |
| | | | | | | | |
| | | | $ | 109,833 | |
| Telecommunications - Wireless - 1.8% | | | | | | | | |
| Advanced Info Service PLC | | | 23,600 | | | $ | 112,834 | |
| China Mobile Ltd. | | | 10,500 | | | | 129,667 | |
| | | | | | | | |
| | | | $ | 242,501 | |
| Telephone Services - 3.6% | | | | | | | | |
| China Unicom (Hong Kong) Ltd. | | | 36,000 | | | $ | 40,791 | |
| Hellenic Telecommunications Organization S.A. | | | 9,316 | | | | 88,328 | |
| KT Corp., ADR | | | 3,369 | | | | 52,321 | |
| PT Telekomunikasi Indonesia | | | 482,500 | | | | 153,134 | |
| PT XL Axiata Tbk (a) | | | 586,250 | | | | 125,515 | |
| Telkom S.A. Ltd. | | | 7,594 | | | | 31,405 | |
| | | | | | | | |
| | | | $ | 491,494 | |
15
Portfolio of Investments – continued
| | | | | | | | |
| Issuer | | Shares/Par | | | Value ($) | |
| Common Stocks - continued | | | | | | | | |
| Tobacco - 1.4% | | | | | | | | |
| British American Tobacco | | | 4,200 | | | $ | 50,974 | |
| PT Gudang Garam Tbk | | | 28,500 | | | | 138,364 | |
| | | | | | | | |
| | | | $ | 189,338 | |
| Trucking - 1.0% | | | | | | | | |
| Emergent Capital, Inc. | | | 12,944 | | | $ | 138,861 | |
| | |
| Utilities - Electric Power - 2.6% | | | | | | | | |
| Equatorial Energia S.A. | | | 3,700 | | | $ | 57,943 | |
| Korea Electric Power Corp. | | | 2,659 | | | | 138,316 | |
| Tenaga Nasional Berhad | | | 12,000 | | | | 43,615 | |
| Terna Participacoes S.A., IEU | | | 16,296 | | | | 117,078 | |
| | | | | | | | |
| | | | $ | 356,952 | |
| Total Common Stocks (Identified Cost, $12,466,663) | | | $ | 12,857,326 | |
| | | | | | | | | | | | |
| | | |
| | | First Exercise | | | | | | | |
| Warrants - 3.8% | | | | | | | | | | | | |
| Cable TV - 0.1% | | | | | | | | | | | | |
| Merrill Lynch International & Co. (Dish TV India Ltd. - Zero Strike Warrant (1 share for 1 warrant)) (a)(n) | | | 5/23/18 | | | | 13,929 | | | $ | 20,476 | |
| | | |
| Energy - Independent - 1.0% | | | | | | | | | | | | |
| Merrill Lynch International & Co. (Coal India Ltd. - Zero Strike Warrant (1 share for 1 warrant)) (a)(n) | | | 5/13/19 | | | | 12,867 | | | $ | 64,226 | |
| Merrill Lynch International & Co. (Hindustan Petroleum Corp. - Zero Strike Warrant (1 share for 1 warrant)) (a)(n) | | | 11/12/19 | | | | 4,203 | | | | 76,437 | |
| | | | | | | | | | | | |
| | | | | | | | | | | $ | 140,663 | |
| Other Banks & Diversified Financials - 0.4% | | | | | | | | | | | | |
| Merrill Lynch International & Co. (Housing Development Finance Corp. Ltd. - Zero Strike Warrant (1 share for 1 warrant)) (a)(n) | | | 10/28/15 | | | | 1,891 | | | $ | 39,749 | |
| Merrill Lynch International & Co. (Rural Electrification Corp. - Zero Strike Warrant (1 share for 1 warrant)) (a)(n) | | | 12/21/18 | | | | 5,868 | | | | 20,877 | |
| | | | | | | | | | | | |
| | | | | | | | | | | $ | 60,626 | |
| Telecommunications - Wireless - 1.0% | | | | | | | | | | | | |
| Merrill Lynch International & Co. (Bharti Airtel Ltd. - Zero Strike Warrant (1 share for 1 warrant)) (a) | | | 5/29/18 | | | | 27,873 | | | $ | 137,971 | |
16
Portfolio of Investments – continued
| | | | | | | | | | | | |
| | | |
| Issuer | | First Exercise | | | Shares/Par | | | Value ($) | |
| Warrants - continued | | | | | | | | | | | | |
| Tobacco - 1.3% | | | | | | | | | | | | |
| Merrill Lynch International & Co. (ITC Ltd. - Zero Strike Warrant (1 share for 1 warrant)) (a)(n) | | | 5/22/18 | | | | 44,947 | | | $ | 174,394 | |
| Total Warrants (Identified Cost, $519,077) | | | | | | | $ | 534,130 | |
| | | |
| Money Market Funds - 4.3% | | | | | | | | | | | | |
MFS Institutional Money Market Portfolio, 0.38% (v)
(Identified Cost, $591,481) | | | | 591,481 | | | $ | 591,481 | |
| Total Investments (Identified Cost, $13,577,221) | | | | | | | $ | 13,982,937 | |
| | | |
| Other Assets, Less Liabilities - (1.1)% | | | | | | | | | | | (152,594 | ) |
| Net Assets - 100.0% | | | | | | | | | | $ | 13,830,343 | |
| (a) | Non-income producing security. |
| (n) | Securities exempt from registration under Rule 144A of the Securities Act of 1933. These securities may be sold in the ordinary course of business in transactions exempt from registration, normally to qualified institutional buyers. At period end, the aggregate value of these securities was $396,159, representing 2.9% of net assets. |
| (v) | Underlying affiliated fund that is available only to investment companies managed by MFS. The rate quoted for the MFS Institutional Money Market Portfolio is the annualized seven-day yield of the fund at period end. |
The following abbreviations are used in this report and are defined:
| ADR | | American Depositary Receipt |
| IEU | | International Equity Unit |
| PJSC | | Public Joint Stock Company |
| PLC | | Public Limited Company |
| REIT | | Real Estate Investment Trust |
See Notes to Financial Statements
17
Financial Statements
STATEMENT OF ASSETS AND LIABILITIES
At 8/31/16
This statement represents your fund’s balance sheet, which details the assets and liabilities comprising the total value of the fund.
| | | | |
| Assets | | | | |
Investments | | | | |
Non-affiliated issuers, at value (identified cost, $12,985,740) | | | $13,391,456 | |
Underlying affiliated funds, at value (identified cost, $591,481) | | | 591,481 | |
Total investments, at value (identified cost, $13,577,221) | | | $13,982,937 | |
Foreign currency, at value (identified cost, $1,728) | | | 1,728 | |
Receivables for | | | | |
Fund shares sold | | | 62,697 | |
Dividends | | | 5,901 | |
Receivable from investment adviser | | | 45,849 | |
Other assets | | | 31 | |
Total assets | | | $14,099,143 | |
| Liabilities | | | | |
Payable to custodian | | | $39,906 | |
Payables for | | | | |
Investments purchased | | | 124,308 | |
Fund shares reacquired | | | 10,792 | |
Payable to affiliates | | | | |
Shareholder servicing costs | | | 314 | |
Distribution and service fees | | | 28 | |
Payable for independent Trustees’ compensation | | | 14 | |
Deferred country tax expense payable | | | 2,198 | |
Accrued expenses and other liabilities | | | 91,240 | |
Total liabilities | | | $268,800 | |
Net assets | | | $13,830,343 | |
| Net assets consist of | | | | |
Paid-in capital | | | $13,361,610 | |
Unrealized appreciation (depreciation) on investments and translation of assets and liabilities in foreign currencies (net of $2,198 deferred country tax) | | | 403,605 | |
Accumulated net realized gain (loss) on investments and foreign currency | | | 5,328 | |
Undistributed net investment income | | | 59,800 | |
Net assets | | | $13,830,343 | |
Shares of beneficial interest outstanding | | | 1,214,767 | |
18
Statement of Assets and Liabilities – continued
| | | | | | | | | | | | |
| | | Net assets | | | Shares outstanding | | | Net asset value per share (a) | |
Class A | | | $957,193 | | | | 84,212 | | | | $11.37 | |
Class B | | | 86,495 | | | | 7,647 | | | | 11.31 | |
Class C | | | 91,469 | | | | 8,090 | | | | 11.31 | |
Class I | | | 436,121 | | | | 38,308 | | | | 11.38 | |
Class R1 | | | 56,729 | | | | 5,016 | | | | 11.31 | |
Class R2 | | | 57,003 | | | | 5,024 | | | | 11.35 | |
Class R3 | | | 57,140 | | | | 5,027 | | | | 11.37 | |
Class R4 | | | 57,278 | | | | 5,031 | | | | 11.38 | |
Class R6 (formerly Class R5) | | | 12,030,915 | | | | 1,056,412 | | | | 11.39 | |
| (a) | Maximum offering price per share was equal to the net asset value per share for all share classes, except for Class A, for which the maximum offering price per share was $12.06 [100 / 94.25 x $11.37]. On sales of $50,000 or more, the maximum offering price of Class A shares is reduced. A contingent deferred sales charge may be imposed on redemptions of Class A, Class B, and Class C shares. Redemption price per share was equal to the net asset value per share for Classes I, R1, R2, R3, R4, and R6. |
See Notes to Financial Statements
19
Financial Statements
STATEMENT OF OPERATIONS
Period ended 8/31/16 (c)
This statement describes how much your fund earned in investment income and accrued in expenses. It also describes any gains and/or losses generated by fund operations.
| | | | |
| Net investment income | | | | |
Income | | | | |
Dividends | | | $106,993 | |
Dividends from underlying affiliated funds | | | 368 | |
Foreign taxes withheld | | | (12,526 | ) |
Total investment income | | | $94,835 | |
Expenses | | | | |
Management fee | | | $26,585 | |
Distribution and service fees | | | 2,872 | |
Shareholder servicing costs | | | 1,181 | |
Administrative services fee | | | 16,829 | |
Independent Trustees’ compensation | | | 838 | |
Custodian fee | | | 52,478 | |
Shareholder communications | | | 5,610 | |
Audit and tax fees | | | 40,565 | |
Legal fees | | | 1,471 | |
Registration fees | | | 78,284 | |
Miscellaneous | | | 15,187 | |
Total expenses | | | $241,900 | |
Fees paid indirectly | | | (11 | ) |
Reduction of expenses by investment adviser | | | (205,314 | ) |
Net expenses | | | $36,575 | |
Net investment income | | | $58,260 | |
| Realized and unrealized gain (loss) on investments and foreign currency | |
Realized gain (loss) (identified cost basis) | | | | |
Investments | | | $18,508 | |
Foreign currency | | | 5,967 | |
Net realized gain (loss) on investments and foreign currency | | | $24,475 | |
Change in unrealized appreciation (depreciation) | | | | |
Investments (net of $2,198 increase in deferred country tax) | | | $403,518 | |
Translation of assets and liabilities in foreign currencies | | | 87 | |
Net unrealized gain (loss) on investments and foreign currency translation | | | $403,605 | |
Net realized and unrealized gain (loss) on investments and foreign currency | | | $428,080 | |
Change in net assets from operations | | | $486,340 | |
| (c) | For the period from the commencement of the fund’s investment operations, September 15, 2015, through the stated period end. |
See Notes to Financial Statements
20
Financial Statements
STATEMENT OF CHANGES IN NET ASSETS
This statement describes the increases and/or decreases in net assets resulting from operations, any distributions, and any shareholder transactions.
| | | | |
| | | Period ended
8/31/16 (c) | |
| Change in net assets | | | |
| From operations | | | | |
Net investment income | | | $58,260 | |
Net realized gain (loss) on investments and foreign currency | | | 24,475 | |
Net unrealized gain (loss) on investments and foreign currency translation | | | 403,605 | |
Change in net assets from operations | | | $486,340 | |
| Distributions declared to shareholders | | | | |
From net investment income | | | $(15,000 | ) |
From net realized gain on investments | | | (3,100 | ) |
Total distributions declared to shareholders | | | $(18,100 | ) |
Change in net assets from fund share transactions | | | $13,362,103 | |
Total change in net assets | | | $13,830,343 | |
| Net assets | | | | |
At beginning of period | | | — | |
At end of period (including undistributed net investment income of $59,800) | | | $13,830,343 | |
| (c) | For the period from the commencement of the fund’s investment operations, September 15, 2015, through the stated period end. |
See Notes to Financial Statements
21
Financial Statements
FINANCIAL HIGHLIGHTS
The financial highlights table is intended to help you understand the fund’s financial performance for the past 5 years (or life of a particular share class, if shorter). Certain information reflects financial results for a single fund share. The total returns in the table represent the rate by which an investor would have earned (or lost) on an investment in the fund share class (assuming reinvestment of all distributions) held for the entire period.
| | | | |
| Class A | | Period ended
8/31/16 (c) | |
Net asset value, beginning of period | | | $10.00 | |
| Income (loss) from investment operations | | | | |
Net investment income (d) | | | $0.24 | |
Net realized and unrealized gain (loss) on investments and foreign currency | | | 1.18 | |
Total from investment operations | | | $1.42 | |
| Less distributions declared to shareholders | | | | |
From net investment income | | | $(0.04 | ) |
From net realized gain on investments | | | (0.01 | ) |
Total distributions declared to shareholders | | | $(0.05 | ) |
Net asset value, end of period (x) | | | $11.37 | |
Total return (%) (r)(s)(t)(x) | | | 14.33 | (n) |
Ratios (%) (to average net assets)
and Supplemental data: | | | | |
Expenses before expense reductions (f) | | | 6.30 | (a) |
Expenses after expense reductions (f) | | | 1.24 | (a) |
Net investment income | | | 2.36 | (a) |
Portfolio turnover | | | 64 | (n) |
Net assets at end of period (000 omitted) | | | $957 | |
See Notes to Financial Statements
22
Financial Highlights – continued
| | | | |
| Class B | | Period ended
8/31/16 (c) | |
Net asset value, beginning of period | | | $10.00 | |
| Income (loss) from investment operations | | | | |
Net investment income (d) | | | $0.09 | |
Net realized and unrealized gain (loss) on investments and foreign currency | | | 1.25 | |
Total from investment operations | | | $1.34 | |
| Less distributions declared to shareholders | | | | |
From net investment income | | | $(0.02 | ) |
From net realized gain on investments | | | (0.01 | ) |
Total distributions declared to shareholders | | | $(0.03 | ) |
Net asset value, end of period (x) | | | $11.31 | |
Total return (%) (r)(s)(t)(x) | | | 13.46 | (n) |
Ratios (%) (to average net assets)
and Supplemental data: | | | | |
Expenses before expense reductions (f) | | | 7.64 | (a) |
Expenses after expense reductions (f) | | | 1.98 | (a) |
Net investment income | | | 0.93 | (a) |
Portfolio turnover | | | 64 | (n) |
Net assets at end of period (000 omitted) | | | $86 | |
| |
| Class C | | Period ended
8/31/16 (c) | |
Net asset value, beginning of period | | | $10.00 | |
| Income (loss) from investment operations | | | | |
Net investment income (d) | | | $0.09 | |
Net realized and unrealized gain (loss) on investments and foreign currency | | | 1.25 | |
Total from investment operations | | | $1.34 | |
| Less distributions declared to shareholders | | | | |
From net investment income | | | $(0.02 | ) |
From net realized gain on investments | | | (0.01 | ) |
Total distributions declared to shareholders | | | $(0.03 | ) |
Net asset value, end of period (x) | | | $11.31 | |
Total return (%) (r)(s)(t)(x) | | | 13.48 | (n) |
Ratios (%) (to average net assets)
and Supplemental data: | | | | |
Expenses before expense reductions (f) | | | 7.63 | (a) |
Expenses after expense reductions (f) | | | 1.98 | (a) |
Net investment income | | | 0.95 | (a) |
Portfolio turnover | | | 64 | (n) |
Net assets at end of period (000 omitted) | | | $91 | |
See Notes to Financial Statements
23
Financial Highlights – continued
| | | | |
| Class I | | Period ended
8/31/16 (c) | |
Net asset value, beginning of period | | | $10.00 | |
| Income (loss) from investment operations | | | | |
Net investment income (d) | | | $0.23 | |
Net realized and unrealized gain (loss) on investments and foreign currency | | | 1.21 | |
Total from investment operations | | | $1.44 | |
| Less distributions declared to shareholders | | | | |
From net investment income | | | $(0.05 | ) |
From net realized gain on investments | | | (0.01 | ) |
Total distributions declared to shareholders | | | $(0.06 | ) |
Net asset value, end of period (x) | | | $11.38 | |
Total return (%) (r)(s)(x) | | | 14.51 | (n) |
Ratios (%) (to average net assets)
and Supplemental data: | | | | |
Expenses before expense reductions (f) | | | 6.27 | (a) |
Expenses after expense reductions (f) | | | 0.99 | (a) |
Net investment income | | | 2.27 | (a) |
Portfolio turnover | | | 64 | (n) |
Net assets at end of period (000 omitted) | | | $436 | |
| |
| Class R1 | | Period ended
8/31/16 (c) | |
Net asset value, beginning of period | | | $10.00 | |
| Income (loss) from investment operations | | | | |
Net investment income (d) | | | $0.07 | |
Net realized and unrealized gain (loss) on investments and foreign currency | | | 1.27 | |
Total from investment operations | | | $1.34 | |
| Less distributions declared to shareholders | | | | |
From net investment income | | | $(0.02 | ) |
From net realized gain on investments | | | (0.01 | ) |
Total distributions declared to shareholders | | | $(0.03 | ) |
Net asset value, end of period (x) | | | $11.31 | |
Total return (%) (r)(s)(x) | | | 13.46 | (n) |
Ratios (%) (to average net assets)
and Supplemental data: | | | | |
Expenses before expense reductions (f) | | | 7.86 | (a) |
Expenses after expense reductions (f) | | | 1.97 | (a) |
Net investment income | | | 0.69 | (a) |
Portfolio turnover | | | 64 | (n) |
Net assets at end of period (000 omitted) | | | $57 | |
See Notes to Financial Statements
24
Financial Highlights – continued
| | | | |
| Class R2 | | Period ended
8/31/16 (c) | |
Net asset value, beginning of period | | | $10.00 | |
| Income (loss) from investment operations | | | | |
Net investment income (d) | | | $0.12 | |
Net realized and unrealized gain (loss) on investments and foreign currency | | | 1.28 | |
Total from investment operations | | | $1.40 | |
| Less distributions declared to shareholders | | | | |
From net investment income | | | $(0.04 | ) |
From net realized gain on investments | | | (0.01 | ) |
Total distributions declared to shareholders | | | $(0.05 | ) |
Net asset value, end of period (x) | | | $11.35 | |
Total return (%) (r)(s)(x) | | | 14.04 | (n) |
Ratios (%) (to average net assets)
and Supplemental data: | | | | |
Expenses before expense reductions (f) | | | 7.36 | (a) |
Expenses after expense reductions (f) | | | 1.47 | (a) |
Net investment income | | | 1.19 | (a) |
Portfolio turnover | | | 64 | (n) |
Net assets at end of period (000 omitted) | | | $57 | |
| |
| Class R3 | | Period ended
8/31/16 (c) | |
Net asset value, beginning of period | | | $10.00 | |
| Income (loss) from investment operations | | | | |
Net investment income (d) | | | $0.14 | |
Net realized and unrealized gain (loss) on investments and foreign currency | | | 1.28 | |
Total from investment operations | | | $1.42 | |
| Less distributions declared to shareholders | | | | |
From net investment income | | | $(0.04 | ) |
From net realized gain on investments | | | (0.01 | ) |
Total distributions declared to shareholders | | | $(0.05 | ) |
Net asset value, end of period (x) | | | $11.37 | |
Total return (%) (r)(s)(x) | | | 14.32 | (n) |
Ratios (%) (to average net assets)
and Supplemental data: | | | | |
Expenses before expense reductions (f) | | | 7.11 | (a) |
Expenses after expense reductions (f) | | | 1.22 | (a) |
Net investment income | | | 1.44 | (a) |
Portfolio turnover | | | 64 | (n) |
Net assets at end of period (000 omitted) | | | $57 | |
See Notes to Financial Statements
25
Financial Highlights – continued
| | | | |
| Class R4 | | Period ended
8/31/16 (c) | |
Net asset value, beginning of period | | | $10.00 | |
| Income (loss) from investment operations | | | | |
Net investment income (d) | | | $0.17 | |
Net realized and unrealized gain (loss) on investments and foreign currency | | | 1.27 | |
Total from investment operations | | | $1.44 | |
| Less distributions declared to shareholders | | | | |
From net investment income | | | $(0.05 | ) |
From net realized gain on investments | | | (0.01 | ) |
Total distributions declared to shareholders | | | $(0.06 | ) |
Net asset value, end of period (x) | | | $11.38 | |
Total return (%) (r)(s)(x) | | | 14.51 | (n) |
Ratios (%) (to average net assets)
and Supplemental data: | | | | |
Expenses before expense reductions (f) | | | 6.86 | (a) |
Expenses after expense reductions (f) | | | 0.97 | (a) |
Net investment income | | | 1.69 | (a) |
Portfolio turnover | | | 64 | (n) |
Net assets at end of period (000 omitted) | | | $57 | |
| |
| Class R6 (formerly Class R5) | | Period ended
8/31/16 (c) | |
Net asset value, beginning of period | | | $10.00 | |
| Income (loss) from investment operations | | | | |
Net investment income (d) | | | $0.16 | |
Net realized and unrealized gain (loss) on investments and foreign currency | | | 1.29 | |
Total from investment operations | | | $1.45 | |
| Less distributions declared to shareholders | | | | |
From net investment income | | | $(0.05 | ) |
From net realized gain on investments | | | (0.01 | ) |
Total distributions declared to shareholders | | | $(0.06 | ) |
Net asset value, end of period (x) | | | $11.39 | |
Total return (%) (r)(s)(x) | | | 14.62 | (n) |
Ratios (%) (to average net assets)
and Supplemental data: | | | | |
Expenses before expense reductions (f) | | | 6.84 | (a) |
Expenses after expense reductions (f) | | | 0.94 | (a) |
Net investment income | | | 1.59 | (a) |
Portfolio turnover | | | 64 | (n) |
Net assets at end of period (000 omitted) | | | $12,031 | |
See Notes to Financial Statements
26
Financial Highlights – continued
| (c) | For the period from the commencement of the fund’s investment operations, September 15, 2015, through the stated period end. |
| (d) | Per share data is based on average shares outstanding. |
| (f) | Ratios do not reflect reductions from fees paid indirectly, if applicable. |
| (r) | Certain expenses have been reduced without which performance would have been lower. |
| (s) | From time to time the fund may receive proceeds from litigation settlements, without which performance would be lower. |
| (t) | Total returns do not include any applicable sales charges. |
| (x) | The net asset values and total returns have been calculated on net assets which include adjustments made in accordance with U.S. generally accepted accounting principles required at period end for financial reporting purposes. |
See Notes to Financial Statements
27
NOTES TO FINANCIAL STATEMENTS
(1) Business and Organization
MFS Blended Research Emerging Markets Equity Fund (the fund) is a diversified series of MFS Series Trust IV (the trust). The trust is organized as a Massachusetts business trust and is registered under the Investment Company Act of 1940, as amended, as an open-end management investment company.
The fund is an investment company and accordingly follows the investment company accounting and reporting guidance of the Financial Accounting Standards Board (FASB) Accounting Standards Codification Topic 946 Financial Services – Investment Companies.
(2) Significant Accounting Policies
General – The preparation of financial statements in conformity with U.S. generally accepted accounting principles requires management to make estimates and assumptions that affect the reported amounts of assets and liabilities, and disclosure of contingent assets and liabilities at the date of the financial statements and the reported amounts of increases and decreases in net assets from operations during the reporting period. Actual results could differ from those estimates. In the preparation of these financial statements, management has evaluated subsequent events occurring after the date of the fund’s Statement of Assets and Liabilities through the date that the financial statements were issued. The fund invests in foreign securities, including securities of emerging market issuers. Investments in foreign securities are vulnerable to the effects of changes in the relative values of the local currency and the U.S. dollar and to the effects of changes in each country’s legal, political, and economic environment. The markets of emerging markets countries are generally more volatile than the markets of developed countries with more mature economies. All of the risks of investing in foreign securities previously described are heightened when investing in emerging markets countries.
Balance Sheet Offsetting – The fund’s accounting policy with respect to balance sheet offsetting is that, absent an event of default by the counterparty or a termination of the agreement, the International Swaps and Derivatives Association (ISDA) Master Agreement does not result in an offset of reported amounts of financial assets and financial liabilities in the Statement of Assets and Liabilities across transactions between the fund and the applicable counterparty. The fund’s right to setoff may be restricted or prohibited by the bankruptcy or insolvency laws of the particular jurisdiction to which a specific master netting agreement counterparty is subject. Balance sheet offsetting disclosures, to the extent applicable to the fund, have been included in the fund’s Significant Accounting Policies note under the captions for each of the fund’s in-scope financial instruments and transactions.
Investment Valuations – Equity securities, including restricted equity securities, are generally valued at the last sale or official closing price on their primary market or exchange as provided by a third-party pricing service. Equity securities, for which there were no sales reported that day, are generally valued at the last quoted daily bid quotation on their primary market or exchange as provided by a third-party pricing service. Short-term instruments with a maturity at issuance of 60 days or less may be
28
Notes to Financial Statements – continued
valued at amortized cost, which approximates market value. Open-end investment companies are generally valued at net asset value per share. Securities and other assets generally valued on the basis of information from a third-party pricing service may also be valued at a broker/dealer bid quotation. Values obtained from third-party pricing services can utilize both transaction data and market information such as yield, quality, coupon rate, maturity, type of issue, trading characteristics, and other market data. The values of foreign securities and other assets and liabilities expressed in foreign currencies are converted to U.S. dollars using the mean of bid and asked prices for rates provided by a third-party pricing service.
The Board of Trustees has delegated primary responsibility for determining or causing to be determined the value of the fund’s investments (including any fair valuation) to the adviser pursuant to valuation policies and procedures approved by the Board. If the adviser determines that reliable market quotations are not readily available, investments are valued at fair value as determined in good faith by the adviser in accordance with such procedures under the oversight of the Board of Trustees. Under the fund’s valuation policies and procedures, market quotations are not considered to be readily available for most types of debt instruments and floating rate loans and many types of derivatives. These investments are generally valued at fair value based on information from third-party pricing services. In addition, investments may be valued at fair value if the adviser determines that an investment’s value has been materially affected by events occurring after the close of the exchange or market on which the investment is principally traded (such as foreign exchange or market) and prior to the determination of the fund’s net asset value, or after the halting of trading of a specific security where trading does not resume prior to the close of the exchange or market on which the security is principally traded. Events that occur on a frequent basis after foreign markets close (such as developments in foreign markets and significant movements in the U.S. markets) and prior to the determination of the fund’s net asset value may be deemed to have a material effect on the value of securities traded in foreign markets. Accordingly, the fund’s foreign equity securities may often be valued at fair value. The adviser generally relies on third-party pricing services or other information (such as the correlation with price movements of similar securities in the same or other markets; the type, cost and investment characteristics of the security; the business and financial condition of the issuer; and trading and other market data) to assist in determining whether to fair value and at what value to fair value an investment. The value of an investment for purposes of calculating the fund’s net asset value can differ depending on the source and method used to determine value. When fair valuation is used, the value of an investment used to determine the fund’s net asset value may differ from quoted or published prices for the same investment. There can be no assurance that the fund could obtain the fair value assigned to an investment if it were to sell the investment at the same time at which the fund determines its net asset value per share.
Various inputs are used in determining the value of the fund’s assets or liabilities. These inputs are categorized into three broad levels. In certain cases, the inputs used to measure fair value may fall into different levels of the fair value hierarchy. In such cases, an investment’s level within the fair value hierarchy is based on the lowest level of input that is significant to the fair value measurement. The fund’s assessment of the significance of a particular input to the fair value measurement in its entirety requires
29
Notes to Financial Statements – continued
judgment, and considers factors specific to the investment. Level 1 includes unadjusted quoted prices in active markets for identical assets or liabilities. Level 2 includes other significant observable market-based inputs (including quoted prices for similar securities, interest rates, prepayment speed, and credit risk). Level 3 includes unobservable inputs, which may include the adviser’s own assumptions in determining the fair value of investments. The following is a summary of the levels used as of August 31, 2016 in valuing the fund’s assets or liabilities:
| | | | | | | | | | | | | | | | |
| Investments at Value | | Level 1 | | | Level 2 | | | Level 3 | | | Total | |
| Equity Securities: | | | | | | | | | | | | | | | | |
China | | | $3,319,370 | | | | $74,714 | | | | $— | | | | $3,394,084 | |
South Korea | | | 2,405,478 | | | | — | | | | — | | | | 2,405,478 | |
Taiwan | | | 1,565,199 | | | | — | | | | — | | | | 1,565,199 | |
Brazil | | | 1,050,276 | | | | — | | | | — | | | | 1,050,276 | |
South Africa | | | 719,676 | | | | — | | | | — | | | | 719,676 | |
India | | | 100,445 | | | | 534,130 | | | | — | | | | 634,575 | |
Russia | | | 609,831 | | | | — | | | | — | | | | 609,831 | |
Mexico | | | 529,314 | | | | — | | | | — | | | | 529,314 | |
Thailand | | | 73,063 | | | | 405,989 | | | | — | | | | 479,052 | |
Other Countries | | | 2,003,971 | | | | — | | | | — | | | | 2,003,971 | |
| Mutual Funds | | | 591,481 | | | | — | | | | — | | | | 591,481 | |
| Total Investments | | | $12,968,104 | | | | $1,014,833 | | | | $— | | | | $13,982,937 | |
For further information regarding security characteristics, see the Portfolio of Investments.
Foreign Currency Translation – Purchases and sales of foreign investments, income, and expenses are converted into U.S. dollars based upon currency exchange rates prevailing on the respective dates of such transactions or on the reporting date for foreign denominated receivables and payables. Gains and losses attributable to foreign currency exchange rates on sales of securities are recorded for financial statement purposes as net realized gains and losses on investments. Gains and losses attributable to foreign exchange rate movements on receivables, payables, income and expenses are recorded for financial statement purposes as foreign currency transaction gains and losses. That portion of both realized and unrealized gains and losses on investments that results from fluctuations in foreign currency exchange rates is not separately disclosed.
Zero Strike Warrants – The fund invested in low exercise price call warrants (zero strike warrants). Zero strike warrants are issued by banks or broker-dealers and allow the fund to gain exposure to common stocks in markets that place restrictions on direct investments by foreign investors and may or may not be traded on an exchange. Income received from zero strike warrants is recorded as dividend income in the Statement of Operations. To the extent the fund invests in zero strike warrants whose returns correspond to the performance of a foreign stock, investing in zero strike warrants will involve risks similar to the risks of investing in foreign securities. Additional risks associated with zero strike warrants include the potential inability of the counterparty to fulfill their obligations under the warrant, inability to transfer or liquidate the warrants and potential delays or an inability to redeem before expiration under certain market conditions.
30
Notes to Financial Statements – continued
Indemnifications – Under the fund’s organizational documents, its officers and Trustees may be indemnified against certain liabilities and expenses arising out of the performance of their duties to the fund. Additionally, in the normal course of business, the fund enters into agreements with service providers that may contain indemnification clauses. The fund’s maximum exposure under these agreements is unknown as this would involve future claims that may be made against the fund that have not yet occurred.
Investment Transactions and Income – Investment transactions are recorded on the trade date. Dividends received in cash are recorded on the ex-dividend date. Certain dividends from foreign securities will be recorded when the fund is informed of the dividend if such information is obtained subsequent to the ex-dividend date. Dividend and interest payments received in additional securities are recorded on the ex-dividend or ex-interest date in an amount equal to the value of the security on such date.
The fund may receive proceeds from litigation settlements. Any proceeds received from litigation involving portfolio holdings are reflected in the Statement of Operations in realized gain/loss if the security has been disposed of by the fund or in unrealized gain/loss if the security is still held by the fund. Any other proceeds from litigation not related to portfolio holdings are reflected as other income in the Statement of Operations.
Fees Paid Indirectly – Prior to October 1, 2015, the fund’s custody fee could be reduced by a credit earned under an arrangement that measured the value of U.S. dollars deposited with the custodian by the fund. The amount of the credit, for the period ended August 31, 2016, is shown as a reduction of total expenses in the Statement of Operations.
Tax Matters and Distributions – The fund intends to qualify as a regulated investment company, as defined under Subchapter M of the Internal Revenue Code, and to distribute all of its taxable income, including realized capital gains. As a result, no provision for federal income tax is required. The fund’s federal tax returns, when filed, will remain subject to examination by the Internal Revenue Service for a three year period. Management has analyzed the fund’s tax positions taken on federal and state tax returns for all open tax years and does not believe that there are any uncertain tax positions that require recognition of a tax liability. Foreign taxes, if any, have been accrued by the fund in the accompanying financial statements in accordance with the applicable foreign tax law. Foreign income taxes may be withheld by certain countries in which the fund invests. Additionally, capital gains realized by the fund on securities issued in or by certain foreign countries may be subject to capital gains tax imposed by those countries.
Distributions to shareholders are recorded on the ex-dividend date. Income and capital gain distributions are determined in accordance with income tax regulations, which may differ from U.S. generally accepted accounting principles. Certain capital accounts in the financial statements are periodically adjusted for permanent differences in order to reflect their tax character. These adjustments have no impact on net assets or net asset value per share. Temporary differences which arise from recognizing certain items of income, expense, gain or loss in different periods for financial statement and tax purposes will reverse at some time in the future. Distributions in excess of net
31
Notes to Financial Statements – continued
investment income or net realized gains are temporary overdistributions for financial statement purposes resulting from differences in the recognition or classification of income or distributions for financial statement and tax purposes.
Book/tax differences primarily relate to wash sale loss deferrals.
The tax character of distributions declared to shareholders for the last fiscal year is as follows:
| | | | |
| | | 8/31/16 | |
Ordinary income (including any short-term capital gains) | | | $18,100 | |
The federal tax cost and the tax basis components of distributable earnings were as follows:
| | | | |
| As of 8/31/16 | | | |
| Cost of investments | | | $13,591,526 | |
| Gross appreciation | | | 577,942 | |
| Gross depreciation | | | (186,531 | ) |
| Net unrealized appreciation (depreciation) | | | $391,411 | |
| Undistributed ordinary income | | | 80,246 | |
| Other temporary differences | | | (2,924 | ) |
Multiple Classes of Shares of Beneficial Interest – The fund offers multiple classes of shares, which differ in their respective distribution and/or service fees. The fund’s income, realized and unrealized gain (loss), and common expenses are allocated to shareholders based on the daily net assets of each class. Dividends are declared separately for each class. Differences in per share dividend rates are generally due to differences in separate class expenses. Class B shares will convert to Class A shares approximately eight years after purchase. The fund’s distributions declared to shareholders as reported in the Statement of Changes in Net Assets are presented by class as follows:
| | | | | | | | |
| | | From net investment
income | | | From net realized gain on
investments | |
| | | Period
ended
8/31/16 (c) | | | Period
ended
8/31/16 (c) | |
| Class A | | | $227 | | | | $53 | |
| Class B | | | 106 | | | | 51 | |
| Class C | | | 124 | | | | 55 | |
| Class I | | | 337 | | | | 67 | |
| Class R1 | | | 106 | | | | 51 | |
| Class R2 | | | 182 | | | | 51 | |
| Class R3 | | | 219 | | | | 51 | |
| Class R4 | | | 257 | | | | 51 | |
| Class R6 (formerly Class R5) | | | 13,442 | | | | 2,670 | |
| Total | | | $15,000 | | | | $3,100 | |
| (c) | For the period from the commencement of the fund’s investment operations, September 15, 2015, through the stated period end. |
32
Notes to Financial Statements – continued
Effective August 26, 2016, Class R5 shares were renamed Class R6 shares.
(3) Transactions with Affiliates
Investment Adviser – The fund has an investment advisory agreement with MFS to provide overall investment management and related administrative services and facilities to the fund. The management fee is computed daily and paid monthly at the following annual rates:
| | | | |
| First $1 billion of average daily net assets | | | 0.75% | |
| Next $1.5 billion of average daily net assets | | | 0.70% | |
| Average daily net assets in excess of $2.5 billion | | | 0.675% | |
MFS has agreed in writing to reduce its management fee by a specified amount if certain MFS mutual fund assets exceed thresholds agreed to by MFS and the fund’s Board of Trustees. For the period ended August 31, 2016, this management fee reduction amounted to $252, which is included in the reduction of total expenses in the Statement of Operations. The management fee incurred for the period ended August 31, 2016 was equivalent to an annual effective rate of 0.74% of the fund’s average daily net assets.
The investment adviser has agreed in writing to pay a portion of the fund’s total annual operating expenses, excluding interest, taxes, extraordinary expenses, brokerage and transaction costs, and investment-related expenses, such that total fund operating expenses do not exceed the following rates annually of each class’s average daily net assets:
| | | | | | | | | | | | | | | | | | | | | | | | | | | | | | | | |
| Classes | |
| A | | B | | | C | | | I | | | R1 | | | R2 | | | R3 | | | R4 | | | R6
(formerly
Class R5) | |
| 1.24% | | | 1.99% | | | | 1.99% | | | | 0.99% | | | | 1.99% | | | | 1.49% | | | | 1.24% | | | | 0.99% | | | | 0.95% | |
This written agreement will continue until modified by the fund’s Board of Trustees, but such agreement will continue at least until December 31, 2017. For the period ended August 31, 2016, this reduction amounted to $205,062, which is included in the reduction of total expenses in the Statement of Operations.
Distributor – MFS Fund Distributors, Inc. (MFD), a wholly-owned subsidiary of MFS, as distributor, received $1,861 for the period ended August 31, 2016, as its portion of the initial sales charge on sales of Class A shares of the fund.
The Board of Trustees has adopted a distribution plan for certain share classes pursuant to Rule 12b-1 of the Investment Company Act of 1940.
The fund’s distribution plan provides that the fund will pay MFD for services provided by MFD and financial intermediaries in connection with the distribution and servicing of certain share classes. One component of the plan is a distribution fee paid to MFD and another component of the plan is a service fee paid to MFD. MFD may subsequently pay all, or a portion, of the distribution and/or service fees to financial intermediaries.
33
Notes to Financial Statements – continued
Distribution Plan Fee Table:
| | | | | | | | | | | | | | | | | | | | |
| | | Distribution
Fee Rate (d) | | | Service
Fee Rate (d) | | | Total
Distribution
Plan (d) | | | Annual
Effective
Rate (e) | | | Distribution
and Service
Fee | |
| Class A | | | — | | | | 0.25% | | | | 0.25% | | | | 0.25% | | | | $755 | |
| Class B | | | 0.75% | | | | 0.25% | | | | 1.00% | | | | 1.00% | | | | 637 | |
| Class C | | | 0.75% | | | | 0.25% | | | | 1.00% | | | | 1.00% | | | | 621 | |
| Class R1 | | | 0.75% | | | | 0.25% | | | | 1.00% | | | | 1.00% | | | | 490 | |
| Class R2 | | | 0.25% | | | | 0.25% | | | | 0.50% | | | | 0.50% | | | | 246 | |
| Class R3 | | | — | | | | 0.25% | | | | 0.25% | | | | 0.25% | | | | 123 | |
| Total Distribution and Service Fees | | | | $2,872 | |
| (d) | In accordance with the distribution plan for certain classes, the fund pays distribution and/or service fees equal to these annual percentage rates of each class’s average daily net assets. The distribution and service fee rates disclosed by class represent the current rates in effect at the end of the reporting period. Any rate changes, if applicable, are detailed below. |
| (e) | The annual effective rates represent actual fees incurred under the distribution plan for the period ended August 31, 2016 based on each class’s average daily net assets. MFD has voluntarily agreed to rebate a portion of each class’s 0.25% service fee attributable to accounts for which MFD retains the 0.25% service fee except for accounts attributable to MFS or its affiliates’ seed money. There were no service fee rebates for the period ended August 31, 2016. |
Certain Class A shares are subject to a contingent deferred sales charge (CDSC) in the event of a shareholder redemption within 18 months of purchase. Class C shares are subject to a CDSC in the event of a shareholder redemption within 12 months of purchase. Class B shares are subject to a CDSC in the event of a shareholder redemption within six years of purchase. All contingent deferred sales charges are paid to MFD and during the period ended August 31, 2016, were as follows:
| | | | |
| | | Amount | |
| Class A | | | $— | |
| Class B | | | 1,000 | |
| Class C | | | — | |
Shareholder Servicing Agent – MFS Service Center, Inc. (MFSC), a wholly-owned subsidiary of MFS, receives a fee from the fund for its services as shareholder servicing agent calculated as a percentage of the average daily net assets of the fund as determined periodically under the supervision of the fund’s Board of Trustees. For the period ended August 31, 2016, the fee was $389, which equated to 0.0110% annually of the fund’s average daily net assets. MFSC also receives payment from the fund for out-of-pocket expenses, sub-accounting and other shareholder servicing costs which may be paid to affiliated and unaffiliated service providers. Class R6 shares do not incur sub-accounting fees. For the period ended August 31, 2016, these out-of-pocket expenses, sub-accounting and other shareholder servicing costs amounted to $792.
Administrator – MFS provides certain financial, legal, shareholder communications, compliance, and other administrative services to the fund. Under an administrative services agreement, the fund reimburses MFS the costs incurred to provide these services. The fund is charged an annual fixed amount of $17,500 plus a fee based on
34
Notes to Financial Statements – continued
average daily net assets. The administrative services fee incurred for the period ended August 31, 2016 was equivalent to an annual effective rate of 0.4745% of the fund’s average daily net assets.
Trustees’ and Officers’ Compensation – The fund pays compensation to independent Trustees in the form of a retainer, attendance fees, and additional compensation to Board and Committee chairpersons. The fund does not pay compensation directly to Trustees or officers of the fund who are also officers of the investment adviser, all of whom receive remuneration for their services to the fund from MFS. Certain officers and Trustees of the fund are officers or directors of MFS, MFD, and MFSC.
Other – This fund and certain other funds managed by MFS (the funds) have entered into a service agreement (the ISO Agreement) which provides for payment of fees solely by the funds to Tarantino LLC in return for the provision of services of an Independent Senior Officer (ISO) for the funds. Frank L. Tarantino serves as the ISO and is an officer of the funds and the sole member of Tarantino LLC. The funds can terminate the ISO Agreement with Tarantino LLC at any time under the terms of the ISO Agreement. For the period ended August 31, 2016, the fee paid by the fund under this agreement was $7 and is included in “Miscellaneous” expense in the Statement of Operations. MFS has agreed to bear all expenses associated with office space, other administrative support, and supplies provided to the ISO.
The fund invests in the MFS Institutional Money Market Portfolio which is managed by MFS and seeks current income consistent with preservation of capital and liquidity. Income earned on this investment is included in “Dividends from underlying affiliated funds” in the Statement of Operations. This money market fund does not pay a management fee to MFS.
On September 14, 2015, MFS purchased 260,000 shares of Class R6 (formerly Class R5) and 5,000 shares of Class A, Class B, Class C, Class I, Class R1, Class R2, Class R3, and Class R4, for an aggregate amount of $3,000,000 as an initial investment in the fund. On March 16, 2016, MFS purchased 16,502 shares of Class I for an aggregate amount of $162,877.
At August 31, 2016, MFS held approximately 66%, 62%, and 56% of the outstanding shares of Class B, Class C, and Class I, respectively, and 100% of the outstanding shares of Class R1, Class R2, Class R3, and Class R4.
The fund is permitted to engage in purchase and sale transactions (“cross-trades”) with funds and accounts for which MFS serves as investment adviser or sub-adviser pursuant to a policy adopted by the Board of Trustees. This policy has been designed to ensure that cross-trades conducted by the fund comply with Rule 17a-7 under the Investment Company Act of 1940. Under this policy, cross-trades are effected at current market prices with no remuneration paid in connection with the transaction. During the period ended August 31, 2016, the fund engaged in purchase transactions pursuant to this policy, which amounted to $1,253,053.
(4) Portfolio Securities
For the period ended August 31, 2016, purchases and sales of investments, other than short-term obligations, aggregated $15,649,109 and $2,681,823, respectively.
35
Notes to Financial Statements – continued
(5) Shares of Beneficial Interest
The fund’s Declaration of Trust permits the Trustees to issue an unlimited number of full and fractional shares of beneficial interest. Transactions in fund shares were as follows:
| | | | | | | | |
| | | Period ended
8/31/16 (c) | |
| | | Shares | | | Amount | |
| Shares sold | | | | | | | | |
Class A | | | 88,131 | | | | $909,386 | |
Class B | | | 10,890 | | | | 105,319 | |
Class C | | | 8,074 | | | | 81,820 | |
Class I | | | 39,201 | | | | 406,374 | |
Class R1 | | | 5,000 | | | | 50,000 | |
Class R2 | | | 5,000 | | | | 50,000 | |
Class R3 | | | 5,000 | | | | 50,000 | |
Class R4 | | | 5,000 | | | | 50,000 | |
Class R6 (formerly Class R5) | | | 1,059,522 | | | | 11,778,174 | |
| | | 1,225,818 | | | | $13,481,073 | |
| | |
Shares issued to shareholders in
reinvestment of distributions | | | | | | | | |
Class A | | | 28 | | | | $280 | |
Class B | | | 16 | | | | 157 | |
Class C | | | 18 | | | | 179 | |
Class I | | | 41 | | | | 404 | |
Class R1 | | | 16 | | | | 157 | |
Class R2 | | | 24 | | | | 233 | |
Class R3 | | | 27 | | | | 270 | |
Class R4 | | | 31 | | | | 308 | |
Class R6 (formerly Class R5) | | | 1,632 | | | | 16,112 | |
| | | 1,833 | | | | $18,100 | |
| | |
| Shares reacquired | | | | | | | | |
Class A | | | (3,947 | ) | | | $(40,150 | ) |
Class B | | | (3,259 | ) | | | (32,134 | ) |
Class C | | | (2 | ) | | | (16 | ) |
Class I | | | (934 | ) | | | (10,594 | ) |
Class R6 (formerly Class R5) | | | (4,742 | ) | | | (54,176 | ) |
| | | (12,884 | ) | | | $(137,070 | ) |
36
Notes to Financial Statements – continued
| | | | | | | | |
| | | Period ended
8/31/16 (c) | |
| | | Shares | | | Amount | |
| Net change | | | | | | | | |
Class A | | | 84,212 | | | | $869,516 | |
Class B | | | 7,647 | | | | 73,342 | |
Class C | | | 8,090 | | | | 81,983 | |
Class I | | | 38,308 | | | | 396,184 | |
Class R1 | | | 5,016 | | | | 50,157 | |
Class R2 | | | 5,024 | | | | 50,233 | |
Class R3 | | | 5,027 | | | | 50,270 | |
Class R4 | | | 5,031 | | | | 50,308 | |
Class R6 (formerly Class R5) | | | 1,056,412 | | | | 11,740,110 | |
| | | 1,214,767 | | | | $13,362,103 | |
| (c) | For the period from the commencement of the fund’s investment operations, September 15, 2015, through the stated period end. |
Effective August 26, 2016, Class R5 shares were renamed Class R6 shares.
The fund is one of several mutual funds in which certain MFS funds may invest. The MFS funds do not invest in the underlying funds for the purpose of exercising management or control. At the end of the period, the MFS Lifetime 2040 Fund, the MFS Lifetime 2030 Fund, the MFS Lifetime 2050 Fund, the MFS Lifetime 2035 Fund, the MFS Lifetime 2045 Fund, and the MFS Lifetime 2055 Fund were the owners of record of approximately 26%, 14%, 9%, 7%, 7%, and 2% respectively, of the value of outstanding voting shares of the fund.
(6) Line of Credit
The fund and certain other funds managed by MFS participate in a $1.25 billion unsecured committed line of credit, subject to a $1 billion sublimit, provided by a syndication of banks under a credit agreement. Borrowings may be made for temporary financing needs. Interest is charged to each fund, based on its borrowings, generally at a rate equal to the higher of the Overnight Federal Reserve funds rate or daily one month LIBOR plus an agreed upon spread. A commitment fee, based on the average daily, unused portion of the committed line of credit, is allocated among the participating funds at the end of each calendar quarter. In addition, the fund and other funds managed by MFS have established unsecured uncommitted borrowing arrangements with certain banks for temporary financing needs. Interest is charged to each fund, based on its borrowings, at a rate equal to the Overnight Federal Reserve funds rate plus an agreed upon spread. For the period ended August 31, 2016, the fund’s commitment fee and interest expense were $11 and $0, respectively, and are included in “Miscellaneous” expense in the Statement of Operations.
37
Notes to Financial Statements – continued
(7) Transactions in Underlying Affiliated Funds-Affiliated Issuers
An affiliated issuer may be considered one in which the fund owns 5% or more of the outstanding voting securities, or a company which is under common control. For the purposes of this report, the fund assumes the following to be an affiliated issuer:
| | | | | | | | | | | | | | | | |
| Underlying Affiliated Fund | | Beginning Shares/Par Amount | | | Acquisitions
Shares/Par
Amount | | | Dispositions
Shares/Par
Amount | | | Ending
Shares/Par
Amount | |
MFS Institutional Money
Market Portfolio | | | — | | | | 3,161,797 | | | | (2,570,316 | ) | | | 591,481 | |
| | | | |
| Underlying Affiliated Fund | | Realized
Gain (Loss) | | | Capital Gain
Distributions | | | Dividend
Income | | | Ending
Value | |
MFS Institutional Money
Market Portfolio | | | $— | | | | $— | | | | $368 | | | | $591,481 | |
38
REPORT OF INDEPENDENT REGISTERED PUBLIC ACCOUNTING FIRM
To the Board of Trustees of MFS Series Trust IV and Shareholders of MFS Blended Research Emerging Markets Equity Fund:
We have audited the accompanying statement of assets and liabilities, including the portfolio of investments, of MFS Blended Research Emerging Markets Equity Fund (the Fund) (one of the series constituting the MFS Series Trust IV) as of August 31, 2016, and the related statements of operations, changes in net assets and the financial highlights for the period from September 15, 2015 (commencement of operations) to August 31, 2016. These financial statements and financial highlights are the responsibility of the Fund’s management. Our responsibility is to express an opinion on these financial statements and financial highlights based on our audit.
We conducted our audit in accordance with the standards of the Public Company Accounting Oversight Board (United States). Those standards require that we plan and perform the audit to obtain reasonable assurance about whether the financial statements and financial highlights are free of material misstatement. We were not engaged to perform an audit of the Fund’s internal control over financial reporting. Our audit included consideration of internal control over financial reporting as a basis for designing audit procedures that are appropriate in the circumstances, but not for the purpose of expressing an opinion on the effectiveness of the Fund’s internal control over financial reporting. Accordingly, we express no such opinion. An audit also includes examining, on a test basis, evidence supporting the amounts and disclosures in the financial statements and financial highlights, assessing the accounting principles used and significant estimates made by management, and evaluating the overall financial statement presentation. Our procedures included confirmation of securities owned as of August 31, 2016, by correspondence with the custodian and others or by other appropriate auditing procedures where replies from others were not received. We believe that our audit provides a reasonable basis for our opinion.
In our opinion, the financial statements and financial highlights referred to above present fairly, in all material respects, the financial position of MFS Blended Research Emerging Markets Equity Fund (one of the series constituting the MFS Series Trust IV) at August 31, 2016, the results of its operations, the changes in its net assets and the financial highlights for the period from September 15, 2015 (commencement of operations) to August 31, 2016, in conformity with U.S. generally accepted accounting principles.

Boston, Massachusetts
October 17, 2016
39
TRUSTEES AND OFFICERS — IDENTIFICATION AND BACKGROUND
The Trustees and Officers of the Trust, as of October 1, 2016, are listed below, together with their principal occupations during the past five years. (Their titles may have varied during that period.) The address of each Trustee and Officer is 111 Huntington Avenue, Boston, Massachusetts 02199-7618.
| | | | | | | | |
Name, Age | | Position(s) Held
with Fund | | Trustee/Officer
Since (h) | | Principal
Occupations During
the Past Five Years | | Other
Directorships (j) |
| INTERESTED TRUSTEES |
Robert J. Manning (k)
(age 52) | | Trustee | | February 2004 | | Massachusetts Financial Services Company, Chairman, Co-Chief Executive Officer and Director | | N/A |
Robin A. Stelmach (k)
(age 55) | | Trustee and
President | | January 2014 | | Massachusetts Financial Services Company, Executive Vice President and Chief Operating Officer | | N/A |
| INDEPENDENT TRUSTEES |
David H. Gunning
(age 74) | | Trustee and Chair of Trustees | | January 2004 | | Private investor | | Lincoln Electric Holdings, Inc., Director; Development Alternatives, Inc., Director/Non-Executive Chairman |
Steven E. Buller
(age 65) | | Trustee | | February 2014 | | Chairman, Financial Accounting Standards Advisory Council (until 2015); Standing Advisory Group, Public Company Accounting Oversight Board, Member (until 2014); BlackRock, Inc. (investment management), Managing Director (until 2014), BlackRock Finco UK (investment management), Director (until 2014) | | N/A |
Robert E. Butler
(age 74) | | Trustee | | January 2006 | | Consultant – investment company industry regulatory and compliance matters | | N/A |
40
Trustees and Officers – continued
| | | | | | | | |
Name, Age | | Position(s) Held
with Fund | | Trustee/Officer
Since (h) | | Principal
Occupations During
the Past Five Years | | Other
Directorships (j) |
Maureen R. Goldfarb
(age 61) | | Trustee | | January 2009 | | Private investor | | N/A |
William R. Gutow
(age 75) | | Trustee | | December 1993 | | Private investor and real estate consultant; Capitol Entertainment Management Company (video franchise), Vice Chairman (until 2014) | | Texas Donuts, Vice Chairman (until 2010) |
Michael Hegarty
(age 71) | | Trustee | | December 2004 | | Private investor | | Rouse Properties Inc., Director; Capmark Financial Group Inc., Director (until 2015) |
John P. Kavanaugh
(age 61) | | Trustee | | January 2009 | | Private investor | | N/A |
Maryanne L. Roepke
(age 60) | | Trustee | | May 2014 | | American Century Investments (investment management), Senior Vice President and Chief Compliance Officer (until 2014) | | N/A |
Laurie J. Thomsen
(age 59) | | Trustee | | March 2005 | | Private investor | | The Travelers Companies, Director; Dycom Industries, Inc., Director |
Robert W. Uek
(age 75) | | Trustee | | January 2006 | | Consultant to investment company industry | | N/A |
| OFFICERS |
Christopher R. Bohane (k)
(age 42) | | Assistant
Secretary and Assistant Clerk | | July 2005 | | Massachusetts Financial Services Company, Vice President and Assistant General Counsel | | N/A |
Kino Clark (k)
(age 48) | | Assistant
Treasurer | | January 2012 | | Massachusetts Financial Services Company, Vice President | | N/A |
Kristin V. Collins (k)
(age 43) | | Assistant
Secretary and Assistant Clerk | | September 2015 | | Massachusetts Financial Services Company, Vice President and Assistant General Counsel | | N/A |
41
Trustees and Officers – continued
| | | | | | | | |
Name, Age | | Position(s) Held
with Fund | | Trustee/Officer
Since (h) | | Principal
Occupations During
the Past Five Years | | Other
Directorships (j) |
Thomas H. Connors (k)
(age 57) | | Assistant
Secretary and Assistant Clerk | | September 2012 | | Massachusetts Financial Services Company, Vice President and Senior Counsel; Deutsche Investment Management Americas Inc. (financial service provider), Director and Senior Counsel (until 2012) | | N/A |
Ethan D. Corey (k)
(age 52) | | Assistant
Secretary and Assistant Clerk | | July 2005 | | Massachusetts Financial Services Company, Senior Vice President and Associate General Counsel | | N/A |
David L. DiLorenzo (k)
(age 48) | | Treasurer | | July 2005 | | Massachusetts Financial Services Company, Senior Vice President | | N/A |
Brian E. Langenfeld (k)
(age 43) | | Assistant
Secretary and Assistant Clerk | | June 2006 | | Massachusetts Financial Services Company, Vice President and Senior Counsel | | N/A |
Susan A. Pereira (k)
(age 45) | | Assistant Secretary and Assistant Clerk | | July 2005 | | Massachusetts Financial Services Company, Vice President and Senior Counsel | | N/A |
Kasey L. Phillips (k)
(age 45) | | Assistant
Treasurer | | September 2012 | | Massachusetts Financial Services Company, Vice President; Wells Fargo Funds Management, LLC, Senior Vice President, Fund Treasurer (until 2012) | | N/A |
42
Trustees and Officers – continued
| | | | | | | | |
Name, Age | | Position(s) Held
with Fund | | Trustee/Officer
Since (h) | | Principal
Occupations During
the Past Five Years | | Other
Directorships (j) |
Mark N. Polebaum (k)
(age 64) | | Secretary and
Clerk | | January 2006 | | Massachusetts Financial Services Company, Executive Vice President, General Counsel and Secretary | | N/A |
Matthew A. Stowe (k)
(age 41) | | Assistant
Secretary and Assistant Clerk | | October 2014 | | Massachusetts Financial Services Company, Vice President and Assistant General Counsel | | N/A |
Frank L. Tarantino
(age 72) | | Independent
Senior Officer | | June 2004 | | Tarantino LLC (provider of compliance services), Principal | | N/A |
Richard S. Weitzel (k)
(age 46) | | Assistant
Secretary and Assistant Clerk | | October 2007 | | Massachusetts Financial Services Company, Senior Vice President and Associate General Counsel | | N/A |
Martin J. Wolin (k)
(age 49) | | Chief Compliance Officer | | July 2015 | | Massachusetts Financial Services Company, Senior Vice President and Chief Compliance Officer (since July 2015); Mercer (financial service provider), Chief Risk and Compliance Officer, North America and Latin America (until June 2015) | | N/A |
James O. Yost (k)
(age 56) | | Deputy Treasurer | | September 1990 | | Massachusetts Financial Services Company, Senior Vice President | | N/A |
| (h) | Date first appointed to serve as Trustee/officer of an MFS Fund. Each Trustee has served continuously since appointment unless indicated otherwise. For the period from December 15, 2004 until February 22, 2005, Mr. Manning served as Advisory Trustee. Prior to January 2012, Messrs. DiLorenzo and Yost served as Assistant Treasurers of the Funds. Ms. Stelmach was appointed as President of the Funds as of October 1, 2014. |
| (j) | Directorships or trusteeships of companies required to report to the Securities and Exchange Commission (i.e., “public companies”). |
(k) “Interested person” of the Trust within the meaning of the Investment Company Act of 1940 (referred to as the 1940 Act), which is the principal federal law governing investment companies like the fund, as a result of a position with MFS. The address of MFS is 111 Huntington Avenue, Boston, Massachusetts 02199-7618.
43
Trustees and Officers – continued
Each Trustee (except Ms. Stelmach, Mr. Buller and Ms. Roepke) has been elected by shareholders and each Trustee and officer holds office until his or her successor is chosen and qualified or until his or her earlier death, resignation, retirement or removal. The Trust does not hold annual meetings for the purpose of electing Trustees, and Trustees are not elected for fixed terms. Messrs. Buller, Butler, Kavanaugh, Uek and Ms. Roepke are members of the Trust’s Audit Committee.
Each of the Fund’s Trustees and officers holds comparable positions with certain other funds of which MFS or a subsidiary is the investment adviser or distributor, and, in the case of the officers, with certain affiliates of MFS. As of October 1, 2016, the Trustees served as board members of 137 funds within the MFS Family of Funds.
The Statement of Additional Information for a Fund includes further information about the Trustees and is available without charge upon request by calling 1-800-225-2606.
| | |
| Investment Adviser | | Custodian |
Massachusetts Financial Services Company
111 Huntington Avenue
Boston, MA 02199-7618 | | State Street Bank and Trust Company 1 Lincoln Street Boston, MA 02111-2900 |
| Distributor | | Independent Registered Public Accounting Firm |
MFS Fund Distributors, Inc.
111 Huntington Avenue
Boston, MA 02199-7618 | | Ernst & Young LLP 200 Clarendon Street Boston, MA 02116 |
| Portfolio Managers | | |
James Fallon Matthew Krummell Jonathan Sage John Stocks | | |
44
PROXY VOTING POLICIES AND INFORMATION
MFS votes proxies on behalf of the fund pursuant to proxy voting policies and procedures that are available without charge, upon request, by calling 1-800-225-2606, by visiting mfs.com (once you have selected “Individual Investor” as your role, click on “Individual Investor Home” in the top navigation and then select “Learn More About Proxy Voting” under the “I want to…” header on the left hand column of the page), or by visiting the SEC’s Web site at http://www.sec.gov.
Information regarding how the fund voted proxies relating to portfolio securities during the most recent twelve-month period ended June 30 is available by August 31 of each year without charge by visiting mfs.com (once you have selected “Individual Investor” as your role, click on “Individual Investor Home” in the top navigation and then select “Learn More About Proxy Voting” under the “I want to…” header on the left hand column of the page), or by visiting the SEC’s Web site at http://www.sec.gov.
QUARTERLY PORTFOLIO DISCLOSURE
The fund will file a complete schedule of portfolio holdings with the Securities and Exchange Commission (the Commission) for the first and third quarters of each fiscal year on Form N-Q. A shareholder can obtain the quarterly portfolio holdings report at mfs.com. The fund’s Form N-Q is also available on the EDGAR database on the Commission’s Internet Web site at http://www.sec.gov, and may be reviewed and copied at the:
Public Reference Room
Securities and Exchange Commission
100 F Street, NE, Room 1580
Washington, D.C. 20549
Information on the operation of the Public Reference Room may be obtained by calling the Commission at 1-800-SEC-0330. Copies of the fund’s Form N-Q also may be obtained, upon payment of a duplicating fee, by electronic request at the following e-mail address: publicinfo@sec.gov or by writing the Public Reference Section at the above address.
FURTHER INFORMATION
From time to time, MFS may post important information about the fund or the MFS funds on the MFS web site (mfs.com). This information is available on mfs.com by following these steps once you have selected “Individual Investor” as your role: (1) Click on the “Individual Investor Home” in the top navigation and then select the “Announcements” option within the “Market Outlooks” drop down, or (2) Click on “Products & Services” and “Mutual Funds” and then choose the fund’s name in the “Select a fund” menu.
45
INFORMATION ABOUT FUND CONTRACTS AND LEGAL CLAIMS
The fund has entered into contractual arrangements with an investment adviser, administrator, distributor, shareholder servicing agent, 529 program manager (if applicable), and custodian who each provide services to the fund. Unless expressly stated otherwise, shareholders are not parties to, or intended beneficiaries of these contractual arrangements, and these contractual arrangements are not intended to create any shareholder right to enforce them against the service providers or to seek any remedy under them against the service providers, either directly or on behalf of the fund.
Under the Trust’s By-Laws and Declaration of Trust, any claims asserted against or on behalf of the MFS Funds, including claims against Trustees and Officers, must be brought in state and federal courts located within the Commonwealth of Massachusetts.
FEDERAL TAX INFORMATION (unaudited)
The fund will notify shareholders of amounts for use in preparing 2016 income tax forms in January 2017. The following information is provided pursuant to provisions of the Internal Revenue Code.
The fund designates the maximum amount allowable as qualified dividend income eligible to be taxed at the same rate as long-term capital gain.
Income derived from foreign sources was $106,869. The fund intends to pass through foreign tax credits of $11,372 for the fiscal year.
46
rev. 3/16
| | | | |
| | | |
FACTS | | WHAT DOES MFS DO WITH YOUR PERSONAL INFORMATION? | |  |
| | |
| Why? | | Financial companies choose how they share your personal information. Federal law gives consumers the right to limit some but not all sharing. Federal law also requires us to tell you how we collect, share, and protect your personal information. Please read this notice carefully to understand what we do. |
| | |
| What? | | The types of personal information we collect and share depend on the product or service you have with us. This information can include: • Social Security number and account balances • Account transactions and transaction history • Checking account information and wire transfer instructions When you are no longer our customer, we continue to share your information as described in this notice. |
| | |
| How? | | All financial companies need to share customers’ personal information to run their everyday business. In the section below, we list the reasons financial companies can share their customers’ personal information; the reasons MFS chooses to share; and whether you can limit this sharing. |
| | | | |
Reasons we can share your
personal information | | Does MFS
share? | | Can you limit
this sharing? |
For our everyday business purposes – such as to process your transactions, maintain your account(s), respond to court orders and legal investigations, or report to credit bureaus | | Yes | | No |
For our marketing purposes – to offer our products and services to you | | No | | We don’t share |
For joint marketing with other financial companies | | No | | We don’t share |
For our affiliates’ everyday business purposes – information about your transactions and experiences | | No | | We don’t share |
For our affiliates’ everyday business purposes – information about your creditworthiness | | No | | We don’t share |
| For nonaffiliates to market to you | | No | | We don’t share |
| | |
| Questions? | | Call 800-225-2606 or go to mfs.com. |
47
| | |
| Who we are |
| Who is providing this notice? | | MFS Funds, MFS Investment Management, MFS Institutional Advisors, Inc., and MFS Heritage Trust Company. |
| | |
| What we do |
| How does MFS protect my personal information? | | To protect your personal information from unauthorized access and use, we use security measures that comply with federal law. These measures include procedural, electronic, and physical safeguards for the protection of the personal information we collect about you. |
| How does MFS collect my personal information? | | We collect your personal information, for example, when you • open an account or provide account information • direct us to buy securities or direct us to sell your securities • make a wire transfer We also collect your personal information from others, such as credit bureaus, affiliates, or other companies. |
| Why can’t I limit all sharing? | | Federal law gives you the right to limit only • sharing for affiliates’ everyday business purposes – information about your creditworthiness • affiliates from using your information to market to you • sharing for nonaffiliates to market to you State laws and individual companies may give you additional rights to limit sharing. |
| | |
| Definitions |
| Affiliates | | Companies related by common ownership or control. They can be financial and nonfinancial companies. • MFS does not share personal information with affiliates, except for everyday business purposes as described on page one of this notice. |
| Nonaffiliates | | Companies not related by common ownership or control. They can be financial and nonfinancial companies. • MFS does not share with nonaffiliates so they can market to you. |
| Joint marketing | | A formal agreement between nonaffiliated financial companies that together market financial products or services to you. • MFS doesn’t jointly market. |
| | |
| Other important information |
| If you own an MFS product or receive an MFS service in the name of a third party such as a bank or broker-dealer, their privacy policy may apply to you instead of ours. |
48
Save paper with eDelivery.

| MFS® will send you prospectuses, |
reports, and proxies directly via e-mail so you will get information faster with less mailbox clutter.
To sign up:
1. Go to mfs.com.
2. Log in via MFS® Access.
3. Select eDelivery.
If you own your MFS fund shares through a financial institution or a retirement plan, MFS® TALK, MFS® Access, or eDelivery may not be available to you.
CONTACT
WEB SITE
mfs.com
MFS TALK
1-800-637-8255
24 hours a day
ACCOUNT SERVICE AND LITERATURE
Shareholders
1-800-225-2606
Financial advisors
1-800-343-2829
Retirement plan services
1-800-637-1255
MAILING ADDRESS
MFS Service Center, Inc.
P.O. Box 55824
Boston, MA 02205-5824
OVERNIGHT MAIL
MFS Service Center, Inc.
c/o Boston Financial Data Services
30 Dan Road
Canton, MA 02021-2809
ANNUAL REPORT
August 31, 2016

MFS® BLENDED RESEARCH® GLOBAL EQUITY FUND

BRL-ANN
MFS® BLENDED RESEARCH® GLOBAL EQUITY FUND
CONTENTS
The report is prepared for the general information of shareholders.
It is authorized for distribution to prospective investors only when preceded or accompanied by a current prospectus.
NOT FDIC INSURED • MAY LOSE VALUE • NO BANK GUARANTEE

LETTER FROM THE CHAIRMAN
Dear Shareholders:
Despite the unexpected vote by the United Kingdom to leave the European Union, most markets proved resilient, with U.S. shares rallying to record highs during August.
Global interest rates remain very low, with most central banks maintaining extremely accommodative monetary policies to reinvigorate slow-growing economies against a backdrop of low inflation. This environment has favored risky assets such as equities, as investors are forced to accept greater risks in search of acceptable returns in a low-return environment. U.S. investment-grade and high-yield bonds have also benefited from low, and even negative, yields overseas.
China remains a source of concern for investors, as overcapacity in its manufacturing sector inhibits the government’s attempt to
change its domestic economy from one driven by exports to a consumer-driven model. Despite the slow-growth environment, emerging market equities have held up well, withstanding geopolitical shocks like an attempted coup in Turkey and impeachment proceedings against Brazil’s president. The U.S. Federal Reserve’s go-slow approach to rate hikes has also helped.
At MFS®, we believe it is best to view markets through a long lens and not react to short-term swings. That makes it possible to filter out market noise and focus on long-term fundamentals.
In our view, the professional guidance of a financial advisor, along with a patient, long-term approach, will help you reach your investment objectives.
Respectfully,

Robert J. Manning
Chairman
MFS Investment Management
October 17, 2016
The opinions expressed in this letter are subject to change and may not be relied upon for investment advice. No forecasts can be guaranteed.
1
PORTFOLIO COMPOSITION
Portfolio structure

| | | | |
| Top ten holdings | | | | |
| Alphabet, Inc., “A” | | | 2.1% | |
| Amazon.com, Inc. | | | 2.0% | |
| Samsung Electronics Co. Ltd. | | | 1.9% | |
| JPMorgan Chase & Co. | | | 1.9% | |
| Taiwan Semiconductor Manufacturing Co. Ltd., ADR | | | 1.8% | |
| Altria Group, Inc. | | | 1.6% | |
| Merck & Co., Inc. | | | 1.5% | |
Eli Lilly & Co. | | | 1.5% | |
Cisco Systems, Inc. | | | 1.5% | |
| Charter Communications, Inc., “A” | | | 1.5% | |
| |
| Equity sectors | | | | |
| Financial Services | | | 19.6% | |
| Technology | | | 13.8% | |
| Health Care | | | 11.1% | |
| Consumer Staples | | | 8.9% | |
| Utilities & Communications | | | 6.9% | |
| Energy | | | 6.8% | |
| Retailing | | | 5.7% | |
| Autos & Housing | | | 5.6% | |
| Leisure | | | 5.2% | |
| Basic Materials | | | 4.6% | |
| Industrial Goods & Services | | | 4.5% | |
| Special Products & Services | | | 3.1% | |
| Transportation | | | 2.4% | |
| | | | |
| Issuer country weightings (x) | |
| United States | | | 53.4% | |
| Japan | | | 7.6% | |
| United Kingdom | | | 5.8% | |
| South Korea | | | 4.6% | |
| France | | | 4.1% | |
| Canada | | | 3.5% | |
| Taiwan | | | 2.3% | |
| Germany | | | 2.2% | |
| Australia | | | 1.8% | |
| Other Countries | | | 14.7% | |
|
| Currency exposure weightings (y) | |
| United States Dollar | | | 55.8% | |
| Euro | | | 9.5% | |
| Japanese Yen | | | 7.6% | |
| British Pound Sterling | | | 5.9% | |
| South Korean Won | | | 4.6% | |
| Taiwan Dollar | | | 2.3% | |
| Australian Dollar | | | 1.8% | |
| Canadian Dollar | | | 1.7% | |
| Swiss Franc | | | 1.5% | |
| Other Currencies | | | 9.3% | |
2
Portfolio Composition – continued
| (x) | Represents the portfolio’s exposure to issuer countries as a percentage of a portfolio’s net assets. For purposes of this presentation, United States includes Cash & Cash Equivalents. |
| (y) | Represents the portfolio’s exposure to a particular currency as a percentage of a portfolio’s net assets. For purposes of this presentation, United States Dollar includes Cash & Cash Equivalents. |
Cash & Cash Equivalents includes any cash, investments in money market funds, short-term securities, and other assets less liabilities. Please see the Statement of Assets and Liabilities for additional information related to the fund’s cash position and other assets and liabilities.
Percentages are based on net assets as of 8/31/16.
The portfolio is actively managed and current holdings may be different.
3
MANAGEMENT REVIEW
Summary of Results
For the period September 15, 2015 through August 31, 2016, Class A shares of the MFS Blended Research Global Equity Fund (“fund”) provided a total return of 5.22%, at net asset value. This compares with a return of 9.41% for the fund’s benchmark, the MSCI All Country World Index.
Market Environment
Sluggish global growth weighed on both developed and emerging market (“EM”) economies during the reporting period. The US Federal Reserve began its long-anticipated monetary tightening cycle in the middle of the period, but the tightening cycle has proved to be more gradual than initially anticipated. Globally, central bank policy remained highly accommodative, which forced many government, and even some corporate, bond yields into negative territory. Near the end of the period, the United Kingdom voted to leave the European Union (“EU”), beginning a multi-year process of negotiation in order to achieve “Brexit”. While markets initially reacted to the vote with alarm, the spillover to European and EM was relatively short-lived (although risks of further hits to EU cohesiveness could re-emerge).
During the second half of the reporting period, US earnings headwinds expanded beyond the energy, materials and industrial sectors, to include most sectors of the market. The sharp rise in the US dollar also weighed on earnings early in the period, though dollar strength ebbed somewhat late in the period. US consumer spending held up well during the second half of the period amid a modest increase in real wages and falling gasoline prices. Demand for autos reached near-record territory before receding modestly late in the period, while the housing market continued its recovery. Slow global trade continued to mirror slow global growth, particularly for many EM countries. That said, EM countries began to show signs of a modest upturn in activity along with adjustment in their external accounts. These improved conditions appeared to have reassured investors and contributed to record inflows into the asset class during July and August as negative yields for an increasing share of developed market bonds drove yield-hungry investors further out on the risk spectrum. Similar investor inflows were experienced in the high grade and high yield corporate markets.
Detractors from Performance
Weak stock selection in the health care sector was a major detractor from performance relative to the MSCI All Country World Index. Here, holdings of non-urban hospital operator Community Health Systems (b) (United States) and an overweight position in biotech firm Gilead Sciences (United States) detracted from relative results. Community Health Systems underperformed during the reporting period as the company posted earnings per share that were below expectations. The miss was attributed to lower sales volume and a slowdown driven by weak sector performance.
A combination of weak stock selection and an overweight position in the autos & housing sector also held back relative performance. Within this sector, overweight positions in Canadian automotive systems manufacturer Magna International and motor vehicle manufacturer Kia Motors (South Korea) detracted from relative results.
4
Management Review – continued
Elsewhere, overweight positions in investment management and banking firm UBS (Switzerland), Life Insurance Company Dai-Ichi Mutual Life Insurance (Japan) and banking firm KBC Groep (Belgium) weighed on relative performance. Shares of UBS underperformed during the reporting period as earnings came in below market expectations as a result of weaker-than-expected revenues in the firm’s wealth and asset management divisions.
Stocks in other sectors that detracted from relative performance included holdings of poor-performing independent petroleum products company Marathon Petroleum (United States), Canadian airline company Air Canada (b) and global cruise line operator Norwegian Cruise Lines (Norway).
Contributors to Performance
Favorable security selection in the technology sector contributed to relative performance. The fund’s overweight positions in microchip and electronics manufacturer Samsung Electronics (South Korea), contract semiconductor manufacturer Taiwan Semiconductor Manufacturing (Taiwan) and financial management solutions provider Intuit (United States) boosted relative performance. Shares of Taiwan Semiconductor Manufacturing had a strong year as the company experienced robust demand from top customers.
Stock selection in the consumer staples sector strengthened relative returns. Within this sector, overweight positions in food producer Tyson Foods (United States) and tobacco company Altria Group (United States) aided relative returns. Shares of Tyson Foods outperformed the benchmark as the company reported strong earnings over the reporting period driven by record operating profit margins in all business segments.
Elsewhere, overweight positions in telecommunications company KDDI (Japan), Brazilian bank Itau Unibanco, electric utility company Korea Electric Power (South Korea) and global security company Northrop Grumman (United States) aided relative results. Holdings of residential and commercial building materials manufacturer Owens Corning (b) (United States) also strengthened relative performance.
Respectfully,
| | | | | | |
| James Fallon | | Matthew Krummell | | Jonathan Sage | | John Stocks |
| Portfolio Manager | | Portfolio Manager | | Portfolio Manager | | Portfolio Manager |
| (b) | Security is not a benchmark constituent. |
The views expressed in this report are those of the portfolio managers only through the end of the period of the report as stated on the cover and do not necessarily reflect the views of MFS or any other person in the MFS organization. These views are subject to change at any time based on market or other conditions, and MFS disclaims any responsibility to update such views. These views may not be relied upon as investment advice or an indication of trading intent on behalf of any MFS portfolio. References to specific securities are not recommendations of such securities, and may not be representative of any MFS portfolio’s current or future investments.
5
PERFORMANCE SUMMARY THROUGH 8/31/16
The following chart illustrates a representative class of the fund’s historical performance in comparison to its benchmark(s). Performance results include the deduction of the maximum applicable sales charge and reflect the percentage change in net asset value, including reinvestment of dividends and capital gains distributions. The performance of other share classes will be greater than or less than that of the class depicted below. Benchmarks are unmanaged and may not be invested in directly. Benchmark returns do not reflect sales charges, commissions or expenses. (See Notes to Performance Summary.)
Performance data shown represents past performance and is no guarantee of future results. Investment return and principal value fluctuate so your shares, when sold, may be worth more or less than the original cost; current performance may be lower or higher than quoted. The performance shown does not reflect the deduction of taxes, if any, that a shareholder would pay on fund distributions or the redemption of fund shares.
Growth of a Hypothetical $10,000 Investment (t)
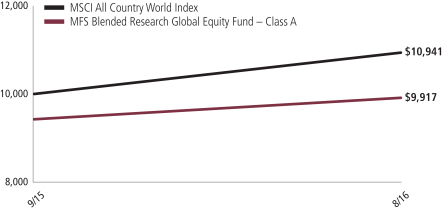
6
Performance Summary – continued
Total Returns through 8/31/16
Average annual without sales charge
| | | | | | | | | | |
| | | Share Class | | Class Inception Date | | | | Life (t) | | |
| | | A | | 9/15/15 | | | | 5.22% | | |
| | | B | | 9/15/15 | | | | 4.47% | | |
| | | C | | 9/15/15 | | | | 4.48% | | |
| | | I | | 9/15/15 | | | | 5.38% | | |
| | | R1 | | 9/15/15 | | | | 4.47% | | |
| | | R2 | | 9/15/15 | | | | 4.92% | | |
| | | R3 | | 9/15/15 | | | | 5.20% | | |
| | | R4 | | 9/15/15 | | | | 5.48% | | |
| | | R6
(formerly Class R5) | | 9/15/15 | | | | 5.48% | | |
| Comparative benchmark | | | | | | |
| | | MSCI All Country World Index (f) | | | | 9.41% | | |
| Average annual with sales charge | | | | | | |
| | | A
With Initial Sales Charge (5.75%) | | | | (0.83)% | | |
| | | B
With CDSC (Declining over six years from 4% to 0%) (v) | | 0.47% | | |
| | | C
With CDSC (1% for 12 months) (v) | | | | 3.48% | | |
CDSC – Contingent Deferred Sales Charge.
Class I, R1, R2, R3, R4, and R6 shares do not have a sales charge.
Effective August 26, 2016, Class R5 shares were renamed Class R6 shares.
| (f) | Source: FactSet Research Systems Inc. |
| (t) | For the period from the class inception date through the stated period end. (See Notes to Performance Summary.) |
| (v) | Assuming redemption at the end of the applicable period. |
Benchmark Definition
MSCI All Country World Index – a market capitalization-weighted index that is designed to measure equity market performance in the global developed and emerging markets.
It is not possible to invest directly in an index.
Notes to Performance Summary
Average annual total return represents the average annual change in value for each share class for the periods presented. Life returns are presented where the share class has less than 10 years of performance history and represent the average annual total return from the class inception date to the stated period end date.
7
Performance Summary – continued
Performance results reflect any applicable expense subsidies and waivers in effect during the periods shown. Without such subsidies and waivers the fund’s performance results would be less favorable. Please see the prospectus and financial statements for complete details.
Performance results do not include adjustments made for financial reporting purposes in accordance with U.S. generally accepted accounting principles and may differ from amounts reported in the financial highlights.
From time to time the fund may receive proceeds from litigation settlements, without which performance would be lower.
8
EXPENSE TABLE
Fund expenses borne by the shareholders during the period, March 1, 2016 through August 31, 2016
As a shareholder of the fund, you incur two types of costs: (1) transaction costs, including sales charges (loads) on certain purchase or redemption payments, and (2) ongoing costs, including management fees; distribution and service (12b-1) fees; and other fund expenses. This example is intended to help you understand your ongoing costs (in dollars) of investing in the fund and to compare these costs with the ongoing costs of investing in other mutual funds.
The example is based on an investment of $1,000 invested at the beginning of the period and held for the entire period March 1, 2016 through August 31, 2016.
Actual Expenses
The first line for each share class in the following table provides information about actual account values and actual expenses. You may use the information in this line, together with the amount you invested, to estimate the expenses that you paid over the period. Simply divide your account value by $1,000 (for example, an $8,600 account value divided by $1,000 = 8.6), then multiply the result by the number in the first line under the heading entitled “Expenses Paid During Period” to estimate the expenses you paid on your account during this period.
Hypothetical Example for Comparison Purposes
The second line for each share class in the following table provides information about hypothetical account values and hypothetical expenses based on the fund’s actual expense ratio and an assumed rate of return of 5% per year before expenses, which is not the fund’s actual return. The hypothetical account values and expenses may not be used to estimate the actual ending account balance or expenses you paid for the period. You may use this information to compare the ongoing costs of investing in the fund and other funds. To do so, compare this 5% hypothetical example with the 5% hypothetical examples that appear in the shareholder reports of the other funds.
Please note that the expenses shown in the table are meant to highlight your ongoing costs only and do not reflect any transactional costs, such as sales charges (loads). Therefore, the second line for each share class in the table is useful in comparing ongoing costs only, and will not help you determine the relative total costs of owning different funds. In addition, if these transactional costs were included, your costs would have been higher.
9
Expense Table – continued
| | | | | | | | | | | | | | | | | | |
Share Class | | | | Annualized
Expense
Ratio | | | Beginning
Account Value
3/01/16 | | | Ending
Account Value
8/31/16 | | | Expenses Paid During Period (p) 3/01/16-8/31/16 | |
| A | | Actual | | | 0.86% | | | | $1,000.00 | | | | $1,128.37 | | | | $4.60 | |
| | Hypothetical (h) | | | 0.86% | | | | $1,000.00 | | | | $1,020.81 | | | | $4.37 | |
| B | | Actual | | | 1.60% | | | | $1,000.00 | | | | $1,124.19 | | | | $8.54 | |
| | Hypothetical (h) | | | 1.60% | | | | $1,000.00 | | | | $1,017.09 | | | | $8.11 | |
| C | | Actual | | | 1.61% | | | | $1,000.00 | | | | $1,124.19 | | | | $8.60 | |
| | Hypothetical (h) | | | 1.61% | | | | $1,000.00 | | | | $1,017.04 | | | | $8.16 | |
| I | | Actual | | | 0.61% | | | | $1,000.00 | | | | $1,129.45 | | | | $3.27 | |
| | Hypothetical (h) | | | 0.61% | | | | $1,000.00 | | | | $1,022.07 | | | | $3.10 | |
| R1 | | Actual | | | 1.60% | | | | $1,000.00 | | | | $1,124.19 | | | | $8.54 | |
| | Hypothetical (h) | | | 1.60% | | | | $1,000.00 | | | | $1,017.09 | | | | $8.11 | |
| R2 | | Actual | | | 1.10% | | | | $1,000.00 | | | | $1,127.43 | | | | $5.88 | |
| | Hypothetical (h) | | | 1.10% | | | | $1,000.00 | | | | $1,019.61 | | | | $5.58 | |
| R3 | | Actual | | | 0.85% | | | | $1,000.00 | | | | $1,128.37 | | | | $4.55 | |
| | Hypothetical (h) | | | 0.85% | | | | $1,000.00 | | | | $1,020.86 | | | | $4.32 | |
| R4 | | Actual | | | 0.60% | | | | $1,000.00 | | | | $1,130.53 | | | | $3.21 | |
| | Hypothetical (h) | | | 0.60% | | | | $1,000.00 | | | | $1,022.12 | | | | $3.05 | |
| R6 (formerly Class R5) | | Actual | | | 0.60% | | | | $1,000.00 | | | | $1,130.53 | | | | $3.21 | |
| | Hypothetical (h) | | | 0.60% | | | | $1,000.00 | | | | $1,022.12 | | | | $3.05 | |
| (h) | 5% class return per year before expenses. |
| (p) | “Expenses Paid During Period” are equal to each class’s annualized expense ratio, as shown above, multiplied by the average account value over the period, multiplied by 184/366 (to reflect the one-half year period). Expenses paid do not include any applicable sales charges (loads). If these transaction costs had been included, your costs would have been higher. |
10
PORTFOLIO OF INVESTMENTS
8/31/16
The Portfolio of Investments is a complete list of all securities owned by your fund. It is categorized by broad-based asset classes.
| | | | | | | | |
| Common Stocks - 96.6% | | | | | | | | |
| Issuer | | Shares/Par | | | Value ($) | |
| Aerospace - 1.7% | | | | | | | | |
| Northrop Grumman Corp. | | | 284 | | | $ | 60,228 | |
| Orbital ATK, Inc. | | | 128 | | | | 9,655 | |
| | | | | | | | |
| | | | $ | 69,883 | |
| Airlines - 1.6% | | | | | | | | |
| Aena S.A. | | | 220 | | | $ | 31,104 | |
| Air Canada (a) | | | 5,092 | | | | 34,791 | |
| | | | | | | | |
| | | | $ | 65,895 | |
| Automotive - 3.2% | | | | | | | | |
| General Motors Co. | | | 660 | | | $ | 21,067 | |
| Hyundai Motor Co. Ltd. | | | 218 | | | | 26,004 | |
| Kia Motors Corp. | | | 1,181 | | | | 44,433 | |
| Magna International, Inc. | | | 1,045 | | | | 42,114 | |
| | | | | | | | |
| | | | $ | 133,618 | |
| Biotechnology - 2.0% | | | | | | | | |
| Bavarian Nordic A/S (a) | | | 619 | | | $ | 22,498 | |
| Celgene Corp. (a) | | | 289 | | | | 30,848 | |
| Gilead Sciences, Inc. | | | 395 | | | | 30,960 | |
| | | | | | | | |
| | | | $ | 84,306 | |
| Broadcasting - 0.5% | | | | | | | | |
| Time Warner, Inc. | | | 265 | | | $ | 20,779 | |
| | |
| Business Services - 3.1% | | | | | | | | |
| Accenture PLC, “A” | | | 221 | | | $ | 25,415 | |
| Ashtead Group PLC | | | 2,552 | | | | 42,392 | |
| Global Payments, Inc. | | | 803 | | | | 60,988 | |
| | | | | | | | |
| | | | $ | 128,795 | |
| Cable TV - 2.1% | | | | | | | | |
| Charter Communications, Inc., “A” (a) | | | 240 | | | $ | 61,730 | |
| Comcast Corp., “A” | | | 439 | | | | 28,649 | |
| | | | | | | | |
| | | | $ | 90,379 | |
| Chemicals - 1.0% | | | | | | | | |
| LyondellBasell Industries N.V., “A” | | | 518 | | | $ | 40,865 | |
11
Portfolio of Investments – continued
| | | | | | | | |
| Issuer | | Shares/Par | | | Value ($) | |
| Common Stocks - continued | | | | | | | | |
| Computer Software - 2.0% | | | | | | | | |
| Adobe Systems, Inc. (a) | | | 338 | | | $ | 34,581 | |
| Intuit, Inc. | | | 427 | | | | 47,589 | |
| | | | | | | | |
| | | | $ | 82,170 | |
| Computer Software - Systems - 2.8% | | | | | | | | |
| Apple, Inc. | | | 159 | | | $ | 16,870 | |
| EMC Corp. | | | 920 | | | | 26,671 | |
| Hitachi Ltd. | | | 3,000 | | | | 14,382 | |
| Hon Hai Precision Industry Co. Ltd., GDR | | | 3,968 | | | | 21,626 | |
| NICE Systems Ltd., ADR | | | 202 | | | | 13,823 | |
| Vantiv, Inc., “A” (a) | | | 428 | | | | 23,001 | |
| | | | | | | | |
| | | | $ | 116,373 | |
| Construction - 2.1% | | | | | | | | |
| Bellway PLC | | | 986 | | | $ | 30,168 | |
| Owens Corning | | | 1,078 | | | | 59,204 | |
| | | | | | | | |
| | | | $ | 89,372 | |
| Consumer Products - 2.3% | | | | | | | | |
| Newell Brands, Inc. | | | 725 | | | $ | 38,483 | |
| Svenska Cellulosa Aktiebolaget | | | 1,856 | | | | 57,042 | |
| | | | | | | | |
| | | | $ | 95,525 | |
| Containers - 0.8% | | | | | | | | |
| Brambles Ltd. | | | 3,841 | | | $ | 35,564 | |
| | |
| Electrical Equipment - 2.1% | | | | | | | | |
| Mitsubishi Electric Corp. | | | 1,000 | | | $ | 13,053 | |
| Schneider Electric S.A. | | | 374 | | | | 25,485 | |
| Siemens AG | | | 435 | | | | 51,943 | |
| | | | | | | | |
| | | | $ | 90,481 | |
| Electronics - 3.7% | | | | | | | | |
| Samsung Electronics Co. Ltd. | | | 55 | | | $ | 79,910 | |
| Taiwan Semiconductor Manufacturing Co. Ltd., ADR | | | 2,692 | | | | 77,368 | |
| | | | | | | | |
| | | | $ | 157,278 | |
| Energy - Independent - 3.8% | | | | | | | | |
| EOG Resources, Inc. | | | 276 | | | $ | 24,423 | |
| Occidental Petroleum Corp. | | | 347 | | | | 26,667 | |
| Parsley Energy, Inc., “A” (a) | | | 772 | | | | 26,132 | |
| Rice Energy, Inc. (a) | | | 1,338 | | | | 35,189 | |
| Valero Energy Corp. | | | 891 | | | | 49,317 | |
| | | | | | | | |
| | | | $ | 161,728 | |
12
Portfolio of Investments – continued
| | | | | | | | |
| Issuer | | Shares/Par | | | Value ($) | |
| Common Stocks - continued | | | | | | | | |
| Energy - Integrated - 2.4% | | | | | | | | |
| BP PLC | | | 6,201 | | | $ | 34,843 | |
| LUKOIL PJSC, ADR | | | 502 | | | | 22,515 | |
| Royal Dutch Shell PLC, “B” | | | 1,733 | | | | 44,194 | |
| | | | | | | | |
| | | | $ | 101,552 | |
| Food & Beverages - 3.4% | | | | | | | | |
| Archer Daniels Midland Co. | | | 880 | | | $ | 38,509 | |
| Bakkafrost P/f | | | 750 | | | | 26,957 | |
| Coca-Cola European Partners PLC | | | 567 | | | | 21,801 | |
| Marine Harvest | | | 1,851 | | | | 28,611 | |
| Nestle S.A. | | | 130 | | | | 10,349 | |
| Tyson Foods, Inc., “A” | | | 230 | | | | 17,381 | |
| | | | | | | | |
| | | | $ | 143,608 | |
| Food & Drug Stores - 1.0% | | | | | | | | |
| Wesfarmers Ltd. | | | 1,271 | | | $ | 40,540 | |
| | |
| Furniture & Appliances - 0.3% | | | | | | | | |
| Zojirushi Corp. | | | 700 | | | $ | 10,953 | |
| | |
| Gaming & Lodging - 1.6% | | | | | | | | |
| Carnival Corp. | | | 867 | | | $ | 41,443 | |
| Paddy Power PLC | | | 221 | | | | 26,583 | |
| | | | | | | | |
| | | | $ | 68,026 | |
| General Merchandise - 0.7% | | | | | | | | |
| Target Corp. | | | 394 | | | $ | 27,655 | |
| | |
| Health Maintenance Organizations - 0.9% | | | | | | | | |
| Anthem, Inc. | | | 319 | | | $ | 39,901 | |
| | |
| Insurance - 4.2% | | | | | | | | |
| MetLife, Inc. | | | 1,289 | | | $ | 55,943 | |
| Prudential Financial, Inc. | | | 552 | | | | 43,818 | |
| Sony Financial Holdings, Inc. | | | 2,600 | | | | 35,709 | |
| Tokio Marine Holding, Inc. | | | 1,100 | | | | 43,207 | |
| | | | | | | | |
| | | | $ | 178,677 | |
| Internet - 3.9% | | | | | | | | |
| Alibaba Group Holding Ltd., ADR (a) | | | 150 | | | $ | 14,579 | |
| Alphabet, Inc., “A” (a) | | | 111 | | | | 87,673 | |
| Alphabet, Inc., “C” (a) | | | 30 | | | | 23,012 | |
| Facebook, Inc., “A” (a) | | | 312 | | | | 39,349 | |
| | | | | | | | |
| | | | $ | 164,613 | |
13
Portfolio of Investments – continued
| | | | | | | | |
| Issuer | | Shares/Par | | | Value ($) | |
| Common Stocks - continued | | | | | | | | |
| Machinery & Tools - 0.7% | | | | | | | | |
| Glory Ltd. | | | 900 | | | $ | 28,836 | |
| | |
| Major Banks - 6.9% | | | | | | | | |
| Bank of China Ltd. | | | 52,000 | | | $ | 23,394 | |
| BNP Paribas | | | 1,093 | | | | 55,601 | |
| Goldman Sachs Group, Inc. | | | 143 | | | | 24,233 | |
| JPMorgan Chase & Co. | | | 1,177 | | | | 79,448 | |
| Royal Bank of Canada | | | 279 | | | | 17,345 | |
| Sumitomo Mitsui Financial Group, Inc. | | | 1,500 | | | | 52,496 | |
| Wells Fargo & Co. | | | 747 | | | | 37,948 | |
| | | | | | | | |
| | | | $ | 290,465 | |
| Medical & Health Technology & Services - 1.3% | | | | | | | | |
| HCA Holdings, Inc. (a) | | | 719 | | | $ | 54,320 | |
| | |
| Medical Equipment - 0.4% | | | | | | | | |
| Nihon Kohden Corp. | | | 800 | | | $ | 18,217 | |
| | |
| Metals & Mining - 1.2% | | | | | | | | |
| Rio Tinto Ltd. | | | 1,613 | | | $ | 48,738 | |
| | |
| Natural Gas - Distribution - 0.6% | | | | | | | | |
| Engie | | | 1,578 | | | $ | 25,153 | |
| | |
| Network & Telecom - 1.5% | | | | | | | | |
| Cisco Systems, Inc. | | | 1,965 | | | $ | 61,780 | |
| | |
| Oil Services - 0.5% | | | | | | | | |
| Technip | | | 357 | | | $ | 21,093 | |
| | |
| Other Banks & Diversified Financials - 4.5% | | | | | | | | |
| China Construction Bank | | | 30,000 | | | $ | 22,430 | |
| DBS Group Holdings Ltd. | | | 3,900 | | | | 42,909 | |
| Discover Financial Services | | | 779 | | | | 46,740 | |
| KBC Groep N.V. | | | 475 | | | | 28,119 | |
| UBS AG | | | 3,514 | | | | 50,805 | |
| | | | | | | | |
| | | | $ | 191,003 | |
| Pharmaceuticals - 6.4% | | | | | | | | |
| Bayer AG | | | 367 | | | $ | 39,287 | |
| Bristol-Myers Squibb Co. | | | 781 | | | | 44,822 | |
| Eli Lilly & Co. | | | 811 | | | | 63,055 | |
| Gedeon Richter PLC | | | 512 | | | | 10,503 | |
14
Portfolio of Investments – continued
| | | | | | | | |
| Issuer | | Shares/Par | | | Value ($) | |
| Common Stocks - continued | | | | | | | | |
| Pharmaceuticals - continued | | | | | | | | |
| Merck & Co., Inc. | | | 1,033 | | | $ | 64,862 | |
| Shionogi & Co. Ltd. | | | 700 | | | | 31,250 | |
| Teva Pharmaceutical Industries Ltd., ADR | | | 338 | | | | 17,032 | |
| | | | | | | | |
| | | | $ | 270,811 | |
| Precious Metals & Minerals - 0.7% | | | | | | | | |
| Anglogold Ashanti Ltd. (a) | | | 1,691 | | | $ | 27,579 | |
| | |
| Printing & Publishing - 0.5% | | | | | | | | |
| Transcontinental, Inc., “A” | | | 1,307 | | | $ | 19,136 | |
| | |
| Railroad & Shipping - 0.9% | | | | | | | | |
| Canadian National Railway Co. | | | 564 | | | $ | 36,271 | |
| | |
| Real Estate - 2.8% | | | | | | | | |
| Medical Properties Trust, Inc., REIT | | | 2,008 | | | $ | 30,662 | |
| Mid-America Apartment Communities, Inc., REIT | | | 128 | | | | 12,031 | |
| Store Capital Corp., REIT | | | 1,048 | | | | 31,052 | |
| Washington Prime Group, Inc., REIT | | | 3,194 | | | | 43,886 | |
| | | | | | | | |
| | | | $ | 117,631 | |
| Restaurants - 0.5% | | | | | | | | |
| Greggs PLC | | | 1,510 | | | $ | 20,562 | |
| | |
| Specialty Chemicals - 1.0% | | | | | | | | |
| Akzo Nobel N.V. | | | 605 | | | $ | 40,882 | |
| | |
| Specialty Stores - 4.0% | | | | | | | | |
| Amazon.com, Inc. (a) | | | 109 | | | $ | 83,838 | |
| AutoZone, Inc. (a) | | | 34 | | | | 25,221 | |
| Best Buy Co., Inc. | | | 364 | | | | 14,007 | |
| Gap, Inc. | | | 1,327 | | | | 33,002 | |
| Urban Outfitters, Inc. (a) | | | 389 | | | | 13,946 | |
| | | | | | | | |
| | | | $ | 170,014 | |
| Telecommunications - Wireless - 0.7% | | | | | | | | |
| KDDI Corp. | | | 1,000 | | | $ | 29,343 | |
| | |
| Telephone Services - 2.5% | | | | | | | | |
| China Unicom (Hong Kong) Ltd. | | | 12,000 | | | $ | 13,597 | |
| France Telecom S.A. | | | 2,859 | | | | 43,658 | |
| Verizon Communications, Inc. | | | 953 | | | | 49,870 | |
| | | | | | | | |
| | | | $ | 107,125 | |
15
Portfolio of Investments – continued
| | | | | | | | |
| Issuer | | Shares/Par | | | Value ($) | |
| Common Stocks - continued | | | | | | | | |
| Tobacco - 3.2% | | | | | | | | |
| Altria Group, Inc. | | | 1,036 | | | $ | 68,469 | |
| Japan Tobacco, Inc. | | | 1,100 | | | | 42,612 | |
| Philip Morris International, Inc. | | | 236 | | | | 23,583 | |
| | | | | | | | |
| | | | $ | 134,664 | |
| Utilities - Electric Power - 2.6% | | | | | | | | |
| Energias de Portugal S.A. | | | 4,906 | | | $ | 16,445 | |
| Exelon Corp. | | | 1,451 | | | | 49,334 | |
| Korea Electric Power Corp. | | | 801 | | | | 41,666 | |
| | | | | | | | |
| | | | $ | 107,445 | |
| Total Common Stocks (Identified Cost, $3,874,515) | | | $ | 4,059,604 | |
| | |
| Preferred Stocks - 1.6% | | | | | | | | |
| Other Banks & Diversified Financials - 1.1% | | | | | | | | |
| Itau Unibanco Holding S.A. | | | 4,300 | | | $ | 47,734 | |
| | |
| Telephone Services - 0.5% | | | | | | | | |
| Telecom Italia S.p.A. | | | 28,189 | | | $ | 20,658 | |
| Total Preferred Stocks (Identified Cost, $60,388) | | | $ | 68,392 | |
| | |
| Money Market Funds - 2.5% | | | | | | | | |
MFS Institutional Money Market Portfolio, 0.38% (v)
(Identified Cost, $103,774) | | | 103,774 | | | $ | 103,774 | |
| Total Investments (Identified Cost, $4,038,677) | | | $ | 4,231,770 | |
| |
| Other Assets, Less Liabilities - (0.7)% | | | | (31,288 | ) |
| Net Assets - 100.0% | | | $ | 4,200,482 | |
| (a) | Non-income producing security. |
| (v) | Underlying affiliated fund that is available only to investment companies managed by MFS. The rate quoted for the MFS Institutional Money Market Portfolio is the annualized seven-day yield of the fund at period end. |
The following abbreviations are used in this report and are defined:
| ADR | | American Depositary Receipt |
| GDR | | Global Depositary Receipt |
| PJSC | | Public Joint Stock Company |
| PLC | | Public Limited Company |
| REIT | | Real Estate Investment Trust |
See Notes to Financial Statements
16
Financial Statements
STATEMENT OF ASSETS AND LIABILITIES
At 8/31/16
This statement represents your fund’s balance sheet, which details the assets and liabilities comprising the total value of the fund.
| | | | |
| Assets | | | | |
Investments | | | | |
Non-affiliated issuers, at value (identified cost, $3,934,903) | | | $4,127,996 | |
Underlying affiliated funds, at value (identified cost, $103,774) | | | 103,774 | |
Total investments, at value (identified cost, $4,038,677) | | | $4,231,770 | |
Foreign currency, at value (identified cost, $710) | | | 710 | |
Receivable for interest and dividends | | | 10,826 | |
Receivable from investment adviser | | | 20,187 | |
Other assets | | | 31 | |
Total assets | | | $4,263,524 | |
| Liabilities | | | | |
Payable to affiliates | | | | |
Shareholder servicing costs | | | $131 | |
Distribution and service fees | | | 16 | |
Payable for independent Trustees’ compensation | | | 14 | |
Accrued expenses and other liabilities | | | 62,881 | |
Total liabilities | | | $63,042 | |
Net assets | | | $4,200,482 | |
| Net assets consist of | | | | |
Paid-in capital | | | $4,009,284 | |
Unrealized appreciation (depreciation) on investments and translation of assets and liabilities in foreign currencies | | | 193,100 | |
Accumulated distributions in excess of net realized gain on investments and foreign currency | | | (60,806 | ) |
Undistributed net investment income | | | 58,904 | |
Net assets | | | $4,200,482 | |
Shares of beneficial interest outstanding | | | 401,130 | |
17
Statement of Assets and Liabilities – continued
| | | | | | | | | | | | |
| | | Net assets | | | Shares
outstanding | | | Net asset value
per share (a) | |
Class A | | | $168,268 | | | | 16,088 | | | | $10.46 | |
Class B | | | 52,219 | | | | 5,018 | | | | 10.41 | |
Class C | | | 104,386 | | | | 10,031 | | | | 10.41 | |
Class I | | | 923,792 | | | | 88,197 | | | | 10.47 | |
Class R1 | | | 52,217 | | | | 5,018 | | | | 10.41 | |
Class R2 | | | 52,470 | | | | 5,025 | | | | 10.44 | |
Class R3 | | | 52,597 | | | | 5,029 | | | | 10.46 | |
Class R4 | | | 52,722 | | | | 5,032 | | | | 10.48 | |
Class R6 (formerly Class R5) | | | 2,741,811 | | | | 261,692 | | | | 10.48 | |
| (a) | Maximum offering price per share was equal to the net asset value per share for all share classes, except for Class A, for which the maximum offering price per share was $11.10 [100 / 94.25 x $10.46]. On sales of $50,000 or more, the maximum offering price of Class A shares is reduced. A contingent deferred sales charge may be imposed on redemptions of Class A, Class B, and Class C shares. Redemption price per share was equal to the net asset value per share for Classes I, R1, R2, R3, R4, and R6. |
See Notes to Financial Statements
18
Financial Statements
STATEMENT OF OPERATIONS
Period ended 8/31/16 (c)
This statement describes how much your fund earned in investment income and accrued in expenses. It also describes any gains and/or losses generated by fund operations.
| | | | |
| Net investment income | | | | |
Income | | | | |
Dividends | | | $97,660 | |
Dividends from underlying affiliated funds | | | 282 | |
Foreign taxes withheld | | | (5,239 | ) |
Total investment income | | | $92,703 | |
Expenses | | | | |
Management fee | | | $16,300 | |
Distribution and service fees | | | 2,320 | |
Shareholder servicing costs | | | 747 | |
Administrative services fee | | | 16,829 | |
Independent Trustees’ compensation | | | 838 | |
Custodian fee | | | 21,580 | |
Shareholder communications | | | 5,387 | |
Audit and tax fees | | | 39,564 | |
Legal fees | | | 1,441 | |
Registration fees | | | 78,283 | |
Miscellaneous | | | 15,131 | |
Total expenses | | | $198,420 | |
Fees paid indirectly | | | (8 | ) |
Reduction of expenses by investment adviser | | | (176,483 | ) |
Net expenses | | | $21,929 | |
Net investment income | | | $70,774 | |
| Realized and unrealized gain (loss) on investments and foreign currency | |
Realized gain (loss) (identified cost basis) | | | | |
Investments | | | $(55,274 | ) |
Foreign currency | | | 1,721 | |
Net realized gain (loss) on investments and foreign currency | | | $(53,553 | ) |
Change in unrealized appreciation (depreciation) | | | | |
Investments | | | $193,093 | |
Translation of assets and liabilities in foreign currencies | | | 7 | |
Net unrealized gain (loss) on investments and foreign currency translation | | | $193,100 | |
Net realized and unrealized gain (loss) on investments and foreign currency | | | $139,547 | |
Change in net assets from operations | | | $210,321 | |
| (c) | For the period from the commencement of the fund’s investment operations, September 15, 2015, through the stated period end. |
See Notes to Financial Statements
19
Financial Statements
STATEMENT OF CHANGES IN NET ASSETS
This statement describes the increases and/or decreases in net assets resulting from operations, any distributions, and any shareholder transactions.
| | | | |
| | | Period ended 8/31/16 (c) | |
| Change in net assets | | | |
| From operations | | | | |
Net investment income | | | $70,774 | |
Net realized gain (loss) on investments and foreign currency | | | (53,553 | ) |
Net unrealized gain (loss) on investments and foreign currency translation | | | 193,100 | |
Change in net assets from operations | | | $210,321 | |
| Distributions declared to shareholders | | | | |
From net investment income | | | $(14,006 | ) |
From net realized gain on investments | | | (5,601 | ) |
Total distributions declared to shareholders | | | $(19,607 | ) |
Change in net assets from fund share transactions | | | $4,009,768 | |
Total change in net assets | | | $4,200,482 | |
| Net assets | | | | |
At beginning of period | | | — | |
At end of period (including undistributed net investment income of $58,904) | | | $4,200,482 | |
| (c) | For the period from the commencement of the fund’s investment operations, September 15, 2015, through the stated period end. |
See Notes to Financial Statements
20
Financial Statements
FINANCIAL HIGHLIGHTS
The financial highlights table is intended to help you understand the fund’s financial performance for the past 5 years (or life of a particular share class, if shorter). Certain information reflects financial results for a single fund share. The total returns in the table represent the rate by which an investor would have earned (or lost) on an investment in the fund share class (assuming reinvestment of all distributions) held for the entire period.
| | | | |
| Class A | | Period ended
8/31/16 (c) | |
Net asset value, beginning of period | | | $10.00 | |
| Income (loss) from investment operations | | | | |
Net investment income (d) | | | $0.20 | |
Net realized and unrealized gain (loss) on investments and foreign currency | | | 0.32 | |
Total from investment operations | | | $0.52 | |
| Less distributions declared to shareholders | | | | |
From net investment income | | | $(0.04 | ) |
From net realized gain on investments | | | (0.02 | ) |
Total distributions declared to shareholders | | | $(0.06 | ) |
Net asset value, end of period (x) | | | $10.46 | |
Total return (%) (r)(s)(t)(x) | | | 5.22 | (n) |
Ratios (%) (to average net assets)
and Supplemental data: | | | | |
Expenses before expense reductions (f) | | | 6.02 | (a) |
Expenses after expense reductions (f) | | | 0.86 | (a) |
Net investment income | | | 2.08 | (a) |
Portfolio turnover | | | 46 | (n) |
Net assets at end of period (000 omitted) | | | $168 | |
See Notes to Financial Statements
21
Financial Highlights – continued
| | | | |
| Class B | | Period ended
8/31/16 (c) | |
Net asset value, beginning of period | | | $10.00 | |
| Income (loss) from investment operations | | | | |
Net investment income (d) | | | $0.11 | |
Net realized and unrealized gain (loss) on investments and foreign currency | | | 0.34 | |
Total from investment operations | | | $0.45 | |
| Less distributions declared to shareholders | | | | |
From net investment income | | | $(0.02 | ) |
From net realized gain on investments | | | (0.02 | ) |
Total distributions declared to shareholders | | | $(0.04 | ) |
Net asset value, end of period (x) | | | $10.41 | |
Total return (%) (r)(s)(t)(x) | | | 4.47 | (n) |
Ratios (%) (to average net assets)
and Supplemental data: | | | | |
Expenses before expense reductions (f) | | | 7.17 | (a) |
Expenses after expense reductions (f) | | | 1.61 | (a) |
Net investment income | | | 1.19 | (a) |
Portfolio turnover | | | 46 | (n) |
Net assets at end of period (000 omitted) | | | $52 | |
| |
| Class C | | Period ended
8/31/16 (c) | |
Net asset value, beginning of period | | | $10.00 | |
| Income (loss) from investment operations | | | | |
Net investment income (d) | | | $0.13 | |
Net realized and unrealized gain (loss) on investments and foreign currency | | | 0.32 | |
Total from investment operations | | | $0.45 | |
| Less distributions declared to shareholders | | | | |
From net investment income | | | $(0.02 | ) |
From net realized gain on investments | | | (0.02 | ) |
Total distributions declared to shareholders | | | $(0.04 | ) |
Net asset value, end of period (x) | | | $10.41 | |
Total return (%) (r)(s)(t)(x) | | | 4.48 | (n) |
Ratios (%) (to average net assets)
and Supplemental data: | | | | |
Expenses before expense reductions (f) | | | 6.81 | (a) |
Expenses after expense reductions (f) | | | 1.61 | (a) |
Net investment income | | | 1.37 | (a) |
Portfolio turnover | | | 46 | (n) |
Net assets at end of period (000 omitted) | | | $104 | |
See Notes to Financial Statements
22
Financial Highlights – continued
| | | | |
| Class I | | Period ended
8/31/16 (c) | |
Net asset value, beginning of period | | | $10.00 | |
| Income (loss) from investment operations | | | | |
Net investment income (d) | | | $0.24 | |
Net realized and unrealized gain (loss) on investments and foreign currency | | | 0.30 | |
Total from investment operations | | | $0.54 | |
| Less distributions declared to shareholders | | | | |
From net investment income | | | $(0.05 | ) |
From net realized gain on investments | | | (0.02 | ) |
Total distributions declared to shareholders | | | $(0.07 | ) |
Net asset value, end of period (x) | | | $10.47 | |
Total return (%) (r)(s)(x) | | | 5.38 | (n) |
Ratios (%) (to average net assets)
and Supplemental data: | | | | |
Expenses before expense reductions (f) | | | 4.99 | (a) |
Expenses after expense reductions (f) | | | 0.61 | (a) |
Net investment income | | | 2.50 | (a) |
Portfolio turnover | | | 46 | (n) |
Net assets at end of period (000 omitted) | | | $924 | |
| |
| Class R1 | | Period ended
8/31/16 (c) | |
Net asset value, beginning of period | | | $10.00 | |
| Income (loss) from investment operations | | | | |
Net investment income (d) | | | $0.11 | |
Net realized and unrealized gain (loss) on investments and foreign currency | | | 0.34 | |
Total from investment operations | | | $0.45 | |
| Less distributions declared to shareholders | | | | |
From net investment income | | | $(0.02 | ) |
From net realized gain on investments | | | (0.02 | ) |
Total distributions declared to shareholders | | | $(0.04 | ) |
Net asset value, end of period (x) | | | $10.41 | |
Total return (%) (r)(s)(x) | | | 4.47 | (n) |
Ratios (%) (to average net assets)
and Supplemental data: | | | | |
Expenses before expense reductions (f) | | | 7.17 | (a) |
Expenses after expense reductions (f) | | | 1.61 | (a) |
Net investment income | | | 1.19 | (a) |
Portfolio turnover | | | 46 | (n) |
Net assets at end of period (000 omitted) | | | $52 | |
See Notes to Financial Statements
23
Financial Highlights – continued
| | | | |
| Class R2 | | Period ended
8/31/16 (c) | |
Net asset value, beginning of period | | | $10.00 | |
| Income (loss) from investment operations | | | | |
Net investment income (d) | | | $0.16 | |
Net realized and unrealized gain (loss) on investments and foreign currency | | | 0.33 | |
Total from investment operations | | | $0.49 | |
| Less distributions declared to shareholders | | | | |
From net investment income | | | $(0.03 | ) |
From net realized gain on investments | | | (0.02 | ) |
Total distributions declared to shareholders | | | $(0.05 | ) |
Net asset value, end of period (x) | | | $10.44 | |
Total return (%) (r)(s)(x) | | | 4.92 | (n) |
Ratios (%) (to average net assets)
and Supplemental data: | | | | |
Expenses before expense reductions (f) | | | 6.67 | (a) |
Expenses after expense reductions (f) | | | 1.11 | (a) |
Net investment income | | | 1.69 | (a) |
Portfolio turnover | | | 46 | (n) |
Net assets at end of period (000 omitted) | | | $52 | |
| |
| Class R3 | | Period ended
8/31/16 (c) | |
Net asset value, beginning of period | | | $10.00 | |
| Income (loss) from investment operations | | | | |
Net investment income (d) | | | $0.19 | |
Net realized and unrealized gain (loss) on investments and foreign currency | | | 0.33 | |
Total from investment operations | | | $0.52 | |
| Less distributions declared to shareholders | | | | |
From net investment income | | | $(0.04 | ) |
From net realized gain on investments | | | (0.02 | ) |
Total distributions declared to shareholders | | | $(0.06 | ) |
Net asset value, end of period (x) | | | $10.46 | |
Total return (%) (r)(s)(x) | | | 5.20 | (n) |
Ratios (%) (to average net assets)
and Supplemental data: | | | | |
Expenses before expense reductions (f) | | | 6.41 | (a) |
Expenses after expense reductions (f) | | | 0.86 | (a) |
Net investment income | | | 1.94 | (a) |
Portfolio turnover | | | 46 | (n) |
Net assets at end of period (000 omitted) | | | $53 | |
See Notes to Financial Statements
24
Financial Highlights – continued
| | | | |
| Class R4 | | Period ended
8/31/16 (c) | |
Net asset value, beginning of period | | | $10.00 | |
| Income (loss) from investment operations | | | | |
Net investment income (d) | | | $0.21 | |
Net realized and unrealized gain (loss) on investments and foreign currency | | | 0.34 | |
Total from investment operations | | | $0.55 | |
| Less distributions declared to shareholders | | | | |
From net investment income | | | $(0.05 | ) |
From net realized gain on investments | | | (0.02 | ) |
Total distributions declared to shareholders | | | $(0.07 | ) |
Net asset value, end of period (x) | | | $10.48 | |
Total return (%) (r)(s)(x) | | | 5.48 | (n) |
Ratios (%) (to average net assets)
and Supplemental data: | | | | |
Expenses before expense reductions (f) | | | 6.16 | (a) |
Expenses after expense reductions (f) | | | 0.61 | (a) |
Net investment income | | | 2.19 | (a) |
Portfolio turnover | | | 46 | (n) |
Net assets at end of period (000 omitted) | | | $53 | |
| |
| Class R6 (formerly Class R5) | | Period ended
8/31/16 (c) | |
Net asset value, beginning of period | | | $10.00 | |
| Income (loss) from investment operations | | | | |
Net investment income (d) | | | $0.21 | |
Net realized and unrealized gain (loss) on investments and foreign currency | | | 0.34 | |
Total from investment operations | | | $0.55 | |
| Less distributions declared to shareholders | | | | |
From net investment income | | | $(0.05 | ) |
From net realized gain on investments | | | (0.02 | ) |
Total distributions declared to shareholders | | | $(0.07 | ) |
Net asset value, end of period (x) | | | $10.48 | |
Total return (%) (r)(s)(x) | | | 5.48 | (n) |
Ratios (%) (to average net assets)
and Supplemental data: | | | | |
Expenses before expense reductions (f) | | | 6.16 | (a) |
Expenses after expense reductions (f) | | | 0.60 | (a) |
Net investment income | | | 2.20 | (a) |
Portfolio turnover | | | 46 | (n) |
Net assets at end of period (000 omitted) | | | $2,742 | |
See Notes to Financial Statements
25
Financial Highlights – continued
| (c) | For the period from the commencement of the fund’s investment operations, September 15, 2015, through the stated period end. |
| (d) | Per share data is based on average shares outstanding. |
| (f) | Ratios do not reflect reductions from fees paid indirectly, if applicable. |
| (r) | Certain expenses have been reduced without which performance would have been lower. |
| (s) | From time to time the fund may receive proceeds from litigation settlements, without which performance would be lower. |
| (t) | Total returns do not include any applicable sales charges. |
| (x) | The net asset values and total returns have been calculated on net assets which include adjustments made in accordance with U.S. generally accepted accounting principles required at period end for financial reporting purposes. |
See Notes to Financial Statements
26
NOTES TO FINANCIAL STATEMENTS
(1) Business and Organization
MFS Blended Research Global Equity Fund (the fund) is a diversified series of MFS Series Trust IV (the trust). The trust is organized as a Massachusetts business trust and is registered under the Investment Company Act of 1940, as amended, as an open-end management investment company.
The fund is an investment company and accordingly follows the investment company accounting and reporting guidance of the Financial Accounting Standards Board (FASB) Accounting Standards Codification Topic 946 Financial Services – Investment Companies.
(2) Significant Accounting Policies
General – The preparation of financial statements in conformity with U.S. generally accepted accounting principles requires management to make estimates and assumptions that affect the reported amounts of assets and liabilities, and disclosure of contingent assets and liabilities at the date of the financial statements and the reported amounts of increases and decreases in net assets from operations during the reporting period. Actual results could differ from those estimates. In the preparation of these financial statements, management has evaluated subsequent events occurring after the date of the fund’s Statement of Assets and Liabilities through the date that the financial statements were issued. The fund invests in foreign securities. Investments in foreign securities are vulnerable to the effects of changes in the relative values of the local currency and the U.S. dollar and to the effects of changes in each country’s legal, political, and economic environment.
Balance Sheet Offsetting – The fund’s accounting policy with respect to balance sheet offsetting is that, absent an event of default by the counterparty or a termination of the agreement, the International Swaps and Derivatives Association (ISDA) Master Agreement does not result in an offset of reported amounts of financial assets and financial liabilities in the Statement of Assets and Liabilities across transactions between the fund and the applicable counterparty. The fund’s right to setoff may be restricted or prohibited by the bankruptcy or insolvency laws of the particular jurisdiction to which a specific master netting agreement counterparty is subject. Balance sheet offsetting disclosures, to the extent applicable to the fund, have been included in the fund’s Significant Accounting Policies note under the captions for each of the fund’s in-scope financial instruments and transactions.
Investment Valuations – Equity securities, including restricted equity securities, are generally valued at the last sale or official closing price on their primary market or exchange as provided by a third-party pricing service. Equity securities, for which there were no sales reported that day, are generally valued at the last quoted daily bid quotation on their primary market or exchange as provided by a third-party pricing service. Short-term instruments with a maturity at issuance of 60 days or less may be valued at amortized cost, which approximates market value. Open-end investment companies are generally valued at net asset value per share. Securities and other assets generally valued on the basis of information from a third-party pricing service may also be valued at a broker/dealer bid quotation. Values obtained from third-party pricing
27
Notes to Financial Statements – continued
services can utilize both transaction data and market information such as yield, quality, coupon rate, maturity, type of issue, trading characteristics, and other market data. The values of foreign securities and other assets and liabilities expressed in foreign currencies are converted to U.S. dollars using the mean of bid and asked prices for rates provided by a third-party pricing service.
The Board of Trustees has delegated primary responsibility for determining or causing to be determined the value of the fund’s investments (including any fair valuation) to the adviser pursuant to valuation policies and procedures approved by the Board. If the adviser determines that reliable market quotations are not readily available, investments are valued at fair value as determined in good faith by the adviser in accordance with such procedures under the oversight of the Board of Trustees. Under the fund’s valuation policies and procedures, market quotations are not considered to be readily available for most types of debt instruments and floating rate loans and many types of derivatives. These investments are generally valued at fair value based on information from third-party pricing services. In addition, investments may be valued at fair value if the adviser determines that an investment’s value has been materially affected by events occurring after the close of the exchange or market on which the investment is principally traded (such as foreign exchange or market) and prior to the determination of the fund’s net asset value, or after the halting of trading of a specific security where trading does not resume prior to the close of the exchange or market on which the security is principally traded. Events that occur on a frequent basis after foreign markets close (such as developments in foreign markets and significant movements in the U.S. markets) and prior to the determination of the fund’s net asset value may be deemed to have a material effect on the value of securities traded in foreign markets. Accordingly, the fund’s foreign equity securities may often be valued at fair value. The adviser generally relies on third-party pricing services or other information (such as the correlation with price movements of similar securities in the same or other markets; the type, cost and investment characteristics of the security; the business and financial condition of the issuer; and trading and other market data) to assist in determining whether to fair value and at what value to fair value an investment. The value of an investment for purposes of calculating the fund’s net asset value can differ depending on the source and method used to determine value. When fair valuation is used, the value of an investment used to determine the fund’s net asset value may differ from quoted or published prices for the same investment. There can be no assurance that the fund could obtain the fair value assigned to an investment if it were to sell the investment at the same time at which the fund determines its net asset value per share.
Various inputs are used in determining the value of the fund’s assets or liabilities. These inputs are categorized into three broad levels. In certain cases, the inputs used to measure fair value may fall into different levels of the fair value hierarchy. In such cases, an investment’s level within the fair value hierarchy is based on the lowest level of input that is significant to the fair value measurement. The fund’s assessment of the significance of a particular input to the fair value measurement in its entirety requires judgment, and considers factors specific to the investment. Level 1 includes unadjusted quoted prices in active markets for identical assets or liabilities. Level 2 includes other significant observable market-based inputs (including quoted prices for similar securities, interest rates, prepayment speed, and credit risk). Level 3 includes
28
Notes to Financial Statements – continued
unobservable inputs, which may include the adviser’s own assumptions in determining the fair value of investments. The following is a summary of the levels used as of August 31, 2016 in valuing the fund’s assets or liabilities:
| | | | | | | | | | | | | | | | |
| Investments at Value | | Level 1 | | | Level 2 | | | Level 3 | | | Total | |
| Equity Securities | | | $4,127,996 | | | | $— | | | | $— | | | | $4,127,996 | |
| Mutual Funds | | | 103,774 | | | | — | | | | — | | | | 103,774 | |
| Total Investments | | | $4,231,770 | | | | $— | | | | $— | | | | $4,231,770 | |
For further information regarding security characteristics, see the Portfolio of Investments.
Foreign Currency Translation – Purchases and sales of foreign investments, income, and expenses are converted into U.S. dollars based upon currency exchange rates prevailing on the respective dates of such transactions or on the reporting date for foreign denominated receivables and payables. Gains and losses attributable to foreign currency exchange rates on sales of securities are recorded for financial statement purposes as net realized gains and losses on investments. Gains and losses attributable to foreign exchange rate movements on receivables, payables, income and expenses are recorded for financial statement purposes as foreign currency transaction gains and losses. That portion of both realized and unrealized gains and losses on investments that results from fluctuations in foreign currency exchange rates is not separately disclosed.
Indemnifications – Under the fund’s organizational documents, its officers and Trustees may be indemnified against certain liabilities and expenses arising out of the performance of their duties to the fund. Additionally, in the normal course of business, the fund enters into agreements with service providers that may contain indemnification clauses. The fund’s maximum exposure under these agreements is unknown as this would involve future claims that may be made against the fund that have not yet occurred.
Investment Transactions and Income – Investment transactions are recorded on the trade date. Dividends received in cash are recorded on the ex-dividend date. Certain dividends from foreign securities will be recorded when the fund is informed of the dividend if such information is obtained subsequent to the ex-dividend date. Dividend payments received in additional securities are recorded on the ex-dividend date in an amount equal to the value of the security on such date.
The fund may receive proceeds from litigation settlements. Any proceeds received from litigation involving portfolio holdings are reflected in the Statement of Operations in realized gain/loss if the security has been disposed of by the fund or in unrealized gain/loss if the security is still held by the fund. Any other proceeds from litigation not related to portfolio holdings are reflected as other income in the Statement of Operations.
Fees Paid Indirectly – Prior to October 1, 2015, the fund’s custody fee could be reduced by a credit earned under an arrangement that measured the value of U.S. dollars deposited with the custodian by the fund. The amount of the credit, for the period ended August 31, 2016, is shown as a reduction of total expenses in the Statement of Operations.
29
Notes to Financial Statements – continued
Tax Matters and Distributions – The fund intends to qualify as a regulated investment company, as defined under Subchapter M of the Internal Revenue Code, and to distribute all of its taxable income, including realized capital gains. As a result, no provision for federal income tax is required. The fund’s federal tax returns, when filed, will remain subject to examination by the Internal Revenue Service for a three year period. Management has analyzed the fund’s tax positions taken on federal and state tax returns for all open tax years and does not believe that there are any uncertain tax positions that require recognition of a tax liability. Foreign taxes, if any, have been accrued by the fund in the accompanying financial statements in accordance with the applicable foreign tax law. Foreign income taxes may be withheld by certain countries in which the fund invests. Additionally, capital gains realized by the fund on securities issued in or by certain foreign countries may be subject to capital gains tax imposed by those countries.
Distributions to shareholders are recorded on the ex-dividend date. Income and capital gain distributions are determined in accordance with income tax regulations, which may differ from U.S. generally accepted accounting principles. Certain capital accounts in the financial statements are periodically adjusted for permanent differences in order to reflect their tax character. These adjustments have no impact on net assets or net asset value per share. Temporary differences which arise from recognizing certain items of income, expense, gain or loss in different periods for financial statement and tax purposes will reverse at some time in the future. Distributions in excess of net investment income or net realized gains are temporary overdistributions for financial statement purposes resulting from differences in the recognition or classification of income or distributions for financial statement and tax purposes.
Book/tax differences primarily relate to wash sale loss deferrals.
The tax character of distributions declared to shareholders for the last fiscal year is as follows:
| | | | |
| | | 8/31/16 | |
Ordinary income (including any
short-term capital gains) | | | $19,607 | |
The federal tax cost and the tax basis components of distributable earnings were as follows:
| | | | |
| As of 8/31/16 | | | |
| Cost of investments | | | $4,042,341 | |
| Gross appreciation | | | 354,236 | |
| Gross depreciation | | | (164,807 | ) |
| Net unrealized appreciation (depreciation) | | | $189,429 | |
| Undistributed ordinary income | | | 58,904 | |
| Post-October capital loss deferral | | | (57,142 | ) |
| Other temporary differences | | | 7 | |
Multiple Classes of Shares of Beneficial Interest – The fund offers multiple classes of shares, which differ in their respective distribution and/or service fees. The fund’s income, realized and unrealized gain (loss), and common expenses are allocated to
30
Notes to Financial Statements – continued
shareholders based on the daily net assets of each class. Dividends are declared separately for each class. Differences in per share dividend rates are generally due to differences in separate class expenses. Class B shares will convert to Class A shares approximately eight years after service. The fund’s distributions declared to shareholders as reported in the Statement of Changes in Net Assets are presented by class as follows:
| | | | | | | | |
| | | From net investment
income | | | From net realized gain on
investments | |
| | | Period
ended
8/31/16 (c) | | | Period
ended
8/31/16 (c) | |
| Class A | | | $284 | | | | $125 | |
| Class B | | | 86 | | | | 91 | |
| Class C | | | 95 | | | | 95 | |
| Class I | | | 564 | | | | 217 | |
| Class R1 | | | 86 | | | | 91 | |
| Class R2 | | | 160 | | | | 91 | |
| Class R3 | | | 198 | | | | 91 | |
| Class R4 | | | 235 | | | | 91 | |
| Class R6 (formerly Class R5) | | | 12,298 | | | | 4,709 | |
| Total | | | $14,006 | | | | $5,601 | |
| (c) | For the period from the commencement of the fund’s investment operations, September 15, 2015, through the stated period end. |
(3) Transactions with Affiliates
Investment Adviser – The fund has an investment advisory agreement with MFS to provide overall investment management and related administrative services and facilities to the fund. The management fee is computed daily and paid monthly at the following annual rates:
| | | | |
| First $1 billion of average daily net assets | | | 0.50% | |
| Next $1.5 billion of average daily net assets | | | 0.475% | |
| Average daily net assets in excess of $2.5 billion | | | 0.45% | |
MFS has agreed in writing to reduce its management fee by a specified amount if certain MFS mutual fund assets exceed thresholds agreed to by MFS and the fund’s Board of Trustees. For the period ended August 31, 2016, this management fee reduction amounted to $233, which is included in the reduction of total expenses in the Statement of Operations. The management fee incurred for the period ended August 31, 2016, was equivalent to an annual effective rate of 0.49% of the fund’s average daily net assets.
The investment adviser has agreed in writing to pay a portion of the fund’s total annual operating expenses, excluding interest, taxes, extraordinary expenses, brokerage and
31
Notes to Financial Statements – continued
transaction costs, and investment-related expenses, such that total fund operating expenses do not exceed the following rates annually of each class’s average daily net assets:
| | | | | | | | | | | | | | | | | | | | | | | | | | | | | | | | |
| Classes | |
| A | | B | | | C | | | I | | | R1 | | | R2 | | | R3 | | | R4 | | | R6
(formerly
Class R5) | |
| 0.89% | | | 1.64% | | | | 1.64% | | | | 0.64% | | | | 1.64% | | | | 1.14% | | | | 0.89% | | | | 0.64% | | | | 0.60% | |
This written agreement will continue until modified by the fund’s Board of Trustees, but such agreement will continue at least until December 31, 2017. For the period ended August 31, 2016, this reduction amounted to $176,250, which is included in the reduction of total expenses in the Statement of Operations.
Distributor – MFS Fund Distributors, Inc. (MFD), a wholly-owned subsidiary of MFS, as distributor, received $579 for the period ended August 31, 2016, as a portion of the initial sales charge on sales of Class A shares of the fund.
The Board of Trustees has adopted a distribution plan for certain share classes pursuant to Rule 12b-1 under the Investment Company Act of 1940.
The fund’s distribution plan provides that the fund will pay MFD for services provided by MFD and financial intermediaries in connection with the distribution and servicing of certain share classes. One component of the plan is a distribution fee paid to MFD and another component of the plan is a service fee paid to MFD. MFD may subsequently pay all, or a portion, of the distribution and/or service fees to financial intermediaries.
Distribution Plan Fee Table:
| | | | | | | | | | | | | | | | | | | | |
| | | Distribution
Fee Rate (d) | | | Service
Fee Rate (d) | | | Total
Distribution
Plan (d) | | | Annual
Effective
Rate (e) | | | Distribution
and Service
Fee | |
| Class A | | | — | | | | 0.25% | | | | 0.25% | | | | 0.25% | | | | $233 | |
| Class B | | | 0.75% | | | | 0.25% | | | | 1.00% | | | | 1.00% | | | | 479 | |
| Class C | | | 0.75% | | | | 0.25% | | | | 1.00% | | | | 1.00% | | | | 769 | |
| Class R1 | | | 0.75% | | | | 0.25% | | | | 1.00% | | | | 1.00% | | | | 479 | |
| Class R2 | | | 0.25% | | | | 0.25% | | | | 0.50% | | | | 0.50% | | | | 240 | |
| Class R3 | | | — | | | | 0.25% | | | | 0.25% | | | | 0.25% | | | | 120 | |
| Total Distribution and Service Fees | | | | $2,320 | |
| (d) | In accordance with the distribution plan for certain classes, the fund pays distribution and/or service fees equal to these annual percentage rates of each class’s average daily net assets. The distribution and service fee rates disclosed by class represent the current rates in effect at the end of the reporting period. Any rate changes, if applicable, are detailed below. |
| (e) | The annual effective rates represent actual fees incurred under the distribution plan for the period ended August 31, 2016 based on each class’s average daily net assets. MFD has voluntarily agreed to rebate a portion of each class’s 0.25% service fee attributable to accounts for which MFD retains the 0.25% service fee except for accounts attributable to MFS or its affiliates’ seed money. There were no service fee rebates for the period ended August 31, 2016. |
Certain Class A shares are subject to a contingent deferred sales charge (CDSC) in the event of a shareholder redemption within 18 months of purchase. Class C shares are
32
Notes to Financial Statements – continued
subject to a CDSC in the event of a shareholder redemption within 12 months of purchase. Class B shares are subject to a CDSC in the event of a shareholder redemption within six years of purchase. All contingent deferred sales charges are paid to MFD and during the period ended August 31, 2016 were as follows:
| | | | |
| | | Amount | |
| Class A | | | $— | |
| Class B | | | — | |
| Class C | | | 20 | |
Shareholder Servicing Agent – MFS Service Center, Inc. (MFSC), a wholly-owned subsidiary of MFS, receives a fee from the fund for its services as shareholder servicing agent calculated as a percentage of the average daily net assets of the fund as determined periodically under the supervision of the fund’s Board of Trustees. For the period ended August 31, 2016, the fee was $352, which equated to 0.0108% annually of the fund’s average daily net assets. MFSC also receives payment from the fund for out-of-pocket expenses, sub-accounting and other shareholder servicing costs which may be paid to affiliated and unaffiliated service providers. Class R6 shares do not incur sub-accounting fees. For the period ended August 31, 2016, these out-of-pocket expenses, sub-accounting and other shareholder servicing costs amounted to $395.
Administrator – MFS provides certain financial, legal, shareholder communications, compliance, and other administrative services to the fund. Under an administrative services agreement, the fund reimburses MFS the costs incurred to provide these services. The fund is charged an annual fixed amount of $17,500 plus a fee based on average daily net assets. The administrative services fee incurred for the period ended August 31, 2016 was equivalent to an annual effective rate of 0.5162% of the fund’s average daily net assets.
Trustees’ and Officers’ Compensation – The fund pays compensation to independent Trustees in the form of a retainer, attendance fees, and additional compensation to Board and Committee chairpersons. The fund does not pay compensation directly to Trustees or officers of the fund who are also officers of the investment adviser, all of whom receive remuneration for their services to the fund from MFS. Certain officers and Trustees of the fund are officers or directors of MFS, MFD, and MFSC.
Other – This fund and certain other funds managed by MFS (the funds) have entered into a service agreement (the ISO Agreement) which provides for payment of fees solely by the funds to Tarantino LLC in return for the provision of services of an Independent Senior Officer (ISO) for the funds. Frank L. Tarantino serves as the ISO and is an officer of the funds and the sole member of Tarantino LLC. The funds can terminate the ISO Agreement with Tarantino LLC at any time under the terms of the ISO Agreement. For the period ended August 31, 2016, the fee paid by the fund under this agreement was $7 and is included in “Miscellaneous” expense in the Statement of Operations. MFS has agreed to bear all expenses associated with office space, other administrative support, and supplies provided to the ISO.
The fund invests in the MFS Institutional Money Market Portfolio which is managed by MFS and seeks current income consistent with preservation of capital and liquidity.
33
Notes to Financial Statements – continued
Income earned on this investment is included in “Dividends from underlying affiliated funds” in the Statement of Operations. This money market fund does not pay a management fee to MFS.
On September 14, 2015, MFS purchased 5,000 shares each of Class A, Class B, Class C, Class I, Class R1, Class R2, Class R3, and Class R4, and 260,000 shares of Class R6 (formerly Class R5) for an aggregate amount of $3,000,000 as an initial investment in the fund. On March 16, 2016, MFS purchased 27,018 shares of Class I for an aggregate amount of 265,049.
At August 31, 2016, MFS held 50% of the outstanding shares of Class C and 100% of the outstanding shares of Class B, Class R1, Class R2, Class R3, Class R4, and Class R6 (formerly Class R5).
(4) Portfolio Securities
For the period ended August 31, 2016, purchases and sales of investments, other than short-term obligations, aggregated $5,547,171 and $1,556,702, respectively.
(5) Shares of Beneficial Interest
The fund’s Declaration of Trust permits the Trustees to issue an unlimited number of full and fractional shares of beneficial interest. Transactions in fund shares were as follows:
| | | | | | | | |
| | | Period ended
8/31/16 (c) | |
| | | Shares | | | Amount | |
| Shares sold | | | | | | | | |
Class A | | | 16,049 | | | | $160,696 | |
Class B | | | 5,000 | | | | 50,000 | |
Class C | | | 10,219 | | | | 98,635 | |
Class I | | | 88,975 | | | | 891,394 | |
Class R1 | | | 5,000 | | | | 50,000 | |
Class R2 | | | 5,000 | | | | 50,000 | |
Class R3 | | | 5,000 | | | | 50,000 | |
Class R4 | | | 5,000 | | | | 50,000 | |
Class R6 (formerly Class R5) | | | 261,692 | | | | 2,617,000 | |
| | | 401,935 | | | | $4,017,725 | |
| | |
Shares issued to shareholders in reinvestment of distributions | | | | | | | | |
Class A | | | 41 | | | | $409 | |
Class B | | | 18 | | | | 177 | |
Class C | | | 19 | | | | 190 | |
Class I | | | 78 | | | | 781 | |
Class R1 | | | 18 | | | | 177 | |
Class R2 | | | 25 | | | | 251 | |
Class R3 | | | 29 | | | | 289 | |
Class R4 | | | 32 | | | | 326 | |
Class R6 (formerly Class R5) | | | 1,692 | | | | 17,007 | |
| | | 1,952 | | | | $19,607 | |
34
Notes to Financial Statements – continued
| | | | | | | | |
| | | Period ended
8/31/16 (c) | |
| | | Shares | | | Amount | |
| Shares reacquired | | | | | | | | |
Class A | | | (2 | ) | | | $(21 | ) |
Class C | | | (207 | ) | | | (2,023 | ) |
Class I | | | (856 | ) | | | (8,808 | ) |
Class R6 (formerly Class R5) | | | (1,692 | ) | | | (16,712 | ) |
| | | (2,757 | ) | | | $(27,564 | ) |
| | |
| Net change | | | | | | | | |
Class A | | | 16,088 | | | | $161,084 | |
Class B | | | 5,018 | | | | 50,177 | |
Class C | | | 10,031 | | | | 96,802 | |
Class I | | | 88,197 | | | | 883,367 | |
Class R1 | | | 5,018 | | | | 50,177 | |
Class R2 | | | 5,025 | | | | 50,251 | |
Class R3 | | | 5,029 | | | | 50,289 | |
Class R4 | | | 5,032 | | | | 50,326 | |
Class R6 (formerly Class R5) | | | 261,692 | | | | 2,617,295 | |
| | | 401,130 | | | | $4,009,768 | |
Effective August 26, 2016, Class R5 shares were renamed Class R6 shares.
| (c) | For the period from the commencement of the fund’s investment operations, September 15, 2015, through the stated period end. |
(6) Line of Credit
The fund and certain other funds managed by MFS participate in a $1.25 billion unsecured committed line of credit, subject to a $1 billion sublimit, provided by a syndication of banks under a credit agreement. Borrowings may be made for temporary financing needs. Interest is charged to each fund, based on its borrowings, generally at a rate equal to the higher of the Overnight Federal Reserve funds rate or daily one month LIBOR plus an agreed upon spread. A commitment fee, based on the average daily, unused portion of the committed line of credit, is allocated among the participating funds at the end of each calendar quarter. In addition, the fund and other funds managed by MFS have established unsecured uncommitted borrowing arrangements with certain banks for temporary financing needs. Interest is charged to each fund, based on its borrowings, at a rate equal to the Overnight Federal Reserve funds rate plus an agreed upon spread. For the period ended August 31, 2016, the fund’s commitment fee and interest expense were $10 and $0, respectively, and are included in “Miscellaneous” expense in the Statement of Operations.
35
Notes to Financial Statements – continued
(7) Transactions in Underlying Affiliated Funds-Affiliated Issuers
An affiliated issuer may be considered one in which the fund owns 5% or more of the outstanding voting securities, or a company which is under common control. For the purposes of this report, the fund assumes the following to be an affiliated issuer:
| | | | | | | | | | | | | | | | |
| Underlying Affiliated Fund | | Beginning
Shares/Par
Amount | | | Acquisitions
Shares/Par
Amount | | | Dispositions
Shares/Par
Amount | | | Ending
Shares/Par
Amount | |
MFS Institutional Money
Market Portfolio | | | — | | | | 916,608 | | | | (812,834 | ) | | | 103,774 | |
| | | | |
| Underlying Affiliated Fund | | Realized
Gain (Loss) | | | Capital Gain
Distributions | | | Dividend
Income | | | Ending
Value | |
MFS Institutional Money
Market Portfolio | | | $— | | | | $— | | | | $282 | | | | $103,774 | |
36
REPORT OF INDEPENDENT REGISTERED PUBLIC ACCOUNTING FIRM
To the Board of Trustees of MFS Series Trust IV and Shareholders of MFS Blended Research Global Equity Fund:
We have audited the accompanying statement of assets and liabilities, including the portfolio of investments, of MFS Blended Research Global Equity Fund (the Fund) (one of the series constituting the MFS Series Trust IV) as of August 31, 2016, and the related statements of operations, changes in net assets and the financial highlights for the period from September 15, 2015 (commencement of operations) to August 31, 2016. These financial statements and financial highlights are the responsibility of the Fund’s management. Our responsibility is to express an opinion on these financial statements and financial highlights based on our audit.
We conducted our audit in accordance with the standards of the Public Company Accounting Oversight Board (United States). Those standards require that we plan and perform the audit to obtain reasonable assurance about whether the financial statements and financial highlights are free of material misstatement. We were not engaged to perform an audit of the Fund’s internal control over financial reporting. Our audit included consideration of internal control over financial reporting as a basis for designing audit procedures that are appropriate in the circumstances, but not for the purpose of expressing an opinion on the effectiveness of the Fund’s internal control over financial reporting. Accordingly, we express no such opinion. An audit also includes examining, on a test basis, evidence supporting the amounts and disclosures in the financial statements and financial highlights, assessing the accounting principles used and significant estimates made by management, and evaluating the overall financial statement presentation. Our procedures included confirmation of securities owned as of August 31, 2016, by correspondence with the custodian and others. We believe that our audit provides a reasonable basis for our opinion.
In our opinion, the financial statements and financial highlights referred to above present fairly, in all material respects, the financial position of MFS Blended Research Global Equity Fund (one of the series constituting the MFS Series Trust IV) at August 31, 2016, the results of its operations, the changes in its net assets and the financial highlights for the period from September 15, 2015 (commencement of operations) to August 31, 2016, in conformity with U.S. generally accepted accounting principles.

Boston, Massachusetts
October 17, 2016
37
TRUSTEES AND OFFICERS — IDENTIFICATION AND BACKGROUND
The Trustees and Officers of the Trust, as of October 1, 2016, are listed below, together with their principal occupations during the past five years. (Their titles may have varied during that period.) The address of each Trustee and Officer is 111 Huntington Avenue, Boston, Massachusetts 02199-7618.
| | | | | | | | |
Name, Age | | Position(s) Held
with Fund | | Trustee/Officer
Since (h) | | Principal
Occupations During
the Past Five Years | | Other
Directorships (j) |
| INTERESTED TRUSTEES |
Robert J. Manning (k)
(age 52) | | Trustee | | February 2004 | | Massachusetts Financial Services Company, Chairman, Co-Chief Executive Officer and Director | | N/A |
Robin A. Stelmach (k)
(age 55) | | Trustee and
President | | January 2014 | | Massachusetts Financial Services Company, Executive Vice President and Chief Operating Officer | | N/A |
| INDEPENDENT TRUSTEES |
David H. Gunning
(age 74) | | Trustee and Chair of Trustees | | January 2004 | | Private investor | | Lincoln Electric Holdings, Inc., Director; Development Alternatives, Inc., Director/Non-Executive Chairman |
Steven E. Buller
(age 65) | | Trustee | | February 2014 | | Chairman, Financial Accounting Standards Advisory Council (until 2015); Standing Advisory Group, Public Company Accounting Oversight Board, Member (until 2014); BlackRock, Inc. (investment management), Managing Director (until 2014), BlackRock Finco UK (investment management), Director (until 2014) | | N/A |
Robert E. Butler
(age 74) | | Trustee | | January 2006 | | Consultant – investment company industry regulatory and compliance matters | | N/A |
38
Trustees and Officers – continued
| | | | | | | | |
Name, Age | | Position(s) Held
with Fund | | Trustee/Officer
Since (h) | | Principal
Occupations During
the Past Five Years | | Other
Directorships (j) |
Maureen R. Goldfarb
(age 61) | | Trustee | | January 2009 | | Private investor | | N/A |
William R. Gutow
(age 75) | | Trustee | | December 1993 | | Private investor and real estate consultant; Capitol Entertainment Management Company (video franchise), Vice Chairman (until 2014) | | Texas Donuts, Vice Chairman (until 2010) |
Michael Hegarty
(age 71) | | Trustee | | December 2004 | | Private investor | | Rouse Properties Inc., Director; Capmark Financial Group Inc., Director (until 2015) |
John P. Kavanaugh
(age 61) | | Trustee | | January 2009 | | Private investor | | N/A |
Maryanne L. Roepke
(age 60) | | Trustee | | May 2014 | | American Century Investments (investment management), Senior Vice President and Chief Compliance Officer (until 2014) | | N/A |
Laurie J. Thomsen
(age 59) | | Trustee | | March 2005 | | Private investor | | The Travelers Companies, Director; Dycom Industries, Inc., Director |
Robert W. Uek
(age 75) | | Trustee | | January 2006 | | Consultant to investment company industry | | N/A |
| OFFICERS |
Christopher R. Bohane (k)
(age 42) | | Assistant
Secretary and Assistant Clerk | | July 2005 | | Massachusetts Financial Services Company, Vice President and Assistant General Counsel | | N/A |
Kino Clark (k)
(age 48) | | Assistant
Treasurer | | January 2012 | | Massachusetts Financial Services Company, Vice President | | N/A |
Kristin V. Collins (k)
(age 43) | | Assistant
Secretary and Assistant Clerk | | September 2015 | | Massachusetts Financial Services Company, Vice President and Assistant General Counsel | | N/A |
39
Trustees and Officers – continued
| | | | | | | | |
Name, Age | | Position(s) Held
with Fund | | Trustee/Officer
Since (h) | | Principal
Occupations During
the Past Five Years | | Other
Directorships (j) |
Thomas H. Connors (k)
(age 57) | | Assistant
Secretary and Assistant Clerk | | September 2012 | | Massachusetts Financial Services Company, Vice President and Senior Counsel; Deutsche Investment Management Americas Inc. (financial service provider), Director and Senior Counsel (until 2012) | | N/A |
Ethan D. Corey (k)
(age 52) | | Assistant
Secretary and Assistant Clerk | | July 2005 | | Massachusetts Financial Services Company, Senior Vice President and Associate General Counsel | | N/A |
David L. DiLorenzo (k)
(age 48) | | Treasurer | | July 2005 | | Massachusetts Financial Services Company, Senior Vice President | | N/A |
Brian E. Langenfeld (k)
(age 43) | | Assistant
Secretary and Assistant Clerk | | June 2006 | | Massachusetts Financial Services Company, Vice President and Senior Counsel | | N/A |
Susan A. Pereira (k)
(age 45) | | Assistant Secretary and Assistant Clerk | | July 2005 | | Massachusetts Financial Services Company, Vice President and Senior Counsel | | N/A |
Kasey L. Phillips (k)
(age 45) | | Assistant
Treasurer | | September 2012 | | Massachusetts Financial Services Company, Vice President; Wells Fargo Funds Management, LLC, Senior Vice President, Fund Treasurer (until 2012) | | N/A |
40
Trustees and Officers – continued
| | | | | | | | |
Name, Age | | Position(s) Held
with Fund | | Trustee/Officer
Since (h) | | Principal
Occupations During
the Past Five Years | | Other
Directorships (j) |
Mark N. Polebaum (k)
(age 64) | | Secretary and
Clerk | | January 2006 | | Massachusetts Financial Services Company, Executive Vice President, General Counsel and Secretary | | N/A |
Matthew A. Stowe (k)
(age 41) | | Assistant
Secretary and Assistant Clerk | | October 2014 | | Massachusetts Financial Services Company, Vice President and Assistant General Counsel | | N/A |
Frank L. Tarantino
(age 72) | | Independent
Senior Officer | | June 2004 | | Tarantino LLC (provider of compliance services), Principal | | N/A |
Richard S. Weitzel (k)
(age 46) | | Assistant
Secretary and Assistant Clerk | | October 2007 | | Massachusetts Financial Services Company, Senior Vice President and Associate General Counsel | | N/A |
Martin J. Wolin (k)
(age 49) | | Chief Compliance Officer | | July 2015 | | Massachusetts Financial Services Company, Senior Vice President and Chief Compliance Officer (since July 2015); Mercer (financial service provider), Chief Risk and Compliance Officer, North America and Latin America (until June 2015) | | N/A |
James O. Yost (k)
(age 56) | | Deputy Treasurer | | September 1990 | | Massachusetts Financial Services Company, Senior Vice President | | N/A |
| (h) | Date first appointed to serve as Trustee/officer of an MFS Fund. Each Trustee has served continuously since appointment unless indicated otherwise. For the period from December 15, 2004 until February 22, 2005, Mr. Manning served as Advisory Trustee. Prior to January 2012, Messrs. DiLorenzo and Yost served as Assistant Treasurers of the Funds. Ms. Stelmach was appointed as President of the Funds as of October 1, 2014. |
| (j) | Directorships or trusteeships of companies required to report to the Securities and Exchange Commission (i.e., “public companies”). |
| (k) | “Interested person” of the Trust within the meaning of the Investment Company Act of 1940 (referred to as the 1940 Act), which is the principal federal law governing investment companies like the fund, as a result of a position with MFS. The address of MFS is 111 Huntington Avenue, Boston, Massachusetts 02199-7618. |
41
Trustees and Officers – continued
Each Trustee (except Ms. Stelmach, Mr. Buller and Ms. Roepke) has been elected by shareholders and each Trustee and officer holds office until his or her successor is chosen and qualified or until his or her earlier death, resignation, retirement or removal. The Trust does not hold annual meetings for the purpose of electing Trustees, and Trustees are not elected for fixed terms. Messrs. Buller, Butler, Kavanaugh, Uek and Ms. Roepke are members of the Trust’s Audit Committee.
Each of the Fund’s Trustees and officers holds comparable positions with certain other funds of which MFS or a subsidiary is the investment adviser or distributor, and, in the case of the officers, with certain affiliates of MFS. As of October 1, 2016, the Trustees served as board members of 137 funds within the MFS Family of Funds.
The Statement of Additional Information for a Fund includes further information about the Trustees and is available without charge upon request by calling 1-800-225-2606.
| | |
| Investment Adviser | | Custodian |
Massachusetts Financial Services Company
111 Huntington Avenue
Boston, MA 02199-7618 | | State Street Bank and Trust Company 1 Lincoln Street Boston, MA 02111-2900 |
| Distributor | | Independent Registered Public Accounting Firm |
MFS Fund Distributors, Inc.
111 Huntington Avenue
Boston, MA 02199-7618 | | Ernst & Young LLP 200 Clarendon Street Boston, MA 02116 |
| Portfolio Managers | | |
James Fallon Matthew Krummell Jonathan Sage John Stocks | | |
42
PROXY VOTING POLICIES AND INFORMATION
MFS votes proxies on behalf of the fund pursuant to proxy voting policies and procedures that are available without charge, upon request, by calling 1-800-225-2606, by visiting mfs.com (once you have selected “Individual Investor” as your role, click on “Individual Investor Home” in the top navigation and then select “Learn More About Proxy Voting” under the “I want to…” header on the left hand column of the page), or by visiting the SEC’s Web site at http://www.sec.gov.
Information regarding how the fund voted proxies relating to portfolio securities during the most recent twelve-month period ended June 30 is available by August 31 of each year without charge by visiting mfs.com (once you have selected “Individual Investor” as your role, click on “Individual Investor Home” in the top navigation and then select “Learn More About Proxy Voting” under the “I want to…” header on the left hand column of the page), or by visiting the SEC’s Web site at http://www.sec.gov.
QUARTERLY PORTFOLIO DISCLOSURE
The fund will file a complete schedule of portfolio holdings with the Securities and Exchange Commission (the Commission) for the first and third quarters of each fiscal year on Form N-Q. A shareholder can obtain the quarterly portfolio holdings report at mfs.com. The fund’s Form N-Q is also available on the EDGAR database on the Commission’s Internet Web site at http://www.sec.gov, and may be reviewed and copied at the:
Public Reference Room
Securities and Exchange Commission
100 F Street, NE, Room 1580
Washington, D.C. 20549
Information on the operation of the Public Reference Room may be obtained by calling the Commission at 1-800-SEC-0330. Copies of the fund’s Form N-Q also may be obtained, upon payment of a duplicating fee, by electronic request at the following e-mail address: publicinfo@sec.gov or by writing the Public Reference Section at the above address.
FURTHER INFORMATION
From time to time, MFS may post important information about the fund or the MFS funds on the MFS web site (mfs.com). This information is available on mfs.com by following these steps once you have selected “Individual Investor” as your role: (1) Click on the “Individual Investor Home” in the top navigation and then select the “Announcements” option within the “Market Outlooks” drop down, or (2) Click on “Products & Services” and “Mutual Funds” and then choose the fund’s name in the “Select a fund” menu.
43
INFORMATION ABOUT FUND CONTRACTS AND LEGAL CLAIMS
The fund has entered into contractual arrangements with an investment adviser, administrator, distributor, shareholder servicing agent, 529 program manager (if applicable), and custodian who each provide services to the fund. Unless expressly stated otherwise, shareholders are not parties to, or intended beneficiaries of these contractual arrangements, and these contractual arrangements are not intended to create any shareholder right to enforce them against the service providers or to seek any remedy under them against the service providers, either directly or on behalf of the fund.
Under the Trust’s By-Laws and Declaration of Trust, any claims asserted against or on behalf of the MFS Funds, including claims against Trustees and Officers, must be brought in state and federal courts located within the Commonwealth of Massachusetts.
FEDERAL TAX INFORMATION (unaudited)
The fund will notify shareholders of amounts for use in preparing 2016 income tax forms in January 2017. The following information is provided pursuant to provisions of the Internal Revenue Code.
The fund designates the maximum amount allowable as qualified dividend income eligible to be taxed at the same rate as long-term capital gain.
For corporate shareholders, 45.47% of the ordinary income dividends paid during the fiscal year qualify for the corporate dividends received deduction.
44
rev. 3/16
| | | | |
| | | |
FACTS | | WHAT DOES MFS DO WITH YOUR PERSONAL INFORMATION? | |  |
| | |
| Why? | | Financial companies choose how they share your personal information. Federal law gives consumers the right to limit some but not all sharing. Federal law also requires us to tell you how we collect, share, and protect your personal information. Please read this notice carefully to understand what we do. |
| | |
| What? | | The types of personal information we collect and share depend on the product or service you have with us. This information can include: • Social Security number and account balances • Account transactions and transaction history • Checking account information and wire transfer instructions When you are no longer our customer, we continue to share your information as described in this notice. |
| | |
| How? | | All financial companies need to share customers’ personal information to run their everyday business. In the section below, we list the reasons financial companies can share their customers’ personal information; the reasons MFS chooses to share; and whether you can limit this sharing. |
| | | | |
Reasons we can share your
personal information | | Does MFS
share? | | Can you limit
this sharing? |
For our everyday business purposes – such as to process your transactions, maintain your account(s), respond to court orders and legal investigations, or report to credit bureaus | | Yes | | No |
For our marketing purposes – to offer our products and services to you | | No | | We don’t share |
For joint marketing with other financial companies | | No | | We don’t share |
For our affiliates’ everyday business purposes – information about your transactions and experiences | | No | | We don’t share |
For our affiliates’ everyday business purposes – information about your creditworthiness | | No | | We don’t share |
| For nonaffiliates to market to you | | No | | We don’t share |
| | |
| Questions? | | Call 800-225-2606 or go to mfs.com. |
45
| | |
| Who we are |
| Who is providing this notice? | | MFS Funds, MFS Investment Management, MFS Institutional Advisors, Inc., and MFS Heritage Trust Company. |
| | |
| What we do |
| How does MFS protect my personal information? | | To protect your personal information from unauthorized access and use, we use security measures that comply with federal law. These measures include procedural, electronic, and physical safeguards for the protection of the personal information we collect about you. |
| How does MFS collect my personal information? | | We collect your personal information, for example, when you • open an account or provide account information • direct us to buy securities or direct us to sell your securities • make a wire transfer We also collect your personal information from others, such as credit bureaus, affiliates, or other companies. |
| Why can’t I limit all sharing? | | Federal law gives you the right to limit only • sharing for affiliates’ everyday business purposes – information about your creditworthiness • affiliates from using your information to market to you • sharing for nonaffiliates to market to you State laws and individual companies may give you additional rights to limit sharing. |
| | |
| Definitions |
| Affiliates | | Companies related by common ownership or control. They can be financial and nonfinancial companies. • MFS does not share personal information with affiliates, except for everyday business purposes as described on page one of this notice. |
| Nonaffiliates | | Companies not related by common ownership or control. They can be financial and nonfinancial companies. • MFS does not share with nonaffiliates so they can market to you. |
| Joint marketing | | A formal agreement between nonaffiliated financial companies that together market financial products or services to you. • MFS doesn’t jointly market. |
| | |
| Other important information |
| If you own an MFS product or receive an MFS service in the name of a third party such as a bank or broker-dealer, their privacy policy may apply to you instead of ours. |
46
Save paper with eDelivery.

| MFS® will send you prospectuses, |
reports, and proxies directly via e-mail so you will get information faster with less mailbox clutter.
To sign up:
1. Go to mfs.com.
2. Log in via MFS® Access.
3. Select eDelivery.
If you own your MFS fund shares through a financial institution or a retirement plan, MFS® TALK, MFS® Access, or eDelivery may not be available to you.
CONTACT
WEB SITE
mfs.com
MFS TALK
1-800-637-8255
24 hours a day
ACCOUNT SERVICE AND LITERATURE
Shareholders
1-800-225-2606
Financial advisors
1-800-343-2829
Retirement plan services
1-800-637-1255
MAILING ADDRESS
MFS Service Center, Inc.
P.O. Box 55824
Boston, MA 02205-5824
OVERNIGHT MAIL
MFS Service Center, Inc.
c/o Boston Financial Data Services
30 Dan Road
Canton, MA 02021-2809
ANNUAL REPORT
August 31, 2016

MFS® BLENDED RESEARCH® INTERNATIONAL EQUITY FUND

BRX-ANN
MFS® BLENDED RESEARCH® INTERNATIONAL EQUITY FUND
CONTENTS
The report is prepared for the general information of shareholders.
It is authorized for distribution to prospective investors only when preceded or accompanied by a current prospectus.
NOT FDIC INSURED • MAY LOSE VALUE • NO BANK GUARANTEE

LETTER FROM THE CHAIRMAN
Dear Shareholders:
Despite the unexpected vote by the United Kingdom to leave the European Union, most markets proved resilient, with U.S. shares rallying to record highs during August.
Global interest rates remain very low, with most central banks maintaining extremely accommodative monetary policies to reinvigorate slow-growing economies against a backdrop of low inflation. This environment has favored risky assets such as equities, as investors are forced to accept greater risks in search of acceptable returns in a low-return environment. U.S. investment-grade and high-yield bonds have also benefited from low, and even negative, yields overseas.
China remains a source of concern for investors, as overcapacity in its manufacturing sector inhibits the government’s attempt to
change its domestic economy from one driven by exports to a consumer-driven model. Despite the slow-growth environment, emerging market equities have held up well, withstanding geopolitical shocks like an attempted coup in Turkey and impeachment proceedings against Brazil’s president. The U.S. Federal Reserve’s go-slow approach to rate hikes has also helped.
At MFS®, we believe it is best to view markets through a long lens and not react to short-term swings. That makes it possible to filter out market noise and focus on long-term fundamentals.
In our view, the professional guidance of a financial advisor, along with a patient, long-term approach, will help you reach your investment objectives.
Respectfully,

Robert J. Manning
Chairman
MFS Investment Management
October 17, 2016
The opinions expressed in this letter are subject to change and may not be relied upon for investment advice. No forecasts can be guaranteed.
1
PORTFOLIO COMPOSITION
Portfolio structure
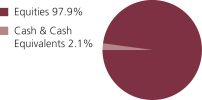
| | | | |
| Top ten holdings | | | | |
| Taiwan Semiconductor Manufacturing Co. Ltd., ADR | | | 2.0% | |
| BP PLC | | | 1.9% | |
| Vodafone Group PLC | | | 1.5% | |
| BOC Hong Kong Holdings Ltd. | | | 1.5% | |
| Zurich Insurance Group AG | | | 1.5% | |
| Legrand S.A. | | | 1.5% | |
| Samsung Electronics Co. Ltd. | | | 1.5% | |
| Siemens AG | | | 1.4% | |
| Alibaba Group Holding Ltd., ADR | | | 1.4% | |
| Sumitomo Mitsui Financial Group, Inc. | | | 1.4% | |
| |
| Equity sectors | | | | |
| Financial Services | | | 24.3% | |
| Technology | | | 9.4% | |
| Utilities & Communications | | | 9.1% | |
| Consumer Staples | | | 8.7% | |
| Health Care | | | 8.1% | |
| Industrial Goods & Services | | | 7.0% | |
| Basic Materials | | | 6.7% | |
| Energy | | | 6.0% | |
| Retailing | | | 4.6% | |
| Leisure | | | 4.5% | |
| Autos & Housing | | | 4.4% | |
| Transportation | | | 2.8% | |
| Special Products & Services | | | 2.3% | |
| | | | |
| Issuer country weightings (x) | |
| Japan | | | 16.8% | |
| United Kingdom | | | 12.2% | |
| France | | | 8.6% | |
| Germany | | | 7.2% | |
| China | | | 6.1% | |
| Canada | | | 5.8% | |
| South Korea | | | 5.6% | |
| Switzerland | | | 5.3% | |
| Hong Kong | | | 3.5% | |
| Other Countries | | | 28.9% | |
|
| Currency exposure weightings (y) | |
| Euro | | | 22.4% | |
| Japanese Yen | | | 16.8% | |
| British Pound Sterling | | | 13.0% | |
| Hong Kong Dollar | | | 7.8% | |
| South Korean Won | | | 5.6% | |
| Swiss Franc | | | 5.3% | |
| United States Dollar | | | 5.2% | |
| Taiwan Dollar | | | 3.2% | |
| Brazilian Real | | | 3.0% | |
| Other Currencies | | | 17.7% | |
2
Portfolio Composition – continued
| (x) | Represents the portfolio’s exposure to issuer countries as a percentage of a portfolio’s net assets. For purposes of this presentation, United States includes Cash & Cash Equivalents. |
| (y) | Represents the portfolio’s exposure to a particular currency as a percentage of a portfolio’s net assets. For purposes of this presentation, United States Dollar includes Cash & Cash Equivalents. |
Cash & Cash Equivalents includes any cash, investments in money market funds, short-term securities, and other assets less liabilities. Please see the Statement of Assets and Liabilities for additional information related to the fund’s cash position and other assets and liabilities.
Percentages are based on net assets as of 8/31/16.
The portfolio is actively managed and current holdings may be different.
3
MANAGEMENT REVIEW
Summary of Results
For the period September 15, 2015 through August 31, 2016, Class A shares of the MFS Blended Research International Equity Fund (“fund”) provided a total return of –0.64%, at net asset value. This compares with a return of 5.58% for the fund’s benchmark, the MSCI All Country World (ex-US) Index.
Market Environment
Sluggish global growth weighed on both developed and emerging market (“EM”) economies during the reporting period. The US Federal Reserve began its long-anticipated monetary tightening cycle in the middle of the period, but the tightening cycle has proved to be more gradual than initially anticipated. Globally, central bank policy remained highly accommodative, which forced many government, and even some corporate, bond yields into negative territory. Near the end of the period, the United Kingdom voted to leave the European Union (“EU”), beginning a multi-year process of negotiation in order to achieve “Brexit”. While markets initially reacted to the vote with alarm, the spillover to European and EM was relatively short-lived (although risks of further hits to EU cohesiveness could re-emerge).
During the second half of the reporting period, US earnings headwinds expanded beyond the energy, materials and industrial sectors, to include most sectors of the market. The sharp rise in the US dollar also weighed on earnings early in the period, though dollar strength ebbed somewhat late in the period. US consumer spending held up well during the second half of the period amid a modest increase in real wages and falling gasoline prices. Demand for autos reached near-record territory before receding modestly late in the period, while the housing market continued its recovery. Slow global trade continued to mirror slow global growth, particularly for many EM countries. That said, EM countries began to show signs of a modest upturn in activity along with adjustment in their external accounts. These improved conditions appeared to have reassured investors and contributed to record inflows into the asset class during July and August as negative yields for an increasing share of developed market bonds drove yield-hungry investors further out on the risk spectrum. Similar investor inflows were experienced in the high grade and high yield corporate markets.
Detractors from Performance
Weak stock selection in the health care sector was a major detractor from performance relative to the MSCI All Country World (ex-US) Index, led by an overweight position in pharmaceutical company Valeant Pharmaceuticals (h) (Canada). Shares of Valeant Pharmaceuticals came under pressure during the reporting period as both accounting scandals and product demand issues continued to plague the business. Additionally, the company posted earnings per share below consensus on lower revenues and weak profit margins.
Stock selection in the autos & housing sector also held back relative performance. Within this sector, holdings of poor-performing residential property developer Bellway (b)(h) (United Kingdom) and an overweight position in motor vehicle manufacturer Kia Motors (South Korea) weakened relative returns.
4
Management Review – continued
Elsewhere, overweight positions in banking and financial services firm Intesa Sanpaolo (Italy), telecommunications networking firm Telecom Italia (Italy) and investment management and banking firm UBS (Switzerland) weighed heavily on relative results. Other stocks among the top relative detractors included an overweight position in holdings of life insurance company Dai-Ichi Mutual Life Insurance (h) (Japan), airline company Air Canada (b) (Canada) and investment holding company Li & Fung (Hong Kong). Not owning shares of strong-performing internet gaming company Tencent Holdings (China) also weakened relative performance.
Contributors to Performance
Stock selection in the industrial goods & services sector aided relative performance, led by the fund’s overweight holding of strong-performing real estate holding company Hochtief (Germany). Shares of Hochtief rose as the company announced earnings that exceeded market expectations as a result of strong order intake in America and the Asia-Pacific region, where orders more than doubled.
Favorable security selection in the technology sector also strengthened relative returns. The fund’s overweight positions in contract semiconductor manufacturer Taiwan Semiconductor Manufacturing (Taiwan) and microchip and electronics manufacturer Samsung Electronics (South Korea) boosted relative performance. Shares of Taiwan Semiconductor Manufacturing had a strong year as the company experienced robust demand from top customers.
Elsewhere, overweight positions in commercial banking firm Sberbank of Russia (Russia), electric utilities company Korea Electric Power (South Korea), tobacco company Japan Tobacco (Japan), banking and financial services provider Banco do Brasil (Brazil) and financial services provider Itau Unibanco Holding (Brazil) supported relative results. The timing of ownership in shares of strong-performing telecommunications company KDDI (h) (Japan) and holdings of salmon products company Bakkafrost P/f (b) (Denmark), also strengthened relative returns.
Respectfully,
| | | | | | |
| James Fallon | | Matthew Krummell | | Jonathan Sage | | John Stocks |
| Portfolio Manager | | Portfolio Manager | | Portfolio Manager | | Portfolio Manager |
| (b) | Security is not a benchmark constituent. |
| (h) | Security was not held in the portfolio at period end. |
The views expressed in this report are those of the portfolio managers only through the end of the period of the report as stated on the cover and do not necessarily reflect the views of MFS or any other person in the MFS organization. These views are subject to change at any time based on market or other conditions, and MFS disclaims any responsibility to update such views. These views may not be relied upon as investment advice or an indication of trading intent on behalf of any MFS portfolio. References to specific securities are not recommendations of such securities, and may not be representative of any MFS portfolio’s current or future investments.
5
PERFORMANCE SUMMARY THROUGH 8/31/16
The following chart illustrates a representative class of the fund’s historical performance in comparison to its benchmark(s). Performance results include the deduction of the maximum applicable sales charge and reflect the percentage change in net asset value, including reinvestment of dividends and capital gains distributions. The performance of other share classes will be greater than or less than that of the class depicted below. Benchmarks are unmanaged and may not be invested in directly. Benchmark returns do not reflect sales charges, commissions or expenses. (See Notes to Performance Summary.)
Performance data shown represents past performance and is no guarantee of future results. Investment return and principal value fluctuate so your shares, when sold, may be worth more or less than the original cost; current performance may be lower or higher than quoted. The performance shown does not reflect the deduction of taxes, if any, that a shareholder would pay on fund distributions or the redemption of fund shares.
Growth of a Hypothetical $10,000 Investment (t)
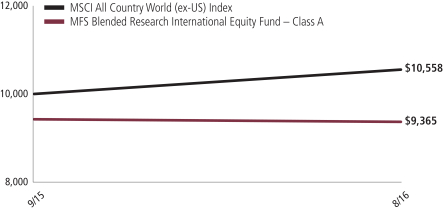
6
Performance Summary – continued
Total Returns through 8/31/16
Average annual without sales charge
| | | | | | | | |
| | | Share Class | | Class Inception Date | | Life (t) | | |
| | | A | | 9/15/15 | | (0.64)% | | |
| | | B | | 9/15/15 | | (1.27)% | | |
| | | C | | 9/15/15 | | (1.27)% | | |
| | | I | | 9/15/15 | | (0.37)% | | |
| | | R1 | | 9/15/15 | | (1.27)% | | |
| | | R2 | | 9/15/15 | | (0.82)% | | |
| | | R3 | | 9/15/15 | | (0.44)% | | |
| | | R4 | | 9/15/15 | | (0.37)% | | |
| | | R6 (formerly Class R5) | | 9/15/15 | | (0.36)% | | |
| Comparative benchmark | | |
| | | MSCI All Country World (ex-US) Index (f) | | 5.58% | | |
| Average annual with sales charge | | | | |
| | | A
With Initial Sales Charge (5.75%) | | (6.35)% | | |
| | | B
With CDSC (Declining over six years from 4% to 0%) (v) | | (5.18)% | | |
| | | C
With CDSC (1% for 12 months) (v) | | (2.25)% | | |
CDSC – Contingent Deferred Sales Charge.
Class I, R1, R2, R3, R4, and R6 shares do not have a sales charge.
Effective August 26, 2016, Class R5 shares were renamed Class R6 shares.
| (f) | Source: FactSet Research Systems Inc. |
| (t) | For the period from the class inception date through the stated period end. (See Notes to Performance Summary.) |
| (v) | Assuming redemption at the end of the applicable period. |
Benchmark Definition
MSCI All Country World (ex-US) Index – a market capitalization-weighted index that is designed to measure equity market performance in the developed and emerging markets, excluding the U.S.
It is not possible to invest directly in an index.
Notes to Performance Summary
Average annual total return represents the average annual change in value for each share class for the periods presented. Life returns are presented where the share class has less than 10 years of performance history and represent the average annual total return from the class inception date to the stated period end date.
7
Performance Summary – continued
Performance results reflect any applicable expense subsidies and waivers in effect during the periods shown. Without such subsidies and waivers the fund’s performance results would be less favorable. Please see the prospectus and financial statements for complete details.
Performance results do not include adjustments made for financial reporting purposes in accordance with U.S. generally accepted accounting principles and may differ from amounts reported in the financial highlights.
From time to time the fund may receive proceeds from litigation settlements, without which performance would be lower.
8
EXPENSE TABLE
Fund expenses borne by the shareholders during the period, March 1, 2016 through August 31, 2016
As a shareholder of the fund, you incur two types of costs: (1) transaction costs, including sales charges (loads) on certain purchase or redemption payments, and (2) ongoing costs, including management fees; distribution and service (12b-1) fees; and other fund expenses. This example is intended to help you understand your ongoing costs (in dollars) of investing in the fund and to compare these costs with the ongoing costs of investing in other mutual funds.
The example is based on an investment of $1,000 invested at the beginning of the period and held for the entire period March 1, 2016 through August 31, 2016.
Actual Expenses
The first line for each share class in the following table provides information about actual account values and actual expenses. You may use the information in this line, together with the amount you invested, to estimate the expenses that you paid over the period. Simply divide your account value by $1,000 (for example, an $8,600 account value divided by $1,000 = 8.6), then multiply the result by the number in the first line under the heading entitled “Expenses Paid During Period” to estimate the expenses you paid on your account during this period.
Hypothetical Example for Comparison Purposes
The second line for each share class in the following table provides information about hypothetical account values and hypothetical expenses based on the fund’s actual expense ratio and an assumed rate of return of 5% per year before expenses, which is not the fund’s actual return. The hypothetical account values and expenses may not be used to estimate the actual ending account balance or expenses you paid for the period. You may use this information to compare the ongoing costs of investing in the fund and other funds. To do so, compare this 5% hypothetical example with the 5% hypothetical examples that appear in the shareholder reports of the other funds.
Please note that the expenses shown in the table are meant to highlight your ongoing costs only and do not reflect any transactional costs, such as sales charges (loads). Therefore, the second line for each share class in the table is useful in comparing ongoing costs only, and will not help you determine the relative total costs of owning different funds. In addition, if these transactional costs were included, your costs would have been higher.
9
Expense Table – continued
| | | | | | | | | | | | |
Share Class | | | | Annualized
Expense Ratio | | Beginning
Account Value
3/01/16 | | Ending
Account Value
8/31/16 | | Expenses
Paid During
Period (p)
3/01/16-8/31/16 | |
| A | | Actual | | 0.90% | | $1,000.00 | | $1,110.86 | | | $4.78 | |
| | Hypothetical (h) | | 0.90% | | $1,000.00 | | $1,020.61 | | | $4.57 | |
| B | | Actual | | 1.64% | | $1,000.00 | | $1,107.59 | | | $8.69 | |
| | Hypothetical (h) | | 1.64% | | $1,000.00 | | $1,016.89 | | | $8.31 | |
| C | | Actual | | 1.64% | | $1,000.00 | | $1,107.59 | | | $8.69 | |
| | Hypothetical (h) | | 1.64% | | $1,000.00 | | $1,016.89 | | | $8.31 | |
| I | | Actual | | 0.65% | | $1,000.00 | | $1,113.12 | | | $3.45 | |
| | Hypothetical (h) | | 0.65% | | $1,000.00 | | $1,021.87 | | | $3.30 | |
| R1 | | Actual | | 1.64% | | $1,000.00 | | $1,107.59 | | | $8.69 | |
| | Hypothetical (h) | | 1.64% | | $1,000.00 | | $1,016.89 | | | $8.31 | |
| R2 | | Actual | | 1.14% | | $1,000.00 | | $1,110.99 | | | $6.05 | |
| | Hypothetical (h) | | 1.14% | | $1,000.00 | | $1,019.41 | | | $5.79 | |
| R3 | | Actual | | 0.87% | | $1,000.00 | | $1,113.12 | | | $4.62 | |
| | Hypothetical (h) | | 0.87% | | $1,000.00 | | $1,020.76 | | | $4.42 | |
| R4 | | Actual | | 0.64% | | $1,000.00 | | $1,113.12 | | | $3.40 | |
| | Hypothetical (h) | | 0.64% | | $1,000.00 | | $1,021.92 | | | $3.25 | |
| R6 (formerly Class R5) | | Actual | | 0.60% | | $1,000.00 | | $1,113.12 | | | $3.19 | |
| | Hypothetical (h) | | 0.60% | | $1,000.00 | | $1,022.12 | | | $3.05 | |
| (h) | 5% class return per year before expenses. |
| (p) | “Expenses Paid During Period” are equal to each class’s annualized expense ratio, as shown above, multiplied by the average account value over the period, multiplied by 184/366 (to reflect the one-half year period). Expenses paid do not include any applicable sales charges (loads). If these transaction costs had been included, your costs would have been higher. |
10
PORTFOLIO OF INVESTMENTS
8/31/16
The Portfolio of Investments is a complete list of all securities owned by your fund. It is categorized by broad-based asset classes.
| | | | | | | | |
| Common Stocks - 96.2% | | | | | | | | |
| Issuer | | Shares/Par | | | Value ($) | |
| Aerospace - 0.7% | | | | | | | | |
| BAE Systems PLC | | | 158,618 | | | $ | 1,121,634 | |
| | |
| Airlines - 0.9% | | | | | | | | |
| Aena S.A. | | | 5,152 | | | $ | 728,407 | |
| Air Canada (a) | | | 104,707 | | | | 715,399 | |
| | | | | | | | |
| | | | $ | 1,443,806 | |
| Alcoholic Beverages - 0.3% | | | | | | | | |
| AmBev S.A. | | | 85,900 | | | $ | 510,473 | |
| | |
| Apparel Manufacturers - 2.0% | | | | | | | | |
| Adidas AG | | | 11,298 | | | $ | 1,877,121 | |
| Li & Fung Ltd. | | | 2,776,000 | | | | 1,427,801 | |
| | | | | | | | |
| | | | $ | 3,304,922 | |
| Automotive - 4.1% | | | | | | | | |
| Hyundai Motor Co. Ltd. | | | 12,944 | | | $ | 1,543,993 | |
| Kia Motors Corp. | | | 51,820 | | | | 1,949,640 | |
| Magna International, Inc. | | | 44,151 | | | | 1,779,285 | |
| Nissan Motor Co. Ltd. | | | 147,800 | | | | 1,449,930 | |
| | | | | | | | |
| | | | $ | 6,722,848 | |
| Broadcasting - 1.0% | | | | | | | | |
| ProSiebenSat.1 Media AG | | | 39,361 | | | $ | 1,692,986 | |
| | |
| Business Services - 1.2% | | | | | | | | |
| Amadeus IT Holding S.A. | | | 16,811 | | | $ | 772,482 | |
| Itochu Corp. | | | 107,500 | | | | 1,268,617 | |
| | | | | | | | |
| | | | $ | 2,041,099 | |
| Chemicals - 0.9% | | | | | | | | |
| Mitsubishi Chemical Holdings Corp. | | | 246,500 | | | $ | 1,555,262 | |
| | |
| Computer Software - 0.6% | | | | | | | | |
| Open Text Corp. | | | 14,823 | | | $ | 931,181 | |
| | |
| Computer Software - Systems - 3.0% | | | | | | | | |
| Fujitsu Ltd. | | | 179,000 | | | $ | 908,624 | |
| Hitachi Ltd. | | | 314,000 | | | | 1,505,282 | |
| Hon Hai Precision Industry Co. Ltd., GDR | | | 363,332 | | | | 1,980,159 | |
11
Portfolio of Investments – continued
| | | | | | | | |
| Issuer | | Shares/Par | | | Value ($) | |
| Common Stocks - continued | | | | | | | | |
| Computer Software - Systems - continued | | | | | | | | |
| NICE Systems Ltd., ADR | | | 7,004 | | | $ | 479,284 | |
| | | | | | | | |
| | | | $ | 4,873,349 | |
| Conglomerates - 0.7% | | | | | | | | |
| First Pacific Co. Ltd. | | | 1,522,000 | | | $ | 1,139,899 | |
| | |
| Consumer Products - 2.2% | | | | | | | | |
| Reckitt Benckiser Group PLC | | | 16,133 | | | $ | 1,557,948 | |
| Svenska Cellulosa Aktiebolaget | | | 68,409 | | | | 2,102,458 | |
| | | | | | | | |
| | | | $ | 3,660,406 | |
| Consumer Services - 0.4% | | | | | | | | |
| Kroton Educacional S.A. | | | 144,600 | | | $ | 617,949 | |
| | |
| Containers - 0.4% | | | | | | | | |
| Smurfit Kappa Group PLC | | | 24,312 | | | $ | 599,326 | |
| | |
| Electrical Equipment - 3.6% | | | | | | | | |
| Legrand S.A. | | | 40,265 | | | $ | 2,412,310 | |
| Schneider Electric S.A. | | | 17,082 | | | | 1,164,016 | |
| Siemens AG | | | 19,839 | | | | 2,368,954 | |
| | | | | | | | |
| | | | $ | 5,945,280 | |
| Electronics - 3.5% | | | | | | | | |
| Samsung Electronics Co. Ltd. | | | 1,657 | | | $ | 2,407,480 | |
| Taiwan Semiconductor Manufacturing Co. Ltd., ADR | | | 114,874 | | | | 3,301,479 | |
| | | | | | | | |
| | | | $ | 5,708,959 | |
| Energy - Independent - 0.2% | | | | | | | | |
| INPEX Corp. | | | 44,800 | | | $ | 389,004 | |
| | |
| Energy - Integrated - 5.8% | | | | | | | | |
| BP PLC | | | 543,416 | | | $ | 3,053,436 | |
| China Petroleum & Chemical Corp. | | | 1,882,000 | | | | 1,365,851 | |
| Eni S.p.A. | | | 110,129 | | | | 1,663,300 | |
| LUKOIL PJSC, ADR | | | 17,534 | | | | 784,471 | |
| Royal Dutch Shell PLC, “B” | | | 76,947 | | | | 1,962,253 | |
| Suncor Energy, Inc. | | | 25,849 | | | | 700,766 | |
| | | | | | | | |
| | | | $ | 9,530,077 | |
| Engineering - Construction - 2.7% | | | | | | | | |
| Bouygues S.A. | | | 18,528 | | | $ | 587,565 | |
| Hochtief AG | | | 10,800 | | | | 1,452,249 | |
| Promotora y Operadora de Infraestructura S.A.B. de C.V. | | | 64,893 | | | | 779,407 | |
12
Portfolio of Investments – continued
| | | | | | | | |
| Issuer | | Shares/Par | | | Value ($) | |
| Common Stocks - continued | | | | | | | | |
| Engineering - Construction - continued | | | | | | | | |
| VINCI S.A. | | | 20,969 | | | $ | 1,590,278 | |
| | | | | | | | |
| | | | $ | 4,409,499 | |
| Food & Beverages - 4.5% | | | | | | | | |
| AVI Ltd. | | | 165,894 | | | $ | 1,004,256 | |
| Bakkafrost P/f | | | 62,498 | | | | 2,246,335 | |
| BRF S.A. | | | 36,100 | | | | 602,002 | |
| Danone S.A. | | | 7,050 | | | | 535,612 | |
| Marine Harvest | | | 44,377 | | | | 685,939 | |
| Nestle S.A. | | | 7,818 | | | | 622,388 | |
| Nippon Suisan Kaisha Ltd. | | | 138,800 | | | | 582,218 | |
| S Foods, Inc. | | | 49,000 | | | | 1,193,447 | |
| | | | | | | | |
| | | | $ | 7,472,197 | |
| Food & Drug Stores - 2.2% | | | | | | | | |
| Alimentation Couche-Tard, Inc., “B” | | | 33,351 | | | $ | 1,719,939 | |
| Wesfarmers Ltd. | | | 60,196 | | | | 1,919,999 | |
| | | | | | | | |
| | | | $ | 3,639,938 | |
| Forest & Paper Products - 0.5% | | | | | | | | |
| Fibria Celulose S.A. | | | 113,000 | | | $ | 770,200 | |
| | |
| Furniture & Appliances - 0.3% | | | | | | | | |
| Zojirushi Corp. | | | 35,800 | | | $ | 560,191 | |
| | |
| Gaming & Lodging - 0.8% | | | | | | | | |
| Paddy Power PLC | | | 10,982 | | | $ | 1,320,964 | |
| | |
| Insurance - 5.5% | | | | | | | | |
| AMP Ltd. | | | 109,642 | | | $ | 433,432 | |
| AXA | | | 31,181 | | | | 654,576 | |
| Beazley PLC | | | 181,485 | | | | 928,483 | |
| QBE Insurance Group Ltd. | | | 146,458 | | | | 1,091,900 | |
| Samsung Fire & Marine Insurance Co. Ltd. | | | 3,673 | | | | 889,426 | |
| Sony Financial Holdings, Inc. | | | 31,400 | | | | 431,251 | |
| Swiss Re Ltd. | | | 10,800 | | | | 911,392 | |
| Tokio Marine Holding, Inc. | | | 31,400 | | | | 1,233,360 | |
| Zurich Insurance Group AG | | | 9,445 | | | | 2,414,186 | |
| | | | | | | | |
| | | | $ | 8,988,006 | |
| Internet - 2.4% | | | | | | | | |
| Alibaba Group Holding Ltd., ADR (a) | | | 24,358 | | | $ | 2,367,354 | |
| Mixi, Inc. | | | 26,900 | | | | 955,468 | |
| NetEase.com, Inc., ADR | | | 2,667 | | | | 565,324 | |
| | | | | | | | |
| | | | $ | 3,888,146 | |
13
Portfolio of Investments – continued
| | | | | | | | |
| Issuer | | Shares/Par | | | Value ($) | |
| Common Stocks - continued | | | | | | | | |
| Major Banks - 8.9% | | | | | | | | |
| Banco do Brasil S.A. | | | 144,600 | | | $ | 1,039,318 | |
| Bank of China Ltd. | | | 2,284,000 | | | | 1,027,536 | |
| Barclays PLC | | | 394,558 | | | | 892,451 | |
| BNP Paribas | | | 43,790 | | | | 2,227,602 | |
| BOC Hong Kong Holdings Ltd. | | | 694,000 | | | | 2,428,873 | |
| Industrial & Commercial Bank of China, “H” | | | 3,359,000 | | | | 2,134,678 | |
| Mitsubishi UFJ Financial Group, Inc. | | | 268,700 | | | | 1,464,975 | |
| Sumitomo Mitsui Financial Group, Inc. | | | 67,200 | | | | 2,351,821 | |
| Westpac Banking Corp. | | | 48,237 | | | | 1,068,000 | |
| | | | | | | | |
| | | | $ | 14,635,254 | |
| Medical & Health Technology & Services - 0.2% | | | | | | | | |
| Toho Holdings Co. Ltd. | | | 17,900 | | | $ | 347,914 | |
| | |
| Medical Equipment - 0.8% | | | | | | | | |
| Nihon Kohden Corp. | | | 40,300 | | | $ | 917,671 | |
| Nipro Corp. | | | 31,400 | | | | 390,888 | |
| | | | | | | | |
| | | | $ | 1,308,559 | |
| Metals & Mining - 1.7% | | | | | | | | |
| Rio Tinto Ltd. | | | 64,532 | | | $ | 1,949,871 | |
| Ternium S.A., ADR | | | 44,829 | | | | 896,580 | |
| | | | | | | | |
| | | | $ | 2,846,451 | |
| Natural Gas - Distribution - 0.9% | | | | | | | | |
| Engie | | | 97,702 | | | $ | 1,557,349 | |
| | |
| Other Banks & Diversified Financials - 6.2% | | | | | | | | |
| Agricultural Bank of China Ltd., “H” | | | 941,000 | | | $ | 386,951 | |
| China Construction Bank | | | 2,239,000 | | | | 1,674,008 | |
| DBS Group Holdings Ltd. | | | 179,200 | | | | 1,971,601 | |
| Intesa Sanpaolo S.p.A. | | | 734,165 | | | | 1,744,309 | |
| Sberbank of Russia, ADR | | | 150,981 | | | | 1,384,496 | |
| Turkiye Garanti Bankasi A.S. | | | 268,025 | | | | 691,484 | |
| UBS AG | | | 160,020 | | | | 2,313,542 | |
| | | | | | | | |
| | | | $ | 10,166,391 | |
| Pharmaceuticals - 7.1% | | | | | | | | |
| Bayer AG | | | 18,438 | | | $ | 1,973,783 | |
| Gedeon Richter PLC | | | 27,566 | | | | 565,491 | |
| KYORIN Holdings, Inc. | | | 31,400 | | | | 629,123 | |
| Merck KGaA | | | 16,585 | | | | 1,745,266 | |
| Novartis AG | | | 4,022 | | | | 316,509 | |
| Roche Holding AG | | | 8,902 | | | | 2,170,403 | |
| Sanofi | | | 21,691 | | | | 1,671,165 | |
14
Portfolio of Investments – continued
| | | | | | | | |
| Issuer | | Shares/Par | | | Value ($) | |
| Common Stocks - continued | | | | | | | | |
| Pharmaceuticals - continued | | | | | | | | |
| Shionogi & Co. Ltd. | | | 26,900 | | | $ | 1,200,900 | |
| Teva Pharmaceutical Industries Ltd., ADR | | | 26,798 | | | | 1,350,351 | |
| | | | | | | | |
| | | | $ | 11,622,991 | |
| Printing & Publishing - 2.4% | | | | | | | | |
| Informa PLC | | | 220,304 | | | $ | 2,049,634 | |
| Transcontinental, Inc., “A” | | | 131,283 | | | | 1,922,094 | |
| | | | | | | | |
| | | | $ | 3,971,728 | |
| Railroad & Shipping - 1.0% | | | | | | | | |
| Canadian National Railway Co. | | | 26,708 | | | $ | 1,717,591 | |
| | |
| Real Estate - 3.0% | | | | | | | | |
| China Evergrande Group | | | 672,000 | | | $ | 464,312 | |
| Link REIT | | | 112,000 | | | | 814,278 | |
| Nomura Real Estate Holdings | | | 62,700 | | | | 1,021,719 | |
| TAG Immobilien AG | | | 49,709 | | | | 715,001 | |
| Unibail-Rodamco, REIT | | | 6,689 | | | | 1,835,467 | |
| | | | | | | | |
| | | | $ | 4,850,777 | |
| Restaurants - 0.3% | | | | | | | | |
| Greggs PLC | | | 34,119 | | | $ | 464,611 | |
| | |
| Specialty Chemicals - 3.2% | | | | | | | | |
| Akzo Nobel N.V. | | | 23,002 | | | $ | 1,554,337 | |
| JSR Corp. | | | 58,200 | | | | 851,076 | |
| LG Chem Ltd. | | | 3,135 | | | | 760,554 | |
| PTT Global Chemical PLC | | | 488,200 | | | | 860,314 | |
| Sumitomo Chemical Co. Ltd. | | | 269,000 | | | | 1,232,359 | |
| | | | | | | | |
| | | | $ | 5,258,640 | |
| Specialty Stores - 0.4% | | | | | | | | |
| NEXT PLC | | | 8,858 | | | $ | 642,661 | |
| | |
| Telecommunications - Wireless - 1.9% | | | | | | | | |
| SoftBank Corp. | | | 9,000 | | | $ | 587,677 | |
| Vodafone Group PLC | | | 836,883 | | | | 2,525,942 | |
| | | | | | | | |
| | | | $ | 3,113,619 | |
| Telephone Services - 2.6% | | | | | | | | |
| BT Group PLC | | | 273,583 | | | $ | 1,387,983 | |
| Nippon Television Holdings, Inc. | | | 44,800 | | | | 1,968,403 | |
| PT XL Axiata Tbk (a) | | | 4,456,500 | | | | 954,124 | |
| | | | | | | | |
| | | | $ | 4,310,510 | |
15
Portfolio of Investments – continued
| | | | | | | | |
| Issuer | | Shares/Par | | | Value ($) | |
| Common Stocks - continued | | | | | | | | |
| Tobacco - 1.6% | | | | | | | | |
| Japan Tobacco, Inc. | | | 44,800 | | | $ | 1,735,451 | |
| PT Gudang Garam Tbk | | | 179,000 | | | | 869,024 | |
| | | | | | | | |
| | | | $ | 2,604,475 | |
| Trucking - 0.8% | | | | | | | | |
| Emergent Capital, Inc. | | | 50,161 | | | $ | 538,117 | |
| Yamato Holdings Co. Ltd. | | | 35,800 | | | | 844,785 | |
| | | | | | | | |
| | | | $ | 1,382,902 | |
| Utilities - Electric Power - 2.8% | | | | | | | | |
| Energias de Portugal S.A. | | | 396,321 | | | $ | 1,328,439 | |
| Korea Electric Power Corp. | | | 32,516 | | | | 1,691,415 | |
| SSE PLC | | | 78,044 | | | | 1,541,351 | |
| | | | | | | | |
| | | | $ | 4,561,205 | |
| Total Common Stocks (Identified Cost, $160,027,265) | | | $ | 158,201,229 | |
| | |
| Preferred Stocks - 1.7% | | | | | | | | |
| Other Banks & Diversified Financials - 0.8% | | | | | | | | |
| Itau Unibanco Holding S.A. | | | 117,400 | | | $ | 1,303,354 | |
| | |
| Telephone Services - 0.9% | | | | | | | | |
| Telecom Italia S.p.A. | | | 2,000,674 | | | $ | 1,466,196 | |
| Total Preferred Stocks (Identified Cost, $2,777,189) | | | $ | 2,769,550 | |
| | |
| Money Market Funds - 2.8% | | | | | | | | |
MFS Institutional Money Market Portfolio, 0.38% (v)
(Identified Cost, $4,620,081) | | | 4,620,081 | | | $ | 4,620,081 | |
| Total Investments (Identified Cost, $167,424,535) | | | $ | 165,590,860 | |
| |
| Other Assets, Less Liabilities - (0.7)% | | | | (1,145,465 | ) |
| Net Assets - 100.0% | | | $ | 164,445,395 | |
| (a) | Non-income producing security. |
| (v) | Underlying affiliated fund that is available only to investment companies managed by MFS. The rate quoted for the MFS Institutional Money Market Portfolio is the annualized seven-day yield of the fund at period end. |
The following abbreviations are used in this report and are defined:
| ADR | | American Depositary Receipt |
| GDR | | Global Depositary Receipt |
| PJSC | | Public Joint Stock Company |
| PLC | | Public Limited Company |
| REIT | | Real Estate Investment Trust |
See Notes to Financial Statements
16
Financial Statements
STATEMENT OF ASSETS AND LIABILITIES
At 8/31/16
This statement represents your fund’s balance sheet, which details the assets and liabilities comprising the total value of the fund.
| | | | |
| Assets | | | | |
Investments | | | | |
Non-affiliated issuers, at value (identified cost, $162,804,454) | | | $160,970,779 | |
Underlying affiliated funds, at value (identified cost, $4,620,081) | | | 4,620,081 | |
Total investments, at value (identified cost, $167,424,535) | | | $165,590,860 | |
Foreign currency, at value (identified cost, $16,980) | | | 17,008 | |
Receivables for | | | | |
Investments sold | | | 184,936 | |
Fund shares sold | | | 669,096 | |
Dividends | | | 106,137 | |
Receivable from investment adviser | | | 20,403 | |
Other assets | | | 31 | |
Total assets | | | $166,588,471 | |
| Liabilities | | | | |
Payable for investments purchased | | | $2,069,512 | |
Payable to affiliates | | | | |
Shareholder servicing costs | | | 223 | |
Distribution and service fees | | | 14 | |
Payable for independent Trustees’ compensation | | | 14 | |
Deferred country tax expense payable | | | 180 | |
Accrued expenses and other liabilities | | | 73,133 | |
Total liabilities | | | $2,143,076 | |
Net assets | | | $164,445,395 | |
| Net assets consist of | | | | |
Paid-in capital | | | $166,363,189 | |
Unrealized appreciation (depreciation) on investments and translation of assets and liabilities in foreign currencies (net of $180 deferred country tax) | | | (1,834,702 | ) |
Accumulated net realized gain (loss) on investments and foreign currency | | | (138,705 | ) |
Undistributed net investment income | | | 55,613 | |
Net assets | | | $164,445,395 | |
Shares of beneficial interest outstanding | | | 16,709,409 | |
17
Statement of Assets and Liabilities – continued
| | | | | | | | | | | | |
| | | Net assets | | | Shares
outstanding | | | Net asset value
per share (a) | |
Class A | | | $138,804 | | | | 14,132 | | | | $9.82 | |
Class B | | | 53,528 | | | | 5,475 | | | | 9.78 | |
Class C | | | 59,464 | | | | 6,083 | | | | 9.78 | |
Class I | | | 639,706 | | | | 65,023 | | | | 9.84 | |
Class R1 | | | 49,344 | | | | 5,047 | | | | 9.78 | |
Class R2 | | | 49,581 | | | | 5,055 | | | | 9.81 | |
Class R3 | | | 49,759 | | | | 5,059 | | | | 9.84 | |
Class R4 | | | 49,820 | | | | 5,063 | | | | 9.84 | |
Class R6 (formerly Class R5) | | | 163,355,389 | | | | 16,598,472 | | | | 9.84 | |
| (a) | Maximum offering price per share was equal to the net asset value per share for all share classes, except for Class A, for which the maximum offering price per share was $10.42 [100 / 94.25 x $9.82]. On sales of $50,000 or more, the maximum offering price of Class A shares is reduced. A contingent deferred sales charge may be imposed on redemptions of Class A, Class B, and Class C shares. Redemption price per share was equal to the net asset value per share for Classes I, R1, R2, R3, R4, and R6. |
See Notes to Financial Statements
18
Financial Statements
STATEMENT OF OPERATIONS
Period ended 8/31/16 (c)
This statement describes how much your fund earned in investment income and accrued in expenses. It also describes any gains and/or losses generated by fund operations.
| | | | |
| Net investment income | | | | |
Income | | | | |
Dividends | | | $233,359 | |
Dividends from underlying affiliated funds | | | 463 | |
Foreign taxes withheld | | | (13,281 | ) |
Total investment income | | | $220,541 | |
Expenses | | | | |
Management fee | | | $33,568 | |
Distribution and service fees | | | 2,219 | |
Shareholder servicing costs | | | 994 | |
Administrative services fee | | | 16,876 | |
Independent Trustees’ compensation | | | 838 | |
Custodian fee | | | 31,750 | |
Shareholder communications | | | 5,178 | |
Audit and tax fees | | | 40,565 | |
Legal fees | | | 1,581 | |
Registration fees | | | 78,279 | |
Miscellaneous | | | 15,141 | |
Total expenses | | | $226,989 | |
Fees paid indirectly | | | (11 | ) |
Reduction of expenses by investment adviser | | | (184,209 | ) |
Net expenses | | | $42,769 | |
Net investment income | | | $177,772 | |
| Realized and unrealized gain (loss) on investments and foreign currency | |
Realized gain (loss) (identified cost basis) | | | | |
Investments (net of $9 country tax) | | | $(120,061 | ) |
Foreign currency | | | (105,224 | ) |
Net realized gain (loss) on investments and foreign currency | | | $(225,285 | ) |
Change in unrealized appreciation (depreciation) | | | | |
Investments (net of $180 increase in deferred country tax) | | | $(1,833,855 | ) |
Translation of assets and liabilities in foreign currencies | | | (847 | ) |
Net unrealized gain (loss) on investments and foreign currency translation | | | $(1,834,702 | ) |
Net realized and unrealized gain (loss) on investments and foreign currency | | | $(2,059,987 | ) |
Change in net assets from operations | | | $(1,882,215 | ) |
| (c) | For the period from the commencement of the fund’s investment operations, September 15, 2015, through the stated period end. |
See Notes to Financial Statements
19
Financial Statements
STATEMENT OF CHANGES IN NET ASSETS
This statement describes the increases and/or decreases in net assets resulting from operations, any distributions, and any shareholder transactions.
| | | | |
| | | Period ended
8/31/16 (c) | |
| Change in net assets | | | |
| From operations | | | | |
Net investment income | | | $177,772 | |
Net realized gain (loss) on investments and foreign currency | | | (225,285 | ) |
Net unrealized gain (loss) on investments and foreign currency translation | | | (1,834,702 | ) |
Change in net assets from operations | | | $(1,882,215 | ) |
| Distributions declared to shareholders | | | | |
From net investment income | | | $(20,051 | ) |
From net realized gain on investments | | | (16,010 | ) |
Total distributions declared to shareholders | | | $(36,061 | ) |
Change in net assets from fund share transactions | | | $166,363,671 | |
Total change in net assets | | | $164,445,395 | |
| Net assets | | | | |
At beginning of period | | | — | |
At end of period (including undistributed net investment income of $55,613) | | | $164,445,395 | |
| (c) | For the period from the commencement of the fund’s investment operations, September 15, 2015, through the stated period end. |
See Notes to Financial Statements
20
Financial Statements
FINANCIAL HIGHLIGHTS
The financial highlights table is intended to help you understand the fund’s financial performance for the past 5 years (or life of a particular share class, if shorter). Certain information reflects financial results for a single fund share. The total returns in the table represent the rate by which an investor would have earned (or lost) on an investment in the fund share class (assuming reinvestment of all distributions) held for the entire period.
| | | | |
| Class A | | Period ended
8/31/16 (c) | |
Net asset value, beginning of period | | | $10.00 | |
| Income (loss) from investment operations | | | | |
Net investment income (d) | | | $0.25 | |
Net realized and unrealized gain (loss) on investments and foreign currency | | | (0.32 | ) |
Total from investment operations | | | $(0.07 | ) |
| Less distributions declared to shareholders | | | | |
From net investment income | | | $(0.06 | ) |
From net realized gain on investments | | | (0.05 | ) |
Total distributions declared to shareholders | | | $(0.11 | ) |
Net asset value, end of period (x) | | | $9.82 | |
Total return (%) (r)(s)(t)(x) | | | (0.64 | )(n) |
Ratios (%) (to average net assets)
and Supplemental data: | | | | |
Expenses before expense reductions (f) | | | 5.84 | (a) |
Expenses after expense reductions (f) | | | 0.89 | (a) |
Net investment income | | | 2.70 | (a) |
Portfolio turnover | | | 64 | (n) |
Net assets at end of period (000 omitted) | | | $139 | |
See Notes to Financial Statements
21
Financial Highlights – continued
| | | | |
| Class B | | Period ended
8/31/16 (c) | |
Net asset value, beginning of period | | | $10.00 | |
| Income (loss) from investment operations | | | | |
Net investment income (d) | | | $0.15 | |
Net realized and unrealized gain (loss) on investments and foreign currency | | | (0.28 | ) |
Total from investment operations | | | $(0.13 | ) |
| Less distributions declared to shareholders | | | | |
From net investment income | | | $(0.04 | ) |
From net realized gain on investments | | | (0.05 | ) |
Total distributions declared to shareholders | | | $(0.09 | ) |
Net asset value, end of period (x) | | | $9.78 | |
Total return (%) (r)(s)(t)(x) | | | (1.27 | )(n) |
Ratios (%) (to average net assets)
and Supplemental data: | | | | |
Expenses before expense reductions (f) | | | 7.12 | (a) |
Expenses after expense reductions (f) | | | 1.63 | (a) |
Net investment income | | | 1.64 | (a) |
Portfolio turnover | | | 64 | (n) |
Net assets at end of period (000 omitted) | | | $54 | |
| |
| Class C | | Period ended
8/31/16 (c) | |
Net asset value, beginning of period | | | $10.00 | |
| Income (loss) from investment operations | | | | |
Net investment income (d) | | | $0.16 | |
Net realized and unrealized gain (loss) on investments and foreign currency | | | (0.29 | ) |
Total from investment operations | | | $(0.13 | ) |
| Less distributions declared to shareholders | | | | |
From net investment income | | | $(0.04 | ) |
From net realized gain on investments | | | (0.05 | ) |
Total distributions declared to shareholders | | | $(0.09 | ) |
Net asset value, end of period (x) | | | $9.78 | |
Total return (%) (r)(s)(t)(x) | | | (1.27 | )(n) |
Ratios (%) (to average net assets)
and Supplemental data: | | | | |
Expenses before expense reductions (f) | | | 7.03 | (a) |
Expenses after expense reductions (f) | | | 1.63 | (a) |
Net investment income | | | 1.70 | (a) |
Portfolio turnover | | | 64 | (n) |
Net assets at end of period (000 omitted) | | | $59 | |
See Notes to Financial Statements
22
Financial Highlights – continued
| | | | |
| Class I | | Period ended
8/31/16 (c) | |
Net asset value, beginning of period | | | $10.00 | |
| Income (loss) from investment operations | | | | |
Net investment income (d) | | | $0.33 | |
Net realized and unrealized gain (loss) on investments and foreign currency | | | (0.37 | ) |
Total from investment operations | | | $(0.04 | ) |
| Less distributions declared to shareholders | | | | |
From net investment income | | | $(0.07 | ) |
From net realized gain on investments | | | (0.05 | ) |
Total distributions declared to shareholders | | | $(0.12 | ) |
Net asset value, end of period (x) | | | $9.84 | |
Total return (%) (r)(s)(x) | | | (0.37 | )(n) |
Ratios (%) (to average net assets)
and Supplemental data: | | | | |
Expenses before expense reductions (f) | | | 4.94 | (a) |
Expenses after expense reductions (f) | | | 0.64 | (a) |
Net investment income | | | 3.65 | (a) |
Portfolio turnover | | | 64 | (n) |
Net assets at end of period (000 omitted) | | | $640 | |
| |
| Class R1 | | Period ended
8/31/16 (c) | |
Net asset value, beginning of period | | | $10.00 | |
| Income (loss) from investment operations | | | | |
Net investment income (d) | | | $0.15 | |
Net realized and unrealized gain (loss) on investments and foreign currency | | | (0.28 | ) |
Total from investment operations | | | $(0.13 | ) |
| Less distributions declared to shareholders | | | | |
From net investment income | | | $(0.04 | ) |
From net realized gain on investments | | | (0.05 | ) |
Total distributions declared to shareholders | | | $(0.09 | ) |
Net asset value, end of period (x) | | | $9.78 | |
Total return (%) (r)(s)(x) | | | (1.27 | )(n) |
Ratios (%) (to average net assets)
and Supplemental data: | | | | |
Expenses before expense reductions (f) | | | 7.19 | (a) |
Expenses after expense reductions (f) | | | 1.63 | (a) |
Net investment income | | | 1.60 | (a) |
Portfolio turnover | | | 64 | (n) |
Net assets at end of period (000 omitted) | | | $49 | |
See Notes to Financial Statements
23
Financial Highlights – continued
| | | | |
| Class R2 | | Period ended
8/31/16 (c) | |
Net asset value, beginning of period | | | $10.00 | |
| Income (loss) from investment operations | | | | |
Net investment income (d) | | | $0.19 | |
Net realized and unrealized gain (loss) on investments and foreign currency | | | (0.28 | ) |
Total from investment operations | | | $(0.09 | ) |
| Less distributions declared to shareholders | | | | |
From net investment income | | | $(0.05 | ) |
From net realized gain on investments | | | (0.05 | ) |
Total distributions declared to shareholders | | | $(0.10 | ) |
Net asset value, end of period (x) | | | $9.81 | |
Total return (%) (r)(s)(x) | | | (0.82 | )(n) |
Ratios (%) (to average net assets)
and Supplemental data: | | | | |
Expenses before expense reductions (f) | | | 6.68 | (a) |
Expenses after expense reductions (f) | | | 1.13 | (a) |
Net investment income | | | 2.11 | (a) |
Portfolio turnover | | | 64 | (n) |
Net assets at end of period (000 omitted) | | | $50 | |
| |
| Class R3 | | Period ended
8/31/16 (c) | |
Net asset value, beginning of period | | | $10.00 | |
| Income (loss) from investment operations | | | | |
Net investment income (d) | | | $0.29 | |
Net realized and unrealized gain (loss) on investments and foreign currency | | | (0.34 | ) |
Total from investment operations | | | $(0.05 | ) |
| Less distributions declared to shareholders | | | | |
From net investment income | | | $(0.06 | ) |
From net realized gain on investments | | | (0.05 | ) |
Total distributions declared to shareholders | | | $(0.11 | ) |
Net asset value, end of period (x) | | | $9.84 | |
Total return (%) (r)(s)(x) | | | (0.44 | )(n) |
Ratios (%) (to average net assets)
and Supplemental data: | | | | |
Expenses before expense reductions (f) | | | 5.94 | (a) |
Expenses after expense reductions (f) | | | 0.87 | (a) |
Net investment income | | | 3.16 | (a) |
Portfolio turnover | | | 64 | (n) |
Net assets at end of period (000 omitted) | | | $50 | |
See Notes to Financial Statements
24
Financial Highlights – continued
| | | | |
| Class R4 | | Period ended
8/31/16 (c) | |
Net asset value, beginning of period | | | $10.00 | |
| Income (loss) from investment operations | | | | |
Net investment income (d) | | | $0.24 | |
Net realized and unrealized gain (loss) on investments and foreign currency | | | (0.28 | ) |
Total from investment operations | | | $(0.04 | ) |
| Less distributions declared to shareholders | | | | |
From net investment income | | | $(0.07 | ) |
From net realized gain on investments | | | (0.05 | ) |
Total distributions declared to shareholders | | | $(0.12 | ) |
Net asset value, end of period (x) | | | $9.84 | |
Total return (%) (r)(s)(x) | | | (0.37 | )(n) |
Ratios (%) (to average net assets)
and Supplemental data: | | | | |
Expenses before expense reductions (f) | | | 6.18 | (a) |
Expenses after expense reductions (f) | | | 0.63 | (a) |
Net investment income | | | 2.60 | (a) |
Portfolio turnover | | | 64 | (n) |
Net assets at end of period (000 omitted) | | | $50 | |
| |
| Class R6 (formerly Class R5) | | Period ended
8/31/16 (c) | |
Net asset value, beginning of period | | | $10.00 | |
| Income (loss) from investment operations | | | | |
Net investment income (d) | | | $0.24 | |
Net realized and unrealized gain (loss) on investments and foreign currency | | | (0.28 | ) |
Total from investment operations | | | $(0.04 | ) |
| Less distributions declared to shareholders | | | | |
From net investment income | | | $(0.07 | ) |
From net realized gain on investments | | | (0.05 | ) |
Total distributions declared to shareholders | | | $(0.12 | ) |
Net asset value, end of period (x) | | | $9.84 | |
Total return (%) (r)(s)(x) | | | (0.36 | )(n) |
Ratios (%) (to average net assets)
and Supplemental data: | | | | |
Expenses before expense reductions (f) | | | 3.06 | (a) |
Expenses after expense reductions (f) | | | 0.60 | (a) |
Net investment income | | | 2.61 | (a) |
Portfolio turnover | | | 64 | (n) |
Net assets at end of period (000 omitted) | | | $163,355 | |
See Notes to Financial Statements
25
Financial Highlights – continued
| (c) | For the period from the commencement of the fund’s investment operations, September 15, 2015, through the stated period end. |
| (d) | Per share data is based on average shares outstanding. |
| (f) | Ratios do not reflect reductions from fees paid indirectly, if applicable. |
| (r) | Certain expenses have been reduced without which performance would have been lower. |
| (s) | From time to time the fund may receive proceeds from litigation settlements, without which performance would be lower. |
| (t) | Total returns do not include any applicable sales charges. |
| (x) | The net asset values and total returns have been calculated on net assets which include adjustments made in accordance with U.S. generally accepted accounting principles required at period end for financial reporting purposes. |
See Notes to Financial Statements
26
NOTES TO FINANCIAL STATEMENTS
(1) Business and Organization
MFS Blended Research International Equity Fund (the fund) is a diversified series of MFS Series Trust IV (the trust). The trust is organized as a Massachusetts business trust and is registered under the Investment Company Act of 1940, as amended, as an open-end management investment company.
The fund is an investment company and accordingly follows the investment company accounting and reporting guidance of the Financial Accounting Standards Board (FASB) Accounting Standards Codification Topic 946 Financial Services – Investment Companies.
(2) Significant Accounting Policies
General – The preparation of financial statements in conformity with U.S. generally accepted accounting principles requires management to make estimates and assumptions that affect the reported amounts of assets and liabilities, and disclosure of contingent assets and liabilities at the date of the financial statements and the reported amounts of increases and decreases in net assets from operations during the reporting period. Actual results could differ from those estimates. In the preparation of these financial statements, management has evaluated subsequent events occurring after the date of the fund’s Statement of Assets and Liabilities through the date that the financial statements were issued. The fund invests in foreign securities, including securities of emerging market issuers. Investments in foreign securities are vulnerable to the effects of changes in the relative values of the local currency and the U.S. dollar and to the effects of changes in each country’s legal, political, and economic environment. The markets of emerging markets countries are generally more volatile than the markets of developed countries with more mature economies. All of the risks of investing in foreign securities previously described are heightened when investing in emerging markets countries.
Balance Sheet Offsetting – The fund’s accounting policy with respect to balance sheet offsetting is that, absent an event of default by the counterparty or a termination of the agreement, the International Swaps and Derivatives Association (ISDA) Master Agreement does not result in an offset of reported amounts of financial assets and financial liabilities in the Statement of Assets and Liabilities across transactions between the fund and the applicable counterparty. The fund’s right to setoff may be restricted or prohibited by the bankruptcy or insolvency laws of the particular jurisdiction to which a specific master netting agreement counterparty is subject. Balance sheet offsetting disclosures, to the extent applicable to the fund, have been included in the fund’s Significant Accounting Policies note under the captions for each of the fund’s in-scope financial instruments and transactions.
Investment Valuations – Equity securities, including restricted equity securities, are generally valued at the last sale or official closing price on their primary market or exchange as provided by a third-party pricing service. Equity securities, for which there were no sales reported that day, are generally valued at the last quoted daily bid quotation on their primary market or exchange as provided by a third-party pricing service. Short-term instruments with a maturity at issuance of 60 days or less may be
27
Notes to Financial Statements – continued
valued at amortized cost, which approximates market value. Open-end investment companies are generally valued at net asset value per share. Securities and other assets generally valued on the basis of information from a third-party pricing service may also be valued at a broker/dealer bid quotation. Values obtained from third-party pricing services can utilize both transaction data and market information such as yield, quality, coupon rate, maturity, type of issue, trading characteristics, and other market data. The values of foreign securities and other assets and liabilities expressed in foreign currencies are converted to U.S. dollars using the mean of bid and asked prices for rates provided by a third-party pricing service.
The Board of Trustees has delegated primary responsibility for determining or causing to be determined the value of the fund’s investments (including any fair valuation) to the adviser pursuant to valuation policies and procedures approved by the Board. If the adviser determines that reliable market quotations are not readily available, investments are valued at fair value as determined in good faith by the adviser in accordance with such procedures under the oversight of the Board of Trustees. Under the fund’s valuation policies and procedures, market quotations are not considered to be readily available for most types of debt instruments and floating rate loans and many types of derivatives. These investments are generally valued at fair value based on information from third-party pricing services. In addition, investments may be valued at fair value if the adviser determines that an investment’s value has been materially affected by events occurring after the close of the exchange or market on which the investment is principally traded (such as foreign exchange or market) and prior to the determination of the fund’s net asset value, or after the halting of trading of a specific security where trading does not resume prior to the close of the exchange or market on which the security is principally traded. Events that occur on a frequent basis after foreign markets close (such as developments in foreign markets and significant movements in the U.S. markets) and prior to the determination of the fund’s net asset value may be deemed to have a material effect on the value of securities traded in foreign markets. Accordingly, the fund’s foreign equity securities may often be valued at fair value. The adviser generally relies on third-party pricing services or other information (such as the correlation with price movements of similar securities in the same or other markets; the type, cost and investment characteristics of the security; the business and financial condition of the issuer; and trading and other market data) to assist in determining whether to fair value and at what value to fair value an investment. The value of an investment for purposes of calculating the fund’s net asset value can differ depending on the source and method used to determine value. When fair valuation is used, the value of an investment used to determine the fund’s net asset value may differ from quoted or published prices for the same investment. There can be no assurance that the fund could obtain the fair value assigned to an investment if it were to sell the investment at the same time at which the fund determines its net asset value per share.
Various inputs are used in determining the value of the fund’s assets or liabilities. These inputs are categorized into three broad levels. In certain cases, the inputs used to measure fair value may fall into different levels of the fair value hierarchy. In such cases, an investment’s level within the fair value hierarchy is based on the lowest level of input that is significant to the fair value measurement. The fund’s assessment of the significance of a particular input to the fair value measurement in its entirety requires
28
Notes to Financial Statements – continued
judgment, and considers factors specific to the investment. Level 1 includes unadjusted quoted prices in active markets for identical assets or liabilities. Level 2 includes other significant observable market-based inputs (including quoted prices for similar securities, interest rates, prepayment speed, and credit risk). Level 3 includes unobservable inputs, which may include the adviser’s own assumptions in determining the fair value of investments. The following is a summary of the levels used as of August 31, 2016 in valuing the fund’s assets or liabilities:
| | | | | | | | | | | | | | | | |
| Investments at Value | | Level 1 | | | Level 2 | | | Level 3 | | | Total | |
| Equity Securities: | | | | | | | | | | | | | | | | |
Japan | | | $27,577,417 | | | | $— | | | | $— | | | | $27,577,417 | |
United Kingdom | | | 20,078,260 | | | | — | | | | — | | | | 20,078,260 | |
France | | | 14,235,937 | | | | — | | | | — | | | | 14,235,937 | |
Germany | | | 11,825,360 | | | | — | | | | — | | | | 11,825,360 | |
China | | | 9,986,013 | | | | — | | | | — | | | | 9,986,013 | |
Canada | | | 9,486,256 | | | | — | | | | — | | | | 9,486,256 | |
South Korea | | | 9,242,508 | | | | — | | | | — | | | | 9,242,508 | |
Switzerland | | | 8,748,421 | | | | — | | | | — | | | | 8,748,421 | |
Hong Kong | | | 5,810,850 | | | | — | | | | — | | | | 5,810,850 | |
Other Countries | | | 43,119,443 | | | | 860,314 | | | | — | | | | 43,979,757 | |
| Mutual Funds | | | 4,620,081 | | | | — | | | | — | | | | 4,620,081 | |
| Total Investments | | | $164,730,546 | | | | $860,314 | | | | $— | | | | $165,590,860 | |
For further information regarding security characteristics, see the Portfolio of Investments.
Foreign Currency Translation – Purchases and sales of foreign investments, income, and expenses are converted into U.S. dollars based upon currency exchange rates prevailing on the respective dates of such transactions or on the reporting date for foreign denominated receivables and payables. Gains and losses attributable to foreign currency exchange rates on sales of securities are recorded for financial statement purposes as net realized gains and losses on investments. Gains and losses attributable to foreign exchange rate movements on receivables, payables, income and expenses are recorded for financial statement purposes as foreign currency transaction gains and losses. That portion of both realized and unrealized gains and losses on investments that results from fluctuations in foreign currency exchange rates is not separately disclosed.
Zero Strike Warrants – The fund invested in low exercise price call warrants (zero strike warrants). Zero strike warrants are issued by banks or broker-dealers and allow the fund to gain exposure to common stocks in markets that place restrictions on direct investments by foreign investors and may or may not be traded on an exchange. Income received from zero strike warrants is recorded as dividend income in the Statement of Operations. To the extent the fund invests in zero strike warrants whose returns correspond to the performance of a foreign stock, investing in zero strike warrants will involve risks similar to the risks of investing in foreign securities. Additional risks associated with zero strike warrants include the potential inability of the counterparty to fulfill their obligations under the warrant, inability to transfer or liquidate the warrants and potential delays or an inability to redeem before expiration under certain market conditions.
29
Notes to Financial Statements – continued
Indemnifications – Under the fund’s organizational documents, its officers and Trustees may be indemnified against certain liabilities and expenses arising out of the performance of their duties to the fund. Additionally, in the normal course of business, the fund enters into agreements with service providers that may contain indemnification clauses. The fund’s maximum exposure under these agreements is unknown as this would involve future claims that may be made against the fund that have not yet occurred.
Investment Transactions and Income – Investment transactions are recorded on the trade date. Dividends received in cash are recorded on the ex-dividend date. Certain dividends from foreign securities will be recorded when the fund is informed of the dividend if such information is obtained subsequent to the ex-dividend date. Dividend payments received in additional securities are recorded on the ex-dividend date in an amount equal to the value of the security on such date.
The fund may receive proceeds from litigation settlements. Any proceeds received from litigation involving portfolio holdings are reflected in the Statement of Operations in realized gain/loss if the security has been disposed of by the fund or in unrealized gain/loss if the security is still held by the fund. Any other proceeds from litigation not related to portfolio holdings are reflected as other income in the Statement of Operations.
Fees Paid Indirectly – Prior to October 1, 2015, the fund’s custody fee could be reduced by a credit earned under an arrangement that measured the value of U.S. dollars deposited with the custodian by the fund. The amount of the credit, for the period ended August 31, 2016, is shown as a reduction of total expenses in the Statement of Operations.
Tax Matters and Distributions – The fund intends to qualify as a regulated investment company, as defined under Subchapter M of the Internal Revenue Code, and to distribute all of its taxable income, including realized capital gains. As a result, no provision for federal income tax is required. The fund’s federal tax returns, when filed, will remain subject to examination by the Internal Revenue Service for a three year period. Management has analyzed the fund’s tax positions taken on federal and state tax returns for all open tax years and does not believe that there are any uncertain tax positions that require recognition of a tax liability. Foreign taxes, if any, have been accrued by the fund in the accompanying financial statements in accordance with the applicable foreign tax law. Foreign income taxes may be withheld by certain countries in which the fund invests. Additionally, capital gains realized by the fund on securities issued in or by certain foreign countries may be subject to capital gains tax imposed by those countries.
Distributions to shareholders are recorded on the ex-dividend date. Income and capital gain distributions are determined in accordance with income tax regulations, which may differ from U.S. generally accepted accounting principles. Certain capital accounts in the financial statements are periodically adjusted for permanent differences in order to reflect their tax character. These adjustments have no impact on net assets or net asset value per share. Temporary differences which arise from recognizing certain items of income, expense, gain or loss in different periods for financial statement and tax purposes will reverse at some time in the future. Distributions in excess of net
30
Notes to Financial Statements – continued
investment income or net realized gains are temporary overdistributions for financial statement purposes resulting from differences in the recognition or classification of income or distributions for financial statement and tax purposes.
During the period ended August 31, 2016, there were no significant adjustments due to differences between book and tax accounting.
The tax character of distributions declared to shareholders for the last fiscal year is as follows:
| | | | |
| | | 8/31/16 | |
Ordinary income (including any short-term capital gains) | | $ | 36,061 | |
The federal tax cost and the tax basis components of distributable earnings were as follows:
| | | | |
| As of 8/31/16 | | | |
| Cost of investments | | | $167,449,495 | |
| Gross appreciation | | | 1,149,804 | |
| Gross depreciation | | | (3,008,439 | ) |
| Net unrealized appreciation (depreciation) | | | $(1,858,635 | ) |
| Undistributed ordinary income | | | 50,846 | |
| Post-October capital loss deferral | | | (113,745 | ) |
| Other temporary differences | | | 3,740 | |
Multiple Classes of Shares of Beneficial Interest – The fund offers multiple classes of shares, which differ in their respective distribution and service fees. The fund’s income, realized and unrealized gain (loss), and common expenses are allocated to shareholders based on the daily net assets of each class. Dividends are declared separately for each class. Differences in per share dividend rates are generally due to differences in separate class expenses. Class B shares will convert to Class A shares approximately eight years after purchase. The fund’s distributions declared to
31
Notes to Financial Statements – continued
shareholders as reported in the Statement of Changes in Net Assets are presented by class as follows:
| | | | | | | | |
| | | From net investment
income | | | From net realized gain on
investments | |
| | | Period
ended
8/31/16 (c) | | | Period
ended
8/31/16 (c) | |
| Class A | | | $353 | | | | $305 | |
| Class B | | | 194 | | | | 266 | |
| Class C | | | 194 | | | | 266 | |
| Class I | | | 342 | | | | 266 | |
| Class R1 | | | 194 | | | | 266 | |
| Class R2 | | | 268 | | | | 266 | |
| Class R3 | | | 305 | | | | 266 | |
| Class R4 | | | 342 | | | | 266 | |
| Class R6 (formerly Class R5) | | | 17,859 | | | | 13,843 | |
| Total | | | $20,051 | | | | $16,010 | |
| (c) | For the period from the commencement of the fund’s investment operations, September 15, 2015, through the stated period end. |
Effective August 26, 2016, Class R5 shares were renamed Class R6 shares.
(3) Transactions with Affiliates
Investment Adviser – The fund has an investment advisory agreement with MFS to provide overall investment management and related administrative services and facilities to the fund. The management fee is computed daily and paid monthly at the following annual rates:
| | | | |
| First $1 billion of average daily net assets | | | 0.50 | % |
| Next $1.5 billion of average daily net assets | | | 0.475 | % |
| Average daily net assets in excess of $2.5 billion | | | 0.45 | % |
MFS has agreed in writing to reduce its management fee by a specified amount if certain MFS mutual fund assets exceed thresholds agreed to by MFS and the fund’s Board of Trustees. For the period ended August 31, 2016, this management fee reduction amounted to $464, which is included in the reduction of total expenses in the Statement of Operations. The management fee incurred for the period ended August 31, 2016 was equivalent to an annual effective rate of 0.49% of the fund’s average daily net assets.
The investment adviser has agreed in writing to pay a portion of the fund’s total annual operating expenses, excluding interest, taxes, extraordinary expenses, brokerage and transaction costs, and investment-related expenses, such that total fund operating expenses do not exceed the following rates annually of each class’s average daily net assets:
| | | | | | | | | | | | | | | | | | | | | | | | | | | | | | | | |
| Classes | |
| A | | B | | | C | | | I | | | R1 | | | R2 | | | R3 | | | R4 | | | R6
(formerly
Class R5) | |
| 0.89% | | | 1.64% | | | | 1.64% | | | | 0.64% | | | | 1.64% | | | | 1.14% | | | | 0.89% | | | | 0.64% | | | | 0.60% | |
32
Notes to Financial Statements – continued
This written agreement will continue until modified by the fund’s Board of Trustees, but such agreement will continue at least until December 31, 2017. For the period ended August 31, 2016, this reduction amounted to $183,745, which is included in the reduction of total expenses in the Statement of Operations.
Distributor – MFS Fund Distributors, Inc. (MFD), a wholly-owned subsidiary of MFS, as distributor, received $159 for the period ended August 31, 2016, as its portion of the initial sales charge on sales of Class A shares of the fund.
The Board of Trustees has adopted a distribution plan for certain share classes pursuant to Rule 12b-1 of the Investment Company Act of 1940.
The fund’s distribution plan provides that the fund will pay MFD for services provided by MFD and financial intermediaries in connection with the distribution and servicing of certain share classes. One component of the plan is a distribution fee paid to MFD and another component of the plan is a service fee paid to MFD. MFD may subsequently pay all, or a portion, of the distribution and/or service fees to financial intermediaries.
Distribution Plan Fee Table:
| | | | | | | | | | | | | | | | | | | | |
| | | Distribution
Fee Rate (d) | | | Service
Fee Rate (d) | | | Total
Distribution
Plan (d) | | | Annual
Effective
Rate (e) | | | Distribution
and Service
Fee | |
| Class A | | | — | | | | 0.25% | | | | 0.25% | | | | 0.25% | | | | $189 | |
| Class B | | | 0.75% | | | | 0.25% | | | | 1.00% | | | | 1.00% | | | | 479 | |
| Class C | | | 0.75% | | | | 0.25% | | | | 1.00% | | | | 1.00% | | | | 496 | |
| Class R1 | | | 0.75% | | | | 0.25% | | | | 1.00% | | | | 1.00% | | | | 464 | |
| Class R2 | | | 0.25% | | | | 0.25% | | | | 0.50% | | | | 0.50% | | | | 232 | |
| Class R3 | | | — | | | | 0.25% | | | | 0.25% | | | | 0.25% | | | | 359 | |
| Total Distribution and Service Fees | | | | | | | | | | | | $2,219 | |
| (d) | In accordance with the distribution plan for certain classes, the fund pays distribution and/or service fees equal to these annual percentage rates of each class’s average daily net assets. The distribution and service fee rates disclosed by class represent the current rates in effect at the end of the reporting period. Any rate changes, if applicable, are detailed below. |
| (e) | The annual effective rates represent actual fees incurred under the distribution plan for the period ended August 31, 2016 based on each class’s average daily net assets. MFD has voluntarily agreed to rebate a portion of each class’s 0.25% service fee attributable to accounts for which MFD retains the 0.25% service fee except for accounts attributable to MFS or its affiliates’ seed money. There were no service fee rebates for the period ended August 31, 2016. |
Certain Class A shares are subject to a contingent deferred sales charge (CDSC) in the event of a shareholder redemption within 18 months of purchase. Class C shares are subject to a CDSC in the event of a shareholder redemption within 12 months of purchase. Class B shares are subject to a CDSC in the event of a shareholder redemption within six years of purchase. There were no contingent deferred sales charges imposed during the period ended August 31, 2016.
Shareholder Servicing Agent – MFS Service Center, Inc. (MFSC), a wholly-owned subsidiary of MFS, receives a fee from the fund for its services as shareholder servicing agent calculated as a percentage of the average daily net assets of the fund as determined periodically under the supervision of the fund’s Board of Trustees. For the period ended August 31, 2016, the fee was $404, which equated to 0.0060%
33
Notes to Financial Statements – continued
annually of the fund’s average daily net assets. MFSC also receives payment from the fund for out-of-pocket expenses, sub-accounting and other shareholder servicing costs which may be paid to affiliated and unaffiliated service providers. Class R6 shares do not incur sub-accounting fees. For the period ended August 31, 2016, these out-of-pocket expenses, sub-accounting and other shareholder servicing costs amounted to $590.
Administrator – MFS provides certain financial, legal, shareholder communications, compliance, and other administrative services to the fund. Under an administrative services agreement, the fund reimburses MFS the costs incurred to provide these services. The fund is charged an annual fixed amount of $17,500 plus a fee based on average daily net assets. The administrative services fee incurred for the period ended August 31, 2016 was equivalent to an annual effective rate of 0.2514% of the fund’s average daily net assets.
Trustees’ and Officers’ Compensation – The fund pays compensation to independent Trustees in the form of a retainer, attendance fees, and additional compensation to Board and Committee chairpersons. The fund does not pay compensation directly to Trustees or officers of the fund who are also officers of the investment adviser, all of whom receive remuneration for their services to the fund from MFS. Certain officers and Trustees of the fund are officers or directors of MFS, MFD, and MFSC.
Other – This fund and certain other funds managed by MFS (the funds) have entered into a service agreement (the ISO Agreement) which provides for payment of fees solely by the funds to Tarantino LLC in return for the provision of services of an Independent Senior Officer (ISO) for the funds. Frank L. Tarantino serves as the ISO and is an officer of the funds and the sole member of Tarantino LLC. The funds can terminate the ISO Agreement with Tarantino LLC at any time under the terms of the ISO Agreement. For the period ended August 31, 2016, the fee paid by the fund under this agreement was $7 and is included in “Miscellaneous” expense in the Statement of Operations. MFS has agreed to bear all expenses associated with office space, other administrative support, and supplies provided to the ISO.
The fund invests in the MFS Institutional Money Market Portfolio which is managed by MFS and seeks current income consistent with preservation of capital and liquidity. Income earned on this investment is included in “Dividends from underlying affiliated funds” in the Statement of Operations. This money market fund does not pay a management fee to MFS.
On September 14, 2015, MFS purchased 260,000 shares of Class R6 (formerly Class R5) and 5,000 shares each of Class A, Class B, Class C, Class I, Class R1, Class R2, Class R3, and Class R4 for an aggregate amount of $3,000,000 as an initial investment in the fund. On March 16, 2016, MFS purchased 34,440 shares of Class I for an aggregate amount of $325,806.
At August 31, 2016, MFS held approximately 92%, 83%, 61%, 100%, 100%, 100%, and 100% of the outstanding shares of Class B, Class C, Class I, Class R1, Class R2, Class R3, and Class R4, respectively.
The fund is permitted to engage in purchase and sale transactions (“cross-trades”) with funds and accounts for which MFS serves as investment adviser or sub-adviser pursuant
34
Notes to Financial Statements – continued
to a policy adopted by the Board of Trustees. This policy has been designed to ensure that cross-trades conducted by the fund comply with Rule 17a-7 under the Investment Company Act of 1940. Under this policy, cross-trades are effected at current market prices with no remuneration paid in connection with the transaction. During the period ended August 31, 2016, the fund engaged in purchase transactions pursuant to this policy, which amounted to $31,669,380.
(4) Portfolio Securities
For the period ended August 31, 2016, purchases and sales of investments, other than short-term obligations, aggregated $173,386,153 and $10,462,220, respectively.
(5) Shares of Beneficial Interest
The fund’s Declaration of Trust permits the Trustees to issue an unlimited number of full and fractional shares of beneficial interest. Transactions in fund shares were as follows:
| | | | | | | | |
| | | Period ended
8/31/16 (c) | |
| | | Shares | | | Amount | |
| Shares sold | | | | | | | | |
Class A | | | 14,637 | | | | $139,553 | |
Class B | | | 5,434 | | | | 54,220 | |
Class C | | | 6,036 | | | | 59,994 | |
Class I | | | 68,916 | | | | 639,937 | |
Class R1 | | | 5,000 | | | | 50,000 | |
Class R2 | | | 5,000 | | | | 50,000 | |
Class R3 | | | 25,912 | | | | 238,907 | |
Class R4 | | | 5,000 | | | | 50,000 | |
Class R6 (formerly Class R5) | | | 16,629,085 | | | | 165,626,422 | |
| | | 16,765,020 | | | | $166,909,033 | |
| | |
Shares issued to shareholders in
reinvestment of distributions | | | | | | | | |
Class A | | | 68 | | | | $658 | |
Class B | | | 47 | | | | 460 | |
Class C | | | 47 | | | | 460 | |
Class I | | | 63 | | | | 608 | |
Class R1 | | | 47 | | | | 460 | |
Class R2 | | | 55 | | | | 534 | |
Class R3 | | | 59 | | | | 571 | |
Class R4 | | | 63 | | | | 608 | |
Class R6 (formerly Class R5) | | | 3,268 | | | | 31,702 | |
| | | 3,717 | | | | $36,061 | |
| | |
| Shares reacquired | | | | | | | | |
Class A | | | (573 | ) | | | $(5,483 | ) |
Class B | | | (6 | ) | | | (57 | ) |
Class I | | | (3,956 | ) | | | (38,165 | ) |
Class R3 | | | (20,912 | ) | | | (201,008 | ) |
Class R6 (formerly Class R5) | | | (33,881 | ) | | | (336,710 | ) |
| | | (59,328 | ) | | | $(581,423 | ) |
35
Notes to Financial Statements – continued
| | | | | | | | |
| | | Period ended
8/31/16 (c) | |
| | | Shares | | | Amount | |
| Net change | | | | | | | | |
Class A | | | 14,132 | | | | $134,728 | |
Class B | | | 5,475 | | | | 54,623 | |
Class C | | | 6,083 | | | | 60,454 | |
Class I | | | 65,023 | | | | 602,380 | |
Class R1 | | | 5,047 | | | | 50,460 | |
Class R2 | | | 5,055 | | | | 50,534 | |
Class R3 | | | 5,059 | | | | 38,470 | |
Class R4 | | | 5,063 | | | | 50,608 | |
Class R6 (formerly Class R5) | | | 16,598,472 | | | | 165,321,414 | |
| | | 16,709,409 | | | | $166,363,671 | |
Effective August 26, 2016, Class R5 shares were renamed Class R6 shares.
| (c) | For the period from the commencement of the fund’s investment operations, September 15, 2015, through the stated period end. |
The fund is one of several mutual funds in which certain MFS funds may invest. The MFS funds do not invest in the underlying funds for the purpose of exercising management or control. At the end of the period, the MFS Lifetime 2040 Fund, the MFS Lifetime 2030 Fund, the MFS Lifetime Income Fund, the MFS Lifetime 2020 Fund, the MFS Lifetime 2050 Fund, the MFS Lifetime 2035 Fund, the MFS Lifetime 2045 Fund, the MFS Lifetime 2025 Fund, and the MFS Lifetime 2055 Fund were the owners of record of approximately 24%, 23%, 10%, 9%, 9%, 8%, 7%, 6%, and 2%, respectively, of the value of outstanding voting shares of the fund.
(6) Line of Credit
The fund and certain other funds managed by MFS participate in a $1.25 billion unsecured committed line of credit, subject to a $1 billion sublimit, provided by a syndication of banks under a credit agreement. Borrowings may be made for temporary financing needs. Interest is charged to each fund, based on its borrowings, generally at a rate equal to the higher of the Overnight Federal Reserve funds rate or daily one month LIBOR plus an agreed upon spread. A commitment fee, based on the average daily, unused portion of the committed line of credit, is allocated among the participating funds at the end of each calendar quarter. In addition, the fund and other funds managed by MFS have established unsecured uncommitted borrowing arrangements with certain banks for temporary financing needs. Interest is charged to each fund, based on its borrowings, at a rate equal to the Overnight Federal Reserve funds rate plus an agreed upon spread. For the period ended August 31, 2016, the fund’s commitment fee and interest expense were $11 and $0, respectively, and are included in “Miscellaneous” expense in the Statement of Operations.
36
Notes to Financial Statements – continued
(7) Transactions in Underlying Affiliated Funds-Affiliated Issuers
An affiliated issuer may be considered one in which the fund owns 5% or more of the outstanding voting securities, or a company which is under common control. For the purposes of this report, the fund assumes the following to be an affiliated issuer:
| | | | | | | | | | | | | | | | |
| Underlying Affiliated Fund | | Beginning
Shares/Par
Amount | | | Acquisitions
Shares/Par
Amount | | | Dispositions
Shares/Par
Amount | | | Ending
Shares/Par
Amount | |
MFS Institutional Money
Market Portfolio | | | — | | | | 5,816,716 | | | | (1,196,635 | ) | | | 4,620,081 | |
| | | | |
| Underlying Affiliated Fund | | Realized
Gain (Loss) | | | Capital Gain
Distributions | | | Dividend
Income | | | Ending
Value | |
MFS Institutional Money
Market Portfolio | | | $— | | | | $— | | | | $463 | | | | $4,620,081 | |
37
REPORT OF INDEPENDENT REGISTERED PUBLIC ACCOUNTING FIRM
To the Board of Trustees of MFS Series Trust IV and Shareholders of MFS Blended Research International Equity Fund:
We have audited the accompanying statement of assets and liabilities, including the portfolio of investments, of MFS Blended Research International Equity Fund (the Fund) (one of the series constituting the MFS Series Trust IV) as of August 31, 2016, and the related statements of operations, changes in net assets and the financial highlights for the period from September 15, 2015 (commencement of operations) to August 31, 2016. These financial statements and financial highlights are the responsibility of the Fund’s management. Our responsibility is to express an opinion on these financial statements and financial highlights based on our audit.
We conducted our audit in accordance with the standards of the Public Company Accounting Oversight Board (United States). Those standards require that we plan and perform the audit to obtain reasonable assurance about whether the financial statements and financial highlights are free of material misstatement. We were not engaged to perform an audit of the Fund’s internal control over financial reporting. Our audit included consideration of internal control over financial reporting as a basis for designing audit procedures that are appropriate in the circumstances, but not for the purpose of expressing an opinion on the effectiveness of the Fund’s internal control over financial reporting. Accordingly, we express no such opinion. An audit also includes examining, on a test basis, evidence supporting the amounts and disclosures in the financial statements and financial highlights, assessing the accounting principles used and significant estimates made by management, and evaluating the overall financial statement presentation. Our procedures included confirmation of securities owned as of August 31, 2016, by correspondence with the custodian and others or by other appropriate auditing procedures where replies from others were not received. We believe that our audit provides a reasonable basis for our opinion.
In our opinion, the financial statements and financial highlights referred to above present fairly, in all material respects, the financial position of MFS Blended Research International Equity Fund (one of the series constituting the MFS Series Trust IV) at August 31, 2016, the results of its operations, the changes in its net assets and the financial highlights for the period from September 15, 2015 (commencement of operations) to August 31, 2016, in conformity with U.S. generally accepted accounting principles.

Boston, Massachusetts
October 17, 2016
38
TRUSTEES AND OFFICERS — IDENTIFICATION AND BACKGROUND
The Trustees and Officers of the Trust, as of October 1, 2016, are listed below, together with their principal occupations during the past five years. (Their titles may have varied during that period.) The address of each Trustee and Officer is 111 Huntington Avenue, Boston, Massachusetts 02199-7618.
| | | | | | | | |
Name, Age | | Position(s) Held
with Fund | | Trustee/Officer
Since (h) | | Principal
Occupations During
the Past Five Years | | Other
Directorships (j) |
| INTERESTED TRUSTEES |
Robert J. Manning (k)
(age 52) | | Trustee | | February 2004 | | Massachusetts Financial Services Company, Chairman, Co-Chief Executive Officer and Director | | N/A |
Robin A. Stelmach (k)
(age 55) | | Trustee and
President | | January 2014 | | Massachusetts Financial Services Company, Executive Vice President and Chief Operating Officer | | N/A |
| INDEPENDENT TRUSTEES |
David H. Gunning
(age 74) | | Trustee and Chair of Trustees | | January 2004 | | Private investor | | Lincoln Electric Holdings, Inc., Director; Development Alternatives, Inc., Director/Non-Executive Chairman |
Steven E. Buller
(age 65) | | Trustee | | February 2014 | | Chairman, Financial Accounting Standards Advisory Council (until 2015); Standing Advisory Group, Public Company Accounting Oversight Board, Member (until 2014); BlackRock, Inc. (investment management), Managing Director (until 2014), BlackRock Finco UK (investment management), Director (until 2014) | | N/A |
Robert E. Butler
(age 74) | | Trustee | | January 2006 | | Consultant – investment company industry regulatory and compliance matters | | N/A |
39
Trustees and Officers – continued
| | | | | | | | |
Name, Age | | Position(s) Held
with Fund | | Trustee/Officer
Since (h) | | Principal
Occupations During
the Past Five Years | | Other
Directorships (j) |
Maureen R. Goldfarb
(age 61) | | Trustee | | January 2009 | | Private investor | | N/A |
William R. Gutow
(age 75) | | Trustee | | December 1993 | | Private investor and real estate consultant; Capitol Entertainment Management Company (video franchise), Vice Chairman (until 2014) | | Texas Donuts, Vice Chairman (until 2010) |
Michael Hegarty
(age 71) | | Trustee | | December 2004 | | Private investor | | Rouse Properties Inc., Director; Capmark Financial Group Inc., Director (until 2015) |
John P. Kavanaugh
(age 61) | | Trustee | | January 2009 | | Private investor | | N/A |
Maryanne L. Roepke
(age 60) | | Trustee | | May 2014 | | American Century Investments (investment management), Senior Vice President and Chief Compliance Officer (until 2014) | | N/A |
Laurie J. Thomsen
(age 59) | | Trustee | | March 2005 | | Private investor | | The Travelers Companies, Director; Dycom Industries, Inc., Director |
Robert W. Uek
(age 75) | | Trustee | | January 2006 | | Consultant to investment company industry | | N/A |
| OFFICERS |
Christopher R. Bohane (k)
(age 42) | | Assistant
Secretary and Assistant Clerk | | July 2005 | | Massachusetts Financial Services Company, Vice President and Assistant General Counsel | | N/A |
Kino Clark (k)
(age 48) | | Assistant
Treasurer | | January 2012 | | Massachusetts Financial Services Company, Vice President | | N/A |
Kristin V. Collins (k)
(age 43) | | Assistant
Secretary and Assistant Clerk | | September 2015 | | Massachusetts Financial Services Company, Vice President and Assistant General Counsel | | N/A |
40
Trustees and Officers – continued
| | | | | | | | |
Name, Age | | Position(s) Held
with Fund | | Trustee/Officer
Since (h) | | Principal
Occupations During
the Past Five Years | | Other
Directorships (j) |
Thomas H. Connors (k)
(age 57) | | Assistant
Secretary and Assistant Clerk | | September 2012 | | Massachusetts Financial Services Company, Vice President and Senior Counsel; Deutsche Investment Management Americas Inc. (financial service provider), Director and Senior Counsel (until 2012) | | N/A |
Ethan D. Corey (k)
(age 52) | | Assistant
Secretary and Assistant Clerk | | July 2005 | | Massachusetts Financial Services Company, Senior Vice President and Associate General Counsel | | N/A |
David L. DiLorenzo (k)
(age 48) | | Treasurer | | July 2005 | | Massachusetts Financial Services Company, Senior Vice President | | N/A |
Brian E. Langenfeld (k)
(age 43) | | Assistant
Secretary and Assistant Clerk | | June 2006 | | Massachusetts Financial Services Company, Vice President and Senior Counsel | | N/A |
Susan A. Pereira (k)
(age 45) | | Assistant Secretary and Assistant Clerk | | July 2005 | | Massachusetts Financial Services Company, Vice President and Senior Counsel | | N/A |
Kasey L. Phillips (k)
(age 45) | | Assistant
Treasurer | | September 2012 | | Massachusetts Financial Services Company, Vice President; Wells Fargo Funds Management, LLC, Senior Vice President, Fund Treasurer (until 2012) | | N/A |
41
Trustees and Officers – continued
| | | | | | | | |
Name, Age | | Position(s) Held
with Fund | | Trustee/Officer
Since (h) | | Principal
Occupations During
the Past Five Years | | Other
Directorships (j) |
Mark N. Polebaum (k)
(age 64) | | Secretary and
Clerk | | January 2006 | | Massachusetts Financial Services Company, Executive Vice President, General Counsel and Secretary | | N/A |
Matthew A. Stowe (k)
(age 41) | | Assistant
Secretary and Assistant Clerk | | October 2014 | | Massachusetts Financial Services Company, Vice President and Assistant General Counsel | | N/A |
Frank L. Tarantino
(age 72) | | Independent
Senior Officer | | June 2004 | | Tarantino LLC (provider of compliance services), Principal | | N/A |
Richard S. Weitzel (k)
(age 46) | | Assistant
Secretary and Assistant Clerk | | October 2007 | | Massachusetts Financial Services Company, Senior Vice President and Associate General Counsel | | N/A |
Martin J. Wolin (k)
(age 49) | | Chief Compliance Officer | | July 2015 | | Massachusetts Financial Services Company, Senior Vice President and Chief Compliance Officer (since July 2015); Mercer (financial service provider), Chief Risk and Compliance Officer, North America and Latin America (until June 2015) | | N/A |
James O. Yost (k)
(age 56) | | Deputy Treasurer | | September 1990 | | Massachusetts Financial Services Company, Senior Vice President | | N/A |
| (h) | Date first appointed to serve as Trustee/officer of an MFS Fund. Each Trustee has served continuously since appointment unless indicated otherwise. For the period from December 15, 2004 until February 22, 2005, Mr. Manning served as Advisory Trustee. Prior to January 2012, Messrs. DiLorenzo and Yost served as Assistant Treasurers of the Funds. Ms. Stelmach was appointed as President of the Funds as of October 1, 2014. |
| (j) | Directorships or trusteeships of companies required to report to the Securities and Exchange Commission (i.e., “public companies”). |
(k) “Interested person” of the Trust within the meaning of the Investment Company Act of 1940 (referred to as the 1940 Act), which is the principal federal law governing investment companies like the fund, as a result of a position with MFS. The address of MFS is 111 Huntington Avenue, Boston, Massachusetts 02199-7618.
42
Trustees and Officers – continued
Each Trustee (except Ms. Stelmach, Mr. Buller and Ms. Roepke) has been elected by shareholders and each Trustee and officer holds office until his or her successor is chosen and qualified or until his or her earlier death, resignation, retirement or removal. The Trust does not hold annual meetings for the purpose of electing Trustees, and Trustees are not elected for fixed terms. Messrs. Buller, Butler, Kavanaugh, Uek and Ms. Roepke are members of the Trust’s Audit Committee.
Each of the Fund’s Trustees and officers holds comparable positions with certain other funds of which MFS or a subsidiary is the investment adviser or distributor, and, in the case of the officers, with certain affiliates of MFS. As of October 1, 2016, the Trustees served as board members of 137 funds within the MFS Family of Funds.
The Statement of Additional Information for a Fund includes further information about the Trustees and is available without charge upon request by calling 1-800-225-2606.
| | |
| Investment Adviser | | Custodian |
Massachusetts Financial Services Company
111 Huntington Avenue
Boston, MA 02199-7618 | | State Street Bank and Trust Company 1 Lincoln Street Boston, MA 02111-2900 |
| Distributor | | Independent Registered Public Accounting Firm |
MFS Fund Distributors, Inc.
111 Huntington Avenue
Boston, MA 02199-7618 | | Ernst & Young LLP 200 Clarendon Street Boston, MA 02116 |
| Portfolio Managers | | |
James Fallon Matthew Krummell Jonathan Sage John Stocks | | |
43
PROXY VOTING POLICIES AND INFORMATION
MFS votes proxies on behalf of the fund pursuant to proxy voting policies and procedures that are available without charge, upon request, by calling 1-800-225-2606, by visiting mfs.com (once you have selected “Individual Investor” as your role, click on “Individual Investor Home” in the top navigation and then select “Learn More About Proxy Voting” under the “I want to…” header on the left hand column of the page), or by visiting the SEC’s Web site at http://www.sec.gov.
Information regarding how the fund voted proxies relating to portfolio securities during the most recent twelve-month period ended June 30 is available by August 31 of each year without charge by visiting mfs.com (once you have selected “Individual Investor” as your role, click on “Individual Investor Home” in the top navigation and then select “Learn More About Proxy Voting” under the “I want to…” header on the left hand column of the page), or by visiting the SEC’s Web site at http://www.sec.gov.
QUARTERLY PORTFOLIO DISCLOSURE
The fund will file a complete schedule of portfolio holdings with the Securities and Exchange Commission (the Commission) for the first and third quarters of each fiscal year on Form N-Q. A shareholder can obtain the quarterly portfolio holdings report at mfs.com. The fund’s Form N-Q is also available on the EDGAR database on the Commission’s Internet Web site at http://www.sec.gov, and may be reviewed and copied at the:
Public Reference Room
Securities and Exchange Commission
100 F Street, NE, Room 1580
Washington, D.C. 20549
Information on the operation of the Public Reference Room may be obtained by calling the Commission at 1-800-SEC-0330. Copies of the fund’s Form N-Q also may be obtained, upon payment of a duplicating fee, by electronic request at the following e-mail address: publicinfo@sec.gov or by writing the Public Reference Section at the above address.
FURTHER INFORMATION
From time to time, MFS may post important information about the fund or the MFS funds on the MFS web site (mfs.com). This information is available on mfs.com by following these steps once you have selected “Individual Investor” as your role: (1) Click on the “Individual Investor Home” in the top navigation and then select the “Announcements” option within the “Market Outlooks” drop down, or (2) Click on “Products & Services” and “Mutual Funds” and then choose the fund’s name in the “Select a fund” menu.
44
INFORMATION ABOUT FUND CONTRACTS AND LEGAL CLAIMS
The fund has entered into contractual arrangements with an investment adviser, administrator, distributor, shareholder servicing agent, 529 program manager (if applicable), and custodian who each provide services to the fund. Unless expressly stated otherwise, shareholders are not parties to, or intended beneficiaries of these contractual arrangements, and these contractual arrangements are not intended to create any shareholder right to enforce them against the service providers or to seek any remedy under them against the service providers, either directly or on behalf of the fund.
Under the Trust’s By-Laws and Declaration of Trust, any claims asserted against or on behalf of the MFS Funds, including claims against Trustees and Officers, must be brought in state and federal courts located within the Commonwealth of Massachusetts.
FEDERAL TAX INFORMATION (unaudited)
The fund will notify shareholders of amounts for use in preparing 2016 income tax forms in January 2017. The following information is provided pursuant to provisions of the Internal Revenue Code.
The fund designates the maximum amount allowable as qualified dividend income eligible to be taxed at the same rate as long-term capital gain.
45
rev. 3/16
| | | | |
| | | |
FACTS | | WHAT DOES MFS DO WITH YOUR PERSONAL INFORMATION? | |  |
| | |
| Why? | | Financial companies choose how they share your personal information. Federal law gives consumers the right to limit some but not all sharing. Federal law also requires us to tell you how we collect, share, and protect your personal information. Please read this notice carefully to understand what we do. |
| | |
| What? | | The types of personal information we collect and share depend on the product or service you have with us. This information can include: • Social Security number and account balances • Account transactions and transaction history • Checking account information and wire transfer instructions When you are no longer our customer, we continue to share your information as described in this notice. |
| | |
| How? | | All financial companies need to share customers’ personal information to run their everyday business. In the section below, we list the reasons financial companies can share their customers’ personal information; the reasons MFS chooses to share; and whether you can limit this sharing. |
| | | | |
Reasons we can share your
personal information | | Does MFS
share? | | Can you limit
this sharing? |
For our everyday business purposes – such as to process your transactions, maintain your account(s), respond to court orders and legal investigations, or report to credit bureaus | | Yes | | No |
For our marketing purposes – to offer our products and services to you | | No | | We don’t share |
For joint marketing with other financial companies | | No | | We don’t share |
For our affiliates’ everyday business purposes – information about your transactions and experiences | | No | | We don’t share |
For our affiliates’ everyday business purposes – information about your creditworthiness | | No | | We don’t share |
| For nonaffiliates to market to you | | No | | We don’t share |
| | |
| Questions? | | Call 800-225-2606 or go to mfs.com. |
46
| | |
| Who we are |
| Who is providing this notice? | | MFS Funds, MFS Investment Management, MFS Institutional Advisors, Inc., and MFS Heritage Trust Company. |
| | |
| What we do |
| How does MFS protect my personal information? | | To protect your personal information from unauthorized access and use, we use security measures that comply with federal law. These measures include procedural, electronic, and physical safeguards for the protection of the personal information we collect about you. |
| How does MFS collect my personal information? | | We collect your personal information, for example, when you • open an account or provide account information • direct us to buy securities or direct us to sell your securities • make a wire transfer We also collect your personal information from others, such as credit bureaus, affiliates, or other companies. |
| Why can’t I limit all sharing? | | Federal law gives you the right to limit only • sharing for affiliates’ everyday business purposes – information about your creditworthiness • affiliates from using your information to market to you • sharing for nonaffiliates to market to you State laws and individual companies may give you additional rights to limit sharing. |
| | |
| Definitions |
| Affiliates | | Companies related by common ownership or control. They can be financial and nonfinancial companies. • MFS does not share personal information with affiliates, except for everyday business purposes as described on page one of this notice. |
| Nonaffiliates | | Companies not related by common ownership or control. They can be financial and nonfinancial companies. • MFS does not share with nonaffiliates so they can market to you. |
| Joint marketing | | A formal agreement between nonaffiliated financial companies that together market financial products or services to you. • MFS doesn’t jointly market. |
| | |
| Other important information |
| If you own an MFS product or receive an MFS service in the name of a third party such as a bank or broker-dealer, their privacy policy may apply to you instead of ours. |
47
Save paper with eDelivery.

| MFS® will send you prospectuses, |
reports, and proxies directly via e-mail so you will get information faster with less mailbox clutter.
To sign up:
1. Go to mfs.com.
2. Log in via MFS® Access.
3. Select eDelivery.
If you own your MFS fund shares through a financial institution or a retirement plan, MFS® TALK, MFS® Access, or eDelivery may not be available to you.
CONTACT
WEB SITE
mfs.com
MFS TALK
1-800-637-8255
24 hours a day
ACCOUNT SERVICE AND LITERATURE
Shareholders
1-800-225-2606
Financial advisors
1-800-343-2829
Retirement plan services
1-800-637-1255
MAILING ADDRESS
MFS Service Center, Inc.
P.O. Box 55824
Boston, MA 02205-5824
OVERNIGHT MAIL
MFS Service Center, Inc.
c/o Boston Financial Data Services
30 Dan Road
Canton, MA 02021-2809
ANNUAL REPORT
August 31, 2016

MFS® GLOBAL NEW DISCOVERY FUND

GND-ANN
MFS® GLOBAL NEW DISCOVERY FUND
CONTENTS
The report is prepared for the general information of shareholders.
It is authorized for distribution to prospective investors only when preceded or accompanied by a current prospectus.
NOT FDIC INSURED • MAY LOSE VALUE • NO BANK GUARANTEE

LETTER FROM THE CHAIRMAN
Dear Shareholders:
Despite the unexpected vote by the United Kingdom to leave the European Union, most markets proved resilient, with U.S. shares rallying to record highs during August.
Global interest rates remain very low, with most central banks maintaining extremely accommodative monetary policies to reinvigorate slow-growing economies against a backdrop of low inflation. This environment has favored risky assets such as equities, as investors are forced to accept greater risks in search of acceptable returns in a low-return environment. U.S. investment-grade and high-yield bonds have also benefited from low, and even negative, yields overseas.
China remains a source of concern for investors, as overcapacity in its manufacturing sector inhibits the government’s attempt to
change its domestic economy from one driven by exports to a consumer-driven model. Despite the slow-growth environment, emerging market equities have held up well, withstanding geopolitical shocks like an attempted coup in Turkey and impeachment proceedings against Brazil’s president. The U.S. Federal Reserve’s go-slow approach to rate hikes has also helped.
At MFS®, we believe it is best to view markets through a long lens and not react to short-term swings. That makes it possible to filter out market noise and focus on long-term fundamentals.
In our view, the professional guidance of a financial advisor, along with a patient, long-term approach, will help you reach your investment objectives.
Respectfully,

Robert J. Manning
Chairman
MFS Investment Management
October 17, 2016
The opinions expressed in this letter are subject to change and may not be relied upon for investment advice. No forecasts can be guaranteed.
1
PORTFOLIO COMPOSITION
Portfolio structure
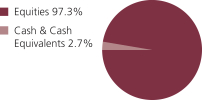
| | | | |
| Top ten holdings | | | | |
| Fuji Seal International, Inc. | | | 1.5% | |
| Bakkafrost P/f | | | 1.5% | |
| Bunzl PLC | | | 1.5% | |
| Koito Manufacturing Co. Ltd. | | | 1.4% | |
| Bright Horizons Family Solutions, Inc. | | | 1.3% | |
| Steris PLC | | | 1.1% | |
| Berry Plastics Group, Inc. | | | 1.1% | |
| Fukuda Denshi Co. Ltd. | | | 1.1% | |
| Axalta Coating Systems Ltd. | | | 1.1% | |
| LKQ Corp. | | | 1.1% | |
| |
| Equity sectors | | | | |
| Special Products & Services | | | 17.5% | |
| Health Care | | | 13.1% | |
| Technology | | | 9.2% | |
| Consumer Staples | | | 8.7% | |
| Basic Materials | | | 8.6% | |
| Leisure | | | 7.7% | |
| Financial Services | | | 7.7% | |
| Industrial Goods & Services | | | 7.4% | |
| Retailing | | | 7.2% | |
| Autos & Housing | | | 6.3% | |
| Utilities & Communications | | | 2.0% | |
| Transportation | | | 1.1% | |
| Energy | | | 0.8% | |
| | | | |
| Issuer country weightings (x) | |
| United States | | | 43.3% | |
| United Kingdom | | | 14.3% | |
| Japan | | | 14.0% | |
| Norway | | | 3.7% | |
| Germany | | | 3.2% | |
| Canada | | | 2.1% | |
| France | | | 2.1% | |
| Ireland | | | 1.9% | |
| Sweden | | | 1.7% | |
| Other Countries | | | 13.7% | |
|
| Currency exposure weightings (y) | |
| United States Dollar | | | 45.1% | |
| British Pound Sterling | | | 14.9% | |
| Japanese Yen | | | 14.0% | |
| Euro | | | 10.3% | |
| Norwegian Krone | | | 3.7% | |
| Swedish Krona | | | 1.7% | |
| Israeli Shekel | | | 1.6% | |
| Canadian Dollar | | | 1.5% | |
| Turkish Lira | | | 1.0% | |
| Other Currencies | | | 6.2% | |
2
Portfolio Composition – continued
| (x) | Represents the portfolio’s exposure to issuer countries as a percentage of a portfolio’s net assets. For purposes of this presentation, United States includes Cash & Cash Equivalents. |
| (y) | Represents the portfolio’s exposure to a particular currency as a percentage of a portfolio’s net assets. For purposes of this presentation, United States Dollar includes Cash & Cash Equivalents. |
Cash & Cash Equivalents includes any cash, investments in money market funds, short-term securities, and other assets less liabilities. Please see the Statement of Assets and Liabilities for additional information related to the fund’s cash position and other assets and liabilities.
Percentages are based on net assets as of 8/31/16.
The portfolio is actively managed and current holdings may be different.
3
MANAGEMENT REVIEW
Summary of Results
For the twelve months ended August 31, 2016, Class A shares of the MFS Global New Discovery Fund (“fund”) provided a total return of 5.75%, at net asset value. This compares with a return of 7.95% for the fund’s benchmark, the MSCI All Country World Small Mid Cap Index.
Market Environment
Sluggish global growth weighed on both developed and emerging market (“EM”) economies during the reporting period. The US Federal Reserve began its long-anticipated monetary tightening cycle in the middle of the period, but the tightening cycle has proved to be more gradual than initially anticipated. Globally, central bank policy remained highly accommodative, which forced many government, and even some corporate, bond yields into negative territory. Near the end of the period, the United Kingdom voted to leave the European Union (“EU”), beginning a multi-year process of negotiation in order to achieve “Brexit”. While markets initially reacted to the vote with alarm, the spillover to European and EM was relatively short-lived (although risks of further hits to EU cohesiveness could re-emerge).
During the second half of the reporting period, US earnings headwinds expanded beyond the energy, materials and industrial sectors, to include most sectors of the market. The sharp rise in the US dollar also weighed on earnings early in the period, though dollar strength ebbed somewhat late in the period. US consumer spending held up well during the second half of the period amid a modest increase in real wages and falling gasoline prices. Demand for autos reached near-record territory before receding modestly late in the period, while the housing market continued its recovery. Slow global trade continued to mirror slow global growth, particularly for many EM countries. That said, EM countries began to show signs of a modest upturn in activity along with adjustment in their external accounts. These improved conditions appeared to have reassured investors and contributed to record inflows into the asset class during July and August as negative yields for an increasing share of developed market bonds drove yield-hungry investors further out on the risk spectrum. Similar investor inflows were experienced in the high grade and high yield corporate markets.
Detractors from Performance
Stock selection in the transportation sector detracted from performance relative to the MSCI All Country World Small Mid Cap Index, led by holdings of shipping company Diana Shipping (b)(h) (Greece) and an overweight position in public transportation company Stagecoach Group (United Kingdom). Shares of both Diana Shipping and Stagecoach Group underperformed during the reporting period on the back of a weak demand environment.
A combination of weak stock selection and an overweight position in the health care sector also hampered relative returns. Here, overweight positions in emergency rooms operator Adeptus Health, owner and operator of senior living communities Brookdale Senior Living, biopharmaceutical company Amag Pharmaceuticals (h), cardiovascular medical device maker Cardiovascular Systems (h), and holdings of medical equipment manufacturer Techno Medica (b) (Japan), weighed heavily on relative results.
4
Management Review – continued
Elsewhere, overweight positions in retail store operator NEXT (United Kingdom), select-service hotel operator La Quinta (h) and module carpet manufacturer Interface (h) all held back relative returns.
During the reporting period, the fund’s relative currency exposure, resulting primarily from differences between the fund’s and the benchmark’s exposures to holdings of securities denominated in foreign currencies, detracted from relative performance. All of MFS’ investment decisions are driven by the fundamentals of each individual security and as such, the fund may have different currency exposure than the benchmark.
Contributors to Performance
Stock selection in the special products & services sector contributed to relative performance. Within this sector, an overweight position in electronic payment services company Global Payments aided relative returns, as shares of the company outperformed the benchmark during the period. Positive security selection within the consumer staples sector, led by an overweight position in food producer M. Dias Branco S.A. Industria e Comercio de Alimentos (Brazil), also boosted relative performance.
Favorable security selection in both the autos & housing and financial services sectors supported relative returns. Within the autos & housing sector, overweight positions in automotive lighting systems manufacturer Koito Manufacturing (Japan) and cookware manufacturer SEB (France), and holdings of commercial and residential landscape supplies distributor Siteone Landscape Supply (b), contributed to relative results. Holding an overweight position in shares of securities exchange services provider NASDAQ also aided relative performance as the company outpaced the market on strong results.
Elsewhere, overweight positions in specialty chemical company Albemarle (h), software solutions provider FleetMatics Group (h) and global medical technology company Masimo strengthened relative results.
The fund’s cash and/or cash equivalents position during the period was another contributor to relative performance. Under normal market conditions, the fund strives to be fully invested and generally holds cash to buy new holdings and to provide liquidity. In a period when equity markets fell, as measured by the fund’s benchmark, holding cash aided performance versus the benchmark, which has no cash position.
Respectfully,
| | | | |
| Peter Fruzzetti | | Paul Gordon | | Michael Grossman |
| Portfolio Manager | | Portfolio Manager | | Portfolio Manager |
| (b) | Security is not a benchmark constituent. |
| (h) | Security was not held in the portfolio at period end. |
The views expressed in this report are those of the portfolio managers only through the end of the period of the report as stated on the cover and do not necessarily reflect the views of MFS or any other person in the MFS organization. These views are subject to change at any time based on market or other conditions, and MFS disclaims any responsibility to update such views. These views may not be relied upon as investment advice or an indication of trading intent on behalf of any MFS portfolio. References to specific securities are not recommendations of such securities, and may not be representative of any MFS portfolio’s current or future investments.
5
PERFORMANCE SUMMARY THROUGH 8/31/16
The following chart illustrates a representative class of the fund’s historical performance in comparison to its benchmark(s). Performance results include the deduction of the maximum applicable sales charge and reflect the percentage change in net asset value, including reinvestment of dividends and capital gains distributions. The performance of other share classes will be greater than or less than that of the class depicted below. Benchmarks are unmanaged and may not be invested in directly. Benchmark returns do not reflect sales charges, commissions or expenses. (See Notes to Performance Summary.)
Performance data shown represents past performance and is no guarantee of future results. Investment return and principal value fluctuate so your shares, when sold, may be worth more or less than the original cost; current performance may be lower or higher than quoted. The performance shown does not reflect the deduction of taxes, if any, that a shareholder would pay on fund distributions or the redemption of fund shares.
Growth of a Hypothetical $10,000 Investment (t)
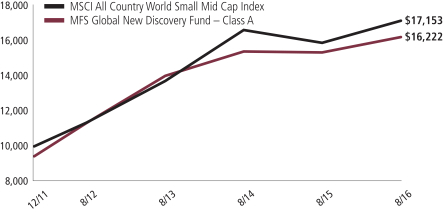
6
Performance Summary – continued
Total Returns through 8/31/16
Average annual without sales charge
| | | | | | | | | | |
| | | Share Class | | Class Inception Date | | 1-yr | | Life (t) | | |
| | | A | | 12/16/11 | | 5.75% | | 12.21% | | |
| | | B | | 12/16/11 | | 4.92% | | 11.37% | | |
| | | C | | 12/16/11 | | 4.92% | | 11.37% | | |
| | | I | | 12/16/11 | | 5.98% | | 12.49% | | |
| | | R1 | | 12/16/11 | | 4.92% | | 11.37% | | |
| | | R2 | | 12/16/11 | | 5.37% | | 11.92% | | |
| | | R3 | | 12/16/11 | | 5.72% | | 12.21% | | |
| | | R4 | | 12/16/11 | | 5.91% | | 12.48% | | |
| | | R6 (formerly Class R5) | | 1/02/13 | | 6.06% | | 8.67% | | |
| Comparative benchmark | | | | | | |
| | | MSCI All Country World Small Mid Cap Index (f) | | 7.95% | | 12.12% | | |
| Average annual with sales charge | | | | | | |
| | | A
With Initial Sales Charge (5.75%) | | (0.33)% | | 10.81% | | |
| | | B
With CDSC (Declining over six years from 4% to 0%) (v) | | 0.92% | | 11.08% | | |
| | | C
With CDSC (1% for 12 months) (v) | | 3.92% | | 11.37% | | |
CDSC – Contingent Deferred Sales Charge.
Class I, R1, R2, R3, R4, and R6 shares do not have a sales charge.
Effective August 26, 2016, Class R5 shares were renamed Class R6 shares.
| (f) | Source: FactSet Research Systems Inc. |
| (t) | For the period from the class inception date through the stated period end. The comparative benchmark performance information provided for the “life” period is from the inception date of the Class A shares. (See Notes to Performance Summary.) |
| (v) | Assuming redemption at the end of the applicable period. |
Benchmark Definition
MSCI All Country World Small Mid Cap Index – a free float weighted index that is designed to measure equity market performance of small and mid cap companies across global developed and emerging market countries.
It is not possible to invest directly in an index.
Notes to Performance Summary
Average annual total return represents the average annual change in value for each share class for the periods presented. Life returns are presented where the share class has less than 10 years of performance history and represent the average annual total
7
Performance Summary – continued
return from the class inception date to the stated period end date. As the fund’s share classes may have different inception dates, the life returns may represent different time periods and may not be comparable.
Performance results reflect any applicable expense subsidies and waivers in effect during the periods shown. Without such subsidies and waivers the fund’s performance results would be less favorable. Please see the prospectus and financial statements for complete details.
Performance results do not include adjustments made for financial reporting purposes in accordance with U.S. generally accepted accounting principles and may differ from amounts reported in the financial highlights.
From time to time the fund may receive proceeds from litigation settlements, without which performance would be lower.
8
EXPENSE TABLE
Fund expenses borne by the shareholders during the period, March 1, 2016 through August 31, 2016
As a shareholder of the fund, you incur two types of costs: (1) transaction costs, including sales charges (loads) on certain purchase or redemption payments, and (2) ongoing costs, including management fees; distribution and service (12b-1) fees; and other fund expenses. This example is intended to help you understand your ongoing costs (in dollars) of investing in the fund and to compare these costs with the ongoing costs of investing in other mutual funds.
The example is based on an investment of $1,000 invested at the beginning of the period and held for the entire period March 1, 2016 through August 31, 2016.
Actual Expenses
The first line for each share class in the following table provides information about actual account values and actual expenses. You may use the information in this line, together with the amount you invested, to estimate the expenses that you paid over the period. Simply divide your account value by $1,000 (for example, an $8,600 account value divided by $1,000 = 8.6), then multiply the result by the number in the first line under the heading entitled “Expenses Paid During Period” to estimate the expenses you paid on your account during this period.
Hypothetical Example for Comparison Purposes
The second line for each share class in the following table provides information about hypothetical account values and hypothetical expenses based on the fund’s actual expense ratio and an assumed rate of return of 5% per year before expenses, which is not the fund’s actual return. The hypothetical account values and expenses may not be used to estimate the actual ending account balance or expenses you paid for the period. You may use this information to compare the ongoing costs of investing in the fund and other funds. To do so, compare this 5% hypothetical example with the 5% hypothetical examples that appear in the shareholder reports of the other funds.
Please note that the expenses shown in the table are meant to highlight your ongoing costs only and do not reflect any transactional costs, such as sales charges (loads). Therefore, the second line for each share class in the table is useful in comparing ongoing costs only, and will not help you determine the relative total costs of owning different funds. In addition, if these transactional costs were included, your costs would have been higher.
9
Expense Table – continued
| | | | | | | | | | | | | | | | | | |
Share
Class | | | | Annualized
Expense
Ratio | | | Beginning
Account Value
3/01/16 | | | Ending
Account Value
8/31/16 | | | Expenses
Paid During
Period (p)
3/01/16-8/31/16 | |
| A | | Actual | | | 1.50% | | | | $1,000.00 | | | | $1,143.59 | | | | $8.08 | |
| | Hypothetical (h) | | | 1.50% | | | | $1,000.00 | | | | $1,017.60 | | | | $7.61 | |
| B | | Actual | | | 2.25% | | | | $1,000.00 | | | | $1,138.45 | | | | $12.09 | |
| | Hypothetical (h) | | | 2.25% | | | | $1,000.00 | | | | $1,013.83 | | | | $11.39 | |
| C | | Actual | | | 2.24% | | | | $1,000.00 | | | | $1,139.31 | | | | $12.05 | |
| | Hypothetical (h) | | | 2.24% | | | | $1,000.00 | | | | $1,013.88 | | | | $11.34 | |
| I | | Actual | | | 1.25% | | | | $1,000.00 | | | | $1,145.13 | | | | $6.74 | |
| | Hypothetical (h) | | | 1.25% | | | | $1,000.00 | | | | $1,018.85 | | | | $6.34 | |
| R1 | | Actual | | | 2.25% | | | | $1,000.00 | | | | $1,139.31 | | | | $12.10 | |
| | Hypothetical (h) | | | 2.25% | | | | $1,000.00 | | | | $1,013.83 | | | | $11.39 | |
| R2 | | Actual | | | 1.75% | | | | $1,000.00 | | | | $1,141.38 | | | | $9.42 | |
| | Hypothetical (h) | | | 1.75% | | | | $1,000.00 | | | | $1,016.34 | | | | $8.87 | |
| R3 | | Actual | | | 1.50% | | | | $1,000.00 | | | | $1,143.48 | | | | $8.08 | |
| | Hypothetical (h) | | | 1.50% | | | | $1,000.00 | | | | $1,017.60 | | | | $7.61 | |
| R4 | | Actual | | | 1.25% | | | | $1,000.00 | | | | $1,145.02 | | | | $6.74 | |
| | Hypothetical (h) | | | 1.25% | | | | $1,000.00 | | | | $1,018.85 | | | | $6.34 | |
R6
(formerly Class R5) | | Actual | | | 1.13% | | | | $1,000.00 | | | | $1,145.02 | | | | $6.09 | |
| | Hypothetical (h) | | | 1.13% | | | | $1,000.00 | | | | $1,019.46 | | | | $5.74 | |
| (h) | 5% class return per year before expenses. |
| (p) | “Expenses Paid During Period” are equal to each class’s annualized expense ratio, as shown above, multiplied by the average account value over the period, multiplied by 184/366 (to reflect the one-half year period). Expenses paid do not include any applicable sales charges (loads). If these transaction costs had been included, your costs would have been higher. |
Notes to Expense Table
Each class with a Rule 12b-1 service fee is subject to a rebate of a portion of such fee. Such rebates are included in the expense ratios above and are outside of the expense limitation arrangement. For Class C shares, this rebate reduced the expense ratio above by 0.01%. See Note 3 in the Notes to Financial Statements for additional information.
10
PORTFOLIO OF INVESTMENTS
8/31/16
The Portfolio of Investments is a complete list of all securities owned by your fund. It is categorized by broad-based asset classes.
| | | | | | | | |
| Common Stocks - 96.7% | | | | | | | | |
| Issuer | | Shares/Par | | | Value ($) | |
| Aerospace - 1.4% | | | | | | | | |
| Leidos Holdings, Inc. | | | 2,617 | | | $ | 106,016 | |
| MTU Aero Engines Holding AG | | | 1,248 | | | | 126,902 | |
| Saab AB | | | 3,786 | | | | 128,962 | |
| | | | | | | | |
| | | | $ | 361,880 | |
| Airlines - 0.2% | | | | | | | | |
| Stagecoach Group PLC | | | 19,245 | | | $ | 57,518 | |
| | |
| Alcoholic Beverages - 0.6% | | | | | | | | |
| Thai Beverage PLC | | | 228,500 | | | $ | 166,874 | |
| | |
| Apparel Manufacturers - 0.3% | | | | | | | | |
| Burberry Group PLC | | | 4,274 | | | $ | 73,186 | |
| | |
| Automotive - 3.9% | | | | | | | | |
| Koito Manufacturing Co. Ltd. | | | 7,500 | | | $ | 357,005 | |
| LKQ Corp. (a) | | | 7,503 | | | | 270,783 | |
| Stanley Electric Co. Ltd. | | | 9,800 | | | | 250,340 | |
| Thai Stanley Electric PLC | | | 10,400 | | | | 52,277 | |
| USS Co. Ltd. | | | 4,800 | | | | 76,733 | |
| | | | | | | | |
| | | | $ | 1,007,138 | |
| Biotechnology - 0.2% | | | | | | | | |
| Bavarian Nordic A/S (a) | | | 1,435 | | | $ | 52,157 | |
| | |
| Broadcasting - 2.4% | | | | | | | | |
| Live Nation, Inc. (a) | | | 9,223 | | | $ | 246,439 | |
| Nielsen Holdings PLC | | | 3,124 | | | | 166,447 | |
| Nippon BS Broadcasting Corp. | | | 14,900 | | | | 139,834 | |
| Proto Corp. | | | 6,400 | | | | 72,805 | |
| | | | | | | | |
| | | | $ | 625,525 | |
| Brokerage & Asset Managers - 1.9% | | | | | | | | |
| NASDAQ, Inc. | | | 3,702 | | | $ | 263,619 | |
| Rathbone Brothers PLC | | | 4,189 | | | | 101,269 | |
| Raymond James Financial, Inc. | | | 1,949 | | | | 113,373 | |
| | | | | | | | |
| | | | $ | 478,261 | |
| Business Services - 13.2% | | | | | | | | |
| Amadeus IT Holding S.A. | | | 4,589 | | | $ | 210,869 | |
| Amsterdam Commodities N.V. | | | 3,181 | | | | 82,852 | |
11
Portfolio of Investments – continued
| | | | | | | | |
| Issuer | | Shares/Par | | | Value ($) | |
| Common Stocks - continued | | | | | | | | |
| Business Services - continued | | | | | | | | |
| Asiakastieto Group Oyj | | | 7,555 | | | $ | 153,881 | |
| Babcock International Group PLC | | | 7,117 | | | | 97,756 | |
| Brenntag AG | | | 928 | | | | 50,504 | |
| Bright Horizons Family Solutions, Inc. (a) | | | 4,817 | | | | 328,327 | |
| Bunzl PLC | | | 12,002 | | | | 371,631 | |
| Cerved Information Solutions S.p.A. | | | 18,880 | | | | 151,630 | |
| Cielo S.A. | | | 8,000 | | | | 83,216 | |
| CoStar Group, Inc. (a) | | | 614 | | | | 127,252 | |
| Diploma PLC | | | 5,980 | | | | 65,255 | |
| Elior Participations SCA | | | 8,408 | | | | 192,826 | |
| Fiserv, Inc. (a) | | | 1,279 | | | | 131,801 | |
| FleetCor Technologies, Inc. (a) | | | 1,471 | | | | 241,538 | |
| Gartner, Inc. (a) | | | 2,130 | | | | 193,830 | |
| Global Payments, Inc. | | | 2,525 | | | | 191,774 | |
| MITIE Group PLC | | | 3,750 | | | | 13,315 | |
| Sodexo | | | 561 | | | | 64,986 | |
| Travelport Worldwide Ltd. | | | 12,993 | | | | 178,394 | |
| Univar, Inc. (a) | | | 6,426 | | | | 132,954 | |
| WNS (Holdings) Ltd., ADR (a) | | | 4,214 | | | | 123,597 | |
| Zoopla Property Group PLC | | | 44,662 | | | | 175,064 | |
| | | | | | | | |
| | | | $ | 3,363,252 | |
| Computer Software - 3.8% | | | | | | | | |
| Cadence Design Systems, Inc. (a) | | | 6,600 | | | $ | 167,904 | |
| Linedata Services | | | 1,941 | | | | 84,049 | |
| OBIC Business Consultants Co. Ltd. | | | 5,600 | | | | 255,468 | |
| OBIC Co. Ltd. | | | 4,600 | | | | 235,635 | |
| Sabre Corp. | | | 8,285 | | | | 233,223 | |
| | | | | | | | |
| | | | $ | 976,279 | |
| Computer Software - Systems - 2.8% | | | | | | | | |
| EMIS Group PLC | | | 9,855 | | | $ | 131,093 | |
| Linx S.A. | | | 10,700 | | | | 57,324 | |
| NICE Systems Ltd., ADR | | | 3,845 | | | | 263,113 | |
| Servelec Group PLC | | | 1,019 | | | | 3,757 | |
| SS&C Technologies Holdings, Inc. | | | 8,157 | | | | 268,773 | |
| | | | | | | | |
| | | | $ | 724,060 | |
| Conglomerates - 0.8% | | | | | | | | |
| DCC PLC | | | 2,195 | | | $ | 199,748 | |
| | |
| Construction - 1.7% | | | | | | | | |
| Bovis Homes Group PLC | | | 11,374 | | | $ | 133,824 | |
| Siteone Landscape Supply, Inc. (a) | | | 4,810 | | | | 183,934 | |
12
Portfolio of Investments – continued
| | | | | | | | |
| Issuer | | Shares/Par | | | Value ($) | |
| Common Stocks - continued | | | | | | | | |
| Construction - continued | | | | | | | | |
| Volution Group PLC | | | 47,845 | | | $ | 106,807 | |
| | | | | | | | |
| | | | $ | 424,565 | |
| Consumer Products - 1.3% | | | | | | | | |
| Hengan International Group Co. Ltd. | | | 15,000 | | | $ | 126,941 | |
| Kobayashi Pharmaceutical Co. Ltd. | | | 1,800 | | | | 83,593 | |
| Mitsubishi Pencil Co. Ltd. | | | 2,400 | | | | 117,141 | |
| | | | | | | | |
| | | | $ | 327,675 | |
| Consumer Services - 3.3% | | | | | | | | |
| 51job, Inc., ADR (a) | | | 1,815 | | | $ | 60,494 | |
| Asante, Inc. | | | 13,000 | | | | 192,239 | |
| Dignity PLC | | | 7,120 | | | | 251,411 | |
| Nord Anglia Education, Inc. (a) | | | 8,956 | | | | 189,688 | |
| ServiceMaster Global Holdings, Inc. (a) | | | 3,715 | | | | 138,607 | |
| | | | | | | | |
| | | | $ | 832,439 | |
| Containers - 3.6% | | | | | | | | |
| Berry Plastics Group, Inc. (a) | | | 6,106 | | | $ | 277,151 | |
| Fuji Seal International, Inc. | | | 10,300 | | | | 391,234 | |
| Mayr-Melnhof Karton AG | | | 1,187 | | | | 133,662 | |
| RPC Group PLC | | | 9,596 | | | | 109,503 | |
| | | | | | | | |
| | | | $ | 911,550 | |
| Electrical Equipment - 1.3% | | | | | | | | |
| AMETEK, Inc. | | | 4,192 | | | $ | 204,360 | |
| IMI PLC | | | 4,901 | | | | 68,026 | |
| Spectris PLC | | | 2,513 | | | | 63,887 | |
| | | | | | | | |
| | | | $ | 336,273 | |
| Electronics - 1.1% | | | | | | | | |
| Analog Devices, Inc. | | | 2,061 | | | $ | 128,936 | |
| Iriso Electronics Co. Ltd. | | | 2,550 | | | | 150,587 | |
| | | | | | | | |
| | | | $ | 279,523 | |
| Engineering - Construction - 1.2% | | | | | | | | |
| Promotora y Operadora de Infraestructura S.A.B. de C.V. | | | 5,078 | | | $ | 60,990 | |
| Stantec, Inc. | | | 4,214 | | | | 100,482 | |
| Team, Inc. (a) | | | 4,850 | | | | 154,085 | |
| | | | | | | | |
| | | | $ | 315,557 | |
| Food & Beverages - 6.4% | | | | | | | | |
| Bakkafrost P/f | | | 10,378 | | | $ | 373,011 | |
| Cranswick PLC | | | 5,087 | | | | 159,652 | |
| Fyffes PLC | | | 86,790 | | | | 150,055 | |
13
Portfolio of Investments – continued
| | | | | | | | |
| Issuer | | Shares/Par | | | Value ($) | |
| Common Stocks - continued | | | | | | | | |
| Food & Beverages - continued | | | | | | | | |
| Greencore Group PLC | | | 14,633 | | | $ | 67,446 | |
| Grupo Lala S.A.B. de C.V. | | | 48,110 | | | | 100,765 | |
| Leroy Seafood Group A.S.A. | | | 3,428 | | | | 153,859 | |
| M. Dias Branco S.A. Industria e Comercio de Alimentos | | | 2,900 | | | | 108,665 | |
| Qinqin Foodstuffs Group (Cayman) Co. Ltd. (a) | | | 3,000 | | | | 1,079 | |
| S Foods, Inc. | | | 5,800 | | | | 141,265 | |
| Scandi Standard AB | | | 28,262 | | | | 214,590 | |
| Total Produce PLC | | | 100,940 | | | | 179,587 | |
| | | | | | | | |
| | | | $ | 1,649,974 | |
| Food & Drug Stores - 0.7% | | | | | | | | |
| Booker Group PLC | | | 46,317 | | | $ | 107,106 | |
| Clicks Group Ltd. | | | 9,019 | | | | 74,289 | |
| | | | | | | | |
| | | | $ | 181,395 | |
| Furniture & Appliances - 0.7% | | | | | | | | |
| SEB S.A. | | | 1,353 | | | $ | 180,048 | |
| | |
| Gaming & Lodging - 0.6% | | | | | | | | |
| Paddy Power PLC | | | 1,320 | | | $ | 158,776 | |
| | |
| General Merchandise - 3.0% | | | | | | | | |
| B&M European Value Retail S.A. | | | 25,840 | | | $ | 93,448 | |
| Dollar Tree, Inc. (a) | | | 1,580 | | | | 130,666 | |
| Dollarama, Inc. | | | 2,772 | | | | 204,824 | |
| Five Below, Inc. (a) | | | 2,961 | | | | 131,942 | |
| Mr Price Group Ltd. | | | 4,866 | | | | 61,055 | |
| Seria Co. Ltd. | | | 2,100 | | | | 138,830 | |
| | | | | | | | |
| | | | $ | 760,765 | |
| Insurance - 0.9% | | | | | | | | |
| Jardine Lloyd Thompson Group PLC | | | 8,377 | | | $ | 108,077 | |
| Sony Financial Holdings, Inc. | | | 9,300 | | | | 127,727 | |
| | | | | | | | |
| | | | $ | 235,804 | |
| Internet - 1.5% | | | | | | | | |
| LogMeIn, Inc. | | | 1,812 | | | $ | 151,302 | |
| Rightmove PLC | | | 4,152 | | | | 223,486 | |
| | | | | | | | |
| | | | $ | 374,788 | |
| Leisure & Toys - 0.4% | | | | | | | | |
| Thule Group AB | | | 5,663 | | | $ | 91,454 | |
| | |
| Machinery & Tools - 2.8% | | | | | | | | |
| Allison Transmission Holdings, Inc. | | | 6,777 | | | $ | 187,994 | |
| Daikin Industries Ltd. | | | 1,700 | | | | 157,554 | |
14
Portfolio of Investments – continued
| | | | | | | | |
| Issuer | | Shares/Par | | | Value ($) | |
| Common Stocks - continued | | | | | | | | |
| Machinery & Tools - continued | | | | | | | | |
| Ritchie Bros. Auctioneers, Inc. | | | 4,450 | | | $ | 154,994 | |
| Spirax Sarco Engineering PLC | | | 2,062 | | | | 117,352 | |
| WABCO Holdings, Inc. (a) | | | 1,021 | | | | 109,002 | |
| | | | | | | | |
| | | | $ | 726,896 | |
| Medical & Health Technology & Services - 5.5% | | | | | | | | |
| Adeptus Health, Inc., “A” (a) | | | 2,090 | | | $ | 88,950 | |
| Brookdale Senior Living, Inc. (a) | | | 7,104 | | | | 122,260 | |
| Capital Senior Living Corp. (a) | | | 9,886 | | | | 169,940 | |
| Healthcare Services Group, Inc. | | | 5,486 | | | | 221,470 | |
| INC Research Holdings, Inc., “A” (a) | | | 1,893 | | | | 82,592 | |
| MEDNAX, Inc. (a) | | | 2,529 | | | | 166,332 | |
| Miraca Holdings, Inc. | | | 2,700 | | | | 128,000 | |
| Selcuk Ecza Deposu Ticaret ve Sanayi A.S. | | | 290,077 | | | | 261,883 | |
| VCA, Inc. (a) | | | 2,212 | | | | 156,632 | |
| | | | | | | | |
| | | | $ | 1,398,059 | |
| Medical Equipment - 7.1% | | | | | | | | |
| Fukuda Denshi Co. Ltd. | | | 4,700 | | | $ | 277,099 | |
| Gerresheimer AG | | | 2,190 | | | | 181,869 | |
| Masimo Corp. (a) | | | 3,808 | | | | 225,205 | |
| Nakanishi, Inc. | | | 2,200 | | | | 79,524 | |
| NxStage Medical, Inc. (a) | | | 7,253 | | | | 165,804 | |
| PerkinElmer, Inc. | | | 4,984 | | | | 265,398 | |
| Sonova Holding AG | | | 442 | | | | 61,162 | |
| Steris PLC | | | 3,931 | | | | 277,843 | |
| Techno Medica Co. Ltd. | | | 7,900 | | | | 118,578 | |
| VWR Corp. (a) | | | 6,298 | | | | 175,777 | |
| | | | | | | | |
| | | | $ | 1,828,259 | |
| Natural Gas - Pipeline - 0.5% | | | | | | | | |
| EQT Midstream Partners LP | | | 1,661 | | | $ | 130,571 | |
| | |
| Oil Services - 0.8% | | | | | | | | |
| Aker Solutions ASA (a) | | | 25,530 | | | $ | 112,871 | |
| Forum Energy Technologies, Inc. (a) | | | 5,663 | | | | 99,499 | |
| | | | | | | | |
| | | | $ | 212,370 | |
| Other Banks & Diversified Financials - 1.3% | | | | | | | | |
| First Republic Bank | | | 2,500 | | | $ | 192,400 | |
| Texas Capital Bancshares, Inc. (a) | | | 2,756 | | | | 144,745 | |
| | | | | | | | |
| | | | $ | 337,145 | |
| Pharmaceuticals - 0.3% | | | | | | | | |
| Genomma Lab Internacional S.A., “B” (a) | | | 66,175 | | | $ | 74,245 | |
15
Portfolio of Investments – continued
| | | | | | | | |
| Issuer | | Shares/Par | | | Value ($) | |
| Common Stocks - continued | | | | | | | | |
| Pollution Control - 0.6% | | | | | | | | |
| Clean Harbors, Inc. (a) | | | 3,115 | | | $ | 148,897 | |
| | |
| Railroad & Shipping - 0.1% | | | | | | | | |
| StealthGas, Inc. (a) | | | 9,676 | | | $ | 34,253 | |
| | |
| Real Estate - 3.6% | | | | | | | | |
| Big Yellow Group PLC, REIT | | | 9,963 | | | $ | 98,972 | |
| LEG Immobilien AG | | | 1,523 | | | | 148,665 | |
| Medical Properties Trust, Inc., REIT | | | 8,249 | | | | 125,962 | |
| OUTFRONT Media, Inc., REIT | | | 5,416 | | | | 120,885 | |
| STAG Industrial, Inc., REIT | | | 3,483 | | | | 86,483 | |
| Store Capital Corp., REIT | | | 5,673 | | | | 168,091 | |
| Tanger Factory Outlet Centers, Inc., REIT | | | 3,953 | | | | 160,650 | |
| | | | | | | | |
| | | | | | | $ | 909,708 | |
| Restaurants - 4.3% | | | | | | | | |
| Aramark | | | 5,496 | | | $ | 208,463 | |
| Arcos Dorados Holdings, Inc. (a) | | | 18,248 | | | | 87,955 | |
| Domino’s Pizza Group PLC | | | 25,214 | | | | 118,798 | |
| Dunkin Brands Group, Inc. | | | 4,595 | | | | 224,925 | |
| Heian Ceremony Service Co. | | | 11,533 | | | | 75,464 | |
| Performance Food Group Co. (a) | | | 4,954 | | | | 127,318 | |
| U.S. Foods Holding Corp. (a) | | | 6,803 | | | | 164,973 | |
| Whitbread PLC | | | 1,515 | | | | 82,999 | |
| | | | | | | | |
| | | | | | | $ | 1,090,895 | |
| Special Products & Services - 0.3% | | | | | | | | |
| Boyd Group Income Fund, IEU | | | 1,288 | | | $ | 84,701 | |
| | |
| Specialty Chemicals - 4.7% | | | | | | | | |
| Axalta Coating Systems Ltd. (a) | | | 9,609 | | | $ | 275,010 | |
| Borregaard ASA | | | 25,066 | | | | 203,801 | |
| Croda International PLC | | | 5,282 | | | | 229,583 | |
| Ferroglobe PLC | | | 9,037 | | | | 74,555 | |
| IMCD Group NV | | | 1,893 | | | | 78,106 | |
| RPM International, Inc. | | | 1,887 | | | | 102,898 | |
| Symrise AG | | | 3,359 | | | | 247,326 | |
| | | | | | | | |
| | | | | | | $ | 1,211,279 | |
| Specialty Stores - 3.3% | | | | | | | | |
| Citi Trends, Inc. | | | 7,529 | | | $ | 147,192 | |
| Dufry AG (a) | | | 1,326 | | | | 155,040 | |
| Howden Joinery Group PLC | | | 11,606 | | | | 69,557 | |
| Just Eat PLC (a) | | | 13,699 | | | | 97,320 | |
| NEXT PLC | | | 916 | | | | 66,457 | |
16
Portfolio of Investments – continued
| | | | | | | | |
| Issuer | | Shares/Par | | | Value ($) | |
| Common Stocks - continued | | | | | | | | |
| Specialty Stores - continued | | | | | | | | |
| Urban Outfitters, Inc. (a) | | | 5,559 | | | $ | 199,290 | |
| XXL ASA | | | 8,190 | | | | 98,778 | |
| | | | | | | | |
| | | | | | | $ | 833,634 | |
| Telecommunications - Wireless - 0.6% | | | | | | | | |
| Cellnex Telecom S.A.U. | | | 8,267 | | | $ | 144,315 | |
| | |
| Telephone Services - 0.9% | | | | | | | | |
| Bezeq - The Israel Telecommunication Corp. Ltd. | | | 66,669 | | | $ | 133,815 | |
| TDC A.S. (a) | | | 16,813 | | | | 92,937 | |
| | | | | | | | |
| | | | | | | $ | 226,752 | |
| Trucking - 0.8% | | | | | | | | |
| Swift Transportation Co. (a) | | | 10,440 | | | $ | 194,288 | |
| Total Common Stocks (Identified Cost, $20,414,959) | | | | | | $ | 24,732,731 | |
| | |
| Preferred Stocks - 0.3% | | | | | | | | |
| Specialty Chemicals - 0.3% | | | | | | | | |
| Fuchs Petrolub SE (Identified Cost, $38,915) | | | 1,529 | | | $ | 69,551 | |
| | | | | | | | | | | | |
| | | |
| | | First Exercise | | | | | | | |
| Warrants - 0.3% | | | | | | | | | | | | |
| Consumer Products - 0.3% | | | | | | | | | | | | |
| Merrill Lynch International & Co. (Dabur India Ltd. - Zero Strike Warrant (1 share for 1 warrant)) (a)(n) (Identified Cost, $63,859) | | | 5/27/11 | | | | 14,826 | | | $ | 64,493 | |
| | | |
| Money Market Funds - 2.6% | | | | | | | | | | | | |
MFS Institutional Money Market Portfolio, 0.38% (v)
(Identified Cost, $656,191) | | | | 656,191 | | | $ | 656,191 | |
| Total Investments (Identified Cost, $21,173,924) | | | | | | | $ | 25,522,966 | |
| | | |
| Other Assets, Less Liabilities - 0.1% | | | | | | | | | | | 37,836 | |
| Net Assets - 100.0% | | | | | | | | | | $ | 25,560,802 | |
| (a) | Non-income producing security. |
| (n) | Securities exempt from registration under Rule 144A of the Securities Act of 1933. These securities may be sold in the ordinary course of business in transactions exempt from registration, normally to qualified institutional buyers. At period end, the aggregate value of these securities was $64,493, representing 0.3% of net assets. |
| (v) | Underlying affiliated fund that is available only to investment companies managed by MFS. The rate quoted for the MFS Institutional Money Market Portfolio is the annualized seven-day yield of the fund at period end. |
17
Portfolio of Investments – continued
The following abbreviations are used in this report and are defined:
| ADR | | American Depositary Receipt |
| IEU | | International Equity Unit |
| PLC | | Public Limited Company |
| REIT | | Real Estate Investment Trust |
See Notes to Financial Statements
18
Financial Statements
STATEMENT OF ASSETS AND LIABILITIES
At 8/31/16
This statement represents your fund’s balance sheet, which details the assets and liabilities comprising the total value of the fund.
| | | | |
| Assets | | | | |
Investments | | | | |
Non-affiliated issuers, at value (identified cost, $20,517,733) | | | $24,866,775 | |
Underlying affiliated funds, at value (identified cost, $656,191) | | | 656,191 | |
Total investments, at value (identified cost, $21,173,924) | | | $25,522,966 | |
Cash | | | 727 | |
Receivables for | | | | |
Investments sold | | | 349,010 | |
Fund shares sold | | | 142,616 | |
Dividends | | | 31,689 | |
Receivable from investment adviser | | | 12,992 | |
Other assets | | | 69 | |
Total assets | | | $26,060,069 | |
| Liabilities | | | | |
Payables for | | | | |
Investments purchased | | | $364,969 | |
Fund shares reacquired | | | 44,323 | |
Payable to affiliates | | | | |
Shareholder servicing costs | | | 7,313 | |
Distribution and service fees | | | 465 | |
Payable for independent Trustees’ compensation | | | 2 | |
Accrued expenses and other liabilities | | | 82,195 | |
Total liabilities | | | $499,267 | |
Net assets | | | $25,560,802 | |
| Net assets consist of | | | | |
Paid-in capital | | | $21,507,688 | |
Unrealized appreciation (depreciation) on investments and translation of assets and liabilities in foreign currencies | | | 4,348,336 | |
Accumulated net realized gain (loss) on investments and foreign currency | | | (354,050 | ) |
Undistributed net investment income | | | 58,828 | |
Net assets | | | $25,560,802 | |
Shares of beneficial interest outstanding | | | 1,638,840 | |
19
Statement of Assets and Liabilities – continued
| | | | | | | | | | | | |
| | | Net assets | | | Shares
outstanding | | | Net asset value
per share (a) | |
Class A | | | $11,698,521 | | | | 745,776 | | | | $15.69 | |
Class B | | | 1,188,139 | | | | 78,511 | | | | 15.13 | |
Class C | | | 5,017,285 | | | | 331,554 | | | | 15.13 | |
Class I | | | 5,051,668 | | | | 318,480 | | | | 15.86 | |
Class R1 | | | 66,394 | | | | 4,389 | | | | 15.13 | |
Class R2 | | | 88,520 | | | | 5,710 | | | | 15.50 | |
Class R3 | | | 80,112 | | | | 5,102 | | | | 15.70 | |
Class R4 | | | 52,958 | | | | 3,337 | | | | 15.87 | |
Class R6 (formerly Class R5) | | | 2,317,205 | | | | 145,981 | | | | 15.87 | |
| (a) | Maximum offering price per share was equal to the net asset value per share for all share classes, except for Class A, for which the maximum offering price per share was $16.65 [100 / 94.25 x $15.69]. On sales of $50,000 or more, the maximum offering price of Class A shares is reduced. A contingent deferred sales charge may be imposed on redemptions of Class A, Class B, and Class C shares. Redemption price per share was equal to the net asset value per share for Classes I, R1, R2, R3, R4, and R6. |
See Notes to Financial Statements
20
Financial Statements
STATEMENT OF OPERATIONS
Year ended 8/31/16
This statement describes how much your fund earned in investment income and accrued in expenses. It also describes any gains and/or losses generated by fund operations.
| | | | |
| Net investment loss | | | | |
Income | | | | |
Dividends | | | $411,867 | |
Dividends from underlying affiliated funds | | | 1,656 | |
Foreign taxes withheld | | | (25,986 | ) |
Total investment income | | | $387,537 | |
Expenses | | | | |
Management fee | | | $237,633 | |
Distribution and service fees | | | 92,807 | |
Shareholder servicing costs | | | 35,797 | |
Administrative services fee | | | 17,500 | |
Independent Trustees’ compensation | | | 1,315 | |
Custodian fee | | | 20,644 | |
Shareholder communications | | | 14,894 | |
Audit and tax fees | | | 54,342 | |
Legal fees | | | 371 | |
Registration fees | | | 108,391 | |
Miscellaneous | | | 17,054 | |
Total expenses | | | $600,748 | |
Reduction of expenses by investment adviser and distributor | | | (206,336 | ) |
Net expenses | | | $394,412 | |
Net investment loss | | | $(6,875 | ) |
| Realized and unrealized gain (loss) on investments and foreign currency | |
Realized gain (loss) (identified cost basis) | | | | |
Investments | | | $430,735 | |
Foreign currency | | | 13,181 | |
Net realized gain (loss) on investments and foreign currency | | | $443,916 | |
Change in unrealized appreciation (depreciation) | | | | |
Investments | | | $885,250 | |
Translation of assets and liabilities in foreign currencies | | | 280 | |
Net unrealized gain (loss) on investments and foreign currency translation | | | $885,530 | |
Net realized and unrealized gain (loss) on investments and foreign currency | | | $1,329,446 | |
Change in net assets from operations | | | $1,322,571 | |
See Notes to Financial Statements
21
Financial Statements
STATEMENTS OF CHANGES IN NET ASSETS
These statements describe the increases and/or decreases in net assets resulting from operations, any distributions, and any shareholder transactions.
| | | | | | | | |
| | | Years ended 8/31 | |
| | | 2016 | | | 2015 | |
| Change in net assets | | | | | | |
| From operations | | | | | | | | |
Net investment loss | | | $(6,875 | ) | | | $(71,347 | ) |
Net realized gain (loss) on investments and foreign currency | | | 443,916 | | | | (519,671 | ) |
Net unrealized gain (loss) on investments and foreign currency translation | | | 885,530 | | | | 316,518 | |
Change in net assets from operations | | | $1,322,571 | | | | $(274,500 | ) |
| Distributions declared to shareholders | | | | | | | | |
From net investment income | | | $(27,008 | ) | | | $— | |
From net realized gain on investments | | | — | | | | (1,069,366 | ) |
Total distributions declared to shareholders | | | $(27,008 | ) | | | $(1,069,366 | ) |
Change in net assets from fund share transactions | | | $(928,282 | ) | | | $(724,038 | ) |
Total change in net assets | | | $367,281 | | | | $(2,067,904 | ) |
| Net assets | | | | | | | | |
At beginning of period | | | 25,193,521 | | | | 27,261,425 | |
At end of period (including undistributed net investment income of $58,828 and $26,576, respectively) | | | $25,560,802 | | | | $25,193,521 | |
See Notes to Financial Statements
22
Financial Statements
FINANCIAL HIGHLIGHTS
The financial highlights table is intended to help you understand the fund’s financial performance for the past 5 years (or life of a particular share class, if shorter). Certain information reflects financial results for a single fund share. The total returns in the table represent the rate by which an investor would have earned (or lost) on an investment in the fund share class (assuming reinvestment of all distributions) held for the entire period.
| | | | | | | | | | | | | | | | | | | | |
| | | Years ended 8/31 | | | Period
ended
8/31/12 (c) | |
| Class A | | 2016 | | | 2015 | | | 2014 | | | 2013 | | |
Net asset value, beginning of period | | | $14.85 | | | | $15.58 | | | | $14.64 | | | | $12.01 | | | | $10.00 | |
| Income (loss) from investment operations | | | | | | | | | | | | | |
Net investment income (loss) (d) | | | $0.01 | | | | $(0.02 | ) | | | $(0.05 | ) | | | $(0.03 | ) | | | $0.00 | (w) |
Net realized and unrealized gain (loss)
on investments and foreign currency | | | 0.84 | | | | (0.06 | ) | | | 1.48 | | | | 2.85 | | | | 2.01 | |
Total from investment operations | | | $0.85 | | | | $(0.08 | ) | | | $1.43 | | | | $2.82 | | | | $2.01 | |
| Less distributions declared to shareholders | | | | | | | | | | | | | |
From net investment income | | | $(0.01 | ) | | | $— | | | | $— | | | | $— | | | | $— | |
From net realized gain on investments | | | — | | | | (0.65 | ) | | | (0.49 | ) | | | (0.19 | ) | | | — | |
Total distributions declared to shareholders | | | $(0.01 | ) | | | $(0.65 | ) | | | $(0.49 | ) | | | $(0.19 | ) | | | $— | |
Net asset value, end of period (x) | | | $15.69 | | | | $14.85 | | | | $15.58 | | | | $14.64 | | | | $12.01 | |
Total return (%) (r)(s)(t)(x) | | | 5.75 | | | | (0.30 | ) | | | 9.84 | | | | 23.75 | | | | 20.10 | (n) |
Ratios (%) (to average net assets)
and Supplemental data: | | | | | | | | | | | | | |
Expenses before expense reductions (f) | | | 2.35 | | | | 2.34 | | | | 2.27 | | | | 3.08 | | | | 4.66 | (a) |
Expenses after expense reductions (f) | | | 1.50 | | | | 1.50 | | | | 1.50 | | | | 1.49 | | | | 1.50 | (a) |
Net investment income (loss) | | | 0.07 | | | | (0.17 | ) | | | (0.33 | ) | | | (0.19 | ) | | | 0.03 | (a) |
Portfolio turnover | | | 37 | | | | 35 | | | | 53 | | | | 39 | | | | 40 | (n) |
Net assets at end of period (000 omitted) | | | $11,699 | | | | $14,144 | | | | $16,309 | | | | $13,661 | | | | $1,274 | |
See Notes to Financial Statements
23
Financial Highlights – continued
| | | | | | | | | | | | | | | | | | | | |
| | | Years ended 8/31 | | | Period
ended
8/31/12 (c) | |
| Class B | | 2016 | | | 2015 | | | 2014 | | | 2013 | | |
Net asset value, beginning of period | | | $14.42 | | | | $15.26 | | | | $14.46 | | | | $11.95 | | | | $10.00 | |
| Income (loss) from investment operations | | | | | | | | | | | | | |
Net investment loss (d) | | | $(0.09 | ) | | | $(0.13 | ) | | | $(0.16 | ) | | | $(0.14 | ) | | | $(0.06 | ) |
Net realized and unrealized gain (loss)
on investments and foreign currency | | | 0.80 | | | | (0.06 | ) | | | 1.45 | | | | 2.84 | | | | 2.01 | |
Total from investment operations | | | $0.71 | | | | $(0.19 | ) | | | $1.29 | | | | $2.70 | | | | $1.95 | |
| Less distributions declared to shareholders | | | | | | | | | | | | | |
From net realized gain on investments | | | $— | | | | $(0.65 | ) | | | $(0.49 | ) | | | $(0.19 | ) | | | $— | |
Net asset value, end of period (x) | | | $15.13 | | | | $14.42 | | | | $15.26 | | | | $14.46 | | | | $11.95 | |
Total return (%) (r)(s)(t)(x) | | | 4.92 | | | | (1.05 | ) | | | 8.98 | | | | 22.85 | | | | 19.50 | (n) |
Ratios (%) (to average net assets)
and Supplemental data: | | | | | | | | | | | | | |
Expenses before expense reductions (f) | | | 3.09 | | | | 3.08 | | | | 3.02 | | | | 4.11 | | | | 5.34 | (a) |
Expenses after expense reductions (f) | | | 2.25 | | | | 2.25 | | | | 2.25 | | | | 2.25 | | | | 2.25 | (a) |
Net investment loss | | | (0.62 | ) | | | (0.90 | ) | | | (1.06 | ) | | | (1.00 | ) | | | (0.78 | )(a) |
Portfolio turnover | | | 37 | | | | 35 | | | | 53 | | | | 39 | | | | 40 | (n) |
Net assets at end of period (000 omitted) | | | $1,188 | | | | $769 | | | | $522 | | | | $447 | | | | $203 | |
| | |
| | | Years ended 8/31 | | | Period
ended
8/31/12 (c) | |
| Class C | | 2016 | | | 2015 | | | 2014 | | | 2013 | | |
Net asset value, beginning of period | | | $14.42 | | | | $15.26 | | | | $14.46 | | | | $11.95 | | | | $10.00 | |
| Income (loss) from investment operations | | | | | | | | | | | | | |
Net investment loss (d) | | | $(0.09 | ) | | | $(0.13 | ) | | | $(0.16 | ) | | | $(0.13 | ) | | | $(0.06 | ) |
Net realized and unrealized gain (loss)
on investments and foreign currency | | | 0.80 | | | | (0.06 | ) | | | 1.45 | | | | 2.83 | | | | 2.01 | |
Total from investment operations | | | $0.71 | | | | $(0.19 | ) | | | $1.29 | | | | $2.70 | | | | $1.95 | |
| Less distributions declared to shareholders | | | | | | | | | | | | | |
From net realized gain on investments | | | $— | | | | $(0.65 | ) | | | $(0.49 | ) | | | $(0.19 | ) | | | $— | |
Net asset value, end of period (x) | | | $15.13 | | | | $14.42 | | | | $15.26 | | | | $14.46 | | | | $11.95 | |
Total return (%) (r)(s)(t)(x) | | | 4.92 | | | | (1.05 | ) | | | 8.98 | | | | 22.85 | | | | 19.50 | (n) |
Ratios (%) (to average net assets)
and Supplemental data: | | | | | | | | | | | | | |
Expenses before expense reductions (f) | | | 3.09 | | | | 3.08 | | | | 3.02 | | | | 3.92 | | | | 5.43 | (a) |
Expenses after expense reductions (f) | | | 2.24 | | | | 2.24 | | | | 2.24 | | | | 2.23 | | | | 2.25 | (a) |
Net investment loss | | | (0.64 | ) | | | (0.91 | ) | | | (1.05 | ) | | | (0.95 | ) | | | (0.80 | )(a) |
Portfolio turnover | | | 37 | | | | 35 | | | | 53 | | | | 39 | | | | 40 | (n) |
Net assets at end of period (000 omitted) | | | $5,017 | | | | $4,737 | | | | $4,681 | | | | $2,298 | | | | $296 | |
See Notes to Financial Statements
24
Financial Highlights – continued
| | | | | | | | | | | | | | | | | | | | |
| | | Years ended 8/31 | | | Period
ended
8/31/12 (c) | |
| Class I | | 2016 | | | 2015 | | | 2014 | | | 2013 | | |
Net asset value, beginning of period | | | $15.00 | | | | $15.69 | | | | $14.71 | | | | $12.03 | | | | $10.00 | |
| Income (loss) from investment operations | | | | | | | | | | | | | |
Net investment income (loss) (d) | | | $0.07 | | | | $0.01 | | | | $(0.01 | ) | | | $(0.00 | )(w) | | | $0.01 | |
Net realized and unrealized gain (loss)
on investments and foreign currency | | | 0.82 | | | | (0.05 | ) | | | 1.48 | | | | 2.87 | | | | 2.02 | |
Total from investment operations | | | $0.89 | | | | $(0.04 | ) | | | $1.47 | | | | $2.87 | | | | $2.03 | |
| Less distributions declared to shareholders | | | | | | | | | | | | | |
From net investment income | | | $(0.03 | ) | | | $— | | | | $— | | | | $— | | | | $— | |
From net realized gain on investments | | | — | | | | (0.65 | ) | | | (0.49 | ) | | | (0.19 | ) | | | — | |
Total distributions declared to shareholders | | | $(0.03 | ) | | | $(0.65 | ) | | | $(0.49 | ) | | | $(0.19 | ) | | | $— | |
Net asset value, end of period (x) | | | $15.86 | | | | $15.00 | | | | $15.69 | | | | $14.71 | | | | $12.03 | |
Total return (%) (r)(s)(x) | | | 5.98 | | | | (0.03 | ) | | | 10.07 | | | | 24.13 | | | | 20.30 | (n) |
Ratios (%) (to average net assets)
and Supplemental data: | | | | | | | | | | | | | |
Expenses before expense reductions (f) | | | 2.06 | | | | 2.08 | | | | 2.02 | | | | 3.16 | | | | 4.37 | (a) |
Expenses after expense reductions (f) | | | 1.25 | | | | 1.25 | | | | 1.25 | | | | 1.25 | | | | 1.25 | (a) |
Net investment income (loss) | | | 0.44 | | | | 0.08 | | | | (0.09 | ) | | | (0.01 | ) | | | 0.17 | (a) |
Portfolio turnover | | | 37 | | | | 35 | | | | 53 | | | | 39 | | | | 40 | (n) |
Net assets at end of period (000 omitted) | | | $5,052 | | | | $4,596 | | | | $4,808 | | | | $4,873 | | | | $3,649 | |
| | |
| | | Years ended 8/31 | | | Period
ended
8/31/12 (c) | |
| Class R1 | | 2016 | | | 2015 | | | 2014 | | | 2013 | | |
Net asset value, beginning of period | | | $14.42 | | | | $15.26 | | | | $14.46 | | | | $11.95 | | | | $10.00 | |
| Income (loss) from investment operations | | | | | | | | | | | | | |
Net investment loss (d) | | | $(0.10 | ) | | | $(0.13 | ) | | | $(0.16 | ) | | | $(0.14 | ) | | | $(0.07 | ) |
Net realized and unrealized gain (loss)
on investments and foreign currency | | | 0.81 | | | | (0.06 | ) | | | 1.45 | | | | 2.84 | | | | 2.02 | |
Total from investment operations | | | $0.71 | | | | $(0.19 | ) | | | $1.29 | | | | $2.70 | | | | $1.95 | |
| Less distributions declared to shareholders | | | | | | | | | | | | | |
From net realized gain on investments | | | $— | | | | $(0.65 | ) | | | $(0.49 | ) | | | $(0.19 | ) | | | $— | |
Net asset value, end of period (x) | | | $15.13 | | | | $14.42 | | | | $15.26 | | | | $14.46 | | | | $11.95 | |
Total return (%) (r)(s)(x) | | | 4.92 | | | | (1.05 | ) | | | 8.98 | | | | 22.85 | | | | 19.50 | (n) |
Ratios (%) (to average net assets)
and Supplemental data: | | | | | | | | | | | | | |
Expenses before expense reductions (f) | | | 3.12 | | | | 3.08 | | | | 3.02 | | | | 4.19 | | | | 5.34 | (a) |
Expenses after expense reductions (f) | | | 2.25 | | | | 2.25 | | | | 2.25 | | | | 2.25 | | | | 2.25 | (a) |
Net investment loss | | | (0.70 | ) | | | (0.92 | ) | | | (1.07 | ) | | | (1.03 | ) | | | (0.81 | )(a) |
Portfolio turnover | | | 37 | | | | 35 | | | | 53 | | | | 39 | | | | 40 | (n) |
Net assets at end of period (000 omitted) | | | $66 | | | | $287 | | | | $290 | | | | $147 | | | | $120 | |
See Notes to Financial Statements
25
Financial Highlights – continued
| | | | | | | | | | | | | | | | | | | | |
| | | Years ended 8/31 | | | Period
ended
8/31/12 (c) | |
| Class R2 | | 2016 | | | 2015 | | | 2014 | | | 2013 | | |
Net asset value, beginning of period | | | $14.71 | | | | $15.47 | | | | $14.58 | | | | $11.99 | | | | $10.00 | |
| Income (loss) from investment operations | | | | | | | | | | | | | |
Net investment loss (d) | | | $(0.03 | ) | | | $(0.06 | ) | | | $(0.09 | ) | | | $(0.07 | ) | | | $(0.03 | ) |
Net realized and unrealized gain (loss)
on investments and foreign currency | | | 0.82 | | | | (0.05 | ) | | | 1.47 | | | | 2.85 | | | | 2.02 | |
Total from investment operations | | | $0.79 | | | | $(0.11 | ) | | | $1.38 | | | | $2.78 | | | | $1.99 | |
| Less distributions declared to shareholders | | | | | | | | | | | | | |
From net realized gain on investments | | | $— | | | | $(0.65 | ) | | | $(0.49 | ) | | | $(0.19 | ) | | | $— | |
Net asset value, end of period (x) | | | $15.50 | | | | $14.71 | | | | $15.47 | | | | $14.58 | | | | $11.99 | |
Total return (%) (r)(s)(x) | | | 5.37 | | | | (0.50 | ) | | | 9.53 | | | | 23.45 | | | | 19.90 | (n) |
Ratios (%) (to average net assets)
and Supplemental data: | | | | | | | | | | | | | |
Expenses before expense reductions (f) | | | 2.59 | | | | 2.58 | | | | 2.52 | | | | 3.68 | | | | 4.84 | (a) |
Expenses after expense reductions (f) | | | 1.75 | | | | 1.75 | | | | 1.75 | | | | 1.75 | | | | 1.75 | (a) |
Net investment loss | | | (0.17 | ) | | | (0.42 | ) | | | (0.57 | ) | | | (0.53 | ) | | | (0.31 | )(a) |
Portfolio turnover | | | 37 | | | | 35 | | | | 53 | | | | 39 | | | | 40 | (n) |
Net assets at end of period (000 omitted) | | | $89 | | | | $188 | | | | $184 | | | | $153 | | | | $120 | |
| | |
| | | Years ended 8/31 | | | Period
ended
8/31/12 (c) | |
| Class R3 | | 2016 | | | 2015 | | | 2014 | | | 2013 | | |
Net asset value, beginning of period | | | $14.85 | | | | $15.58 | | | | $14.64 | | | | $12.01 | | | | $10.00 | |
| Income (loss) from investment operations | | | | | | | | | | | | | |
Net investment income (loss) (d) | | | $0.01 | | | | $(0.02 | ) | | | $(0.05 | ) | | | $(0.04 | ) | | | $(0.00 | )(w) |
Net realized and unrealized gain (loss)
on investments and foreign currency | | | 0.84 | | | | (0.06 | ) | | | 1.48 | | | | 2.86 | | | | 2.01 | |
Total from investment operations | | | $0.85 | | | | $(0.08 | ) | | | $1.43 | | | | $2.82 | | | | $2.01 | |
| Less distributions declared to shareholders | | | | | | | | | | | | | |
From net realized gain on investments | | | $— | | | | $(0.65 | ) | | | $(0.49 | ) | | | $(0.19 | ) | | | $— | |
Net asset value, end of period (x) | | | $15.70 | | | | $14.85 | | | | $15.58 | | | | $14.64 | | | | $12.01 | |
Total return (%) (r)(s)(x) | | | 5.72 | | | | (0.30 | ) | | | 9.84 | | | | 23.75 | | | | 20.10 | (n) |
Ratios (%) (to average net assets)
and Supplemental data: | | | | | | | | | | | | | |
Expenses before expense reductions (f) | | | 2.34 | | | | 2.33 | | | | 2.27 | | | | 3.43 | | | | 4.59 | (a) |
Expenses after expense reductions (f) | | | 1.50 | | | | 1.50 | | | | 1.50 | | | | 1.50 | | | | 1.50 | (a) |
Net investment income (loss) | | | 0.07 | | | | (0.17 | ) | | | (0.34 | ) | | | (0.28 | ) | | | (0.06 | )(a) |
Portfolio turnover | | | 37 | | | | 35 | | | | 53 | | | | 39 | | | | 40 | (n) |
Net assets at end of period (000 omitted) | | | $80 | | | | $181 | | | | $175 | | | | $158 | | | | $120 | |
See Notes to Financial Statements
26
Financial Highlights – continued
| | | | | | | | | | | | | | | | | | | | |
| | | Years ended 8/31 | | | Period
ended
8/31/12 (c) | |
| Class R4 | | 2016 | | | 2015 | | | 2014 | | | 2013 | | |
Net asset value, beginning of period | | | $15.00 | | | | $15.69 | | | | $14.71 | | | | $12.04 | | | | $10.00 | |
| Income (loss) from investment operations | | | | | | | | | | | | | |
Net investment income (loss) (d) | | | $0.05 | | | | $0.01 | | | | $(0.01 | ) | | | $(0.00 | )(w) | | | $0.02 | |
Net realized and unrealized gain (loss)
on investments and foreign currency | | | 0.83 | | | | (0.05 | ) | | | 1.48 | | | | 2.86 | | | | 2.02 | |
Total from investment operations | | | $0.88 | | | | $(0.04 | ) | | | $1.47 | | | | $2.86 | | | | $2.04 | |
| Less distributions declared to shareholders | | | | | | | | | | | | | |
From net investment income | | | $(0.01 | ) | | | $— | | | | $— | | | | $— | | | | $— | |
From net realized gain on investments | | | — | | | | (0.65 | ) | | | (0.49 | ) | | | (0.19 | ) | | | — | |
Total distributions declared to shareholders | | | $(0.01 | ) | | | $(0.65 | ) | | | $(0.49 | ) | | | $(0.19 | ) | | | $— | |
Net asset value, end of period (x) | | | $15.87 | | | | $15.00 | | | | $15.69 | | | | $14.71 | | | | $12.04 | |
Total return (%) (r)(s)(x) | | | 5.91 | | | | (0.03 | ) | | | 10.07 | | | | 24.02 | | | | 20.40 | (n) |
Ratios (%) (to average net assets)
and Supplemental data: | | | | | | | | | | | | | |
Expenses before expense reductions (f) | | | 2.09 | | | | 2.09 | | | | 2.02 | | | | 3.19 | | | | 4.34 | (a) |
Expenses after expense reductions (f) | | | 1.25 | | | | 1.25 | | | | 1.25 | | | | 1.25 | | | | 1.25 | (a) |
Net investment income (loss) | | | 0.30 | | | | 0.08 | | | | (0.08 | ) | | | (0.03 | ) | | | 0.19 | (a) |
Portfolio turnover | | | 37 | | | | 35 | | | | 53 | | | | 39 | | | | 40 | (n) |
Net assets at end of period (000 omitted) | | | $53 | | | | $164 | | | | $164 | | | | $149 | | | | $120 | |
| | | | | | | | | | | | | | | | |
| | | Years ended 8/31 | | | Period
ended
8/31/13 (i) | |
| Class R6 (formerly Class R5) | | 2016 | | | 2015 | | | 2014 | | |
Net asset value, beginning of period | | | $15.03 | | | | $15.70 | | | | $14.71 | | | | $12.68 | |
| Income (loss) from investment operations | | | | | | | | | |
Net investment income (d) | | | $0.07 | | | | $0.03 | | | | $(0.00 | )(w) | | | $(0.00 | )(w) |
Net realized and unrealized gain (loss) on investments
and foreign currency | | | 0.84 | | | | (0.05 | ) | | | 1.48 | | | | 2.03 | (g) |
Total from investment operations | | | $0.91 | | | | $(0.02 | ) | | | $1.48 | | | | $2.03 | |
| Less distributions declared to shareholders | | | | | | | | | |
From net investment income | | | $(0.07 | ) | | | $— | | | | $— | | | | $— | |
From net realized gain on investments | | | — | | | | (0.65 | ) | | | (0.49 | ) | | | — | |
Total distributions declared to shareholders | | | $(0.07 | ) | | | $(0.65 | ) | | | $(0.49 | ) | | | $— | |
Net asset value, end of period (x) | | | $15.87 | | | | $15.03 | | | | $15.70 | | | | $14.71 | |
Total return (%) (r)(s)(x) | | | 6.06 | | | | 0.10 | | | | 10.14 | | | | 16.01 | (n) |
Ratios (%) (to average net assets)
and Supplemental data: | | | | | | | | | |
Expenses before expense reductions (f) | | | 1.98 | | | | 1.98 | | | | 1.92 | | | | 2.79 | (a) |
Expenses after expense reductions (f) | | | 1.13 | | | | 1.15 | | | | 1.14 | | | | 1.22 | (a) |
Net investment income (loss) | | | 0.44 | | | | 0.19 | | | | 0.03 | | | | (0.04 | )(a) |
Portfolio turnover | | | 37 | | | | 35 | | | | 53 | | | | 39 | |
Net assets at end of period (000 omitted) | | | $2,317 | | | | $128 | | | | $128 | | | | $116 | |
See Notes to Financial Statements
27
Financial Highlights – continued
| (c) | For the period from the commencement of the fund’s investment operations, December 16, 2011, through the stated period end. |
| (d) | Per share data is based on average shares outstanding. |
| (f) | Ratios do not reflect reductions from fees paid indirectly, if applicable. |
| (g) | The per share amount varies from the net realized and unrealized gain/loss for the period because of the timing of sales of fund shares and the per share amount of realized and unrealized gains and losses at such time. |
| (i) | For the period from the class inception, January 2, 2013, through the stated period end. |
| (r) | Certain expenses have been reduced without which performance would have been lower. |
| (s) | From time to time the fund may receive proceeds from litigation settlements, without which performance would be lower. |
| (t) | Total returns do not include any applicable sales charges. |
| (w) | Per share amount was less than $0.01. |
| (x) | The net asset values and total returns have been calculated on net assets which include adjustments made in accordance with U.S. generally accepted accounting principles required at period end for financial reporting purposes. |
See Notes to Financial Statements
28
NOTES TO FINANCIAL STATEMENTS
(1) Business and Organization
MFS Global New Discovery Fund (the fund) is a diversified series of MFS Series Trust IV (the trust). The trust is organized as a Massachusetts business trust and is registered under the Investment Company Act of 1940, as amended, as an open-end management investment company.
The fund is an investment company and accordingly follows the investment company accounting and reporting guidance of the Financial Accounting Standards Board (FASB) Accounting Standards Codification Topic 946 Financial Services – Investment Companies.
(2) Significant Accounting Policies
General – The preparation of financial statements in conformity with U.S. generally accepted accounting principles requires management to make estimates and assumptions that affect the reported amounts of assets and liabilities, and disclosure of contingent assets and liabilities at the date of the financial statements and the reported amounts of increases and decreases in net assets from operations during the reporting period. Actual results could differ from those estimates. In the preparation of these financial statements, management has evaluated subsequent events occurring after the date of the fund’s Statement of Assets and Liabilities through the date that the financial statements were issued. The fund invests in foreign securities. Investments in foreign securities are vulnerable to the effects of changes in the relative values of the local currency and the U.S. dollar and to the effects of changes in each country’s legal, political, and economic environment.
Balance Sheet Offsetting – The fund’s accounting policy with respect to balance sheet offsetting is that, absent an event of default by the counterparty or a termination of the agreement, the International Swaps and Derivatives Association (ISDA) Master Agreement does not result in an offset of reported amounts of financial assets and financial liabilities in the Statement of Assets and Liabilities across transactions between the fund and the applicable counterparty. The fund’s right to setoff may be restricted or prohibited by the bankruptcy or insolvency laws of the particular jurisdiction to which a specific master netting agreement counterparty is subject. Balance sheet offsetting disclosures, to the extent applicable to the fund, have been included in the fund’s Significant Accounting Policies note under the captions for each of the fund’s in-scope financial instruments and transactions.
Investment Valuations – Equity securities, including restricted equity securities, are generally valued at the last sale or official closing price on their primary market or exchange as provided by a third-party pricing service. Equity securities, for which there were no sales reported that day, are generally valued at the last quoted daily bid quotation on their primary market or exchange as provided by a third-party pricing service. Short-term instruments with a maturity at issuance of 60 days or less may be valued at amortized cost, which approximates market value. Open-end investment companies are generally valued at net asset value per share. Securities and other assets generally valued on the basis of information from a third-party pricing service may also be valued at a broker/dealer bid quotation. Values obtained from third-party pricing
29
Notes to Financial Statements – continued
services can utilize both transaction data and market information such as yield, quality, coupon rate, maturity, type of issue, trading characteristics, and other market data. The values of foreign securities and other assets and liabilities expressed in foreign currencies are converted to U.S. dollars using the mean of bid and asked prices for rates provided by a third-party pricing service.
The Board of Trustees has delegated primary responsibility for determining or causing to be determined the value of the fund’s investments (including any fair valuation) to the adviser pursuant to valuation policies and procedures approved by the Board. If the adviser determines that reliable market quotations are not readily available, investments are valued at fair value as determined in good faith by the adviser in accordance with such procedures under the oversight of the Board of Trustees. Under the fund’s valuation policies and procedures, market quotations are not considered to be readily available for most types of debt instruments and floating rate loans and many types of derivatives. These investments are generally valued at fair value based on information from third-party pricing services. In addition, investments may be valued at fair value if the adviser determines that an investment’s value has been materially affected by events occurring after the close of the exchange or market on which the investment is principally traded (such as foreign exchange or market) and prior to the determination of the fund’s net asset value, or after the halting of trading of a specific security where trading does not resume prior to the close of the exchange or market on which the security is principally traded. Events that occur on a frequent basis after foreign markets close (such as developments in foreign markets and significant movements in the U.S. markets) and prior to the determination of the fund’s net asset value may be deemed to have a material effect on the value of securities traded in foreign markets. Accordingly, the fund’s foreign equity securities may often be valued at fair value. The adviser generally relies on third-party pricing services or other information (such as the correlation with price movements of similar securities in the same or other markets; the type, cost and investment characteristics of the security; the business and financial condition of the issuer; and trading and other market data) to assist in determining whether to fair value and at what value to fair value an investment. The value of an investment for purposes of calculating the fund’s net asset value can differ depending on the source and method used to determine value. When fair valuation is used, the value of an investment used to determine the fund’s net asset value may differ from quoted or published prices for the same investment. There can be no assurance that the fund could obtain the fair value assigned to an investment if it were to sell the investment at the same time at which the fund determines its net asset value per share.
Various inputs are used in determining the value of the fund’s assets or liabilities. These inputs are categorized into three broad levels. In certain cases, the inputs used to measure fair value may fall into different levels of the fair value hierarchy. In such cases, an investment’s level within the fair value hierarchy is based on the lowest level of input that is significant to the fair value measurement. The fund’s assessment of the significance of a particular input to the fair value measurement in its entirety requires judgment, and considers factors specific to the investment. Level 1 includes unadjusted quoted prices in active markets for identical assets or liabilities. Level 2 includes other significant observable market-based inputs (including quoted prices for similar securities, interest rates, prepayment speed, and credit risk). Level 3 includes
30
Notes to Financial Statements – continued
unobservable inputs, which may include the adviser’s own assumptions in determining the fair value of investments. The following is a summary of the levels used as of August 31, 2016 in valuing the fund’s assets or liabilities:
| | | | | | | | | | | | | | | | |
| Investments at Value | | Level 1 | | | Level 2 | | | Level 3 | | | Total | |
| Equity Securities: | | | | | | | | | | | | | | | | |
United States | | | $10,375,723 | | | | $— | | | | $— | | | | $10,375,723 | |
United Kingdom | | | 3,663,303 | | | | — | | | | — | | | | 3,663,303 | |
Japan | | | 3,566,655 | | | | — | | | | — | | | | 3,566,655 | |
Norway | | | 942,321 | | | | — | | | | — | | | | 942,321 | |
Germany | | | 824,818 | | | | — | | | | — | | | | 824,818 | |
Canada | | | 545,001 | | | | — | | | | — | | | | 545,001 | |
France | | | 521,909 | | | | — | | | | — | | | | 521,909 | |
Ireland | | | 488,418 | | | | — | | | | — | | | | 488,418 | |
Sweden | | | 435,006 | | | | — | | | | — | | | | 435,006 | |
Other Countries | | | 3,386,851 | | | | 116,770 | | | | — | | | | 3,503,621 | |
| Mutual Funds | | | 656,191 | | | | — | | | | — | | | | 656,191 | |
| Total Investments | | | $25,406,196 | | | | $116,770 | | | | $— | | | | $25,522,966 | |
For further information regarding security characteristics, see the Portfolio of Investments.
Of the level 2 investments presented above, equity investments amounting to $52,277 would have been considered level 1 investments at the beginning of the period. Of the level 1 investments presented above, equity investments amounting to $2,502,671 would have been considered level 2 investments at the beginning of the period. The primary reason for changes in the classifications between levels 1 and 2 occurs when foreign equity securities are fair valued using other observable market-based inputs in place of the closing exchange price due to events occurring after the close of the exchange or market on which the investment is principally traded. The fund’s foreign equity securities may often be valued at fair value. The fund’s policy is to recognize transfers between the levels as of the end of the period.
Foreign Currency Translation – Purchases and sales of foreign investments, income, and expenses are converted into U.S. dollars based upon currency exchange rates prevailing on the respective dates of such transactions or on the reporting date for foreign denominated receivables and payables. Gains and losses attributable to foreign currency exchange rates on sales of securities are recorded for financial statement purposes as net realized gains and losses on investments. Gains and losses attributable to foreign exchange rate movements on receivables, payables, income and expenses are recorded for financial statement purposes as foreign currency transaction gains and losses. That portion of both realized and unrealized gains and losses on investments that results from fluctuations in foreign currency exchange rates is not separately disclosed.
Zero Strike Warrants – The fund invested in low exercise price call warrants (zero strike warrants). Zero strike warrants are issued by banks or broker-dealers and allow the fund to gain exposure to common stocks in markets that place restrictions on direct investments by foreign investors and may or may not be traded on an exchange. Income received from zero strike warrants is recorded as dividend income in the
31
Notes to Financial Statements – continued
Statement of Operations. To the extent the fund invests in zero strike warrants whose returns correspond to the performance of a foreign stock, investing in zero strike warrants will involve risks similar to the risks of investing in foreign securities. Additional risks associated with zero strike warrants include the potential inability of the counterparty to fulfill their obligations under the warrant, inability to transfer or liquidate the warrants and potential delays or an inability to redeem before expiration under certain market conditions.
Indemnifications – Under the fund’s organizational documents, its officers and Trustees may be indemnified against certain liabilities and expenses arising out of the performance of their duties to the fund. Additionally, in the normal course of business, the fund enters into agreements with service providers that may contain indemnification clauses. The fund’s maximum exposure under these agreements is unknown as this would involve future claims that may be made against the fund that have not yet occurred.
Investment Transactions and Income – Investment transactions are recorded on the trade date. Dividends received in cash are recorded on the ex-dividend date. Certain dividends from foreign securities will be recorded when the fund is informed of the dividend if such information is obtained subsequent to the ex-dividend date. Dividend payments received in additional securities are recorded on the ex-dividend date in an amount equal to the value of the security on such date.
The fund may receive proceeds from litigation settlements. Any proceeds received from litigation involving portfolio holdings are reflected in the Statement of Operations in realized gain/loss if the security has been disposed of by the fund or in unrealized gain/loss if the security is still held by the fund. Any other proceeds from litigation not related to portfolio holdings are reflected as other income in the Statement of Operations.
Fees Paid Indirectly – Prior to October 1, 2015, the fund’s custody fee could be reduced by a credit earned under an arrangement that measured the value of U.S. dollars deposited with the custodian by the fund. For the year ended August 31, 2016, custody fees were not reduced.
Tax Matters and Distributions – The fund intends to qualify as a regulated investment company, as defined under Subchapter M of the Internal Revenue Code, and to distribute all of its taxable income, including realized capital gains. As a result, no provision for federal income tax is required. The fund’s federal tax returns, when filed, will remain subject to examination by the Internal Revenue Service for a three year period. Management has analyzed the fund’s tax positions taken on federal and state tax returns for all open tax years and does not believe that there are any uncertain tax positions that require recognition of a tax liability. Foreign taxes, if any, have been accrued by the fund in the accompanying financial statements in accordance with the applicable foreign tax law. Foreign income taxes may be withheld by certain countries in which the fund invests. Additionally, capital gains realized by the fund on securities issued in or by certain foreign countries may be subject to capital gains tax imposed by those countries.
Distributions to shareholders are recorded on the ex-dividend date. Income and capital gain distributions are determined in accordance with income tax regulations, which
32
Notes to Financial Statements – continued
may differ from U.S. generally accepted accounting principles. Certain capital accounts in the financial statements are periodically adjusted for permanent differences in order to reflect their tax character. These adjustments have no impact on net assets or net asset value per share. Temporary differences which arise from recognizing certain items of income, expense, gain or loss in different periods for financial statement and tax purposes will reverse at some time in the future. Distributions in excess of net investment income or net realized gains are temporary overdistributions for financial statement purposes resulting from differences in the recognition or classification of income or distributions for financial statement and tax purposes.
Book/tax differences primarily relate to passive foreign investment companies.
The tax character of distributions declared to shareholders for the last two fiscal years is as follows:
| | | | | | | | |
| | | 8/31/16 | | | 8/31/15 | |
| Ordinary income (including any short-term capital gains) | | | $27,008 | | | | $388,174 | |
| Long-term capital gains | | | — | | | | 681,192 | |
| Total distributions | | | $27,008 | | | | $1,069,366 | |
The federal tax cost and the tax basis components of distributable earnings were as follows:
| | | | |
| As of 8/31/16 | | | |
| Cost of investments | | | $21,418,214 | |
| Gross appreciation | | | 5,158,972 | |
| Gross depreciation | | | (1,054,220 | ) |
| Net unrealized appreciation (depreciation) | | | $4,104,752 | |
| Undistributed ordinary income | | | 59,855 | |
| Post-October capital loss deferral | | | (109,760 | ) |
| Other temporary differences | | | (1,733 | ) |
Multiple Classes of Shares of Beneficial Interest – The fund offers multiple classes of shares, which differ in their respective distribution and service fees. The fund’s income, realized and unrealized gain (loss), and common expenses are allocated to shareholders based on the daily net assets of each class. Dividends are declared separately for each class. Differences in per share dividend rates are generally due to differences in separate class expenses. Class B shares will convert to Class A shares
33
Notes to Financial Statements – continued
approximately eight years after purchase. The fund’s distributions declared to shareholders as reported in the Statements of Changes in Net Assets are presented by class as follows:
| | | | | | | | | | | | | | | | |
| | | From net investment
income | | | From net realized gain on
investments | |
| | | Year
ended
8/31/16 | | | Year
ended
8/31/15 | | | Year
ended
8/31/16 | | | Year
ended
8/31/15 | |
| Class A | | | $12,312 | | | | $— | | | | $— | | | | $617,543 | |
| Class B | | | — | | | | — | | | | — | | | | 23,425 | |
| Class C | | | — | | | | — | | | | — | | | | 198,476 | |
| Class I | | | 4,732 | | | | — | | | | — | | | | 190,824 | |
| Class R1 | | | — | | | | — | | | | — | | | | 11,857 | |
| Class R2 | | | — | | | | — | | | | — | | | | 7,873 | |
| Class R3 | | | — | | | | — | | | | — | | | | 7,327 | |
| Class R4 | | | 50 | | | | — | | | | — | | | | 6,776 | |
| Class R6 (formerly Class R5) | | | 9,914 | | | | — | | | | — | | | | 5,265 | |
| Total | | | $27,008 | | | | $— | | | | $— | | | | $1,069,366 | |
Effective August 26, 2016, Class R5 shares were renamed Class R6 shares.
(3) Transactions with Affiliates
Investment Adviser – The fund has an investment advisory agreement with MFS to provide overall investment management and related administrative services and facilities to the fund. The management fee is computed daily and paid monthly at the following annual rates:
| | | | |
| First $1 billion of average daily net assets | | | 0.975 | % |
| Next $1.5 billion of average daily net assets | | | 0.90 | % |
| Average daily net assets in excess of $2.5 billion | | | 0.85 | % |
MFS has agreed in writing to reduce its management fee by a specified amount if certain MFS mutual fund assets exceed thresholds agreed to by MFS and the fund’s Board of Trustees. For the year ended August 31, 2016, this management fee reduction amounted to $1,749, which is included in the reduction of total expenses in the Statement of Operations. The management fee incurred for the year ended August 31, 2016 was equivalent to an annual effective rate of 0.97% of the fund’s average daily net assets.
The investment adviser has agreed in writing to pay a portion of the fund’s total annual operating expenses, excluding interest, taxes, extraordinary expenses, brokerage and transaction costs, and investment-related expenses, such that total fund operating expenses do not exceed the following rates annually of each class’s average daily net assets:
| | | | | | | | | | | | | | | | | | | | | | | | | | | | | | | | |
| Classes | |
| A | | B | | | C | | | I | | | R1 | | | R2 | | | R3 | | | R4 | | | R6
(formerly
Class R5) | |
| 1.50% | | | 2.25% | | | | 2.25% | | | | 1.25% | | | | 2.25% | | | | 1.75% | | | | 1.50% | | | | 1.25% | | | | 1.22% | |
This written agreement will continue until modified by the fund’s Board of Trustees, but such agreement will continue at least until December 31, 2017. For the year ended
34
Notes to Financial Statements – continued
August 31, 2016, this reduction amounted to $204,053, which is included in the reduction of total expenses in the Statement of Operations.
Distributor – MFS Fund Distributors, Inc. (MFD), a wholly-owned subsidiary of MFS, as distributor, received $5,993 for the year ended August 31, 2016, as its portion of the initial sales charge on sales of Class A shares of the fund.
The Board of Trustees has adopted a distribution plan for certain share classes pursuant to Rule 12b-1 of the Investment Company Act of 1940.
The fund’s distribution plan provides that the fund will pay MFD for services provided by MFD and financial intermediaries in connection with the distribution and servicing of certain share classes. One component of the plan is a distribution fee paid to MFD and another component of the plan is a service fee paid to MFD. MFD may subsequently pay all, or a portion, of the distribution and/or service fees to financial intermediaries.
Distribution Plan Fee Table:
| | | | | | | | | | | | | | | | | | | | |
| | | Distribution
Fee Rate (d) | | | Service
Fee Rate (d) | | | Total
Distribution
Plan (d) | | | Annual
Effective
Rate (e) | | | Distribution
and Service
Fee | |
| Class A | | | — | | | | 0.25% | | | | 0.25% | | | | 0.25% | | | | $33,256 | |
| Class B | | | 0.75% | | | | 0.25% | | | | 1.00% | | | | 1.00% | | | | 9,664 | |
| Class C | | | 0.75% | | | | 0.25% | | | | 1.00% | | | | 0.99% | | | | 47,630 | |
| Class R1 | | | 0.75% | | | | 0.25% | | | | 1.00% | | | | 1.00% | | | | 1,671 | |
| Class R2 | | | 0.25% | | | | 0.25% | | | | 0.50% | | | | 0.50% | | | | 406 | |
| Class R3 | | | — | | | | 0.25% | | | | 0.25% | | | | 0.25% | | | | 180 | |
| Total Distribution and Service Fees | | | | | | | | | | | | $92,807 | |
| (d) | In accordance with the distribution plan for certain classes, the fund pays distribution and/or service fees equal to these annual percentage rates of each class’s average daily net assets. The distribution and service fee rates disclosed by class represent the current rates in effect at the end of the reporting period. Any rate changes, if applicable, are detailed below. |
| (e) | The annual effective rates represent actual fees incurred under the distribution plan for the year ended August 31, 2016 based on each class’s average daily net assets. MFD has voluntarily agreed to rebate a portion of each class’s 0.25% service fee attributable to accounts for which MFD retains the 0.25% service fee except for accounts attributable to MFS or its affiliates’ seed money. For the year ended August 31, 2016, this rebate amounted to $251 and $283 for Class A and Class C, respectively, and is included in the reduction of total expenses in the Statement of Operations. |
Certain Class A shares are subject to a contingent deferred sales charge (CDSC) in the event of a shareholder redemption within 18 months of purchase. Class C shares are subject to a CDSC in the event of a shareholder redemption within 12 months of purchase. Class B shares are subject to a CDSC in the event of a shareholder redemption within six years of purchase. All contingent deferred sales charges are paid to MFD and during the year ended August 31, 2016, were as follows:
| | | | |
| | | Amount | |
| Class A | | | $327 | |
| Class B | | | 724 | |
| Class C | | | 724 | |
Shareholder Servicing Agent – MFS Service Center, Inc. (MFSC), a wholly-owned subsidiary of MFS, receives a fee from the fund for its services as shareholder servicing
35
Notes to Financial Statements – continued
agent calculated as a percentage of the average daily net assets of the fund as determined periodically under the supervision of the fund’s Board of Trustees. For the year ended August 31, 2016, the fee was $4,539, which equated to 0.0186% annually of the fund’s average daily net assets. MFSC also receives payment from the fund for out-of-pocket expenses, sub-accounting and other shareholder servicing costs which may be paid to affiliated and unaffiliated service providers. Class R6 shares do not incur sub-accounting fees. For the year ended August 31, 2016, these out-of-pocket expenses, sub-accounting and other shareholder servicing costs amounted to $31,258.
Administrator – MFS provides certain financial, legal, shareholder communications, compliance, and other administrative services to the fund. Under an administrative services agreement, the fund reimburses MFS the costs incurred to provide these services. The fund is charged an annual fixed amount of $17,500 plus a fee based on average daily net assets. The administrative services fee incurred for the year ended August 31, 2016 was equivalent to an annual effective rate of 0.0718% of the fund’s average daily net assets.
Trustees’ and Officers’ Compensation – The fund pays compensation to independent Trustees in the form of a retainer, attendance fees, and additional compensation to Board and Committee chairpersons. The fund does not pay compensation directly to Trustees or officers of the fund who are also officers of the investment adviser, all of whom receive remuneration for their services to the fund from MFS. Certain officers and Trustees of the fund are officers or directors of MFS, MFD, and MFSC.
Other – This fund and certain other funds managed by MFS (the funds) have entered into a service agreement (the ISO Agreement) which provides for payment of fees solely by the funds to Tarantino LLC in return for the provision of services of an Independent Senior Officer (ISO) for the funds. Frank L. Tarantino serves as the ISO and is an officer of the funds and the sole member of Tarantino LLC. The funds can terminate the ISO Agreement with Tarantino LLC at any time under the terms of the ISO Agreement. For the year ended August 31, 2016, the fee paid by the fund under this agreement was $65 and is included in “Miscellaneous” expense in the Statement of Operations. MFS has agreed to bear all expenses associated with office space, other administrative support, and supplies provided to the ISO.
The fund invests in the MFS Institutional Money Market Portfolio which is managed by MFS and seeks current income consistent with preservation of capital and liquidity. Income earned on this investment is included in “Dividends from underlying affiliated funds” in the Statement of Operations. This money market fund does not pay a management fee to MFS.
On September 9, 2015, MFS redeemed 10,958 shares of Class A, 7,510 shares of Class B, 10,976 shares of Class C, 27,988 shares of Class I, 7,510 shares of Class R1, 7,567 shares of Class R2, 7,593 shares of Class R3, 7,620 shares of Class R4, and 5,182 shares of Class R6 (formerly Class R5) for an aggregate amount of $1,350,384. On June 29, 2016, MFS redeemed 3,466 shares of Class B for an aggregate amount of $49,396.
At August 31, 2016, MFS held approximately 79%, 60%, 66%, and 100% of the outstanding shares of Class R1, Class R2, Class R3, and Class R4, respectively.
36
Notes to Financial Statements – continued
(4) Portfolio Securities
For the year ended August 31, 2016, purchases and sales of investments, other than short-term obligations, aggregated $8,911,030 and $9,538,810, respectively.
(5) Shares of Beneficial Interest
The fund’s Declaration of Trust permits the Trustees to issue an unlimited number of full and fractional shares of beneficial interest. Transactions in fund shares were as follows:
| | | | | | | | | | | | | | | | |
| | | Year ended
8/31/16 | | | Year ended
8/31/15 | |
| | | Shares | | | Amount | | | Shares | | | Amount | |
| Shares sold | | | | | | | | | | | | | | | | |
Class A | | | 158,392 | | | | $2,318,571 | | | | 227,725 | | | | $3,383,354 | |
Class B | | | 41,987 | | | | 604,821 | | | | 23,588 | | | | 344,602 | |
Class C | | | 56,866 | | | | 798,856 | | | | 51,351 | | | | 734,646 | |
Class I | | | 210,226 | | | | 3,216,833 | | | | 77,866 | | | | 1,178,698 | |
Class R1 | | | 1,343 | | | | 18,843 | | | | 1,983 | | | | 28,360 | |
Class R2 | | | 483 | | | | 7,162 | | | | 348 | | | | 5,076 | |
Class R3 | | | 708 | | | | 10,614 | | | | 453 | | | | 6,656 | |
Class R6 (formerly Class R5) | | | 199,293 | | | | 2,946,758 | | | | — | | | | — | |
| | | 669,298 | | | | $9,922,458 | | | | 383,314 | | | | $5,681,392 | |
| | | | |
| Shares issued to shareholders in reinvestment of distributions | | | | | | | | | | | | | | | | |
Class A | | | 846 | | | | $12,281 | | | | 43,952 | | | | $617,523 | |
Class B | | | — | | | | — | | | | 1,707 | | | | 23,425 | |
Class C | | | — | | | | — | | | | 14,466 | | | | 198,476 | |
Class I | | | 324 | | | | 4,732 | | | | 13,467 | | | | 190,824 | |
Class R1 | | | — | | | | — | | | | 864 | | | | 11,857 | |
Class R2 | | | — | | | | — | | | | 565 | | | | 7,873 | |
Class R3 | | | — | | | | — | | | | 521 | | | | 7,327 | |
Class R4 | | | 3 | | | | 50 | | | | 478 | | | | 6,776 | |
Class R6 (formerly Class R5) | | | 15 | | | | 217 | | | | 371 | | | | 5,265 | |
| | | 1,188 | | | | $17,280 | | | | 76,391 | | | | $1,069,346 | |
| | | | |
| Shares reacquired | | | | | | | | | | | | | | | | |
Class A | | | (365,816 | ) | | | $(5,446,585 | ) | | | (366,287 | ) | | | $(5,401,872 | ) |
Class B | | | (16,774 | ) | | | (235,868 | ) | | | (6,234 | ) | | | (90,425 | ) |
Class C | | | (53,802 | ) | | | (765,406 | ) | | | (44,082 | ) | | | (629,541 | ) |
Class I | | | (198,491 | ) | | | (2,945,826 | ) | | | (91,424 | ) | | | (1,323,863 | ) |
Class R1 | | | (16,862 | ) | | | (240,919 | ) | | | (1,938 | ) | | | (28,736 | ) |
Class R2 | | | (7,574 | ) | | | (109,523 | ) | | | (19 | ) | | | (291 | ) |
Class R3 | | | (7,791 | ) | | | (113,541 | ) | | | (3 | ) | | | (48 | ) |
Class R4 | | | (7,620 | ) | | | (112,395 | ) | | | — | | | | — | |
Class R6 (formerly Class R5) | | | (61,837 | ) | | | (897,957 | ) | | | — | | | | — | |
| | | (736,567 | ) | | | $(10,868,020 | ) | | | (509,987 | ) | | | $(7,474,776 | ) |
37
Notes to Financial Statements – continued
| | | | | | | | | | | | | | | | |
| | | Year ended
8/31/16 | | | Year ended
8/31/15 | |
| | | Shares | | | Amount | | | Shares | | | Amount | |
| Net change | | | | | | | | | | | | | | | | |
Class A | | | (206,578 | ) | | | $(3,115,733 | ) | | | (94,610 | ) | | | $(1,400,995 | ) |
Class B | | | 25,213 | | | | 368,953 | | | | 19,061 | | | | 277,602 | |
Class C | | | 3,064 | | | | 33,450 | | | | 21,735 | | | | 303,581 | |
Class I | | | 12,059 | | | | 275,739 | | | | (91 | ) | | | 45,659 | |
Class R1 | | | (15,519 | ) | | | (222,076 | ) | | | 909 | | | | 11,481 | |
Class R2 | | | (7,091 | ) | | | (102,361 | ) | | | 894 | | | | 12,658 | |
Class R3 | | | (7,083 | ) | | | (102,927 | ) | | | 971 | | | | 13,935 | |
Class R4 | | | (7,617 | ) | | | (112,345 | ) | | | 478 | | | | 6,776 | |
Class R6 (formerly Class R5) | | | 137,471 | | | | 2,049,018 | | | | 371 | | | | 5,265 | |
| | | (66,081 | ) | | | $(928,282 | ) | | | (50,282 | ) | | | $(724,038 | ) |
Effective August 26, 2016, Class R5 shares were renamed Class R6 shares.
(6) Line of Credit
The fund and certain other funds managed by MFS participate in a $1.25 billion unsecured committed line of credit, subject to a $1 billion sublimit, provided by a syndication of banks under a credit agreement. Borrowings may be made for temporary financing needs. Interest is charged to each fund, based on its borrowings, generally at a rate equal to the higher of the Overnight Federal Reserve funds rate or daily one month LIBOR plus an agreed upon spread. A commitment fee, based on the average daily, unused portion of the committed line of credit, is allocated among the participating funds at the end of each calendar quarter. In addition, the fund and other funds managed by MFS have established unsecured uncommitted borrowing arrangements with certain banks for temporary financing needs. Interest is charged to each fund, based on its borrowings, at a rate equal to the Overnight Federal Reserve funds rate plus an agreed upon spread. For the year ended August 31, 2016, the fund’s commitment fee and interest expense were $116 and $0, respectively, and are included in “Miscellaneous” expense in the Statement of Operations.
(7) Transactions in Underlying Affiliated Funds-Affiliated Issuers
An affiliated issuer may be considered one in which the fund owns 5% or more of the outstanding voting securities, or a company which is under common control. For the purposes of this report, the fund assumes the following to be an affiliated issuer:
| | | | | | | | | | | | | | | | |
| Underlying Affiliated Fund | | Beginning
Shares/Par
Amount | | | Acquisitions
Shares/Par
Amount | | | Dispositions
Shares/Par
Amount | | | Ending
Shares/Par
Amount | |
MFS Institutional Money
Market Portfolio | | | 1,023,697 | | | | 7,776,852 | | | | (8,144,358 | ) | | | 656,191 | |
| | | | |
| Underlying Affiliated Fund | | Realized
Gain (Loss) | | | Capital Gain
Distributions | | | Dividend
Income | | | Ending
Value | |
MFS Institutional Money
Market Portfolio | | | $— | | | | $— | | | | $1,656 | | | | $656,191 | |
38
REPORT OF INDEPENDENT REGISTERED PUBLIC ACCOUNTING FIRM
To the Board of Trustees of MFS Series Trust IV and Shareholders of MFS Global New Discovery Fund:
We have audited the accompanying statement of assets and liabilities, including the portfolio of investments, of MFS Global New Discovery Fund (the Fund) (one of the series constituting the MFS Series Trust IV) as of August 31, 2016, and the related statement of operations for the year then ended, the statements of changes in net assets for each of the two years in the period then ended and the financial highlights for each of the periods indicated therein. These financial statements and financial highlights are the responsibility of the Fund’s management. Our responsibility is to express an opinion on these financial statements and financial highlights based on our audits.
We conducted our audits in accordance with the standards of the Public Company Accounting Oversight Board (United States). Those standards require that we plan and perform the audit to obtain reasonable assurance about whether the financial statements and financial highlights are free of material misstatement. We were not engaged to perform an audit of the Fund’s internal control over financial reporting. Our audits included consideration of internal control over financial reporting as a basis for designing audit procedures that are appropriate in the circumstances, but not for the purpose of expressing an opinion on the effectiveness of the Fund’s internal control over financial reporting. Accordingly, we express no such opinion. An audit also includes examining, on a test basis, evidence supporting the amounts and disclosures in the financial statements and financial highlights, assessing the accounting principles used and significant estimates made by management, and evaluating the overall financial statement presentation. Our procedures included confirmation of securities owned as of August 31, 2016, by correspondence with the custodian and others or by other appropriate auditing procedures where replies from others were not received. We believe that our audits provide a reasonable basis for our opinion.
In our opinion, the financial statements and financial highlights referred to above present fairly, in all material respects, the financial position of MFS Global New Discovery Fund (one of the series constituting the MFS Series Trust IV) at August 31, 2016, the results of its operations for the year then ended, the changes in its net assets for each of the two years in the period then ended and the financial highlights for each of the periods indicated therein, in conformity with U.S. generally accepted accounting principles.

Boston, Massachusetts
October 17, 2016
39
TRUSTEES AND OFFICERS — IDENTIFICATION AND BACKGROUND
The Trustees and Officers of the Trust, as of October 1, 2016, are listed below, together with their principal occupations during the past five years. (Their titles may have varied during that period.) The address of each Trustee and Officer is 111 Huntington Avenue, Boston, Massachusetts 02199-7618.
| | | | | | | | |
Name, Age | | Position(s) Held
with Fund | | Trustee/Officer
Since (h) | | Principal
Occupations During
the Past Five Years | | Other
Directorships (j) |
| INTERESTED TRUSTEES |
Robert J. Manning (k)
(age 52) | | Trustee | | February 2004 | | Massachusetts Financial Services Company, Chairman, Co-Chief Executive Officer and Director | | N/A |
Robin A. Stelmach (k)
(age 55) | | Trustee and
President | | January 2014 | | Massachusetts Financial Services Company, Executive Vice President and Chief Operating Officer | | N/A |
| INDEPENDENT TRUSTEES |
David H. Gunning
(age 74) | | Trustee and Chair of Trustees | | January 2004 | | Private investor | | Lincoln Electric Holdings, Inc., Director; Development Alternatives, Inc., Director/Non-Executive Chairman |
Steven E. Buller
(age 65) | | Trustee | | February 2014 | | Chairman, Financial Accounting Standards Advisory Council (until 2015); Standing Advisory Group, Public Company Accounting Oversight Board, Member (until 2014); BlackRock, Inc. (investment management), Managing Director (until 2014), BlackRock Finco UK (investment management), Director (until 2014) | | N/A |
Robert E. Butler
(age 74) | | Trustee | | January 2006 | | Consultant – investment company industry regulatory and compliance matters | | N/A |
40
Trustees and Officers – continued
| | | | | | | | |
Name, Age | | Position(s) Held
with Fund | | Trustee/Officer
Since (h) | | Principal
Occupations During
the Past Five Years | | Other
Directorships (j) |
Maureen R. Goldfarb
(age 61) | | Trustee | | January 2009 | | Private investor | | N/A |
William R. Gutow
(age 75) | | Trustee | | December 1993 | | Private investor and real estate consultant; Capitol Entertainment Management Company (video franchise), Vice Chairman (until 2014) | | Texas Donuts, Vice Chairman (until 2010) |
Michael Hegarty
(age 71) | | Trustee | | December 2004 | | Private investor | | Rouse Properties Inc., Director; Capmark Financial Group Inc., Director (until 2015) |
John P. Kavanaugh
(age 61) | | Trustee | | January 2009 | | Private investor | | N/A |
Maryanne L. Roepke
(age 60) | | Trustee | | May 2014 | | American Century Investments (investment management), Senior Vice President and Chief Compliance Officer (until 2014) | | N/A |
Laurie J. Thomsen
(age 59) | | Trustee | | March 2005 | | Private investor | | The Travelers Companies, Director; Dycom Industries, Inc., Director |
Robert W. Uek
(age 75) | | Trustee | | January 2006 | | Consultant to investment company industry | | N/A |
| OFFICERS |
Christopher R. Bohane (k)
(age 42) | | Assistant
Secretary and Assistant Clerk | | July 2005 | | Massachusetts Financial Services Company, Vice President and Assistant General Counsel | | N/A |
Kino Clark (k)
(age 48) | | Assistant
Treasurer | | January 2012 | | Massachusetts Financial Services Company, Vice President | | N/A |
Kristin V. Collins (k)
(age 43) | | Assistant
Secretary and Assistant Clerk | | September 2015 | | Massachusetts Financial Services Company, Vice President and Assistant General Counsel | | N/A |
41
Trustees and Officers – continued
| | | | | | | | |
Name, Age | | Position(s) Held
with Fund | | Trustee/Officer
Since (h) | | Principal
Occupations During
the Past Five Years | | Other
Directorships (j) |
Thomas H. Connors (k)
(age 57) | | Assistant
Secretary and Assistant Clerk | | September 2012 | | Massachusetts Financial Services Company, Vice President and Senior Counsel; Deutsche Investment Management Americas Inc. (financial service provider), Director and Senior Counsel (until 2012) | | N/A |
Ethan D. Corey (k)
(age 52) | | Assistant
Secretary and Assistant Clerk | | July 2005 | | Massachusetts Financial Services Company, Senior Vice President and Associate General Counsel | | N/A |
David L. DiLorenzo (k)
(age 48) | | Treasurer | | July 2005 | | Massachusetts Financial Services Company, Senior Vice President | | N/A |
Brian E. Langenfeld (k)
(age 43) | | Assistant
Secretary and Assistant Clerk | | June 2006 | | Massachusetts Financial Services Company, Vice President and Senior Counsel | | N/A |
Susan A. Pereira (k)
(age 45) | | Assistant Secretary and Assistant Clerk | | July 2005 | | Massachusetts Financial Services Company, Vice President and Senior Counsel | | N/A |
Kasey L. Phillips (k)
(age 45) | | Assistant
Treasurer | | September 2012 | | Massachusetts Financial Services Company, Vice President; Wells Fargo Funds Management, LLC, Senior Vice President, Fund Treasurer (until 2012) | | N/A |
42
Trustees and Officers – continued
| | | | | | | | |
Name, Age | | Position(s) Held
with Fund | | Trustee/Officer
Since (h) | | Principal
Occupations During
the Past Five Years | | Other
Directorships (j) |
Mark N. Polebaum (k)
(age 64) | | Secretary and
Clerk | | January 2006 | | Massachusetts Financial Services Company, Executive Vice President, General Counsel and Secretary | | N/A |
Matthew A. Stowe (k)
(age 41) | | Assistant
Secretary and Assistant Clerk | | October 2014 | | Massachusetts Financial Services Company, Vice President and Assistant General Counsel | | N/A |
Frank L. Tarantino
(age 72) | | Independent
Senior Officer | | June 2004 | | Tarantino LLC (provider of compliance services), Principal | | N/A |
Richard S. Weitzel (k)
(age 46) | | Assistant
Secretary and Assistant Clerk | | October 2007 | | Massachusetts Financial Services Company, Senior Vice President and Associate General Counsel | | N/A |
Martin J. Wolin (k)
(age 49) | | Chief Compliance Officer | | July 2015 | | Massachusetts Financial Services Company, Senior Vice President and Chief Compliance Officer (since July 2015); Mercer (financial service provider), Chief Risk and Compliance Officer, North America and Latin America (until June 2015) | | N/A |
James O. Yost (k)
(age 56) | | Deputy Treasurer | | September 1990 | | Massachusetts Financial Services Company, Senior Vice President | | N/A |
| (h) | Date first appointed to serve as Trustee/officer of an MFS Fund. Each Trustee has served continuously since appointment unless indicated otherwise. For the period from December 15, 2004 until February 22, 2005, Mr. Manning served as Advisory Trustee. Prior to January 2012, Messrs. DiLorenzo and Yost served as Assistant Treasurers of the Funds. Ms. Stelmach was appointed as President of the Funds as of October 1, 2014. |
| (j) | Directorships or trusteeships of companies required to report to the Securities and Exchange Commission (i.e., “public companies”). |
(k) “Interested person” of the Trust within the meaning of the Investment Company Act of 1940 (referred to as the 1940 Act), which is the principal federal law governing investment companies like the fund, as a result of a position with MFS. The address of MFS is 111 Huntington Avenue, Boston, Massachusetts 02199-7618.
43
Trustees and Officers – continued
Each Trustee (except Ms. Stelmach, Mr. Buller and Ms. Roepke) has been elected by shareholders and each Trustee and officer holds office until his or her successor is chosen and qualified or until his or her earlier death, resignation, retirement or removal. The Trust does not hold annual meetings for the purpose of electing Trustees, and Trustees are not elected for fixed terms. Messrs. Buller, Butler, Kavanaugh, Uek and Ms. Roepke are members of the Trust’s Audit Committee.
Each of the Fund’s Trustees and officers holds comparable positions with certain other funds of which MFS or a subsidiary is the investment adviser or distributor, and, in the case of the officers, with certain affiliates of MFS. As of October 1, 2016, the Trustees served as board members of 137 funds within the MFS Family of Funds.
The Statement of Additional Information for a Fund includes further information about the Trustees and is available without charge upon request by calling 1-800-225-2606.
| | |
| Investment Adviser | | Custodian |
Massachusetts Financial Services Company
111 Huntington Avenue
Boston, MA 02199-7618 | | State Street Bank and Trust Company 1 Lincoln Street Boston, MA 02111-2900 |
| Distributor | | Independent Registered Public Accounting Firm |
MFS Fund Distributors, Inc.
111 Huntington Avenue
Boston, MA 02199-7618 | | Ernst & Young LLP 200 Clarendon Street Boston, MA 02116 |
| Portfolio Managers | | |
Peter Fruzzetti Paul Gordon Michael Grossman | | |
44
BOARD REVIEW OF INVESTMENT ADVISORY AGREEMENT
The Investment Company Act of 1940 requires that both the full Board of Trustees and a majority of the non-interested (“independent”) Trustees, voting separately, annually approve the continuation of the Fund’s investment advisory agreement with MFS. The Trustees consider matters bearing on the Fund and its advisory arrangements at their meetings throughout the year, including a review of performance data at each regular meeting. In addition, the independent Trustees met several times over the course of three months beginning in May and ending in July, 2016 (“contract review meetings”) for the specific purpose of considering whether to approve the continuation of the investment advisory agreement for the Fund and the other investment companies that the Board oversees (the “MFS Funds”). The independent Trustees were assisted in their evaluation of the Fund’s investment advisory agreement by independent legal counsel, from whom they received separate legal advice and with whom they met separately from MFS during various contract review meetings. The independent Trustees were also assisted in this process by the MFS Funds’ Independent Senior Officer, a senior officer appointed by and reporting to the independent Trustees.
In connection with their deliberations regarding the continuation of the investment advisory agreement, the Trustees, including the independent Trustees, considered such information and factors as they believed, in light of the legal advice furnished to them and their own business judgment, to be relevant. The investment advisory agreement for the Fund was considered separately, although the Trustees also took into account the common interests of all MFS Funds in their review. As described below, the Trustees considered the nature, quality, and extent of the various investment advisory, administrative, and shareholder services performed by MFS under the existing investment advisory agreement and other arrangements with the Fund.
In connection with their contract review meetings, the Trustees received and relied upon materials that included, among other items: (i) information provided by Broadridge, an independent third party, on the investment performance of the Fund for various time periods ended December 31, 2015 and the investment performance of a group of funds with substantially similar investment classifications/objectives (the “Lipper performance universe”), (ii) information provided by Broadridge on the Fund’s advisory fees and other expenses and the advisory fees and other expenses of comparable funds identified by Broadridge (the “Broadridge expense group”), (iii) information provided by MFS on the advisory fees of portfolios of other clients of MFS, including institutional separate accounts and other clients, (iv) information as to whether and to what extent applicable expense waivers, reimbursements or fee “breakpoints” are observed for the Fund, (v) information regarding MFS’ financial results and financial condition, including MFS’ and certain of its affiliates’ estimated profitability from services performed for the Fund and the MFS Funds as a whole, and compared to MFS’ institutional business, (vi) MFS’ views regarding the outlook for the mutual fund industry and the strategic business plans of MFS, (vii) descriptions of various functions performed by MFS for the Funds, such as compliance monitoring and portfolio trading practices, and (viii) information regarding the overall organization of MFS, including information about MFS’ senior management and other personnel providing investment advisory, administrative and other services to the Fund and the
45
Board Review of Investment Advisory Agreement – continued
other MFS Funds. The comparative performance, fee and expense information prepared and provided by Broadridge was not independently verified and the independent Trustees did not independently verify any information provided to them by MFS.
The Trustees’ conclusion as to the continuation of the investment advisory agreement was based on a comprehensive consideration of all information provided to the Trustees and not the result of any single factor. Some of the factors that figured particularly in the Trustees’ deliberations are described below, although individual Trustees may have evaluated the information presented differently from one another, giving different weights to various factors. It is also important to recognize that the fee arrangements for the Fund and other MFS Funds are the result of years of review and discussion between the independent Trustees and MFS, that certain aspects of such arrangements may receive greater scrutiny in some years than in others, and that the Trustees’ conclusions may be based, in part, on their consideration of these same arrangements during the course of the year and in prior years.
Based on information provided by Broadridge and MFS, the Trustees reviewed the Fund’s total return investment performance as well as the performance of peer groups of funds over various time periods. The Trustees placed particular emphasis on the total return performance of the Fund’s Class A shares in comparison to the performance of funds in its Lipper performance universe over the three-year period ended December 31, 2015, which the Trustees believed was a long enough period to reflect differing market conditions. The total return performance of the Fund’s Class A shares was in the 4th quintile relative to the other funds in the universe for this three-year period (the 1st quintile being the best performers and the 5th quintile being the worst performers). The total return performance of the Fund’s Class A shares was in the 2nd quintile for the one-year period ended December 31, 2015 relative to the Lipper performance universe. The Fund commenced operations on December 16, 2011; therefore no performance data for the five-year period was available. Because of the passage of time, these performance results may differ from the performance results for more recent periods, including those shown elsewhere in this report.
The Trustees expressed concern to MFS about the substandard investment performance of the Fund. In the course of their deliberations, the Trustees took into account information provided by MFS in connection with the contract review meetings, as well as during investment review meetings conducted with portfolio management personnel during the course of the year, as to MFS’ efforts to improve the Fund’s performance. In addition, the Trustees requested that they receive a separate update on the Fund’s performance at each of their regular meetings. After reviewing these and related factors, the Trustees concluded, within the context of their overall conclusions regarding the investment advisory agreement, that MFS’ responses and efforts and plans to improve investment performance were sufficient to support approval of the continuance of the investment advisory agreement for an additional one-year period, but that they would continue to closely monitor the performance of the Fund.
In assessing the reasonableness of the Fund’s advisory fee, the Trustees considered, among other information, the Fund’s advisory fee and the total expense ratio of the Fund’s Class A shares as a percentage of average daily net assets and the advisory fee
46
Board Review of Investment Advisory Agreement – continued
and total expense ratios of peer groups of funds based on information provided by Broadridge. The Trustees considered that MFS currently observes an expense limitation for the Fund, which may not be changed without the Trustees’ approval. The Trustees also considered that, according to the data provided by Broadridge (which takes into account any fee reductions or expense limitations that were in effect during the Fund’s last fiscal year), the Fund’s effective advisory fee rate was lower than the Broadridge expense group median, and the Fund’s total expense ratio was approximately at the Broadridge expense group median.
The Trustees also considered the advisory fees charged by MFS to any institutional separate accounts advised by MFS (“separate accounts”) and unaffiliated investment companies for which MFS serves as subadviser (“subadvised funds”) that have comparable investment strategies to the Fund. In comparing these fees, the Trustees considered information provided by MFS as to the generally broader scope of services provided by MFS to the Fund, as well as the more extensive regulatory burdens imposed on MFS in managing the Fund, in comparison to separate accounts and subadvised funds. The Trustees also considered the higher demands placed on MFS’ investment personnel and trading infrastructure as a result of the daily cash in-flows and out-flows of the Fund in comparison to separate accounts.
The Trustees also considered whether the Fund may benefit from any economies of scale in the management of the Fund in the event of growth in assets of the Fund and/or growth in assets of the MFS Funds as a whole. They noted that the Fund’s advisory fee rate schedule is subject to contractual breakpoints that reduce the Fund’s advisory fee rate on average daily net assets over $1 billion and $2.5 billion. The Trustees also noted that MFS has agreed in writing to waive a portion of the management fees of certain MFS Funds, including the Fund, if the total combined assets of certain funds within the MFS Funds’ complex increase above agreed upon thresholds (the “group fee waiver”), enabling the Fund’s shareholders to share in the benefits from any economies of scale at the complex level. The group fee waiver is reviewed and renewed annually between the Board and MFS. The Trustees concluded that the breakpoints and the group fee waiver were sufficient to allow the Fund to benefit from economies of scale as its assets and overall complex assets grow.
The Trustees also considered information prepared by MFS relating to MFS’ costs and profits with respect to the Fund, the MFS Funds considered as a group, and other investment companies and accounts advised by MFS, as well as MFS’ methodologies used to determine and allocate its costs to the MFS Funds, the Fund and other accounts and products for purposes of estimating profitability.
After reviewing these and other factors described herein, the Trustees concluded, within the context of their overall conclusions regarding the investment advisory agreement, that the advisory fees charged to the Fund represent reasonable compensation in light of the services being provided by MFS to the Fund.
In addition, the Trustees considered MFS’ resources and related efforts to continue to retain, attract and motivate capable personnel to serve the Fund. The Trustees also considered current and developing conditions in the financial services industry, including the presence of large and well-capitalized companies which are spending, and appear to be prepared to continue to spend, substantial sums to engage personnel
47
Board Review of Investment Advisory Agreement – continued
and to provide services to competing investment companies. In this regard, the Trustees also considered the financial resources of MFS and its ultimate parent, Sun Life Financial Inc. The Trustees also considered the advantages and possible disadvantages to the Fund of having an adviser that also serves other investment companies as well as other accounts.
The Trustees also considered the nature, quality, cost, and extent of administrative, transfer agency, and distribution services provided to the Fund by MFS and its affiliates under agreements and plans other than the investment advisory agreement, including any 12b-1 fees the Fund pays to MFS Fund Distributors, Inc., an affiliate of MFS. The Trustees also considered the nature, extent and quality of certain other services MFS performs or arranges for on the Fund’s behalf, which may include securities lending programs, directed expense payment programs, class action recovery programs, and MFS’ interaction with third-party service providers, principally custodians and sub-custodians. The Trustees concluded that the various non-advisory services provided by MFS and its affiliates on behalf of the Fund were satisfactory.
The Trustees also considered benefits to MFS from the use of the Fund’s portfolio brokerage commissions, if applicable, to pay for investment research and various other factors. Additionally, the Trustees considered so-called “fall-out benefits” to MFS such as reputational value derived from serving as investment manager to the Fund.
Based on their evaluation of factors that they deemed to be material, including those factors described above, the Board of Trustees, including the independent Trustees, concluded that the Fund’s investment advisory agreement with MFS should be continued for an additional one-year period, commencing August 1, 2016.
48
PROXY VOTING POLICIES AND INFORMATION
MFS votes proxies on behalf of the fund pursuant to proxy voting policies and procedures that are available without charge, upon request, by calling 1-800-225-2606, by visiting mfs.com (once you have selected “Individual Investor” as your role, click on “Individual Investor Home” in the top navigation and then select “Learn More About Proxy Voting” under the “I want to…” header on the left hand column of the page), or by visiting the SEC’s Web site at http://www.sec.gov.
Information regarding how the fund voted proxies relating to portfolio securities during the most recent twelve-month period ended June 30 is available by August 31 of each year without charge by visiting mfs.com (once you have selected “Individual Investor” as your role, click on “Individual Investor Home” in the top navigation and then select “Learn More About Proxy Voting” under the “I want to…” header on the left hand column of the page), or by visiting the SEC’s Web site at http://www.sec.gov.
QUARTERLY PORTFOLIO DISCLOSURE
The fund will file a complete schedule of portfolio holdings with the Securities and Exchange Commission (the Commission) for the first and third quarters of each fiscal year on Form N-Q. A shareholder can obtain the quarterly portfolio holdings report at mfs.com. The fund’s Form N-Q is also available on the EDGAR database on the Commission’s Internet Web site at http://www.sec.gov, and may be reviewed and copied at the:
Public Reference Room
Securities and Exchange Commission
100 F Street, NE, Room 1580
Washington, D.C. 20549
Information on the operation of the Public Reference Room may be obtained by calling the Commission at 1-800-SEC-0330. Copies of the fund’s Form N-Q also may be obtained, upon payment of a duplicating fee, by electronic request at the following e-mail address: publicinfo@sec.gov or by writing the Public Reference Section at the above address.
FURTHER INFORMATION
From time to time, MFS may post important information about the fund or the MFS funds on the MFS web site (mfs.com). This information is available on mfs.com by following these steps once you have selected “Individual Investor” as your role: (1) Click on the “Individual Investor Home” in the top navigation and then select the “Announcements” option within the “Market Outlooks” drop down, or (2) Click on “Products & Services” and “Mutual Funds” and then choose the fund’s name in the “Select a fund” menu.
49
INFORMATION ABOUT FUND CONTRACTS AND LEGAL CLAIMS
The fund has entered into contractual arrangements with an investment adviser, administrator, distributor, shareholder servicing agent, 529 program manager (if applicable), and custodian who each provide services to the fund. Unless expressly stated otherwise, shareholders are not parties to, or intended beneficiaries of these contractual arrangements, and these contractual arrangements are not intended to create any shareholder right to enforce them against the service providers or to seek any remedy under them against the service providers, either directly or on behalf of the fund.
Under the Trust’s By-Laws and Declaration of Trust, any claims asserted against or on behalf of the MFS Funds, including claims against Trustees and Officers, must be brought in state and federal courts located within the Commonwealth of Massachusetts.
FEDERAL TAX INFORMATION (unaudited)
The fund will notify shareholders of amounts for use in preparing 2016 income tax forms in January 2017. The following information is provided pursuant to provisions of the Internal Revenue Code.
The fund designates the maximum amount allowable as qualified dividend income eligible to be taxed at the same rate as long-term capital gain.
For corporate shareholders, 78.11% of the ordinary income dividends paid during the fiscal year qualify for the corporate dividends received deduction.
Income derived from foreign sources was $312,667. The fund intends to pass through foreign tax credits of $24,736 for the fiscal year.
50
rev. 3/16
| | | | |
| | | |
FACTS | | WHAT DOES MFS DO WITH YOUR PERSONAL INFORMATION? | |  |
| | |
| Why? | | Financial companies choose how they share your personal information. Federal law gives consumers the right to limit some but not all sharing. Federal law also requires us to tell you how we collect, share, and protect your personal information. Please read this notice carefully to understand what we do. |
| | |
| What? | | The types of personal information we collect and share depend on the product or service you have with us. This information can include: • Social Security number and account balances • Account transactions and transaction history • Checking account information and wire transfer instructions When you are no longer our customer, we continue to share your information as described in this notice. |
| | |
| How? | | All financial companies need to share customers’ personal information to run their everyday business. In the section below, we list the reasons financial companies can share their customers’ personal information; the reasons MFS chooses to share; and whether you can limit this sharing. |
| | | | |
Reasons we can share your
personal information | | Does MFS
share? | | Can you limit
this sharing? |
For our everyday business purposes – such as to process your transactions, maintain your account(s), respond to court orders and legal investigations, or report to credit bureaus | | Yes | | No |
For our marketing purposes – to offer our products and services to you | | No | | We don’t share |
For joint marketing with other financial companies | | No | | We don’t share |
For our affiliates’ everyday business purposes – information about your transactions and experiences | | No | | We don’t share |
For our affiliates’ everyday business purposes – information about your creditworthiness | | No | | We don’t share |
| For nonaffiliates to market to you | | No | | We don’t share |
| | |
| Questions? | | Call 800-225-2606 or go to mfs.com. |
51
| | |
| Who we are |
| Who is providing this notice? | | MFS Funds, MFS Investment Management, MFS Institutional Advisors, Inc., and MFS Heritage Trust Company. |
| | |
| What we do |
| How does MFS protect my personal information? | | To protect your personal information from unauthorized access and use, we use security measures that comply with federal law. These measures include procedural, electronic, and physical safeguards for the protection of the personal information we collect about you. |
| How does MFS collect my personal information? | | We collect your personal information, for example, when you • open an account or provide account information • direct us to buy securities or direct us to sell your securities • make a wire transfer We also collect your personal information from others, such as credit bureaus, affiliates, or other companies. |
| Why can’t I limit all sharing? | | Federal law gives you the right to limit only • sharing for affiliates’ everyday business purposes – information about your creditworthiness • affiliates from using your information to market to you • sharing for nonaffiliates to market to you State laws and individual companies may give you additional rights to limit sharing. |
| | |
| Definitions |
| Affiliates | | Companies related by common ownership or control. They can be financial and nonfinancial companies. • MFS does not share personal information with affiliates, except for everyday business purposes as described on page one of this notice. |
| Nonaffiliates | | Companies not related by common ownership or control. They can be financial and nonfinancial companies. • MFS does not share with nonaffiliates so they can market to you. |
| Joint marketing | | A formal agreement between nonaffiliated financial companies that together market financial products or services to you. • MFS doesn’t jointly market. |
| | |
| Other important information |
| If you own an MFS product or receive an MFS service in the name of a third party such as a bank or broker-dealer, their privacy policy may apply to you instead of ours. |
52
Save paper with eDelivery.

| MFS® will send you prospectuses, |
reports, and proxies directly via e-mail so you will get information faster with less mailbox clutter.
To sign up:
1. Go to mfs.com.
2. Log in via MFS® Access.
3. Select eDelivery.
If you own your MFS fund shares through a financial institution or a retirement plan, MFS® TALK, MFS® Access, or eDelivery may not be available to you.
CONTACT
WEB SITE
mfs.com
MFS TALK
1-800-637-8255
24 hours a day
ACCOUNT SERVICE AND LITERATURE
Shareholders
1-800-225-2606
Financial advisors
1-800-343-2829
Retirement plan services
1-800-637-1255
MAILING ADDRESS
MFS Service Center, Inc.
P.O. Box 55824
Boston, MA 02205-5824
OVERNIGHT MAIL
MFS Service Center, Inc.
c/o Boston Financial Data Services
30 Dan Road
Canton, MA 02021-2809
ANNUAL REPORT
August 31, 2016

MFS® MID CAP GROWTH FUND

OTC-ANN
MFS® MID CAP GROWTH FUND
CONTENTS
The report is prepared for the general information of shareholders.
It is authorized for distribution to prospective investors only when preceded or accompanied by a current prospectus.
NOT FDIC INSURED • MAY LOSE VALUE • NO BANK GUARANTEE

LETTER FROM THE CHAIRMAN
Dear Shareholders:
Despite the unexpected vote by the United Kingdom to leave the European Union, most markets proved resilient, with U.S. shares rallying to record highs during August.
Global interest rates remain very low, with most central banks maintaining extremely accommodative monetary policies to reinvigorate slow-growing economies against a backdrop of low inflation. This environment has favored risky assets such as equities, as investors are forced to accept greater risks in search of acceptable returns in a low-return environment. U.S. investment-grade and high-yield bonds have also benefited from low, and even negative, yields overseas.
China remains a source of concern for investors, as overcapacity in its manufacturing sector inhibits the government’s attempt to
change its domestic economy from one driven by exports to a consumer-driven model. Despite the slow-growth environment, emerging market equities have held up well, withstanding geopolitical shocks like an attempted coup in Turkey and impeachment proceedings against Brazil’s president. The U.S. Federal Reserve’s go-slow approach to rate hikes has also helped.
At MFS®, we believe it is best to view markets through a long lens and not react to short-term swings. That makes it possible to filter out market noise and focus on long-term fundamentals.
In our view, the professional guidance of a financial advisor, along with a patient, long-term approach, will help you reach your investment objectives.
Respectfully,

Robert J. Manning
Chairman
MFS Investment Management
October 17, 2016
The opinions expressed in this letter are subject to change and may not be relied upon for investment advice. No forecasts can be guaranteed.
1
PORTFOLIO COMPOSITION
Portfolio structure
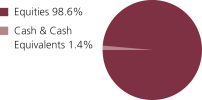
| | | | |
| Top ten holdings | | | | |
| Bright Horizons Family Solutions, Inc. | | | 2.5% | |
| Aramark | | | 2.1% | |
| Roper Technologies, Inc. | | | 2.1% | |
| Constellation Brands, Inc., “A” | | | 2.1% | |
| FleetCor Technologies, Inc. | | | 2.1% | |
| Ross Stores, Inc. | | | 2.1% | |
| Amphenol Corp., “A” | | | 2.0% | |
| O’Reilly Automotive, Inc. | | | 1.8% | |
| LKQ Corp. | | | 1.8% | |
| SBA Communications Corp. | | | 1.8% | |
| | | | |
| Equity sectors | | | | |
| Special Products & Services | | | 15.5% | |
| Health Care | | | 12.9% | |
| Industrial Goods & Services | | | 12.3% | |
| Technology | | | 10.2% | |
| Retailing | | | 10.1% | |
| Autos & Housing | | | 9.5% | |
| Financial Services | | | 8.0% | |
| Consumer Staples | | | 7.5% | |
| Leisure | | | 7.1% | |
| Basic Materials | | | 2.0% | |
| Utilities & Communications | | | 1.8% | |
| Transportation | | | 1.0% | |
| Energy | | | 0.7% | |
Cash & Cash Equivalents includes any cash, investments in money market funds, short-term securities, and other assets less liabilities. Please see the Statement of Assets and Liabilities for additional information related to the fund’s cash position and other assets and liabilities.
Percentages are based on net assets as of 8/31/16.
The portfolio is actively managed and current holdings may be different.
2
MANAGEMENT REVIEW
Summary of Results
For the twelve months ended August 31, 2016, Class A shares of the MFS Mid Cap Growth Fund (“fund”) provided a total return of 5.87%, at net asset value. This compares with a return of 7.00% for the fund’s benchmark, the Russell Midcap® Growth Index.
Market Environment
Sluggish global growth weighed on both developed and emerging market (“EM”) economies during the reporting period. The US Federal Reserve began its long-anticipated monetary tightening cycle in the middle of the period, but the tightening cycle has proved to be more gradual than initially anticipated. Globally, central bank policy remained highly accommodative, which forced many government, and even some corporate, bond yields into negative territory. Near the end of the period, the United Kingdom voted to leave the European Union (“EU”), beginning a multi-year process of negotiation in order to achieve “Brexit”. While markets initially reacted to the whole vote with alarm, the spillover to European and EM was relatively short-lived (although risks of further hits to EU cohesiveness could re-emerge).
During the second half of the reporting period, US earnings headwinds expanded beyond the energy, materials and industrial sectors, to include most sectors of the market. The sharp rise in the US dollar also weighed on earnings early in the period, though dollar strength ebbed somewhat late in the period. US consumer spending held up well during the second half of the period amid a modest increase in real wages and falling gasoline prices. Demand for autos reached near-record territory before receding modestly late in the period, while the housing market continued its recovery. Slow global trade continued to mirror slow global growth, particularly for many EM countries. That said, EM countries began to show signs of a modest upturn in activity along with adjustment in their external accounts. These improved conditions appeared to have reassured investors and contributed to record inflows into the asset class during July and August as negative yields for an increasing share of developed market bonds drove yield-hungry investors further out on the risk spectrum. Similar investor inflows were experienced in the high grade and high yield corporate markets.
Detractors from Performance
Weak security selection in the industrial goods & services sector weighed on results relative to the Russell Midcap® Growth Index. Holding global aerospace and defense systems company Orbital ATK (b)(h) hindered relative returns. Towards the end of the reporting period, shares appeared to have reacted negatively to a disappointing second quarter marked by a reduction in operating cash flows resulting from an isolated change in accounting treatment relating to a longstanding contract.
The combination of weak stock selection and an overweight position in the health care sector further detracted from relative performance. Holding biopharmaceutical company Alexion Pharmaceuticals (b), eye care and skin care products company Allergan (b)(h) and biopharmaceutical companies Regeneron Pharmaceuticals and AMAG Pharmaceuticals (b)(h) all detracted from relative results. Alexion announced disappointing results from its phase 3 study of the drug Soliris, which is being tested as
3
Management Review – continued
an additional therapy to treat myasthenia gravis, a rare disorder characterized by rapid muscle fatigue and weakness. In addition, the stock was impacted by currency headwinds as a significant portion of revenues come from overseas.
Elsewhere, holding shares of internet TV show and movie subscription services provider Netflix (b), apparel retailer PVH (b) and business intelligence software solutions developer Qlik Technologies (b)(h) hurt relative performance. Overweight positions in global cruise line operator Norwegian Cruise Lines (h) and asset management company Affiliated Managers Group further diminished relative performance.
Contributors to Performance
Strong stock selection in the autos & housing and retailing sectors benefited relative performance. Within autos & housing, an overweight position in swimming pool supply and equipment distributor Pool Corp. supported relative returns. Shares of Pool Corp. rose throughout the period on the back of strong results that were aided by healthy demand and favorable weather. Within the retailing sector, overweighting apparel retailer Ross Stores lifted relative results. Strong demand from consumers for off-price merchandise helped drive market share gains throughout the period for Ross Stores as the company continued to offer competitive values.
Stocks in other sectors that contributed positively to relative performance included overweight positions in computer graphics processors maker NVIDIA, electronic payment services company Global Payments, home and security products provider Fortune Brands Home & Security, health care product and service provider Henry Schein and food and facilities service provider Aramark. Not holding quick service Mexican restaurant Chipotle Mexican Grill and nitrogen products manufacturer CF Industries (b) and holding natural ingredient solutions provider Chr. Hansen also supported relative returns.
Respectfully,
| | | | |
| Eric Fischman | | Paul Gordon | | Matthew Sabel |
| Portfolio Manager | | Portfolio Manager | | Portfolio Manager |
| (b) | Security is not a benchmark constituent. |
| (h) | Security was not held in the portfolio at period end. |
The views expressed in this report are those of the portfolio managers only through the end of the period of the report as stated on the cover and do not necessarily reflect the views of MFS or any other person in the MFS organization. These views are subject to change at any time based on market or other conditions, and MFS disclaims any responsibility to update such views. These views may not be relied upon as investment advice or an indication of trading intent on behalf of any MFS portfolio. References to specific securities are not recommendations of such securities, and may not be representative of any MFS portfolio’s current or future investments.
4
PERFORMANCE SUMMARY THROUGH 8/31/16
The following chart illustrates a representative class of the fund’s historical performance in comparison to its benchmark(s). Performance results include the deduction of the maximum applicable sales charge and reflect the percentage change in net asset value, including reinvestment of dividends and capital gains distributions. The performance of other share classes will be greater than or less than that of the class depicted below. Benchmarks are unmanaged and may not be invested in directly. Benchmark returns do not reflect sales charges, commissions or expenses. (See Notes to Performance Summary.)
Performance data shown represents past performance and is no guarantee of future results. Investment return and principal value fluctuate so your shares, when sold, may be worth more or less than the original cost; current performance may be lower or higher than quoted. The performance shown does not reflect the deduction of taxes, if any, that a shareholder would pay on fund distributions or the redemption of fund shares.
Growth of a Hypothetical $10,000 Investment
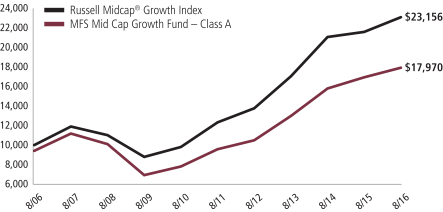
5
Performance Summary – continued
Total Returns through 8/31/16
Average annual without sales charge
| | | | | | | | | | | | | | |
| | | Share Class | | Class Inception Date | | 1-yr | | 5-yr | | 10-yr | | Life (t) | | |
| | | A | | 12/01/93 | | 5.87% | | 13.41% | | 6.67% | | N/A | | |
| | | B | | 12/01/93 | | 5.11% | | 12.55% | | 5.88% | | N/A | | |
| | | C | | 8/01/94 | | 5.16% | | 12.56% | | 5.88% | | N/A | | |
| | | I | | 1/02/97 | | 6.17% | | 13.67% | | 6.93% | | N/A | | |
| | | R1 | | 4/01/05 | | 5.13% | | 12.56% | | 5.86% | | N/A | | |
| | | R2 | | 10/31/03 | | 5.68% | | 13.13% | | 6.39% | | N/A | | |
| | | R3 | | 4/01/05 | | 5.90% | | 13.40% | | 6.64% | | N/A | | |
| | | R4 | | 4/01/05 | | 6.15% | | 13.71% | | 6.90% | | N/A | | |
| | | R6 (formerly Class R5) | | 1/02/13 | | 6.29% | | N/A | | N/A | | 14.86% | | |
| | | 529A | | 7/31/02 | | 5.95% | | 13.39% | | 6.55% | | N/A | | |
| | | 529B | | 7/31/02 | | 5.13% | | 12.53% | | 5.78% | | N/A | | |
| | | 529C | | 7/31/02 | | 5.09% | | 12.52% | | 5.77% | | N/A | | |
| Comparative benchmark | | | | | | | | | | |
| | | Russell Midcap® Growth Index (f) | | 7.00% | | 13.43% | | 8.76% | | N/A | | |
| Average annual with sales charge | | | | | | | | | | |
| | | A
With Initial Sales Charge (5.75%) | | (0.22)% | | 12.07% | | 6.04% | | N/A | | |
| | | B
With CDSC (Declining over six years from 4% to 0%) (v) | | 1.11% | | 12.30% | | 5.88% | | N/A | | |
| | | C
With CDSC (1% for 12 months) (v) | | 4.16% | | 12.56% | | 5.88% | | N/A | | |
| | | 529A
With Initial Sales Charge (5.75%) | | (0.15)% | | 12.05% | | 5.92% | | N/A | | |
| | | 529B
With CDSC (Declining over six years from 4% to 0%) (v) | | 1.13% | | 12.28% | | 5.78% | | N/A | | |
| | | 529C
With CDSC (1% for 12 months) (v) | | 4.09% | | 12.52% | | 5.77% | | N/A | | |
CDSC – Contingent Deferred Sales Charge.
Class I, R1, R2, R3, R4, and R6 shares do not have a sales charge.
Effective August 26, 2016, Class R5 shares were renamed Class R6 shares.
| (f) | Source: FactSet Research Systems Inc. |
| (t) | For the period from the class inception date through the stated period end (for those share classes with less than 10 years of performance history). No comparative benchmark performance information is provided for “life” periods. (See Notes to Performance Summary.) |
| (v) | Assuming redemption at the end of the applicable period. |
6
Performance Summary – continued
Benchmark Definition
Russell Midcap® Growth Index – constructed to provide a comprehensive barometer for growth securities in the mid-cap segment of the U.S. equity universe. Companies in this index generally have higher price-to-book ratios and higher forecasted growth values. The Russell Midcap® Growth Index is a trademark/service mark of the Frank Russell Company. Russell® is a trademark of the Frank Russell Company.
It is not possible to invest directly in an index.
Notes to Performance Summary
Class 529 shares are only available in conjunction with qualified tuition programs, such as the MFS 529 Savings Plan. There also is an additional fee, which is detailed in the program description, on qualified tuition programs. If this fee was reflected, the performance for Class 529 shares would have been lower. This annual fee is waived for Oregon residents and for those accounts with assets of $25,000 or more.
Average annual total return represents the average annual change in value for each share class for the periods presented. Life returns are presented where the share class has less than 10 years of performance history and represent the average annual total return from the class inception date to the stated period end date. As the fund’s share classes may have different inception dates, the life returns may represent different time periods and may not be comparable. As a result, no comparative benchmark performance information is provided for life periods.
Performance results reflect any applicable expense subsidies and waivers in effect during the periods shown. Without such subsidies and waivers the fund’s performance results would be less favorable. Please see the prospectus and financial statements for complete details.
Performance results do not include adjustments made for financial reporting purposes in accordance with U.S. generally accepted accounting principles and may differ from amounts reported in the financial highlights.
From time to time the fund may receive proceeds from litigation settlements, without which performance would be lower.
7
EXPENSE TABLE
Fund expenses borne by the shareholders during the period, March 1, 2016 through August 31, 2016
As a shareholder of the fund, you incur two types of costs: (1) transaction costs, including sales charges (loads) on certain purchase or redemption payments, and (2) ongoing costs, including management fees; distribution and service (12b-1) fees; and other fund expenses. This example is intended to help you understand your ongoing costs (in dollars) of investing in the fund and to compare these costs with the ongoing costs of investing in other mutual funds.
The example is based on an investment of $1,000 invested at the beginning of the period and held for the entire period March 1, 2016 through August 31, 2016.
The expenses include the payment of a portion of the transfer-agent-related expenses of MFS funds that invest in the fund. For further information, please see the Notes to the Financial Statements.
Actual Expenses
The first line for each share class in the following table provides information about actual account values and actual expenses. You may use the information in this line, together with the amount you invested, to estimate the expenses that you paid over the period. Simply divide your account value by $1,000 (for example, an $8,600 account value divided by $1,000 = 8.6), then multiply the result by the number in the first line under the heading entitled “Expenses Paid During Period” to estimate the expenses you paid on your account during this period.
Hypothetical Example for Comparison Purposes
The second line for each share class in the following table provides information about hypothetical account values and hypothetical expenses based on the fund’s actual expense ratio and an assumed rate of return of 5% per year before expenses, which is not the fund’s actual return. The hypothetical account values and expenses may not be used to estimate the actual ending account balance or expenses you paid for the period. You may use this information to compare the ongoing costs of investing in the fund and other funds. To do so, compare this 5% hypothetical example with the 5% hypothetical examples that appear in the shareholder reports of the other funds.
Please note that the expenses shown in the table are meant to highlight your ongoing costs only and do not reflect any transactional costs, such as sales charges (loads). Therefore, the second line for each share class in the table is useful in comparing ongoing costs only, and will not help you determine the relative total costs of owning different funds. In addition, if these transactional costs were included, your costs would have been higher.
8
Expense Table – continued
| | | | | | | | | | | | |
Share
Class | | | | Annualized
Expense
Ratio | | Beginning
Account Value
3/01/16 | | Ending
Account Value
8/31/16 | | Expenses
Paid During
Period (p)
3/01/16-8/31/16 | |
| A | | Actual | | 1.24% | | $1,000.00 | | $1,140.88 | | | $6.67 | |
| | Hypothetical (h) | | 1.24% | | $1,000.00 | | $1,018.90 | | | $6.29 | |
| B | | Actual | | 1.99% | | $1,000.00 | | $1,136.77 | | | $10.69 | |
| | Hypothetical (h) | | 1.99% | | $1,000.00 | | $1,015.13 | | | $10.08 | |
| C | | Actual | | 1.99% | | $1,000.00 | | $1,136.61 | | | $10.69 | |
| | Hypothetical (h) | | 1.99% | | $1,000.00 | | $1,015.13 | | | $10.08 | |
| I | | Actual | | 1.00% | | $1,000.00 | | $1,142.23 | | | $5.38 | |
| | Hypothetical (h) | | 1.00% | | $1,000.00 | | $1,020.11 | | | $5.08 | |
| R1 | | Actual | | 1.99% | | $1,000.00 | | $1,137.38 | | | $10.69 | |
| | Hypothetical (h) | | 1.99% | | $1,000.00 | | $1,015.13 | | | $10.08 | |
| R2 | | Actual | | 1.49% | | $1,000.00 | | $1,140.10 | | | $8.02 | |
| | Hypothetical (h) | | 1.49% | | $1,000.00 | | $1,017.65 | | | $7.56 | |
| R3 | | Actual | | 1.24% | | $1,000.00 | | $1,140.87 | | | $6.67 | |
| | Hypothetical (h) | | 1.24% | | $1,000.00 | | $1,018.90 | | | $6.29 | |
| R4 | | Actual | | 0.99% | | $1,000.00 | | $1,142.86 | | | $5.33 | |
| | Hypothetical (h) | | 0.99% | | $1,000.00 | | $1,020.16 | | | $5.03 | |
| R6 (formerly Class R5) | | Actual | | 0.87% | | $1,000.00 | | $1,143.38 | | | $4.69 | |
| | Hypothetical (h) | | 0.87% | | $1,000.00 | | $1,020.76 | | | $4.42 | |
| 529A | | Actual | | 1.24% | | $1,000.00 | | $1,141.39 | | | $6.67 | |
| | Hypothetical (h) | | 1.24% | | $1,000.00 | | $1,018.90 | | | $6.29 | |
| 529B | | Actual | | 2.04% | | $1,000.00 | | $1,136.78 | | | $10.96 | |
| | Hypothetical (h) | | 2.04% | | $1,000.00 | | $1,014.88 | | | $10.33 | |
| 529C | | Actual | | 2.03% | | $1,000.00 | | $1,136.74 | | | $10.90 | |
| | Hypothetical (h) | | 2.03% | | $1,000.00 | | $1,014.93 | | | $10.28 | |
| (h) | 5% class return per year before expenses. |
| (p) | “Expenses Paid During Period” are equal to each class’s annualized expense ratio, as shown above, multiplied by the average account value over the period, multiplied by 184/366 (to reflect the one-half year period). Expenses paid do not include any applicable sales charges (loads). If these transaction costs had been included, your costs would have been higher. |
Notes to Expense Table
Each class with a Rule 12b-1 service fee is subject to a rebate of a portion of such fee. Such rebates are included in the expense ratios above and are outside of the expense limitation arrangement. For Class 529A and Class 529C shares, this rebate reduced the expense ratios above by 0.05% and 0.01%, respectively. See Note 3 in the Notes to Financial Statements for additional information.
9
PORTFOLIO OF INVESTMENTS
8/31/16
The Portfolio of Investments is a complete list of all securities owned by your fund. It is categorized by broad-based asset classes.
| | | | | | | | |
| Common Stocks - 98.6% | | | | | | | | |
| Issuer | | Shares/Par | | | Value ($) | |
| Aerospace - 1.7% | | | | | | | | |
| Leidos Holdings, Inc. | | | 183,850 | | | $ | 7,447,760 | |
| TransDigm Group, Inc. (a) | | | 95,262 | | | | 27,167,770 | |
| | | | | | | | |
| | | | $ | 34,615,530 | |
| Alcoholic Beverages - 2.1% | | | | | | | | |
| Constellation Brands, Inc., “A” | | | 255,555 | | | $ | 41,923,798 | |
| | |
| Apparel Manufacturers - 1.5% | | | | | | | | |
| Hanesbrands, Inc. | | | 762,236 | | | $ | 20,229,743 | |
| PVH Corp. | | | 91,261 | | | | 9,834,285 | |
| | | | | | | | |
| | | | $ | 30,064,028 | |
| Automotive - 2.2% | | | | | | | | |
| LKQ Corp. (a) | | | 980,544 | | | $ | 35,387,833 | |
| Mobileye N.V. (a) | | | 180,204 | | | | 8,810,174 | |
| | | | | | | | |
| | | | $ | 44,198,007 | |
| Biotechnology - 2.2% | | | | | | | | |
| Alexion Pharmaceuticals, Inc. (a) | | | 132,662 | | | $ | 16,696,839 | |
| Biomarin Pharmaceutical, Inc. (a) | | | 136,672 | | | | 12,832,134 | |
| Regeneron Pharmaceuticals, Inc. (a) | | | 35,182 | | | | 13,810,694 | |
| | | | | | | | |
| | | | $ | 43,339,667 | |
| Brokerage & Asset Managers - 3.4% | | | | | | | | |
| Affiliated Managers Group, Inc. (a) | | | 102,341 | | | $ | 14,537,539 | |
| Blackstone Group LP | | | 345,365 | | | | 9,469,908 | |
| Intercontinental Exchange, Inc. | | | 63,030 | | | | 17,775,721 | |
| NASDAQ, Inc. | | | 384,915 | | | | 27,409,797 | |
| | | | | | | | |
| | | | $ | 69,192,965 | |
| Business Services - 13.4% | | | | | | | | |
| Bright Horizons Family Solutions, Inc. (a) | | | 726,068 | | | $ | 49,488,795 | |
| CoStar Group, Inc. (a) | | | 34,870 | | | | 7,226,808 | |
| Equifax, Inc. | | | 256,256 | | | | 33,800,166 | |
| Fidelity National Information Services, Inc. | | | 199,780 | | | | 15,848,547 | |
| Fiserv, Inc. (a) | | | 283,521 | | | | 29,216,839 | |
| FleetCor Technologies, Inc. (a) | | | 255,134 | | | | 41,893,003 | |
| Gartner, Inc. (a) | | | 316,924 | | | | 28,840,084 | |
| Global Payments, Inc. | | | 345,431 | | | | 26,235,484 | |
| Tyler Technologies, Inc. (a) | | | 55,380 | | | | 9,079,551 | |
10
Portfolio of Investments – continued
| | | | | | | | |
| Issuer | | Shares/Par | | | Value ($) | |
| Common Stocks - continued | | | | | | | | |
| Business Services - continued | | | | | | | | |
| Univar, Inc. (a) | | | 400,977 | | | $ | 8,296,214 | |
| Verisk Analytics, Inc., “A” (a) | | | 228,739 | | | | 18,996,774 | |
| | | | | | | | |
| | | | $ | 268,922,265 | |
| Cable TV - 1.0% | | | | | | | | |
| Charter Communications, Inc., “A” (a) | | | 80,627 | | | $ | 20,738,071 | |
| | |
| Computer Software - 2.6% | | | | | | | | |
| Akamai Technologies, Inc. (a) | | | 92,221 | | | $ | 5,062,933 | |
| Autodesk, Inc. (a) | | | 146,799 | | | | 9,894,253 | |
| Cadence Design Systems, Inc. (a) | | | 707,602 | | | | 18,001,395 | |
| Sabre Corp. | | | 693,591 | | | | 19,524,587 | |
| | | | | | | | |
| | | | $ | 52,483,168 | |
| Computer Software - Systems - 3.5% | | | | | | | | |
| Guidewire Software, Inc. (a) | | | 168,000 | | | $ | 10,337,040 | |
| NICE Systems Ltd., ADR | | | 120,064 | | | | 8,215,980 | |
| ServiceNow, Inc. (a) | | | 127,938 | | | | 9,297,254 | |
| SS&C Technologies Holdings, Inc. | | | 733,483 | | | | 24,168,265 | |
| Vantiv, Inc., “A” (a) | | | 359,142 | | | | 19,300,291 | |
| | | | | | | | |
| | | | $ | 71,318,830 | |
| Construction - 7.3% | | | | | | | | |
| Armstrong Flooring, Inc. (a) | | | 84,230 | | | $ | 1,736,823 | |
| Armstrong World Industries, Inc. (a) | | | 237,542 | | | | 10,325,951 | |
| Fortune Brands Home & Security, Inc. | | | 435,956 | | | | 27,709,363 | |
| Lennox International, Inc. | | | 149,940 | | | | 24,150,836 | |
| Masco Corp. | | | 361,758 | | | | 12,835,174 | |
| Pool Corp. | | | 298,423 | | | | 30,101,928 | |
| Siteone Landscape Supply, Inc. (a) | | | 219,010 | | | | 8,374,942 | |
| Vulcan Materials Co. | | | 277,663 | | | | 31,617,486 | |
| | | | | | | | |
| | | | $ | 146,852,503 | |
| Consumer Products - 1.6% | | | | | | | | |
| Newell Brands, Inc. | | | 620,560 | | | $ | 32,939,325 | |
| | |
| Consumer Services - 2.1% | | | | | | | | |
| Nord Anglia Education, Inc. (a) | | | 620,843 | | | $ | 13,149,455 | |
| Priceline Group, Inc. (a) | | | 8,507 | | | | 12,052,122 | |
| ServiceMaster Global Holdings, Inc. (a) | | | 455,244 | | | | 16,985,154 | |
| | | | | | | | |
| | | | $ | 42,186,731 | |
| Containers - 1.0% | | | | | | | | |
| CCL Industries, Inc. | | | 52,528 | | | $ | 10,023,740 | |
| Crown Holdings, Inc. (a) | | | 182,321 | | | | 9,887,268 | |
| | | | | | | | |
| | | | $ | 19,911,008 | |
11
Portfolio of Investments – continued
| | | | | | | | |
| Issuer | | Shares/Par | | | Value ($) | |
| Common Stocks - continued | | | | | | | | |
| Electrical Equipment - 4.4% | | | | | | | | |
| AMETEK, Inc. | | | 539,908 | | | $ | 26,320,515 | |
| Amphenol Corp., “A” | | | 650,225 | | | | 40,515,520 | |
| Mettler-Toledo International, Inc. (a) | | | 54,482 | | | | 21,960,060 | |
| | | | | | | | |
| | | | $ | 88,796,095 | |
| Electronics - 3.4% | | | | | | | | |
| Analog Devices, Inc. | | | 300,127 | | | $ | 18,775,945 | |
| Inphi Corp. (a) | | | 126,488 | | | | 5,447,838 | |
| Monolithic Power Systems, Inc. | | | 195,004 | | | | 14,960,707 | |
| NVIDIA Corp. | | | 489,239 | | | | 30,009,920 | |
| | | | | | | | |
| | | | $ | 69,194,410 | |
| Energy - Independent - 0.6% | | | | | | | | |
| Concho Resources, Inc. (a) | | | 88,013 | | | $ | 11,371,280 | |
| | |
| Entertainment - 0.9% | | | | | | | | |
| Netflix, Inc. (a) | | | 184,522 | | | $ | 17,981,669 | |
| | |
| Food & Beverages - 3.8% | | | | | | | | |
| Blue Buffalo Pet Products, Inc. (a) | | | 386,987 | | | $ | 9,976,525 | |
| Chr. Hansen Holding A.S. | | | 298,361 | | | | 18,093,326 | |
| Freshpet, Inc. (a)(l) | | | 481,423 | | | | 5,059,756 | |
| J.M. Smucker Co. | | | 137,777 | | | | 19,535,401 | |
| Mead Johnson Nutrition Co., “A” | | | 139,194 | | | | 11,841,234 | |
| Monster Worldwide, Inc. (a) | | | 75,850 | | | | 11,672,557 | |
| | | | | | | | |
| | | | $ | 76,178,799 | |
| Gaming & Lodging - 0.3% | | | | | | | | |
| MGM Mirage (a) | | | 246,956 | | | $ | 5,899,779 | |
| | |
| General Merchandise - 2.1% | | | | | | | | |
| Dollar Tree, Inc. (a) | | | 325,177 | | | $ | 26,892,138 | |
| Five Below, Inc. (a) | | | 348,793 | | | | 15,542,216 | |
| | | | | | | | |
| | | | $ | 42,434,354 | |
| Insurance - 1.2% | | | | | | | | |
| Aon PLC | | | 217,200 | | | $ | 24,185,220 | |
| | |
| Internet - 0.6% | | | | | | | | |
| LogMeIn, Inc. | | | 139,850 | | | $ | 11,677,475 | |
| | |
| Leisure & Toys - 1.1% | | | | | | | | |
| Electronic Arts, Inc. (a) | | | 275,862 | | | $ | 22,408,270 | |
12
Portfolio of Investments – continued
| | | | | | | | |
| Issuer | | Shares/Par | | | Value ($) | |
| Common Stocks - continued | | | | | | | | |
| Machinery & Tools - 5.7% | | | | | | | | |
| Colfax Corp. (a) | | | 303,270 | | | $ | 9,001,054 | |
| Flowserve Corp. | | | 522,820 | | | | 25,288,803 | |
| Roper Technologies, Inc. | | | 238,342 | | | | 42,317,622 | |
| SPX FLOW, Inc. (a) | | | 158,834 | | | | 4,671,308 | |
| WABCO Holdings, Inc. (a) | | | 248,185 | | | | 26,496,231 | |
| Xylem, Inc. | | | 139,749 | | | | 7,107,634 | |
| | | | | | | | |
| | | | $ | 114,882,652 | |
| Medical & Health Technology & Services - 2.4% | | | | | | | | |
| Adeptus Health, Inc., “A” (a) | | | 56,348 | | | $ | 2,398,171 | |
| Henry Schein, Inc. (a) | | | 198,382 | | | | 32,492,988 | |
| VCA, Inc. (a) | | | 178,120 | | | | 12,612,677 | |
| | | | | | | | |
| | | | $ | 47,503,836 | |
| Medical Equipment - 8.4% | | | | | | | | |
| C.R. Bard, Inc. | | | 145,416 | | | $ | 32,113,669 | |
| Cooper Cos., Inc. | | | 153,984 | | | | 28,628,705 | |
| DexCom, Inc. (a) | | | 141,195 | | | | 12,861,453 | |
| Edwards Lifesciences Corp. (a) | | | 113,122 | | | | 13,027,130 | |
| Integra LifeSciences Holdings Corp. (a) | | | 121,858 | | | | 10,530,968 | |
| PerkinElmer, Inc. | | | 630,708 | | | | 33,585,201 | |
| Steris PLC | | | 245,559 | | | | 17,356,110 | |
| VWR Corp. (a) | | | 726,393 | | | | 20,273,629 | |
| | | | | | | | |
| | | | $ | 168,376,865 | |
| Oil Services - 0.2% | | | | | | | | |
| FMC Technologies, Inc. (a) | | | 121,056 | | | $ | 3,413,779 | |
| | |
| Other Banks & Diversified Financials - 2.3% | | | | | | | | |
| First Republic Bank | | | 269,971 | | | $ | 20,776,968 | |
| MasterCard, Inc., “A” | | | 253,602 | | | | 24,505,561 | |
| | | | | | | | |
| | | | $ | 45,282,529 | |
| Pollution Control - 0.5% | | | | | | | | |
| Clean Harbors, Inc. (a) | | | 194,085 | | | $ | 9,277,263 | |
| | |
| Railroad & Shipping - 1.0% | | | | | | | | |
| Kansas City Southern Co. | | | 210,221 | | | $ | 20,332,575 | |
| | |
| Real Estate - 1.1% | | | | | | | | |
| Extra Space Storage, Inc., REIT | | | 278,982 | | | $ | 22,472,000 | |
| | |
| Restaurants - 3.7% | | | | | | | | |
| Aramark | | | 1,127,095 | | | $ | 42,750,713 | |
| Domino’s Pizza, Inc. | | | 79,635 | | | | 11,911,007 | |
13
Portfolio of Investments – continued
| | | | | | | | |
| Issuer | | Shares/Par | | | Value ($) | |
| Common Stocks - continued | | | | | | | | |
| Restaurants - continued | | | | | | | | |
| Dunkin Brands Group, Inc. | | | 402,917 | | | $ | 19,722,787 | |
| | | | | | | | |
| | | | $ | 74,384,507 | |
| Specialty Chemicals - 1.0% | | | | | | | | |
| Axalta Coating Systems Ltd. (a) | | | 559,209 | | | $ | 16,004,562 | |
| PolyOne Corp. | | | 136,558 | | | | 4,707,154 | |
| | | | | | | | |
| | | | $ | 20,711,716 | |
| Specialty Stores - 6.5% | | | | | | | | |
| Burlington Stores, Inc. (a) | | | 73,227 | | | $ | 5,947,497 | |
| Lululemon Athletica, Inc. (a) | | | 150,773 | | | | 11,535,642 | |
| O’Reilly Automotive, Inc. (a) | | | 132,757 | | | | 37,165,322 | |
| Ross Stores, Inc. | | | 671,617 | | | | 41,801,442 | |
| Tiffany & Co. | | | 88,651 | | | | 6,327,022 | |
| Tractor Supply Co. | | | 337,060 | | | | 28,296,187 | |
| | | | | | | | |
| | | | $ | 131,073,112 | |
| Telecommunications - Wireless - 1.8% | | | | | | | | |
| SBA Communications Corp. (a) | | | 308,694 | | | $ | 35,237,420 | |
| Total Common Stocks (Identified Cost, $1,518,653,732) | | | $ | 1,981,761,501 | |
| | |
| Money Market Funds - 1.4% | | | | | | | | |
| MFS Institutional Money Market Portfolio, 0.38% (v) (Identified Cost, $28,738,439) | | | 28,738,439 | | | $ | 28,738,439 | |
| |
| Collateral for Securities Loaned - 0.1% | | | | | |
JPMorgan Prime Money Market Fund, 0.36%,
at Cost and Value (j) | | $ | 934,500 | | | $ | 934,500 | |
| Total Investments (Identified Cost, $1,548,326,671) | | | $ | 2,011,434,440 | |
| |
| Other Assets, Less Liabilities - (0.1)% | | | | (1,603,904 | ) |
| Net Assets - 100.0% | | | $ | 2,009,830,536 | |
| (a) | Non-income producing security. |
| (j) | The rate quoted is the annualized seven-day yield of the fund at period end. |
| (l) | A portion of this security is on loan. |
| (v) | Underlying affiliated fund that is available only to investment companies managed by MFS. The rate quoted for the MFS Institutional Money Market Portfolio is the annualized seven-day yield of the fund at period end. |
The following abbreviations are used in this report and are defined:
| ADR | | American Depositary Receipt |
| PLC | | Public Limited Company |
| REIT | | Real Estate Investment Trust |
See Notes to Financial Statements
14
Financial Statements
STATEMENT OF ASSETS AND LIABILITIES
At 8/31/16
This statement represents your fund’s balance sheet, which details the assets and liabilities comprising the total value of the fund.
| | | | |
| Assets | | | | |
Investments | | | | |
Non-affiliated issuers, at value (identified cost, $1,519,588,232) | | | $1,982,696,001 | |
Underlying affiliated funds, at value (identified cost, $28,738,439) | | | 28,738,439 | |
Total investments, at value, including $935,390 of securities on loan
(identified cost, $1,548,326,671) | | | $2,011,434,440 | |
Receivables for | | | | |
Investments sold | | | 14,722,900 | |
Fund shares sold | | | 4,926,549 | |
Interest and dividends | | | 1,280,227 | |
Other assets | | | 2,145 | |
Total assets | | | $2,032,366,261 | |
| Liabilities | | | | |
Payable to custodian | | | $2,436 | |
Payables for | | | | |
Investments purchased | | | 15,164,609 | |
Fund shares reacquired | | | 5,654,714 | |
Collateral for securities loaned, at value | | | 934,500 | |
Payable to affiliates | | | | |
Investment adviser | | | 80,927 | |
Shareholder servicing costs | | | 510,722 | |
Distribution and service fees | | | 9,431 | |
Program manager fees | | | 14 | |
Payable for independent Trustees’ compensation | | | 25,413 | |
Accrued expenses and other liabilities | | | 152,959 | |
Total liabilities | | | $22,535,725 | |
Net assets | | | $2,009,830,536 | |
| Net assets consist of | | | | |
Paid-in capital | | | $1,492,675,192 | |
Unrealized appreciation (depreciation) on investments and translation of assets and liabilities in foreign currencies | | | 463,110,698 | |
Accumulated net realized gain (loss) on investments and foreign currency | | | 55,896,647 | |
Accumulated net investment loss | | | (1,852,001 | ) |
Net assets | | | $2,009,830,536 | |
Shares of beneficial interest outstanding | | | 132,008,597 | |
15
Statement of Assets and Liabilities – continued
| | | | | | | | | | | | |
| | | Net assets | | | Shares
outstanding | | | Net asset value
per share (a) | |
Class A | | | $454,881,090 | | | | 30,692,143 | | | | $14.82 | |
Class B | | | 17,977,749 | | | | 1,404,814 | | | | 12.80 | |
Class C | | | 53,861,867 | | | | 4,317,170 | | | | 12.48 | |
Class I | | | 110,802,742 | | | | 7,149,179 | | | | 15.50 | |
Class R1 | | | 2,057,432 | | | | 161,390 | | | | 12.75 | |
Class R2 | | | 5,651,206 | | | | 399,127 | | | | 14.16 | |
Class R3 | | | 14,835,899 | | | | 1,006,377 | | | | 14.74 | |
Class R4 | | | 13,883,373 | | | | 913,615 | | | | 15.20 | |
Class R6 (formerly Class R5) | | | 1,330,138,838 | | | | 85,544,570 | | | | 15.55 | |
Class 529A | | | 3,889,636 | | | | 269,217 | | | | 14.45 | |
Class 529B | | | 209,281 | | | | 16,681 | | | | 12.55 | |
Class 529C | | | 1,641,423 | | | | 134,314 | | | | 12.22 | |
| (a) | Maximum offering price per share was equal to the net asset value per share for all share classes, except for Classes A and 529A, for which the maximum offering prices per share were $15.72 [100 / 94.25 x $14.82] and $15.33 [100 / 94.25 x $14.45], respectively. On sales of $50,000 or more, the maximum offering prices of Class A and Class 529A shares are reduced. A contingent deferred sales charge may be imposed on redemptions of Class A, Class B, Class C, Class 529B, and Class 529C shares. Redemption price per share was equal to the net asset value per share for Classes I, R1, R2, R3, R4, R6, and 529A. |
See Notes to Financial Statements
16
Financial Statements
STATEMENT OF OPERATIONS
Year ended 8/31/16
This statement describes how much your fund earned in investment income and accrued in expenses. It also describes any gains and/or losses generated by fund operations.
| | | | |
| Net investment loss | | | | |
Income | | | | |
Dividends | | | $13,139,765 | |
Interest | | | 578,877 | |
Dividends from underlying affiliated funds | | | 136,428 | |
Foreign taxes withheld | | | (60,496 | ) |
Total investment income | | | $13,794,574 | |
Expenses | | | | |
Management fee | | | $13,821,949 | |
Distribution and service fees | | | 1,654,603 | |
Shareholder servicing costs | | | 2,446,379 | |
Program manager fees | | | 5,262 | |
Administrative services fee | | | 299,388 | |
Independent Trustees’ compensation | | | 37,496 | |
Custodian fee | | | 157,420 | |
Shareholder communications | | | 64,653 | |
Audit and tax fees | | | 54,912 | |
Legal fees | | | 19,878 | |
Miscellaneous | | | 241,927 | |
Total expenses | | | $18,803,867 | |
Reduction of expenses by investment adviser and distributor | | | (571,109 | ) |
Net expenses | | | $18,232,758 | |
Net investment loss | | | $(4,438,184 | ) |
| Realized and unrealized gain (loss) on investments and foreign currency | |
Realized gain (loss) (identified cost basis) | | | | |
Investments | | | $106,522,748 | |
Foreign currency | | | (28,911 | ) |
Net realized gain (loss) on investments and foreign currency | | | $106,493,837 | |
Change in unrealized appreciation (depreciation) | | | | |
Investments | | | $25,485,046 | |
Translation of assets and liabilities in foreign currencies | | | 1,851 | |
Net unrealized gain (loss) on investments and foreign currency translation | | | $25,486,897 | |
Net realized and unrealized gain (loss) on investments and foreign currency | | | $131,980,734 | |
Change in net assets from operations | | | $127,542,550 | |
See Notes to Financial Statements
17
Financial Statements
STATEMENTS OF CHANGES IN NET ASSETS
These statements describe the increases and/or decreases in net assets resulting from operations, any distributions, and any shareholder transactions.
| | | | | | | | |
| | | Years ended 8/31 | |
| | | 2016 | | | 2015 | |
| Change in net assets | | | | | | |
| From operations | | | | | | | | |
Net investment loss | | | $(4,438,184 | ) | | | $(8,453,240 | ) |
Net realized gain (loss) on investments and foreign currency | | | 106,493,837 | | | | 53,581,412 | |
Net unrealized gain (loss) on investments and foreign currency translation | | | 25,486,897 | | | | 80,449,173 | |
Change in net assets from operations | | | $127,542,550 | | | | $125,577,345 | |
| Distributions declared to shareholders | | | | | | | | |
From net realized gain on investments | | | $(47,608,616 | ) | | | $(108,646,048 | ) |
Change in net assets from fund share transactions | | | $195,713,637 | | | | $46,241,537 | |
Total change in net assets | | | $275,647,571 | | | | $63,172,834 | |
| Net assets | | | | | | | | |
At beginning of period | | | 1,734,182,965 | | | | 1,671,010,131 | |
At end of period (including accumulated net investment loss of $1,852,001 and $754,571, respectively) | | | $2,009,830,536 | | | | $1,734,182,965 | |
See Notes to Financial Statements
18
Financial Statements
FINANCIAL HIGHLIGHTS
The financial highlights table is intended to help you understand the fund’s financial performance for the past 5 years (or life of a particular share class, if shorter). Certain information reflects financial results for a single fund share. The total returns in the table represent the rate by which an investor would have earned (or lost) on an investment in the fund share class (assuming reinvestment of all distributions) held for the entire period.
| | | | | | | | | | | | | | | | | | | | |
| Class A | | Years ended 8/31 | |
| | | 2016 | | | 2015 | | | 2014 | | | 2013 | | | 2012 | |
Net asset value, beginning of period | | | $14.40 | | | | $14.41 | | | | $11.86 | | | | $9.57 | | | | $8.73 | |
| Income (loss) from investment operations | | | | | | | | | | | | | | | | | |
Net investment loss (d) | | | $(0.06 | ) | | | $(0.10 | ) | | | $(0.09 | ) | | | $(0.03 | ) | | | $(0.07 | ) |
Net realized and unrealized gain (loss)
on investments and foreign currency | | | 0.88 | | | | 1.07 | | | | 2.64 | | | | 2.32 | | | | 0.91 | |
Total from investment operations | | | $0.82 | | | | $0.97 | | | | $2.55 | | | | $2.29 | | | | $0.84 | |
| Less distributions declared to shareholders | | | | | | | | | | | | | | | | | |
From net realized gain on investments | | | $(0.40 | ) | | | $(0.98 | ) | | | $— | | | | $— | | | | $— | |
Net asset value, end of period (x) | | | $14.82 | | | | $14.40 | | | | $14.41 | | | | $11.86 | | | | $9.57 | |
Total return (%) (r)(s)(t)(x) | | | 5.87 | | | | 7.36 | | | | 21.50 | | | | 23.93 | | | | 9.62 | |
Ratios (%) (to average net assets)
and Supplemental data: | | | | | | | | | | | | | | | | | |
Expenses before expense reductions (f) | | | 1.26 | | | | 1.24 | | | | 1.22 | | | | 1.24 | | | | 1.26 | |
Expenses after expense reductions (f) | | | 1.22 | | | | 1.21 | | | | 1.19 | | | | 1.23 | | | | 1.25 | |
Net investment loss | | | (0.45 | ) | | | (0.72 | ) | | | (0.69 | ) | | | (0.30 | ) | | | (0.74 | ) |
Portfolio turnover | | | 43 | | | | 37 | | | | 59 | | | | 58 | | | | 63 | |
Net assets at end of period (000 omitted) | | | $454,881 | | | | $295,230 | | | | $255,308 | | | | $218,693 | | | | $191,462 | |
See Notes to Financial Statements
19
Financial Highlights – continued
| | | | | | | | | | | | | | | | | | | | |
| Class B | | Years ended 8/31 | |
| | | 2016 | | | 2015 | | | 2014 | | | 2013 | | | 2012 | |
Net asset value, beginning of period | | | $12.58 | | | | $12.81 | | | | $10.61 | | | | $8.63 | | | | $7.94 | |
| Income (loss) from investment operations | | | | | | | | | | | | | | | | | |
Net investment loss (d) | | | $(0.15 | ) | | | $(0.19 | ) | | | $(0.17 | ) | | | $(0.10 | ) | | | $(0.12 | ) |
Net realized and unrealized gain (loss)
on investments and foreign currency | | | 0.77 | | | | 0.94 | | | | 2.37 | | | | 2.08 | | | | 0.81 | |
Total from investment operations | | | $0.62 | | | | $0.75 | | | | $2.20 | | | | $1.98 | | | | $0.69 | |
| Less distributions declared to shareholders | | | | | | | | | | | | | | | | | |
From net realized gain on investments | | | $(0.40 | ) | | | $(0.98 | ) | | | $— | | | | $— | | | | $— | |
Net asset value, end of period (x) | | | $12.80 | | | | $12.58 | | | | $12.81 | | | | $10.61 | | | | $8.63 | |
Total return (%) (r)(s)(t)(x) | | | 5.11 | | | | 6.51 | | | | 20.74 | | | | 22.94 | | | | 8.69 | |
Ratios (%) (to average net assets)
and Supplemental data: | | | | | | | | | | | | | | | | | |
Expenses before expense reductions (f) | | | 2.00 | | | | 1.99 | | | | 1.97 | | | | 1.99 | | | | 2.01 | |
Expenses after expense reductions (f) | | | 1.97 | | | | 1.96 | | | | 1.94 | | | | 1.98 | | | | 2.01 | |
Net investment loss | | | (1.24 | ) | | | (1.47 | ) | | | (1.44 | ) | | | (1.05 | ) | | | (1.49 | ) |
Portfolio turnover | | | 43 | | | | 37 | | | | 59 | | | | 58 | | | | 63 | |
Net assets at end of period (000 omitted) | | | $17,978 | | | | $17,415 | | | | $18,061 | | | | $17,881 | | | | $18,918 | |
| |
| Class C | | Years ended 8/31 | |
| | | 2016 | | | 2015 | | | 2014 | | | 2013 | | | 2012 | |
Net asset value, beginning of period | | | $12.27 | | | | $12.52 | | | | $10.38 | | | | $8.44 | | | | $7.76 | |
| Income (loss) from investment operations | | | | | | | | | | | | | | | | | |
Net investment loss (d) | | | $(0.14 | ) | | | $(0.18 | ) | | | $(0.17 | ) | | | $(0.10 | ) | | | $(0.12 | ) |
Net realized and unrealized gain (loss)
on investments and foreign currency | | | 0.75 | | | | 0.91 | | | | 2.31 | | | | 2.04 | | | | 0.80 | |
Total from investment operations | | | $0.61 | | | | $0.73 | | | | $2.14 | | | | $1.94 | | | | $0.68 | |
| Less distributions declared to shareholders | | | | | | | | | | | | | | | | | |
From net realized gain on investments | | | $(0.40 | ) | | | $(0.98 | ) | | | $— | | | | $— | | | | $— | |
Net asset value, end of period (x) | | | $12.48 | | | | $12.27 | | | | $12.52 | | | | $10.38 | | | | $8.44 | |
Total return (%) (r)(s)(t)(x) | | | 5.16 | | | | 6.50 | | | | 20.62 | | | | 22.99 | | | | 8.76 | |
Ratios (%) (to average net assets)
and Supplemental data: | | | | | | | | | | | | | | | | | |
Expenses before expense reductions (f) | | | 2.00 | | | | 1.99 | | | | 1.97 | | | | 1.99 | | | | 2.01 | |
Expenses after expense reductions (f) | | | 1.97 | | | | 1.96 | | | | 1.94 | | | | 1.98 | | | | 2.01 | |
Net investment loss | | | (1.22 | ) | | | (1.47 | ) | | | (1.43 | ) | | | (1.06 | ) | | | (1.49 | ) |
Portfolio turnover | | | 43 | | | | 37 | | | | 59 | | | | 58 | | | | 63 | |
Net assets at end of period (000 omitted) | | | $53,862 | | | | $42,806 | | | | $38,341 | | | | $32,334 | | | | $28,647 | |
See Notes to Financial Statements
20
Financial Highlights – continued
| | | | | | | | | | | | | | | | | | | | |
| Class I | | Years ended 8/31 | |
| | | 2016 | | | 2015 | | | 2014 | | | 2013 | | | 2012 | |
Net asset value, beginning of period | | | $15.00 | | | | $14.94 | | | | $12.26 | | | | $9.87 | | | | $8.99 | |
| Income (loss) from investment operations | | | | | | | | | | | | | | | | | |
Net investment income (loss) (d) | | | $(0.00 | )(w) | | | $(0.07 | ) | | | $(0.06 | ) | | | $0.01 | | | | $(0.05 | ) |
Net realized and unrealized gain (loss)
on investments and foreign currency | | | 0.90 | | | | 1.11 | | | | 2.74 | | | | 2.38 | | | | 0.93 | |
Total from investment operations | | | $0.90 | | | | $1.04 | | | | $2.68 | | | | $2.39 | | | | $0.88 | |
| Less distributions declared to shareholders | | | | | | | | | | | | | | | | | |
From net realized gain on investments | | | $(0.40 | ) | | | $(0.98 | ) | | | $— | | | | $— | | | | $— | |
Net asset value, end of period (x) | | | $15.50 | | | | $15.00 | | | | $14.94 | | | | $12.26 | | | | $9.87 | |
Total return (%) (r)(s)(x) | | | 6.17 | | | | 7.57 | | | | 21.86 | | | | 24.21 | | | | 9.79 | |
Ratios (%) (to average net assets)
and Supplemental data: | | | | | | | | | | | | | | | | | |
Expenses before expense reductions (f) | | | 1.02 | | | | 1.00 | | | | 0.97 | | | | 0.96 | | | | 1.00 | |
Expenses after expense reductions (f) | | | 0.99 | | | | 0.97 | | | | 0.95 | | | | 0.96 | | | | 1.00 | |
Net investment income (loss) | | | (0.01 | ) | | | (0.47 | ) | | | (0.44 | ) | | | 0.13 | | | | (0.49 | ) |
Portfolio turnover | | | 43 | | | | 37 | | | | 59 | | | | 58 | | | | 63 | |
Net assets at end of period (000 omitted) | | | $110,803 | | | | $26,931 | | | | $13,526 | | | | $8,986 | | | | $764,857 | |
| |
| Class R1 | | Years ended 8/31 | |
| | | 2016 | | | 2015 | | | 2014 | | | 2013 | | | 2012 | |
Net asset value, beginning of period | | | $12.53 | | | | $12.76 | | | | $10.58 | | | | $8.60 | | | | $7.91 | |
| Income (loss) from investment operations | | | | | | | | | | | | | | | | | |
Net investment loss (d) | | | $(0.15 | ) | | | $(0.19 | ) | | | $(0.17 | ) | | | $(0.10 | ) | | | $(0.12 | ) |
Net realized and unrealized gain (loss)
on investments and foreign currency | | | 0.77 | | | | 0.94 | | | | 2.35 | | | | 2.08 | | | | 0.81 | |
Total from investment operations | | | $0.62 | | | | $0.75 | | | | $2.18 | | | | $1.98 | | | | $0.69 | |
| Less distributions declared to shareholders | | | | | | | | | | | | | | | | | |
From net realized gain on investments | | | $(0.40 | ) | | | $(0.98 | ) | | | $— | | | | $— | | | | $— | |
Net asset value, end of period (x) | | | $12.75 | | | | $12.53 | | | | $12.76 | | | | $10.58 | | | | $8.60 | |
Total return (%) (r)(s)(x) | | | 5.13 | | | | 6.54 | | | | 20.60 | | | | 23.02 | | | | 8.72 | |
Ratios (%) (to average net assets)
and Supplemental data: | | | | | | | | | | | | | | | | | |
Expenses before expense reductions (f) | | | 2.00 | | | | 1.99 | | | | 1.97 | | | | 1.99 | | | | 2.01 | |
Expenses after expense reductions (f) | | | 1.97 | | | | 1.97 | | | | 1.95 | | | | 1.98 | | | | 2.01 | |
Net investment loss | | | (1.25 | ) | | | (1.47 | ) | | | (1.44 | ) | | | (1.05 | ) | | | (1.49 | ) |
Portfolio turnover | | | 43 | | | | 37 | | | | 59 | | | | 58 | | | | 63 | |
Net assets at end of period (000 omitted) | | | $2,057 | | | | $2,288 | | | | $2,238 | | | | $1,949 | | | | $1,777 | |
See Notes to Financial Statements
21
Financial Highlights – continued
| | | | | | | | | | | | | | | | | | | | |
| Class R2 | | Years ended 8/31 | |
| | | 2016 | | | 2015 | | | 2014 | | | 2013 | | | 2012 | |
Net asset value, beginning of period | | | $13.80 | | | | $13.89 | | | | $11.46 | | | | $9.27 | | | | $8.48 | |
| Income (loss) from investment operations | | | | | | | | | | | | | | | | | |
Net investment loss (d) | | | $(0.10 | ) | | | $(0.14 | ) | | | $(0.12 | ) | | | $(0.06 | ) | | | $(0.09 | ) |
Net realized and unrealized gain (loss)
on investments and foreign currency | | | 0.86 | | | | 1.03 | | | | 2.55 | | | | 2.25 | | | | 0.88 | |
Total from investment operations | | | $0.76 | | | | $0.89 | | | | $2.43 | | | | $2.19 | | | | $0.79 | |
| Less distributions declared to shareholders | | | | | | | | | | | | | | | | | |
From net realized gain on investments | | | $(0.40 | ) | | | $(0.98 | ) | | | $— | | | | $— | | | | $— | |
Net asset value, end of period (x) | | | $14.16 | | | | $13.80 | | | | $13.89 | | | | $11.46 | | | | $9.27 | |
Total return (%) (r)(s)(x) | | | 5.68 | | | | 7.04 | | | | 21.20 | | | | 23.62 | | | | 9.32 | |
Ratios (%) (to average net assets)
and Supplemental data: | | | | | | | | | | | | | | | | | |
Expenses before expense reductions (f) | | | 1.50 | | | | 1.49 | | | | 1.47 | | | | 1.49 | | | | 1.51 | |
Expenses after expense reductions (f) | | | 1.47 | | | | 1.47 | | | | 1.45 | | | | 1.48 | | | | 1.51 | |
Net investment loss | | | (0.73 | ) | | | (0.97 | ) | | | (0.94 | ) | | | (0.56 | ) | | | (0.99 | ) |
Portfolio turnover | | | 43 | | | | 37 | | | | 59 | | | | 58 | | | | 63 | |
Net assets at end of period (000 omitted) | | | $5,651 | | | | $4,598 | | | | $4,473 | | | | $4,449 | | | | $4,357 | |
| |
| Class R3 | | Years ended 8/31 | |
| | | 2016 | | | 2015 | | | 2014 | | | 2013 | | | 2012 | |
Net asset value, beginning of period | | | $14.32 | | | | $14.34 | | | | $11.80 | | | | $9.52 | | | | $8.69 | |
| Income (loss) from investment operations | | | | | | | | | | | | | | | | | |
Net investment loss (d) | | | $(0.06 | ) | | | $(0.10 | ) | | | $(0.10 | ) | | | $(0.03 | ) | | | $(0.07 | ) |
Net realized and unrealized gain (loss)
on investments and foreign currency | | | 0.88 | | | | 1.06 | | | | 2.64 | | | | 2.31 | | | | 0.90 | |
Total from investment operations | | | $0.82 | | | | $0.96 | | | | $2.54 | | | | $2.28 | | | | $0.83 | |
| Less distributions declared to shareholders | | | | | | | | | | | | | | | | | |
From net realized gain on investments | | | $(0.40 | ) | | | $(0.98 | ) | | | $— | | | | $— | | | | $— | |
Net asset value, end of period (x) | | | $14.74 | | | | $14.32 | | | | $14.34 | | | | $11.80 | | | | $9.52 | |
Total return (%) (r)(s)(x) | | | 5.90 | | | | 7.32 | | | | 21.53 | | | | 23.95 | | | | 9.55 | |
Ratios (%) (to average net assets)
and Supplemental data: | | | | | | | | | | | | | | | | | |
Expenses before expense reductions (f) | | | 1.26 | | | | 1.25 | | | | 1.22 | | | | 1.24 | | | | 1.25 | |
Expenses after expense reductions (f) | | | 1.23 | | | | 1.22 | | | | 1.20 | | | | 1.23 | | | | 1.25 | |
Net investment loss | | | (0.42 | ) | | | (0.72 | ) | | | (0.74 | ) | | | (0.31 | ) | | | (0.74 | ) |
Portfolio turnover | | | 43 | | | | 37 | | | | 59 | | | | 58 | | | | 63 | |
Net assets at end of period (000 omitted) | | | $14,836 | | | | $8,440 | | | | $3,680 | | | | $2,000 | | | | $1,617 | |
See Notes to Financial Statements
22
Financial Highlights – continued
| | | | | | | | | | | | | | | | | | | | |
| Class R4 | | Years ended 8/31 | |
| | | 2016 | | | 2015 | | | 2014 | | | 2013 | | | 2012 | |
Net asset value, beginning of period | | | $14.72 | | | | $14.67 | | | | $12.04 | | | | $9.70 | | | | $8.82 | |
| Income (loss) from investment operations | | | | | | | | | | | | | | | | | |
Net investment loss (d) | | | $(0.02 | ) | | | $(0.07 | ) | | | $(0.06 | ) | | | $(0.01 | ) | | | $(0.05 | ) |
Net realized and unrealized gain (loss)
on investments and foreign currency | | | 0.90 | | | | 1.10 | | | | 2.69 | | | | 2.35 | | | | 0.93 | |
Total from investment operations | | | $0.88 | | | | $1.03 | | | | $2.63 | | | | $2.34 | | | | $0.88 | |
| Less distributions declared to shareholders | | | | | | | | | | | | | | | | | |
From net realized gain on investments | | | $(0.40 | ) | | | $(0.98 | ) | | | $— | | | | $— | | | | $— | |
Net asset value, end of period (x) | | | $15.20 | | | | $14.72 | | | | $14.67 | | | | $12.04 | | | | $9.70 | |
Total return (%) (r)(s)(x) | | | 6.15 | | | | 7.65 | | | | 21.84 | | | | 24.12 | | | | 9.98 | |
Ratios (%) (to average net assets)
and Supplemental data: | | | | | | | | | | | | | | | | | |
Expenses before expense reductions (f) | | | 1.01 | | | | 1.00 | | | | 0.97 | | | | 0.99 | | | | 1.00 | |
Expenses after expense reductions (f) | | | 0.98 | | | | 0.98 | | | | 0.95 | | | | 0.98 | | | | 1.00 | |
Net investment loss | | | (0.17 | ) | | | (0.47 | ) | | | (0.44 | ) | | | (0.06 | ) | | | (0.49 | ) |
Portfolio turnover | | | 43 | | | | 37 | | | | 59 | | | | 58 | | | | 63 | |
Net assets at end of period (000 omitted) | | | $13,883 | | | | $2,322 | | | | $422 | | | | $355 | | | | $256 | |
| | | | | | | | | | | | | | | | |
| |
| Class R6 (formerly Class R5) | | Years ended 8/31 | |
| | | 2016 | | | 2015 | | | 2014 | | | 2013 (i) | |
Net asset value, beginning of period | | | $15.03 | | | | $14.96 | | | | $12.27 | | | | $10.30 | |
| Income (loss) from investment operations | | | | | | | | | | | | | |
Net investment income (loss) (d) | | | $(0.02 | ) | | | $(0.06 | ) | | | $(0.05 | ) | | | $(0.01 | ) |
Net realized and unrealized gain (loss)
on investments and foreign currency | | | 0.94 | | | | 1.11 | | | | 2.74 | | | | 1.98 | |
Total from investment operations | | | $0.92 | | | | $1.05 | | | | $2.69 | | | | $1.97 | |
| Less distributions declared to shareholders | | | | | | | | | | | | | |
From net realized gain on investments | | | $(0.40 | ) | | | $(0.98 | ) | | | $— | | | | $— | |
Net asset value, end of period (x) | | | $15.55 | | | | $15.03 | | | | $14.96 | | | | $12.27 | |
Total return (%) (r)(s)(x) | | | 6.29 | | | | 7.63 | | | | 21.92 | | | | 19.13 | (n) |
Ratios (%) (to average net assets)
and Supplemental data: | | | | | | | | | | | | | |
Expenses before expense reductions (f) | | | 0.90 | | | | 0.91 | | | | 0.91 | | | | 0.93 | (a) |
Expenses after expense reductions (f) | | | 0.87 | | | | 0.89 | | | | 0.89 | | | | 0.92 | (a) |
Net investment income (loss) | | | (0.14 | ) | | | (0.39 | ) | | | (0.38 | ) | | | (0.08 | )(a) |
Portfolio turnover | | | 43 | | | | 37 | | | | 59 | | | | 58 | |
Net assets at end of period (000 omitted) | | | $1,330,139 | | | | $1,329,257 | | | | $1,331,244 | | | | $1,027,324 | |
See Notes to Financial Statements
23
Financial Highlights – continued
| | | | | | | | | | | | | | | | | | | | |
| Class 529A | | Years ended 8/31 | |
| | | 2016 | | | 2015 | | | 2014 | | | 2013 | | | 2012 | |
Net asset value, beginning of period | | | $14.04 | | | | $14.08 | | | | $11.59 | | | | $9.35 | | | | $8.54 | |
| Income (loss) from investment operations | | | | | | | | | | | | | | | | | |
Net investment loss (d) | | | $(0.07 | ) | | | $(0.10 | ) | | | $(0.09 | ) | | | $(0.03 | ) | | | $(0.07 | ) |
Net realized and unrealized gain (loss)
on investments and foreign currency | | | 0.88 | | | | 1.04 | | | | 2.58 | | | | 2.27 | | | | 0.88 | |
Total from investment operations | | | $0.81 | | | | $(0.94 | ) | | | $2.49 | | | | $2.24 | | | | $0.81 | |
| Less distributions declared to shareholders | | | | | | | | | | | | | | | | | |
From net realized gain on investments | | | $(0.40 | ) | | | $(0.98 | ) | | | $— | | | | $— | | | | $— | |
Net asset value, end of period (x) | | | $14.45 | | | | $14.04 | | | | $14.08 | | | | $11.59 | | | | $9.35 | |
Total return (%) (r)(s)(t)(x) | | | 5.95 | | | | 7.31 | | | | 21.48 | | | | 23.96 | | | | 9.48 | |
Ratios (%) (to average net assets)
and Supplemental data: | | | | | | | | | | | | | | | | | |
Expenses before expense reductions (f) | | | 1.35 | | | | 1.34 | | | | 1.32 | | | | 1.34 | | | | 1.35 | |
Expenses after expense reductions (f) | | | 1.23 | | | | 1.21 | | | | 1.19 | | | | 1.24 | | | | 1.30 | |
Net investment loss | | | (0.48 | ) | | | (0.72 | ) | | | (0.69 | ) | | | (0.33 | ) | | | (0.79 | ) |
Portfolio turnover | | | 43 | | | | 37 | | | | 59 | | | | 58 | | | | 63 | |
Net assets at end of period (000 omitted) | | | $3,890 | | | | $3,159 | | | | $2,434 | | | | $1,844 | | | | $1,231 | |
| |
| Class 529B | | Years ended 8/31 | |
| | | 2016 | | | 2015 | | | 2014 | | | 2013 | | | 2012 | |
Net asset value, beginning of period | | | $12.34 | | | | $12.59 | | | | $10.44 | | | | $8.50 | | | | $7.81 | |
| Income (loss) from investment operations | | | | | | | | | | | | | | | | | |
Net investment loss (d) | | | $(0.15 | ) | | | $(0.19 | ) | | | $(0.18 | ) | | | $(0.11 | ) | | | $(0.12 | ) |
Net realized and unrealized gain (loss)
on investments and foreign currency | | | 0.76 | | | | 0.92 | | | | 2.33 | | | | 2.05 | | | | 0.81 | |
Total from investment operations | | | $0.61 | | | | $0.73 | | | | $2.15 | | | | $1.94 | | | | $0.69 | |
| Less distributions declared to shareholders | | | | | | | | | | | | | | | | | |
From net realized gain on investments | | | $(0.40 | ) | | | $(0.98 | ) | | | $— | | | | $— | | | | $— | |
Net asset value, end of period (x) | | | $12.55 | | | | $12.34 | | | | $12.59 | | | | $10.44 | | | | $8.50 | |
Total return (%) (r)(s)(t)(x) | | | 5.13 | | | | 6.46 | | | | 20.59 | | | | 22.82 | | | | 8.83 | |
Ratios (%) (to average net assets)
and Supplemental data: | | | | | | | | | | | | | | | | | |
Expenses before expense reductions (f) | | | 2.11 | | | | 2.09 | | | | 2.07 | | | | 2.09 | | | | 2.11 | |
Expenses after expense reductions (f) | | | 2.02 | | | | 2.02 | | | | 2.00 | | | | 2.03 | | | | 2.06 | |
Net investment loss | | | (1.26 | ) | | | (1.52 | ) | | | (1.49 | ) | | | (1.11 | ) | | | (1.54 | ) |
Portfolio turnover | | | 43 | | | | 37 | | | | 59 | | | | 58 | | | | 63 | |
Net assets at end of period (000 omitted) | | | $209 | | | | $347 | | | | $331 | | | | $287 | | | | $243 | |
See Notes to Financial Statements
24
Financial Highlights – continued
| | | | | | | | | | | | | | | | | | | | |
| Class 529C | | Years ended 8/31 | |
| | | 2016 | | | 2015 | | | 2014 | | | 2013 | | | 2012 | |
Net asset value, beginning of period | | | $12.03 | | | | $12.30 | | | | $10.20 | | | | $8.30 | | | | $7.63 | |
| Income (loss) from investment operations | | | | | | | | | | | | | | | | | |
Net investment loss (d) | | | $(0.15 | ) | | | $(0.19 | ) | | | $(0.17 | ) | | | $(0.10 | ) | | | $(0.12 | ) |
Net realized and unrealized gain (loss)
on investments and foreign currency | | | 0.74 | | | | 0.90 | | | | 2.27 | | | | 2.00 | | | | 0.79 | |
Total from investment operations | | | $0.59 | | | | $0.71 | | | | $2.10 | | | | $1.90 | | | | $0.67 | |
| Less distributions declared to shareholders | | | | | | | | | | | | | | | | | |
From net realized gain on investments | | | $(0.40 | ) | | | $(0.98 | ) | | | $— | | | | $— | | | | $— | |
Net asset value, end of period (x) | | | $12.22 | | | | $12.03 | | | | $12.30 | | | | $10.20 | | | | $8.30 | |
Total return (%) (r)(s)(t)(x) | | | 5.09 | | | | 6.45 | | | | 20.59 | | | | 22.89 | | | | 8.78 | |
Ratios (%) (to average net assets)
and Supplemental data: | | | | | | | | | | | | | | | | | |
Expenses before expense reductions (f) | | | 2.10 | | | | 2.10 | | | | 2.07 | | | | 2.09 | | | | 2.10 | |
Expenses after expense reductions (f) | | | 2.01 | | | | 2.01 | | | | 1.99 | | | | 2.03 | | | | 2.05 | |
Net investment loss | | | (1.27 | ) | | | (1.52 | ) | | | (1.49 | ) | | | (1.11 | ) | | | (1.54 | ) |
Portfolio turnover | | | 43 | | | | 37 | | | | 59 | | | | 58 | | | | 63 | |
Net assets at end of period (000 omitted) | | | $1,641 | | | | $1,391 | | | | $953 | | | | $582 | | | | $386 | |
| (d) | Per share data is based on average shares outstanding. |
| (f) | Ratios do not reflect reductions from fees paid indirectly, if applicable. |
| (i) | For the period from the class inception, January 2, 2013, through the stated period end. |
| (r) | Certain expenses have been reduced without which performance would have been lower. |
| (s) | From time to time the fund may receive proceeds from litigation settlements, without which performance would be lower. |
| (t) | Total returns do not include any applicable sales charges. |
| (w) | Per share amount was less than $0.01. |
| (x) | The net asset values and total returns have been calculated on net assets which include adjustments made in accordance with U.S. generally accepted accounting principles required at period end for financial reporting purposes. |
See Notes to Financial Statements
25
NOTES TO FINANCIAL STATEMENTS
(1) Business and Organization
MFS Mid Cap Growth Fund (the fund) is a diversified series of MFS Series Trust IV (the trust). The trust is organized as a Massachusetts business trust and is registered under the Investment Company Act of 1940, as amended, as an open-end management investment company.
The fund is an investment company and accordingly follows the investment company accounting and reporting guidance of the Financial Accounting Standards Board (FASB) Accounting Standards Codification Topic 946 Financial Services – Investment Companies.
(2) Significant Accounting Policies
General – The preparation of financial statements in conformity with U.S. generally accepted accounting principles requires management to make estimates and assumptions that affect the reported amounts of assets and liabilities, and disclosure of contingent assets and liabilities at the date of the financial statements and the reported amounts of increases and decreases in net assets from operations during the reporting period. Actual results could differ from those estimates. In the preparation of these financial statements, management has evaluated subsequent events occurring after the date of the fund’s Statement of Assets and Liabilities through the date that the financial statements were issued.
Balance Sheet Offsetting – The fund’s accounting policy with respect to balance sheet offsetting is that, absent an event of default by the counterparty or a termination of the agreement, the International Swaps and Derivatives Association (ISDA) Master Agreement does not result in an offset of reported amounts of financial assets and financial liabilities in the Statement of Assets and Liabilities across transactions between the fund and the applicable counterparty. The fund’s right to setoff may be restricted or prohibited by the bankruptcy or insolvency laws of the particular jurisdiction to which a specific master netting agreement counterparty is subject. Balance sheet offsetting disclosures, to the extent applicable to the fund, have been included in the fund’s Significant Accounting Policies note under the captions for each of the fund’s in-scope financial instruments and transactions.
Investment Valuations – Equity securities, including restricted equity securities, are generally valued at the last sale or official closing price on their primary market or exchange as provided by a third-party pricing service. Equity securities, for which there were no sales reported that day, are generally valued at the last quoted daily bid quotation on their primary market or exchange as provided by a third-party pricing service. Short-term instruments with a maturity at issuance of 60 days or less may be valued at amortized cost, which approximates market value. Open-end investment companies are generally valued at net asset value per share. Securities and other assets generally valued on the basis of information from a third-party pricing service may also be valued at a broker/dealer bid quotation. Values obtained from third-party pricing services can utilize both transaction data and market information such as yield, quality, coupon rate, maturity, type of issue, trading characteristics, and other market data. The
26
Notes to Financial Statements – continued
values of foreign securities and other assets and liabilities expressed in foreign currencies are converted to U.S. dollars using the mean of bid and asked prices for rates provided by a third-party pricing service.
The Board of Trustees has delegated primary responsibility for determining or causing to be determined the value of the fund’s investments (including any fair valuation) to the adviser pursuant to valuation policies and procedures approved by the Board. If the adviser determines that reliable market quotations are not readily available, investments are valued at fair value as determined in good faith by the adviser in accordance with such procedures under the oversight of the Board of Trustees. Under the fund’s valuation policies and procedures, market quotations are not considered to be readily available for most types of debt instruments and floating rate loans and many types of derivatives. These investments are generally valued at fair value based on information from third-party pricing services. In addition, investments may be valued at fair value if the adviser determines that an investment’s value has been materially affected by events occurring after the close of the exchange or market on which the investment is principally traded (such as foreign exchange or market) and prior to the determination of the fund’s net asset value, or after the halting of trading of a specific security where trading does not resume prior to the close of the exchange or market on which the security is principally traded. Events that occur on a frequent basis after foreign markets close (such as developments in foreign markets and significant movements in the U.S. markets) and prior to the determination of the fund’s net asset value may be deemed to have a material effect on the value of securities traded in foreign markets. Accordingly, the fund’s foreign equity securities may often be valued at fair value. The adviser generally relies on third-party pricing services or other information (such as the correlation with price movements of similar securities in the same or other markets; the type, cost and investment characteristics of the security; the business and financial condition of the issuer; and trading and other market data) to assist in determining whether to fair value and at what value to fair value an investment. The value of an investment for purposes of calculating the fund’s net asset value can differ depending on the source and method used to determine value. When fair valuation is used, the value of an investment used to determine the fund’s net asset value may differ from quoted or published prices for the same investment. There can be no assurance that the fund could obtain the fair value assigned to an investment if it were to sell the investment at the same time at which the fund determines its net asset value per share.
Various inputs are used in determining the value of the fund’s assets or liabilities. These inputs are categorized into three broad levels. In certain cases, the inputs used to measure fair value may fall into different levels of the fair value hierarchy. In such cases, an investment’s level within the fair value hierarchy is based on the lowest level of input that is significant to the fair value measurement. The fund’s assessment of the significance of a particular input to the fair value measurement in its entirety requires judgment, and considers factors specific to the investment. Level 1 includes unadjusted quoted prices in active markets for identical assets or liabilities. Level 2 includes other significant observable market-based inputs (including quoted prices for similar securities, interest rates, prepayment speed, and credit risk). Level 3 includes unobservable inputs, which may include the adviser’s own assumptions in determining
27
Notes to Financial Statements – continued
the fair value of investments. The following is a summary of the levels used as of August 31, 2016 in valuing the fund’s assets or liabilities:
| | | | | | | | | | | | | | | | |
| Investments at Value | | Level 1 | | | Level 2 | | | Level 3 | | | Total | |
| Equity Securities | | | $1,981,761,501 | | | | $— | | | | $— | | | | $1,981,761,501 | |
| Mutual Funds | | | 29,672,939 | | | | — | | | | — | | | | 29,672,939 | |
| Total Investments | | | $2,011,434,440 | | | | $— | | | | $— | | | | $2,011,434,440 | |
For further information regarding security characteristics, see the Portfolio of Investments.
Foreign Currency Translation – Purchases and sales of foreign investments, income, and expenses are converted into U.S. dollars based upon currency exchange rates prevailing on the respective dates of such transactions or on the reporting date for foreign denominated receivables and payables. Gains and losses attributable to foreign currency exchange rates on sales of securities are recorded for financial statement purposes as net realized gains and losses on investments. Gains and losses attributable to foreign exchange rate movements on receivables, payables, income and expenses are recorded for financial statement purposes as foreign currency transaction gains and losses. That portion of both realized and unrealized gains and losses on investments that results from fluctuations in foreign currency exchange rates is not separately disclosed.
Security Loans – Under its Securities Lending Agency Agreement with the fund, JPMorgan Chase and Co. (“Chase”), as lending agent, loans the securities of the fund to certain qualified institutions (the “Borrowers”) approved by the fund. Security loans can be terminated at the discretion of either the lending agent or the fund and the related securities must be returned within the earlier of the standard trade settlement period for such securities or within three business days. The loans are collateralized by cash and/or U.S. Treasury and federal agency obligations in an amount typically at least equal to the market value of the securities loaned. On loans collateralized by cash, the cash collateral is invested in a money market fund. The market value of the loaned securities is determined at the close of business of the fund and any additional required collateral is delivered to the fund on the next business day. Chase provides the fund with indemnification against Borrower default. In the event of Borrower default, Chase will, for the benefit of the fund, either purchase securities identical to those loaned or, when such purchase is commercially impracticable, pay the fund the market value of the loaned securities. In return, Chase assumes the fund’s rights to the related collateral. If the collateral value is less than the cost to purchase identical securities, Chase is responsible for the shortfall, but only to the extent that such shortfall is not due to a decline in collateral value resulting from collateral reinvestment for which the fund bears the risk of loss. At period end, the fund had investment securities on loan, all of which were classified as equity securities in the fund’s Portfolio of Investments, with a fair value of $935,390. The fair value of the fund’s investment securities on loan and a related liability of $934,500 for cash collateral received on securities loaned are both presented gross in the Statement of Assets and Liabilities. The value of the fund’s securities on loan net of the related collateral is $890 at period end. The liability for cash collateral for securities loaned is carried at fair value, which is categorized as level 2 within the fair value hierarchy. A portion of the income generated upon investment
28
Notes to Financial Statements – continued
of the collateral is remitted to the Borrowers, and the remainder is allocated between the fund and the lending agent. On loans collateralized by U.S. Treasury and/or federal agency obligations, a fee is received from the Borrower, and is allocated between the fund and the lending agent. Income from securities lending is included in “Interest” income in the Statement of Operations. The dividend and interest income earned on the securities loaned is accounted for in the same manner as other dividend and interest income.
Indemnifications – Under the fund’s organizational documents, its officers and Trustees may be indemnified against certain liabilities and expenses arising out of the performance of their duties to the fund. Additionally, in the normal course of business, the fund enters into agreements with service providers that may contain indemnification clauses. The fund’s maximum exposure under these agreements is unknown as this would involve future claims that may be made against the fund that have not yet occurred.
Investment Transactions and Income – Investment transactions are recorded on the trade date. Interest income is recorded on the accrual basis. Dividends received in cash are recorded on the ex-dividend date. Certain dividends from foreign securities will be recorded when the fund is informed of the dividend if such information is obtained subsequent to the ex-dividend date. Dividend payments received in additional securities are recorded on the ex-dividend date in an amount equal to the value of the security on such date.
The fund may receive proceeds from litigation settlements. Any proceeds received from litigation involving portfolio holdings are reflected in the Statement of Operations in realized gain/loss if the security has been disposed of by the fund or in unrealized gain/loss if the security is still held by the fund. Any other proceeds from litigation not related to portfolio holdings are reflected as other income in the Statement of Operations.
Fees Paid Indirectly – The fund’s custody fee may be reduced by a credit earned under an arrangement that measures the value of U.S. dollars deposited with the custodian by the fund. For the year ended August 31, 2016, custody fees were not reduced.
Tax Matters and Distributions – The fund intends to qualify as a regulated investment company, as defined under Subchapter M of the Internal Revenue Code, and to distribute all of its taxable income, including realized capital gains. As a result, no provision for federal income tax is required. The fund’s federal tax returns, when filed, will remain subject to examination by the Internal Revenue Service for a three year period. Management has analyzed the fund’s tax positions taken on federal and state tax returns for all open tax years and does not believe that there are any uncertain tax positions that require recognition of a tax liability. Foreign taxes, if any, have been accrued by the fund in the accompanying financial statements in accordance with the applicable foreign tax law. Foreign income taxes may be withheld by certain countries in which the fund invests. Additionally, capital gains realized by the fund on securities issued in or by certain foreign countries may be subject to capital gains tax imposed by those countries.
29
Notes to Financial Statements – continued
Distributions to shareholders are recorded on the ex-dividend date. Income and capital gain distributions are determined in accordance with income tax regulations, which may differ from U.S. generally accepted accounting principles. Certain capital accounts in the financial statements are periodically adjusted for permanent differences in order to reflect their tax character. These adjustments have no impact on net assets or net asset value per share. Temporary differences which arise from recognizing certain items of income, expense, gain or loss in different periods for financial statement and tax purposes will reverse at some time in the future. Distributions in excess of net investment income or net realized gains are temporary overdistributions for financial statement purposes resulting from differences in the recognition or classification of income or distributions for financial statement and tax purposes.
Book/tax differences primarily relate to net operating losses and treating a portion of the proceeds from redemptions as a distribution for tax purposes.
The tax character of distributions declared to shareholders for the last two fiscal years is as follows:
| | | | | | | | |
| | | 8/31/16 | | | 8/31/15 | |
| Long-term capital gains | | | $47,608,616 | | | | $108,646,048 | |
The federal tax cost and the tax basis components of distributable earnings were as follows:
| | | | |
| As of 8/31/16 | | | |
| Cost of investments | | | $1,548,533,871 | |
| Gross appreciation | | | 483,181,011 | |
| Gross depreciation | | | (20,280,442 | ) |
| Net unrealized appreciation (depreciation) | | | $462,900,569 | |
| Undistributed long-term capital gain | | | 56,103,847 | |
| Late year ordinary loss deferral | | | (1,826,651 | ) |
| Other temporary differences | | | (22,421 | ) |
Multiple Classes of Shares of Beneficial Interest – The fund offers multiple classes of shares, which differ in their respective distribution, service, and program manager fees. The fund’s income, realized and unrealized gain (loss), and common expenses are allocated to shareholders based on the daily net assets of each class. Dividends are declared separately for each class. Differences in per share dividend rates are generally due to differences in separate class expenses. Class B and Class 529B shares will convert to Class A and Class 529A shares, respectively, approximately eight years after
30
Notes to Financial Statements – continued
purchase. The fund’s distributions declared to shareholders as reported in the Statements of Changes in Net Assets are presented by class as follows:
| | | | | | | | |
| | | From net realized gain on
investments | |
| | | Year
ended
8/31/16 | | | Year
ended
8/31/15 | |
| Class A | | | $9,044,705 | | | | $17,348,544 | |
| Class B | | | 561,607 | | | | 1,325,645 | |
| Class C | | | 1,488,127 | | | | 2,954,517 | |
| Class I | | | 596,290 | | | | 975,545 | |
| Class R1 | | | 72,059 | | | | 168,201 | |
| Class R2 | | | 140,164 | | | | 290,055 | |
| Class R3 | | | 245,170 | | | | 268,398 | |
| Class R4 | | | 84,969 | | | | 30,085 | |
| Class R6 (formerly Class R5) | | | 35,224,535 | | | | 85,006,430 | |
| Class 529A | | | 99,277 | | | | 175,563 | |
| Class 529B | | | 4,661 | | | | 25,608 | |
| Class 529C | | | 47,052 | | | | 77,457 | |
| Total | | | $47,608,616 | | | | $108,646,048 | |
Effective August 26, 2016, Class R5 shares were renamed Class R6 shares.
(3) Transactions with Affiliates
Investment Adviser – The fund has an investment advisory agreement with MFS to provide overall investment management and related administrative services and facilities to the fund. The management fee is computed daily and paid monthly at the following annual rates:
| | | | |
| First $3 billion of average daily net assets | | | 0.75 | % |
| Average daily net assets in excess of $3 billion | | | 0.70 | % |
The investment adviser has agreed in writing to reduce its management fee to 0.70% of average daily net assets in excess of $1 billion to $2.5 billion, and 0.65% of average daily net assets in excess of $2.5 billion. This written agreement will terminate on December 28, 2016. For the year ended August 31, 2016, this management fee reduction amounted to $422,059, which is included in the reduction of total expenses in the Statement of Operations. MFS has also agreed in writing to reduce its management fee by a specified amount if certain MFS mutual fund assets exceed thresholds agreed to by MFS and the fund’s Board of Trustees. For the year ended August 31, 2016, this management fee reduction amounted to $131,988, which is included in the reduction of total expenses in the Statement of Operations. The management fee incurred for the year ended August 31, 2016 was equivalent to an annual effective rate of 0.72% of the fund’s average daily net assets.
Effective December 29, 2016, the management fee will be computed daily and paid monthly at the following annual rates:
| | | | |
| First $1 billion of average daily net assets | | | 0.75 | % |
| Next $1.5 billion of average daily net assets | | | 0.70 | % |
| Average daily net assets in excess of $2.5 billion | | | 0.65 | % |
31
Notes to Financial Statements – continued
The investment adviser has agreed in writing to pay a portion of the fund’s total annual operating expenses, excluding interest, taxes, extraordinary expenses, brokerage and transaction costs, and investment-related expenses, such that total fund operating expenses do not exceed the following rates annually of each class’s average daily net assets:
| | | | | | | | | | | | | | | | | | | | | | | | | | | | | | | | | | | | | | | | | | | | |
| Classes | |
| A | | B | | | C | | | I | | | R1 | | | R2 | | | R3 | | | R4 | | | R6 (formerly Class R5) | | | 529A | | | 529B | | | 529C | |
| 1.30% | | | 2.05% | | | | 2.05% | | | | 1.05% | | | | 2.05% | | | | 1.55% | | | | 1.30% | | | | 1.05% | | | | 0.95% | | | | 1.35% | | | | 2.10% | | | | 2.10% | |
This written agreement will continue until modified by the fund’s Board of Trustees, but such agreement will continue at least until December 31, 2017. For the year ended August 31, 2016, the fund’s actual operating expenses did not exceed the limit and therefore, the investment adviser did not pay any portion of the fund’s expenses related to this agreement.
Distributor – MFS Fund Distributors, Inc. (MFD), a wholly-owned subsidiary of MFS, as distributor, received $755,005 and $3,648 for the year ended August 31, 2016, as its portion of the initial sales charge on sales of Class A and Class 529A shares of the fund, respectively.
The Board of Trustees has adopted a distribution plan for certain share classes pursuant to Rule 12b-1 of the Investment Company Act of 1940.
The fund’s distribution plan provides that the fund will pay MFD for services provided by MFD and financial intermediaries in connection with the distribution and servicing of certain share classes. One component of the plan is a distribution fee paid to MFD and another component of the plan is a service fee paid to MFD. MFD may subsequently pay all, or a portion, of the distribution and/or service fees to financial intermediaries.
Distribution Plan Fee Table:
| | | | | | | | | | | | | | | | | | | | |
| | | Distribution Fee Rate (d) | | | Service Fee Rate (d) | | | Total Distribution Plan (d) | | | Annual Effective Rate (e) | | | Distribution and Service Fee | |
| Class A | | | — | | | | 0.25% | | | | 0.25% | | | | 0.25% | | | | $907,542 | |
| Class B | | | 0.75% | | | | 0.25% | | | | 1.00% | | | | 1.00% | | | | 174,835 | |
| Class C | | | 0.75% | | | | 0.25% | | | | 1.00% | | | | 1.00% | | | | 470,697 | |
| Class R1 | | | 0.75% | | | | 0.25% | | | | 1.00% | | | | 1.00% | | | | 21,024 | |
| Class R2 | | | 0.25% | | | | 0.25% | | | | 0.50% | | | | 0.50% | | | | 25,086 | |
| Class R3 | | | — | | | | 0.25% | | | | 0.25% | | | | 0.25% | | | | 29,600 | |
| Class 529A | | | — | | | | 0.25% | | | | 0.25% | | | | 0.20% | | | | 8,928 | |
| Class 529B | | | 0.75% | | | | 0.25% | | | | 1.00% | | | | 1.00% | | | | 1,727 | |
| Class 529C | | | 0.75% | | | | 0.25% | | | | 1.00% | | | | 0.99% | | | | 15,164 | |
| Total Distribution and Service Fees | | | | $1,654,603 | |
| (d) | In accordance with the distribution plan for certain classes, the fund pays distribution and/or service fees equal to these annual percentage rates of each class’s average daily net assets. The distribution and service fee rates disclosed by class represent the current rates in effect at the end of the reporting period. Any rate changes, if applicable, are detailed below. |
| (e) | The annual effective rates represent actual fees incurred under the distribution plan for the year ended August 31, 2016 based on each class’s average daily net assets. MFD has |
32
Notes to Financial Statements – continued
| | voluntarily agreed to rebate a portion of each class’s 0.25% service fee attributable to accounts for which MFD retains the 0.25% service fee except for accounts attributable to MFS or its affiliates’ seed money. For the year ended August 31, 2016, this rebate amounted to $10,971, $186, $1,389, $1,723, and $162 for Class A, Class B, Class C, Class 529A, and Class 529C, respectively, and is included in the reduction of total expenses in the Statement of Operations. |
Certain Class A shares are subject to a contingent deferred sales charge (CDSC) in the event of a shareholder redemption within 18 months of purchase. Class C and Class 529C shares are subject to a CDSC in the event of a shareholder redemption within 12 months of purchase. Class B and Class 529B shares are subject to a CDSC in the event of a shareholder redemption within six years of purchase. All contingent deferred sales charges are paid to MFD and during the year ended August 31, 2016, were as follows:
| | | | |
| | | Amount | |
| Class A | | | $2,501 | |
| Class B | | | 18,982 | |
| Class C | | | 4,093 | |
| Class 529B | | | — | |
| Class 529C | | | 3 | |
The fund has entered into and may from time to time enter into contracts with program managers and other parties which administer the tuition programs through which an investment in the fund’s 529 share classes is made. The fund has entered into an agreement with MFD pursuant to which MFD receives an annual fee of up to 0.10% of the average daily net assets attributable to each 529 share class. MFD has agreed to waive a portion of this fee in an amount equal to 0.05% of the average daily net assets for each 529 share class. This waiver agreement will expire on December 31, 2017, unless MFD elects to extend the waiver. For the year ended August 31, 2016, this waiver amounted to $2,631 and is included in the reduction of total expenses in the Statement of Operations. The program manager fee incurred for the year ended August 31, 2016 was equivalent to an annual effective rate of 0.05% of the average daily net assets attributable to each 529 share class. The services provided by MFD, or a third party with which MFD contracts, include recordkeeping and tax reporting and account services, as well as services designed to maintain the program’s compliance with the Internal Revenue Code and other regulatory requirements. Program manager fees and waivers for the year ended August 31, 2016, were as follows:
| | | | | | | | |
| | | Fee | | | Waiver | |
| Class 529A | | | $3,571 | | | | $1,785 | |
| Class 529B | | | 173 | | | | 87 | |
| Class 529C | | | 1,518 | | | | 759 | |
| Total Program Manager Fees and Waivers | | | $5,262 | | | | $2,631 | |
Shareholder Servicing Agent – MFS Service Center, Inc. (MFSC), a wholly-owned subsidiary of MFS, receives a fee from the fund for its services as shareholder servicing agent calculated as a percentage of the average daily net assets of the fund as determined periodically under the supervision of the fund’s Board of Trustees. For the year ended August 31, 2016, the fee was $258,512, which equated to 0.0140% annually of the fund’s average daily net assets. MFSC also receives payment from the fund for out-of-pocket expenses, sub-accounting and other shareholder servicing costs
33
Notes to Financial Statements – continued
which may be paid to affiliated and unaffiliated service providers. Class R6 shares do not incur sub-accounting fees. For the year ended August 31, 2016, these out-of-pocket expenses, sub-accounting and other shareholder servicing costs amounted to $728,042.
Under a Special Servicing Agreement among MFS, certain MFS funds which invest in other MFS funds (“MFS fund-of-funds”) and certain underlying funds in which a MFS fund-of-funds invests (“underlying funds”), each underlying fund may pay a portion of each MFS fund-of-funds’ transfer agent-related expenses, including sub-accounting fees payable to financial intermediaries, to the extent such payments do not exceed the benefits realized or expected to be realized by the underlying fund from the investment in the underlying fund by the MFS fund-of-funds. For the year ended August 31, 2016, these costs for the fund amounted to $1,459,825 and are included in “Shareholder servicing costs” in the Statement of Operations.
Administrator – MFS provides certain financial, legal, shareholder communications, compliance, and other administrative services to the fund. Under an administrative services agreement, the fund reimburses MFS the costs incurred to provide these services. The fund is charged an annual fixed amount of $17,500 plus a fee based on average daily net assets. The administrative services fee incurred for the year ended August 31, 2016 was equivalent to an annual effective rate of 0.0162% of the fund’s average daily net assets.
Trustees’ and Officers’ Compensation – The fund pays compensation to independent Trustees in the form of a retainer, attendance fees, and additional compensation to Board and Committee chairpersons. The fund does not pay compensation directly to Trustees or officers of the fund who are also officers of the investment adviser, all of whom receive remuneration for their services to the fund from MFS. Certain officers and Trustees of the fund are officers or directors of MFS, MFD, and MFSC.
Prior to December 31, 2001, the fund had an unfunded defined benefit plan (“DB plan”) for independent Trustees. As of December 31, 2001, the Board took action to terminate the DB plan with respect to then-current and any future independent Trustees, such that the DB plan covers only certain of those former independent Trustees who retired on or before December 31, 2001. Effective January 1, 2002, accrued benefits under the DB plan for then-current independent Trustees who continued were credited to an unfunded retirement deferral plan (the “Retirement Deferral plan”), which was established for and exists solely with respect to these credited amounts, and is not available for other deferrals by these or other independent Trustees. Although the Retirement Deferral plan is unfunded, amounts deferred under the plan are periodically adjusted for investment experience as if they had been invested in shares of the fund. The DB plan resulted in a pension expense of $876 and the Retirement Deferral plan resulted in a net decrease in expense of $803. Both amounts are included in “Independent Trustees’ compensation” in the Statement of Operations for the year ended August 31, 2016. The liability for deferred retirement benefits payable to certain independent Trustees under both plans amounted to $25,393 at August 31, 2016, and is included in “Payable for independent Trustees’ compensation” in the Statement of Assets and Liabilities.
34
Notes to Financial Statements – continued
Other – This fund and certain other funds managed by MFS (the funds) have entered into a service agreement (the ISO Agreement) which provides for payment of fees solely by the funds to Tarantino LLC in return for the provision of services of an Independent Senior Officer (ISO) for the funds. Frank L. Tarantino serves as the ISO and is an officer of the funds and the sole member of Tarantino LLC. The funds can terminate the ISO Agreement with Tarantino LLC at any time under the terms of the ISO Agreement. For the year ended August 31, 2016, the fee paid by the fund under this agreement was $4,750 and is included in “Miscellaneous” expense in the Statement of Operations. MFS has agreed to bear all expenses associated with office space, other administrative support, and supplies provided to the ISO.
The fund invests in the MFS Institutional Money Market Portfolio which is managed by MFS and seeks current income consistent with preservation of capital and liquidity. Income earned on this investment is included in “Dividends from underlying affiliated funds” in the Statement of Operations. This money market fund does not pay a management fee to MFS.
On September 9, 2015, MFS redeemed 22,478 shares of Class R4 for an aggregate amount of $327,729. On September 9, 2015, MFS redeemed 17,204 shares of Class 529B for an aggregate amount of $210,233. On March 16, 2016, MFS redeemed 6,243 shares of Class I for an aggregate amount of $87,842.
The fund is permitted to engage in purchase and sale transactions (“cross-trades”) with funds and accounts for which MFS serves as investment adviser or sub-adviser pursuant to a policy adopted by the Board of Trustees. This policy has been designed to ensure that cross-trades conducted by the fund comply with Rule 17a-7 under the Investment Company Act of 1940. Under this policy, cross-trades are effected at current market prices with no remuneration paid in connection with the transaction. During the year ended August 31, 2016, the fund engaged in purchase and sale transactions pursuant to this policy, which amounted to $1,346,443 and $28,822,376, respectively. The sales transactions resulted in net realized gains (losses) of $1,808,878.
(4) Portfolio Securities
For the year ended August 31, 2016, purchases and sales of investments, other than short-term obligations, aggregated $924,849,066 and $770,885,453, respectively.
35
Notes to Financial Statements – continued
(5) Shares of Beneficial Interest
The fund’s Declaration of Trust permits the Trustees to issue an unlimited number of full and fractional shares of beneficial interest. Transactions in fund shares were as follows:
| | | | | | | | | | | | | | | | |
| | | Year ended
8/31/16 | | | Year ended
8/31/15 | |
| | | Shares | | | Amount | | | Shares | | | Amount | |
| Shares sold | | | | | | | | | | | | | | | | |
Class A | | | 14,853,451 | | | | $206,498,577 | | | | 5,360,759 | | | | $77,557,015 | |
Class B | | | 364,706 | | | | 4,402,594 | | | | 294,648 | | | | 3,738,951 | |
Class C | | | 1,333,736 | | | | 15,766,496 | | | | 640,200 | | | | 7,989,248 | |
Class I | | | 7,638,191 | | | | 112,665,923 | | | | 1,036,427 | | | | 15,648,688 | |
Class R1 | | | 25,535 | | | | 300,467 | | | | 27,280 | | | | 346,518 | |
Class R2 | | | 157,369 | | | | 2,106,979 | | | | 89,096 | | | | 1,247,611 | |
Class R3 | | | 790,051 | | | | 10,695,937 | | | | 458,378 | | | | 6,619,370 | |
Class R4 | | | 968,483 | | | | 13,900,218 | | | | 138,264 | | | | 1,990,271 | |
Class R6 (formerly Class R5) | | | 6,428,833 | | | | 92,590,122 | | | | 2,538,882 | | | | 37,060,078 | |
Class 529A | | | 76,769 | | | | 1,041,389 | | | | 56,910 | | | | 796,014 | |
Class 529B | | | 6,948 | | | | 82,853 | | | | 1,604 | | | | 19,970 | |
Class 529C | | | 36,484 | | | | 419,517 | | | | 38,503 | | | | 449,773 | |
| | | 32,680,556 | | | | $460,471,072 | | | | 10,680,951 | | | | $153,463,507 | |
| | | | |
| Shares issued to shareholders in reinvestment of distributions | | | | | | | | | | | | | | | | |
Class A | | | 634,468 | | | | $8,793,726 | | | | 1,271,157 | | | | $16,753,855 | |
Class B | | | 45,606 | | | | 549,100 | | | | 111,752 | | | | 1,294,085 | |
Class C | | | 120,005 | | | | 1,407,653 | | | | 245,102 | | | | 2,769,650 | |
Class I | | | 36,954 | | | | 534,731 | | | | 63,822 | | | | 875,004 | |
Class R1 | | | 6,010 | | | | 72,059 | | | | 14,588 | | | | 168,201 | |
Class R2 | | | 8,550 | | | | 113,455 | | | | 21,396 | | | | 270,871 | |
Class R3 | | | 17,779 | | | | 245,170 | | | | 20,473 | | | | 268,398 | |
Class R4 | | | 5,237 | | | | 74,314 | | | | 2,237 | | | | 30,085 | |
Class R6 (formerly Class R5) | | | 2,407,635 | | | | 34,934,781 | | | | 6,191,291 | | | | 85,006,430 | |
Class 529A | | | 7,343 | | | | 99,277 | | | | 13,652 | | | | 175,563 | |
Class 529B | | | 395 | | | | 4,661 | | | | 2,254 | | | | 25,608 | |
Class 529C | | | 4,091 | | | | 47,052 | | | | 6,991 | | | | 77,457 | |
| | | 3,294,073 | | | | $46,875,979 | | | | 7,964,715 | | | | $107,715,207 | |
36
Notes to Financial Statements – continued
| | | | | | | | | | | | | | | | |
| | | Year ended
8/31/16 | | | Year ended
8/31/15 | |
| | | Shares | | | Amount | | | Shares | | | Amount | |
| Shares reacquired | | | | | | | | | | | | | | | | |
Class A | | | (5,304,919 | ) | | | $(73,360,356 | ) | | | (3,839,284 | ) | | | $(55,426,012 | ) |
Class B | | | (390,234 | ) | | | (4,725,171 | ) | | | (432,057 | ) | | | (5,466,613 | ) |
Class C | | | (624,920 | ) | | | (7,308,162 | ) | | | (459,422 | ) | | | (5,676,326 | ) |
Class I | | | (2,321,173 | ) | | | (34,337,106 | ) | | | (210,263 | ) | | | (3,130,916 | ) |
Class R1 | | | (52,735 | ) | | | (634,518 | ) | | | (34,654 | ) | | | (434,411 | ) |
Class R2 | | | (99,865 | ) | | | (1,349,351 | ) | | | (99,370 | ) | | | (1,363,585 | ) |
Class R3 | | | (390,797 | ) | | | (5,583,110 | ) | | | (146,102 | ) | | | (2,075,737 | ) |
Class R4 | | | (217,876 | ) | | | (3,113,021 | ) | | | (11,458 | ) | | | (170,854 | ) |
Class R6 (formerly Class R5) | | | (11,726,039 | ) | | | (180,191,104 | ) | | | (9,299,443 | ) | | | (140,824,312 | ) |
Class 529A | | | (39,809 | ) | | | (542,336 | ) | | | (18,484 | ) | | | (253,844 | ) |
Class 529B | | | (18,801 | ) | | | (229,536 | ) | | | (1,977 | ) | | | (24,566 | ) |
Class 529C | | | (21,860 | ) | | | (259,643 | ) | | | (7,370 | ) | | | (90,001 | ) |
| | | (21,209,028 | ) | | | $(311,633,414 | ) | | | (14,559,884 | ) | | | $(214,937,177 | ) |
| | | | |
| Net change | | | | | | | | | | | | | | | | |
Class A | | | 10,183,000 | | | | $141,931,947 | | | | 2,792,632 | | | | $38,884,858 | |
Class B | | | 20,078 | | | | 226,523 | | | | (25,657 | ) | | | (433,577 | ) |
Class C | | | 828,821 | | | | 9,865,987 | | | | 425,880 | | | | 5,082,572 | |
Class I | | | 5,353,972 | | | | 78,863,548 | | | | 889,986 | | | | 13,392,776 | |
Class R1 | | | (21,190 | ) | | | (261,992 | ) | | | 7,214 | | | | 80,308 | |
Class R2 | | | 66,054 | | | | 871,083 | | | | 11,122 | | | | 154,897 | |
Class R3 | | | 417,033 | | | | 5,357,997 | | | | 332,749 | | | | 4,812,031 | |
Class R4 | | | 755,844 | | | | 10,861,511 | | | | 129,043 | | | | 1,849,502 | |
Class R6 (formerly Class R5) | | | (2,889,571 | ) | | | (52,666,201 | ) | | | (569,270 | ) | | | (18,757,804 | ) |
Class 529A | | | 44,303 | | | | 598,330 | | | | 52,078 | | | | 717,733 | |
Class 529B | | | (11,458 | ) | | | (142,022 | ) | | | 1,881 | | | | 21,012 | |
Class 529C | | | 18,715 | | | | 206,926 | | | | 38,124 | | | | 437,229 | |
| | | 14,765,601 | | | | $195,713,637 | | | | 4,085,782 | | | | $46,241,537 | |
Effective August 26, 2016, Class R5 shares were renamed Class R6 shares.
The fund is one of several mutual funds in which certain MFS funds may invest. The MFS funds do not invest in the underlying funds for the purpose of exercising management or control. At the end of the period, the MFS Growth Allocation Fund, the MFS Moderate Allocation Fund, the MFS Aggressive Growth Allocation Fund, the MFS Conservative Allocation Fund, and the MFS Lifetime 2030 Fund were the owners of record of approximately 24%, 22%, 8%, 6%, and 1%, respectively, of the value of outstanding voting shares of the fund. In addition, the MFS Lifetime Income Fund, the MFS Lifetime 2020 Fund, the MFS Lifetime 2025 Fund, the MFS Lifetime 2035 Fund, the MFS Lifetime 2040 Fund, the MFS Lifetime 2045 Fund, the MFS Lifetime 2050 Fund, and the MFS Lifetime 2055 Fund were each the owners of record of less than 1% of the value of outstanding voting shares of the fund.
37
Notes to Financial Statements – continued
(6) Line of Credit
The fund and certain other funds managed by MFS participate in a $1.25 billion unsecured committed line of credit, subject to a $1 billion sublimit, provided by a syndication of banks under a credit agreement. Borrowings may be made for temporary financing needs. Interest is charged to each fund, based on its borrowings, generally at a rate equal to the higher of the Overnight Federal Reserve funds rate or daily one month LIBOR plus an agreed upon spread. A commitment fee, based on the average daily, unused portion of the committed line of credit, is allocated among the participating funds at the end of each calendar quarter. In addition, the fund and other funds managed by MFS have established unsecured uncommitted borrowing arrangements with certain banks for temporary financing needs. Interest is charged to each fund, based on its borrowings, at a rate equal to the Overnight Federal Reserve funds rate plus an agreed upon spread. For the year ended August 31, 2016, the fund’s commitment fee and interest expense were $8,350 and $0, respectively, and are included in “Miscellaneous” expense in the Statement of Operations.
(7) Transactions in Underlying Affiliated Funds-Affiliated Issuers
An affiliated issuer may be considered one in which the fund owns 5% or more of the outstanding voting securities, or a company which is under common control. For the purposes of this report, the fund assumes the following to be an affiliated issuer:
| | | | | | | | | | | | | | | | |
| Underlying Affiliated Fund | | Beginning Shares/Par Amount | | | Acquisitions Shares/Par Amount | | | Dispositions Shares/Par Amount | | | Ending Shares/Par Amount | |
MFS Institutional Money
Market Portfolio | | | 36,935,839 | | | | 394,654,187 | | | | (402,851,587 | ) | | | 28,738,439 | |
| | | | |
| Underlying Affiliated Fund | | Realized Gain (Loss) | | | Capital Gain Distributions | | | Dividend Income | | | Ending Value | |
MFS Institutional Money
Market Portfolio | | | $— | | | | $— | | | | $136,428 | | | | $28,738,439 | |
38
REPORT OF INDEPENDENT REGISTERED PUBLIC ACCOUNTING FIRM
To the Board of Trustees of MFS Series Trust IV and the Shareholders of MFS Mid Cap Growth Fund:
We have audited the accompanying statement of assets and liabilities, including the portfolio of investments, of MFS Mid Cap Growth Fund (one of the series of MFS Series Trust IV) (the “Fund”) as of August 31, 2016, and the related statement of operations for the year then ended, the statements of changes in net assets for each of the two years in the period then ended, and the financial highlights for each of the five years in the period then ended. These financial statements and financial highlights are the responsibility of the Fund’s management. Our responsibility is to express an opinion on these financial statements and financial highlights based on our audits.
We conducted our audits in accordance with the standards of the Public Company Accounting Oversight Board (United States). Those standards require that we plan and perform the audit to obtain reasonable assurance about whether the financial statements and financial highlights are free of material misstatement. The Fund is not required to have, nor were we engaged to perform, an audit of its internal control over financial reporting. Our audits included consideration of internal control over financial reporting as a basis for designing audit procedures that are appropriate in the circumstances, but not for the purpose of expressing an opinion on the effectiveness of the Fund’s internal control over financial reporting. Accordingly, we express no such opinion. An audit also includes examining, on a test basis, evidence supporting the amounts and disclosures in the financial statements, assessing the accounting principles used and significant estimates made by management, as well as evaluating the overall financial statement presentation. Our procedures included confirmation of securities owned as of August 31, 2016, by correspondence with the custodian and brokers; when replies were not received from brokers, we performed other auditing procedures. We believe that our audits provide a reasonable basis for our opinion.
In our opinion, such financial statements and financial highlights referred to above present fairly, in all material respects, the financial position of MFS Mid Cap Growth Fund as of August 31, 2016, the results of its operations for the year then ended, the changes in its net assets for each of the two years in the period then ended, and the financial highlights for each of the five years in the period then ended, in conformity with accounting principles generally accepted in the United States of America.
DELOITTE & TOUCHE LLP
Boston, Massachusetts
October 17, 2016
39
TRUSTEES AND OFFICERS — IDENTIFICATION AND BACKGROUND
The Trustees and Officers of the Trust, as of October 1, 2016, are listed below, together with their principal occupations during the past five years. (Their titles may have varied during that period.) The address of each Trustee and Officer is 111 Huntington Avenue, Boston, Massachusetts 02199-7618.
| | | | | | | | |
Name, Age | | Position(s) Held
with Fund | | Trustee/Officer
Since (h) | | Principal
Occupations During
the Past Five Years | | Other
Directorships (j) |
| INTERESTED TRUSTEES |
Robert J. Manning (k)
(age 52) | | Trustee | | February 2004 | | Massachusetts Financial Services Company, Chairman, Co-Chief Executive Officer and Director | | N/A |
Robin A. Stelmach (k)
(age 55) | | Trustee and
President | | January 2014 | | Massachusetts Financial Services Company, Executive Vice President and Chief Operating Officer | | N/A |
| INDEPENDENT TRUSTEES |
David H. Gunning
(age 74) | | Trustee and Chair of Trustees | | January 2004 | | Private investor | | Lincoln Electric Holdings, Inc., Director; Development Alternatives, Inc., Director/Non-Executive Chairman |
Steven E. Buller
(age 65) | | Trustee | | February 2014 | | Chairman, Financial Accounting Standards Advisory Council (until 2015); Standing Advisory Group, Public Company Accounting Oversight Board, Member (until 2014); BlackRock, Inc. (investment management), Managing Director (until 2014), BlackRock Finco UK (investment management), Director (until 2014) | | N/A |
Robert E. Butler
(age 74) | | Trustee | | January 2006 | | Consultant – investment company industry regulatory and compliance matters | | N/A |
40
Trustees and Officers – continued
| | | | | | | | |
Name, Age | | Position(s) Held
with Fund | | Trustee/Officer
Since (h) | | Principal
Occupations During
the Past Five Years | | Other
Directorships (j) |
Maureen R. Goldfarb
(age 61) | | Trustee | | January 2009 | | Private investor | | N/A |
William R. Gutow
(age 75) | | Trustee | | December 1993 | | Private investor and real estate consultant; Capitol Entertainment Management Company (video franchise), Vice Chairman (until 2014) | | Texas Donuts, Vice Chairman (until 2010) |
Michael Hegarty
(age 71) | | Trustee | | December 2004 | | Private investor | | Rouse Properties Inc., Director; Capmark Financial Group Inc., Director (until 2015) |
John P. Kavanaugh
(age 61) | | Trustee | | January 2009 | | Private investor | | N/A |
Maryanne L. Roepke
(age 60) | | Trustee | | May 2014 | | American Century Investments (investment management), Senior Vice President and Chief Compliance Officer (until 2014) | | N/A |
Laurie J. Thomsen
(age 59) | | Trustee | | March 2005 | | Private investor | | The Travelers Companies, Director; Dycom Industries, Inc., Director |
Robert W. Uek
(age 75) | | Trustee | | January 2006 | | Consultant to investment company industry | | N/A |
| OFFICERS |
Christopher R. Bohane (k)
(age 42) | | Assistant
Secretary and Assistant Clerk | | July 2005 | | Massachusetts Financial Services Company, Vice President and Assistant General Counsel | | N/A |
Kino Clark (k)
(age 48) | | Assistant
Treasurer | | January 2012 | | Massachusetts Financial Services Company, Vice President | | N/A |
Kristin V. Collins (k)
(age 43) | | Assistant
Secretary and Assistant Clerk | | September 2015 | | Massachusetts Financial Services Company, Vice President and Assistant General Counsel | | N/A |
41
Trustees and Officers – continued
| | | | | | | | |
Name, Age | | Position(s) Held
with Fund | | Trustee/Officer
Since (h) | | Principal
Occupations During
the Past Five Years | | Other
Directorships (j) |
Thomas H. Connors (k)
(age 57) | | Assistant
Secretary and Assistant Clerk | | September 2012 | | Massachusetts Financial Services Company, Vice President and Senior Counsel; Deutsche Investment Management Americas Inc. (financial service provider), Director and Senior Counsel (until 2012) | | N/A |
Ethan D. Corey (k)
(age 52) | | Assistant
Secretary and Assistant Clerk | | July 2005 | | Massachusetts Financial Services Company, Senior Vice President and Associate General Counsel | | N/A |
David L. DiLorenzo (k)
(age 48) | | Treasurer | | July 2005 | | Massachusetts Financial Services Company, Senior Vice President | | N/A |
Brian E. Langenfeld (k)
(age 43) | | Assistant
Secretary and Assistant Clerk | | June 2006 | | Massachusetts Financial Services Company, Vice President and Senior Counsel | | N/A |
Susan A. Pereira (k)
(age 45) | | Assistant Secretary and Assistant Clerk | | July 2005 | | Massachusetts Financial Services Company, Vice President and Senior Counsel | | N/A |
Kasey L. Phillips (k)
(age 45) | | Assistant
Treasurer | | September 2012 | | Massachusetts Financial Services Company, Vice President; Wells Fargo Funds Management, LLC, Senior Vice President, Fund Treasurer (until 2012) | | N/A |
42
Trustees and Officers – continued
| | | | | | | | |
Name, Age | | Position(s) Held
with Fund | | Trustee/Officer
Since (h) | | Principal
Occupations During
the Past Five Years | | Other
Directorships (j) |
Mark N. Polebaum (k)
(age 64) | | Secretary and
Clerk | | January 2006 | | Massachusetts Financial Services Company, Executive Vice President, General Counsel and Secretary | | N/A |
Matthew A. Stowe (k)
(age 41) | | Assistant
Secretary and Assistant Clerk | | October 2014 | | Massachusetts Financial Services Company, Vice President and Assistant General Counsel | | N/A |
Frank L. Tarantino
(age 72) | | Independent
Senior Officer | | June 2004 | | Tarantino LLC (provider of compliance services), Principal | | N/A |
Richard S. Weitzel (k)
(age 46) | | Assistant
Secretary and Assistant Clerk | | October 2007 | | Massachusetts Financial Services Company, Senior Vice President and Associate General Counsel | | N/A |
Martin J. Wolin (k)
(age 49) | | Chief Compliance Officer | | July 2015 | | Massachusetts Financial Services Company, Senior Vice President and Chief Compliance Officer (since July 2015); Mercer (financial service provider), Chief Risk and Compliance Officer, North America and Latin America (until June 2015) | | N/A |
James O. Yost (k)
(age 56) | | Deputy Treasurer | | September 1990 | | Massachusetts Financial Services Company, Senior Vice President | | N/A |
| (h) | Date first appointed to serve as Trustee/officer of an MFS Fund. Each Trustee has served continuously since appointment unless indicated otherwise. For the period from December 15, 2004 until February 22, 2005, Mr. Manning served as Advisory Trustee. Prior to January 2012, Messrs. DiLorenzo and Yost served as Assistant Treasurers of the Funds. Ms. Stelmach was appointed as President of the Funds as of October 1, 2014. |
| (j) | Directorships or trusteeships of companies required to report to the Securities and Exchange Commission (i.e., “public companies”). |
(k) “Interested person” of the Trust within the meaning of the Investment Company Act of 1940 (referred to as the 1940 Act), which is the principal federal law governing investment companies like the fund, as a result of a position with MFS. The address of MFS is 111 Huntington Avenue, Boston, Massachusetts 02199-7618.
43
Trustees and Officers – continued
Each Trustee (except Ms. Stelmach, Mr. Buller and Ms. Roepke) has been elected by shareholders and each Trustee and officer holds office until his or her successor is chosen and qualified or until his or her earlier death, resignation, retirement or removal. The Trust does not hold annual meetings for the purpose of electing Trustees, and Trustees are not elected for fixed terms. Messrs. Buller, Butler, Kavanaugh, Uek and Ms. Roepke are members of the Trust’s Audit Committee.
Each of the Fund’s Trustees and officers holds comparable positions with certain other funds of which MFS or a subsidiary is the investment adviser or distributor, and, in the case of the officers, with certain affiliates of MFS. As of October 1, 2016, the Trustees served as board members of 137 funds within the MFS Family of Funds.
The Statement of Additional Information for a Fund includes further information about the Trustees and is available without charge upon request by calling 1-800-225-2606.
| | |
| Investment Adviser | | Custodian |
Massachusetts Financial Services Company
111 Huntington Avenue
Boston, MA 02199-7618 | | JPMorgan Chase Bank, NA 4 Metrotech Center New York, NY 11245 |
| Distributor | | Independent Registered Public Accounting Firm |
MFS Fund Distributors, Inc.
111 Huntington Avenue
Boston, MA 02199-7618 | | Deloitte & Touche LLP 200 Berkeley Street Boston, MA 02116 |
| Portfolio Managers | | |
Eric Fishman Paul Gordon Matthew Sabel | | |
44
BOARD REVIEW OF INVESTMENT ADVISORY AGREEMENT
The Investment Company Act of 1940 requires that both the full Board of Trustees and a majority of the non-interested (“independent”) Trustees, voting separately, annually approve the continuation of the Fund’s investment advisory agreement with MFS. The Trustees consider matters bearing on the Fund and its advisory arrangements at their meetings throughout the year, including a review of performance data at each regular meeting. In addition, the independent Trustees met several times over the course of three months beginning in May and ending in July, 2016 (“contract review meetings”) for the specific purpose of considering whether to approve the continuation of the investment advisory agreement for the Fund and the other investment companies that the Board oversees (the “MFS Funds”). The independent Trustees were assisted in their evaluation of the Fund’s investment advisory agreement by independent legal counsel, from whom they received separate legal advice and with whom they met separately from MFS during various contract review meetings. The independent Trustees were also assisted in this process by the MFS Funds’ Independent Senior Officer, a senior officer appointed by and reporting to the independent Trustees.
In connection with their deliberations regarding the continuation of the investment advisory agreement, the Trustees, including the independent Trustees, considered such information and factors as they believed, in light of the legal advice furnished to them and their own business judgment, to be relevant. The investment advisory agreement for the Fund was considered separately, although the Trustees also took into account the common interests of all MFS Funds in their review. As described below, the Trustees considered the nature, quality, and extent of the various investment advisory, administrative, and shareholder services performed by MFS under the existing investment advisory agreement and other arrangements with the Fund.
In connection with their contract review meetings, the Trustees received and relied upon materials that included, among other items: (i) information provided by Broadridge Financial Solutions, Inc. (“Broadridge”), an independent third party, on the investment performance of the Fund for various time periods ended December 31, 2015 and the investment performance of a group of funds with substantially similar investment classifications/objectives (the “Lipper performance universe”), (ii) information provided by Broadridge on the Fund’s advisory fees and other expenses and the advisory fees and other expenses of comparable funds identified by Broadridge (the “Broadridge expense group”), (iii) information provided by MFS on the advisory fees of portfolios of other clients of MFS, including institutional separate accounts and other clients, (iv) information as to whether and to what extent applicable expense waivers, reimbursements or fee “breakpoints” are observed for the Fund, (v) information regarding MFS’ financial results and financial condition, including MFS’ and certain of its affiliates’ estimated profitability from services performed for the Fund and the MFS Funds as a whole, and compared to MFS’ institutional business, (vi) MFS’ views regarding the outlook for the mutual fund industry and the strategic business plans of MFS, (vii) descriptions of various functions performed by MFS for the Funds, such as compliance monitoring and portfolio trading practices, and (viii) information regarding the overall organization of MFS, including information about MFS’ senior management and other personnel providing investment advisory, administrative and
45
Board Review of Investment Advisory Agreement – continued
other services to the Fund and the other MFS Funds. The comparative performance, fee and expense information prepared and provided by Broadridge was not independently verified and the independent Trustees did not independently verify any information provided to them by MFS.
The Trustees’ conclusion as to the continuation of the investment advisory agreement was based on a comprehensive consideration of all information provided to the Trustees and not the result of any single factor. Some of the factors that figured particularly in the Trustees’ deliberations are described below, although individual Trustees may have evaluated the information presented differently from one another, giving different weights to various factors. It is also important to recognize that the fee arrangements for the Fund and other MFS Funds are the result of years of review and discussion between the independent Trustees and MFS, that certain aspects of such arrangements may receive greater scrutiny in some years than in others, and that the Trustees’ conclusions may be based, in part, on their consideration of these same arrangements during the course of the year and in prior years.
Based on information provided by Broadridge and MFS, the Trustees reviewed the Fund’s total return investment performance as well as the performance of peer groups of funds over various time periods. The Trustees placed particular emphasis on the total return performance of the Fund’s Class A shares in comparison to the performance of funds in its Lipper performance universe over the three-year period ended December 31, 2015, which the Trustees believed was a long enough period to reflect differing market conditions. The total return performance of the Fund’s Class A shares was in the 1st quintile relative to the other funds in the universe for this three-year period (the 1st quintile being the best performers and the 5th quintile being the worst performers). The total return performance of the Fund’s Class A shares was in the 1st quintile for each of the one-year period and the 2nd quintile five-year period ended December 31, 2015 relative to the Lipper performance universe. Because of the passage of time, these performance results may differ from the performance results for more recent periods, including those shown elsewhere in this report.
In the course of their deliberations, the Trustees took into account information provided by MFS in connection with the contract review meetings, as well as during investment review meetings conducted with portfolio management personnel during the course of the year regarding the Fund’s performance. After reviewing these and related factors, the Trustees concluded, within the context of their overall conclusions regarding the investment advisory agreement, that they were satisfied with MFS’ responses and efforts relating to investment performance.
In assessing the reasonableness of the Fund’s advisory fee, the Trustees considered, among other information, the Fund’s advisory fee and the total expense ratio of the Fund’s Class A shares as a percentage of average daily net assets and the advisory fee and total expense ratios of peer groups of funds based on information provided by Broadridge. The Trustees considered that MFS currently observes an expense limitation for the Fund, which may not be changed without the Trustees’ approval. The Trustees also considered that, according to the data provided by Broadridge (which takes into account any fee reductions or expense limitations that were in effect during the Fund’s last fiscal year), the Fund’s effective advisory fee rate and total expense ratio were each approximately at the Broadridge expense group median.
46
Board Review of Investment Advisory Agreement – continued
The Trustees also considered the advisory fees charged by MFS to any institutional separate accounts advised by MFS (“separate accounts”) and unaffiliated investment companies for which MFS serves as subadviser (“subadvised funds”) that have comparable investment strategies to the Fund. In comparing these fees, the Trustees considered information provided by MFS as to the generally broader scope of services provided by MFS to the Fund, as well as the more extensive regulatory burdens imposed on MFS in managing the Fund, in comparison to separate accounts and subadvised funds. The Trustees also considered the higher demands placed on MFS’ investment personnel and trading infrastructure as a result of the daily cash in-flows and out-flows of the Fund in comparison to separate accounts.
The Trustees also considered whether the Fund may benefit from any economies of scale in the management of the Fund in the event of growth in assets of the Fund and/or growth in assets of the MFS Funds as a whole. They noted that the Fund’s advisory fee rate schedule is subject to a contractual breakpoint that reduces the Fund’s advisory fee rate on average daily net assets over $3 billion, and that MFS has agreed in writing to further reduce its advisory fee rate on the Fund’s average daily net assets over $1 billion and $2.5 billion, each of which may not be changed without the Trustees’ approval (the “management fee waiver rates”). They also noted that MFS has agreed to amend its contractual advisory fee rate schedule to reflect the existing management fee waiver rates effective as of December 29, 2016. The Trustees also noted that MFS has agreed in writing to waive a portion of the management fees of certain MFS Funds, including the Fund, if the total combined assets of certain funds within the MFS Funds’ complex increase above agreed upon thresholds (the “group fee waiver”), enabling the Fund’s shareholders to share in the benefits from any economies of scale at the complex level. The group fee waiver is reviewed and renewed annually between the Board and MFS. The Trustees concluded that the breakpoints and the group fee waiver were sufficient to allow the Fund to benefit from economies of scale as its assets and overall complex assets grow.
The Trustees also considered information prepared by MFS relating to MFS’ costs and profits with respect to the Fund, the MFS Funds considered as a group, and other investment companies and accounts advised by MFS, as well as MFS’ methodologies used to determine and allocate its costs to the MFS Funds, the Fund and other accounts and products for purposes of estimating profitability.
After reviewing these and other factors described herein, the Trustees concluded, within the context of their overall conclusions regarding the investment advisory agreement, that the advisory fees charged to the Fund represent reasonable compensation in light of the services being provided by MFS to the Fund.
In addition, the Trustees considered MFS’ resources and related efforts to continue to retain, attract and motivate capable personnel to serve the Fund. The Trustees also considered current and developing conditions in the financial services industry, including the presence of large and well-capitalized companies which are spending, and appear to be prepared to continue to spend, substantial sums to engage personnel and to provide services to competing investment companies. In this regard, the Trustees also considered the financial resources of MFS and its ultimate parent, Sun Life
47
Board Review of Investment Advisory Agreement – continued
Financial Inc. The Trustees also considered the advantages and possible disadvantages to the Fund of having an adviser that also serves other investment companies as well as other accounts.
The Trustees also considered the nature, quality, cost, and extent of administrative, transfer agency, and distribution services provided to the Fund by MFS and its affiliates under agreements and plans other than the investment advisory agreement, including any 12b-1 fees the Fund pays to MFS Fund Distributors, Inc., an affiliate of MFS. The Trustees also considered the nature, extent and quality of certain other services MFS performs or arranges for on the Fund’s behalf, which may include securities lending programs, directed expense payment programs, class action recovery programs, and MFS’ interaction with third-party service providers, principally custodians and sub-custodians. The Trustees concluded that the various non-advisory services provided by MFS and its affiliates on behalf of the Fund were satisfactory.
The Trustees also considered benefits to MFS from the use of the Fund’s portfolio brokerage commissions, if applicable, to pay for investment research and various other factors. Additionally, the Trustees considered so-called “fall-out benefits” to MFS such as reputational value derived from serving as investment manager to the Fund.
Based on their evaluation of factors that they deemed to be material, including those factors described above, the Board of Trustees, including the independent Trustees, concluded that the Fund’s investment advisory agreement with MFS should be continued for an additional one-year period, commencing August 1, 2016.
48
PROXY VOTING POLICIES AND INFORMATION
MFS votes proxies on behalf of the fund pursuant to proxy voting policies and procedures that are available without charge, upon request, by calling 1-800-225-2606, by visiting mfs.com (once you have selected “Individual Investor” as your role, click on “Individual Investor Home” in the top navigation and then select “Learn More About Proxy Voting” under the “I want to…” header on the left hand column of the page), or by visiting the SEC’s Web site at http://www.sec.gov.
Information regarding how the fund voted proxies relating to portfolio securities during the most recent twelve-month period ended June 30 is available by August 31 of each year without charge by visiting mfs.com (once you have selected “Individual Investor” as your role, click on “Individual Investor Home” in the top navigation and then select “Learn More About Proxy Voting” under the “I want to…” header on the left hand column of the page), or by visiting the SEC’s Web site at http://www.sec.gov.
QUARTERLY PORTFOLIO DISCLOSURE
The fund will file a complete schedule of portfolio holdings with the Securities and Exchange Commission (the Commission) for the first and third quarters of each fiscal year on Form N-Q. A shareholder can obtain the quarterly portfolio holdings report at mfs.com. The fund’s Form N-Q is also available on the EDGAR database on the Commission’s Internet Web site at http://www.sec.gov, and may be reviewed and copied at the:
Public Reference Room
Securities and Exchange Commission
100 F Street, NE, Room 1580
Washington, D.C. 20549
Information on the operation of the Public Reference Room may be obtained by calling the Commission at 1-800-SEC-0330. Copies of the fund’s Form N-Q also may be obtained, upon payment of a duplicating fee, by electronic request at the following e-mail address: publicinfo@sec.gov or by writing the Public Reference Section at the above address.
FURTHER INFORMATION
From time to time, MFS may post important information about the fund or the MFS funds on the MFS web site (mfs.com). This information is available on mfs.com by following these steps once you have selected “Individual Investor” as your role: (1) Click on the “Individual Investor Home” in the top navigation and then select the “Announcements” option within the “Market Outlooks” drop down, or (2) Click on “Products & Services” and “Mutual Funds” and then choose the fund’s name in the “Select a fund” menu.
49
INFORMATION ABOUT FUND CONTRACTS AND LEGAL CLAIMS
The fund has entered into contractual arrangements with an investment adviser, administrator, distributor, shareholder servicing agent, 529 program manager (if applicable), and custodian who each provide services to the fund. Unless expressly stated otherwise, shareholders are not parties to, or intended beneficiaries of these contractual arrangements, and these contractual arrangements are not intended to create any shareholder right to enforce them against the service providers or to seek any remedy under them against the service providers, either directly or on behalf of the fund.
Under the Trust’s By-Laws and Declaration of Trust, any claims asserted against or on behalf of the MFS Funds, including claims against Trustees and Officers, must be brought in state and federal courts located within the Commonwealth of Massachusetts.
FEDERAL TAX INFORMATION (unaudited)
The fund will notify shareholders of amounts for use in preparing 2016 income tax forms in January 2017. The following information is provided pursuant to provisions of the Internal Revenue Code.
The fund designates $56,333,000 as capital gain dividends paid during the fiscal year.
50
rev. 3/16
| | | | |
| | | |
FACTS | | WHAT DOES MFS DO WITH YOUR PERSONAL INFORMATION? | |  |
| | |
| Why? | | Financial companies choose how they share your personal information. Federal law gives consumers the right to limit some but not all sharing. Federal law also requires us to tell you how we collect, share, and protect your personal information. Please read this notice carefully to understand what we do. |
| | |
| What? | | The types of personal information we collect and share depend on the product or service you have with us. This information can include: • Social Security number and account balances • Account transactions and transaction history • Checking account information and wire transfer instructions When you are no longer our customer, we continue to share your information as described in this notice. |
| | |
| How? | | All financial companies need to share customers’ personal information to run their everyday business. In the section below, we list the reasons financial companies can share their customers’ personal information; the reasons MFS chooses to share; and whether you can limit this sharing. |
| | | | |
Reasons we can share your
personal information | | Does MFS
share? | | Can you limit
this sharing? |
For our everyday business purposes – such as to process your transactions, maintain your account(s), respond to court orders and legal investigations, or report to credit bureaus | | Yes | | No |
For our marketing purposes – to offer our products and services to you | | No | | We don’t share |
For joint marketing with other financial companies | | No | | We don’t share |
For our affiliates’ everyday business purposes – information about your transactions and experiences | | No | | We don’t share |
For our affiliates’ everyday business purposes – information about your creditworthiness | | No | | We don’t share |
| For nonaffiliates to market to you | | No | | We don’t share |
| | |
| Questions? | | Call 800-225-2606 or go to mfs.com. |
51
| | |
| Who we are |
| Who is providing this notice? | | MFS Funds, MFS Investment Management, MFS Institutional Advisors, Inc., and MFS Heritage Trust Company. |
| | |
| What we do |
| How does MFS protect my personal information? | | To protect your personal information from unauthorized access and use, we use security measures that comply with federal law. These measures include procedural, electronic, and physical safeguards for the protection of the personal information we collect about you. |
| How does MFS collect my personal information? | | We collect your personal information, for example, when you • open an account or provide account information • direct us to buy securities or direct us to sell your securities • make a wire transfer We also collect your personal information from others, such as credit bureaus, affiliates, or other companies. |
| Why can’t I limit all sharing? | | Federal law gives you the right to limit only • sharing for affiliates’ everyday business purposes – information about your creditworthiness • affiliates from using your information to market to you • sharing for nonaffiliates to market to you State laws and individual companies may give you additional rights to limit sharing. |
| | |
| Definitions |
| Affiliates | | Companies related by common ownership or control. They can be financial and nonfinancial companies. • MFS does not share personal information with affiliates, except for everyday business purposes as described on page one of this notice. |
| Nonaffiliates | | Companies not related by common ownership or control. They can be financial and nonfinancial companies. • MFS does not share with nonaffiliates so they can market to you. |
| Joint marketing | | A formal agreement between nonaffiliated financial companies that together market financial products or services to you. • MFS doesn’t jointly market. |
| | |
| Other important information |
| If you own an MFS product or receive an MFS service in the name of a third party such as a bank or broker-dealer, their privacy policy may apply to you instead of ours. |
52
Save paper with eDelivery.

| MFS® will send you prospectuses, |
reports, and proxies directly via e-mail so you will get information faster with less mailbox clutter.
To sign up:
1. Go to mfs.com.
2. Log in via MFS® Access.
3. Select eDelivery.
If you own your MFS fund shares through a financial institution or a retirement plan, MFS® TALK, MFS® Access, or eDelivery may not be available to you.
CONTACT
WEB SITE
mfs.com
MFS TALK
1-800-637-8255
24 hours a day
ACCOUNT SERVICE AND LITERATURE
Shareholders
1-800-225-2606
Financial advisors
1-800-343-2829
Retirement plan services
1-800-637-1255
MAILING ADDRESS
MFS Service Center, Inc.
P.O. Box 55824
Boston, MA 02205-5824
OVERNIGHT MAIL
MFS Service Center, Inc.
c/o Boston Financial Data Services
30 Dan Road
Canton, MA 02021-2809
ANNUAL REPORT
August 31, 2016

MFS® U.S. GOVERNMENT MONEY MARKET FUND

MCM-ANN
MFS® U.S. GOVERNMENT MONEY MARKET FUND
CONTENTS
The report is prepared for the general information of shareholders.
It is authorized for distribution to prospective investors only when preceded or accompanied by a current prospectus.
NOT FDIC INSURED • MAY LOSE VALUE • NO BANK GUARANTEE

LETTER FROM THE CHAIRMAN
Dear Shareholders:
Despite the unexpected vote by the United Kingdom to leave the European Union, most markets proved resilient, with U.S. shares rallying to record highs during August.
Global interest rates remain very low, with most central banks maintaining extremely accommodative monetary policies to reinvigorate slow-growing economies against a backdrop of low inflation. This environment has favored risky assets such as equities, as investors are forced to accept greater risks in search of acceptable returns in a low-return environment. U.S. investment-grade and high-yield bonds have also benefited from low, and even negative, yields overseas.
China remains a source of concern for investors, as overcapacity in its manufacturing sector inhibits the government’s attempt to
change its domestic economy from one driven by exports to a consumer-driven model. Despite the slow-growth environment, emerging market equities have held up well, withstanding geopolitical shocks like an attempted coup in Turkey and impeachment proceedings against Brazil’s president. The U.S. Federal Reserve’s go-slow approach to rate hikes has also helped.
At MFS®, we believe it is best to view markets through a long lens and not react to short-term swings. That makes it possible to filter out market noise and focus on long-term fundamentals.
In our view, the professional guidance of a financial advisor, along with a patient, long-term approach, will help you reach your investment objectives.
Respectfully,

Robert J. Manning
Chairman
MFS Investment Management
October 17, 2016
The opinions expressed in this letter are subject to change and may not be relied upon for investment advice. No forecasts can be guaranteed.
1
PORTFOLIO COMPOSITION
Portfolio structure (u)
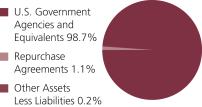
| | | | |
| Composition including fixed income credit quality (a)(u) | |
| A-1+ | | | 16.2% | |
| A-1 | | | 82.5% | |
| A-2 | | | 1.1% | |
| Not Rated | | | 0.0% | |
| Other Assets Less Liabilities | | | 0.2% | |
| | | | |
| Maturity breakdown (u) | | | | |
| 0 - 7 days | | | 21.9% | |
| 8 - 29 days | | | 32.4% | |
| 30 - 59 days | | | 24.8% | |
| 60 - 89 days | | | 19.6% | |
| 90 - 365 days | | | 1.1% | |
| Other Assets Less Liabilities | | | 0.2% | |
| (a) | Ratings are assigned to portfolio securities utilizing ratings from Moody’s, Fitch, and Standard & Poor’s rating agencies and applying the following hierarchy: If all three agencies provide a rating, the middle rating (after dropping the highest and lowest ratings) is assigned; if two of the three agencies rate a security, the lower of the two is assigned. Ratings are shown in the S&P scale. All ratings are subject to change. The fund is not rated by these agencies. |
| (u) | For purposes of this presentation, accrued interest, where applicable, is included. |
Percentages are based on net assets as of 8/31/16.
The portfolio is actively managed and current holdings may be different.
2
PERFORMANCE SUMMARY THROUGH 8/31/16
Total returns as well as the current 7-day yield have been provided for the applicable time periods. Performance results reflect the percentage change in net asset value, including the reinvestment of any dividends and capital gains distributions. (See Notes to Performance Summary.)
Performance data shown represents past performance and is no guarantee of future results. Although the fund seeks to preserve the value of your investment at $1.00 per share, you could lose money on your investment in the fund. An investment in the fund is not a bank deposit and is not insured or guaranteed by the Federal Deposit Insurance Corporation or any other governmental agency. The performance shown does not reflect the deduction of taxes, if any, that a shareholder would pay on fund distributions or the redemption of fund shares.
| | | | | | | | |
| | | Inception | | 1-Year Total
Return (without
sales charge) | | Current
7-day yield | | |
| | | 12/19/75 | | 0.00%(w) | | 0.00% | | |
| (w) | Total return was less than 0.01%. |
Yields quoted are based on the latest seven days ended as of August 31, 2016, with dividends annualized. The yield quotations more closely reflect the current earnings of the fund than the total return quotations. Shares of the fund can be purchased at net asset value without a sales charge.
Certain shares of the fund acquired through an exchange may be subject to a contingent deferred sales charge upon redemption depending on when the shares exchanged were originally purchased. See the notes to financial statements for more details.
Notes to Performance Summary
Performance results reflect any applicable expense subsidies, waivers and adjustments in effect during the periods shown. Subsidies and fee waivers may be imposed to enhance a fund’s yield or to avoid a negative yield during periods when the fund’s operating expenses have a significant impact on the fund’s yield due to lower interest rates. Without such subsidies and waivers the fund’s performance results would be less favorable. Please see the prospectus and financial statements for complete details. All results are historical and assume the reinvestment of any dividends and capital gain distributions.
3
EXPENSE TABLE
Fund expenses borne by the shareholders during the period, March 1, 2016 through August 31, 2016
As a shareholder of the fund, you incur two types of costs: (1) transaction costs, including sales charges (loads) on certain purchase or redemption payments, and (2) ongoing costs, including management fees; and other fund expenses. This example is intended to help you understand your ongoing costs (in dollars) of investing in the fund and to compare these costs with the ongoing costs of investing in other mutual funds.
The example is based on an investment of $1,000 invested at the beginning of the period and held for the entire period March 1, 2016 through August 31, 2016.
Actual Expenses
The first line in the following table provides information about actual account values and actual expenses. You may use the information in this line, together with the amount you invested, to estimate the expenses that you paid over the period. Simply divide your account value by $1,000 (for example, an $8,600 account value divided by $1,000 = 8.6), then multiply the result by the number in the first line under the heading entitled “Expenses Paid During Period” to estimate the expenses you paid on your account during this period.
Hypothetical Example for Comparison Purposes
The second line in the following table provides information about hypothetical account values and hypothetical expenses based on the fund’s actual expense ratio and an assumed rate of return of 5% per year before expenses, which is not the fund’s actual return. The hypothetical account values and expenses may not be used to estimate the actual ending account balance or expenses you paid for the period. You may use this information to compare the ongoing costs of investing in the fund and other funds. To do so, compare this 5% hypothetical example with the 5% hypothetical examples that appear in the shareholder reports of the other funds.
Please note that the expenses shown in the table are meant to highlight your ongoing costs only and do not reflect any transactional costs, such as sales charges (loads). Therefore, the second line in the following table is useful in comparing ongoing costs only, and will not help you determine the relative total costs of owning different funds. In addition, if these transactional costs were included, your costs would have been higher.
4
Expense Table – continued
| | | | | | | | | | | | | | | | |
| | | Annualized
Expense Ratio | | | Beginning
Account Value
3/01/16 | | | Ending
Account Value
8/31/16 | | | Expenses Paid During Period (p) 3/01/16-8/31/16 | |
| Actual | | | 0.32% | | | | $1,000.00 | | | | $1,000.00 | | | | $1.61 | |
| Hypothetical (h) | | | 0.32% | | | | $1,000.00 | | | | $1,023.53 | | | | $1.63 | |
| (h) | 5% fund return per year before expenses. |
| (p) | “Expenses Paid During Period” are equal to the fund’s annualized expense ratio, as shown above, multiplied by the average account value over the period, multiplied by 184/366 (to reflect the one-half year period). Expenses paid do not include any applicable sales charges (loads). If these transaction costs had been included, your costs would have been higher. |
Notes to Expense Table
As more fully disclosed in footnote 3 to the financial statements, the expense ratios reported above include additional expense reductions to avoid a negative yield.
5
PORTFOLIO OF INVESTMENTS
8/31/16
The Portfolio of Investments is a complete list of all securities owned by your fund. It is categorized by broad-based asset classes.
| | | | | | | | |
| U.S. Government Agencies and Equivalents (y) - 98.7% | |
| Issuer | | Shares/Par | | | Value ($) | |
| Fannie Mae, 0.245%, due 10/05/16 | | $ | 4,000,000 | | | $ | 3,999,075 | |
| Fannie Mae, 0.25%, due 10/19/16 | | | 2,650,000 | | | | 2,649,117 | |
| Fannie Mae, 0.31%, due 11/02/16 | | | 2,510,000 | | | | 2,508,660 | |
| Federal Farm Credit Bank, 0.26%, due 9/23/16 | | | 8,900,000 | | | | 8,898,586 | |
| Federal Farm Credit Bank, 0.26%, due 10/03/16 | | | 3,400,000 | | | | 3,399,214 | |
| Federal Home Loan Bank, 0.27%, due 9/01/16 | | | 10,900,000 | | | | 10,900,000 | |
| Federal Home Loan Bank, 0.315%, due 9/01/16 | | | 11,900,000 | | | | 11,900,000 | |
| Federal Home Loan Bank, 0.265%, due 9/02/16 | | | 13,276,000 | | | | 13,275,902 | |
| Federal Home Loan Bank, 0.32%, due 9/02/16 | | | 1,900,000 | | | | 1,899,983 | |
| Federal Home Loan Bank, 0.34%, due 9/07/16 | | | 18,975,000 | | | | 18,973,924 | |
| Federal Home Loan Bank, 0.29%, due 9/09/16 | | | 1,350,000 | | | | 1,349,913 | |
| Federal Home Loan Bank, 0.344%, due 9/09/16 | | | 860,000 | | | | 859,934 | |
| Federal Home Loan Bank, 0.39%, due 9/09/16 | | | 6,000,000 | | | | 5,999,480 | |
| Federal Home Loan Bank, 0.28%, due 9/13/16 | | | 1,532,000 | | | | 1,531,857 | |
| Federal Home Loan Bank, 0.41%, due 9/14/16 | | | 4,100,000 | | | | 4,099,393 | |
| Federal Home Loan Bank, 0.325%, due 9/16/16 | | | 10,696,000 | | | | 10,694,552 | |
| Federal Home Loan Bank, 0.35%, due 9/19/16 | | | 8,338,000 | | | | 8,336,541 | |
| Federal Home Loan Bank, 0.28%, due 9/20/16 | | | 5,495,000 | | | | 5,494,188 | |
| Federal Home Loan Bank, 0.265%, due 9/22/16 | | | 11,432,000 | | | | 11,430,233 | |
| Federal Home Loan Bank, 0.285%, due 9/27/16 | | | 12,796,000 | | | | 12,793,366 | |
| Federal Home Loan Bank, 0.294%, due 9/28/16 | | | 11,070,000 | | | | 11,067,559 | |
| Federal Home Loan Bank, 0.295%, due 10/03/16 | | | 1,300,000 | | | | 1,299,659 | |
| Federal Home Loan Bank, 0.27%, due 10/05/16 | | | 2,880,000 | | | | 2,879,266 | |
| Federal Home Loan Bank, 0.365%, due 10/05/16 | | | 4,983,000 | | | | 4,981,282 | |
| Federal Home Loan Bank, 0.305%, due 10/06/16 | | | 7,006,000 | | | | 7,003,923 | |
| Federal Home Loan Bank, 0.275%, due 10/07/16 | | | 9,825,000 | | | | 9,822,298 | |
| Federal Home Loan Bank, 0.29%, due 10/07/16 | | | 8,707,000 | | | | 8,704,475 | |
| Federal Home Loan Bank, 0.34%, due 10/07/16 | | | 2,150,000 | | | | 2,149,269 | |
| Federal Home Loan Bank, 0.295%, due 10/11/16 | | | 2,687,000 | | | | 2,686,119 | |
| Federal Home Loan Bank, 0.295%, due 10/12/16 | | | 9,812,000 | | | | 9,808,703 | |
| Federal Home Loan Bank, 0.28%, due 10/13/16 | | | 4,650,000 | | | | 4,648,481 | |
| Federal Home Loan Bank, 0.31%, due 10/28/16 | | | 4,214,000 | | | | 4,211,932 | |
| Federal Home Loan Bank, 0.33%, due 11/02/16 | | | 9,173,000 | | | | 9,167,787 | |
| Federal Home Loan Bank, 0.335%, due 11/14/16 | | | 9,984,000 | | | | 9,977,125 | |
| Freddie Mac, 0.24%, due 9/06/16 | | | 3,616,000 | | | | 3,615,879 | |
| Freddie Mac, 0.25%, due 9/08/16 | | | 2,046,000 | | | | 2,045,901 | |
| Freddie Mac, 0.24%, due 9/12/16 | | | 2,550,000 | | | | 2,549,813 | |
| Freddie Mac, 0.25%, due 9/12/16 | | | 1,500,000 | | | | 1,499,885 | |
| Freddie Mac, 0.26%, due 9/22/16 | | | 12,785,000 | | | | 12,783,061 | |
| Freddie Mac, 0.32%, due 11/08/16 | | | 12,800,000 | | | | 12,792,263 | |
6
Portfolio of Investments – continued
| | | | | | | | |
Issuer | | Shares/Par | | | Value ($) | |
| |
| U.S. Government Agencies and Equivalents (y) - continued | | | | | |
| U.S. Treasury Bill, 0.23%, due 9/08/16 | | $ | 3,998,000 | | | $ | 3,997,821 | |
| U.S. Treasury Bill, 0.22%, due 9/29/16 | | | 4,640,000 | | | | 4,639,206 | |
| U.S. Treasury Bill, 0.245%, due 10/20/16 | | | 1,602,000 | | | | 1,601,466 | |
| U.S. Treasury Bill, 0.258%, due 10/27/16 | | | 9,778,000 | | | | 9,774,083 | |
| U.S. Treasury Bill, 0.295%, due 11/10/16 | | | 6,200,000 | | | | 6,196,444 | |
| U.S. Treasury Bill, 0.285%, due 11/17/16 | | | 12,760,000 | | | | 12,752,222 | |
| U.S. Treasury Bill, 0.305%, due 11/25/16 | | | 9,623,000 | | | | 9,616,070 | |
| U.S. Treasury Bill, 0.27%, due 12/08/16 | | | 2,320,000 | | | | 2,318,295 | |
| U.S. Treasury Bill, 0.38%, due 1/26/17 | | | 1,055,000 | | | | 1,053,363 | |
Total U.S. Government Agencies and Equivalents,
at Amortized Cost and Value | | | | | | $ | 316,637,568 | |
| | |
| Repurchase Agreements - 1.1% | | | | | | | | |
| Goldman Sachs Repurchase Agreement, 0.30%, dated 8/31/16, due 9/01/16, total to be received $3,673,031 (secured by U.S. Federal Agency obligations valued at $3,746,860 in a jointly traded account), at Cost and value | | $ | 3,673,000 | | | $ | 3,673,000 | |
| Total Investments, at Amortized Cost and Value | | | | | | $ | 320,310,568 | |
| | |
| Other Assets, Less Liabilities - 0.2% | | | | | | | 536,104 | |
| Net Assets - 100.0% | | | | | | $ | 320,846,672 | |
| (y) | The rate shown represents an annualized yield at time of purchase. |
See Notes to Financial Statements
7
Financial Statements
STATEMENT OF ASSETS AND LIABILITIES
At 8/31/16
This statement represents your fund’s balance sheet, which details the assets and liabilities comprising the total value of the fund.
| | | | |
| Assets | | | | |
Investments, at amortized cost and value | | | $320,310,568 | |
Cash | | | 317 | |
Receivables for | | | | |
Fund shares sold | | | 1,118,908 | |
Interest | | | 31 | |
Receivable from investment adviser and distributor | | | 651 | |
Other assets | | | 535 | |
Total assets | | | $321,431,010 | |
| Liabilities | | | | |
Payable for fund shares reacquired | | | $447,758 | |
Payable to affiliates for shareholder servicing costs | | | 74,820 | |
Payable for independent Trustees’ compensation | | | 7,470 | |
Accrued expenses and other liabilities | | | 54,290 | |
Total liabilities | | | $584,338 | |
Net assets | | | $320,846,672 | |
| Net assets consist of | | | | |
Paid-in capital | | | $321,278,518 | |
Accumulated net realized gain (loss) on investments | | | (423,378 | ) |
Accumulated distributions in excess of net investment income | | | (8,468 | ) |
Net assets | | | $320,846,672 | |
Shares of beneficial interest outstanding | | | 321,429,163 | |
Net asset value per share (net assets of $320,846,672 / 321,429,163 shares of beneficial interest outstanding) | | | $1.00 | |
A contingent deferred sales charge may be imposed on redemptions.
See Notes to Financial Statements
8
Financial Statements
STATEMENT OF OPERATIONS
Year ended 8/31/16
This statement describes how much your fund earned in investment income and accrued in expenses. It also describes any gains and/or losses generated by fund operations.
| | | | |
| Net investment income | | | | |
Interest income | | | $775,866 | |
Expenses | | | | |
Management fee | | | $1,382,964 | |
Shareholder servicing costs | | | 491,798 | |
Administrative services fee | | | 63,919 | |
Independent Trustees’ compensation | | | 13,102 | |
Custodian fee | | | 23,567 | |
Shareholder communications | | | 18,070 | |
Audit and tax fees | | | 36,078 | |
Legal fees | | | 4,132 | |
Miscellaneous | | | 76,772 | |
Total expenses | | | $2,110,402 | |
Fees paid indirectly | | | (24,336 | ) |
Reduction of expenses by investment adviser | | | (1,310,200 | ) |
Net expenses | | | $775,866 | |
Net investment income | | | $0 | |
Net realized gain (loss) on investments | | | $(448 | ) |
Change in net assets from operations | | | $(448 | ) |
See Notes to Financial Statements
9
Financial Statements
STATEMENTS OF CHANGES IN NET ASSETS
These statements describe the increases and/or decreases in net assets resulting from operations, any distributions, and any shareholder transactions.
| | | | | | | | |
| | | Years ended 8/31 | |
| | | 2016 | | | 2015 | |
| Change in net assets | | | | | | |
| From operations | | | | | | | | |
Net investment income | | | $0 | | | | $0 | |
Net realized gain (loss) on investments | | | (448 | ) | | | (136 | ) |
Change in net assets from operations | | | $(448 | ) | | | $(136 | ) |
| Fund share (principal) transactions at net asset value of $1 per share | | | | | | | | |
Net proceeds from sale of shares | | | 230,617,204 | | | | 208,290,372 | |
Cost of shares reacquired | | | (281,259,295 | ) | | | (215,045,588 | ) |
Change in net assets from fund share transactions | | | $(50,642,091 | ) | | | $(6,755,216 | ) |
Total change in net assets | | | $(50,642,539 | ) | | | $(6,755,352 | ) |
| Net assets | | | | | | | | |
At beginning of period | | | 371,489,211 | | | | 378,244,563 | |
At end of period (including accumulated distributions in excess of net investment income of $8,468 and 9,093, respectively) | | | $320,846,672 | | | | $371,489,211 | |
See Notes to Financial Statements
10
Financial Statements
FINANCIAL HIGHLIGHTS
The financial highlights table is intended to help you understand the fund’s financial performance for the past 5 years. Certain information reflects financial results for a single fund share. The total returns in the table represent the rate by which an investor would have earned (or lost) on an investment in the fund share class (assuming reinvestment of all distributions) held for the entire period.
| | | | | | | | | | | | | | | | | | | | |
| | | Years ended 8/31 | |
| | | 2016 | | | 2015 | | | 2014 | | | 2013 | | | 2012 | |
Net asset value, beginning of period | | | $1.00 | | | | $1.00 | | | | $1.00 | | | | $1.00 | | | | $1.00 | |
| Income (loss) from investment operations | |
Net investment income (d) | | | 0.00 | | | | 0.00 | | | | 0.00 | | | | 0.00 | | | | 0.00 | |
Net realized and unrealized gain (loss)
on investments | | | (0.00 | )(w) | | | (0.00 | )(w) | | | 0.00 | (w) | | | — | | | | — | |
Total from investment operations | | | $(0.00 | )(w) | | | $(0.00 | )(w) | | | $0.00 | (w) | | | $0.00 | | | | $0.00 | |
Net asset value, end of period | | | $1.00 | | | | $1.00 | | | | $1.00 | | | | $1.00 | | | | $1.00 | |
Total return (%) (r)(t) | | | 0.00 | (w) | | | 0.00 | (w) | | | 0.00 | (w) | | | 0.00 | | | | 0.00 | |
Ratios (%) (to average net assets)
and Supplemental data: | |
Expenses before expense reductions (f) | | | 0.61 | | | | 0.62 | | | | 0.62 | | | | 0.65 | | | | 0.64 | |
Expenses after expense reductions (f) | | | 0.23 | | | | 0.07 | | | | 0.10 | | | | 0.16 | | | | 0.13 | |
Net investment income | | | 0.00 | | | | 0.00 | | | | 0.00 | | | | 0.00 | | | | 0.00 | |
Net assets at end of period (000 omitted) | | | $320,847 | | | | $371,489 | | | | $378,245 | | | | $404,117 | | | | $402,989 | |
| (d) | Per share data is based on average shares outstanding. |
| (f) | Ratios do not reflect reductions from fees paid indirectly, if applicable. |
| (r) | Certain expenses have been reduced without which performance would have been lower. |
| (t) | Total returns do not include any applicable sales charges. |
| (w) | Per share amount was less than $0.01 and total return or ratio was less than 0.01%, as applicable. |
See Notes to Financial Statements
11
NOTES TO FINANCIAL STATEMENTS
(1) Business and Organization
MFS U.S. Government Money Market Fund (the fund) is a diversified series of MFS Series Trust IV (the trust). The trust is organized as a Massachusetts business trust and is registered under the Investment Company Act of 1940, as amended, as an open-end management investment company.
The fund is an investment company and accordingly follows the investment company accounting and reporting guidance of the Financial Accounting Standards Board (FASB) Accounting Standards Codification Topic 946 Financial Services – Investment Companies.
(2) Significant Accounting Policies
General – The preparation of financial statements in conformity with U.S. generally accepted accounting principles requires management to make estimates and assumptions that affect the reported amounts of assets and liabilities, and disclosure of contingent assets and liabilities at the date of the financial statements and the reported amounts of increases and decreases in net assets from operations during the reporting period. Actual results could differ from those estimates. In the preparation of these financial statements, management has evaluated subsequent events occurring after the date of the fund’s Statement of Assets and Liabilities through the date that the financial statements were issued.
Balance Sheet Offsetting – The fund’s accounting policy with respect to balance sheet offsetting is that, absent an event of default by the counterparty or a termination of the agreement, the International Swaps and Derivatives Association (ISDA) Master Agreement does not result in an offset of reported amounts of financial assets and financial liabilities in the Statement of Assets and Liabilities across transactions between the fund and the applicable counterparty. The fund’s right to setoff may be restricted or prohibited by the bankruptcy or insolvency laws of the particular jurisdiction to which a specific master netting agreement counterparty is subject. Balance sheet offsetting disclosures, to the extent applicable to the fund, have been included in the fund’s Significant Accounting Policies note under the captions for each of the fund’s in-scope financial instruments and transactions.
Investment Valuations – Pursuant to procedures approved by the Board of Trustees, investments held by the fund are generally valued at amortized cost, which approximates market value. Amortized cost involves valuing an instrument at its cost as adjusted for amortization of premium or accretion of discount rather than its current market value. The amortized cost value of an instrument can be different from the market value of an instrument.
Various inputs are used in determining the value of the fund’s assets or liabilities. These inputs are categorized into three broad levels. In certain cases, the inputs used to measure fair value may fall into different levels of the fair value hierarchy. In such cases, an investment’s level within the fair value hierarchy is based on the lowest level of input that is significant to the fair value measurement. The fund’s assessment of the significance of a particular input to the fair value measurement in its entirety requires judgment, and considers factors specific to the investment. Level 1 includes unadjusted
12
Notes to Financial Statements – continued
quoted prices in active markets for identical assets or liabilities. Level 2 includes other significant observable market-based inputs (including quoted prices for similar securities, interest rates, prepayment speed, and credit risk). Level 3 includes unobservable inputs, which may include the adviser’s own assumptions in determining the fair value of investments. The following is a summary of the levels used as of August 31, 2016 in valuing the fund’s assets or liabilities:
| | | | | | | | | | | | | | | | |
| Investments at Value | | Level 1 | | | Level 2 | | | Level 3 | | | Total | |
| Short-Term Securities | | | $— | | | | $320,310,568 | | | | $— | | | | $320,310,568 | |
For further information regarding security characteristics, see the Portfolio of Investments.
Repurchase Agreements – The fund enters into repurchase agreements under the terms of Master Repurchase Agreements with approved counterparties. Each repurchase agreement is recorded at cost. The fund requires that the securities collateral in a repurchase transaction be transferred to a custodian. The fund monitors, on a daily basis, the value of the collateral to ensure that its value, including accrued interest, is greater than amounts owed to the fund under each such repurchase agreement. Upon an event of default under a Master Repurchase Agreement, the non-defaulting party may close out all transactions traded under such agreement and net amounts owed under each transaction to one net amount payable by one party to the other. Absent an event of default, the Master Repurchase Agreement does not result in an offset of reported amounts of assets and liabilities in the Statement of Assets and Liabilities across transactions between the fund and the applicable counterparty. The fund and other funds managed by MFS may utilize a joint trading account for the purpose of entering into one or more repurchase agreements. At period end, the fund had investments in repurchase agreements with a gross value of $3,673,000 included in “Investments” in the Statement of Assets and Liabilities. The value of the related collateral exceeded the value of the repurchase agreements at period end.
Indemnifications – Under the fund’s organizational documents, its officers and Trustees may be indemnified against certain liabilities and expenses arising out of the performance of their duties to the fund. Additionally, in the normal course of business, the fund enters into agreements with service providers that may contain indemnification clauses. The fund’s maximum exposure under these agreements is unknown as this would involve future claims that may be made against the fund that have not yet occurred.
Investment Transactions and Income – Investment transactions are recorded on the trade date. Interest income is recorded on the accrual basis. All premium and discount is amortized or accreted for financial statement purposes in accordance with U.S. generally accepted accounting principles.
Fees Paid Indirectly – The fund’s custody fee may be reduced by a credit earned under an arrangement that measures the value of U.S. dollars deposited with the custodian by the fund. The amount of the credit, for the year ended August 31, 2016, is shown as a reduction of total expenses in the Statement of Operations.
Tax Matters and Distributions – The fund intends to qualify as a regulated investment company, as defined under Subchapter M of the Internal Revenue Code,
13
Notes to Financial Statements – continued
and to distribute all of its taxable income, including realized capital gains. As a result, no provision for federal income tax is required. The fund’s federal tax returns, when filed, will remain subject to examination by the Internal Revenue Service for a three year period. Management has analyzed the fund’s tax positions taken on federal and state tax returns for all open tax years and does not believe that there are any uncertain tax positions that require recognition of a tax liability.
Distributions to shareholders are recorded on the ex-dividend date. Income and capital gain distributions are determined in accordance with income tax regulations, which may differ from U.S. generally accepted accounting principles. Certain capital accounts in the financial statements are periodically adjusted for permanent differences in order to reflect their tax character. These adjustments have no impact on net assets or net asset value per share. Temporary differences which arise from recognizing certain items of income, expense, gain or loss in different periods for financial statement and tax purposes will reverse at some time in the future. Distributions in excess of net investment income or net realized gains are temporary overdistributions for financial statement purposes resulting from differences in the recognition or classification of income or distributions for financial statement and tax purposes.
During the year ended August 31, 2016, there were no significant adjustments due to differences between book and tax accounting.
The fund declared no distributions for the years ended August 31, 2016 and August 31, 2015.
The federal tax cost and the tax basis components of distributable earnings were as follows:
| | | | |
| As of 8/31/16 | | | |
| Cost of investments | | | $320,310,568 | |
| Capital loss carryforwards | | | (423,378 | ) |
| Late year ordinary loss deferral | | | (1,038 | ) |
| Other temporary differences | | | (7,430 | ) |
Under the Regulated Investment Company Modernization Act of 2010 (the “Act”), net capital losses recognized for fund fiscal years beginning after August 31, 2011 may be carried forward indefinitely, and their character is retained as short-term and/or long-term losses (“post-enactment losses”). Previously, net capital losses were carried forward for eight years and treated as short-term losses (“pre-enactment losses”). As a transition rule, the Act requires that all post-enactment net capital losses be used before pre-enactment net capital losses.
As of August 31, 2016, the fund had capital loss carryforwards available to offset future realized gains as follows:
| | | | |
Pre-enactment losses which
expire as follows: | | | |
| 8/31/17 | | | $(422,794 | ) |
| | | | |
Post-enactment losses which are
characterized as follows: | | | |
| Short-Term | | | $(584 | ) |
14
Notes to Financial Statements – continued
(3) Transactions with Affiliates
Investment Adviser – The fund has an investment advisory agreement with MFS to provide overall investment management and related administrative services and facilities to the fund. The management fee is computed daily and paid monthly at the following annual rates:
| | | | |
| First $1 billion of average daily net assets | | | 0.40 | % |
| Average daily net assets in excess of $1 billion | | | 0.35 | % |
During the year ended August 31, 2016, MFS voluntarily waived receipt of $1,184,048 of the fund’s management fee in order to avoid a negative yield. This amount, for the year ended August 31, 2016, is included in the reduction of total expenses in the Statement of Operations. MFS has also agreed in writing to reduce its management fee by a specified amount if certain MFS mutual fund assets exceed thresholds agreed to by MFS and the fund’s Board of Trustees. For the year ended August 31, 2016, this management fee reduction amounted to $24,916, which is included in the reduction of total expenses in the Statement of Operations. For the year ended August 31, 2016, these waivers had the effect of reducing the management fee by 0.35% of average daily net assets on an annualized basis. The management fee incurred for the year ended August 31, 2016 was equivalent to an annual effective rate of 0.05% of the fund’s average daily net assets.
In order to avoid a negative yield for the year ended August 31, 2016, MFS voluntarily agreed to reduce certain other expenses in the amount of $101,236, which is included in the reduction of total expenses in the Statement of Operations.
Distributor – Certain shares acquired through an exchange may be subject to a contingent deferred sales charge upon redemption depending on when the shares exchanged were originally purchased. Contingent deferred sales charges paid to MFS Distributors, Inc. (MFD) during the year ended August 31, 2016 for the MFS U.S. Government Money Market Fund was $17,251.
Shareholder Servicing Agent – MFS Service Center, Inc. (MFSC), a wholly-owned subsidiary of MFS, receives a fee from the fund for its services as shareholder servicing agent calculated as a percentage of the average daily net assets of the fund as determined periodically under the supervision of the fund’s Board of Trustees. For the year ended August 31, 2016, the fee was $205,422, which equated to 0.0594% annually of the fund’s average daily net assets. MFSC also receives payment from the fund for out-of-pocket expenses, sub-accounting and other shareholder servicing costs which may be paid to affiliated and unaffiliated service providers. For the year ended August 31, 2016, these out-of-pocket expenses, sub-accounting and other shareholder servicing costs amounted to $286,376.
Administrator – MFS provides certain financial, legal, shareholder communications, compliance, and other administrative services to the fund. Under an administrative services agreement, the fund reimburses MFS the costs incurred to provide these services. The fund is charged an annual fixed amount of $17,500 plus a fee based on average daily net assets. The administrative services fee incurred for the year ended August 31, 2016 was equivalent to an annual effective rate of 0.0185% of the fund’s average daily net assets.
Trustees’ and Officers’ Compensation – The fund pays compensation to independent Trustees in the form of a retainer, attendance fees, and additional
15
Notes to Financial Statements – continued
compensation to Board and Committee chairpersons. The fund does not pay compensation directly to Trustees or officers of the fund who are also officers of the investment adviser, all of whom receive remuneration for their services to the fund from MFS. Certain officers and Trustees of the fund are officers or directors of MFS, MFD, and MFSC.
Prior to December 31, 2001, the fund had an unfunded defined benefit plan (“DB plan”) for independent Trustees. As of December 31, 2001, the Board took action to terminate the DB plan with respect to then-current and any future independent Trustees, such that the DB plan covers only certain of those former independent Trustees who retired on or before December 31, 2001. The DB plan resulted in a pension expense of $2,730 and is included in “Independent Trustees’ compensation” in the Statement of Operations for the year ended August 31, 2016. The liability for deferred retirement benefits payable to certain independent Trustees under the DB plan amounted to $7,429 at August 31, 2016, and is included in “Payable for independent Trustees’ compensation” in the Statement of Assets and Liabilities.
Other – This fund and certain other funds managed by MFS (the funds) have entered into a service agreement (the ISO Agreement) which provides for payment of fees solely by the funds to Tarantino LLC in return for the provision of services of an Independent Senior Officer (ISO) for the funds. Frank L. Tarantino serves as the ISO and is an officer of the funds and the sole member of Tarantino LLC. The funds can terminate the ISO Agreement with Tarantino LLC at any time under the terms of the ISO Agreement. For the year ended August 31, 2016, the fee paid by the fund under this agreement was $939 and is included in “Miscellaneous” expense in the Statement of Operations. MFS has agreed to bear all expenses associated with office space, other administrative support, and supplies provided to the ISO.
(4) Shares of Beneficial Interest
The fund’s Declaration of Trust permits the Trustees to issue an unlimited number of full and fractional shares of beneficial interest.
The sale of the fund’s shares has been suspended except in certain circumstances. Please see the fund’s prospectus for details.
(5) Line of Credit
The fund and certain other funds managed by MFS participate in a $1.25 billion unsecured committed line of credit, subject to a $1 billion sublimit, provided by a syndication of banks under a credit agreement. Borrowings may be made for temporary financing needs. Interest is charged to each fund, based on its borrowings, generally at a rate equal to the higher of the Overnight Federal Reserve funds rate or daily one month LIBOR plus an agreed upon spread. A commitment fee, based on the average daily, unused portion of the committed line of credit, is allocated among the participating funds at the end of each calendar quarter. In addition, the fund and other funds managed by MFS have established unsecured uncommitted borrowing arrangements with certain banks for temporary financing needs. Interest is charged to each fund, based on its borrowings, at a rate equal to the Overnight Federal Reserve funds rate plus an agreed upon spread. For the year ended August 31, 2016, the fund’s commitment fee and interest expense were $1,552 and $0, respectively, and are included in “Miscellaneous” expense in the Statement of Operations.
16
REPORT OF INDEPENDENT REGISTERED PUBLIC ACCOUNTING FIRM
To the Board of Trustees of MFS Series Trust IV and the Shareholders of MFS U.S. Government Money Market Fund:
We have audited the accompanying statement of assets and liabilities, including the portfolio of investments, of MFS U.S. Government Money Market Fund (one of the series of MFS Series Trust IV) (the “Fund”) as of August 31, 2016, and the related statement of operations for the year then ended, the statements of changes in net assets for each of the two years in the period then ended, and the financial highlights for each of the five years in the period then ended. These financial statements and financial highlights are the responsibility of the Fund’s management. Our responsibility is to express an opinion on these financial statements and financial highlights based on our audits.
We conducted our audits in accordance with the standards of the Public Company Accounting Oversight Board (United States). Those standards require that we plan and perform the audit to obtain reasonable assurance about whether the financial statements and financial highlights are free of material misstatement. The Fund is not required to have, nor were we engaged to perform, an audit of its internal control over financial reporting. Our audits included consideration of internal control over financial reporting as a basis for designing audit procedures that are appropriate in the circumstances, but not for the purpose of expressing an opinion on the effectiveness of the Fund’s internal control over financial reporting. Accordingly, we express no such opinion. An audit also includes examining, on a test basis, evidence supporting the amounts and disclosures in the financial statements, assessing the accounting principles used and significant estimates made by management, as well as evaluating the overall financial statement presentation. Our procedures included confirmation of securities owned as of August 31, 2016, by correspondence with the custodian and brokers. We believe that our audits provide a reasonable basis for our opinion.
In our opinion, such financial statements and financial highlights referred to above present fairly, in all material respects, the financial position of MFS U.S. Government Money Market Fund as of August 31, 2016, the results of its operations for the year then ended, the changes in its net assets for each of the two years in the period then ended, and the financial highlights for each of the five years in the period then ended, in conformity with accounting principles generally accepted in the United States of America.
DELOITTE & TOUCHE LLP
Boston, Massachusetts
October 17, 2016
17
TRUSTEES AND OFFICERS — IDENTIFICATION AND BACKGROUND
The Trustees and Officers of the Trust, as of October 1, 2016, are listed below, together with their principal occupations during the past five years. (Their titles may have varied during that period.) The address of each Trustee and Officer is 111 Huntington Avenue, Boston, Massachusetts 02199-7618.
| | | | | | | | |
Name, Age | | Position(s) Held
with Fund | | Trustee/Officer
Since (h) | | Principal
Occupations During
the Past Five Years | | Other
Directorships (j) |
| INTERESTED TRUSTEES |
Robert J. Manning (k)
(age 52) | | Trustee | | February 2004 | | Massachusetts Financial Services Company, Chairman, Co-Chief Executive Officer and Director | | N/A |
Robin A. Stelmach (k)
(age 55) | | Trustee and
President | | January 2014 | | Massachusetts Financial Services Company, Executive Vice President and Chief Operating Officer | | N/A |
| INDEPENDENT TRUSTEES |
David H. Gunning
(age 74) | | Trustee and Chair of Trustees | | January 2004 | | Private investor | | Lincoln Electric Holdings, Inc., Director; Development Alternatives, Inc., Director/Non-Executive Chairman |
Steven E. Buller
(age 65) | | Trustee | | February 2014 | | Chairman, Financial Accounting Standards Advisory Council (until 2015); Standing Advisory Group, Public Company Accounting Oversight Board, Member (until 2014); BlackRock, Inc. (investment management), Managing Director (until 2014), BlackRock Finco UK (investment management), Director (until 2014) | | N/A |
Robert E. Butler
(age 74) | | Trustee | | January 2006 | | Consultant – investment company industry regulatory and compliance matters | | N/A |
18
Trustees and Officers – continued
| | | | | | | | |
Name, Age | | Position(s) Held
with Fund | | Trustee/Officer
Since (h) | | Principal
Occupations During
the Past Five Years | | Other
Directorships (j) |
Maureen R. Goldfarb
(age 61) | | Trustee | | January 2009 | | Private investor | | N/A |
William R. Gutow
(age 75) | | Trustee | | December 1993 | | Private investor and real estate consultant; Capitol Entertainment Management Company (video franchise), Vice Chairman (until 2014) | | Texas Donuts, Vice Chairman (until 2010) |
Michael Hegarty
(age 71) | | Trustee | | December 2004 | | Private investor | | Rouse Properties Inc., Director; Capmark Financial Group Inc., Director (until 2015) |
John P. Kavanaugh
(age 61) | | Trustee | | January 2009 | | Private investor | | N/A |
Maryanne L. Roepke
(age 60) | | Trustee | | May 2014 | | American Century Investments (investment management), Senior Vice President and Chief Compliance Officer (until 2014) | | N/A |
Laurie J. Thomsen
(age 59) | | Trustee | | March 2005 | | Private investor | | The Travelers Companies, Director; Dycom Industries, Inc., Director |
Robert W. Uek
(age 75) | | Trustee | | January 2006 | | Consultant to investment company industry | | N/A |
| OFFICERS |
Christopher R. Bohane (k)
(age 42) | | Assistant
Secretary and Assistant Clerk | | July 2005 | | Massachusetts Financial Services Company, Vice President and Assistant General Counsel | | N/A |
Kino Clark (k)
(age 48) | | Assistant
Treasurer | | January 2012 | | Massachusetts Financial Services Company, Vice President | | N/A |
Kristin V. Collins (k)
(age 43) | | Assistant
Secretary and Assistant Clerk | | September 2015 | | Massachusetts Financial Services Company, Vice President and Assistant General Counsel | | N/A |
19
Trustees and Officers – continued
| | | | | | | | |
Name, Age | | Position(s) Held
with Fund | | Trustee/Officer
Since (h) | | Principal
Occupations During
the Past Five Years | | Other
Directorships (j) |
Thomas H. Connors (k)
(age 57) | | Assistant
Secretary and Assistant Clerk | | September 2012 | | Massachusetts Financial Services Company, Vice President and Senior Counsel; Deutsche Investment Management Americas Inc. (financial service provider), Director and Senior Counsel (until 2012) | | N/A |
Ethan D. Corey (k)
(age 52) | | Assistant
Secretary and Assistant Clerk | | July 2005 | | Massachusetts Financial Services Company, Senior Vice President and Associate General Counsel | | N/A |
David L. DiLorenzo (k)
(age 48) | | Treasurer | | July 2005 | | Massachusetts Financial Services Company, Senior Vice President | | N/A |
Brian E. Langenfeld (k)
(age 43) | | Assistant
Secretary and Assistant Clerk | | June 2006 | | Massachusetts Financial Services Company, Vice President and Senior Counsel | | N/A |
Susan A. Pereira (k)
(age 45) | | Assistant Secretary and Assistant Clerk | | July 2005 | | Massachusetts Financial Services Company, Vice President and Senior Counsel | | N/A |
Kasey L. Phillips (k)
(age 45) | | Assistant
Treasurer | | September 2012 | | Massachusetts Financial Services Company, Vice President; Wells Fargo Funds Management, LLC, Senior Vice President, Fund Treasurer (until 2012) | | N/A |
20
Trustees and Officers – continued
| | | | | | | | |
Name, Age | | Position(s) Held
with Fund | | Trustee/Officer
Since (h) | | Principal
Occupations During
the Past Five Years | | Other
Directorships (j) |
Mark N. Polebaum (k)
(age 64) | | Secretary and
Clerk | | January 2006 | | Massachusetts Financial Services Company, Executive Vice President, General Counsel and Secretary | | N/A |
Matthew A. Stowe (k)
(age 41) | | Assistant
Secretary and Assistant Clerk | | October 2014 | | Massachusetts Financial Services Company, Vice President and Assistant General Counsel | | N/A |
Frank L. Tarantino
(age 72) | | Independent
Senior Officer | | June 2004 | | Tarantino LLC (provider of compliance services), Principal | | N/A |
Richard S. Weitzel (k)
(age 46) | | Assistant
Secretary and Assistant Clerk | | October 2007 | | Massachusetts Financial Services Company, Senior Vice President and Associate General Counsel | | N/A |
Martin J. Wolin (k)
(age 49) | | Chief Compliance Officer | | July 2015 | | Massachusetts Financial Services Company, Senior Vice President and Chief Compliance Officer (since July 2015); Mercer (financial service provider), Chief Risk and Compliance Officer, North America and Latin America (until June 2015) | | N/A |
James O. Yost (k)
(age 56) | | Deputy Treasurer | | September 1990 | | Massachusetts Financial Services Company, Senior Vice President | | N/A |
| (h) | Date first appointed to serve as Trustee/officer of an MFS Fund. Each Trustee has served continuously since appointment unless indicated otherwise. For the period from December 15, 2004 until February 22, 2005, Mr. Manning served as Advisory Trustee. Prior to January 2012, Messrs. DiLorenzo and Yost served as Assistant Treasurers of the Funds. Ms. Stelmach was appointed as President of the Funds as of October 1, 2014. |
| (j) | Directorships or trusteeships of companies required to report to the Securities and Exchange Commission (i.e., “public companies”). |
(k) “Interested person” of the Trust within the meaning of the Investment Company Act of 1940 (referred to as the 1940 Act), which is the principal federal law governing investment companies like the fund, as a result of a position with MFS. The address of MFS is 111 Huntington Avenue, Boston, Massachusetts 02199-7618.
21
Trustees and Officers – continued
Each Trustee (except Ms. Stelmach, Mr. Buller and Ms. Roepke) has been elected by shareholders and each Trustee and officer holds office until his or her successor is chosen and qualified or until his or her earlier death, resignation, retirement or removal. The Trust does not hold annual meetings for the purpose of electing Trustees, and Trustees are not elected for fixed terms. Messrs. Buller, Butler, Kavanaugh, Uek and Ms. Roepke are members of the Trust’s Audit Committee.
Each of the Fund’s Trustees and officers holds comparable positions with certain other funds of which MFS or a subsidiary is the investment adviser or distributor, and, in the case of the officers, with certain affiliates of MFS. As of October 1, 2016, the Trustees served as board members of 137 funds within the MFS Family of Funds.
The Statement of Additional Information for a Fund includes further information about the Trustees and is available without charge upon request by calling 1-800-225-2606.
| | |
| Investment Adviser | | Custodian |
Massachusetts Financial Services Company
111 Huntington Avenue
Boston, MA 02199-7618 | | State Street Bank and Trust Company 1 Lincoln Street Boston, MA 02111-2900 |
| Distributor | | Independent Registered Public Accounting Firm |
MFS Fund Distributors, Inc.
111 Huntington Avenue
Boston, MA 02199-7618 | | Deloitte & Touche LLP 200 Berkeley Street Boston, MA 02116 |
| Portfolio Manager | | |
| Edward O’Dette | | |
22
BOARD REVIEW OF INVESTMENT ADVISORY AGREEMENT
The Investment Company Act of 1940 requires that both the full Board of Trustees and a majority of the non-interested (“independent”) Trustees, voting separately, annually approve the continuation of the Fund’s investment advisory agreement with MFS. The Trustees consider matters bearing on the Fund and its advisory arrangements at their meetings throughout the year, including a review of performance data at each regular meeting. In addition, the independent Trustees met several times over the course of three months beginning in May and ending in July, 2016 (“contract review meetings”) for the specific purpose of considering whether to approve the continuation of the investment advisory agreement for the Fund and the other investment companies that the Board oversees (the “MFS Funds”). The independent Trustees were assisted in their evaluation of the Fund’s investment advisory agreement by independent legal counsel, from whom they received separate legal advice and with whom they met separately from MFS during various contract review meetings. The independent Trustees were also assisted in this process by the MFS Funds’ Independent Senior Officer, a senior officer appointed by and reporting to the independent Trustees.
In connection with their deliberations regarding the continuation of the investment advisory agreement, the Trustees, including the independent Trustees, considered such information and factors as they believed, in light of the legal advice furnished to them and their own business judgment, to be relevant. The investment advisory agreement for the Fund was considered separately, although the Trustees also took into account the common interests of all MFS Funds in their review. As described below, the Trustees considered the nature, quality, and extent of the various investment advisory, administrative, and shareholder services performed by MFS under the existing investment advisory agreement and other arrangements with the Fund.
In connection with their contract review meetings, the Trustees received and relied upon materials that included, among other items: (i) information provided by Broadridge, an independent third party, on the investment performance of the Fund for various time periods ended December 31, 2015 and the investment performance of a group of funds with substantially similar investment classifications/objectives (the “Lipper performance universe”), (ii) information provided by Broadridge on the Fund’s advisory fees and other expenses and the advisory fees and other expenses of comparable funds identified by Broadridge (the “Broadridge expense group”), (iii) information provided by MFS on the advisory fees of portfolios of other clients of MFS, including institutional separate accounts and other clients, (iv) information as to whether and to what extent applicable expense waivers, reimbursements or fee “breakpoints” are observed for the Fund, (v) information regarding MFS’ financial results and financial condition, including MFS’ and certain of its affiliates’ estimated profitability from services performed for the Fund and the MFS Funds as a whole, and compared to MFS’ institutional business, (vi) MFS’ views regarding the outlook for the mutual fund industry and the strategic business plans of MFS, (vii) descriptions of various functions performed by MFS for the Funds, such as compliance monitoring and portfolio trading practices, and (viii) information regarding the overall organization of MFS, including information about MFS’ senior management and other personnel providing investment advisory, administrative and other services to the Fund and the
23
Board Review of Investment Advisory Agreement – continued
other MFS Funds. The comparative performance, fee and expense information prepared and provided by Broadridge was not independently verified and the independent Trustees did not independently verify any information provided to them by MFS.
The Trustees’ conclusion as to the continuation of the investment advisory agreement was based on a comprehensive consideration of all information provided to the Trustees and not the result of any single factor. Some of the factors that figured particularly in the Trustees’ deliberations are described below, although individual Trustees may have evaluated the information presented differently from one another, giving different weights to various factors. It is also important to recognize that the fee arrangements for the Fund and other MFS Funds are the result of years of review and discussion between the independent Trustees and MFS, that certain aspects of such arrangements may receive greater scrutiny in some years than in others, and that the Trustees’ conclusions may be based, in part, on their consideration of these same arrangements during the course of the year and in prior years.
Based on information provided by Broadridge and MFS, the Trustees reviewed the Fund’s total return investment performance as well as the performance of peer groups of funds over various time periods. The Trustees placed particular emphasis on the total return performance of the Fund’s shares in comparison to the performance of funds in its Lipper performance universe over the three-year period ended December 31, 2015, which the Trustees believed was a long enough period to reflect differing market conditions. The total return performance of the Fund’s shares was in the 4th quintile relative to the other funds in the universe for this three-year period (the 1st quintile being the best performers and the 5th quintile being the worst performers). The total return performance of the Fund’s shares was in the 4th quintile for each of the one-and five-year periods ended December 31, 2015 relative to the Lipper performance universe. Because of the passage of time, these performance results may differ from the performance results for more recent periods, including those shown elsewhere in this report.
In the course of their deliberations, the Trustees took into account information provided by MFS in connection with the contract review meetings, as well as during investment review meetings conducted with portfolio management personnel during the course of the year regarding the Fund’s performance. In addition, the Trustees noted the market conditions affecting all money market funds, in particular the low interest rate environment, and MFS’ voluntary waiver of its fees to ensure that the Fund avoids a negative yield. After reviewing these and related factors, the Trustees concluded, within the context of their overall conclusions regarding the investment advisory agreement, that they were satisfied with MFS’ responses and efforts relating to investment performance.
In assessing the reasonableness of the Fund’s advisory fee, the Trustees considered, among other information, the Fund’s advisory fee and the total expense ratio of the Fund’s shares as a percentage of average daily net assets and the advisory fee and total expense ratios of peer groups of funds based on information provided by Broadridge. The Trustees considered that, according to the data provided by Broadridge (which takes into account any fee reductions or expense limitations that were in effect during
24
Board Review of Investment Advisory Agreement – continued
the Fund’s last fiscal year), the Fund’s effective advisory fee rate was lower than the Broadridge expense group median and the Fund’s total expense ratio was approximately at the Broadridge expense group median.
The Trustees also considered the advisory fees charged by MFS to any institutional separate accounts advised by MFS (“separate accounts”) and unaffiliated investment companies for which MFS serves as subadviser (“subadvised funds”) that have comparable investment strategies to the Fund. In comparing these fees, the Trustees considered information provided by MFS as to the generally broader scope of services provided by MFS to the Fund, as well as the more extensive regulatory burdens imposed on MFS in managing the Fund, in comparison to separate accounts and subadvised funds. The Trustees also considered the higher demands placed on MFS’ investment personnel and trading infrastructure as a result of the daily cash in-flows and out-flows of the Fund in comparison to separate accounts.
The Trustees also considered whether the Fund may benefit from any economies of scale in the management of the Fund in the event of growth in assets of the Fund and/or growth in assets of the MFS Funds as a whole. They noted that the Fund’s advisory fee rate schedule is subject to a contractual breakpoint that reduces the Fund’s advisory fee rate on average daily net assets over $1 billion. The Trustees also noted that MFS has agreed in writing to waive a portion of the management fees of certain MFS Funds, including the Fund, if the total combined assets of certain funds within the MFS Funds’ complex increase above agreed upon thresholds (the “group fee waiver”), enabling the Fund’s shareholders to share in the benefits from any economies of scale at the complex level. The group fee waiver is reviewed and renewed annually between the Board and MFS. The Trustees concluded that the breakpoint and the group fee waiver were sufficient to allow the Fund to benefit from economies of scale as its assets and overall complex assets grow.
The Trustees also considered information prepared by MFS relating to MFS’ costs and profits with respect to the Fund, the MFS Funds considered as a group, and other investment companies and accounts advised by MFS, as well as MFS’ methodologies used to determine and allocate its costs to the MFS Funds, the Fund and other accounts and products for purposes of estimating profitability.
After reviewing these and other factors described herein, the Trustees concluded, within the context of their overall conclusions regarding the investment advisory agreement, that the advisory fees charged to the Fund represent reasonable compensation in light of the services being provided by MFS to the Fund.
In addition, the Trustees considered MFS’ resources and related efforts to continue to retain, attract and motivate capable personnel to serve the Fund. The Trustees also considered current and developing conditions in the financial services industry, including the presence of large and well-capitalized companies which are spending, and appear to be prepared to continue to spend, substantial sums to engage personnel and to provide services to competing investment companies. In this regard, the Trustees also considered the financial resources of MFS and its ultimate parent, Sun Life Financial Inc. The Trustees also considered the advantages and possible disadvantages to the Fund of having an adviser that also serves other investment companies as well as other accounts.
25
Board Review of Investment Advisory Agreement – continued
The Trustees also considered the nature, quality, cost, and extent of administrative, transfer agency, and distribution services provided to the Fund by MFS and its affiliates under agreements and plans other than the investment advisory agreement. The Trustees also considered the nature, extent and quality of certain other services MFS performs or arranges for on the Fund’s behalf, which may include securities lending programs, directed expense payment programs, class action recovery programs, and MFS’ interaction with third-party service providers, principally custodians and sub-custodians. The Trustees concluded that the various non-advisory services provided by MFS and its affiliates on behalf of the Fund were satisfactory.
The Trustees also considered benefits to MFS from the use of the Fund’s portfolio brokerage commissions, if applicable, to pay for investment research and various other factors. Additionally, the Trustees considered so-called “fall-out benefits” to MFS such as reputational value derived from serving as investment manager to the Fund.
Based on their evaluation of factors that they deemed to be material, including those factors described above, the Board of Trustees, including the independent Trustees, concluded that the Fund’s investment advisory agreement with MFS should be continued for an additional one-year period, commencing August 1, 2016.
26
PROXY VOTING POLICIES AND INFORMATION
MFS votes proxies on behalf of the fund pursuant to proxy voting policies and procedures that are available without charge, upon request, by calling 1-800-225-2606, by visiting mfs.com (once you have selected “Individual Investor” as your role, click on “Individual Investor Home” in the top navigation and then select “Learn More About Proxy Voting” under the “I want to…” header on the left hand column of the page), or by visiting the SEC’s Web site at http://www.sec.gov.
Information regarding how the fund voted proxies relating to portfolio securities during the most recent twelve-month period ended June 30 is available by August 31 of each year without charge by visiting mfs.com (once you have selected “Individual Investor” as your role, click on “Individual Investor Home” in the top navigation and then select “Learn More About Proxy Voting” under the “I want to…” header on the left hand column of the page), or by visiting the SEC’s Web site at http://www.sec.gov.
QUARTERLY PORTFOLIO DISCLOSURE
The fund will file a complete schedule of portfolio holdings with the Securities and Exchange Commission (the Commission) for the first and third quarters of each fiscal year on Form N-Q. A shareholder can obtain the quarterly portfolio holdings report at mfs.com. The fund’s Form N-Q is also available on the EDGAR database on the Commission’s Internet Web site at http://www.sec.gov, and may be reviewed and copied at the:
Public Reference Room
Securities and Exchange Commission
100 F Street, NE, Room 1580
Washington, D.C. 20549
Information on the operation of the Public Reference Room may be obtained by calling the Commission at 1-800-SEC-0330. Copies of the fund’s Form N-Q also may be obtained, upon payment of a duplicating fee, by electronic request at the following e-mail address: publicinfo@sec.gov or by writing the Public Reference Section at the above address.
FURTHER INFORMATION
From time to time, MFS may post important information about the fund or the MFS funds on the MFS web site (mfs.com). This information is available on mfs.com by following these steps once you have selected “Individual Investor” as your role: (1) Click on the “Individual Investor Home” in the top navigation and then select the “Announcements” option within the “Market Outlooks” drop down, or (2) Click on “Products & Services” and “Mutual Funds” and then choose the fund’s name in the “Select a fund” menu.
27
INFORMATION ABOUT FUND CONTRACTS AND LEGAL CLAIMS
The fund has entered into contractual arrangements with an investment adviser, administrator, distributor, shareholder servicing agent, 529 program manager (if applicable), and custodian who each provide services to the fund. Unless expressly stated otherwise, shareholders are not parties to, or intended beneficiaries of these contractual arrangements, and these contractual arrangements are not intended to create any shareholder right to enforce them against the service providers or to seek any remedy under them against the service providers, either directly or on behalf of the fund.
Under the Trust’s By-Laws and Declaration of Trust, any claims asserted against or on behalf of the MFS Funds, including claims against Trustees and Officers, must be brought in state and federal courts located within the Commonwealth of Massachusetts.
FEDERAL TAX INFORMATION (unaudited)
The fund will notify shareholders of amounts for use in preparing 2016 income tax forms in January 2017.
28
rev. 3/16
| | | | |
| | | |
FACTS | | WHAT DOES MFS DO WITH YOUR PERSONAL INFORMATION? | |  |
| | |
| Why? | | Financial companies choose how they share your personal information. Federal law gives consumers the right to limit some but not all sharing. Federal law also requires us to tell you how we collect, share, and protect your personal information. Please read this notice carefully to understand what we do. |
| | |
| What? | | The types of personal information we collect and share depend on the product or service you have with us. This information can include: • Social Security number and account balances • Account transactions and transaction history • Checking account information and wire transfer instructions When you are no longer our customer, we continue to share your information as described in this notice. |
| | |
| How? | | All financial companies need to share customers’ personal information to run their everyday business. In the section below, we list the reasons financial companies can share their customers’ personal information; the reasons MFS chooses to share; and whether you can limit this sharing. |
| | | | |
Reasons we can share your
personal information | | Does MFS
share? | | Can you limit
this sharing? |
For our everyday business purposes – such as to process your transactions, maintain your account(s), respond to court orders and legal investigations, or report to credit bureaus | | Yes | | No |
For our marketing purposes – to offer our products and services to you | | No | | We don’t share |
For joint marketing with other financial companies | | No | | We don’t share |
For our affiliates’ everyday business purposes – information about your transactions and experiences | | No | | We don’t share |
For our affiliates’ everyday business purposes – information about your creditworthiness | | No | | We don’t share |
| For nonaffiliates to market to you | | No | | We don’t share |
| | |
| Questions? | | Call 800-225-2606 or go to mfs.com. |
29
| | |
| Who we are |
| Who is providing this notice? | | MFS Funds, MFS Investment Management, MFS Institutional Advisors, Inc., and MFS Heritage Trust Company. |
| | |
| What we do |
| How does MFS protect my personal information? | | To protect your personal information from unauthorized access and use, we use security measures that comply with federal law. These measures include procedural, electronic, and physical safeguards for the protection of the personal information we collect about you. |
| How does MFS collect my personal information? | | We collect your personal information, for example, when you • open an account or provide account information • direct us to buy securities or direct us to sell your securities • make a wire transfer We also collect your personal information from others, such as credit bureaus, affiliates, or other companies. |
| Why can’t I limit all sharing? | | Federal law gives you the right to limit only • sharing for affiliates’ everyday business purposes – information about your creditworthiness • affiliates from using your information to market to you • sharing for nonaffiliates to market to you State laws and individual companies may give you additional rights to limit sharing. |
| | |
| Definitions |
| Affiliates | | Companies related by common ownership or control. They can be financial and nonfinancial companies. • MFS does not share personal information with affiliates, except for everyday business purposes as described on page one of this notice. |
| Nonaffiliates | | Companies not related by common ownership or control. They can be financial and nonfinancial companies. • MFS does not share with nonaffiliates so they can market to you. |
| Joint marketing | | A formal agreement between nonaffiliated financial companies that together market financial products or services to you. • MFS doesn’t jointly market. |
| | |
| Other important information |
| If you own an MFS product or receive an MFS service in the name of a third party such as a bank or broker-dealer, their privacy policy may apply to you instead of ours. |
30
Save paper with eDelivery.

| MFS® will send you prospectuses, |
reports, and proxies directly via e-mail so you will get information faster with less mailbox clutter.
To sign up:
1. Go to mfs.com.
2. Log in via MFS® Access.
3. Select eDelivery.
If you own your MFS fund shares through a financial institution or a retirement plan, MFS® TALK, MFS® Access, or eDelivery may not be available to you.
CONTACT
WEB SITE
mfs.com
MFS TALK
1-800-637-8255
24 hours a day
ACCOUNT SERVICE AND LITERATURE
Shareholders
1-800-225-2606
Financial advisors
1-800-343-2829
Retirement plan services
1-800-637-1255
MAILING ADDRESS
MFS Service Center, Inc.
P.O. Box 55824
Boston, MA 02205-5824
OVERNIGHT MAIL
MFS Service Center, Inc.
c/o Boston Financial Data Services
30 Dan Road
Canton, MA 02021-2809
The Registrant has adopted a Code of Ethics pursuant to Section 406 of the Sarbanes-Oxley Act and as defined in Form N-CSR that applies to the Registrant’s principal executive officer and principal financial and accounting officer. During the period covered by this report, the Registrant has not amended any provision in its Code of Ethics (the “Code”) that relates to an element of the Code’s definition enumerated in paragraph (b) of Item 2 of this Form N-CSR. During the period covered by this report, the Registrant did not grant a waiver, including an implicit waiver, from any provision of the Code.
A copy of the Code of Ethics is filed as an exhibit to this Form N-CSR.
| ITEM 3. | AUDIT COMMITTEE FINANCIAL EXPERT. |
Messrs. Steven E. Buller, Robert E. Butler, John P. Kavanaugh and Robert W. Uek and Ms. Maryanne L. Roepke, members of the Audit Committee, have been determined by the Board of Trustees in their reasonable business judgment to meet the definition of “audit committee financial expert” as such term is defined in Form N-CSR. In addition, Messrs. Buller, Butler, Kavanaugh and Uek and Ms. Roepke are “independent” members of the Audit Committee (as such term has been defined by the Securities and Exchange Commission in regulations implementing Section 407 of the Sarbanes-Oxley Act of 2002). The Securities and Exchange Commission has stated that the designation of a person as an audit committee financial expert pursuant to this Item 3 on the Form N-CSR does not impose on such a person any duties, obligations or liability that are greater than the duties, obligations or liability imposed on such person as a member of the Audit Committee and the Board of Trustees in the absence of such designation or identification.
| ITEM 4. | PRINCIPAL ACCOUNTANT FEES AND SERVICES. |
Items 4(a) through 4(d) and 4(g):
The Board of Trustees has appointed Deloitte & Touche LLP (“Deloitte”) to serve as independent accountant to certain series of the Registrant and Ernst & Young LLP (“E&Y”) to serve in the same capacity to certain other series of the Registrant (each a “Fund” and collectively the “Funds”). The tables below set forth the audit fees billed to each Fund as well as fees for non-audit services provided to each Fund and/or to each Fund’s investment adviser, Massachusetts Financial Services Company (“MFS”), and to various entities either controlling, controlled by, or under common control with MFS that provide ongoing services to the Fund (“MFS Related Entities”).
For the fiscal years ended August 31, 2016 and 2015, audit fees billed to each Fund by Deloitte and E&Y were as follows:
| | | | | | | | |
| | | Audit Fees | |
| | | 2016 | | | 2015 | |
Fees Billed by Deloitte | | | | | | | | |
MFS Mid Cap Growth Fund | | | 44,416 | | | | 44,416 | |
MFS U.S. Government Money Market Fund | | | 31,171 | | | | 31,171 | |
| | | | | | | | |
Total | | | 75,587 | | | | 75,587 | |
| |
| | | Audit Fees | |
| | | 2016 | | | 2015 | |
Fees Billed by E&Y | | | | | | | | |
MFS Blended Research Emerging Markets Equity Fund | | | 25,800 | | | | N/A | ** |
MFS Blended Research Global Equity Fund | | | 24,800 | | | | N/A | ** |
MFS Blended Research International Equity Fund | | | 25,800 | | | | N/A | ** |
MFS Global New Discovery Fund | | | 44,145 | | | | 44,145 | |
| | | | | | | | |
Total | | | 120,545 | | | | 44,145 | |
For the fiscal years ended August 31, 2016 and 2015, fees billed by Deloitte and E&Y for audit-related, tax and other services provided to each Fund and for audit-related, tax and other services provided to MFS and MFS Related Entities were as follows:
| | | | | | | | | | | | | | | | | | | | | | | | |
| | | Audit-Related Fees1 | | | Tax Fees2 | | | All Other Fees3 | |
| | | 2016 | | | 2015 | | | 2016 | | | 2015 | | | 2016 | | | 2015 | |
Fees Billed by Deloitte | | | | | | | | | | | | | | | | | | | | | | | | |
To MFS Mid Cap Growth Fund | | | 0 | | | | 0 | | | | 6,601 | | | | 6,601 | | | | 0 | | | | 1,358 | |
To MFS U.S. Government Money Market Fund | | | 0 | | | | 0 | | | | 3,752 | | | | 3,752 | | | | 0 | | | | 1,085 | |
Total fees billed by Deloitte To above Funds | | | 0 | | | | 0 | | | | 10,353 | | | | 10,353 | | | | 0 | | | | 2,443 | |
| | | | | | | | | | | | | | | | | | | | | | | | |
| | | Audit-Related Fees1 | | | Tax Fees2 | | | All Other Fees3 | |
| | | 2016 | | | 2015 | | | 2016 | | | 2015 | | | 2016 | | | 2015 | |
Fees Billed by Deloitte | | | | | | | | | | | | | | | | | | | | | | | | |
To MFS and MFS Related Entities of MFS Mid Cap Growth Fund* | | | 0 | | | | 968,289 | | | | 0 | | | | 0 | | | | 5,000 | | | | 5,000 | |
To MFS and MFS Related Entities of MFS U.S. Government Money Market Fund* | | | 0 | | | | 968,289 | | | | 0 | | | | 0 | | | | 5,000 | | | | 5,000 | |
| | | | | | | | |
| | | Aggregate Fees for Non-audit
Services | |
| | | 2016 | | | 2015 | |
Fees Billed by Deloitte | | | | | | | | |
To MFS Mid Cap Growth Fund, MFS and MFS Related Entities# | | | 76,879 | | | | 981,248 | |
To MFS U.S. Government Money Market Fund, MFS and MFS Related Entities# | | | 74,030 | | | | 978,126 | |
| | | | | | | | | | | | | | | | | | | | | | | | |
| | | Audit-Related Fees1 | | | Tax Fees2 | | | All Other Fees4 | |
| | | 2016 | | | 2015 | | | 2016 | | | 2015 | | | 2016 | | | 20155 | |
Fees Billed by E&Y | | | | | | | | | | | | | | | | | | | | | | | | |
To MFS Blended Research Emerging Markets Equity Fund | | | 0 | | | | N/A | ** | | | 9,613 | | | | N/A | ** | | | 2,001 | | | | N/A | ** |
To MFS Blended Research Global Equity Fund | | | 0 | | | | N/A | ** | | | 9,613 | | | | N/A | ** | | | 2,001 | | | | N/A | ** |
To MFS Blended Research International Equity Fund | | | 0 | | | | N/A | ** | | | 9,613 | | | | N/A | ** | | | 2,003 | | | | N/A | ** |
To MFS Global New Discovery Fund | | | 0 | | | | 0 | | | | 8,591 | | | | 8,521 | | | | 1,010 | | | | 1,001 | |
Total fees billed by E&Y To above Funds | | | 0 | | | | 0 | | | | 37,430 | | | | 8,521 | | | | 7,015 | | | | 1,001 | |
| | | |
| | | Audit-Related Fees1 | | | Tax Fees2 | | | All Other Fees4 | |
| | | 2016 | | | 20155 | | | 2016 | | | 2015 | | | 2016 | | | 20155 | |
Fees Billed by E&Y | | | | | | | | | | | | | | | | | | | | | | | | |
To MFS and MFS Related Entities of MFS Blended Research Emerging Markets Equity Fund* | | | 1,612,499 | | | | 920,675 | ** | | | 0 | | | | 0 | ** | | | 99,446 | | | | 49,723 | ** |
To MFS and MFS Related Entities of MFS Blended Research Global Equity Fund* | | | 1,612,499 | | | | 920,675 | ** | | | 0 | | | | 0 | ** | | | 99,446 | | | | 49,723 | ** |
To MFS and MFS Related Entities of MFS Blended Research International Equity Fund* | | | 1,612,499 | | | | 920,675 | ** | | | 0 | | | | 0 | ** | | | 99,446 | | | | 49,723 | ** |
To MFS and MFS Related Entities of MFS Global New Discovery Fund* | | | 1,612,499 | | | | 920,675 | | | | 0 | | | | 0 | | | | 99,446 | | | | 49,723 | |
| | | | | | | | |
| | | Aggregate Fees for Non-audit
Services | |
| | | 2016 | | | 20155 | |
Fees Billed by E&Y | | | | | | | | |
To MFS Blended Research Emerging Markets Equity Fund, MFS and MFS Related Entities# | | | 1,874,159 | | | | 1,146,398 | ** |
To MFS Blended Research Global Equity Fund, MFS and MFS Related Entities# | | | 1,874,159 | | | | 1,146,398 | ** |
To MFS Blended Research International Equity Fund, MFS and MFS Related Entities# | | | 1,874,161 | | | | 1,146,398 | ** |
To MFS Global New Discovery Fund, MFS and MFS Related Entities# | | | 1,872,146 | | | | 1,155,920 | |
| * | This amount reflects the fees billed to MFS and MFS Related Entities for non-audit services relating directly to the operations and financial reporting of the Funds (portions of which services also related to the operations and financial reporting of other funds within the MFS Funds complex). |
| ** | MFS Blended Research Emerging Markets Equity Fund, MFS Blended Research Global Equity Fund, and MFS Blended International Equity Fund commenced investment operations in September 2015. |
| # | This amount reflects the aggregate fees billed by Deloitte or E&Y for non-audit services rendered to the Fund and for non-audit services rendered to MFS and the MFS Related Entities. |
| 1 | The fees included under “Audit-Related Fees” are fees related to assurance and related services that are reasonably related to the performance of the audit or review of financial statements, but not reported under ‘‘Audit Fees,’’ including accounting consultations, agreed-upon procedure reports, attestation reports, comfort letters and internal control reviews. |
| 2 | The fees included under “Tax Fees” are fees associated with tax compliance, tax advice and tax planning, including services relating to the filing or amendment of federal, state or local income tax returns, regulated investment company qualification reviews and tax distribution and analysis. |
| 3 | The fees included under “All Other Fees” are fees for products and services provided by Deloitte other than those reported under “Audit Fees,” “Audit-Related Fees” and “Tax Fees,” including fees for services related to review of internal controls and Rule 38a-1 compliance program. |
| 4 | The fees included under “All Other Fees” are fees for products and services provided by E&Y other than those reported under “Audit Fees,” “Audit-Related Fees” and “Tax Fees,” including fees for services related to review of internal controls and Rule 38a-1 compliance program. |
| 5 | Certain fees reported in 2015 have been restated in this filing from those reported in the Registrant’s filing for the reporting period ended August 31, 2015. |
Item 4(e)(1):
Set forth below are the policies and procedures established by the Audit Committee of the Board of Trustees relating to the pre-approval of audit and non-audit related services:
To the extent required by applicable law, pre-approval by the Audit Committee of the Board is needed for all audit and permissible non-audit services rendered to the Funds and all permissible non-audit services rendered to MFS or MFS Related Entities if the services relate directly to the operations and financial reporting of the Registrant. Pre-approval is currently on an engagement-by-engagement basis. In the event pre-approval of such services is necessary between regular meetings of the Audit Committee and it is not practical to wait to seek pre-approval at the next regular meeting of the Audit Committee, pre-approval of such services may be referred to the Chair of the Audit Committee for approval; provided that the Chair may not pre-approve any individual engagement for such services exceeding $50,000 or multiple engagements for such services in the aggregate exceeding $100,000 in each period between regular meetings of the Audit Committee. Any engagement pre-approved by the Chair between regular meetings of the Audit Committee shall be presented for ratification by the entire Audit Committee at its next regularly scheduled meeting.
Item 4(e)(2):
None, or 0%, of the services relating to the Audit-Related Fees, Tax Fees and All Other Fees paid by the Fund and MFS and MFS Related Entities relating directly to the operations and financial reporting of the Registrant disclosed above were approved by the audit committee pursuant to paragraphs (c)(7)(i)(C) of Rule 2-01 of Regulation S-X (which permits audit committee approval after the start of the engagement with respect to services other than audit, review or attest services, if certain conditions are satisfied).
Item 4(f): Not applicable.
Item 4(h): The Registrant’s Audit Committee has considered whether the provision by a Registrant’s independent registered public accounting firm of non-audit services to MFS and MFS Related Entities that were not pre-approved by the Committee (because such services did not relate directly to the operations and financial reporting of the Registrant) was compatible with maintaining the independence of the independent registered public accounting firm as the Registrant’s principal auditors.
| ITEM 5. | AUDIT COMMITTEE OF LISTED REGISTRANTS. |
Not applicable to the Registrant.
A schedule of investments of the Registrant is included as part of the report to shareholders of such series under Item 1 of this Form N-CSR.
| ITEM 7. | DISCLOSURE OF PROXY VOTING POLICIES AND PROCEDURES FOR CLOSED-END MANAGEMENT INVESTMENT COMPANIES. |
Not applicable to the Registrant.
| ITEM 8. | PORTFOLIO MANAGERS OF CLOSED-END MANAGEMENT INVESTMENT COMPANIES. |
Not applicable to the Registrant.
| ITEM 9. | PURCHASES OF EQUITY SECURITIES BY CLOSED-END MANAGEMENT INVESTMENT COMPANY AND AFFILIATED PURCHASERS. |
Not applicable to the Registrant.
| ITEM 10. | SUBMISSION OF MATTERS TO A VOTE OF SECURITY HOLDERS. |
There were no material changes to the procedures by which shareholders may send recommendations to the Board for nominees to the Registrant’s Board since the Registrant last provided disclosure as to such procedures in response to the requirements of Item 407 (c)(2)(iv) of Regulation S-K or this Item.
| ITEM 11. | CONTROLS AND PROCEDURES. |
| (a) | Based upon their evaluation of the effectiveness of the registrant’s disclosure controls and procedures (as defined in Rule 30a-3(c) under the Investment Company Act of 1940 (the “Act”)) as conducted within 90 days of the filing date of this report on Form N-CSR, the registrant’s principal financial officer and principal executive officer have concluded that those disclosure controls and procedures provide reasonable assurance that the material information required to be disclosed by the registrant on this report is recorded, processed, summarized and reported within the time periods specified in the Securities and Exchange Commission’s rules and forms. |
| (b) | There were no changes in the registrant’s internal controls over financial reporting (as defined in Rule 30a-3(d) under the Act) that occurred during the second fiscal quarter of the period covered by the report that have materially affected, or are reasonably likely to materially affect, the registrant’s internal control over financial reporting. |
| (a) | File the exhibits listed below as part of this form. Letter or number the exhibits in the sequence indicated. |
| | (1) | Any code of ethics, or amendment thereto, that is the subject of the disclosure required by Item 2, to the extent that the registrant intends to satisfy the Item 2 requirements through filing of an exhibit: Code of Ethics attached hereto. |
| | (2) | A separate certification for each principal executive officer and principal financial officer of the registrant as required by Rule 30a-2 under the Act (17 CFR 270.30a-2): Attached hereto. |
| (b) | If the report is filed under Section 13(a) or 15(d) of the Exchange Act, provide the certifications required by Rule 30a-2(b) under the Act (17 CFR 270.30a-2(b)), Rule 13a-14(b) or Rule 15d-14(b) under the Exchange Act (17 CFR 240.13a-14(b) or 240.15d-14(b)) and Section 1350 of Chapter 63 of Title 18 of the United States Code (18 U.S.C. 1350) as an exhibit. A certification furnished pursuant to this paragraph will not be deemed “filed” for the purposes of Section 18 of the Exchange Act (15 U.S.C. 78r), or otherwise subject to the liability of that section. Such certification will not be deemed to be incorporated by reference into any filing under the Securities Act of 1933 or the Exchange Act, except to the extent that the registrant specifically incorporates it by reference: Attached hereto. |
Notice
A copy of the Amended and Restated Declaration of Trust, as amended, of the Registrant is on file with the Secretary of State of The Commonwealth of Massachusetts and notice is hereby given that this instrument is executed on behalf of the Registrant by an officer of the Registrant as an officer and not individually and the obligations of or arising out of this instrument are not binding upon any of the Trustees or shareholders individually, but are binding only upon the assets and property of the respective constituent series of the Registrant.
SIGNATURES
Pursuant to the requirements of the Securities Exchange Act of 1934 and the Investment Company Act of 1940, the registrant has duly caused this report to be signed on its behalf by the undersigned, thereunto duly authorized.
(Registrant) MFS SERIES TRUST IV
| | |
| By (Signature and Title)* | | ROBIN A. STELMACH |
| | Robin A. Stelmach, President |
Date: October 17, 2016
Pursuant to the requirements of the Securities Exchange Act of 1934 and the Investment Company Act of 1940, this report has been signed below by the following persons on behalf of the registrant and in the capacities and on the dates indicated.
| | |
| By (Signature and Title)* | | ROBIN A. STELMACH |
| | Robin A. Stelmach, President (Principal Executive Officer) |
Date: October 17, 2016
| | |
| By (Signature and Title)* | | DAVID L. DILORENZO |
| | David L. DiLorenzo, Treasurer (Principal Financial Officer and Accounting Officer) |
Date: October 17, 2016
| * | Print name and title of each signing officer under his or her signature. |