UNITED STATES
SECURITIES AND EXCHANGE COMMISSION
Washington, D.C. 20549
FORM N-CSR
CERTIFIED SHAREHOLDER REPORT OF
REGISTERED MANAGEMENT INVESTMENT COMPANIES
Investment Company Act file number 811-2594
MFS SERIES TRUST IV
(Exact name of registrant as specified in charter)
111 Huntington Avenue, Boston, Massachusetts 02199
(Address of principal executive offices) (Zip code)
Christopher R. Bohane
Massachusetts Financial Services Company
111 Huntington Avenue
Boston, Massachusetts 02199
(Name and address of agents for service)
Registrant’s telephone number, including area code: (617) 954-5000
Date of fiscal year end: August 31
Date of reporting period: August 31, 2018
| ITEM 1. | REPORTS TO STOCKHOLDERS. |
Annual Report
August 31, 2018

MFS® Blended Research® Emerging Markets Equity Fund

BRK-ANN
MFS® Blended Research®
Emerging Markets Equity Fund
CONTENTS
The report is prepared for the general information of shareholders.
It is authorized for distribution to prospective investors only when preceded or accompanied by a current prospectus.
NOT FDIC INSURED • MAY LOSE VALUE • NO BANK GUARANTEE

LETTER FROM THE EXECUTIVE CHAIRMAN
Dear Shareholders:
The strengthening U.S. dollar, international trade friction and geopolitical uncertainty have contributed to a measurable uptick in market volatility in recent quarters — a
departure from the low-volatility environment that prevailed for much of 2017. Against this more challenging backdrop, global markets have become less synchronized, with equity markets in the United States outperforming most international markets. Global economic growth remains healthy, notwithstanding signs of a modest slowdown over the past few months, particularly in Europe, China and some emerging markets.
Although the U.S. Federal Reserve continues to gradually raise interest rates and shrink its balance sheet, monetary policy remains accommodative around the world, with many central
banks taking only tentative steps toward tighter policies. Newly enacted U.S. tax reforms have been welcomed by equity markets while emerging market economies have recently had to contend with tighter financial conditions as a result of firmer U.S. Treasury yields and a stronger dollar. Around the world, inflation remains largely subdued, but tight labor markets and solid global demand have investors on the lookout for its potential reappearance. Increased U.S. protectionism is also a growing concern, as investors fear that trade disputes could dampen business sentiment, leading to slower global growth.
As a global investment manager with nearly a century of expertise, MFS® firmly believes that active risk management offers downside mitigation and may help improve investment outcomes, and we built our active investment platform with that in mind. Our long-term perspective influences nearly every aspect of our business, but most importantly, it aligns our investment decisions with clients’ investing time horizons.
Respectfully,

Robert J. Manning
Executive Chairman
MFS Investment Management
October 16, 2018
The opinions expressed in this letter are subject to change and may not be relied upon for investment advice. No forecasts can be guaranteed.
1
PORTFOLIO COMPOSITION
Portfolio structure

| | | | |
| Top ten holdings | | | | |
| Samsung Electronics Co. Ltd. | | | 5.6% | |
| Taiwan Semiconductor Manufacturing Co. Ltd. | | | 5.6% | |
| Tencent Holdings Ltd. | | | 5.5% | |
| Alibaba Group Holding Ltd., ADR | | | 3.5% | |
| China Construction Bank | | | 2.8% | |
| LUKOIL PJSC, ADR | | | 2.2% | |
| China Petroleum & Chemical Corp. | | | 1.9% | |
| Industrial & Commercial Bank of China, “H” | | | 1.8% | |
| Infosys Ltd. | | | 1.7% | |
| Naspers Ltd. | | | 1.7% | |
| |
| Equity sectors | | | | |
| Technology | | | 25.6% | |
| Financial Services | | | 24.8% | |
| Utilities & Communications | | | 7.7% | |
| Energy | | | 6.2% | |
| Autos & Housing | | | 5.9% | |
| Basic Materials | | | 5.6% | |
| Consumer Staples | | | 5.0% | |
| Special Products & Services | | | 4.5% | |
| Industrial Goods & Services | | | 3.7% | |
| Retailing | | | 3.5% | |
| Leisure | | | 2.6% | |
| Health Care | | | 2.3% | |
| Transportation | | | 2.2% | |
| | | | |
| Issuer country weightings (x) | | | | |
| China | | | 32.4% | |
| South Korea | | | 15.3% | |
| Taiwan | | | 10.9% | |
| India | | | 8.1% | |
| South Africa | | | 6.0% | |
| Brazil | | | 5.9% | |
| Mexico | | | 4.3% | |
| Thailand | | | 4.2% | |
| Russia | | | 3.8% | |
| Other Countries | | | 9.1% | |
|
| Currency exposure weightings (y) | |
| Hong Kong Dollar | | | 29.1% | |
| South Korean Won | | | 15.3% | |
| Taiwan Dollar | | | 10.9% | |
| Indian Rupee | | | 8.1% | |
| South African Rand | | | 6.0% | |
| Brazilian Real | | | 5.9% | |
| Chinese Renminbi | | | 4.3% | |
| Mexican Peso | | | 4.3% | |
| Thailand Baht | | | 4.2% | |
| Other Currencies | | | 11.9% | |
2
Portfolio Composition – continued
| (x) | Represents the portfolio’s exposure to issuer countries as a percentage of a portfolio’s net assets. For purposes of this presentation, United States (included in Other Countries) includes Cash & Cash Equivalents. |
| (y) | Represents the portfolio’s exposure to a particular currency as a percentage of a portfolio’s net assets. For purposes of this presentation, United States Dollar (included in Other Currencies) includes Cash & Cash Equivalents. |
Cash & Cash Equivalents includes any cash, investments in money market funds, short-term securities, and other assets less liabilities. Please see the Statement of Assets and Liabilities for additional information related to the fund’s cash position and other assets and liabilities.
Percentages are based on net assets as of August 31, 2018.
The portfolio is actively managed and current holdings may be different.
3
MANAGEMENT REVIEW
Summary of Results
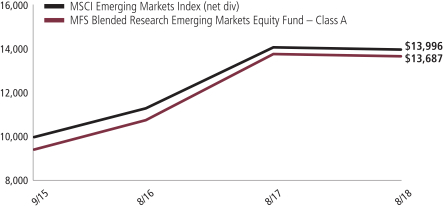
For the twelve months ended August 31, 2018, Class A shares of the MFS Blended Research Emerging Markets Equity Fund (“fund”) provided a total return of –0.77%, at net asset value. This compares with a return of –0.68% for the fund’s benchmark, the MSCI Emerging Markets Index (net div).
Market Environment
Despite headwinds from increasing global trade tensions, several US equity indices advanced to set new record highs late in the period after rebounding from a mid-period market correction. Very strong earnings per share and revenue growth, helped in part by the 2017 US tax reform package, has underpinned the advance, as has solid US economic growth. Strong fundamentals have brought US equity valuations down more in line with long-term average valuations from elevated levels early in the period. While the US economy has maintained its strength, global economic growth became less synchronized during the period, with Europe and China showing signs of a modest slowdown and some emerging markets coming under stress.
During the period, the US Federal Reserve raised interest rates by 75 basis points, bringing the total number of hikes to seven since the central bank began to normalize monetary policy in late 2015. The growth rate in the US, eurozone and Japan remained above trend, although inflation remained contained, particularly outside the US. Late in the period, the European Central Bank announced that it would halt its asset purchase program at the end of 2018, but issued forward guidance that it does not expect to raise interest rates at least until after the summer of 2019. Both the Bank of England and the Bank of Canada raised rates several times during the period. The European political backdrop became a bit more volatile late in the period, spurred by a chaotic process which resulted in the formation of an anti-establishment, Eurosceptic coalition government in Italy.
Bond yields rose in the US during the period but remained low by historical standards, while yields in many developed markets fell. Credit spreads remained relatively tight but widened modestly, late in the period, as market volatility increased. Growing concern over increasing global trade friction appeared to have weighed on business sentiment during the period’s second half, especially outside the US. Tighter financial conditions from rising US rates and a strong dollar combined with trade uncertainty helped expose structural weaknesses in several emerging markets late in the period.
Detractors from Performance
Security selection within both the health care and utilities sectors was a primary detractor from performance relative to the MSCI Emerging Markets Index. Within the health care sector, an overweight position in insurance and healthcare provider Qualicorp (Brazil), and not holding shares of South Korean pharmaceutical developer Celltrion, weighed on relative returns. Within the utilities sector, the fund’s position in shares of public utility company Light (b)(h) (Brazil) weakened relative returns. Shares of Light declined as falling energy demand, due to a weak Brazilian economy, weighed on the company’s earning results.
4
Management Review – continued
Elsewhere, overweight positions in education services provider Kroton Educacional (Brazil), banking services provider Turkiye Garanti Bankasi (Turkey) and Turkish financial services provider Turkiye Is Bankasi (h), and an underweight position in internet gaming company Tencent (China), held back relative performance. Shares of Kroton Educacional depreciated as the company reported lackluster earnings and disappointing guidance, owing primarily to softer-than-expected growth and a decline in margins that was driven by weakness in the company’s campus segment. In addition, not owning shares of conglomerate holding company Reliance Industries (India), and the fund’s holdings of women’s footwear, handbags, clothing and accessories manufacturer Arezzo Industria e Comercio SA (b)(h) (Brazil) and educational services provider Estacio Participacoes SA (b) (Brazil), hindered relative results.
Contributors to Performance
Security selection in the autos & housing sector contributed to relative performance. Within this sector, an overweight position in cement producer China Resources Cement (China), and not holding shares of household goods manufacturer Steinhoff International (South Africa), supported relative performance. Shares of China Resources Cement advanced as the company reported solid earnings results and announced that it expected an increase in cement demand from Southern China.
Stock selection in the consumer staples sector further benefited relative results. An overweight position in beer manufacturer and distributor holding company China Resources Beer (China) bolstered relative returns. Shares of China Resources Beer appreciated after investors appeared to have reacted positively to news that the company was in talks to acquire Dutch brewing company Heineken’s China business and after management gave a confident growth outlook into 2018.
Stocks in other sectors that also aided relative returns included the fund’s overweight positions in integrated oil company LUKOIL (Russia), Chinese exploration and production firm China Petroleum & Chemical, oil and gas company CNOOC (China), Chinese e-commerce giant Alibaba Group, Taiwanese semiconductor products manufacturer Taiwan Semiconductor Manufacturing, Taiwanese plastics company Formosa Plastics and telecommunications company Advanced Info Service (Thailand).
During the reporting period, the fund’s relative currency exposure, resulting primarily from differences between the fund’s and the benchmark’s exposures to holdings of securities denominated in foreign currencies, was a contributor to relative performance. All of MFS’ investment decisions are driven by the fundamentals of each individual opportunity and as such, it is common for our portfolios to have different currency exposure than the benchmark.
Respectfully,
Portfolio Manager(s)
Jim Fallon, Matt Krummell, Jonathan Sage, and Jed Stocks
| (b) | Security is not a benchmark constituent. |
| (h) | Security was not held in the portfolio at period end. |
5
Management Review – continued
The views expressed in this report are those of the portfolio manager(s) only through the end of the period of the report as stated on the cover and do not necessarily reflect the views of MFS or any other person in the MFS organization. These views are subject to change at any time based on market or other conditions, and MFS disclaims any responsibility to update such views. These views may not be relied upon as investment advice or an indication of trading intent on behalf of any MFS portfolio. References to specific securities are not recommendations of such securities, and may not be representative of any MFS portfolio’s current or future investments.
6
PERFORMANCE SUMMARY THROUGH 8/31/18
The following chart illustrates a representative class of the fund’s historical performance in comparison to its benchmark(s). Performance results include the deduction of the maximum applicable sales charge and reflect the percentage change in net asset value, including reinvestment of dividends and capital gains distributions. The performance of other share classes will be greater than or less than that of the class depicted below. Benchmarks are unmanaged and may not be invested in directly. Benchmark returns do not reflect sales charges, commissions or expenses. (See Notes to Performance Summary.)
Performance data shown represents past performance and is no guarantee of future results. Investment return and principal value fluctuate so your shares, when sold, may be worth more or less than the original cost; current performance may be lower or higher than quoted. The performance shown does not reflect the deduction of taxes, if any, that a shareholder would pay on fund distributions or the redemption of fund shares.
Growth of a Hypothetical $10,000 Investment (t)
7
Performance Summary – continued
Total Returns through 8/31/18
Average annual without sales charge
| | | | | | | | | | |
| | | Share Class | | Class Inception Date | | 1-yr | | Life (t) | | |
| | | A | | 9/15/15 | | (0.77)% | | 13.41% | | |
| | | B | | 9/15/15 | | (1.54)% | | 12.58% | | |
| | | C | | 9/15/15 | | (1.48)% | | 12.57% | | |
| | | I | | 9/15/15 | | (0.55)% | | 13.69% | | |
| | | R1 | | 9/15/15 | | (1.49)% | | 12.57% | | |
| | | R2 | | 9/15/15 | | (1.03)% | | 13.12% | | |
| | | R3 | | 9/15/15 | | (0.80)% | | 13.41% | | |
| | | R4 | | 9/15/15 | | (0.50)% | | 13.70% | | |
| | | R6 | | 9/15/15 | | (0.42)% | | 13.78% | | |
| Comparative benchmark(s) | | | | | | |
| | | MSCI Emerging Markets Index (net div) (f) | | (0.68)% | | 12.01% | | |
| Average annual with sales charge | | | | | | |
| | | A
With Initial Sales Charge (5.75%) | | (6.48)% | | 11.17% | | |
| | | B
With CDSC (Declining over six years from 4% to 0%) (v) | | (5.33)% | | 11.77% | | |
| | | C
With CDSC (1% for 12 months) (v) | | (2.43)% | | 12.57% | | |
CDSC – Contingent Deferred Sales Charge.
Class I, R1, R2, R3, R4, and R6 shares do not have a sales charge.
| (f) | Source: FactSet Research Systems Inc. |
| (t) | For the period from the class inception date through the stated period end. (See Notes to Performance Summary.) |
| (v) | Assuming redemption at the end of the applicable period. |
Benchmark Definition(s)
MSCI Emerging Markets Index (net div) – a market capitalization-weighted index that is designed to measure equity market performance in the global emerging markets.
It is not possible to invest directly in an index.
Notes to Performance Summary
Average annual total return represents the average annual change in value for each share class for the periods presented. Life returns are presented where the share class has less than 10 years of performance history and represent the average annual total return from the class inception date to the stated period end date.
Performance results reflect any applicable expense subsidies and waivers in effect during the periods shown. Without such subsidies and waivers the fund’s performance results would be less favorable. Please see the prospectus and financial statements for complete details.
8
Performance Summary – continued
Performance results do not include adjustments made for financial reporting purposes in accordance with U.S. generally accepted accounting principles and may differ from amounts reported in the financial highlights.
From time to time the fund may receive proceeds from litigation settlements, without which performance would be lower.
9
EXPENSE TABLE
Fund expenses borne by the shareholders during the period, March 1, 2018 through August 31, 2018
As a shareholder of the fund, you incur two types of costs: (1) transaction costs, including sales charges (loads) on certain purchase or redemption payments, and (2) ongoing costs, including management fees; distribution and service (12b-1) fees; and other fund expenses. This example is intended to help you understand your ongoing costs (in dollars) of investing in the fund and to compare these costs with the ongoing costs of investing in other mutual funds.
The example is based on an investment of $1,000 invested at the beginning of the period and held for the entire period March 1, 2018 through August 31, 2018.
Actual Expenses
The first line for each share class in the following table provides information about actual account values and actual expenses. You may use the information in this line, together with the amount you invested, to estimate the expenses that you paid over the period. Simply divide your account value by $1,000 (for example, an $8,600 account value divided by $1,000 = 8.6), then multiply the result by the number in the first line under the heading entitled “Expenses Paid During Period” to estimate the expenses you paid on your account during this period.
Hypothetical Example for Comparison Purposes
The second line for each share class in the following table provides information about hypothetical account values and hypothetical expenses based on the fund’s actual expense ratio and an assumed rate of return of 5% per year before expenses, which is not the fund’s actual return. The hypothetical account values and expenses may not be used to estimate the actual ending account balance or expenses you paid for the period. You may use this information to compare the ongoing costs of investing in the fund and other funds. To do so, compare this 5% hypothetical example with the 5% hypothetical examples that appear in the shareholder reports of the other funds.
Please note that the expenses shown in the table are meant to highlight your ongoing costs only and do not reflect any transactional costs, such as sales charges (loads). Therefore, the second line for each share class in the table is useful in comparing ongoing costs only, and will not help you determine the relative total costs of owning different funds. In addition, if these transactional costs were included, your costs would have been higher.
10
Expense Table – continued
| | | | | | | | | | | | | | | | | | |
Share
Class | | | | Annualized
Expense
Ratio | | | Beginning
Account Value
3/01/18 | | | Ending
Account Value
8/31/18 | | | Expenses
Paid During
Period (p)
3/01/18-8/31/18 | |
| A | | Actual | | | 1.23% | | | | $1,000.00 | | | | $897.50 | | | | $5.88 | |
| | Hypothetical (h) | | | 1.23% | | | | $1,000.00 | | | | $1,019.00 | | | | $6.26 | |
| B | | Actual | | | 1.99% | | | | $1,000.00 | | | | $894.32 | | | | $9.50 | |
| | Hypothetical (h) | | | 1.99% | | | | $1,000.00 | | | | $1,015.17 | | | | $10.11 | |
| C | | Actual | | | 1.99% | | | | $1,000.00 | | | | $894.63 | | | | $9.50 | |
| | Hypothetical (h) | | | 1.99% | | | | $1,000.00 | | | | $1,015.17 | | | | $10.11 | |
| I | | Actual | | | 0.99% | | | | $1,000.00 | | | | $898.43 | | | | $4.74 | |
| | Hypothetical (h) | | | 0.99% | | | | $1,000.00 | | | | $1,020.21 | | | | $5.04 | |
| R1 | | Actual | | | 1.99% | | | | $1,000.00 | | | | $893.94 | | | | $9.50 | |
| | Hypothetical (h) | | | 1.99% | | | | $1,000.00 | | | | $1,015.17 | | | | $10.11 | |
| R2 | | Actual | | | 1.49% | | | | $1,000.00 | | | | $896.33 | | | | $7.12 | |
| | Hypothetical (h) | | | 1.49% | | | | $1,000.00 | | | | $1,017.69 | | | | $7.58 | |
| R3 | | Actual | | | 1.24% | | | | $1,000.00 | | | | $897.71 | | | | $5.93 | |
| | Hypothetical (h) | | | 1.24% | | | | $1,000.00 | | | | $1,018.95 | | | | $6.31 | |
| R4 | | Actual | | | 0.99% | | | | $1,000.00 | | | | $898.49 | | | | $4.74 | |
| | Hypothetical (h) | | | 0.99% | | | | $1,000.00 | | | | $1,020.21 | | | | $5.04 | |
| R6 | | Actual | | | 0.91% | | | | $1,000.00 | | | | $899.15 | | | | $4.36 | |
| | Hypothetical (h) | | | 0.91% | | | | $1,000.00 | | | | $1,020.62 | | | | $4.63 | |
| (h) | 5% class return per year before expenses. |
| (p) | “Expenses Paid During Period” are equal to each class’s annualized expense ratio, as shown above, multiplied by the average account value over the period, multiplied by 184/365 (to reflect the one-half year period). Expenses paid do not include any applicable sales charges (loads). If these transaction costs had been included, your costs would have been higher. |
Notes to Expense Table
Each class with a Rule 12b-1 service fee is subject to a rebate of a portion of such fee. Such rebates are included in the expense ratios above and are outside of the expense limitation arrangement. For Class A shares, this rebate reduced the expense ratio above by 0.01%. See Note 3 in the Notes to Financial Statements for additional information.
11
PORTFOLIO OF INVESTMENTS
8/31/18
The Portfolio of Investments is a complete list of all securities owned by your fund. It is categorized by broad-based asset classes.
| | | | | | | | |
| Common Stocks - 95.9% | | | | | | | | |
| Issuer | | Shares/Par | | | Value ($) | |
| Airlines - 2.2% | | | | | | | | |
| AirAsia Berhad | | | 156,100 | | | $ | 130,669 | |
| Grupo Aeroportuario del Sureste, “B” | | | 12,922 | | | | 242,082 | |
| Malaysia Airports Holdings Berhad | | | 70,000 | | | | 159,265 | |
| | | | | | | | |
| | | | | | | $ | 532,016 | |
| Alcoholic Beverages - 1.5% | | | | | | | | |
| China Resources Beer Holdings Co. Ltd. | | | 86,000 | | | $ | 365,969 | |
| | |
| Apparel Manufacturers - 0.6% | | | | | | | | |
| Pou Chen Corp. | | | 55,000 | | | $ | 60,614 | |
| Shenzhou International Group Holdings Ltd. | | | 6,000 | | | | 78,738 | |
| | | | | | | | |
| | | | | | | $ | 139,352 | |
| Automotive - 2.8% | | | | | | | | |
| Ford Otomotiv Sanayi A.S. | | | 6,953 | | | $ | 70,894 | |
| Geely Automobile Holdings Ltd. | | | 23,000 | | | | 48,879 | |
| Great Wall Motor Co. Ltd. | | | 88,000 | | | | 54,154 | |
| Kia Motors Corp. | | | 10,547 | | | | 303,671 | |
| Mahindra & Mahindra Ltd. | | | 14,221 | | | | 193,547 | |
| | | | | | | | |
| | | | | | | $ | 671,145 | |
| Biotechnology - 0.4% | | | | | | | | |
| Sino Biopharmaceutical | | | 79,500 | | | $ | 100,682 | |
| | |
| Broadcasting - 0.3% | | | | | | | | |
| Grupo Televisa S.A., ADR | | | 3,528 | | | $ | 63,539 | |
| | |
| Business Services - 3.1% | | | | | | | | |
| Cognizant Technology Solutions Corp., “A” | | | 2,350 | | | $ | 184,310 | |
| HCL Technologies Ltd. | | | 6,502 | | | | 95,931 | |
| Infosys Ltd. | | | 20,588 | | | | 418,313 | |
| Multiplus S.A. | | | 7,089 | | | | 42,345 | |
| | | | | | | | |
| | | | | | | $ | 740,899 | |
| Cable TV - 1.7% | | | | | | | | |
| Naspers Ltd. | | | 1,803 | | | $ | 400,693 | |
| | |
| Computer Software - Systems - 1.2% | | | | | | | | |
| Hon Hai Precision Industry Co. Ltd. | | | 79,300 | | | $ | 207,835 | |
| SK Holdings Co. Ltd. | | | 328 | | | | 77,495 | |
| | | | | | | | |
| | | | | | | $ | 285,330 | |
12
Portfolio of Investments – continued
| | | | | | | | |
| Issuer | | Shares/Par | | | Value ($) | |
| Common Stocks - continued | | | | | | | | |
| Conglomerates - 0.7% | | | | | | | | |
| Barloworld Ltd. | | | 9,848 | | | $ | 83,770 | |
| CITIC Pacific Ltd. | | | 60,000 | | | | 85,313 | |
| | | | | | | | |
| | | | | | | $ | 169,083 | |
| Construction - 2.2% | | | | | | | | |
| Anhui Conch Cement Co. Ltd. | | | 28,500 | | | $ | 173,569 | |
| China National Building Material Co. Ltd., “H” | | | 132,000 | | | | 123,444 | |
| China Resources Cement Holdings Ltd. | | | 200,000 | | | | 233,413 | |
| | | | | | | | |
| | | | | | | $ | 530,426 | |
| Consumer Products - 0.6% | | | | | | | | |
| Hindustan Unilever Ltd. | | | 6,061 | | | $ | 152,119 | |
| | |
| Consumer Services - 0.7% | | | | | | | | |
| Estacio Participacoes S.A. | | | 11,000 | | | $ | 60,872 | |
| Kroton Educacional S.A. | | | 43,600 | | | | 109,399 | |
| | | | | | | | |
| | | | | | | $ | 170,271 | |
| Electronics - 12.6% | | | | | | | | |
| AU Optronics Corp. | | | 140,000 | | | $ | 60,622 | |
| Innolux Display Corp. | | | 266,000 | | | | 99,160 | |
| MediaTek, Inc. | | | 13,000 | | | | 106,446 | |
| Nanya Techonology Corp. | | | 25,000 | | | | 56,731 | |
| Samsung Electronics Co. Ltd. | | | 30,868 | | | | 1,343,534 | |
| Taiwan Semiconductor Manufacturing Co. Ltd. | | | 161,000 | | | | 1,341,885 | |
| | | | | | | | |
| | | | | | | $ | 3,008,378 | |
| Energy - Independent - 1.5% | | | | | | | | |
| CNOOC Ltd. | | | 206,000 | | | $ | 364,298 | |
| | |
| Energy - Integrated - 4.7% | | | | | | | | |
| China Petroleum & Chemical Corp. | | | 462,000 | | | $ | 464,428 | |
| LUKOIL PJSC, ADR | | | 7,634 | | | | 526,746 | |
| PetroChina Co. Ltd. | | | 174,000 | | | | 129,468 | |
| | | | | | | | |
| | | | | | | $ | 1,120,642 | |
| Engineering - Construction - 0.7% | | | | | | | | |
| China Communications Construction Co. Ltd. | | | 86,000 | | | $ | 85,356 | |
| GS Engineering & Construction Corp. | | | 1,961 | | | | 84,384 | |
| | | | | | | | |
| | | | | | | $ | 169,740 | |
| Food & Beverages - 1.1% | | | | | | | | |
| AVI Ltd. | | | 21,318 | | | $ | 168,296 | |
| Fomento Economico Mexicano S.A.B. de C.V., ADR | | | 1,006 | | | | 96,455 | |
| | | | | | | | |
| | | | | | | $ | 264,751 | |
13
Portfolio of Investments – continued
| | | | | | | | |
| Issuer | | Shares/Par | | | Value ($) | |
| Common Stocks - continued | | | | | | | | |
| Furniture & Appliances - 0.9% | | | | | | | | |
| Coway Co. Ltd. | | | 2,551 | | | $ | 209,461 | |
| | |
| Gaming & Lodging - 0.6% | | | | | | | | |
| Genting Berhad | | | 72,800 | | | $ | 152,704 | |
| | |
| General Merchandise - 1.0% | | | | | | | | |
| Mr Price Group Ltd. | | | 4,310 | | | $ | 66,092 | |
| S.A.C.I. Falabella | | | 7,455 | | | | 59,200 | |
| Shinsegae Co. Ltd. | | | 352 | | | | 102,613 | |
| | | | | | | | |
| | | | | | | $ | 227,905 | |
| Health Maintenance Organizations - 0.3% | | | | | | | | |
| Qualicorp S.A. | | | 17,800 | | | $ | 68,873 | |
| | |
| Insurance - 5.0% | | | | | | | | |
| AIA Group Ltd. | | | 22,400 | | | $ | 193,213 | |
| China Pacific Insurance Co. Ltd. | | | 82,600 | | | | 307,826 | |
| Fubon Financial Holding Co. Ltd. | | | 121,000 | | | | 200,518 | |
| Liberty Holdings Ltd. | | | 4,588 | | | | 36,345 | |
| PICC Property & Casualty Co. Ltd. | | | 118,000 | | | | 132,903 | |
| Samsung Fire & Marine Insurance Co. Ltd. | | | 1,211 | | | | 288,294 | |
| Shin Kong Financial Holding Co. Ltd. | | | 110,000 | | | | 43,513 | |
| | | | | | | | |
| | | | | | | $ | 1,202,612 | |
| Internet - 11.0% | | | | | | | | |
| Alibaba Group Holding Ltd., ADR (a) | | | 4,815 | | | $ | 842,673 | |
| Autohome, Inc., ADR | | | 503 | | | | 41,553 | |
| Baidu, Inc., ADR (a) | | | 232 | | | | 52,543 | |
| NAVER Corp. | | | 418 | | | | 282,384 | |
| Tencent Holdings Ltd. | | | 30,200 | | | | 1,308,234 | |
| YY, Inc., ADR (a) | | | 1,183 | | | | 90,417 | |
| | | | | | | | |
| | | | | | | $ | 2,617,804 | |
| Machinery & Tools - 3.0% | | | | | | | | |
| Far Eastern New Century Corp. | | | 129,000 | | | $ | 150,147 | |
| Lonking Holdings Ltd. | | | 325,000 | | | | 111,801 | |
| PT United Tractors Tbk | | | 97,300 | | | | 227,231 | |
| Sinotruk Hong Kong Ltd. | | | 73,000 | | | | 109,006 | |
| Weichai Power Co. Ltd., “H” | | | 111,000 | | | | 117,665 | |
| | | | | | | | |
| | | | | | | $ | 715,850 | |
| Major Banks - 7.0% | | | | | | | | |
| ABSA Group Ltd. | | | 22,658 | | | $ | 250,633 | |
| Bank of China Ltd. | | | 411,000 | | | | 184,848 | |
14
Portfolio of Investments – continued
| | | | | | | | |
| Issuer | | Shares/Par | | | Value ($) | |
| Common Stocks - continued | | | | | | | | |
| Major Banks - continued | | | | | | | | |
| China Construction Bank | | | 749,000 | | | $ | 663,233 | |
| Industrial & Commercial Bank of China, “H” | | | 600,000 | | | | 441,854 | |
| Nedbank Group Ltd. | | | 6,423 | | | | 121,502 | |
| | | | | | | | |
| | | | | | | $ | 1,662,070 | |
| Metals & Mining - 3.1% | | | | | | | | |
| Kumba Iron Ore Ltd. | | | 4,021 | | | $ | 72,537 | |
| POSCO | | | 991 | | | | 290,672 | |
| Tata Steel Ltd. | | | 19,951 | | | | 168,916 | |
| Vale S.A., ADR | | | 9,987 | | | | 131,828 | |
| Vedanta Ltd. | | | 22,654 | | | | 72,728 | |
| | | | | | | | |
| | | | | | | $ | 736,681 | |
| Network & Telecom - 0.3% | | | | | | | | |
| VTech Holdings Ltd. | | | 5,300 | | | $ | 58,647 | |
| | |
| Other Banks & Diversified Financials - 9.5% | | | | | | | | |
| Agricultural Bank of China Ltd., “H” | | | 205,000 | | | $ | 99,251 | |
| Banco Macro S.A., ADR | | | 844 | | | | 36,832 | |
| Bangkok Bank Public Co. Ltd. | | | 17,800 | | | | 113,119 | |
| China CITIC Bank Corp. Ltd., “H” | | | 151,000 | | | | 94,270 | |
| Credicorp Ltd. | | | 1,300 | | | | 283,426 | |
| FirstRand Ltd. | | | 37,791 | | | | 181,819 | |
| Grupo Financiero Banorte S.A. de C.V. | | | 29,749 | | | | 203,764 | |
| Hana Financial Group, Inc. | | | 4,275 | | | | 163,987 | |
| HDFC Bank Ltd., ADR | | | 1,793 | | | | 181,577 | |
| Industrial Bank of Korea | | | 7,917 | | | | 105,972 | |
| Kasikornbank Co. Ltd. | | | 47,700 | | | | 308,964 | |
| Rural Electrification Corp. Ltd. | | | 47,279 | | | | 79,858 | |
| Sberbank of Russia, ADR | | | 26,279 | | | | 285,259 | |
| Turkiye Garanti Bankasi A.S. | | | 48,564 | | | | 44,007 | |
| Union National Bank | | | 92,473 | | | | 92,142 | |
| | | | | | | | |
| | | | | | | $ | 2,274,247 | |
| Pharmaceuticals - 1.5% | | | | | | | | |
| Genomma Lab Internacional S.A., “B” (a) | | | 131,035 | | | $ | 113,441 | |
| Hypermarcas S.A. | | | 14,000 | | | | 94,179 | |
| Luye Pharma Group Ltd. | | | 98,530 | | | | 92,771 | |
| Sihuan Pharmaceutical Holdings Group Ltd. | | | 307,000 | | | | 68,059 | |
| | | | | | | | |
| | | | | | | $ | 368,450 | |
| Precious Metals & Minerals - 0.2% | | | | | | | | |
| Gold Fields Ltd., ADR | | | 22,209 | | | $ | 55,301 | |
15
Portfolio of Investments – continued
| | | | | | | | |
| Issuer | | Shares/Par | | | Value ($) | |
| Common Stocks - continued | | | | | | | | |
| Real Estate - 2.9% | | | | | | | | |
| Agile Property Holdings Ltd. | | | 54,000 | | | $ | 88,203 | |
| Atrium European Real Estate Ltd. | | | 25,984 | | | | 115,818 | |
| Cifi Holdings Group Co. Ltd. | | | 94,000 | | | | 54,493 | |
| Concentradora Fibra Danhos S.A. de C.V., REIT | | | 42,324 | | | | 70,004 | |
| Country Garden Holdings Co. Ltd. | | | 90,000 | | | | 133,932 | |
| Fibra Uno Administracion S.A. | | | 181,174 | | | | 237,642 | |
| | | | | | | | |
| | | | | | | $ | 700,092 | |
| Specialty Chemicals - 2.2% | | | | | | | | |
| Formosa Plastics Corp. | | | 73,000 | | | $ | 267,377 | |
| PTT Global Chemical PLC | | | 106,600 | | | | 266,256 | |
| | | | | | | | |
| | | | | | | $ | 533,633 | |
| Specialty Stores - 0.4% | | | | | | | | |
| Via Varejo S.A. | | | 22,900 | | | $ | 95,016 | |
| | |
| Telecommunications - Wireless - 2.4% | | | | | | | | |
| Advanced Info Service PLC | | | 51,600 | | | $ | 318,460 | |
| Mobile TeleSystems PJSC, ADR | | | 13,090 | | | | 101,448 | |
| Play Communications S.A. | | | 9,543 | | | | 55,867 | |
| SK Telecom Co. Ltd. | | | 311 | | | | 73,339 | |
| Turkcell Iletisim Hizmetleri A.S. | | | 16,766 | | | | 27,066 | |
| | | | | | | | |
| | | | | | | $ | 576,180 | |
| Telephone Services - 1.3% | | | | | | | | |
| China Unicom (Hong Kong) Ltd. | | | 106,000 | | | $ | 123,304 | |
| KT Corp., ADR | | | 4,952 | | | | 68,387 | |
| Telekomunikacja Polska S.A. (a) | | | 82,759 | | | | 108,509 | |
| | | | | | | | |
| | | | | | | $ | 300,200 | |
| Tobacco - 1.8% | | | | | | | | |
| ITC Ltd. | | | 78,909 | | | $ | 355,849 | |
| PT Gudang Garam Tbk | | | 12,800 | | | | 63,435 | |
| | | | | | | | |
| | | | | | | $ | 419,284 | |
| Unknown Industry Major - 0.4% | | | | | | | | |
| Fila Korea Ltd. | | | 2,563 | | | $ | 96,128 | |
| | |
| Utilities - Electric Power - 2.5% | | | | | | | | |
| China Longyuan Power Group | | | 331,000 | | | $ | 278,759 | |
| Engie Brasil Energia S.A. | | | 11,200 | | | | 101,466 | |
| NTPC Ltd. | | | 92,276 | | | | 223,124 | |
| | | | | | | | |
| | | | | | | $ | 603,349 | |
| Total Common Stocks (Identified Cost, $20,989,738) | | | | | | $ | 22,923,820 | |
16
Portfolio of Investments – continued
| | | | | | | | |
| Preferred Stocks - 3.7% | | | | | | | | |
| Issuer | | Shares/Par | | | Value ($) | |
| Electronics - 0.7% | | | | | | | | |
| Samsung Electronics Co. Ltd. | | | 4,453 | | | $ | 158,814 | |
| | |
| Food & Drug Stores - 1.2% | | | | | | | | |
| Cia Brasileira de Distribuicao | | | 14,100 | | | $ | 282,720 | |
| | |
| Major Banks - 0.3% | | | | | | | | |
| Banco Bradesco S.A. | | | 10,797 | | | $ | 75,230 | |
| | |
| Telephone Services - 1.0% | | | | | | | | |
| Telefonica Brasil S.A | | | 24,800 | | | $ | 243,671 | |
| | |
| Utilities - Electric Power - 0.5% | | | | | | | | |
| Companhia Energetica de Minas Gerais | | | 32,600 | | | $ | 59,708 | |
| Companhia Paranaense de Energia | | | 11,000 | | | | 55,066 | |
| | | | | | | | |
| | | | | | | $ | 114,774 | |
| Total Preferred Stocks (Identified Cost, $988,130) | | | | | | $ | 875,209 | |
| | |
| Investment Companies (h) - 0.9% | | | | | | | | |
| Money Market Funds - 0.9% | | | | | | | | |
MFS Institutional Money Market Portfolio, 2.03% (v)
(Identified Cost, $224,167) | | | 224,182 | | | $ | 224,182 | |
| | |
| Other Assets, Less Liabilities - (0.5)% | | | | | | | (114,586 | ) |
| Net Assets - 100.0% | | | | | | $ | 23,908,625 | |
| (a) | Non-income producing security. |
| (h) | An affiliated issuer, which may be considered one in which the fund owns 5% or more of the outstanding voting securities, or a company which is under common control. At period end, the aggregate values of the fund’s investments in affiliated issuers and in unaffiliated issuers were $224,182 and $23,799,029, respectively. |
| (v) | Affiliated issuer that is available only to investment companies managed by MFS. The rate quoted for the MFS Institutional Money Market Portfolio is the annualized seven-day yield of the fund at period end. |
The following abbreviations are used in this report and are defined:
| ADR | | American Depositary Receipt |
| PJSC | | Public Joint Stock Company |
| PLC | | Public Limited Company |
| REIT | | Real Estate Investment Trust |
See Notes to Financial Statements
17
Financial Statements
STATEMENT OF ASSETS AND LIABILITIES
At 8/31/18
This statement represents your fund’s balance sheet, which details the assets and liabilities comprising the total value of the fund.
| | | | |
| Assets | | | | |
Investments in unaffiliated issuers, at value (identified cost, $21,977,868) | | | $23,799,029 | |
Investments in affiliated issuers, at value (identified cost, $224,167) | | | 224,182 | |
Foreign currency, at value (identified cost, $11,444) | | | 11,382 | |
Receivables for | | | | |
Investments sold | | | 14,696 | |
Fund shares sold | | | 24,851 | |
Dividends | | | 27,858 | |
Receivable from investment adviser | | | 44,549 | |
Other assets | | | 57 | |
Total assets | | | $24,146,604 | |
| Liabilities | | | | |
Payables for | | | | |
Fund shares reacquired | | | $90,226 | |
Payable to affiliates | | | | |
Shareholder servicing costs | | | 5,166 | |
Distribution and service fees | | | 70 | |
Payable for independent Trustees’ compensation | | | 7 | |
Deferred country tax expense payable | | | 30,729 | |
Accrued expenses and other liabilities | | | 111,781 | |
Total liabilities | | | $237,979 | |
Net assets | | | $23,908,625 | |
| Net assets consist of | | | | |
Paid-in capital | | | $21,365,489 | |
Unrealized appreciation (depreciation) (net of $30,497 deferred country tax) | | | 1,789,783 | |
Accumulated net realized gain (loss) | | | 364,427 | |
Undistributed net investment income | | | 388,926 | |
Net assets | | | $23,908,625 | |
Shares of beneficial interest outstanding | | | 1,745,169 | |
18
Statement of Assets and Liabilities – continued
| | | | | | | | | | | | |
| | | Net assets | | | Shares
outstanding | | | Net asset value
per share (a) | |
| Class A | | | $7,144,532 | | | | 522,988 | | | | $13.66 | |
| Class B | | | 318,040 | | | | 23,490 | | | | 13.54 | |
| Class C | | | 453,472 | | | | 33,597 | | | | 13.50 | |
| Class I | | | 2,343,233 | | | | 170,861 | | | | 13.71 | |
| Class R1 | | | 71,023 | | | | 5,233 | | | | 13.57 | |
| Class R2 | | | 72,083 | | | | 5,276 | | | | 13.66 | |
| Class R3 | | | 101,690 | | | | 7,428 | | | | 13.69 | |
| Class R4 | | | 82,458 | | | | 6,010 | | | | 13.72 | |
| Class R6 | | | 13,322,094 | | | | 970,286 | | | | 13.73 | |
| (a) | Maximum offering price per share was equal to the net asset value per share for all share classes, except for Class A, for which the maximum offering price per share was $14.49 [100 / 94.25 x $13.66]. On sales of $50,000 or more, the maximum offering price of Class A shares is reduced. A contingent deferred sales charge may be imposed on redemptions of Class A, Class B, and Class C shares. Redemption price per share was equal to the net asset value per share for Classes I, R1, R2, R3, R4, and R6. |
See Notes to Financial Statements
19
Financial Statements
STATEMENT OF OPERATIONS
Year ended 8/31/18
This statement describes how much your fund earned in investment income and accrued in expenses. It also describes any gains and/or losses generated by fund operations.
| | | | |
| Net investment income (loss) | | | | |
Income | | | | |
Dividends | | | $729,959 | |
Dividends from affiliated issuers | | | 6,224 | |
Other | | | 3,374 | |
Foreign taxes withheld | | | (78,153 | ) |
Total investment income | | | $661,404 | |
Expenses | | | | |
Management fee | | | $176,057 | |
Distribution and service fees | | | 29,450 | |
Shareholder servicing costs | | | 14,549 | |
Administrative services fee | | | 17,500 | |
Independent Trustees’ compensation | | | 1,109 | |
Custodian fee | | | 170,729 | |
Shareholder communications | | | 15,097 | |
Audit and tax fees | | | 76,439 | |
Legal fees | | | 713 | |
Registration fees | | | 123,899 | |
Miscellaneous | | | 20,539 | |
Total expenses | | | $646,081 | |
Reduction of expenses by investment adviser and distributor | | | (395,504 | ) |
Net expenses | | | $250,577 | |
Net investment income (loss) | | | $410,827 | |
| Realized and unrealized gain (loss) | | | | |
Realized gain (loss) (identified cost basis) | | | | |
Unaffiliated issuers (net of $16,381 country tax) | | | $827,779 | |
Affiliated issuers | | | 59 | |
Foreign currency | | | (8,109 | ) |
Net realized gain (loss) | | | $819,729 | |
Change in unrealized appreciation or depreciation | | | | |
Unaffiliated issuers (net of $6,838 increase in deferred country tax) | | | $(1,799,651 | ) |
Affiliated issuers | | | 6 | |
Translation of assets and liabilities in foreign currencies | | | (907 | ) |
Net unrealized gain (loss) | | | $(1,800,552 | ) |
Net realized and unrealized gain (loss) | | | $(980,823 | ) |
Change in net assets from operations | | | $(569,996 | ) |
See Notes to Financial Statements
20
Financial Statements
STATEMENTS OF CHANGES IN NET ASSETS
These statements describe the increases and/or decreases in net assets resulting from operations, any distributions, and any shareholder transactions.
| | | | | | | | |
| | | Year ended | |
| | | 8/31/18 | | | 8/31/17 | |
| Change in net assets | | | | | | |
| From operations | | | | | | | | |
Net investment income (loss) | | | $410,827 | | | | $285,526 | |
Net realized gain (loss) | | | 819,729 | | | | 461,685 | |
Net unrealized gain (loss) | | | (1,800,552 | ) | | | 3,186,730 | |
Change in net assets from operations | | | $(569,996 | ) | | | $3,933,941 | |
| Distributions declared to shareholders | | | | | | | | |
From net investment income | | | $(261,022 | ) | | | $(82,051 | ) |
From net realized gain | | | (694,026 | ) | | | (83,103 | ) |
Total distributions declared to shareholders | | | $(955,048 | ) | | | $(165,154 | ) |
Change in net assets from fund share transactions | | | $6,712,520 | | | | $1,122,019 | |
Total change in net assets | | | $5,187,476 | | | | $4,890,806 | |
| Net assets | | | | | | | | |
At beginning of period | | | 18,721,149 | | | | 13,830,343 | |
At end of period (including undistributed net investment income of $388,926 and $256,608, respectively) | | | $23,908,625 | | | | $18,721,149 | |
See Notes to Financial Statements
21
Financial Statements
FINANCIAL HIGHLIGHTS
The financial highlights table is intended to help you understand the fund’s financial performance for the past 5 years (or life of a particular share class, if shorter). Certain information reflects financial results for a single fund share. The total returns in the table represent the rate that an investor would have earned (or lost) on an investment in the fund share class (assuming reinvestment of all distributions) held for the entire period.
| | | | | | | | | | | | |
| Class A | | Year ended | |
| | | 8/31/18 | | | 8/31/17 | | | 8/31/16 (c) | |
Net asset value, beginning of period | | | $14.37 | | | | $11.37 | | | | $10.00 | |
| Income (loss) from investment operations | | | | | | | | | | | | |
Net investment income (loss) (d) | | | $0.24 | | | | $0.28 | | | | $0.24 | |
Net realized and unrealized gain (loss) | | | (0.32 | ) | | | 2.86 | | | | 1.18 | |
Total from investment operations | | | $(0.08 | ) | | | $3.14 | | | | $1.42 | |
| Less distributions declared to shareholders | | | | | | | | | | | | |
From net investment income | | | $(0.16 | ) | | | $(0.06 | ) | | | $(0.04 | ) |
From net realized gain | | | (0.47 | ) | | | (0.08 | ) | | | (0.01 | ) |
Total distributions declared to shareholders | | | $(0.63 | ) | | | $(0.14 | ) | | | $(0.05 | ) |
Net asset value, end of period (x) | | | $13.66 | | | | $14.37 | | | | $11.37 | |
Total return (%) (r)(s)(t)(x) | | | (0.77 | ) | | | 28.01 | | | | 14.33 | (n) |
Ratios (%) (to average net assets)
and Supplemental data: | | | | | | | | | | | | |
Expenses before expense reductions (f) | | | 2.94 | | | | 3.23 | | | | 6.30 | (a) |
Expenses after expense reductions (f) | | | 1.23 | | | | 1.23 | | | | 1.24 | (a) |
Net investment income (loss) | | | 1.65 | | | | 2.22 | | | | 2.36 | (a) |
Portfolio turnover | | | 58 | | | | 92 | | | | 64 | (n) |
Net assets at end of period (000 omitted) | | | $7,145 | | | | $4,982 | | | | $957 | |
See Notes to Financial Statements
22
Financial Highlights – continued
| | | | | | | | | | | | |
| Class B | | Year ended | |
| | | 8/31/18 | | | 8/31/17 | | | 8/31/16 (c) | |
Net asset value, beginning of period | | | $14.27 | | | | $11.31 | | | | $10.00 | |
| Income (loss) from investment operations | | | | | | | | | | | | |
Net investment income (loss) (d) | | | $0.12 | | | | $0.12 | | | | $0.09 | |
Net realized and unrealized gain (loss) | | | (0.30 | ) | | | 2.92 | | | | 1.25 | |
Total from investment operations | | | $(0.18 | ) | | | $3.04 | | | | $1.34 | |
| Less distributions declared to shareholders | | | | | | | | | | | | |
From net investment income | | | $(0.08 | ) | | | $(0.00 | )(w) | | | $(0.02 | ) |
From net realized gain | | | (0.47 | ) | | | (0.08 | ) | | | (0.01 | ) |
Total distributions declared to shareholders | | | $(0.55 | ) | | | $(0.08 | ) | | | $(0.03 | ) |
Net asset value, end of period (x) | | | $13.54 | | | | $14.27 | | | | $11.31 | |
Total return (%) (r)(s)(t)(x) | | | (1.47 | ) | | | 27.09 | | | | 13.46 | (n) |
Ratios (%) (to average net assets)
and Supplemental data: | | | | | | | | | | | | |
Expenses before expense reductions (f) | | | 3.67 | | | | 4.04 | | | | 7.64 | (a) |
Expenses after expense reductions (f) | | | 1.98 | | | | 1.99 | | | | 1.98 | (a) |
Net investment income (loss) | | | 0.79 | | | | 0.97 | | | | 0.93 | (a) |
Portfolio turnover | | | 58 | | | | 92 | | | | 64 | (n) |
Net assets at end of period (000 omitted) | | | $318 | | | | $213 | | | | $86 | |
| |
| Class C | | Year ended | |
| | | 8/31/18 | | | 8/31/17 | | | 8/31/16 (c) | |
Net asset value, beginning of period | | | $14.23 | | | | $11.31 | | | | $10.00 | |
| Income (loss) from investment operations | | | | | | | | | | | | |
Net investment income (loss) (d) | | | $0.11 | | | | $0.14 | | | | $0.09 | |
Net realized and unrealized gain (loss) | | | (0.29 | ) | | | 2.89 | | | | 1.25 | |
Total from investment operations | | | $(0.18 | ) | | | $3.03 | | | | $1.34 | |
| Less distributions declared to shareholders | | | | | | | | | | | | |
From net investment income | | | $(0.08 | ) | | | $(0.03 | ) | | | $(0.02 | ) |
From net realized gain | | | (0.47 | ) | | | (0.08 | ) | | | (0.01 | ) |
Total distributions declared to shareholders | | | $(0.55 | ) | | | $(0.11 | ) | | | $(0.03 | ) |
Net asset value, end of period (x) | | | $13.50 | | | | $14.23 | | | | $11.31 | |
Total return (%) (r)(s)(t)(x) | | | (1.48 | ) | | | 27.06 | | | | 13.48 | (n) |
Ratios (%) (to average net assets)
and Supplemental data: | | | | | | | | | | | | |
Expenses before expense reductions (f) | | | 3.64 | | | | 4.02 | | | | 7.63 | (a) |
Expenses after expense reductions (f) | | | 1.99 | | | | 1.99 | | | | 1.98 | (a) |
Net investment income (loss) | | | 0.75 | | | | 1.16 | | | | 0.95 | (a) |
Portfolio turnover | | | 58 | | | | 92 | | | | 64 | (n) |
Net assets at end of period (000 omitted) | | | $453 | | | | $438 | | | | $91 | |
See Notes to Financial Statements
23
Financial Highlights – continued
| | | | | | | | | | | | |
| Class I | | Year ended | |
| | | 8/31/18 | | | 8/31/17 | | | 8/31/16 (c) | |
Net asset value, beginning of period | | | $14.41 | | | | $11.38 | | | | $10.00 | |
| Income (loss) from investment operations | | | | | | | | | | | | |
Net investment income (loss) (d) | | | $0.34 | | | | $0.28 | | | | $0.23 | |
Net realized and unrealized gain (loss) | | | (0.39 | ) | | | 2.91 | | | | 1.21 | |
Total from investment operations | | | $(0.05 | ) | | | $3.19 | | | | $1.44 | |
| Less distributions declared to shareholders | | | | | | | | | | | | |
From net investment income | | | $(0.18 | ) | | | $(0.08 | ) | | | $(0.05 | ) |
From net realized gain | | | (0.47 | ) | | | (0.08 | ) | | | (0.01 | ) |
Total distributions declared to shareholders | | | $(0.65 | ) | | | $(0.16 | ) | | | $(0.06 | ) |
Net asset value, end of period (x) | | | $13.71 | | | | $14.41 | | | | $11.38 | |
Total return (%) (r)(s)(t)(x) | | | (0.55 | ) | | | 28.44 | | | | 14.51 | (n) |
Ratios (%) (to average net assets)
and Supplemental data: | | | | | | | | | | | | |
Expenses before expense reductions (f) | | | 2.78 | | | | 3.05 | | | | 6.27 | (a) |
Expenses after expense reductions (f) | | | 0.99 | | | | 0.99 | | | | 0.99 | (a) |
Net investment income (loss) | | | 2.30 | | | | 2.28 | | | | 2.27 | (a) |
Portfolio turnover | | | 58 | | | | 92 | | | | 64 | (n) |
Net assets at end of period (000 omitted) | | | $2,343 | | | | $669 | | | | $436 | |
| |
| Class R1 | | Year ended | |
| | | 8/31/18 | | | 8/31/17 | | | 8/31/16 (c) | |
Net asset value, beginning of period | | | $14.27 | | | | $11.31 | | | | $10.00 | |
| Income (loss) from investment operations | | | | | | | | | | | | |
Net investment income (loss) (d) | | | $0.10 | | | | $0.11 | | | | $0.07 | |
Net realized and unrealized gain (loss) | | | (0.28 | ) | | | 2.93 | | | | 1.27 | |
Total from investment operations | | | $(0.18 | ) | | | $3.04 | | | | $1.34 | |
| Less distributions declared to shareholders | | | | | | | | | | | | |
From net investment income | | | $(0.05 | ) | | | $— | | | | $(0.02 | ) |
From net realized gain | | | (0.47 | ) | | | (0.08 | ) | | | (0.01 | ) |
Total distributions declared to shareholders | | | $(0.52 | ) | | | $(0.08 | ) | | | $(0.03 | ) |
Net asset value, end of period (x) | | | $13.57 | | | | $14.27 | | | | $11.31 | |
Total return (%) (r)(s)(t)(x) | | | (1.49 | ) | | | 27.08 | | | | 13.46 | (n) |
Ratios (%) (to average net assets)
and Supplemental data: | | | | | | | | | | | | |
Expenses before expense reductions (f) | | | 3.64 | | | | 4.06 | | | | 7.86 | (a) |
Expenses after expense reductions (f) | | | 1.99 | | | | 1.99 | | | | 1.97 | (a) |
Net investment income (loss) | | | 0.70 | | | | 0.88 | | | | 0.69 | (a) |
Portfolio turnover | | | 58 | | | | 92 | | | | 64 | (n) |
Net assets at end of period (000 omitted) | | | $71 | | | | $72 | | | | $57 | |
See Notes to Financial Statements
24
Financial Highlights – continued
| | | | | | | | | | | | |
| Class R2 | | Year ended | |
| | | 8/31/18 | | | 8/31/17 | | | 8/31/16 (c) | |
Net asset value, beginning of period | | | $14.36 | | | | $11.35 | | | | $10.00 | |
| Income (loss) from investment operations | | | | | | | | | | | | |
Net investment income (loss) (d) | | | $0.18 | | | | $0.17 | | | | $0.12 | |
Net realized and unrealized gain (loss) | | | (0.30 | ) | | | 2.94 | | | | 1.28 | |
Total from investment operations | | | $(0.12 | ) | | | $3.11 | | | | $1.40 | |
| Less distributions declared to shareholders | | | | | | | | | | | | |
From net investment income | | | $(0.11 | ) | | | $(0.02 | ) | | | $(0.04 | ) |
From net realized gain | | | (0.47 | ) | | | (0.08 | ) | | | (0.01 | ) |
Total distributions declared to shareholders | | | $(0.58 | ) | | | $(0.10 | ) | | | $(0.05 | ) |
Net asset value, end of period (x) | | | $13.66 | | | | $14.36 | | | | $11.35 | |
Total return (%) (r)(s)(t)(x) | | | (1.03 | ) | | | 27.71 | | | | 14.04 | (n) |
Ratios (%) (to average net assets)
and Supplemental data: | | | | | | | | | | | | |
Expenses before expense reductions (f) | | | 3.14 | | | | 3.56 | | | | 7.36 | (a) |
Expenses after expense reductions (f) | | | 1.49 | | | | 1.49 | | | | 1.47 | (a) |
Net investment income (loss) | | | 1.20 | | | | 1.38 | | | | 1.19 | (a) |
Portfolio turnover | | | 58 | | | | 92 | | | | 64 | (n) |
Net assets at end of period (000 omitted) | | | $72 | | | | $73 | | | | $57 | |
| |
| Class R3 | | Year ended | |
| | | 8/31/18 | | | 8/31/17 | | | 8/31/16 (c) | |
Net asset value, beginning of period | | | $14.39 | | | | $11.37 | | | | $10.00 | |
| Income (loss) from investment operations | | | | | | | | | | | | |
Net investment income (loss) (d) | | | $0.24 | | | | $0.20 | | | | $0.14 | |
Net realized and unrealized gain (loss) | | | (0.32 | ) | | | 2.95 | | | | 1.28 | |
Total from investment operations | | | $(0.08 | ) | | | $3.15 | | | | $1.42 | |
| Less distributions declared to shareholders | | | | | | | | | | | | |
From net investment income | | | $(0.15 | ) | | | $(0.05 | ) | | | $(0.04 | ) |
From net realized gain | | | (0.47 | ) | | | (0.08 | ) | | | (0.01 | ) |
Total distributions declared to shareholders | | | $(0.62 | ) | | | $(0.13 | ) | | | $(0.05 | ) |
Net asset value, end of period (x) | | | $13.69 | | | | $14.39 | | | | $11.37 | |
Total return (%) (r)(s)(t)(x) | | | (0.80 | ) | | | 28.05 | | | | 14.32 | (n) |
Ratios (%) (to average net assets)
and Supplemental data: | | | | | | | | | | | | |
Expenses before expense reductions (f) | | | 2.94 | | | | 3.31 | | | | 7.11 | (a) |
Expenses after expense reductions (f) | | | 1.24 | | | | 1.24 | | | | 1.22 | (a) |
Net investment income (loss) | | | 1.66 | | | | 1.63 | | | | 1.44 | (a) |
Portfolio turnover | | | 58 | | | | 92 | | | | 64 | (n) |
Net assets at end of period (000 omitted) | | | $102 | | | | $73 | | | | $57 | |
See Notes to Financial Statements
25
Financial Highlights – continued
| | | | | | | | | | | | |
| Class R4 | | Year ended | |
| | | 8/31/18 | | | 8/31/17 | | | 8/31/16 (c) | |
Net asset value, beginning of period | | | $14.41 | | | | $11.38 | | | | $10.00 | |
| Income (loss) from investment operations | | | | | | | | | | | | |
Net investment income (loss) (d) | | | $0.26 | | | | $0.23 | | | | $0.17 | |
Net realized and unrealized gain (loss) | | | (0.30 | ) | | | 2.96 | | | | 1.27 | |
Total from investment operations | | | $(0.04 | ) | | | $3.19 | | | | $1.44 | |
| Less distributions declared to shareholders | | | | | | | | | | | | |
From net investment income | | | $(0.18 | ) | | | $(0.08 | ) | | | $(0.05 | ) |
From net realized gain | | | (0.47 | ) | | | (0.08 | ) | | | (0.01 | ) |
Total distributions declared to shareholders | | | $(0.65 | ) | | | $(0.16 | ) | | | $(0.06 | ) |
Net asset value, end of period (x) | | | $13.72 | | | | $14.41 | | | | $11.38 | |
Total return (%) (r)(s)(t)(x) | | | (0.50 | ) | | | 28.42 | | | | 14.51 | (n) |
Ratios (%) (to average net assets)
and Supplemental data: | | | | | | | | | | | | |
Expenses before expense reductions (f) | | | 2.66 | | | | 3.06 | | | | 6.86 | (a) |
Expenses after expense reductions (f) | | | 0.99 | | | | 0.99 | | | | 0.97 | (a) |
Net investment income (loss) | | | 1.76 | | | | 1.89 | | | | 1.69 | (a) |
Portfolio turnover | | | 58 | | | | 92 | | | | 64 | (n) |
Net assets at end of period (000 omitted) | | | $82 | | | | $74 | | | | $57 | |
| |
| Class R6 | | Year ended | |
| | | 8/31/18 | | | 8/31/17 | | | 8/31/16 (c) | |
Net asset value, beginning of period | | | $14.42 | | | | $11.39 | | | | $10.00 | |
| Income (loss) from investment operations | | | | | | | | | | | | |
Net investment income (loss) (d) | | | $0.27 | | | | $0.24 | | | | $0.16 | |
Net realized and unrealized gain (loss) | | | (0.30 | ) | | | 2.95 | | | | 1.29 | |
Total from investment operations | | | $(0.03 | ) | | | $3.19 | | | | $1.45 | |
| Less distributions declared to shareholders | | | | | | | | | | | | |
From net investment income | | | $(0.19 | ) | | | $(0.08 | ) | | | $(0.05 | ) |
From net realized gain | | | (0.47 | ) | | | (0.08 | ) | | | (0.01 | ) |
Total distributions declared to shareholders | | | $(0.66 | ) | | | $(0.16 | ) | | | $(0.06 | ) |
Net asset value, end of period (x) | | | $13.73 | | | | $14.42 | | | | $11.39 | |
Total return (%) (r)(s)(t)(x) | | | (0.42 | ) | | | 28.45 | | | | 14.62 | (n) |
Ratios (%) (to average net assets)
and Supplemental data: | | | | | | | | | | | | |
Expenses before expense reductions (f) | | | 2.56 | | | | 2.98 | | | | 6.84 | (a) |
Expenses after expense reductions (f) | | | 0.90 | | | | 0.91 | | | | 0.94 | (a) |
Net investment income (loss) | | | 1.81 | | | | 1.97 | | | | 1.59 | (a) |
Portfolio turnover | | | 58 | | | | 92 | | | | 64 | (n) |
Net assets at end of period (000 omitted) | | | $13,322 | | | | $12,127 | | | | $12,031 | |
See Notes to Financial Statements
26
Financial Highlights – continued
| (c) | For the period from the commencement of the fund’s investment operations, September 15, 2015, through the stated period end. |
| (d) | Per share data is based on average shares outstanding. |
| (f) | Ratios do not reflect reductions from fees paid indirectly, if applicable. |
| (r) | Certain expenses have been reduced without which performance would have been lower. |
| (s) | From time to time the fund may receive proceeds from litigation settlements, without which performance would be lower. |
| (t) | Total returns do not include any applicable sales charges. |
| (w) | Per share amount was less than $0.01. |
| (x) | The net asset values and total returns have been calculated on net assets which include adjustments made in accordance with U.S. generally accepted accounting principles required at period end for financial reporting purposes. |
See Notes to Financial Statements
27
NOTES TO FINANCIAL STATEMENTS
(1) Business and Organization
MFS Blended Research Emerging Markets Equity Fund (the fund) is a diversified series of MFS Series Trust IV (the trust). The trust is organized as a Massachusetts business trust and is registered under the Investment Company Act of 1940, as amended, as an open-end management investment company.
The fund is an investment company and accordingly follows the investment company accounting and reporting guidance of the Financial Accounting Standards Board (FASB) Accounting Standards Codification Topic 946 Financial Services – Investment Companies.
(2) Significant Accounting Policies
General – The preparation of financial statements in conformity with U.S. generally accepted accounting principles requires management to make estimates and assumptions that affect the reported amounts of assets and liabilities, and disclosure of contingent assets and liabilities at the date of the financial statements and the reported amounts of increases and decreases in net assets from operations during the reporting period. Actual results could differ from those estimates. In the preparation of these financial statements, management has evaluated subsequent events occurring after the date of the fund’s Statement of Assets and Liabilities through the date that the financial statements were issued. The fund invests in foreign securities, including securities of emerging market issuers. Investments in foreign securities are vulnerable to the effects of changes in the relative values of the local currency and the U.S. dollar and to the effects of changes in each country’s market, economic, industrial, political, regulatory, geopolitical, and other conditions. Investments in emerging markets can involve additional and greater risks than the risks associated with investments in developed foreign markets. Emerging markets can have less developed markets, greater custody and operational risk, less developed legal, regulatory, and accounting systems, and greater political, social, and economic instability than developed markets.
In August 2018, the FASB issued Accounting Standards Update 2018-13, Fair Value Measurement (Topic 820) – Disclosure Framework – Changes to the Disclosure Requirements for Fair Value Measurement (“ASU 2018-13”) which introduces new fair value disclosure requirements as well as eliminates and modifies certain existing fair value disclosure requirements. ASU 2018-13 would be effective for fiscal years beginning after December 15, 2019, and interim periods within those fiscal years; however, management has elected to early adopt ASU 2018-13 effective with the current reporting period. The impact of the fund’s adoption was limited to changes in the fund’s financial statement disclosures regarding fair value, primarily those disclosures related to transfers between levels of the fair value hierarchy.
Balance Sheet Offsetting – The fund’s accounting policy with respect to balance sheet offsetting is that, absent an event of default by the counterparty or a termination of the agreement, the International Swaps and Derivatives Association (ISDA) Master Agreement, or similar agreement, does not result in an offset of reported amounts of financial assets and financial liabilities in the Statement of Assets and Liabilities across transactions between the fund and the applicable counterparty. The fund’s right to setoff may be restricted or prohibited by the bankruptcy or insolvency laws of the
28
Notes to Financial Statements – continued
particular jurisdiction to which a specific master netting agreement counterparty is subject. Balance sheet offsetting disclosures, to the extent applicable to the fund, have been included in the fund’s Significant Accounting Policies note under the captions for each of the fund’s in-scope financial instruments and transactions.
Investment Valuations – Equity securities, including restricted equity securities, are generally valued at the last sale or official closing price on their primary market or exchange as provided by a third-party pricing service. Equity securities, for which there were no sales reported that day, are generally valued at the last quoted daily bid quotation on their primary market or exchange as provided by a third-party pricing service. Short-term instruments with a maturity at issuance of 60 days or less may be valued at amortized cost, which approximates market value. Open-end investment companies are generally valued at net asset value per share. Securities and other assets generally valued on the basis of information from a third-party pricing service may also be valued at a broker/dealer bid quotation. In determining values, third-party pricing services can utilize both transaction data and market information such as yield, quality, coupon rate, maturity, type of issue, trading characteristics, and other market data. The values of foreign securities and other assets and liabilities expressed in foreign currencies are converted to U.S. dollars using the mean of bid and asked prices for rates provided by a third-party pricing service.
The Board of Trustees has delegated primary responsibility for determining or causing to be determined the value of the fund’s investments (including any fair valuation) to the adviser pursuant to valuation policies and procedures approved by the Board. If the adviser determines that reliable market quotations are not readily available, investments are valued at fair value as determined in good faith by the adviser in accordance with such procedures under the oversight of the Board of Trustees. Under the fund’s valuation policies and procedures, market quotations are not considered to be readily available for most types of debt instruments and floating rate loans and many types of derivatives. These investments are generally valued at fair value based on information from third-party pricing services. In addition, investments may be valued at fair value if the adviser determines that an investment’s value has been materially affected by events occurring after the close of the exchange or market on which the investment is principally traded (such as foreign exchange or market) and prior to the determination of the fund’s net asset value, or after the halting of trading of a specific security where trading does not resume prior to the close of the exchange or market on which the security is principally traded. Events that occur on a frequent basis after foreign markets close (such as developments in foreign markets and significant movements in the U.S. markets) and prior to the determination of the fund’s net asset value may be deemed to have a material effect on the value of securities traded in foreign markets. Accordingly, the fund’s foreign equity securities may often be valued at fair value. The adviser generally relies on third-party pricing services or other information (such as the correlation with price movements of similar securities in the same or other markets; the type, cost and investment characteristics of the security; the business and financial condition of the issuer; and trading and other market data) to assist in determining whether to fair value and at what value to fair value an investment. The value of an investment for purposes of calculating the fund’s net asset value can differ depending on the source and method used to determine value. When fair valuation is used, the
29
Notes to Financial Statements – continued
value of an investment used to determine the fund’s net asset value may differ from quoted or published prices for the same investment. There can be no assurance that the fund could obtain the fair value assigned to an investment if it were to sell the investment at the same time at which the fund determines its net asset value per share.
Various inputs are used in determining the value of the fund’s assets or liabilities. These inputs are categorized into three broad levels. In certain cases, the inputs used to measure fair value may fall into different levels of the fair value hierarchy. In such cases, an investment’s level within the fair value hierarchy is based on the lowest level of input that is significant to the fair value measurement. The fund’s assessment of the significance of a particular input to the fair value measurement in its entirety requires judgment, and considers factors specific to the investment. Level 1 includes unadjusted quoted prices in active markets for identical assets or liabilities. Level 2 includes other significant observable market-based inputs (including quoted prices for similar securities, interest rates, prepayment speed, and credit risk). Level 3 includes unobservable inputs, which may include the adviser’s own assumptions in determining the fair value of investments. Other financial instruments are derivative instruments, such as futures contracts, forward foreign currency exchange contracts, and written options. The following is a summary of the levels used as of August 31, 2018 in valuing the fund’s assets or liabilities:
| | | | | | | | | | | | | | | | |
| Financial Instruments | | Level 1 | | | Level 2 | | | Level 3 | | | Total | |
| Equity Securities: | | | | | | | | | | | | | | | | |
China | | | $7,745,307 | | | | $— | | | | $— | | | | $7,745,307 | |
South Korea | | | 3,649,138 | | | | — | | | | — | | | | 3,649,138 | |
Taiwan | | | 2,594,848 | | | | — | | | | — | | | | 2,594,848 | |
India | | | 1,941,961 | | | | — | | | | — | | | | 1,941,961 | |
South Africa | | | 1,436,986 | | | | — | | | | — | | | | 1,436,986 | |
Brazil | | | 1,420,374 | | | | — | | | | — | | | | 1,420,374 | |
Mexico | | | 1,026,928 | | | | — | | | | — | | | | 1,026,928 | |
Thailand | | | 422,084 | | | | 584,716 | | | | — | | | | 1,006,800 | |
Russia | | | 913,452 | | | | — | | | | — | | | | 913,452 | |
Other Countries | | | 2,063,235 | | | | — | | | | — | | | | 2,063,235 | |
| Mutual Funds | | | 224,182 | | | | — | | | | — | | | | 224,182 | |
| Total | | | $23,438,495 | | | | $584,716 | | | | $— | | | | $24,023,211 | |
For further information regarding security characteristics, see the Portfolio of Investments.
Foreign Currency Translation – Purchases and sales of foreign investments, income, and expenses are converted into U.S. dollars based upon currency exchange rates prevailing on the respective dates of such transactions or on the reporting date for foreign denominated receivables and payables. Gains and losses attributable to foreign currency exchange rates on sales of securities are recorded for financial statement purposes as net realized gains and losses on investments. Gains and losses attributable to foreign exchange rate movements on receivables, payables, income and expenses are recorded for financial statement purposes as foreign currency transaction gains and losses. That portion of both realized and unrealized gains and losses on investments that results from fluctuations in foreign currency exchange rates is not separately disclosed.
30
Notes to Financial Statements – continued
Indemnifications – Under the fund’s organizational documents, its officers and Trustees may be indemnified against certain liabilities and expenses arising out of the performance of their duties to the fund. Additionally, in the normal course of business, the fund enters into agreements with service providers that may contain indemnification clauses. The fund’s maximum exposure under these agreements is unknown as this would involve future claims that may be made against the fund that have not yet occurred.
Investment Transactions and Income – Investment transactions are recorded on the trade date. Dividends received in cash are recorded on the ex-dividend date. Certain dividends from foreign securities will be recorded when the fund is informed of the dividend if such information is obtained subsequent to the ex-dividend date. Dividend payments received in additional securities are recorded on the ex-dividend date in an amount equal to the value of the security on such date.
The fund may receive proceeds from litigation settlements. Any proceeds received from litigation involving portfolio holdings are reflected in the Statement of Operations in realized gain/loss if the security has been disposed of by the fund or in unrealized gain/loss if the security is still held by the fund. Any other proceeds from litigation not related to portfolio holdings are reflected as other income in the Statement of Operations.
Tax Matters and Distributions – The fund intends to qualify as a regulated investment company, as defined under Subchapter M of the Internal Revenue Code, and to distribute all of its taxable income, including realized capital gains. As a result, no provision for federal income tax is required. The fund’s federal tax returns, when filed, will remain subject to examination by the Internal Revenue Service for a three year period. Management has analyzed the fund’s tax positions taken on federal and state tax returns for all open tax years and does not believe that there are any uncertain tax positions that require recognition of a tax liability. Foreign taxes, if any, have been accrued by the fund in the accompanying financial statements in accordance with the applicable foreign tax law. Foreign income taxes may be withheld by certain countries in which the fund invests. Additionally, capital gains realized by the fund on securities issued in or by certain foreign countries may be subject to capital gains tax imposed by those countries.
Distributions to shareholders are recorded on the ex-dividend date. Income and capital gain distributions are determined in accordance with income tax regulations, which may differ from U.S. generally accepted accounting principles. Certain capital accounts in the financial statements are periodically adjusted for permanent differences in order to reflect their tax character. These adjustments have no impact on net assets or net asset value per share. Temporary differences which arise from recognizing certain items of income, expense, gain or loss in different periods for financial statement and tax purposes will reverse at some time in the future. Distributions in excess of net investment income or net realized gains are temporary overdistributions for financial statement purposes resulting from differences in the recognition or classification of income or distributions for financial statement and tax purposes.
Book/tax differences primarily relate to wash sale loss deferrals and treating a portion of the proceeds from redemptions as a distribution for tax purposes.
31
Notes to Financial Statements – continued
The tax character of distributions declared to shareholders for the last two fiscal years is as follows:
| | | | | | | | |
| | | Year ended | | | Year ended | |
| | | 8/31/18 | | | 8/31/17 | |
| Ordinary income (including any short-term capital gains) | | | $785,036 | | | | $162,103 | |
| Long-term capital gains | | | 170,012 | | | | 3,051 | |
| Total distributions | | | $955,048 | | | | $165,154 | |
The federal tax cost and the tax basis components of distributable earnings were as follows:
| | | | |
| As of 8/31/18 | | | |
| Cost of investments | | | $22,471,038 | |
| Gross appreciation | | | 3,032,528 | |
| Gross depreciation | | | (1,480,355 | ) |
| Net unrealized appreciation (depreciation) | | | $1,552,173 | |
| Undistributed ordinary income | | | 556,416 | |
| Undistributed long-term capital gain | | | 436,219 | |
| Other temporary differences | | | (1,672 | ) |
Multiple Classes of Shares of Beneficial Interest – The fund offers multiple classes of shares, which differ in their respective distribution and service fees. The fund’s income, realized and unrealized gain (loss), and common expenses are allocated to shareholders based on the daily net assets of each class. Dividends are declared separately for each class. Differences in per share dividend rates are generally due to differences in separate class expenses. Class B shares will convert to Class A shares approximately eight years after purchase. Effective April 23, 2018, Class C shares will convert to Class A shares approximately ten years after purchase. The fund’s distributions declared to shareholders as reported in the Statements of Changes in Net Assets are presented by class as follows:
| | | | | | | | | | | | | | | | |
| | | From net investment
income | | | From net realized
gain | |
| | | Year
ended
8/31/18 | | | Year
ended
8/31/17 | | | Year
ended
8/31/18 | | | Year
ended
8/31/17 | |
| Class A | | | $65,346 | | | | $6,529 | | | | $192,268 | | | | $8,158 | |
| Class B | | | 1,511 | | | | 14 | | | | 8,834 | | | | 816 | |
| Class C | | | 2,780 | | | | 566 | | | | 16,524 | | | | 1,497 | |
| Class I | | | 16,485 | | | | 4,482 | | | | 42,692 | | | | 4,463 | |
| Class R1 | | | 229 | | | | — | | | | 2,373 | | | | 393 | |
| Class R2 | | | 567 | | | | 123 | | | | 2,382 | | | | 394 | |
| Class R3 | | | 739 | | | | 256 | | | | 2,389 | | | | 394 | |
| Class R4 | | | 913 | | | | 389 | | | | 2,397 | | | | 395 | |
| Class R6 | | | 172,452 | | | | 69,692 | | | | 424,167 | | | | 66,593 | |
| Total | | | $261,022 | | | | $82,051 | | | | $694,026 | | | | $83,103 | |
32
Notes to Financial Statements – continued
(3) Transactions with Affiliates
Investment Adviser – The fund has an investment advisory agreement with MFS to provide overall investment management and related administrative services and facilities to the fund. The management fee is computed daily and paid monthly at the following annual rates based on the fund’s average daily net assets:
| | | | |
| Up to $1 billion | | | 0.75 | % |
| In excess of $1 billion and up to $2.5 billion | | | 0.70 | % |
| In excess of $2.5 billion | | | 0.675 | % |
MFS has agreed in writing to reduce its management fee by a specified amount if certain MFS mutual fund assets exceed thresholds agreed to by MFS and the fund’s Board of Trustees. For the year ended August 31, 2018, this management fee reduction amounted to $2,141, which is included in the reduction of total expenses in the Statement of Operations. The management fee incurred for the year ended August 31, 2018 was equivalent to an annual effective rate of 0.74% of the fund’s average daily net assets.
The investment adviser has agreed in writing to pay a portion of the fund’s total annual operating expenses, excluding interest, taxes, extraordinary expenses, brokerage and transaction costs, and investment-related expenses, such that total fund operating expenses do not exceed the following rates annually of each class’s average daily net assets:
| | | | | | | | | | | | | | | | | | | | | | | | | | | | | | | | | | |
| Classes | |
| A | | | B | | | C | | | I | | | R1 | | | R2 | | | R3 | | | R4 | | | R6 | |
| | 1.24% | | | | 1.99 | % | | | 1.99 | % | | | 0.99 | % | | | 1.99 | % | | | 1.49 | % | | | 1.24 | % | | | 0.99 | % | | | 0.95 | % |
This written agreement will continue until modified by the fund’s Board of Trustees, but such agreement will continue at least until December 31, 2019. For the year ended August 31, 2018, this reduction amounted to $392,747, which is included in the reduction of total expenses in the Statement of Operations.
Distributor – MFS Fund Distributors, Inc. (MFD), a wholly-owned subsidiary of MFS, as distributor, received $6,715 for the year ended August 31, 2018, as its portion of the initial sales charge on sales of Class A shares of the fund.
The Board of Trustees has adopted a distribution plan for certain share classes pursuant to Rule 12b-1 of the Investment Company Act of 1940.
The fund’s distribution plan provides that the fund will pay MFD for services provided by MFD and financial intermediaries in connection with the distribution and servicing of certain share classes. One component of the plan is a distribution fee paid to MFD and another component of the plan is a service fee paid to MFD. MFD may subsequently pay all, or a portion, of the distribution and/or service fees to financial intermediaries.
33
Notes to Financial Statements – continued
Distribution Plan Fee Table:
| | | | | | | | | | | | | | | | | | | | |
| | | Distribution
Fee Rate (d) | | | Service
Fee Rate (d) | | | Total
Distribution
Plan (d) | | | Annual
Effective
Rate (e) | | | Distribution
and Service
Fee | |
| Class A | | | — | | | | 0.25% | | | | 0.25% | | | | 0.24% | | | | $19,095 | |
| Class B | | | 0.75% | | | | 0.25% | | | | 1.00% | | | | 0.99% | | | | 3,047 | |
| Class C | | | 0.75% | | | | 0.25% | | | | 1.00% | | | | 1.00% | | | | 5,927 | |
| Class R1 | | | 0.75% | | | | 0.25% | | | | 1.00% | | | | 1.00% | | | | 758 | |
| Class R2 | | | 0.25% | | | | 0.25% | | | | 0.50% | | | | 0.50% | | | | 384 | |
| Class R3 | | | — | | | | 0.25% | | | | 0.25% | | | | 0.25% | | | | 239 | |
| Total Distribution and Service Fees | | | | | | | | | | | | $29,450 | |
| (d) | In accordance with the distribution plan for certain classes, the fund pays distribution and/or service fees equal to these annual percentage rates of each class’s average daily net assets. The distribution and service fee rates disclosed by class represent the current rates in effect at the end of the reporting period. Any rate changes, if applicable, are detailed below. |
| (e) | The annual effective rates represent actual fees incurred under the distribution plan for the year ended August 31, 2018 based on each class’s average daily net assets. MFD has voluntarily agreed to rebate a portion of each class’s 0.25% service fee attributable to accounts for which MFD retains the 0.25% service fee except for accounts attributable to MFS or its affiliates’ seed money. For the year ended August 31, 2018, this rebate amounted to $595, $20, and $1 for Class A, Class B, and Class C, respectively, and is included in the reduction of total expenses in the Statement of Operations. |
Certain Class A shares are subject to a contingent deferred sales charge (CDSC) in the event of a shareholder redemption within 18 months of purchase. Class B shares are subject to a CDSC in the event of a shareholder redemption within six years of purchase. Class C shares are subject to a CDSC in the event of a shareholder redemption within 12 months of purchase. All contingent deferred sales charges are paid to MFD and during the year ended August 31, 2018, were as follows:
| | | | |
| | | Amount | |
| Class A | | | $392 | |
| Class B | | | 3,669 | |
| Class C | | | 362 | |
Shareholder Servicing Agent – MFS Service Center, Inc. (MFSC), a wholly-owned subsidiary of MFS, receives a fee from the fund for its services as shareholder servicing agent calculated as a percentage of the average daily net assets of the fund as determined periodically under the supervision of the fund’s Board of Trustees. For the year ended August 31, 2018, the fee was $2,520, which equated to 0.0107% annually of the fund’s average daily net assets. MFSC also receives payment from the fund for out-of-pocket expenses, sub-accounting and other shareholder servicing costs which may be paid to affiliated and unaffiliated service providers. Class R6 shares do not incur sub-accounting fees. For the year ended August 31, 2018, these out-of-pocket expenses, sub-accounting and other shareholder servicing costs amounted to $12,029.
Administrator – MFS provides certain financial, legal, shareholder communications, compliance, and other administrative services to the fund. Under an administrative services agreement, the fund reimburses MFS the costs incurred to provide these
services. The fund is charged an annual fixed amount of $17,500 plus a fee based on
34
Notes to Financial Statements – continued
average daily net assets. The administrative services fee incurred for the year ended August 31, 2018 was equivalent to an annual effective rate of 0.0745% of the fund’s average daily net assets.
Trustees’ and Officers’ Compensation – The fund pays compensation to independent Trustees in the form of a retainer, attendance fees, and additional compensation to Board and Committee chairpersons. The fund does not pay compensation directly to Trustees or officers of the fund who are also officers of the investment adviser, all of whom receive remuneration for their services to the fund from MFS. Certain officers and Trustees of the fund are officers or directors of MFS, MFD, and MFSC.
Other – This fund and certain other funds managed by MFS (the funds) have entered into a service agreement (the ISO Agreement) which provides for payment of fees solely by the funds to Tarantino LLC in return for the provision of services of an Independent Senior Officer (ISO) for the funds. Frank L. Tarantino serves as the ISO and is an officer of the funds and the sole member of Tarantino LLC. The funds can terminate the ISO Agreement with Tarantino LLC at any time under the terms of the ISO Agreement. For the year ended August 31, 2018, the fee paid by the fund under this agreement was $40 and is included in “Miscellaneous” expense in the Statement of Operations. MFS has agreed to bear all expenses associated with office space, other administrative support, and supplies provided to the ISO.
The fund invests in the MFS Institutional Money Market Portfolio which is managed by MFS and seeks current income consistent with preservation of capital and liquidity. This money market fund does not pay a management fee to MFS.
On September 22, 2016, MFS redeemed 250,852 shares of Class R6 for an aggregate amount of $2,945,000. On March 16, 2017, MFS purchased 6,565 shares of Class I for an aggregate amount of $82,132. On August 15, 2017, MFS redeemed 5,090 shares of Class A and 10,936 shares of Class R6 for an aggregate amount of $223,526. On September 20, 2017, MFS purchased 29,746 shares of Class I for an aggregate amount of $440,538.
At August 31, 2018, MFS held approximately 100%, 100%, 89%, and 71% of the outstanding shares of Class R1, Class R2, Class R4, and Class R3, respectively.
Effective on or about January 3, 2018, the adviser has voluntarily undertaken to reimburse the fund from its own resources on a quarterly basis for the cost of investment research embedded in the cost of the fund’s securities trades. This agreement may be rescinded at any time. For the period on or about January 3, 2018 to August 31, 2018, this reimbursement amounted to $3,365, which is included in “Other” income in the Statement of Operations.
(4) Portfolio Securities
For the year ended August 31, 2018, purchases and sales of investments, other than short-term obligations, aggregated $19,568,741 and $13,318,685, respectively.
35
Notes to Financial Statements – continued
(5) Shares of Beneficial Interest
The fund’s Declaration of Trust permits the Trustees to issue an unlimited number of full and fractional shares of beneficial interest. Transactions in fund shares were as follows:
| | | | | | | | | | | | | | | | |
| | | Year ended
8/31/18 | | | Year ended
8/31/17 | |
| | | Shares | | | Amount | | | Shares | | | Amount | |
| Shares sold | | | | | | | | | | | | | | | | |
Class A | | | 437,356 | | | | $6,544,177 | | | | 315,250 | | | | $3,981,360 | |
Class B | | | 24,354 | | | | 356,020 | | | | 12,300 | | | | 151,599 | |
Class C | | | 30,098 | | | | 455,803 | | | | 23,404 | | | | 282,885 | |
Class I | | | 162,294 | | | | 2,412,961 | | | | 65,369 | | | | 802,157 | |
Class R3 | | | 2,124 | | | | 34,107 | | | | — | | | | — | |
Class R4 | | | 680 | | | | 10,356 | | | | — | | | | — | |
Class R6 | | | 374,263 | | | | 5,414,426 | | | | 251,493 | | | | 3,111,433 | |
| | | 1,031,169 | | | | $15,227,850 | | | | 667,816 | | | | $8,329,434 | |
| | | | |
| Shares issued to shareholders in reinvestment of distributions | | | | | | | | | | | | | | | | |
Class A | | | 17,940 | | | | $257,614 | | | | 1,339 | | | | $14,687 | |
Class B | | | 723 | | | | 10,345 | | | | 76 | | | | 830 | |
Class C | | | 1,354 | | | | 19,304 | | | | 189 | | | | 2,063 | |
Class I | | | 4,112 | | | | 59,177 | | | | 815 | | | | 8,945 | |
Class R1 | | | 181 | | | | 2,602 | | | | 36 | | | | 393 | |
Class R2 | | | 205 | | | | 2,949 | | | | 47 | | | | 517 | |
Class R3 | | | 217 | | | | 3,128 | | | | 60 | | | | 650 | |
Class R4 | | | 230 | | | | 3,310 | | | | 72 | | | | 784 | |
Class R6 | | | 41,432 | | | | 596,619 | | | | 12,412 | | | | 136,285 | |
| | | 66,394 | | | | $955,048 | | | | 15,046 | | | | $165,154 | |
| | | | |
| Shares reacquired | | | | | | | | | | | | | | | | |
Class A | | | (279,003 | ) | | | $(4,016,492 | ) | | | (54,106 | ) | | | $(677,867 | ) |
Class B | | | (16,502 | ) | | | (239,884 | ) | | | (5,108 | ) | | | (63,373 | ) |
Class C | | | (28,638 | ) | | | (413,559 | ) | | | (900 | ) | | | (11,323 | ) |
Class I | | | (41,977 | ) | | | (583,913 | ) | | | (58,060 | ) | | | (783,886 | ) |
Class R4 | | | (3 | ) | | | (45 | ) | | | — | | | | — | |
Class R6 | | | (286,227 | ) | | | (4,216,485 | ) | | | (479,499 | ) | | | (5,836,120 | ) |
| | | (652,350 | ) | | | $(9,470,378 | ) | | | (597,673 | ) | | | $(7,372,569 | ) |
36
Notes to Financial Statements – continued
| | | | | | | | | | | | | | | | |
| | | Year ended
8/31/18 | | | Year ended
8/31/17 | |
| | | Shares | | | Amount | | | Shares | | | Amount | |
| Net change | | | | | | | | | | | | | | | | |
Class A | | | 176,293 | | | | $2,785,299 | | | | 262,483 | | | | $3,318,180 | |
Class B | | | 8,575 | | | | 126,481 | | | | 7,268 | | | | 89,056 | |
Class C | | | 2,814 | | | | 61,548 | | | | 22,693 | | | | 273,625 | |
Class I | | | 124,429 | | | | 1,888,225 | | | | 8,124 | | | | 27,216 | |
Class R1 | | | 181 | | | | 2,602 | | | | 36 | | | | 393 | |
Class R2 | | | 205 | | | | 2,949 | | | | 47 | | | | 517 | |
Class R3 | | | 2,341 | | | | 37,235 | | | | 60 | | | | 650 | |
Class R4 | | | 907 | | | | 13,621 | | | | 72 | | | | 784 | |
Class R6 | | | 129,468 | | | | 1,794,560 | | | | (215,594 | ) | | | (2,588,402 | ) |
| | | 445,213 | | | | $6,712,520 | | | | 85,189 | | | | $1,122,019 | |
Class T shares were not publicly available for sale during the period. Please see the fund’s prospectus for details.
The fund is one of several mutual funds in which certain MFS funds may invest. The MFS funds do not invest in the underlying funds for the purpose of exercising management or control. At the end of the period, the MFS Lifetime 2040 Fund, the MFS Lifetime 2050 Fund, the MFS Lifetime 2045 Fund, the MFS Lifetime 2035 Fund, the MFS Lifetime 2030 Fund, and the MFS Lifetime 2055 Fund were the owners of record of approximately 16%, 9%, 7%, 7%, 5%, and 4%, respectively, of the value of outstanding voting shares of the fund. In addition, the MFS Lifetime 2060 Fund was the owner of record of less than 1% of the value of outstanding voting shares of the fund.
(6) Line of Credit
The fund and certain other funds managed by MFS participate in a $1.25 billion unsecured committed line of credit, subject to a $1 billion sublimit, provided by a syndication of banks under a credit agreement. Borrowings may be made for temporary financing needs. Interest is charged to each fund, based on its borrowings, generally at a rate equal to the higher of the Overnight Bank Funding rate or daily one month LIBOR plus an agreed upon spread. A commitment fee, based on the average daily, unused portion of the committed line of credit, is allocated among the participating funds. In addition, the fund and other funds managed by MFS have established unsecured uncommitted borrowing arrangements with certain banks for temporary financing needs. Interest is charged to each fund, based on its borrowings, at a rate equal to the Overnight Bank Funding rate plus an agreed upon spread. For the year ended August 31, 2018, the fund’s commitment fee and interest expense were $137 and $0, respectively, and are included in “Miscellaneous” expense in the Statement of Operations.
37
Notes to Financial Statements – continued
(7) Investments in Affiliated Issuers
An affiliated issuer may be considered one in which the fund owns 5% or more of the outstanding voting securities, or a company which is under common control. For the purposes of this report, the fund assumes the following to be affiliated issuers:
| | | | | | | | | | | | | | | | | | | | |
| Affiliated Issuers | | | | | Beginning
Shares/Par
Amount | | | Acquisitions
Shares/Par
Amount | | | Dispositions
Shares/Par
Amount | | | Ending
Shares/Par
Amount | |
| MFS Institutional Money Market Portfolio | | | | | | | 253,555 | | | | 12,466,343 | | | | (12,495,716 | ) | | | 224,182 | |
| | | | | |
| Affiliated Issuers | | Realized
Gain (Loss) | | | Change in
Unrealized
Appreciation/
Depreciation | | | Capital Gain
Distributions | | | Dividend
Income | | | Ending
Value | |
| MFS Institutional Money Market Portfolio | | | $59 | | | | $6 | | | | $— | | | | $6,224 | | | | $224,182 | |
38
REPORT OF INDEPENDENT REGISTERED PUBLIC ACCOUNTING FIRM
To the Shareholders of MFS Blended Research Emerging Markets Equity Fund and the Board of Trustees of MFS Series Trust IV
Opinion on the Financial Statements
We have audited the accompanying statement of assets and liabilities of MFS Blended Research Emerging Markets Equity Fund (the “Fund”) (one of the funds constituting the MFS Series Trust IV (the “Trust”)), including the portfolio of investments, as of August 31, 2018, and the related statement of operations for the year then ended, the statements of changes in net assets for each of the two years in the period then ended, the financial highlights for each of the two years in the period then ended and the period from September 15, 2015 (commencement of operations) through August 31, 2016 and the related notes (collectively referred to as the “financial statements”). In our opinion, the financial statements present fairly, in all material respects, the financial position of the Fund (one of the funds constituting the MFS Series Trust IV) at August 31, 2018, the results of its operations for the year then ended, the changes in its net assets for each of the two years in the period then ended and its financial highlights for each of the two years in the period then ended and the period from September 15, 2015 (commencement of operations) through August 31, 2016, in conformity with U.S. generally accepted accounting principles.
Basis for Opinion
These financial statements are the responsibility of the Trust’s management. Our responsibility is to express an opinion on the Fund’s financial statements based on our audits. We are a public accounting firm registered with the Public Company Accounting Oversight Board (United States) (“PCAOB”) and are required to be independent with respect to the Trust in accordance with the U.S. federal securities laws and the applicable rules and regulations of the Securities and Exchange Commission and the PCAOB.
We conducted our audits in accordance with the standards of the PCAOB. Those standards require that we plan and perform the audit to obtain reasonable assurance about whether the financial statements are free of material misstatement, whether due to error or fraud. The Trust is not required to have, nor were we engaged to perform, an audit of the Trust’s internal control over financial reporting. As part of our audits we are required to obtain an understanding of internal control over financial reporting but not for the purpose of expressing an opinion on the effectiveness of the Trust’s internal control over financial reporting. Accordingly, we express no such opinion.
Our audits included performing procedures to assess the risks of material misstatement of the financial statements, whether due to error or fraud, and performing procedures that respond to those risks. Such procedures included examining, on a test basis, evidence regarding the amounts and disclosures in the financial statements. Our procedures included confirmation of securities owned as of August 31, 2018, by correspondence with the custodian and others. Our audits also included evaluating the
39
Report of Independent Registered Public Accounting Firm – continued
accounting principles used and significant estimates made by management, as well as evaluating the overall presentation of the financial statements. We believe that our audits provide a reasonable basis for our opinion.

We have served as the auditor of one or more MFS investment companies since 1993.
Boston, Massachusetts
October 16, 2018
40
TRUSTEES AND OFFICERS —
IDENTIFICATION AND BACKGROUND
The Trustees and Officers of the Trust, as of October 1, 2018, are listed below, together with their principal occupations during the past five years. (Their titles may have varied during that period.) The address of each Trustee and Officer is 111 Huntington Avenue, Boston, Massachusetts 02199-7618.
| | | | | | | | | | |
Name, Age | | Position(s)
Held with Fund | | Trustee/Officer Since (h) | | Number of
MFS Funds
overseen by the Trustee | | Principal
Occupations During the Past Five Years | | Other Directorships During the Past Five Years (j) |
| INTERESTED TRUSTEES |
Robert J. Manning (k)
(age 54) | | Trustee | | February 2004 | | 135 | | Massachusetts Financial Services Company, Executive Chairman (since January 2017); Director; Chairman of the Board; Chief Executive Officer (until 2015); Co-Chief Executive Officer (2015-2016) | | N/A |
Robin A. Stelmach (k)
(age 57) | | Trustee | | January 2014 | | 135 | | Massachusetts Financial Services Company, Vice Chair (since January 2017); Chief Operating Officer and Executive Vice President (until January 2017) | | N/A |
| INDEPENDENT TRUSTEES |
John P. Kavanaugh
(age 63) | | Trustee and Chair of Trustees | | January 2009 | | 135 | | Private investor | | N/A |
Steven E. Buller
(age 67) | | Trustee | | February 2014 | | 135 | | Financial Accounting Standards Advisory Council, Chairman (2014-2015); Public Company Accounting Oversight Board, Standing Advisory Group, Member (until 2014); BlackRock, Inc. (investment management), Managing Director (until 2014), BlackRock Finco UK (investment management), Director (until 2014) | | N/A |
41
Trustees and Officers – continued
| | | | | | | | | | |
Name, Age | | Position(s)
Held with Fund | | Trustee/Officer Since (h) | | Number of
MFS Funds
overseen by the Trustee | | Principal
Occupations During the Past Five Years | | Other Directorships During the Past Five Years (j) |
John A. Caroselli
(age 64) | | Trustee | | March 2017 | | 135 | | JC Global Advisors, LLC (management consulting), President (since 2015); First Capital Corporation (commercial finance), Executive Vice President (until 2015) | | N/A |
Maureen R. Goldfarb
(age 63) | | Trustee | | January 2009 | | 135 | | Private investor | | N/A |
Michael Hegarty
(age 73) | | Trustee | | December 2004 | | 135 | | Private investor | | Rouse Properties Inc., Director (until 2016); Capmark Financial Group Inc., Director (until 2015) |
Clarence Otis, Jr.
(age 62) | | Trustee | | March 2017 | | 135 | | Darden Restaurants, Inc., Chief Executive Officer (until 2014) | | VF Corporation, Director; Verizon Communications, Inc., Director; The Travelers Companies, Director; Federal Reserve Bank of Atlanta, Director (until 2015) |
Maryanne L. Roepke
(age 62) | | Trustee | | May 2014 | | 135 | | American Century Investments (investment management), Senior Vice President and Chief Compliance Officer (until 2014) | | N/A |
Laurie J. Thomsen
(age 61) | | Trustee | | March 2005 | | 135 | | Private investor | | The Travelers Companies, Director; Dycom Industries, Inc., Director (since 2015) |
42
Trustees and Officers – continued
| | | | | | | | |
Name, Age | | Position(s) Held with Fund | | Trustee/Officer
Since (h) | | Number of MFS Funds for which the Person is an Officer | | Principal
Occupations During the Past Five Years |
| OFFICERS | | | | | | | | |
Christopher R. Bohane (k)
(age 44) | | Assistant Secretary and Assistant Clerk | | July 2005 | | 135 | | Massachusetts Financial Services Company, Vice President and Assistant General Counsel |
Kino Clark (k)
(age 50) | | Assistant Treasurer | | January 2012 | | 135 | | Massachusetts Financial Services Company, Vice President |
John W. Clark, Jr. (k)
(age 51) | | Assistant Treasurer | | April 2017 | | 135 | | Massachusetts Financial Services Company, Vice President (since March 2017); Deutsche Bank (financial services), Department Head – Treasurer’s Office (until February 2017) |
Thomas H. Connors (k)
(age 59) | | Assistant Secretary and Assistant Clerk | | September 2012 | | 135 | | Massachusetts Financial Services Company, Vice President and Senior Counsel |
Ethan D. Corey (k)
(age 54) | | Assistant Secretary and Assistant Clerk | | July 2005 | | 135 | | Massachusetts Financial Services Company, Senior Vice President and Associate General Counsel |
David L. DiLorenzo (k)
(age 50) | | President | | July 2005 | | 135 | | Massachusetts Financial Services Company, Senior Vice President |
43
Trustees and Officers – continued
| | | | | | | | |
Name, Age | | Position(s) Held with Fund | | Trustee/Officer
Since (h) | | Number of MFS Funds for which the Person is an Officer | | Principal
Occupations During the Past Five Years |
Heidi W. Hardin (k)
(age 51) | | Secretary and Clerk | | April 2017 | | 135 | | Massachusetts Financial Services Company, Executive Vice President and General Counsel (since March 2017); Harris Associates (investment management), General Counsel (from September 2015 to January 2017); Janus Capital Management LLC (investment management), Senior Vice President and General Counsel (until September 2015) |
Brian E. Langenfeld (k)
(age 45) | | Assistant Secretary and Assistant Clerk | | June 2006 | | 135 | | Massachusetts Financial Services Company, Vice President and Senior Counsel |
Amanda S. Mooradian (k)
(age 39) | | Assistant Secretary and Assistant Clerk | | September 2018 | | 135 | | Massachusetts Financial Services Company, Assistant Vice President and Counsel |
Susan A. Pereira (k)
(age 47) | | Assistant Secretary and Assistant Clerk | | July 2005 | | 135 | | Massachusetts Financial Services Company, Vice President and Senior Counsel |
Kasey L. Phillips (k)
(age 47) | | Assistant Treasurer | | September 2012 | | 135 | | Massachusetts Financial Services Company, Vice President |
Matthew A. Stowe (k)
(age 43) | | Assistant Secretary and Assistant Clerk | | October 2014 | | 135 | | Massachusetts Financial Services Company, Vice President and Assistant General Counsel |
44
Trustees and Officers – continued
| | | | | | | | |
Name, Age | | Position(s) Held with Fund | | Trustee/Officer
Since (h) | | Number of MFS Funds for which the Person is an Officer | | Principal
Occupations During the Past Five Years |
Frank L. Tarantino
(age 74) | | Independent
Senior Officer | | June 2004 | | 135 | | Tarantino LLC (provider of compliance services), Principal |
Richard S. Weitzel (k)
(age 48) | | Assistant Secretary and Assistant Clerk | | October 2007 | | 135 | | Massachusetts Financial Services Company, Senior Vice President and Associate General Counsel |
Martin J. Wolin (k)
(age 51) | | Chief Compliance Officer | | July 2015 | | 135 | | Massachusetts Financial Services Company, Senior Vice President and Chief Compliance Officer (since July 2015); Mercer (financial service provider), Chief Risk and Compliance Officer, North America and Latin America (until June 2015) |
James O. Yost (k)
(age 58) | | Treasurer | | September 1990 | | 135 | | Massachusetts Financial Services Company, Senior Vice President |
| (h) | Date first appointed to serve as Trustee/officer of an MFS Fund. Each Trustee has served continuously since appointment unless indicated otherwise. For the period from December 15, 2004 until February 22, 2005, Mr. Manning served as Advisory Trustee. From January 2012 through December 2016, Messrs. DiLorenzo and Yost served as Treasurer and Deputy Treasurer of the Funds, respectively. |
| (j) | Directorships or trusteeships of companies required to report to the Securities and Exchange Commission (i.e., “public companies”). |
| (k) | “Interested person” of the Trust within the meaning of the Investment Company Act of 1940 (referred to as the 1940 Act), which is the principal federal law governing investment companies like the fund, as a result of a position with MFS. The address of MFS is 111 Huntington Avenue, Boston, Massachusetts 02199-7618. |
Each Trustee has been elected by shareholders and each Trustee and officer holds office until his or her successor is chosen and qualified or until his or her earlier death, resignation, retirement or removal. The Trust does not hold annual meetings for the purpose of electing Trustees, and Trustees are not elected for fixed terms. Under the terms of the Board’s retirement policy, an Independent Trustee shall retire at the end of
45
Trustees and Officers – continued
the calendar year in which he or she reaches the earlier of 75 years of age or 15 years of service on the Board (or, in the case of any Independent Trustee who joined the Board prior to 2015, 20 years of service on the Board).
Messrs. Buller and Otis and Ms. Roepke are members of the Trust’s Audit Committee.
Each of the Interested Trustees and certain Officers hold comparable officer positions with certain affiliates of MFS.
The Statement of Additional Information for a Fund includes further information about the Trustees and is available without charge upon request by calling 1-800-225-2606.
| | |
| Investment Adviser | | Custodian |
Massachusetts Financial Services Company
111 Huntington Avenue Boston, MA 02199-7618 | | State Street Bank and Trust Company 1 Lincoln Street Boston, MA 02111-2900 |
| Distributor | | Independent Registered Public Accounting Firm |
MFS Fund Distributors, Inc.
111 Huntington Avenue Boston, MA 02199-7618 | | Ernst & Young LLP 200 Clarendon Street Boston, MA 02116 |
| Portfolio Manager(s) | | |
| Jim Fallon | | |
| Matt Krummell | | |
| Jonathan Sage | | |
| Jed Stocks | | |
46
BOARD REVIEW OF INVESTMENT ADVISORY AGREEMENT
The Investment Company Act of 1940 requires that both the full Board of Trustees and a majority of the non-interested (“independent”) Trustees, voting separately, annually approve the continuation of the Fund’s investment advisory agreement with MFS. The Trustees consider matters bearing on the Fund and its advisory arrangements at their meetings throughout the year, including a review of performance data at each regular meeting. In addition, the independent Trustees met several times over the course of three months beginning in May and ending in July, 2018 (“contract review meetings”) for the specific purpose of considering whether to approve the continuation of the investment advisory agreement for the Fund and the other investment companies that the Board oversees (the “MFS Funds”). The independent Trustees were assisted in their evaluation of the Fund’s investment advisory agreement by independent legal counsel, from whom they received separate legal advice and with whom they met separately from MFS during various contract review meetings. The independent Trustees were also assisted in this process by the MFS Funds’ Independent Senior Officer, a senior officer appointed by and reporting to the independent Trustees.
In connection with their deliberations regarding the continuation of the investment advisory agreement, the Trustees, including the independent Trustees, considered such information and factors as they believed, in light of the legal advice furnished to them and their own business judgment, to be relevant. The investment advisory agreement for the Fund was considered separately, although the Trustees also took into account the common interests of all MFS Funds in their review. As described below, the Trustees considered the nature, quality, and extent of the various investment advisory, administrative, and shareholder services performed by MFS under the existing investment advisory agreement and other arrangements with the Fund.
In connection with their contract review meetings, the Trustees received and relied upon materials that included, among other items: (i) information provided by Broadridge Financial Solutions, Inc. (“Broadridge”), an independent third party, on the investment performance of the Fund for the one-year period ended December 31, 2017 and the investment performance of a group of funds with substantially similar investment classifications/objectives (the “Broadridge performance universe”), (ii) information provided by Broadridge on the Fund’s advisory fees and other expenses and the advisory fees and other expenses of comparable funds identified by Broadridge (the “Broadridge expense group”), (iii) information provided by MFS on the advisory fees of portfolios of other clients of MFS, including institutional separate accounts and other clients, (iv) information as to whether and to what extent applicable expense waivers, reimbursements or fee “breakpoints” are observed for the Fund, (v) information regarding MFS’ financial results and financial condition, including MFS’ and certain of its affiliates’ estimated profitability from services performed for the Fund and the MFS Funds as a whole, and compared to MFS’ institutional business, (vi) MFS’ views regarding the outlook for the mutual fund industry and the strategic business plans of MFS, (vii) descriptions of various functions performed by MFS for the Funds, such as compliance monitoring and portfolio trading practices, and (viii) information regarding the overall organization of MFS, including information about MFS’ senior management and other personnel providing investment advisory, administrative and other services to
47
Board Review of Investment Advisory Agreement – continued
the Fund and the other MFS Funds. The comparative performance, fee and expense information prepared and provided by Broadridge was not independently verified and the independent Trustees did not independently verify any information provided to them by MFS.
The Trustees’ conclusion as to the continuation of the investment advisory agreement was based on a comprehensive consideration of all information provided to the Trustees and not the result of any single factor. Some of the factors that figured particularly in the Trustees’ deliberations are described below, although individual Trustees may have evaluated the information presented differently from one another, giving different weights to various factors. It is also important to recognize that the fee arrangements for the Fund and other MFS Funds are the result of years of review and discussion between the independent Trustees and MFS, that certain aspects of such arrangements may receive greater scrutiny in some years than in others, and that the Trustees’ conclusions may be based, in part, on their consideration of these same arrangements during the course of the year and in prior years.
Based on information provided by Broadridge and MFS, the Trustees reviewed the Fund’s total return investment performance as well as the Broadridge performance universe over the one-year period ended December 31, 2017. The total return performance of the Fund’s Class A shares was in the 2nd quintile relative to the other funds in the universe for this one-year period (the 1st quintile being the best performers and the 5th quintile being the worst performers). The Fund commenced operations on September 15, 2015, and has a limited operating history and performance record; therefore no performance data for the three- or five-year periods was available. Because of the passage of time, these performance results may differ from the performance results for more recent periods, including those shown elsewhere in this report.
In the course of their deliberations, the Trustees took into account information provided by MFS in connection with the contract review meetings, as well as during investment review meetings conducted with portfolio management personnel during the course of the year regarding the Fund’s performance. After reviewing these and related factors, the Trustees concluded, within the context of their overall conclusions regarding the investment advisory agreement, that they were satisfied with MFS’ responses and efforts relating to investment performance.
In assessing the reasonableness of the Fund’s advisory fee, the Trustees considered, among other information, the Fund’s advisory fee and the total expense ratio of the Fund’s Class A shares as a percentage of average daily net assets and the advisory fee and total expense ratios of peer groups of funds based on information provided by Broadridge. The Trustees considered that MFS currently observes an expense limitation for the Fund, which may not be changed without the Trustees’ approval. The Trustees also considered that, according to the data provided by Broadridge (which takes into account any fee reductions or expense limitations that were in effect during the Fund’s last fiscal year), the Fund’s effective advisory fee rate and total expense ratio were each lower than the Broadridge expense group median.
The Trustees also considered the advisory fees charged by MFS to any institutional separate accounts advised by MFS (“separate accounts”) and unaffiliated investment
48
Board Review of Investment Advisory Agreement – continued
companies for which MFS serves as subadviser (“subadvised funds”) that have comparable investment strategies to the Fund, if any. In comparing these fees, the Trustees considered information provided by MFS as to the generally broader scope of services provided by MFS to the Fund, as well as the more extensive regulatory burdens imposed on MFS in managing the Fund, in comparison to separate accounts and subadvised funds. The Trustees also considered the higher demands placed on MFS’ investment personnel and trading infrastructure as a result of the daily cash in-flows and out-flows of the Fund in comparison to separate accounts.
The Trustees also considered whether the Fund may benefit from any economies of scale in the management of the Fund in the event of growth in assets of the Fund and/or growth in assets of the MFS Funds as a whole. They noted that the Fund’s advisory fee rate schedule is subject to contractual breakpoints that reduce the Fund’s advisory fee rate on average daily net assets over $1 billion and $2.5 billion. The Trustees also noted that MFS has agreed in writing to waive a portion of the management fees of certain MFS Funds, including the Fund, if the total combined assets of certain funds within the MFS Funds’ complex increase above agreed upon thresholds (the “group fee waiver”), enabling the Fund’s shareholders to share in the benefits from any economies of scale at the complex level. The group fee waiver is reviewed and renewed annually between the Board and MFS. The Trustees concluded that the breakpoints and the group fee waiver were sufficient to allow the Fund to benefit from economies of scale as its assets and overall complex assets grow.
The Trustees also considered information prepared by MFS relating to MFS’ costs and profits with respect to the Fund, the MFS Funds considered as a group, and other investment companies and accounts advised by MFS, as well as MFS’ methodologies used to determine and allocate its costs to the MFS Funds, the Fund, and other accounts and products for purposes of estimating profitability.
After reviewing these and other factors described herein, the Trustees concluded, within the context of their overall conclusions regarding the investment advisory agreement, that the advisory fees charged to the Fund represent reasonable compensation in light of the services being provided by MFS to the Fund.
In addition, the Trustees considered MFS’ resources and related efforts to continue to retain, attract and motivate capable personnel to serve the Fund. The Trustees also considered current and developing conditions in the financial services industry, including the presence of large and well-capitalized companies which are spending, and appear to be prepared to continue to spend, substantial sums to engage personnel and to provide services to competing investment companies. In this regard, the Trustees also considered the financial resources of MFS and its ultimate parent, Sun Life Financial Inc. The Trustees also considered the advantages and possible disadvantages to the Fund of having an adviser that also serves other investment companies as well as other accounts.
The Trustees also considered the nature, quality, cost, and extent of administrative, transfer agency, and distribution services provided to the Fund by MFS and its affiliates under agreements and plans other than the investment advisory agreement, including any 12b-1 fees the Fund pays to MFS Fund Distributors, Inc., an affiliate of MFS. The Trustees also considered the nature, extent and quality of certain other services MFS
49
Board Review of Investment Advisory Agreement – continued
performs or arranges for on the Fund’s behalf, which may include securities lending programs, directed expense payment programs, class action recovery programs, and MFS’ interaction with third-party service providers, principally custodians and sub-custodians. The Trustees concluded that the various non-advisory services provided by MFS and its affiliates on behalf of the Fund were satisfactory.
The Trustees considered so-called “fall-out benefits” to MFS such as reputational value derived from serving as investment manager to the MFS Funds. The Trustees also considered that, effective January 3, 2018, MFS had discontinued its historic practice of obtaining investment research from portfolio brokerage commissions paid by certain MFS Funds and would thereafter voluntarily reimburse a Fund, if applicable, for the costs of external research acquired through the use of the Fund’s portfolio brokerage commissions.
Based on their evaluation of factors that they deemed to be material, including those factors described above, the Board of Trustees, including the independent Trustees, concluded that the Fund’s investment advisory agreement with MFS should be continued for an additional one-year period, commencing August 1, 2018.
50
PROXY VOTING POLICIES AND INFORMATION
MFS votes proxies on behalf of the fund pursuant to proxy voting policies and procedures that are available without charge, upon request, by calling 1-800-225-2606, by visiting mfs.com/proxyvoting, or by visiting the SEC’s Web site at http://www.sec.gov.
Information regarding how the fund voted proxies relating to portfolio securities during the most recent twelve-month period ended June 30 is available by August 31 of each year without charge by visiting mfs.com/proxyvoting, or by visiting the SEC’s Web site at http://www.sec.gov.
QUARTERLY PORTFOLIO DISCLOSURE
The fund files a complete schedule of portfolio holdings with the Securities and Exchange Commission (the Commission) for the first and third quarters of each fiscal year on Form N-Q. A shareholder can obtain the quarterly portfolio holdings report at mfs.com. The fund’s Form N-Q is also available on the EDGAR database on the Commission’s Internet Web site at http://www.sec.gov, and may be reviewed and copied at the:
Public Reference Room
Securities and Exchange Commission
100 F Street, NE, Room 1580
Washington, D.C. 20549
Information on the operation of the Public Reference Room may be obtained by calling the Commission at 1-800-SEC-0330. Copies of the fund’s Form N-Q also may be obtained, upon payment of a duplicating fee, by electronic request at the following e-mail address: publicinfo@sec.gov or by writing the Public Reference Section at the above address.
FURTHER INFORMATION
From time to time, MFS may post important information about the fund or the MFS funds on the MFS web site (mfs.com). This information is available at https://www.mfs.com/en-us/what-we-do/announcements.html or at mfs.com/openendfunds by choosing the fund’s name.
51
INFORMATION ABOUT FUND CONTRACTS AND LEGAL CLAIMS
The fund has entered into contractual arrangements with an investment adviser, administrator, distributor, shareholder servicing agent, 529 program manager (if applicable), and custodian who each provide services to the fund. Unless expressly stated otherwise, shareholders are not parties to, or intended beneficiaries of these contractual arrangements, and these contractual arrangements are not intended to create any shareholder right to enforce them against the service providers or to seek any remedy under them against the service providers, either directly or on behalf of the fund.
Under the Trust’s By-Laws and Declaration of Trust, any claims asserted against or on behalf of the MFS Funds, including claims against Trustees and Officers, must be brought in state and federal courts located within the Commonwealth of Massachusetts.
FEDERAL TAX INFORMATION (unaudited)
The fund will notify shareholders of amounts for use in preparing 2018 income tax forms in January 2019. The following information is provided pursuant to provisions of the Internal Revenue Code.
The fund designates the maximum amount allowable as qualified dividend income eligible to be taxed at the same rate as long-term capital gain.
The fund designates $337,000 as capital gain dividends paid during the fiscal year.
Income derived from foreign sources was $728,275. The fund intends to pass through foreign tax credits of $96,969 for the fiscal year.
52
rev. 3/16
| | | | |
| | | |
FACTS | | WHAT DOES MFS DO WITH YOUR PERSONAL INFORMATION? | |  |
| | |
| Why? | | Financial companies choose how they share your personal information. Federal law gives consumers the right to limit some but not all sharing. Federal law also requires us to tell you how we collect, share, and protect your personal information. Please read this notice carefully to understand what we do. |
| | |
| What? | | The types of personal information we collect and share depend on the product or service you have with us. This information can include: • Social Security number and account balances • Account transactions and transaction history • Checking account information and wire transfer instructions When you are no longer our customer, we continue to share your information as described in this notice. |
| | |
| How? | | All financial companies need to share customers’ personal information to run their everyday business. In the section below, we list the reasons financial companies can share their customers’ personal information; the reasons MFS chooses to share; and whether you can limit this sharing. |
| | | | |
Reasons we can share your
personal information | | Does MFS
share? | | Can you limit
this sharing? |
For our everyday business purposes – such as to process your transactions, maintain your account(s), respond to court orders and legal investigations, or report to credit bureaus | | Yes | | No |
For our marketing purposes – to offer our products and services to you | | No | | We don’t share |
For joint marketing with other financial companies | | No | | We don’t share |
For our affiliates’ everyday business purposes – information about your transactions and experiences | | No | | We don’t share |
For our affiliates’ everyday business purposes – information about your creditworthiness | | No | | We don’t share |
| For nonaffiliates to market to you | | No | | We don’t share |
| | |
| Questions? | | Call 800-225-2606 or go to mfs.com. |
53
| | |
| Who we are |
| Who is providing this notice? | | MFS Funds, MFS Investment Management, MFS Institutional Advisors, Inc., and MFS Heritage Trust Company. |
| | |
| What we do |
| How does MFS protect my personal information? | | To protect your personal information from unauthorized access and use, we use security measures that comply with federal law. These measures include procedural, electronic, and physical safeguards for the protection of the personal information we collect about you. |
| How does MFS collect my personal information? | | We collect your personal information, for example, when you • open an account or provide account information • direct us to buy securities or direct us to sell your securities • make a wire transfer We also collect your personal information from others, such as credit bureaus, affiliates, or other companies. |
| Why can’t I limit all sharing? | | Federal law gives you the right to limit only • sharing for affiliates’ everyday business purposes – information about your creditworthiness • affiliates from using your information to market to you • sharing for nonaffiliates to market to you State laws and individual companies may give you additional rights to limit sharing. |
| | |
| Definitions |
| Affiliates | | Companies related by common ownership or control. They can be financial and nonfinancial companies. • MFS does not share personal information with affiliates, except for everyday business purposes as described on page one of this notice. |
| Nonaffiliates | | Companies not related by common ownership or control. They can be financial and nonfinancial companies. • MFS does not share with nonaffiliates so they can market to you. |
| Joint marketing | | A formal agreement between nonaffiliated financial companies that together market financial products or services to you. • MFS doesn’t jointly market. |
| | |
| Other important information |
| If you own an MFS product or receive an MFS service in the name of a third party such as a bank or broker-dealer, their privacy policy may apply to you instead of ours. |
54
Save paper with eDelivery.

| MFS® will send you prospectuses, |
reports, and proxies directly via e-mail so you will get information faster with less mailbox clutter.
To sign up:
1. Go to mfs.com.
2. Log in via MFS® Access.
3. Select eDelivery.
If you own your MFS fund shares through a financial institution or a retirement plan, MFS® TALK, MFS® Access, or eDelivery may not be available to you.
CONTACT
WEB SITE
mfs.com
MFS TALK
1-800-637-8255
24 hours a day
ACCOUNT SERVICE AND LITERATURE
Shareholders
1-800-225-2606
Financial advisors
1-800-343-2829
Retirement plan services
1-800-637-1255
MAILING ADDRESS
MFS Service Center, Inc.
P.O. Box 55824
Boston, MA 02205-5824
OVERNIGHT MAIL
MFS Service Center, Inc.
c/o DST Asset Manager Solutions, Inc.
30 Dan Road
Canton, MA 02021-2809
Annual Report
August 31, 2018

MFS® Blended Research®
Global Equity Fund

BRL-ANN
MFS® Blended Research® Global Equity Fund
CONTENTS
The report is prepared for the general information of shareholders.
It is authorized for distribution to prospective investors only when preceded or accompanied by a current prospectus.
NOT FDIC INSURED • MAY LOSE VALUE • NO BANK GUARANTEE

LETTER FROM THE EXECUTIVE CHAIRMAN
Dear Shareholders:
The strengthening U.S. dollar, international trade friction and geopolitical uncertainty have contributed to a measurable uptick in market volatility in recent quarters — a
departure from the low-volatility environment that prevailed for much of 2017. Against this more challenging backdrop, global markets have become less synchronized, with equity markets in the United States outperforming most international markets. Global economic growth remains healthy, notwithstanding signs of a modest slowdown over the past few months, particularly in Europe, China and some emerging markets.
Although the U.S. Federal Reserve continues to gradually raise interest rates and shrink its balance sheet, monetary policy remains accommodative around the world, with many central
banks taking only tentative steps toward tighter policies. Newly enacted U.S. tax reforms have been welcomed by equity markets while emerging market economies have recently had to contend with tighter financial conditions as a result of firmer U.S. Treasury yields and a stronger dollar. Around the world, inflation remains largely subdued, but tight labor markets and solid global demand have investors on the lookout for its potential reappearance. Increased U.S. protectionism is also a growing concern, as investors fear that trade disputes could dampen business sentiment, leading to slower global growth.
As a global investment manager with nearly a century of expertise, MFS® firmly believes that active risk management offers downside mitigation and may help improve investment outcomes, and we built our active investment platform with that in mind. Our long-term perspective influences nearly every aspect of our business, but most importantly, it aligns our investment decisions with clients’ investing time horizons.
Respectfully,

Robert J. Manning
Executive Chairman
MFS Investment Management
October 16, 2018
The opinions expressed in this letter are subject to change and may not be relied upon for investment advice. No forecasts can be guaranteed.
1
PORTFOLIO COMPOSITION
Portfolio structure
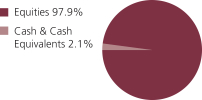
| | | | |
| Top ten holdings | | | | |
| Alphabet, Inc., “A” | | | 2.3% | |
| Microsoft Corp. | | | 1.9% | |
| Facebook, Inc., “A” | | | 1.8% | |
| Taiwan Semiconductor Manufacturing Co. Ltd., ADR | | | 1.8% | |
| Boeing Co. | | | 1.7% | |
| Adobe Systems, Inc. | | | 1.7% | |
| LVMH Moet Hennessy Louis Vuitton SE | | | 1.6% | |
| Bristol-Myers Squibb Co. | | | 1.6% | |
| HCA Healthcare, Inc. | | | 1.6% | |
| Cisco Systems, Inc. | | | 1.5% | |
| |
| Equity sectors | | | | |
| Financial Services | | | 19.2% | |
| Technology | | | 17.9% | |
| Health Care | | | 12.5% | |
| Industrial Goods & Services | | | 6.8% | |
| Consumer Staples | | | 6.2% | |
| Energy | | | 6.0% | |
| Utilities & Communications | | | 5.9% | |
| Leisure | | | 5.6% | |
| Retailing | | | 5.4% | |
| Basic Materials | | | 4.9% | |
| Special Products & Services | | | 3.0% | |
| Autos & Housing | | | 2.7% | |
| Transportation | | | 1.8% | |
| | | | |
| Issuer country weightings (x) | | | | |
| United States | | | 54.1% | |
| Japan | | | 7.4% | |
| Canada | | | 5.8% | |
| United Kingdom | | | 4.7% | |
| France | | | 4.6% | |
| South Korea | | | 4.5% | |
| Taiwan | | | 2.2% | |
| Switzerland | | | 2.2% | |
| China | | | 1.9% | |
| Other Countries | | | 12.6% | |
|
| Currency exposure weightings (y) | |
| United States Dollar | | | 57.7% | |
| Euro | | | 8.7% | |
| Japanese Yen | | | 7.4% | |
| British Pound Sterling | | | 4.7% | |
| South Korean Won | | | 4.5% | |
| Canadian Dollar | | | 3.6% | |
| Hong Kong Dollar | | | 3.4% | |
| Taiwan Dollar | | | 2.2% | |
| Swiss Franc | | | 2.2% | |
| Other Currencies | | | 5.6% | |
2
Portfolio Composition – continued
| (x) | Represents the portfolio’s exposure to issuer countries as a percentage of a portfolio’s net assets. For purposes of this presentation, United States includes Cash & Cash Equivalents. |
| (y) | Represents the portfolio’s exposure to a particular currency as a percentage of a portfolio’s net assets. For purposes of this presentation, United States Dollar includes Cash & Cash Equivalents. |
Cash & Cash Equivalents includes any cash, investments in money market funds, short-term securities, and other assets less liabilities. Please see the Statement of Assets and Liabilities for additional information related to the fund’s cash position and other assets and liabilities.
Percentages are based on net assets as of August 31, 2018.
The portfolio is actively managed and current holdings may be different.
3
MANAGEMENT REVIEW
Summary of Results
For the twelve months ended August 31, 2018, Class A shares of the MFS Blended Research Global Equity Fund (“fund”) provided a total return of 9.05%, at net asset value. This compares with a return of 11.41% for the fund’s benchmark, the MSCI All Country World Index (net div).
Market Environment
Despite headwinds from increasing global trade tensions, several US equity indices advanced to set new record highs late in the period after rebounding from a mid-period market correction. Very strong earnings per share and revenue growth, helped in part by the 2017 US tax reform package, has underpinned the advance, as has solid US economic growth. Strong fundamentals have brought US equity valuations down more in line with long-term average valuations from elevated levels early in the period. While the US economy has maintained its strength, global economic growth became less synchronized during the period, with Europe and China showing signs of a modest slowdown and some emerging markets coming under stress.
During the period, the US Federal Reserve raised interest rates by 75 basis points, bringing the total number of hikes to seven since the central bank began to normalize monetary policy in late 2015. The growth rate in the US, eurozone and Japan remained above trend, although inflation remained contained, particularly outside the US. Late in the period, the European Central Bank announced that it would halt its asset purchase program at the end of 2018, but issued forward guidance that it does not expect to raise interest rates at least until after the summer of 2019. Both the Bank of England and the Bank of Canada raised rates several times during the period. The European political backdrop became a bit more volatile late in the period, spurred by a chaotic process which resulted in the formation of an anti-establishment, Eurosceptic coalition government in Italy.
Bond yields rose in the US during the period but remained low by historical standards, while yields in many developed markets fell. Credit spreads remained relatively tight but widened modestly, late in the period, as market volatility increased. Growing concern over increasing global trade friction appeared to have weighed on business sentiment during the period’s second half, especially outside the US. Tighter financial conditions from rising US rates and a strong dollar combined with trade uncertainty helped expose structural weaknesses in several emerging markets late in the period.
Detractors from Performance
Security selection within the leisure sector was a primary factor that negatively impacted performance relative to the MSCI All Country World Index. However, there were no individual stocks within this sector that were among the fund’s top relative detractors for the reporting period.
Stock selection within the financial services sector also held back relative performance. Within this sector, the fund’s overweight holdings of global banking group BNP Paribas (France) and property development firm CK Asset Holdings (Hong Kong) weakened relative results. Shares of BNP Paribas underperformed during the reporting period after the company reported underlying pretax profit below consensus estimates, mainly due
4
Management Review – continued
to weaker-than-expected corporate and institutional banking. The firm’s capital market revenues and fixed income revenues were the main detractors, while its international financial services profits were also weaker, due to lower BancWest revenues and higher costs in its personal finance and wealth & asset management divisions.
Security selection within the health care sector further detracted from relative results. Here, the fund’s overweight holdings of biopharmaceutical company Celgene (h) and healthcare products maker Bayer AG (Germany) held back relative returns. The share price of Bayer declined during the reporting period after the company reported weak sales results across its pharmaceutical, consumer health and crop science divisions. Management also issued unfavorable guidance for 2018, which further weighed on the stock.
In other sectors, the portfolio’s underweight positions in strong-performing internet retailer Amazon.com, computer and personal electronics maker Apple and software giant Microsoft detracted from relative returns, as all three companies outpaced the benchmark. The fund’s overweight positions in tobacco company Philip Morris International and residential and commercial building materials manufacturer Owens Corning (h) hampered relative results. Additionally, the fund’s holdings of electronics manufacturer Hon Hai Precision Industry (b) (Taiwan) held back relative performance.
Contributors to Performance
Stock selection in both the energy and basic materials sectors aided relative performance during the reporting period. Within the energy sector, the fund’s overweight position in multinational energy company Phillips 66 contributed to relative returns. Shares of Phillips 66 outpaced the benchmark as strength in the company’s midstream and chemicals divisions drove better-than-expected earnings results. The company also completed $3.5 billion in share repurchases, which further supported the stock price. Within the basic materials sector, the fund’s position in methanol producer Methanex (b) (Canada) had a positive impact on relative performance. Shares of Methanex rose as the company acquired additional land at its existing Geismar site for future development and methanol production, which supported the stock price.
Elsewhere, the fund’s overweight holdings of software company Adobe Systems, hospital operator HCA Healthcare, multinational retailer Best Buy, network equipment company Cisco Systems, luxury goods company LVMH Moet Hennessy Louis Vuitton SE (France), pharmaceutical company Eli Lilly and technology company Alphabet all contributed to relative performance. Not owning shares of diversified industrial conglomerate General Electric contributed positively to relative performance. The share price of General Electric fell over the period as weakness in the company’s power and energy division, along with other impairment charges, weighed on earnings results and led management to slash the firm’s dividend.
Respectfully,
Portfolio Manager(s)
Jim Fallon, Matt Krummell, Jonathan Sage, and Jed Stocks
| (b) | Security is not a benchmark constituent. |
| (h) | Security was not held in the portfolio at period end. |
5
Management Review – continued
The views expressed in this report are those of the portfolio manager(s) only through the end of the period of the report as stated on the cover and do not necessarily reflect the views of MFS or any other person in the MFS organization. These views are subject to change at any time based on market or other conditions, and MFS disclaims any responsibility to update such views. These views may not be relied upon as investment advice or an indication of trading intent on behalf of any MFS portfolio. References to specific securities are not recommendations of such securities, and may not be representative of any MFS portfolio’s current or future investments.
6
PERFORMANCE SUMMARY THROUGH 8/31/18
The following chart illustrates a representative class of the fund’s historical performance in comparison to its benchmark(s). Performance results include the deduction of the maximum applicable sales charge and reflect the percentage change in net asset value, including reinvestment of dividends and capital gains distributions. The performance of other share classes will be greater than or less than that of the class depicted below. Benchmarks are unmanaged and may not be invested in directly. Benchmark returns do not reflect sales charges, commissions or expenses. (See Notes to Performance Summary.)
Performance data shown represents past performance and is no guarantee of future results. Investment return and principal value fluctuate so your shares, when sold, may be worth more or less than the original cost; current performance may be lower or higher than quoted. The performance shown does not reflect the deduction of taxes, if any, that a shareholder would pay on fund distributions or the redemption of fund shares.
Growth of a Hypothetical $10,000 Investment (t)
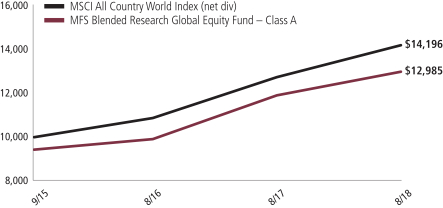
7
Performance Summary – continued
Total Returns through 8/31/18
Average annual without sales charge
| | | | | | | | | | |
| | | Share Class | | Class Inception Date | | 1-yr | | Life (t) | | |
| | | A | | 9/15/15 | | 9.05% | | 11.42% | | |
| | | B | | 9/15/15 | | 8.24% | | 10.57% | | |
| | | C | | 9/15/15 | | 8.23% | | 10.57% | | |
| | | I | | 9/15/15 | | 9.35% | | 11.68% | | |
| | | R1 | | 9/15/15 | | 8.25% | | 10.57% | | |
| | | R2 | | 9/15/15 | | 8.71% | | 11.11% | | |
| | | R3 | | 9/15/15 | | 9.03% | | 11.40% | | |
| | | R4 | | 9/15/15 | | 9.35% | | 11.69% | | |
| | | R6 | | 9/15/15 | | 9.41% | | 11.74% | | |
| Comparative benchmark(s) | | | | | | |
| | | MSCI All Country World Index (net div) (f) | | 11.41% | | 12.55% | | |
| Average annual with sales charge | | | | | | |
| | | A
With Initial Sales Charge (5.75%) | | 2.78% | | 9.21% | | |
| | | B
With CDSC (Declining over six years from 4% to 0%) (v) | | 4.24% | | 9.73% | | |
| | | C
With CDSC (1% for 12 months) (v) | | 7.23% | | 10.57% | | |
CDSC – Contingent Deferred Sales Charge.
Class I, R1, R2, R3, R4, and R6 shares do not have a sales charge.
| (f) | Source: FactSet Research Systems Inc. |
| (t) | For the period from the class inception date through the stated period end. (See Notes to Performance Summary.) |
| (v) | Assuming redemption at the end of the applicable period. |
Benchmark Definition(s)
MSCI All Country World Index (net div) – a market capitalization-weighted index that is designed to measure equity market performance in the global developed and emerging markets.
It is not possible to invest directly in an index.
Notes to Performance Summary
Average annual total return represents the average annual change in value for each share class for the periods presented. Life returns are presented where the share class has less than 10 years of performance history and represent the average annual total return from the class inception date to the stated period end date.
8
Performance Summary – continued
Performance results reflect any applicable expense subsidies and waivers in effect during the periods shown. Without such subsidies and waivers the fund’s performance results would be less favorable. Please see the prospectus and financial statements for complete details.
Performance results do not include adjustments made for financial reporting purposes in accordance with U.S. generally accepted accounting principles and may differ from amounts reported in the financial highlights.
From time to time the fund may receive proceeds from litigation settlements, without which performance would be lower.
9
EXPENSE TABLE
Fund expenses borne by the shareholders during the period, March 1, 2018 through August 31, 2018
As a shareholder of the fund, you incur two types of costs: (1) transaction costs, including sales charges (loads) on certain purchase or redemption payments, and (2) ongoing costs, including management fees; distribution and service (12b-1) fees; and other fund expenses. This example is intended to help you understand your ongoing costs (in dollars) of investing in the fund and to compare these costs with the ongoing costs of investing in other mutual funds.
The example is based on an investment of $1,000 invested at the beginning of the period and held for the entire period March 1, 2018 through August 31, 2018.
Actual Expenses
The first line for each share class in the following table provides information about actual account values and actual expenses. You may use the information in this line, together with the amount you invested, to estimate the expenses that you paid over the period. Simply divide your account value by $1,000 (for example, an $8,600 account value divided by $1,000 = 8.6), then multiply the result by the number in the first line under the heading entitled “Expenses Paid During Period” to estimate the expenses you paid on your account during this period.
Hypothetical Example for Comparison Purposes
The second line for each share class in the following table provides information about hypothetical account values and hypothetical expenses based on the fund’s actual expense ratio and an assumed rate of return of 5% per year before expenses, which is not the fund’s actual return. The hypothetical account values and expenses may not be used to estimate the actual ending account balance or expenses you paid for the period. You may use this information to compare the ongoing costs of investing in the fund and other funds. To do so, compare this 5% hypothetical example with the 5% hypothetical examples that appear in the shareholder reports of the other funds.
Please note that the expenses shown in the table are meant to highlight your ongoing costs only and do not reflect any transactional costs, such as sales charges (loads). Therefore, the second line for each share class in the table is useful in comparing ongoing costs only, and will not help you determine the relative total costs of owning different funds. In addition, if these transactional costs were included, your costs would have been higher.
10
Expense Table – continued
| | | | | | | | | | | | | | | | | | |
Share
Class | | | | Annualized
Expense Ratio | | | Beginning
Account Value
3/01/18 | | | Ending Account Value
8/31/18 | | | Expenses Paid During Period (p) 3/01/18-8/31/18 | |
| A | | Actual | | | 0.89% | | | | $1,000.00 | | | | $1,013.98 | | | | $4.52 | |
| | Hypothetical (h) | | | 0.89% | | | | $1,000.00 | | | | $1,020.72 | | | | $4.53 | |
| B | | Actual | | | 1.64% | | | | $1,000.00 | | | | $1,010.11 | | | | $8.31 | |
| | Hypothetical (h) | | | 1.64% | | | | $1,000.00 | | | | $1,016.94 | | | | $8.34 | |
| C | | Actual | | | 1.64% | | | | $1,000.00 | | | | $1,010.12 | | | | $8.31 | |
| | Hypothetical (h) | | | 1.64% | | | | $1,000.00 | | | | $1,016.94 | | | | $8.34 | |
| I | | Actual | | | 0.64% | | | | $1,000.00 | | | | $1,015.49 | | | | $3.25 | |
| | Hypothetical (h) | | | 0.64% | | | | $1,000.00 | | | | $1,021.98 | | | | $3.26 | |
| R1 | | Actual | | | 1.64% | | | | $1,000.00 | | | | $1,010.10 | | | | $8.31 | |
| | Hypothetical (h) | | | 1.64% | | | | $1,000.00 | | | | $1,016.94 | | | | $8.34 | |
| R2 | | Actual | | | 1.14% | | | | $1,000.00 | | | | $1,012.41 | | | | $5.78 | |
| | Hypothetical (h) | | | 1.14% | | | | $1,000.00 | | | | $1,019.46 | | | | $5.80 | |
| R3 | | Actual | | | 0.89% | | | | $1,000.00 | | | | $1,013.95 | | | | $4.52 | |
| | Hypothetical (h) | | | 0.89% | | | | $1,000.00 | | | | $1,020.72 | | | | $4.53 | |
| R4 | | Actual | | | 0.64% | | | | $1,000.00 | | | | $1,015.49 | | | | $3.25 | |
| | Hypothetical (h) | | | 0.64% | | | | $1,000.00 | | | | $1,021.98 | | | | $3.26 | |
| R6 | | Actual | | | 0.55% | | | | $1,000.00 | | | | $1,016.27 | | | | $2.80 | |
| | Hypothetical (h) | | | 0.55% | | | | $1,000.00 | | | | $1,022.43 | | | | $2.80 | |
| (h) | 5% class return per year before expenses. |
| (p) | “Expenses Paid During Period” are equal to each class’s annualized expense ratio, as shown above, multiplied by the average account value over the period, multiplied by 184/365 (to reflect the one-half year period). Expenses paid do not include any applicable sales charges (loads). If these transaction costs had been included, your costs would have been higher. |
Notes to Expense Table
Each class with a Rule 12b-1 service fee is subject to a rebate of a portion of such fee. Such rebates are included in the expense ratios above and are outside of the expense limitation arrangement. For Class A shares, this rebate reduced the expense ratio above by 0.01%. See Note 3 in the Notes to Financial Statements for additional information.
11
PORTFOLIO OF INVESTMENTS
8/31/18
The Portfolio of Investments is a complete list of all securities owned by your fund. It is categorized by broad-based asset classes.
| | | | | | | | |
| Common Stocks - 96.4% | | | | | | | | |
| Issuer | | Shares/Par | | | Value ($) | |
| Aerospace - 1.7% | | | | | | | | |
| Boeing Co. | | | 291 | | | $ | 99,752 | |
| | |
| Airlines - 1.8% | | | | | | | | |
| Aena S.A. | | | 313 | | | $ | 55,406 | |
| Air Canada (a) | | | 2,311 | | | | 47,495 | |
| | | | | | | | |
| | | | | | | $ | 102,901 | |
| Apparel Manufacturers - 1.6% | | | | | | | | |
| LVMH Moet Hennessy Louis Vuitton SE | | | 264 | | | $ | 92,498 | |
| | |
| Automotive - 2.7% | | | | | | | | |
| Magna International, Inc. | | | 1,350 | | | $ | 73,062 | |
| Toyota Motor Corp. | | | 1,400 | | | | 87,319 | |
| | | | | | | | |
| | | | | | | $ | 160,381 | |
| Biotechnology - 1.0% | | | | | | | | |
| Biogen, Inc. (a) | | | 159 | | | $ | 56,205 | |
| | |
| Brokerage & Asset Managers - 1.9% | | | | | | | | |
| Apollo Global Management LLC, “A” | | | 2,354 | | | $ | 81,284 | |
| IG Group Holdings PLC | | | 2,545 | | | | 29,827 | |
| | | | | | | | |
| | | | | | | $ | 111,111 | |
| Business Services - 1.6% | | | | | | | | |
| Cognizant Technology Solutions Corp., “A” | | | 230 | | | $ | 18,039 | |
| DXC Technology Co. | | | 797 | | | | 72,599 | |
| | | | | | | | |
| | | | | | | $ | 90,638 | |
| Cable TV - 1.3% | | | | | | | | |
| Comcast Corp., “A” | | | 2,134 | | | $ | 78,937 | |
| | |
| Chemicals - 0.8% | | | | | | | | |
| CF Industries Holdings, Inc. | | | 914 | | | $ | 47,482 | |
| | |
| Computer Software - 4.9% | | | | | | | | |
| Adobe Systems, Inc. (a) | | | 373 | | | $ | 98,289 | |
| Check Point Software Technologies Ltd. (a) | | | 437 | | | | 50,775 | |
| Microsoft Corp. | | | 1,008 | | | | 113,229 | |
| Salesforce.com, Inc. (a) | | | 150 | | | | 22,902 | |
| | | | | | | | |
| | | | | | | $ | 285,195 | |
12
Portfolio of Investments – continued
| | | | | | | | |
| Issuer | | Shares/Par | | | Value ($) | |
| Common Stocks - continued | | | | | | | | |
| Computer Software - Systems - 2.6% | | | | | | | | |
| Apple, Inc. | | | 241 | | | $ | 54,859 | |
| Hitachi Ltd. | | | 11,000 | | | | 71,825 | |
| Hon Hai Precision Industry Co. Ltd., GDR | | | 4,766 | | | | 25,355 | |
| | | | | | | | |
| | | | | | | $ | 152,039 | |
| Consumer Products - 1.1% | | | | | | | | |
| Essity AB | | | 637 | | | $ | 16,508 | |
| Kimberly-Clark Corp. | | | 410 | | | | 47,372 | |
| | | | | | | | |
| | | | | | | $ | 63,880 | |
| Consumer Services - 1.4% | | | | | | | | |
| Bookings Holdings, Inc. (a) | | | 34 | | | $ | 66,353 | |
| Localiza Rent a Car S.A. | | | 3,200 | | | | 16,915 | |
| | | | | | | | |
| | | | | | | $ | 83,268 | |
| Electrical Equipment - 1.2% | | | | | | | | |
| Schneider Electric S.A. | | | 861 | | | $ | 70,198 | |
| | |
| Electronics - 3.9% | | | | | | | | |
| Applied Materials, Inc. | | | 485 | | | $ | 20,865 | |
| NVIDIA Corp. | | | 70 | | | | 19,648 | |
| Samsung Electronics Co. Ltd. | | | 1,950 | | | | 84,874 | |
| Taiwan Semiconductor Manufacturing Co. Ltd., ADR | | | 2,361 | | | | 102,939 | |
| | | | | | | | |
| | | | | | | $ | 228,326 | |
| Energy - Independent - 3.0% | | | | | | | | |
| CNOOC Ltd. | | | 21,000 | | | $ | 37,137 | |
| Marathon Petroleum Corp. | | | 611 | | | | 50,280 | |
| Phillips 66 | | | 716 | | | | 84,853 | |
| | | | | | | | |
| | | | | | | $ | 172,270 | |
| Energy - Integrated - 3.0% | | | | | | | | |
| BP PLC | | | 10,202 | | | $ | 72,388 | |
| China Petroleum & Chemical Corp. | | | 18,000 | | | | 18,095 | |
| Galp Energia SGPS S.A., “B” | | | 2,867 | | | | 58,138 | |
| LUKOIL PJSC, ADR | | | 420 | | | | 28,980 | |
| | | | | | | | |
| | | | | | | $ | 177,601 | |
| Engineering - Construction - 0.7% | | | | | | | | |
| Bouygues S.A. | | | 390 | | | $ | 17,216 | |
| GS Engineering & Construction Corp. | | | 500 | | | | 21,515 | |
| | | | | | | | |
| | | | | | | $ | 38,731 | |
13
Portfolio of Investments – continued
| | | | | | | | |
| Issuer | | Shares/Par | | | Value ($) | |
| Common Stocks - continued | | | | | | | | |
| Food & Beverages - 2.6% | | | | | | | | |
| Bakkafrost P/f | | | 610 | | | $ | 34,828 | |
| Marine Harvest | | | 3,060 | | | | 66,099 | |
| Tyson Foods, Inc., “A” | | | 768 | | | | 48,238 | |
| | | | | | | | |
| | | | | | | $ | 149,165 | |
| Food & Drug Stores - 0.5% | | | | | | | | |
| Wesfarmers Ltd. | | | 788 | | | $ | 29,146 | |
| | |
| Forest & Paper Products - 0.4% | | | | | | | | |
| Svenska Cellulosa Aktiebolaget | | | 2,027 | | | $ | 23,594 | |
| | |
| Gaming & Lodging - 0.7% | | | | | | | | |
| Marriott International, Inc., “A” | | | 310 | | | $ | 39,206 | |
| | |
| Health Maintenance Organizations - 1.6% | | | | | | | | |
| Cigna Corp. | | | 101 | | | $ | 19,022 | |
| Humana Inc. | | | 219 | | | | 72,984 | |
| | | | | | | | |
| | | | | | | $ | 92,006 | |
| Insurance - 3.3% | | | | | | | | |
| MetLife, Inc. | | | 1,583 | | | $ | 72,644 | |
| Prudential Financial, Inc. | | | 452 | | | | 44,409 | |
| Zurich Insurance Group AG | | | 238 | | | | 72,486 | |
| | | | | | | | |
| | | | | | | $ | 189,539 | |
| Internet - 4.7% | | | | | | | | |
| Alphabet, Inc., “A” (a) | | | 111 | | | $ | 136,730 | |
| Alphabet, Inc., “C” (a) | | | 24 | | | | 29,236 | |
| Facebook, Inc., “A” (a) | | | 611 | | | | 107,371 | |
| | | | | | | | |
| | | | | | | $ | 273,337 | |
| Leisure & Toys - 0.3% | | | | | | | | |
| Capcom Co. Ltd. | | | 700 | | | $ | 16,323 | |
| | |
| Machinery & Tools - 3.2% | | | | | | | | |
| Allison Transmission Holdings, Inc. | | | 580 | | | $ | 28,803 | |
| Eaton Corp. PLC | | | 933 | | | | 77,569 | |
| Ingersoll-Rand Co. Ltd., “A” | | | 210 | | | | 21,271 | |
| Regal Beloit Corp. | | | 700 | | | | 58,590 | |
| | | | | | | | |
| | | | | | | $ | 186,233 | |
| Major Banks - 8.1% | | | | | | | | |
| Banco Bradesco S.A., ADR | | | 3,803 | | | $ | 26,393 | |
| Bank of America Corp. | | | 2,770 | | | | 85,676 | |
14
Portfolio of Investments – continued
| | | | | | | | |
| Issuer | | Shares/Par | | | Value ($) | |
| Common Stocks - continued | | | | | | | | |
| Major Banks - continued | | | | | | | | |
| Bank of China Ltd. | | | 54,000 | | | $ | 24,287 | |
| BNP Paribas | | | 1,103 | | | | 64,758 | |
| China Construction Bank | | | 35,000 | | | | 30,992 | |
| Royal Bank of Canada | | | 464 | | | | 36,857 | |
| Sumitomo Mitsui Financial Group, Inc. | | | 1,700 | | | | 67,030 | |
| Toronto-Dominion Bank | | | 1,313 | | | | 79,132 | |
| UBS AG | | | 3,479 | | | | 54,325 | |
| | | | | | | | |
| | | | | | | $ | 469,450 | |
| Medical & Health Technology & Services - 3.8% | | | | | | | | |
| Express Scripts Holding Co. (a) | | | 756 | | | $ | 66,543 | |
| HCA Healthcare, Inc. | | | 675 | | | | 90,524 | |
| McKesson Corp. | | | 191 | | | | 24,591 | |
| Walgreens Boots Alliance, Inc. | | | 590 | | | | 40,451 | |
| | | | | | | | |
| | | | | | | $ | 222,109 | |
| Metals & Mining - 2.2% | | | | | | | | |
| POSCO | | | 241 | | | $ | 70,688 | |
| Rio Tinto Ltd. | | | 1,169 | | | | 55,454 | |
| | | | | | | | |
| | | | | | | $ | 126,142 | |
| Natural Gas - Distribution - 0.4% | | | | | | | | |
| ENGIE | | | 1,724 | | | $ | 25,274 | |
| | |
| Network & Telecom - 1.5% | | | | | | | | |
| Cisco Systems, Inc. | | | 1,873 | | | $ | 89,473 | |
| | |
| Other Banks & Diversified Financials - 2.9% | | | | | | | | |
| Credicorp Ltd. | | | 131 | | | $ | 28,561 | |
| DBS Group Holdings Ltd. | | | 1,700 | | | | 30,902 | |
| Discover Financial Services | | | 1,012 | | | | 79,057 | |
| ORIX Corp. | | | 1,900 | | | | 30,558 | |
| | | | | | | | |
| | | | | | | $ | 169,078 | |
| Pharmaceuticals - 6.2% | | | | | | | | |
| Bayer AG | | | 851 | | | $ | 79,399 | |
| Bristol-Myers Squibb Co. | | | 1,524 | | | | 92,278 | |
| Eli Lilly & Co. | | | 837 | | | | 88,429 | |
| Pfizer, Inc. | | | 1,434 | | | | 59,540 | |
| Shionogi & Co. Ltd. | | | 700 | | | | 40,673 | |
| | | | | | | | |
| | | | | | | $ | 360,319 | |
| Printing & Publishing - 0.8% | | | | | | | | |
| Transcontinental, Inc., “A” | | | 1,938 | | | $ | 47,210 | |
15
Portfolio of Investments – continued
| | | | | | | | |
| Issuer | | Shares/Par | | | Value ($) | |
| Common Stocks - continued | | | | | | | | |
| Real Estate - 2.1% | | | | | | | | |
| CK Asset Holdings Ltd. | | | 7,000 | | | $ | 49,899 | |
| Medical Properties Trust, Inc., REIT | | | 1,381 | | | | 20,784 | |
| Store Capital Corp., REIT | | | 1,833 | | | | 52,809 | |
| | | | | | | | |
| | | | | | | $ | 123,492 | |
| Restaurants - 2.4% | | | | | | | | |
| Aramark | | | 1,037 | | | $ | 42,600 | |
| Greggs PLC | | | 2,774 | | | | 38,229 | |
| U.S. Foods Holding Corp. (a) | | | 1,898 | | | | 61,856 | |
| | | | | | | | |
| | | | | | | $ | 142,685 | |
| Specialty Chemicals - 1.5% | | | | | | | | |
| Covestro AG | | | 350 | | | $ | 29,812 | |
| Methanex Corp. | | | 769 | | | | 56,060 | |
| | | | | | | | |
| | | | | | | $ | 85,872 | |
| Specialty Stores - 3.3% | | | | | | | | |
| Amazon.com, Inc. (a) | | | 20 | | | $ | 40,254 | |
| Best Buy Co., Inc. | | | 646 | | | | 51,396 | |
| Ross Stores, Inc. | | | 408 | | | | 39,078 | |
| Urban Outfitters, Inc. (a) | | | 1,370 | | | | 63,678 | |
| | | | | | | | |
| | | | | | | $ | 194,406 | |
| Telecommunications - Wireless - 2.1% | | | | | | | | |
| KDDI Corp. | | | 1,600 | | | $ | 42,351 | |
| SK Telecom Co. Ltd. | | | 207 | | | | 48,814 | |
| Vodafone Group PLC | | | 14,184 | | | | 30,250 | |
| | | | | | | | |
| | | | | | | $ | 121,415 | |
| Telephone Services - 0.3% | | | | | | | | |
| KT Corp., ADR | | | 1,234 | | | $ | 17,042 | |
| | |
| Tobacco - 2.5% | | | | | | | | |
| Japan Tobacco, Inc. | | | 2,800 | | | $ | 73,635 | |
| Philip Morris International, Inc. | | | 951 | | | | 74,074 | |
| | | | | | | | |
| | | | | | | $ | 147,709 | |
| Utilities - Electric Power - 2.8% | | | | | | | | |
| CLP Holdings Ltd. | | | 3,500 | | | $ | 41,137 | |
| Exelon Corp. | | | 1,725 | | | | 75,400 | |
| SSE PLC | | | 2,749 | | | | 44,656 | |
| | | | | | | | |
| | | | | | | $ | 161,193 | |
| Total Common Stocks (Identified Cost, $4,626,896) | | | | | | $ | 5,612,831 | |
16
Portfolio of Investments – continued
| | | | | | | | |
| Preferred Stocks - 1.5% | | | | | | | | |
| Issuer | | Shares/Par | | | Value ($) | |
| Electronics - 0.3% | | | | | | | | |
| Samsung Electronics Co. Ltd. | | | 460 | | | $ | 16,406 | |
| | |
| Major Banks - 0.9% | | | | | | | | |
| Itau Unibanco Holding S.A. | | | 5,050 | | | $ | 52,408 | |
| | |
| Telephone Services - 0.3% | | | | | | | | |
| Telecom Italia S.p.A. | | | 30,782 | | | $ | 17,111 | |
| Total Preferred Stocks (Identified Cost, $77,679) | | | | | | $ | 85,925 | |
| | |
| Investment Companies (h) - 2.1% | | | | | | | | |
| Money Market Funds - 2.1% | | | | | | | | |
MFS Institutional Money Market Portfolio, 2.03% (v)
(Identified Cost, $122,935) | | | 122,953 | | | $ | 122,953 | |
| | |
| Other Assets, Less Liabilities - (0.0)% | | | | | | | (2,086 | ) |
| Net Assets - 100.0% | | | | | | $ | 5,819,623 | |
| (a) | Non-income producing security. |
| (h) | An affiliated issuer, which may be considered one in which the fund owns 5% or more of the outstanding voting securities, or a company which is under common control. At period end, the aggregate values of the fund’s investments in affiliated issuers and in unaffiliated issuers were $122,953 and $5,698,756, respectively. |
| (v) | Affiliated issuer that is available only to investment companies managed by MFS. The rate quoted for the MFS Institutional Money Market Portfolio is the annualized seven-day yield of the fund at period end. |
The following abbreviations are used in this report and are defined:
| ADR | | American Depositary Receipt |
| GDR | | Global Depositary Receipt |
| PJSC | | Public Joint Stock Company |
| PLC | | Public Limited Company |
| REIT | | Real Estate Investment Trust |
See Notes to Financial Statements
17
Financial Statements
STATEMENT OF ASSETS AND LIABILITIES
At 8/31/18
This statement represents your fund’s balance sheet, which details the assets and liabilities comprising the total value of the fund.
| | | | |
| Assets | | | | |
Investments in unaffiliated issuers, at value (identified cost, $4,704,575) | | | $5,698,756 | |
Investments in affiliated issuers, at value (identified cost, $122,935) | | | 122,953 | |
Cash | | | 394 | |
Foreign currency, at value (identified cost, $50,378) | | | 50,515 | |
Receivables for | | | | |
Investments sold | | | 41,725 | |
Fund shares sold | | | 23,819 | |
Dividends | | | 17,348 | |
Receivable from investment adviser | | | 24,854 | |
Other assets | | | 34 | |
Total assets | | | $5,980,398 | |
| Liabilities | | | | |
Payables for | | | | |
Investments purchased | | | $83,816 | |
Payable to affiliates | | | | |
Shareholder servicing costs | | | 1,032 | |
Distribution and service fees | | | 25 | |
Payable for independent Trustees’ compensation | | | 7 | |
Accrued expenses and other liabilities | | | 75,895 | |
Total liabilities | | | $160,775 | |
Net assets | | | $5,819,623 | |
| Net assets consist of | | | | |
Paid-in capital | | | $4,388,903 | |
Unrealized appreciation (depreciation) | | | 994,041 | |
Accumulated net realized gain (loss) | | | 363,725 | |
Undistributed net investment income | | | 72,954 | |
Net assets | | | $5,819,623 | |
Shares of beneficial interest outstanding | | | 444,361 | |
18
Statement of Assets and Liabilities – continued
| | | | | | | | | | | | |
| | | Net assets | | | Shares
outstanding | | | Net asset value
per share (a) | |
Class A | | | $909,660 | | | | 69,663 | | | | $13.06 | |
Class B | | | 76,630 | | | | 5,899 | | | | 12.99 | |
Class C | | | 218,919 | | | | 16,870 | | | | 12.98 | |
Class I | | | 633,432 | | | | 48,333 | | | | 13.11 | |
Class R1 | | | 67,343 | | | | 5,181 | | | | 13.00 | |
Class R2 | | | 68,347 | | | | 5,236 | | | | 13.05 | |
Class R3 | | | 68,857 | | | | 5,264 | | | | 13.08 | |
Class R4 | | | 69,367 | | | | 5,293 | | | | 13.11 | |
Class R6 | | | 3,707,068 | | | | 282,622 | | | | 13.12 | |
| (a) | Maximum offering price per share was equal to the net asset value per share for all share classes, except for Class A, for which the maximum offering price per share was $13.86 [100 / 94.25 x $13.06]. On sales of $50,000 or more, the maximum offering price of Class A shares is reduced. A contingent deferred sales charge may be imposed on redemptions of Class A, Class B, and Class C shares. Redemption price per share was equal to the net asset value per share for Classes I, R1, R2, R3, R4, and R6. |
See Notes to Financial Statements
19
Financial Statements
STATEMENT OF OPERATIONS
Year ended 8/31/18
This statement describes how much your fund earned in investment income and accrued in expenses. It also describes any gains and/or losses generated by fund operations.
| | | | |
| Net investment income (loss) | | | | |
Income | | | | |
Dividends | | | $155,887 | |
Dividends from affiliated issuers | | | 1,787 | |
Other | | | 317 | |
Foreign taxes withheld | | | (10,671 | ) |
Total investment income | | | $147,320 | |
Expenses | | | | |
Management fee | | | $30,346 | |
Distribution and service fees | | | 5,636 | |
Shareholder servicing costs | | | 3,640 | |
Administrative services fee | | | 17,500 | |
Independent Trustees’ compensation | | | 1,089 | |
Custodian fee | | | 24,640 | |
Shareholder communications | | | 8,379 | |
Audit and tax fees | | | 64,060 | |
Legal fees | | | 586 | |
Registration fees | | | 122,866 | |
Miscellaneous | | | 20,025 | |
Total expenses | | | $298,767 | |
Reduction of expenses by investment adviser and distributor | | | (257,432 | ) |
Net expenses | | | $41,335 | |
Net investment income (loss) | | | $105,985 | |
| Realized and unrealized gain (loss) | | | | |
Realized gain (loss) (identified cost basis) | | | | |
Unaffiliated issuers | | | $478,668 | |
Affiliated issuers | | | (3 | ) |
Foreign currency | | | (350 | ) |
Net realized gain (loss) | | | $478,315 | |
Change in unrealized appreciation or depreciation | | | | |
Unaffiliated issuers | | | $(21,592 | ) |
Affiliated issuers | | | 11 | |
Translation of assets and liabilities in foreign currencies | | | (272 | ) |
Net unrealized gain (loss) | | | $(21,853 | ) |
Net realized and unrealized gain (loss) | | | $456,462 | |
Change in net assets from operations | | | $562,447 | |
See Notes to Financial Statements
20
Financial Statements
STATEMENTS OF CHANGES IN NET ASSETS
These statements describe the increases and/or decreases in net assets resulting from operations,
any distributions, and any shareholder transactions.
| | | | | | | | |
| | | Year ended | |
| | | 8/31/18 | | | 8/31/17 | |
| Change in net assets | | | | | | |
| From operations | | | | | | | | |
Net investment income (loss) | | | $105,985 | | | | $95,696 | |
Net realized gain (loss) | | | 478,315 | | | | 91,214 | |
Net unrealized gain (loss) | | | (21,853 | ) | | | 822,794 | |
Change in net assets from operations | | | $562,447 | | | | $1,009,704 | |
| Distributions declared to shareholders | | | | | | | | |
From net investment income | | | $(105,003 | ) | | | $(80,010 | ) |
From net realized gain | | | (101,308 | ) | | | — | |
Total distributions declared to shareholders | | | $(206,311 | ) | | | $(80,010 | ) |
Change in net assets from fund share transactions | | | $(793,979 | ) | | | $1,127,290 | |
Total change in net assets | | | $(437,843 | ) | | | $2,056,984 | |
| Net assets | | | | | | | | |
At beginning of period | | | 6,257,466 | | | | 4,200,482 | |
At end of period (including undistributed net investment
income of $72,954 and $74,219, respectively) | | | $5,819,623 | | | | $6,257,466 | |
See Notes to Financial Statements
21
Financial Statements
FINANCIAL HIGHLIGHTS
The financial highlights table is intended to help you understand the fund’s financial performance for the past 5 years (or life of a particular share class, if shorter). Certain information reflects financial results for a single fund share. The total returns in the table represent the rate that an investor would have earned (or lost) on an investment in the fund share class (assuming reinvestment of all distributions) held for the entire period.
| | | | | | | | | | | | |
| Class A | | Year ended | |
| | | 8/31/18 | | | 8/31/17 | | | 8/31/16 (c) | |
Net asset value, beginning of period | | | $12.35 | | | | $10.46 | | | | $10.00 | |
| Income (loss) from investment operations | | | | | | | | | | | | |
Net investment income (loss) (d) | | | $0.22 | | | | $0.19 | | | | $0.20 | |
Net realized and unrealized gain (loss) | | | 0.88 | | | | 1.88 | | | | 0.32 | |
Total from investment operations | | | $1.10 | | | | $2.07 | | | | $0.52 | |
| Less distributions declared to shareholders | | | | | | | | | | | | |
From net investment income | | | $(0.19 | ) | | | $(0.18 | ) | | | $(0.04 | ) |
From net realized gain | | | (0.20 | ) | | | — | | | | (0.02 | ) |
Total distributions declared to shareholders | | | $(0.39 | ) | | | $(0.18 | ) | | | $(0.06 | ) |
Net asset value, end of period (x) | | | $13.06 | | | | $12.35 | | | | $10.46 | |
Total return (%) (r)(s)(t)(x) | | | 9.05 | | | | 20.07 | | | | 5.22 | (n) |
Ratios (%) (to average net assets)
and Supplemental data: | | | | | | | | | | | | |
Expenses before expense reductions (f) | | | 5.26 | | | | 5.22 | | | | 6.02 | (a) |
Expenses after expense reductions (f) | | | 0.88 | | | | 0.88 | | | | 0.86 | (a) |
Net investment income (loss) | | | 1.70 | | | | 1.63 | | | | 2.08 | (a) |
Portfolio turnover | | | 48 | | | | 55 | | | | 46 | (n) |
Net assets at end of period (000 omitted) | | | $910 | | | | $474 | | | | $168 | |
See Notes to Financial Statements
22
Financial Highlights – continued
| | | | | | | | | | | | |
| Class B | | Year ended | |
| | | 8/31/18 | | | 8/31/17 | | | 8/31/16 (c) | |
Net asset value, beginning of period | | | $12.29 | | | | $10.41 | | | | $10.00 | |
| Income (loss) from investment operations | | | | | | | | | | | | |
Net investment income (loss) (d) | | | $0.11 | | | | $0.09 | | | | $0.11 | |
Net realized and unrealized gain (loss) | | | 0.89 | | | | 1.89 | | | | 0.34 | |
Total from investment operations | | | $1.00 | | | | $1.98 | | | | $0.45 | |
| Less distributions declared to shareholders | | | | | | | | | | | | |
From net investment income | | | $(0.10 | ) | | | $(0.10 | ) | | | $(0.02 | ) |
From net realized gain | | | (0.20 | ) | | | — | | | | (0.02 | ) |
Total distributions declared to shareholders | | | $(0.30 | ) | | | $(0.10 | ) | | | $(0.04 | ) |
Net asset value, end of period (x) | | | $12.99 | | | | $12.29 | | | | $10.41 | |
Total return (%) (r)(s)(t)(x) | | | 8.24 | | | | 19.12 | | | | 4.47 | (n) |
Ratios (%) (to average net assets)
and Supplemental data: | | | | | | | | | | | | |
Expenses before expense reductions (f) | | | 5.94 | | | | 6.05 | | | | 7.17 | (a) |
Expenses after expense reductions (f) | | | 1.64 | | | | 1.64 | | | | 1.61 | (a) |
Net investment income (loss) | | | 0.86 | | | | 0.79 | | | | 1.19 | (a) |
Portfolio turnover | | | 48 | | | | 55 | | | | 46 | (n) |
Net assets at end of period (000 omitted) | | | $77 | | | | $64 | | | | $52 | |
| |
| Class C | | Year ended | |
| | | 8/31/18 | | | 8/31/17 | | | 8/31/16 (c) | |
Net asset value, beginning of period | | | $12.28 | | | | $10.41 | | | | $10.00 | |
| Income (loss) from investment operations | | | | | | | | | | | | |
Net investment income (loss) (d) | | | $0.12 | | | | $0.09 | | | | $0.13 | |
Net realized and unrealized gain (loss) | | | 0.88 | | | | 1.89 | | | | 0.32 | |
Total from investment operations | | | $1.00 | | | | $1.98 | | | | $0.45 | |
| Less distributions declared to shareholders | | | | | | | | | | | | |
From net investment income | | | $(0.10 | ) | | | $(0.11 | ) | | | $(0.02 | ) |
From net realized gain | | | (0.20 | ) | | | — | | | | (0.02 | ) |
Total distributions declared to shareholders | | | $(0.30 | ) | | | $(0.11 | ) | | | $(0.04 | ) |
Net asset value, end of period (x) | | | $12.98 | | | | $12.28 | | | | $10.41 | |
Total return (%) (r)(s)(t)(x) | | | 8.23 | | | | 19.14 | | | | 4.48 | (n) |
Ratios (%) (to average net assets)
and Supplemental data: | | | | | | | | | | | | |
Expenses before expense reductions (f) | | | 6.01 | | | | 6.06 | | | | 6.81 | (a) |
Expenses after expense reductions (f) | | | 1.64 | | | | 1.64 | | | | 1.61 | (a) |
Net investment income (loss) | | | 0.96 | | | | 0.78 | | | | 1.37 | (a) |
Portfolio turnover | | | 48 | | | | 55 | | | | 46 | (n) |
Net assets at end of period (000 omitted) | | | $219 | | | | $133 | | | | $104 | |
See Notes to Financial Statements
23
Financial Highlights – continued
| | | | | | | | | | | | |
| Class I | | Year ended | |
| | | 8/31/18 | | | 8/31/17 | | | 8/31/16 (c) | |
Net asset value, beginning of period | | | $12.38 | | | | $10.47 | | | | $10.00 | |
| Income (loss) from investment operations | | | | | | | | | | | | |
Net investment income (loss) (d) | | | $0.19 | | | | $0.22 | | | | $0.24 | |
Net realized and unrealized gain (loss) | | | 0.95 | | | | 1.89 | | | | 0.30 | |
Total from investment operations | | | $1.14 | | | | $2.11 | | | | $0.54 | |
| Less distributions declared to shareholders | | | | | | | | | | | | |
From net investment income | | | $(0.21 | ) | | | $(0.20 | ) | | | $(0.05 | ) |
From net realized gain | | | (0.20 | ) | | | — | | | | (0.02 | ) |
Total distributions declared to shareholders | | | $(0.41 | ) | | | $(0.20 | ) | | | $(0.07 | ) |
Net asset value, end of period (x) | | | $13.11 | | | | $12.38 | | | | $10.47 | |
Total return (%) (r)(s)(t)(x) | | | 9.35 | | | | 20.42 | | | | 5.38 | (n) |
Ratios (%) (to average net assets)
and Supplemental data: | | | | | | | | | | | | |
Expenses before expense reductions (f) | | | 4.63 | | | | 4.94 | | | | 4.99 | (a) |
Expenses after expense reductions (f) | | | 0.64 | | | | 0.64 | | | | 0.61 | (a) |
Net investment income (loss) | | | 1.45 | | | | 1.94 | | | | 2.50 | (a) |
Portfolio turnover | | | 48 | | | | 55 | | | | 46 | (n) |
Net assets at end of period (000 omitted) | | | $633 | | | | $1,959 | | | | $924 | |
| |
| Class R1 | | Year ended | |
| | | 8/31/18 | | | 8/31/17 | | | 8/31/16 (c) | |
Net asset value, beginning of period | | | $12.29 | | | | $10.41 | | | | $10.00 | |
| Income (loss) from investment operations | | | | | | | | | | | | |
Net investment income (loss) (d) | | | $0.11 | | | | $0.09 | | | | $0.11 | |
Net realized and unrealized gain (loss) | | | 0.89 | | | | 1.89 | | | | 0.34 | |
Total from investment operations | | | $1.00 | | | | $1.98 | | | | $0.45 | |
| Less distributions declared to shareholders | | | | | | | | | | | | |
From net investment income | | | $(0.09 | ) | | | $(0.10 | ) | | | $(0.02 | ) |
From net realized gain | | | (0.20 | ) | | | — | | | | (0.02 | ) |
Total distributions declared to shareholders | | | $(0.29 | ) | | | $(0.10 | ) | | | $(0.04 | ) |
Net asset value, end of period (x) | | | $13.00 | | | | $12.29 | | | | $10.41 | |
Total return (%) (r)(s)(t)(x) | | | 8.25 | | | | 19.12 | | | | 4.47 | (n) |
Ratios (%) (to average net assets)
and Supplemental data: | | | | | | | | | | | | |
Expenses before expense reductions (f) | | | 5.92 | | | | 6.06 | | | | 7.17 | (a) |
Expenses after expense reductions (f) | | | 1.64 | | | | 1.64 | | | | 1.61 | (a) |
Net investment income (loss) | | | 0.84 | | | | 0.78 | | | | 1.19 | (a) |
Portfolio turnover | | | 48 | | | | 55 | | | | 46 | (n) |
Net assets at end of period (000 omitted) | | | $67 | | | | $62 | | | | $52 | |
See Notes to Financial Statements
24
Financial Highlights – continued
| | | | | | | | | | | | |
| Class R2 | | Year ended | |
| | | 8/31/18 | | | 8/31/17 | | | 8/31/16 (c) | |
Net asset value, beginning of period | | | $12.34 | | | | $10.44 | | | | $10.00 | |
| Income (loss) from investment operations | | | | | | | | | | | | |
Net investment income (loss) (d) | | | $0.17 | | | | $0.14 | | | | $0.16 | |
Net realized and unrealized gain (loss) | | | 0.89 | | | | 1.91 | | | | 0.33 | |
Total from investment operations | | | $1.06 | | | | $2.05 | | | | $0.49 | |
| Less distributions declared to shareholders | | | | | | | | | | | | |
From net investment income | | | $(0.15 | ) | | | $(0.15 | ) | | | $(0.03 | ) |
From net realized gain | | | (0.20 | ) | | | — | | | | (0.02 | ) |
Total distributions declared to shareholders | | | $(0.35 | ) | | | $(0.15 | ) | | | $(0.05 | ) |
Net asset value, end of period (x) | | | $13.05 | | | | $12.34 | | | | $10.44 | |
Total return (%) (r)(s)(t)(x) | | | 8.71 | | | | 19.82 | | | | 4.92 | (n) |
Ratios (%) (to average net assets)
and Supplemental data: | | | | | | | | | | | | |
Expenses before expense reductions (f) | | | 5.42 | | | | 5.56 | | | | 6.67 | (a) |
Expenses after expense reductions (f) | | | 1.14 | | | | 1.14 | | | | 1.11 | (a) |
Net investment income (loss) | | | 1.34 | | | | 1.28 | | | | 1.69 | (a) |
Portfolio turnover | | | 48 | | | | 55 | | | | 46 | (n) |
Net assets at end of period (000 omitted) | | | $68 | | | | $63 | | | | $52 | |
| |
| Class R3 | | Year ended | |
| | | 8/31/18 | | | 8/31/17 | | | 8/31/16 (c) | |
Net asset value, beginning of period | | | $12.36 | | | | $10.46 | | | | $10.00 | |
| Income (loss) from investment operations | | | | | | | | | | | | |
Net investment income (loss) (d) | | | $0.20 | | | | $0.17 | | | | $0.19 | |
Net realized and unrealized gain (loss) | | | 0.90 | | | | 1.90 | | | | 0.33 | |
Total from investment operations | | | $1.10 | | | | $2.07 | | | | $0.52 | |
| Less distributions declared to shareholders | | | | | | | | | | | | |
From net investment income | | | $(0.18 | ) | | | $(0.17 | ) | | | $(0.04 | ) |
From net realized gain | | | (0.20 | ) | | | — | | | | (0.02 | ) |
Total distributions declared to shareholders | | | $(0.38 | ) | | | $(0.17 | ) | | | $(0.06 | ) |
Net asset value, end of period (x) | | | $13.08 | | | | $12.36 | | | | $10.46 | |
Total return (%) (r)(s)(t)(x) | | | 9.03 | | | | 20.06 | | | | 5.20 | (n) |
Ratios (%) (to average net assets)
and Supplemental data: | | | | | | | | | | | | |
Expenses before expense reductions (f) | | | 5.17 | | | | 5.31 | | | | 6.41 | (a) |
Expenses after expense reductions (f) | | | 0.89 | | | | 0.89 | | | | 0.86 | (a) |
Net investment income (loss) | | | 1.59 | | | | 1.53 | | | | 1.94 | (a) |
Portfolio turnover | | | 48 | | | | 55 | | | | 46 | (n) |
Net assets at end of period (000 omitted) | | | $69 | | | | $63 | | | | $53 | |
See Notes to Financial Statements
25
Financial Highlights – continued
| | | | | | | | | | | | |
| Class R4 | | Year ended | |
| | | 8/31/18 | | | 8/31/17 | | | 8/31/16 (c) | |
Net asset value, beginning of period | | | $12.38 | | | | $10.48 | | | | $10.00 | |
| Income (loss) from investment operations | | | | | | | | | | | | |
Net investment income (loss) (d) | | | $0.24 | | | | $0.20 | | | | $0.21 | |
Net realized and unrealized gain (loss) | | | 0.90 | | | | 1.90 | | | | 0.34 | |
Total from investment operations | | | $1.14 | | | | $2.10 | | | | $0.55 | |
| Less distributions declared to shareholders | | | | | | | | | | | | |
From net investment income | | | $(0.21 | ) | | | $(0.20 | ) | | | $(0.05 | ) |
From net realized gain | | | (0.20 | ) | | | — | | | | (0.02 | ) |
Total distributions declared to shareholders | | | $(0.41 | ) | | | $(0.20 | ) | | | $(0.07 | ) |
Net asset value, end of period (x) | | | $13.11 | | | | $12.38 | | | | $10.48 | |
Total return (%) (r)(s)(t)(x) | | | 9.35 | | | | 20.31 | | | | 5.48 | (n) |
Ratios (%) (to average net assets)
and Supplemental data: | | | | | | | | | | | | |
Expenses before expense reductions (f) | | | 4.92 | | | | 5.06 | | | | 6.16 | (a) |
Expenses after expense reductions (f) | | | 0.64 | | | | 0.64 | | | | 0.61 | (a) |
Net investment income (loss) | | | 1.84 | | | | 1.78 | | | | 2.19 | (a) |
Portfolio turnover | | | 48 | | | | 55 | | | | 46 | (n) |
Net assets at end of period (000 omitted) | | | $69 | | | | $63 | | | | $53 | |
| |
| Class R6 | | Year ended | |
| | | 8/31/18 | | | 8/31/17 | | | 8/31/16 (c) | |
Net asset value, beginning of period | | | $12.39 | | | | $10.48 | | | | $10.00 | |
| Income (loss) from investment operations | | | | | | | | | | | | |
Net investment income (loss) (d) | | | $0.25 | | | | $0.21 | | | | $0.21 | |
Net realized and unrealized gain (loss) | | | 0.90 | | | | 1.90 | | | | 0.34 | |
Total from investment operations | | | $1.15 | | | | $2.11 | | | | $0.55 | |
| Less distributions declared to shareholders | | | | | | | | | | | | |
From net investment income | | | $(0.22 | ) | | | $(0.20 | ) | | | $(0.05 | ) |
From net realized gain | | | (0.20 | ) | | | — | | | | (0.02 | ) |
Total distributions declared to shareholders | | | $(0.42 | ) | | | $(0.20 | ) | | | $(0.07 | ) |
Net asset value, end of period (x) | | | $13.12 | | | | $12.39 | | | | $10.48 | |
Total return (%) (r)(s)(t)(x) | | | 9.41 | | | | 20.42 | | | | 5.48 | (n) |
Ratios (%) (to average net assets)
and Supplemental data: | | | | | | | | | | | | |
Expenses before expense reductions (f) | | | 4.84 | | | | 5.01 | | | | 6.16 | (a) |
Expenses after expense reductions (f) | | | 0.55 | | | | 0.59 | | | | 0.60 | (a) |
Net investment income (loss) | | | 1.93 | | | | 1.84 | | | | 2.20 | (a) |
Portfolio turnover | | | 48 | | | | 55 | | | | 46 | (n) |
Net assets at end of period (000 omitted) | | | $3,707 | | | | $3,376 | | | | $2,742 | |
See Notes to Financial Statements
26
Financial Highlights – continued
| (c) | For the period from the commencement of the fund’s investment operations, September 15, 2015, through the stated period end. |
| (d) | Per share data is based on average shares outstanding. |
| (f) | Ratios do not reflect reductions from fees paid indirectly, if applicable. |
| (r) | Certain expenses have been reduced without which performance would have been lower. |
| (s) | From time to time the fund may receive proceeds from litigation settlements, without which performance would be lower. |
| (t) | Total returns do not include any applicable sales charges. |
| (x) | The net asset values and total returns have been calculated on net assets which include adjustments made in accordance with U.S. generally accepted accounting principles required at period end for financial reporting purposes. |
See Notes to Financial Statements
27
NOTES TO FINANCIAL STATEMENTS
(1) Business and Organization
MFS Blended Research Global Equity Fund (the fund) is a diversified series of MFS Series Trust IV (the trust). The trust is organized as a Massachusetts business trust and is registered under the Investment Company Act of 1940, as amended, as an open-end management investment company.
The fund is an investment company and accordingly follows the investment company accounting and reporting guidance of the Financial Accounting Standards Board (FASB) Accounting Standards Codification Topic 946 Financial Services – Investment Companies.
(2) Significant Accounting Policies
General – The preparation of financial statements in conformity with U.S. generally accepted accounting principles requires management to make estimates and assumptions that affect the reported amounts of assets and liabilities, and disclosure of contingent assets and liabilities at the date of the financial statements and the reported amounts of increases and decreases in net assets from operations during the reporting period. Actual results could differ from those estimates. In the preparation of these financial statements, management has evaluated subsequent events occurring after the date of the fund’s Statement of Assets and Liabilities through the date that the financial statements were issued. The fund invests in foreign securities. Investments in foreign securities are vulnerable to the effects of changes in the relative values of the local currency and the U.S. dollar and to the effects of changes in each country’s market, economic, industrial, political, regulatory, geopolitical, and other conditions.
In August 2018, the FASB issued Accounting Standards Update 2018-13, Fair Value Measurement (Topic 820) – Disclosure Framework – Changes to the Disclosure Requirements for Fair Value Measurement (“ASU 2018-13”) which introduces new fair value disclosure requirements as well as eliminates and modifies certain existing fair value disclosure requirements. ASU 2018-13 would be effective for fiscal years beginning after December 15, 2019, and interim periods within those fiscal years; however, management has elected to early adopt ASU 2018-13 effective with the current reporting period. The impact of the fund’s adoption was limited to changes in the fund’s financial statement disclosures regarding fair value, primarily those disclosures related to transfers between levels of the fair value hierarchy.
Balance Sheet Offsetting – The fund’s accounting policy with respect to balance sheet offsetting is that, absent an event of default by the counterparty or a termination of the agreement, the International Swaps and Derivatives Association (ISDA) Master Agreement, or similar agreement, does not result in an offset of reported amounts of financial assets and financial liabilities in the Statement of Assets and Liabilities across transactions between the fund and the applicable counterparty. The fund’s right to setoff may be restricted or prohibited by the bankruptcy or insolvency laws of the particular jurisdiction to which a specific master netting agreement counterparty is subject. Balance sheet offsetting disclosures, to the extent applicable to the fund, have been included in the fund’s Significant Accounting Policies note under the captions for each of the fund’s in-scope financial instruments and transactions.
28
Notes to Financial Statements – continued
Investment Valuations – Equity securities, including restricted equity securities, are generally valued at the last sale or official closing price on their primary market or exchange as provided by a third-party pricing service. Equity securities, for which there were no sales reported that day, are generally valued at the last quoted daily bid quotation on their primary market or exchange as provided by a third-party pricing service. Short-term instruments with a maturity at issuance of 60 days or less may be valued at amortized cost, which approximates market value. Open-end investment companies are generally valued at net asset value per share. Securities and other assets generally valued on the basis of information from a third-party pricing service may also be valued at a broker/dealer bid quotation. In determining values, third-party pricing services can utilize both transaction data and market information such as yield, quality, coupon rate, maturity, type of issue, trading characteristics, and other market data. The values of foreign securities and other assets and liabilities expressed in foreign currencies are converted to U.S. dollars using the mean of bid and asked prices for rates provided by a third-party pricing service.
The Board of Trustees has delegated primary responsibility for determining or causing to be determined the value of the fund’s investments (including any fair valuation) to the adviser pursuant to valuation policies and procedures approved by the Board. If the adviser determines that reliable market quotations are not readily available, investments are valued at fair value as determined in good faith by the adviser in accordance with such procedures under the oversight of the Board of Trustees. Under the fund’s valuation policies and procedures, market quotations are not considered to be readily available for most types of debt instruments and floating rate loans and many types of derivatives. These investments are generally valued at fair value based on information from third-party pricing services. In addition, investments may be valued at fair value if the adviser determines that an investment’s value has been materially affected by events occurring after the close of the exchange or market on which the investment is principally traded (such as foreign exchange or market) and prior to the determination of the fund’s net asset value, or after the halting of trading of a specific security where trading does not resume prior to the close of the exchange or market on which the security is principally traded. Events that occur on a frequent basis after foreign markets close (such as developments in foreign markets and significant movements in the U.S. markets) and prior to the determination of the fund’s net asset value may be deemed to have a material effect on the value of securities traded in foreign markets. Accordingly, the fund’s foreign equity securities may often be valued at fair value. The adviser generally relies on third-party pricing services or other information (such as the correlation with price movements of similar securities in the same or other markets; the type, cost and investment characteristics of the security; the business and financial condition of the issuer; and trading and other market data) to assist in determining whether to fair value and at what value to fair value an investment. The value of an investment for purposes of calculating the fund’s net asset value can differ depending on the source and method used to determine value. When fair valuation is used, the value of an investment used to determine the fund’s net asset value may differ from quoted or published prices for the same investment. There can be no assurance that the fund could obtain the fair value assigned to an investment if it were to sell the investment at the same time at which the fund determines its net asset value per share.
29
Notes to Financial Statements – continued
Various inputs are used in determining the value of the fund’s assets or liabilities. These inputs are categorized into three broad levels. In certain cases, the inputs used to measure fair value may fall into different levels of the fair value hierarchy. In such cases, an investment’s level within the fair value hierarchy is based on the lowest level of input that is significant to the fair value measurement. The fund’s assessment of the significance of a particular input to the fair value measurement in its entirety requires judgment, and considers factors specific to the investment. Level 1 includes unadjusted quoted prices in active markets for identical assets or liabilities. Level 2 includes other significant observable market-based inputs (including quoted prices for similar securities, interest rates, prepayment speed, and credit risk). Level 3 includes unobservable inputs, which may include the adviser’s own assumptions in determining the fair value of investments. The following is a summary of the levels used as of August 31, 2018 in valuing the fund’s assets or liabilities:
| | | | | | | | | | | | | | | | |
| Financial Instruments | | Level 1 | | | Level 2 | | | Level 3 | | | Total | |
| Equity Securities | | | $5,698,756 | | | | $— | | | | $— | | | | $5,698,756 | |
| Mutual Funds | | | 122,953 | | | | — | | | | — | | | | 122,953 | |
| Total | | | $5,821,709 | | | | $— | | | | $— | | | | $5,821,709 | |
For further information regarding security characteristics, see the Portfolio of Investments.
Foreign Currency Translation – Purchases and sales of foreign investments, income, and expenses are converted into U.S. dollars based upon currency exchange rates prevailing on the respective dates of such transactions or on the reporting date for foreign denominated receivables and payables. Gains and losses attributable to foreign currency exchange rates on sales of securities are recorded for financial statement purposes as net realized gains and losses on investments. Gains and losses attributable to foreign exchange rate movements on receivables, payables, income and expenses are recorded for financial statement purposes as foreign currency transaction gains and losses. That portion of both realized and unrealized gains and losses on investments that results from fluctuations in foreign currency exchange rates is not separately disclosed.
Indemnifications – Under the fund’s organizational documents, its officers and Trustees may be indemnified against certain liabilities and expenses arising out of the performance of their duties to the fund. Additionally, in the normal course of business, the fund enters into agreements with service providers that may contain indemnification clauses. The fund’s maximum exposure under these agreements is unknown as this would involve future claims that may be made against the fund that have not yet occurred.
Investment Transactions and Income – Investment transactions are recorded on the trade date. Dividends received in cash are recorded on the ex-dividend date. Certain dividends from foreign securities will be recorded when the fund is informed of the dividend if such information is obtained subsequent to the ex-dividend date. Dividend payments received in additional securities are recorded on the ex-dividend date in an amount equal to the value of the security on such date.
30
Notes to Financial Statements – continued
The fund may receive proceeds from litigation settlements. Any proceeds received from litigation involving portfolio holdings are reflected in the Statement of Operations in realized gain/loss if the security has been disposed of by the fund or in unrealized gain/loss if the security is still held by the fund. Any other proceeds from litigation not related to portfolio holdings are reflected as other income in the Statement of Operations.
Tax Matters and Distributions – The fund intends to qualify as a regulated investment company, as defined under Subchapter M of the Internal Revenue Code, and to distribute all of its taxable income, including realized capital gains. As a result, no provision for federal income tax is required. The fund’s federal tax returns, when filed, will remain subject to examination by the Internal Revenue Service for a three year period. Management has analyzed the fund’s tax positions taken on federal and state tax returns for all open tax years and does not believe that there are any uncertain tax positions that require recognition of a tax liability. Foreign taxes, if any, have been accrued by the fund in the accompanying financial statements in accordance with the applicable foreign tax law. Foreign income taxes may be withheld by certain countries in which the fund invests. Additionally, capital gains realized by the fund on securities issued in or by certain foreign countries may be subject to capital gains tax imposed by those countries.
Distributions to shareholders are recorded on the ex-dividend date. Income and capital gain distributions are determined in accordance with income tax regulations, which may differ from U.S. generally accepted accounting principles. Certain capital accounts in the financial statements are periodically adjusted for permanent differences in order to reflect their tax character. These adjustments have no impact on net assets or net asset value per share. Temporary differences which arise from recognizing certain items of income, expense, gain or loss in different periods for financial statement and tax purposes will reverse at some time in the future. Distributions in excess of net investment income or net realized gains are temporary overdistributions for financial statement purposes resulting from differences in the recognition or classification of income or distributions for financial statement and tax purposes.
Book/tax differences primarily relate to wash sale loss deferrals, treating a portion of the proceeds from redemptions as a distribution for tax purposes, and partnership adjustments.
The tax character of distributions declared to shareholders for the last two fiscal years is as follows:
| | | | | | | | |
| | | Year ended
8/31/18 | | | Year ended
8/31/17 | |
| Ordinary income (including any short-term capital gains) | | | $132,311 | | | | $80,010 | |
| Long-term capital gains | | | 74,000 | | | | — | |
| Total distributions | | | $206,311 | | | | $80,010 | |
31
Notes to Financial Statements – continued
The federal tax cost and the tax basis components of distributable earnings were as follows:
| | | | |
| As of 8/31/18 | | | |
| Cost of investments | | | $4,843,111 | |
| Gross appreciation | | | 1,076,929 | |
| Gross depreciation | | | (98,331 | ) |
| Net unrealized appreciation (depreciation) | | | $978,598 | |
| Undistributed ordinary income | | | 162,374 | |
| Undistributed long-term capital gain | | | 282,054 | |
| Other temporary differences | | | 7,694 | |
Multiple Classes of Shares of Beneficial Interest – The fund offers multiple classes of shares, which differ in their respective distribution and service fees. The fund’s income, realized and unrealized gain (loss), and common expenses are allocated to shareholders based on the daily net assets of each class. Dividends are declared separately for each class. Differences in per share dividend rates are generally due to differences in separate class expenses. Class B shares will convert to Class A shares approximately eight years after purchase. Effective April 23, 2018, Class C shares will convert to Class A shares approximately ten years after purchase. The fund’s distributions declared to shareholders as reported in the Statements of Changes in Net Assets are presented by class as follows:
| | | | | | | | | | | | | | | | |
| | | From net investment
income | | | From net realized
gain | |
| | | Year
ended
8/31/18 | | | Year
ended
8/31/17 | | | Year
ended
8/31/18 | | | Year
ended
8/31/17 | |
| Class A | | | $9,828 | | | | $4,127 | | | | $10,205 | | | | $— | |
| Class B | | | 579 | | | | 479 | | | | 1,135 | | | | — | |
| Class C | | | 1,158 | | | | 1,145 | | | | 2,316 | | | | — | |
| Class I | | | 29,872 | | | | 19,538 | | | | 28,439 | | | | — | |
| Class R1 | | | 478 | | | | 479 | | | | 1,023 | | | | — | |
| Class R2 | | | 783 | | | | 732 | | | | 1,030 | | | | — | |
| Class R3 | | | 938 | | | | 860 | | | | 1,032 | | | | — | |
| Class R4 | | | 1,094 | | | | 987 | | | | 1,036 | | | | — | |
| Class R6 | | | 60,273 | | | | 51,663 | | | | 55,092 | | | | — | |
| Total | | | $105,003 | | | | $80,010 | | | | $101,308 | | | | $— | |
(3) Transactions with Affiliates
Investment Adviser – The fund has an investment advisory agreement with MFS to provide overall investment management and related administrative services and facilities to the fund. The management fee is computed daily and paid monthly at the following annual rates based on the fund’s average daily net assets:
| | | | |
| Up to $1 billion | | | 0.50 | % |
| In excess of $1 billion and up to $2.5 billion | | | 0.475 | % |
| In excess of $2.5 billion | | | 0.45 | % |
32
Notes to Financial Statements – continued
MFS has agreed in writing to reduce its management fee by a specified amount if certain MFS mutual fund assets exceed thresholds agreed to by MFS and the fund’s Board of Trustees. For the year ended August 31, 2018, this management fee reduction amounted to $549, which is included in the reduction of total expenses in the Statement of Operations. The management fee incurred for the year ended August 31, 2018 was equivalent to an annual effective rate of 0.49% of the fund’s average daily net assets.
The investment adviser has agreed in writing to pay a portion of the fund’s total annual operating expenses, excluding interest, taxes, extraordinary expenses, brokerage and transaction costs, and investment-related expenses, such that total fund operating expenses do not exceed the following rates annually of each class’s average daily net assets:
| | | | | | | | | | | | | | | | | | | | | | | | | | | | | | | | | | |
| Classes | |
| A | | | B | | | C | | | I | | | R1 | | | R2 | | | R3 | | | R4 | | | R6 | |
| | 0.89% | | | | 1.64 | % | | | 1.64 | % | | | 0.64 | % | | | 1.64 | % | | | 1.14 | % | | | 0.89 | % | | | 0.64 | % | | | 0.60 | % |
This written agreement will continue until modified by the fund’s Board of Trustees, but such agreement will continue at least until December 31, 2019. For the year ended August 31, 2018, this reduction amounted to $256,822, which is included in the reduction of total expenses in the Statement of Operations.
Distributor – MFS Fund Distributors, Inc. (MFD), a wholly-owned subsidiary of MFS, as distributor, received $627 for the year ended August 31, 2018, as its portion of the initial sales charge on sales of Class A shares of the fund.
The Board of Trustees has adopted a distribution plan for certain share classes pursuant to Rule 12b-1 of the Investment Company Act of 1940.
The fund’s distribution plan provides that the fund will pay MFD for services provided by MFD and financial intermediaries in connection with the distribution and servicing of certain share classes. One component of the plan is a distribution fee paid to MFD and another component of the plan is a service fee paid to MFD. MFD may subsequently pay all, or a portion, of the distribution and/or service fees to financial intermediaries.
Distribution Plan Fee Table:
| | | | | | | | | | | | | | | | | | | | |
| | | Distribution
Fee Rate (d) | | | Service
Fee Rate (d) | | | Total
Distribution
Plan (d) | | | Annual
Effective
Rate (e) | | | Distribution
and Service
Fee | |
| Class A | | | — | | | | 0.25% | | | | 0.25% | | | | 0.24% | | | | $1,843 | |
| Class B | | | 0.75% | | | | 0.25% | | | | 1.00% | | | | 1.00% | | | | 729 | |
| Class C | | | 0.75% | | | | 0.25% | | | | 1.00% | | | | 1.00% | | | | 1,904 | |
| Class R1 | | | 0.75% | | | | 0.25% | | | | 1.00% | | | | 1.00% | | | | 658 | |
| Class R2 | | | 0.25% | | | | 0.25% | | | | 0.50% | | | | 0.50% | | | | 334 | |
| Class R3 | | | — | | | | 0.25% | | | | 0.25% | | | | 0.25% | | | | 168 | |
| Total Distribution and Service Fees | | | | | | | | | | | | $5,636 | |
| (d) | In accordance with the distribution plan for certain classes, the fund pays distribution and/or service fees equal to these annual percentage rates of each class’s average daily net assets. The distribution and service fee rates disclosed by class represent the current rates in effect at the end of the reporting period. Any rate changes, if applicable, are detailed below. |
33
Notes to Financial Statements – continued
| (e) | The annual effective rates represent actual fees incurred under the distribution plan for the year ended August 31, 2018 based on each class’s average daily net assets. MFD has voluntarily agreed to rebate a portion of each class’s 0.25% service fee attributable to accounts for which MFD retains the 0.25% service fee except for accounts attributable to MFS or its affiliates’ seed money. For the year ended August 31, 2018, this rebate amounted to $61 for Class A and is included in the reduction of total expenses in the Statement of Operations. |
Certain Class A shares are subject to a contingent deferred sales charge (CDSC) in the event of a shareholder redemption within 18 months of purchase. Class B shares are subject to a CDSC in the event of a shareholder redemption within six years of purchase. Class C shares are subject to a CDSC in the event of a shareholder redemption within 12 months of purchase. All contingent deferred sales charges are paid to MFD and during the year ended August 31, 2018, were as follows:
| | | | |
| | | Amount | |
| Class A | | | $1 | |
| Class B | | | 2 | |
| Class C | | | 34 | |
Shareholder Servicing Agent – MFS Service Center, Inc. (MFSC), a wholly-owned subsidiary of MFS, receives a fee from the fund for its services as shareholder servicing agent calculated as a percentage of the average daily net assets of the fund as determined periodically under the supervision of the fund’s Board of Trustees. For the year ended August 31, 2018, the fee was $555, which equated to 0.0091% annually of the fund’s average daily net assets. MFSC also receives payment from the fund for out-of-pocket expenses, sub-accounting and other shareholder servicing costs which may be paid to affiliated and unaffiliated service providers. Class R6 shares do not incur sub-accounting fees. For the year ended August 31, 2018, these out-of-pocket expenses, sub-accounting and other shareholder servicing costs amounted to $3,085.
Administrator – MFS provides certain financial, legal, shareholder communications, compliance, and other administrative services to the fund. Under an administrative services agreement, the fund reimburses MFS the costs incurred to provide these services. The fund is charged an annual fixed amount of $17,500 plus a fee based on average daily net assets. The administrative services fee incurred for the year ended August 31, 2018 was equivalent to an annual effective rate of 0.2882% of the fund’s average daily net assets.
Trustees’ and Officers’ Compensation – The fund pays compensation to independent Trustees in the form of a retainer, attendance fees, and additional compensation to Board and Committee chairpersons. The fund does not pay compensation directly to Trustees or officers of the fund who are also officers of the investment adviser, all of whom receive remuneration for their services to the fund from MFS. Certain officers and Trustees of the fund are officers or directors of MFS, MFD, and MFSC.
Other – This fund and certain other funds managed by MFS (the funds) have entered into a service agreement (the ISO Agreement) which provides for payment of fees solely by the funds to Tarantino LLC in return for the provision of services of an Independent Senior Officer (ISO) for the funds. Frank L. Tarantino serves as the ISO and
34
Notes to Financial Statements – continued
is an officer of the funds and the sole member of Tarantino LLC. The funds can terminate the ISO Agreement with Tarantino LLC at any time under the terms of the ISO Agreement. For the year ended August 31, 2018, the fee paid by the fund under this agreement was $9 and is included in “Miscellaneous” expense in the Statement of Operations. MFS has agreed to bear all expenses associated with office space, other administrative support, and supplies provided to the ISO.
The fund invests in the MFS Institutional Money Market Portfolio which is managed by MFS and seeks current income consistent with preservation of capital and liquidity. This money market fund does not pay a management fee to MFS.
On August 15, 2017, MFS redeemed 5,123 shares of Class I for an aggregate amount of $62,504.
At August 31, 2018, MFS held approximately 88% of the outstanding shares of Class B, 97% of the outstanding shares of Class R6, and 100% of the outstanding shares of Class R1, Class R2, Class R3, and Class R4, respectively.
Effective on or about January 3, 2018, the adviser has voluntarily undertaken to reimburse the fund from its own resources on a quarterly basis for the cost of investment research embedded in the cost of the fund’s securities trades. This agreement may be rescinded at any time. For the period on or about January 3, 2018 to August 31, 2018, this reimbursement amounted to $311, which is included in “Other” income in the Statement of Operations.
(4) Portfolio Securities
For the year ended August 31, 2018, purchases and sales of investments, other than short-term obligations, aggregated $2,894,015 and $3,827,743, respectively.
(5) Shares of Beneficial Interest
The fund’s Declaration of Trust permits the Trustees to issue an unlimited number of full and fractional shares of beneficial interest. Transactions in fund shares were as follows:
| | | | | | | | | | | | | | | | |
| | | Year ended
8/31/18 | | | Year ended
8/31/17 | |
| | | Shares | | | Amount | | | Shares | | | Amount | |
| Shares sold | | | | | | | | | | | | | | | | |
Class A | | | 33,941 | | | | $435,187 | | | | 27,296 | | | | $306,635 | |
Class B | | | 554 | | | | 7,000 | | | | 155 | | | | 1,752 | |
Class C | | | 8,563 | | | | 110,868 | | | | 4,185 | | | | 47,841 | |
Class I | | | 6,732 | | | | 86,830 | | | | 114,223 | | | | 1,260,845 | |
Class R6 | | | 5,141 | | | | 66,166 | | | | 5,923 | | | | 70,087 | |
| | | 54,931 | | | | $706,051 | | | | 151,782 | | | | $1,687,160 | |
35
Notes to Financial Statements – continued
| | | | | | | | | | | | | | | | |
| | | Year ended
8/31/18 | | | Year ended
8/31/17 | |
| | | Shares | | | Amount | | | Shares | | | Amount | |
| Shares issued to shareholders in reinvestment of distributions | | | | | | | | | | | | | | | | |
Class A | | | 1,577 | | | | $20,033 | | | | 388 | | | | $4,127 | |
Class B | | | 135 | | | | 1,714 | | | | 45 | | | | 479 | |
Class C | | | 274 | | | | 3,474 | | | | 108 | | | | 1,145 | |
Class I | | | 4,584 | | | | 58,311 | | | | 1,835 | | | | 19,538 | |
Class R1 | | | 118 | | | | 1,501 | | | | 45 | | | | 479 | |
Class R2 | | | 142 | | | | 1,813 | | | | 69 | | | | 732 | |
Class R3 | | | 155 | | | | 1,970 | | | | 80 | | | | 860 | |
Class R4 | | | 168 | | | | 2,130 | | | | 93 | | | | 987 | |
Class R6 | | | 9,062 | | | | 115,365 | | | | 4,851 | | | | 51,663 | |
| | | 16,215 | | | | $206,311 | | | | 7,514 | | | | $80,010 | |
| | | | |
| Shares reacquired | | | | | | | | | | | | | | | | |
Class A | | | (4,234 | ) | | | $(54,064 | ) | | | (5,393 | ) | | | $(62,901 | ) |
Class B | | | (7 | ) | | | (85 | ) | | | (1 | ) | | | (15 | ) |
Class C | | | (2,780 | ) | | | (35,527 | ) | | | (3,511 | ) | | | (39,932 | ) |
Class I | | | (121,176 | ) | | | (1,564,511 | ) | | | (46,062 | ) | | | (537,000 | ) |
Class R6 | | | (4,044 | ) | | | (52,154 | ) | | | (3 | ) | | | (32 | ) |
| | | (132,241 | ) | | | $(1,706,341 | ) | | | (54,970 | ) | | | $(639,880 | ) |
| | | | |
| Net change | | | | | | | | | | | | | | | | |
Class A | | | 31,284 | | | | $401,156 | | | | 22,291 | | | | $247,861 | |
Class B | | | 682 | | | | 8,629 | | | | 199 | | | | 2,216 | |
Class C | | | 6,057 | | | | 78,815 | | | | 782 | | | | 9,054 | |
Class I | | | (109,860 | ) | | | (1,419,370 | ) | | | 69,996 | | | | 743,383 | |
Class R1 | | | 118 | | | | 1,501 | | | | 45 | | | | 479 | |
Class R2 | | | 142 | | | | 1,813 | | | | 69 | | | | 732 | |
Class R3 | | | 155 | | | | 1,970 | | | | 80 | | | | 860 | |
Class R4 | | | 168 | | | | 2,130 | | | | 93 | | | | 987 | |
Class R6 | | | 10,159 | | | | 129,377 | | | | 10,771 | | | | 121,718 | |
| | | (61,095 | ) | | | $(793,979 | ) | | | 104,326 | | | | $1,127,290 | |
Class T shares were not publicly available for sale during the period. Please see the fund’s prospectus for details.
(6) Line of Credit
The fund and certain other funds managed by MFS participate in a $1.25 billion unsecured committed line of credit, subject to a $1 billion sublimit, provided by a syndication of banks under a credit agreement. Borrowings may be made for temporary financing needs. Interest is charged to each fund, based on its borrowings, generally at a rate equal to the higher of the Overnight Bank Funding rate or daily one month LIBOR plus an agreed upon spread. A commitment fee, based on the average daily, unused portion of the committed line of credit, is allocated among the participating funds. In addition, the fund and other funds managed by MFS have
36
Notes to Financial Statements – continued
established unsecured uncommitted borrowing arrangements with certain banks for temporary financing needs. Interest is charged to each fund, based on its borrowings, at a rate equal to the Overnight Bank Funding rate plus an agreed upon spread. For the year ended August 31, 2018, the fund’s commitment fee and interest expense were $39 and $0, respectively, and are included in “Miscellaneous” expense in the Statement of Operations.
(7) Investments in Affiliated Issuers
An affiliated issuer may be considered one in which the fund owns 5% or more of the outstanding voting securities, or a company which is under common control. For the purposes of this report, the fund assumes the following to be affiliated issuers:
| | | | | | | | | | | | | | | | | | | | |
| Affiliated Issuers | | | | | Beginning
Shares/Par
Amount | | | Acquisitions
Shares/Par
Amount | | | Dispositions
Shares/Par
Amount | | | Ending
Shares/Par
Amount | |
| MFS Institutional Money Market Portfolio | | | | | | | 107,563 | | | | 1,260,600 | | | | (1,245,210 | ) | | | 122,953 | |
| | | | | |
| Affiliated Issuers | | Realized
Gain (Loss) | | | Change in
Unrealized
Appreciation/
Depreciation | | | Capital Gain
Distributions | | | Dividend
Income | | | Ending
Value | |
| MFS Institutional Money Market Portfolio | | | $(3 | ) | | | $11 | | | | $— | | | | $1,787 | | | | $122,953 | |
37
REPORT OF INDEPENDENT REGISTERED PUBLIC ACCOUNTING FIRM
To the Shareholders of MFS Blended Research Global Equity Fund and the Board of Trustees of MFS Series Trust IV
Opinion on the Financial Statements
We have audited the accompanying statement of assets and liabilities of MFS Blended Research Global Equity Fund (the “Fund”) (one of the funds constituting the MFS Series Trust IV (the “Trust”)), including the portfolio of investments, as of August 31, 2018, and the related statement of operations for the year then ended, the statements of changes in net assets for each of the two years in the period then ended, the financial highlights for each of two years in the period then ended and the period from September 15, 2015 (commencement of operations) through August 31, 2016 and the related notes (collectively referred to as the “financial statements”). In our opinion, the financial statements present fairly, in all material respects, the financial position of the Fund (one of the funds constituting the MFS Series Trust IV) at August 31, 2018, the results of its operations for the year then ended, the changes in its net assets for each of the two years in the period then ended and its financial highlights for each of two years in the period then ended and the period from September 15, 2015 (commencement of operations) through August 31, 2016, in conformity with U.S. generally accepted accounting principles.
Basis for Opinion
These financial statements are the responsibility of the Trust’s management. Our responsibility is to express an opinion on the Fund’s financial statements based on our audits. We are a public accounting firm registered with the Public Company Accounting Oversight Board (United States) (“PCAOB”) and are required to be independent with respect to the Trust in accordance with the U.S. federal securities laws and the applicable rules and regulations of the Securities and Exchange Commission and the PCAOB.
We conducted our audits in accordance with the standards of the PCAOB. Those standards require that we plan and perform the audit to obtain reasonable assurance about whether the financial statements are free of material misstatement, whether due to error or fraud. The Trust is not required to have, nor were we engaged to perform, an audit of the Trust’s internal control over financial reporting. As part of our audits we are required to obtain an understanding of internal control over financial reporting but not for the purpose of expressing an opinion on the effectiveness of the Trust’s internal control over financial reporting. Accordingly, we express no such opinion.
Our audits included performing procedures to assess the risks of material misstatement of the financial statements, whether due to error or fraud, and performing procedures that respond to those risks. Such procedures included examining, on a test basis, evidence regarding the amounts and disclosures in the financial statements. Our procedures included confirmation of securities owned as of August 31, 2018, by correspondence with the custodian and others or by other appropriate auditing procedures where replies from others were not received. Our audits also included
38
Report of Independent Registered Public Accounting Firm – continued
evaluating the accounting principles used and significant estimates made by management, as well as evaluating the overall presentation of the financial statements. We believe that our audits provide a reasonable basis for our opinion.

We have served as the auditor of one or more MFS investment companies since 1993.
Boston, Massachusetts
October 16, 2018
39
TRUSTEES AND OFFICERS —
IDENTIFICATION AND BACKGROUND
The Trustees and Officers of the Trust, as of October 1, 2018, are listed below, together with their principal occupations during the past five years. (Their titles may have varied during that period.) The address of each Trustee and Officer is 111 Huntington Avenue, Boston, Massachusetts 02199-7618.
| | | | | | | | | | |
Name, Age | | Position(s)
Held with Fund | | Trustee/Officer Since (h) | | Number of
MFS Funds
overseen by the Trustee | | Principal
Occupations During the Past Five Years | | Other Directorships During the Past Five Years (j) |
| INTERESTED TRUSTEES |
Robert J. Manning (k)
(age 54) | | Trustee | | February 2004 | | 135 | | Massachusetts Financial Services Company, Executive Chairman (since January 2017); Director; Chairman of the Board; Chief Executive Officer (until 2015); Co-Chief Executive Officer (2015-2016) | | N/A |
Robin A. Stelmach (k)
(age 57) | | Trustee | | January 2014 | | 135 | | Massachusetts Financial Services Company, Vice Chair (since January 2017); Chief Operating Officer and Executive Vice President (until January 2017) | | N/A |
| INDEPENDENT TRUSTEES |
John P. Kavanaugh
(age 63) | | Trustee and Chair of Trustees | | January 2009 | | 135 | | Private investor | | N/A |
Steven E. Buller
(age 67) | | Trustee | | February 2014 | | 135 | | Financial Accounting Standards Advisory Council, Chairman (2014-2015); Public Company Accounting Oversight Board, Standing Advisory Group, Member (until 2014); BlackRock, Inc. (investment management), Managing Director (until 2014), BlackRock Finco UK (investment management), Director (until 2014) | | N/A |
40
Trustees and Officers – continued
| | | | | | | | | | |
Name, Age | | Position(s)
Held with Fund | | Trustee/Officer Since (h) | | Number of
MFS Funds
overseen by the Trustee | | Principal
Occupations During the Past Five Years | | Other Directorships During the Past Five Years (j) |
John A. Caroselli
(age 64) | | Trustee | | March 2017 | | 135 | | JC Global Advisors, LLC (management consulting), President (since 2015); First Capital Corporation (commercial finance), Executive Vice President (until 2015) | | N/A |
Maureen R. Goldfarb
(age 63) | | Trustee | | January 2009 | | 135 | | Private investor | | N/A |
Michael Hegarty
(age 73) | | Trustee | | December 2004 | | 135 | | Private investor | | Rouse Properties Inc., Director (until 2016); Capmark Financial Group Inc., Director (until 2015) |
Clarence Otis, Jr.
(age 62) | | Trustee | | March 2017 | | 135 | | Darden Restaurants, Inc., Chief Executive Officer (until 2014) | | VF Corporation, Director; Verizon Communications, Inc., Director; The Travelers Companies, Director; Federal Reserve Bank of Atlanta, Director (until 2015) |
Maryanne L. Roepke
(age 62) | | Trustee | | May 2014 | | 135 | | American Century Investments (investment management), Senior Vice President and Chief Compliance Officer (until 2014) | | N/A |
Laurie J. Thomsen
(age 61) | | Trustee | | March 2005 | | 135 | | Private investor | | The Travelers Companies, Director; Dycom Industries, Inc., Director (since 2015) |
41
Trustees and Officers – continued
| | | | | | | | |
Name, Age | | Position(s) Held with Fund | | Trustee/Officer
Since (h) | | Number of MFS Funds for which the Person is an Officer | | Principal
Occupations During the Past Five Years |
| OFFICERS | | | | | | | | |
Christopher R. Bohane (k)
(age 44) | | Assistant Secretary and Assistant Clerk | | July 2005 | | 135 | | Massachusetts Financial Services Company, Vice President and Assistant General Counsel |
Kino Clark (k)
(age 50) | | Assistant Treasurer | | January 2012 | | 135 | | Massachusetts Financial Services Company, Vice President |
John W. Clark, Jr. (k)
(age 51) | | Assistant Treasurer | | April 2017 | | 135 | | Massachusetts Financial Services Company, Vice President (since March 2017); Deutsche Bank (financial services), Department Head – Treasurer’s Office (until February 2017) |
Thomas H. Connors (k)
(age 59) | | Assistant Secretary and Assistant Clerk | | September 2012 | | 135 | | Massachusetts Financial Services Company, Vice President and Senior Counsel |
Ethan D. Corey (k)
(age 54) | | Assistant Secretary and Assistant Clerk | | July 2005 | | 135 | | Massachusetts Financial Services Company, Senior Vice President and Associate General Counsel |
David L. DiLorenzo (k)
(age 50) | | President | | July 2005 | | 135 | | Massachusetts Financial Services Company, Senior Vice President |
42
Trustees and Officers – continued
| | | | | | | | |
Name, Age | | Position(s) Held with Fund | | Trustee/Officer
Since (h) | | Number of MFS Funds for which the Person is an Officer | | Principal
Occupations During the Past Five Years |
Heidi W. Hardin (k)
(age 51) | | Secretary and Clerk | | April 2017 | | 135 | | Massachusetts Financial Services Company, Executive Vice President and General Counsel (since March 2017); Harris Associates (investment management), General Counsel (from September 2015 to January 2017); Janus Capital Management LLC (investment management), Senior Vice President and General Counsel (until September 2015) |
Brian E. Langenfeld (k)
(age 45) | | Assistant Secretary and Assistant Clerk | | June 2006 | | 135 | | Massachusetts Financial Services Company, Vice President and Senior Counsel |
Amanda S. Mooradian (k) (age 39) | | Assistant Secretary and Assistant Clerk | | September 2018 | | 135 | | Massachusetts Financial Services Company, Assistant Vice President and Counsel |
Susan A. Pereira (k)
(age 47) | | Assistant Secretary and Assistant Clerk | | July 2005 | | 135 | | Massachusetts Financial Services Company, Vice President and Senior Counsel |
Kasey L. Phillips (k)
(age 47) | | Assistant Treasurer | | September 2012 | | 135 | | Massachusetts Financial Services Company, Vice President |
Matthew A. Stowe (k)
(age 43) | | Assistant Secretary and Assistant Clerk | | October 2014 | | 135 | | Massachusetts Financial Services Company, Vice President and Assistant General Counsel |
43
Trustees and Officers – continued
| | | | | | | | |
Name, Age | | Position(s) Held with Fund | | Trustee/Officer
Since (h) | | Number of MFS Funds for which the Person is an Officer | | Principal
Occupations During the Past Five Years |
Frank L. Tarantino
(age 74) | | Independent
Senior Officer | | June 2004 | | 135 | | Tarantino LLC (provider of compliance services), Principal |
Richard S. Weitzel (k)
(age 48) | | Assistant Secretary and Assistant Clerk | | October 2007 | | 135 | | Massachusetts Financial Services Company, Senior Vice President and Associate General Counsel |
Martin J. Wolin (k)
(age 51) | | Chief Compliance Officer | | July 2015 | | 135 | | Massachusetts Financial Services Company, Senior Vice President and Chief Compliance Officer (since July 2015); Mercer (financial service provider), Chief Risk and Compliance Officer, North America and Latin America (until June 2015) |
James O. Yost (k)
(age 58) | | Treasurer | | September 1990 | | 135 | | Massachusetts Financial Services Company, Senior Vice President |
| (h) | Date first appointed to serve as Trustee/officer of an MFS Fund. Each Trustee has served continuously since appointment unless indicated otherwise. For the period from December 15, 2004 until February 22, 2005, Mr. Manning served as Advisory Trustee. From January 2012 through December 2016, Messrs. DiLorenzo and Yost served as Treasurer and Deputy Treasurer of the Funds, respectively. |
| (j) | Directorships or trusteeships of companies required to report to the Securities and Exchange Commission (i.e., “public companies”). |
| (k) | “Interested person” of the Trust within the meaning of the Investment Company Act of 1940 (referred to as the 1940 Act), which is the principal federal law governing investment companies like the fund, as a result of a position with MFS. The address of MFS is 111 Huntington Avenue, Boston, Massachusetts 02199-7618. |
Each Trustee has been elected by shareholders and each Trustee and officer holds office until his or her successor is chosen and qualified or until his or her earlier death, resignation, retirement or removal. The Trust does not hold annual meetings for the purpose of electing Trustees, and Trustees are not elected for fixed terms. Under the terms of the Board’s retirement policy, an Independent Trustee shall retire at the end of
44
Trustees and Officers – continued
the calendar year in which he or she reaches the earlier of 75 years of age or 15 years of service on the Board (or, in the case of any Independent Trustee who joined the Board prior to 2015, 20 years of service on the Board).
Messrs. Buller and Otis and Ms. Roepke are members of the Trust’s Audit Committee.
Each of the Interested Trustees and certain Officers hold comparable officer positions with certain affiliates of MFS.
The Statement of Additional Information for a Fund includes further information about the Trustees and is available without charge upon request by calling 1-800-225-2606.
| | |
| Investment Adviser | | Custodian |
Massachusetts Financial Services Company
111 Huntington Avenue Boston, MA 02199-7618 | | State Street Bank and Trust Company 1 Lincoln Street Boston, MA 02111-2900 |
| Distributor | | Independent Registered Public Accounting Firm |
MFS Fund Distributors, Inc.
111 Huntington Avenue Boston, MA 02199-7618 | | Ernst & Young LLP 200 Clarendon Street Boston, MA 02116 |
| Portfolio Manager(s) | | |
| Jim Fallon | | |
| Matt Krummell | | |
| Jonathan Sage | | |
| Jed Stocks | | |
45
BOARD REVIEW OF INVESTMENT ADVISORY AGREEMENT
The Investment Company Act of 1940 requires that both the full Board of Trustees and a majority of the non-interested (“independent”) Trustees, voting separately, annually approve the continuation of the Fund’s investment advisory agreement with MFS. The Trustees consider matters bearing on the Fund and its advisory arrangements at their meetings throughout the year, including a review of performance data at each regular meeting. In addition, the independent Trustees met several times over the course of three months beginning in May and ending in July, 2018 (“contract review meetings”) for the specific purpose of considering whether to approve the continuation of the investment advisory agreement for the Fund and the other investment companies that the Board oversees (the “MFS Funds”). The independent Trustees were assisted in their evaluation of the Fund’s investment advisory agreement by independent legal counsel, from whom they received separate legal advice and with whom they met separately from MFS during various contract review meetings. The independent Trustees were also assisted in this process by the MFS Funds’ Independent Senior Officer, a senior officer appointed by and reporting to the independent Trustees.
In connection with their deliberations regarding the continuation of the investment advisory agreement, the Trustees, including the independent Trustees, considered such information and factors as they believed, in light of the legal advice furnished to them and their own business judgment, to be relevant. The investment advisory agreement for the Fund was considered separately, although the Trustees also took into account the common interests of all MFS Funds in their review. As described below, the Trustees considered the nature, quality, and extent of the various investment advisory, administrative, and shareholder services performed by MFS under the existing investment advisory agreement and other arrangements with the Fund.
In connection with their contract review meetings, the Trustees received and relied upon materials that included, among other items: (i) information provided by Broadridge Financial Solutions, Inc. (“Broadridge”), an independent third party, on the investment performance of the Fund for the one-year period ended December 31, 2017 and the investment performance of a group of funds with substantially similar investment classifications/objectives (the “Broadridge performance universe”), (ii) information provided by Broadridge on the Fund’s advisory fees and other expenses and the advisory fees and other expenses of comparable funds identified by Broadridge (the “Broadridge expense group”), (iii) information provided by MFS on the advisory fees of portfolios of other clients of MFS, including institutional separate accounts and other clients, (iv) information as to whether and to what extent applicable expense waivers, reimbursements or fee “breakpoints” are observed for the Fund, (v) information regarding MFS’ financial results and financial condition, including MFS’ and certain of its affiliates’ estimated profitability from services performed for the Fund and the MFS Funds as a whole, and compared to MFS’ institutional business, (vi) MFS’ views regarding the outlook for the mutual fund industry and the strategic business plans of MFS, (vii) descriptions of various functions performed by MFS for the Funds, such as compliance monitoring and portfolio trading practices, and (viii) information regarding the overall organization of MFS, including information about MFS’ senior management and other personnel providing investment advisory,
46
Board Review of Investment Advisory Agreement – continued
administrative and other services to the Fund and the other MFS Funds. The comparative performance, fee and expense information prepared and provided by Broadridge was not independently verified and the independent Trustees did not independently verify any information provided to them by MFS.
The Trustees’ conclusion as to the continuation of the investment advisory agreement was based on a comprehensive consideration of all information provided to the Trustees and not the result of any single factor. Some of the factors that figured particularly in the Trustees’ deliberations are described below, although individual Trustees may have evaluated the information presented differently from one another, giving different weights to various factors. It is also important to recognize that the fee arrangements for the Fund and other MFS Funds are the result of years of review and discussion between the independent Trustees and MFS, that certain aspects of such arrangements may receive greater scrutiny in some years than in others, and that the Trustees’ conclusions may be based, in part, on their consideration of these same arrangements during the course of the year and in prior years.
Based on information provided by Broadridge and MFS, the Trustees reviewed the Fund’s total return investment performance as well as the Broadridge performance universe over the one-year period ended December 31, 2017. The total return performance of the Fund’s Class A shares was in the 3rd quintile relative to the other funds in the universe for this one-year period (the 1st quintile being the best performers and the 5th quintile being the worst performers). The Fund commenced operations on September 15, 2015, and has a limited operating history and performance record; therefore no performance data for the three- or five-year periods was available. Because of the passage of time, these performance results may differ from the performance results for more recent periods, including those shown elsewhere in this report.
In the course of their deliberations, the Trustees took into account information provided by MFS in connection with the contract review meetings, as well as during investment review meetings conducted with portfolio management personnel during the course of the year regarding the Fund’s performance. After reviewing these and related factors, the Trustees concluded, within the context of their overall conclusions regarding the investment advisory agreement, that they were satisfied with MFS’ responses and efforts relating to investment performance.
In assessing the reasonableness of the Fund’s advisory fee, the Trustees considered, among other information, the Fund’s advisory fee and the total expense ratio of the Fund’s Class A shares as a percentage of average daily net assets and the advisory fee and total expense ratios of peer groups of funds based on information provided by Broadridge. The Trustees considered that MFS currently observes an expense limitation for the Fund, which may not be changed without the Trustees’ approval. The Trustees also considered that, according to the data provided by Broadridge (which takes into account any fee reductions or expense limitations that were in effect during the Fund’s last fiscal year), the Fund’s effective advisory fee rate and total expense ratio were each lower than the Broadridge expense group median.
The Trustees also considered the advisory fees charged by MFS to any institutional separate accounts advised by MFS (“separate accounts”) and unaffiliated investment
47
Board Review of Investment Advisory Agreement – continued
companies for which MFS serves as subadviser (“subadvised funds”) that have comparable investment strategies to the Fund, if any. In comparing these fees, the Trustees considered information provided by MFS as to the generally broader scope of services provided by MFS to the Fund, as well as the more extensive regulatory burdens imposed on MFS in managing the Fund, in comparison to separate accounts and subadvised funds. The Trustees also considered the higher demands placed on MFS’ investment personnel and trading infrastructure as a result of the daily cash in-flows and out-flows of the Fund in comparison to separate accounts.
The Trustees also considered whether the Fund may benefit from any economies of scale in the management of the Fund in the event of growth in assets of the Fund and/or growth in assets of the MFS Funds as a whole. They noted that the Fund’s advisory fee rate schedule is subject to contractual breakpoints that reduce the Fund’s advisory fee rate on average daily net assets over $1 billion and $2.5 billion. The Trustees also noted that MFS has agreed in writing to waive a portion of the management fees of certain MFS Funds, including the Fund, if the total combined assets of certain funds within the MFS Funds’ complex increase above agreed upon thresholds (the “group fee waiver”), enabling the Fund’s shareholders to share in the benefits from any economies of scale at the complex level. The group fee waiver is reviewed and renewed annually between the Board and MFS. The Trustees concluded that the breakpoints and the group fee waiver were sufficient to allow the Fund to benefit from economies of scale as its assets and overall complex assets grow.
The Trustees also considered information prepared by MFS relating to MFS’ costs and profits with respect to the Fund, the MFS Funds considered as a group, and other investment companies and accounts advised by MFS, as well as MFS’ methodologies used to determine and allocate its costs to the MFS Funds, the Fund and other accounts and products for purposes of estimating profitability.
After reviewing these and other factors described herein, the Trustees concluded, within the context of their overall conclusions regarding the investment advisory agreement, that the advisory fees charged to the Fund represent reasonable compensation in light of the services being provided by MFS to the Fund.
In addition, the Trustees considered MFS’ resources and related efforts to continue to retain, attract and motivate capable personnel to serve the Fund. The Trustees also considered current and developing conditions in the financial services industry, including the presence of large and well-capitalized companies which are spending, and appear to be prepared to continue to spend, substantial sums to engage personnel and to provide services to competing investment companies. In this regard, the Trustees also considered the financial resources of MFS and its ultimate parent, Sun Life Financial Inc. The Trustees also considered the advantages and possible disadvantages to the Fund of having an adviser that also serves other investment companies as well as other accounts.
The Trustees also considered the nature, quality, cost, and extent of administrative, transfer agency, and distribution services provided to the Fund by MFS and its affiliates under agreements and plans other than the investment advisory agreement, including any 12b-1 fees the Fund pays to MFS Fund Distributors, Inc., an affiliate of MFS. The Trustees also considered the nature, extent and quality of certain other services MFS
48
Board Review of Investment Advisory Agreement – continued
performs or arranges for on the Fund’s behalf, which may include securities lending programs, directed expense payment programs, class action recovery programs, and MFS’ interaction with third-party service providers, principally custodians and sub-custodians. The Trustees concluded that the various non-advisory services provided by MFS and its affiliates on behalf of the Fund were satisfactory.
The Trustees considered so-called “fall-out benefits” to MFS such as reputational value derived from serving as investment manager to the MFS Funds. The Trustees also considered that, effective January 3, 2018, MFS had discontinued its historic practice of obtaining investment research from portfolio brokerage commissions paid by certain MFS Funds and would thereafter voluntarily reimburse a Fund, if applicable, for the costs of external research acquired through the use of the Fund’s portfolio brokerage commissions.
Based on their evaluation of factors that they deemed to be material, including those factors described above, the Board of Trustees, including the independent Trustees, concluded that the Fund’s investment advisory agreement with MFS should be continued for an additional one-year period, commencing August 1, 2018.
49
PROXY VOTING POLICIES AND INFORMATION
MFS votes proxies on behalf of the fund pursuant to proxy voting policies and procedures that are available without charge, upon request, by calling 1-800-225-2606, by visiting mfs.com/proxyvoting, or by visiting the SEC’s Web site at http://www.sec.gov.
Information regarding how the fund voted proxies relating to portfolio securities during the most recent twelve-month period ended June 30 is available by August 31 of each year without charge by visiting mfs.com/proxyvoting, or by visiting the SEC’s Web site at http://www.sec.gov.
QUARTERLY PORTFOLIO DISCLOSURE
The fund files a complete schedule of portfolio holdings with the Securities and Exchange Commission (the Commission) for the first and third quarters of each fiscal year on Form N-Q. A shareholder can obtain the quarterly portfolio holdings report at mfs.com. The fund’s Form N-Q is also available on the EDGAR database on the Commission’s Internet Web site at http://www.sec.gov, and may be reviewed and copied at the:
Public Reference Room
Securities and Exchange Commission
100 F Street, NE, Room 1580
Washington, D.C. 20549
Information on the operation of the Public Reference Room may be obtained by calling the Commission at 1-800-SEC-0330. Copies of the fund’s Form N-Q also may be obtained, upon payment of a duplicating fee, by electronic request at the following e-mail address: publicinfo@sec.gov or by writing the Public Reference Section at the above address.
FURTHER INFORMATION
From time to time, MFS may post important information about the fund or the MFS funds on the MFS web site (mfs.com). This information is available at https://www.mfs.com/en-us/what-we-do/announcements.html or at mfs.com/openendfunds by choosing the fund’s name.
50
INFORMATION ABOUT FUND CONTRACTS AND LEGAL CLAIMS
The fund has entered into contractual arrangements with an investment adviser, administrator, distributor, shareholder servicing agent, 529 program manager (if applicable), and custodian who each provide services to the fund. Unless expressly stated otherwise, shareholders are not parties to, or intended beneficiaries of these contractual arrangements, and these contractual arrangements are not intended to create any shareholder right to enforce them against the service providers or to seek any remedy under them against the service providers, either directly or on behalf of the fund.
Under the Trust’s By-Laws and Declaration of Trust, any claims asserted against or on behalf of the MFS Funds, including claims against Trustees and Officers, must be brought in state and federal courts located within the Commonwealth of Massachusetts.
FEDERAL TAX INFORMATION (unaudited)
The fund will notify shareholders of amounts for use in preparing 2018 income tax forms in January 2019. The following information is provided pursuant to provisions of the Internal Revenue Code.
The fund designates the maximum amount allowable as qualified dividend income eligible to be taxed at the same rate as long-term capital gain.
The fund designates $132,000 as capital gain dividends paid during the fiscal year.
For corporate shareholders, 29.34% of the ordinary income dividends paid during the fiscal year qualify for the corporate dividends received deduction.
51
rev. 3/16
| | | | |
| | | |
FACTS | | WHAT DOES MFS DO WITH YOUR PERSONAL INFORMATION? | |  |
| | |
| Why? | | Financial companies choose how they share your personal information. Federal law gives consumers the right to limit some but not all sharing. Federal law also requires us to tell you how we collect, share, and protect your personal information. Please read this notice carefully to understand what we do. |
| | |
| What? | | The types of personal information we collect and share depend on the product or service you have with us. This information can include: • Social Security number and account balances • Account transactions and transaction history • Checking account information and wire transfer instructions When you are no longer our customer, we continue to share your information as described in this notice. |
| | |
| How? | | All financial companies need to share customers’ personal information to run their everyday business. In the section below, we list the reasons financial companies can share their customers’ personal information; the reasons MFS chooses to share; and whether you can limit this sharing. |
| | | | |
Reasons we can share your
personal information | | Does MFS
share? | | Can you limit
this sharing? |
For our everyday business purposes – such as to process your transactions, maintain your account(s), respond to court orders and legal investigations, or report to credit bureaus | | Yes | | No |
For our marketing purposes – to offer our products and services to you | | No | | We don’t share |
For joint marketing with other financial companies | | No | | We don’t share |
For our affiliates’ everyday business purposes – information about your transactions and experiences | | No | | We don’t share |
For our affiliates’ everyday business purposes – information about your creditworthiness | | No | | We don’t share |
| For nonaffiliates to market to you | | No | | We don’t share |
| | |
| Questions? | | Call 800-225-2606 or go to mfs.com. |
52
| | |
| Who we are |
| Who is providing this notice? | | MFS Funds, MFS Investment Management, MFS Institutional Advisors, Inc., and MFS Heritage Trust Company. |
| | |
| What we do |
| How does MFS protect my personal information? | | To protect your personal information from unauthorized access and use, we use security measures that comply with federal law. These measures include procedural, electronic, and physical safeguards for the protection of the personal information we collect about you. |
| How does MFS collect my personal information? | | We collect your personal information, for example, when you • open an account or provide account information • direct us to buy securities or direct us to sell your securities • make a wire transfer We also collect your personal information from others, such as credit bureaus, affiliates, or other companies. |
| Why can’t I limit all sharing? | | Federal law gives you the right to limit only • sharing for affiliates’ everyday business purposes – information about your creditworthiness • affiliates from using your information to market to you • sharing for nonaffiliates to market to you State laws and individual companies may give you additional rights to limit sharing. |
| | |
| Definitions |
| Affiliates | | Companies related by common ownership or control. They can be financial and nonfinancial companies. • MFS does not share personal information with affiliates, except for everyday business purposes as described on page one of this notice. |
| Nonaffiliates | | Companies not related by common ownership or control. They can be financial and nonfinancial companies. • MFS does not share with nonaffiliates so they can market to you. |
| Joint marketing | | A formal agreement between nonaffiliated financial companies that together market financial products or services to you. • MFS doesn’t jointly market. |
| | |
| Other important information |
| If you own an MFS product or receive an MFS service in the name of a third party such as a bank or broker-dealer, their privacy policy may apply to you instead of ours. |
53
Save paper with eDelivery.

| MFS® will send you prospectuses, |
reports, and proxies directly via e-mail so you will get information faster with less mailbox clutter.
To sign up:
1. Go to mfs.com.
2. Log in via MFS® Access.
3. Select eDelivery.
If you own your MFS fund shares through a financial institution or a retirement plan, MFS® TALK, MFS® Access, or eDelivery may not be available to you.
CONTACT
WEB SITE
mfs.com
MFS TALK
1-800-637-8255
24 hours a day
ACCOUNT SERVICE AND LITERATURE
Shareholders
1-800-225-2606
Financial advisors
1-800-343-2829
Retirement plan services
1-800-637-1255
MAILING ADDRESS
MFS Service Center, Inc.
P.O. Box 55824
Boston, MA 02205-5824
OVERNIGHT MAIL
MFS Service Center, Inc.
c/o DST Asset Manager Solutions, Inc.
30 Dan Road
Canton, MA 02021-2809
Annual Report
August 31, 2018

MFS® Blended Research® International Equity Fund

BRX-ANN
MFS® Blended Research®
International Equity Fund
CONTENTS
The report is prepared for the general information of shareholders.
It is authorized for distribution to prospective investors only when preceded or accompanied by a current prospectus.
NOT FDIC INSURED • MAY LOSE VALUE • NO BANK GUARANTEE

LETTER FROM THE EXECUTIVE CHAIRMAN
Dear Shareholders:
The strengthening U.S. dollar, international trade friction and geopolitical uncertainty have contributed to a measurable uptick in market volatility in recent quarters — a
departure from the low-volatility environment that prevailed for much of 2017. Against this more challenging backdrop, global markets have become less synchronized, with equity markets in the United States outperforming most international markets. Global economic growth remains healthy, notwithstanding signs of a modest slowdown over the past few months, particularly in Europe, China and some emerging markets.
Although the U.S. Federal Reserve continues to gradually raise interest rates and shrink its balance sheet, monetary policy remains accommodative around the world, with many central
banks taking only tentative steps toward tighter policies. Newly enacted U.S. tax reforms have been welcomed by equity markets while emerging market economies have recently had to contend with tighter financial conditions as a result of firmer U.S. Treasury yields and a stronger dollar. Around the world, inflation remains largely subdued, but tight labor markets and solid global demand have investors on the lookout for its potential reappearance. Increased U.S. protectionism is also a growing concern, as investors fear that trade disputes could dampen business sentiment, leading to slower global growth.
As a global investment manager with nearly a century of expertise, MFS® firmly believes that active risk management offers downside mitigation and may help improve investment outcomes, and we built our active investment platform with that in mind. Our long-term perspective influences nearly every aspect of our business, but most importantly, it aligns our investment decisions with clients’ investing time horizons.
Respectfully,

Robert J. Manning
Executive Chairman
MFS Investment Management
October 16, 2018
The opinions expressed in this letter are subject to change and may not be relied upon for investment advice. No forecasts can be guaranteed.
1
PORTFOLIO COMPOSITION
Portfolio structure

| | | | |
| Top ten holdings | | | | |
| Roche Holding AG | | | 2.2% | |
| Toyota Motor Corp. | | | 2.1% | |
| Novartis AG | | | 2.0% | |
| BP PLC | | | 2.0% | |
| Taiwan Semiconductor Manufacturing Co. Ltd., ADR | | | 1.8% | |
| LVMH Moet Hennessy Louis Vuitton SE | | | 1.8% | |
| Bakkafrost P/f | | | 1.7% | |
| Bayer AG | | | 1.6% | |
| Westpac Banking Corp. | | | 1.6% | |
| China Petroleum & Chemical Corp. | | | 1.6% | |
|
| Equity sectors | |
| Financial Services | | | 23.8% | |
| Technology | | | 11.8% | |
| Energy | | | 8.1% | |
| Consumer Staples | | | 7.9% | |
| Health Care | | | 7.8% | |
| Basic Materials | | | 7.4% | |
| Utilities & Communications | | | 7.1% | |
| Retailing | | | 6.3% | |
| Industrial Goods & Services | | | 5.7% | |
| Autos & Housing | | | 5.0% | |
| Leisure | | | 3.1% | |
| Special Products & Services | | | 2.8% | |
| Transportation | | | 2.6% | |
| | | | |
| Issuer country weightings (x) | |
| Japan | | | 16.7% | |
| United Kingdom | | | 12.0% | |
| China | | | 9.4% | |
| France | | | 9.0% | |
| Canada | | | 7.1% | |
| Switzerland | | | 6.5% | |
| South Korea | | | 4.2% | |
| Germany | | | 4.1% | |
| Australia | | | 4.0% | |
| Other Countries | | | 27.0% | |
|
| Currency exposure weightings (y) | |
| Euro | | | 20.0% | |
| Japanese Yen | | | 16.7% | |
| British Pound Sterling | | | 12.0% | |
| Hong Kong Dollar | | | 10.7% | |
| Swiss Franc | | | 6.5% | |
| United States Dollar | | | 5.3% | |
| South Korean Won | | | 4.2% | |
| Australian Dollar | | | 4.0% | |
| Canadian Dollar | | | 3.3% | |
| Other Currencies | | | 17.3% | |
2
Portfolio Composition – continued
| (x) | Represents the portfolio’s exposure to issuer countries as a percentage of a portfolio’s net assets. For purposes of this presentation, United States (included in Other Countries) includes Cash & Cash Equivalents. |
| (y) | Represents the portfolio’s exposure to a particular currency as a percentage of a portfolio’s net assets. For purposes of this presentation, United States Dollar includes Cash & Cash Equivalents. |
Cash & Cash Equivalents includes any cash, investments in money market funds, short-term securities, and other assets less liabilities. Please see the Statement of Assets and Liabilities for additional information related to the fund’s cash position and other assets and liabilities.
Percentages are based on net assets as of August 31, 2018.
The portfolio is actively managed and current holdings may be different.
3
MANAGEMENT REVIEW
Summary of Results
For the twelve months ended August 31, 2018, Class A shares of the MFS Blended Research International Equity Fund (“fund”) provided a total return of 1.47%, at net asset value. This compares with a return of 3.18% for the fund’s benchmark, the MSCI All Country World (ex-US) Index (net div).
Market Environment
Despite headwinds from increasing global trade tensions, several US equity indices advanced to set new record highs late in the period after rebounding from a mid-period market correction. Very strong earnings per share and revenue growth, helped in part by the 2017 US tax reform package, has underpinned the advance, as has solid US economic growth. Strong fundamentals have brought US equity valuations down more in line with long-term average valuations from elevated levels early in the period. While the US economy has maintained its strength, global economic growth became less synchronized during the period, with Europe and China showing signs of a modest slowdown and some emerging markets coming under stress.
During the period, the US Federal Reserve raised interest rates by 75 basis points, bringing the total number of hikes to seven since the central bank began to normalize monetary policy in late 2015. The growth rate in the US, eurozone and Japan remained above trend, although inflation remained contained, particularly outside the US. Late in the period, the European Central Bank announced that it would halt its asset purchase program at the end of 2018, but issued forward guidance that it does not expect to raise interest rates at least until after the summer of 2019. Both the Bank of England and the Bank of Canada raised rates several times during the period. The European political backdrop became a bit more volatile late in the period, spurred by a chaotic process which resulted in the formation of an anti-establishment, Eurosceptic coalition government in Italy.
Bond yields rose in the US during the period but remained low by historical standards, while yields in many developed markets fell. Credit spreads remained relatively tight but widened modestly, late in the period, as market volatility increased. Growing concern over increasing global trade friction appeared to have weighed on business sentiment during the period’s second half, especially outside the US. Tighter financial conditions from rising US rates and a strong dollar combined with trade uncertainty helped expose structural weaknesses in several emerging markets late in the period.
Detractors from Performance
Security selection within the health care, financial services and technology sectors was a primary factor that detracted from performance relative to the MSCI All Country World (ex-US) Index. Within the health care sector, the fund’s overweight position in shares of pharmaceutical company Bayer AG (Germany) held back relative performance after the company reported weak sales results across its pharmaceutical, consumer health and crop science divisions. Management also issued unfavorable guidance for 2018, which further weighed on the stock. Within the financial services sector, the fund’s overweight positions in shares of banking and financial services firm Intesa Sanpaolo (Italy), global banking group BNP Paribas (France), property development firm CK Asset Holdings (Hong Kong) and banking firm Turkiye Is Bankasi (h) (Turkey) held back relative performance. Within the technology sector, the fund’s holdings of electronics manufacturer Hon Hai Precision Industry (b) (Taiwan) further dampened relative results.
4
Management Review – continued
Stocks in other sectors that detracted from relative returns included overweight positions in education services provider Kroton Educacional (Brazil), investment and management company First Pacific (Hong Kong), telecommunications company Vodafone Group (United Kingdom) and tobacco company Japan Tobacco (Japan).
Contributors to Performance
Stock selection within the energy sector contributed to relative performance during the reporting period. Within this sector, the fund’s overweight positions in integrated energy and chemical company China Petroleum & Chemical (China), oil and gas company CNOOC (China) and integrated oil company BP (United Kingdom) aided relative results as the stock prices of all three companies advanced as oil prices increased.
Although security selection was a positive factor in the autos & housing sector, there were no individual stocks within this sector that were among the fund’s top relative contributors for the reporting period.
Security selection within the consumer staples sector further aided relative returns. Here, the fund’s overweight position in brewing company China Resources Beer Holdings (China) benefited relative returns. Shares of China Resources Beer Holdings rose as investors appeared to have reacted favorably to 2017 profit growth that topped expectations and management’s confident growth outlook into 2018. The fund’s position in salmon products manufacturer Bakkafrost P/f (b) (Norway) also contributed to relative performance. Shares of Bakkafrost P/f appreciated after the company reported impressive earnings, driven by lower production costs, strong realized prices and volume growth in Russia.
Elsewhere, the fund’s overweight positions in luxury goods company LVMH Moet Hennessy Louis Vuitton SE (France) and tourism and travel IT solutions provider Amadeus IT Group (Spain) aided relative performance. The fund’s positions in methanol producer Methanex (b) (Canada), real estate company TAG Immobilien (b) (Germany) and semiconductor company Taiwan Semiconductor Manufacturing (b) (Taiwan) also contributed to relative returns.
Respectfully,
Portfolio Manager(s)
Jim Fallon, Matt Krummell, Jonathan Sage, and Jed Stocks
| (b) | Security is not a benchmark constituent. |
| (h) | Security was not held in the portfolio at period end. |
The views expressed in this report are those of the portfolio manager(s) only through the end of the period of the report as stated on the cover and do not necessarily reflect the views of MFS or any other person in the MFS organization. These views are subject to change at any time based on market or other conditions, and MFS disclaims any responsibility to update such views. These views may not be relied upon as investment advice or an indication of trading intent on behalf of any MFS portfolio. References to specific securities are not recommendations of such securities, and may not be representative of any MFS portfolio’s current or future investments.
5
PERFORMANCE SUMMARY THROUGH 8/31/18
The following chart illustrates a representative class of the fund’s historical performance in comparison to its benchmark(s). Performance results include the deduction of the maximum applicable sales charge and reflect the percentage change in net asset value, including reinvestment of dividends and capital gains distributions. The performance of other share classes will be greater than or less than that of the class depicted below. Benchmarks are unmanaged and may not be invested in directly. Benchmark returns do not reflect sales charges, commissions or expenses. (See Notes to Performance Summary.)
Performance data shown represents past performance and is no guarantee of future results. Investment return and principal value fluctuate so your shares, when sold, may be worth more or less than the original cost; current performance may be lower or higher than quoted. The performance shown does not reflect the deduction of taxes, if any, that a shareholder would pay on fund distributions or the redemption of fund shares.
Growth of a Hypothetical $10,000 Investment (t)
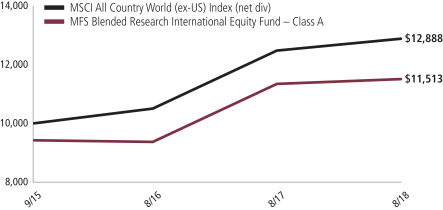
6
Performance Summary – continued
Total Returns through 8/31/18
Average annual without sales charge
| | | | | | | | | | |
| | | Share Class | | Class Inception Date | | 1-yr | | Life (t) | | |
| | | A | | 9/15/15 | | 1.47% | | 6.98% | | |
| | | B | | 9/15/15 | | 0.73% | | 6.19% | | |
| | | C | | 9/15/15 | | 0.74% | | 6.19% | | |
| | | I | | 9/15/15 | | 1.74% | | 7.24% | | |
| | | R1 | | 9/15/15 | | 0.72% | | 6.18% | | |
| | | R2 | | 9/15/15 | | 1.27% | | 6.72% | | |
| | | R3 | | 9/15/15 | | 1.50% | | 7.03% | | |
| | | R4 | | 9/15/15 | | 1.82% | | 7.27% | | |
| | | R6 | | 9/15/15 | | 1.86% | | 7.30% | | |
| Comparative benchmark(s) | | | | |
| | | MSCI All Country World (ex-US) Index (net div) (f) | | 3.18% | | 8.94% | | |
| Average annual with sales charge | | | | |
| | | A
With Initial Sales Charge (5.75%) | | (4.37)% | | 4.87% | | |
| | | B
With CDSC (Declining over six years from 4% to 0%) (v) | | (3.23)% | | 5.28% | | |
| | | C
With CDSC (1% for 12 months) (v) | | (0.24)% | | 6.19% | | |
CDSC – Contingent Deferred Sales Charge.
Class I, R1, R2, R3, R4, and R6 shares do not have a sales charge.
| (f) | Source: FactSet Research Systems Inc. |
| (t) | For the period from the class inception date through the stated period end. (See Notes to Performance Summary.) |
| (v) | Assuming redemption at the end of the applicable period. |
Benchmark Definition(s)
MSCI All Country World (ex-US) Index (net div) – a market capitalization-weighted index that is designed to measure equity market performance in the developed and emerging markets, excluding the U.S.
It is not possible to invest directly in an index.
Notes to Performance Summary
Average annual total return represents the average annual change in value for each share class for the periods presented. Life returns are presented where the share class has less than 10 years of performance history and represent the average annual total return from the class inception date to the stated period end date.
7
Performance Summary – continued
Performance results reflect any applicable expense subsidies and waivers in effect during the periods shown. Without such subsidies and waivers the fund’s performance results would be less favorable. Please see the prospectus and financial statements for complete details.
Performance results do not include adjustments made for financial reporting purposes in accordance with U.S. generally accepted accounting principles and may differ from amounts reported in the financial highlights.
From time to time the fund may receive proceeds from litigation settlements, without which performance would be lower.
8
EXPENSE TABLE
Fund expenses borne by the shareholders during the period,
March 1, 2018 through August 31, 2018
As a shareholder of the fund, you incur two types of costs: (1) transaction costs, including sales charges (loads) on certain purchase or redemption payments, and (2) ongoing costs, including management fees; distribution and service (12b-1) fees; and other fund expenses. This example is intended to help you understand your ongoing costs (in dollars) of investing in the fund and to compare these costs with the ongoing costs of investing in other mutual funds.
The example is based on an investment of $1,000 invested at the beginning of the period and held for the entire period March 1, 2018 through August 31, 2018.
Actual Expenses
The first line for each share class in the following table provides information about actual account values and actual expenses. You may use the information in this line, together with the amount you invested, to estimate the expenses that you paid over the period. Simply divide your account value by $1,000 (for example, an $8,600 account value divided by $1,000 = 8.6), then multiply the result by the number in the first line under the heading entitled “Expenses Paid During Period” to estimate the expenses you paid on your account during this period.
Hypothetical Example for Comparison Purposes
The second line for each share class in the following table provides information about hypothetical account values and hypothetical expenses based on the fund’s actual expense ratio and an assumed rate of return of 5% per year before expenses, which is not the fund’s actual return. The hypothetical account values and expenses may not be used to estimate the actual ending account balance or expenses you paid for the period. You may use this information to compare the ongoing costs of investing in the fund and other funds. To do so, compare this 5% hypothetical example with the 5% hypothetical examples that appear in the shareholder reports of the other funds.
Please note that the expenses shown in the table are meant to highlight your ongoing costs only and do not reflect any transactional costs, such as sales charges (loads). Therefore, the second line for each share class in the table is useful in comparing ongoing costs only, and will not help you determine the relative total costs of owning different funds. In addition, if these transactional costs were included, your costs would have been higher.
9
Expense Table – continued
| | | | | | | | | | | | | | | | | | |
Share
Class | | | | Annualized
Expense
Ratio | | | Beginning
Account Value
3/01/18 | | | Ending
Account Value
8/31/18 | | | Expenses
Paid During
Period (p)
3/01/18-8/31/18 | |
| A | | Actual | | | 0.89% | | | | $1,000.00 | | | | $952.03 | | | | $4.38 | |
| | Hypothetical (h) | | | 0.89% | | | | $1,000.00 | | | | $1,020.72 | | | | $4.53 | |
| B | | Actual | | | 1.64% | | | | $1,000.00 | | | | $948.66 | | | | $8.06 | |
| | Hypothetical (h) | | | 1.64% | | | | $1,000.00 | | | | $1,016.94 | | | | $8.34 | |
| C | | Actual | | | 1.64% | | | | $1,000.00 | | | | $949.22 | | | | $8.06 | |
| | Hypothetical (h) | | | 1.64% | | | | $1,000.00 | | | | $1,016.94 | | | | $8.34 | |
| I | | Actual | | | 0.64% | | | | $1,000.00 | | | | $953.81 | | | | $3.15 | |
| | Hypothetical (h) | | | 0.64% | | | | $1,000.00 | | | | $1,021.98 | | | | $3.26 | |
| R1 | | Actual | | | 1.64% | | | | $1,000.00 | | | | $948.61 | | | | $8.05 | |
| | Hypothetical (h) | | | 1.64% | | | | $1,000.00 | | | | $1,016.94 | | | | $8.34 | |
| R2 | | Actual | | | 1.14% | | | | $1,000.00 | | | | $951.34 | | | | $5.61 | |
| | Hypothetical (h) | | | 1.14% | | | | $1,000.00 | | | | $1,019.46 | | | | $5.80 | |
| R3 | | Actual | | | 0.89% | | | | $1,000.00 | | | | $952.38 | | | | $4.38 | |
| | Hypothetical (h) | | | 0.89% | | | | $1,000.00 | | | | $1,020.72 | | | | $4.53 | |
| R4 | | Actual | | | 0.64% | | | | $1,000.00 | | | | $953.85 | | | | $3.15 | |
| | Hypothetical (h) | | | 0.64% | | | | $1,000.00 | | | | $1,021.98 | | | | $3.26 | |
| R6 | | Actual | | | 0.50% | | | | $1,000.00 | | | | $953.85 | | | | $2.46 | |
| | Hypothetical (h) | | | 0.50% | | | | $1,000.00 | | | | $1,022.68 | | | | $2.55 | |
| (h) | 5% class return per year before expenses. |
| (p) | “Expenses Paid During Period” are equal to each class’s annualized expense ratio, as shown above, multiplied by the average account value over the period, multiplied by 184/365 (to reflect the one-half year period). Expenses paid do not include any applicable sales charges (loads). If these transaction costs had been included, your costs would have been higher. |
10
PORTFOLIO OF INVESTMENTS
8/31/18
The Portfolio of Investments is a complete list of all securities owned by your fund. It is categorized by broad-based asset classes.
| | | | | | | | |
| Common Stocks - 98.4% | | | | | | | | |
| Issuer | | Shares/Par | | | Value ($) | |
| Airlines - 2.1% | | | | | | | | |
| Aena S.A. | | | 18,075 | | | $ | 3,199,535 | |
| Air Canada (a) | | | 141,182 | | | | 2,901,533 | |
| | | | | | | | |
| | | | | | | $ | 6,101,068 | |
| Alcoholic Beverages - 0.6% | | | | | | | | |
| China Resources Beer Holdings Co. Ltd. | | | 422,000 | | | $ | 1,795,802 | |
| | |
| Apparel Manufacturers - 2.8% | | | | | | | | |
| Burberry Group PLC | | | 54,724 | | | $ | 1,586,374 | |
| Compagnie Financiere Richemont S.A. | | | 17,139 | | | | 1,515,411 | |
| LVMH Moet Hennessy Louis Vuitton SE | | | 14,906 | | | | 5,222,650 | |
| | | | | | | | |
| | | | | | | $ | 8,324,435 | |
| Automotive - 4.5% | | | | | | | | |
| Magna International, Inc. | | | 74,287 | | | $ | 4,020,412 | |
| PSA Peugeot Citroen S.A. | | | 114,029 | | | | 3,136,912 | |
| Toyota Motor Corp. | | | 99,300 | | | | 6,193,403 | |
| | | | | | | | |
| | | | | | | $ | 13,350,727 | |
| Broadcasting - 0.3% | | | | | | | | |
| ProSiebenSat.1 Media AG | | | 37,589 | | | $ | 989,997 | |
| | |
| Brokerage & Asset Managers - 1.3% | | | | | | | | |
| IG Group Holdings PLC | | | 328,369 | | | $ | 3,848,455 | |
| | |
| Business Services - 2.2% | | | | | | | | |
| Ashtead Group PLC | | | 47,794 | | | $ | 1,463,555 | |
| Infosys Ltd. | | | 144,783 | | | | 2,941,743 | |
| Marubeni Corp. | | | 259,300 | | | | 2,127,422 | |
| | | | | | | | |
| | | | | | | $ | 6,532,720 | |
| Chemicals - 0.9% | | | | | | | | |
| Mitsubishi Chemical Holdings Corp. | | | 309,800 | | | $ | 2,777,075 | |
| | |
| Computer Software - 0.7% | | | | | | | | |
| Check Point Software Technologies Ltd. (a) | | | 16,437 | | | $ | 1,909,815 | |
11
Portfolio of Investments – continued
| | | | | | | | |
| Issuer | | Shares/Par | | | Value ($) | |
| Common Stocks - continued | | | | | | | | |
| Computer Software - Systems - 4.7% | | | | | | | | |
| Amadeus IT Group S.A. | | | 45,855 | | | $ | 4,253,837 | |
| Hitachi Ltd. | | | 646,000 | | | | 4,218,099 | |
| Hon Hai Precision Industry Co. Ltd., GDR | | | 503,766 | | | | 2,680,035 | |
| NICE Systems Ltd., ADR (a) | | | 10,779 | | | | 1,245,945 | |
| SK Holdings Co. Ltd. | | | 7,068 | | | | 1,669,931 | |
| | | | | | | | |
| | | | | | | $ | 14,067,847 | |
| Conglomerates - 0.4% | | | | | | | | |
| First Pacific Co. Ltd. | | | 2,362,000 | | | $ | 1,077,364 | |
| | |
| Construction - 0.6% | | | | | | | | |
| Anhui Conch Cement Co. Ltd. | | | 128,500 | | | $ | 782,583 | |
| Persimmon PLC | | | 27,876 | | | | 879,283 | |
| | | | | | | | |
| | | | | | | $ | 1,661,866 | |
| Consumer Products - 1.6% | | | | | | | | |
| KOSE Corp. | | | 16,700 | | | $ | 3,081,181 | |
| Shiseido Co. Ltd. | | | 24,800 | | | | 1,746,334 | |
| | | | | | | | |
| | | | | | | $ | 4,827,515 | |
| Consumer Services - 0.2% | | | | | | | | |
| Kroton Educacional S.A. | | | 282,800 | | | $ | 709,586 | |
| | |
| Electrical Equipment - 3.0% | | | | | | | | |
| Legrand S.A. | | | 61,965 | | | $ | 4,667,989 | |
| Schneider Electric S.A. | | | 53,112 | | | | 4,330,279 | |
| | | | | | | | |
| | | | | | | $ | 8,998,268 | |
| Electronics - 3.3% | | | | | | | | |
| Samsung Electronics Co. Ltd. | | | 106,948 | | | $ | 4,654,926 | |
| Taiwan Semiconductor Manufacturing Co. Ltd., ADR | | | 120,081 | | | | 5,235,531 | |
| | | | | | | | |
| | | | | | | $ | 9,890,457 | |
| Energy - Independent - 1.6% | | | | | | | | |
| CNOOC Ltd. | | | 2,619,000 | | | $ | 4,631,530 | |
| | |
| Energy - Integrated - 6.6% | | | | | | | | |
| BP PLC | | | 836,292 | | | $ | 5,933,886 | |
| China Petroleum & Chemical Corp. | | | 4,676,000 | | | | 4,700,575 | |
| Eni S.p.A. | | | 191,564 | | | | 3,553,279 | |
| Galp Energia SGPS S.A., “B” | | | 194,000 | | | | 3,933,991 | |
| LUKOIL PJSC, ADR | | | 22,545 | | | | 1,556,958 | |
| | | | | | | | |
| | | | | | | $ | 19,678,689 | |
12
Portfolio of Investments – continued
| | | | | | | | |
| Issuer | | Shares/Par | | | Value ($) | |
| Common Stocks - continued | | | | | | | | |
| Engineering - Construction - 1.1% | | | | | | | | |
| Bouygues S.A. | | | 47,909 | | | $ | 2,114,862 | |
| Hochtief AG | | | 7,123 | | | | 1,155,870 | |
| | | | | | | | |
| | | | | | | $ | 3,270,732 | |
| Food & Beverages - 3.1% | | | | | | | | |
| Bakkafrost P/f | | | 89,393 | | | $ | 5,103,816 | |
| Marine Harvest (l) | | | 114,257 | | | | 2,468,076 | |
| Nestle S.A. | | | 12,033 | | | | 1,010,313 | |
| Orion Corp. | | | 8,067 | | | | 775,429 | |
| | | | | | | | |
| | | | | | | $ | 9,357,634 | |
| Food & Drug Stores - 2.0% | | | | | | | | |
| Seven & I Holdings Co. Ltd. | | | 89,900 | | | $ | 3,661,214 | |
| Tesco PLC | | | 506,313 | | | | 1,618,050 | |
| Wesfarmers Ltd. | | | 20,856 | | | | 771,409 | |
| | | | | | | | |
| | | | | | | $ | 6,050,673 | |
| Forest & Paper Products - 0.3% | | | | | | | | |
| Svenska Cellulosa Aktiebolaget | | | 71,003 | | | $ | 826,479 | |
| | |
| Health Maintenance Organizations - 0.2% | | | | | | | | |
| Qualicorp S.A. | | | 175,500 | | | $ | 679,060 | |
| | |
| Insurance - 5.8% | | | | | | | | |
| Aegon N.V. | | | 152,556 | | | $ | 914,792 | |
| Legal & General Group PLC | | | 567,908 | | | | 1,872,320 | |
| Manulife Financial Corp. | | | 189,031 | | | | 3,459,050 | |
| Samsung Fire & Marine Insurance Co. Ltd. | | | 11,634 | | | | 2,769,627 | |
| Sompo Holdings, Inc. | | | 41,000 | | | | 1,750,554 | |
| Tokio Marine Holding, Inc. | | | 46,500 | | | | 2,191,706 | |
| Zurich Insurance Group AG | | | 14,538 | | | | 4,427,772 | |
| | | | | | | | |
| | | | | | | $ | 17,385,821 | |
| Internet - 2.0% | | | | | | | | |
| Baidu, Inc., ADR (a) | | | 17,219 | | | $ | 3,899,759 | |
| Tencent Holdings Ltd. | | | 43,900 | | | | 1,901,704 | |
| | | | | | | | |
| | | | | | | $ | 5,801,463 | |
| Machinery & Tools - 1.6% | | | | | | | | |
| Atlas Copco AB, “A” | | | 74,419 | | | $ | 2,121,456 | |
| Ebara Corp. | | | 80,200 | | | | 2,742,867 | |
| | | | | | | | |
| | | | | | | $ | 4,864,323 | |
13
Portfolio of Investments – continued
| | | | | | | | |
| Issuer | | Shares/Par | | | Value ($) | |
| Common Stocks - continued | | | | | | | | |
| Major Banks - 10.3% | | | | | | | | |
| ABSA Group Ltd. | | | 152,997 | | | $ | 1,692,389 | |
| Banco do Brasil S.A. | | | 222,500 | | | | 1,644,264 | |
| Bank of China Ltd. | | | 2,134,000 | | | | 959,773 | |
| BNP Paribas | | | 67,390 | | | | 3,956,516 | |
| China Construction Bank | | | 4,159,000 | | | | 3,682,758 | |
| Industrial & Commercial Bank of China, “H” | | | 5,217,000 | | | | 3,841,919 | |
| National Australia Bank Ltd. | | | 195,322 | | | | 3,983,630 | |
| Nedbank Group Ltd. | | | 89,749 | | | | 1,697,749 | |
| Sumitomo Mitsui Financial Group, Inc. | | | 94,800 | | | | 3,737,907 | |
| Toronto-Dominion Bank | | | 10,320 | | | | 624,360 | |
| Westpac Banking Corp. | | | 232,737 | | | | 4,775,160 | |
| | | | | | | | |
| | | | | | | $ | 30,596,425 | |
| Medical & Health Technology & Services - 1.0% | | | | | | | | |
| Sinopharm Group Co. Ltd., “H” | | | 112,400 | | | $ | 559,225 | |
| Sonic Healthcare Ltd. | | | 133,450 | | | | 2,512,596 | |
| | | | | | | | |
| | | | | | | $ | 3,071,821 | |
| Metals & Mining - 3.1% | | | | | | | | |
| Anglo American PLC | | | 122,308 | | | $ | 2,444,457 | |
| ArcelorMittal S.A. | | | 36,049 | | | | 1,085,430 | |
| JFE Holdings, Inc. | | | 33,400 | | | | 730,916 | |
| POSCO | | | 5,728 | | | | 1,680,090 | |
| Teck Resources Ltd., “B” | | | 112,917 | | | | 2,567,733 | |
| Ternium S.A., ADR | | | 21,297 | | | | 600,575 | |
| | | | | | | | |
| | | | | | | $ | 9,109,201 | |
| Natural Gas - Distribution - 1.1% | | | | | | | | |
| ENGIE | | | 150,360 | | | $ | 2,204,319 | |
| Tokyo Gas Co. Ltd. | | | 45,800 | | | | 1,085,333 | |
| | | | | | | | |
| | | | | | | $ | 3,289,652 | |
| Network & Telecom - 1.1% | | | | | | | | |
| LM Ericsson Telephone Co., “B” | | | 401,135 | | | $ | 3,383,603 | |
| | |
| Other Banks & Diversified Financials - 3.2% | | | | | | | | |
| DBS Group Holdings Ltd. | | | 40,300 | | | $ | 732,567 | |
| Intesa Sanpaolo S.p.A. | | | 1,411,977 | | | | 3,486,871 | |
| ORIX Corp. | | | 158,800 | | | | 2,554,006 | |
| Rural Electrification Corp. Ltd. | | | 321,230 | | | | 542,583 | |
| Sberbank of Russia, ADR | | | 207,599 | | | | 2,253,487 | |
| | | | | | | | |
| | | | | | | $ | 9,569,514 | |
14
Portfolio of Investments – continued
| | | | | | | | |
| Issuer | | Shares/Par | | | Value ($) | |
| Common Stocks - continued | | | | | | | | |
| Pharmaceuticals - 6.5% | | | | | | | | |
| Bayer AG | | | 51,448 | | | $ | 4,800,154 | |
| Kyowa Hakko Kirin Co. Ltd. | | | 119,500 | | | | 2,118,756 | |
| Novartis AG | | | 71,635 | | | | 5,940,698 | |
| Roche Holding AG | | | 26,300 | | | | 6,533,959 | |
| | | | | | | | |
| | | | | | | $ | 19,393,567 | |
| Printing & Publishing - 1.5% | | | | | | | | |
| Pearson PLC | | | 91,305 | | | $ | 1,085,948 | |
| Transcontinental, Inc., “A” | | | 142,208 | | | | 3,464,209 | |
| | | | | | | | |
| | | | | | | $ | 4,550,157 | |
| Railroad & Shipping - 0.5% | | | | | | | | |
| East Japan Railway Co. | | | 17,400 | | | $ | 1,574,629 | |
| | |
| Real Estate - 2.7% | | | | | | | | |
| CK Asset Holdings Ltd. | | | 498,500 | | | $ | 3,553,569 | |
| Link REIT | | | 74,500 | | | | 742,271 | |
| TAG Immobilien AG | | | 127,651 | | | | 3,141,223 | |
| Wheelock & Co. Ltd. | | | 85,000 | | | | 533,365 | |
| | | | | | | | |
| | | | | | | $ | 7,970,428 | |
| Restaurants - 1.2% | | | | | | | | |
| Domino’s Pizza Group PLC | | | 389,835 | | | $ | 1,470,719 | |
| Greggs PLC | | | 160,207 | | | | 2,207,855 | |
| | | | | | | | |
| | | | | | | $ | 3,678,574 | |
| Specialty Chemicals - 3.1% | | | | | | | | |
| Covestro AG | | | 24,188 | | | $ | 2,060,233 | |
| Kumho Petrochemical Co. Ltd. | | | 9,799 | | | | 897,901 | |
| Methanex Corp. | | | 55,758 | | | | 4,064,758 | |
| PTT Global Chemical PLC | | | 889,600 | | | | 2,221,961 | |
| | | | | | | | |
| | | | | | | $ | 9,244,853 | |
| Specialty Stores - 1.1% | | | | | | | | |
| Just Eat PLC (a) | | | 114,322 | | | $ | 1,136,199 | |
| K’s Holdings Corp. | | | 163,600 | | | | 1,980,398 | |
| | | | | | | | |
| | | | | | | $ | 3,116,597 | |
| Telecommunications - Wireless - 2.3% | | | | | | | | |
| KDDI Corp. | | | 48,800 | | | $ | 1,291,700 | |
| Millicom International Cellular S.A. | | | 12,625 | | | | 726,840 | |
| TIM Participacoes S.A., ADR | | | 78,817 | | | | 1,185,408 | |
| Vodafone Group PLC | | | 1,686,517 | | | | 3,596,768 | |
| | | | | | | | |
| | | | | | | $ | 6,800,716 | |
15
Portfolio of Investments – continued
| | | | | | | | |
| Issuer | | Shares/Par | | | Value ($) | |
| Common Stocks - continued | | | | | | | | |
| Telephone Services - 1.7% | | | | | | | | |
| China Unicom (Hong Kong) Ltd. | | | 1,090,000 | | | $ | 1,267,934 | |
| Com Hem Holding AB | | | 121,811 | | | | 2,055,236 | |
| PT XL Axiata Tbk (a) | | | 4,744,300 | | | | 1,024,228 | |
| Telekomunikacja Polska S.A. (a) | | | 548,333 | | | | 718,941 | |
| | | | | | | | |
| | | | | | | $ | 5,066,339 | |
| Tobacco - 2.5% | | | | | | | | |
| British American Tobacco PLC | | | 69,504 | | | $ | 3,353,387 | |
| Japan Tobacco, Inc. | | | 158,600 | | | | 4,170,904 | |
| | | | | | | | |
| | | | | | | $ | 7,524,291 | |
| Utilities - Electric Power - 2.0% | | | | | | | | |
| CLP Holdings Ltd. | | | 151,500 | | | $ | 1,780,650 | |
| Enel S.p.A. | | | 171,160 | | | | 846,351 | |
| SSE PLC | | | 211,682 | | | | 3,438,673 | |
| | | | | | | | |
| | | | | | | $ | 6,065,674 | |
| Total Common Stocks (Identified Cost, $280,797,963) | | | | | | $ | 293,415,442 | |
| | |
| Preferred Stocks - 1.0% | | | | | | | | |
| Food & Drug Stores - 0.5% | | | | | | | | |
| Cia Brasileira de Distribuicao | | | 68,600 | | | $ | 1,375,503 | |
| | |
| Major Banks - 0.5% | | | | | | | | |
| Itau Unibanco Holding S.A. | | | 145,640 | | | $ | 1,511,430 | |
| Total Preferred Stocks (Identified Cost, $3,146,153) | | | | | | $ | 2,886,933 | |
| | |
| Investment Companies (h) - 0.3% | | | | | | | | |
| Money Market Funds - 0.3% | | | | | | | | |
MFS Institutional Money Market Portfolio, 2.03% (v)
(Identified Cost, $1,000,362) | | | 1,000,462 | | | $ | 1,000,462 | |
| | |
| Collateral for Securities Loaned - 0.0% | | | | | | | | |
State Street Navigator Securities Lending Government
Money Market Portfolio, 1.93% (j) (Identified Cost, $20,430) | | | 20,430 | | | $ | 20,430 | |
| | |
| Other Assets, Less Liabilities - 0.3% | | | | | | | 784,098 | |
| Net Assets - 100.0% | | | | | | $ | 298,107,365 | |
| (a) | Non-income producing security. |
| (h) | An affiliated issuer, which may be considered one in which the fund owns 5% or more of the outstanding voting securities, or a company which is under common control. At period end, the aggregate values of the fund’s investments in affiliated issuers and in unaffiliated issuers were $1,000,462 and $296,322,805, respectively. |
16
Portfolio of Investments – continued
| (j) | The rate quoted is the annualized seven-day yield of the fund at period end. |
| (l) | A portion of this security is on loan. |
| (v) | Affiliated issuer that is available only to investment companies managed by MFS. The rate quoted for the MFS Institutional Money Market Portfolio is the annualized seven-day yield of the fund at period end. |
The following abbreviations are used in this report and are defined:
| ADR | | American Depositary Receipt |
| GDR | | Global Depositary Receipt |
| PJSC | | Public Joint Stock Company |
| PLC | | Public Limited Company |
| REIT | | Real Estate Investment Trust |
See Notes to Financial Statements
17
Financial Statements
STATEMENT OF ASSETS AND LIABILITIES
At 8/31/18
This statement represents your fund’s balance sheet, which details the assets and liabilities comprising the total value of the fund.
| | | | |
| Assets | | | | |
Investments in unaffiliated issuers, at value, including $2,169,987 of securities on loan (identified cost, $283,964,546) | | | $296,322,805 | |
Investments in affiliated issuers, at value (identified cost, $1,000,362) | | | 1,000,462 | |
Foreign currency, at value (identified cost, $1,082) | | | 1,094 | |
Receivables for | | | | |
Investments sold | | | 4 | |
Fund shares sold | | | 33,883 | |
Interest and dividends | | | 1,071,626 | |
Receivable from investment adviser | | | 98,875 | |
Other assets | | | 349 | |
Total assets | | | $298,529,098 | |
| Liabilities | | | | |
Payables for | | | | |
Fund shares reacquired | | | $160,529 | |
Collateral for securities loaned, at value (c) | | | 20,430 | |
Payable to affiliates | | | | |
Shareholder servicing costs | | | 37,063 | |
Distribution and service fees | | | 1,251 | |
Payable for independent Trustees’ compensation | | | 45 | |
Deferred country tax expense payable | | | 97,483 | |
Accrued expenses and other liabilities | | | 104,932 | |
Total liabilities | | | $421,733 | |
Net assets | | | $298,107,365 | |
| Net assets consist of | | | | |
Paid-in capital | | | $271,551,272 | |
Unrealized appreciation (depreciation) (net of $97,483 deferred country tax) | | | 12,257,126 | |
Accumulated net realized gain (loss) | | | 8,354,322 | |
Undistributed net investment income | | | 5,944,645 | |
Net assets | | | $298,107,365 | |
Shares of beneficial interest outstanding | | | 25,346,003 | |
| (c) | Non-cash collateral is not included. |
18
Statement of Assets and Liabilities – continued
| | | | | | | | | | | | |
| | | Net assets | | | Shares
outstanding | | | Net asset value
per share (a) | |
Class A | | | $88,168,142 | | | | 7,527,530 | | | | $11.71 | |
Class B | | | 97,363 | | | | 8,364 | | | | 11.64 | |
Class C | | | 283,598 | | | | 24,474 | | | | 11.59 | |
Class I | | | 1,759,630 | | | | 149,492 | | | | 11.77 | |
Class R1 | | | 59,742 | | | | 5,136 | | | | 11.63 | |
Class R2 | | | 167,172 | | | | 14,251 | | | | 11.73 | |
Class R3 | | | 61,154 | | | | 5,183 | | | | 11.80 | |
Class R4 | | | 61,536 | | | | 5,226 | | | | 11.77 | |
Class R6 | | | 207,449,028 | | | | 17,606,347 | | | | 11.78 | |
| (a) | Maximum offering price per share was equal to the net asset value per share for all share classes, except for Class A, for which the maximum offering price per share was $12.42 [100 / 94.25 x $11.71]. On sales of $50,000 or more, the maximum offering price of Class A shares is reduced. A contingent deferred sales charge may be imposed on redemptions of Class A, Class B, and Class C shares. Redemption price per share was equal to the net asset value per share for Classes I, R1, R2, R3, R4, and R6. |
See Notes to Financial Statements
19
Financial Statements
STATEMENT OF OPERATIONS
Year ended 8/31/18
This statement describes how much your fund earned in investment income and accrued in expenses. It also describes any gains and/or losses generated by fund operations.
| | | | |
| Net investment income (loss) | | | | |
Income | | | | |
Dividends | | | $9,596,210 | |
Dividends from affiliated issuers | | | 63,022 | |
Other | | | 18,577 | |
Income on securities loaned | | | 9,718 | |
Foreign taxes withheld | | | (897,420 | ) |
Total investment income | | | $8,790,107 | |
Expenses | | | | |
Management fee | | | $1,371,019 | |
Distribution and service fees | | | 189,826 | |
Shareholder servicing costs | | | 76,795 | |
Administrative services fee | | | 50,995 | |
Independent Trustees’ compensation | | | 6,978 | |
Custodian fee | | | 97,146 | |
Shareholder communications | | | 10,341 | |
Audit and tax fees | | | 79,515 | |
Legal fees | | | 2,734 | |
Registration fees | | | 127,125 | |
Miscellaneous | | | 29,113 | |
Total expenses | | | $2,041,587 | |
Reduction of expenses by investment adviser and distributor | | | (285,348 | ) |
Net expenses | | | $1,756,239 | |
Net investment income (loss) | | | $7,033,868 | |
| Realized and unrealized gain (loss) | | | | |
Realized gain (loss) (identified cost basis) | | | | |
Unaffiliated issuers (net of $85,105 country tax) | | | $11,269,501 | |
Affiliated issuers | | | (1,745 | ) |
Foreign currency | | | (168,005 | ) |
Net realized gain (loss) | | | $11,099,751 | |
Change in unrealized appreciation or depreciation | | | | |
Unaffiliated issuers (net of $44,334 increase in deferred country tax) | | | $(15,498,537 | ) |
Affiliated issuers | | | (15 | ) |
Translation of assets and liabilities in foreign currencies | | | (11,346 | ) |
Net unrealized gain (loss) | | | $(15,509,898 | ) |
Net realized and unrealized gain (loss) | | | $(4,410,147 | ) |
Change in net assets from operations | | | $2,623,721 | |
See Notes to Financial Statements
20
Financial Statements
STATEMENTS OF CHANGES IN NET ASSETS
These statements describe the increases and/or decreases in net assets resulting from operations, any distributions, and any shareholder transactions.
| | | | | | | | |
| | | Year ended | |
| | | 8/31/18 | | | 8/31/17 | |
| Change in net assets | | | | | | |
| From operations | | | | | | | | |
Net investment income (loss) | | | $7,033,868 | | | | $4,349,392 | |
Net realized gain (loss) | | | 11,099,751 | | | | 2,078,327 | |
Net unrealized gain (loss) | | | (15,509,898 | ) | | | 29,601,726 | |
Change in net assets from operations | | | $2,623,721 | | | | $36,029,445 | |
| Distributions declared to shareholders | | | | | | | | |
From net investment income | | | $(4,600,065 | ) | | | $(950,103 | ) |
From net realized gain | | | (3,388,377 | ) | | | — | |
Total distributions declared to shareholders | | | $(7,988,442 | ) | | | $(950,103 | ) |
Change in net assets from fund share transactions | | | $104,511,719 | | | | $(564,370 | ) |
Total change in net assets | | | $99,146,998 | | | | $34,514,972 | |
| Net assets | | | | | | | | |
At beginning of period | | | 198,960,367 | | | | 164,445,395 | |
At end of period (including undistributed net investment income of $5,944,645 and $3,455,710, respectively) | | | $298,107,365 | | | | $198,960,367 | |
See Notes to Financial Statements
21
Financial Statements
FINANCIAL HIGHLIGHTS
The financial highlights table is intended to help you understand the fund’s financial performance for the past 5 years (or life of a particular share class, if shorter). Certain information reflects financial results for a single fund share. The total returns in the table represent the rate that an investor would have earned (or lost) on an investment in the fund share class (assuming reinvestment of all distributions) held for the entire period.
| | | | | | | | | | | | |
| Class A | | Year ended | |
| | | 8/31/18 | | | 8/31/17 | | | 8/31/16 (c) | |
Net asset value, beginning of period | | | $11.85 | | | | $9.82 | | | | $10.00 | |
| Income (loss) from investment operations | | | | | | | | | | | | |
Net investment income (loss) (d) | | | $0.30 | | | | $0.25 | | | | $0.25 | |
Net realized and unrealized gain (loss) | | | (0.12 | ) | | | 1.82 | | | | (0.32 | ) |
Total from investment operations | | | $0.18 | | | | $2.07 | | | | $(0.07 | ) |
| Less distributions declared to shareholders | | | | | | | | | | | | |
From net investment income | | | $(0.18 | ) | | | $(0.04 | ) | | | $(0.06 | ) |
From net realized gain | | | (0.14 | ) | | | — | | | | (0.05 | ) |
Total distributions declared to shareholders | | | $(0.32 | ) | | | $(0.04 | ) | | | $(0.11 | ) |
Net asset value, end of period (x) | | | $11.71 | | | | $11.85 | | | | $9.82 | |
Total return (%) (r)(s)(t)(x) | | | 1.47 | | | | 21.15 | | | | (0.64 | )(n) |
Ratios (%) (to average net assets)
and Supplemental data: | | | | | | | | | | | | |
Expenses before expense reductions (f) | | | 0.99 | | | | 0.98 | | | | 5.84 | (a) |
Expenses after expense reductions (f) | | | 0.89 | | | | 0.89 | | | | 0.89 | (a) |
Net investment income (loss) | | | 2.49 | | | | 2.34 | | | | 2.70 | (a) |
Portfolio turnover | | | 69 | | | | 63 | | | | 64 | (n) |
Net assets at end of period (000 omitted) | | | $88,168 | | | | $535 | | | | $139 | |
See Notes to Financial Statements
22
Financial Highlights – continued
| | | | | | | | | | | | |
| Class B | | Year ended | |
| | | 8/31/18 | | | 8/31/17 | | | 8/31/16 (c) | |
Net asset value, beginning of period | | | $11.75 | | | | $9.78 | | | | $10.00 | |
| Income (loss) from investment operations | | | | | | | | | | | | |
Net investment income (loss) (d) | | | $0.20 | | | | $0.16 | | | | $0.15 | |
Net realized and unrealized gain (loss) | | | (0.11 | ) | | | 1.81 | | | | (0.28 | ) |
Total from investment operations | | | $0.09 | | | | $1.97 | | | | $(0.13 | ) |
| Less distributions declared to shareholders | | | | | | | | | | | | |
From net investment income | | | $(0.06 | ) | | | $— | | | | $(0.04 | ) |
From net realized gain | | | (0.14 | ) | | | — | | | | (0.05 | ) |
Total distributions declared to shareholders | | | $(0.20 | ) | | | $— | | | | $(0.09 | ) |
Net asset value, end of period (x) | | | $11.64 | | | | $11.75 | | | | $9.78 | |
Total return (%) (r)(s)(t)(x) | | | 0.73 | | | | 20.14 | | | | (1.27 | )(n) |
Ratios (%) (to average net assets)
and Supplemental data: | | | | | | | | | | | | |
Expenses before expense reductions (f) | | | 1.74 | | | | 1.73 | | | | 7.12 | (a) |
Expenses after expense reductions (f) | | | 1.64 | | | | 1.64 | | | | 1.63 | (a) |
Net investment income (loss) | | | 1.63 | | | | 1.51 | | | | 1.64 | (a) |
Portfolio turnover | | | 69 | | | | 63 | | | | 64 | (n) |
Net assets at end of period (000 omitted) | | | $97 | | | | $109 | | | | $54 | |
| |
| Class C | | Year ended | |
| | | 8/31/18 | | | 8/31/17 | | | 8/31/16 (c) | |
Net asset value, beginning of period | | | $11.75 | | | | $9.78 | | | | $10.00 | |
| Income (loss) from investment operations | | | | | | | | | | | | |
Net investment income (loss) (d) | | | $0.21 | | | | $0.16 | | | | $0.16 | |
Net realized and unrealized gain (loss) | | | (0.11 | ) | | | 1.81 | | | | (0.29 | ) |
Total from investment operations | | | $0.10 | | | | $1.97 | | | | $(0.13 | ) |
| Less distributions declared to shareholders | | | | | | | | | | | | |
From net investment income | | | $(0.12 | ) | | | $— | | | | $(0.04 | ) |
From net realized gain | | | (0.14 | ) | | | — | | | | (0.05 | ) |
Total distributions declared to shareholders | | | $(0.26 | ) | | | $— | | | | $(0.09 | ) |
Net asset value, end of period (x) | | | $11.59 | | | | $11.75 | | | | $9.78 | |
Total return (%) (r)(s)(t)(x) | | | 0.74 | | | | 20.14 | | | | (1.27 | )(n) |
Ratios (%) (to average net assets)
and Supplemental data: | | | | | | | | | | | | |
Expenses before expense reductions (f) | | | 1.75 | | | | 1.73 | | | | 7.03 | (a) |
Expenses after expense reductions (f) | | | 1.64 | | | | 1.64 | | | | 1.63 | (a) |
Net investment income (loss) | | | 1.73 | | | | 1.54 | | | | 1.70 | (a) |
Portfolio turnover | | | 69 | | | | 63 | | | | 64 | (n) |
Net assets at end of period (000 omitted) | | | $284 | | | | $133 | | | | $59 | |
See Notes to Financial Statements
23
Financial Highlights – continued
| | | | | | | | | | | | |
| Class I | | Year ended | |
| | | 8/31/18 | | | 8/31/17 | | | 8/31/16 (c) | |
Net asset value, beginning of period | | | $11.88 | | | | $9.84 | | | | $10.00 | |
| Income (loss) from investment operations | | | | | | | | | | | | |
Net investment income (loss) (d) | | | $0.31 | | | | $0.29 | | | | $0.33 | |
Net realized and unrealized gain (loss) | | | (0.10 | ) | | | 1.80 | | | | (0.37 | ) |
Total from investment operations | | | $0.21 | | | | $2.09 | | | | $(0.04 | ) |
| Less distributions declared to shareholders | | | | | | | | | | | | |
From net investment income | | | $(0.18 | ) | | | $(0.05 | ) | | | $(0.07 | ) |
From net realized gain | | | (0.14 | ) | | | — | | | | (0.05 | ) |
Total distributions declared to shareholders | | | $(0.32 | ) | | | $(0.05 | ) | | | $(0.12 | ) |
Net asset value, end of period (x) | | | $11.77 | | | | $11.88 | | | | $9.84 | |
Total return (%) (r)(s)(t)(x) | | | 1.74 | | | | 21.37 | | | | (0.37 | )(n) |
Ratios (%) (to average net assets)
and Supplemental data: | | | | | | | | | | | | |
Expenses before expense reductions (f) | | | 0.74 | | | | 0.73 | | | | 4.94 | (a) |
Expenses after expense reductions (f) | | | 0.64 | | | | 0.64 | | | | 0.64 | (a) |
Net investment income (loss) | | | 2.50 | | | | 2.70 | | | | 3.65 | (a) |
Portfolio turnover | | | 69 | | | | 63 | | | | 64 | (n) |
Net assets at end of period (000 omitted) | | | $1,760 | | | | $1,259 | | | | $640 | |
| |
| Class R1 | | Year ended | |
| | | 8/31/18 | | | 8/31/17 | | | 8/31/16 (c) | |
Net asset value, beginning of period | | | $11.75 | | | | $9.78 | | | | $10.00 | |
| Income (loss) from investment operations | | | | | | | | | | | | |
Net investment income (loss) (d) | | | $0.19 | | | | $0.15 | | | | $0.15 | |
Net realized and unrealized gain (loss) | | | (0.10 | ) | | | 1.82 | | | | (0.28 | ) |
Total from investment operations | | | $0.09 | | | | $1.97 | | | | $(0.13 | ) |
| Less distributions declared to shareholders | | | | | | | | | | | | |
From net investment income | | | $(0.07 | ) | | | $— | | | | $(0.04 | ) |
From net realized gain | | | (0.14 | ) | | | — | | | | (0.05 | ) |
Total distributions declared to shareholders | | | $(0.21 | ) | | | $— | | | | $(0.09 | ) |
Net asset value, end of period (x) | | | $11.63 | | | | $11.75 | | | | $9.78 | |
Total return (%) (r)(s)(t)(x) | | | 0.72 | | | | 20.14 | | | | (1.27 | )(n) |
Ratios (%) (to average net assets)
and Supplemental data: | | | | | | | | | | | | |
Expenses before expense reductions (f) | | | 1.73 | | | | 1.72 | | | | 7.19 | (a) |
Expenses after expense reductions (f) | | | 1.64 | | | | 1.64 | | | | 1.63 | (a) |
Net investment income (loss) | | | 1.54 | | | | 1.41 | | | | 1.60 | (a) |
Portfolio turnover | | | 69 | | | | 63 | | | | 64 | (n) |
Net assets at end of period (000 omitted) | | | $60 | | | | $59 | | | | $49 | |
See Notes to Financial Statements
24
Financial Highlights – continued
| | | | | | | | | | | | |
| Class R2 | | Year ended | |
| | | 8/31/18 | | | 8/31/17 | | | 8/31/16 (c) | |
Net asset value, beginning of period | | | $11.84 | | | | $9.81 | | | | $10.00 | |
| Income (loss) from investment operations | | | | | | | | | | | | |
Net investment income (loss) (d) | | | $0.29 | | | | $0.20 | | | | $0.19 | |
Net realized and unrealized gain (loss) | | | (0.13 | ) | | | 1.83 | | | | (0.28 | ) |
Total from investment operations | | | $0.16 | | | | $2.03 | | | | $(0.09 | ) |
| Less distributions declared to shareholders | | | | | | | | | | | | |
From net investment income | | | $(0.13 | ) | | | $(0.00 | )(w) | | | $(0.05 | ) |
From net realized gain | | | (0.14 | ) | | | — | | | | (0.05 | ) |
Total distributions declared to shareholders | | | $(0.27 | ) | | | $(0.00 | )(w) | | | $(0.10 | ) |
Net asset value, end of period (x) | | | $11.73 | | | | $11.84 | | | | $9.81 | |
Total return (%) (r)(s)(t)(x) | | | 1.27 | | | | 20.74 | | | | (0.82 | )(n) |
Ratios (%) (to average net assets)
and Supplemental data: | | | | | | | | | | | | |
Expenses before expense reductions (f) | | | 1.25 | | | | 1.22 | | | | 6.68 | (a) |
Expenses after expense reductions (f) | | | 1.14 | | | | 1.14 | | | | 1.13 | (a) |
Net investment income (loss) | | | 2.34 | | | | 1.90 | | | | 2.11 | (a) |
Portfolio turnover | | | 69 | | | | 63 | | | | 64 | (n) |
Net assets at end of period (000 omitted) | | | $167 | | | | $60 | | | | $50 | |
| |
| Class R3 | | Year ended | |
| | | 8/31/18 | | | 8/31/17 | | | 8/31/16 (c) | |
Net asset value, beginning of period | | | $11.91 | | | | $9.84 | | | | $10.00 | |
| Income (loss) from investment operations | | | | | | | | | | | | |
Net investment income (loss) (d) | | | $0.28 | | | | $0.23 | | | | $0.29 | |
Net realized and unrealized gain (loss) | | | (0.09 | ) | | | 1.84 | | | | (0.34 | ) |
Total from investment operations | | | $0.19 | | | | $2.07 | | | | $(0.05 | ) |
| Less distributions declared to shareholders | | | | | | | | | | | | |
From net investment income | | | $(0.16 | ) | | | $— | | | | $(0.06 | ) |
From net realized gain | | | (0.14 | ) | | | — | | | | (0.05 | ) |
Total distributions declared to shareholders | | | $(0.30 | ) | | | $— | | | | $(0.11 | ) |
Net asset value, end of period (x) | | | $11.80 | | | | $11.91 | | | | $9.84 | |
Total return (%) (r)(s)(t)(x) | | | 1.50 | | | | 21.04 | | | | (0.44 | )(n) |
Ratios (%) (to average net assets)
and Supplemental data: | | | | | | | | | | | | |
Expenses before expense reductions (f) | | | 0.98 | | | | 0.97 | | | | 5.94 | (a) |
Expenses after expense reductions (f) | | | 0.89 | | | | 0.89 | | | | 0.87 | (a) |
Net investment income (loss) | | | 2.29 | | | | 2.15 | | | | 3.16 | (a) |
Portfolio turnover | | | 69 | | | | 63 | | | | 64 | (n) |
Net assets at end of period (000 omitted) | | | $61 | | | | $60 | | | | $50 | |
See Notes to Financial Statements
25
Financial Highlights – continued
| | | | | | | | | | | | |
| Class R4 | | Year ended | |
| | | 8/31/18 | | | 8/31/17 | | | 8/31/16 (c) | |
Net asset value, beginning of period | | | $11.88 | | | | $9.84 | | | | $10.00 | |
| Income (loss) from investment operations | | | | | | | | | | | | |
Net investment income (loss) (d) | | | $0.31 | | | | $0.25 | | | | $0.24 | |
Net realized and unrealized gain (loss) | | | (0.10 | ) | | | 1.84 | | | | (0.28 | ) |
Total from investment operations | | | $0.21 | | | | $2.09 | | | | $(0.04 | ) |
| Less distributions declared to shareholders | | | | | | | | | | | | |
From net investment income | | | $(0.18 | ) | | | $(0.05 | ) | | | $(0.07 | ) |
From net realized gain | | | (0.14 | ) | | | — | | | | (0.05 | ) |
Total distributions declared to shareholders | | | $(0.32 | ) | | | $(0.05 | ) | | | $(0.12 | ) |
Net asset value, end of period (x) | | | $11.77 | | | | $11.88 | | | | $9.84 | |
Total return (%) (r)(s)(t)(x) | | | 1.74 | | | | 21.36 | | | | (0.37 | )(n) |
Ratios (%) (to average net assets)
and Supplemental data: | | | | | | | | | | | | |
Expenses before expense reductions (f) | | | 0.73 | | | | 0.72 | | | | 6.18 | (a) |
Expenses after expense reductions (f) | | | 0.64 | | | | 0.64 | | | | 0.63 | (a) |
Net investment income (loss) | | | 2.54 | | | | 2.41 | | | | 2.60 | (a) |
Portfolio turnover | | | 69 | | | | 63 | | | | 64 | (n) |
Net assets at end of period (000 omitted) | | | $62 | | | | $60 | | | | $50 | |
| |
| Class R6 | | Year ended | |
| | | 8/31/18 | | | 8/31/17 | | | 8/31/16 (c) | |
Net asset value, beginning of period | | | $11.88 | | | | $9.84 | | | | $10.00 | |
| Income (loss) from investment operations | | | | | | | | | | | | |
Net investment income (loss) (d) | | | $0.32 | | | | $0.26 | | | | $0.24 | |
Net realized and unrealized gain (loss) | | | (0.09 | ) | | | 1.84 | | | | (0.28 | ) |
Total from investment operations | | | $0.23 | | | | $2.10 | | | | $(0.04 | ) |
| Less distributions declared to shareholders | | | | | | | | | | | | |
From net investment income | | | $(0.19 | ) | | | $(0.06 | ) | | | $(0.07 | ) |
From net realized gain | | | (0.14 | ) | | | — | | | | (0.05 | ) |
Total distributions declared to shareholders | | | $(0.33 | ) | | | $(0.06 | ) | | | $(0.12 | ) |
Net asset value, end of period (x) | | | $11.78 | | | | $11.88 | | | | $9.84 | |
Total return (%) (r)(s)(t)(x) | | | 1.86 | | | | 21.41 | | | | (0.36 | )(n) |
Ratios (%) (to average net assets)
and Supplemental data: | | | | | | | | | | | | |
Expenses before expense reductions (f) | | | 0.65 | | | | 0.68 | | | | 3.06 | (a) |
Expenses after expense reductions (f) | | | 0.54 | | | | 0.60 | | | | 0.60 | (a) |
Net investment income (loss) | | | 2.60 | | | | 2.43 | | | | 2.61 | (a) |
Portfolio turnover | | | 69 | | | | 63 | | | | 64 | (n) |
Net assets at end of period (000 omitted) | | | $207,449 | | | | $196,685 | | | | $163,355 | |
See Notes to Financial Statements
26
Financial Highlights – continued
| (c) | For the period from the commencement of the fund’s investment operations, September 15, 2015, through the stated period end. |
| (d) | Per share data is based on average shares outstanding. |
| (f) | Ratios do not reflect reductions from fees paid indirectly, if applicable. |
| (r) | Certain expenses have been reduced without which performance would have been lower. |
| (s) | From time to time the fund may receive proceeds from litigation settlements, without which performance would be lower. |
| (t) | Total returns do not include any applicable sales charges. |
| (w) | Per share amount was less than $0.01. |
| (x) | The net asset values and total returns have been calculated on net assets which include adjustments made in accordance with U.S. generally accepted accounting principles required at period end for financial reporting purposes. |
See Notes to Financial Statements
27
NOTES TO FINANCIAL STATEMENTS
(1) Business and Organization
MFS Blended Research International Equity Fund (the fund) is a diversified series of MFS Series Trust IV (the trust). The trust is organized as a Massachusetts business trust and is registered under the Investment Company Act of 1940, as amended, as an open-end management investment company.
The fund is an investment company and accordingly follows the investment company accounting and reporting guidance of the Financial Accounting Standards Board (FASB) Accounting Standards Codification Topic 946 Financial Services – Investment Companies.
(2) Significant Accounting Policies
General – The preparation of financial statements in conformity with U.S. generally accepted accounting principles requires management to make estimates and assumptions that affect the reported amounts of assets and liabilities, and disclosure of contingent assets and liabilities at the date of the financial statements and the reported amounts of increases and decreases in net assets from operations during the reporting period. Actual results could differ from those estimates. In the preparation of these financial statements, management has evaluated subsequent events occurring after the date of the fund’s Statement of Assets and Liabilities through the date that the financial statements were issued. The fund invests in foreign securities, including securities of emerging market issuers. Investments in foreign securities are vulnerable to the effects of changes in the relative values of the local currency and the U.S. dollar and to the effects of changes in each country’s market, economic, industrial, political, regulatory, geopolitical, and other conditions. Investments in emerging markets can involve additional and greater risks than the risks associated with investments in developed foreign markets. Emerging markets can have less developed markets, greater custody and operational risk, less developed legal, regulatory, and accounting systems, and greater political, social, and economic instability than developed markets.
In August 2018, the FASB issued Accounting Standards Update 2018-13, Fair Value Measurement (Topic 820) – Disclosure Framework – Changes to the Disclosure Requirements for Fair Value Measurement (“ASU 2018-13”) which introduces new fair value disclosure requirements as well as eliminates and modifies certain existing fair value disclosure requirements. ASU 2018-13 would be effective for fiscal years beginning after December 15, 2019, and interim periods within those fiscal years; however, management has elected to early adopt ASU 2018-13 effective with the current reporting period. The impact of the fund’s adoption was limited to changes in the fund’s financial statement disclosures regarding fair value, primarily those disclosures related to transfers between levels of the fair value hierarchy.
Balance Sheet Offsetting – The fund’s accounting policy with respect to balance sheet offsetting is that, absent an event of default by the counterparty or a termination of the agreement, the International Swaps and Derivatives Association (ISDA) Master Agreement, or similar agreement, does not result in an offset of reported amounts of financial assets and financial liabilities in the Statement of Assets and Liabilities across transactions between the fund and the applicable counterparty. The fund’s right to
28
Notes to Financial Statements – continued
setoff may be restricted or prohibited by the bankruptcy or insolvency laws of the particular jurisdiction to which a specific master netting agreement counterparty is subject. Balance sheet offsetting disclosures, to the extent applicable to the fund, have been included in the fund’s Significant Accounting Policies note under the captions for each of the fund’s in-scope financial instruments and transactions.
Investment Valuations – Equity securities, including restricted equity securities, are generally valued at the last sale or official closing price on their primary market or exchange as provided by a third-party pricing service. Equity securities, for which there were no sales reported that day, are generally valued at the last quoted daily bid quotation on their primary market or exchange as provided by a third-party pricing service. Short-term instruments with a maturity at issuance of 60 days or less may be valued at amortized cost, which approximates market value. Open-end investment companies are generally valued at net asset value per share. Securities and other assets generally valued on the basis of information from a third-party pricing service may also be valued at a broker/dealer bid quotation. In determining values, third-party pricing services can utilize both transaction data and market information such as yield, quality, coupon rate, maturity, type of issue, trading characteristics, and other market data. The values of foreign securities and other assets and liabilities expressed in foreign currencies are converted to U.S. dollars using the mean of bid and asked prices for rates provided by a third-party pricing service.
The Board of Trustees has delegated primary responsibility for determining or causing to be determined the value of the fund’s investments (including any fair valuation) to the adviser pursuant to valuation policies and procedures approved by the Board. If the adviser determines that reliable market quotations are not readily available, investments are valued at fair value as determined in good faith by the adviser in accordance with such procedures under the oversight of the Board of Trustees. Under the fund’s valuation policies and procedures, market quotations are not considered to be readily available for most types of debt instruments and floating rate loans and many types of derivatives. These investments are generally valued at fair value based on information from third-party pricing services. In addition, investments may be valued at fair value if the adviser determines that an investment’s value has been materially affected by events occurring after the close of the exchange or market on which the investment is principally traded (such as foreign exchange or market) and prior to the determination of the fund’s net asset value, or after the halting of trading of a specific security where trading does not resume prior to the close of the exchange or market on which the security is principally traded. Events that occur on a frequent basis after foreign markets close (such as developments in foreign markets and significant movements in the U.S. markets) and prior to the determination of the fund’s net asset value may be deemed to have a material effect on the value of securities traded in foreign markets. Accordingly, the fund’s foreign equity securities may often be valued at fair value. The adviser generally relies on third-party pricing services or other information (such as the correlation with price movements of similar securities in the same or other markets; the type, cost and investment characteristics of the security; the business and financial condition of the issuer; and trading and other market data) to assist in determining whether to fair value and at what value to fair value an investment. The value of an investment for purposes of calculating the fund’s net asset value can differ depending
29
Notes to Financial Statements – continued
on the source and method used to determine value. When fair valuation is used, the value of an investment used to determine the fund’s net asset value may differ from quoted or published prices for the same investment. There can be no assurance that the fund could obtain the fair value assigned to an investment if it were to sell the investment at the same time at which the fund determines its net asset value per share. Various inputs are used in determining the value of the fund’s assets or liabilities. These inputs are categorized into three broad levels. In certain cases, the inputs used to measure fair value may fall into different levels of the fair value hierarchy. In such cases, an investment’s level within the fair value hierarchy is based on the lowest level of input that is significant to the fair value measurement. The fund’s assessment of the significance of a particular input to the fair value measurement in its entirety requires judgment, and considers factors specific to the investment. Level 1 includes unadjusted quoted prices in active markets for identical assets or liabilities. Level 2 includes other significant observable market-based inputs (including quoted prices for similar securities, interest rates, prepayment speed, and credit risk). Level 3 includes unobservable inputs, which may include the adviser’s own assumptions in determining the fair value of investments. The following is a summary of the levels used as of August 31, 2018 in valuing the fund’s assets or liabilities:
| | | | | | | | | | | | | | | | |
| Financial Instruments | | Level 1 | | | Level 2 | | | Level 3 | | | Total | |
| Equity Securities: | | | | | | | | | | | | | | | | |
Japan | | | $49,734,405 | | | | $— | | | | $— | | | | $49,734,405 | |
United Kingdom | | | 35,935,929 | | | | — | | | | — | | | | 35,935,929 | |
China | | | 28,023,564 | | | | — | | | | — | | | | 28,023,564 | |
France | | | 26,718,957 | | | | — | | | | — | | | | 26,718,957 | |
Canada | | | 21,102,055 | | | | — | | | | — | | | | 21,102,055 | |
Switzerland | | | 19,428,152 | | | | — | | | | — | | | | 19,428,152 | |
South Korea | | | 12,447,903 | | | | — | | | | — | | | | 12,447,903 | |
Germany | | | 12,147,476 | | | | — | | | | — | | | | 12,147,476 | |
Australia | | | 12,042,795 | | | | — | | | | — | | | | 12,042,795 | |
Other Countries | | | 76,499,177 | | | | 2,221,962 | | | | — | | | | 78,721,139 | |
| Mutual Funds | | | 1,020,892 | | | | — | | | | — | | | | 1,020,892 | |
| Total | | | $295,101,305 | | | | $2,221,962 | | | | $— | | | | $297,323,267 | |
For further information regarding security characteristics, see the Portfolio of Investments.
Foreign Currency Translation – Purchases and sales of foreign investments, income, and expenses are converted into U.S. dollars based upon currency exchange rates prevailing on the respective dates of such transactions or on the reporting date for foreign denominated receivables and payables. Gains and losses attributable to foreign currency exchange rates on sales of securities are recorded for financial statement purposes as net realized gains and losses on investments. Gains and losses attributable to foreign exchange rate movements on receivables, payables, income and expenses are recorded for financial statement purposes as foreign currency transaction gains and losses. That portion of both realized and unrealized gains and losses on investments that results from fluctuations in foreign currency exchange rates is not separately disclosed.
30
Notes to Financial Statements – continued
Security Loans – Under its Securities Lending Agency Agreement with the fund, State Street Bank and Trust Company (“State Street”), as lending agent, loans the securities of the fund to certain qualified institutions (the “Borrowers”) approved by the fund. Security loans can be terminated at the discretion of either the lending agent or the fund and the related securities must be returned within the earlier of the standard trade settlement period for such securities or within three business days. The loans are collateralized by cash and/or U.S. Treasury and federal agency obligations in an amount typically at least equal to the market value of the securities loaned. On loans collateralized by cash, the cash collateral is invested in a money market fund. The market value of the loaned securities is determined at the close of business of the fund and any additional required collateral is delivered to the fund on the next business day. State Street provides the fund with indemnification against Borrower default. In the event of Borrower default, State Street will, for the benefit of the fund, either purchase securities identical to those loaned or, when such purchase is commercially impracticable, pay the fund the market value of the loaned securities. In return, State Street assumes the fund’s rights to the related collateral. If the collateral value is less than the cost to purchase identical securities, State Street is responsible for the shortfall, but only to the extent that such shortfall is not due to a decline in collateral value resulting from collateral reinvestment for which the fund bears the risk of loss. At period end, the fund had investment securities on loan, all of which were classified as equity securities in the fund’s Portfolio of Investments, with a fair value of $2,169,987. The fair value of the fund’s investment securities on loan and a related liability of $20,430 for cash collateral received on securities loaned are both presented gross in the Statement of Assets and Liabilities. Additionally, these loans were collateralized by U.S. Treasury Obligations of $2,267,899. The collateral on securities loaned exceeded the value of securities on loan at period end. The liability for cash collateral for securities loaned is carried at fair value, which is categorized as level 2 within the fair value hierarchy. A portion of the income generated upon investment of the collateral is remitted to the Borrowers, and the remainder is allocated between the fund and the lending agent. On loans collateralized by U.S. Treasury and/or federal agency obligations, a fee is received from the Borrower, and is allocated between the fund and the lending agent. Income from securities lending is separately reported in the Statement of Operations. The dividend and interest income earned on the securities loaned is accounted for in the same manner as other dividend and interest income.
Indemnifications – Under the fund’s organizational documents, its officers and Trustees may be indemnified against certain liabilities and expenses arising out of the performance of their duties to the fund. Additionally, in the normal course of business, the fund enters into agreements with service providers that may contain indemnification clauses. The fund’s maximum exposure under these agreements is unknown as this would involve future claims that may be made against the fund that have not yet occurred.
Investment Transactions and Income – Investment transactions are recorded on the trade date. Dividends received in cash are recorded on the ex-dividend date. Certain dividends from foreign securities will be recorded when the fund is informed of the
31
Notes to Financial Statements – continued
dividend if such information is obtained subsequent to the ex-dividend date. Dividend payments received in additional securities are recorded on the ex-dividend date in an amount equal to the value of the security on such date.
The fund may receive proceeds from litigation settlements. Any proceeds received from litigation involving portfolio holdings are reflected in the Statement of Operations in realized gain/loss if the security has been disposed of by the fund or in unrealized gain/loss if the security is still held by the fund. Any other proceeds from litigation not related to portfolio holdings are reflected as other income in the Statement of Operations.
Tax Matters and Distributions – The fund intends to qualify as a regulated investment company, as defined under Subchapter M of the Internal Revenue Code, and to distribute all of its taxable income, including realized capital gains. As a result, no provision for federal income tax is required. The fund’s federal tax returns, when filed, will remain subject to examination by the Internal Revenue Service for a three year period. Management has analyzed the fund’s tax positions taken on federal and state tax returns for all open tax years and does not believe that there are any uncertain tax positions that require recognition of a tax liability. Foreign taxes, if any, have been accrued by the fund in the accompanying financial statements in accordance with the applicable foreign tax law. Foreign income taxes may be withheld by certain countries in which the fund invests. Additionally, capital gains realized by the fund on securities issued in or by certain foreign countries may be subject to capital gains tax imposed by those countries.
Distributions to shareholders are recorded on the ex-dividend date. Income and capital gain distributions are determined in accordance with income tax regulations, which may differ from U.S. generally accepted accounting principles. Certain capital accounts in the financial statements are periodically adjusted for permanent differences in order to reflect their tax character. These adjustments have no impact on net assets or net asset value per share. Temporary differences which arise from recognizing certain items of income, expense, gain or loss in different periods for financial statement and tax purposes will reverse at some time in the future. Distributions in excess of net investment income or net realized gains are temporary overdistributions for financial statement purposes resulting from differences in the recognition or classification of income or distributions for financial statement and tax purposes.
Book/tax differences primarily relate to passive foreign investment companies, wash sale loss deferrals, and treating a portion of the proceeds from redemptions as a distribution for tax purposes.
The tax character of distributions declared to shareholders for the last two fiscal years is as follows:
| | | | | | | | |
| | | Year ended
8/31/18 | | | Year ended
8/31/17 | |
| Ordinary income (including any short-term capital gains) | | | $7,573,262 | | | | $950,103 | |
| Long-term capital gains | | | 415,180 | | | | — | |
| Total distributions | | | $7,988,442 | | | | $950,103 | |
32
Notes to Financial Statements – continued
The federal tax cost and the tax basis components of distributable earnings were as follows:
| | | | |
| As of 8/31/18 | | | |
| Cost of investments | | | $286,103,739 | |
| Gross appreciation | | | 25,599,068 | |
| Gross depreciation | | | (14,379,540 | ) |
| Net unrealized appreciation (depreciation) | | | $11,219,528 | |
| Undistributed ordinary income | | | 5,996,723 | |
| Undistributed long-term capital gain | | | 9,469,109 | |
| Post-October capital loss deferral | | | (73,439 | ) |
| Other temporary differences | | | (55,828 | ) |
Multiple Classes of Shares of Beneficial Interest – The fund offers multiple classes of shares, which differ in their respective distribution and service fees. The fund’s income, realized and unrealized gain (loss), and common expenses are allocated to shareholders based on the daily net assets of each class. Dividends are declared separately for each class. Differences in per share dividend rates are generally due to differences in separate class expenses. Class B shares will convert to Class A shares approximately eight years after purchase. Effective April 23, 2018, Class C shares will convert to Class A shares approximately ten years after purchase. The fund’s distributions declared to shareholders as reported in the Statements of Changes in Net Assets are presented by class as follows:
| | | | | | | | | | | | | | | | |
| | | From net investment
income | | | From net realized
gain | |
| | | Year
ended
8/31/18 | | | Year
ended
8/31/17 | | | Year
ended
8/31/18 | | | Year
ended
8/31/17 | |
| Class A | | | $1,277,016 | | | | $857 | | | | $963,500 | | | | $— | |
| Class B | | | 455 | | | | — | | | | 992 | | | | — | |
| Class C | | | 1,981 | | | | — | | | | 2,364 | | | | — | |
| Class I | | | 21,010 | | | | 4,033 | | | | 15,679 | | | | — | |
| Class R1 | | | 363 | | | | — | | | | 695 | | | | — | |
| Class R2 | | | 645 | | | | 20 | | | | 696 | | | | — | |
| Class R3 | | | 788 | | | | — | | | | 696 | | | | — | |
| Class R4 | | | 938 | | | | 261 | | | | 701 | | | | — | |
| Class R6 | | | 3,296,869 | | | | 944,932 | | | | 2,403,054 | | | | — | |
| Total | | | $4,600,065 | | | | $950,103 | | | | $3,388,377 | | | | $— | |
(3) Transactions with Affiliates
Investment Adviser – The fund has an investment advisory agreement with MFS to provide overall investment management and related administrative services and facilities to the fund. The management fee is computed daily and paid monthly at the following annual rates based on the fund’s average daily net assets:
| | | | |
| Up to $1 billion | | | 0.50 | % |
| In excess of $1 billion and up to $2.5 billion | | | 0.475 | % |
| In excess of $2.5 billion | | | 0.45 | % |
33
Notes to Financial Statements – continued
MFS has agreed in writing to reduce its management fee by a specified amount if certain MFS mutual fund assets exceed thresholds agreed to by MFS and the fund’s Board of Trustees. For the year ended August 31, 2018, this management fee reduction amounted to $25,006, which is included in the reduction of total expenses in the Statement of Operations. The management fee incurred for the year ended August 31, 2018 was equivalent to an annual effective rate of 0.49% of the fund’s average daily net assets.
The investment adviser has agreed in writing to pay a portion of the fund’s total annual operating expenses, excluding interest, taxes, extraordinary expenses, brokerage and transaction costs, and investment-related expenses, such that total fund operating expenses do not exceed the following rates annually of each class’s average daily net assets:
| | | | | | | | | | | | | | | | | | | | | | | | | | | | | | | | |
| Classes | |
| A | | B | | | C | | | I | | | R1 | | | R2 | | | R3 | | | R4 | | | R6 | |
| 0.89% | | | 1.64% | | | | 1.64% | | | | 0.64% | | | | 1.64% | | | | 1.14% | | | | 0.89% | | | | 0.64% | | | | 0.60% | |
This written agreement will continue until modified by the fund’s Board of Trustees, but such agreement will continue at least until December 31, 2019. For the year ended August 31, 2018, this reduction amounted to $260,339, which is included in the reduction of total expenses in the Statement of Operations.
Distributor – MFS Fund Distributors, Inc. (MFD), a wholly-owned subsidiary of MFS, as distributor, received $1,448 for the year ended August 31, 2018, as its portion of the initial sales charge on sales of Class A shares of the fund.
The Board of Trustees has adopted a distribution plan for certain share classes pursuant to Rule 12b-1 of the Investment Company Act of 1940.
The fund’s distribution plan provides that the fund will pay MFD for services provided by MFD and financial intermediaries in connection with the distribution and servicing of certain share classes. One component of the plan is a distribution fee paid to MFD and another component of the plan is a service fee paid to MFD. MFD may subsequently pay all, or a portion, of the distribution and/or service fees to financial intermediaries.
Distribution Plan Fee Table:
| | | | | | | | | | | | | | | | | | | | |
| | | Distribution
Fee Rate (d) | | | Service
Fee Rate (d) | | | Total
Distribution
Plan (d) | | | Annual
Effective
Rate (e) | | | Distribution
and Service
Fee | |
| Class A | | | — | | | | 0.25% | | | | 0.25% | | | | 0.25% | | | | $185,130 | |
| Class B | | | 0.75% | | | | 0.25% | | | | 1.00% | | | | 1.00% | | | | 998 | |
| Class C | | | 0.75% | | | | 0.25% | | | | 1.00% | | | | 1.00% | | | | 2,341 | |
| Class R1 | | | 0.75% | | | | 0.25% | | | | 1.00% | | | | 1.00% | | | | 619 | |
| Class R2 | | | 0.25% | | | | 0.25% | | | | 0.50% | | | | 0.50% | | | | 580 | |
| Class R3 | | | — | | | | 0.25% | | | | 0.25% | | | | 0.25% | | | | 158 | |
| Total Distribution and Service Fees | | | | | | | | | | | | $189,826 | |
| (d) | In accordance with the distribution plan for certain classes, the fund pays distribution and/or service fees equal to these annual percentage rates of each class’s average daily net assets. The distribution and service fee rates disclosed by class represent the current rates in effect at the end of the reporting period. Any rate changes, if applicable, are detailed below. |
34
Notes to Financial Statements – continued
| (e) | The annual effective rates represent actual fees incurred under the distribution plan for the year ended August 31, 2018 based on each class’s average daily net assets. MFD has voluntarily agreed to rebate a portion of each class’s 0.25% service fee attributable to accounts for which MFD retains the 0.25% service fee except for accounts attributable to MFS or its affiliates’ seed money. For the year ended August 31, 2018, this rebate amounted to $3 for Class A and is included in the reduction of total expenses in the Statement of Operations. |
Certain Class A shares are subject to a contingent deferred sales charge (CDSC) in the event of a shareholder redemption within 18 months of purchase. Class B shares are subject to a CDSC in the event of a shareholder redemption within six years of purchase. Class C shares are subject to a CDSC in the event of a shareholder redemption within 12 months of purchase. There were no contingent deferred sales charges imposed during the year ended August 31, 2018.
Shareholder Servicing Agent – MFS Service Center, Inc. (MFSC), a wholly-owned subsidiary of MFS, receives a fee from the fund for its services as shareholder servicing agent calculated as a percentage of the average daily net assets of the fund as determined periodically under the supervision of the fund’s Board of Trustees. For the year ended August 31, 2018, the fee was $1,534, which equated to 0.0006% annually of the fund’s average daily net assets. MFSC also receives payment from the fund for out-of-pocket expenses, sub-accounting and other shareholder servicing costs which may be paid to affiliated and unaffiliated service providers. Class R6 shares do not incur sub-accounting fees. For the year ended August 31, 2018, these out-of-pocket expenses, sub-accounting and other shareholder servicing costs amounted to $75,261.
Administrator – MFS provides certain financial, legal, shareholder communications, compliance, and other administrative services to the fund. Under an administrative services agreement, the fund reimburses MFS the costs incurred to provide these services. The fund is charged an annual fixed amount of $17,500 plus a fee based on average daily net assets. The administrative services fee incurred for the year ended August 31, 2018 was equivalent to an annual effective rate of 0.0186% of the fund’s average daily net assets.
Trustees’ and Officers’ Compensation – The fund pays compensation to independent Trustees in the form of a retainer, attendance fees, and additional compensation to Board and Committee chairpersons. The fund does not pay compensation directly to Trustees or officers of the fund who are also officers of the investment adviser, all of whom receive remuneration for their services to the fund from MFS. Certain officers and Trustees of the fund are officers or directors of MFS, MFD, and MFSC.
Other – This fund and certain other funds managed by MFS (the funds) have entered into a service agreement (the ISO Agreement) which provides for payment of fees solely by the funds to Tarantino LLC in return for the provision of services of an Independent Senior Officer (ISO) for the funds. Frank L. Tarantino serves as the ISO and is an officer of the funds and the sole member of Tarantino LLC. The funds can terminate the ISO Agreement with Tarantino LLC at any time under the terms of the ISO Agreement. For the year ended August 31, 2018, the fee paid by the fund under this agreement was $474 and is included in “Miscellaneous” expense in the Statement of Operations. MFS has agreed to bear all expenses associated with office space, other administrative support, and supplies provided to the ISO.
35
Notes to Financial Statements – continued
The fund invests in the MFS Institutional Money Market Portfolio which is managed by MFS and seeks current income consistent with preservation of capital and liquidity. This money market fund does not pay a management fee to MFS.
On September 22, 2016, MFS redeemed 247,280 shares of Class R6 for an aggregate amount of $2,500,000. On March 16, 2017, MFS purchased 40,526 shares of Class I for an aggregate amount of $430,382. On August 15, 2017, MFS redeemed 5,088 shares of Class I for an aggregate amount of $59,220. On August 15, 2017, MFS redeemed 16,076 shares of Class R6 for an aggregate amount of $187,129. On September 20, 2017, MFS purchased 313 shares of Class I for an aggregate amount of $3,871. On March 19, 2018, MFS redeemed 68,399 shares of Class I for an aggregate amount of $842,670.
At August 31, 2018, MFS held approximately 61%, 100%, 100%, and 100% of the outstanding shares of Class B, Class R1, Class R3, and Class R4, respectively.
The fund is permitted to engage in purchase and sale transactions with funds and accounts for which MFS serves as investment adviser or sub-adviser (“cross-trades”) pursuant to a policy adopted by the Board of Trustees. This policy has been designed to ensure that cross-trades conducted by the fund comply with Rule 17a-7 under the Investment Company Act of 1940. During the year ended August 31, 2018, the fund engaged in purchase transactions pursuant to this policy, which amounted to $192,752.
Effective on or about January 3, 2018, the adviser has voluntarily undertaken to reimburse the fund from its own resources on a quarterly basis for the cost of investment research embedded in the cost of the fund’s securities trades. This agreement may be rescinded at any time. For the period on or about January 3, 2018 to August 31, 2018, this reimbursement amounted to $18,501, which is included in “Other” income in the Statement of Operations.
(4) Portfolio Securities
For the year ended August 31, 2018, purchases and sales of investments, other than short-term obligations, aggregated $287,171,721 and $183,615,813, respectively.
(5) Shares of Beneficial Interest
The fund’s Declaration of Trust permits the Trustees to issue an unlimited number of full and fractional shares of beneficial interest. Transactions in fund shares were as follows:
| | | | | | | | | | | | | | | | |
| | | Year ended
8/31/18 | | | Year ended
8/31/17 | |
| | | Shares | | | Amount | | | Shares | | | Amount | |
| Shares sold | | | | | | | | | | | | | | | | |
Class A | | | 8,773,664 | | | | $107,427,453 | | | | 32,427 | | | | $340,094 | |
Class B | | | 1,742 | | | | 21,300 | | | | 3,929 | | | | 42,473 | |
Class C | | | 13,475 | | | | 163,178 | | | | 6,235 | | | | 66,995 | |
Class I | | | 127,703 | | | | 1,577,117 | | | | 83,035 | | | | 873,923 | |
Class R2 | | | 9,083 | | | | 110,819 | | | | — | | | | — | |
Class R6 | | | 4,993,393 | | | | 60,127,927 | | | | 3,192,064 | | | | 33,150,497 | |
| | | 13,919,060 | | | | $169,427,794 | | | | 3,317,690 | | | | $34,473,982 | |
36
Notes to Financial Statements – continued
| | | | | | | | | | | | | | | | |
| | | Year ended
8/31/18 | | | Year ended
8/31/17 | |
| | | Shares | | | Amount | | | Shares | | | Amount | |
| Shares issued to shareholders in reinvestment of distributions | | | | | | | | | | | | | | | | |
Class A | | | 2,093 | | | | $24,995 | | | | 87 | | | | $857 | |
Class B | | | 121 | | | | 1,447 | | | | — | | | | — | |
Class C | | | 366 | | | | 4,345 | | | | — | | | | — | |
Class I | | | 3,065 | | | | 36,689 | | | | 410 | | | | 4,033 | |
Class R1 | | | 89 | | | | 1,058 | | | | — | | | | — | |
Class R2 | | | 111 | | | | 1,341 | | | | 2 | | | | 20 | |
Class R3 | | | 124 | | | | 1,484 | | | | — | | | | — | |
Class R4 | | | 137 | | | | 1,639 | | | | 26 | | | | 261 | |
Class R6 | | | 475,786 | | | | 5,699,923 | | | | 96,030 | | | | 944,932 | |
| | | 481,892 | | | | $5,772,921 | | | | 96,555 | | | | $950,103 | |
| | | | |
| Shares reacquired | | | | | | | | | | | | | | | | |
Class A | | | (1,293,378 | ) | | | $(15,767,289 | ) | | | (1,495 | ) | | | $(15,688 | ) |
Class B | | | (2,808 | ) | | | (33,914 | ) | | | (95 | ) | | | (1,002 | ) |
Class C | | | (648 | ) | | | (7,733 | ) | | | (1,037 | ) | | | (9,924 | ) |
Class I | | | (87,251 | ) | | | (1,069,597 | ) | | | (42,493 | ) | | | (474,667 | ) |
Class R6 | | | (4,414,806 | ) | | | (53,810,463 | ) | | | (3,334,592 | ) | | | (35,487,174 | ) |
| | | (5,798,891 | ) | | | $(70,688,996 | ) | | | (3,379,712 | ) | | | $(35,988,455 | ) |
| | | | |
| Net change | | | | | | | | | | | | | | | | |
Class A | | | 7,482,379 | | | | $91,685,159 | | | | 31,019 | | | | $325,263 | |
Class B | | | (945 | ) | | | (11,167 | ) | | | 3,834 | | | | 41,471 | |
Class C | | | 13,193 | | | | 159,790 | | | | 5,198 | | | | 57,071 | |
Class I | | | 43,517 | | | | 544,209 | | | | 40,952 | | | | 403,289 | |
Class R1 | | | 89 | | | | 1,058 | | | | — | | | | — | |
Class R2 | | | 9,194 | | | | 112,160 | | | | 2 | | | | 20 | |
Class R3 | | | 124 | | | | 1,484 | | | | — | | | | — | |
Class R4 | | | 137 | | | | 1,639 | | | | 26 | | | | 261 | |
Class R6 | | | 1,054,373 | | | | 12,017,387 | | | | (46,498 | ) | | | (1,391,745 | ) |
| | | 8,602,061 | | | | $104,511,719 | | | | 34,533 | | | | $(564,370 | ) |
Class T shares were not publicly available for sale during the period. Please see the fund’s prospectus for details.
The fund is one of several mutual funds in which certain MFS funds may invest. The MFS funds do not invest in the underlying funds for the purpose of exercising management or control. At the end of the period, the MFS Lifetime 2040 Fund, the MFS Lifetime 2030 Fund, the MFS Lifetime 2050 Fund, the MFS Lifetime 2035 Fund, the MFS Lifetime 2045 Fund, the MFS Lifetime Income Fund, the MFS Lifetime 2025 Fund, the MFS Lifetime 2020 Fund, and the MFS Lifetime 2055 Fund were the owners of record of approximately 16%, 14%, 8%, 8%, 7%, 5%, 4%, 4%, and 3%, respectively, of the value of outstanding voting shares of the fund. In addition, the MFS Lifetime 2060 Fund was the owner of record of less than 1% of the value of outstanding voting shares of the fund.
37
Notes to Financial Statements – continued
(6) Line of Credit
The fund and certain other funds managed by MFS participate in a $1.25 billion unsecured committed line of credit, subject to a $1 billion sublimit, provided by a syndication of banks under a credit agreement. Borrowings may be made for temporary financing needs. Interest is charged to each fund, based on its borrowings, generally at a rate equal to the higher of the Overnight Bank Funding rate or daily one month LIBOR plus an agreed upon spread. A commitment fee, based on the average daily, unused portion of the committed line of credit, is allocated among the participating funds. In addition, the fund and other funds managed by MFS have established unsecured uncommitted borrowing arrangements with certain banks for temporary financing needs. Interest is charged to each fund, based on its borrowings, at a rate equal to the Overnight Bank Funding rate plus an agreed upon spread. For the year ended August 31, 2018, the fund’s commitment fee and interest expense were $1,537 and $0, respectively, and are included in “Miscellaneous” expense in the Statement of Operations.
(7) Investments in Affiliated Issuers
An affiliated issuer may be considered one in which the fund owns 5% or more of the outstanding voting securities, or a company which is under common control. For the purposes of this report, the fund assumes the following to be affiliated issuers:
| | | | | | | | | | | | | | | | | | | | |
| Affiliated Issuers | | | | | Beginning
Shares/Par
Amount | | | Acquisitions
Shares/Par
Amount | | | Dispositions
Shares/Par
Amount | | | Ending
Shares/Par
Amount | |
| MFS Institutional Money Market Portfolio | | | | | | | 1,552,926 | | | | 164,371,980 | | | | (164,924,444 | ) | | | 1,000,462 | |
| | | | | |
| Affiliated Issuers | | Realized
Gain (Loss) | | | Change in
Unrealized
Appreciation/
Depreciation | | | Capital Gain
Distributions | | | Dividend
Income | | | Ending
Value | |
| MFS Institutional Money Market Portfolio | | | $(1,745 | ) | | | $(15 | ) | | | $— | | | | $63,022 | | | | $1,000,462 | |
38
REPORT OF INDEPENDENT REGISTERED PUBLIC ACCOUNTING FIRM
To the Shareholders of MFS Blended Research International Equity Fund and the Board of Trustees of MFS Series Trust IV
Opinion on the Financial Statements
We have audited the accompanying statement of assets and liabilities of MFS Blended Research International Equity Fund (the “Fund”) (one of the funds constituting the MFS Series Trust IV (the “Trust”)), including the portfolio of investments, as of August 31, 2018, and the related statement of operations for the year then ended, the statements of changes in net assets for each of the two years in the period then ended, the financial highlights for each of the two years in the period then ended and the period from September 15, 2015 (commencement of operations) through August 31, 2016 and the related notes (collectively referred to as the “financial statements”). In our opinion, the financial statements present fairly, in all material respects, the financial position of the Fund (one of the funds constituting the MFS Series Trust IV) at August 31, 2018, the results of its operations for the year then ended, the changes in its net assets for each of the two years in the period then ended and its financial highlights for each of the two years in the period then ended and the period from September 15, 2015 (commencement of operations) through August 31, 2016, in conformity with U.S. generally accepted accounting principles.
Basis for Opinion
These financial statements are the responsibility of the Trust’s management. Our responsibility is to express an opinion on the Fund’s financial statements based on our audits. We are a public accounting firm registered with the Public Company Accounting Oversight Board (United States) (“PCAOB”) and are required to be independent with respect to the Trust in accordance with the U.S. federal securities laws and the applicable rules and regulations of the Securities and Exchange Commission and the PCAOB.
We conducted our audits in accordance with the standards of the PCAOB. Those standards require that we plan and perform the audit to obtain reasonable assurance about whether the financial statements are free of material misstatement, whether due to error or fraud. The Trust is not required to have, nor were we engaged to perform, an audit of the Trust’s internal control over financial reporting. As part of our audits we are required to obtain an understanding of internal control over financial reporting but not for the purpose of expressing an opinion on the effectiveness of the Trust’s internal control over financial reporting. Accordingly, we express no such opinion.
Our audits included performing procedures to assess the risks of material misstatement of the financial statements, whether due to error or fraud, and performing procedures that respond to those risks. Such procedures included examining, on a test basis, evidence regarding the amounts and disclosures in the financial statements. Our procedures included confirmation of securities owned as of August 31, 2018, by correspondence with the custodian and others. Our audits also included evaluating the
39
Report of Independent Registered Public Accounting Firm – continued
accounting principles used and significant estimates made by management, as well as evaluating the overall presentation of the financial statements. We believe that our audits provide a reasonable basis for our opinion.

We have served as the auditor of one or more MFS investment companies since 1993.
Boston, Massachusetts
October 16, 2018
40
TRUSTEES AND OFFICERS —
IDENTIFICATION AND BACKGROUND
The Trustees and Officers of the Trust, as of October 1, 2018, are listed below, together with their principal occupations during the past five years. (Their titles may have varied during that period.) The address of each Trustee and Officer is 111 Huntington Avenue, Boston, Massachusetts 02199-7618.
| | | | | | | | | | |
Name, Age | | Position(s)
Held with Fund | | Trustee/Officer Since (h) | | Number of
MFS Funds
overseen by the Trustee | | Principal
Occupations During the Past Five Years | | Other Directorships During the Past Five Years (j) |
| INTERESTED TRUSTEES |
Robert J. Manning (k)
(age 54) | | Trustee | | February 2004 | | 135 | | Massachusetts Financial Services Company, Executive Chairman (since January 2017); Director; Chairman of the Board; Chief Executive Officer (until 2015); Co-Chief Executive Officer (2015-2016) | | N/A |
Robin A. Stelmach (k)
(age 57) | | Trustee | | January 2014 | | 135 | | Massachusetts Financial Services Company, Vice Chair (since January 2017); Chief Operating Officer and Executive Vice President (until January 2017) | | N/A |
| INDEPENDENT TRUSTEES |
John P. Kavanaugh
(age 63) | | Trustee and Chair of Trustees | | January 2009 | | 135 | | Private investor | | N/A |
Steven E. Buller
(age 67) | | Trustee | | February 2014 | | 135 | | Financial Accounting Standards Advisory Council, Chairman (2014-2015); Public Company Accounting Oversight Board, Standing Advisory Group, Member (until 2014); BlackRock, Inc. (investment management), Managing Director (until 2014), BlackRock Finco UK (investment management), Director (until 2014) | | N/A |
41
Trustees and Officers – continued
| | | | | | | | | | |
Name, Age | | Position(s)
Held with Fund | | Trustee/Officer Since (h) | | Number of
MFS Funds
overseen by the Trustee | | Principal
Occupations During the Past Five Years | | Other Directorships During the Past Five Years (j) |
John A. Caroselli
(age 64) | | Trustee | | March 2017 | | 135 | | JC Global Advisors, LLC (management consulting), President (since 2015); First Capital Corporation (commercial finance), Executive Vice President (until 2015) | | N/A |
Maureen R. Goldfarb
(age 63) | | Trustee | | January 2009 | | 135 | | Private investor | | N/A |
Michael Hegarty
(age 73) | | Trustee | | December 2004 | | 135 | | Private investor | | Rouse Properties Inc., Director (until 2016); Capmark Financial Group Inc., Director (until 2015) |
Clarence Otis, Jr.
(age 62) | | Trustee | | March 2017 | | 135 | | Darden Restaurants, Inc., Chief Executive Officer (until 2014) | | VF Corporation, Director; Verizon Communications, Inc., Director; The Travelers Companies, Director; Federal Reserve Bank of Atlanta, Director (until 2015) |
Maryanne L. Roepke
(age 62) | | Trustee | | May 2014 | | 135 | | American Century Investments (investment management), Senior Vice President and Chief Compliance Officer (until 2014) | | N/A |
Laurie J. Thomsen
(age 61) | | Trustee | | March 2005 | | 135 | | Private investor | | The Travelers Companies, Director; Dycom Industries, Inc., Director (since 2015) |
42
Trustees and Officers – continued
| | | | | | | | |
Name, Age | | Position(s) Held with Fund | | Trustee/Officer
Since (h) | | Number of MFS Funds for which the Person is an Officer | | Principal
Occupations During the Past Five Years |
| OFFICERS | | | | | | | | |
Christopher R. Bohane (k)
(age 44) | | Assistant Secretary and Assistant Clerk | | July 2005 | | 135 | | Massachusetts Financial Services Company, Vice President and Assistant General Counsel |
Kino Clark (k)
(age 50) | | Assistant Treasurer | | January 2012 | | 135 | | Massachusetts Financial Services Company, Vice President |
John W. Clark, Jr. (k)
(age 51) | | Assistant Treasurer | | April 2017 | | 135 | | Massachusetts Financial Services Company, Vice President (since March 2017); Deutsche Bank (financial services), Department Head – Treasurer’s Office (until February 2017) |
Thomas H. Connors (k)
(age 59) | | Assistant Secretary and Assistant Clerk | | September 2012 | | 135 | | Massachusetts Financial Services Company, Vice President and Senior Counsel |
Ethan D. Corey (k)
(age 54) | | Assistant Secretary and Assistant Clerk | | July 2005 | | 135 | | Massachusetts Financial Services Company, Senior Vice President and Associate General Counsel |
David L. DiLorenzo (k)
(age 50) | | President | | July 2005 | | 135 | | Massachusetts Financial Services Company, Senior Vice President |
43
Trustees and Officers – continued
| | | | | | | | |
Name, Age | | Position(s) Held with Fund | | Trustee/Officer
Since (h) | | Number of MFS Funds for which the Person is an Officer | | Principal
Occupations During the Past Five Years |
Heidi W. Hardin (k)
(age 51) | | Secretary and Clerk | | April 2017 | | 135 | | Massachusetts Financial Services Company, Executive Vice President and General Counsel (since March 2017); Harris Associates (investment management), General Counsel (from September 2015 to January 2017); Janus Capital Management LLC (investment management), Senior Vice President and General Counsel (until September 2015) |
Brian E. Langenfeld (k)
(age 45) | | Assistant Secretary and Assistant Clerk | | June 2006 | | 135 | | Massachusetts Financial Services Company, Vice President and Senior Counsel |
| Amanda S. Mooradian (k) (age 39) | | Assistant Secretary and Assistant Clerk | | September 2018 | | 135 | | Massachusetts Financial Services Company, Assistant Vice President and Counsel |
Susan A. Pereira (k)
(age 47) | | Assistant Secretary and Assistant Clerk | | July 2005 | | 135 | | Massachusetts Financial Services Company, Vice President and Senior Counsel |
Kasey L. Phillips (k)
(age 47) | | Assistant Treasurer | | September 2012 | | 135 | | Massachusetts Financial Services Company, Vice President |
Matthew A. Stowe (k)
(age 43) | | Assistant Secretary and Assistant Clerk | | October 2014 | | 135 | | Massachusetts Financial Services Company, Vice President and Assistant General Counsel |
44
Trustees and Officers – continued
| | | | | | | | |
Name, Age | | Position(s) Held with Fund | | Trustee/Officer
Since (h) | | Number of MFS Funds for which the Person is an Officer | | Principal
Occupations During the Past Five Years |
Frank L. Tarantino
(age 74) | | Independent
Senior Officer | | June 2004 | | 135 | | Tarantino LLC (provider of compliance services), Principal |
Richard S. Weitzel (k)
(age 48) | | Assistant Secretary and Assistant Clerk | | October 2007 | | 135 | | Massachusetts Financial Services Company, Senior Vice President and Associate General Counsel |
Martin J. Wolin (k)
(age 51) | | Chief Compliance Officer | | July 2015 | | 135 | | Massachusetts Financial Services Company, Senior Vice President and Chief Compliance Officer (since July 2015); Mercer (financial service provider), Chief Risk and Compliance Officer, North America and Latin America (until June 2015) |
James O. Yost (k)
(age 58) | | Treasurer | | September 1990 | | 135 | | Massachusetts Financial Services Company, Senior Vice President |
| (h) | Date first appointed to serve as Trustee/officer of an MFS Fund. Each Trustee has served continuously since appointment unless indicated otherwise. For the period from December 15, 2004 until February 22, 2005, Mr. Manning served as Advisory Trustee. From January 2012 through December 2016, Messrs. DiLorenzo and Yost served as Treasurer and Deputy Treasurer of the Funds, respectively. |
| (j) | Directorships or trusteeships of companies required to report to the Securities and Exchange Commission (i.e., “public companies”). |
| (k) | “Interested person” of the Trust within the meaning of the Investment Company Act of 1940 (referred to as the 1940 Act), which is the principal federal law governing investment companies like the fund, as a result of a position with MFS. The address of MFS is 111 Huntington Avenue, Boston, Massachusetts 02199-7618. |
Each Trustee has been elected by shareholders and each Trustee and officer holds office until his or her successor is chosen and qualified or until his or her earlier death, resignation, retirement or removal. The Trust does not hold annual meetings for the purpose of electing Trustees, and Trustees are not elected for fixed terms. Under the terms of the Board’s retirement policy, an Independent Trustee shall retire at the end of
45
Trustees and Officers – continued
the calendar year in which he or she reaches the earlier of 75 years of age or 15 years of service on the Board (or, in the case of any Independent Trustee who joined the Board prior to 2015, 20 years of service on the Board).
Messrs. Buller and Otis and Ms. Roepke are members of the Trust’s Audit Committee.
Each of the Interested Trustees and certain Officers hold comparable officer positions with certain affiliates of MFS.
The Statement of Additional Information for a Fund includes further information about the Trustees and is available without charge upon request by calling 1-800-225-2606.
| | |
| Investment Adviser | | Custodian |
Massachusetts Financial Services Company
111 Huntington Avenue Boston, MA 02199-7618 | | State Street Bank and Trust Company 1 Lincoln Street Boston, MA 02111-2900 |
| Distributor | | Independent Registered Public Accounting Firm |
MFS Fund Distributors, Inc.
111 Huntington Avenue Boston, MA 02199-7618 | | Ernst & Young LLP 200 Clarendon Street Boston, MA 02116 |
| Portfolio Manager(s) | | |
| Jim Fallon | | |
| Matt Krummell | | |
| Jonathan Sage | | |
| Jed Stocks | | |
46
BOARD REVIEW OF INVESTMENT ADVISORY AGREEMENT
The Investment Company Act of 1940 requires that both the full Board of Trustees and a majority of the non-interested (“independent”) Trustees, voting separately, annually approve the continuation of the Fund’s investment advisory agreement with MFS. The Trustees consider matters bearing on the Fund and its advisory arrangements at their meetings throughout the year, including a review of performance data at each regular meeting. In addition, the independent Trustees met several times over the course of three months beginning in May and ending in July, 2018 (“contract review meetings”) for the specific purpose of considering whether to approve the continuation of the investment advisory agreement for the Fund and the other investment companies that the Board oversees (the “MFS Funds”). The independent Trustees were assisted in their evaluation of the Fund’s investment advisory agreement by independent legal counsel, from whom they received separate legal advice and with whom they met separately from MFS during various contract review meetings. The independent Trustees were also assisted in this process by the MFS Funds’ Independent Senior Officer, a senior officer appointed by and reporting to the independent Trustees.
In connection with their deliberations regarding the continuation of the investment advisory agreement, the Trustees, including the independent Trustees, considered such information and factors as they believed, in light of the legal advice furnished to them and their own business judgment, to be relevant. The investment advisory agreement for the Fund was considered separately, although the Trustees also took into account the common interests of all MFS Funds in their review. As described below, the Trustees considered the nature, quality, and extent of the various investment advisory, administrative, and shareholder services performed by MFS under the existing investment advisory agreement and other arrangements with the Fund.
In connection with their contract review meetings, the Trustees received and relied upon materials that included, among other items: (i) information provided by Broadridge Financial Solutions, Inc. (“Broadridge”), an independent third party, on the investment performance of the Fund for the one-year period ended December 31, 2017 and the investment performance of a group of funds with substantially similar investment classifications/objectives (the “Broadridge performance universe”), (ii) information provided by Broadridge on the Fund’s advisory fees and other expenses and the advisory fees and other expenses of comparable funds identified by Broadridge (the “Broadridge expense group”), (iii) information provided by MFS on the advisory fees of portfolios of other clients of MFS, including institutional separate accounts and other clients, (iv) information as to whether and to what extent applicable expense waivers, reimbursements or fee “breakpoints” are observed for the Fund, (v) information regarding MFS’ financial results and financial condition, including MFS’ and certain of its affiliates’ estimated profitability from services performed for the Fund and the MFS Funds as a whole, and compared to MFS’ institutional business, (vi) MFS’ views regarding the outlook for the mutual fund industry and the strategic business plans of MFS, (vii) descriptions of various functions performed by MFS for the Funds, such as compliance monitoring and portfolio trading practices, and (viii) information regarding the overall organization of MFS, including information about MFS’ senior management and other personnel providing investment advisory,
47
Board Review of Investment Advisory Agreement – continued
administrative and other services to the Fund and the other MFS Funds. The comparative performance, fee and expense information prepared and provided by Broadridge was not independently verified and the independent Trustees did not independently verify any information provided to them by MFS.
The Trustees’ conclusion as to the continuation of the investment advisory agreement was based on a comprehensive consideration of all information provided to the Trustees and not the result of any single factor. Some of the factors that figured particularly in the Trustees’ deliberations are described below, although individual Trustees may have evaluated the information presented differently from one another, giving different weights to various factors. It is also important to recognize that the fee arrangements for the Fund and other MFS Funds are the result of years of review and discussion between the independent Trustees and MFS, that certain aspects of such arrangements may receive greater scrutiny in some years than in others, and that the Trustees’ conclusions may be based, in part, on their consideration of these same arrangements during the course of the year and in prior years.
Based on information provided by Broadridge and MFS, the Trustees reviewed the Fund’s total return investment performance as well as the Broadridge performance universe over the one-year period ended December 31, 2017. The total return performance of the Fund’s Class A shares was in the 2nd quintile relative to the other funds in the universe for this one-year period (the 1st quintile being the best performers and the 5th quintile being the worst performers). The Fund commenced operations on September 15, 2015, and has a limited operating history and performance record; therefore no performance data for the three- or five-year periods was available. Because of the passage of time, these performance results may differ from the performance results for more recent periods, including those shown elsewhere in this report.
In the course of their deliberations, the Trustees took into account information provided by MFS in connection with the contract review meetings, as well as during investment review meetings conducted with portfolio management personnel during the course of the year regarding the Fund’s performance. After reviewing these and related factors, the Trustees concluded, within the context of their overall conclusions regarding the investment advisory agreement, that they were satisfied with MFS’ responses and efforts relating to investment performance.
In assessing the reasonableness of the Fund’s advisory fee, the Trustees considered, among other information, the Fund’s advisory fee and the total expense ratio of the Fund’s Class A shares as a percentage of average daily net assets and the advisory fee and total expense ratios of peer groups of funds based on information provided by Broadridge. The Trustees considered that MFS currently observes an expense limitation for the Fund, which may not be changed without the Trustees’ approval. The Trustees also considered that, according to the data provided by Broadridge (which takes into account any fee reductions or expense limitations that were in effect during the Fund’s last fiscal year), the Fund’s effective advisory fee rate and total expense ratio were each lower than the Broadridge expense group median.
The Trustees also considered the advisory fees charged by MFS to any institutional separate accounts advised by MFS (“separate accounts”) and unaffiliated investment
48
Board Review of Investment Advisory Agreement – continued
companies for which MFS serves as subadviser (“subadvised funds”) that have comparable investment strategies to the Fund, if any. In comparing these fees, the Trustees considered information provided by MFS as to the generally broader scope of services provided by MFS to the Fund, as well as the more extensive regulatory burdens imposed on MFS in managing the Fund, in comparison to separate accounts and subadvised funds. The Trustees also considered the higher demands placed on MFS’ investment personnel and trading infrastructure as a result of the daily cash in-flows and out-flows of the Fund in comparison to separate accounts.
The Trustees also considered whether the Fund may benefit from any economies of scale in the management of the Fund in the event of growth in assets of the Fund and/or growth in assets of the MFS Funds as a whole. They noted that the Fund’s advisory fee rate schedule is subject to contractual breakpoints that reduce the Fund’s advisory fee rate on average daily net assets over $1 billion and $2.5 billion. The Trustees also noted that MFS has agreed in writing to waive a portion of the management fees of certain MFS Funds, including the Fund, if the total combined assets of certain funds within the MFS Funds’ complex increase above agreed upon thresholds (the “group fee waiver”), enabling the Fund’s shareholders to share in the benefits from any economies of scale at the complex level. The group fee waiver is reviewed and renewed annually between the Board and MFS. The Trustees concluded that the breakpoints and the group fee waiver were sufficient to allow the Fund to benefit from economies of scale as its assets and overall complex assets grow.
The Trustees also considered information prepared by MFS relating to MFS’ costs and profits with respect to the Fund, the MFS Funds considered as a group, and other investment companies and accounts advised by MFS, as well as MFS’ methodologies used to determine and allocate its costs to the MFS Funds, the Fund and other accounts and products for purposes of estimating profitability.
After reviewing these and other factors described herein, the Trustees concluded, within the context of their overall conclusions regarding the investment advisory agreement, that the advisory fees charged to the Fund represent reasonable compensation in light of the services being provided by MFS to the Fund.
In addition, the Trustees considered MFS’ resources and related efforts to continue to retain, attract and motivate capable personnel to serve the Fund. The Trustees also considered current and developing conditions in the financial services industry, including the presence of large and well-capitalized companies which are spending, and appear to be prepared to continue to spend, substantial sums to engage personnel and to provide services to competing investment companies. In this regard, the Trustees also considered the financial resources of MFS and its ultimate parent, Sun Life Financial Inc. The Trustees also considered the advantages and possible disadvantages to the Fund of having an adviser that also serves other investment companies as well as other accounts.
The Trustees also considered the nature, quality, cost, and extent of administrative, transfer agency, and distribution services provided to the Fund by MFS and its affiliates under agreements and plans other than the investment advisory agreement, including any 12b-1 fees the Fund pays to MFS Fund Distributors, Inc., an affiliate of MFS. The Trustees also considered the nature, extent and quality of certain other services MFS
49
Board Review of Investment Advisory Agreement – continued
performs or arranges for on the Fund’s behalf, which may include securities lending programs, directed expense payment programs, class action recovery programs, and MFS’ interaction with third-party service providers, principally custodians and sub-custodians. The Trustees concluded that the various non-advisory services provided by MFS and its affiliates on behalf of the Fund were satisfactory.
The Trustees considered so-called “fall-out benefits” to MFS such as reputational value derived from serving as investment manager to the MFS Funds. The Trustees also considered that, effective January 3, 2018, MFS had discontinued its historic practice of obtaining investment research from portfolio brokerage commissions paid by certain MFS Funds and would thereafter voluntarily reimburse a Fund, if applicable, for the costs of external research acquired through the use of the Fund’s portfolio brokerage commissions.
Based on their evaluation of factors that they deemed to be material, including those factors described above, the Board of Trustees, including the independent Trustees, concluded that the Fund’s investment advisory agreement with MFS should be continued for an additional one-year period, commencing August 1, 2018.
50
PROXY VOTING POLICIES AND INFORMATION
MFS votes proxies on behalf of the fund pursuant to proxy voting policies and procedures that are available without charge, upon request, by calling 1-800-225-2606, by visiting mfs.com/proxyvoting, or by visiting the SEC’s Web site at http://www.sec.gov.
Information regarding how the fund voted proxies relating to portfolio securities during the most recent twelve-month period ended June 30 is available by August 31 of each year without charge by visiting mfs.com/proxyvoting, or by visiting the SEC’s Web site at http://www.sec.gov.
QUARTERLY PORTFOLIO DISCLOSURE
The fund files a complete schedule of portfolio holdings with the Securities and Exchange Commission (the Commission) for the first and third quarters of each fiscal year on Form N-Q. A shareholder can obtain the quarterly portfolio holdings report at mfs.com. The fund’s Form N-Q is also available on the EDGAR database on the Commission’s Internet Web site at http://www.sec.gov, and may be reviewed and copied at the:
Public Reference Room
Securities and Exchange Commission
100 F Street, NE, Room 1580
Washington, D.C. 20549
Information on the operation of the Public Reference Room may be obtained by calling the Commission at 1-800-SEC-0330. Copies of the fund’s Form N-Q also may be obtained, upon payment of a duplicating fee, by electronic request at the following e-mail address: publicinfo@sec.gov or by writing the Public Reference Section at the above address.
FURTHER INFORMATION
From time to time, MFS may post important information about the fund or the MFS funds on the MFS web site (mfs.com). This information is available at https://www.mfs.com/en-us/what-we-do/announcements.html or at mfs.com/openendfunds by choosing the fund’s name.
51
INFORMATION ABOUT FUND CONTRACTS AND LEGAL CLAIMS
The fund has entered into contractual arrangements with an investment adviser, administrator, distributor, shareholder servicing agent, 529 program manager (if applicable), and custodian who each provide services to the fund. Unless expressly stated otherwise, shareholders are not parties to, or intended beneficiaries of these contractual arrangements, and these contractual arrangements are not intended to create any shareholder right to enforce them against the service providers or to seek any remedy under them against the service providers, either directly or on behalf of the fund.
Under the Trust’s By-Laws and Declaration of Trust, any claims asserted against or on behalf of the MFS Funds, including claims against Trustees and Officers, must be brought in state and federal courts located within the Commonwealth of Massachusetts.
FEDERAL TAX INFORMATION (unaudited)
The fund will notify shareholders of amounts for use in preparing 2018 income tax forms in January 2019. The following information is provided pursuant to provisions of the Internal Revenue Code.
The fund designates $1,836,000 as capital gain dividends paid during the fiscal year.
The fund designates the maximum amount allowable as qualified dividend income eligible to be taxed at the same rate as long-term capital gain.
Income derived from foreign sources was $9,596,229. The fund intends to pass through foreign tax credits of $939,266 for the fiscal year.
52
rev. 3/16
| | | | |
| | | |
FACTS | | WHAT DOES MFS DO WITH YOUR PERSONAL INFORMATION? | |  |
| | |
| Why? | | Financial companies choose how they share your personal information. Federal law gives consumers the right to limit some but not all sharing. Federal law also requires us to tell you how we collect, share, and protect your personal information. Please read this notice carefully to understand what we do. |
| | |
| What? | | The types of personal information we collect and share depend on the product or service you have with us. This information can include: • Social Security number and account balances • Account transactions and transaction history • Checking account information and wire transfer instructions When you are no longer our customer, we continue to share your information as described in this notice. |
| | |
| How? | | All financial companies need to share customers’ personal information to run their everyday business. In the section below, we list the reasons financial companies can share their customers’ personal information; the reasons MFS chooses to share; and whether you can limit this sharing. |
| | | | |
Reasons we can share your
personal information | | Does MFS
share? | | Can you limit
this sharing? |
For our everyday business purposes – such as to process your transactions, maintain your account(s), respond to court orders and legal investigations, or report to credit bureaus | | Yes | | No |
For our marketing purposes – to offer our products and services to you | | No | | We don’t share |
For joint marketing with other financial companies | | No | | We don’t share |
For our affiliates’ everyday business purposes – information about your transactions and experiences | | No | | We don’t share |
For our affiliates’ everyday business purposes – information about your creditworthiness | | No | | We don’t share |
| For nonaffiliates to market to you | | No | | We don’t share |
| | |
| Questions? | | Call 800-225-2606 or go to mfs.com. |
53
| | |
| Who we are |
| Who is providing this notice? | | MFS Funds, MFS Investment Management, MFS Institutional Advisors, Inc., and MFS Heritage Trust Company. |
| | |
| What we do |
| How does MFS protect my personal information? | | To protect your personal information from unauthorized access and use, we use security measures that comply with federal law. These measures include procedural, electronic, and physical safeguards for the protection of the personal information we collect about you. |
| How does MFS collect my personal information? | | We collect your personal information, for example, when you • open an account or provide account information • direct us to buy securities or direct us to sell your securities • make a wire transfer We also collect your personal information from others, such as credit bureaus, affiliates, or other companies. |
| Why can’t I limit all sharing? | | Federal law gives you the right to limit only • sharing for affiliates’ everyday business purposes – information about your creditworthiness • affiliates from using your information to market to you • sharing for nonaffiliates to market to you State laws and individual companies may give you additional rights to limit sharing. |
| | |
| Definitions |
| Affiliates | | Companies related by common ownership or control. They can be financial and nonfinancial companies. • MFS does not share personal information with affiliates, except for everyday business purposes as described on page one of this notice. |
| Nonaffiliates | | Companies not related by common ownership or control. They can be financial and nonfinancial companies. • MFS does not share with nonaffiliates so they can market to you. |
| Joint marketing | | A formal agreement between nonaffiliated financial companies that together market financial products or services to you. �� • MFS doesn’t jointly market. |
| | |
| Other important information |
| If you own an MFS product or receive an MFS service in the name of a third party such as a bank or broker-dealer, their privacy policy may apply to you instead of ours. |
54
Save paper with eDelivery.

| MFS® will send you prospectuses, |
reports, and proxies directly via e-mail so you will get information faster with less mailbox clutter.
To sign up:
1. Go to mfs.com.
2. Log in via MFS® Access.
3. Select eDelivery.
If you own your MFS fund shares through a financial institution or a retirement plan, MFS® TALK, MFS® Access, or eDelivery may not be available to you.
CONTACT
WEB SITE
mfs.com
MFS TALK
1-800-637-8255
24 hours a day
ACCOUNT SERVICE AND LITERATURE
Shareholders
1-800-225-2606
Financial advisors
1-800-343-2829
Retirement plan services
1-800-637-1255
MAILING ADDRESS
MFS Service Center, Inc.
P.O. Box 55824
Boston, MA 02205-5824
OVERNIGHT MAIL
MFS Service Center, Inc.
c/o DST Asset Manager Solutions, Inc.
30 Dan Road
Canton, MA 02021-2809
Annual Report
August 31, 2018

MFS® Global New Discovery Fund

GND-ANN
MFS® Global New Discovery Fund
CONTENTS
The report is prepared for the general information of shareholders.
It is authorized for distribution to prospective investors only when preceded or accompanied by a current prospectus.
NOT FDIC INSURED • MAY LOSE VALUE • NO BANK GUARANTEE

LETTER FROM THE EXECUTIVE CHAIRMAN
Dear Shareholders:
The strengthening U.S. dollar, international trade friction and geopolitical uncertainty have contributed to a measurable uptick in market volatility in recent quarters — a
departure from the low-volatility environment that prevailed for much of 2017. Against this more challenging backdrop, global markets have become less synchronized, with equity markets in the United States outperforming most international markets. Global economic growth remains healthy, notwithstanding signs of a modest slowdown over the past few months, particularly in Europe, China and some emerging markets.
Although the U.S. Federal Reserve continues to gradually raise interest rates and shrink its balance sheet, monetary policy remains accommodative around the world, with many central
banks taking only tentative steps toward tighter policies. Newly enacted U.S. tax reforms have been welcomed by equity markets while emerging market economies have recently had to contend with tighter financial conditions as a result of firmer U.S. Treasury yields and a stronger dollar. Around the world, inflation remains largely subdued, but tight labor markets and solid global demand have investors on the lookout for its potential reappearance. Increased U.S. protectionism is also a growing concern, as investors fear that trade disputes could dampen business sentiment, leading to slower global growth.
As a global investment manager with nearly a century of expertise, MFS® firmly believes that active risk management offers downside mitigation and may help improve investment outcomes, and we built our active investment platform with that in mind. Our long-term perspective influences nearly every aspect of our business, but most importantly, it aligns our investment decisions with clients’ investing time horizons.
Respectfully,

Robert J. Manning
Executive Chairman
MFS Investment Management
October 16, 2018
The opinions expressed in this letter are subject to change and may not be relied upon for investment advice. No forecasts can be guaranteed.
1
PORTFOLIO COMPOSITION
Portfolio structure
| | | | |
| Top ten holdings | | | | |
| OBIC Co. Ltd. | | | 1.4% | |
| ICON PLC | | | 1.3% | |
| Bright Horizons Family Solutions, Inc. | | | 1.1% | |
| Symrise AG | | | 1.1% | |
| LogMeIn, Inc. | | | 1.1% | |
| NICE Systems Ltd., ADR | | | 1.1% | |
| Amadeus IT Group S.A. | | | 1.1% | |
| LISI Group | | | 1.1% | |
| Global Payments, Inc. | | | 1.0% | |
| Quidel Corp. | | | 1.0% | |
| | | | |
| Equity sectors | | | | |
| Industrial Goods & Services | | | 15.1% | |
| Special Products & Services | | | 13.4% | |
| Technology | | | 13.3% | |
| Financial Services | | | 12.2% | |
| Basic Materials | | | 10.5% | |
| Autos & Housing | | | 9.0% | |
| Health Care | | | 8.9% | |
| Retailing | | | 4.9% | |
| Leisure | | | 3.6% | |
| Transportation | | | 3.2% | |
| Consumer Staples | | | 2.8% | |
| Energy | | | 0.8% | |
| Utilities & Communications | | | 0.2% | |
|
| Issuer country weightings (x) | |
| United States | | | 48.8% | |
| Japan | | | 13.5% | |
| United Kingdom | | | 9.7% | |
| Germany | | | 4.6% | |
| France | | | 2.2% | |
| Netherlands | | | 2.0% | |
| Norway | | | 1.8% | |
| Canada | | | 1.8% | |
| Ireland | | | 1.5% | |
| Other Countries | | | 14.1% | |
2
Portfolio Composition – continued
| | | | |
|
| Currency exposure weightings (y) | |
| United States Dollar | | | 51.7% | |
| Japanese Yen | | | 13.5% | |
| Euro | | | 11.2% | |
| British Pound Sterling | | | 9.7% | |
| Norwegian Krone | | | 1.8% | |
| Mexican Peso | | | 1.5% | |
| Swiss Franc | | | 1.4% | |
| Indian Rupee | | | 1.4% | |
| Brazilian Real | | | 1.4% | |
| Other Currencies | | | 6.4% | |
| (x) | Represents the portfolio’s exposure to issuer countries as a percentage of a portfolio’s net assets. For purposes of this presentation, United States includes Cash & Cash Equivalents and Other. |
| (y) | Represents the portfolio’s exposure to a particular currency as a percentage of a portfolio’s net assets. For purposes of this presentation, United States Dollar includes Cash & Cash Equivalents and Other. |
Cash & Cash Equivalents includes any cash, investments in money market funds, short-term securities, and other assets less liabilities. Please see the Statement of Assets and Liabilities for additional information related to the fund’s cash position and other assets and liabilities.
Other includes equivalent exposure from currency derivatives and/or any offsets to derivative positions and may be negative.
Percentages are based on net assets as of August 31, 2018.
The portfolio is actively managed and current holdings may be different.
3
MANAGEMENT REVIEW
Summary of Results
For the twelve months ended August 31, 2018, Class A shares of the MFS Global New Discovery Fund (“fund”) provided a total return of 19.70%, at net asset value. This compares with a return of 12.35% for the fund’s benchmark, the MSCI All Country World Small Mid Cap Index (net div).
Market Environment
Despite headwinds from increasing global trade tensions, several US equity indices advanced to set new record highs late in the period after rebounding from a mid-period market correction. Very strong earnings per share and revenue growth, helped in part by the 2017 US tax reform package, has underpinned the advance, as has solid US economic growth. Strong fundamentals have brought US equity valuations down more in line with long-term average valuations from elevated levels early in the period. While the US economy has maintained its strength, global economic growth became less synchronized during the period, with Europe and China showing signs of a modest slowdown and some emerging markets coming under stress.
During the period, the US Federal Reserve raised interest rates by 75 basis points, bringing the total number of hikes to seven since the central bank began to normalize monetary policy in late 2015. The growth rate in the US, eurozone and Japan remained above trend, although inflation remained contained, particularly outside the US. Late in the period, the European Central Bank announced that it would halt its asset purchase program at the end of 2018, but issued forward guidance that it does not expect to raise interest rates at least until after the summer of 2019. Both the Bank of England and the Bank of Canada raised rates several times during the period. The European political backdrop became a bit more volatile late in the period, spurred by a chaotic process which resulted in the formation of an anti-establishment, Eurosceptic coalition government in Italy.
Bond yields rose in the US during the period but remained low by historical standards, while yields in many developed markets fell. Credit spreads remained relatively tight but widened modestly, late in the period, as market volatility increased. Growing concern over increasing global trade friction appeared to have weighed on business sentiment during the period’s second half, especially outside the US. Tighter financial conditions from rising US rates and a strong dollar combined with trade uncertainty helped expose structural weaknesses in several emerging markets late in the period.
Contributors to Performance
Stock selection in the special products & services sector contributed to performance relative to the MSCI All Country World Small Mid Cap Index. Here, the fund’s overweight holdings of software development company Zendesk and international school operator China Maple Leaf Educational Systems (h) (Hong Kong) aided relative performance. Shares of Zendesk rose on earnings that beat consensus estimates, driven by increased revenues. In addition, the stock benefited from raised sales guidance for the remainder of 2018.
4
Management Review – continued
Although security selection was a positive factor in the industrial goods & services sector, there were no individual stocks within this sector that were among the fund’s top relative contributors for the reporting period.
Stock selection within the technology sector further supported relative results. Here, the fund’s overweight positions in system services provider OBIC (Japan), enterprise cloud communications and collaboration services provider RingCentral and financial services software designer SS&C Technologies Holdings bolstered relative performance. Shares of OBIC outperformed the benchmark after management’s efforts to even out the seasonality of sales volumes, and strong performance from its systems integration group, fueled better-than-expected sales and earnings results. The fund’s holding of data recording products provider NICE Systems (b) (Israel) also helped relative performance.
In other sectors, the fund’s positions in retail financial services company AEON Thana Sinsap Public (b) (Thailand) and parcel delivery services company Yamato Holdings (b) (Japan) contributed to relative results. Shares of AEON Thana Sinsap Public benefited from solid earnings, driven by higher-than-expected loan growth and strong margin results. Overweighting shares of online vehicle auctioneer Copart and medical device manufacturing company DexCom (h) also benefited relative performance during the reporting period. Shares of Copart appreciated as the company delivered better-than-expected earnings results, driven by strong sales in the US, higher-than-average selling prices and increased auction bidding activity.
Detractors from Performance
Security selection in the health care sector detracted from relative performance during the reporting period. Within this sector, the fund’s overweight positions in pharmaceutical products manufacturer Selcuk Ecza Deposu (Turkey), medical electronic equipment manufacturer Fukuda Denshi (Japan) and over-the-counter pharmaceutical and personal care products manufacturer Genomma Lab Internacional (h) (Mexico) held back relative performance.
Elsewhere, the fund’s overweight positions in remote access and support solutions provider LogMeIn, suspended ceilings systems distributor GMS, engineered materials manufacturer Berry Global Group, specialty chemical producer Borregaard (Norway), global investment management firm Invesco, writing instrument manufacturer Mitsubishi Pencil (Japan) and travel retail company Dufry (Switzerland) weakened relative performance.
Respectfully,
Portfolio Manager(s)
Peter Fruzzetti and Michael Grossman
| (b) | Security is not a benchmark constituent. |
| (h) | Security was not held in the portfolio at period end. |
Note to Shareholders: Effective October 1, 2017, Paul Gordon was no longer a Portfolio Manager of the Fund.
5
Management Review – continued
The views expressed in this report are those of the portfolio manager(s) only through the end of the period of the report as stated on the cover and do not necessarily reflect the views of MFS or any other person in the MFS organization. These views are subject to change at any time based on market or other conditions, and MFS disclaims any responsibility to update such views. These views may not be relied upon as investment advice or an indication of trading intent on behalf of any MFS portfolio. References to specific securities are not recommendations of such securities, and may not be representative of any MFS portfolio’s current or future investments.
6
PERFORMANCE SUMMARY THROUGH 8/31/18
The following chart illustrates a representative class of the fund’s historical performance in comparison to its benchmark(s). Performance results include the deduction of the maximum applicable sales charge and reflect the percentage change in net asset value, including reinvestment of dividends and capital gains distributions. The performance of other share classes will be greater than or less than that of the class depicted below. Benchmarks are unmanaged and may not be invested in directly. Benchmark returns do not reflect sales charges, commissions or expenses. (See Notes to Performance Summary.)
Performance data shown represents past performance and is no guarantee of future results. Investment return and principal value fluctuate so your shares, when sold, may be worth more or less than the original cost; current performance may be lower or higher than quoted. The performance shown does not reflect the deduction of taxes, if any, that a shareholder would pay on fund distributions or the redemption of fund shares.
Growth of a Hypothetical $10,000 Investment (t)

7
Performance Summary – continued
Total Returns through 8/31/18
Average annual without sales charge
| | | | | | | | | | | | |
| | | Share Class | | Class Inception Date | | 1-yr | | 5-yr | | Life (t) | | |
| | | A | | 12/16/11 | | 19.70% | | 10.13% | | 13.98% | | |
| | | B | | 12/16/11 | | 18.83% | | 9.29% | | 13.13% | | |
| | | C | | 12/16/11 | | 18.83% | | 9.29% | | 13.13% | | |
| | | I | | 12/16/11 | | 20.01% | | 10.40% | | 14.28% | | |
| | | R1 | | 12/16/11 | | 18.77% | | 9.28% | | 13.13% | | |
| | | R2 | | 12/16/11 | | 19.47% | | 9.85% | | 13.70% | | |
| | | R3 | | 12/16/11 | | 19.72% | | 10.13% | | 13.98% | | |
| | | R4 | | 12/16/11 | | 20.05% | | 10.38% | | 14.26% | | |
| | | R6 | | 1/02/13 | | 20.09% | | 10.50% | | 12.11% | | |
| Comparative benchmark(s) | | | | | | | | |
| | | MSCI All Country World Small Mid Cap Index (net div) (f) | | 12.35% | | 10.03% | | 12.42% | | |
| Average annual with sales charge | | | | | | | | |
| | | A
With Initial Sales Charge (5.75%) | | 12.82% | | 8.83% | | 12.98% | | |
| | | B
With CDSC (Declining over six years from 4% to 0%) (v) | | 14.83% | | 9.01% | | 13.13% | | |
| | | C
With CDSC (1% for 12 months) (v) | | 17.83% | | 9.29% | | 13.13% | | |
CDSC – Contingent Deferred Sales Charge.
Class I, R1, R2, R3, R4, and R6 shares do not have a sales charge.
| (f) | Source: FactSet Research Systems Inc. |
| (t) | For the period from the class inception date through the stated period end. The comparative benchmark performance information provided for the “life” period is from the inception date of the Class A shares. (See Notes to Performance Summary.) |
| (v) | Assuming redemption at the end of the applicable period. |
Benchmark Definition(s)
MSCI All Country World Small Mid Cap Index (net div) – a free float weighted index that is designed to measure equity market performance of small and mid cap companies across global developed and emerging market countries.
It is not possible to invest directly in an index.
Notes to Performance Summary
Average annual total return represents the average annual change in value for each share class for the periods presented. Life returns are presented where the share class has less than 10 years of performance history and represent the average annual total return from the class inception date to the stated period end date. As the fund’s share classes may have different inception dates, the life returns may represent different time periods and may not be comparable.
8
Performance Summary – continued
Performance results reflect any applicable expense subsidies and waivers in effect during the periods shown. Without such subsidies and waivers the fund’s performance results would be less favorable. Please see the prospectus and financial statements for complete details.
Performance results do not include adjustments made for financial reporting purposes in accordance with U.S. generally accepted accounting principles and may differ from amounts reported in the financial highlights.
From time to time the fund may receive proceeds from litigation settlements, without which performance would be lower.
9
EXPENSE TABLE
Fund expenses borne by the shareholders during the period, March 1, 2018 through August 31, 2018
As a shareholder of the fund, you incur two types of costs: (1) transaction costs, including sales charges (loads) on certain purchase or redemption payments, and (2) ongoing costs, including management fees; distribution and service (12b-1) fees; and other fund expenses. This example is intended to help you understand your ongoing costs (in dollars) of investing in the fund and to compare these costs with the ongoing costs of investing in other mutual funds.
The example is based on an investment of $1,000 invested at the beginning of the period and held for the entire period March 1, 2018 through August 31, 2018.
Actual Expenses
The first line for each share class in the following table provides information about actual account values and actual expenses. You may use the information in this line, together with the amount you invested, to estimate the expenses that you paid over the period. Simply divide your account value by $1,000 (for example, an $8,600 account value divided by $1,000 = 8.6), then multiply the result by the number in the first line under the heading entitled “Expenses Paid During Period” to estimate the expenses you paid on your account during this period.
Hypothetical Example for Comparison Purposes
The second line for each share class in the following table provides information about hypothetical account values and hypothetical expenses based on the fund’s actual expense ratio and an assumed rate of return of 5% per year before expenses, which is not the fund’s actual return. The hypothetical account values and expenses may not be used to estimate the actual ending account balance or expenses you paid for the period. You may use this information to compare the ongoing costs of investing in the fund and other funds. To do so, compare this 5% hypothetical example with the 5% hypothetical examples that appear in the shareholder reports of the other funds.
Please note that the expenses shown in the table are meant to highlight your ongoing costs only and do not reflect any transactional costs, such as sales charges (loads). Therefore, the second line for each share class in the table is useful in comparing ongoing costs only, and will not help you determine the relative total costs of owning different funds. In addition, if these transactional costs were included, your costs would have been higher.
10
Expense Table – continued
| | | | | | | | | | | | | | | | | | |
Share
Class | | | | Annualized
Expense
Ratio | | | Beginning
Account Value
3/01/18 | | | Ending
Account Value
8/31/18 | | | Expenses
Paid During
Period (p)
3/01/18-8/31/18 | |
| A | | Actual | | | 1.50% | | | | $1,000.00 | | | | $1,072.08 | | | | $7.83 | |
| | Hypothetical (h) | | | 1.50% | | | | $1,000.00 | | | | $1,017.64 | | | | $7.63 | |
| B | | Actual | | | 2.25% | | | | $1,000.00 | | | | $1,068.18 | | | | $11.73 | |
| | Hypothetical (h) | | | 2.25% | | | | $1,000.00 | | | | $1,013.86 | | | | $11.42 | |
| C | | Actual | | | 2.25% | | | | $1,000.00 | | | | $1,068.18 | | | | $11.73 | |
| | Hypothetical (h) | | | 2.25% | | | | $1,000.00 | | | | $1,013.86 | | | | $11.42 | |
| I | | Actual | | | 1.25% | | | | $1,000.00 | | | | $1,073.78 | | | | $6.53 | |
| | Hypothetical (h) | | | 1.25% | | | | $1,000.00 | | | | $1,018.90 | | | | $6.36 | |
| R1 | | Actual | | | 2.25% | | | | $1,000.00 | | | | $1,067.65 | | | | $11.73 | |
| | Hypothetical (h) | | | 2.25% | | | | $1,000.00 | | | | $1,013.86 | | | | $11.42 | |
| R2 | | Actual | | | 1.75% | | | | $1,000.00 | | | | $1,071.14 | | | | $9.14 | |
| | Hypothetical (h) | | | 1.75% | | | | $1,000.00 | | | | $1,016.38 | | | | $8.89 | |
| R3 | | Actual | | | 1.50% | | | | $1,000.00 | | | | $1,072.11 | | | | $7.83 | |
| | Hypothetical (h) | | | 1.50% | | | | $1,000.00 | | | | $1,017.64 | | | | $7.63 | |
| R4 | | Actual | | | 1.25% | | | | $1,000.00 | | | | $1,073.71 | | | | $6.53 | |
| | Hypothetical (h) | | | 1.25% | | | | $1,000.00 | | | | $1,018.90 | | | | $6.36 | |
| R6 | | Actual | | | 1.16% | | | | $1,000.00 | | | | $1,073.63 | | | | $6.06 | |
| | Hypothetical (h) | | | 1.16% | | | | $1,000.00 | | | | $1,019.36 | | | | $5.90 | |
| (h) | 5% class return per year before expenses. |
| (p) | “Expenses Paid During Period” are equal to each class’s annualized expense ratio, as shown above, multiplied by the average account value over the period, multiplied by 184/365 (to reflect the one-half year period). Expenses paid do not include any applicable sales charges (loads). If these transaction costs had been included, your costs would have been higher. |
Notes to Expense Table
Each class with a Rule 12b-1 service fee is subject to a rebate of a portion of such fee. Such rebates are included in the expense ratios above and are outside of the expense limitation arrangement. For Class B shares, this rebate reduced the expense ratio above by 0.01%. See Note 3 in the Notes to Financial Statements for additional information.
11
PORTFOLIO OF INVESTMENTS
8/31/18
The Portfolio of Investments is a complete list of all securities owned by your fund. It is categorized by broad-based asset classes.
| | | | | | | | |
| Common Stocks - 97.7% | | | | | | | | |
| Issuer | | Shares/Par | | | Value ($) | |
| Aerospace - 5.6% | | | | | | | | |
| CACI International, Inc., “A” (a) | | | 2,621 | | | $ | 511,095 | |
| Curtiss-Wright Corp. | | | 1,945 | | | | 260,533 | |
| FLIR Systems, Inc. | | | 8,355 | | | | 524,193 | |
| Harris Corp. | | | 3,166 | | | | 514,507 | |
| LISI Group | | | 13,819 | | | | 567,830 | |
| MTU Aero Engines Holding AG | | | 1,665 | | | | 365,077 | |
| Singapore Technologies Engineering Ltd. | | | 118,300 | | | | 287,874 | |
| | | | | | | | |
| | | | | | | $ | 3,031,109 | |
| Apparel Manufacturers - 0.7% | | | | | | | | |
| Burberry Group PLC | | | 5,701 | | | $ | 165,264 | |
| Hanesbrands, Inc. | | | 11,136 | | | | 195,326 | |
| | | | | | | | |
| | | | | | | $ | 360,590 | |
| Automotive - 6.3% | | | | | | | | |
| Copart, Inc. (a) | | | 8,265 | | | $ | 531,522 | |
| Hella KGaA Hueck & Co. | | | 5,322 | | | | 321,231 | |
| KAR Auction Services, Inc. | | | 7,790 | | | | 488,355 | |
| Koito Manufacturing Co. Ltd. | | | 7,800 | | | | 482,279 | |
| LKQ Corp. (a) | | | 11,753 | | | | 405,714 | |
| Stanley Electric Co. Ltd. | | | 11,300 | | | | 391,040 | |
| Thai Stanley Electric PLC | | | 13,800 | | | | 110,889 | |
| USS Co. Ltd. | | | 15,300 | | | | 288,484 | |
| WABCO Holdings, Inc. (a) | | | 2,945 | | | | 362,471 | |
| | | | | | | | |
| | | | | | | $ | 3,381,985 | |
| Brokerage & Asset Managers - 2.1% | | | | | | | | |
| Brewin Dolphin Holdings PLC | | | 41,853 | | | $ | 196,748 | |
| Invesco Ltd. | | | 9,377 | | | | 225,986 | |
| NASDAQ, Inc. | | | 5,397 | | | | 515,090 | |
| Rathbone Brothers PLC | | | 5,587 | | | | 190,787 | |
| | | | | | | | |
| | | | | | | $ | 1,128,611 | |
| Business Services - 10.1% | | | | | | | | |
| Ahlsell AB | | | 27,040 | | | $ | 155,378 | |
| Asiakastieto Group Oyj | | | 10,078 | | | | 362,639 | |
| Auto Trader Group PLC | | | 46,191 | | | | 268,940 | |
| Bunzl PLC | | | 16,806 | | | | 522,480 | |
| Cerved Information Solutions S.p.A. | | | 25,187 | | | | 262,538 | |
| CoStar Group, Inc. (a) | | | 583 | | | | 257,779 | |
12
Portfolio of Investments – continued
| | | | | | | | |
| Issuer | | Shares/Par | | | Value ($) | |
| Common Stocks - continued | | | | | | | | |
| Business Services - continued | | | | | | | | |
| Diploma PLC | | | 7,977 | | | $ | 150,576 | |
| EVO Payments, Inc., “A” (a) | | | 14,284 | | | | 335,960 | |
| Fiserv, Inc. (a) | | | 4,344 | | | | 347,824 | |
| FleetCor Technologies, Inc. (a) | | | 1,794 | | | | 383,450 | |
| Global Payments, Inc. | | | 4,499 | | | | 560,485 | |
| Plastic Omnium SA | | | 4,273 | | | | 169,231 | |
| Total System Services, Inc. | | | 4,849 | | | | 471,032 | |
| WNS (Holdings) Ltd., ADR (a) | | | 6,169 | | | | 319,739 | |
| Worldpay, Inc. (a) | | | 3,802 | | | | 370,277 | |
| Zendesk, Inc. (a) | | | 7,620 | | | | 524,942 | |
| | | | | | | | |
| | | | | | | $ | 5,463,270 | |
| Computer Software - 3.7% | | | | | | | | |
| 8x8, Inc. (a) | | | 11,253 | | | $ | 255,443 | |
| Cadence Design Systems, Inc. (a) | | | 7,866 | | | | 370,016 | |
| OBIC Business Consultants Co. Ltd. | | | 2,600 | | | | 213,176 | |
| OBIC Co. Ltd. | | | 8,200 | | | | 770,480 | |
| RingCentral, Inc. (a) | | | 3,986 | | | | 371,296 | |
| | | | | | | | |
| | | | | | | $ | 1,980,411 | |
| Computer Software - Systems - 4.3% | | | | | | | | |
| Amadeus IT Group S.A. | | | 6,122 | | | $ | 567,920 | |
| Box, Inc. (a) | | | 10,761 | | | | 264,290 | |
| Endava PLC, ADR (a) | | | 9,738 | | | | 255,330 | |
| Linx S.A. | | | 42,000 | | | | 177,359 | |
| NICE Systems Ltd., ADR (a) | | | 4,925 | | | | 569,281 | |
| SS&C Technologies Holdings, Inc. | | | 8,403 | | | | 498,634 | |
| | | | | | | | |
| | | | | | | $ | 2,332,814 | |
| Conglomerates - 0.3% | | | | | | | | |
| DCC PLC | | | 1,738 | | | $ | 156,712 | |
| | |
| Construction - 2.2% | | | | | | | | |
| GMS, Inc. (a) | | | 12,464 | | | $ | 309,730 | |
| Somfy SA | | | 1,635 | | | | 151,826 | |
| Summit Materials, Inc., “A” (a) | | | 19,083 | | | | 405,895 | |
| Techtronic Industries Co. Ltd. | | | 30,500 | | | | 186,527 | |
| Volution Group PLC | | | 48,122 | | | | 120,097 | |
| | | | | | | | |
| | | | | | | $ | 1,174,075 | |
| Consumer Products - 0.7% | | | | | | | | |
| Dabur India Ltd. | | | 28,304 | | | $ | 191,051 | |
| Mitsubishi Pencil Co. Ltd. | | | 10,700 | | | | 193,661 | |
| | | | | | | | |
| | | | | | | $ | 384,712 | |
13
Portfolio of Investments – continued
| | | | | | | | |
| Issuer | | Shares/Par | | | Value ($) | |
| Common Stocks - continued | | | | | | | | |
| Consumer Services - 2.5% | | | | | | | | |
| Asante, Inc. | | | 17,300 | | | $ | 365,276 | |
| Bright Horizons Family Solutions, Inc. (a) | | | 5,104 | | | | 609,571 | |
| Heian Ceremony Service Co. | | | 27,300 | | | | 220,886 | |
| On the Beach Group PLC | | | 18,418 | | | | 125,598 | |
| | | | | | | | |
| | | | | | | $ | 1,321,331 | |
| Containers - 2.9% | | | | | | | | |
| Berry Global Group, Inc. (a) | | | 11,604 | | | $ | 553,859 | |
| Fuji Seal International, Inc. | | | 15,200 | | | | 536,262 | |
| Gerresheimer AG | | | 2,922 | | | | 244,203 | |
| Mayr-Melnhof Karton AG | | | 1,583 | | | | 203,591 | |
| | | | | | | | |
| | | | | | | $ | 1,537,915 | |
| Electrical Equipment - 5.9% | | | | | | | | |
| AMETEK, Inc. | | | 4,290 | | | $ | 330,158 | |
| HD Supply Holdings, Inc. (a) | | | 11,848 | | | | 540,150 | |
| Hubbell, Inc. | | | 3,949 | | | | 498,996 | |
| IMI PLC | | | 16,572 | | | | 259,536 | |
| Littlefuse, Inc. | | | 1,901 | | | | 424,988 | |
| Sensata Technologies Holding PLC (a) | | | 8,894 | | | | 470,937 | |
| TE Connectivity Ltd. | | | 5,210 | | | | 477,653 | |
| Voltronic Power Technology Corp. | | | 10,000 | | | | 172,229 | |
| | | | | | | | |
| | | | | | | $ | 3,174,647 | |
| Electronics - 2.6% | | | | | | | | |
| Amano Corp. | | | 8,000 | | | $ | 167,258 | |
| Analog Devices, Inc. | | | 2,580 | | | | 255,033 | |
| Inphi Corp. (a) | | | 8,254 | | | | 305,976 | |
| IPG Photonics Corp. (a) | | | 1,299 | | | | 227,948 | |
| Kardex AG | | | 1,444 | | | | 258,631 | |
| Strix Group PLC | | | 76,245 | | | | 164,483 | |
| | | | | | | | |
| | | | | | | $ | 1,379,329 | |
| Entertainment - 0.9% | | | | | | | | |
| Live Nation, Inc. (a) | | | 9,360 | | | $ | 465,005 | |
| | |
| Food & Beverages - 2.1% | | | | | | | | |
| Bakkafrost P/f | | | 7,120 | | | $ | 406,510 | |
| Cranswick PLC | | | 6,786 | | | | 284,166 | |
| M. Dias Branco S.A. Industria e Comercio de Alimentos | | | 11,700 | | | | 121,536 | |
| S Foods, Inc. | | | 7,800 | | | | 305,724 | |
| | | | | | | | |
| | | | | | | $ | 1,117,936 | |
14
Portfolio of Investments – continued
| | | | | | | | |
| Issuer | | Shares/Par | | | Value ($) | |
| Common Stocks - continued | | | | | | | | |
| Forest & Paper Products - 0.8% | | | | | | | | |
| Suzano Papel e Celulose | | | 36,900 | | | $ | 428,602 | |
| | |
| Furniture & Appliances - 0.5% | | | | | | | | |
| SEB S.A. | | | 1,573 | | | $ | 293,233 | |
| | |
| Gaming & Lodging - 1.5% | | | | | | | | |
| Dalata Hotel Group PLC (a) | | | 51,633 | | | $ | 427,921 | |
| Paddy Power Betfair PLC | | | 2,743 | | | | 249,465 | |
| Shangri-La Asia Ltd. | | | 80,000 | | | | 123,332 | |
| | | | | | | | |
| | | | | | | $ | 800,718 | |
| General Merchandise - 1.0% | | | | | | | | |
| B&M European Value Retail S.A. | | | 34,471 | | | $ | 184,346 | |
| Dollarama, Inc. | | | 9,499 | | | | 359,215 | |
| | | | | | | | |
| | | | | | | $ | 543,561 | |
| Insurance - 0.5% | | | | | | | | |
| Sony Financial Holdings, Inc. | | | 12,400 | | | $ | 247,196 | |
| | |
| Internet - 2.2% | | | | | | | | |
| LogMeIn, Inc. | | | 6,735 | | | $ | 578,873 | |
| Rightmove PLC | | | 82,330 | | | | 525,198 | |
| Rocket Internet AG (a) | | | 3,062 | | | | 105,845 | |
| | | | | | | | |
| | | | | | | $ | 1,209,916 | |
| Leisure & Toys - 0.3% | | | | | | | | |
| Thule Group AB | | | 7,555 | | | $ | 178,938 | |
| | |
| Machinery & Tools - 3.5% | | | | | | | | |
| Daikin Industries Ltd. | | | 2,200 | | | $ | 280,569 | |
| Lincoln Electric Holdings, Inc. | | | 2,844 | | | | 267,791 | |
| Nabtesco Corp. | | | 5,500 | | | | 143,403 | |
| Nissei ASB Machine Co. Ltd. | | | 9,700 | | | | 436,068 | |
| Ritchie Bros. Auctioneers, Inc. | | | 8,965 | | | | 341,656 | |
| Shima Seiki MFG Ltd. | | | 4,000 | | | | 186,842 | |
| Spirax Sarco Engineering PLC | | | 2,751 | | | | 254,294 | |
| | | | | | | | |
| | | | | | | $ | 1,910,623 | |
| Medical & Health Technology & Services - 3.1% | | | | | | | | |
| Charles River Laboratories International, Inc. (a) | | | 2,615 | | | $ | 322,979 | |
| ICON PLC (a) | | | 4,520 | | | | 673,570 | |
| Selcuk Ecza Deposu Ticaret ve Sanayi A.S. | | | 386,968 | | | | 183,283 | |
| Syneos Health, Inc. (a) | | | 9,613 | | | | 479,208 | |
| | | | | | | | |
| | | | | | | $ | 1,659,040 | |
15
Portfolio of Investments – continued
| | | | | | | | |
| Issuer | | Shares/Par | | | Value ($) | |
| Common Stocks - continued | | | | | | | | |
| Medical Equipment - 5.8% | | | | | | | | |
| Fukuda Denshi Co. Ltd. | | | 6,400 | | | $ | 437,188 | |
| Masimo Corp. (a) | | | 2,965 | | | | 349,544 | |
| Nakanishi, Inc. | | | 5,000 | | | | 100,531 | |
| PerkinElmer, Inc. | | | 5,245 | | | | 484,795 | |
| QIAGEN N.V. (a) | | | 8,950 | | | | 348,781 | |
| Quidel Corp. (a) | | | 7,240 | | | | 556,611 | |
| Sonova Holding AG | | | 589 | | | | 111,754 | |
| Steris PLC | | | 4,706 | | | | 538,461 | |
| Techno Medica Co. Ltd. | | | 10,500 | | | | 194,672 | |
| | | | | | | | |
| | | | | | | $ | 3,122,337 | |
| Natural Gas - Pipeline - 0.2% | | | | | | | | |
| EQT Midstream Partners LP | | | 2,215 | | | $ | 126,609 | |
| | |
| Network & Telecom - 0.5% | | | | | | | | |
| Interxion Holding N.V. (a) | | | 4,211 | | | $ | 277,631 | |
| | |
| Oil Services - 0.8% | | | | | | | | |
| Aker Solutions ASA (a) | | | 34,057 | | | $ | 232,458 | |
| Liberty Oilfield Services, Inc. (l) | | | 9,069 | | | | 178,115 | |
| | | | | | | | |
| | | | | | | $ | 410,573 | |
| Other Banks & Diversified Financials - 3.4% | | | | | | | | |
| AEON Thana Sinsap Public Co. Ltd. | | | 64,900 | | | $ | 356,920 | |
| Bank OZK | | | 6,320 | | | | 255,707 | |
| First Republic Bank | | | 2,232 | | | | 226,749 | |
| Shriram City Union Finance Ltd. | | | 8,219 | | | | 232,260 | |
| Wintrust Financial Corp. | | | 4,925 | | | | 436,109 | |
| Zions Bancorporation | | | 6,008 | | | | 320,167 | |
| | | | | | | | |
| | | | | | | $ | 1,827,912 | |
| Railroad & Shipping - 1.4% | | | | | | | | |
| DFDS A/S | | | 4,197 | | | $ | 221,411 | |
| DPWorld Ltd. | | | 11,293 | | | | 241,670 | |
| GMexico Transportes S.A.B. de C.V | | | 122,300 | | | | 198,251 | |
| StealthGas, Inc. (a) | | | 23,034 | | | | 82,001 | |
| | | | | | | | |
| | | | | | | $ | 743,333 | |
| Real Estate - 6.2% | | | | | | | | |
| Atrium European Real Estate Ltd. | | | 46,935 | | | $ | 209,202 | |
| Big Yellow Group PLC, REIT | | | 19,920 | | | | 243,274 | |
| Concentradora Fibra Danhos S.A. de C.V., REIT | | | 113,062 | | | | 187,004 | |
| Fibra Uno Administracion S.A. | | | 103,185 | | | | 135,346 | |
| Hibernia PLC, REIT | | | 77,343 | | | | 134,664 | |
16
Portfolio of Investments – continued
| | | | | | | | |
| Issuer | | Shares/Par | | | Value ($) | |
| Common Stocks - continued | | | | | | | | |
| Real Estate - continued | | | | | | | | |
| LEG Immobilien AG | | | 2,031 | | | $ | 247,889 | |
| Medical Properties Trust, Inc., REIT | | | 16,009 | | | | 240,935 | |
| Mid-America Apartment Communities, Inc., REIT | | | 2,077 | | | | 215,094 | |
| National Storage, REIT | | | 213,231 | | | | 259,830 | |
| PLA Administradora Industrial, S. de R.L. de C.V., REIT | | | 81,563 | | | | 122,610 | |
| Prologis Property Mexico S.A. de C.V., REIT | | | 70,965 | | | | 139,811 | |
| STAG Industrial, Inc., REIT | | | 15,086 | | | | 435,533 | |
| Store Capital Corp., REIT | | | 15,457 | | | | 445,316 | |
| Unite Group PLC, REIT | | | 28,839 | | | | 331,448 | |
| | | | | | | | |
| | | | | | | $ | 3,347,956 | |
| Restaurants - 0.9% | | | | | | | | |
| Performance Food Group Co. (a) | | | 15,352 | | | $ | 508,151 | |
| | |
| Special Products & Services - 0.5% | | | | | | | | |
| Boyd Group Income Fund, IEU | | | 2,607 | | | $ | 259,901 | |
| | |
| Specialty Chemicals - 6.7% | | | | | | | | |
| Axalta Coating Systems Ltd. (a) | | | 15,782 | | | $ | 481,351 | |
| Borregaard ASA | | | 30,312 | | | | 288,078 | |
| Croda International PLC | | | 7,046 | | | | 465,874 | |
| Ferro Corp. (a) | | | 19,467 | | | | 427,301 | |
| IMCD Group NV | | | 2,525 | | | | 188,750 | |
| RPM International, Inc. | | | 4,991 | | | | 336,892 | |
| Symrise AG | | | 6,519 | | | | 608,835 | |
| Taisei Lamick Co. Ltd. | | | 12,300 | | | | 353,690 | |
| Univar, Inc. (a) | | | 15,455 | | | | 429,958 | |
| | | | | | | | |
| | | | | | | $ | 3,580,729 | |
| Specialty Stores - 3.2% | | | | | | | | |
| Dufry AG | | | 3,068 | | | $ | 379,524 | |
| Just Eat PLC (a) | | | 37,372 | | | | 371,425 | |
| Takeaway.Com Holding B.V. (a) | | | 4,684 | | | | 370,256 | |
| Tractor Supply Co. | | | 4,939 | | | | 436,015 | |
| XXL ASA | | | 10,926 | | | | 60,779 | |
| Zalando SE (a) | | | 2,312 | | | | 121,623 | |
| | | | | | | | |
| | | | | | | $ | 1,739,622 | |
| Trucking - 1.8% | | | | | | | | |
| SG Holdings Co. Ltd. | | | 18,900 | | | $ | 447,197 | |
| Yamato Holdings Co. Ltd. | | | 17,700 | | | | 526,333 | |
| | | | | | | | |
| | | | | | | $ | 973,530 | |
| Total Common Stocks (Identified Cost, $40,855,122) | | | | | | $ | 52,580,563 | |
17
Portfolio of Investments – continued
| | | | | | | | | | | | | | | | |
| Preferred Stocks - 0.2% | | | | | | | | | | | | | | | | |
| Issuer | | | | | | | | Shares/Par | | | Value ($) | |
| Specialty Chemicals - 0.2% | | | | | | | | | | | | | | | | |
| Fuchs Petrolub SE (Identified Cost, $67,854) | | | | | | | | | | | 2,040 | | | $ | 119,462 | |
| | | | |
| | | Strike
Price | | | First
Exercise | | | | | | | |
| Rights - 0.0% | | | | | | | | | | | | | | | | |
| Real Estate - 0.0% | | | | | | | | | | | | | | | | |
National Storage, REIT (37 shares for 5 rights) (a)
(Identified Cost, $0) | | AUD | 1.66 | | | | 8/24/18 | | | | 28,815 | | | $ | 725 | |
| | |
| Investment Companies (h) - 1.8% | | | | | | | | | |
| Money Market Funds - 1.8% | | | | | | | | | | | | | | | | |
MFS Institutional Money Market
Portfolio, 2.03% (v)
(Identified Cost, $980,515) | | | | | | | | | | | 980,690 | | | $ | 980,690 | |
| | |
| Collateral for Securities Loaned - 0.1% | | | | | | | | | |
State Street Navigator Securities Lending Government Money Market
Portfolio, 1.93% (j)
(Identified Cost, $33,700) | | | | | | | | | | | 33,700 | | | $ | 33,700 | |
| | |
| Other Assets, Less Liabilities - 0.2% | | | | | | | | 120,363 | |
| Net Assets - 100.0% | | | | | | | | | | | | | | $ | 53,835,503 | |
| (a) | Non-income producing security. |
| (h) | An affiliated issuer, which may be considered one in which the fund owns 5% or more of the outstanding voting securities, or a company which is under common control. At period end, the aggregate values of the fund’s investments in affiliated issuers and in unaffiliated issuers were $980,690 and $52,734,450, respectively. |
| (j) | The rate quoted is the annualized seven-day yield of the fund at period end. |
| (l) | A portion of this security is on loan. |
| (v) | Affiliated issuer that is available only to investment companies managed by MFS. The rate quoted for the MFS Institutional Money Market Portfolio is the annualized seven-day yield of the fund at period end. |
The following abbreviations are used in this report and are defined:
| ADR | | American Depositary Receipt |
| IEU | | International Equity Unit |
| PLC | | Public Limited Company |
| REIT | | Real Estate Investment Trust |
Abbreviations indicate amounts shown in currencies other than the U.S. dollar. All amounts are stated in U.S. dollars unless otherwise indicated. A list of abbreviations is shown below:
See Notes to Financial Statements
18
Financial Statements
STATEMENT OF ASSETS AND LIABILITIES
At 8/31/18
This statement represents your fund’s balance sheet, which details the assets and liabilities comprising the total value of the fund.
| | | | |
| Assets | | | | |
Investments in unaffiliated issuers, at value, including $33,093 of securities on loan (identified cost, $40,956,676) | | | $52,734,450 | |
Investments in affiliated issuers, at value (identified cost, $980,515) | | | 980,690 | |
Foreign currency, at value (identified cost, $3,901) | | | 3,898 | |
Receivables for | | | | |
Investments sold | | | 22,019 | |
Fund shares sold | | | 195,214 | |
Interest and dividends | | | 52,455 | |
Receivable from investment adviser | | | 21,557 | |
Other assets | | | 99 | |
Total assets | | | $54,010,382 | |
| Liabilities | | | | |
Payables for | | | | |
Investments purchased | | | $4,622 | |
Fund shares reacquired | | | 6,989 | |
Collateral for securities loaned, at value | | | 33,700 | |
Payable to affiliates | | | | |
Shareholder servicing costs | | | 22,058 | |
Distribution and service fees | | | 506 | |
Payable for independent Trustees’ compensation | | | 7 | |
Deferred country tax expense payable | | | 25,587 | |
Accrued expenses and other liabilities | | | 81,410 | |
Total liabilities | | | $174,879 | |
Net assets | | | $53,835,503 | |
| Net assets consist of | | | | |
Paid-in capital | | | $39,057,879 | |
Unrealized appreciation (depreciation) (net of $25,587 deferred country tax) | | | 11,752,045 | |
Accumulated net realized gain (loss) | | | 2,958,498 | |
Undistributed net investment income | | | 67,081 | |
Net assets | | | $53,835,503 | |
Shares of beneficial interest outstanding | | | 2,527,440 | |
19
Statement of Assets and Liabilities – continued
| | | | | | | | | | | | |
| | | Net assets | | | Shares
outstanding | | | Net asset value
per share (a) | |
Class A | | | $11,580,703 | | | | 544,450 | | | | $21.27 | |
Class B | | | 2,488,490 | | | | 123,107 | | | | 20.21 | |
Class C | | | 4,469,647 | | | | 221,133 | | | | 20.21 | |
Class I | | | 28,462,573 | | | | 1,321,458 | | | | 21.54 | |
Class R1 | | | 73,254 | | | | 3,625 | | | | 20.20 | |
Class R2 | | | 210,992 | | | | 10,083 | | | | 20.93 | |
Class R3 | | | 143,818 | | | | 6,764 | | | | 21.26 | |
Class R4 | | | 74,464 | | | | 3,454 | | | | 21.56 | |
Class R6 | | | 6,331,562 | | | | 293,366 | | | | 21.58 | |
| (a) | Maximum offering price per share was equal to the net asset value per share for all share classes, except for Class A, for which the maximum offering price per share was $22.57 [100 / 94.25 x $21.27]. On sales of $50,000 or more, the maximum offering price of Class A shares is reduced. A contingent deferred sales charge may be imposed on redemptions of Class A, Class B, and Class C shares. Redemption price per share was equal to the net asset value per share for Classes I, R1, R2, R3, R4, and R6. |
See Notes to Financial Statements
20
Financial Statements
STATEMENT OF OPERATIONS
Year ended 8/31/18
This statement describes how much your fund earned in investment income and accrued in expenses. It also describes any gains and/or losses generated by fund operations.
| | | | |
| Net investment income (loss) | | | | |
Income | | | | |
Dividends | | | $652,586 | |
Dividends from affiliated issuers | | | 23,031 | |
Income on securities loaned | | | 2,366 | |
Other | | | 25 | |
Foreign taxes withheld | | | (41,904 | ) |
Total investment income | | | $636,104 | |
Expenses | | | | |
Management fee | | | $461,323 | |
Distribution and service fees | | | 95,626 | |
Shareholder servicing costs | | | 50,384 | |
Administrative services fee | | | 17,500 | |
Independent Trustees’ compensation | | | 1,152 | |
Custodian fee | | | 33,922 | |
Shareholder communications | | | 19,811 | |
Audit and tax fees | | | 61,452 | |
Legal fees | | | 908 | |
Registration fees | | | 125,264 | |
Miscellaneous | | | 21,247 | |
Total expenses | | | $888,589 | |
Reduction of expenses by investment adviser and distributor | | | (206,966 | ) |
Net expenses | | | $681,623 | |
Net investment income (loss) | | | $(45,519 | ) |
| Realized and unrealized gain (loss) | | | | |
Realized gain (loss) (identified cost basis) | | | | |
Unaffiliated issuers | | | $3,918,219 | |
Affiliated issuers | | | 103 | |
Foreign currency | | | 2,283 | |
Net realized gain (loss) | | | $3,920,605 | |
Change in unrealized appreciation or depreciation | | | | |
Unaffiliated issuers (net of $23,279 increase in deferred country tax) | | | $4,202,754 | |
Affiliated issuers | | | 169 | |
Translation of assets and liabilities in foreign currencies | | | (425 | ) |
Net unrealized gain (loss) | | | $4,202,498 | |
Net realized and unrealized gain (loss) | | | $8,123,103 | |
Change in net assets from operations | | | $8,077,584 | |
See Notes to Financial Statements
21
Financial Statements
STATEMENTS OF CHANGES IN NET ASSETS
These statements describe the increases and/or decreases in net assets resulting from operations, any distributions, and any shareholder transactions.
| | | | | | | | |
| | | Year ended | |
| | | 8/31/18 | | | 8/31/17 | |
| Change in net assets | | | | | | |
| From operations | | | | | | | | |
Net investment income (loss) | | | $(45,519 | ) | | | $(40,106 | ) |
Net realized gain (loss) | | | 3,920,605 | | | | 1,327,977 | |
Net unrealized gain (loss) | | | 4,202,498 | | | | 3,201,211 | |
Change in net assets from operations | | | $8,077,584 | | | | $4,489,082 | |
| Distributions declared to shareholders | | | | | | | | |
From net investment income | | | $— | | | | $(59,859 | ) |
From net realized gain | | | (1,220,716 | ) | | | — | |
Total distributions declared to shareholders | | | $(1,220,716 | ) | | | $(59,859 | ) |
Change in net assets from fund share transactions | | | $10,058,478 | | | | $6,930,132 | |
Total change in net assets | | | $16,915,346 | | | | $11,359,355 | |
| Net assets | | | | | | | | |
At beginning of period | | | 36,920,157 | | | | 25,560,802 | |
At end of period (including undistributed net investment income of $67,081 and accumulated distributions in excess of net investment income of $11,568, respectively) | | | $53,835,503 | | | | $36,920,157 | |
See Notes to Financial Statements
22
Financial Statements
FINANCIAL HIGHLIGHTS
The financial highlights table is intended to help you understand the fund’s financial performance for the past 5 years (or life of a particular share class, if shorter). Certain information reflects financial results for a single fund share. The total returns in the table represent the rate that an investor would have earned (or lost) on an investment in the fund share class (assuming reinvestment of all distributions) held for the entire period.
| | | | | | | | | | | | | | | | | | | | |
| Class A | | Year ended | |
| | | 8/31/18 | | | 8/31/17 | | | 8/31/16 | | | 8/31/15 | | | 8/31/14 | |
Net asset value, beginning of period | | | $18.31 | | | | $15.69 | | | | $14.85 | | | | $15.58 | | | | $14.64 | |
| Income (loss) from investment operations | | | | | | | | | | | | | | | | | |
Net investment income (loss) (d) | | | $(0.03 | ) | | | $(0.02 | ) | | | $0.01 | | | | $(0.02 | ) | | | $(0.05 | ) |
Net realized and unrealized gain (loss) | | | 3.57 | | | | 2.66 | | | | 0.84 | | | | (0.06 | ) | | | 1.48 | |
Total from investment operations | | | $3.54 | | | | $2.64 | | | | $0.85 | | | | $(0.08 | ) | | | $1.43 | |
| Less distributions declared to shareholders | | | | | | | | | | | | | | | | | |
From net investment income | | | $— | | | | $(0.02 | ) | | | $(0.01 | ) | | | $— | | | | $— | |
From net realized gain | | | (0.58 | ) | | | — | | | | — | | | | (0.65 | ) | | | (0.49 | ) |
Total distributions declared to shareholders | | | $(0.58 | ) | | | $(0.02 | ) | | | $(0.01 | ) | | | $(0.65 | ) | | | $(0.49 | ) |
Net asset value, end of period (x) | | | $21.27 | | | | $18.31 | | | | $15.69 | | | | $14.85 | | | | $15.58 | |
Total return (%) (r)(s)(t)(x) | | | 19.70 | | | | 16.85 | | | | 5.75 | | | | (0.30 | ) | | | 9.84 | |
Ratios (%) (to average net assets)
and Supplemental data: | | | | | | | | | | | | | | | | | |
Expenses before expense reductions (f) | | | 1.94 | | | | 2.33 | | | | 2.35 | | | | 2.34 | | | | 2.27 | |
Expenses after expense reductions (f) | | | 1.50 | | | | 1.50 | | | | 1.50 | | | | 1.50 | | | | 1.50 | |
Net investment income (loss) | | | (0.17 | ) | | | (0.15 | ) | | | 0.07 | | | | (0.17 | ) | | | (0.33 | ) |
Portfolio turnover | | | 36 | | | | 37 | | | | 37 | | | | 35 | | | | 53 | |
Net assets at end of period (000 omitted) | | | $11,581 | | | | $7,893 | | | | $11,699 | | | | $14,144 | | | | $16,309 | |
See Notes to Financial Statements
23
Financial Highlights – continued
| | | | | | | | | | | | | | | | | | | | |
| Class B | | Year ended | |
| | | 8/31/18 | | | 8/31/17 | | | 8/31/16 | | | 8/31/15 | | | 8/31/14 | |
Net asset value, beginning of period | | | $17.55 | | | | $15.13 | | | | $14.42 | | | | $15.26 | | | | $14.46 | |
| Income (loss) from investment operations | | | | | | | | | | | | | | | | | |
Net investment income (loss) (d) | | | $(0.17 | ) | | | $(0.13 | ) | | | $(0.09 | ) | | | $(0.13 | ) | | | $(0.16 | ) |
Net realized and unrealized gain (loss) | | | 3.41 | | | | 2.55 | | | | 0.80 | | | | (0.06 | ) | | | 1.45 | |
Total from investment operations | | | $3.24 | | | | $2.42 | | | | $0.71 | | | | $(0.19 | ) | | | $1.29 | |
| Less distributions declared to shareholders | | | | | | | | | | | | | | | | | |
From net investment income | | | $— | | | | $— | | | | $— | | | | $— | | | | $— | |
From net realized gain | | | (0.58 | ) | | | — | | | | — | | | | (0.65 | ) | | | (0.49 | ) |
Total distributions declared to shareholders | | | $(0.58 | ) | | | $— | | | | $— | | | | $(0.65 | ) | | | $(0.49 | ) |
Net asset value, end of period (x) | | | $20.21 | | | | $17.55 | | | | $15.13 | | | | $14.42 | | | | $15.26 | |
Total return (%) (r)(s)(t)(x) | | | 18.83 | | | | 15.99 | | | | 4.92 | | | | (1.05 | ) | | | 8.98 | |
Ratios (%) (to average net assets)
and Supplemental data: | | | | | | | | | | | | | | | | | |
Expenses before expense reductions (f) | | | 2.69 | | | | 3.07 | | | | 3.09 | | | | 3.08 | | | | 3.02 | |
Expenses after expense reductions (f) | | | 2.25 | | | | 2.25 | | | | 2.25 | | | | 2.25 | | | | 2.25 | |
Net investment income (loss) | | | (0.90 | ) | | | (0.83 | ) | | | (0.62 | ) | | | (0.90 | ) | | | (1.06 | ) |
Portfolio turnover | | | 36 | | | | 37 | | | | 37 | | | | 35 | | | | 53 | |
Net assets at end of period (000 omitted) | | | $2,488 | | | | $1,513 | | | | $1,188 | | | | $769 | | | | $522 | |
| |
| Class C | | Year ended | |
| | | 8/31/18 | | | 8/31/17 | | | 8/31/16 | | | 8/31/15 | | | 8/31/14 | |
Net asset value, beginning of period | | | $17.55 | | | | $15.13 | | | | $14.42 | | | | $15.26 | | | | $14.46 | |
| Income (loss) from investment operations | | | | | | | | | | | | | | | | | |
Net investment income (loss) (d) | | | $(0.18 | ) | | | $(0.13 | ) | | | $(0.09 | ) | | | $(0.13 | ) | | | $(0.16 | ) |
Net realized and unrealized gain (loss) | | | 3.42 | | | | 2.55 | | | | 0.80 | | | | (0.06 | ) | | | 1.45 | |
Total from investment operations | | | $3.24 | | | | $2.42 | | | | $0.71 | | | | $(0.19 | ) | | | $1.29 | |
| Less distributions declared to shareholders | | | | | | | | | | | | | | | | | |
From net investment income | | | $— | | | | $— | | | | $— | | | | $— | | | | $— | |
From net realized gain | | | (0.58 | ) | | | — | | | | — | | | | (0.65 | ) | | | (0.49 | ) |
Total distributions declared to shareholders | | | $(0.58 | ) | | | $— | | | | $— | | | | $(0.65 | ) | | | $(0.49 | ) |
Net asset value, end of period (x) | | | $20.21 | | | | $17.55 | | | | $15.13 | | | | $14.42 | | | | $15.26 | |
Total return (%) (r)(s)(t)(x) | | | 18.83 | | | | 15.99 | | | | 4.92 | | | | (1.05 | ) | | | 8.98 | |
Ratios (%) (to average net assets)
and Supplemental data: | | | | | | | | | | | | | | | | | |
Expenses before expense reductions (f) | | | 2.69 | | | | 3.08 | | | | 3.09 | | | | 3.08 | | | | 3.02 | |
Expenses after expense reductions (f) | | | 2.25 | | | | 2.25 | | | | 2.24 | | | | 2.24 | | | | 2.24 | |
Net investment income (loss) | | | (0.93 | ) | | | (0.84 | ) | | | (0.64 | ) | | | (0.91 | ) | | | (1.05 | ) |
Portfolio turnover | | | 36 | | | | 37 | | | | 37 | | | | 35 | | | | 53 | |
Net assets at end of period (000 omitted) | | | $4,470 | | | | $4,944 | | | | $5,017 | | | | $4,737 | | | | $4,681 | |
See Notes to Financial Statements
24
Financial Highlights – continued
| | | | | | | | | | | | | | | | | | | | |
| Class I | | Year ended | |
| | | 8/31/18 | | | 8/31/17 | | | 8/31/16 | | | 8/31/15 | | | 8/31/14 | |
Net asset value, beginning of period | | | $18.49 | | | | $15.86 | | | | $15.00 | | | | $15.69 | | | | $14.71 | |
| Income (loss) from investment operations | | | | | | | | | | | | | | | | | |
Net investment income (loss) (d) | | | $0.02 | | | | $0.04 | | | | $0.07 | | | | $0.01 | | | | $(0.01 | ) |
Net realized and unrealized gain (loss) | | | 3.61 | | | | 2.67 | | | | 0.82 | | | | (0.05 | ) | | | 1.48 | |
Total from investment operations | | | $3.63 | | | | $2.71 | | | | $0.89 | | | | $(0.04 | ) | | | $1.47 | |
| Less distributions declared to shareholders | | | | | | | | | | | | | | | | | |
From net investment income | | | $— | | | | $(0.08 | ) | | | $(0.03 | ) | | | $— | | | | $— | |
From net realized gain | | | (0.58 | ) | | | — | | | | — | | | | (0.65 | ) | | | (0.49 | ) |
Total distributions declared to shareholders | | | $(0.58 | ) | | | $(0.08 | ) | | | $(0.03 | ) | | | $(0.65 | ) | | | $(0.49 | ) |
Net asset value, end of period (x) | | | $21.54 | | | | $18.49 | | | | $15.86 | | | | $15.00 | | | | $15.69 | |
Total return (%) (r)(s)(t)(x) | | | 20.01 | | | | 17.20 | | | | 5.98 | | | | (0.03 | ) | | | 10.07 | |
Ratios (%) (to average net assets)
and Supplemental data: | | | | | | | | �� | | | | | | | | | |
Expenses before expense reductions (f) | | | 1.69 | | | | 2.06 | | | | 2.06 | | | | 2.08 | | | | 2.02 | |
Expenses after expense reductions (f) | | | 1.25 | | | | 1.25 | | | | 1.25 | | | | 1.25 | | | | 1.25 | |
Net investment income (loss) | | | 0.11 | | | | 0.21 | | | | 0.44 | | | | 0.08 | | | | (0.09 | ) |
Portfolio turnover | | | 36 | | | | 37 | | | | 37 | | | | 35 | | | | 53 | |
Net assets at end of period (000 omitted) | | | $28,463 | | | | $17,606 | | | | $5,052 | | | | $4,596 | | | | $4,808 | |
| |
| Class R1 | | Year ended | |
| | | 8/31/18 | | | 8/31/17 | | | 8/31/16 | | | 8/31/15 | | | 8/31/14 | |
Net asset value, beginning of period | | | $17.55 | | | | $15.13 | | | | $14.42 | | | | $15.26 | | | | $14.46 | |
| Income (loss) from investment operations | | | | | | | | | | | | | | | | | |
Net investment income (loss) (d) | | | $(0.18 | ) | | | $(0.14 | ) | | | $(0.10 | ) | | | $(0.13 | ) | | | $(0.16 | ) |
Net realized and unrealized gain (loss) | | | 3.41 | | | | 2.56 | | | | 0.81 | | | | (0.06 | ) | | | 1.45 | |
Total from investment operations | | | $3.23 | | | | $2.42 | | | | $0.71 | | | | $(0.19 | ) | | | $1.29 | |
| Less distributions declared to shareholders | | | | | | | | | | | | | | | | | |
From net investment income | | | $— | | | | $— | | | | $— | | | | $— | | | | $— | |
From net realized gain | | | (0.58 | ) | | | — | | | | — | | | | (0.65 | ) | | | (0.49 | ) |
Total distributions declared to shareholders | | | $(0.58 | ) | | | $— | | | | $— | | | | $(0.65 | ) | | | $(0.49 | ) |
Net asset value, end of period (x) | | | $20.20 | | | | $17.55 | | | | $15.13 | | | | $14.42 | | | | $15.26 | |
Total return (%) (r)(s)(t)(x) | | | 18.77 | | | | 15.99 | | | | 4.92 | | | | (1.05 | ) | | | 8.98 | |
Ratios (%) (to average net assets)
and Supplemental data: | | | | | | | | | | | | | | | | | |
Expenses before expense reductions (f) | | | 2.69 | | | | 3.08 | | | | 3.12 | | | | 3.08 | | | | 3.02 | |
Expenses after expense reductions (f) | | | 2.25 | | | | 2.25 | | | | 2.25 | | | | 2.25 | | | | 2.25 | |
Net investment income (loss) | | | (0.92 | ) | | | (0.86 | ) | | | (0.70 | ) | | | (0.92 | ) | | | (1.07 | ) |
Portfolio turnover | | | 36 | | | | 37 | | | | 37 | | | | 35 | | | | 53 | |
Net assets at end of period (000 omitted) | | | $73 | | | | $62 | | | | $66 | | | | $287 | | | | $290 | |
See Notes to Financial Statements
25
Financial Highlights – continued
| | | | | | | | | | | | | | | | | | | | |
| Class R2 | | Year ended | |
| | | 8/31/18 | | | 8/31/17 | | | 8/31/16 | | | 8/31/15 | | | 8/31/14 | |
Net asset value, beginning of period | | | $18.06 | | | | $15.50 | | | | $14.71 | | | | $15.47 | | | | $14.58 | |
| Income (loss) from investment operations | | | | | | | | | | | | | | | | | |
Net investment income (loss) (d) | | | $(0.07 | ) | | | $(0.05 | ) | | | $(0.03 | ) | | | $(0.06 | ) | | | $(0.09 | ) |
Net realized and unrealized gain (loss) | | | 3.52 | | | | 2.62 | | | | 0.82 | | | | (0.05 | ) | | | 1.47 | |
Total from investment operations | | | $3.45 | | | | $2.57 | | | | $0.79 | | | | $(0.11 | ) | | | $1.38 | |
| Less distributions declared to shareholders | | | | | | | | | | | | | | | | | |
From net investment income | | | $— | | | | $(0.01 | ) | | | $— | | | | $— | | | | $— | |
From net realized gain | | | (0.58 | ) | | | — | | | | — | | | | (0.65 | ) | | | (0.49 | ) |
Total distributions declared to shareholders | | | $(0.58 | ) | | | $(0.01 | ) | | | $— | | | | $(0.65 | ) | | | $(0.49 | ) |
Net asset value, end of period (x) | | | $20.93 | | | | $18.06 | | | | $15.50 | | | | $14.71 | | | | $15.47 | |
Total return (%) (r)(s)(t)(x) | | | 19.47 | | | | 16.58 | | | | 5.37 | | | | (0.50 | ) | | | 9.53 | |
Ratios (%) (to average net assets)
and Supplemental data: | | | | | | | | | | | | | | | | | |
Expenses before expense reductions (f) | | | 2.18 | | | | 2.57 | | | | 2.59 | | | | 2.58 | | | | 2.52 | |
Expenses after expense reductions (f) | | | 1.75 | | | | 1.75 | | | | 1.75 | | | | 1.75 | | | | 1.75 | |
Net investment income (loss) | | | (0.33 | ) | | | (0.32 | ) | | | (0.17 | ) | | | (0.42 | ) | | | (0.57 | ) |
Portfolio turnover | | | 36 | | | | 37 | | | | 37 | | | | 35 | | | | 53 | |
Net assets at end of period (000 omitted) | | | $211 | | | | $115 | | | | $89 | | | | $188 | | | | $184 | |
| |
| Class R3 | | Year ended | |
| | | 8/31/18 | | | 8/31/17 | | | 8/31/16 | | | 8/31/15 | | | 8/31/14 | |
Net asset value, beginning of period | | | $18.30 | | | | $15.70 | | | | $14.85 | | | | $15.58 | | | | $14.64 | |
| Income (loss) from investment operations | | | | | | | | | | | | | | | | | |
Net investment income (loss) (d) | | | $(0.04 | ) | | | $(0.02 | ) | | | $0.01 | | | | $(0.02 | ) | | | $(0.05 | ) |
Net realized and unrealized gain (loss) | | | 3.58 | | | | 2.66 | | | | 0.84 | | | | (0.06 | ) | | | 1.48 | |
Total from investment operations | | | $3.54 | | | | $2.64 | | | | $0.85 | | | | $(0.08 | ) | | | $1.43 | |
| Less distributions declared to shareholders | | | | | | | | | | | | | | | | | |
From net investment income | | | $— | | | | $(0.04 | ) | | | $— | | | | $— | | | | $— | |
From net realized gain | | | (0.58 | ) | | | — | | | | — | | | | (0.65 | ) | | | (0.49 | ) |
Total distributions declared to shareholders | | | $(0.58 | ) | | | $(0.04 | ) | | | $— | | | | $(0.65 | ) | | | $(0.49 | ) |
Net asset value, end of period (x) | | | $21.26 | | | | $18.30 | | | | $15.70 | | | | $14.85 | | | | $15.58 | |
Total return (%) (r)(s)(t)(x) | | | 19.72 | | | | 16.87 | | | | 5.72 | | | | (0.30 | ) | | | 9.84 | |
Ratios (%) (to average net assets)
and Supplemental data: | | | | | | | | | | | | | | | | | |
Expenses before expense reductions (f) | | | 1.94 | | | | 2.32 | | | | 2.34 | | | | 2.33 | | | | 2.27 | |
Expenses after expense reductions (f) | | | 1.50 | | | | 1.50 | | | | 1.50 | | | | 1.50 | | | | 1.50 | |
Net investment income (loss) | | | (0.18 | ) | | | (0.13 | ) | | | 0.07 | | | | (0.17 | ) | | | (0.34 | ) |
Portfolio turnover | | | 36 | | | | 37 | | | | 37 | | | | 35 | | | | 53 | |
Net assets at end of period (000 omitted) | | | $144 | | | | $116 | | | | $80 | | | | $181 | | | | $175 | |
See Notes to Financial Statements
26
Financial Highlights – continued
| | | | | | | | | | | | | | | | | | | | |
| Class R4 | | Year ended | |
| | | 8/31/18 | | | 8/31/17 | | | 8/31/16 | | | 8/31/15 | | | 8/31/14 | |
Net asset value, beginning of period | | | $18.50 | | | | $15.87 | | | | $15.00 | | | | $15.69 | | | | $14.71 | |
| Income (loss) from investment operations | | | | | | | | | | | | | | | | | |
Net investment income (loss) (d) | | | $0.02 | | | | $0.03 | | | | $0.05 | | | | $0.01 | | | | $(0.01 | ) |
Net realized and unrealized gain (loss) | | | 3.62 | | | | 2.67 | | | | 0.83 | | | | (0.05 | ) | | | 1.48 | |
Total from investment operations | | | $3.64 | | | | $2.70 | | | | $0.88 | | | | $(0.04 | ) | | | $1.47 | |
| Less distributions declared to shareholders | | | | | | | | | | | | | | | | | |
From net investment income | | | $— | | | | $(0.07 | ) | | | $(0.01 | ) | | | $— | | | | $— | |
From net realized gain | | | (0.58 | ) | | | — | | | | — | | | | (0.65 | ) | | | (0.49 | ) |
Total distributions declared to shareholders | | | $(0.58 | ) | | | $(0.07 | ) | | | $(0.01 | ) | | | $(0.65 | ) | | | $(0.49 | ) |
Net asset value, end of period (x) | | | $21.56 | | | | $18.50 | | | | $15.87 | | | | $15.00 | | | | $15.69 | |
Total return (%) (r)(s)(t)(x) | | | 20.05 | | | | 17.11 | | | | 5.91 | | | | (0.03 | ) | | | 10.07 | |
Ratios (%) (to average net assets)
and Supplemental data: | | | | | | | | | | | | | | | | | |
Expenses before expense reductions (f) | | | 1.69 | | | | 2.08 | | | | 2.09 | | | | 2.09 | | | | 2.02 | |
Expenses after expense reductions (f) | | | 1.25 | | | | 1.25 | | | | 1.25 | | | | 1.25 | | | | 1.25 | |
Net investment income (loss) | | | 0.08 | | | | 0.18 | | | | 0.30 | | | | 0.08 | | | | (0.08 | ) |
Portfolio turnover | | | 36 | | | | 37 | | | | 37 | | | | 35 | | | | 53 | |
Net assets at end of period (000 omitted) | | | $74 | | | | $62 | | | | $53 | | | | $164 | | | | $164 | |
| |
| Class R6 | | Year ended | |
| | | 8/31/18 | | | 8/31/17 | | | 8/31/16 | | | 8/31/15 | | | 8/31/14 | |
Net asset value, beginning of period | | | $18.51 | | | | $15.87 | | | | $15.03 | | | | $15.70 | | | | $14.71 | |
| Income (loss) from investment operations | | | | | | | | | | | | | | | | | |
Net investment income (loss) (d) | | | $0.04 | | | | $0.03 | | | | $0.07 | | | | $0.03 | | | | $0.00 | (w) |
Net realized and unrealized gain (loss) | | | 3.61 | | | | 2.70 | | | | 0.84 | | | | (0.05 | ) | | | 1.48 | |
Total from investment operations | | | $3.65 | | | | $2.73 | | | | $0.91 | | | | $(0.02 | ) | | | $1.48 | |
| Less distributions declared to shareholders | | | | | | | | | | | | | | | | | |
From net investment income | | | $— | | | | $(0.09 | ) | | | $(0.07 | ) | | | $— | | | | $— | |
From net realized gain | | | (0.58 | ) | | | — | | | | — | | | | (0.65 | ) | | | (0.49 | ) |
Total distributions declared to shareholders | | | $(0.58 | ) | | | $(0.09 | ) | | | $(0.07 | ) | | | $(0.65 | ) | | | $(0.49 | ) |
Net asset value, end of period (x) | | | $21.58 | | | | $18.51 | | | | $15.87 | | | | $15.03 | | | | $15.70 | |
Total return (%) (r)(s)(t)(x) | | | 20.09 | | | | 17.31 | | | | 6.06 | | | | 0.10 | | | | 10.14 | |
Ratios (%) (to average net assets)
and Supplemental data: | | | | | | | | | | | | | | | | | |
Expenses before expense reductions (f) | | | 1.60 | | | | 1.97 | | | | 1.98 | | | | 1.98 | | | | 1.92 | |
Expenses after expense reductions (f) | | | 1.16 | | | | 1.15 | | | | 1.13 | | | | 1.15 | | | | 1.14 | |
Net investment income (loss) | | | 0.18 | | | | 0.21 | | | | 0.44 | | | | 0.19 | | | | 0.03 | |
Portfolio turnover | | | 36 | | | | 37 | | | | 37 | | | | 35 | | | | 53 | |
Net assets at end of period (000 omitted) | | | $6,332 | | | | $4,609 | | | | $2,317 | | | | $128 | | | | $128 | |
See Notes to Financial Statements
27
Financial Highlights – continued
| (d) | Per share data is based on average shares outstanding. |
| (f) | Ratios do not reflect reductions from fees paid indirectly, if applicable. |
| (r) | Certain expenses have been reduced without which performance would have been lower. |
| (s) | From time to time the fund may receive proceeds from litigation settlements, without which performance would be lower. |
| (t) | Total returns do not include any applicable sales charges. |
| (w) | Per share amount was less than $0.01. |
| (x) | The net asset values and total returns have been calculated on net assets which include adjustments made in accordance with U.S. generally accepted accounting principles required at period end for financial reporting purposes. |
See Notes to Financial Statements
28
NOTES TO FINANCIAL STATEMENTS
(1) Business and Organization
MFS Global New Discovery Fund (the fund) is a diversified series of MFS Series Trust IV (the trust). The trust is organized as a Massachusetts business trust and is registered under the Investment Company Act of 1940, as amended, as an open-end management investment company.
The fund is an investment company and accordingly follows the investment company accounting and reporting guidance of the Financial Accounting Standards Board (FASB) Accounting Standards Codification Topic 946 Financial Services – Investment Companies.
(2) Significant Accounting Policies
General – The preparation of financial statements in conformity with U.S. generally accepted accounting principles requires management to make estimates and assumptions that affect the reported amounts of assets and liabilities, and disclosure of contingent assets and liabilities at the date of the financial statements and the reported amounts of increases and decreases in net assets from operations during the reporting period. Actual results could differ from those estimates. In the preparation of these financial statements, management has evaluated subsequent events occurring after the date of the fund’s Statement of Assets and Liabilities through the date that the financial statements were issued. The fund invests in foreign securities. Investments in foreign securities are vulnerable to the effects of changes in the relative values of the local currency and the U.S. dollar and to the effects of changes in each country’s market, economic, industrial, political, regulatory, geopolitical, and other conditions.
In August 2018, the FASB issued Accounting Standards Update 2018-13, Fair Value Measurement (Topic 820) – Disclosure Framework – Changes to the Disclosure Requirements for Fair Value Measurement (“ASU 2018-13”) which introduces new fair value disclosure requirements as well as eliminates and modifies certain existing fair value disclosure requirements. ASU 2018-13 would be effective for fiscal years beginning after December 15, 2019, and interim periods within those fiscal years; however, management has elected to early adopt ASU 2018-13 effective with the current reporting period. The impact of the fund’s adoption was limited to changes in the fund’s financial statement disclosures regarding fair value, primarily those disclosures related to transfers between levels of the fair value hierarchy.
Balance Sheet Offsetting – The fund’s accounting policy with respect to balance sheet offsetting is that, absent an event of default by the counterparty or a termination of the agreement, the International Swaps and Derivatives Association (ISDA) Master Agreement, or similar agreement, does not result in an offset of reported amounts of financial assets and financial liabilities in the Statement of Assets and Liabilities across transactions between the fund and the applicable counterparty. The fund’s right to setoff may be restricted or prohibited by the bankruptcy or insolvency laws of the particular jurisdiction to which a specific master netting agreement counterparty is subject. Balance sheet offsetting disclosures, to the extent applicable to the fund, have been included in the fund��s Significant Accounting Policies note under the captions for each of the fund’s in-scope financial instruments and transactions.
29
Notes to Financial Statements – continued
Investment Valuations – Equity securities, including restricted equity securities, are generally valued at the last sale or official closing price on their primary market or exchange as provided by a third-party pricing service. Equity securities, for which there were no sales reported that day, are generally valued at the last quoted daily bid quotation on their primary market or exchange as provided by a third-party pricing service. Short-term instruments with a maturity at issuance of 60 days or less may be valued at amortized cost, which approximates market value. Open-end investment companies are generally valued at net asset value per share. Securities and other assets generally valued on the basis of information from a third-party pricing service may also be valued at a broker/dealer bid quotation. In determining values, third-party pricing services can utilize both transaction data and market information such as yield, quality, coupon rate, maturity, type of issue, trading characteristics, and other market data. The values of foreign securities and other assets and liabilities expressed in foreign currencies are converted to U.S. dollars using the mean of bid and asked prices for rates provided by a third-party pricing service.
The Board of Trustees has delegated primary responsibility for determining or causing to be determined the value of the fund’s investments (including any fair valuation) to the adviser pursuant to valuation policies and procedures approved by the Board. If the adviser determines that reliable market quotations are not readily available, investments are valued at fair value as determined in good faith by the adviser in accordance with such procedures under the oversight of the Board of Trustees. Under the fund’s valuation policies and procedures, market quotations are not considered to be readily available for most types of debt instruments and floating rate loans and many types of derivatives. These investments are generally valued at fair value based on information from third-party pricing services. In addition, investments may be valued at fair value if the adviser determines that an investment’s value has been materially affected by events occurring after the close of the exchange or market on which the investment is principally traded (such as foreign exchange or market) and prior to the determination of the fund’s net asset value, or after the halting of trading of a specific security where trading does not resume prior to the close of the exchange or market on which the security is principally traded. Events that occur on a frequent basis after foreign markets close (such as developments in foreign markets and significant movements in the U.S. markets) and prior to the determination of the fund’s net asset value may be deemed to have a material effect on the value of securities traded in foreign markets. Accordingly, the fund’s foreign equity securities may often be valued at fair value. The adviser generally relies on third-party pricing services or other information (such as the correlation with price movements of similar securities in the same or other markets; the type, cost and investment characteristics of the security; the business and financial condition of the issuer; and trading and other market data) to assist in determining whether to fair value and at what value to fair value an investment. The value of an investment for purposes of calculating the fund’s net asset value can differ depending on the source and method used to determine value. When fair valuation is used, the value of an investment used to determine the fund’s net asset value may differ from quoted or published prices for the same investment. There can be no assurance that the fund could obtain the fair value assigned to an investment if it were to sell the investment at the same time at which the fund determines its net asset value per share.
30
Notes to Financial Statements – continued
Various inputs are used in determining the value of the fund’s assets or liabilities. These inputs are categorized into three broad levels. In certain cases, the inputs used to measure fair value may fall into different levels of the fair value hierarchy. In such cases, an investment’s level within the fair value hierarchy is based on the lowest level of input that is significant to the fair value measurement. The fund’s assessment of the significance of a particular input to the fair value measurement in its entirety requires judgment, and considers factors specific to the investment. Level 1 includes unadjusted quoted prices in active markets for identical assets or liabilities. Level 2 includes other significant observable market-based inputs (including quoted prices for similar securities, interest rates, prepayment speed, and credit risk). Level 3 includes unobservable inputs, which may include the adviser’s own assumptions in determining the fair value of investments. The following is a summary of the levels used as of August 31, 2018 in valuing the fund’s assets or liabilities:
| | | | | | | | | | | | | | | | |
| Financial Instruments | | Level 1 | | | Level 2 | | | Level 3 | | | Total | |
| Equity Securities: | | | | | | | | | | | | | | | | |
United States | | | $25,173,952 | | | | $— | | | | $— | | | | $25,173,952 | |
Japan | | | 7,288,215 | | | | — | | | | — | | | | 7,288,215 | |
United Kingdom | | | 5,236,577 | | | | — | | | | — | | | | 5,236,577 | |
Germany | | | 2,482,947 | | | | — | | | | — | | | | 2,482,947 | |
France | | | 1,182,121 | | | | — | | | | — | | | | 1,182,121 | |
Netherlands | | | 1,045,840 | | | | — | | | | — | | | | 1,045,840 | |
Norway | | | 987,824 | | | | — | | | | — | | | | 987,824 | |
Canada | | | 960,772 | | | | — | | | | — | | | | 960,772 | |
Ireland | | | 812,050 | | | | — | | | | — | | | | 812,050 | |
Other Countries | | | 7,061,918 | | | | 468,534 | | | | — | | | | 7,530,452 | |
| Mutual Funds | | | 1,014,390 | | | | — | | | | — | | | | 1,014,390 | |
| Total | | | $53,246,606 | | | | $468,534 | | | | $— | | | | $53,715,140 | |
For further information regarding security characteristics, see the Portfolio of Investments.
Foreign Currency Translation – Purchases and sales of foreign investments, income, and expenses are converted into U.S. dollars based upon currency exchange rates prevailing on the respective dates of such transactions or on the reporting date for foreign denominated receivables and payables. Gains and losses attributable to foreign currency exchange rates on sales of securities are recorded for financial statement purposes as net realized gains and losses on investments. Gains and losses attributable to foreign exchange rate movements on receivables, payables, income and expenses are recorded for financial statement purposes as foreign currency transaction gains and losses. That portion of both realized and unrealized gains and losses on investments that results from fluctuations in foreign currency exchange rates is not separately disclosed.
Security Loans – Under its Securities Lending Agency Agreement with the fund, State Street Bank and Trust Company (“State Street”), as lending agent, loans the securities of the fund to certain qualified institutions (the “Borrowers”) approved by the fund. Security loans can be terminated at the discretion of either the lending agent or the fund and the related securities must be returned within the earlier of the standard
31
Notes to Financial Statements – continued
trade settlement period for such securities or within three business days. The loans are collateralized by cash and/or U.S. Treasury and federal agency obligations in an amount typically at least equal to the market value of the securities loaned. On loans collateralized by cash, the cash collateral is invested in a money market fund. The market value of the loaned securities is determined at the close of business of the fund and any additional required collateral is delivered to the fund on the next business day. State Street provides the fund with indemnification against Borrower default. In the event of Borrower default, State Street will, for the benefit of the fund, either purchase securities identical to those loaned or, when such purchase is commercially impracticable, pay the fund the market value of the loaned securities. In return, State Street assumes the fund’s rights to the related collateral. If the collateral value is less than the cost to purchase identical securities, State Street is responsible for the shortfall, but only to the extent that such shortfall is not due to a decline in collateral value resulting from collateral reinvestment for which the fund bears the risk of loss. At period end, the fund had investment securities on loan, all of which were classified as equity securities in the fund’s Portfolio of Investments, with a fair value of $33,093. The fair value of the fund’s investment securities on loan and a related liability of $33,700 for cash collateral received on securities loaned are both presented gross in the Statement of Assets and Liabilities. The collateral on securities loaned exceeded the value of securities on loan at period end. The liability for cash collateral for securities loaned is carried at fair value, which is categorized as level 2 within the fair value hierarchy. A portion of the income generated upon investment of the collateral is remitted to the Borrowers, and the remainder is allocated between the fund and the lending agent. On loans collateralized by U.S. Treasury and/or federal agency obligations, a fee is received from the Borrower, and is allocated between the fund and the lending agent. Income from securities lending is separately reported in the Statement of Operations. The dividend and interest income earned on the securities loaned is accounted for in the same manner as other dividend and interest income.
Indemnifications – Under the fund’s organizational documents, its officers and Trustees may be indemnified against certain liabilities and expenses arising out of the performance of their duties to the fund. Additionally, in the normal course of business, the fund enters into agreements with service providers that may contain indemnification clauses. The fund’s maximum exposure under these agreements is unknown as this would involve future claims that may be made against the fund that have not yet occurred.
Investment Transactions and Income – Investment transactions are recorded on the trade date. Dividends received in cash are recorded on the ex-dividend date. Certain dividends from foreign securities will be recorded when the fund is informed of the dividend if such information is obtained subsequent to the ex-dividend date. Dividend payments received in additional securities are recorded on the ex-dividend date in an amount equal to the value of the security on such date.
The fund may receive proceeds from litigation settlements. Any proceeds received from litigation involving portfolio holdings are reflected in the Statement of Operations in realized gain/loss if the security has been disposed of by the fund or in unrealized
32
Notes to Financial Statements – continued
gain/loss if the security is still held by the fund. Any other proceeds from litigation not related to portfolio holdings are reflected as other income in the Statement of Operations.
Tax Matters and Distributions – The fund intends to qualify as a regulated investment company, as defined under Subchapter M of the Internal Revenue Code, and to distribute all of its taxable income, including realized capital gains. As a result, no provision for federal income tax is required. The fund’s federal tax returns, when filed, will remain subject to examination by the Internal Revenue Service for a three year period. Management has analyzed the fund’s tax positions taken on federal and state tax returns for all open tax years and does not believe that there are any uncertain tax positions that require recognition of a tax liability. Foreign taxes, if any, have been accrued by the fund in the accompanying financial statements in accordance with the applicable foreign tax law. Foreign income taxes may be withheld by certain countries in which the fund invests. Additionally, capital gains realized by the fund on securities issued in or by certain foreign countries may be subject to capital gains tax imposed by those countries.
Distributions to shareholders are recorded on the ex-dividend date. Income and capital gain distributions are determined in accordance with income tax regulations, which may differ from U.S. generally accepted accounting principles. Certain capital accounts in the financial statements are periodically adjusted for permanent differences in order to reflect their tax character. These adjustments have no impact on net assets or net asset value per share. Temporary differences which arise from recognizing certain items of income, expense, gain or loss in different periods for financial statement and tax purposes will reverse at some time in the future. Distributions in excess of net investment income or net realized gains are temporary overdistributions for financial statement purposes resulting from differences in the recognition or classification of income or distributions for financial statement and tax purposes.
Book/tax differences primarily relate to passive foreign investment companies, wash sale loss deferrals, and treating a portion of the proceeds from redemptions as a distribution for tax purposes.
The tax character of distributions declared to shareholders for the last two fiscal years is as follows:
| | | | | | | | |
| | | Year ended | | | Year ended | |
| | | 8/31/18 | | | 8/31/17 | |
| Ordinary income (including any short-term capital gains) | | | $140,659 | | | | $59,859 | |
| Long-term capital gains | | | 1,080,057 | | | | — | |
| Total distributions | | | $1,220,716 | | | | $59,859 | |
33
Notes to Financial Statements – continued
The federal tax cost and the tax basis components of distributable earnings were as follows:
| | | | |
| As of 8/31/18 | | | |
| Cost of investments | | | $42,262,225 | |
| Gross appreciation | | | 12,894,714 | |
| Gross depreciation | | | (1,441,799 | ) |
| Net unrealized appreciation (depreciation) | | | $11,452,915 | |
| Undistributed ordinary income | | | 2,105,469 | |
| Undistributed long-term capital gain | | | 1,206,625 | |
| Other temporary differences | | | 12,615 | |
Multiple Classes of Shares of Beneficial Interest – The fund offers multiple classes of shares, which differ in their respective distribution and service fees. The fund’s income, realized and unrealized gain (loss), and common expenses are allocated to shareholders based on the daily net assets of each class. Dividends are declared separately for each class. Differences in per share dividend rates are generally due to differences in separate class expenses. Class B shares will convert to Class A shares approximately eight years after purchase. Effective April 23, 2018, Class C shares will convert to Class A shares approximately ten years after purchase. The fund’s distributions declared to shareholders as reported in the Statements of Changes in Net Assets are presented by class as follows:
| | | | | | | | | | | | | | | | |
| | | From net investment
income | | | From net realized
gain | |
| | | Year
ended
8/31/18 | | | Year
ended
8/31/17 | | | Year
ended
8/31/18 | | | Year
ended
8/31/17 | |
| Class A | | | $— | | | | $14,293 | | | | $257,614 | | | | $— | |
| Class B | | | — | | | | — | | | | 48,962 | | | | — | |
| Class C | | | — | | | | — | | | | 161,786 | | | | — | |
| Class I | | | — | | | | 31,973 | | | | 597,084 | | | | — | |
| Class R1 | | | — | | | | — | | | | 2,035 | | | | — | |
| Class R2 | | | — | | | | 47 | | | | 3,041 | | | | — | |
| Class R3 | | | — | | | | 214 | | | | 3,772 | | | | — | |
| Class R4 | | | — | | | | 243 | | | | 1,943 | | | | — | |
| Class R6 | | | — | | | | 13,089 | | | | 144,479 | | | | — | |
| Total | | | $— | | | | $59,859 | | | | $1,220,716 | | | | $— | |
(3) Transactions with Affiliates
Investment Adviser – The fund has an investment advisory agreement with MFS to provide overall investment management and related administrative services and facilities to the fund. The management fee is computed daily and paid monthly at the following annual rates based on the fund’s average daily net assets:
| | | | |
| Up to $1 billion | | | 0.975 | % |
| In excess of $1 billion and up to $2.5 billion | | | 0.90 | % |
| In excess of $2.5 billion | | | 0.85 | % |
34
Notes to Financial Statements – continued
MFS has agreed in writing to reduce its management fee by a specified amount if certain MFS mutual fund assets exceed thresholds agreed to by MFS and the fund’s Board of Trustees. For the year ended August 31, 2018, this management fee reduction amounted to $4,317, which is included in the reduction of total expenses in the Statement of Operations. The management fee incurred for the year ended August 31, 2018 was equivalent to an annual effective rate of 0.97% of the fund’s average daily net assets.
The investment adviser has agreed in writing to pay a portion of the fund’s total annual operating expenses, excluding interest, taxes, extraordinary expenses, brokerage and transaction costs, and investment-related expenses, such that total fund operating expenses do not exceed the following rates annually of each class’s average daily net assets:
| | | | | | | | | | | | | | | | | | | | | | | | | | | | | | | | |
| Classes | |
| A | | B | | | C | | | I | | | R1 | | | R2 | | | R3 | | | R4 | | | R6 | |
| 1.50% | | | 2.25% | | | | 2.25% | | | | 1.25% | | | | 2.25% | | | | 1.75% | | | | 1.50% | | | | 1.25% | | | | 1.22% | |
This written agreement will continue until modified by the fund’s Board of Trustees, but such agreement will continue at least until December 31, 2019. For the year ended August 31, 2018, this reduction amounted to $202,168, which is included in the reduction of total expenses in the Statement of Operations.
Distributor – MFS Fund Distributors, Inc. (MFD), a wholly-owned subsidiary of MFS, as distributor, received $8,687 for the year ended August 31, 2018, as its portion of the initial sales charge on sales of Class A shares of the fund.
The Board of Trustees has adopted a distribution plan for certain share classes pursuant to Rule 12b-1 of the Investment Company Act of 1940.
The fund’s distribution plan provides that the fund will pay MFD for services provided by MFD and financial intermediaries in connection with the distribution and servicing of certain share classes. One component of the plan is a distribution fee paid to MFD and another component of the plan is a service fee paid to MFD. MFD may subsequently pay all, or a portion, of the distribution and/or service fees to financial intermediaries.
Distribution Plan Fee Table:
| | | | | | | | | | | | | | | | | | | | |
| | | Distribution
Fee Rate (d) | | | Service
Fee Rate (d) | | | Total
Distribution
Plan (d) | | | Annual
Effective
Rate (e) | | | Distribution
and Service
Fee | |
| Class A | | | — | | | | 0.25% | | | | 0.25% | | | | 0.25% | | | | $24,009 | |
| Class B | | | 0.75% | | | | 0.25% | | | | 1.00% | | | | 0.99% | | | | 18,500 | |
| Class C | | | 0.75% | | | | 0.25% | | | | 1.00% | | | | 1.00% | | | | 51,301 | |
| Class R1 | | | 0.75% | | | | 0.25% | | | | 1.00% | | | | 1.00% | | | | 683 | |
| Class R2 | | | 0.25% | | | | 0.25% | | | | 0.50% | | | | 0.50% | | | | 804 | |
| Class R3 | | | — | | | | 0.25% | | | | 0.25% | | | | 0.25% | | | | 329 | |
| Total Distribution and Service Fees | | | | | | | | | | | | $95,626 | |
| (d) | In accordance with the distribution plan for certain classes, the fund pays distribution and/or service fees equal to these annual percentage rates of each class’s average daily net assets. The distribution and service fee rates disclosed by class represent the current rates in effect at the end of the reporting period. Any rate changes, if applicable, are detailed below. |
35
Notes to Financial Statements – continued
| (e) | The annual effective rates represent actual fees incurred under the distribution plan for the year ended August 31, 2018 based on each class’s average daily net assets. MFD has voluntarily agreed to rebate a portion of each class’s 0.25% service fee attributable to accounts for which MFD retains the 0.25% service fee except for accounts attributable to MFS or its affiliates’ seed money. For the year ended August 31, 2018, this rebate amounted to $341, $91, and $49 for Class A, Class B, and Class C, respectively, and is included in the reduction of total expenses in the Statement of Operations. |
Certain Class A shares are subject to a contingent deferred sales charge (CDSC) in the event of a shareholder redemption within 18 months of purchase. Class B shares are subject to a CDSC in the event of a shareholder redemption within six years of purchase. Class C shares are subject to a CDSC in the event of a shareholder redemption within 12 months of purchase. All contingent deferred sales charges are paid to MFD and during the year ended August 31, 2018, were as follows:
| | | | |
| | | Amount | |
| Class A | | | $75 | |
| Class B | | | 3,718 | |
| Class C | | | 694 | |
Shareholder Servicing Agent – MFS Service Center, Inc. (MFSC), a wholly-owned subsidiary of MFS, receives a fee from the fund for its services as shareholder servicing agent calculated as a percentage of the average daily net assets of the fund as determined periodically under the supervision of the fund’s Board of Trustees. For the year ended August 31, 2018, the fee was $7,713, which equated to 0.0163% annually of the fund’s average daily net assets. MFSC also receives payment from the fund for out-of-pocket expenses, sub-accounting and other shareholder servicing costs which may be paid to affiliated and unaffiliated service providers. Class R6 shares do not incur sub-accounting fees. For the year ended August 31, 2018, these out-of-pocket expenses, sub-accounting and other shareholder servicing costs amounted to $42,671.
Administrator – MFS provides certain financial, legal, shareholder communications, compliance, and other administrative services to the fund. Under an administrative services agreement, the fund reimburses MFS the costs incurred to provide these services. The fund is charged an annual fixed amount of $17,500 plus a fee based on average daily net assets. The administrative services fee incurred for the year ended August 31, 2018 was equivalent to an annual effective rate of 0.0370% of the fund’s average daily net assets.
Trustees’ and Officers’ Compensation – The fund pays compensation to independent Trustees in the form of a retainer, attendance fees, and additional compensation to Board and Committee chairpersons. The fund does not pay compensation directly to Trustees or officers of the fund who are also officers of the investment adviser, all of whom receive remuneration for their services to the fund from MFS. Certain officers and Trustees of the fund are officers or directors of MFS, MFD, and MFSC.
Other – This fund and certain other funds managed by MFS (the funds) have entered into a service agreement (the ISO Agreement) which provides for payment of fees solely by the funds to Tarantino LLC in return for the provision of services of an Independent Senior Officer (ISO) for the funds. Frank L. Tarantino serves as the ISO and
36
Notes to Financial Statements – continued
is an officer of the funds and the sole member of Tarantino LLC. The funds can terminate the ISO Agreement with Tarantino LLC at any time under the terms of the ISO Agreement. For the year ended August 31, 2018, the fee paid by the fund under this agreement was $77 and is included in “Miscellaneous” expense in the Statement of Operations. MFS has agreed to bear all expenses associated with office space, other administrative support, and supplies provided to the ISO.
The fund invests in the MFS Institutional Money Market Portfolio which is managed by MFS and seeks current income consistent with preservation of capital and liquidity. This money market fund does not pay a management fee to MFS.
On March 16, 2017, MFS redeemed 2,470 shares of Class I for an aggregate amount of $40,750. On March 19, 2018, MFS purchased 14,554 shares of Class I for an aggregate amount of $296,174. On August 16, 2018, MFS redeemed 874 shares of Class I for an aggregate amount of $18,243.
At August 31, 2018, MFS held approximately 99%, 51%, and 100% of the outstanding shares of Class R1, Class R3, and Class R4, respectively.
(4) Portfolio Securities
For the year ended August 31, 2018, purchases and sales of investments, other than short-term obligations, aggregated $25,170,032 and $16,521,075, respectively.
(5) Shares of Beneficial Interest
The fund’s Declaration of Trust permits the Trustees to issue an unlimited number of full and fractional shares of beneficial interest. Transactions in fund shares were as follows:
| | | | | | | | | | | | | | | | |
| | | Year ended
8/31/18 | | | Year ended
8/31/17 | |
| | | Shares | | | Amount | | | Shares | | | Amount | |
| Shares sold | | | | | | | | | | | | | | | | |
Class A | | | 203,981 | | | | $4,092,052 | | | | 88,458 | | | | $1,456,016 | |
Class B | | | 48,248 | | | | 937,186 | | | | 15,966 | | | | 256,375 | |
Class C | | | 52,856 | | | | 1,009,060 | | | | 38,470 | | | | 617,755 | |
Class I | | | 920,724 | | | | 18,531,591 | | | | 901,999 | | | | 15,445,210 | |
Class R1 | | | — | | | | — | | | | 10 | | | | 162 | |
Class R2 | | | 4,755 | | | | 95,370 | | | | 763 | | | | 12,159 | |
Class R3 | | | 753 | | | | 14,986 | | | | 2,275 | | | | 39,470 | |
Class R4 | | | 167 | | | | 3,399 | | | | — | | | | — | |
Class R6 | | | 100,539 | | | | 2,019,191 | | | | 135,405 | | | | 2,399,263 | |
| | | 1,332,023 | | | | $26,702,835 | | | | 1,183,346 | | | | $20,226,410 | |
37
Notes to Financial Statements – continued
| | | | | | | | | | | | | | | | |
| | | Year ended
8/31/18 | | | Year ended
8/31/17 | |
| | | Shares | | | Amount | | | Shares | | | Amount | |
| Shares issued to shareholders in reinvestment of distributions | | | | | | | | | | | | | | | | |
Class A | | | 13,513 | | | | $257,014 | | | | 913 | | | | $14,271 | |
Class B | | | 2,695 | | | | 48,962 | | | | — | | | | — | |
Class C | | | 8,904 | | | | 161,786 | | | | — | | | | — | |
Class I | | | 31,066 | | | | 597,084 | | | | 2,029 | | | | 31,973 | |
Class R1 | | | 112 | | | | 2,035 | | | | — | | | | — | |
Class R2 | | | 162 | | | | 3,041 | | | | 3 | | | | 47 | |
Class R3 | | | 198 | | | | 3,772 | | | | 14 | | | | 214 | |
Class R4 | | | 101 | | | | 1,943 | | | | 16 | | | | 243 | |
Class R6 | | | 3,791 | | | | 72,969 | | | | 19 | | | | 306 | |
| | | 60,542 | | | | $1,148,606 | | | | 2,994 | | | | $47,054 | |
| | | | |
| Shares reacquired | | | | | | | | | | | | | | | | |
Class A | | | (104,165 | ) | | | $(2,081,023 | ) | | | (404,026 | ) | | | $(6,520,285 | ) |
Class B | | | (14,007 | ) | | | (263,506 | ) | | | (8,306 | ) | | | (129,365 | ) |
Class C | | | (122,283 | ) | | | (2,359,276 | ) | | | (88,368 | ) | | | (1,409,046 | ) |
Class I | | | (582,661 | ) | | | (11,851,038 | ) | | | (270,179 | ) | | | (4,704,824 | ) |
Class R1 | | | — | | | | — | | | | (886 | ) | | | (13,503 | ) |
Class R2 | | | (1,218 | ) | | | (22,641 | ) | | | (92 | ) | | | (1,588 | ) |
Class R3 | | | (520 | ) | | | (10,303 | ) | | | (1,058 | ) | | | (17,688 | ) |
Class R4 | | | (167 | ) | | | (3,437 | ) | | | — | | | | — | |
Class R6 | | | (60,010 | ) | | | (1,201,739 | ) | | | (32,359 | ) | | | (547,033 | ) |
| | | (885,031 | ) | | | $(17,792,963 | ) | | | (805,274 | ) | | | $(13,343,332 | ) |
| | | | |
| Net change | | | | | | | | | | | | | | | | |
Class A | | | 113,329 | | | | $2,268,043 | | | | (314,655 | ) | | | $(5,049,998 | ) |
Class B | | | 36,936 | | | | 722,642 | | | | 7,660 | | | | 127,010 | |
Class C | | | (60,523 | ) | | | (1,188,430 | ) | | | (49,898 | ) | | | (791,291 | ) |
Class I | | | 369,129 | | | | 7,277,637 | | | | 633,849 | | | | 10,772,359 | |
Class R1 | | | 112 | | | | 2,035 | | | | (876 | ) | | | (13,341 | ) |
Class R2 | | | 3,699 | | | | 75,770 | | | | 674 | | | | 10,618 | |
Class R3 | | | 431 | | | | 8,455 | | | | 1,231 | | | | 21,996 | |
Class R4 | | | 101 | | | | 1,905 | | | | 16 | | | | 243 | |
Class R6 | | | 44,320 | | | | 890,421 | | | | 103,065 | | | | 1,852,536 | |
| | | 507,534 | | | | $10,058,478 | | | | 381,066 | | | | $6,930,132 | |
Class T shares were not publicly available for sale during the period. Please see the fund’s prospectus for details.
(6) Line of Credit
The fund and certain other funds managed by MFS participate in a $1.25 billion unsecured committed line of credit, subject to a $1 billion sublimit, provided by a syndication of banks under a credit agreement. Borrowings may be made for temporary financing needs. Interest is charged to each fund, based on its borrowings,
38
Notes to Financial Statements – continued
generally at a rate equal to the higher of the Overnight Bank Funding rate or daily one month LIBOR plus an agreed upon spread. A commitment fee, based on the average daily, unused portion of the committed line of credit, is allocated among the participating funds. In addition, the fund and other funds managed by MFS have established unsecured uncommitted borrowing arrangements with certain banks for temporary financing needs. Interest is charged to each fund, based on its borrowings, at a rate equal to the Overnight Bank Funding rate plus an agreed upon spread. For the year ended August 31, 2018, the fund’s commitment fee and interest expense were $266 and $0, respectively, and are included in “Miscellaneous” expense in the Statement of Operations.
(7) Investments in Affiliated Issuers
An affiliated issuer may be considered one in which the fund owns 5% or more of the outstanding voting securities, or a company which is under common control. For the purposes of this report, the fund assumes the following to be affiliated issuers:
| | | | | | | | | | | | | | | | | | | | |
| Affiliated Issuers | | | | | Beginning
Shares/Par
Amount | | | Acquisitions
Shares/Par
Amount | | | Dispositions
Shares/Par
Amount | | | Ending
Shares/Par
Amount | |
| MFS Institutional Money Market Portfolio | | | | | | | 260,547 | | | | 19,741,262 | | | | (19,021,119 | ) | | | 980,690 | |
| | | | | |
| Affiliated Issuers | | Realized
Gain (Loss) | | | Change in
Unrealized
Appreciation/
Depreciation | | | Capital Gain
Distributions | | | Dividend
Income | | | Ending
Value | |
| MFS Institutional Money Market Portfolio | | | $103 | | | | $169 | | | | $— | | | | $23,031 | | | | $980,690 | |
39
REPORT OF INDEPENDENT REGISTERED PUBLIC ACCOUNTING FIRM
To the Shareholders of MFS Global New Discovery Fund and the Board of Trustees of MFS Series Trust IV
Opinion on the Financial Statements
We have audited the accompanying statement of assets and liabilities of MFS Global New Discovery Fund (the “Fund”) (one of the funds constituting the MFS Series Trust IV (the “Trust”)), including the portfolio of investments, as of August 31, 2018, and the related statement of operations for the year then ended, the statements of changes in net assets for each of the two years in the period then ended, the financial highlights for each of the five years in the period then ended and the related notes (collectively referred to as the “financial statements”). In our opinion, the financial statements present fairly, in all material respects, the financial position of the Fund (one of the funds constituting the MFS Series Trust IV) at August 31, 2018, the results of its operations for the year then ended, the changes in its net assets for each of the two years in the period then ended and its financial highlights for each of the five years in the period then ended, in conformity with U.S. generally accepted accounting principles.
Basis for Opinion
These financial statements are the responsibility of the Trust’s management. Our responsibility is to express an opinion on the Fund’s financial statements based on our audits. We are a public accounting firm registered with the Public Company Accounting Oversight Board (United States) (“PCAOB”) and are required to be independent with respect to the Trust in accordance with the U.S. federal securities laws and the applicable rules and regulations of the Securities and Exchange Commission and the PCAOB.
We conducted our audits in accordance with the standards of the PCAOB. Those standards require that we plan and perform the audit to obtain reasonable assurance about whether the financial statements are free of material misstatement, whether due to error or fraud. The Trust is not required to have, nor were we engaged to perform, an audit of the Trust’s internal control over financial reporting. As part of our audits we are required to obtain an understanding of internal control over financial reporting but not for the purpose of expressing an opinion on the effectiveness of the Trust’s internal control over financial reporting. Accordingly, we express no such opinion.
Our audits included performing procedures to assess the risks of material misstatement of the financial statements, whether due to error or fraud, and performing procedures that respond to those risks. Such procedures included examining, on a test basis, evidence regarding the amounts and disclosures in the financial statements. Our procedures included confirmation of securities owned as of August 31, 2018, by correspondence with the custodian and others or by other appropriate auditing procedures where replies from others were not received. Our audits also included
40
Report of Independent Registered Public Accounting Firm – continued
evaluating the accounting principles used and significant estimates made by management, as well as evaluating the overall presentation of the financial statements. We believe that our audits provide a reasonable basis for our opinion.

We have served as the auditor of one or more MFS investment companies since 1993.
Boston, Massachusetts
October 16, 2018
41
TRUSTEES AND OFFICERS —
IDENTIFICATION AND BACKGROUND
The Trustees and Officers of the Trust, as of October 1, 2018, are listed below, together with their principal occupations during the past five years. (Their titles may have varied during that period.) The address of each Trustee and Officer is 111 Huntington Avenue, Boston, Massachusetts 02199-7618.
| | | | | | | | | | |
Name, Age | | Position(s)
Held with Fund | | Trustee/Officer Since (h) | | Number of
MFS Funds
overseen by the Trustee | | Principal
Occupations During the Past Five Years | | Other Directorships During the Past Five Years (j) |
| INTERESTED TRUSTEES |
Robert J. Manning (k)
(age 54) | | Trustee | | February 2004 | | 135 | | Massachusetts Financial Services Company, Executive Chairman (since January 2017); Director; Chairman of the Board; Chief Executive Officer (until 2015); Co-Chief Executive Officer (2015-2016) | | N/A |
Robin A. Stelmach (k)
(age 57) | | Trustee | | January 2014 | | 135 | | Massachusetts Financial Services Company, Vice Chair (since January 2017); Chief Operating Officer and Executive Vice President (until January 2017) | | N/A |
| INDEPENDENT TRUSTEES |
John P. Kavanaugh
(age 63) | | Trustee and Chair of Trustees | | January 2009 | | 135 | | Private investor | | N/A |
Steven E. Buller
(age 67) | | Trustee | | February 2014 | | 135 | | Financial Accounting Standards Advisory Council, Chairman (2014-2015); Public Company Accounting Oversight Board, Standing Advisory Group, Member (until 2014); BlackRock, Inc. (investment management), Managing Director (until 2014), BlackRock Finco UK (investment management), Director (until 2014) | | N/A |
42
Trustees and Officers – continued
| | | | | | | | | | |
Name, Age | | Position(s)
Held with Fund | | Trustee/Officer Since (h) | | Number of
MFS Funds
overseen by the Trustee | | Principal
Occupations During the Past Five Years | | Other Directorships During the Past Five Years (j) |
John A. Caroselli
(age 64) | | Trustee | | March 2017 | | 135 | | JC Global Advisors, LLC (management consulting), President (since 2015); First Capital Corporation (commercial finance), Executive Vice President (until 2015) | | N/A |
Maureen R. Goldfarb
(age 63) | | Trustee | | January 2009 | | 135 | | Private investor | | N/A |
Michael Hegarty
(age 73) | | Trustee | | December 2004 | | 135 | | Private investor | | Rouse Properties Inc., Director (until 2016); Capmark Financial Group Inc., Director (until 2015) |
Clarence Otis, Jr.
(age 62) | | Trustee | | March 2017 | | 135 | | Darden Restaurants, Inc., Chief Executive Officer (until 2014) | | VF Corporation, Director; Verizon Communications, Inc., Director; The Travelers Companies, Director; Federal Reserve Bank of Atlanta, Director (until 2015) |
Maryanne L. Roepke
(age 62) | | Trustee | | May 2014 | | 135 | | American Century Investments (investment management), Senior Vice President and Chief Compliance Officer (until 2014) | | N/A |
Laurie J. Thomsen
(age 61) | | Trustee | | March 2005 | | 135 | | Private investor | | The Travelers Companies, Director; Dycom Industries, Inc., Director (since 2015) |
43
Trustees and Officers – continued
| | | | | | | | |
Name, Age | | Position(s) Held with Fund | | Trustee/Officer
Since (h) | | Number of MFS Funds for which the Person is an Officer | | Principal
Occupations During the Past Five Years |
| OFFICERS | | | | | | | | |
Christopher R. Bohane (k)
(age 44) | | Assistant Secretary and Assistant Clerk | | July 2005 | | 135 | | Massachusetts Financial Services Company, Vice President and Assistant General Counsel |
Kino Clark (k)
(age 50) | | Assistant Treasurer | | January 2012 | | 135 | | Massachusetts Financial Services Company, Vice President |
John W. Clark, Jr. (k)
(age 51) | | Assistant Treasurer | | April 2017 | | 135 | | Massachusetts Financial Services Company, Vice President (since March 2017); Deutsche Bank (financial services), Department Head – Treasurer’s Office (until February 2017) |
Thomas H. Connors (k)
(age 59) | | Assistant Secretary and Assistant Clerk | | September 2012 | | 135 | | Massachusetts Financial Services Company, Vice President and Senior Counsel |
Ethan D. Corey (k)
(age 54) | | Assistant Secretary and Assistant Clerk | | July 2005 | | 135 | | Massachusetts Financial Services Company, Senior Vice President and Associate General Counsel |
David L. DiLorenzo (k)
(age 50) | | President | | July 2005 | | 135 | | Massachusetts Financial Services Company, Senior Vice President |
44
Trustees and Officers – continued
| | | | | | | | |
Name, Age | | Position(s) Held with Fund | | Trustee/Officer
Since (h) | | Number of MFS Funds for which the Person is an Officer | | Principal
Occupations During the Past Five Years |
Heidi W. Hardin (k)
(age 51) | | Secretary and Clerk | | April 2017 | | 135 | | Massachusetts Financial Services Company, Executive Vice President and General Counsel (since March 2017); Harris Associates (investment management), General Counsel (from September 2015 to January 2017); Janus Capital Management LLC (investment management), Senior Vice President and General Counsel (until September 2015) |
Brian E. Langenfeld (k)
(age 45) | | Assistant Secretary and Assistant Clerk | | June 2006 | | 135 | | Massachusetts Financial Services Company, Vice President and Senior Counsel |
Amanda S. Mooradian (k)
(age 39) | | Assistant Secretary and Assistant Clerk | | September 2018 | | 135 | | Massachusetts Financial Services Company, Assistant Vice President and Counsel |
Susan A. Pereira (k)
(age 47) | | Assistant Secretary and Assistant Clerk | | July 2005 | | 135 | | Massachusetts Financial Services Company, Vice President and Senior Counsel |
Kasey L. Phillips (k)
(age 47) | | Assistant Treasurer | | September 2012 | | 135 | | Massachusetts Financial Services Company, Vice President |
Matthew A. Stowe (k)
(age 43) | | Assistant Secretary and Assistant Clerk | | October 2014 | | 135 | | Massachusetts Financial Services Company, Vice President and Assistant General Counsel |
45
Trustees and Officers – continued
| | | | | | | | |
Name, Age | | Position(s) Held with Fund | | Trustee/Officer
Since (h) | | Number of MFS Funds for which the Person is an Officer | | Principal
Occupations During the Past Five Years |
Frank L. Tarantino
(age 74) | | Independent
Senior Officer | | June 2004 | | 135 | | Tarantino LLC (provider of compliance services), Principal |
Richard S. Weitzel (k)
(age 48) | | Assistant Secretary and Assistant Clerk | | October 2007 | | 135 | | Massachusetts Financial Services Company, Senior Vice President and Associate General Counsel |
Martin J. Wolin (k)
(age 51) | | Chief Compliance Officer | | July 2015 | | 135 | | Massachusetts Financial Services Company, Senior Vice President and Chief Compliance Officer (since July 2015); Mercer (financial service provider), Chief Risk and Compliance Officer, North America and Latin America (until June 2015) |
James O. Yost (k)
(age 58) | | Treasurer | | September 1990 | | 135 | | Massachusetts Financial Services Company, Senior Vice President |
| (h) | Date first appointed to serve as Trustee/officer of an MFS Fund. Each Trustee has served continuously since appointment unless indicated otherwise. For the period from December 15, 2004 until February 22, 2005, Mr. Manning served as Advisory Trustee. From January 2012 through December 2016, Messrs. DiLorenzo and Yost served as Treasurer and Deputy Treasurer of the Funds, respectively. |
| (j) | Directorships or trusteeships of companies required to report to the Securities and Exchange Commission (i.e., “public companies”). |
| (k) | “Interested person” of the Trust within the meaning of the Investment Company Act of 1940 (referred to as the 1940 Act), which is the principal federal law governing investment companies like the fund, as a result of a position with MFS. The address of MFS is 111 Huntington Avenue, Boston, Massachusetts 02199-7618. |
Each Trustee has been elected by shareholders and each Trustee and officer holds office until his or her successor is chosen and qualified or until his or her earlier death, resignation, retirement or removal. The Trust does not hold annual meetings for the purpose of electing Trustees, and Trustees are not elected for fixed terms. Under the terms of the Board’s retirement policy, an Independent Trustee shall retire at the end of
46
Trustees and Officers – continued
the calendar year in which he or she reaches the earlier of 75 years of age or 15 years of service on the Board (or, in the case of any Independent Trustee who joined the Board prior to 2015, 20 years of service on the Board).
Messrs. Buller and Otis and Ms. Roepke are members of the Trust’s Audit Committee.
Each of the Interested Trustees and certain Officers hold comparable officer positions with certain affiliates of MFS.
The Statement of Additional Information for a Fund includes further information about the Trustees and is available without charge upon request by calling 1-800-225-2606.
| | |
| Investment Adviser | | Custodian |
Massachusetts Financial Services Company
111 Huntington Avenue Boston, MA 02199-7618 | | State Street Bank and Trust Company 1 Lincoln Street Boston, MA 02111-2900 |
| Distributor | | Independent Registered Public Accounting Firm |
MFS Fund Distributors, Inc.
111 Huntington Avenue Boston, MA 02199-7618 | | Ernst & Young LLP 200 Clarendon Street Boston, MA 02116 |
| Portfolio Manager(s) | | |
| Peter Fruzzetti | | |
| Michael Grossman | | |
47
BOARD REVIEW OF INVESTMENT ADVISORY AGREEMENT
The Investment Company Act of 1940 requires that both the full Board of Trustees and a majority of the non-interested (“independent”) Trustees, voting separately, annually approve the continuation of the Fund’s investment advisory agreement with MFS. The Trustees consider matters bearing on the Fund and its advisory arrangements at their meetings throughout the year, including a review of performance data at each regular meeting. In addition, the independent Trustees met several times over the course of three months beginning in May and ending in July, 2018 (“contract review meetings”) for the specific purpose of considering whether to approve the continuation of the investment advisory agreement for the Fund and the other investment companies that the Board oversees (the “MFS Funds”). The independent Trustees were assisted in their evaluation of the Fund’s investment advisory agreement by independent legal counsel, from whom they received separate legal advice and with whom they met separately from MFS during various contract review meetings. The independent Trustees were also assisted in this process by the MFS Funds’ Independent Senior Officer, a senior officer appointed by and reporting to the independent Trustees.
In connection with their deliberations regarding the continuation of the investment advisory agreement, the Trustees, including the independent Trustees, considered such information and factors as they believed, in light of the legal advice furnished to them and their own business judgment, to be relevant. The investment advisory agreement for the Fund was considered separately, although the Trustees also took into account the common interests of all MFS Funds in their review. As described below, the Trustees considered the nature, quality, and extent of the various investment advisory, administrative, and shareholder services performed by MFS under the existing investment advisory agreement and other arrangements with the Fund.
In connection with their contract review meetings, the Trustees received and relied upon materials that included, among other items: (i) information provided by Broadridge Financial Solutions, Inc. (“Broadridge”), an independent third party, on the investment performance of the Fund for various time periods ended December 31, 2017 and the investment performance of a group of funds with substantially similar investment classifications/objectives (the “Broadridge performance universe”), (ii) information provided by Broadridge on the Fund’s advisory fees and other expenses and the advisory fees and other expenses of comparable funds identified by Broadridge (the “Broadridge expense group”), (iii) information provided by MFS on the advisory fees of portfolios of other clients of MFS, including institutional separate accounts and other clients, (iv) information as to whether and to what extent applicable expense waivers, reimbursements or fee “breakpoints” are observed for the Fund, (v) information regarding MFS’ financial results and financial condition, including MFS’ and certain of its affiliates’ estimated profitability from services performed for the Fund and the MFS Funds as a whole, and compared to MFS’ institutional business, (vi) MFS’ views regarding the outlook for the mutual fund industry and the strategic business plans of MFS, (vii) descriptions of various functions performed by MFS for the Funds, such as compliance monitoring and portfolio trading practices, and (viii) information regarding the overall organization of MFS, including information
about MFS’ senior management and other personnel providing investment advisory,
48
Board Review of Investment Advisory Agreement – continued
administrative and other services to the Fund and the other MFS Funds. The comparative performance, fee and expense information prepared and provided by Broadridge was not independently verified and the independent Trustees did not independently verify any information provided to them by MFS.
The Trustees’ conclusion as to the continuation of the investment advisory agreement was based on a comprehensive consideration of all information provided to the Trustees and not the result of any single factor. Some of the factors that figured particularly in the Trustees’ deliberations are described below, although individual Trustees may have evaluated the information presented differently from one another, giving different weights to various factors. It is also important to recognize that the fee arrangements for the Fund and other MFS Funds are the result of years of review and discussion between the independent Trustees and MFS, that certain aspects of such arrangements may receive greater scrutiny in some years than in others, and that the Trustees’ conclusions may be based, in part, on their consideration of these same arrangements during the course of the year and in prior years.
Based on information provided by Broadridge and MFS, the Trustees reviewed the Fund’s total return investment performance as well as the Broadridge performance universe over various time periods. The Trustees placed particular emphasis on the total return performance of the Fund’s Class A shares in comparison to the performance of funds in its Broadridge performance universe over the three-year period ended December 31, 2017, which the Trustees believed was a long enough period to reflect differing market conditions. The total return performance of the Fund’s Class A shares was in the 2nd quintile relative to the other funds in the universe for this three-year period (the 1st quintile being the best performers and the 5th quintile being the worst performers). The total return performance of the Fund’s Class A shares was in the 2nd quintile for the one-year period and the 3rd quintile for the five-year period ended December 31, 2017 relative to the Broadridge performance universe. Because of the passage of time, these performance results may differ from the performance results for more recent periods, including those shown elsewhere in this report.
In addition to considering the performance information provided in connection with the contract review meetings, the Trustees noted that, in light of the Fund’s substandard relative performance at the time of their contract review meetings in 2017, they had met at each of their regular meetings since then with MFS’ senior investment management personnel to discuss the Fund’s performance and MFS’ efforts to improve the Fund’s performance. The Trustees further noted that the Fund’s three-year performance as compared to its benchmark improved for the period ended December 31, 2017, as compared to the prior year. Taking this information into account, the Trustees concluded, within the context of their overall conclusions regarding the investment advisory agreement, that they were satisfied with MFS’ responses and efforts relating to investment performance.
In assessing the reasonableness of the Fund’s advisory fee, the Trustees considered, among other information, the Fund’s advisory fee and the total expense ratio of the Fund’s Class A shares as a percentage of average daily net assets and the advisory fee and total expense ratios of peer groups of funds based on information provided by Broadridge. The Trustees considered that MFS currently observes an expense limitation
49
Board Review of Investment Advisory Agreement – continued
for the Fund, which may not be changed without the Trustees’ approval. The Trustees also considered that, according to the data provided by Broadridge (which takes into account any fee reductions or expense limitations that were in effect during the Fund’s last fiscal year), the Fund’s effective advisory fee rate and total expense ratio were each approximately at the Broadridge expense group median.
The Trustees also considered the advisory fees charged by MFS to any institutional separate accounts advised by MFS (“separate accounts”) and unaffiliated investment companies for which MFS serves as subadviser (“subadvised funds”) that have comparable investment strategies to the Fund, if any. In comparing these fees, the Trustees considered information provided by MFS as to the generally broader scope of services provided by MFS to the Fund, as well as the more extensive regulatory burdens imposed on MFS in managing the Fund, in comparison to separate accounts and subadvised funds. The Trustees also considered the higher demands placed on MFS’ investment personnel and trading infrastructure as a result of the daily cash in-flows and out-flows of the Fund in comparison to separate accounts.
The Trustees also considered whether the Fund may benefit from any economies of scale in the management of the Fund in the event of growth in assets of the Fund and/or growth in assets of the MFS Funds as a whole. They noted that the Fund’s advisory fee rate schedule is subject to contractual breakpoints that reduce the Fund’s advisory fee rate on average daily net assets over $1 billion and $2.5 billion. The Trustees also noted that MFS has agreed in writing to waive a portion of the management fees of certain MFS Funds, including the Fund, if the total combined assets of certain funds within the MFS Funds’ complex increase above agreed upon thresholds (the “group fee waiver”), enabling the Fund’s shareholders to share in the benefits from any economies of scale at the complex level. The group fee waiver is reviewed and renewed annually between the Board and MFS. The Trustees concluded that the breakpoints and the group fee waiver were sufficient to allow the Fund to benefit from economies of scale as its assets and overall complex assets grow.
The Trustees also considered information prepared by MFS relating to MFS’ costs and profits with respect to the Fund, the MFS Funds considered as a group, and other investment companies and accounts advised by MFS, as well as MFS’ methodologies used to determine and allocate its costs to the MFS Funds, the Fund and other accounts and products for purposes of estimating profitability.
After reviewing these and other factors described herein, the Trustees concluded, within the context of their overall conclusions regarding the investment advisory agreement, that the advisory fees charged to the Fund represent reasonable compensation in light of the services being provided by MFS to the Fund.
In addition, the Trustees considered MFS’ resources and related efforts to continue to retain, attract and motivate capable personnel to serve the Fund. The Trustees also considered current and developing conditions in the financial services industry, including the presence of large and well-capitalized companies which are spending, and appear to be prepared to continue to spend, substantial sums to engage personnel and to provide services to competing investment companies. In this regard, the Trustees also considered the financial resources of MFS and its ultimate parent,
50
Board Review of Investment Advisory Agreement – continued
Sun Life Financial Inc. The Trustees also considered the advantages and possible disadvantages to the Fund of having an adviser that also serves other investment companies as well as other accounts.
The Trustees also considered the nature, quality, cost, and extent of administrative, transfer agency, and distribution services provided to the Fund by MFS and its affiliates under agreements and plans other than the investment advisory agreement, including any 12b-1 fees the Fund pays to MFS Fund Distributors, Inc., an affiliate of MFS. The Trustees also considered the nature, extent and quality of certain other services MFS performs or arranges for on the Fund’s behalf, which may include securities lending programs, directed expense payment programs, class action recovery programs, and MFS’ interaction with third-party service providers, principally custodians and sub-custodians. The Trustees concluded that the various non-advisory services provided by MFS and its affiliates on behalf of the Fund were satisfactory.
The Trustees considered so-called “fall-out benefits” to MFS such as reputational value derived from serving as investment manager to the MFS Funds. The Trustees also considered that, effective January 3, 2018, MFS had discontinued its historic practice of obtaining investment research from portfolio brokerage commissions paid by certain MFS Funds and would thereafter voluntarily reimburse a Fund, if applicable, for the costs of external research acquired through the use of the Fund’s portfolio brokerage commissions.
Based on their evaluation of factors that they deemed to be material, including those factors described above, the Board of Trustees, including the independent Trustees, concluded that the Fund’s investment advisory agreement with MFS should be continued for an additional one-year period, commencing August 1, 2018.
51
PROXY VOTING POLICIES AND INFORMATION
MFS votes proxies on behalf of the fund pursuant to proxy voting policies and procedures that are available without charge, upon request, by calling 1-800-225-2606, by visiting mfs.com/proxyvoting, or by visiting the SEC’s Web site at http://www.sec.gov.
Information regarding how the fund voted proxies relating to portfolio securities during the most recent twelve-month period ended June 30 is available by August 31 of each year without charge by visiting mfs.com/proxyvoting, or by visiting the SEC’s Web site at http://www.sec.gov.
QUARTERLY PORTFOLIO DISCLOSURE
The fund files a complete schedule of portfolio holdings with the Securities and Exchange Commission (the Commission) for the first and third quarters of each fiscal year on Form N-Q. A shareholder can obtain the quarterly portfolio holdings report at mfs.com. The fund’s Form N-Q is also available on the EDGAR database on the Commission’s Internet Web site at http://www.sec.gov, and may be reviewed and copied at the:
Public Reference Room
Securities and Exchange Commission
100 F Street, NE, Room 1580
Washington, D.C. 20549
Information on the operation of the Public Reference Room may be obtained by calling the Commission at 1-800-SEC-0330. Copies of the fund’s Form N-Q also may be obtained, upon payment of a duplicating fee, by electronic request at the following e-mail address: publicinfo@sec.gov or by writing the Public Reference Section at the above address.
FURTHER INFORMATION
From time to time, MFS may post important information about the fund or the MFS funds on the MFS web site (mfs.com). This information is available at https://www.mfs.com/en-us/what-we-do/announcements.html or at mfs.com/openendfunds by choosing the fund’s name.
52
INFORMATION ABOUT FUND CONTRACTS AND LEGAL CLAIMS
The fund has entered into contractual arrangements with an investment adviser, administrator, distributor, shareholder servicing agent, 529 program manager (if applicable), and custodian who each provide services to the fund. Unless expressly stated otherwise, shareholders are not parties to, or intended beneficiaries of these contractual arrangements, and these contractual arrangements are not intended to create any shareholder right to enforce them against the service providers or to seek any remedy under them against the service providers, either directly or on behalf of the fund.
Under the Trust’s By-Laws and Declaration of Trust, any claims asserted against or on behalf of the MFS Funds, including claims against Trustees and Officers, must be brought in state and federal courts located within the Commonwealth of Massachusetts.
FEDERAL TAX INFORMATION (unaudited)
The fund will notify shareholders of amounts for use in preparing 2018 income tax forms in January 2019. The following information is provided pursuant to provisions of the Internal Revenue Code.
The fund designates the maximum amount allowable as qualified dividend income eligible to be taxed at the same rate as long-term capital gain.
The fund designates $1,725,000 as capital gain dividends paid during the fiscal year.
For corporate shareholders, 28.45% of the ordinary income dividends paid during the fiscal year qualify for the corporate dividends received deduction.
Income derived from foreign sources was $506,676. The fund intends to pass through foreign tax credits of $40,546 for the fiscal year.
53
rev. 3/16
| | | | |
| | | |
FACTS | | WHAT DOES MFS DO WITH YOUR PERSONAL INFORMATION? | |  |
| | |
| Why? | | Financial companies choose how they share your personal information. Federal law gives consumers the right to limit some but not all sharing. Federal law also requires us to tell you how we collect, share, and protect your personal information. Please read this notice carefully to understand what we do. |
| | |
| What? | | The types of personal information we collect and share depend on the product or service you have with us. This information can include: • Social Security number and account balances • Account transactions and transaction history • Checking account information and wire transfer instructions When you are no longer our customer, we continue to share your information as described in this notice. |
| | |
| How? | | All financial companies need to share customers’ personal information to run their everyday business. In the section below, we list the reasons financial companies can share their customers’ personal information; the reasons MFS chooses to share; and whether you can limit this sharing. |
| | | | |
Reasons we can share your
personal information | | Does MFS
share? | | Can you limit
this sharing? |
For our everyday business purposes – such as to process your transactions, maintain your account(s), respond to court orders and legal investigations, or report to credit bureaus | | Yes | | No |
For our marketing purposes – to offer our products and services to you | | No | | We don’t share |
For joint marketing with other financial companies | | No | | We don’t share |
For our affiliates’ everyday business purposes – information about your transactions and experiences | | No | | We don’t share |
For our affiliates’ everyday business purposes – information about your creditworthiness | | No | | We don’t share |
| For nonaffiliates to market to you | | No | | We don’t share |
| | |
| Questions? | | Call 800-225-2606 or go to mfs.com. |
54
| | |
| Who we are |
| Who is providing this notice? | | MFS Funds, MFS Investment Management, MFS Institutional Advisors, Inc., and MFS Heritage Trust Company. |
| | |
| What we do |
| How does MFS protect my personal information? | | To protect your personal information from unauthorized access and use, we use security measures that comply with federal law. These measures include procedural, electronic, and physical safeguards for the protection of the personal information we collect about you. |
| How does MFS collect my personal information? | | We collect your personal information, for example, when you • open an account or provide account information • direct us to buy securities or direct us to sell your securities • make a wire transfer We also collect your personal information from others, such as credit bureaus, affiliates, or other companies. |
| Why can’t I limit all sharing? | | Federal law gives you the right to limit only • sharing for affiliates’ everyday business purposes – information about your creditworthiness • affiliates from using your information to market to you • sharing for nonaffiliates to market to you State laws and individual companies may give you additional rights to limit sharing. |
| | |
| Definitions |
| Affiliates | | Companies related by common ownership or control. They can be financial and nonfinancial companies. • MFS does not share personal information with affiliates, except for everyday business purposes as described on page one of this notice. |
| Nonaffiliates | | Companies not related by common ownership or control. They can be financial and nonfinancial companies. • MFS does not share with nonaffiliates so they can market to you. |
| Joint marketing | | A formal agreement between nonaffiliated financial companies that together market financial products or services to you. • MFS doesn’t jointly market. |
| | |
| Other important information |
| If you own an MFS product or receive an MFS service in the name of a third party such as a bank or broker-dealer, their privacy policy may apply to you instead of ours. |
55
Save paper with eDelivery.

| MFS® will send you prospectuses, |
reports, and proxies directly via e-mail so you will get information faster with less mailbox clutter.
To sign up:
1. Go to mfs.com.
2. Log in via MFS® Access.
3. Select eDelivery.
If you own your MFS fund shares through a financial institution or a retirement plan, MFS® TALK, MFS® Access, or eDelivery may not be available to you.
CONTACT
WEB SITE
mfs.com
MFS TALK
1-800-637-8255
24 hours a day
ACCOUNT SERVICE AND LITERATURE
Shareholders
1-800-225-2606
Financial advisors
1-800-343-2829
Retirement plan services
1-800-637-1255
MAILING ADDRESS
MFS Service Center, Inc.
P.O. Box 55824
Boston, MA 02205-5824
OVERNIGHT MAIL
MFS Service Center, Inc.
c/o DST Asset Manager Solutions, Inc.
30 Dan Road
Canton, MA 02021-2809
Annual Report
August 31, 2018

MFS® Mid Cap Growth Fund

OTC-ANN
MFS® Mid Cap Growth Fund
CONTENTS
The report is prepared for the general information of shareholders.
It is authorized for distribution to prospective investors only when preceded or accompanied by a current prospectus.
NOT FDIC INSURED • MAY LOSE VALUE • NO BANK GUARANTEE

LETTER FROM THE EXECUTIVE CHAIRMAN
Dear Shareholders:
The strengthening U.S. dollar, international trade friction and geopolitical uncertainty have contributed to a measurable uptick in market volatility in recent quarters — a
departure from the low-volatility environment that prevailed for much of 2017. Against this more challenging backdrop, global markets have become less synchronized, with equity markets in the United States outperforming most international markets. Global economic growth remains healthy, notwithstanding signs of a modest slowdown over the past few months, particularly in Europe, China and some emerging markets.
Although the U.S. Federal Reserve continues to gradually raise interest rates and shrink its balance sheet, monetary policy remains accommodative around the world, with many central
banks taking only tentative steps toward tighter policies. Newly enacted U.S. tax reforms have been welcomed by equity markets while emerging market economies have recently had to contend with tighter financial conditions as a result of firmer U.S. Treasury yields and a stronger dollar. Around the world, inflation remains largely subdued, but tight labor markets and solid global demand have investors on the lookout for its potential reappearance. Increased U.S. protectionism is also a growing concern, as investors fear that trade disputes could dampen business sentiment, leading to slower global growth.
As a global investment manager with nearly a century of expertise, MFS® firmly believes that active risk management offers downside mitigation and may help improve investment outcomes, and we built our active investment platform with that in mind. Our long-term perspective influences nearly every aspect of our business, but most importantly, it aligns our investment decisions with clients’ investing time horizons.
Respectfully,

Robert J. Manning
Executive Chairman
MFS Investment Management
October 16, 2018
The opinions expressed in this letter are subject to change and may not be relied upon for investment advice. No forecasts can be guaranteed.
1
PORTFOLIO COMPOSITION
Portfolio structure
| | | | |
| Top ten holdings | | | | |
| Bright Horizons Family Solutions, Inc. | | | 3.1% | |
| PerkinElmer, Inc. | | | 2.6% | |
| Take-Two Interactive Software, Inc. | | | 2.1% | |
| Global Payments, Inc. | | | 2.1% | |
| AMETEK, Inc. | | | 2.0% | |
| Copart, Inc. | | | 1.9% | |
| NASDAQ, Inc. | | | 1.8% | |
| SS&C Technologies Holdings, Inc. | | | 1.8% | |
| Roper Industries, Inc. | | | 1.8% | |
| Steris PLC | | | 1.7% | |
| | | | |
| Equity sectors | | | | |
| Special Products & Services | | | 17.8% | |
| Technology | | | 16.3% | |
| Health Care | | | 13.4% | |
| Industrial Goods & Services | | | 12.1% | |
| Leisure | | | 10.9% | |
| Autos & Housing | | | 7.9% | |
| Financial Services | | | 6.6% | |
| Retailing | | | 5.0% | |
| Basic Materials | | | 2.0% | |
| Consumer Staples | | | 1.7% | |
| Transportation | | | 1.3% | |
| Utilities & Communications | | | 1.3% | |
| Energy | | | 1.1% | |
Cash & Cash Equivalents includes any cash, investments in money market funds, short-term securities, and other assets less liabilities. Please see the Statement of Assets and Liabilities for additional information related to the fund’s cash position and other assets and liabilities.
Percentages are based on net assets as of August 31, 2018.
The portfolio is actively managed and current holdings may be different.
2
MANAGEMENT REVIEW
Summary of Results
For the twelve months ended August 31, 2018, Class A shares of the MFS Mid Cap Growth Fund (“fund”) provided a total return of 27.69%, at net asset value. This compares with a return of 25.06% for the fund’s benchmark, the Russell Midcap® Growth Index.
Market Environment
Despite headwinds from increasing global trade tensions, several US equity indices advanced to set new record highs late in the period after rebounding from a mid-period market correction. Very strong earnings per share and revenue growth, helped in part by the 2017 US tax reform package, has underpinned the advance, as has solid US economic growth. Strong fundamentals have brought US equity valuations down more in line with long-term average valuations from elevated levels early in the period. While the US economy has maintained its strength, global economic growth became less synchronized during the period, with Europe and China showing signs of a modest slowdown and some emerging markets coming under stress.
During the period, the US Federal Reserve raised interest rates by 75 basis points, bringing the total number of hikes to seven since the central bank began to normalize monetary policy in late 2015. The growth rate in the US, Eurozone and Japan remained above trend, although inflation remained contained, particularly outside the US. Late in the period, the European Central Bank announced that it would halt its asset purchase program at the end of 2018, but issued forward guidance that it does not expect to raise interest rates at least until after the summer of 2019. Both the Bank of England and the Bank of Canada raised rates several times during the period. The European political backdrop became a bit more volatile late in the period, spurred by a chaotic process which resulted in the formation of an anti-establishment, Eurosceptic coalition government in Italy.
Bond yields rose in the US during the period but remained low by historical standards, while yields in many developed markets fell. Credit spreads remained relatively tight but widened modestly, late in the period, as market volatility increased. Growing concern over increasing global trade friction appeared to have weighed on business sentiment during the period’s second half, especially outside the US. Tighter financial conditions from rising US rates and a strong dollar combined with trade uncertainty helped expose structural weaknesses in several emerging markets late in the period.
Contributors to Performance
Stock selection in both the autos & housing and special products & services sectors contributed to performance relative to the Russell Midcap® Growth Index. Within the autos & housing sector, holding shares of commercial and residential landscape supplies distributor Siteone Landscape Supply (b), and an overweight position in online vehicle auctioneer Copart, lifted relative returns. Shares of Siteone Landscape Supply advanced over the period as the company reported strong net sales growth. Within the special products & services sector, the fund’s overweight position in child care and early education provider Bright Horizons Family Solutions benefited relative performance. Bright Horizons Family Solutions’ stock rose on the back of a lower effective tax rate, higher revenues and improved operating margins.
3
Management Review – continued
Both security selection and an underweight position in the basic materials sector also supported relative performance. However, there were no individual stocks within this sector that were among the fund’s top relative contributors during the reporting period.
Stocks in other sectors that contributed to relative returns included owning shares of internet TV show and movie subscription services provider Netflix (b), specialty value retailer Five Below (b) and computer graphics processors maker NVIDIA (b). Shares of Netflix benefited from strong domestic and international subscriber growth as the company’s original content development strategy appeared successful in attracting and retaining customers. Additionally, not holding shares of biopharmaceutical company Incyte and social networking service provider Twitter, as well as overweight positions in software developer PTC and financial services software designer SS&C Technologies Holdings, aided relative results.
Detractors from Performance
Security selection in both the industrial goods & services and consumer staples sectors weighed on relative performance over the reporting period. Although stock selection had an unfavorable impact within the industrial goods & services sector, there were no individual securities within this sector among the fund’s top relative detractors during the reporting period. Within the consumer staples sector, the fund’s holdings of commercial products manufacturer Newell Brands (b)(h) weakened relative returns. Shares of Newell Brands declined as the company reported weaker-than-expected sales results due, in part, to the impacts of hurricane Harvey, and as three of its well-regarded board members resigned during the period.
Elsewhere, the fund’s holdings of video game maker Electronic Arts (b), as well as overweight positions in shares of remote access and support solutions provider LogMeIn, electronic and mechanical vehicle products manufacturer WABCO Holdings, healthcare products and services provider Henry Schein, casino operator MGM Resorts International and consumer credit reporting agency Equifax (h), hurt relative performance. Shares of Electronic Arts came under pressure at the end of the reporting period as the company reduced its full-year guidance due to a delay in the development and release of its Battlefield V title. Not holding shares of strong-performing enterprise storage and data management software company NetApp and global semiconductor company Advanced Micro Devices further dampened relative results.
The fund’s cash and/or cash equivalents position during the period was also a detractor from relative performance. Under normal market conditions, the fund strives to be fully invested and generally holds cash to buy new holdings and to provide liquidity. In a period when equity markets rose, as measured by the fund’s benchmark, holding cash hurt performance versus the benchmark, which has no cash position.
Respectfully,
Portfolio Manager(s)
Eric Fischman, Paul Gordon, and Matthew Sabel
| (b) | Security is not a benchmark constituent. |
| (h) | Security was not held in the portfolio at period end. |
Note to Shareholders: Effective September 1, 2018, Matthew Sabel was no longer a Portfolio Manager of the Fund.
4
Management Review – continued
The views expressed in this report are those of the portfolio manager(s) only through the end of the period of the report as stated on the cover and do not necessarily reflect the views of MFS or any other person in the MFS organization. These views are subject to change at any time based on market or other conditions, and MFS disclaims any responsibility to update such views. These views may not be relied upon as investment advice or an indication of trading intent on behalf of any MFS portfolio. References to specific securities are not recommendations of such securities, and may not be representative of any MFS portfolio’s current or future investments.
5
PERFORMANCE SUMMARY THROUGH 8/31/18
The following chart illustrates a representative class of the fund’s historical performance in comparison to its benchmark(s). Performance results include the deduction of the maximum applicable sales charge and reflect the percentage change in net asset value, including reinvestment of dividends and capital gains distributions. The performance of other share classes will be greater than or less than that of the class depicted below. Benchmarks are unmanaged and may not be invested in directly. Benchmark returns do not reflect sales charges, commissions or expenses. (See Notes to Performance Summary.)
Performance data shown represents past performance and is no guarantee of future results. Investment return and principal value fluctuate so your shares, when sold, may be worth more or less than the original cost; current performance may be lower or higher than quoted. The performance shown does not reflect the deduction of taxes, if any, that a shareholder would pay on fund distributions or the redemption of fund shares.
Growth of a Hypothetical $10,000 Investment
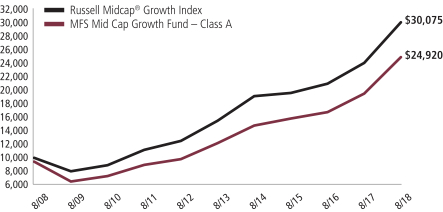
6
Performance Summary – continued
Total Returns through 8/31/18
Average annual without sales charge
| | | | | | | | | | | | | | |
| | | Share Class | | Class Inception Date | | 1-yr | | 5-yr | | 10-yr | | Life (t) | | |
| | | A | | 12/01/93 | | 27.69% | | 15.47% | | 10.21% | | N/A | | |
| | | B | | 12/01/93 | | 26.77% | | 14.64% | | 9.39% | | N/A | | |
| | | C | | 8/01/94 | | 26.77% | | 14.61% | | 9.40% | | N/A | | |
| | | I | | 1/02/97 | | 28.05% | | 15.77% | | 10.49% | | N/A | | |
| | | R1 | | 4/01/05 | | 26.73% | | 14.62% | | 9.39% | | N/A | | |
| | | R2 | | 10/31/03 | | 27.37% | | 15.19% | | 9.94% | | N/A | | |
| | | R3 | | 4/01/05 | | 27.73% | | 15.48% | | 10.20% | | N/A | | |
| | | R4 | | 4/01/05 | | 27.98% | | 15.77% | | 10.48% | | N/A | | |
| | | R6 | | 1/02/13 | | 28.17% | | 15.87% | | N/A | | 17.46% | | |
| | | 529A | | 7/31/02 | | 27.70% | | 15.47% | | 10.16% | | N/A | | |
| | | 529B | | 7/31/02 | | 26.69% | | 14.58% | | 9.33% | | N/A | | |
| | | 529C | | 7/31/02 | | 26.78% | | 14.58% | | 9.32% | | N/A | | |
| Comparative benchmark(s) | | | | | | | | | | |
| | | Russell Midcap® Growth Index (f) | | 25.06% | | 14.19% | | 11.64% | | N/A | | |
| Average annual with sales charge | | | | | | | | | | |
| | | A
With Initial Sales Charge (5.75%) | | 20.35% | | 14.12% | | 9.56% | | N/A | | |
| | | B
With CDSC (Declining over six years from 4% to 0%) (v) | | 22.77% | | 14.41% | | 9.39% | | N/A | | |
| | | C
With CDSC (1% for 12 months) (v) | | 25.77% | | 14.61% | | 9.40% | | N/A | | |
| | | 529A
With Initial Sales Charge (5.75%) | | 20.36% | | 14.11% | | 9.51% | | N/A | | |
| | | 529B
With CDSC (Declining over six years from 4% to 0%) (v) | | 22.69% | | 14.34% | | 9.33% | | N/A | | |
| | | 529C
With CDSC (1% for 12 months) (v) | | 25.78% | | 14.58% | | 9.32% | | N/A | | |
CDSC – Contingent Deferred Sales Charge.
Class I, R1, R2, R3, R4, and R6 shares do not have a sales charge.
| (f) | Source: FactSet Research Systems Inc. |
| (t) | For the period from the class inception date through the stated period end (for those share classes with less than 10 years of performance history). No comparative benchmark performance information is provided for “life” periods. (See Notes to Performance Summary.) |
| (v) | Assuming redemption at the end of the applicable period. |
7
Performance Summary – continued
Benchmark Definition(s)
Russell Midcap® Growth Index – constructed to provide a comprehensive barometer for growth securities in the mid-cap segment of the U.S. equity universe. Companies in this index generally have higher price-to-book ratios and higher forecasted growth values. The Russell Midcap® Growth Index is a trademark/service mark of the Frank Russell Company. Russell® is a trademark of the Frank Russell Company.
It is not possible to invest directly in an index.
Notes to Performance Summary
Class 529 shares are only available in conjunction with qualified tuition programs, such as the MFS 529 Savings Plan. There also is an additional fee, which is detailed in the program description, on qualified tuition programs. If this fee was reflected, the performance for Class 529 shares would have been lower. This annual fee is waived for Oregon residents and for those accounts with assets of $25,000 or more.
Average annual total return represents the average annual change in value for each share class for the periods presented. Life returns are presented where the share class has less than 10 years of performance history and represent the average annual total return from the class inception date to the stated period end date. As the fund’s share classes may have different inception dates, the life returns may represent different time periods and may not be comparable. As a result, no comparative benchmark performance information is provided for life periods.
Performance results reflect any applicable expense subsidies and waivers in effect during the periods shown. Without such subsidies and waivers the fund’s performance results would be less favorable. Please see the prospectus and financial statements for complete details.
Performance results do not include adjustments made for financial reporting purposes in accordance with U.S. generally accepted accounting principles and may differ from amounts reported in the financial highlights.
From time to time the fund may receive proceeds from litigation settlements, without which performance would be lower.
8
EXPENSE TABLE
Fund expenses borne by the shareholders during the period, March 1, 2018 through August 31, 2018
As a shareholder of the fund, you incur two types of costs: (1) transaction costs, including sales charges (loads) on certain purchase or redemption payments, and (2) ongoing costs, including management fees; distribution and service (12b-1) fees; and other fund expenses. This example is intended to help you understand your ongoing costs (in dollars) of investing in the fund and to compare these costs with the ongoing costs of investing in other mutual funds.
The example is based on an investment of $1,000 invested at the beginning of the period and held for the entire period March 1, 2018 through August 31, 2018.
The expenses include the payment of a portion of the transfer-agent-related expenses of MFS funds that invest in the fund. For further information, please see the Notes to Financial Statements.
Actual Expenses
The first line for each share class in the following table provides information about actual account values and actual expenses. You may use the information in this line, together with the amount you invested, to estimate the expenses that you paid over the period. Simply divide your account value by $1,000 (for example, an $8,600 account value divided by $1,000 = 8.6), then multiply the result by the number in the first line under the heading entitled “Expenses Paid During Period” to estimate the expenses you paid on your account during this period.
Hypothetical Example for Comparison Purposes
The second line for each share class in the following table provides information about hypothetical account values and hypothetical expenses based on the fund’s actual expense ratio and an assumed rate of return of 5% per year before expenses, which is not the fund’s actual return. The hypothetical account values and expenses may not be used to estimate the actual ending account balance or expenses you paid for the period. You may use this information to compare the ongoing costs of investing in the fund and other funds. To do so, compare this 5% hypothetical example with the 5% hypothetical examples that appear in the shareholder reports of the other funds.
Please note that the expenses shown in the table are meant to highlight your ongoing costs only and do not reflect any transactional costs, such as sales charges (loads). Therefore, the second line for each share class in the table is useful in comparing ongoing costs only, and will not help you determine the relative total costs of owning different funds. In addition, if these transactional costs were included, your costs would have been higher.
9
Expense Table – continued
| | | | | | | | | | | | | | | | | | |
Share
Class | | | | Annualized
Expense
Ratio | | | Beginning
Account Value
3/01/18 | | | Ending
Account Value
8/31/18 | | | Expenses
Paid During
Period (p) 3/01/18-8/31/18 | |
| A | | Actual | | | 1.16% | | | | $1,000.00 | | | | $1,150.75 | | | | $6.29 | |
| | Hypothetical (h) | | | 1.16% | | | | $1,000.00 | | | | $1,019.36 | | | | $5.90 | |
| B | | Actual | | | 1.90% | | | | $1,000.00 | | | | $1,146.36 | | | | $10.28 | |
| | Hypothetical (h) | | | 1.90% | | | | $1,000.00 | | | | $1,015.63 | | | | $9.65 | |
| C | | Actual | | | 1.91% | | | | $1,000.00 | | | | $1,146.47 | | | | $10.33 | |
| | Hypothetical (h) | | | 1.91% | | | | $1,000.00 | | | | $1,015.58 | | | | $9.70 | |
| I | | Actual | | | 0.91% | | | | $1,000.00 | | | | $1,152.27 | | | | $4.94 | |
| | Hypothetical (h) | | | 0.91% | | | | $1,000.00 | | | | $1,020.62 | | | | $4.63 | |
| R1 | | Actual | | | 1.91% | | | | $1,000.00 | | | | $1,146.38 | | | | $10.33 | |
| | Hypothetical (h) | | | 1.91% | | | | $1,000.00 | | | | $1,015.58 | | | | $9.70 | |
| R2 | | Actual | | | 1.41% | | | | $1,000.00 | | | | $1,149.40 | | | | $7.64 | |
| | Hypothetical (h) | | | 1.41% | | | | $1,000.00 | | | | $1,018.10 | | | | $7.17 | |
| R3 | | Actual | | | 1.16% | | | | $1,000.00 | | | | $1,150.45 | | | | $6.29 | |
| | Hypothetical (h) | | | 1.16% | | | | $1,000.00 | | | | $1,019.36 | | | | $5.90 | |
| R4 | | Actual | | | 0.91% | | | | $1,000.00 | | | | $1,152.33 | | | | $4.94 | |
| | Hypothetical (h) | | | 0.91% | | | | $1,000.00 | | | | $1,020.62 | | | | $4.63 | |
| R6 | | Actual | | | 0.80% | | | | $1,000.00 | | | | $1,153.19 | | | | $4.34 | |
| | Hypothetical (h) | | | 0.80% | | | | $1,000.00 | | | | $1,021.17 | | | | $4.08 | |
| 529A | | Actual | | | 1.17% | | | | $1,000.00 | | | | $1,150.99 | | | | $6.34 | |
| | Hypothetical (h) | | | 1.17% | | | | $1,000.00 | | | | $1,019.31 | | | | $5.96 | |
| 529B | | Actual | | | 1.96% | | | | $1,000.00 | | | | $1,146.34 | | | | $10.60 | |
| | Hypothetical (h) | | | 1.96% | | | | $1,000.00 | | | | $1,015.32 | | | | $9.96 | |
| 529C | | Actual | | | 1.95% | | | | $1,000.00 | | | | $1,146.34 | | | | $10.55 | |
| | Hypothetical (h) | | | 1.95% | | | | $1,000.00 | | | | $1,015.38 | | | | $9.91 | |
| (h) | 5% class return per year before expenses. |
| (p) | “Expenses Paid During Period” are equal to each class’s annualized expense ratio, as shown above, multiplied by the average account value over the period, multiplied by 184/365 (to reflect the one-half year period). Expenses paid do not include any applicable sales charges (loads). If these transaction costs had been included, your costs would have been higher. |
Notes to Expense Table
Each class with a Rule 12b-1 service fee is subject to a rebate of a portion of such fee. Such rebates are included in the expense ratios above and are outside of the expense limitation arrangement. For Class 529A and Class 529C shares, this rebate reduced the expense ratios above by 0.04% and 0.01%, respectively. See Note 3 in the Notes to Financial Statements for additional information.
10
PORTFOLIO OF INVESTMENTS
8/31/18
The Portfolio of Investments is a complete list of all securities owned by your fund. It is categorized by broad-based asset classes.
| | | | | | | | |
| Common Stocks - 97.4% | | | | | | | | |
| Issuer | | Shares/Par | | | Value ($) | |
| Aerospace - 3.9% | | | | | | | | |
| Curtiss-Wright Corp. | | | 100,675 | | | $ | 13,485,416 | |
| FLIR Systems, Inc. | | | 683,735 | | | | 42,897,534 | |
| Harris Corp. | | | 316,977 | | | | 51,511,932 | |
| Leidos Holdings, Inc. | | | 133,826 | | | | 9,470,866 | |
| TransDigm Group, Inc. | | | 45,283 | | | | 15,849,050 | |
| | | | | | | | |
| | | | | | | $ | 133,214,798 | |
| Alcoholic Beverages - 0.5% | | | | | | | | |
| Constellation Brands, Inc., “A” | | | 75,738 | | | $ | 15,768,652 | |
| | |
| Automotive - 2.8% | | | | | | | | |
| Copart, Inc. (a) | | | 1,009,179 | | | $ | 64,900,302 | |
| WABCO Holdings, Inc. (a) | | | 257,428 | | | | 31,684,238 | |
| | | | | | | | |
| | | | | | | $ | 96,584,540 | |
| Biotechnology - 2.1% | | | | | | | | |
| Biomarin Pharmaceutical, Inc. (a) | | | 300,571 | | | $ | 30,051,089 | |
| Bio-Techne Corp. | | | 216,809 | | | | 41,664,185 | |
| | | | | | | | |
| | | | | | | $ | 71,715,274 | |
| Broadcasting - 0.9% | | | | | | | | |
| Netflix, Inc. (a) | | | 86,930 | | | $ | 31,962,422 | |
| | |
| Brokerage & Asset Managers - 3.8% | | | | | | | | |
| Apollo Global Management LLC, “A” | | | 706,161 | | | $ | 24,383,739 | |
| E*TRADE Financial Corp. (a) | | | 721,616 | | | | 42,474,318 | |
| NASDAQ, Inc. | | | 651,152 | | | | 62,145,947 | |
| | | | | | | | |
| | | | | | | $ | 129,004,004 | |
| Business Services - 14.6% | | | | | | | | |
| CoStar Group, Inc. (a) | | | 78,094 | | | $ | 34,530,043 | |
| Fidelity National Information Services, Inc. | | | 307,791 | | | | 33,293,753 | |
| Fiserv, Inc. (a) | | | 677,284 | | | | 54,230,130 | |
| FleetCor Technologies, Inc. (a) | | | 153,075 | | | | 32,718,251 | |
| Global Payments, Inc. | | | 578,359 | | | | 72,051,964 | |
| MSCI, Inc. | | | 240,163 | | | | 43,291,782 | |
| Total System Services, Inc. | | | 316,324 | | | | 30,727,713 | |
| TransUnion | | | 749,126 | | | | 56,409,188 | |
| Tyler Technologies, Inc. (a) | | | 132,799 | | | | 32,794,713 | |
| Verisk Analytics, Inc., “A” (a) | | | 498,398 | | | | 59,354,218 | |
11
Portfolio of Investments – continued
| | | | | | | | |
| Issuer | | Shares/Par | | | Value ($) | |
| Common Stocks - continued | | | | | | | | |
| Business Services - continued | | | | | | | | |
| Worldpay, Inc. (a) | | | 513,793 | | | $ | 50,038,300 | |
| | | | | | | | |
| | | | | | | $ | 499,440,055 | |
| Chemicals - 0.9% | | | | | | | | |
| Ingevity Corp. (a) | | | 290,451 | | | $ | 29,338,456 | |
| | |
| Computer Software - 5.0% | | | | | | | | |
| Autodesk, Inc. (a) | | | 371,914 | | | $ | 57,404,926 | |
| Cadence Design Systems, Inc. (a) | | | 1,140,238 | | | | 53,636,795 | |
| PTC, Inc. (a) | | | 542,027 | | | | 54,170,178 | |
| Ultimate Software Group, Inc. (a) | | | 22,471 | | | | 6,958,595 | |
| | | | | | | | |
| | | | | | | $ | 172,170,494 | |
| Computer Software - Systems - 5.9% | | | | | | | | |
| Constellation Software, Inc. | | | 16,706 | | | $ | 12,738,677 | |
| Guidewire Software, Inc. (a) | | | 259,696 | | | | 26,117,627 | |
| NICE Systems Ltd., ADR (a) | | | 256,889 | | | | 29,693,800 | |
| Pluralsight, Inc., “A” (a) | | | 130,794 | | | | 4,469,231 | |
| ServiceNow, Inc. (a) | | | 214,487 | | | | 42,116,667 | |
| Square, Inc., “A” (a) | | | 302,285 | | | | 26,794,542 | |
| SS&C Technologies Holdings, Inc. | | | 1,029,441 | | | | 61,087,029 | |
| | | | | | | | |
| | | | | | | $ | 203,017,573 | |
| Construction - 5.0% | | | | | | | | |
| Armstrong World Industries, Inc. (a) | | | 261,582 | | | $ | 18,258,423 | |
| Lennox International, Inc. | | | 163,486 | | | | 36,426,316 | |
| Pool Corp. | | | 207,457 | | | | 34,076,887 | |
| Siteone Landscape Supply, Inc. (a) | | | 516,791 | | | | 46,702,403 | |
| Vulcan Materials Co. | | | 331,647 | | | | 36,746,487 | |
| | | | | | | | |
| | | | | | | $ | 172,210,516 | |
| Consumer Products - 0.3% | | | | | | | | |
| Scotts Miracle-Gro Co. | | | 157,413 | | | $ | 11,761,899 | |
| | |
| Consumer Services - 3.2% | | | | | | | | |
| Bright Horizons Family Solutions, Inc. (a) | | | 900,231 | | | $ | 107,514,588 | |
| | |
| Containers - 0.6% | | | | | | | | |
| CCL Industries, Inc. | | | 395,190 | | | $ | 19,038,770 | |
| | |
| Electrical Equipment - 5.5% | | | | | | | | |
| AMETEK, Inc. | | | 882,174 | | | $ | 67,892,111 | |
| Amphenol Corp., “A” | | | 505,545 | | | | 47,814,446 | |
| Littlefuse, Inc. | | | 156,261 | | | | 34,933,709 | |
12
Portfolio of Investments – continued
| | | | | | | | |
| Issuer | | Shares/Par | | | Value ($) | |
| Common Stocks - continued | | | | | | | | |
| Electrical Equipment - continued | | | | | | | | |
| Mettler-Toledo International, Inc. (a) | | | 60,660 | | | $ | 35,453,344 | |
| | | | | | | | |
| | | | | | | $ | 186,093,610 | |
| Electronics - 3.4% | | | | | | | | |
| Monolithic Power Systems, Inc. | | | 363,892 | | | $ | 54,536,494 | |
| NVIDIA Corp. | | | 82,065 | | | | 23,034,004 | |
| Silicon Laboratories, Inc. (a) | | | 399,645 | | | | 39,165,210 | |
| | | | | | | | |
| | | | | | | $ | 116,735,708 | |
| Energy - Independent - 1.1% | | | | | | | | |
| Concho Resources, Inc. (a) | | | 72,597 | | | $ | 9,956,679 | |
| Energen Corp. (a) | | | 218,666 | | | | 16,957,548 | |
| Parsley Energy, Inc., “A” (a) | | | 401,966 | | | | 11,162,596 | |
| | | | | | | | |
| | | | | | | $ | 38,076,823 | |
| Entertainment - 1.1% | | | | | | | | |
| Six Flags Entertainment Corp. | | | 570,479 | | | $ | 38,535,856 | |
| | |
| Food & Beverages - 1.0% | | | | | | | | |
| Chr. Hansen Holding A.S. | | | 262,194 | | | $ | 26,618,680 | |
| Monster Worldwide, Inc. (a) | | | 94,351 | | | | 5,745,033 | |
| | | | | | | | |
| | | | | | | $ | 32,363,713 | |
| Gaming & Lodging - 2.3% | | | | | | | | |
| MGM Resorts International | | | 877,029 | | | $ | 25,425,071 | |
| Paddy Power Betfair PLC | | | 108,013 | | | | 9,823,346 | |
| Vail Resorts, Inc. | | | 142,931 | | | | 42,600,585 | |
| | | | | | | | |
| | | | | | | $ | 77,849,002 | |
| General Merchandise - 1.8% | | | | | | | | |
| Dollar Tree, Inc. (a) | | | 222,216 | | | $ | 17,890,610 | |
| Five Below, Inc. (a) | | | 378,311 | | | | 44,061,882 | |
| | | | | | | | |
| | | | | | | $ | 61,952,492 | |
| Insurance - 1.0% | | | | | | | | |
| Aon PLC | | | 239,661 | | | $ | 34,885,055 | |
| | |
| Internet - 1.9% | | | | | | | | |
| IAC/InterActiveCorp (a) | | | 92,984 | | | $ | 18,336,445 | |
| LogMeIn, Inc. | | | 294,718 | | | | 25,331,012 | |
| Match Group, Inc. (a)(l) | | | 178,006 | | | | 8,909,200 | |
| Wix.com Ltd. (a) | | | 110,163 | | | | 12,239,110 | |
| | | | | | | | |
| | | | | | | $ | 64,815,767 | |
13
Portfolio of Investments – continued
| | | | | | | | |
| Issuer | | Shares/Par | | | Value ($) | |
| Common Stocks - continued | | | | | | | | |
| Leisure & Toys - 3.4% | | | | | | | | |
| Electronic Arts, Inc. (a) | | | 380,904 | | | $ | 43,198,323 | |
| Take-Two Interactive Software, Inc. (a) | | | 540,438 | | | | 72,180,899 | |
| | | | | | | | |
| | | | | | | $ | 115,379,222 | |
| Machinery & Tools - 2.2% | | | | | | | | |
| Gardner Denver Holdings, Inc. (a) | | | 359,808 | | | $ | 10,060,232 | |
| Roper Technologies, Inc. | | | 200,916 | | | | 59,947,307 | |
| Xylem, Inc. | | | 88,419 | | | | 6,711,886 | |
| | | | | | | | |
| | | | | | | $ | 76,719,425 | |
| Medical & Health Technology & Services - 1.5% | | | | | | | | |
| Henry Schein, Inc. (a) | | | 112,408 | | | $ | 8,731,853 | |
| ICON PLC (a) | | | 285,402 | | | | 42,530,606 | |
| | | | | | | | |
| | | | | | | $ | 51,262,459 | |
| Medical Equipment - 9.8% | | | | | | | | |
| Abiomed, Inc. (a) | | | 30,259 | | | $ | 12,302,704 | |
| Align Technology, Inc. (a) | | | 124,057 | | | | 47,946,790 | |
| Cooper Cos., Inc. | | | 127,991 | | | | 32,737,538 | |
| DexCom, Inc. (a) | | | 116,684 | | | | 16,846,836 | |
| Edwards Lifesciences Corp. (a) | | | 167,809 | | | | 24,204,770 | |
| Integra LifeSciences Holdings Corp. (a) | | | 86,109 | | | | 5,120,902 | |
| Nevro Corp. (a) | | | 80,810 | | | | 5,448,210 | |
| PerkinElmer, Inc. | | | 958,906 | | | | 88,631,682 | |
| QIAGEN N.V. (a) | | | 736,750 | | | | 28,711,147 | |
| Steris PLC | | | 521,521 | | | | 59,672,433 | |
| West Pharmaceutical Services, Inc. | | | 115,451 | | | | 13,513,540 | |
| | | | | | | | |
| | | | | | | $ | 335,136,552 | |
| Other Banks & Diversified Financials - 0.7% | | | | | | | | |
| First Republic Bank | | | 226,099 | | | $ | 22,969,397 | |
| | |
| Pollution Control - 0.5% | | | | | | | | |
| Clean Harbors, Inc. (a) | | | 249,666 | | | $ | 17,124,591 | |
| | |
| Printing & Publishing - 1.4% | | | | | | | | |
| IHS Markit Ltd. (a) | | | 875,109 | | | $ | 48,130,995 | |
| | |
| Railroad & Shipping - 1.3% | | | | | | | | |
| Kansas City Southern Co. | | | 389,116 | | | $ | 45,121,891 | |
| | |
| Real Estate - 1.2% | | | | | | | | |
| Extra Space Storage, Inc., REIT | | | 425,751 | | | $ | 39,258,500 | |
14
Portfolio of Investments – continued
| | | | | | | | |
| Issuer | | Shares/Par | | | Value ($) | |
| Common Stocks - continued | | | | | | | | |
| Restaurants - 1.7% | | | | | | | | |
| Aramark | | | 407,685 | | | $ | 16,747,700 | |
| Chipotle Mexican Grill, Inc., “A” (a) | | | 23,928 | | | | 11,370,107 | |
| Domino’s Pizza, Inc. | | | 48,640 | | | | 14,521,959 | |
| Dunkin Brands Group, Inc. | | | 225,497 | | | | 16,436,476 | |
| | | | | | | | |
| | | | | | | $ | 59,076,242 | |
| Specialty Chemicals - 0.6% | | | | | | | | |
| Axalta Coating Systems Ltd. (a) | | | 667,933 | | | $ | 20,371,957 | |
| | |
| Specialty Stores - 3.2% | | | | | | | | |
| BJ’s Wholesale Club Holdings, Inc. (a) | | | 322,642 | | | $ | 9,517,939 | |
| Lululemon Athletica, Inc. (a) | | | 187,026 | | | | 28,975,938 | |
| O’Reilly Automotive, Inc. (a) | | | 65,653 | | | | 22,021,329 | |
| Ross Stores, Inc. | | | 251,974 | | | | 24,134,070 | |
| Tractor Supply Co. | | | 274,062 | | | | 24,194,194 | |
| | | | | | | | |
| | | | | | | $ | 108,843,470 | |
| | |
| Telecommunications - Wireless - 1.3% | | | | | | | | |
| SBA Communications Corp., REIT (a) | | | 279,637 | | | $ | 43,408,052 | |
| Total Common Stocks (Identified Cost, $2,163,528,687) | | | | | | $ | 3,326,852,820 | |
| | |
| Investment Companies (h) - 2.3% | | | | | | | | |
| Money Market Funds - 2.3% | | | | | | | | |
MFS Institutional Money Market Portfolio, 2.03% (v)
(Identified Cost, $77,758,971) | | | 77,771,037 | | | $ | 77,771,037 | |
| | |
| Other Assets, Less Liabilities - 0.3% | | | | | | | 10,432,261 | |
| Net Assets - 100.0% | | | | | | $ | 3,415,056,118 | |
| (a) | Non-income producing security. |
| (h) | An affiliated issuer, which may be considered one in which the fund owns 5% or more of the outstanding voting securities, or a company which is under common control. At period end, the aggregate values of the fund’s investments in affiliated issuers and in unaffiliated issuers were $77,771,037 and $3,326,852,820, respectively. |
| (l) | A portion of this security is on loan. |
| (v) | Affiliated issuer that is available only to investment companies managed by MFS. The rate quoted for the MFS Institutional Money Market Portfolio is the annualized seven-day yield of the fund at period end. |
The following abbreviations are used in this report and are defined:
| ADR | | American Depositary Receipt |
| PLC | | Public Limited Company |
| REIT | | Real Estate Investment Trust |
See Notes to Financial Statements
15
Financial Statements
STATEMENT OF ASSETS AND LIABILITIES
At 8/31/18
This statement represents your fund’s balance sheet, which details the assets and liabilities comprising the total value of the fund.
| | | | |
| Assets | | | | |
Investments in unaffiliated issuers, at value, including $8,013,005 of securities on loan (identified cost, $2,163,528,687) | | | $3,326,852,820 | |
Investments in affiliated issuers, at value (identified cost, $77,758,971) | | | 77,771,037 | |
Cash | | | 23,686 | |
Receivables for | | | | |
Fund shares sold | | | 12,585,706 | |
Interest and dividends | | | 1,678,490 | |
Other assets | | | 2,331 | |
Total assets | | | $3,418,914,070 | |
| Liabilities | | | | |
Payables for | | | | |
Fund shares reacquired | | | $2,539,933 | |
Payable to affiliates | | | | |
Investment adviser | | | 131,921 | |
Shareholder servicing costs | | | 978,864 | |
Distribution and service fees | | | 14,596 | |
Program manager fee | | | 28 | |
Payable for independent Trustees’ compensation | | | 29,375 | |
Accrued expenses and other liabilities | | | 163,235 | |
Total liabilities | | | $3,857,952 | |
Net assets | | | $3,415,056,118 | |
| Net assets consist of | | | | |
Paid-in capital | | | $2,168,456,048 | |
Unrealized appreciation (depreciation) | | | 1,163,344,771 | |
Accumulated net realized gain (loss) | | | 83,286,105 | |
Accumulated net investment loss | | | (30,806 | ) |
Net assets | | | $3,415,056,118 | |
Shares of beneficial interest outstanding | | | 171,829,829 | |
16
Statement of Assets and Liabilities – continued
| | | | | | | | | | | | |
| | | Net assets | | | Shares
outstanding | | | Net asset value
per share (a) | |
Class A | | | $824,847,032 | | | | 43,048,581 | | | | $19.16 | |
Class B | | | 19,328,767 | | | | 1,216,001 | | | | 15.90 | |
Class C | | | 54,079,872 | | | | 3,506,062 | | | | 15.42 | |
Class I | | | 332,007,555 | | | | 16,369,474 | | | | 20.28 | |
Class R1 | | | 2,826,785 | | | | 178,672 | | | | 15.82 | |
Class R2 | | | 9,068,942 | | | | 501,607 | | | | 18.08 | |
Class R3 | | | 95,010,308 | | | | 4,989,006 | | | | 19.04 | |
Class R4 | | | 54,140,807 | | | | 2,731,315 | | | | 19.82 | |
Class R6 | | | 2,013,623,850 | | | | 98,713,066 | | | | 20.40 | |
Class 529A | | | 7,582,059 | | | | 407,719 | | | | 18.60 | |
Class 529B | | | 303,685 | | | | 19,581 | | | | 15.51 | |
Class 529C | | | 2,236,456 | | | | 148,745 | | | | 15.04 | |
| (a) | Maximum offering price per share was equal to the net asset value per share for all share classes, except for Classes A and 529A, for which the maximum offering prices per share were $20.33 [100 / 94.25 x $19.16] and $19.73 [100 / 94.25 x $18.60], respectively. On sales of $50,000 or more, the maximum offering prices of Class A and Class 529A shares are reduced. A contingent deferred sales charge may be imposed on redemptions of Class A, Class B, Class C, Class 529B, and Class 529C shares. Redemption price per share was equal to the net asset value per share for Classes I, R1, R2, R3, R4, R6, and 529A. |
See Notes to Financial Statements
17
Financial Statements
STATEMENT OF OPERATIONS
Year ended 8/31/18
This statement describes how much your fund earned in investment income and accrued in expenses. It also describes any gains and/or losses generated by fund operations.
| | | | |
| Net investment income (loss) | | | | |
Income | | | | |
Dividends | | | $15,921,890 | |
Dividends from affiliated issuers | | | 1,032,559 | |
Income on securities loaned | | | 74,287 | |
Other | | | 53,659 | |
Foreign taxes withheld | | | (96,628 | ) |
Total investment income | | | $16,985,767 | |
Expenses | | | | |
Management fee | | | $19,778,861 | |
Distribution and service fees | | | 2,674,755 | |
Shareholder servicing costs | | | 2,751,935 | |
Program manager fees | | | 5,201 | |
Administrative services fee | | | 425,227 | |
Independent Trustees’ compensation | | | 43,342 | |
Custodian fee | | | 170,963 | |
Shareholder communications | | | 195,033 | |
Audit and tax fees | | | 56,851 | |
Legal fees | | | 23,441 | |
Miscellaneous | | | 298,070 | |
Total expenses | | | $26,423,679 | |
Fees paid indirectly | | | (3,168 | ) |
Reduction of expenses by investment adviser and distributor | | | (278,098 | ) |
Net expenses | | | $26,142,413 | |
Net investment income (loss) | | | $(9,156,646 | ) |
| Realized and unrealized gain (loss) | | | | |
Realized gain (loss) (identified cost basis) | | | | |
Unaffiliated issuers | | | $283,429,541 | |
Affiliated issuers | | | (7,433 | ) |
Foreign currency | | | (17,780 | ) |
Net realized gain (loss) | | | $283,404,328 | |
Change in unrealized appreciation or depreciation | | | | |
Unaffiliated issuers | | | $423,688,373 | |
Affiliated issuers | | | 7,971 | |
Translation of assets and liabilities in foreign currencies | | | (8,233 | ) |
Net unrealized gain (loss) | | | $423,688,111 | |
Net realized and unrealized gain (loss) | | | $707,092,439 | |
Change in net assets from operations | | | $697,935,793 | |
See Notes to Financial Statements
18
Financial Statements
STATEMENTS OF CHANGES IN NET ASSETS
These statements describe the increases and/or decreases in net assets resulting from operations, any distributions, and any shareholder transactions.
| | | | | | | | |
| | | Year ended | |
| | | 8/31/18 | | | 8/31/17 | |
| Change in net assets | | | | | | |
| From operations | | | | | | | | |
Net investment income (loss) | | | $(9,156,646 | ) | | | $(4,203,903 | ) |
Net realized gain (loss) | | | 283,404,328 | | | | 66,449,626 | |
Net unrealized gain (loss) | | | 423,688,111 | | | | 276,545,962 | |
Change in net assets from operations | | | $697,935,793 | | | | $338,791,685 | |
| Distributions declared to shareholders | | | | | | | | |
From net realized gain | | | $(200,632,417 | ) | | | $(104,568,995 | ) |
Change in net assets from fund share transactions | | | $578,316,924 | | | | $95,382,592 | |
Total change in net assets | | | $1,075,620,300 | | | | $329,605,282 | |
| Net assets | | | | | | | | |
At beginning of period | | | 2,339,435,818 | | | | 2,009,830,536 | |
At end of period (including accumulated net investment loss of $30,806 and $26,964, respectively) | | | $3,415,056,118 | | | | $2,339,435,818 | |
See Notes to Financial Statements
19
Financial Statements
FINANCIAL HIGHLIGHTS
The financial highlights table is intended to help you understand the fund’s financial performance for the past 5 years. Certain information reflects financial results for a single fund share. The total returns in the table represent the rate that an investor would have earned (or lost) on an investment in the fund share class (assuming reinvestment of all distributions) held for the entire period.
| | | | | | | | | | | | | | | | | | | | |
| Class A | | Year ended | |
| | | 8/31/18 | | | 8/31/17 | | | 8/31/16 | | | 8/31/15 | | | 8/31/14 | |
Net asset value, beginning of period | | | $16.34 | | | | $14.82 | | | | $14.40 | | | | $14.41 | | | | $11.86 | |
| Income (loss) from investment operations | | | | | | | | | | | | | |
Net investment income (loss) (d) | | | $(0.09 | ) | | | $(0.06 | )(c) | | | $(0.06 | ) | | | $(0.10 | ) | | | $(0.09 | ) |
Net realized and unrealized gain (loss) | | | 4.32 | | | | 2.36 | | | | 0.88 | | | | 1.07 | | | | 2.64 | |
Total from investment operations | | | $4.23 | | | | $2.30 | | | | $0.82 | | | | $0.97 | | | | $2.55 | |
| Less distributions declared to shareholders | | | | | | | | | | | | | | | | | |
From net realized gain | | | $(1.41 | ) | | | $(0.78 | ) | | | $(0.40 | ) | | | $(0.98 | ) | | | $— | |
Net asset value, end of period (x) | | | $19.16 | | | | $16.34 | | | | $14.82 | | | | $14.40 | | | | $14.41 | |
Total return (%) (r)(s)(t)(x) | | | 27.69 | | | | 16.44 | (c) | | | 5.87 | | | | 7.36 | | | | 21.50 | |
Ratios (%) (to average net assets)
and Supplemental data: | | | | | | | | | | | | | | | | | |
Expenses before expense reductions (f) | | | 1.17 | | | | 1.22 | (c) | | | 1.26 | | | | 1.24 | | | | 1.22 | |
Expenses after expense reductions (f) | | | 1.16 | | | | 1.20 | (c) | | | 1.22 | | | | 1.21 | | | | 1.19 | |
Net investment income (loss) | | | (0.55 | ) | | | (0.42 | )(c) | | | (0.45 | ) | | | (0.72 | ) | | | (0.69 | ) |
Portfolio turnover | | | 33 | | | | 30 | | | | 43 | | | | 37 | | | | 59 | |
Net assets at end of period (000 omitted) | | | $824,847 | | | | $572,338 | | | | $454,881 | | | | $295,230 | | | | $255,308 | |
See Notes to Financial Statements
20
Financial Highlights – continued
| | | | | | | | | | | | | | | | | | | | |
| Class B | | Year ended | |
| | | 8/31/18 | | | 8/31/17 | | | 8/31/16 | | | 8/31/15 | | | 8/31/14 | |
Net asset value, beginning of period | | | $13.88 | | | | $12.80 | | | | $12.58 | | | | $12.81 | | | | $10.61 | |
| Income (loss) from investment operations | | | | | | | | | | | | | | | | | |
Net investment income (loss) (d) | | | $(0.19 | ) | | | $(0.15 | )(c) | | | $(0.15 | ) | | | $(0.19 | ) | | | $(0.17 | ) |
Net realized and unrealized gain (loss) | | | 3.62 | | | | 2.01 | | | | 0.77 | | | | 0.94 | | | | 2.37 | |
Total from investment operations | | | $3.43 | | | | $1.86 | | | | $0.62 | | | | $0.75 | | | | $2.20 | |
| Less distributions declared to shareholders | | | | | | | | | | | | | | | | | |
From net realized gain | | | $(1.41 | ) | | | $(0.78 | ) | | | $(0.40 | ) | | | $(0.98 | ) | | | $— | |
Net asset value, end of period (x) | | | $15.90 | | | | $13.88 | | | | $12.80 | | | | $12.58 | | | | $12.81 | |
Total return (%) (r)(s)(t)(x) | | | 26.77 | | | | 15.56 | (c) | | | 5.11 | | | | 6.51 | | | | 20.74 | |
Ratios (%) (to average net assets)
and Supplemental data: | | | | | | | | | | | | | | | | | |
Expenses before expense reductions (f) | | | 1.92 | | | | 1.97 | (c) | | | 2.00 | | | | 1.99 | | | | 1.97 | |
Expenses after expense reductions (f) | | | 1.91 | | | | 1.95 | (c) | | | 1.97 | | | | 1.96 | | | | 1.94 | |
Net investment income (loss) | | | (1.30 | ) | | | (1.16 | )(c) | | | (1.24 | ) | | | (1.47 | ) | | | (1.44 | ) |
Portfolio turnover | | | 33 | | | | 30 | | | | 43 | | | | 37 | | | | 59 | |
Net assets at end of period (000 omitted) | | | $19,329 | | | | $16,326 | | | | $17,978 | | | | $17,415 | | | | $18,061 | |
| |
| Class C | | Year ended | |
| | | 8/31/18 | | | 8/31/17 | | | 8/31/16 | | | 8/31/15 | | | 8/31/14 | |
Net asset value, beginning of period | | | $13.50 | | | | $12.48 | | | | $12.27 | | | | $12.52 | | | | $10.38 | |
| Income (loss) from investment operations | | | | | | | | | | | | | | | | | |
Net investment income (loss) (d) | | | $(0.18 | ) | | | $(0.15 | )(c) | | | $(0.14 | ) | | | $(0.18 | ) | | | $(0.17 | ) |
Net realized and unrealized gain (loss) | | | 3.51 | | | | 1.95 | | | | 0.75 | | | | 0.91 | | | | 2.31 | |
Total from investment operations | | | $3.33 | | | | $1.80 | | | | $0.61 | | | | $0.73 | | | | $2.14 | |
| Less distributions declared to shareholders | | | | | | | | | | | | | | | | | |
From net realized gain | | | $(1.41 | ) | | | $(0.78 | ) | | | $(0.40 | ) | | | $(0.98 | ) | | | $— | |
Net asset value, end of period (x) | | | $15.42 | | | | $13.50 | | | | $12.48 | | | | $12.27 | | | | $12.52 | |
Total return (%) (r)(s)(t)(x) | | | 26.77 | | | | 15.48 | (c) | | | 5.16 | | | | 6.50 | | | | 20.62 | |
Ratios (%) (to average net assets)
and Supplemental data: | | | | | | | | | | | | | | | | | |
Expenses before expense reductions (f) | | | 1.92 | | | | 1.97 | (c) | | | 2.00 | | | | 1.99 | | | | 1.97 | |
Expenses after expense reductions (f) | | | 1.91 | | | | 1.95 | (c) | | | 1.97 | | | | 1.96 | | | | 1.94 | |
Net investment income (loss) | | | (1.30 | ) | | | (1.17 | )(c) | | | (1.22 | ) | | | (1.47 | ) | | | (1.43 | ) |
Portfolio turnover | | | 33 | | | | 30 | | | | 43 | | | | 37 | | | | 59 | |
Net assets at end of period (000 omitted) | | | $54,080 | | | | $58,623 | | | | $53,862 | | | | $42,806 | | | | $38,341 | |
See Notes to Financial Statements
21
Financial Highlights – continued
| | | | | | | | | | | | | | | | | | | | |
| Class I | | Year ended | |
| | | 8/31/18 | | | 8/31/17 | | | 8/31/16 | | | 8/31/15 | | | 8/31/14 | |
Net asset value, beginning of period | | | $17.17 | | | | $15.50 | | | | $15.00 | | | | $14.94 | | | | $12.26 | |
| Income (loss) from investment operations | | | | | | | | | | | | | | | | | |
Net investment income (loss) (d) | | | $(0.06 | ) | | | $(0.03 | )(c) | | | $(0.00 | )(w) | | | $(0.07 | ) | | | $(0.06 | ) |
Net realized and unrealized gain (loss) | | | 4.58 | | | | 2.48 | | | | 0.90 | | | | 1.11 | | | | 2.74 | |
Total from investment operations | | | $4.52 | | | | $2.45 | | | | $0.90 | | | | $1.04 | | | | $2.68 | |
| Less distributions declared to shareholders | | | | | | | | | | | | | | | | | |
From net realized gain | | | $(1.41 | ) | | | $(0.78 | ) | | | $(0.40 | ) | | | $(0.98 | ) | | | $— | |
Net asset value, end of period (x) | | | $20.28 | | | | $17.17 | | | | $15.50 | | | | $15.00 | | | | $14.94 | |
Total return (%) (r)(s)(t)(x) | | | 28.05 | | | | 16.70 | (c) | | | 6.17 | | | | 7.57 | | | | 21.86 | |
Ratios (%) (to average net assets)
and Supplemental data: | | | | | | | | | | | | | | | | | |
Expenses before expense reductions (f) | | | 0.92 | | | | 0.97 | (c) | | | 1.02 | | | | 1.00 | | | | 0.97 | |
Expenses after expense reductions (f) | | | 0.91 | | | | 0.96 | (c) | | | 0.99 | | | | 0.97 | | | | 0.95 | |
Net investment income (loss) | | | (0.30 | ) | | | (0.18 | )(c) | | | (0.01 | ) | | | (0.47 | ) | | | (0.44 | ) |
Portfolio turnover | | | 33 | | | | 30 | | | | 43 | | | | 37 | | | | 59 | |
Net assets at end of period (000 omitted) | | | $332,008 | | | | $100,858 | | | | $110,803 | | | | $26,931 | | | | $13,526 | |
| |
| Class R1 | | Year ended | |
| | | 8/31/18 | | | 8/31/17 | | | 8/31/16 | | | 8/31/15 | | | 8/31/14 | |
Net asset value, beginning of period | | | $13.82 | | | | $12.75 | | | | $12.53 | | | | $12.76 | | | | $10.58 | |
| Income (loss) from investment operations | | | | | | | | | | | | | | | | | |
Net investment income (loss) (d) | | | $(0.19 | ) | | | $(0.15 | )(c) | | | $(0.15 | ) | | | $(0.19 | ) | | | $(0.17 | ) |
Net realized and unrealized gain (loss) | | | 3.60 | | | | 2.00 | | | | 0.77 | | | | 0.94 | | | | 2.35 | |
Total from investment operations | | | $3.41 | | | | $1.85 | | | | $0.62 | | | | $0.75 | | | | $2.18 | |
| Less distributions declared to shareholders | | | | | | | | | | | | | | | | | |
From net realized gain | | | $(1.41 | ) | | | $(0.78 | ) | | | $(0.40 | ) | | | $(0.98 | ) | | | $— | |
Net asset value, end of period (x) | | | $15.82 | | | | $13.82 | | | | $12.75 | | | | $12.53 | | | | $12.76 | |
Total return (%) (r)(s)(t)(x) | | | 26.73 | | | | 15.54 | (c) | | | 5.13 | | | | 6.54 | | | | 20.60 | |
Ratios (%) (to average net assets)
and Supplemental data: | | | | | | | | | | | | | | | | | |
Expenses before expense reductions (f) | | | 1.92 | | | | 1.97 | (c) | | | 2.00 | | | | 1.99 | | | | 1.97 | |
Expenses after expense reductions (f) | | | 1.91 | | | | 1.96 | (c) | | | 1.97 | | | | 1.97 | | | | 1.95 | |
Net investment income (loss) | | | (1.30 | ) | | | (1.17 | )(c) | | | (1.25 | ) | | | (1.47 | ) | | | (1.44 | ) |
Portfolio turnover | | | 33 | | | | 30 | | | | 43 | | | | 37 | | | | 59 | |
Net assets at end of period (000 omitted) | | | $2,827 | | | | $2,348 | | | | $2,057 | | | | $2,288 | | | | $2,238 | |
See Notes to Financial Statements
22
Financial Highlights – continued
| | | | | | | | | | | | | | | | | | | | |
| Class R2 | | Year ended | |
| | | 8/31/18 | | | 8/31/17 | | | 8/31/16 | | | 8/31/15 | | | 8/31/14 | |
Net asset value, beginning of period | | | $15.53 | | | | $14.16 | | | | $13.80 | | | | $13.89 | | | | $11.46 | |
| Income (loss) from investment operations | | | | | | | | | | | | | | | | | |
Net investment income (loss) (d) | | | $(0.13 | ) | | | $(0.10 | )(c) | | | $(0.10 | ) | | | $(0.14 | ) | | | $(0.12 | ) |
Net realized and unrealized gain (loss) | | | 4.09 | | | | 2.25 | | | | 0.86 | | | | 1.03 | | | | 2.55 | |
Total from investment operations | | | $3.96 | | | | $2.15 | | | | $0.76 | | | | $0.89 | | | | $2.43 | |
| Less distributions declared to shareholders | | | | | | | | | | | | | | | | | |
From net realized gain | | | $(1.41 | ) | | | $(0.78 | ) | | | $(0.40 | ) | | | $(0.98 | ) | | | $— | |
Net asset value, end of period (x) | | | $18.08 | | | | $15.53 | | | | $14.16 | | | | $13.80 | | | | $13.89 | |
Total return (%) (r)(s)(t)(x) | | | 27.37 | | | | 16.14 | (c) | | | 5.68 | | | | 7.04 | | | | 21.20 | |
Ratios (%) (to average net assets)
and Supplemental data: | | | | | | | | | | | | | | | | | |
Expenses before expense reductions (f) | | | 1.42 | | | | 1.47 | (c) | | | 1.50 | | | | 1.49 | | | | 1.47 | |
Expenses after expense reductions (f) | | | 1.41 | | | | 1.46 | (c) | | | 1.47 | | | | 1.47 | | | | 1.45 | |
Net investment income (loss) | | | (0.80 | ) | | | (0.67 | )(c) | | | (0.73 | ) | | | (0.97 | ) | | | (0.94 | ) |
Portfolio turnover | | | 33 | | | | 30 | | | | 43 | | | | 37 | | | | 59 | |
Net assets at end of period (000 omitted) | | | $9,069 | | | | $6,681 | | | | $5,651 | | | | $4,598 | | | | $4,473 | |
| |
| Class R3 | | Year ended | |
| | | 8/31/18 | | | 8/31/17 | | | 8/31/16 | | | 8/31/15 | | | 8/31/14 | |
Net asset value, beginning of period | | | $16.24 | | | | $14.74 | | | | $14.32 | | | | $14.34 | | | | $11.80 | |
| Income (loss) from investment operations | | | | | | | | | | | | | | | | | |
Net investment income (loss) (d) | | | $(0.09 | ) | | | $(0.07 | )(c) | | | $(0.06 | ) | | | $(0.10 | ) | | | $(0.10 | ) |
Net realized and unrealized gain (loss) | | | 4.30 | | | | 2.35 | | | | 0.88 | | | | 1.06 | | | | 2.64 | |
Total from investment operations | | | $4.21 | | | | $2.28 | | | | $0.82 | | | | $0.96 | | | | $2.54 | |
| Less distributions declared to shareholders | | | | | | | | | | | | | | | | | |
From net realized gain | | | $(1.41 | ) | | | $(0.78 | ) | | | $(0.40 | ) | | | $(0.98 | ) | | | $— | |
Net asset value, end of period (x) | | | $19.04 | | | | $16.24 | | | | $14.74 | | | | $14.32 | | | | $14.34 | |
Total return (%) (r)(s)(t)(x) | | | 27.73 | | | | 16.39 | (c) | | | 5.90 | | | | 7.32 | | | | 21.53 | |
Ratios (%) (to average net assets)
and Supplemental data: | | | | | | | | | | | | | | | | | |
Expenses before expense reductions (f) | | | 1.17 | | | | 1.22 | (c) | | | 1.26 | | | | 1.25 | | | | 1.22 | |
Expenses after expense reductions (f) | | | 1.16 | | | | 1.21 | (c) | | | 1.23 | | | | 1.22 | | | | 1.20 | |
Net investment income (loss) | | | (0.55 | ) | | | (0.44 | )(c) | | | (0.42 | ) | | | (0.72 | ) | | | (0.74 | ) |
Portfolio turnover | | | 33 | | | | 30 | | | | 43 | | | | 37 | | | | 59 | |
Net assets at end of period (000 omitted) | | | $95,010 | | | | $32,496 | | | | $14,836 | | | | $8,440 | | | | $3,680 | |
See Notes to Financial Statements
23
Financial Highlights – continued
| | | | | | | | | | | | | | | | | | | | |
| Class R4 | | Year ended | |
| | | 8/31/18 | | | 8/31/17 | | | 8/31/16 | | | 8/31/15 | | | 8/31/14 | |
Net asset value, beginning of period | | | $16.82 | | | | $15.20 | | | | $14.72 | | | | $14.67 | | | | $12.04 | |
| Income (loss) from investment operations | | | | | | | | | | | | | | | | | |
Net investment income (loss) (d) | | | $(0.05 | ) | | | $(0.03 | )(c) | | | $(0.02 | ) | | | $(0.07 | ) | | | $(0.06 | ) |
Net realized and unrealized gain (loss) | | | 4.46 | | | | 2.43 | | | | 0.90 | | | | 1.10 | | | | 2.69 | |
Total from investment operations | | | $4.41 | | | | $2.40 | | | | $0.88 | | | | $1.03 | | | | $2.63 | |
| Less distributions declared to shareholders | | | | | | | | | | | | | | | | | |
From net realized gain | | | $(1.41 | ) | | | $(0.78 | ) | | | $(0.40 | ) | | | $(0.98 | ) | | | $— | |
Net asset value, end of period (x) | | | $19.82 | | | | $16.82 | | | | $15.20 | | | | $14.72 | | | | $14.67 | |
Total return (%) (r)(s)(t)(x) | | | 27.98 | | | | 16.70 | (c) | | | 6.15 | | | | 7.65 | | | | 21.84 | |
Ratios (%) (to average net assets)
and Supplemental data: | | | | | | | | | | | | | | | | | |
Expenses before expense reductions (f) | | | 0.92 | | | | 0.97 | (c) | | | 1.01 | | | | 1.00 | | | | 0.97 | |
Expenses after expense reductions (f) | | | 0.91 | | | | 0.96 | (c) | | | 0.98 | | | | 0.98 | | | | 0.95 | |
Net investment income (loss) | | | (0.30 | ) | | | (0.18 | )(c) | | | (0.17 | ) | | | (0.47 | ) | | | (0.44 | ) |
Portfolio turnover | | | 33 | | | | 30 | | | | 43 | | | | 37 | | | | 59 | |
Net assets at end of period (000 omitted) | | | $54,141 | | | | $22,346 | | | | $13,883 | | | | $2,322 | | | | $422 | |
| |
| Class R6 | | Year ended | |
| | | 8/31/18 | | | 8/31/17 | | | 8/31/16 | | | 8/31/15 | | | 8/31/14 | |
Net asset value, beginning of period | | | $17.25 | | | | $15.55 | | | | $15.03 | | | | $14.96 | | | | $12.27 | |
| Income (loss) from investment operations | | | | | | | | | | | | | | | | | |
Net investment income (loss) (d) | | | $(0.04 | ) | | | $(0.01 | )(c) | | | $(0.02 | ) | | | $(0.06 | ) | | | $(0.05 | ) |
Net realized and unrealized gain (loss) | | | 4.60 | | | | 2.49 | | | | 0.94 | | | | 1.11 | | | | 2.74 | |
Total from investment operations | | | $4.56 | | | | $2.48 | | | | $0.92 | | | | $1.05 | | | | $2.69 | |
| Less distributions declared to shareholders | | | | | | | | | |
From net realized gain | | | $(1.41 | ) | | | $(0.78 | ) | | | $(0.40 | ) | | | $(0.98 | ) | | | $— | |
Net asset value, end of period (x) | | | $20.40 | | | | $17.25 | | | | $15.55 | | | | $15.03 | | | | $14.96 | |
Total return (%) (r)(s)(t)(x) | | | 28.17 | | | | 16.84 | (c) | | | 6.29 | | | | 7.63 | | | | 21.92 | |
Ratios (%) (to average net assets)
and Supplemental data: | | | | | | | | | | | | | | | | | |
Expenses before expense reductions (f) | | | 0.81 | | | | 0.86 | (c) | | | 0.90 | | | | 0.91 | | | | 0.91 | |
Expenses after expense reductions (f) | | | 0.81 | | | | 0.84 | (c) | | | 0.87 | | | | 0.89 | | | | 0.89 | |
Net investment income (loss) | | | (0.19 | ) | | | (0.05 | )(c) | | | (0.14 | ) | | | (0.39 | ) | | | (0.38 | ) |
Portfolio turnover | | | 33 | | | | 30 | | | | 43 | | | | 37 | | | | 59 | |
Net assets at end of period (000 omitted) | | | $2,013,624 | | | | $1,520,339 | | | | $1,330,139 | | | | $1,329,257 | | | | $1,331,244 | |
See Notes to Financial Statements
24
Financial Highlights – continued
| | | | | | | | | | | | | | | | | | | | |
| Class 529A | | Year ended | |
| | | 8/31/18 | | | 8/31/17 | | | 8/31/16 | | | 8/31/15 | | | 8/31/14 | |
Net asset value, beginning of period | | | $15.90 | | | | $14.45 | | | | $14.04 | | | | $14.08 | | | | $11.59 | |
| Income (loss) from investment operations | | | | | | | | | | | | | | | | | |
Net investment income (loss) (d) | | | $(0.09 | ) | | | $(0.06 | )(c) | | | $(0.07 | ) | | | $(0.10 | ) | | | $(0.09 | ) |
Net realized and unrealized gain (loss) | | | 4.20 | | | | 2.29 | | | | 0.88 | | | | 1.04 | | | | 2.58 | |
Total from investment operations | | | $4.11 | | | | $2.23 | | | | $0.81 | | | | $0.94 | | | | $2.49 | |
| Less distributions declared to shareholders | | | | | | | | | | | | | | | | | |
From net realized gain | | | $(1.41 | ) | | | $(0.78 | ) | | | $(0.40 | ) | | | $(0.98 | ) | | | $— | |
Net asset value, end of period (x) | | | $18.60 | | | | $15.90 | | | | $14.45 | | | | $14.04 | | | | $14.08 | |
Total return (%) (r)(s)(t)(x) | | | 27.70 | | | | 16.38 | (c) | | | 5.95 | | | | 7.31 | | | | 21.48 | |
Ratios (%) (to average net assets)
and Supplemental data: | | | | | | | | | | | | | | | | | |
Expenses before expense reductions (f) | | | 1.23 | | | | 1.32 | (c) | | | 1.35 | | | | 1.34 | | | | 1.32 | |
Expenses after expense reductions (f) | | | 1.18 | | | | 1.21 | (c) | | | 1.23 | | | | 1.21 | | | | 1.19 | |
Net investment income (loss) | | | (0.56 | ) | | | (0.43 | )(c) | | | (0.48 | ) | | | (0.72 | ) | | | (0.69 | ) |
Portfolio turnover | | | 33 | | | | 30 | | | | 43 | | | | 37 | | | | 59 | |
Net assets at end of period (000 omitted) | | | $7,582 | | | | $4,916 | | | | $3,890 | | | | $3,159 | | | | $2,434 | |
| |
| Class 529B | | Year ended | |
| | | 8/31/18 | | | 8/31/17 | | | 8/31/16 | | | 8/31/15 | | | 8/31/14 | |
Net asset value, beginning of period | | | $13.58 | | | | $12.55 | | | | $12.34 | | | | $12.59 | | | | $10.44 | |
| Income (loss) from investment operations | | | | | | | | | | | | | | | | | |
Net investment income (loss) (d) | | | $(0.19 | ) | | | $(0.15 | )(c) | | | $(0.15 | ) | | | $(0.19 | ) | | | $(0.18 | ) |
Net realized and unrealized gain (loss) | | | 3.53 | | | | 1.96 | | | | 0.76 | | | | 0.92 | | | | 2.33 | |
Total from investment operations | | | $3.34 | | | | $1.81 | | | | $0.61 | | | | $0.73 | | | | $2.15 | |
| Less distributions declared to shareholders | | | | | | | | | | | | | | | | | |
From net realized gain | | | $(1.41 | ) | | | $(0.78 | ) | | | $(0.40 | ) | | | $(0.98 | ) | | | $— | |
Net asset value, end of period (x) | | | $15.51 | | | | $13.58 | | | | $12.55 | | | | $12.34 | | | | $12.59 | |
Total return (%) (r)(s)(t)(x) | | | 26.69 | | | | 15.47 | (c) | | | 5.13 | | | | 6.46 | | | | 20.59 | |
Ratios (%) (to average net assets)
and Supplemental data: | | | | | | | | | | | | | | | | | |
Expenses before expense reductions (f) | | | 1.98 | | | | 2.07 | (c) | | | 2.11 | | | | 2.09 | | | | 2.07 | |
Expenses after expense reductions (f) | | | 1.96 | | | | 2.00 | (c) | | | 2.02 | | | | 2.02 | | | | 2.00 | |
Net investment income (loss) | | | (1.35 | ) | | | (1.23 | )(c) | | | (1.26 | ) | | | (1.52 | ) | | | (1.49 | ) |
Portfolio turnover | | | 33 | | | | 30 | | | | 43 | | | | 37 | | | | 59 | |
Net assets at end of period (000 omitted) | | | $304 | | | | $210 | | | | $209 | | | | $347 | | | | $331 | |
See Notes to Financial Statements
25
Financial Highlights – continued
| | | | | | | | | | | | | | | | | | | | |
| Class 529C | | Year ended | |
| | | 8/31/18 | | | 8/31/17 | | | 8/31/16 | | | 8/31/15 | | | 8/31/14 | |
Net asset value, beginning of period | | | $13.20 | | | | $12.22 | | | | $12.03 | | | | $12.30 | | | | $10.20 | |
| Income (loss) from investment operations | | | | | | | | | | | | | | | | | |
Net investment income (loss) (d) | | | $(0.18 | ) | | | $(0.15 | )(c) | | | $(0.15 | ) | | | $(0.19 | ) | | | $(0.17 | ) |
Net realized and unrealized gain (loss) | | | 3.43 | | | | 1.91 | | | | 0.74 | | | | 0.90 | | | | 2.27 | |
Total from investment operations | | | $3.25 | | | | $1.76 | | | | $0.59 | | | | $0.71 | | | | $2.10 | |
| Less distributions declared to shareholders | | | | | | | | | | | | | | | | | |
From net realized gain | | | $(1.41 | ) | | | $(0.78 | ) | | | $(0.40 | ) | | | $(0.98 | ) | | | $— | |
Net asset value, end of period (x) | | | $15.04 | | | | $13.20 | | | | $12.22 | | | | $12.03 | | | | $12.30 | |
Total return (%) (r)(s)(t)(x) | | | 26.78 | | | | 15.48 | (c) | | | 5.09 | | | | 6.45 | | | | 20.59 | |
Ratios (%) (to average net assets)
and Supplemental data: | | | | | | | | | | | | | | | | | |
Expenses before expense reductions (f) | | | 1.99 | | | | 2.07 | (c) | | | 2.10 | | | | 2.10 | | | | 2.07 | |
Expenses after expense reductions (f) | | | 1.95 | | | | 1.99 | (c) | | | 2.01 | | | | 2.01 | | | | 1.99 | |
Net investment income (loss) | | | (1.34 | ) | | | (1.21 | )(c) | | | (1.27 | ) | | | (1.52 | ) | | | (1.49 | ) |
Portfolio turnover | | | 33 | | | | 30 | | | | 43 | | | | 37 | | | | 59 | |
Net assets at end of period (000 omitted) | | | $2,236 | | | | $1,955 | | | | $1,641 | | | | $1,391 | | | | $953 | |
| (c) | Amount reflects a one-time reimbursement of expenses by the custodian (or former custodian) without which net investment income and performance would be lower and expenses would be higher. |
| (d) | Per share data is based on average shares outstanding. |
| (f) | Ratios do not reflect reductions from fees paid indirectly, if applicable. |
| (r) | Certain expenses have been reduced without which performance would have been lower. |
| (s) | From time to time the fund may receive proceeds from litigation settlements, without which performance would be lower. |
| (t) | Total returns do not include any applicable sales charges. |
| (w) | Per share amount was less than $0.01. |
| (x) | The net asset values and total returns have been calculated on net assets which include adjustments made in accordance with U.S. generally accepted accounting principles required at period end for financial reporting purposes. |
See Notes to Financial Statements
26
NOTES TO FINANCIAL STATEMENTS
(1) Business and Organization
MFS Mid Cap Growth Fund (the fund) is a diversified series of MFS Series Trust IV (the trust). The trust is organized as a Massachusetts business trust and is registered under the Investment Company Act of 1940, as amended, as an open-end management investment company.
The fund is an investment company and accordingly follows the investment company accounting and reporting guidance of the Financial Accounting Standards Board (FASB) Accounting Standards Codification Topic 946 Financial Services – Investment Companies.
(2) Significant Accounting Policies
General – The preparation of financial statements in conformity with U.S. generally accepted accounting principles requires management to make estimates and assumptions that affect the reported amounts of assets and liabilities, and disclosure of contingent assets and liabilities at the date of the financial statements and the reported amounts of increases and decreases in net assets from operations during the reporting period. Actual results could differ from those estimates. In the preparation of these financial statements, management has evaluated subsequent events occurring after the date of the fund’s Statement of Assets and Liabilities through the date that the financial statements were issued.
In August 2018, the FASB issued Accounting Standards Update 2018-13, Fair Value Measurement (Topic 820) – Disclosure Framework – Changes to the Disclosure Requirements for Fair Value Measurement (“ASU 2018-13”) which introduces new fair value disclosure requirements as well as eliminates and modifies certain existing fair value disclosure requirements. ASU 2018-13 would be effective for fiscal years beginning after December 15, 2019, and interim periods within those fiscal years; however, management has elected to early adopt ASU 2018-13 effective with the current reporting period. The impact of the fund’s adoption was limited to changes in the fund’s financial statement disclosures regarding fair value, primarily those disclosures related to transfers between levels of the fair value hierarchy.
Balance Sheet Offsetting – The fund’s accounting policy with respect to balance sheet offsetting is that, absent an event of default by the counterparty or a termination of the agreement, the International Swaps and Derivatives Association (ISDA) Master Agreement, or similar agreement, does not result in an offset of reported amounts of financial assets and financial liabilities in the Statement of Assets and Liabilities across transactions between the fund and the applicable counterparty. The fund’s right to setoff may be restricted or prohibited by the bankruptcy or insolvency laws of the particular jurisdiction to which a specific master netting agreement counterparty is subject. Balance sheet offsetting disclosures, to the extent applicable to the fund, have been included in the fund’s Significant Accounting Policies note under the captions for each of the fund’s in-scope financial instruments and transactions.
Investment Valuations – Equity securities, including restricted equity securities, are generally valued at the last sale or official closing price on their primary market or exchange as provided by a third-party pricing service. Equity securities, for which there
27
Notes to Financial Statements – continued
were no sales reported that day, are generally valued at the last quoted daily bid quotation on their primary market or exchange as provided by a third-party pricing service. Short-term instruments with a maturity at issuance of 60 days or less may be valued at amortized cost, which approximates market value. Open-end investment companies are generally valued at net asset value per share. Securities and other assets generally valued on the basis of information from a third-party pricing service may also be valued at a broker/dealer bid quotation. In determining values, third-party pricing services can utilize both transaction data and market information such as yield, quality, coupon rate, maturity, type of issue, trading characteristics, and other market data. The values of foreign securities and other assets and liabilities expressed in foreign currencies are converted to U.S. dollars using the mean of bid and asked prices for rates provided by a third-party pricing service.
The Board of Trustees has delegated primary responsibility for determining or causing to be determined the value of the fund’s investments (including any fair valuation) to the adviser pursuant to valuation policies and procedures approved by the Board. If the adviser determines that reliable market quotations are not readily available, investments are valued at fair value as determined in good faith by the adviser in accordance with such procedures under the oversight of the Board of Trustees. Under the fund’s valuation policies and procedures, market quotations are not considered to be readily available for most types of debt instruments and floating rate loans and many types of derivatives. These investments are generally valued at fair value based on information from third-party pricing services. In addition, investments may be valued at fair value if the adviser determines that an investment’s value has been materially affected by events occurring after the close of the exchange or market on which the investment is principally traded (such as foreign exchange or market) and prior to the determination of the fund’s net asset value, or after the halting of trading of a specific security where trading does not resume prior to the close of the exchange or market on which the security is principally traded. Events that occur on a frequent basis after foreign markets close (such as developments in foreign markets and significant movements in the U.S. markets) and prior to the determination of the fund’s net asset value may be deemed to have a material effect on the value of securities traded in foreign markets. Accordingly, the fund’s foreign equity securities may often be valued at fair value. The adviser generally relies on third-party pricing services or other information (such as the correlation with price movements of similar securities in the same or other markets; the type, cost and investment characteristics of the security; the business and financial condition of the issuer; and trading and other market data) to assist in determining whether to fair value and at what value to fair value an investment. The value of an investment for purposes of calculating the fund’s net asset value can differ depending on the source and method used to determine value. When fair valuation is used, the value of an investment used to determine the fund’s net asset value may differ from quoted or published prices for the same investment. There can be no assurance that the fund could obtain the fair value assigned to an investment if it were to sell the investment at the same time at which the fund determines its net asset value per share.
Various inputs are used in determining the value of the fund’s assets or liabilities. These inputs are categorized into three broad levels. In certain cases, the inputs used to measure fair value may fall into different levels of the fair value hierarchy. In such cases,
28
Notes to Financial Statements – continued
an investment’s level within the fair value hierarchy is based on the lowest level of input that is significant to the fair value measurement. The fund’s assessment of the significance of a particular input to the fair value measurement in its entirety requires judgment, and considers factors specific to the investment. Level 1 includes unadjusted quoted prices in active markets for identical assets or liabilities. Level 2 includes other significant observable market-based inputs (including quoted prices for similar
securities, interest rates, prepayment speed, and credit risk). Level 3 includes unobservable inputs, which may include the adviser’s own assumptions in determining the fair value of investments. The following is a summary of the levels used as of August 31, 2018 in valuing the fund’s assets or liabilities:
| | | | | | | | | | | | | | | | |
| Financial Instruments | | Level 1 | | | Level 2 | | | Level 3 | | | Total | |
| Equity Securities | | | $3,326,852,820 | | | | $— | | | | $— | | | | $3,326,852,820 | |
| Mutual Funds | | | 77,771,037 | | | | — | | | | — | | | | 77,771,037 | |
| Total | | | $3,404,623,857 | | | | $— | | | | $— | | | | $3,404,623,857 | |
For further information regarding security characteristics, see the Portfolio of Investments.
Foreign Currency Translation – Purchases and sales of foreign investments, income, and expenses are converted into U.S. dollars based upon currency exchange rates prevailing on the respective dates of such transactions or on the reporting date for foreign denominated receivables and payables. Gains and losses attributable to foreign currency exchange rates on sales of securities are recorded for financial statement purposes as net realized gains and losses on investments. Gains and losses attributable to foreign exchange rate movements on receivables, payables, income and expenses are recorded for financial statement purposes as foreign currency transaction gains and losses. That portion of both realized and unrealized gains and losses on investments that results from fluctuations in foreign currency exchange rates is not separately disclosed.
Security Loans – Under its Securities Lending Agency Agreement with the fund, JPMorgan Chase and Co. (“Chase”), as lending agent, loans the securities of the fund to certain qualified institutions (the “Borrowers”) approved by the fund. Security loans can be terminated at the discretion of either the lending agent or the fund and the related securities must be returned within the earlier of the standard trade settlement period for such securities or within three business days. The loans are collateralized by cash and/or U.S. Treasury and federal agency obligations in an amount typically at least equal to the market value of the securities loaned. On loans collateralized by cash, the cash collateral is invested in a money market fund. The market value of the loaned securities is determined at the close of business of the fund and any additional required collateral is delivered to the fund on the next business day. Chase provides the fund with indemnification against Borrower default. In the event of Borrower default, Chase will, for the benefit of the fund, either purchase securities identical to those loaned or, when such purchase is commercially impracticable, pay the fund the market value of the loaned securities. In return, Chase assumes the fund’s rights to the related collateral. If the collateral value is less than the cost to purchase identical securities, Chase is responsible for the shortfall, but only to the extent that such shortfall is not due to a decline in collateral value resulting from collateral reinvestment for which the
29
Notes to Financial Statements – continued
fund bears the risk of loss. At period end, the fund had investment securities on loan, all of which were classified as equity securities in the fund’s Portfolio of Investments, with a fair value of $8,013,005. The fair value of the fund’s investment securities on loan is presented gross in the Statement of Assets and Liabilities. These loans were collateralized by U.S. Treasury Obligations of $8,212,113. The collateral on securities loaned exceeded the value of securities on loan at period end. A portion of the income generated upon investment of the collateral is remitted to the Borrowers, and the remainder is allocated between the fund and the lending agent. On loans collateralized by U.S. Treasury and/or federal agency obligations, a fee is received from the Borrower, and is allocated between the fund and the lending agent. Income from securities lending is separately reported in the Statement of Operations. The dividend and interest income earned on the securities loaned is accounted for in the same manner as other dividend and interest income.
Indemnifications – Under the fund’s organizational documents, its officers and Trustees may be indemnified against certain liabilities and expenses arising out of the performance of their duties to the fund. Additionally, in the normal course of business, the fund enters into agreements with service providers that may contain indemnification clauses. The fund’s maximum exposure under these agreements is unknown as this would involve future claims that may be made against the fund that have not yet occurred.
Investment Transactions and Income – Investment transactions are recorded on the trade date. Dividends received in cash are recorded on the ex-dividend date. Certain dividends from foreign securities will be recorded when the fund is informed of the dividend if such information is obtained subsequent to the ex-dividend date. Dividend payments received in additional securities are recorded on the ex-dividend date in an amount equal to the value of the security on such date.
The fund may receive proceeds from litigation settlements. Any proceeds received from litigation involving portfolio holdings are reflected in the Statement of Operations in realized gain/loss if the security has been disposed of by the fund or in unrealized gain/loss if the security is still held by the fund. Any other proceeds from litigation not related to portfolio holdings are reflected as other income in the Statement of Operations.
Fees Paid Indirectly – The fund’s custody fee may be reduced by a credit earned under an arrangement that measures the value of U.S. dollars deposited with the custodian by the fund. The amount of the credit, for the year ended August 31, 2018, is shown as a reduction of total expenses in the Statement of Operations.
Tax Matters and Distributions – The fund intends to qualify as a regulated investment company, as defined under Subchapter M of the Internal Revenue Code, and to distribute all of its taxable income, including realized capital gains. As a result, no provision for federal income tax is required. The fund’s federal tax returns, when filed, will remain subject to examination by the Internal Revenue Service for a three year period. Management has analyzed the fund’s tax positions taken on federal and state tax returns for all open tax years and does not believe that there are any uncertain tax positions that require recognition of a tax liability. Foreign taxes, if any, have been accrued by the fund in the accompanying financial statements in accordance with the
30
Notes to Financial Statements – continued
applicable foreign tax law. Foreign income taxes may be withheld by certain countries in which the fund invests. Additionally, capital gains realized by the fund on securities issued in or by certain foreign countries may be subject to capital gains tax imposed by those countries.
Distributions to shareholders are recorded on the ex-dividend date. Income and capital gain distributions are determined in accordance with income tax regulations, which may differ from U.S. generally accepted accounting principles. Certain capital accounts in the financial statements are periodically adjusted for permanent differences in order to reflect their tax character. These adjustments have no impact on net assets or net asset value per share. Temporary differences which arise from recognizing certain items of income, expense, gain or loss in different periods for financial statement and tax
purposes will reverse at some time in the future. Distributions in excess of net investment income or net realized gains are temporary overdistributions for financial statement purposes resulting from differences in the recognition or classification of income or distributions for financial statement and tax purposes.
Book/tax differences primarily relate to net operating losses, wash sale loss deferrals, and treating a portion of the proceeds from redemptions as a distribution for tax purposes.
The tax character of distributions declared to shareholders for the last two fiscal years is as follows:
| | | | | | | | |
| | | Year ended
8/31/18 | | | Year ended
8/31/17 | |
| Ordinary income (including any short-term capital gains) | | | $2,072,730 | | | | $— | |
| Long-term capital gains | | | 198,559,687 | | | | 104,568,995 | |
| Total distributions | | | $200,632,417 | | | | $104,568,995 | |
The federal tax cost and the tax basis components of distributable earnings were as follows:
| | | | |
| As of 8/31/18 | | | |
| Cost of investments | | | $2,242,637,776 | |
| Gross appreciation | | | 1,172,141,439 | |
| Gross depreciation | | | (10,155,358 | ) |
| Net unrealized appreciation (depreciation) | | | $1,161,986,081 | |
| Undistributed long-term capital gain | | | 84,636,223 | |
| Other temporary differences | | | (22,234 | ) |
Multiple Classes of Shares of Beneficial Interest – The fund offers multiple classes of shares, which differ in their respective distribution, service, and program manager fees. The fund’s income, realized and unrealized gain (loss), and common expenses are allocated to shareholders based on the daily net assets of each class. Dividends are declared separately for each class. Differences in per share dividend rates are generally due to differences in separate class expenses. Class B and Class 529B shares will convert to Class A and Class 529A shares, respectively, approximately eight years after purchase. Effective April 23, 2018, Class C and Class 529C shares will convert to
31
Notes to Financial Statements – continued
Class A and Class 529A shares, respectively, approximately ten years after purchase. The fund’s distributions declared to shareholders as reported in the Statements of Changes in Net Assets are presented by class as follows:
| | | | | | | | |
| | | From net realized
gain | |
| | | Year
ended
8/31/18 | | | Year
ended
8/31/17 | |
| Class A | | | $50,384,409 | | | | $24,244,271 | |
| Class B | | | 1,602,761 | | | | 1,018,305 | |
| Class C | | | 6,058,344 | | | | 3,350,788 | |
| Class I | | | 11,753,271 | | | | 7,969,041 | |
| Class R1 | | | 218,273 | | | | 120,315 | |
| Class R2 | | | 559,069 | | | | 308,979 | |
| Class R3 | | | 3,724,124 | | | | 852,762 | |
| Class R4 | | | 2,000,734 | | | | 730,593 | |
| Class R6 | | | 123,661,112 | | | | 65,639,889 | |
| Class 529A | | | 442,551 | | | | 214,497 | |
| Class 529B | | | 21,794 | | | | 11,119 | |
| Class 529C | | | 205,975 | | | | 108,436 | |
| Total | | | $200,632,417 | | | | $104,568,995 | |
(3) Transactions with Affiliates
Investment Adviser – The fund has an investment advisory agreement with MFS to provide overall investment management and related administrative services and facilities to the fund. The management fee is computed daily and paid monthly at the following annual rates based on the fund’s average daily net assets:
| | | | |
| Up to $1 billion | | | 0.75 | % |
| In excess of $1 billion and up to $2.5 billion | | | 0.70 | % |
| In excess of $2.5 billion | | | 0.65 | % |
MFS has agreed in writing to reduce its management fee by a specified amount if certain MFS mutual fund assets exceed thresholds agreed to by MFS and the fund’s Board of Trustees. For the year ended August 31, 2018, this management fee reduction amounted to $253,402, which is included in the reduction of total expenses in the Statement of Operations. The management fee incurred for the year ended August 31, 2018 was equivalent to an annual effective rate of 0.70% of the fund’s average daily net assets.
The investment adviser has agreed in writing to pay a portion of the fund’s total annual operating expenses, excluding interest, taxes, extraordinary expenses, brokerage and transaction costs, and investment-related expenses, such that total fund operating expenses do not exceed the following rates annually of each class’s average daily net assets:
| | | | | | | | | | | | | | | | | | | | | | | | | | | | | | | | | | | | | | | | | | | | |
| Classes | |
| A | | B | | | C | | | I | | | R1 | | | R2 | | | R3 | | | R4 | | | R6 | | | 529A | | | 529B | | | 529C | |
| 1.30% | | | 2.05% | | | | 2.05% | | | | 1.05% | | | | 2.05% | | | | 1.55% | | | | 1.30% | | | | 1.05% | | | | 0.95% | | | | 1.35% | | | | 2.10% | | | | 2.10% | |
This written agreement will continue until modified by the fund’s Board of Trustees, but such agreement will continue at least until December 31, 2019. For the year ended
32
Notes to Financial Statements – continued
August 31, 2018, the fund’s actual operating expenses did not exceed the limit and therefore, the investment adviser did not pay any portion of the fund’s expenses related to this agreement.
Distributor – MFS Fund Distributors, Inc. (MFD), a wholly-owned subsidiary of MFS, as distributor, received $348,363 and $4,824 for the year ended August 31, 2018, as its portion of the initial sales charge on sales of Class A and Class 529A shares of the fund, respectively.
The Board of Trustees has adopted a distribution plan for certain share classes pursuant to Rule 12b-1 of the Investment Company Act of 1940.
The fund’s distribution plan provides that the fund will pay MFD for services provided by MFD and financial intermediaries in connection with the distribution and servicing of certain share classes. One component of the plan is a distribution fee paid to MFD and another component of the plan is a service fee paid to MFD. MFD may subsequently pay all, or a portion, of the distribution and/or service fees to financial intermediaries.
Distribution Plan Fee Table:
| | | | | | | | | | | | | | | | | | | | |
| | | Distribution
Fee Rate (d) | | | Service
Fee Rate (d) | | | Total
Distribution
Plan (d) | | | Annual
Effective
Rate (e) | | | Distribution
and Service
Fee | |
| Class A | | | — | | | | 0.25% | | | | 0.25% | | | | 0.25% | | | | $1,674,653 | |
| Class B | | | 0.75% | | | | 0.25% | | | | 1.00% | | | | 1.00% | | | | 172,285 | |
| Class C | | | 0.75% | | | | 0.25% | | | | 1.00% | | | | 1.00% | | | | 577,296 | |
| Class R1 | | | 0.75% | | | | 0.25% | | | | 1.00% | | | | 1.00% | | | | 24,937 | |
| Class R2 | | | 0.25% | | | | 0.25% | | | | 0.50% | | | | 0.50% | | | | 36,639 | |
| Class R3 | | | — | | | | 0.25% | | | | 0.25% | | | | 0.25% | | | | 150,438 | |
| Class 529A | | | — | | | | 0.25% | | | | 0.25% | | | | 0.21% | | | | 15,015 | |
| Class 529B | | | 0.75% | | | | 0.25% | | | | 1.00% | | | | 1.00% | | | | 2,535 | |
| Class 529C | | | 0.75% | | | | 0.25% | | | | 1.00% | | | | 0.99% | | | | 20,957 | |
| Total Distribution and Service Fees | | | | | | | | | | | | $2,674,755 | |
| (d) | In accordance with the distribution plan for certain classes, the fund pays distribution and/or service fees equal to these annual percentage rates of each class’s average daily net assets. The distribution and service fee rates disclosed by class represent the current rates in effect at the end of the reporting period. Any rate changes, if applicable, are detailed below. |
| (e) | The annual effective rates represent actual fees incurred under the distribution plan for the year ended August 31, 2018 based on each class’s average daily net assets. MFD has voluntarily agreed to rebate a portion of each class’s 0.25% service fee attributable to accounts for which MFD retains the 0.25% service fee except for accounts attributable to MFS or its affiliates’ seed money. For the year ended August 31, 2018, this rebate amounted to $19,094, $737, $1,377, $2,236, and $228 for Class A, Class B, Class C, Class 529A, and Class 529C, respectively, and is included in the reduction of total expenses in the Statement of Operations. |
Certain Class A shares are subject to a contingent deferred sales charge (CDSC) in the event of a shareholder redemption within 18 months of purchase. Class B and Class 529B shares are subject to a CDSC in the event of a shareholder redemption within six years of purchase. Class C and Class 529C shares are subject to a CDSC in
33
Notes to Financial Statements – continued
the event of a shareholder redemption within 12 months of purchase. All contingent deferred sales charges are paid to MFD and during the year ended August 31, 2018, were as follows:
| | | | |
| | | Amount | |
| Class A | | | $11,948 | |
| Class B | | | 20,024 | |
| Class C | | | 6,854 | |
| Class 529B | | | — | |
| Class 529C | | | 49 | |
The fund has entered into and may from time to time enter into contracts with program managers and other parties which administer the tuition programs through which an investment in the fund’s 529 share classes is made. For the period from September 1, 2017 through December 10, 2017, the fund had entered into an agreement with MFD pursuant to which MFD received an annual fee of up to 0.10% of the average daily net assets attributable to each 529 share class. MFD had agreed to waive a portion of this fee in an amount equal to 0.05% of the average daily net assets for each 529 share class. This waiver agreement terminated on December 10, 2017. For the period from September 1, 2017 through December 10, 2017, this waiver amounted to $1,024 and is included in the reduction of total expenses in the Statement of Operations. Effective December 11, 2017, the fund has entered into an agreement with MFD pursuant to which MFD receives an annual fee of up to 0.05% of the average daily net assets attributable to each 529 share class. The program manager fee incurred for the year ended August 31, 2018 was equivalent to an annual effective rate of 0.05% of the average daily net assets attributable to each 529 share class. The services provided by MFD, or a third party with which MFD contracts, include recordkeeping and tax reporting and account services, as well as services designed to maintain the program’s compliance with the Internal Revenue Code and other regulatory requirements. Program manager fees and waivers for the year ended August 31, 2018, were as follows:
| | | | | | | | |
| | | Fee | | | Waiver | |
| Class 529A | | | $3,717 | | | | $714 | |
| Class 529B | | | 157 | | | | 30 | |
| Class 529C | | | 1,327 | | | | 280 | |
| Total Program Manager Fees and Waivers | | | $5,201 | | | | $1,024 | |
Shareholder Servicing Agent – MFS Service Center, Inc. (MFSC), a wholly-owned subsidiary of MFS, receives a fee from the fund for its services as shareholder servicing agent calculated as a percentage of the average daily net assets of the fund as determined periodically under the supervision of the fund’s Board of Trustees. For the year ended August 31, 2018, the fee was $302,736, which equated to 0.0109% annually of the fund’s average daily net assets. MFSC also receives payment from the fund for out-of-pocket expenses, sub-accounting and other shareholder servicing costs which may be paid to affiliated and unaffiliated service providers. Class R6 shares do not incur sub-accounting fees. For the year ended August 31, 2018, these out-of-pocket expenses, sub-accounting and other shareholder servicing costs amounted to $1,305,725.
34
Notes to Financial Statements – continued
Under a Special Servicing Agreement among MFS, certain MFS funds which invest in other MFS funds (“MFS fund-of-funds”) and certain underlying funds in which a MFS fund-of-funds invests (“underlying funds”), each underlying fund may pay a portion of each MFS fund-of-funds’ transfer agent-related expenses, including sub-accounting fees payable to financial intermediaries, to the extent such payments do not exceed the benefits realized or expected to be realized by the underlying fund from the investment in the underlying fund by the MFS fund-of-funds. For the year ended August 31, 2018, these costs for the fund amounted to $1,143,474 and are included in “Shareholder servicing costs” in the Statement of Operations.
Administrator – MFS provides certain financial, legal, shareholder communications, compliance, and other administrative services to the fund. Under an administrative services agreement, the fund reimburses MFS the costs incurred to provide these services. The fund is charged an annual fixed amount of $17,500 plus a fee based on average daily net assets. The administrative services fee incurred for the year ended August 31, 2018 was equivalent to an annual effective rate of 0.0153% of the fund’s average daily net assets.
Trustees’ and Officers’ Compensation – The fund pays compensation to independent Trustees in the form of a retainer, attendance fees, and additional compensation to Board and Committee chairpersons. The fund does not pay compensation directly to Trustees or officers of the fund who are also officers of the investment adviser, all of whom receive remuneration for their services to the fund from MFS. Certain officers and Trustees of the fund are officers or directors of MFS, MFD, and MFSC.
Prior to December 31, 2001, the fund had an unfunded defined benefit plan (“DB plan”) for independent Trustees. As of December 31, 2001, the Board took action to terminate the DB plan with respect to then-current and any future independent Trustees, such that the DB plan covers only certain of those former independent Trustees who retired on or before December 31, 2001. Effective January 1, 2002, accrued benefits under the DB plan for then-current independent Trustees who continued were credited to an unfunded retirement deferral plan (the “Retirement Deferral plan”), which was established for and exists solely with respect to these credited amounts, and is not available for other deferrals by these or other independent Trustees. Although the Retirement Deferral plan is unfunded, amounts deferred under the plan are periodically adjusted for investment experience as if they had been invested in shares of the fund. The DB plan resulted in a pension expense of $1,056 and the Retirement Deferral plan resulted in an expense of $5,001. Both amounts are included in “Independent Trustees’ compensation” in the Statement of Operations for the year ended August 31, 2018. The liability for deferred retirement benefits payable to those former independent Trustees under both plans amounted to $29,238 at August 31, 2018, and is included in “Payable for independent Trustees’ compensation” in the Statement of Assets and Liabilities.
Other – This fund and certain other funds managed by MFS (the funds) have entered into a service agreement (the ISO Agreement) which provides for payment of fees solely by the funds to Tarantino LLC in return for the provision of services of an Independent Senior Officer (ISO) for the funds. Frank L. Tarantino serves as the ISO and is an officer of the funds and the sole member of Tarantino LLC. The funds can
35
Notes to Financial Statements – continued
terminate the ISO Agreement with Tarantino LLC at any time under the terms of the ISO Agreement. For the year ended August 31, 2018, the fee paid by the fund under this agreement was $4,699 and is included in “Miscellaneous” expense in the Statement of Operations. MFS has agreed to bear all expenses associated with office space, other administrative support, and supplies provided to the ISO.
The fund invests in the MFS Institutional Money Market Portfolio which is managed by MFS and seeks current income consistent with preservation of capital and liquidity. This money market fund does not pay a management fee to MFS.
The fund is permitted to engage in purchase and sale transactions with funds and accounts for which MFS serves as investment adviser or sub-adviser (“cross-trades”) pursuant to a policy adopted by the Board of Trustees. This policy has been designed to ensure that cross-trades conducted by the fund comply with Rule 17a-7 under the Investment Company Act of 1940. During the year ended August 31, 2018, the fund engaged in purchase and sale transactions pursuant to this policy, which amounted to $7,571,849 and $382,040, respectively. The sales transactions resulted in net realized gains (losses) of $7,791.
Effective on or about January 3, 2018, the adviser has voluntarily undertaken to reimburse the fund from its own resources on a quarterly basis for the cost of investment research embedded in the cost of the fund’s securities trades. This agreement may be rescinded at any time. For the period on or about January 3, 2018 to August 31, 2018, this reimbursement amounted to $53,118, which is included in “Other” income in the Statement of Operations.
(4) Portfolio Securities
For the year ended August 31, 2018, purchases and sales of investments, other than short-term obligations, aggregated $1,217,076,054 and $898,112,470, respectively.
36
Notes to Financial Statements – continued
(5) Shares of Beneficial Interest
The fund’s Declaration of Trust permits the Trustees to issue an unlimited number of full and fractional shares of beneficial interest. Transactions in fund shares were as follows:
| | | | | | | | | | | | | | | | |
| | | Year ended
8/31/18 | | | Year ended
8/31/17 | |
| | | Shares | | | Amount | | | Shares | | | Amount | |
| Shares sold | | | | | | | | | | | | | | | | |
Class A | | | 14,065,015 | | | | $242,799,954 | | | | 12,105,552 | | | | $179,700,551 | |
Class B | | | 252,682 | | | | 3,660,395 | | | | 164,087 | | | | 2,086,315 | |
Class C | | | 1,103,666 | | | | 15,578,907 | | | | 931,425 | | | | 11,513,690 | |
Class I | | | 12,660,264 | | | | 231,521,443 | | | | 13,167,909 | | | | 203,697,542 | |
Class R1 | | | 51,455 | | | | 730,780 | | | | 46,557 | | | | 584,581 | |
Class R2 | | | 187,019 | | | | 3,037,589 | | | | 124,685 | | | | 1,767,559 | |
Class R3 | | | 3,661,027 | | | | 62,774,764 | | | | 1,506,862 | | | | 22,094,578 | |
Class R4 | | | 1,672,898 | | | | 29,803,783 | | | | 613,726 | | | | 9,314,558 | |
Class R6 | | | 24,401,679 | | | | 448,163,924 | | | | 16,344,410 | | | | 269,836,579 | |
Class 529A | | | 99,357 | | | | 1,668,196 | | | | 63,804 | | | | 918,132 | |
Class 529B | | | 3,527 | | | | 48,866 | | | | 2,077 | | | | 25,222 | |
Class 529C | | | 11,318 | | | | 151,672 | | | | 24,650 | | | | 291,374 | |
| | | 58,169,907 | | | | $1,039,940,273 | | | | 45,095,744 | | | | $701,830,681 | |
|
Shares issued to shareholders in
reinvestment of distributions | |
Class A | | | 2,914,331 | | | | $46,075,586 | | | | 1,693,625 | | | | $23,659,943 | |
Class B | | | 119,096 | | | | 1,570,884 | | | | 83,232 | | | | 992,956 | |
Class C | | | 462,829 | | | | 5,924,215 | | | | 273,252 | | | | 3,172,455 | |
Class I | | | 675,001 | | | | 11,279,263 | | | | 444,442 | | | | 6,515,527 | |
Class R1 | | | 16,624 | | | | 218,273 | | | | 10,127 | | | | 120,315 | |
Class R2 | | | 28,734 | | | | 429,577 | | | | 18,166 | | | | 241,608 | |
Class R3 | | | 236,889 | | | | 3,723,888 | | | | 61,394 | | | | 852,762 | |
Class R4 | | | 121,206 | | | | 1,979,292 | | | | 49,720 | | | | 713,483 | |
Class R6 | | | 7,226,495 | | | | 121,332,844 | | | | 4,428,404 | | | | 65,141,818 | |
Class 529A | | | 28,831 | | | | 442,551 | | | | 15,751 | | | | 214,213 | |
Class 529B | | | 1,693 | | | | 21,794 | | | | 952 | | | | 11,119 | |
Class 529C | | | 16,374 | | | | 204,347 | | | | 9,554 | | | | 108,436 | |
| | | 11,848,103 | | | | $193,202,514 | | | | 7,088,619 | | | | $101,744,635 | |
37
Notes to Financial Statements – continued
| | | | | | | | | | | | | | | | |
| | | Year ended
8/31/18 | | | Year ended
8/31/17 | |
| | | Shares | | | Amount | | | Shares | | | Amount | |
| Shares reacquired | | | | | | | | | | | | | | | | |
Class A | | | (8,964,959 | ) | | | $(152,775,799 | ) | | | (9,457,126 | ) | | | $(140,074,443 | ) |
Class B | | | (332,429 | ) | | | (4,761,028 | ) | | | (475,481 | ) | | | (6,038,789 | ) |
Class C | | | (2,401,544 | ) | | | (33,170,587 | ) | | | (1,180,736 | ) | | | (14,739,240 | ) |
Class I | | | (2,838,466 | ) | | | (51,579,752 | ) | | | (14,888,855 | ) | | | (244,386,597 | ) |
Class R1 | | | (59,352 | ) | | | (845,513 | ) | | | (48,129 | ) | | | (608,541 | ) |
Class R2 | | | (144,478 | ) | | | (2,342,100 | ) | | | (111,646 | ) | | | (1,573,576 | ) |
Class R3 | | | (909,378 | ) | | | (15,546,060 | ) | | | (574,165 | ) | | | (8,536,507 | ) |
Class R4 | | | (391,644 | ) | | | (6,976,696 | ) | | | (248,206 | ) | | | (3,793,157 | ) |
Class R6 | | | (21,062,540 | ) | | | (385,946,155 | ) | | | (18,169,952 | ) | | | (287,574,391 | ) |
Class 529A | | | (29,686 | ) | | | (501,514 | ) | | | (39,555 | ) | | | (568,257 | ) |
Class 529B | | | (1,072 | ) | | | (15,579 | ) | | | (4,277 | ) | | | (52,981 | ) |
Class 529C | | | (27,056 | ) | | | (365,080 | ) | | | (20,409 | ) | | | (246,245 | ) |
| | | (37,162,604 | ) | | | $(654,825,863 | ) | | | (45,218,537 | ) | | | $(708,192,724 | ) |
| | | | |
| Net change | | | | | | | | | | | | | | | | |
Class A | | | 8,014,387 | | | | $136,099,741 | | | | 4,342,051 | | | | $63,286,051 | |
Class B | | | 39,349 | | | | 470,251 | | | | (228,162 | ) | | | (2,959,518 | ) |
Class C | | | (835,049 | ) | | | (11,667,465 | ) | | | 23,941 | | | | (53,095 | ) |
Class I | | | 10,496,799 | | | | 191,220,954 | | | | (1,276,504 | ) | | | (34,173,528 | ) |
Class R1 | | | 8,727 | | | | 103,540 | | | | 8,555 | | | | 96,355 | |
Class R2 | | | 71,275 | | | | 1,125,066 | | | | 31,205 | | | | 435,591 | |
Class R3 | | | 2,988,538 | | | | 50,952,592 | | | | 994,091 | | | | 14,410,833 | |
Class R4 | | | 1,402,460 | | | | 24,806,379 | | | | 415,240 | | | | 6,234,884 | |
Class R6 | | | 10,565,634 | | | | 183,550,613 | | | | 2,602,862 | | | | 47,404,006 | |
Class 529A | | | 98,502 | | | | 1,609,233 | | | | 40,000 | | | | 564,088 | |
Class 529B | | | 4,148 | | | | 55,081 | | | | (1,248 | ) | | | (16,640 | ) |
Class 529C | | | 636 | | | | (9,061 | ) | | | 13,795 | | | | 153,565 | |
| | | 32,855,406 | | | | $578,316,924 | | | | 6,965,826 | | | | $95,382,592 | |
Class T shares were not publicly available for sale during the period. Please see the fund’s prospectus for details.
The fund is one of several mutual funds in which certain MFS funds may invest. The MFS funds do not invest in the underlying funds for the purpose of exercising management or control. At the end of the period, the MFS Growth Allocation Fund, the MFS Moderate Allocation Fund, the MFS Aggressive Growth Allocation Fund, and the MFS Conservative Allocation Fund were the owners of record of approximately 14%, 12%, 6%, and 4%, respectively, of the value of outstanding voting shares of the fund. In addition, the MFS Lifetime Income Fund, the MFS Lifetime 2020 Fund, the MFS Lifetime 2025 Fund, the MFS Lifetime 2030 Fund, the MFS Lifetime 2035 Fund, the MFS Lifetime 2040 Fund, the MFS Lifetime 2045 Fund, the MFS Lifetime 2050 Fund, the MFS Lifetime 2055 Fund, and the MFS Lifetime 2060 Fund were each the owners of record of less than 1% of the value of outstanding voting shares of the fund.
38
Notes to Financial Statements – continued
(6) Line of Credit
The fund and certain other funds managed by MFS participate in a $1.25 billion unsecured committed line of credit, subject to a $1 billion sublimit, provided by a syndication of banks under a credit agreement. Borrowings may be made for temporary financing needs. Interest is charged to each fund, based on its borrowings, generally at a rate equal to the higher of the Overnight Bank Funding rate or daily one month LIBOR plus an agreed upon spread. A commitment fee, based on the average daily, unused portion of the committed line of credit, is allocated among the participating funds. In addition, the fund and other funds managed by MFS have established unsecured uncommitted borrowing arrangements with certain banks for temporary financing needs. Interest is charged to each fund, based on its borrowings, at a rate equal to the Overnight Bank Funding rate plus an agreed upon spread. For the year ended August 31, 2018, the fund’s commitment fee and interest expense were $14,688 and $0, respectively, and are included in “Miscellaneous” expense in the Statement of Operations.
(7) Investments in Affiliated Issuers
An affiliated issuer may be considered one in which the fund owns 5% or more of the outstanding voting securities, or a company which is under common control. For the purposes of this report, the fund assumes the following to be affiliated issuers:
| | | | | | | | | | | | | | | | | | | | |
| Affiliated Issuers | | | | | Beginning
Shares/Par
Amount | | | Acquisitions
Shares/Par
Amount | | | Dispositions
Shares/Par
Amount | | | Ending
Shares/Par
Amount | |
| MFS Institutional Money | | | | | | | | | | | | | | | | | |
| Market Portfolio | | | | 44,180,902 | | | | 600,268,786 | | | | (566,678,651 | ) | | | 77,771,037 | |
| | | | | |
| Affiliated Issuers | | Realized
Gain (Loss) | | | Change in
Unrealized
Appreciation/
Depreciation | | | Capital Gain
Distributions | | | Dividend
Income | | | Ending
Value | |
| MFS Institutional Money Market Portfolio | | | $(7,433 | ) | | | $7,971 | | | | $— | | | | $1,032,559 | | | | $77,771,037 | |
39
REPORT OF INDEPENDENT REGISTERED PUBLIC ACCOUNTING FIRM
To the Board of Trustees of MFS Series Trust IV and the Shareholders of
MFS Mid Cap Growth Fund:
Opinion on the Financial Statements and Financial Highlights
We have audited the accompanying statement of assets and liabilities of MFS Mid Cap Growth Fund (the “Fund”), including the portfolio of investments, as of August 31, 2018, the related statement of operations for the year then ended, the statements of changes in net assets for each of the two years in the period then ended, the financial highlights for each of the five years in the period then ended, and the related notes. In our opinion, the financial statements and financial highlights present fairly, in all material respects, the financial position of the Fund as of August 31, 2018, and the results of its operations for the year then ended, the changes in its net assets for each of the two years in the period then ended, and the financial highlights for each of the five years in the period then ended, in conformity with accounting principles generally accepted in the United States of America.
Basis for Opinion
These financial statements and financial highlights are the responsibility of the Fund’s management. Our responsibility is to express an opinion on the Fund’s financial statements and financial highlights based on our audits. We are a public accounting firm registered with the Public Company Accounting Oversight Board (United States) (PCAOB) and are required to be independent with respect to the Fund in accordance with the U.S. federal securities laws and the applicable rules and regulations of the Securities and Exchange Commission and the PCAOB.
We conducted our audits in accordance with the standards of the PCAOB. Those standards require that we plan and perform the audit to obtain reasonable assurance about whether the financial statements and financial highlights are free of material misstatement, whether due to error or fraud. The Fund is not required to have, nor were we engaged to perform, an audit of its internal control over financial reporting. As part of our audits we are required to obtain an understanding of internal control over financial reporting but not for the purpose of expressing an opinion on the effectiveness of the Fund’s internal control over financial reporting. Accordingly, we express no such opinion.
Our audits included performing procedures to assess the risks of material misstatement of the financial statements and financial highlights, whether due to error or fraud, and performing procedures that respond to those risks. Such procedures included examining, on a test basis, evidence regarding the amounts and disclosures in the financial statements and financial highlights. Our audits also included evaluating the accounting principles used and significant estimates made by management, as well as evaluating the overall presentation of the financial statements and financial highlights. Our procedures included confirmation of securities owned as of August 31, 2018, by
40
Report of Independent Registered Public Accounting Firm – continued
correspondence with the custodian and brokers. We believe that our audits provide a reasonable basis for our opinion.
DELOITTE & TOUCHE LLP
Boston, Massachusetts
October 16, 2018
We have served as the auditor of one or more of the MFS investment companies since 1924.
41
TRUSTEES AND OFFICERS —
IDENTIFICATION AND BACKGROUND
The Trustees and Officers of the Trust, as of October 1, 2018, are listed below, together with their principal occupations during the past five years. (Their titles may have varied during that period.) The address of each Trustee and Officer is 111 Huntington Avenue, Boston, Massachusetts 02199-7618.
| | | | | | | | | | |
Name, Age | | Position(s)
Held with Fund | | Trustee/Officer Since (h) | | Number of
MFS Funds
overseen by the Trustee | | Principal
Occupations During the Past Five Years | | Other Directorships During the Past Five Years (j) |
| INTERESTED TRUSTEES |
Robert J. Manning (k)
(age 54) | | Trustee | | February 2004 | | 135 | | Massachusetts Financial Services Company, Executive Chairman (since January 2017); Director; Chairman of the Board; Chief Executive Officer (until 2015); Co-Chief Executive Officer (2015-2016) | | N/A |
Robin A. Stelmach (k)
(age 57) | | Trustee | | January 2014 | | 135 | | Massachusetts Financial Services Company, Vice Chair (since January 2017); Chief Operating Officer and Executive Vice President (until January 2017) | | N/A |
| INDEPENDENT TRUSTEES |
John P. Kavanaugh
(age 63) | | Trustee and Chair of Trustees | | January 2009 | | 135 | | Private investor | | N/A |
Steven E. Buller
(age 67) | | Trustee | | February 2014 | | 135 | | Financial Accounting Standards Advisory Council, Chairman (2014-2015); Public Company Accounting Oversight Board, Standing Advisory Group, Member (until 2014); BlackRock, Inc. (investment management), Managing Director (until 2014), BlackRock Finco UK (investment management), Director (until 2014) | | N/A |
42
Trustees and Officers – continued
| | | | | | | | | | |
Name, Age | | Position(s)
Held with Fund | | Trustee/Officer Since (h) | | Number of
MFS Funds
overseen by the Trustee | | Principal
Occupations During the Past Five Years | | Other Directorships During the Past Five Years (j) |
John A. Caroselli
(age 64) | | Trustee | | March 2017 | | 135 | | JC Global Advisors, LLC (management consulting), President (since 2015); First Capital Corporation (commercial finance), Executive Vice President (until 2015) | | N/A |
Maureen R. Goldfarb
(age 63) | | Trustee | | January 2009 | | 135 | | Private investor | | N/A |
Michael Hegarty
(age 73) | | Trustee | | December 2004 | | 135 | | Private investor | | Rouse Properties Inc., Director (until 2016); Capmark Financial Group Inc., Director (until 2015) |
Clarence Otis, Jr.
(age 62) | | Trustee | | March 2017 | | 135 | | Darden Restaurants, Inc., Chief Executive Officer (until 2014) | | VF Corporation, Director; Verizon Communications, Inc., Director; The Travelers Companies, Director; Federal Reserve Bank of Atlanta, Director (until 2015) |
Maryanne L. Roepke
(age 62) | | Trustee | | May 2014 | | 135 | | American Century Investments (investment management), Senior Vice President and Chief Compliance Officer (until 2014) | | N/A |
Laurie J. Thomsen
(age 61) | | Trustee | | March 2005 | | 135 | | Private investor | | The Travelers Companies, Director; Dycom Industries, Inc., Director (since 2015) |
43
Trustees and Officers – continued
| | | | | | | | |
Name, Age | | Position(s) Held with Fund | | Trustee/Officer
Since (h) | | Number of MFS Funds for which the Person is an Officer | | Principal
Occupations During the Past Five Years |
| OFFICERS | | | | | | | | |
Christopher R. Bohane (k)
(age 44) | | Assistant Secretary and Assistant Clerk | | July 2005 | | 135 | | Massachusetts Financial Services Company, Vice President and Assistant General Counsel |
Kino Clark (k)
(age 50) | | Assistant Treasurer | | January 2012 | | 135 | | Massachusetts Financial Services Company, Vice President |
John W. Clark, Jr. (k)
(age 51) | | Assistant Treasurer | | April 2017 | | 135 | | Massachusetts Financial Services Company, Vice President (since March 2017); Deutsche Bank (financial services), Department Head – Treasurer’s Office (until February 2017) |
Thomas H. Connors (k)
(age 59) | | Assistant Secretary and Assistant Clerk | | September 2012 | | 135 | | Massachusetts Financial Services Company, Vice President and Senior Counsel |
Ethan D. Corey (k)
(age 54) | | Assistant Secretary and Assistant Clerk | | July 2005 | | 135 | | Massachusetts Financial Services Company, Senior Vice President and Associate General Counsel |
David L. DiLorenzo (k)
(age 50) | | President | | July 2005 | | 135 | | Massachusetts Financial Services Company, Senior Vice President |
44
Trustees and Officers – continued
| | | | | | | | |
Name, Age | | Position(s) Held with Fund | | Trustee/Officer
Since (h) | | Number of MFS Funds for which the Person is an Officer | | Principal
Occupations During the Past Five Years |
Heidi W. Hardin (k)
(age 51) | | Secretary and Clerk | | April 2017 | | 135 | | Massachusetts Financial Services Company, Executive Vice President and General Counsel (since March 2017); Harris Associates (investment management), General Counsel (from September 2015 to January 2017); Janus Capital Management LLC (investment management), Senior Vice President and General Counsel (until September 2015) |
Brian E. Langenfeld (k)
(age 45) | | Assistant Secretary and Assistant Clerk | | June 2006 | | 135 | | Massachusetts Financial Services Company, Vice President and Senior Counsel |
Amanda S. Mooradian (k)
(age 39) | | Assistant Secretary and Assistant Clerk | | September 2018 | | 135 | | Massachusetts Financial Services Company, Assistant Vice President and Counsel |
Susan A. Pereira (k)
(age 47) | | Assistant Secretary and Assistant Clerk | | July 2005 | | 135 | | Massachusetts Financial Services Company, Vice President and Senior Counsel |
Kasey L. Phillips (k)
(age 47) | | Assistant Treasurer | | September 2012 | | 135 | | Massachusetts Financial Services Company, Vice President |
Matthew A. Stowe (k)
(age 43) | | Assistant Secretary and Assistant Clerk | | October 2014 | | 135 | | Massachusetts Financial Services Company, Vice President and Assistant General Counsel |
45
Trustees and Officers – continued
| | | | | | | | |
Name, Age | | Position(s) Held with Fund | | Trustee/Officer
Since (h) | | Number of MFS Funds for which the Person is an Officer | | Principal
Occupations During the Past Five Years |
Frank L. Tarantino
(age 74) | | Independent
Senior Officer | | June 2004 | | 135 | | Tarantino LLC (provider of compliance services), Principal |
Richard S. Weitzel (k)
(age 48) | | Assistant Secretary and Assistant Clerk | | October 2007 | | 135 | | Massachusetts Financial Services Company, Senior Vice President and Associate General Counsel |
Martin J. Wolin (k)
(age 51) | | Chief Compliance Officer | | July 2015 | | 135 | | Massachusetts Financial Services Company, Senior Vice President and Chief Compliance Officer (since July 2015); Mercer (financial service provider), Chief Risk and Compliance Officer, North America and Latin America (until June 2015) |
James O. Yost (k)
(age 58) | | Treasurer | | September 1990 | | 135 | | Massachusetts Financial Services Company, Senior Vice President |
| (h) | Date first appointed to serve as Trustee/officer of an MFS Fund. Each Trustee has served continuously since appointment unless indicated otherwise. For the period from December 15, 2004 until February 22, 2005, Mr. Manning served as Advisory Trustee. From January 2012 through December 2016, Messrs. DiLorenzo and Yost served as Treasurer and Deputy Treasurer of the Funds, respectively. |
| (j) | Directorships or trusteeships of companies required to report to the Securities and Exchange Commission (i.e., “public companies”). |
| (k) | “Interested person” of the Trust within the meaning of the Investment Company Act of 1940 (referred to as the 1940 Act), which is the principal federal law governing investment companies like the fund, as a result of a position with MFS. The address of MFS is 111 Huntington Avenue, Boston, Massachusetts 02199-7618. |
Each Trustee has been elected by shareholders and each Trustee and officer holds office until his or her successor is chosen and qualified or until his or her earlier death, resignation, retirement or removal. The Trust does not hold annual meetings for the purpose of electing Trustees, and Trustees are not elected for fixed terms. Under the terms of the Board’s retirement policy, an Independent Trustee shall retire at the end of
46
Trustees and Officers – continued
the calendar year in which he or she reaches the earlier of 75 years of age or 15 years of service on the Board (or, in the case of any Independent Trustee who joined the Board prior to 2015, 20 years of service on the Board).
Messrs. Buller and Otis and Ms. Roepke are members of the Trust’s Audit Committee.
Each of the Interested Trustees and certain Officers hold comparable officer positions with certain affiliates of MFS.
The Statement of Additional Information for a Fund includes further information about the Trustees and is available without charge upon request by calling 1-800-225-2606.
| | |
| Investment Adviser | | Custodian |
Massachusetts Financial Services Company
111 Huntington Avenue Boston, MA 02199-7618 | | JPMorgan Chase Bank, NA
4 Metrotech Center
New York, NY 11245 |
| Distributor | | Independent Registered Public Accounting Firm |
MFS Fund Distributors, Inc.
111 Huntington Avenue Boston, MA 02199-7618 | | Deloitte & Touche LLP 200 Berkeley Street Boston, MA 02116 |
| Portfolio Manager(s) | | |
| Eric Fischman | | |
| Paul Gordon | | |
| Matthew Sabel | | |
47
BOARD REVIEW OF INVESTMENT ADVISORY AGREEMENT
The Investment Company Act of 1940 requires that both the full Board of Trustees and a majority of the non-interested (“independent”) Trustees, voting separately, annually approve the continuation of the Fund’s investment advisory agreement with MFS. The Trustees consider matters bearing on the Fund and its advisory arrangements at their meetings throughout the year, including a review of performance data at each regular meeting. In addition, the independent Trustees met several times over the course of three months beginning in May and ending in July, 2018 (“contract review meetings”) for the specific purpose of considering whether to approve the continuation of the investment advisory agreement for the Fund and the other investment companies that the Board oversees (the “MFS Funds”). The independent Trustees were assisted in their evaluation of the Fund’s investment advisory agreement by independent legal counsel, from whom they received separate legal advice and with whom they met separately from MFS during various contract review meetings. The independent Trustees were also assisted in this process by the MFS Funds’ Independent Senior Officer, a senior officer appointed by and reporting to the independent Trustees.
In connection with their deliberations regarding the continuation of the investment advisory agreement, the Trustees, including the independent Trustees, considered such information and factors as they believed, in light of the legal advice furnished to them and their own business judgment, to be relevant. The investment advisory agreement for the Fund was considered separately, although the Trustees also took into account the common interests of all MFS Funds in their review. As described below, the Trustees considered the nature, quality, and extent of the various investment advisory, administrative, and shareholder services performed by MFS under the existing investment advisory agreement and other arrangements with the Fund.
In connection with their contract review meetings, the Trustees received and relied upon materials that included, among other items: (i) information provided by Broadridge Financial Solutions, Inc. (“Broadridge”), an independent third party, on the investment performance of the Fund for various time periods ended December 31, 2017 and the investment performance of a group of funds with substantially similar investment classifications/objectives (the “Broadridge performance universe”), (ii) information provided by Broadridge on the Fund’s advisory fees and other expenses and the advisory fees and other expenses of comparable funds identified by Broadridge (the “Broadridge expense group”), (iii) information provided by MFS on the advisory fees of portfolios of other clients of MFS, including institutional separate accounts and other clients, (iv) information as to whether and to what extent applicable expense waivers, reimbursements or fee “breakpoints” are observed for the Fund, (v) information regarding MFS’ financial results and financial condition, including MFS’ and certain of its affiliates’ estimated profitability from services performed for the Fund and the MFS Funds as a whole, and compared to MFS’ institutional business, (vi) MFS’ views regarding the outlook for the mutual fund industry and the strategic business plans of MFS, (vii) descriptions of various functions performed by MFS for the Funds, such as compliance monitoring and portfolio trading practices, and (viii) information regarding the overall organization of MFS, including information about MFS’ senior management and other personnel providing investment advisory,
48
Board Review of Investment Advisory Agreement – continued
administrative and other services to the Fund and the other MFS Funds. The comparative performance, fee and expense information prepared and provided by Broadridge was not independently verified and the independent Trustees did not independently verify any information provided to them by MFS.
The Trustees’ conclusion as to the continuation of the investment advisory agreement was based on a comprehensive consideration of all information provided to the Trustees and not the result of any single factor. Some of the factors that figured particularly in the Trustees’ deliberations are described below, although individual Trustees may have evaluated the information presented differently from one another, giving different weights to various factors. It is also important to recognize that the fee arrangements for the Fund and other MFS Funds are the result of years of review and discussion between the independent Trustees and MFS, that certain aspects of such arrangements may receive greater scrutiny in some years than in others, and that the Trustees’ conclusions may be based, in part, on their consideration of these same arrangements during the course of the year and in prior years.
Based on information provided by Broadridge and MFS, the Trustees reviewed the Fund’s total return investment performance as well as the Broadridge performance universe over various time periods. The Trustees placed particular emphasis on the total return performance of the Fund’s Class A shares in comparison to the performance of funds in its Broadridge performance universe over the three-year period ended December 31, 2017, which the Trustees believed was a long enough period to reflect differing market conditions. The total return performance of the Fund’s Class A shares was in the 2nd quintile relative to the other funds in the universe for this three-year period (the 1st quintile being the best performers and the 5th quintile being the worst performers). The total return performance of the Fund’s Class A shares was in the 2nd quintile for each of the one- and five-year periods ended December 31, 2017 relative to the Broadridge performance universe. Because of the passage of time, these performance results may differ from the performance results for more recent periods, including those shown elsewhere in this report.
In the course of their deliberations, the Trustees took into account information provided by MFS in connection with the contract review meetings, as well as during investment review meetings conducted with portfolio management personnel during the course of the year regarding the Fund’s performance. After reviewing these and related factors, the Trustees concluded, within the context of their overall conclusions regarding the investment advisory agreement, that they were satisfied with MFS’ responses and efforts relating to investment performance.
In assessing the reasonableness of the Fund’s advisory fee, the Trustees considered, among other information, the Fund’s advisory fee and the total expense ratio of the Fund’s Class A shares as a percentage of average daily net assets and the advisory fee and total expense ratios of peer groups of funds based on information provided by Broadridge. The Trustees considered that MFS currently observes an expense limitation for the Fund, which may not be changed without the Trustees’ approval. The Trustees also considered that, according to the data provided by Broadridge (which takes into account any fee reductions or expense limitations that were in effect during the Fund’s last fiscal year), the Fund’s effective advisory fee rate and total expense ratio were each approximately at the Broadridge expense group median.
49
Board Review of Investment Advisory Agreement – continued
The Trustees also considered the advisory fees charged by MFS to any institutional separate accounts advised by MFS (“separate accounts”) and unaffiliated investment companies for which MFS serves as subadviser (“subadvised funds”) that have comparable investment strategies to the Fund, if any. In comparing these fees, the Trustees considered information provided by MFS as to the generally broader scope of services provided by MFS to the Fund, as well as the more extensive regulatory burdens imposed on MFS in managing the Fund, in comparison to separate accounts and subadvised funds. The Trustees also considered the higher demands placed on MFS’ investment personnel and trading infrastructure as a result of the daily cash in-flows and out-flows of the Fund in comparison to separate accounts.
The Trustees also considered whether the Fund may benefit from any economies of scale in the management of the Fund in the event of growth in assets of the Fund and/or growth in assets of the MFS Funds as a whole. They noted that the Fund’s advisory fee rate schedule is subject to contractual breakpoints that reduce the Fund’s advisory fee rate on average daily net assets over $1 billion and $2.5 billion. The Trustees also noted that MFS has agreed in writing to waive a portion of the management fees of certain MFS Funds, including the Fund, if the total combined assets of certain funds within the MFS Funds’ complex increase above agreed upon thresholds (the “group fee waiver”), enabling the Fund’s shareholders to share in the benefits from any economies of scale at the complex level. The group fee waiver is reviewed and renewed annually between the Board and MFS. The Trustees concluded that the breakpoints and the group fee waiver were sufficient to allow the Fund to benefit from economies of scale as its assets and overall complex assets grow.
The Trustees also considered information prepared by MFS relating to MFS’ costs and profits with respect to the Fund, the MFS Funds considered as a group, and other investment companies and accounts advised by MFS, as well as MFS’ methodologies used to determine and allocate its costs to the MFS Funds, the Fund and other accounts and products for purposes of estimating profitability.
After reviewing these and other factors described herein, the Trustees concluded, within the context of their overall conclusions regarding the investment advisory agreement, that the advisory fees charged to the Fund represent reasonable compensation in light of the services being provided by MFS to the Fund.
In addition, the Trustees considered MFS’ resources and related efforts to continue to retain, attract and motivate capable personnel to serve the Fund. The Trustees also considered current and developing conditions in the financial services industry, including the presence of large and well-capitalized companies which are spending, and appear to be prepared to continue to spend, substantial sums to engage personnel and to provide services to competing investment companies. In this regard, the Trustees also considered the financial resources of MFS and its ultimate parent, Sun Life Financial Inc. The Trustees also considered the advantages and possible disadvantages to the Fund of having an adviser that also serves other investment companies as well as other accounts.
The Trustees also considered the nature, quality, cost, and extent of administrative, transfer agency, and distribution services provided to the Fund by MFS and its affiliates under agreements and plans other than the investment advisory agreement, including
50
Board Review of Investment Advisory Agreement – continued
any 12b-1 fees the Fund pays to MFS Fund Distributors, Inc., an affiliate of MFS. The Trustees also considered the nature, extent and quality of certain other services MFS performs or arranges for on the Fund’s behalf, which may include securities lending programs, directed expense payment programs, class action recovery programs, and MFS’ interaction with third-party service providers, principally custodians and sub-custodians. The Trustees concluded that the various non-advisory services provided by MFS and its affiliates on behalf of the Fund were satisfactory.
The Trustees considered so-called “fall-out benefits” to MFS such as reputational value derived from serving as investment manager to the MFS Funds. The Trustees also considered that, effective January 3, 2018, MFS had discontinued its historic practice of obtaining investment research from portfolio brokerage commissions paid by certain MFS Funds and would thereafter voluntarily reimburse a Fund, if applicable, for the costs of external research acquired through the use of the Fund’s portfolio brokerage commissions.
Based on their evaluation of factors that they deemed to be material, including those factors described above, the Board of Trustees, including the independent Trustees, concluded that the Fund’s investment advisory agreement with MFS should be continued for an additional one-year period, commencing August 1, 2018.
51
PROXY VOTING POLICIES AND INFORMATION
MFS votes proxies on behalf of the fund pursuant to proxy voting policies and procedures that are available without charge, upon request, by calling 1-800-225-2606, by visiting mfs.com/proxyvoting, or by visiting the SEC’s Web site at http://www.sec.gov.
Information regarding how the fund voted proxies relating to portfolio securities during the most recent twelve-month period ended June 30 is available by August 31 of each year without charge by visiting mfs.com/proxyvoting, or by visiting the SEC’s Web site at http://www.sec.gov.
QUARTERLY PORTFOLIO DISCLOSURE
The fund files a complete schedule of portfolio holdings with the Securities and Exchange Commission (the Commission) for the first and third quarters of each fiscal year on Form N-Q. A shareholder can obtain the quarterly portfolio holdings report at mfs.com. The fund’s Form N-Q is also available on the EDGAR database on the Commission’s Internet Web site at http://www.sec.gov, and may be reviewed and copied at the:
Public Reference Room
Securities and Exchange Commission
100 F Street, NE, Room 1580
Washington, D.C. 20549
Information on the operation of the Public Reference Room may be obtained by calling the Commission at 1-800-SEC-0330. Copies of the fund’s Form N-Q also may be obtained, upon payment of a duplicating fee, by electronic request at the following e-mail address: publicinfo@sec.gov or by writing the Public Reference Section at the above address.
FURTHER INFORMATION
From time to time, MFS may post important information about the fund or the MFS funds on the MFS web site (mfs.com). This information is available at https://www.mfs.com/en-us/what-we-do/announcements.html or at mfs.com/openendfunds by choosing the fund’s name.
52
INFORMATION ABOUT FUND CONTRACTS AND LEGAL CLAIMS
The fund has entered into contractual arrangements with an investment adviser, administrator, distributor, shareholder servicing agent, 529 program manager (if applicable), and custodian who each provide services to the fund. Unless expressly stated otherwise, shareholders are not parties to, or intended beneficiaries of these contractual arrangements, and these contractual arrangements are not intended to create any shareholder right to enforce them against the service providers or to seek any remedy under them against the service providers, either directly or on behalf of the fund.
Under the Trust’s By-Laws and Declaration of Trust, any claims asserted against or on behalf of the MFS Funds, including claims against Trustees and Officers, must be brought in state and federal courts located within the Commonwealth of Massachusetts.
FEDERAL TAX INFORMATION (unaudited)
The fund will notify shareholders of amounts for use in preparing 2018 income tax forms in January 2019. The following information is provided pursuant to provisions of the Internal Revenue Code.
The fund designates the maximum amount allowable as qualified dividend income eligible to be taxed at the same rate as long-term capital gain.
The fund designates $224,360,000 as capital gain dividends paid during the fiscal year.
53
rev. 3/16
| | | | |
| | | |
FACTS | | WHAT DOES MFS DO WITH YOUR PERSONAL INFORMATION? | |  |
| | |
| Why? | | Financial companies choose how they share your personal information. Federal law gives consumers the right to limit some but not all sharing. Federal law also requires us to tell you how we collect, share, and protect your personal information. Please read this notice carefully to understand what we do. |
| | |
| What? | | The types of personal information we collect and share depend on the product or service you have with us. This information can include: • Social Security number and account balances • Account transactions and transaction history • Checking account information and wire transfer instructions When you are no longer our customer, we continue to share your information as described in this notice. |
| | |
| How? | | All financial companies need to share customers’ personal information to run their everyday business. In the section below, we list the reasons financial companies can share their customers’ personal information; the reasons MFS chooses to share; and whether you can limit this sharing. |
| | | | |
Reasons we can share your
personal information | | Does MFS
share? | | Can you limit
this sharing? |
For our everyday business purposes – such as to process your transactions, maintain your account(s), respond to court orders and legal investigations, or report to credit bureaus | | Yes | | No |
For our marketing purposes – to offer our products and services to you | | No | | We don’t share |
For joint marketing with other financial companies | | No | | We don’t share |
For our affiliates’ everyday business purposes – information about your transactions and experiences | | No | | We don’t share |
For our affiliates’ everyday business purposes – information about your creditworthiness | | No | | We don’t share |
| For nonaffiliates to market to you | | No | | We don’t share |
| | |
| Questions? | | Call 800-225-2606 or go to mfs.com. |
54
| | |
| Who we are |
| Who is providing this notice? | | MFS Funds, MFS Investment Management, MFS Institutional Advisors, Inc., and MFS Heritage Trust Company. |
| | |
| What we do |
| How does MFS protect my personal information? | | To protect your personal information from unauthorized access and use, we use security measures that comply with federal law. These measures include procedural, electronic, and physical safeguards for the protection of the personal information we collect about you. |
| How does MFS collect my personal information? | | We collect your personal information, for example, when you • open an account or provide account information • direct us to buy securities or direct us to sell your securities • make a wire transfer We also collect your personal information from others, such as credit bureaus, affiliates, or other companies. |
| Why can’t I limit all sharing? | | Federal law gives you the right to limit only • sharing for affiliates’ everyday business purposes – information about your creditworthiness • affiliates from using your information to market to you • sharing for nonaffiliates to market to you State laws and individual companies may give you additional rights to limit sharing. |
| | |
| Definitions |
| Affiliates | | Companies related by common ownership or control. They can be financial and nonfinancial companies. • MFS does not share personal information with affiliates, except for everyday business purposes as described on page one of this notice. |
| Nonaffiliates | | Companies not related by common ownership or control. They can be financial and nonfinancial companies. • MFS does not share with nonaffiliates so they can market to you. |
| Joint marketing | | A formal agreement between nonaffiliated financial companies that together market financial products or services to you. • MFS doesn’t jointly market. |
| | |
| Other important information |
| If you own an MFS product or receive an MFS service in the name of a third party such as a bank or broker-dealer, their privacy policy may apply to you instead of ours. |
55
Save paper with eDelivery.

| MFS® will send you prospectuses, |
reports, and proxies directly via e-mail so you will get information faster with less mailbox clutter.
To sign up:
1. Go to mfs.com.
2. Log in via MFS® Access.
3. Select eDelivery.
If you own your MFS fund shares through a financial institution or a retirement plan, MFS® TALK, MFS® Access, or eDelivery may not be available to you.
CONTACT
WEB SITE
mfs.com
MFS TALK
1-800-637-8255
24 hours a day
ACCOUNT SERVICE AND LITERATURE
Shareholders
1-800-225-2606
Financial advisors
1-800-343-2829
Retirement plan services
1-800-637-1255
MAILING ADDRESS
MFS Service Center, Inc.
P.O. Box 55824
Boston, MA 02205-5824
OVERNIGHT MAIL
MFS Service Center, Inc.
c/o DST Asset Manager Solutions, Inc.
30 Dan Road
Canton, MA 02021-2809
Annual Report
August 31, 2018

MFS® U.S. Government Money Market Fund

MCM-ANN
MFS® U.S. Government Money Market Fund
CONTENTS
The report is prepared for the general information of shareholders.
It is authorized for distribution to prospective investors only when preceded or accompanied by a current prospectus.
NOT FDIC INSURED • MAY LOSE VALUE • NO BANK GUARANTEE

LETTER FROM THE EXECUTIVE CHAIRMAN
Dear Shareholders:
The strengthening U.S. dollar, international trade friction and geopolitical uncertainty have contributed to a measurable uptick in market volatility in recent quarters — a
departure from the low-volatility environment that prevailed for much of 2017. Against this more challenging backdrop, global markets have become less synchronized, with equity markets in the United States outperforming most international markets. Global economic growth remains healthy, notwithstanding signs of a modest slowdown over the past few months, particularly in Europe, China and some emerging markets.
Although the U.S. Federal Reserve continues to gradually raise interest rates and shrink its balance sheet, monetary policy remains accommodative around the world, with many central
banks taking only tentative steps toward tighter policies. Newly enacted U.S. tax reforms have been welcomed by equity markets while emerging market economies have recently had to contend with tighter financial conditions as a result of firmer U.S. Treasury yields and a stronger dollar. Around the world, inflation remains largely subdued, but tight labor markets and solid global demand have investors on the lookout for its potential reappearance. Increased U.S. protectionism is also a growing concern, as investors fear that trade disputes could dampen business sentiment, leading to slower global growth.
As a global investment manager with nearly a century of expertise, MFS® firmly believes that active risk management offers downside mitigation and may help improve investment outcomes, and we built our active investment platform with that in mind. Our long-term perspective influences nearly every aspect of our business, but most importantly, it aligns our investment decisions with clients’ investing time horizons.
Respectfully,

Robert J. Manning
Executive Chairman
MFS Investment Management
October 16, 2018
The opinions expressed in this letter are subject to change and may not be relied upon for investment advice. No forecasts can be guaranteed.
1
PORTFOLIO COMPOSITION
Portfolio structure (u)
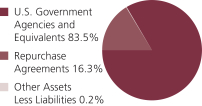
| | | | |
| Composition including fixed income credit quality (a)(u) | |
| A-1+ | | | 10.0% | |
| A-1 | | | 89.8% | |
| Other Assets Less Liabilities | | | 0.2% | |
| | | | |
| Maturity breakdown (u) | |
| 0 - 7 days | | | 29.9% | |
| 8 - 29 days | | | 47.3% | |
| 30 - 59 days | | | 19.2% | |
| 60 - 89 days | | | 1.1% | |
| 90 - 365 days | | | 2.3% | |
| Other Assets Less Liabilities | | | 0.2% | |
| (a) | Ratings are assigned to portfolio securities utilizing ratings from Moody’s, Fitch, and Standard & Poor’s rating agencies and applying the following hierarchy: If all three agencies provide a rating, the middle rating (after dropping the highest and lowest ratings) is assigned; if two of the three agencies rate a security, the lower of the two is assigned. Ratings are shown in the S&P scale. All ratings are subject to change. The fund did not hold unrated securities. The fund is not rated by these agencies. |
| (u) | For purposes of this presentation, accrued interest, where applicable, is included. |
Percentages are based on net assets as of August 31, 2018.
The portfolio is actively managed and current holdings may be different.
2
PERFORMANCE SUMMARY THROUGH 8/31/18
Total returns as well as the current 7-day yield have been provided for the applicable time periods. Performance results reflect the percentage change in net asset value, including the reinvestment of any dividends and capital gains distributions. (See Notes to Performance Summary.)
Performance data shown represents past performance and is no guarantee of future results. You could lose money by investing in the fund. Although the fund seeks to preserve the value of your investment at $1.00 per share, it cannot guarantee it will do so. An investment in the fund is not insured or guaranteed by the Federal Deposit Insurance Corporation or any other governmental agency. The fund’s sponsor has no legal obligation to provide financial support to the fund, and you should not expect the sponsor will provide financial support to the fund at any time. The performance shown does not reflect the deduction of taxes, if any, that a shareholder would pay on fund distributions or the redemption of fund shares.
| | | | | | | | |
| | | Inception | | 1-Year Total
Return (without
sales charge) | | Current
7-day yield | | |
| | | 12/19/75 | | 0.83% | | 1.31% | | |
Yields quoted are based on the latest seven days ended as of August 31, 2018, with dividends annualized. The yield quotations more closely reflect the current earnings of the fund than the total return quotations. Shares of the fund can be purchased at net asset value without a sales charge.
Certain shares of the fund acquired through an exchange may be subject to a contingent deferred sales charge upon redemption depending on when the shares exchanged were originally purchased. See the notes to financial statements for more details.
Notes to Performance Summary
Performance results reflect any applicable expense subsidies, waivers and adjustments in effect during the periods shown. Performance results reflect a capital contribution of $582,494 made on July 2, 2018 by MFS to the fund to offset historical realized capital losses incurred by the fund prior to January 1, 2010. Without such subsidies, waivers and capital contribution the fund’s performance results would be less favorable. Please see the prospectus and financial statements for complete details. All results are historical and assume the reinvestment of any dividends and capital gain distributions.
3
EXPENSE TABLE
Fund expenses borne by the shareholders during the period, March 1, 2018 through August 31, 2018
As a shareholder of the fund, you incur two types of costs: (1) transaction costs, including sales charges (loads) on certain purchase or redemption payments, and (2) ongoing costs, including management fees; and other fund expenses. This example is intended to help you understand your ongoing costs (in dollars) of investing in the fund and to compare these costs with the ongoing costs of investing in other mutual funds.
The example is based on an investment of $1,000 invested at the beginning of the period and held for the entire period March 1, 2018 through August 31, 2018.
Actual Expenses
The first line in the following table provides information about actual account values and actual expenses. You may use the information in this line, together with the amount you invested, to estimate the expenses that you paid over the period. Simply divide your account value by $1,000 (for example, an $8,600 account value divided by $1,000 = 8.6), then multiply the result by the number in the first line under the heading entitled “Expenses Paid During Period” to estimate the expenses you paid on your account during this period.
Hypothetical Example for Comparison Purposes
The second line in the following table provides information about hypothetical account values and hypothetical expenses based on the fund’s actual expense ratio and an assumed rate of return of 5% per year before expenses, which is not the fund’s actual return. The hypothetical account values and expenses may not be used to estimate the actual ending account balance or expenses you paid for the period. You may use this information to compare the ongoing costs of investing in the fund and other funds. To do so, compare this 5% hypothetical example with the 5% hypothetical examples that appear in the shareholder reports of the other funds.
Please note that the expenses shown in the table are meant to highlight your ongoing costs only and do not reflect any transactional costs, such as sales charges (loads). Therefore, the second line in the following table is useful in comparing ongoing costs only, and will not help you determine the relative total costs of owning different funds. In addition, if these transactional costs were included, your costs would have been higher.
4
Expense Table – continued
| | | | | | | | | | | | | | | | |
| | | Annualized Expense
Ratio | | | Beginning
Account Value
3/01/18 | | | Ending Account Value
8/31/18 | | | Expenses Paid During
Period (p) 3/01/18-8/31/18 | |
| Actual | | | 0.61% | | | | $1,000.00 | | | | $1,005.64 | | | | $3.08 | |
| Hypothetical (h) | | | 0.61% | | | | $1,000.00 | | | | $1,022.13 | | | | $3.11 | |
| (h) | 5% fund return per year before expenses. |
| (p) | “Expenses Paid During Period” are equal to the fund’s annualized expense ratio, as shown above, multiplied by the average account value over the period, multiplied by 184/365 (to reflect the one-half year period). Expenses paid do not include any applicable sales charges (loads). If these transaction costs had been included, your costs would have been higher. |
5
PORTFOLIO OF INVESTMENTS
8/31/18
The Portfolio of Investments is a complete list of all securities owned by your fund. It is categorized by broad-based asset classes.
| | | | | | | | |
| U.S. Government Agencies and Equivalents (y) - 83.5% | |
| Issuer | | Shares/Par | | | Value ($) | |
| Fannie Mae, 1.892%, due 9/10/2018 | | $ | 10,700,000 | | | $ | 10,695,024 | |
| Fannie Mae, 1.892%, due 9/11/2018 | | | 10,700,000 | | | | 10,694,472 | |
| Fannie Mae, 1.895%, due 9/17/2018 | | | 19,700,000 | | | | 19,683,671 | |
| Fannie Mae, 2.002%, due 10/09/2018 | | | 11,435,000 | | | | 11,411,222 | |
| Federal Farm Credit Bank, 1.91%, due 9/07/2018 | | | 13,500,000 | | | | 13,495,770 | |
| Federal Farm Credit Bank, 1.92%, due 9/12/2018 | | | 6,600,000 | | | | 6,596,188 | |
| Federal Farm Credit Bank, 2.036%, due 10/24/2018 | | | 16,800,000 | | | | 16,750,533 | |
| Federal Home Loan Bank, 1.923%, due 9/04/2018 | | | 9,998,000 | | | | 9,996,421 | |
| Federal Home Loan Bank, 1.938%, due 9/14/2018 | | | 11,280,000 | | | | 11,272,220 | |
| Federal Home Loan Bank, 1.952%, due 9/18/2018 | | | 1,000,000 | | | | 999,093 | |
| Federal Home Loan Bank, 1.9%, due 9/20/2018 | | | 8,058,000 | | | | 8,050,047 | |
| Federal Home Loan Bank, 1.879%, due 9/21/2018 | | | 6,774,000 | | | | 6,767,038 | |
| Federal Home Loan Bank, 2.009%, due 10/10/2018 | | | 1,629,000 | | | | 1,625,515 | |
| Federal Home Loan Bank, 4.016%, due 10/10/18 | | | 13,778,000 | | | | 13,748,521 | |
| Freddie Mac, 1.933%, due 9/05/2018 | | | 10,600,000 | | | | 10,597,762 | |
| Freddie Mac, 1.949%, due 9/19/2018 | | | 10,500,000 | | | | 10,489,946 | |
| Freddie Mac, 1.919%, due 9/21/2018 | | | 10,700,000 | | | | 10,688,795 | |
| Freddie Mac, 1.924%, due 9/26/2018 | | | 10,700,000 | | | | 10,685,956 | |
| Freddie Mac, 1.949%, due 10/03/2018 | | | 7,226,000 | | | | 7,213,700 | |
| Freddie Mac, 2.066%, due 11/08/2018 | | | 2,795,000 | | | | 2,784,283 | |
| U.S. Treasury Bill, 1.909%, due 9/06/2018 | | | 2,000,000 | | | | 1,999,479 | |
| U.S. Treasury Bill, 1.918%, due 9/20/2018 | | | 2,000,000 | | | | 1,998,013 | |
| U.S. Treasury Bill, 1.928%, due 9/20/2018 | | | 16,500,000 | | | | 16,483,498 | |
| U.S. Treasury Bill, 1.785%, due 1/03/2019 | | | 6,000,000 | | | | 5,964,247 | |
| Total U.S. Government Agencies and Equivalents, at Amortized Cost and Value | | | | | | $ | 220,691,414 | |
| | |
| Repurchase Agreements - 16.3% | | | | | | | | |
| Goldman Sachs Repurchase Agreement, 1.96%, dated 8/31/2018, due 9/04/2018, total to be received $7,016,528 (secured by U.S. Treasury and Federal Agency obligations valued at $7,155,300 in a jointly traded account) | | $ | 7,015,000 | | | $ | 7,015,000 | |
| JPMorgan Chase & Co. Repurchase Agreement, 1.92%, dated 8/31/2018, due 9/04/2018, total to be received $36,007,680 (secured by U.S. Treasury and Federal Agency obligations valued at $36,727,904 in a jointly traded account) | | | 36,000,000 | | | | 36,000,000 | |
| Total Repurchase Agreements, at Cost and Value | | | | | | $ | 43,015,000 | |
| | |
| Other Assets, Less Liabilities - 0.2% | | | | | | | 663,729 | |
| Net Assets - 100.0% | | | | | | $ | 264,370,143 | |
| (y) | The rate shown represents an annualized yield at time of purchase. |
See Notes to Financial Statements
6
Financial Statements
STATEMENT OF ASSETS AND LIABILITIES
At 8/31/18
This statement represents your fund’s balance sheet, which details the assets and liabilities comprising the total value of the fund.
| | | | |
| Assets | | | | |
Investments in unaffiliated issuers, at cost and value | | | $220,691,414 | |
Repurchase agreements, at cost and value | | | 43,015,000 | |
Cash | | | 836 | |
Receivables for | | | | |
Fund shares sold | | | 1,099,686 | |
Interest | | | 2,302 | |
Other assets | | | 361 | |
Total assets | | | $264,809,599 | |
| Liabilities | | | | |
Payables for | | | | |
Distributions | | | $44,358 | |
Fund shares reacquired | | | 245,947 | |
Payable to affiliates | | | | |
Investment adviser | | | 5,895 | |
Shareholder servicing costs | | | 83,623 | |
Payable for independent Trustees’ compensation | | | 5,012 | |
Accrued expenses and other liabilities | | | 54,621 | |
Total liabilities | | | $439,456 | |
Net assets | | | $264,370,143 | |
| Net assets consist of | | | | |
Paid-in capital | | | $264,091,166 | |
Accumulated net realized gain (loss) | | | (586 | ) |
Undistributed net investment income | | | 279,563 | |
Net assets | | | $264,370,143 | |
Shares of beneficial interest outstanding | | | 264,370,142 | |
Net asset value per share (net assets of $264,370,143 / 264,370,142 shares of beneficial interest outstanding) | | | $1.00 | |
A contingent deferred sales charge may be imposed on redemptions.
See Notes to Financial Statements
7
Financial Statements
STATEMENT OF OPERATIONS
Year ended 8/31/18
This statement describes how much your fund earned in investment income and accrued in expenses. It also describes any gains and/or losses generated by fund operations.
| | | | |
| Net investment income (loss) | | | | |
Income | | | | |
Interest | | | $4,039,999 | |
Other | | | 61 | |
Total investment income | | | $4,040,060 | |
Expenses | | | | |
Management fee | | | $1,134,722 | |
Shareholder servicing costs | | | 425,278 | |
Administrative services fee | | | 52,526 | |
Independent Trustees’ compensation | | | 11,905 | |
Custodian fee | | | 14,953 | |
Shareholder communications | | | 14,557 | |
Audit and tax fees | | | 37,444 | |
Legal fees | | | 3,351 | |
Miscellaneous | | | 79,516 | |
Total expenses | | | $1,774,252 | |
Fees paid indirectly | | | (13,139 | ) |
Reduction of expenses by investment adviser | | | (25,682 | ) |
Net expenses | | | $1,735,431 | |
Net investment income (loss) | | | $2,304,629 | |
Change in net assets from operations | | | $2,304,629 | |
See Notes to Financial Statements
8
Financial Statements
STATEMENTS OF CHANGES IN NET ASSETS
These statements describe the increases and/or decreases in net assets resulting from operations, any distributions, and any shareholder transactions.
| | | | | | | | |
| | | Year ended | |
| | | 8/31/18 | | | 8/31/17 | |
| Change in net assets | | | | | | |
| From operations | | | | | | | | |
Net investment income (loss) | | | $2,304,629 | | | | $562,278 | |
Net realized gain (loss) | | | — | | | | (2 | ) |
Change in net assets from operations | | | $2,304,629 | | | | $562,276 | |
| Distributions declared to shareholders | | | | | | | | |
From net investment income | | | $(2,304,629 | ) | | | $(562,278 | ) |
Change in net assets from fund share transactions | | | $(43,803,377 | ) | | | $(13,255,644 | ) |
Contribution from adviser | | | $582,494 | | | | $— | |
Total change in net assets | | | $(43,220,883 | ) | | | $(13,255,646 | ) |
| Net assets | | | | | | | | |
At beginning of period | | | 307,591,026 | | | | 320,846,672 | |
At end of period (including undistributed net investment income of $279,563 and accumulated distributions in excess of net investment income of $8,468, respectively) | | | $264,370,143 | | | | $307,591,026 | |
See Notes to Financial Statements
9
Financial Statements
FINANCIAL HIGHLIGHTS
The financial highlights table is intended to help you understand the fund’s financial performance for the past 5 years. Certain information reflects financial results for a single fund share. The total returns in the table represent the rate that an investor would have earned (or lost) on an investment in the fund share class (assuming reinvestment of all distributions) held for the entire period.
| | | | | | | | | | | | | | | | | | | | |
| | | Year ended | |
| | | 8/31/18 | | | 8/31/17 | | | 8/31/16 | | | 8/31/15 | | | 8/31/14 | |
Net asset value, beginning of period | | | $1.00 | | | | $1.00 | | | | $1.00 | | | | $1.00 | | | | $1.00 | |
| Income (loss) from investment operations | | | | | | | | | | | | | | | | | |
Net investment income (loss) (d) | | | $0.01 | | | | $0.00 | (c)(w) | | | $0.00 | | | | $0.00 | | | | $0.00 | |
Net realized and unrealized gain (loss) | | | — | | | | (0.00 | )(w) | | | (0.00 | )(w) | | | (0.00 | )(w) | | | 0.00 | (w) |
Total from investment operations | | | $0.01 | | | | $0.00 | (w) | | | $(0.00 | )(w) | | | $(0.00 | )(w) | | | $0.00 | (w) |
| Less distributions declared to shareholders | | | | | | | | | | | | | | | | | |
From net investment income | | | $(0.01 | ) | | | $(0.00 | )(w) | | | $— | | | | $— | | | | $— | |
Contribution from adviser | | | $(0.00 | )(w) | | | $— | | | | $— | | | | $— | | | | $— | |
Net asset value, end of period | | | $1.00 | | | | $1.00 | | | | $1.00 | | | | $1.00 | | | | $1.00 | |
Total return (%) (r)(t) | | | 0.83 | | | | 0.17 | (c) | | | 0.00 | (w) | | | 0.00 | (w) | | | 0.00 | (w) |
Ratios (%) (to average net assets) and Supplemental data: | | | | | | | | | | | | | | | | | | | | |
Expenses before expense reductions (f) | | | 0.63 | | | | 0.56 | (c) | | | 0.61 | | | | 0.62 | | | | 0.62 | |
Expenses after expense reductions (f) | | | 0.62 | | | | 0.43 | (c) | | | 0.23 | | | | 0.07 | | | | 0.10 | |
Net investment income (loss) | | | 0.81 | | | | 0.17 | (c) | | | 0.00 | | | | 0.00 | | | | 0.00 | |
Net assets at end of period (000 omitted) | | | $264,370 | | | | $307,591 | | | | $320,847 | | | | $371,489 | | | | $378,245 | |
| (c) | Amount reflects a one-time reimbursement of expenses by the custodian (or former custodian) without which net investment income and performance would be lower and expenses would be higher. |
| (d) | Per share data is based on average shares outstanding. |
| (f) | Ratios do not reflect reductions from fees paid indirectly, if applicable. |
| (r) | Certain expenses have been reduced without which performance would have been lower. |
| (t) | Total returns do not include any applicable sales charges. |
| (w) | Per share amount was less than $0.01 and total return or ratio was less than 0.01%, as applicable. |
See Notes to Financial Statements
10
NOTES TO FINANCIAL STATEMENTS
(1) Business and Organization
MFS U.S. Government Money Market Fund (the fund) is a diversified series of MFS Series Trust IV (the trust). The trust is organized as a Massachusetts business trust and is registered under the Investment Company Act of 1940, as amended, as an open-end management investment company.
The fund is an investment company and accordingly follows the investment company accounting and reporting guidance of the Financial Accounting Standards Board (FASB) Accounting Standards Codification Topic 946 Financial Services – Investment Companies.
(2) Significant Accounting Policies
General – The preparation of financial statements in conformity with U.S. generally accepted accounting principles requires management to make estimates and assumptions that affect the reported amounts of assets and liabilities, and disclosure of contingent assets and liabilities at the date of the financial statements and the reported amounts of increases and decreases in net assets from operations during the reporting period. Actual results could differ from those estimates. In the preparation of these financial statements, management has evaluated subsequent events occurring after the date of the fund’s Statement of Assets and Liabilities through the date that the financial statements were issued.
In August 2018, the FASB issued Accounting Standards Update 2018-13, Fair Value Measurement (Topic 820) – Disclosure Framework – Changes to the Disclosure Requirements for Fair Value Measurement (“ASU 2018-13”) which introduces new fair value disclosure requirements as well as eliminates and modifies certain existing fair value disclosure requirements. ASU 2018-13 would be effective for fiscal years beginning after December 15, 2019, and interim periods within those fiscal years; however, management has elected to early adopt ASU 2018-13 effective with the current reporting period. The impact of the fund’s adoption was limited to changes in the fund’s financial statement disclosures regarding fair value, primarily those disclosures related to transfers between levels of the fair value hierarchy.
Balance Sheet Offsetting – The fund’s accounting policy with respect to balance sheet offsetting is that, absent an event of default by the counterparty or a termination of the agreement, the International Swaps and Derivatives Association (ISDA) Master Agreement, or similar agreement, does not result in an offset of reported amounts of financial assets and financial liabilities in the Statement of Assets and Liabilities across transactions between the fund and the applicable counterparty. The fund’s right to setoff may be restricted or prohibited by the bankruptcy or insolvency laws of the particular jurisdiction to which a specific master netting agreement counterparty is subject. Balance sheet offsetting disclosures, to the extent applicable to the fund, have been included in the fund’s Significant Accounting Policies note under the captions for each of the fund’s in-scope financial instruments and transactions.
Investment Valuations – Pursuant to procedures approved by the Board of Trustees, investments held by the fund are generally valued at amortized cost, which approximates market value. Amortized cost involves valuing an instrument at its cost as
11
Notes to Financial Statements – continued
adjusted for amortization of premium or accretion of discount rather than its current market value. The amortized cost value of an instrument can be different from the market value of an instrument.
Various inputs are used in determining the value of the fund’s assets or liabilities. These inputs are categorized into three broad levels. In certain cases, the inputs used to measure fair value may fall into different levels of the fair value hierarchy. In such cases, an investment’s level within the fair value hierarchy is based on the lowest level of input that is significant to the fair value measurement. The fund’s assessment of the significance of a particular input to the fair value measurement in its entirety requires judgment, and considers factors specific to the investment. Level 1 includes unadjusted quoted prices in active markets for identical assets or liabilities. Level 2 includes other significant observable market-based inputs (including quoted prices for similar securities, interest rates, prepayment speed, and credit risk). Level 3 includes unobservable inputs, which may include the adviser’s own assumptions in determining the fair value of investments. The following is a summary of the levels used as of August 31, 2018 in valuing the fund’s assets or liabilities:
| | | | | | | | | | | | | | | | |
| Financial Instruments | | Level 1 | | | Level 2 | | | Level 3 | | | Total | |
| Short-Term Securities | | | $— | | | | $263,706,414 | | | | $— | | | | $263,706,414 | |
For further information regarding security characteristics, see the Portfolio of Investments.
Repurchase Agreements – The fund enters into repurchase agreements under the terms of Master Repurchase Agreements with approved counterparties. Each repurchase agreement is recorded at cost. The fund requires that the securities collateral in a repurchase transaction be transferred to a custodian. The fund monitors, on a daily basis, the value of the collateral to ensure that its value, including accrued interest, is greater than amounts owed to the fund under each such repurchase agreement. Upon an event of default under a Master Repurchase Agreement, the non-defaulting party may close out all transactions traded under such agreement and net amounts owed under each transaction to one net amount payable by one party to the other. Absent an event of default, the Master Repurchase Agreement does not result in an offset of reported amounts of assets and liabilities in the Statement of Assets and Liabilities across transactions between the fund and the applicable counterparty. The fund and other funds managed by MFS may utilize a joint trading account for the purpose of entering into one or more repurchase agreements. At August 31, 2018, the fund had investments in repurchase agreements with a gross value of $43,015,000. The value of the related collateral exceeded the value of the repurchase agreements at period end.
Indemnifications – Under the fund’s organizational documents, its officers and Trustees may be indemnified against certain liabilities and expenses arising out of the performance of their duties to the fund. Additionally, in the normal course of business, the fund enters into agreements with service providers that may contain indemnification clauses. The fund’s maximum exposure under these agreements is unknown as this would involve future claims that may be made against the fund that have not yet occurred.
12
Notes to Financial Statements – continued
Investment Transactions and Income – Investment transactions are recorded on the trade date. Interest income is recorded on the accrual basis. All premium and discount is amortized or accreted for financial statement purposes in accordance with U.S. generally accepted accounting principles.
Fees Paid Indirectly – The fund’s custody fee may be reduced by credits earned under a previous arrangement that measured the value of U.S. dollars deposited with the custodian by the fund. The amount of the credits that were used to reduce the fund’s custody fee for the year ended August 31, 2018, is shown as a reduction of total expenses in the Statement of Operations.
Tax Matters and Distributions – The fund intends to qualify as a regulated investment company, as defined under Subchapter M of the Internal Revenue Code, and to distribute all of its taxable income, including realized capital gains. As a result, no provision for federal income tax is required. The fund’s federal tax returns, when filed, will remain subject to examination by the Internal Revenue Service for a three year period. Management has analyzed the fund’s tax positions taken on federal and state tax returns for all open tax years and does not believe that there are any uncertain tax positions that require recognition of a tax liability.
Distributions to shareholders are recorded on the ex-dividend date. Income and capital gain distributions are determined in accordance with income tax regulations, which may differ from U.S. generally accepted accounting principles. Certain capital accounts in the financial statements are periodically adjusted for permanent differences in order to reflect their tax character. These adjustments have no impact on net assets or net asset value per share. Temporary differences which arise from recognizing certain items of income, expense, gain or loss in different periods for financial statement and tax purposes will reverse at some time in the future. Distributions in excess of net investment income or net realized gains are temporary overdistributions for financial statement purposes resulting from differences in the recognition or classification of income or distributions for financial statement and tax purposes.
Book/tax differences primarily relate to treating a portion of the proceeds from redemptions as a distribution for tax purposes.
The tax character of distributions declared to shareholders for the last two fiscal years is as follows:
| | | | | | | | |
| | | Year ended
8/31/18 | | | Year ended
8/31/17 | |
| Ordinary income (including any short-term capital gains) | | | $2,304,629 | | | | $562,278 | |
The federal tax cost and the tax basis components of distributable earnings were as follows:
| | | | |
| As of 8/31/18 | | | |
| Cost of investments | | | $263,706,414 | |
| Undistributed ordinary income | | | 328,878 | |
| Capital loss carryforwards | | | (586 | ) |
| Other temporary differences | | | (49,315 | ) |
13
Notes to Financial Statements – continued
As of August 31, 2018, the fund had capital loss carryforwards available to offset future realized gains. These net capital losses may be carried forward indefinitely and their character is retained as short-term and/or long-term losses. Such losses are characterized as follows:
(3) Transactions with Affiliates
Investment Adviser – The fund has an investment advisory agreement with MFS to provide overall investment management and related administrative services and facilities to the fund. The management fee is computed daily and paid monthly at the following annual rates based on the fund’s average daily net assets:
| | | | |
| Up to $1 billion | | | 0.40 | % |
| In excess of $1 billion | | | 0.35 | % |
MFS has agreed in writing to reduce its management fee by a specified amount if certain MFS mutual fund assets exceed thresholds agreed to by MFS and the fund’s Board of Trustees. For the year ended August 31, 2018, this management fee reduction amounted to $25,682, which is included in the reduction of total expenses in the Statement of Operations. The management fee incurred for the year ended August 31, 2018 was equivalent to an annual effective rate of 0.39% of the fund’s average daily net assets.
Distributor – Certain shares acquired through an exchange may be subject to a contingent deferred sales charge upon redemption depending on when the shares exchanged were originally purchased. Contingent deferred sales charges paid to MFS Distributors, Inc. (MFD) during the year ended August 31, 2018 were $4,822.
Shareholder Servicing Agent – MFS Service Center, Inc. (MFSC), a wholly-owned subsidiary of MFS, receives a fee from the fund for its services as shareholder servicing agent calculated as a percentage of the average daily net assets of the fund as determined periodically under the supervision of the fund’s Board of Trustees. For the year ended August 31, 2018, the fee was $196,842, which equated to 0.0694% annually of the fund’s average daily net assets. MFSC also receives payment from the fund for out-of-pocket expenses, sub-accounting and other shareholder servicing costs which may be paid to affiliated and unaffiliated service providers. For the year ended August 31, 2018, these out-of-pocket expenses, sub-accounting and other shareholder servicing costs amounted to $228,436.
Administrator – MFS provides certain financial, legal, shareholder communications, compliance, and other administrative services to the fund. Under an administrative services agreement, the fund reimburses MFS the costs incurred to provide these services. The fund is charged an annual fixed amount of $17,500 plus a fee based on average daily net assets. The administrative services fee incurred for the year ended August 31, 2018 was equivalent to an annual effective rate of 0.0185% of the fund’s average daily net assets.
Trustees’ and Officers’ Compensation – The fund pays compensation to independent Trustees in the form of a retainer, attendance fees, and additional compensation to Board and Committee chairpersons. The fund does not pay compensation directly to Trustees or officers of the fund who are also officers of the
14
Notes to Financial Statements – continued
investment adviser, all of whom receive remuneration for their services to the fund from MFS. Certain officers and Trustees of the fund are officers or directors of MFS, MFD, and MFSC.
Prior to December 31, 2001, the fund had an unfunded defined benefit plan (“DB plan”) for independent Trustees. As of December 31, 2001, the Board took action to terminate the DB plan with respect to then-current and any future independent Trustees, such that the DB plan covers only certain of those former independent Trustees who retired on or before December 31, 2001. The DB plan resulted in a pension expense of $3,290 and is included in “Independent Trustees’ compensation” in the Statement of Operations for the year ended August 31, 2018. The liability for deferred retirement benefits payable to those former independent Trustees under the DB plan amounted to $4,957 at August 31, 2018, and is included in “Payable for independent Trustees’ compensation” in the Statement of Assets and Liabilities.
Other – This fund and certain other funds managed by MFS (the funds) have entered into a service agreement (the ISO Agreement) which provides for payment of fees solely by the funds to Tarantino LLC in return for the provision of services of an Independent Senior Officer (ISO) for the funds. Frank L. Tarantino serves as the ISO and is an officer of the funds and the sole member of Tarantino LLC. The funds can terminate the ISO Agreement with Tarantino LLC at any time under the terms of the ISO Agreement. For the year ended August 31, 2018, the fee paid by the fund under this agreement was $469 and is included in “Miscellaneous” expense in the Statement of Operations. MFS has agreed to bear all expenses associated with office space, other administrative support, and supplies provided to the ISO.
On July 2, 2018, a capital contribution of $582,494 was made by MFS to offset historical realized capital losses incurred by the fund prior to January 1, 2010. MFS did not receive any fund shares in exchange for the contribution, and has no claim on the fund’s assets with respect to the contribution.
(4) Shares of Beneficial Interest
The fund’s Declaration of Trust permits the Trustees to issue an unlimited number of full and fractional shares of beneficial interest. The number of shares sold, reinvested and reacquired corresponds to the net proceeds from the sale of shares, reinvestment of distributions and cost of shares reacquired, respectively, since shares are sold and reacquired at $1.00 per share. Transactions in fund shares were as follows:
| | | | | | | | |
| | | Year ended
8/31/18 | | | Year ended
8/31/17 | |
| Shares sold | | | 114,453,856 | | | | 182,766,605 | |
| Shares issued to shareholders in reinvestment of distributions | | | 1,956,156 | | | | 486,863 | |
| Shares reacquired | | | (160,213,389 | ) | | | (196,509,112 | ) |
| Net change | | | (43,803,377 | ) | | | (13,255,644 | ) |
(5) Line of Credit
The fund and certain other funds managed by MFS participate in a $1.25 billion unsecured committed line of credit, subject to a $1 billion sublimit, provided by a syndication of banks under a credit agreement. Borrowings may be made for temporary financing needs. Interest is charged to each fund, based on its borrowings,
15
Notes to Financial Statements – continued
generally at a rate equal to the higher of the Overnight Bank Funding rate or daily one month LIBOR plus an agreed upon spread. A commitment fee, based on the average daily, unused portion of the committed line of credit, is allocated among the participating funds. In addition, the fund and other funds managed by MFS have established unsecured uncommitted borrowing arrangements with certain banks for temporary financing needs. Interest is charged to each fund, based on its borrowings, at a rate equal to the Overnight Bank Funding rate plus an agreed upon spread. For the year ended August 31, 2018, the fund’s commitment fee and interest expense were $1,720 and $0, respectively, and are included in “Miscellaneous” expense in the Statement of Operations.
16
REPORT OF INDEPENDENT REGISTERED PUBLIC ACCOUNTING FIRM
To the Board of Trustees of MFS Series Trust IV and the Shareholders of MFS U.S. Government Money Market Fund:
Opinion on the Financial Statements and Financial Highlights
We have audited the accompanying statement of assets and liabilities of MFS U.S. Government Money Market Fund (the “Fund”), including the portfolio of investments, as of August 31, 2018, the related statement of operations for the year then ended, the statements of changes in net assets for each of the two years in the period then ended, the financial highlights for each of the five years in the period then ended, and the related notes. In our opinion, the financial statements and financial highlights present fairly, in all material respects, the financial position of the Fund as of August 31, 2018, and the results of its operations for the year then ended, the changes in its net assets for each of the two years in the period then ended, and the financial highlights for each of the five years in the period then ended, in conformity with accounting principles generally accepted in the United States of America.
Basis for Opinion
These financial statements and financial highlights are the responsibility of the Fund’s management. Our responsibility is to express an opinion on the Fund’s financial statements and financial highlights based on our audits. We are a public accounting firm registered with the Public Company Accounting Oversight Board (United States) (PCAOB) and are required to be independent with respect to the Fund in accordance with the U.S. federal securities laws and the applicable rules and regulations of the Securities and Exchange Commission and the PCAOB.
We conducted our audits in accordance with the standards of the PCAOB. Those standards require that we plan and perform the audit to obtain reasonable assurance about whether the financial statements and financial highlights are free of material misstatement, whether due to error or fraud. The Fund is not required to have, nor were we engaged to perform, an audit of its internal control over financial reporting. As part of our audits we are required to obtain an understanding of internal control over financial reporting but not for the purpose of expressing an opinion on the effectiveness of the Fund’s internal control over financial reporting. Accordingly, we express no such opinion.
Our audits included performing procedures to assess the risks of material misstatement of the financial statements and financial highlights, whether due to error or fraud, and performing procedures that respond to those risks. Such procedures included examining, on a test basis, evidence regarding the amounts and disclosures in the financial statements and financial highlights. Our audits also included evaluating the accounting principles used and significant estimates made by management, as well as evaluating the overall presentation of the financial statements and financial highlights. Our procedures included confirmation of securities owned as of August 31, 2018, by
17
Report of Independent Registered Public Accounting Firm – continued
correspondence with the custodian and brokers. We believe that our audits provide a reasonable basis for our opinion.
DELOITTE & TOUCHE LLP
Boston, Massachusetts
October 16, 2018
We have served as the auditor of one or more of the MFS investment companies since 1924.
18
TRUSTEES AND OFFICERS —
IDENTIFICATION AND BACKGROUND
The Trustees and Officers of the Trust, as of October 1, 2018, are listed below, together with their principal occupations during the past five years. (Their titles may have varied during that period.) The address of each Trustee and Officer is 111 Huntington Avenue, Boston, Massachusetts 02199-7618.
| | | | | | | | | | |
Name, Age | | Position(s)
Held with Fund | | Trustee/Officer Since (h) | | Number of
MFS Funds
overseen by the Trustee | | Principal
Occupations During the Past Five Years | | Other Directorships During the Past Five Years (j) |
| INTERESTED TRUSTEES |
Robert J. Manning (k)
(age 54) | | Trustee | | February 2004 | | 135 | | Massachusetts Financial Services Company, Executive Chairman (since January 2017); Director; Chairman of the Board; Chief Executive Officer (until 2015); Co-Chief Executive Officer (2015-2016) | | N/A |
Robin A. Stelmach (k)
(age 57) | | Trustee | | January 2014 | | 135 | | Massachusetts Financial Services Company, Vice Chair (since January 2017); Chief Operating Officer and Executive Vice President (until January 2017) | | N/A |
| INDEPENDENT TRUSTEES |
John P. Kavanaugh
(age 63) | | Trustee and Chair of Trustees | | January 2009 | | 135 | | Private investor | | N/A |
Steven E. Buller
(age 67) | | Trustee | | February 2014 | | 135 | | Financial Accounting Standards Advisory Council, Chairman (2014-2015); Public Company Accounting Oversight Board, Standing Advisory Group, Member (until 2014); BlackRock, Inc. (investment management), Managing Director (until 2014), BlackRock Finco UK (investment management), Director (until 2014) | | N/A |
19
Trustees and Officers – continued
| | | | | | | | | | |
Name, Age | | Position(s)
Held with Fund | | Trustee/Officer Since (h) | | Number of
MFS Funds
overseen by the Trustee | | Principal
Occupations During the Past Five Years | | Other Directorships During the Past Five Years (j) |
John A. Caroselli
(age 64) | | Trustee | | March 2017 | | 135 | | JC Global Advisors, LLC (management consulting), President (since 2015); First Capital Corporation (commercial finance), Executive Vice President (until 2015) | | N/A |
Maureen R. Goldfarb
(age 63) | | Trustee | | January 2009 | | 135 | | Private investor | | N/A |
Michael Hegarty
(age 73) | | Trustee | | December 2004 | | 135 | | Private investor | | Rouse Properties Inc., Director (until 2016); Capmark Financial Group Inc., Director (until 2015) |
Clarence Otis, Jr.
(age 62) | | Trustee | | March 2017 | | 135 | | Darden Restaurants, Inc., Chief Executive Officer (until 2014) | | VF Corporation, Director; Verizon Communications, Inc., Director; The Travelers Companies, Director; Federal Reserve Bank of Atlanta, Director (until 2015) |
Maryanne L. Roepke
(age 62) | | Trustee | | May 2014 | | 135 | | American Century Investments (investment management), Senior Vice President and Chief Compliance Officer (until 2014) | | N/A |
Laurie J. Thomsen
(age 61) | | Trustee | | March 2005 | | 135 | | Private investor | | The Travelers Companies, Director; Dycom Industries, Inc., Director (since 2015) |
20
Trustees and Officers – continued
| | | | | | | | |
Name, Age | | Position(s) Held with Fund | | Trustee/Officer
Since (h) | | Number of MFS Funds for which the Person is an Officer | | Principal
Occupations During the Past Five Years |
| OFFICERS | | | | | | | | |
Christopher R. Bohane (k)
(age 44) | | Assistant Secretary and Assistant Clerk | | July 2005 | | 135 | | Massachusetts Financial Services Company, Vice President and Assistant General Counsel |
Kino Clark (k)
(age 50) | | Assistant Treasurer | | January 2012 | | 135 | | Massachusetts Financial Services Company, Vice President |
John W. Clark, Jr. (k)
(age 51) | | Assistant Treasurer | | April 2017 | | 135 | | Massachusetts Financial Services Company, Vice President (since March 2017); Deutsche Bank (financial services), Department Head – Treasurer’s Office (until February 2017) |
Thomas H. Connors (k)
(age 59) | | Assistant Secretary and Assistant Clerk | | September 2012 | | 135 | | Massachusetts Financial Services Company, Vice President and Senior Counsel |
Ethan D. Corey (k)
(age 54) | | Assistant Secretary and Assistant Clerk | | July 2005 | | 135 | | Massachusetts Financial Services Company, Senior Vice President and Associate General Counsel |
David L. DiLorenzo (k)
(age 50) | | President | | July 2005 | | 135 | | Massachusetts Financial Services Company, Senior Vice President |
21
Trustees and Officers – continued
| | | | | | | | |
Name, Age | | Position(s) Held with Fund | | Trustee/Officer
Since (h) | | Number of MFS Funds for which the Person is an Officer | | Principal
Occupations During the Past Five Years |
Heidi W. Hardin (k)
(age 51) | | Secretary and Clerk | | April 2017 | | 135 | | Massachusetts Financial Services Company, Executive Vice President and General Counsel (since March 2017); Harris Associates (investment management), General Counsel (from September 2015 to January 2017); Janus Capital Management LLC (investment management), Senior Vice President and General Counsel (until September 2015) |
Brian E. Langenfeld (k)
(age 45) | | Assistant Secretary and Assistant Clerk | | June 2006 | | 135 | | Massachusetts Financial Services Company, Vice President and Senior Counsel |
Amanda S. Mooradian (k)
(age 39) | | Assistant Secretary and Assistant Clerk | | September 2018 | | 135 | | Massachusetts Financial Services Company, Assistant Vice President and Counsel |
Susan A. Pereira (k)
(age 47) | | Assistant Secretary and Assistant Clerk | | July 2005 | | 135 | | Massachusetts Financial Services Company, Vice President and Senior Counsel |
Kasey L. Phillips (k)
(age 47) | | Assistant Treasurer | | September 2012 | | 135 | | Massachusetts Financial Services Company, Vice President |
Matthew A. Stowe (k)
(age 43) | | Assistant Secretary and Assistant Clerk | | October 2014 | | 135 | | Massachusetts Financial Services Company, Vice President and Assistant General Counsel |
22
Trustees and Officers – continued
| | | | | | | | |
Name, Age | | Position(s) Held with Fund | | Trustee/Officer
Since (h) | | Number of MFS Funds for which the Person is an Officer | | Principal
Occupations During the Past Five Years |
Frank L. Tarantino
(age 74) | | Independent
Senior Officer | | June 2004 | | 135 | | Tarantino LLC (provider of compliance services), Principal |
Richard S. Weitzel (k)
(age 48) | | Assistant Secretary and Assistant Clerk | | October 2007 | | 135 | | Massachusetts Financial Services Company, Senior Vice President and Associate General Counsel |
Martin J. Wolin (k)
(age 51) | | Chief Compliance Officer | | July 2015 | | 135 | | Massachusetts Financial Services Company, Senior Vice President and Chief Compliance Officer (since July 2015); Mercer (financial service provider), Chief Risk and Compliance Officer, North America and Latin America (until June 2015) |
James O. Yost (k)
(age 58) | | Treasurer | | September 1990 | | 135 | | Massachusetts Financial Services Company, Senior Vice President |
| (h) | Date first appointed to serve as Trustee/officer of an MFS Fund. Each Trustee has served continuously since appointment unless indicated otherwise. For the period from December 15, 2004 until February 22, 2005, Mr. Manning served as Advisory Trustee. From January 2012 through December 2016, Messrs. DiLorenzo and Yost served as Treasurer and Deputy Treasurer of the Funds, respectively. |
| (j) | Directorships or trusteeships of companies required to report to the Securities and Exchange Commission (i.e., “public companies”). |
| (k) | “Interested person” of the Trust within the meaning of the Investment Company Act of 1940 (referred to as the 1940 Act), which is the principal federal law governing investment companies like the fund, as a result of a position with MFS. The address of MFS is 111 Huntington Avenue, Boston, Massachusetts 02199-7618. |
Each Trustee has been elected by shareholders and each Trustee and officer holds office until his or her successor is chosen and qualified or until his or her earlier death, resignation, retirement or removal. The Trust does not hold annual meetings for the purpose of electing Trustees, and Trustees are not elected for fixed terms. Under the terms of the Board’s retirement policy, an Independent Trustee shall retire at the end of
23
Trustees and Officers – continued
the calendar year in which he or she reaches the earlier of 75 years of age or 15 years of service on the Board (or, in the case of any Independent Trustee who joined the Board prior to 2015, 20 years of service on the Board).
Messrs. Buller and Otis and Ms. Roepke are members of the Trust’s Audit Committee.
Each of the Interested Trustees and certain Officers hold comparable officer positions with certain affiliates of MFS.
The Statement of Additional Information for a Fund includes further information about the Trustees and is available without charge upon request by calling 1-800-225-2606.
| | |
| Investment Adviser | | Custodian |
Massachusetts Financial Services Company
111 Huntington Avenue
Boston, MA 02199-7618 | | State Street Bank and Trust Company 1 Lincoln Street Boston, MA 02111-2900 |
| Distributor | | Independent Registered Public Accounting Firm |
MFS Fund Distributors, Inc.
111 Huntington Avenue
Boston, MA 02199-7618 | | Deloitte & Touche LLP 200 Berkeley Street Boston, MA 02116 |
| Portfolio Manager(s) | | |
| Edward O’Dette | | |
24
BOARD REVIEW OF INVESTMENT ADVISORY AGREEMENT
The Investment Company Act of 1940 requires that both the full Board of Trustees and a majority of the non-interested (“independent”) Trustees, voting separately, annually approve the continuation of the Fund’s investment advisory agreement with MFS. The Trustees consider matters bearing on the Fund and its advisory arrangements at their meetings throughout the year, including a review of performance data at each regular meeting. In addition, the independent Trustees met several times over the course of three months beginning in May and ending in July, 2018 (“contract review meetings”) for the specific purpose of considering whether to approve the continuation of the investment advisory agreement for the Fund and the other investment companies that the Board oversees (the “MFS Funds”). The independent Trustees were assisted in their evaluation of the Fund’s investment advisory agreement by independent legal counsel, from whom they received separate legal advice and with whom they met separately from MFS during various contract review meetings. The independent Trustees were also assisted in this process by the MFS Funds’ Independent Senior Officer, a senior officer appointed by and reporting to the independent Trustees.
In connection with their deliberations regarding the continuation of the investment advisory agreement, the Trustees, including the independent Trustees, considered such information and factors as they believed, in light of the legal advice furnished to them and their own business judgment, to be relevant. The investment advisory agreement for the Fund was considered separately, although the Trustees also took into account the common interests of all MFS Funds in their review. As described below, the Trustees considered the nature, quality, and extent of the various investment advisory, administrative, and shareholder services performed by MFS under the existing investment advisory agreement and other arrangements with the Fund.
In connection with their contract review meetings, the Trustees received and relied upon materials that included, among other items: (i) information provided by Broadridge Financial Solutions, Inc. (“Broadridge”), an independent third party, on the investment performance of the Fund for various time periods ended December 31, 2017 and the investment performance of a group of funds with substantially similar investment classifications/objectives (the “Broadridge performance universe”), (ii) information provided by Broadridge on the Fund’s advisory fees and other expenses and the advisory fees and other expenses of comparable funds identified by Broadridge (the “Broadridge expense group”), (iii) information provided by MFS on the advisory fees of portfolios of other clients of MFS, including institutional separate accounts and other clients, (iv) information as to whether and to what extent applicable expense waivers, reimbursements or fee “breakpoints” are observed for the Fund, (v) information regarding MFS’ financial results and financial condition, including MFS’ and certain of its affiliates’ estimated profitability from services performed for the Fund and the MFS Funds as a whole, and compared to MFS’ institutional business, (vi) MFS’ views regarding the outlook for the mutual fund industry and the strategic business plans of MFS, (vii) descriptions of various functions performed by MFS for the Funds, such as compliance monitoring and portfolio trading practices, and (viii) information regarding the overall organization of MFS, including information about MFS’ senior management and other personnel providing investment advisory, administrative and other services to
25
Board Review of Investment Advisory Agreement – continued
the Fund and the other MFS Funds. The comparative performance, fee and expense information prepared and provided by Broadridge was not independently verified and the independent Trustees did not independently verify any information provided to them by MFS.
The Trustees’ conclusion as to the continuation of the investment advisory agreement was based on a comprehensive consideration of all information provided to the Trustees and not the result of any single factor. Some of the factors that figured particularly in the Trustees’ deliberations are described below, although individual Trustees may have evaluated the information presented differently from one another, giving different weights to various factors. It is also important to recognize that the fee arrangements for the Fund and other MFS Funds are the result of years of review and discussion between the independent Trustees and MFS, that certain aspects of such arrangements may receive greater scrutiny in some years than in others, and that the Trustees’ conclusions may be based, in part, on their consideration of these same arrangements during the course of the year and in prior years.
Based on information provided by Broadridge and MFS, the Trustees reviewed the Fund’s total return investment performance as well as the Broadridge performance universe over various time periods. The Trustees placed particular emphasis on the total return performance of the Fund’s shares in comparison to the performance of funds in its Broadridge performance universe over the three-year period ended December 31, 2017, which the Trustees believed was a long enough period to reflect differing market conditions. The total return performance of the Fund’s shares was in the 3rd quintile relative to the other funds in the universe for this three-year period (the 1st quintile being the best performers and the 5th quintile being the worst performers). The total return performance of the Fund’s shares was in the 3rd quintile for each of the one- and five-year periods ended December 31, 2017 relative to the Broadridge performance universe. Because of the passage of time, these performance results may differ from the performance results for more recent periods, including those shown elsewhere in this report.
In the course of their deliberations, the Trustees took into account information provided by MFS in connection with the contract review meetings, as well as during investment review meetings conducted with portfolio management personnel during the course of the year regarding the Fund’s performance. In addition, the Trustees noted the market conditions affecting all money market funds, in particular the low interest rate environment during portions of the one-, three- and five-year periods, and MFS’ voluntary waiver of all or a portion of its fees to ensure that the Fund avoided a negative yield during those periods. After reviewing these and related factors, the Trustees concluded, within the context of their overall conclusions regarding the investment advisory agreement, that they were satisfied with MFS’ responses and efforts relating to investment performance.
In assessing the reasonableness of the Fund’s advisory fee, the Trustees considered, among other information, the Fund’s advisory fee and the total expense ratio of the Fund’s shares as a percentage of average daily net assets and the advisory fee and total expense ratios of peer groups of funds based on information provided by Broadridge. The Trustees considered that, according to the data provided by Broadridge (which takes into account any fee reductions or expense limitations that were in effect during
26
Board Review of Investment Advisory Agreement – continued
the Fund’s last fiscal year), the Fund’s effective advisory fee rate was higher than the Broadridge expense group median and the Fund’s total expense ratio was approximately at the Broadridge expense group median.
The Trustees also considered the advisory fees charged by MFS to any institutional separate accounts advised by MFS (“separate accounts”) and unaffiliated investment companies for which MFS serves as subadviser (“subadvised funds”) that have comparable investment strategies to the Fund, if any. In comparing these fees, the Trustees considered information provided by MFS as to the generally broader scope of services provided by MFS to the Fund, as well as the more extensive regulatory burdens imposed on MFS in managing the Fund, in comparison to separate accounts and subadvised funds. The Trustees also considered the higher demands placed on MFS’ investment personnel and trading infrastructure as a result of the daily cash in-flows and out-flows of the Fund in comparison to separate accounts.
The Trustees also considered whether the Fund may benefit from any economies of scale in the management of the Fund in the event of growth in assets of the Fund and/or growth in assets of the MFS Funds as a whole. They noted that the Fund’s advisory fee rate schedule is subject to a contractual breakpoint that reduces the Fund’s advisory fee rate on average daily net assets over $1 billion. The Trustees also noted that MFS has agreed in writing to waive a portion of the management fees of certain MFS Funds, including the Fund, if the total combined assets of certain funds within the MFS Funds’ complex increase above agreed upon thresholds (the “group fee waiver”), enabling the Fund’s shareholders to share in the benefits from any economies of scale at the complex level. The group fee waiver is reviewed and renewed annually between the Board and MFS. The Trustees concluded that the breakpoint and the group fee waiver were sufficient to allow the Fund to benefit from economies of scale as its assets and overall complex assets grow.
The Trustees also considered information prepared by MFS relating to MFS’ costs and profits with respect to the Fund, the MFS Funds considered as a group, and other investment companies and accounts advised by MFS, as well as MFS’ methodologies used to determine and allocate its costs to the MFS Funds, the Fund and other accounts and products for purposes of estimating profitability.
After reviewing these and other factors described herein, the Trustees concluded, within the context of their overall conclusions regarding the investment advisory agreement, that the advisory fees charged to the Fund represent reasonable compensation in light of the services being provided by MFS to the Fund.
In addition, the Trustees considered MFS’ resources and related efforts to continue to retain, attract and motivate capable personnel to serve the Fund. The Trustees also considered current and developing conditions in the financial services industry, including the presence of large and well-capitalized companies which are spending, and appear to be prepared to continue to spend, substantial sums to engage personnel and to provide services to competing investment companies. In this regard, the Trustees also considered the financial resources of MFS and its ultimate parent, Sun Life Financial Inc. The Trustees also considered the advantages and possible disadvantages to the Fund of having an adviser that also serves other investment companies as well as other accounts.
27
Board Review of Investment Advisory Agreement – continued
The Trustees also considered the nature, quality, cost, and extent of administrative, transfer agency, and distribution services provided to the Fund by MFS and its affiliates under agreements and plans other than the investment advisory agreement. The Trustees also considered the nature, extent and quality of certain other services MFS performs or arranges for on the Fund’s behalf, which may include securities lending programs, directed expense payment programs, class action recovery programs, and MFS’ interaction with third-party service providers, principally custodians and sub-custodians. The Trustees concluded that the various non-advisory services provided by MFS and its affiliates on behalf of the Fund were satisfactory.
The Trustees considered so-called “fall-out benefits” to MFS such as reputational value derived from serving as investment manager to the MFS Funds. The Trustees also considered that, effective January 3, 2018, MFS had discontinued its historic practice of obtaining investment research from portfolio brokerage commissions paid by certain MFS Funds and would thereafter voluntarily reimburse a Fund, if applicable, for the costs of external research acquired through the use of the Fund’s portfolio brokerage commissions.
Based on their evaluation of factors that they deemed to be material, including those factors described above, the Board of Trustees, including the independent Trustees, concluded that the Fund’s investment advisory agreement with MFS should be continued for an additional one-year period, commencing August 1, 2018.
28
PROXY VOTING POLICIES AND INFORMATION
MFS votes proxies on behalf of the fund pursuant to proxy voting policies and procedures that are available without charge, upon request, by calling 1-800-225-2606, by visiting mfs.com/proxyvoting, or by visiting the SEC’s Web site at http://www.sec.gov.
Information regarding how the fund voted proxies relating to portfolio securities during the most recent twelve-month period ended June 30 is available by August 31 of each year without charge by visiting mfs.com/proxyvoting, or by visiting the SEC’s Web site at http://www.sec.gov.
QUARTERLY PORTFOLIO DISCLOSURE
The fund files a complete schedule of portfolio holdings with the Securities and Exchange Commission (the Commission) for the first and third quarters of each fiscal year on Form N-Q. A shareholder can obtain the quarterly portfolio holdings report at mfs.com. The fund’s Form N-Q is also available on the EDGAR database on the Commission’s Internet Web site at http://www.sec.gov, and may be reviewed and copied at the:
Public Reference Room
Securities and Exchange Commission
100 F Street, NE, Room 1580
Washington, D.C. 20549
Information on the operation of the Public Reference Room may be obtained by calling the Commission at 1-800-SEC-0330. Copies of the fund’s Form N-Q also may be obtained, upon payment of a duplicating fee, by electronic request at the following e-mail address: publicinfo@sec.gov or by writing the Public Reference Section at the above address.
FURTHER INFORMATION
From time to time, MFS may post important information about the fund or the MFS funds on the MFS web site (mfs.com). This information is available at https://www.mfs.com/en-us/what-we-do/announcements.html or at mfs.com/openendfunds by choosing the fund’s name.
29
INFORMATION ABOUT FUND CONTRACTS AND LEGAL CLAIMS
The fund has entered into contractual arrangements with an investment adviser, administrator, distributor, shareholder servicing agent, 529 program manager (if applicable), and custodian who each provide services to the fund. Unless expressly stated otherwise, shareholders are not parties to, or intended beneficiaries of these contractual arrangements, and these contractual arrangements are not intended to create any shareholder right to enforce them against the service providers or to seek any remedy under them against the service providers, either directly or on behalf of the fund.
Under the Trust’s By-Laws and Declaration of Trust, any claims asserted against or on behalf of the MFS Funds, including claims against Trustees and Officers, must be brought in state and federal courts located within the Commonwealth of Massachusetts.
FEDERAL TAX INFORMATION (unaudited)
The fund will notify shareholders of amounts for use in preparing 2018 income tax forms in January 2019.
30
rev. 3/16
| | | | |
| | | |
FACTS | | WHAT DOES MFS DO WITH YOUR PERSONAL INFORMATION? | |  |
| | |
| Why? | | Financial companies choose how they share your personal information. Federal law gives consumers the right to limit some but not all sharing. Federal law also requires us to tell you how we collect, share, and protect your personal information. Please read this notice carefully to understand what we do. |
| | |
| What? | | The types of personal information we collect and share depend on the product or service you have with us. This information can include: • Social Security number and account balances • Account transactions and transaction history • Checking account information and wire transfer instructions When you are no longer our customer, we continue to share your information as described in this notice. |
| | |
| How? | | All financial companies need to share customers’ personal information to run their everyday business. In the section below, we list the reasons financial companies can share their customers’ personal information; the reasons MFS chooses to share; and whether you can limit this sharing. |
| | | | |
Reasons we can share your
personal information | | Does MFS
share? | | Can you limit
this sharing? |
For our everyday business purposes – such as to process your transactions, maintain your account(s), respond to court orders and legal investigations, or report to credit bureaus | | Yes | | No |
For our marketing purposes – to offer our products and services to you | | No | | We don’t share |
For joint marketing with other financial companies | | No | | We don’t share |
For our affiliates’ everyday business purposes – information about your transactions and experiences | | No | | We don’t share |
For our affiliates’ everyday business purposes – information about your creditworthiness | | No | | We don’t share |
| For nonaffiliates to market to you | | No | | We don’t share |
| | |
| Questions? | | Call 800-225-2606 or go to mfs.com. |
31
| | |
| Who we are |
| Who is providing this notice? | | MFS Funds, MFS Investment Management, MFS Institutional Advisors, Inc., and MFS Heritage Trust Company. |
| | |
| What we do |
| How does MFS protect my personal information? | | To protect your personal information from unauthorized access and use, we use security measures that comply with federal law. These measures include procedural, electronic, and physical safeguards for the protection of the personal information we collect about you. |
| How does MFS collect my personal information? | | We collect your personal information, for example, when you • open an account or provide account information • direct us to buy securities or direct us to sell your securities • make a wire transfer We also collect your personal information from others, such as credit bureaus, affiliates, or other companies. |
| Why can’t I limit all sharing? | | Federal law gives you the right to limit only • sharing for affiliates’ everyday business purposes – information about your creditworthiness • affiliates from using your information to market to you • sharing for nonaffiliates to market to you State laws and individual companies may give you additional rights to limit sharing. |
| | |
| Definitions |
| Affiliates | | Companies related by common ownership or control. They can be financial and nonfinancial companies. • MFS does not share personal information with affiliates, except for everyday business purposes as described on page one of this notice. |
| Nonaffiliates | | Companies not related by common ownership or control. They can be financial and nonfinancial companies. • MFS does not share with nonaffiliates so they can market to you. |
| Joint marketing | | A formal agreement between nonaffiliated financial companies that together market financial products or services to you. • MFS doesn’t jointly market. |
| | |
| Other important information |
| If you own an MFS product or receive an MFS service in the name of a third party such as a bank or broker-dealer, their privacy policy may apply to you instead of ours. |
32
Save paper with eDelivery.

| MFS® will send you prospectuses, |
reports, and proxies directly via e-mail so you will get information faster with less mailbox clutter.
To sign up:
1. Go to mfs.com.
2. Log in via MFS® Access.
3. Select eDelivery.
If you own your MFS fund shares through a financial institution or a retirement plan, MFS® TALK, MFS® Access, or eDelivery may not be available to you.
CONTACT
WEB SITE
mfs.com
MFS TALK
1-800-637-8255
24 hours a day
ACCOUNT SERVICE AND LITERATURE
Shareholders
1-800-225-2606
Financial advisors
1-800-343-2829
Retirement plan services
1-800-637-1255
MAILING ADDRESS
MFS Service Center, Inc.
P.O. Box 55824
Boston, MA 02205-5824
OVERNIGHT MAIL
MFS Service Center, Inc.
c/o DST Asset Manager Solutions, Inc.
30 Dan Road
Canton, MA 02021-2809
The Registrant has adopted a Code of Ethics (the “Code”) pursuant to Section 406 of the Sarbanes-Oxley Act and as defined in Form N-CSR that applies to the Registrant’s principal executive officer and principal financial and accounting officer. During the period covered by this report, the Registrant has not amended any provision in its Code of Ethics (the “Code”) that relates to an element of the Code’s definition enumerated in paragraph (b) of Item 2 of this Form N-CSR. During the period covered by this report, the Registrant did not grant a waiver, including an implicit waiver, from any provision of the Code.
A copy of the Code is attached hereto as EX-99.COE.
| ITEM 3. | AUDIT COMMITTEE FINANCIAL EXPERT. |
Messrs. Steven E. Buller and Clarence Otis, Jr. and Ms. Maryanne L. Roepke, members of the Audit Committee, have been determined by the Board of Trustees in their reasonable business judgment to meet the definition of “audit committee financial expert” as such term is defined in Form N-CSR. In addition, Messrs. Buller and Otis and Ms. Roepke are “independent” members of the Audit Committee (as such term has been defined by the Securities and Exchange Commission in regulations implementing Section 407 of the Sarbanes-Oxley Act of 2002). The Securities and Exchange Commission has stated that the designation of a person as an audit committee financial expert pursuant to this Item 3 on the Form N-CSR does not impose on such a person any duties, obligations or liability that are greater than the duties, obligations or liability imposed on such person as a member of the Audit Committee and the Board of Trustees in the absence of such designation or identification.
| ITEM 4. | PRINCIPAL ACCOUNTANT FEES AND SERVICES. |
Items 4(a) through 4(d) and 4(g):
The Board of Trustees has appointed Deloitte & Touche LLP (“Deloitte”) to serve as independent accountants to certain series of the Registrant and Ernst & Young LLP (“E&Y”) to serve in the same capacity to certain other series of the Registrant (each a “Fund” and collectively the “Funds”). The tables below set forth the audit fees billed to each Fund as well as fees for non-audit services provided to each Fund and/or to each Fund’s investment adviser, Massachusetts Financial Services Company (“MFS”), and to various entities either controlling, controlled by, or under common control with MFS that provide ongoing services to the Funds (“MFS Related Entities”).
For the fiscal years ended August 31, 2018 and 2017, audit fees billed to each Fund by Deloitte and E&Y were as follows:
| | | | | | | | |
| | | Audit Fees | |
| | 2018 | | | 2017 | |
Fees Billed by Deloitte | | | | | | | | |
MFS Mid Cap Growth Fund | | | 46,267 | | | | 45,288 | |
MFS U.S. Government Money Market Fund | | | 32,461 | | | | 31,779 | |
| | | | | | | | |
Total | | | 78,728 | | | | 77,067 | |
| |
| | | Audit Fees | |
| | | 2018 | | | 2017 | |
Fees Billed by E&Y | | | | | | | | |
MFS Blended Research Emerging Markets Equity Fund | | | 53,050 | | | | 39,425 | |
MFS Blended Research Global Equity Fund | | | 50,960 | | | | 37,880 | |
MFS Blended Research International Equity Fund | | | 53,050 | | | | 39,425 | |
MFS Global New Discovery Fund | | | 46,427 | | | | 45,445 | |
| | | | | | | | |
Total | | | 203,487 | | | | 162,175 | |
For the fiscal years ended August 31, 2018 and 2017, fees billed by Deloitte and E&Y for audit-related, tax and other services provided to each Fund and for audit-related, tax and other services provided to MFS and MFS Related Entities were as follows:
| | | | | | | | | | | | | | | | | | | | | | | | |
| | | Audit-Related Fees1 | | | Tax Fees2 | | | All Other Fees3 | |
| | 2018 | | | 2017 | | | 2018 | | | 2017 | | | 2018 | | | 2017 | |
Fees Billed by Deloitte | | | | | | | | | | | | | | | | | | | | | | | | |
To MFS Mid Cap Growth Fund | | | 0 | | | | 0 | | | | 6,847 | | | | 6,700 | | | | 0 | | | | 0 | |
To MFS U.S. Government Money Market Fund | | | 0 | | | | 0 | | | | 3,892 | | | | 3,808 | | | | 0 | | | | 0 | |
Total fees billed by Deloitte To above Funds | | | 0 | | | | 0 | | | | 10,739 | | | | 10,508 | | | | 0 | | | | 0 | |
| | | | | | | | | | | | | | | | | | | | | | | | |
| | | Audit-Related Fees1 | | | Tax Fees2 | | | All Other Fees3 | |
| | 2018 | | | 2017 | | | 2018 | | | 2017 | | | 2018 | | | 2017 | |
Fees Billed by Deloitte | | | | | | | | | | | | | | | | | | | | | | | | |
To MFS and MFS Related Entities of MFS Mid Cap Growth Fund* | | | 0 | | | | 0 | | | | 0 | | | | 0 | | | | 5,390 | | | | 5,390 | |
To MFS and MFS Related Entities of MFS U.S. Government Money Market Fund* | | | 0 | | | | 0 | | | | 0 | | | | 0 | | | | 5,390 | | | | 5,390 | |
| | | | | | | | |
| | | Aggregate Fees for Non-audit
Services | |
| | 2018 | | | 2017 | |
Fees Billed by Deloitte | | | | | | | | |
To MFS Mid Cap Growth Fund, MFS and MFS Related Entities# | | | 12,237 | | | | 851,560 | |
To MFS U.S. Government Money Market Fund, MFS and MFS Related Entities# | | | 9,282 | | | | 848,668 | |
| | | | | | | | | | | | | | | | | | | | | | | | |
| | | Audit-Related Fees1 | | | Tax Fees2 | | | All Other Fees4 | |
| | 2018 | | | 2017 | | | 2018 | | | 2017 | | | 2018 | | | 2017 | |
Fees Billed by E&Y | | | | | | | | | | | | | | | | | | | | | | | | |
To MFS Blended Research Emerging Markets Equity Fund | | | 0 | | | | 0 | | | | 9,992 | | | | 9,771 | | | | 1,005 | | | | 1,002 | |
To MFS Blended Research Global Equity Fund | | | 0 | | | | 0 | | | | 9,992 | | | | 10,871 | | | | 1,002 | | | | 1,002 | |
To MFS Blended Research International Equity Fund | | | 0 | | | | 0 | | | | 9,992 | | | | 9,771 | | | | 1,061 | | | | 1,017 | |
To MFS Global New Discovery Fund | | | 0 | | | | 0 | | | | 8,932 | | | | 8,734 | | | | 1,011 | | | | 1,010 | |
Total fees billed by E&Y To above Funds | | | 0 | | | | 0 | | | | 38,908 | | | | 39,147 | | | | 4,079 | | | | 4,031 | |
| | | |
| | | Audit-Related Fees1 | | | Tax Fees2 | | | All Other Fees4 | |
| | 2018 | | | 2017 | | | 2018 | | | 2017 | | | 2018 | | | 2017 | |
Fees Billed by E&Y | | | | | | | | | | | | | | | | | | | | | | | | |
To MFS and MFS Related Entities of MFS Blended Research Emerging Markets Equity Fund* | | | 1,728,076 | | | | 1,603,983 | | | | 0 | | | | 0 | | | | 102,450 | | | | 99,450 | |
To MFS and MFS Related Entities of MFS Blended Research Global Equity Fund* | | | 1,728,076 | | | | 1,603,983 | | | | 0 | | | | 0 | | | | 102,450 | | | | 99,450 | |
To MFS and MFS Related Entities of MFS Blended Research International Equity Fund* | | | 1,728,076 | | | | 1,603,983 | | | | 0 | | | | 0 | | | | 102,450 | | | | 99,450 | |
To MFS and MFS Related Entities of MFS Global New Discovery Fund* | | | 1,728,076 | | | | 1,603,983 | | | | 0 | | | | 0 | | | | 102,450 | | | | 99,450 | |
| | | | | | | | |
| | | Aggregate Fees for Non-audit
Services | |
| | 2018 | | | 2017 | |
Fees Billed by E&Y | | | | | | | | |
To MFS Blended Research Emerging Markets Equity Fund, MFS and MFS Related Entities# | | | 2,039,223 | | | | 1,886,206 | |
To MFS Blended Research Global Equity Fund, MFS and MFS Related Entities# | | | 2,039,220 | | | | 1,887,306 | |
To MFS Blended Research International Equity Fund, MFS and MFS Related Entities# | | | 2,039,279 | | | | 1,886,221 | |
To MFS Global New Discovery Fund, MFS and MFS Related Entities# | | | 2,038,169 | | | | 1,885,177 | |
| * | This amount reflects the fees billed to MFS and MFS Related Entities for non-audit services relating directly to the operations and financial reporting of the Funds (portions of which services also related to the operations and financial reporting of other funds within the MFS Funds complex). |
| # | This amount reflects the aggregate fees billed by Deloitte or E&Y for non-audit services rendered to the Funds and for non-audit services rendered to MFS and the MFS Related Entities. |
| 1 | The fees included under “Audit-Related Fees” are fees related to assurance and related services that are reasonably related to the performance of the audit or review of financial statements, but not reported under “Audit Fees,” including accounting consultations, agreed-upon procedure reports, attestation reports, comfort letters and internal control reviews. |
| 2 | The fees included under “Tax Fees” are fees associated with tax compliance, tax advice and tax planning, including services relating to the filing or amendment of federal, state or local income tax returns, regulated investment company qualification reviews and tax distribution and analysis. |
| 3 | The fees included under “All Other Fees” are fees for products and services provided by Deloitte other than those reported under “Audit Fees,” “Audit-Related Fees” and “Tax Fees”. |
| 4 | The fees included under “All Other Fees” are fees for products and services provided by E&Y other than those reported under “Audit Fees,” “Audit-Related Fees” and “Tax Fees,” including fees for services related to review of internal controls and review of Rule 38a-1 compliance program. |
Item 4(e)(1):
Set forth below are the policies and procedures established by the Audit Committee of the Board of Trustees relating to the pre-approval of audit and non-audit related services:
To the extent required by applicable law, pre-approval by the Audit Committee of the Board is needed for all audit and permissible non-audit services rendered to the Fund and all permissible non-audit services rendered to MFS or MFS Related Entities if the services relate directly to the operations and financial reporting of the Registrant. Pre-approval is currently on an engagement-by-engagement basis. In the event pre-approval of such services is necessary between regular meetings of the Audit Committee and it is not practical to wait to seek pre-approval at the next regular meeting of the Audit Committee, pre-approval of such services may be referred to the Chair of the Audit Committee for approval; provided that the Chair may not pre-approve any individual engagement for such services exceeding $50,000 or multiple engagements for such services in the aggregate exceeding $100,000 in each period between regular meetings of the Audit Committee. Any engagement pre-approved by the Chair between regular meetings of the Audit Committee shall be presented for ratification by the entire Audit Committee at its next regularly scheduled meeting.
Item 4(e)(2):
None, or 0%, of the services relating to the Audit-Related Fees, Tax Fees and All Other Fees paid by the Fund and MFS and MFS Related Entities relating directly to the operations and financial reporting of the Registrant disclosed above were approved by the audit committee pursuant to paragraphs (c)(7)(i)(C) of Rule 2-01 of Regulation S-X (which permits audit committee approval after the start of the engagement with respect to services other than audit, review or attest services, if certain conditions are satisfied).
Item 4(f): Not applicable.
Item 4(h): The Registrant’s Audit Committee has considered whether the provision by a Registrant’s independent registered public accounting firm of non-audit services to MFS and MFS Related Entities that were not pre-approved by the Committee (because such services did not relate directly to the operations and financial reporting of the Registrant) was compatible with maintaining the independence of the independent registered public accounting firm as the Registrant’s principal auditors.
| ITEM 5. | AUDIT COMMITTEE OF LISTED REGISTRANTS. |
Not applicable to the Registrant.
A schedule of investments of the Registrant is included as part of the report to shareholders of such series under Item 1 of this Form N-CSR.
| ITEM 7. | DISCLOSURE OF PROXY VOTING POLICIES AND PROCEDURES FOR CLOSED-END MANAGEMENT INVESTMENT COMPANIES. |
Not applicable to the Registrant.
| ITEM 8. | PORTFOLIO MANAGERS OF CLOSED-END MANAGEMENT INVESTMENT COMPANIES. |
Not applicable to the Registrant.
| ITEM 9. | PURCHASES OF EQUITY SECURITIES BY CLOSED-END MANAGEMENT INVESTMENT COMPANY AND AFFILIATED PURCHASERS. |
Not applicable to the Registrant.
| ITEM 10. | SUBMISSION OF MATTERS TO A VOTE OF SECURITY HOLDERS. |
There were no material changes to the procedures by which shareholders may send recommendations to the Board for nominees to the Registrant’s Board since the Registrant last provided disclosure as to such procedures in response to the requirements of Item 407 (c)(2)(iv) of Regulation S-K or this Item.
| ITEM 11. | CONTROLS AND PROCEDURES. |
| (a) | Based upon their evaluation of the effectiveness of the registrant’s disclosure controls and procedures (as defined in Rule 30a-3(c) under the Investment Company Act of 1940 (the “Act”)) as conducted within 90 days of the filing date of this report on Form N-CSR, the registrant’s principal financial officer and principal executive officer have concluded that those disclosure controls and procedures provide reasonable assurance that the material information required to be disclosed by the registrant on this report is recorded, processed, summarized and reported within the time periods specified in the Securities and Exchange Commission’s rules and forms. |
| (b) | There were no changes in the registrant’s internal controls over financial reporting (as defined in Rule 30a-3(d) under the Act) that occurred during the second fiscal quarter of the period covered by the report that have materially affected, or are reasonably likely to materially affect, the registrant’s internal control over financial reporting. |
| ITEM 12. | DISCLOSURE OF SECURITIES LENDING ACTIVITIES FOR CLOSED-END MANAGEMENT INVESTMENT COMPANIES. |
Not applicable to the Registrant.
| (a) (1) | Any code of ethics, or amendment thereto, that is the subject of the disclosure required by Item 2, to the extent that the registrant intends to satisfy the Item 2 requirements through filing of an exhibit: Attached hereto as EX-99.COE. |
| | (2) | A separate certification for each principal executive officer and principal financial officer of the registrant as required by Rule 30a-2(a) under the Act (17 CFR 270.30a-2): Attached hereto as EX-99.302CERT. |
| | (3) | Any written solicitation to purchase securities under Rule 23c-1 under the Act (17 CFR 270.23c-1) sent or given during the period covered by the report by or on behalf of the registrant to 10 or more persons. Not applicable. |
| | (4) | Change in the registrant’s independent public accountant. Not applicable. |
| (b) | If the report is filed under Section 13(a) or 15(d) of the Exchange Act, provide the certifications required by Rule 30a-2(b) under the Act (17 CFR 270.30a-2(b)), Rule 13a-14(b) or Rule 15d-14(b) under the Exchange Act (17 CFR 240.13a-14(b) or 240.15d-14(b)) and Section 1350 of Chapter 63 of Title 18 of the United States Code (18 U.S.C. 1350) as an exhibit. A certification furnished pursuant to this paragraph will not be deemed “filed” for the purposes of Section 18 of the Exchange Act (15 U.S.C. 78r), or otherwise subject to the liability of that section. Such certification will not be deemed to be incorporated by reference into any filing under the Securities Act of 1933 or the Exchange Act, except to the extent that the registrant specifically incorporates it by reference. Attached hereto as EX-99.906CERT. |
Notice
A copy of the Amended and Restated Declaration of Trust, as amended, of the Registrant is on file with the Secretary of State of The Commonwealth of Massachusetts and notice is hereby given that this instrument is executed on behalf of the Registrant by an officer of the Registrant as an officer and not individually and the obligations of or arising out of this instrument are not binding upon any of the Trustees or shareholders individually, but are binding only upon the assets and property of the respective constituent series of the Registrant.
SIGNATURES
Pursuant to the requirements of the Securities Exchange Act of 1934 and the Investment Company Act of 1940, the registrant has duly caused this report to be signed on its behalf by the undersigned, thereunto duly authorized.
(Registrant) MFS SERIES TRUST IV
| | |
| By (Signature and Title)* | | DAVID L. DILORENZO |
| | David L. DiLorenzo, President |
Date: October 16, 2018
Pursuant to the requirements of the Securities Exchange Act of 1934 and the Investment Company Act of 1940, this report has been signed below by the following persons on behalf of the registrant and in the capacities and on the dates indicated.
| | |
| By (Signature and Title)* | | DAVID L. DILORENZO |
| | David L. DiLorenzo, President (Principal Executive Officer) |
Date: October 16, 2018
| | |
| By (Signature and Title)* | | JAMES O. YOST |
| | James O. Yost, Treasurer (Principal Financial Officer and Accounting Officer) |
Date: October 16, 2018
| * | Print name and title of each signing officer under his or her signature. |