UNITED STATES
SECURITIES AND EXCHANGE COMMISSION
Washington, D.C. 20549
FORMN-CSR
CERTIFIED SHAREHOLDER REPORT OF
REGISTERED MANAGEMENT INVESTMENT COMPANIES
Investment Company Act file number811-02594
MFS SERIES TRUST IV
(Exact name of registrant as specified in charter)
111 Huntington Avenue, Boston, Massachusetts 02199
(Address of principal executive offices) (Zip code)
Christopher R. Bohane
Massachusetts Financial Services Company
111 Huntington Avenue
Boston, Massachusetts 02199
(Name and address of agents for service)
Registrant’s telephone number, including area code: (617)954-5000
Date of fiscal year end: August 31
Date of reporting period: February 29, 2020
| ITEM 1. | REPORTS TO STOCKHOLDERS. |
Semiannual Report
February 29, 2020

MFS® Blended Research® Emerging Markets Equity Fund

Beginning on January 1, 2021, as permitted by regulations adopted by the U.S. Securities and Exchange Commission, paper copies of the fund’s annual and semiannual shareholder reports will no longer be sent by mail, unless you specifically request paper copies of the reports. Instead, the complete reports will be made available on the fund’s Web site (funds.mfs.com), and you will be notified by mail each time a report is posted and provided with a Web site link to access the report.
If you are already signed up to receive shareholder reports by email, you will not be affected by this change and you need not take any action. You may sign up to receive shareholder reports and other communications from the fund by email by contacting your financial intermediary (such as a broker-dealer or bank) or, if you hold your shares directly with the fund, by calling 1-800-225-2606 or by logging on to MFS Access at mfs.com.
Beginning on January 1, 2019, you may elect to receive all future reports in paper free of charge. Contact your financial intermediary to request that you continue to receive paper copies of your shareholder reports. If you invest directly with the fund, you can call 1-800-225-2606 or send an email request to orderliterature@mfs.com to let the fund know that you wish to continue receiving paper copies of your shareholder reports. Your election to receive reports in paper will apply to all funds held in your account if you invest through your financial intermediary or all funds held with the MFS fund complex if you invest directly.
BRK-SEM
MFS® Blended Research® Emerging Markets Equity Fund
CONTENTS
The report is prepared for the general information of shareholders.
It is authorized for distribution to prospective investors only when preceded or accompanied by a current prospectus.
NOT FDIC INSURED• MAY LOSE VALUE• NO BANK GUARANTEE

LETTER FROM THE EXECUTIVE CHAIR
Dear Shareholders:
During the first quarter of 2020, market volatility reached levels not seen since the global financial crisis. Optimism heading into the year — on receding trade and
geopolitical risk along with easier central bank policies — was overwhelmed in February as the health effects of a novel coronavirus,COVID-19, spread beyond China’s borders, ultimately impacting more than 200 countries. The global pandemic prompted many governments to take drastic action to slow the spread of the virus, such as quarantines, school and business closures, and prohibitions on public gatherings. While these are important steps to protect the public health, they come at a cost: rising market volatility and an abrupt decline in economic growth.
Global central banks have taken aggressive, coordinated steps to cushion the economic and market fallout related to the virus, and
governments are undertaking unprecedented levels of fiscal stimulus. As uncertainty recedes, these measures can help create a supportive environment and encourage economic recovery. In the aftermath of the crisis, there are likely to be societal changes as households, businesses and governments adjust to a new reality and these alterations could change the investment landscape. Occurrences such as the COVID-19 outbreak demonstrate the importance of having a deep understanding of company fundamentals, and our global research platform has been built to do just that.
Here at MFS®, we aim to help our clients navigate the growing complexity of the markets and world economies. Our long-term investment philosophy and commitment to the responsible allocation of capital allow us to tune out the noise and uncover what we believe are the best, most durable investment opportunities in the market. Through our powerful global investment platform, we combine collective expertise, thoughtful risk management, and long-term discipline to create sustainable value for investors.
Respectfully,

Robert J. Manning
Executive Chair
MFS Investment Management
April 16, 2020
The opinions expressed in this letter are subject to change and may not be relied upon for investment advice. No forecasts can be guaranteed.
1
PORTFOLIO COMPOSITION
Portfolio structure

| | | | |
| Top ten holdings | | | | |
| Tencent Holdings Ltd. | | | 5.8% | |
| Samsung Electronics Co. Ltd. | | | 5.3% | |
| Alibaba Group Holding Ltd., ADR | | | 5.3% | |
Taiwan Semiconductor
Manufacturing Co. Ltd. | | | 4.8% | |
| China Construction Bank | | | 2.8% | |
| Industrial & Commercial Bank of China, “H” | | | 1.9% | |
| LUKOIL PJSC, ADR | | | 1.8% | |
| Infosys Ltd. | | | 1.7% | |
| Sberbank of Russia PJSC, ADR | | | 1.7% | |
| China Petroleum & Chemical Corp. | | | 1.5% | |
| |
| GICS equity sectors (g) | | | | |
| Financials | | | 22.1% | |
| Information Technology | | | 16.1% | |
| Consumer Discretionary | | | 13.7% | |
| Communication Services | | | 11.1% | |
| Energy | | | 6.5% | |
| Materials | | | 6.3% | |
| Industrials | | | 6.1% | |
| Consumer Staples | | | 5.5% | |
| Real Estate | | | 3.9% | |
| Health Care | | | 3.3% | |
| Utilities | | | 2.6% | |
| | | | |
| Issuer country weightings (x) | | | | |
| China | | | 33.7% | |
| South Korea | | | 13.0% | |
| Taiwan | | | 8.9% | |
| India | | | 8.0% | |
| Brazil | | | 7.8% | |
| Russia | | | 4.7% | |
| South Africa | | | 3.8% | |
| Thailand | | | 3.1% | |
| United States | | | 2.8% | |
| Other Countries | | | 14.2% | |
|
| Currency exposure weightings (y) | |
| Hong Kong Dollar | | | 24.4% | |
| South Korean Won | | | 13.0% | |
| Chinese Renminbi | | | 9.3% | |
| Taiwan Dollar | | | 8.9% | |
| Indian Rupee | | | 8.0% | |
| Brazilian Real | | | 7.8% | |
| Russian Ruble | | | 4.6% | |
| United States Dollar | | | 4.1% | |
| South African Rand | | | 3.8% | |
| Other Currencies | | | 16.1% | |
2
Portfolio Composition – continued
| (g) | The Global Industry Classification Standard (GICS®) was developed by and/or is the exclusive property of MSCI, Inc. and S&P Global Market Intelligence Inc. (“S&P Global Market Intelligence”). GICS is a service mark of MSCI and S&P Global Market Intelligence and has been licensed for use by MFS. |
| (x) | Represents the portfolio’s exposure to issuer countries as a percentage of a portfolio’s net assets. For purposes of this presentation, United States includes Cash & Cash Equivalents. |
| (y) | Represents the portfolio’s exposure to a particular currency as a percentage of a portfolio’s net assets. For purposes of this presentation, United States Dollar includes Cash & Cash Equivalents. |
Cash & Cash Equivalents includes any cash, investments in money market funds, short-term securities, and other assets less liabilities. Please see the Statement of Assets and Liabilities for additional information related to the fund’s cash position and other assets and liabilities.
Percentages are based on net assets as of February 29, 2020.
The portfolio is actively managed and current holdings may be different.
3
EXPENSE TABLE
Fund expenses borne by the shareholders during the period, September 1, 2019 through February 29, 2020
As a shareholder of the fund, you incur two types of costs: (1) transaction costs, including sales charges (loads) on certain purchase or redemption payments, and (2) ongoing costs, including management fees; distribution and service(12b-1) fees; and other fund expenses. This example is intended to help you understand your ongoing costs (in dollars) of investing in the fund and to compare these costs with the ongoing costs of investing in other mutual funds.
The example is based on an investment of $1,000 invested at the beginning of the period and held for the entire period September 1, 2019 through February 29, 2020.
Actual Expenses
The first line for each share class in the following table provides information about actual account values and actual expenses. You may use the information in this line, together with the amount you invested, to estimate the expenses that you paid over the period. Simply divide your account value by $1,000 (for example, an $8,600 account value divided by $1,000 = 8.6), then multiply the result by the number in the first line under the heading entitled “Expenses Paid During Period” to estimate the expenses you paid on your account during this period.
Hypothetical Example for Comparison Purposes
The second line for each share class in the following table provides information about hypothetical account values and hypothetical expenses based on the fund’s actual expense ratio and an assumed rate of return of 5% per year before expenses, which is not the fund’s actual return. The hypothetical account values and expenses may not be used to estimate the actual ending account balance or expenses you paid for the period. You may use this information to compare the ongoing costs of investing in the fund and other funds. To do so, compare this 5% hypothetical example with the 5% hypothetical examples that appear in the shareholder reports of the other funds.
Please note that the expenses shown in the table are meant to highlight your ongoing costs only and do not reflect any transactional costs, such as sales charges (loads). Therefore, the second line for each share class in the table is useful in comparing ongoing costs only, and will not help you determine the relative total costs of owning different funds. In addition, if these transactional costs were included, your costs would have been higher.
4
Expense Table – continued
| | | | | | | | | | | | | | | | | | |
Share
Class | | | | Annualized
Expense
Ratio | | | Beginning
Account Value
9/01/19 | | | Ending
Account Value
2/29/20 | | | Expenses
Paid During
Period (p)
9/01/19-2/29/20 | |
| A | | Actual | | | 1.24% | | | | $1,000.00 | | | | $1,025.20 | | | | $6.24 | |
| | Hypothetical (h) | | | 1.24% | | | | $1,000.00 | | | | $1,018.70 | | | | $6.22 | |
| B | | Actual | | | 1.99% | | | | $1,000.00 | | | | $1,021.51 | | | | $10.00 | |
| | Hypothetical (h) | | | 1.99% | | | | $1,000.00 | | | | $1,014.97 | | | | $9.97 | |
| C | | Actual | | | 1.99% | | | | $1,000.00 | | | | $1,021.32 | | | | $10.00 | |
| | Hypothetical (h) | | | 1.99% | | | | $1,000.00 | | | | $1,014.97 | | | | $9.97 | |
| I | | Actual | | | 0.99% | | | | $1,000.00 | | | | $1,026.09 | | | | $4.99 | |
| | Hypothetical (h) | | | 0.99% | | | | $1,000.00 | | | | $1,019.94 | | | | $4.97 | |
| R1 | | Actual | | | 1.99% | | | | $1,000.00 | | | | $1,021.25 | | | | $10.00 | |
| | Hypothetical (h) | | | 1.99% | | | | $1,000.00 | | | | $1,014.97 | | | | $9.97 | |
| R2 | | Actual | | | 1.49% | | | | $1,000.00 | | | | $1,023.23 | | | | $7.50 | |
| | Hypothetical (h) | | | 1.49% | | | | $1,000.00 | | | | $1,017.45 | | | | $7.47 | |
| R3 | | Actual | | | 1.24% | | | | $1,000.00 | | | | $1,025.04 | | | | $6.24 | |
| | Hypothetical (h) | | | 1.24% | | | | $1,000.00 | | | | $1,018.70 | | | | $6.22 | |
| R4 | | Actual | | | 0.99% | | | | $1,000.00 | | | | $1,026.23 | | | | $4.99 | |
| | Hypothetical (h) | | | 0.99% | | | | $1,000.00 | | | | $1,019.94 | | | | $4.97 | |
| R6 | | Actual | | | 0.89% | | | | $1,000.00 | | | | $1,027.30 | | | | $4.49 | |
| | Hypothetical (h) | | | 0.89% | | | | $1,000.00 | | | | $1,020.44 | | | | $4.47 | |
| (h) | 5% class return per year before expenses. |
| (p) | “Expenses Paid During Period” are equal to each class’s annualized expense ratio, as shown above, multiplied by the average account value over the period, multiplied by 182/366 (to reflect theone-half year period). Expenses paid do not include any applicable sales charges (loads). If these transaction costs had been included, your costs would have been higher. |
5
PORTFOLIO OF INVESTMENTS
2/29/20 (unaudited)
The Portfolio of Investments is a complete list of all securities owned by your fund. It is categorized by broad-based asset classes.
| | | | | | | | |
| | |
| Issuer | | Shares/Par | | | Value ($) | |
| Common Stocks - 94.5% | | | | | | |
| Airlines - 1.7% | | | | | | |
| Grupo Aeroportuario del Centro Norte S.A.B. de C.V. | | | 19,430 | | | $ | 127,609 | |
| Grupo Aeroportuario del Pacifico S.A.B. de C.V. | | | 23,710 | | | | 257,373 | |
| Malaysia Airports Holdings Berhad | | | 101,800 | | | | 159,735 | |
| | | | | | | | |
| | | | | | | $ | 544,717 | |
| Alcoholic Beverages - 2.4% | | | | | | |
| Ambev S.A. | | | 30,800 | | | $ | 100,144 | |
| China Resources Beer Holdings Co. Ltd. | | | 16,000 | | | | 74,568 | |
| Kweichow Moutai Co. Ltd., “A” | | | 2,497 | | | | 380,521 | |
| Thai Beverage PLC | | | 373,800 | | | | 210,946 | |
| | | | | | | | |
| | | | | | | $ | 766,179 | |
| Apparel Manufacturers - 1.3% | | | | | | |
| ANTA Sports Products Ltd. | | | 19,000 | | | $ | 154,572 | |
| Li Ning Co. Ltd. | | | 44,000 | | | | 116,815 | |
| Pou Chen Corp. | | | 142,000 | | | | 156,385 | |
| | | | | | | | |
| | | | | | | $ | 427,772 | |
| Automotive - 1.7% | | | | | | |
| Hyundai Motor Co. Ltd. | | | 1,919 | | | $ | 183,521 | |
| Kia Motors Corp. | | | 9,316 | | | | 281,574 | |
| Zhongsheng Group Holdings Ltd. | | | 21,000 | | | | 80,707 | |
| | | | | | | | |
| | | | | | | $ | 545,802 | |
| Biotechnology - 0.7% | | | | | | |
| Sino Biopharmaceutical | | | 150,000 | | | $ | 220,616 | |
| | |
| Brokerage & Asset Managers - 0.2% | | | | | | |
| Bolsa Mexicana de Valores S.A. de C.V. | | | 30,800 | | | $ | 65,065 | |
| | |
| Business Services - 2.6% | | | | | | |
| HCL Technologies Ltd. | | | 8,246 | | | $ | 61,056 | |
| Infosys Ltd. | | | 55,579 | | | | 560,857 | |
| Tata Consultancy Services Ltd. | | | 5,299 | | | | 146,864 | |
| WNS (Holdings) Ltd., ADR (a) | | | 1,091 | | | | 71,831 | |
| | | | | | | | |
| | | | | | | $ | 840,608 | |
| Computer Software - Systems - 1.5% | | | | | | |
| Hon Hai Precision Industry Co. Ltd. | | | 189,000 | | | $ | 484,862 | |
6
Portfolio of Investments (unaudited) – continued
| | | | | | | | |
| | |
| Issuer | | Shares/Par | | | Value ($) | |
| Common Stocks - continued | | | | | | |
| Conglomerates - 0.3% | | | | | | |
| CITIC Pacific Ltd. | | | 93,000 | | | $ | 104,114 | |
| | |
| Construction - 1.5% | | | | | | |
| Anhui Conch Cement Co. Ltd. | | | 39,500 | | | $ | 292,133 | |
| Asia Cement Corp. | | | 56,000 | | | | 80,270 | |
| Taiwan Cement Corp. | | | 91,486 | | | | 125,127 | |
| | | | | | | | |
| | | | | | | $ | 497,530 | |
| Consumer Products - 0.2% | | | | | | |
| Colgate-Palmolive (India) Ltd. | | | 3,581 | | | $ | 64,096 | |
| | |
| Consumer Services - 0.4% | | | | | | |
| Localiza Rent a Car S.A. | | | 11,215 | | | $ | 124,241 | |
| | |
| Electronics - 10.6% | | | | | | |
| E Ink Holdings, Inc. | | | 65,000 | | | $ | 62,977 | |
| Powertech Technology, Inc. | | | 34,000 | | | | 109,910 | |
| Samsung Electronics Co. Ltd. | | | 37,640 | | | | 1,702,834 | |
| Taiwan Semiconductor Manufacturing Co. Ltd. | | | 152,000 | | | | 1,558,494 | |
| | | | | | | | |
| | | | | | | $ | 3,434,215 | |
| Energy - Independent - 1.6% | | | | | | |
| CNOOC Ltd. | | | 184,000 | | | $ | 253,743 | |
| Hindustan Petroleum Corp. Ltd. | | | 44,766 | | | | 123,334 | |
| Oil & Natural Gas Corp. Ltd. | | | 101,681 | | | | 129,554 | |
| | | | | | | | |
| | | | | | | $ | 506,631 | |
| Energy - Integrated - 3.9% | | | | | | |
| China Petroleum & Chemical Corp. | | | 958,000 | | | $ | 497,133 | |
| LUKOIL PJSC, ADR | | | 6,727 | | | | 584,867 | |
| PetroChina Co. Ltd. | | | 440,000 | | | | 171,171 | |
| | | | | | | | |
| | | | | | | $ | 1,253,171 | |
| Engineering - Construction - 0.2% | | | | | | |
| China Communications Construction Co. Ltd. | | | 98,000 | | | $ | 73,595 | |
| | |
| Food & Beverages - 1.7% | | | | | | |
| AVI Ltd. | | | 43,768 | | | $ | 205,401 | |
| Inner Mongolia Yili Industrial Group Co. Ltd., “A” | | | 23,864 | | | | 98,699 | |
| JBS S.A. | | | 31,807 | | | | 161,457 | |
| Orion Corp. | | | 1,052 | | | | 82,459 | |
| | | | | | | | |
| | | | | | | $ | 548,016 | |
7
Portfolio of Investments (unaudited) – continued
| | | | | | | | |
| | |
| Issuer | | Shares/Par | | | Value ($) | |
| Common Stocks - continued | | | | | | |
| Food & Drug Stores - 0.9% | | | | | | |
| Raia Drogasil S.A. | | | 4,650 | | | $ | 124,675 | |
| SPAR Group Ltd. | | | 9,441 | | | | 102,639 | |
| X5 Retail Group N.V., GDR | | | 1,890 | | | | 58,874 | |
| | | | | | | | |
| | | | | | | $ | 286,188 | |
| Gaming & Lodging - 0.9% | | | | | | |
| Genting Berhad | | | 238,600 | | | $ | 280,206 | |
| | |
| General Merchandise - 1.4% | | | | | | |
| Lojas Renner S.A. | | | 38,010 | | | $ | 453,036 | |
| | |
| Health Maintenance Organizations - 0.6% | | | | | | |
| Qualicorp S.A. | | | 25,800 | | | $ | 197,601 | |
| | |
| Insurance - 4.0% | | | | | | |
| AIA Group Ltd. | | | 18,400 | | | $ | 177,956 | |
| BB Seguridade Participacoes S.A. | | | 33,500 | | | | 238,595 | |
| China Pacific Insurance Co. Ltd. | | | 127,000 | | | | 421,930 | |
| PICC Property & Casualty Co. Ltd. | | | 94,000 | | | | 98,175 | |
| Samsung Fire & Marine Insurance Co. Ltd. | | | 2,113 | | | | 344,483 | |
| | | | | | | | |
| | | | | | | $ | 1,281,139 | |
| Internet - 11.6% | | | | | | |
| Alibaba Group Holding Ltd., ADR (a) | | | 8,141 | | | $ | 1,693,328 | |
| NetEase.com, Inc., ADR | | | 566 | | | | 180,390 | |
| Tencent Holdings Ltd. | | | 37,900 | | | | 1,869,433 | |
| | | | | | | | |
| | | | | | | $ | 3,743,151 | |
| Machinery & Tools - 2.9% | | | | | | |
| Doosan Bobcat, Inc. | | | 12,991 | | | $ | 307,565 | |
| Sinotruk Hong Kong Ltd. | | | 57,000 | | | | 110,618 | |
| Weichai Power Co. Ltd., “H” | | | 145,000 | | | | 287,958 | |
| Zhengzhou Yutong Bus Co. Ltd., “A” | | | 56,490 | | | | 122,961 | |
| Zoomlion Science and Technology Co. Ltd. | | | 116,198 | | | | 104,395 | |
| | | | | | | | |
| | | | | | | $ | 933,497 | |
| Major Banks - 7.1% | | | | | | |
| ABSA Group Ltd. | | | 40,614 | | | $ | 347,864 | |
| Bank of China Ltd. | | | 600,000 | | | | 238,683 | |
| China Construction Bank | | | 1,091,000 | | | | 888,773 | |
| Gentera S.A.B. de C.V. | | | 68,734 | | | | 65,965 | |
| Industrial & Commercial Bank of China, “H” | | | 875,000 | | | | 602,942 | |
| Nedbank Group Ltd. | | | 13,078 | | | | 152,368 | |
| | | | | | | | |
| | | | | | | $ | 2,296,595 | |
8
Portfolio of Investments (unaudited) – continued
| | | | | | | | |
| | |
| Issuer | | Shares/Par | | | Value ($) | |
| Common Stocks - continued | | | | | | |
| Medical & Health Technology & Services - 0.2% | | | | | | |
| Netcare Ltd. | | | 49,986 | | | $ | 59,862 | |
| | |
| Metals & Mining - 2.7% | | | | | | |
| Kumba Iron Ore Ltd. | | | 5,845 | | | $ | 109,235 | |
| MMC Norilsk Nickel PJSC, ADR | | | 11,462 | | | | 347,233 | |
| POSCO | | | 1,624 | | | | 260,962 | |
| Tata Steel Ltd. | | | 29,411 | | | | 155,760 | |
| | | | | | | | |
| | | | | | | $ | 873,190 | |
| Natural Gas - Pipeline - 0.4% | | | | | | |
| Petronet LNG Ltd. | | | 34,403 | | | $ | 117,080 | |
| | |
| Network & Telecom - 0.6% | | | | | | |
| VTech Holdings Ltd. | | | 20,300 | | | $ | 178,397 | |
| | |
| Oil Services - 0.6% | | | | | | |
| Star Petroleum Refining PLC, “A” | | | 825,600 | | | $ | 206,694 | |
| | |
| Other Banks & Diversified Financials - 9.5% | | | | | | |
| Banco de Oro Unibank, Inc. | | | 60,120 | | | $ | 163,937 | |
| Banco Macro S.A., ADR | | | 2,778 | | | | 80,506 | |
| Bancolombia S.A., ADR | | | 3,284 | | | | 155,924 | |
| Bank Rakyat Indonesia | | | 986,300 | | | | 288,036 | |
| BNK Financial Group, Inc. | | | 14,798 | | | | 75,178 | |
| E.Sun Financial Holding Co. Ltd. | | | 311,000 | | | | 293,707 | |
| Grupo Financiero Inbursa S.A. de C.V. | | | 65,485 | | | | 70,266 | |
| Haci Ömer Sabanci Holding A.S. | | | 85,540 | | | | 116,831 | |
| Hana Financial Group, Inc. | | | 7,692 | | | | 198,871 | |
| HDFC Bank Ltd., ADR | | | 2,256 | | | | 123,742 | |
| Industrial Bank of Korea | | | 11,514 | | | | 90,829 | |
| KB Financial Group, Inc. | | | 7,286 | | | | 234,006 | |
| Komercni Banka A.S. | | | 9,259 | | | | 284,217 | |
| REC Ltd. | | | 69,698 | | | | 113,345 | |
| Sberbank of Russia PJSC, ADR | | | 38,214 | | | | 542,007 | |
| Shriram Transport Finance Co. Ltd. | | | 4,640 | | | | 77,503 | |
| Turkiye Garanti Bankasi A.S. (a) | | | 94,374 | | | | 149,118 | |
| | | | | | | | |
| | | | | | | $ | 3,058,023 | |
| Pharmaceuticals - 1.8% | | | | | | |
| Ajanta Pharma Ltd. | | | 7,504 | | | $ | 144,028 | |
| China Medical System Holdings Ltd. | | | 89,000 | | | | 110,305 | |
| Gedeon Richter PLC | | | 9,668 | | | | 196,476 | |
| Kalbe Farma Tbk PT | | | 695,300 | | | | 59,123 | |
9
Portfolio of Investments (unaudited) – continued
| | | | | | | | |
| | |
| Issuer | | Shares/Par | | | Value ($) | |
| Common Stocks - continued | | | | | | |
| Pharmaceuticals - continued | | | | | | |
| Luye Pharma Group Ltd. | | | 141,530 | | | $ | 87,151 | |
| | | | | | | | |
| | | | | | | $ | 597,083 | |
| Precious Metals & Minerals - 0.3% | | | | | | |
| Harmony Gold, ADR (a) | | | 26,013 | | | $ | 88,444 | |
| | |
| Railroad & Shipping - 0.3% | | | | | | |
| DP World Ltd. | | | 6,119 | | | $ | 99,434 | |
| | |
| Real Estate - 4.2% | | | | | | |
| Atrium European Real Estate Ltd. | | | 21,692 | | | $ | 78,546 | |
| BR Malls Participacoes S.A. | | | 24,000 | | | | 87,694 | |
| Country Garden Holdings Co. Ltd. | | | 50,000 | | | | 66,903 | |
| Country Garden Services Holdings Co. Ltd. | | | 26,000 | | | | 102,221 | |
| Embassy Office Parks, REIT | | | 12,200 | | | | 75,727 | |
| Fibra Uno Administracion S.A. de C.V., REIT | | | 190,764 | | | | 286,781 | |
| Fortress REIT Ltd. | | | 66,551 | | | | 69,209 | |
| Longfor Properties Co. Ltd. | | | 98,000 | | | | 457,069 | |
| Shimao Property Holdings Ltd. | | | 37,000 | | | | 133,675 | |
| | | | | | | | |
| | | | | | | $ | 1,357,825 | |
| Restaurants - 1.0% | | | | | | |
| Yum China Holdings, Inc. | | | 7,564 | | | $ | 331,228 | |
| | |
| Specialty Chemicals - 1.8% | | | | | | |
| Asian Paints Ltd. | | | 10,608 | | | $ | 264,283 | |
| Lotte Chemical Corp. | | | 418 | | | | 64,423 | |
| PTT Global Chemical PLC | | | 182,200 | | | | 238,180 | |
| | | | | | | | |
| | | | | | | $ | 566,886 | |
| Specialty Stores - 1.9% | | | | | | |
| Dufry AG | | | 2,249 | | | $ | 164,500 | |
| JD.com, Inc., ADR (a) | | | 2,181 | | | | 83,990 | |
| Vipshop Holdings Ltd., ADR (a) | | | 27,212 | | | | 349,130 | |
| | | | | | | | |
| | | | | | | $ | 597,620 | |
| Telecommunications - Wireless - 1.3% | | | | | | |
| Advanced Info Service Public Co. Ltd. | | | 53,800 | | | $ | 342,697 | |
| PLDT, Inc. | | | 4,280 | | | | 83,123 | |
| | | | | | | | |
| | | | | | | $ | 425,820 | |
| Telephone Services - 3.7% | | | | | | |
| Hellenic Telecommunications Organization S.A. | | | 30,939 | | | $ | 439,044 | |
| KT Corp., ADR | | | 10,615 | | | | 102,435 | |
| Naspers Ltd. | | | 474 | | | | 74,971 | |
10
Portfolio of Investments (unaudited) – continued
| | | | | | | | |
| | |
| Issuer | | Shares/Par | | | Value ($) | |
| Common Stocks - continued | | | | | | |
| Telephone Services - continued | | | | | | |
| PT Telekomunikasi Indonesia | | | 1,296,900 | | | $ | 315,468 | |
| PT XL Axiata Tbk (a) | | | 458,200 | | | | 82,714 | |
| Telekomunikacja Polska S.A. (a) | | | 70,885 | | | | 111,519 | |
| Turk Telekomunikasyon A.S. (a) | | | 51,320 | | | | 62,021 | |
| | | | | | | | |
| | | | | | | $ | 1,188,172 | |
| Utilities - Electric Power - 2.3% | | | | | | |
| ENGIE Energía Brasil S.A. | | | 36,600 | | | $ | 389,006 | |
| NTPC Ltd. | | | 233,510 | | | | 345,849 | |
| | | | | | | | |
| | | | | | | $ | 734,855 | |
| Total Common Stocks (Identified Cost, $29,601,142) | | | | | | $ | 30,453,256 | |
| | |
| Preferred Stocks - 2.7% | | | | | | |
| Electronics - 0.7% | | | | | | |
| Samsung Electronics Co. Ltd. | | | 6,476 | | | $ | 245,867 | |
| | |
| Food & Drug Stores - 0.3% | | | | | | |
| Cia Brasileira de Distribuicao | | | 6,800 | | | $ | 109,651 | |
| | |
| Major Banks - 1.3% | | | | | | |
| Banco Bradesco S.A. | | | 60,876 | | | $ | 415,605 | |
| | |
| Utilities - Electric Power - 0.4% | | | | | | |
| Centrais Eletricas Brasileiras S.A. | | | 4,700 | | | $ | 37,679 | |
| Companhia Paranaense de Energia | | | 5,000 | | | | 80,178 | |
| | | | | | | | |
| | | | | | | $ | 117,857 | |
| Total Preferred Stocks (Identified Cost, $901,576) | | | | | | $ | 888,980 | |
| | |
| Investment Companies (h) - 14.2% | | | | | | |
| Money Market Funds - 14.2% | | | | | | |
MFS Institutional Money Market Portfolio, 1.61% (v)
(Identified Cost, $4,569,642) | | | 4,569,228 | | | $ | 4,569,685 | |
| | |
| Other Assets, Less Liabilities - (11.4)% | | | | | (3,673,333) | |
| Net Assets - 100.0% | | | | | | $ | 32,238,588 | |
| (a) | Non-income producing security. |
| (h) | An affiliated issuer, which may be considered one in which the fund owns 5% or more of the outstanding voting securities, or a company which is under common control. At period end, the aggregate values of the fund’s investments in affiliated issuers and in unaffiliated issuers were $4,569,685 and $31,342,236, respectively. |
| (v) | Affiliated issuer that is available only to investment companies managed by MFS. The rate quoted for the MFS Institutional Money Market Portfolio is the annualizedseven-day yield of the fund at period end. |
11
Portfolio of Investments (unaudited) – continued
The following abbreviations are used in this report and are defined:
| ADR | | American Depositary Receipt |
| GDR | | Global Depositary Receipt |
| REIT | | Real Estate Investment Trust |
See Notes to Financial Statements
12
Financial Statements
STATEMENT OF ASSETS AND LIABILITIES
At 2/29/20 (unaudited)
This statement represents your fund’s balance sheet, which details the assets and liabilities comprising the total value of the fund.
| | | | |
| Assets | | | | |
Investments in unaffiliated issuers, at value (identified cost, $30,502,718) | | | $31,342,236 | |
Investments in affiliated issuers, at value (identified cost, $4,569,642) | | | 4,569,685 | |
Foreign currency, at value (identified cost, $4,091) | | | 4,099 | |
Receivables for | | | | |
Fund shares sold | | | 4,321 | |
Dividends | | | 82,717 | |
Receivable from investment adviser | | | 24,828 | |
Other assets | | | 226 | |
Total assets | | | $36,028,112 | |
| |
| Liabilities | | | | |
Payable to custodian | | | $87,545 | |
Payables for | | | | |
Investments purchased | | | 3,530,297 | |
Fund shares reacquired | | | 16,667 | |
Payable to affiliates | | | | |
Administrative services fee | | | 144 | |
Shareholder servicing costs | | | 7,286 | |
Distribution and service fees | | | 165 | |
Payable for independent Trustees’ compensation | | | 115 | |
Accrued expenses and other liabilities | | | 147,305 | |
Total liabilities | | | $3,789,524 | |
Net assets | | | $32,238,588 | |
| |
| Net assets consist of | | | | |
Paid-in capital | | | $32,827,005 | |
Total distributable earnings (loss) | | | (588,417 | ) |
Net assets | | | $32,238,588 | |
Shares of beneficial interest outstanding | | | 2,630,950 | |
13
Statement of Assets and Liabilities (unaudited) – continued
| | | | | | | | | | | | |
| | | |
| | | Net assets | | | Shares
outstanding | | | Net asset value
per share (a) | |
Class A | | | $5,379,000 | | | | 439,691 | | | | $12.23 | |
Class B | | | 331,791 | | | | 27,362 | | | | 12.13 | |
Class C | | | 357,126 | | | | 29,494 | | | | 12.11 | |
Class I | | | 12,217,766 | | | | 997,639 | | | | 12.25 | |
Class R1 | | | 67,082 | | | | 5,518 | | | | 12.16 | |
Class R2 | | | 68,599 | | | | 5,609 | | | | 12.23 | |
Class R3 | | | 74,415 | | | | 6,077 | | | | 12.25 | |
Class R4 | | | 89,844 | | | | 7,324 | | | | 12.27 | |
Class R6 | | | 13,652,965 | | | | 1,112,236 | | | | 12.28 | |
| (a) | Maximum offering price per share was equal to the net asset value per share for all share classes, except for Class A, for which the maximum offering price per share was $12.98 [100 / 94.25 x $12.23]. On sales of $50,000 or more, the maximum offering price of Class A shares is reduced. A contingent deferred sales charge may be imposed on redemptions of Class A, Class B, and Class C shares. Redemption price per share was equal to the net asset value per share for Classes I, R1, R2, R3, R4, and R6. |
See Notes to Financial Statements
14
Financial Statements
STATEMENT OF OPERATIONS
Six months ended 2/29/20 (unaudited)
This statement describes how much your fund earned in investment income and accrued in expenses. It also describes any gains and/or losses generated by fund operations.
| | | | |
| Net investment income (loss) | | | | |
Income | | | | |
Dividends | | | $386,242 | |
Dividends from affiliated issuers | | | 4,313 | |
Other | | | 3,417 | |
Foreign taxes withheld | | | (33,737 | ) |
Total investment income | | | $360,235 | |
Expenses | | | | |
Management fee | | | $94,958 | |
Distribution and service fees | | | 11,726 | |
Shareholder servicing costs | | | 9,416 | |
Administrative services fee | | | 8,701 | |
Independent Trustees’ compensation | | | 636 | |
Custodian fee | | | 64,442 | |
Shareholder communications | | | 6,258 | |
Audit and tax fees | | | 37,124 | |
Legal fees | | | 115 | |
Registration fees | | | 60,295 | |
Miscellaneous | | | 15,341 | |
Total expenses | | | $309,012 | |
Reduction of expenses by investment adviser and distributor | | | (178,734 | ) |
Net expenses | | | $130,278 | |
Net investment income (loss) | | | $229,957 | |
| |
| Realized and unrealized gain (loss) | | | | |
Realized gain (loss) (identified cost basis) | | | | |
Unaffiliated issuers (net of $18 country tax) | | | $24,788 | |
Affiliated issuers | | | (268 | ) |
Foreign currency | | | (6,181 | ) |
Net realized gain (loss) | | | $18,339 | |
Change in unrealized appreciation or depreciation | | | | |
Unaffiliated issuers (net of $8,743 decrease in deferred country tax) | | | $(357,690 | ) |
Affiliated issuers | | | 4 | |
Translation of assets and liabilities in foreign currencies | | | (5,558 | ) |
Net unrealized gain (loss) | | | $(363,244 | ) |
Net realized and unrealized gain (loss) | | | $(344,905 | ) |
Change in net assets from operations | | | $(114,948 | ) |
See Notes to Financial Statements
15
Financial Statements
STATEMENTS OF CHANGES IN NET ASSETS
These statements describe the increases and/or decreases in net assets resulting from operations, any distributions, and any shareholder transactions.
| | | | | | | | |
| Change in net assets | | Six months ended
2/29/20
(unaudited) | | | Year ended
8/31/19 | |
| | |
| From operations | | | | | | | | |
Net investment income (loss) | | | $229,957 | | | | $480,879 | |
Net realized gain (loss) | | | 18,339 | | | | (1,434,350 | ) |
Net unrealized gain (loss) | | | (363,244 | ) | | | (593,981 | ) |
Change in net assets from operations | | | $(114,948 | ) | | | $(1,547,452 | ) |
Total distributions to shareholders | | | $(465,097 | ) | | | $(1,004,056 | ) |
Change in net assets from fund share transactions | | | $12,143,245 | | | | $(681,729 | ) |
Total change in net assets | | | $11,563,200 | | | | $(3,233,237 | ) |
| | |
| Net assets | | | | | | | | |
At beginning of period | | | 20,675,388 | | | | 23,908,625 | |
At end of period | | | $32,238,588 | | | | $20,675,388 | |
See Notes to Financial Statements
16
Financial Statements
FINANCIAL HIGHLIGHTS
The financial highlights table is intended to help you understand the fund’s financial performance for the semiannual period and the past 5 fiscal years (or life of a particular share class, if shorter). Certain information reflects financial results for a single fund share. The total returns in the table represent the rate that an investor would have earned (or lost) on an investment in the fund share class (assuming reinvestment of all distributions) held for the entire period.
| | | | | | | | | | | | | | | | | | | | |
| | | Six months
ended
2/29/20 | | | Year ended | |
| Class A | | 8/31/19 | | | 8/31/18 | | | 8/31/17 | | | 8/31/16 (c) | |
| | | (unaudited) | | | | | | | | | | | | | |
Net asset value, beginning of period | | | $12.12 | | | | $13.66 | | | | $14.37 | | | | $11.37 | | | | $10.00 | |
| | |
| Income (loss) from investment operations | | | | | | | | | |
Net investment income (loss) (d) | | | $0.11 | | | | $0.25 | | | | $0.24 | | | | $0.28 | | | | $0.24 | |
Net realized and unrealized gain (loss) | | | 0.20 | | | | (1.20 | ) | | | (0.32 | ) | | | 2.86 | | | | 1.18 | |
Total from investment operations | | | $0.31 | | | | $(0.95 | ) | | | $(0.08 | ) | | | $3.14 | | | | $1.42 | |
| | |
| Less distributions declared to shareholders | | | | | | | | | |
From net investment income | | | $(0.20 | ) | | | $(0.22 | ) | | | $(0.16 | ) | | | $(0.06 | ) | | | $(0.04 | ) |
From net realized gain | | | — | | | | (0.37 | ) | | | (0.47 | ) | | | (0.08 | ) | | | (0.01 | ) |
Total distributions declared to shareholders | | | $(0.20 | ) | | | $(0.59 | ) | | | $(0.63 | ) | | | $(0.14 | ) | | | $(0.05 | ) |
Net asset value, end of period (x) | | | $12.23 | | | | $12.12 | | | | $13.66 | | | | $14.37 | | | | $11.37 | |
Total return (%) (r)(s)(t)(x) | | | 2.44 | (n) | | | (6.77 | ) | | | (0.77 | ) | | | 28.01 | | | | 14.33 | (n) |
| | |
Ratios (%) (to average net assets)
and Supplemental data: | | | | | | | | | |
Expenses before expense reductions (f) | | | 2.68 | (a) | | | 2.95 | | | | 2.94 | | | | 3.23 | | | | 6.30 | (a) |
Expenses after expense reductions (f) | | | 1.24 | (a) | | | 1.24 | | | | 1.23 | | | | 1.23 | | | | 1.24 | (a) |
Net investment income (loss) | | | 1.67 | (a) | | | 2.01 | | | | 1.65 | | | | 2.22 | | | | 2.36 | (a) |
Portfolio turnover | | | 27 | (n) | | | 64 | | | | 58 | | | | 92 | | | | 64 | (n) |
Net assets at end of period (000 omitted) | | | $5,379 | | | | $5,174 | | | | $7,145 | | | | $4,982 | | | | $957 | |
See Notes to Financial Statements
17
Financial Highlights – continued
| | | | | | | | | | | | | | | | | | | | |
| | | Six months
ended
2/29/20 | | | Year ended | |
| Class B | | 8/31/19 | | | 8/31/18 | | | 8/31/17 | | | 8/31/16 (c) | |
| | | (unaudited) | | | | | | | | | | | | | |
Net asset value, beginning of period | | | $11.99 | | | | $13.54 | | | | $14.27 | | | | $11.31 | | | | $10.00 | |
| | |
| Income (loss) from investment operations | | | | | | | | | |
Net investment income (loss) (d) | | | $0.06 | | | | $0.21 | | | | $0.12 | | | | $0.12 | | | | $0.09 | |
Net realized and unrealized gain (loss) | | | 0.21 | | | | (1.25 | ) | | | (0.30 | ) | | | 2.92 | | | | 1.25 | |
Total from investment operations | | | $0.27 | | | | $(1.04 | ) | | | $(0.18 | ) | | | $3.04 | | | | $1.34 | |
| | |
| Less distributions declared to shareholders | | | | | | | | | |
From net investment income | | | $(0.13 | ) | | | $(0.14 | ) | | | $(0.08 | ) | | | $(0.00 | )(w) | | | $(0.02 | ) |
From net realized gain | | | — | | | | (0.37 | ) | | | (0.47 | ) | | | (0.08 | ) | | | (0.01 | ) |
Total distributions declared to shareholders | | | $(0.13 | ) | | | $(0.51 | ) | | | $(0.55 | ) | | | $(0.08 | ) | | | $(0.03 | ) |
Net asset value, end of period (x) | | | $12.13 | | | | $11.99 | | | | $13.54 | | | | $14.27 | | | | $11.31 | |
Total return (%) (r)(s)(t)(x) | | | 2.15 | (n) | | | (7.51 | ) | | | (1.47 | ) | | | 27.09 | | | | 13.46 | (n) |
| | |
Ratios (%) (to average net assets)
and Supplemental data: | | | | | | | | | |
Expenses before expense reductions (f) | | | 3.45 | (a) | | | 3.70 | | | | 3.67 | | | | 4.04 | | | | 7.64 | (a) |
Expenses after expense reductions (f) | | | 1.99 | (a) | | | 1.99 | | | | 1.98 | | | | 1.99 | | | | 1.98 | (a) |
Net investment income (loss) | | | 0.95 | (a) | | | 1.63 | | | | 0.79 | | | | 0.97 | | | | 0.93 | (a) |
Portfolio turnover | | | 27 | (n) | | | 64 | | | | 58 | | | | 92 | | | | 64 | (n) |
Net assets at end of period (000 omitted) | | | $332 | | | | $391 | | | | $318 | | | | $213 | | | | $86 | |
| | |
| | | Six months
ended
2/29/20 | | | Year ended | |
| Class C | | 8/31/19 | | | 8/31/18 | | | 8/31/17 | | | 8/31/16 (c) | |
| | | (unaudited) | | | | | | | | | | | | | |
Net asset value, beginning of period | | | $11.95 | | | | $13.50 | | | | $14.23 | | | | $11.31 | | | | $10.00 | |
| | |
| Income (loss) from investment operations | | | | | | | | | |
Net investment income (loss) (d) | | | $0.06 | | | | $0.16 | | | | $0.11 | | | | $0.14 | | | | $0.09 | |
Net realized and unrealized gain (loss) | | | 0.20 | | | | (1.19 | ) | | | (0.29 | ) | | | 2.89 | | | | 1.25 | |
Total from investment operations | | | $0.26 | | | | $(1.03 | ) | | | $(0.18 | ) | | | $3.03 | | | | $1.34 | |
| | |
| Less distributions declared to shareholders | | | | | | | | | |
From net investment income | | | $(0.10 | ) | | | $(0.15 | ) | | | $(0.08 | ) | | | $(0.03 | ) | | | $(0.02 | ) |
From net realized gain | | | — | | | | (0.37 | ) | | | (0.47 | ) | | | (0.08 | ) | | | (0.01 | ) |
Total distributions declared to shareholders | | | $(0.10 | ) | | | $(0.52 | ) | | | $(0.55 | ) | | | $(0.11 | ) | | | $(0.03 | ) |
Net asset value, end of period (x) | | | $12.11 | | | | $11.95 | | | | $13.50 | | | | $14.23 | | | | $11.31 | |
Total return (%) (r)(s)(t)(x) | | | 2.13 | (n) | | | (7.51 | ) | | | (1.48 | ) | | | 27.06 | | | | 13.48 | (n) |
| | |
Ratios (%) (to average net assets)
and Supplemental data: | | | | | | | | | |
Expenses before expense reductions (f) | | | 3.45 | (a) | | | 3.70 | | | | 3.64 | | | | 4.02 | | | | 7.63 | (a) |
Expenses after expense reductions (f) | | | 1.99 | (a) | | | 1.99 | | | | 1.99 | | | | 1.99 | | | | 1.98 | (a) |
Net investment income (loss) | | | 0.97 | (a) | | | 1.31 | | | | 0.75 | | | | 1.16 | | | | 0.95 | (a) |
Portfolio turnover | | | 27 | (n) | | | 64 | | | | 58 | | | | 92 | | | | 64 | (n) |
Net assets at end of period (000 omitted) | | | $357 | | | | $420 | | | | $453 | | | | $438 | | | | $91 | |
See Notes to Financial Statements
18
Financial Highlights – continued
| | | | | | | | | | | | | | | | | | | | |
| | | Six months
ended
2/29/20 | | | Year ended | |
| Class I | | 8/31/19 | | | 8/31/18 | | | 8/31/17 | | | 8/31/16 (c) | |
| | | (unaudited) | | | | | | | | | | | | | |
Net asset value, beginning of period | | | $12.16 | | | | $13.71 | | | | $14.41 | | | | $11.38 | | | | $10.00 | |
| | |
| Income (loss) from investment operations | | | | | | | | | |
Net investment income (loss) (d) | | | $0.10 | | | | $0.29 | | | | $0.34 | | | | $0.28 | | | | $0.23 | |
Net realized and unrealized gain (loss) | | | 0.24 | | | | (1.22 | ) | | | (0.39 | ) | | | 2.91 | | | | 1.21 | |
Total from investment operations | | | $0.34 | | | | $(0.93 | ) | | | $(0.05 | ) | | | $3.19 | | | | $1.44 | |
| | |
| Less distributions declared to shareholders | | | | | | | | | |
From net investment income | | | $(0.25 | ) | | | $(0.25 | ) | | | $(0.18 | ) | | | $(0.08 | ) | | | $(0.05 | ) |
From net realized gain | | | — | | | | (0.37 | ) | | | (0.47 | ) | | | (0.08 | ) | | | (0.01 | ) |
Total distributions declared to shareholders | | | $(0.25 | ) | | | $(0.62 | ) | | | $(0.65 | ) | | | $(0.16 | ) | | | $(0.06 | ) |
Net asset value, end of period (x) | | | $12.25 | | | | $12.16 | | | | $13.71 | | | | $14.41 | | | | $11.38 | |
Total return (%) (r)(s)(t)(x) | | | 2.61 | (n) | | | (6.55 | ) | | | (0.55 | ) | | | 28.44 | | | | 14.51 | (n) |
| | |
Ratios (%) (to average net assets)
and Supplemental data: | | | | | | | | | |
Expenses before expense reductions (f) | | | 2.29 | (a) | | | 2.70 | | | | 2.78 | | | | 3.05 | | | | 6.27 | (a) |
Expenses after expense reductions (f) | | | 0.99 | (a) | | | 0.99 | | | | 0.99 | | | | 0.99 | | | | 0.99 | (a) |
Net investment income (loss) | | | 1.58 | (a) | | | 2.26 | | | | 2.30 | | | | 2.28 | | | | 2.27 | (a) |
Portfolio turnover | | | 27 | (n) | | | 64 | | | | 58 | | | | 92 | | | | 64 | (n) |
Net assets at end of period (000 omitted) | | | $12,218 | | | | $1,811 | | | | $2,343 | | | | $669 | | | | $436 | |
| | |
| | | Six months
ended
2/29/20 | | | Year ended | |
| Class R1 | | 8/31/19 | | | 8/31/18 | | | 8/31/17 | | | 8/31/16 (c) | |
| | | (unaudited) | | | | | | | | | | | | | |
Net asset value, beginning of period | | | $12.01 | | | | $13.57 | | | | $14.27 | | | | $11.31 | | | | $10.00 | |
| | |
| Income (loss) from investment operations | | | | | | | | | |
Net investment income (loss) (d) | | | $0.06 | | | | $0.17 | | | | $0.10 | | | | $0.11 | | | | $0.07 | |
Net realized and unrealized gain (loss) | | | 0.21 | | | | (1.20 | ) | | | (0.28 | ) | | | 2.93 | | | | 1.27 | |
Total from investment operations | | | $0.27 | | | | $(1.03 | ) | | | $(0.18 | ) | | | $3.04 | | | | $1.34 | |
| | |
| Less distributions declared to shareholders | | | | | | | | | |
From net investment income | | | $(0.12 | ) | | | $(0.16 | ) | | | $(0.05 | ) | | | $— | | | | $(0.02 | ) |
From net realized gain | | | — | | | | (0.37 | ) | | | (0.47 | ) | | | (0.08 | ) | | | (0.01 | ) |
Total distributions declared to shareholders | | | $(0.12 | ) | | | $(0.53 | ) | | | $(0.52 | ) | | | $(0.08 | ) | | | $(0.03 | ) |
Net asset value, end of period (x) | | | $12.16 | | | | $12.01 | | | | $13.57 | | | | $14.27 | | | | $11.31 | |
Total return (%) (r)(s)(t)(x) | | | 2.12 | (n) | | | (7.47 | ) | | | (1.49 | ) | | | 27.08 | | | | 13.46 | (n) |
| | |
Ratios (%) (to average net assets)
and Supplemental data: | | | | | | | | | |
Expenses before expense reductions (f) | | | 3.43 | (a) | | | 3.70 | | | | 3.64 | | | | 4.06 | | | | 7.86 | (a) |
Expenses after expense reductions (f) | | | 1.99 | (a) | | | 1.99 | | | | 1.99 | | | | 1.99 | | | | 1.97 | (a) |
Net investment income (loss) | | | 0.91 | (a) | | | 1.32 | | | | 0.70 | | | | 0.88 | | | | 0.69 | (a) |
Portfolio turnover | | | 27 | (n) | | | 64 | | | | 58 | | | | 92 | | | | 64 | (n) |
Net assets at end of period (000 omitted) | | | $67 | | | | $66 | | | | $71 | | | | $72 | | | | $57 | |
See Notes to Financial Statements
19
Financial Highlights – continued
| | | | | | | | | | | | | | | | | | | | |
| | | Six months
ended
2/29/20 | | | Year ended | |
| Class R2 | | 8/31/19 | | | 8/31/18 | | | 8/31/17 | | | 8/31/16 (c) | |
| | | (unaudited) | | | | | | | | | | | | | |
Net asset value, beginning of period | | | $12.11 | | | | $13.66 | | | | $14.36 | | | | $11.35 | | | | $10.00 | |
| | |
| Income (loss) from investment operations | | | | | | | | | |
Net investment income (loss) (d) | | | $0.09 | | | | $0.23 | | | | $0.18 | | | | $0.17 | | | | $0.12 | |
Net realized and unrealized gain (loss) | | | 0.21 | | | | (1.20 | ) | | | (0.30 | ) | | | 2.94 | | | | 1.28 | |
Total from investment operations | | | $0.30 | | | | $(0.97 | ) | | | $(0.12 | ) | | | $3.11 | | | | $1.40 | |
| | |
| Less distributions declared to shareholders | | | | | | | | | |
From net investment income | | | $(0.18 | ) | | | $(0.21 | ) | | | $(0.11 | ) | | | $(0.02 | ) | | | $(0.04 | ) |
From net realized gain | | | — | | | | (0.37 | ) | | | (0.47 | ) | | | (0.08 | ) | | | (0.01 | ) |
Total distributions declared to shareholders | | | $(0.18 | ) | | | $(0.58 | ) | | | $(0.58 | ) | | | $(0.10 | ) | | | $(0.05 | ) |
Net asset value, end of period (x) | | | $12.23 | | | | $12.11 | | | | $13.66 | | | | $14.36 | | | | $11.35 | |
Total return (%) (r)(s)(t)(x) | | | 2.32 | (n) | | | (6.97 | ) | | | (1.03 | ) | | | 27.71 | | | | 14.04 | (n) |
| | |
Ratios (%) (to average net assets)
and Supplemental data: | | | | | | | | | |
Expenses before expense reductions (f) | | | 2.93 | (a) | | | 3.20 | | | | 3.14 | | | | 3.56 | | | | 7.36 | (a) |
Expenses after expense reductions (f) | | | 1.49 | (a) | | | 1.49 | | | | 1.49 | | | | 1.49 | | | | 1.47 | (a) |
Net investment income (loss) | | | 1.42 | (a) | | | 1.82 | | | | 1.20 | | | | 1.38 | | | | 1.19 | (a) |
Portfolio turnover | | | 27 | (n) | | | 64 | | | | 58 | | | | 92 | | | | 64 | (n) |
Net assets at end of period (000 omitted) | | | $69 | | | | $67 | | | | $72 | | | | $73 | | | | $57 | |
| | |
| | | Six months
ended
2/29/20 | | | Year ended | |
| Class R3 | | 8/31/19 | | | 8/31/18 | | | 8/31/17 | | | 8/31/16 (c) | |
| | | (unaudited) | | | | | | | | | | | | | |
Net asset value, beginning of period | | | $12.14 | | | | $13.69 | | | | $14.39 | | | | $11.37 | | | | $10.00 | |
| | |
| Income (loss) from investment operations | | | | | | | | | |
Net investment income (loss) (d) | | | $0.08 | | | | $0.24 | | | | $0.24 | | | | $0.20 | | | | $0.14 | |
Net realized and unrealized gain (loss) | | | 0.23 | | | | (1.19 | ) | | | (0.32 | ) | | | 2.95 | | | | 1.28 | |
Total from investment operations | | | $0.31 | | | | $(0.95 | ) | | | $(0.08 | ) | | | $3.15 | | | | $1.42 | |
| | |
| Less distributions declared to shareholders | | | | | | | | | |
From net investment income | | | $(0.20 | ) | | | $(0.23 | ) | | | $(0.15 | ) | | | $(0.05 | ) | | | $(0.04 | ) |
From net realized gain | | | — | | | | (0.37 | ) | | | (0.47 | ) | | | (0.08 | ) | | | (0.01 | ) |
Total distributions declared to shareholders | | | $(0.20 | ) | | | $(0.60 | ) | | | $(0.62 | ) | | | $(0.13 | ) | | | $(0.05 | ) |
Net asset value, end of period (x) | | | $12.25 | | | | $12.14 | | | | $13.69 | | | | $14.39 | | | | $11.37 | |
Total return (%) (r)(s)(t)(x) | | | 2.42 | (n) | | | (6.75 | ) | | | (0.80 | ) | | | 28.05 | | | | 14.32 | (n) |
| | |
Ratios (%) (to average net assets)
and Supplemental data: | | | | | | | | | |
Expenses before expense reductions (f) | | | 2.70 | (a) | | | 2.95 | | | | 2.94 | | | | 3.31 | | | | 7.11 | (a) |
Expenses after expense reductions (f) | | | 1.24 | (a) | | | 1.24 | | | | 1.24 | | | | 1.24 | | | | 1.22 | (a) |
Net investment income (loss) | | | 1.24 | (a) | | | 1.89 | | | | 1.66 | | | | 1.63 | | | | 1.44 | (a) |
Portfolio turnover | | | 27 | (n) | | | 64 | | | | 58 | | | | 92 | | | | 64 | (n) |
Net assets at end of period (000 omitted) | | | $74 | | | | $71 | | | | $102 | | | | $73 | | | | $57 | |
See Notes to Financial Statements
20
Financial Highlights – continued
| | | | | | | | | | | | | | | | | | | | |
| | | Six months
ended
2/29/20 | | | Year ended | |
| Class R4 | | 8/31/19 | | | 8/31/18 | | | 8/31/17 | | | 8/31/16 (c) | |
| | | (unaudited) | | | | | | | | | | | | | |
Net asset value, beginning of period | | | $12.17 | | | | $13.72 | | | | $14.41 | | | | $11.38 | | | | $10.00 | |
| | |
| Income (loss) from investment operations | | | | | | | | | |
Net investment income (loss) (d) | | | $0.12 | | | | $0.30 | | | | $0.26 | | | | $0.23 | | | | $0.17 | |
Net realized and unrealized gain (loss) | | | 0.22 | | | | (1.23 | ) | | | (0.30 | ) | | | 2.96 | | | | 1.27 | |
Total from investment operations | | | $0.34 | | | | $(0.93 | ) | | | $(0.04 | ) | | | $3.19 | | | | $1.44 | |
| | |
| Less distributions declared to shareholders | | | | | | | | | |
From net investment income | | | $(0.24 | ) | | | $(0.25 | ) | | | $(0.18 | ) | | | $(0.08 | ) | | | $(0.05 | ) |
From net realized gain | | | — | | | | (0.37 | ) | | | (0.47 | ) | | | (0.08 | ) | | | (0.01 | ) |
Total distributions declared to shareholders | | | $(0.24 | ) | | | $(0.62 | ) | | | $(0.65 | ) | | | $(0.16 | ) | | | $(0.06 | ) |
Net asset value, end of period (x) | | | $12.27 | | | | $12.17 | | | | $13.72 | | | | $14.41 | | | | $11.38 | |
Total return (%) (r)(s)(t)(x) | | | 2.62 | (n) | | | (6.55 | ) | | | (0.50 | ) | | | 28.42 | | | | 14.51 | (n) |
| | |
Ratios (%) (to average net assets)
and Supplemental data: | | | | | | | | | |
Expenses before expense reductions (f) | | | 2.43 | (a) | | | 2.70 | | | | 2.66 | | | | 3.06 | | | | 6.86 | (a) |
Expenses after expense reductions (f) | | | 0.99 | (a) | | | 0.99 | | | | 0.99 | | | | 0.99 | | | | 0.97 | (a) |
Net investment income (loss) | | | 1.91 | (a) | | | 2.36 | | | | 1.76 | | | | 1.89 | | | | 1.69 | (a) |
Portfolio turnover | | | 27 | (n) | | | 64 | | | | 58 | | | | 92 | | | | 64 | (n) |
Net assets at end of period (000 omitted) | | | $90 | | | | $85 | | | | $82 | | | | $74 | | | | $57 | |
| | |
| | | Six months
ended
2/29/20 | | | Year ended | |
| Class R6 | | 8/31/19 | | | 8/31/18 | | | 8/31/17 | | | 8/31/16 (c) | |
| | | (unaudited) | | | | | | | | | | | | | |
Net asset value, beginning of period | | | $12.19 | | | | $13.73 | | | | $14.42 | | | | $11.39 | | | | $10.00 | |
| | |
| Income (loss) from investment operations | | | | | | | | | |
Net investment income (loss) (d) | | | $0.13 | | | | $0.31 | | | | $0.27 | | | | $0.24 | | | | $0.16 | |
Net realized and unrealized gain (loss) | | | 0.22 | | | | (1.22 | ) | | | (0.30 | ) | | | 2.95 | | | | 1.29 | |
Total from investment operations | | | $0.35 | | | | $(0.91 | ) | | | $(0.03 | ) | | | $3.19 | | | | $1.45 | |
| | |
| Less distributions declared to shareholders | | | | | | | | | |
From net investment income | | | $(0.26 | ) | | | $(0.26 | ) | | | $(0.19 | ) | | | $(0.08 | ) | | | $(0.05 | ) |
From net realized gain | | | — | | | | (0.37 | ) | | | (0.47 | ) | | | (0.08 | ) | | | (0.01 | ) |
Total distributions declared to shareholders | | | $(0.26 | ) | | | $(0.63 | ) | | | $(0.66 | ) | | | $(0.16 | ) | | | $(0.06 | ) |
Net asset value, end of period (x) | | | $12.28 | | | | $12.19 | | | | $13.73 | | | | $14.42 | | | | $11.39 | |
Total return (%) (r)(s)(t)(x) | | | 2.65 | (n) | | | (6.40 | ) | | | (0.42 | ) | | | 28.45 | | | | 14.62 | (n) |
| | |
Ratios (%) (to average net assets)
and Supplemental data: | | | | | | | | | |
Expenses before expense reductions (f) | | | 2.33 | (a) | | | 2.58 | | | | 2.56 | | | | 2.98 | | | | 6.84 | (a) |
Expenses after expense reductions (f) | | | 0.89 | (a) | | | 0.87 | | | | 0.90 | | | | 0.91 | | | | 0.94 | (a) |
Net investment income (loss) | | | 2.02 | (a) | | | 2.44 | | | | 1.81 | | | | 1.97 | | | | 1.59 | (a) |
Portfolio turnover | | | 27 | (n) | | | 64 | | | | 58 | | | | 92 | | | | 64 | (n) |
Net assets at end of period (000 omitted) | | | $13,653 | | | | $12,590 | | | | $13,322 | | | | $12,127 | | | | $12,031 | |
See Notes to Financial Statements
21
Financial Highlights – continued
| (c) | For the period from the commencement of the fund’s investment operations, September 15, 2015, through the stated period end. |
| (d) | Per share data is based on average shares outstanding. |
| (f) | Ratios do not reflect reductions from fees paid indirectly, if applicable. |
| (r) | Certain expenses have been reduced without which performance would have been lower. |
| (s) | From time to time the fund may receive proceeds from litigation settlements, without which performance would be lower. |
| (t) | Total returns do not include any applicable sales charges. |
| (w) | Per share amount was less than $0.01. |
| (x) | The net asset values and total returns have been calculated on net assets which include adjustments made in accordance with U.S. generally accepted accounting principles required at period end for financial reporting purposes. |
See Notes to Financial Statements
22
NOTES TO FINANCIAL STATEMENTS
(unaudited)
(1) Business and Organization
MFS Blended Research Emerging Markets Equity Fund (the fund) is a diversified series of MFS Series Trust IV (the trust). The trust is organized as a Massachusetts business trust and is registered under the Investment Company Act of 1940, as amended, as anopen-end management investment company.
The fund is an investment company and accordingly follows the investment company accounting and reporting guidance of the Financial Accounting Standards Board (FASB) Accounting Standards Codification Topic 946 Financial Services – Investment Companies.
(2) Significant Accounting Policies
General– The preparation of financial statements in conformity with U.S. generally accepted accounting principles requires management to make estimates and assumptions that affect the reported amounts of assets and liabilities, and disclosure of contingent assets and liabilities at the date of the financial statements and the reported amounts of increases and decreases in net assets from operations during the reporting period. Actual results could differ from those estimates. In the preparation of these financial statements, management has evaluated subsequent events occurring after the date of the fund’s Statement of Assets and Liabilities through the date that the financial statements were issued. The fund invests in foreign securities, including securities of emerging market issuers. Investments in foreign securities are vulnerable to the effects of changes in the relative values of the local currency and the U.S. dollar and to the effects of changes in each country’s market, economic, industrial, political, regulatory, geopolitical, and other conditions. Investments in emerging markets can involve additional and greater risks than the risks associated with investments in developed foreign markets. Emerging markets can have less developed markets, greater custody and operational risk, less developed legal, regulatory, and accounting systems, and greater political, social, and economic instability than developed markets.
In March 2020, the FASB issued Accounting Standards Update2020-04, Reference Rate Reform (Topic 848) – Facilitation of the Effects of Reference Rate Reform on Financial Reporting (“ASU2020-04”), which provides optional, temporary relief with respect to the financial reporting of contracts subject to certain types of modifications due to the planned discontinuation of the London Interbank Offered Rate (LIBOR) and other IBOR-based reference rates as of the end of 2021. The temporary relief provided by ASU2020-04 is effective for certain reference rate-related contract modifications that occur during the period from March 12, 2020 through December 31, 2022. Management is evaluating the impact of ASU2020-04 on the fund’s investments, derivatives, debt and other contracts that will undergo reference rate-related modifications as a result of the reference rate reform.
Balance Sheet Offsetting– The fund’s accounting policy with respect to balance sheet offsetting is that, absent an event of default by the counterparty or a termination of the agreement, the International Swaps and Derivatives Association (ISDA) Master Agreement, or similar agreement, does not result in an offset of reported amounts of financial assets and financial liabilities in the Statement of Assets and Liabilities across transactions between the fund and the applicable counterparty. The fund’s right to
23
Notes to Financial Statements (unaudited) – continued
setoff may be restricted or prohibited by the bankruptcy or insolvency laws of the particular jurisdiction to which a specific master netting agreement counterparty is subject. Balance sheet offsetting disclosures, to the extent applicable to the fund, have been included in the fund’s Significant Accounting Policies note under the captions for each of the fund’sin-scope financial instruments and transactions.
Investment Valuations– Equity securities, including restricted equity securities, are generally valued at the last sale or official closing price on their primary market or exchange as provided by a third-party pricing service. Equity securities, for which there were no sales reported that day, are generally valued at the last quoted daily bid quotation on their primary market or exchange as provided by a third-party pricing service. Short-term instruments with a maturity at issuance of 60 days or less may be valued at amortized cost, which approximates market value.Open-end investment companies are generally valued at net asset value per share. Securities and other assets generally valued on the basis of information from a third-party pricing service may also be valued at a broker/dealer bid quotation. In determining values, third-party pricing services can utilize both transaction data and market information such as yield, quality, coupon rate, maturity, type of issue, trading characteristics, and other market data. The values of foreign securities and other assets and liabilities expressed in foreign currencies are converted to U.S. dollars using the mean of bid and asked prices for rates provided by a third-party pricing service.
The Board of Trustees has delegated primary responsibility for determining or causing to be determined the value of the fund’s investments (including any fair valuation) to the adviser pursuant to valuation policies and procedures approved by the Board. If the adviser determines that reliable market quotations are not readily available, investments are valued at fair value as determined in good faith by the adviser in accordance with such procedures under the oversight of the Board of Trustees. Under the fund’s valuation policies and procedures, market quotations are not considered to be readily available for most types of debt instruments and floating rate loans and many types of derivatives. These investments are generally valued at fair value based on information from third-party pricing services. In addition, investments may be valued at fair value if the adviser determines that an investment’s value has been materially affected by events occurring after the close of the exchange or market on which the investment is principally traded (such as foreign exchange or market) and prior to the determination of the fund’s net asset value, or after the halt of trading of a specific security where trading does not resume prior to the close of the exchange or market on which the security is principally traded. Events that occur after foreign markets close (such as developments in foreign markets and significant movements in the U.S. markets) and prior to the determination of the fund’s net asset value may be deemed to have a material effect on the value of securities traded in foreign markets. Accordingly, the fund’s foreign equity securities may often be valued at fair value. The adviser generally relies on third-party pricing services or other information (such as the correlation with price movements of similar securities in the same or other markets; the type, cost and investment characteristics of the security; the business and financial condition of the issuer; and trading and other market data) to assist in determining whether to fair value and at what value to fair value an investment. The value of an investment for purposes of calculating the fund’s net asset value can differ depending on the source
24
Notes to Financial Statements (unaudited) – continued
and method used to determine value. When fair valuation is used, the value of an investment used to determine the fund’s net asset value may differ from quoted or published prices for the same investment. There can be no assurance that the fund could obtain the fair value assigned to an investment if it were to sell the investment at the same time at which the fund determines its net asset value per share.
Various inputs are used in determining the value of the fund’s assets or liabilities. These inputs are categorized into three broad levels. In certain cases, the inputs used to measure fair value may fall into different levels of the fair value hierarchy. In such cases, an investment’s level within the fair value hierarchy is based on the lowest level of input that is significant to the fair value measurement. The fund’s assessment of the significance of a particular input to the fair value measurement in its entirety requires judgment, and considers factors specific to the investment. Level 1 includes unadjusted quoted prices in active markets for identical assets or liabilities. Level 2 includes other significant observable market-based inputs (including quoted prices for similar securities, interest rates, prepayment speed, and credit risk). Level 3 includes unobservable inputs, which may include the adviser’s own assumptions in determining the fair value of investments. The following is a summary of the levels used as of February 29, 2020 in valuing the fund’s assets or liabilities:
| | | | | | | | | | | | | | | | |
| | | | |
| Financial Instruments | | Level 1 | | | Level 2 | | | Level 3 | | | Total | |
| Equity Securities: | | | | | | | | | | | | | | | | |
China | | | $2,841,160 | | | | $8,018,485 | | | | $— | | | | $10,859,645 | |
South Korea | | | 720,967 | | | | 3,454,040 | | | | — | | | | 4,175,007 | |
Taiwan | | | — | | | | 2,871,732 | | | | — | | | | 2,871,732 | |
India | | | 1,134,165 | | | | 1,440,744 | | | | — | | | | 2,574,909 | |
Brazil | | | 2,519,562 | | | | — | | | | — | | | | 2,519,562 | |
Russia | | | 58,874 | | | | 1,474,107 | | | | — | | | | 1,532,981 | |
South Africa | | | 88,444 | | | | 1,121,549 | | | | — | | | | 1,209,993 | |
Thailand | | | 342,697 | | | | 655,820 | | | | — | | | | 998,517 | |
Mexico | | | 873,059 | | | | — | | | | — | | | | 873,059 | |
Other Countries | | | 1,977,388 | | | | 1,749,443 | | | | — | | | | 3,726,831 | |
| Mutual Funds | | | 4,569,685 | | | | — | | | | — | | | | 4,569,685 | |
| Total | | | $15,126,001 | | | | $20,785,920 | | | | $— | | | | $35,911,921 | |
For further information regarding security characteristics, see the Portfolio of Investments.
Foreign Currency Translation– Purchases and sales of foreign investments, income, and expenses are converted into U.S. dollars based upon currency exchange rates prevailing on the respective dates of such transactions or on the reporting date for foreign denominated receivables and payables. Gains and losses attributable to foreign currency exchange rates on sales of securities are recorded for financial statement purposes as net realized gains and losses on investments. Gains and losses attributable to foreign exchange rate movements on receivables, payables, income and expenses are recorded for financial statement purposes as foreign currency transaction gains and losses. That portion of both realized and unrealized gains and losses on investments that results from fluctuations in foreign currency exchange rates is not separately disclosed.
25
Notes to Financial Statements (unaudited) – continued
Indemnifications– Under the fund’s organizational documents, its officers and Trustees may be indemnified against certain liabilities and expenses arising out of the performance of their duties to the fund. Additionally, in the normal course of business, the fund enters into agreements with service providers that may contain indemnification clauses. The fund’s maximum exposure under these agreements is unknown as this would involve future claims that may be made against the fund that have not yet occurred.
Investment Transactions and Income– Investment transactions are recorded on the trade date. Dividends received in cash are recorded on theex-dividend date. Certain dividends from foreign securities will be recorded when the fund is informed of the dividend if such information is obtained subsequent to theex-dividend date. Dividend payments received in additional securities are recorded on theex-dividend date in an amount equal to the value of the security on such date.
The fund may receive proceeds from litigation settlements. Any proceeds received from litigation involving portfolio holdings are reflected in the Statement of Operations in realized gain/loss if the security has been disposed of by the fund or in unrealized gain/loss if the security is still held by the fund. Any other proceeds from litigation not related to portfolio holdings are reflected as other income in the Statement of Operations.
Tax Matters and Distributions– The fund intends to qualify as a regulated investment company, as defined under Subchapter M of the Internal Revenue Code, and to distribute all of its taxable income, including realized capital gains. As a result, no provision for federal income tax is required. The fund’s federal tax returns, when filed, will remain subject to examination by the Internal Revenue Service for a three year period. Management has analyzed the fund’s tax positions taken on federal and state tax returns for all open tax years and does not believe that there are any uncertain tax positions that require recognition of a tax liability. Foreign taxes, if any, have been accrued by the fund in the accompanying financial statements in accordance with the applicable foreign tax law. Foreign income taxes may be withheld by certain countries in which the fund invests. Additionally, capital gains realized by the fund on securities issued in or by certain foreign countries may be subject to capital gains tax imposed by those countries.
Distributions to shareholders are recorded on theex-dividend date. Income and capital gain distributions are determined in accordance with income tax regulations, which may differ from U.S. generally accepted accounting principles. Certain capital accounts in the financial statements are periodically adjusted for permanent differences in order to reflect their tax character. These adjustments have no impact on net assets or net asset value per share. Temporary differences which arise from recognizing certain items of income, expense, gain or loss in different periods for financial statement and tax purposes will reverse at some time in the future.
Book/tax differences primarily relate to wash sale loss deferrals.
26
Notes to Financial Statements (unaudited) – continued
The tax character of distributions made during the current period will be determined at fiscal year end. The tax character of distributions declared to shareholders for the last fiscal year is as follows:
| | | | |
| |
| | | Year ended
8/31/19 | |
Ordinary income (including any
short-term capital gains) | | | $567,687 | |
| Long-term capital gains | | | 436,369 | |
| |
| Total distributions | | | $1,004,056 | |
The federal tax cost and the tax basis components of distributable earnings were as follows:
| | | | |
| |
| As of 2/29/20 | | | |
| |
| Cost of investments | | | $35,386,007 | |
| Gross appreciation | | | 3,026,991 | |
| |
| Gross depreciation | | | (2,501,077 | ) |
| Net unrealized appreciation (depreciation) | | | $525,914 | |
| |
| As of 8/31/19 | | | |
| |
| Undistributed ordinary income | | | 464,405 | |
| Capital loss carryforwards | | | (1,349,233 | ) |
| Other temporary differences | | | (7,144 | ) |
| Net unrealized appreciation (depreciation) | | | 883,600 | |
The aggregate cost above includes prior fiscal year end tax adjustments, if applicable.
As of August 31, 2019, the fund had capital loss carryforwards available to offset future realized gains. These net capital losses may be carried forward indefinitely and their character is retained as short-term and/or long-term losses. Such losses are characterized as follows:
| | | | |
| Short-Term | | | $(1,169,999 | ) |
| Long-Term | | | (179,234 | ) |
| Total | | | $(1,349,233 | ) |
Multiple Classes of Shares of Beneficial Interest– The fund offers multiple classes of shares, which differ in their respective distribution and service fees. The fund’s income, realized and unrealized gain (loss), and common expenses are allocated to shareholders based on the daily net assets of each class. Dividends are declared separately for each class. Differences in per share dividend rates are generally due to differences in separate class expenses. Class B shares will convert to Class A shares approximately eight years after purchase. Class C shares will convert to Class A shares
27
Notes to Financial Statements (unaudited) – continued
approximately ten years after purchase. The fund’s distributions declared to shareholders as reported in the Statements of Changes in Net Assets are presented by class as follows:
| | | | | | | | |
| | |
| | | Six months
ended
2/29/20 | | | Year
ended
8/31/19 | |
| Class A | | | $83,064 | | | | $263,367 | |
| Class B | | | 3,860 | | | | 10,175 | |
| Class C | | | 3,499 | | | | 21,350 | |
| Class I | | | 103,204 | | | | 93,192 | |
| Class R1 | | | 633 | | | | 2,759 | |
| Class R2 | | | 982 | | | | 3,037 | |
| Class R3 | | | 1,187 | | | | 4,513 | |
| Class R4 | | | 1,710 | | | | 3,787 | |
| Class R6 | | | 266,958 | | | | 601,876 | |
| Total | | | $465,097 | | | | $1,004,056 | |
(3) Transactions with Affiliates
Investment Adviser– The fund has an investment advisory agreement with MFS to provide overall investment management and related administrative services and facilities to the fund. The management fee is computed daily and paid monthly at the following annual rates based on the fund’s average daily net assets:
| | | | |
| Up to $1 billion | | | 0.75 | % |
| In excess of $1 billion and up to $2.5 billion | | | 0.70 | % |
| In excess of $2.5 billion | | | 0.675 | % |
MFS has agreed in writing to reduce its management fee by a specified amount if certain MFS mutual fund assets exceed thresholds agreed to by MFS and the fund’s Board of Trustees. For the six months ended February 29, 2020, this management fee reduction amounted to $1,287, which is included in the reduction of total expenses in the Statement of Operations. The management fee incurred for the six months ended February 29, 2020 was equivalent to an annual effective rate of 0.74% of the fund’s average daily net assets.
The investment adviser has agreed in writing to pay a portion of the fund’s total annual operating expenses, excluding interest, taxes, extraordinary expenses, brokerage and transaction costs, and investment-related expenses, such that total fund operating expenses do not exceed the following rates annually of each class’s average daily net assets:
| | | | | | | | | | | | | | | | | | | | | | | | | | | | | | | | |
| Classes | |
| | | | | | | | |
| A | | B | | | C | | | I | | | R1 | | | R2 | | | R3 | | | R4 | | | R6 | |
| 1.24% | | | 1.99% | | | | 1.99% | | | | 0.99% | | | | 1.99% | | | | 1.49% | | | | 1.24% | | | | 0.99% | | | | 0.95% | |
This written agreement will continue until modified by the fund’s Board of Trustees, but such agreement will continue at least until December 31, 2020. For the six months ended February 29, 2020, this reduction amounted to $177,372, which is included in the reduction of total expenses in the Statement of Operations.
28
Notes to Financial Statements (unaudited) – continued
Distributor– MFS Fund Distributors, Inc. (MFD), a wholly-owned subsidiary of MFS, as distributor, received $363 for the six months ended February 29, 2020, as its portion of the initial sales charge on sales of Class A shares of the fund.
The Board of Trustees has adopted a distribution plan for certain share classes pursuant to Rule12b-1 of the Investment Company Act of 1940.
The fund’s distribution plan provides that the fund will pay MFD for services provided by MFD and financial intermediaries in connection with the distribution and servicing of certain share classes. One component of the plan is a distribution fee paid to MFD and another component of the plan is a service fee paid to MFD. MFD may subsequently pay all, or a portion, of the distribution and/or service fees to financial intermediaries.
Distribution Plan Fee Table:
| | | | | | | | | | | | | | | | | | | | |
| | | | | |
| | | Distribution
Fee Rate (d) | | | Service
Fee Rate (d) | | | Total
Distribution
Plan (d) | | | Annual
Effective
Rate (e) | | | Distribution
and Service
Fee | |
| Class A | | | — | | | | 0.25% | | | | 0.25% | | | | 0.25% | | | | $7,030 | |
| Class B | | | 0.75% | | | | 0.25% | | | | 1.00% | | | | 1.00% | | | | 1,961 | |
| Class C | | | 0.75% | | | | 0.25% | | | | 1.00% | | | | 1.00% | | | | 2,082 | |
| Class R1 | | | 0.75% | | | | 0.25% | | | | 1.00% | | | | 1.00% | | | | 352 | |
| Class R2 | | | 0.25% | | | | 0.25% | | | | 0.50% | | | | 0.50% | | | | 180 | |
| Class R3 | | | — | | | | 0.25% | | | | 0.25% | | | | 0.25% | | | | 121 | |
| Total Distribution and Service Fees | | | | | | | | | | | | $11,726 | |
| (d) | In accordance with the distribution plan for certain classes, the fund pays distribution and/or service fees equal to these annual percentage rates of each class’s average daily net assets. The distribution and service fee rates disclosed by class represent the current rates in effect at the end of the reporting period. Any rate changes, if applicable, are detailed below. |
| (e) | The annual effective rates represent actual fees incurred under the distribution plan for the six months ended February 29, 2020 based on each class’s average daily net assets. MFD has voluntarily agreed to rebate a portion of each class’s 0.25% service fee attributable to accounts for which MFD retains the 0.25% service fee except for accounts attributable to MFS or its affiliates’ seed money. For the six months ended February 29, 2020, this rebate amounted to $74 and $1 for Class A and Class C, respectively, and is included in the reduction of total expenses in the Statement of Operations. |
Certain Class A shares are subject to a contingent deferred sales charge (CDSC) in the event of a shareholder redemption within 18 months of purchase. Class B shares are subject to a CDSC in the event of a shareholder redemption within six years of purchase. Class C shares are subject to a CDSC in the event of a shareholder redemption within 12 months of purchase. All contingent deferred sales charges are paid to MFD and during the six months ended February 29, 2020, were as follows:
| | | | |
| |
| | | Amount | |
| Class A | | | $42 | |
| Class B | | | 1,312 | |
| Class C | | | — | |
Shareholder Servicing Agent– MFS Service Center, Inc. (MFSC), a wholly-owned subsidiary of MFS, receives a fee from the fund for its services as shareholder servicing agent calculated as a percentage of the average daily net assets of the fund as determined periodically under the supervision of the fund’s Board of Trustees. For the six months ended February 29, 2020, the fee was $1,964, which equated to 0.0155%
29
Notes to Financial Statements (unaudited) – continued
annually of the fund’s average daily net assets. MFSC also receives payment from the fund forout-of-pocket expenses,sub-accounting and other shareholder servicing costs which may be paid to affiliated and unaffiliated service providers. Class R6 shares do not incursub-accounting fees. For the six months ended February 29, 2020, theseout-of-pocket expenses,sub-accounting and other shareholder servicing costs amounted to $7,452.
Administrator– MFS provides certain financial, legal, shareholder communications, compliance, and other administrative services to the fund. Under an administrative services agreement, the fund reimburses MFS the costs incurred to provide these
services. The fund is charged an annual fixed amount of $17,500 plus a fee based on average daily net assets. The administrative services fee incurred for the six months ended February 29, 2020 was equivalent to an annual effective rate of 0.0687% of the fund’s average daily net assets.
Trustees’ and Officers’ Compensation– The fund pays compensation to independent Trustees in the form of a retainer, attendance fees, and additional compensation to Board and Committee chairpersons. The fund does not pay compensation directly to Trustees or officers of the fund who are also officers of the investment adviser, all of whom receive remuneration from MFS for their services to the fund. Certain officers and Trustees of the fund are officers or directors of MFS, MFD, and MFSC.
Other –The fund invests in the MFS Institutional Money Market Portfolio which is managed by MFS and seeks current income consistent with preservation of capital and liquidity. This money market fund does not pay a management fee to MFS but does incur investment and operating costs.
On December 14, 2018, MFS redeemed 5,332 shares of Class I for an aggregate amount of $65,906.
At February 29, 2020, MFS held approximately 93% of the outstanding shares of Class R3, approximately 78% of the outstanding shares of Class R4, and 100% of the outstanding shares of Class R1 and Class R2, respectively.
The fund is permitted to engage in purchase and sale transactions with funds and accounts for which MFS serves as investment adviser orsub-adviser (“cross-trades”) pursuant to a policy adopted by the Board of Trustees. This policy has been designed to ensure that cross-trades conducted by the fund comply with Rule17a-7 under the Investment Company Act of 1940. During the six months ended February 29, 2020, the fund engaged in sale transactions pursuant to this policy, which amounted to $6,515. The sales transactions resulted in net realized gains (losses) of $(751).
The adviser has voluntarily undertaken to reimburse the fund from its own resources on a quarterly basis for the cost of investment research embedded in the cost of the fund’s securities trades. This agreement may be rescinded at any time. For the six months ended February 29, 2020, this reimbursement amounted to $3,417, which is included in “Other” income in the Statement of Operations.
(4) Portfolio Securities
For the six months ended February 29, 2020, purchases and sales of investments, other than short-term obligations, aggregated $17,984,463 and $6,693,308, respectively.
30
Notes to Financial Statements (unaudited) – continued
(5) Shares of Beneficial Interest
The fund’s Declaration of Trust permits the Trustees to issue an unlimited number of full and fractional shares of beneficial interest. Transactions in fund shares were as follows:
| | | | | | | | | | | | | | | | |
| | | Six months ended
2/29/20 | | | Year ended
8/31/19 | |
| | | | |
| | | Shares | | | Amount | | | Shares | | | Amount | |
| Shares sold | | | | | | | | | | | | | | | | |
Class A | | | 66,832 | | | | $893,787 | | | | 109,033 | | | | $1,365,317 | |
Class B | | | — | | | | — | | | | 21,468 | | | | 271,754 | |
Class C | | | 6,716 | | | | 81,116 | | | | 13,979 | | | | 174,602 | |
Class I | | | 855,864 | | | | 11,139,732 | | | | 112,407 | | | | 1,483,863 | |
Class R3 | | | 10,202 | | | | 134,152 | | | | 696 | | | | 8,589 | |
Class R4 | | | 250 | | | | 3,282 | | | | 680 | | | | 8,550 | |
Class R6 | | | 166,434 | | | | 2,176,402 | | | | 327,609 | | | | 4,157,491 | |
| | | 1,106,298 | | | | $14,428,471 | | | | 585,872 | | | | $7,470,166 | |
| | | | |
| Shares issued to shareholders in reinvestment of distributions | | | | | | | | | | | | | | | | |
Class A | | | 6,053 | | | | $81,347 | | | | 22,471 | | | | $261,568 | |
Class B | | | 289 | | | | 3,860 | | | | 879 | | | | 10,175 | |
Class C | | | 262 | | | | 3,499 | | | | 1,853 | | | | 21,350 | |
Class I | | | 6,268 | | | | 84,300 | | | | 7,754 | | | | 90,446 | |
Class R1 | | | 47 | | | | 633 | | | | 238 | | | | 2,759 | |
Class R2 | | | 73 | | | | 982 | | | | 260 | | | | 3,037 | |
Class R3 | | | 88 | | | | 1,187 | | | | 387 | | | | 4,513 | |
Class R4 | | | 127 | | | | 1,710 | | | | 324 | | | | 3,787 | |
Class R6 | | | 19,804 | | | | 266,958 | | | | 51,575 | | | | 601,876 | |
| | | 33,011 | | | | $444,476 | | | | 85,741 | | | | $999,511 | |
| | | | |
| Shares reacquired | | | | | | | | | | | | | | | | |
Class A | | | (60,097 | ) | | | $(783,854 | ) | | | (227,589 | ) | | | $(2,900,829 | ) |
Class B | | | (5,538 | ) | | | (72,346 | ) | | | (13,226 | ) | | | (166,596 | ) |
Class C | | | (12,646 | ) | | | (159,428 | ) | | | (14,267 | ) | | | (173,013 | ) |
Class I | | | (13,406 | ) | | | (174,106 | ) | | | (142,109 | ) | | | (1,825,448 | ) |
Class R3 | | | (10,026 | ) | | | (128,530 | ) | | | (2,698 | ) | | | (34,133 | ) |
Class R4 | | | (53 | ) | | | (712 | ) | | | (14 | ) | | | (178 | ) |
Class R6 | | | (107,134 | ) | | | (1,410,726 | ) | | | (316,338 | ) | | | (4,051,209 | ) |
| | | (208,900 | ) | | | $(2,729,702 | ) | | | (716,241 | ) | | | $(9,151,406 | ) |
31
Notes to Financial Statements (unaudited) – continued
| | | | | | | | | | | | | | | | |
| | | Six months ended
2/29/20 | | | Year ended
8/31/19 | |
| | | | |
| | | Shares | | | Amount | | | Shares | | | Amount | |
| Net change | | | | | | | | | | | | | | | | |
Class A | | | 12,788 | | | | $191,280 | | | | (96,085 | ) | | | $(1,273,944 | ) |
Class B | | | (5,249 | ) | | | (68,486 | ) | | | 9,121 | | | | 115,333 | |
Class C | | | (5,668 | ) | | | (74,813 | ) | | | 1,565 | | | | 22,939 | |
Class I | | | 848,726 | | | | 11,049,926 | | | | (21,948 | ) | | | (251,139 | ) |
Class R1 | | | 47 | | | | 633 | | | | 238 | | | | 2,759 | |
Class R2 | | | 73 | | | | 982 | | | | 260 | | | | 3,037 | |
Class R3 | | | 264 | | | | 6,809 | | | | (1,615 | ) | | | (21,031 | ) |
Class R4 | | | 324 | | | | 4,280 | | | | 990 | | | | 12,159 | |
Class R6 | | | 79,104 | | | | 1,032,634 | | | | 62,846 | | | | 708,158 | |
| | | 930,409 | | | | $12,143,245 | | | | (44,628 | ) | | | $(681,729 | ) |
Class T shares were not publicly available for sale during the period. Please see the fund’s prospectus for details.
Effective June 1, 2019, purchases of the fund’s Class B shares are closed to new and existing investors subject to certain exceptions. Please see the fund’s prospectus for details.
The fund is one of several mutual funds in which certain MFS funds may invest. The MFS funds do not invest in the underlying funds for the purpose of exercising management or control. At the end of the period, the MFS Lifetime 2040 Fund, the MFS Lifetime 2050 Fund, the MFS Lifetime 2045 Fund, the MFS Lifetime 2035 Fund, the MFS Lifetime 2055 Fund, and the MFS Lifetime 2030 Fund, were the owners of record of approximately 11%, 8%, 8%, 6%, 4%, and 1%, respectively, of the value of outstanding voting shares of the fund. In addition, the MFS Lifetime 2060 Fund was the owner of record of less than 1% of the value of outstanding voting shares of the fund.
(6) Line of Credit
The fund and certain other funds managed by MFS participate in a $1.25 billion unsecured committed line of credit, subject to a $1 billion sublimit, provided by a syndicate of banks under a credit agreement. Borrowings may be made for temporary financing needs. Interest is charged to each fund, based on its borrowings, generally at a rate equal to the highest of one month LIBOR, the Federal Funds Effective Rate and the Overnight Bank Funding Rate, plus an agreed upon spread. A commitment fee, based on the average daily, unused portion of the committed line of credit, is allocated among the participating funds. In addition, the fund and other funds managed by MFS have established unsecured uncommitted borrowing arrangements with certain banks for temporary financing needs. Interest is charged to each fund, based on its borrowings, at rates equal to customary reference rates plus an agreed upon spread. For the six months ended February 29, 2020, the fund’s commitment fee and interest expense were $58 and $0, respectively, and are included in “Miscellaneous” expense in the Statement of Operations.
32
Notes to Financial Statements (unaudited) – continued
(7) Investments in Affiliated Issuers
An affiliated issuer may be considered one in which the fund owns 5% or more of the outstanding voting securities, or a company which is under common control. For the purposes of this report, the following were affiliated issuers:
| | | | | | | | | | | | | | | | | | | | | | | | |
| | | | | | |
| Affiliated Issuers | | Beginning
Value | | | Purchases | | | Sales
Proceeds | | | Realized
Gain
(Loss) | | | Change in
Unrealized
Appreciation or
Depreciation | | | Ending
Value | |
MFS Institutional Money
Market Portfolio | | | $418,199 | | | | $14,865,562 | | | | $10,713,812 | | | | $(268 | ) | | | $4 | | | | $4,569,685 | |
| | | | | | |
| Affiliated Issuers | | | | | | | | | | | | | | Dividend
Income | | | Capital Gain
Distributions | |
| MFS Institutional Money Market Portfolio | | | | | | | | $4,313 | | | | $— | |
(8) Impacts of COVID-19
The pandemic related to the global spread of novel coronavirus disease (COVID-19), which was first detected in December 2019, has resulted in significant disruptions to global business activity and the global economy, as well as the economies of individual countries, the financial performance of individual companies and sectors, and the securities and commodities markets in general. This pandemic, the full effects of which are still unknown, has resulted in substantial market volatility and may have adversely impacted the prices and liquidity of the fund’s investments and the fund’s performance during the period February 29, 2020 through April 16, 2020, the date that these financial statements were issued.
33
PROXY VOTING POLICIES AND INFORMATION
MFS votes proxies on behalf of the fund pursuant to proxy voting policies and procedures that are available without charge, upon request, by calling1-800-225-2606, by visitingmfs.com/proxyvoting, or by visiting the SEC’s Web site athttp://www.sec.gov.
Information regarding how the fund voted proxies relating to portfolio securities during the most recent twelve-month period ended June 30 is available by August 31 of each year without charge by visitingmfs.com/proxyvoting, or by visiting the SEC’s Web site athttp://www.sec.gov.
QUARTERLY PORTFOLIO DISCLOSURE
The fund files a complete schedule of portfolio holdings with the SEC for the first and third quarters of each fiscal year as an exhibit to its reports onForm N-PORT. The fund’s Form N-PORT reports are available on the SEC’s website athttp://www.sec.gov.A shareholder can obtain the portfolio holdings report for the first and third quarters of the fund’s fiscal year atmfs.com/openendfunds by choosing the fund’s name and then selecting the “Resources” tab and clicking on “Prospectus and Reports”.
FURTHER INFORMATION
From time to time, MFS may post important information about the fund or the MFS funds on the MFS web site (mfs.com). This information is available athttps://www.mfs.com/en-us/what-we-do/announcements.html or atmfs.com/openendfunds by choosing the fund’s name.
INFORMATION ABOUT FUND CONTRACTS AND LEGAL CLAIMS
The fund has entered into contractual arrangements with an investment adviser, administrator, distributor, shareholder servicing agent, 529 program manager (if applicable), and custodian who each provide services to the fund. Unless expressly stated otherwise, shareholders are not parties to, or intended beneficiaries of these contractual arrangements, and these contractual arrangements are not intended to create any shareholder right to enforce them against the service providers or to seek any remedy under them against the service providers, either directly or on behalf of the fund.
Under the Trust’s By-Laws and Declaration of Trust, any claims asserted against or on behalf of the MFS Funds, including claims against Trustees and Officers, must be brought in state and federal courts located within the Commonwealth of Massachusetts.
PROVISION OF FINANCIAL REPORTS AND SUMMARY PROSPECTUSES
The fund produces financial reports every six months and updates its summary prospectus and prospectus annually. To avoid sending duplicate copies of materials to households, only one copy of the fund’s annual and semiannual report and summary prospectus may be mailed to shareholders having the same last name and residential address on the fund’s records. However, any shareholder may contact MFSC (please see back cover for address and telephone number) to request that copies of these reports and summary prospectuses be sent personally to that shareholder.
34
Save paper with eDelivery.

| MFS® will send you prospectuses, |
reports, and proxies directly viae-mail so you will get information faster with less mailbox clutter.
To sign up:
1. Go to mfs.com.
2. Log in via MFS® Access.
3. Select eDelivery.
If you own your MFS fund shares through a financial institution or a retirement plan, MFS® TALK, MFS® Access, or eDelivery may not be available to you.
CONTACT
WEB SITE
mfs.com
MFS TALK
1-800-637-8255
24 hours a day
ACCOUNT SERVICE AND LITERATURE
Shareholders
1-800-225-2606
Financial advisors
1-800-343-2829
Retirement plan services
1-800-637-1255
MAILING ADDRESS
MFS Service Center, Inc.
P.O. Box 219341
Kansas City, MO 64121-9341
OVERNIGHT MAIL
MFS Service Center, Inc.
Suite 219341
430 W 7th Street
Kansas City, MO 64105-1407
Semiannual Report
February 29, 2020

MFS® Blended Research® Global Equity Fund

Beginning on January 1, 2021, as permitted by regulations adopted by the U.S. Securities and Exchange Commission, paper copies of the fund’s annual and semiannual shareholder reports will no longer be sent by mail, unless you specifically request paper copies of the reports. Instead, the complete reports will be made available on the fund’s Web site (funds.mfs.com), and you will be notified by mail each time a report is posted and provided with a Web site link to access the report.
If you are already signed up to receive shareholder reports by email, you will not be affected by this change and you need not take any action. You may sign up to receive shareholder reports and other communications from the fund by email by contacting your financial intermediary (such as a broker-dealer or bank) or, if you hold your shares directly with the fund, by calling 1-800-225-2606 or by logging on to MFS Access at mfs.com.
Beginning on January 1, 2019, you may elect to receive all future reports in paper free of charge. Contact your financial intermediary to request that you continue to receive paper copies of your shareholder reports. If you invest directly with the fund, you can call 1-800-225-2606 or send an email request to orderliterature@mfs.com to let the fund know that you wish to continue receiving paper copies of your shareholder reports. Your election to receive reports in paper will apply to all funds held in your account if you invest through your financial intermediary or all funds held with the MFS fund complex if you invest directly.
BRL-SEM
MFS® Blended Research® Global Equity Fund
CONTENTS
The report is prepared for the general information of shareholders.
It is authorized for distribution to prospective investors only when preceded or accompanied by a current prospectus.
NOT FDIC INSURED• MAY LOSE VALUE• NO BANK GUARANTEE

LETTER FROM THE EXECUTIVE CHAIR
Dear Shareholders:
During the first quarter of 2020, market volatility reached levels not seen since the global financial crisis. Optimism heading into the year — on receding trade and
geopolitical risk along with easier central bank policies — was overwhelmed in February as the health effects of a novel coronavirus,COVID-19, spread beyond China’s borders, ultimately impacting more than 200 countries. The global pandemic prompted many governments to take drastic action to slow the spread of the virus, such as quarantines, school and business closures, and prohibitions on public gatherings. While these are important steps to protect the public health, they come at a cost: rising market volatility and an abrupt decline in economic growth.
Global central banks have taken aggressive, coordinated steps to cushion the economic and market fallout related to the virus, and
governments are undertaking unprecedented levels of fiscal stimulus. As uncertainty recedes, these measures can help create a supportive environment and encourage economic recovery. In the aftermath of the crisis, there are likely to be societal changes as households, businesses and governments adjust to a new reality and these alterations could change the investment landscape. Occurrences such as the COVID-19 outbreak demonstrate the importance of having a deep understanding of company fundamentals, and our global research platform has been built to do just that.
Here at MFS®, we aim to help our clients navigate the growing complexity of the markets and world economies. Our long-term investment philosophy and commitment to the responsible allocation of capital allow us to tune out the noise and uncover what we believe are the best, most durable investment opportunities in the market. Through our powerful global investment platform, we combine collective expertise, thoughtful risk management, and long-term discipline to create sustainable value for investors.
Respectfully,

Robert J. Manning
Executive Chair
MFS Investment Management
April 16, 2020
The opinions expressed in this letter are subject to change and may not be relied upon for investment advice. No forecasts can be guaranteed.
1
PORTFOLIO COMPOSITION
Portfolio structure

| | | | |
| Top ten holdings | | | | |
| Microsoft Corp. | | | 4.2% | |
| Alphabet, Inc., “A” | | | 2.7% | |
| Roche Holding AG | | | 2.1% | |
| Taiwan Semiconductor Manufacturing Co. Ltd., ADR | | | 2.1% | |
| Adobe Systems, Inc. | | | 2.0% | |
| Eli Lilly & Co. | | | 1.7% | |
| LVMH Moet Hennessy Louis Vuitton SE | | | 1.7% | |
| Samsung Electronics Co. Ltd. | | | 1.7% | |
| Citigroup, Inc. | | | 1.6% | |
| Apple, Inc. | | | 1.6% | |
| |
| GICS equity sectors (g) | | | | |
| Information Technology | | | 18.1% | |
| Financials | | | 15.2% | |
| Health Care | | | 12.5% | |
| Consumer Discretionary | | | 11.2% | |
| Communication Services | | | 9.8% | |
| Industrials | | | 9.4% | |
| Consumer Staples | | | 7.7% | |
| Energy | | | 4.9% | |
| Real Estate | | | 3.7% | |
| Materials | | | 3.4% | |
| Utilities | | | 3.0% | |
| | | | |
| Issuer country weightings (x) | |
| United States | | | 57.1% | |
| Japan | | | 7.9% | |
| France | | | 5.6% | |
| Switzerland | | | 5.6% | |
| United Kingdom | | | 3.9% | |
| South Korea | | | 3.4% | |
| Canada | | | 3.0% | |
| Taiwan | | | 2.4% | |
| China | | | 2.0% | |
| Other Countries | | | 9.1% | |
|
| Currency exposure weightings (y) | |
| United States Dollar | | | 57.7% | |
| Euro | | | 9.3% | |
| Japanese Yen | | | 7.9% | |
| Swiss Franc | | | 5.6% | |
| British Pound Sterling | | | 3.9% | |
| South Korean Won | | | 3.4% | |
| Hong Kong Dollar | | | 3.0% | |
| Taiwan Dollar | | | 2.4% | |
| Canadian Dollar | | | 1.4% | |
| Other Currencies | | | 5.4% | |
2
Portfolio Composition – continued
| (g) | The Global Industry Classification Standard (GICS®) was developed by and/or is the exclusive property of MSCI, Inc. and S&P Global Market Intelligence Inc. (“S&P Global Market Intelligence”). GICS is a service mark of MSCI and S&P Global Market Intelligence and has been licensed for use by MFS. |
| (x) | Represents the portfolio’s exposure to issuer countries as a percentage of a portfolio’s net assets. For purposes of this presentation, United States includes Cash & Cash Equivalents. |
| (y) | Represents the portfolio’s exposure to a particular currency as a percentage of a portfolio’s net assets. For purposes of this presentation, United States Dollar includes Cash & Cash Equivalents. |
Cash & Cash Equivalents includes any cash, investments in money market funds, short-term securities, and other assets less liabilities. Please see the Statement of Assets and Liabilities for additional information related to the fund’s cash position and other assets and liabilities.
Percentages are based on net assets as of February 29, 2020.
The portfolio is actively managed and current holdings may be different.
3
EXPENSE TABLE
Fund expenses borne by the shareholders during the period, September 1, 2019 through February 29, 2020
As a shareholder of the fund, you incur two types of costs: (1) transaction costs, including sales charges (loads) on certain purchase or redemption payments, and (2) ongoing costs, including management fees; distribution and service(12b-1) fees; and other fund expenses. This example is intended to help you understand your ongoing costs (in dollars) of investing in the fund and to compare these costs with the
ongoing costs of investing in other mutual funds.
The example is based on an investment of $1,000 invested at the beginning of the period and held for the entire period September 1, 2019 through February 29, 2020.
Actual Expenses
The first line for each share class in the following table provides information about actual account values and actual expenses. You may use the information in this line, together with the amount you invested, to estimate the expenses that you paid over the period. Simply divide your account value by $1,000 (for example, an $8,600 account value divided by $1,000 = 8.6), then multiply the result by the number in the first line under the heading entitled “Expenses Paid During Period” to estimate the expenses you paid on your account during this period.
Hypothetical Example for Comparison Purposes
The second line for each share class in the following table provides information about hypothetical account values and hypothetical expenses based on the fund’s actual expense ratio and an assumed rate of return of 5% per year before expenses, which is not the fund’s actual return. The hypothetical account values and expenses may not be used to estimate the actual ending account balance or expenses you paid for the period. You may use this information to compare the ongoing costs of investing in the fund and other funds. To do so, compare this 5% hypothetical example with the 5% hypothetical examples that appear in the shareholder reports of the other funds.
Please note that the expenses shown in the table are meant to highlight your ongoing costs only and do not reflect any transactional costs, such as sales charges (loads). Therefore, the second line for each share class in the table is useful in comparing ongoing costs only, and will not help you determine the relative total costs of owning different funds. In addition, if these transactional costs were included, your costs would have been higher.
4
Expense Table – continued
| | | | | | | | | | | | | | | | | | |
Share
Class | | | | Annualized
Expense
Ratio | | | Beginning
Account Value
9/01/19 | | | Ending
Account Value
2/29/20 | | | Expenses
Paid During
Period (p) 9/01/19-2/29/20 | |
| A | | Actual | | | 0.88% | | | | $1,000.00 | | | | $1,015.40 | | | | $4.41 | |
| | Hypothetical (h) | | | 0.88% | | | | $1,000.00 | | | | $1,020.49 | | | | $4.42 | |
| B | | Actual | | | 1.63% | | | | $1,000.00 | | | | $1,011.28 | | | | $8.15 | |
| | Hypothetical (h) | | | 1.63% | | | | $1,000.00 | | | | $1,016.76 | | | | $8.17 | |
| C | | Actual | | | 1.63% | | | | $1,000.00 | | | | $1,011.55 | | | | $8.15 | |
| | Hypothetical (h) | | | 1.63% | | | | $1,000.00 | | | | $1,016.76 | | | | $8.17 | |
| I | | Actual | | | 0.63% | | | | $1,000.00 | | | | $1,016.71 | | | | $3.16 | |
| | Hypothetical (h) | | | 0.63% | | | | $1,000.00 | | | | $1,021.73 | | | | $3.17 | |
| R1 | | Actual | | | 1.63% | | | | $1,000.00 | | | | $1,011.04 | | | | $8.15 | |
| | Hypothetical (h) | | | 1.63% | | | | $1,000.00 | | | | $1,016.76 | | | | $8.17 | |
| R2 | | Actual | | | 1.13% | | | | $1,000.00 | | | | $1,013.90 | | | | $5.66 | |
| | Hypothetical (h) | | | 1.13% | | | | $1,000.00 | | | | $1,019.24 | | | | $5.67 | |
| R3 | | Actual | | | 0.88% | | | | $1,000.00 | | | | $1,015.30 | | | | $4.41 | |
| | Hypothetical (h) | | | 0.88% | | | | $1,000.00 | | | | $1,020.49 | | | | $4.42 | |
| R4 | | Actual | | | 0.63% | | | | $1,000.00 | | | | $1,016.74 | | | | $3.16 | |
| | Hypothetical (h) | | | 0.63% | | | | $1,000.00 | | | | $1,021.73 | | | | $3.17 | |
| R6 | | Actual | | | 0.60% | | | | $1,000.00 | | | | $1,017.08 | | | | $3.01 | |
| | Hypothetical (h) | | | 0.60% | | | | $1,000.00 | | | | $1,021.88 | | | | $3.02 | |
| (h) | 5% class return per year before expenses. |
| (p) | “Expenses Paid During Period” are equal to each class’s annualized expense ratio, as shown above, multiplied by the average account value over the period, multiplied by 182/366 (to reflect theone-half year period). Expenses paid do not include any applicable sales charges (loads). If these transaction costs had been included, your costs would have been higher. |
5
PORTFOLIO OF INVESTMENTS
2/29/20 (unaudited)
The Portfolio of Investments is a complete list of all securities owned by your fund. It is categorized by broad-based asset classes.
| | | | | | | | |
| | |
| Issuer | | Shares/Par | | | Value ($) | |
| Common Stocks - 98.6% | | | | | | |
| Aerospace - 1.0% | | | | | | |
| Huntington Ingalls Industries, Inc. | | | 82 | | | $ | 16,853 | |
| L3Harris Technologies, Inc. | | | 179 | | | | 35,394 | |
| | | | | | | | |
| | | | | | | $ | 52,247 | |
| Airlines - 1.0% | | | | | | |
| Air Canada (a) | | | 1,408 | | | $ | 35,928 | |
| Grupo Aeroportuario del Pacifico S.A.B. de C.V. | | | 1,418 | | | | 15,392 | |
| | | | | | | | |
| | | | | | | $ | 51,320 | |
| Apparel Manufacturers - 2.0% | | | | | | |
| Burberry Group PLC | | | 814 | | | $ | 17,783 | |
| LVMH Moet Hennessy Louis Vuitton SE | | | 211 | | | | 87,054 | |
| | | | | | | | |
| | | | | | | $ | 104,837 | |
| Automotive - 2.8% | | | | | | |
| Copart, Inc. (a) | | | 278 | | | $ | 23,486 | |
| Lear Corp. | | | 522 | | | | 58,046 | |
| Magna International, Inc. | | | 1,450 | | | | 66,439 | |
| | | | | | | | |
| | | | | | | $ | 147,971 | |
| Biotechnology - 1.0% | | | | | | |
| Biogen, Inc. (a) | | | 168 | | | $ | 51,810 | |
| | |
| Brokerage & Asset Managers - 1.7% | | | | | | |
| Invesco Ltd. | | | 3,130 | | | $ | 45,072 | |
| TD Ameritrade Holding Corp. | | | 1,088 | | | | 45,946 | |
| | | | | | | | |
| | | | | | | $ | 91,018 | |
| Business Services - 2.5% | | | | | | |
| Fidelity National Information Services, Inc. | | | 408 | | | $ | 57,006 | |
| Fiserv, Inc. (a) | | | 671 | | | | 73,380 | |
| | | | | | | | |
| | | | | | | $ | 130,386 | |
| Cable TV - 2.2% | | | | | | |
| Charter Communications, Inc., “A” (a) | | | 133 | | | $ | 65,592 | |
| Comcast Corp., “A” | | | 1,185 | | | | 47,909 | |
| | | | | | | | |
| | | | | | | $ | 113,501 | |
| Chemicals - 0.6% | | | | | | |
| Eastman Chemical Co. | | | 474 | | | $ | 29,156 | |
6
Portfolio of Investments (unaudited) – continued
| | | | | | | | |
| | |
| Issuer | | Shares/Par | | | Value ($) | |
| Common Stocks - continued | | | | | | |
| Computer Software - 6.1% | | | | | | |
| Adobe Systems, Inc. (a) | | | 296 | | | $ | 102,156 | |
| Microsoft Corp. | | | 1,343 | | | | 217,579 | |
| | | | | | | | |
| | | | | | | $ | 319,735 | |
| Computer Software - Systems - 4.4% | | | | | | |
| Apple, Inc. | | | 304 | | | $ | 83,102 | |
| Fujitsu Ltd. | | | 600 | | | | 63,320 | |
| Hitachi Ltd. | | | 2,000 | | | | 67,086 | |
| Hon Hai Precision Industry Co. Ltd., GDR | | | 3,675 | | | | 19,053 | |
| | | | | | | | |
| | | | | | | $ | 232,561 | |
| Consumer Products - 2.2% | | | | | | |
| Essity AB | | | 745 | | | $ | 22,341 | |
| Kimberly-Clark Corp. | | | 513 | | | | 67,301 | |
| L’Oréal | | | 102 | | | | 27,432 | |
| | | | | | | | |
| | | | | | | $ | 117,074 | |
| Consumer Services - 1.4% | | | | | | |
| Booking Holdings, Inc. (a) | | | 43 | | | $ | 72,913 | |
| | |
| Electrical Equipment - 1.5% | | | | | | |
| Schneider Electric SE | | | 791 | | | $ | 80,621 | |
| | |
| Electronics - 4.7% | | | | | | |
| Applied Materials, Inc. | | | 632 | | | $ | 36,732 | |
| Samsung Electronics Co. Ltd. | | | 1,910 | | | | 86,408 | |
| Taiwan Semiconductor Manufacturing Co. Ltd., ADR | | | 2,022 | | | | 108,865 | |
| Texas Instruments, Inc. | | | 135 | | | | 15,409 | |
| | | | | | | | |
| | | | | | | $ | 247,414 | |
| Energy - Independent - 1.4% | | | | | | |
| CNOOC Ltd. | | | 19,000 | | | $ | 26,202 | |
| Marathon Petroleum Corp. | | | 549 | | | | 26,033 | |
| Valero Energy Corp. | | | 347 | | | | 22,989 | |
| | | | | | | | |
| | | | | | | $ | 75,224 | |
| Energy - Integrated - 1.9% | | | | | | |
| BP PLC | | | 5,691 | | | $ | 29,478 | |
| China Petroleum & Chemical Corp. | | | 56,000 | | | | 29,060 | |
| Galp Energia SGPS S.A., “B” | | | 2,762 | | | | 37,914 | |
| | | | | | | | |
| | | | | | | $ | 96,452 | |
| Food & Beverages - 1.9% | | | | | | |
| Nestle S.A. | | | 524 | | | $ | 54,290 | |
| Tyson Foods, Inc., “A” | | | 676 | | | | 45,853 | |
| | | | | | | | |
| | | | | | | $ | 100,143 | |
7
Portfolio of Investments (unaudited) – continued
| | | | | | | | |
| | |
| Issuer | | Shares/Par | | | Value ($) | |
| Common Stocks - continued | | | | | | |
| Health Maintenance Organizations - 1.2% | | | | | | |
| Cigna Corp. | | | 350 | | | $ | 64,029 | |
| | |
| Insurance - 4.6% | | | | | | |
| Equitable Holdings, Inc. | | | 704 | | | $ | 15,066 | |
| Hartford Financial Services Group, Inc. | | | 664 | | | | 33,167 | |
| Manulife Financial Corp. | | | 1,051 | | | | 17,699 | |
| MetLife, Inc. | | | 1,526 | | | | 65,191 | |
| Prudential Financial, Inc. | | | 436 | | | | 32,896 | |
| Zurich Insurance Group AG | | | 198 | | | | 77,055 | |
| | | | | | | | |
| | | | | | | $ | 241,074 | |
| Internet - 4.7% | | | | | | |
| Alphabet, Inc., “A” (a) | | | 106 | | | $ | 141,960 | |
| Alphabet, Inc., “C” (a) | | | 21 | | | | 28,126 | |
| Facebook, Inc., “A” (a) | | | 387 | | | | 74,486 | |
| | | | | | | | |
| | | | | | | $ | 244,572 | |
| Leisure & Toys - 0.3% | | | | | | |
| Take-Two Interactive Software, Inc. (a) | | | 143 | | | $ | 15,370 | |
| | |
| Machinery & Tools - 4.0% | | | | | | |
| AGCO Corp. | | | 881 | | | $ | 53,239 | |
| Doosan Bobcat, Inc. | | | 1,052 | | | | 24,906 | |
| Eaton Corp. PLC | | | 899 | | | | 81,557 | |
| Regal Beloit Corp. | | | 410 | | | | 31,833 | |
| Trane Technologies PLC | | | 146 | | | | 18,840 | |
| | | | | | | | |
| | | | | | | $ | 210,375 | |
| Major Banks - 4.7% | | | | | | |
| ABSA Group Ltd. | | | 3,060 | | | $ | 26,209 | |
| Banco Bradesco S.A., ADR | | | 5,069 | | | | 34,368 | |
| Bank of China Ltd. | | | 51,000 | | | | 20,288 | |
| BNP Paribas | | | 781 | | | | 38,161 | |
| China Construction Bank | | | 35,000 | | | | 28,512 | |
| National Australia Bank Ltd. | | | 791 | | | | 12,769 | |
| Sumitomo Mitsui Financial Group, Inc. | | | 1,600 | | | | 51,429 | |
| UBS Group AG | | | 2,875 | | | | 31,844 | |
| | | | | | | | |
| | | | | | | $ | 243,580 | |
| Medical & Health Technology & Services - 3.6% | | | | | | |
| HCA Healthcare, Inc. | | | 573 | | | $ | 72,777 | |
| McKesson Corp. | | | 513 | | | | 71,748 | |
| Premier, Inc., “A” (a) | | | 887 | | | | 26,104 | |
| Universal Health Services, Inc. | | | 124 | | | | 15,344 | |
| | | | | | | | |
| | | | | | | $ | 185,973 | |
8
Portfolio of Investments (unaudited) – continued
| | | | | | | | |
| | |
| Issuer | | Shares/Par | | | Value ($) | |
| Common Stocks - continued | | | | | | |
| Metals & Mining - 1.3% | | | | | | |
| POSCO | | | 298 | | | $ | 47,886 | |
| Rio Tinto PLC | | | 462 | | | | 21,653 | |
| | | | | | | | |
| | | | | | | $ | 69,539 | |
| Natural Gas - Pipeline - 1.6% | | | | | | |
| Enterprise Products Partners LP | | | 2,665 | | | $ | 62,201 | |
| EQM Midstream Partners LP | | | 1,326 | | | | 23,020 | |
| | | | | | | | |
| | | | | | | $ | 85,221 | |
| Other Banks & Diversified Financials - 4.2% | | | | | | |
| Banco Macro S.A., ADR | | | 316 | | | $ | 9,158 | |
| Citigroup, Inc. | | | 1,331 | | | | 84,465 | |
| DBS Group Holdings Ltd. | | | 3,800 | | | | 66,357 | |
| ORIX Corp. | | | 1,500 | | | | 23,939 | |
| Sberbank of Russia PJSC, ADR | | | 2,603 | | | | 36,920 | |
| | | | | | | | |
| | | | | | | $ | 220,839 | |
| Pharmaceuticals - 6.7% | | | | | | |
| Bayer AG | | | 898 | | | $ | 65,014 | |
| Eli Lilly & Co. | | | 714 | | | | 90,057 | |
| Novartis AG | | | 228 | | | | 19,141 | |
| Novo Nordisk A.S., “B” | | | 711 | | | | 42,257 | |
| Pfizer, Inc. | | | 657 | | | | 21,957 | |
| Roche Holding AG | | | 340 | | | | 110,821 | |
| | | | | | | | |
| | | | | | | $ | 349,247 | |
| Precious Metals & Minerals - 0.3% | | | | | | |
| Impala Platinum Holdings Ltd. | | | 1,880 | | | $ | 15,215 | |
| | |
| Printing & Publishing - 0.7% | | | | | | |
| Transcontinental, Inc., “A” | | | 2,891 | | | $ | 34,935 | |
| | |
| Railroad & Shipping - 0.8% | | | | | | |
| Kansas City Southern Co. | | | 133 | | | $ | 20,040 | |
| Sankyu, Inc. | | | 500 | | | | 21,224 | |
| | | | | | | | |
| | | | | | | $ | 41,264 | |
| Real Estate - 3.7% | | | | | | |
| Daiwa House Industry Co. Ltd. | | | 2,000 | | | $ | 55,066 | |
| Spirit Realty Capital, Inc., REIT | | | 316 | | | | 14,378 | |
| STORE Capital Corp., REIT | | | 1,804 | | | | 59,280 | |
| Unibail-Rodamco-Westfield, REIT | | | 514 | | | | 62,044 | |
| | | | | | | | |
| | | | | | | $ | 190,768 | |
9
Portfolio of Investments (unaudited) – continued
| | | | | | | | |
| | |
| Issuer | | Shares/Par | | | Value ($) | |
| Common Stocks - continued | | | | | | |
| Restaurants - 3.3% | | | | | | |
| Greggs PLC | | | 2,155 | | | $ | 58,108 | |
| Starbucks Corp. | | | 705 | | | | 55,293 | |
| U.S. Foods Holding Corp. (a) | | | 1,815 | | | | 61,057 | |
| | | | | | | | |
| | | | | | | $ | 174,458 | |
| Specialty Chemicals - 1.2% | | | | | | |
| Akzo Nobel N.V. | | | 170 | | | $ | 13,648 | |
| Linde PLC | | | 270 | | | | 51,124 | |
| | | | | | | | |
| | | | | | | $ | 64,772 | |
| Specialty Stores - 3.3% | | | | | | |
| Amazon.com, Inc. (a) | | | 19 | | | $ | 35,791 | |
| AutoZone, Inc. (a) | | | 43 | | | | 44,398 | |
| Best Buy Co., Inc. | | | 225 | | | | 17,021 | |
| Target Corp. | | | 717 | | | | 73,851 | |
| | | | | | | | |
| | | | | | | $ | 171,061 | |
| Telecommunications - Wireless - 2.2% | | | | | | |
| KDDI Corp. | | | 2,600 | | | $ | 73,477 | |
| Vodafone Group PLC | | | 24,683 | | | | 43,107 | |
| | | | | | | | |
| | | | | | | $ | 116,584 | |
| Telephone Services - 0.5% | | | | | | |
| Hellenic Telecommunications Organization S.A. | | | 1,749 | | | $ | 24,819 | |
| | |
| Tobacco - 2.4% | | | | | | |
| British American Tobacco PLC | | | 906 | | | $ | 36,004 | |
| Japan Tobacco, Inc. | | | 3,000 | | | | 59,494 | |
| Philip Morris International, Inc. | | | 365 | | | | 29,883 | |
| | | | | | | | |
| | | | | | | $ | 125,381 | |
| Utilities - Electric Power - 3.0% | | | | | | |
| CLP Holdings Ltd. | | | 5,000 | | | $ | 52,685 | |
| Exelon Corp. | | | 612 | | | | 26,383 | |
| NextEra Energy Partners LP | | | 418 | | | | 24,106 | |
| Southern Co. | | | 428 | | | | 25,834 | |
| Vistra Energy Corp. | | | 1,540 | | | | 29,614 | |
| | | | | | | | |
| | | | | | | $ | 158,622 | |
| Total Common Stocks (Identified Cost, $4,668,311) | | | | | | $ | 5,162,081 | |
| | |
| Preferred Stocks - 0.3% | | | | | | |
| Electronics - 0.3% | | | | | | |
| Samsung Electronics Co. Ltd. (Identified Cost, $14,536) | | | 435 | | | $ | 16,515 | |
10
Portfolio of Investments (unaudited) – continued
| | | | | | | | |
| | |
| Issuer | | Shares/Par | | | Value ($) | |
| Investment Companies (h) - 3.5% | | | | | | |
| Money Market Funds - 3.5% | | | | | | |
MFS Institutional Money Market Portfolio, 1.61% (v)
(Identified Cost, $183,798) | | | 183,799 | | | $ | 183,817 | |
| | |
| Other Assets, Less Liabilities - (2.4)% | | | | | (126,037) | |
| Net Assets - 100.0% | | | | | | $ | 5,236,376 | |
| (a) | Non-income producing security. |
| (h) | An affiliated issuer, which may be considered one in which the fund owns 5% or more of the outstanding voting securities, or a company which is under common control. At period end, the aggregate values of the fund’s investments in affiliated issuers and in unaffiliated issuers were $183,817 and $5,178,596, respectively. |
| (v) | Affiliated issuer that is available only to investment companies managed by MFS. The rate quoted for the MFS Institutional Money Market Portfolio is the annualizedseven-day yield of the fund at period end. |
The following abbreviations are used in this report and are defined:
| ADR | | American Depositary Receipt |
| GDR | | Global Depositary Receipt |
| REIT | | Real Estate Investment Trust |
See Notes to Financial Statements
11
Financial Statements
STATEMENT OF ASSETS AND LIABILITIES
At 2/29/20 (unaudited)
This statement represents your fund’s balance sheet, which details the assets and liabilities comprising the total value of the fund.
| | | | |
| Assets | | | | |
Investments in unaffiliated issuers, at value (identified cost, $4,682,847) | | | $5,178,596 | |
Investments in affiliated issuers, at value (identified cost, $183,798) | | | 183,817 | |
Receivables for | | | | |
Fund shares sold | | | 860 | |
Dividends | | | 15,497 | |
Receivable from investment adviser | | | 21,615 | |
Other assets | | | 118 | |
Total assets | | | $5,400,503 | |
| |
| Liabilities | | | | |
Payables for | | | | |
Investments purchased | | | $80,535 | |
Fund shares reacquired | | | 8,612 | |
Payable to affiliates | | | | |
Administrative services fee | | | 144 | |
Shareholder servicing costs | | | 1,034 | |
Distribution and service fees | | | 55 | |
Payable for independent Trustees’ compensation | | | 114 | |
Accrued expenses and other liabilities | | | 73,633 | |
Total liabilities | | | $164,127 | |
Net assets | | | $5,236,376 | |
| |
| Net assets consist of | | | | |
Paid-in capital | | | $4,693,353 | |
Total distributable earnings (loss) | | | 543,023 | |
Net assets | | | $5,236,376 | |
Shares of beneficial interest outstanding | | | 472,175 | |
12
Statement of Assets and Liabilities (unaudited) – continued
| | | | | | | | | | | | |
| | | |
| | | Net assets | | | Shares
outstanding | | | Net asset value
per share (a) | |
Class A | | | $1,071,273 | | | | 96,837 | | | | $11.06 | |
Class B | | | 97,599 | | | | 8,831 | | | | 11.05 | |
Class C | | | 177,754 | | | | 16,072 | | | | 11.06 | |
Class I | | | 310,212 | | | | 27,937 | | | | 11.10 | |
Class R1 | | | 65,348 | | | | 5,906 | | | | 11.07 | |
Class R2 | | | 66,821 | | | | 6,029 | | | | 11.08 | |
Class R3 | | | 67,570 | | | | 6,092 | | | | 11.09 | |
Class R4 | | | 68,327 | | | | 6,156 | | | | 11.10 | |
Class R6 | | | 3,311,472 | | | | 298,315 | | | | 11.10 | |
| (a) | Maximum offering price per share was equal to the net asset value per share for all share classes, except for Class A, for which the maximum offering price per share was $11.73 [100 / 94.25 x $11.06]. On sales of $50,000 or more, the maximum offering price of Class A shares is reduced. A contingent deferred sales charge may be imposed on redemptions of Class A, Class B, and Class C shares. Redemption price per share was equal to the net asset value per share for Classes I, R1, R2, R3, R4, and R6. |
See Notes to Financial Statements
13
Financial Statements
STATEMENT OF OPERATIONS
Six months ended 2/29/20 (unaudited)
This statement describes how much your fund earned in investment income and accrued in expenses. It also describes any gains and/or losses generated by fund operations.
| | | | |
| Net investment income (loss) | | | | |
Income | | | | |
Dividends | | | $55,389 | |
Dividends from affiliated issuers | | | 778 | |
Other | | | 112 | |
Foreign taxes withheld | | | (2,636 | ) |
Total investment income | | | $53,643 | |
Expenses | | | | |
Management fee | | | $13,699 | |
Distribution and service fees | | | 3,431 | |
Shareholder servicing costs | | | 1,243 | |
Administrative services fee | | | 8,701 | |
Independent Trustees’ compensation | | | 620 | |
Custodian fee | | | 6,726 | |
Shareholder communications | | | 3,848 | |
Audit and tax fees | | | 32,083 | |
Legal fees | | | 43 | |
Registration fees | | | 59,551 | |
Miscellaneous | | | 14,724 | |
Total expenses | | | $144,669 | |
Reduction of expenses by investment adviser | | | (124,469 | ) |
Net expenses | | | $20,200 | |
Net investment income (loss) | | | $33,443 | |
| |
| Realized and unrealized gain (loss) | | | | |
Realized gain (loss) (identified cost basis) | | | | |
Unaffiliated issuers | | | $44,648 | |
Affiliated issuers | | | (2 | ) |
Foreign currency | | | (3 | ) |
Net realized gain (loss) | | | $44,643 | |
Change in unrealized appreciation or depreciation | | | | |
Unaffiliated issuers | | | $(2,933 | ) |
Affiliated issuers | | | 1 | |
Translation of assets and liabilities in foreign currencies | | | 52 | |
Net unrealized gain (loss) | | | $(2,880 | ) |
Net realized and unrealized gain (loss) | | | $41,763 | |
Change in net assets from operations | | | $75,206 | |
See Notes to Financial Statements
14
Financial Statements
STATEMENTS OF CHANGES IN NET ASSETS
These statements describe the increases and/or decreases in net assets resulting from operations, any distributions, and any shareholder transactions.
| | | | | | | | |
| Change in net assets | | Six months ended
2/29/20
(unaudited) | | | Year ended
8/31/19 | |
| | |
| From operations | | | | | | | | |
Net investment income (loss) | | | $33,443 | | | | $104,561 | |
Net realized gain (loss) | | | 44,643 | | | | 193,047 | |
Net unrealized gain (loss) | | | (2,880 | ) | | | (495,352 | ) |
Change in net assets from operations | | | $75,206 | | | | $(197,744 | ) |
Total distributions to shareholders | | | $(222,002 | ) | | | $(532,030 | ) |
Change in net assets from fund share transactions | | | $350,529 | | | | $(57,206 | ) |
Total change in net assets | | | $203,733 | | | | $(786,980 | ) |
| | |
| Net assets | | | | | | | | |
At beginning of period | | | 5,032,643 | | | | 5,819,623 | |
At end of period | | | $5,236,376 | | | | $5,032,643 | |
See Notes to Financial Statements
15
Financial Statements
FINANCIAL HIGHLIGHTS
The financial highlights table is intended to help you understand the fund’s financial performance for the semiannual period and the past 5 fiscal years (or life of a particular share class, if shorter). Certain information reflects financial results for a single fund share. The total returns in the table represent the rate that an investor would have earned (or lost) on an investment in the fund share class (assuming reinvestment of all distributions) held for the entire period.
| | | | | | | | | | | | | | | | | | | | |
| | | Six months
ended
2/29/20 | | | Year ended | |
| Class A | | 8/31/19 | | | 8/31/18 | | | 8/31/17 | | | 8/31/16 (c) | |
| | | (unaudited) | | | | | | | | | | | | | |
Net asset value, beginning of period | | | $11.32 | | | | $13.06 | | | | $12.35 | | | | $10.46 | | | | $10.00 | |
| | |
| Income (loss) from investment operations | | | | | | | | | |
Net investment income (loss) (d) | | | $0.06 | | | | $0.22 | | | | $0.22 | | | | $0.19 | | | | $0.20 | |
Net realized and unrealized gain (loss) | | | 0.16 | | | | (0.78 | ) | | | 0.88 | | | | 1.88 | | | | 0.32 | |
Total from investment operations | | | $0.22 | | | | $(0.56 | ) | | | $1.10 | | | | $2.07 | | | | $0.52 | |
| | |
| Less distributions declared to shareholders | | | | | | | | | |
From net investment income | | | $(0.17 | ) | | | $(0.22 | ) | | | $(0.19 | ) | | | $(0.18 | ) | | | $(0.04 | ) |
From net realized gain | | | (0.31 | ) | | | (0.96 | ) | | | (0.20 | ) | | | — | | | | (0.02 | ) |
Total distributions declared to shareholders | | | $(0.48 | ) | | | $(1.18 | ) | | | $(0.39 | ) | | | $(0.18 | ) | | | $(0.06 | ) |
Net asset value, end of period (x) | | | $11.06 | | | | $11.32 | | | | $13.06 | | | | $12.35 | | | | $10.46 | |
Total return (%) (r)(s)(t)(x) | | | 1.54 | (n) | | | (3.38 | ) | | | 9.05 | | | | 20.07 | | | | 5.22 | (n) |
| | |
Ratios (%) (to average net assets)
and Supplemental data: | | | | | | | | | |
Expenses before expense reductions (f) | | | 5.42 | (a) | | | 5.63 | | | | 5.26 | | | | 5.22 | | | | 6.02 | (a) |
Expenses after expense reductions (f) | | | 0.88 | (a) | | | 0.89 | | | | 0.88 | | | | 0.88 | | | | 0.86 | (a) |
Net investment income (loss) | | | 1.07 | (a)(l) | | | 1.90 | | | | 1.70 | | | | 1.63 | | | | 2.08 | (a) |
Portfolio turnover | | | 20 | (n) | | | 46 | | | | 48 | | | | 55 | | | | 46 | (n) |
Net assets at end of period (000 omitted) | | | $1,071 | | | | $975 | | | | $910 | | | | $474 | | | | $168 | |
See Notes to Financial Statements
16
Financial Highlights – continued
| | | | | | | | | | | | | | | | | | | | |
| | | Six months
ended
2/29/20 | | | Year ended | |
| Class B | | 8/31/19 | | | 8/31/18 | | | 8/31/17 | | | 8/31/16 (c) | |
| | | (unaudited) | | | | | | | | | | | | | |
Net asset value, beginning of period | | | $11.27 | | | | $12.99 | | | | $12.29 | | | | $10.41 | | | | $10.00 | |
| | |
| Income (loss) from investment operations | | | | | | | | | |
Net investment income (loss) (d) | | | $0.02 | | | | $0.14 | | | | $0.11 | | | | $0.09 | | | | $0.11 | |
Net realized and unrealized gain (loss) | | | 0.15 | | | | (0.78 | ) | | | 0.89 | | | | 1.89 | | | | 0.34 | |
Total from investment operations | | | $0.17 | | | | $(0.64 | ) | | | $1.00 | | | | $1.98 | | | | $0.45 | |
| | |
| Less distributions declared to shareholders | | | | | | | | | |
From net investment income | | | $(0.08 | ) | | | $(0.12 | ) | | | $(0.10 | ) | | | $(0.10 | ) | | | $(0.02 | ) |
From net realized gain | | | (0.31 | ) | | | (0.96 | ) | | | (0.20 | ) | | | — | | | | (0.02 | ) |
Total distributions declared to shareholders | | | $(0.39 | ) | | | $(1.08 | ) | | | $(0.30 | ) | | | $(0.10 | ) | | | $(0.04 | ) |
Net asset value, end of period (x) | | | $11.05 | | | | $11.27 | | | | $12.99 | | | | $12.29 | | | | $10.41 | |
Total return (%) (r)(s)(t)(x) | | | 1.22 | (n) | | | (4.16 | ) | | | 8.24 | | | | 19.12 | | | | 4.47 | (n) |
| | |
Ratios (%) (to average net assets)
and Supplemental data: | | | | | | | | | |
Expenses before expense reductions (f) | | | 6.18 | (a) | | | 6.40 | | | | 5.94 | | | | 6.05 | | | | 7.17 | (a) |
Expenses after expense reductions (f) | | | 1.63 | (a) | | | 1.64 | | | | 1.64 | | | | 1.64 | | | | 1.61 | (a) |
Net investment income (loss) | | | 0.32 | (a)(l) | | | 1.21 | | | | 0.86 | | | | 0.79 | | | | 1.19 | (a) |
Portfolio turnover | | | 20 | (n) | | | 46 | | | | 48 | | | | 55 | | | | 46 | (n) |
Net assets at end of period (000 omitted) | | | $98 | | | | $97 | | | | $77 | | | | $64 | | | | $52 | |
| | |
| | | Six months
ended 2/29/20 | | | Year ended | |
| Class C | | 8/31/19 | | | 8/31/18 | | | 8/31/17 | | | 8/31/16 (c) | |
| | | (unaudited) | | | | | | | | | | | | | |
Net asset value, beginning of period | | | $11.28 | | | | $12.98 | | | | $12.28 | | | | $10.41 | | | | $10.00 | |
| | |
| Income (loss) from investment operations | | | | | | | | | |
Net investment income (loss) (d) | | | $0.02 | | | | $0.13 | | | | $0.12 | | | | $0.09 | | | | $0.13 | |
Net realized and unrealized gain (loss) | | | 0.14 | | | | (0.76 | ) | | | 0.88 | | | | 1.89 | | | | 0.32 | |
Total from investment operations | | | $0.16 | | | | $(0.63 | ) | | | $1.00 | | | | $1.98 | | | | $0.45 | |
| | |
| Less distributions declared to shareholders | | | | | | | | | |
From net investment income | | | $(0.07 | ) | | | $(0.11 | ) | | | $(0.10 | ) | | | $(0.11 | ) | | | $(0.02 | ) |
From net realized gain | | | (0.31 | ) | | | (0.96 | ) | | | (0.20 | ) | | | — | | | | (0.02 | ) |
Total distributions declared to shareholders | | | $(0.38 | ) | | | $(1.07 | ) | | | $(0.30 | ) | | | $(0.11 | ) | | | $(0.04 | ) |
Net asset value, end of period (x) | | | $11.06 | | | | $11.28 | | | | $12.98 | | | | $12.28 | | | | $10.41 | |
Total return (%) (r)(s)(t)(x) | | | 1.15 | (n) | | | (4.10 | ) | | | 8.23 | | | | 19.14 | | | | 4.48 | (n) |
| | |
Ratios (%) (to average net assets)
and Supplemental data: | | | | | | | | | |
Expenses before expense reductions (f) | | | 6.18 | (a) | | | 6.36 | | | | 6.01 | | | | 6.06 | | | | 6.81 | (a) |
Expenses after expense reductions (f) | | | 1.63 | (a) | | | 1.64 | | | | 1.64 | | | | 1.64 | | | | 1.61 | (a) |
Net investment income (loss) | | | 0.33 | (a)(l) | | | 1.12 | | | | 0.96 | | | | 0.78 | | | | 1.37 | (a) |
Portfolio turnover | | | 20 | (n) | | | 46 | | | | 48 | | | | 55 | | | | 46 | (n) |
Net assets at end of period (000 omitted) | | | $178 | | | | $176 | | | | $219 | | | | $133 | | | | $104 | |
See Notes to Financial Statements
17
Financial Highlights – continued
| | | | | | | | | | | | | | | | | | | | |
| | | Six months
ended 2/29/20 | | | Year ended | |
| Class I | | 8/31/19 | | | 8/31/18 | | | 8/31/17 | | | 8/31/16 (c) | |
| | | (unaudited) | | | | | | | | | | | | | |
Net asset value, beginning of period | | | $11.37 | | | | $13.11 | | | | $12.38 | | | | $10.47 | | | | $10.00 | |
| | |
| Income (loss) from investment operations | | | | | | | | | |
Net investment income (loss) (d) | | | $0.08 | | | | $0.23 | | | | $0.19 | | | | $0.22 | | | | $0.24 | |
Net realized and unrealized gain (loss) | | | 0.15 | | | | (0.77 | ) | | | 0.95 | | | | 1.89 | | | | 0.30 | |
Total from investment operations | | | $0.23 | | | | $(0.54 | ) | | | $1.14 | | | | $2.11 | | | | $0.54 | |
| | |
| Less distributions declared to shareholders | | | | | | | | | |
From net investment income | | | $(0.19 | ) | | | $(0.24 | ) | | | $(0.21 | ) | | | $(0.20 | ) | | | $(0.05 | ) |
From net realized gain | | | (0.31 | ) | | | (0.96 | ) | | | (0.20 | ) | | | — | | | | (0.02 | ) |
Total distributions declared to shareholders | | | $(0.50 | ) | | | $(1.20 | ) | | | $(0.41 | ) | | | $(0.20 | ) | | | $(0.07 | ) |
Net asset value, end of period (x) | | | $11.10 | | | | $11.37 | | | | $13.11 | | | | $12.38 | | | | $10.47 | |
Total return (%) (r)(s)(t)(x) | | | 1.67 | (n) | | | (3.19 | ) | | | 9.35 | | | | 20.42 | | | | 5.38 | (n) |
| | |
Ratios (%) (to average net assets)
and Supplemental data: | | | | | | | | | |
Expenses before expense reductions (f) | | | 5.18 | (a) | | | 5.33 | | | | 4.63 | | | | 4.94 | | | | 4.99 | (a) |
Expenses after expense reductions (f) | | | 0.63 | (a) | | | 0.64 | | | | 0.64 | | | | 0.64 | | | | 0.61 | (a) |
Net investment income (loss) | | | 1.33 | (a)(l) | | | 1.95 | | | | 1.45 | | | | 1.94 | | | | 2.50 | (a) |
Portfolio turnover | | | 20 | (n) | | | 46 | | | | 48 | | | | 55 | | | | 46 | (n) |
Net assets at end of period (000 omitted) | | | $310 | | | | $313 | | | | $633 | | | | $1,959 | | | | $924 | |
| | |
| | | Six months
ended 2/29/20 | | | Year ended | |
| Class R1 | | 8/31/19 | | | 8/31/18 | | | 8/31/17 | | | 8/31/16 (c) | |
| | | (unaudited) | | | | | | | | | | | | | |
Net asset value, beginning of period | | | $11.29 | | | | $13.00 | | | | $12.29 | | | | $10.41 | | | | $10.00 | |
| | |
| Income (loss) from investment operations | | | | | | | | | |
Net investment income (loss) (d) | | | $0.02 | | | | $0.13 | | | | $0.11 | | | | $0.09 | | | | $0.11 | |
Net realized and unrealized gain (loss) | | | 0.15 | | | | (0.76 | ) | | | 0.89 | | | | 1.89 | | | | 0.34 | |
Total from investment operations | | | $0.17 | | | | $(0.63 | ) | | | $1.00 | | | | $1.98 | | | | $0.45 | |
| | |
| Less distributions declared to shareholders | | | | | | | | | |
From net investment income | | | $(0.08 | ) | | | $(0.12 | ) | | | $(0.09 | ) | | | $(0.10 | ) | | | $(0.02 | ) |
From net realized gain | | | (0.31 | ) | | | (0.96 | ) | | | (0.20 | ) | | | — | | | | (0.02 | ) |
Total distributions declared to shareholders | | | $(0.39 | ) | | | $(1.08 | ) | | | $(0.29 | ) | | | $(0.10 | ) | | | $(0.04 | ) |
Net asset value, end of period (x) | | | $11.07 | | | | $11.29 | | | | $13.00 | | | | $12.29 | | | | $10.41 | |
Total return (%) (r)(s)(t)(x) | | | 1.20 | (n) | | | (4.08 | ) | | | 8.25 | | | | 19.12 | | | | 4.47 | (n) |
| | |
Ratios (%) (to average net assets)
and Supplemental data: | | | | | | | | | |
Expenses before expense reductions (f) | | | 6.17 | (a) | | | 6.38 | | | | 5.92 | | | | 6.06 | | | | 7.17 | (a) |
Expenses after expense reductions (f) | | | 1.63 | (a) | | | 1.64 | | | | 1.64 | | | | 1.64 | | | | 1.61 | (a) |
Net investment income (loss) | | | 0.33 | (a)(l) | | | 1.13 | | | | 0.84 | | | | 0.78 | | | | 1.19 | (a) |
Portfolio turnover | | | 20 | (n) | | | 46 | | | | 48 | | | | 55 | | | | 46 | (n) |
Net assets at end of period (000 omitted) | | | $65 | | | | $65 | | | | $67 | | | | $62 | | | | $52 | |
See Notes to Financial Statements
18
Financial Highlights – continued
| | | | | | | | | | | | | | | | | | | | |
| | | Six months
ended 2/29/20 | | | Year ended | |
| Class R2 | | 8/31/19 | | | 8/31/18 | | | 8/31/17 | | | 8/31/16 (c) | |
| | | (unaudited) | | | | | | | | | | | | | |
Net asset value, beginning of period | | | $11.33 | | | | $13.05 | | | | $12.34 | | | | $10.44 | | | | $10.00 | |
| | |
| Income (loss) from investment operations | | | | | | | | | |
Net investment income (loss) (d) | | | $0.05 | | | | $0.19 | | | | $0.17 | | | | $0.14 | | | | $0.16 | |
Net realized and unrealized gain (loss) | | | 0.15 | | | | (0.77 | ) | | | 0.89 | | | | 1.91 | | | | 0.33 | |
Total from investment operations | | | $0.20 | | | | $(0.58 | ) | | | $1.06 | | | | $2.05 | | | | $0.49 | |
| | |
| Less distributions declared to shareholders | | | | | | | | | |
From net investment income | | | $(0.14 | ) | | | $(0.18 | ) | | | $(0.15 | ) | | | $(0.15 | ) | | | $(0.03 | ) |
From net realized gain | | | (0.31 | ) | | | (0.96 | ) | | | (0.20 | ) | | | — | | | | (0.02 | ) |
Total distributions declared to shareholders | | | $(0.45 | ) | | | $(1.14 | ) | | | $(0.35 | ) | | | $(0.15 | ) | | | $(0.05 | ) |
Net asset value, end of period (x) | | | $11.08 | | | | $11.33 | | | | $13.05 | | | | $12.34 | | | | $10.44 | |
Total return (%) (r)(s)(t)(x) | | | 1.39 | (n) | | | (3.57 | ) | | | 8.71 | | | | 19.82 | | | | 4.92 | (n) |
| | |
Ratios (%) (to average net assets)
and Supplemental data: | | | | | | | | | |
Expenses before expense reductions (f) | | | 5.68 | (a) | | | 5.88 | | | | 5.42 | | | | 5.56 | | | | 6.67 | (a) |
Expenses after expense reductions (f) | | | 1.13 | (a) | | | 1.14 | | | | 1.14 | | | | 1.14 | | | | 1.11 | (a) |
Net investment income (loss) | | | 0.82 | (a)(l) | | | 1.63 | | | | 1.34 | | | | 1.28 | | | | 1.69 | (a) |
Portfolio turnover | | | 20 | (n) | | | 46 | | | | 48 | | | | 55 | | | | 46 | (n) |
Net assets at end of period (000 omitted) | | | $67 | | | | $66 | | | | $68 | | | | $63 | | | | $52 | |
| | |
| | | Six months ended 2/29/20 | | | Year ended | |
| Class R3 | | 8/31/19 | | | 8/31/18 | | | 8/31/17 | | | 8/31/16 (c) | |
| | | (unaudited) | | | | | | | | | | | | | |
Net asset value, beginning of period | | | $11.35 | | | | $13.08 | | | | $12.36 | | | | $10.46 | | | | $10.00 | |
| | |
| Income (loss) from investment operations | | | | | | | | | |
Net investment income (loss) (d) | | | $0.06 | | | | $0.22 | | | | $0.20 | | | | $0.17 | | | | $0.19 | |
Net realized and unrealized gain (loss) | | | 0.16 | | | | (0.78 | ) | | | 0.90 | | | | 1.90 | | | | 0.33 | |
Total from investment operations | | | $0.22 | | | | $(0.56 | ) | | | $1.10 | | | | $2.07 | | | | $0.52 | |
| | |
| Less distributions declared to shareholders | | | | | | | | | |
From net investment income | | | $(0.17 | ) | | | $(0.21 | ) | | | $(0.18 | ) | | | $(0.17 | ) | | | $(0.04 | ) |
From net realized gain | | | (0.31 | ) | | | (0.96 | ) | | | (0.20 | ) | | | — | | | | (0.02 | ) |
Total distributions declared to shareholders | | | $(0.48 | ) | | | $(1.17 | ) | | | $(0.38 | ) | | | $(0.17 | ) | | | $(0.06 | ) |
Net asset value, end of period (x) | | | $11.09 | | | | $11.35 | | | | $13.08 | | | | $12.36 | | | | $10.46 | |
Total return (%) (r)(s)(t)(x) | | | 1.53 | (n) | | | (3.36 | ) | | | 9.03 | | | | 20.06 | | | | 5.20 | (n) |
| | |
Ratios (%) (to average net assets)
and Supplemental data: | | | | | | | | | |
Expenses before expense reductions (f) | | | 5.43 | (a) | | | 5.63 | | | | 5.17 | | | | 5.31 | | | | 6.41 | (a) |
Expenses after expense reductions (f) | | | 0.88 | (a) | | | 0.89 | | | | 0.89 | | | | 0.89 | | | | 0.86 | (a) |
Net investment income (loss) | | | 1.08 | (a)(l) | | | 1.87 | | | | 1.59 | | | | 1.53 | | | | 1.94 | (a) |
Portfolio turnover | | | 20 | (n) | | | 46 | | | | 48 | | | | 55 | | | | 46 | (n) |
Net assets at end of period (000 omitted) | | | $68 | | | | $67 | | | | $69 | | | | $63 | | | | $53 | |
See Notes to Financial Statements
19
Financial Highlights – continued
| | | | | | | | | | | | | | | | | | | | |
| | | Six months
ended 2/29/20 | | | Year ended | |
| Class R4 | | 8/31/19 | | | 8/31/18 | | | 8/31/17 | | | 8/31/16 (c) | |
| | | (unaudited) | | | | | | | | | | | | | |
Net asset value, beginning of period | | | $11.37 | | | | $13.11 | | | | $12.38 | | | | $10.48 | | | | $10.00 | |
| | |
| Income (loss) from investment operations | | | | | | | | | |
Net investment income (loss) (d) | | | $0.08 | | | | $0.25 | | | | $0.24 | | | | $0.20 | | | | $0.21 | |
Net realized and unrealized gain (loss) | | | 0.15 | | | | (0.79 | ) | | | 0.90 | | | | 1.90 | | | | 0.34 | |
Total from investment operations | | | $0.23 | | | | $(0.54 | ) | | | $1.14 | | | | $2.10 | | | | $0.55 | |
| | |
| Less distributions declared to shareholders | | | | | | | | | |
From net investment income | | | $(0.19 | ) | | | $(0.24 | ) | | | $(0.21 | ) | | | $(0.20 | ) | | | $(0.05 | ) |
From net realized gain | | | (0.31 | ) | | | (0.96 | ) | | | (0.20 | ) | | | — | | | | (0.02 | ) |
Total distributions declared to shareholders | | | $(0.50 | ) | | | $(1.20 | ) | | | $(0.41 | ) | | | $(0.20 | ) | | | $(0.07 | ) |
Net asset value, end of period (x) | | | $11.10 | | | | $11.37 | | | | $13.11 | | | | $12.38 | | | | $10.48 | |
Total return (%) (r)(s)(t)(x) | | | 1.67 | (n) | | | (3.14 | ) | | | 9.35 | | | | 20.31 | | | | 5.48 | (n) |
| | |
Ratios (%) (to average net assets)
and Supplemental data: | | | | | | | | | |
Expenses before expense reductions (f) | | | 5.18 | (a) | | | 5.38 | | | | 4.92 | | | | 5.06 | | | | 6.16 | (a) |
Expenses after expense reductions (f) | | | 0.63 | (a) | | | 0.64 | | | | 0.64 | | | | 0.64 | | | | 0.61 | (a) |
Net investment income (loss) | | | 1.32 | (a)(l) | | | 2.12 | | | | 1.84 | | | | 1.78 | | | | 2.19 | (a) |
Portfolio turnover | | | 20 | (n) | | | 46 | | | | 48 | | | | 55 | | | | 46 | (n) |
Net assets at end of period (000 omitted) | | | $68 | | | | $67 | | | | $69 | | | | $63 | | | | $53 | |
| | |
| | | Six months ended 2/29/20 | | | Year ended | |
| Class R6 | | 8/31/19 | | | 8/31/18 | | | 8/31/17 | | | 8/31/16 (c) | |
| | | (unaudited) | | | | | | | | | | | | | |
Net asset value, beginning of period | | | $11.37 | | | | $13.12 | | | | $12.39 | | | | $10.48 | | | | $10.00 | |
| | |
| Income (loss) from investment operations | | | | | | | | | |
Net investment income (loss) (d) | | | $0.08 | | | | $0.25 | | | | $0.25 | | | | $0.21 | | | | $0.21 | |
Net realized and unrealized gain (loss) | | | 0.16 | | | | (0.79 | ) | | | 0.90 | | | | 1.90 | | | | 0.34 | |
Total from investment operations | | | $0.24 | | | | $(0.54 | ) | | | $1.15 | | | | $2.11 | | | | $0.55 | |
| | |
| Less distributions declared to shareholders | | | | | | | | | |
From net investment income | | | $(0.20 | ) | | | $(0.25 | ) | | | $(0.22 | ) | | | $(0.20 | ) | | | $(0.05 | ) |
From net realized gain | | | (0.31 | ) | | | (0.96 | ) | | | (0.20 | ) | | | — | | | | (0.02 | ) |
Total distributions declared to shareholders | | | $(0.51 | ) | | | $(1.21 | ) | | | $(0.42 | ) | | | $(0.20 | ) | | | $(0.07 | ) |
Net asset value, end of period (x) | | | $11.10 | | | | $11.37 | | | | $13.12 | | | | $12.39 | | | | $10.48 | |
Total return (%) (r)(s)(t)(x) | | | 1.71 | (n) | | | (3.12 | ) | | | 9.41 | | | | 20.42 | | | | 5.48 | (n) |
| | |
Ratios (%) (to average net assets)
and Supplemental data: | | | | | | | | | |
Expenses before expense reductions (f) | | | 5.14 | (a) | | | 5.32 | | | | 4.84 | | | | 5.01 | | | | 6.16 | (a) |
Expenses after expense reductions (f) | | | 0.60 | (a) | | | 0.59 | | | | 0.55 | | | | 0.59 | | | | 0.60 | (a) |
Net investment income (loss) | | | 1.36 | (a)(l) | | | 2.13 | | | | 1.93 | | | | 1.84 | | | | 2.20 | (a) |
Portfolio turnover | | | 20 | (n) | | | 46 | | | | 48 | | | | 55 | | | | 46 | (n) |
Net assets at end of period (000 omitted) | | | $3,311 | | | | $3,209 | | | | $3,707 | | | | $3,376 | | | | $2,742 | |
See Notes to Financial Statements
20
Financial Highlights – continued
| (c) | For the period from the commencement of the fund’s investment operations, September 15, 2015, through the stated period end. |
| (d) | Per share data is based on average shares outstanding. |
| (f) | Ratios do not reflect reductions from fees paid indirectly, if applicable. |
| (l) | Recognition of net investment income by the fund may be affected by the timing of the declaration of dividends by companies in which the fund invests and the actual annual net investment income ratio may differ. |
| (r) | Certain expenses have been reduced without which performance would have been lower. |
| (s) | From time to time the fund may receive proceeds from litigation settlements, without which performance would be lower. |
| (t) | Total returns do not include any applicable sales charges. |
| (x) | The net asset values and total returns have been calculated on net assets which include adjustments made in accordance with U.S. generally accepted accounting principles required at period end for financial reporting purposes. |
See Notes to Financial Statements
21
NOTES TO FINANCIAL STATEMENTS
(unaudited)
(1) Business and Organization
MFS Blended Research Global Equity Fund (the fund) is a diversified series of MFS Series Trust IV (the trust). The trust is organized as a Massachusetts business trust and is registered under the Investment Company Act of 1940, as amended, as anopen-end management investment company.
The fund is an investment company and accordingly follows the investment company accounting and reporting guidance of the Financial Accounting Standards Board (FASB) Accounting Standards Codification Topic 946 Financial Services – Investment Companies.
(2) Significant Accounting Policies
General– The preparation of financial statements in conformity with U.S. generally accepted accounting principles requires management to make estimates and assumptions that affect the reported amounts of assets and liabilities, and disclosure of contingent assets and liabilities at the date of the financial statements and the reported amounts of increases and decreases in net assets from operations during the reporting period. Actual results could differ from those estimates. In the preparation of these financial statements, management has evaluated subsequent events occurring after the date of the fund’s Statement of Assets and Liabilities through the date that the financial statements were issued. The fund invests in foreign securities. Investments in foreign securities are vulnerable to the effects of changes in the relative values of the local currency and the U.S. dollar and to the effects of changes in each country’s market, economic, industrial, political, regulatory, geopolitical, and other conditions.
In March 2020, the FASB issued Accounting Standards Update 2020-04, Reference Rate Reform (Topic 848) – Facilitation of the Effects of Reference Rate Reform on Financial Reporting (“ASU 2020-04”), which provides optional, temporary relief with respect to the financial reporting of contracts subject to certain types of modifications due to the planned discontinuation of the London Interbank Offered Rate (LIBOR) and other IBOR-based reference rates as of the end of 2021. The temporary relief provided by ASU 2020-04 is effective for certain reference rate-related contract modifications that occur during the period from March 12, 2020 through December 31, 2022. Management is evaluating the impact of ASU 2020-04 on the fund’s investments, derivatives, debt and other contracts that will undergo reference rate-related modifications as a result of the reference rate reform.
Balance Sheet Offsetting – The fund’s accounting policy with respect to balance sheet offsetting is that, absent an event of default by the counterparty or a termination of the agreement, the International Swaps and Derivatives Association (ISDA) Master Agreement, or similar agreement, does not result in an offset of reported amounts of financial assets and financial liabilities in the Statement of Assets and Liabilities across transactions between the fund and the applicable counterparty. The fund’s right to setoff may be restricted or prohibited by the bankruptcy or insolvency laws of the particular jurisdiction to which a specific master netting agreement counterparty is subject. Balance sheet offsetting disclosures, to the extent applicable to the fund, have been included in the fund’s Significant Accounting Policies note under the captions for each of the fund’sin-scope financial instruments and transactions.
22
Notes to Financial Statements (unaudited) – continued
Investment Valuations – Equity securities, including restricted equity securities, are generally valued at the last sale or official closing price on their primary market or exchange as provided by a third-party pricing service. Equity securities, for which there were no sales reported that day, are generally valued at the last quoted daily bid quotation on their primary market or exchange as provided by a third-party pricing service. Short-term instruments with a maturity at issuance of 60 days or less may be valued at amortized cost, which approximates market value.Open-end investment companies are generally valued at net asset value per share. Securities and other assets generally valued on the basis of information from a third-party pricing service may also be valued at a broker/dealer bid quotation. In determining values, third-party pricing services can utilize both transaction data and market information such as yield, quality, coupon rate, maturity, type of issue, trading characteristics, and other market data. The values of foreign securities and other assets and liabilities expressed in foreign currencies are converted to U.S. dollars using the mean of bid and asked prices for rates provided by a third-party pricing service.
The Board of Trustees has delegated primary responsibility for determining or causing to be determined the value of the fund’s investments (including any fair valuation) to the adviser pursuant to valuation policies and procedures approved by the Board. If the adviser determines that reliable market quotations are not readily available, investments are valued at fair value as determined in good faith by the adviser in accordance with such procedures under the oversight of the Board of Trustees. Under the fund’s valuation policies and procedures, market quotations are not considered to be readily available for most types of debt instruments and floating rate loans and many types of derivatives. These investments are generally valued at fair value based on information from third-party pricing services. In addition, investments may be valued at fair value if the adviser determines that an investment’s value has been materially affected by events occurring after the close of the exchange or market on which the investment is principally traded (such as foreign exchange or market) and prior to the determination of the fund’s net asset value, or after the halt of trading of a specific security where trading does not resume prior to the close of the exchange or market on which the security is principally traded. Events that occur after foreign markets close (such as developments in foreign markets and significant movements in the U.S. markets) and prior to the determination of the fund’s net asset value may be deemed to have a material effect on the value of securities traded in foreign markets. Accordingly, the fund’s foreign equity securities may often be valued at fair value. The adviser generally relies on third-party pricing services or other information (such as the correlation with price movements of similar securities in the same or other markets; the type, cost and investment characteristics of the security; the business and financial condition of the issuer; and trading and other market data) to assist in determining whether to fair value and at what value to fair value an investment. The value of an investment for purposes of calculating the fund’s net asset value can differ depending on the source and method used to determine value. When fair valuation is used, the value of an investment used to determine the fund’s net asset value may differ from quoted or published prices for the same investment. There can be no assurance that the fund could obtain the fair value assigned to an investment if it were to sell the investment at the same time at which the fund determines its net asset value per share.
23
Notes to Financial Statements (unaudited) – continued
Various inputs are used in determining the value of the fund’s assets or liabilities. These inputs are categorized into three broad levels. In certain cases, the inputs used to measure fair value may fall into different levels of the fair value hierarchy. In such cases, an investment’s level within the fair value hierarchy is based on the lowest level of input that is significant to the fair value measurement. The fund’s assessment of the significance of a particular input to the fair value measurement in its entirety requires judgment, and considers factors specific to the investment. Level 1 includes unadjusted quoted prices in active markets for identical assets or liabilities. Level 2 includes other significant observable market-based inputs (including quoted prices for similar securities, interest rates, prepayment speed, and credit risk). Level 3 includes unobservable inputs, which may include the adviser’s own assumptions in determining the fair value of investments. The following is a summary of the levels used as of February 29, 2020 in valuing the fund’s assets or liabilities:
| | | | | | | | | | | | | | | | |
| | | | |
| Financial Instruments | | Level 1 | | | Level 2 | | | Level 3 | | | Total | |
| Equity Securities: | | | | | | | | | | | | | | | | |
United States | | | $2,880,079 | | | | $51,124 | | | | $— | | | | $2,931,203 | |
Japan | | | — | | | | 415,035 | | | | — | | | | 415,035 | |
France | | | — | | | | 295,312 | | | | — | | | | 295,312 | |
Switzerland | | | — | | | | 293,151 | | | | — | | | | 293,151 | |
United Kingdom | | | — | | | | 206,133 | | | | — | | | | 206,133 | |
South Korea | | | — | | | | 175,715 | | | | — | | | | 175,715 | |
Canada | | | 155,001 | | | | — | | | | — | | | | 155,001 | |
Taiwan | | | 108,865 | | | | 19,053 | | | | — | | | | 127,918 | |
China | | | — | | | | 104,062 | | | | — | | | | 104,062 | |
Other Countries | | | 58,918 | | | | 416,148 | | | | — | | | | 475,066 | |
| Mutual Funds | | | 183,817 | | | | — | | | | — | | | | 183,817 | |
| Total | | | $3,386,680 | | | | $1,975,733 | | | | $— | | | | $5,362,413 | |
For further information regarding security characteristics, see the Portfolio of Investments.
Foreign Currency Translation– Purchases and sales of foreign investments, income, and expenses are converted into U.S. dollars based upon currency exchange rates prevailing on the respective dates of such transactions or on the reporting date for foreign denominated receivables and payables. Gains and losses attributable to foreign currency exchange rates on sales of securities are recorded for financial statement purposes as net realized gains and losses on investments. Gains and losses attributable to foreign exchange rate movements on receivables, payables, income and expenses are recorded for financial statement purposes as foreign currency transaction gains and losses. That portion of both realized and unrealized gains and losses on investments that results from fluctuations in foreign currency exchange rates is not separately disclosed.
Indemnifications – Under the fund’s organizational documents, its officers and Trustees may be indemnified against certain liabilities and expenses arising out of the performance of their duties to the fund. Additionally, in the normal course of business, the fund enters into agreements with service providers that may contain indemnification clauses. The fund’s maximum exposure under these agreements is unknown as this would involve future claims that may be made against the fund that have not yet occurred.
24
Notes to Financial Statements (unaudited) – continued
Investment Transactions and Income – Investment transactions are recorded on the trade date. Dividends received in cash are recorded on theex-dividend date. Certain dividends from foreign securities will be recorded when the fund is informed of the dividend if such information is obtained subsequent to theex-dividend date. Dividend payments received in additional securities are recorded on theex-dividend date in an amount equal to the value of the security on such date.
The fund may receive proceeds from litigation settlements. Any proceeds received from litigation involving portfolio holdings are reflected in the Statement of Operations in realized gain/loss if the security has been disposed of by the fund or in unrealized gain/loss if the security is still held by the fund. Any other proceeds from litigation not related to portfolio holdings are reflected as other income in the Statement of Operations.
Tax Matters and Distributions – The fund intends to qualify as a regulated investment company, as defined under Subchapter M of the Internal Revenue Code, and to distribute all of its taxable income, including realized capital gains. As a result, no provision for federal income tax is required. The fund’s federal tax returns, when filed, will remain subject to examination by the Internal Revenue Service for a three year period. Management has analyzed the fund’s tax positions taken on federal and state tax returns for all open tax years and does not believe that there are any uncertain tax positions that require recognition of a tax liability. Foreign taxes, if any, have been accrued by the fund in the accompanying financial statements in accordance with the applicable foreign tax law. Foreign income taxes may be withheld by certain countries in which the fund invests. Additionally, capital gains realized by the fund on securities issued in or by certain foreign countries may be subject to capital gains tax imposed by those countries.
Distributions to shareholders are recorded on theex-dividend date. Income and capital gain distributions are determined in accordance with income tax regulations, which may differ from U.S. generally accepted accounting principles. Certain capital accounts in the financial statements are periodically adjusted for permanent differences in order to reflect their tax character. These adjustments have no impact on net assets or net asset value per share. Temporary differences which arise from recognizing certain items of income, expense, gain or loss in different periods for financial statement and tax purposes will reverse at some time in the future.
Book/tax differences primarily relate to wash sale loss deferrals and treating a portion of the proceeds from redemptions as a distribution for tax purposes.
The tax character of distributions made during the current period will be determined at fiscal year end. The tax character of distributions declared to shareholders for the last fiscal year is as follows:
| | | | |
| |
| | | Year ended
8/31/19 | |
Ordinary income (including any short-term capital gains) | | | $195,021 | |
| Long-term capital gains | | | 337,009 | |
| Total distributions | | | $532,030 | |
25
Notes to Financial Statements (unaudited) – continued
The federal tax cost and the tax basis components of distributable earnings were as follows:
| | | | |
| |
| As of 2/29/20 | | | |
| |
| Cost of investments | | | $4,882,840 | |
| Gross appreciation | | | 819,615 | |
| |
| Gross depreciation | | | (340,042 | ) |
| Net unrealized appreciation (depreciation) | | | $479,573 | |
| |
| As of 8/31/19 | | | |
| |
| Undistributed ordinary income | | | 64,555 | |
| Undistributed long-term capital gain | | | 139,579 | |
| Other temporary differences | | | 957 | |
| Net unrealized appreciation (depreciation) | | | 484,728 | |
The aggregate cost above includes prior fiscal year end tax adjustments, if applicable.
Multiple Classes of Shares of Beneficial Interest – The fund offers multiple classes of shares, which differ in their respective distribution and service fees. The fund’s income, realized and unrealized gain (loss), and common expenses are allocated to shareholders based on the daily net assets of each class. Dividends are declared separately for each class. Differences in per share dividend rates are generally due to differences in separate class expenses. Class B shares will convert to Class A shares approximately eight years after purchase. Class C shares will convert to Class A shares approximately ten years after purchase. The fund’s distributions declared to shareholders as reported in the Statements of Changes in Net Assets are presented by class as follows:
| | | | | | | | |
| | |
| | | Six months
ended
2/29/20 | | | Year
ended
8/31/19 | |
| Class A | | | $42,752 | | | | $91,900 | |
| Class B | | | 3,366 | | | | 6,362 | |
| Class C | | | 6,011 | | | | 16,224 | |
| Class I | | | 13,565 | | | | 50,229 | |
| Class R1 | | | 2,233 | | | | 5,584 | |
| Class R2 | | | 2,602 | | | | 5,974 | |
| Class R3 | | | 2,792 | | | | 6,174 | |
| Class R4 | | | 2,985 | | | | 6,376 | |
| Class R6 | | | 145,696 | | | | 343,207 | |
| Total | | | $222,002 | | | | $532,030 | |
(3) Transactions with Affiliates
Investment Adviser – The fund has an investment advisory agreement with MFS to provide overall investment management and related administrative services and facilities to the fund. The management fee is computed daily and paid monthly at the following annual rates based on the fund’s average daily net assets:
| | | | |
| Up to $1 billion | | | 0.50 | % |
| In excess of $1 billion and up to $2.5 billion | | | 0.475 | % |
| In excess of $2.5 billion | | | 0.45 | % |
26
Notes to Financial Statements (unaudited) – continued
MFS has agreed in writing to reduce its management fee by a specified amount if certain MFS mutual fund assets exceed thresholds agreed to by MFS and the fund’s Board of Trustees. For the six months ended February 29, 2020, this management fee reduction amounted to $278, which is included in the reduction of total expenses in the Statement of Operations. The management fee incurred for the six months ended February 29, 2020 was equivalent to an annual effective rate of 0.49% of the fund’s average daily net assets.
The investment adviser has agreed in writing to pay a portion of the fund’s total annual operating expenses, excluding interest, taxes, extraordinary expenses, brokerage and transaction costs, and investment-related expenses, such that total fund operating expenses do not exceed the following rates annually of each class’s average daily net assets:
| | | | | | | | | | | | | | | | | | | | | | | | | | | | | | | | |
| Classes | |
| | | | | | | | |
| A | | B | | | C | | | I | | | R1 | | | R2 | | | R3 | | | R4 | | | R6 | |
| 0.89% | | | 1.64% | | | | 1.64% | | | | 0.64% | | | | 1.64% | | | | 1.14% | | | | 0.89% | | | | 0.64% | | | | 0.60% | |
This written agreement will continue until modified by the fund’s Board of Trustees, but such agreement will continue at least until December 31, 2020. For the six months ended February 29, 2020, this reduction amounted to $124,191, which is included in the reduction of total expenses in the Statement of Operations.
Distributor – MFS Fund Distributors, Inc. (MFD), a wholly-owned subsidiary of MFS, as distributor, received $347 for the six months ended February 29, 2020, as its portion of the initial sales charge on sales of Class A shares of the fund.
The Board of Trustees has adopted a distribution plan for certain share classes pursuant to Rule12b-1 of the Investment Company Act of 1940.
The fund’s distribution plan provides that the fund will pay MFD for services provided by MFD and financial intermediaries in connection with the distribution and servicing of certain share classes. One component of the plan is a distribution fee paid to MFD and another component of the plan is a service fee paid to MFD. MFD may subsequently pay all, or a portion, of the distribution and/or service fees to financial intermediaries.
Distribution Plan Fee Table:
| | | | | | | | | | | | | | | | | | | | |
| | | | | |
| | | Distribution
Fee Rate (d) | | | Service
Fee Rate (d) | | | Total
Distribution
Plan (d) | | | Annual
Effective
Rate (e) | | | Distribution
and Service
Fee | |
| Class A | | | — | | | | 0.25% | | | | 0.25% | | | | 0.25% | | | | $1,353 | |
| Class B | | | 0.75% | | | | 0.25% | | | | 1.00% | | | | 1.00% | | | | 519 | |
| Class C | | | 0.75% | | | | 0.25% | | | | 1.00% | | | | 1.00% | | | | 945 | |
| Class R1 | | | 0.75% | | | | 0.25% | | | | 1.00% | | | | 1.00% | | | | 347 | |
| Class R2 | | | 0.25% | | | | 0.25% | | | | 0.50% | | | | 0.50% | | | | 178 | |
| Class R3 | | | — | | | | 0.25% | | | | 0.25% | | | | 0.25% | | | | 89 | |
| Total Distribution and Service Fees | | | | | | | | | | | | $3,431 | |
| (d) | In accordance with the distribution plan for certain classes, the fund pays distribution and/or service fees equal to these annual percentage rates of each class’s average daily net assets. The distribution and service fee rates disclosed by class represent the current rates in effect at the end of the reporting period. Any rate changes, if applicable, are detailed below. |
27
Notes to Financial Statements (unaudited) – continued
| (e) | The annual effective rates represent actual fees incurred under the distribution plan for the six months ended February 29, 2020 based on each class’s average daily net assets. MFD has voluntarily agreed to rebate a portion of each class’s 0.25% service fee attributable to accounts for which MFD retains the 0.25% service fee except for accounts attributable to MFS or its affiliates’ seed money. There were no service fee rebates for the six months ended February 29, 2020. |
Certain Class A shares are subject to a contingent deferred sales charge (CDSC) in the event of a shareholder redemption within 18 months of purchase. Class B shares are subject to a CDSC in the event of a shareholder redemption within six years of purchase. Class C shares are subject to a CDSC in the event of a shareholder redemption within 12 months of purchase. There were no contingent deferred sales charges imposed during the six months ended February 29, 2020.
Shareholder Servicing Agent – MFS Service Center, Inc. (MFSC), a wholly-owned subsidiary of MFS, receives a fee from the fund for its services as shareholder servicing agent calculated as a percentage of the average daily net assets of the fund as determined periodically under the supervision of the fund’s Board of Trustees. For the six months ended February 29, 2020, the fee was $353, which equated to 0.0129% annually of the fund’s average daily net assets. MFSC also receives payment from the fund forout-of-pocket expenses,sub-accounting and other shareholder servicing costs which may be paid to affiliated and unaffiliated service providers. Class R6 shares do not incursub-accounting fees. For the six months ended February 29, 2020, theseout-of-pocket expenses,sub-accounting and other shareholder servicing costs amounted to $890.
Administrator – MFS provides certain financial, legal, shareholder communications, compliance, and other administrative services to the fund. Under an administrative services agreement, the fund reimburses MFS the costs incurred to provide these services. The fund is charged an annual fixed amount of $17,500 plus a fee based on average daily net assets. The administrative services fee incurred for the six months ended February 29, 2020 was equivalent to an annual effective rate of 0.3176% of the fund’s average daily net assets.
Trustees’ and Officers’ Compensation – The fund pays compensation to independent Trustees in the form of a retainer, attendance fees, and additional compensation to Board and Committee chairpersons. The fund does not pay compensation directly to Trustees or officers of the fund who are also officers of the investment adviser, all of whom receive remuneration from MFS for their services to the fund. Certain officers and Trustees of the fund are officers or directors of MFS, MFD, and MFSC.
Other – The fund invests in the MFS Institutional Money Market Portfolio which is managed by MFS and seeks current income consistent with preservation of capital and liquidity. This money market fund does not pay a management fee to MFS but does incur investment and operating costs.
On March 13, 2019, MFS redeemed 44,092 shares of Class R6 for an aggregate amount of $500,000.
At February 29, 2020, MFS held approximately 67% of the outstanding shares of Class B, 92% of the outstanding shares of Class R6, and 100% of the outstanding shares of Class R1, Class R2, Class R3, and Class R4, respectively.
28
Notes to Financial Statements (unaudited) – continued
The adviser has voluntarily undertaken to reimburse the fund from its own resources on a quarterly basis for the cost of investment research embedded in the cost of the fund’s securities trades. This agreement may be rescinded at any time. For the six months ended February 29, 2020, this reimbursement amounted to $97, which is included in “Other” income in the Statement of Operations.
(4) Portfolio Securities
For the six months ended February 29, 2020, purchases and sales of investments, other than short-term obligations, aggregated $1,230,377 and $1,065,971, respectively.
(5) Shares of Beneficial Interest
The fund’s Declaration of Trust permits the Trustees to issue an unlimited number of full and fractional shares of beneficial interest. Transactions in fund shares were as follows:
| | | | | | | | | | | | | | | | |
| | | Six months ended
2/29/20 | | | Year ended
8/31/19 | |
| | | | |
| | | Shares | | | Amount | | | Shares | | | Amount | |
| Shares sold | | | | | | | | | | | | | | | | |
Class A | | | 11,806 | | | | $141,967 | | | | 36,641 | | | | $429,217 | |
Class B | | | — | | | | — | | | | 2,220 | | | | 23,726 | |
Class C | | | 39 | | | | 469 | | | | 2,432 | | | | 27,363 | |
Class I | | | 1,458 | | | | 17,868 | | | | 1,727 | | | | 22,382 | |
Class R6 | | | 6,449 | | | | 77,767 | | | | 12,407 | | | | 141,409 | |
| | | 19,752 | | | | $238,071 | | | | 55,427 | | | | $644,097 | |
| | | | |
Shares issued to shareholders in
reinvestment of distributions | | | | | | | | | | | | | | | | |
Class A | | | 3,519 | | | | $42,752 | | | | 8,931 | | | | $91,900 | |
Class B | | | 277 | | | | 3,366 | | | | 618 | | | | 6,362 | |
Class C | | | 494 | | | | 6,011 | | | | 1,575 | | | | 16,224 | |
Class I | | | 1,114 | | | | 13,565 | | | | 4,867 | | | | 50,229 | |
Class R1 | | | 183 | | | | 2,233 | | | | 542 | | | | 5,584 | |
Class R2 | | | 214 | | | | 2,602 | | | | 579 | | | | 5,974 | |
Class R3 | | | 229 | | | | 2,792 | | | | 599 | | | | 6,174 | |
Class R4 | | | 245 | | | | 2,985 | | | | 618 | | | | 6,376 | |
Class R6 | | | 11,962 | | | | 145,696 | | | | 33,289 | | | | 343,207 | |
| | | 18,237 | | | | $222,002 | | | | 51,618 | | | | $532,030 | |
| | | | |
| Shares reacquired | | | | | | | | | | | | | | | | |
Class A | | | (4,588 | ) | | | $(54,945 | ) | | | (29,135 | ) | | | $(339,319 | ) |
Class B | | | (15 | ) | | | (184 | ) | | | (168 | ) | | | (1,884 | ) |
Class C | | | (45 | ) | | | (550 | ) | | | (5,293 | ) | | | (61,585 | ) |
Class I | | | (2,157 | ) | | | (26,118 | ) | | | (27,405 | ) | | | (306,925 | ) |
Class R6 | | | (2,304 | ) | | | (27,747 | ) | | | (46,110 | ) | | | (523,620 | ) |
| | | (9,109 | ) | | | $(109,544 | ) | | | (108,111 | ) | | | $(1,233,333 | ) |
29
Notes to Financial Statements (unaudited) – continued
| | | | | | | | | | | | | | | | |
| | | Six months ended
2/29/20 | | | Year ended
8/31/19 | |
| | | | |
| | | Shares | | | Amount | | | Shares | | | Amount | |
| Net change | | | | | | | | | | | | | | | | |
Class A | | | 10,737 | | | | $129,774 | | | | 16,437 | | | | $181,798 | |
Class B | | | 262 | | | | 3,182 | | | | 2,670 | | | | 28,204 | |
Class C | | | 488 | | | | 5,930 | | | | (1,286 | ) | | | (17,998 | ) |
Class I | | | 415 | | | | 5,315 | | | | (20,811 | ) | | | (234,314 | ) |
Class R1 | | | 183 | | | | 2,233 | | | | 542 | | | | 5,584 | |
Class R2 | | | 214 | | | | 2,602 | | | | 579 | | | | 5,974 | |
Class R3 | | | 229 | | | | 2,792 | | | | 599 | | | | 6,174 | |
Class R4 | | | 245 | | | | 2,985 | | | | 618 | | | | 6,376 | |
Class R6 | | | 16,107 | | | | 195,716 | | | | (414 | ) | | | (39,004 | ) |
| | | 28,880 | | | | $350,529 | | | | (1,066 | ) | | | $(57,206 | ) |
Class T shares were not publicly available for sale during the period. Please see the fund’s prospectus for details.
Effective June 1, 2019, purchases of the fund’s Class B shares are closed to new and existing investors subject to certain exceptions. Please see the fund’s prospectus for details.
(6) Line of Credit
The fund and certain other funds managed by MFS participate in a $1.25 billion unsecured committed line of credit, subject to a $1 billion sublimit, provided by a syndicate of banks under a credit agreement. Borrowings may be made for temporary financing needs. Interest is charged to each fund, based on its borrowings, generally at a rate equal to the highest of one month LIBOR, the Federal Funds Effective Rate and the Overnight Bank Funding Rate, plus an agreed upon spread. A commitment fee, based on the average daily, unused portion of the committed line of credit, is allocated among the participating funds. In addition, the fund and other funds managed by MFS have established unsecured uncommitted borrowing arrangements with certain banks for temporary financing needs. Interest is charged to each fund, based on its borrowings, at rates equal to customary reference rates plus an agreed upon spread. For the six months ended February 29, 2020, the fund’s commitment fee and interest expense were $15 and $0, respectively, and are included in “Miscellaneous” expense in the Statement of Operations.
30
Notes to Financial Statements (unaudited) – continued
(7) Investments in Affiliated Issuers
An affiliated issuer may be considered one in which the fund owns 5% or more of the outstanding voting securities, or a company which is under common control. For the purposes of this report, the following were affiliated issuers:
| | | | | | | | | | | | | | | | | | | | | | | | |
| | | | | | |
| Affiliated Issuers | | Beginning
Value | | | Purchases | | | Sales
Proceeds | | | Realized
Gain
(Loss) | | | Change in
Unrealized
Appreciation or
Depreciation | | | Ending
Value | |
| MFS Institutional Money Market Portfolio | | | $156,608 | | | | $407,656 | | | | $380,446 | | | | $(2 | ) | | | $1 | | | | $183,817 | |
| | | | | | |
| Affiliated Issuers | | | | | | | | | | | | | | Dividend
Income | | | Capital Gain
Distributions | |
| MFS Institutional Money Market Portfolio | | | | | | | | | | | | | | | | $778 | | | | $— | |
(8) Impacts of COVID-19
The pandemic related to the global spread of novel coronavirus disease (COVID-19), which was first detected in December 2019, has resulted in significant disruptions to global business activity and the global economy, as well as the economies of individual countries, the financial performance of individual companies and sectors, and the securities and commodities markets in general. This pandemic, the full effects of which are still unknown, has resulted in substantial market volatility and may have adversely impacted the prices and liquidity of the fund’s investments and the fund’s performance during the period February 29, 2020 through April 16, 2020, the date that these financial statements were issued.
31
PROXY VOTING POLICIES AND INFORMATION
MFS votes proxies on behalf of the fund pursuant to proxy voting policies and procedures that are available without charge, upon request, by calling1-800-225-2606, by visitingmfs.com/proxyvoting, or by visiting the SEC’s Web site athttp://www.sec.gov.
Information regarding how the fund voted proxies relating to portfolio securities during the most recent twelve-month period ended June 30 is available by August 31 of each year without charge by visitingmfs.com/proxyvoting, or by visiting the SEC’s Web site athttp://www.sec.gov.
QUARTERLY PORTFOLIO DISCLOSURE
The fund files a complete schedule of portfolio holdings with the SEC for the first and third quarters of each fiscal year as an exhibit to its reports onForm N-PORT. The fund’s Form N-PORT reports are available on the SEC’s website athttp://www.sec.gov.A shareholder can obtain the portfolio holdings report for the first and third quarters of the fund’s fiscal year atmfs.com/openendfunds by choosing the fund’s name and then selecting the “Resources” tab and clicking on “Prospectus and Reports”.
FURTHER INFORMATION
From time to time, MFS may post important information about the fund or the MFS funds on the MFS web site (mfs.com). This information is available athttps://www.mfs.com/en-us/what-we-do/announcements.html or atmfs.com/openendfunds by choosing the fund’s name.
INFORMATION ABOUT FUND CONTRACTS AND LEGAL CLAIMS
The fund has entered into contractual arrangements with an investment adviser, administrator, distributor, shareholder servicing agent, 529 program manager (if applicable), and custodian who each provide services to the fund. Unless expressly stated otherwise, shareholders are not parties to, or intended beneficiaries of these contractual arrangements, and these contractual arrangements are not intended to create any shareholder right to enforce them against the service providers or to seek any remedy under them against the service providers, either directly or on behalf of the fund.
Under the Trust’s By-Laws and Declaration of Trust, any claims asserted against or on behalf of the MFS Funds, including claims against Trustees and Officers, must be brought in state and federal courts located within the Commonwealth of Massachusetts.
PROVISION OF FINANCIAL REPORTS AND SUMMARY PROSPECTUSES
The fund produces financial reports every six months and updates its summary prospectus and prospectus annually. To avoid sending duplicate copies of materials to households, only one copy of the fund’s annual and semiannual report and summary prospectus may be mailed to shareholders having the same last name and residential address on the fund’s records. However, any shareholder may contact MFSC (please see back cover for address and telephone number) to request that copies of these reports and summary prospectuses be sent personally to that shareholder.
32
Save paper with eDelivery.

| MFS® will send you prospectuses, |
reports, and proxies directly viae-mail so you will get information faster with less mailbox clutter.
To sign up:
1. Go to mfs.com.
2. Log in via MFS® Access.
3. Select eDelivery.
If you own your MFS fund shares through a financial institution or a retirement plan, MFS® TALK, MFS® Access, or eDelivery may not be available to you.
CONTACT
WEB SITE
mfs.com
MFS TALK
1-800-637-8255
24 hours a day
ACCOUNT SERVICE AND LITERATURE
Shareholders
1-800-225-2606
Financial advisors
1-800-343-2829
Retirement plan services
1-800-637-1255
MAILING ADDRESS
MFS Service Center, Inc.
P.O. Box 219341
Kansas City, MO 64121-9341
OVERNIGHT MAIL
MFS Service Center, Inc.
Suite 219341
430 W 7th Street
Kansas City, MO 64105-1407
Semiannual Report
February 29, 2020

MFS® Blended Research® International Equity Fund

Beginning on January 1, 2021, as permitted by regulations adopted by the U.S. Securities and Exchange Commission, paper copies of the fund’s annual and semiannual shareholder reports will no longer be sent by mail, unless you specifically request paper copies of the reports. Instead, the complete reports will be made available on the fund’s Web site (funds.mfs.com), and you will be notified by mail each time a report is posted and provided with a Web site link to access the report.
If you are already signed up to receive shareholder reports by email, you will not be affected by this change and you need not take any action. You may sign up to receive shareholder reports and other communications from the fund by email by contacting your financial intermediary (such as a broker-dealer or bank) or, if you hold your shares directly with the fund, by calling 1-800-225-2606 or by logging on to MFS Access at mfs.com.
Beginning on January 1, 2019, you may elect to receive all future reports in paper free of charge. Contact your financial intermediary to request that you continue to receive paper copies of your shareholder reports. If you invest directly with the fund, you can call 1-800-225-2606 or send an email request to orderliterature@mfs.com to let the fund know that you wish to continue receiving paper copies of your shareholder reports. Your election to receive reports in paper will apply to all funds held in your account if you invest through your financial intermediary or all funds held with the MFS fund complex if you invest directly.
BRX-SEM
MFS® Blended Research®
International Equity Fund
CONTENTS
The report is prepared for the general information of shareholders.
It is authorized for distribution to prospective investors only when preceded or accompanied by a current prospectus.
NOT FDIC INSURED• MAY LOSE VALUE• NO BANK GUARANTEE

LETTER FROM THE EXECUTIVE CHAIR
Dear Shareholders:
During the first quarter of 2020, market volatility reached levels not seen since the global financial crisis. Optimism heading into the year — on receding trade and
geopolitical risk along with easier central bank policies — was overwhelmed in February as the health effects of a novel coronavirus,COVID-19, spread beyond China’s borders, ultimately impacting more than 200 countries. The global pandemic prompted many governments to take drastic action to slow the spread of the virus, such as quarantines, school and business closures, and prohibitions on public gatherings. While these are important steps to protect the public health, they come at a cost: rising market volatility and an abrupt decline in growth.
Global central banks have taken aggressive, coordinated steps to cushion the economic and market fallout related to the virus, and
governments are undertaking unprecedented levels of fiscal stimulus. As uncertainty recedes, these measures can help create a supportive environment and encourage economic recovery. In the aftermath of the crisis, there are likely to be societal changes as households, businesses and governments adjust to a new reality and these alterations could change the investment landscape. Occurrences such as the COVID-19 outbreak demonstrate the importance of having a deep understanding of company fundamentals, and our global research platform has been built to do just that.
Here at MFS®, we aim to help our clients navigate the growing complexity of the markets and world economies. Our long-term investment philosophy and commitment to the responsible allocation of capital allow us to tune out the noise and uncover what we believe are the best, most durable investment opportunities in the market. Through our powerful global investment platform, we combine collective expertise, thoughtful risk management, and long-term discipline to create sustainable value for investors.
Respectfully,

Robert J. Manning
Executive Chair
MFS Investment Management
April 16, 2020
The opinions expressed in this letter are subject to change and may not be relied upon for investment advice. No forecasts can be guaranteed.
1
PORTFOLIO COMPOSITION
Portfolio structure

| | | | |
| Top ten holdings | | | | |
| Roche Holding AG | | | 2.8% | |
| Taiwan Semiconductor Manufacturing Co. Ltd., ADR | | | 2.3% | |
| Samsung Electronics Co. Ltd. | | | 2.2% | |
| Novartis AG | | | 2.2% | |
| Schneider Electric S.A. | | | 2.0% | |
| LVMH Moet Hennessy Louis Vuitton SE | | | 1.9% | |
| Zurich Insurance Group AG | | | 1.8% | |
| KDDI Corp. | | | 1.8% | |
| Olympus Corp. | | | 1.7% | |
| Hitachi Ltd. | | | 1.6% | |
| |
| GICS equity sectors (g) | | | | |
| Financials | | | 20.4% | |
| Industrials | | | 11.1% | |
| Information Technology | | | 11.0% | |
| Consumer Discretionary | | | 10.9% | |
| Health Care | | | 10.0% | |
| Consumer Staples | | | 9.5% | |
| Communication Services | | | 6.6% | |
| Materials | | | 5.8% | |
| Energy | | | 5.1% | |
| Real Estate | | | 3.9% | |
| Utilities | | | 3.1% | |
| | | | |
| Issuer country weightings (x) | | | | |
| Japan | | | 16.8% | |
| France | | | 10.5% | |
| United Kingdom | | | 9.0% | |
| Switzerland | | | 8.3% | |
| China | | | 8.1% | |
| Canada | | | 5.1% | |
| Australia | | | 4.9% | |
| South Korea | | | 4.5% | |
| Germany | | | 3.5% | |
| Other Countries | | | 29.3% | |
|
| Currency exposure weightings (y) | |
| Euro | | | 21.0% | |
| Japanese Yen | | | 16.8% | |
| British Pound Sterling | | | 9.0% | |
| Hong Kong Dollar | | | 8.8% | |
| Swiss Franc | | | 8.3% | |
| Australian Dollar | | | 4.9% | |
| United States Dollar | | | 4.9% | |
| South Korean Won | | | 4.5% | |
| Canadian Dollar | | | 3.5% | |
| Other Currencies | | | 18.3% | |
2
Portfolio Composition – continued
| (g) | The Global Industry Classification Standard (GICS®) was developed by and/or is the exclusive property of MSCI, Inc. and S&P Global Market Intelligence Inc. (“S&P Global Market Intelligence”). GICS is a service mark of MSCI and S&P Global Market Intelligence and has been licensed for use by MFS. |
| (x) | Represents the portfolio’s exposure to issuer countries as a percentage of a portfolio’s net assets. For purposes of this presentation, United States (included in Other Countries) includes Cash & Cash Equivalents. |
| (y) | Represents the portfolio’s exposure to a particular currency as a percentage of a portfolio’s net assets. For purposes of this presentation, United States Dollar includes Cash & Cash Equivalents. |
Cash & Cash Equivalents includes any cash, investments in money market funds, short-term securities, and other assets less liabilities. Please see the Statement of Assets and Liabilities for additional information related to the fund’s cash position and other assets and liabilities.
Percentages are based on net assets as of February 29, 2020.
The portfolio is actively managed and current holdings may be different.
3
EXPENSE TABLE
Fund expenses borne by the shareholders during the period, September 1, 2019 through February 29, 2020
As a shareholder of the fund, you incur two types of costs: (1) transaction costs, including sales charges (loads) on certain purchase or redemption payments, and (2) ongoing costs, including management fees; distribution and service(12b-1) fees; and other fund expenses. This example is intended to help you understand your ongoing costs (in dollars) of investing in the fund and to compare these costs with the ongoing costs of investing in other mutual funds.
The example is based on an investment of $1,000 invested at the beginning of the period and held for the entire period September 1, 2019 through February 29, 2020.
Actual Expenses
The first line for each share class in the following table provides information about actual account values and actual expenses. You may use the information in this line, together with the amount you invested, to estimate the expenses that you paid over the period. Simply divide your account value by $1,000 (for example, an $8,600 account value divided by $1,000 = 8.6), then multiply the result by the number in the first line under the heading entitled “Expenses Paid During Period” to estimate the expenses you paid on your account during this period.
Hypothetical Example for Comparison Purposes
The second line for each share class in the following table provides information about hypothetical account values and hypothetical expenses based on the fund’s actual expense ratio and an assumed rate of return of 5% per year before expenses, which is not the fund’s actual return. The hypothetical account values and expenses may not be used to estimate the actual ending account balance or expenses you paid for the period. You may use this information to compare the ongoing costs of investing in the fund and other funds. To do so, compare this 5% hypothetical example with the 5% hypothetical examples that appear in the shareholder reports of the other funds.
Please note that the expenses shown in the table are meant to highlight your ongoing costs only and do not reflect any transactional costs, such as sales charges (loads). Therefore, the second line for each share class in the table is useful in comparing ongoing costs only, and will not help you determine the relative total costs of owning different funds. In addition, if these transactional costs were included, your costs would have been higher.
4
Expense Table – continued
| | | | | | | | | | | | | | | | | | |
Share
Class | | | | Annualized
Expense
Ratio | | | Beginning
Account Value
9/01/19 | | | Ending
Account Value
2/29/20 | | | Expenses
Paid During
Period (p)
9/01/19-2/29/20 | |
| A | | Actual | | | 0.89% | | | | $1,000.00 | | | | $1,018.98 | | | | $4.47 | |
| | Hypothetical (h) | | | 0.89% | | | | $1,000.00 | | | | $1,020.44 | | | | $4.47 | |
| B | | Actual | | | 1.64% | | | | $1,000.00 | | | | $1,015.09 | | | | $8.22 | |
| | Hypothetical (h) | | | 1.64% | | | | $1,000.00 | | | | $1,016.71 | | | | $8.22 | |
| C | | Actual | | | 1.64% | | | | $1,000.00 | | | | $1,015.16 | | | | $8.22 | |
| | Hypothetical (h) | | | 1.64% | | | | $1,000.00 | | | | $1,016.71 | | | | $8.22 | |
| I | | Actual | | | 0.64% | | | | $1,000.00 | | | | $1,020.53 | | | | $3.22 | |
| | Hypothetical (h) | | | 0.64% | | | | $1,000.00 | | | | $1,021.68 | | | | $3.22 | |
| R1 | | Actual | | | 1.64% | | | | $1,000.00 | | | | $1,015.49 | | | | $8.22 | |
| | Hypothetical (h) | | | 1.64% | | | | $1,000.00 | | | | $1,016.71 | | | | $8.22 | |
| R2 | | Actual | | | 1.14% | | | | $1,000.00 | | | | $1,018.28 | | | | $5.72 | |
| | Hypothetical (h) | | | 1.14% | | | | $1,000.00 | | | | $1,019.19 | | | | $5.72 | |
| R3 | | Actual | | | 0.89% | | | | $1,000.00 | | | | $1,019.05 | | | | $4.47 | |
| | Hypothetical (h) | | | 0.89% | | | | $1,000.00 | | | | $1,020.44 | | | | $4.47 | |
| R4 | | Actual | | | 0.64% | | | | $1,000.00 | | | | $1,020.47 | | | | $3.22 | |
| | Hypothetical (h) | | | 0.64% | | | | $1,000.00 | | | | $1,021.68 | | | | $3.22 | |
| R6 | | Actual | | | 0.54% | | | | $1,000.00 | | | | $1,020.44 | | | | $2.71 | |
| | Hypothetical (h) | | | 0.54% | | | | $1,000.00 | | | | $1,022.18 | | | | $2.72 | |
| (h) | 5% class return per year before expenses. |
| (p) | “Expenses Paid During Period” are equal to each class’s annualized expense ratio, as shown above, multiplied by the average account value over the period, multiplied by 182/366 (to reflect theone-half year period). Expenses paid do not include any applicable sales charges (loads). If these transaction costs had been included, your costs would have been higher. |
5
PORTFOLIO OF INVESTMENTS
2/29/20 (unaudited)
The Portfolio of Investments is a complete list of all securities owned by your fund. It is categorized by broad-based asset classes.
| | | | | | | | |
| | |
| Issuer | | Shares/Par | | | Value ($) | |
| Common Stocks - 96.7% | | | | | | |
| Airlines - 0.9% | | | | | | |
| Air Canada (a) | | | 79,737 | | | $ | 2,034,638 | |
| Malaysia Airports Holdings Berhad | | | 455,200 | | | | 714,257 | |
| | | | | | | | |
| | | | | | | $ | 2,748,895 | |
| Alcoholic Beverages - 0.6% | | | | | | |
| China Resources Beer Holdings Co. Ltd. | | | 158,000 | | | $ | 736,364 | |
| Kweichow Moutai Co. Ltd., “A” | | | 6,560 | | | | 999,687 | |
| | | | | | | | |
| | | | | | | $ | 1,736,051 | |
| Apparel Manufacturers - 3.6% | | | | | | |
| Adidas AG | | | 15,743 | | | $ | 4,386,296 | |
| Burberry Group PLC | | | 39,621 | | | | 865,564 | |
| LVMH Moet Hennessy Louis Vuitton SE | | | 14,139 | | | | 5,833,447 | |
| | | | | | | | |
| | | | | | | $ | 11,085,307 | |
| Automotive - 3.9% | | | | | | |
| D’Ieteren S.A. | | | 26,093 | | | $ | 1,528,075 | |
| Kia Motors Corp. | | | 36,043 | | | | 1,089,392 | |
| Koito Manufacturing Co. Ltd. | | | 16,400 | | | | 660,919 | |
| Magna International, Inc. | | | 82,273 | | | | 3,769,749 | |
| PSA Peugeot Citroen S.A. | | | 126,287 | | | | 2,462,472 | |
| Stanley Electric Co. Ltd. | | | 63,800 | | | | 1,550,161 | |
| USS Co. Ltd. | | | 50,400 | | | | 794,422 | |
| | | | | | | | |
| | | | | | | $ | 11,855,190 | |
| Brokerage & Asset Managers - 0.7% | | | | | | |
| ASX Ltd. | | | 16,579 | | | $ | 789,221 | |
| IG Group Holdings PLC | | | 154,455 | | | | 1,339,136 | |
| | | | | | | | |
| | | | | | | $ | 2,128,357 | |
| Business Services - 2.5% | | | | | | |
| Auto Trader Group PLC | | | 106,007 | | | $ | 715,344 | |
| CGI, Inc. (a) | | | 8,031 | | | | 565,463 | |
| Infosys Ltd. | | | 192,833 | | | | 1,945,908 | |
| IPH Ltd. | | | 104,973 | | | | 567,563 | |
| Itochu Corp. | | | 90,800 | | | | 2,064,250 | |
| Superior Plus Corp. | | | 147,722 | | | | 1,103,857 | |
| Thomson Reuters Corp. | | | 10,473 | | | | 780,029 | |
| | | | | | | | |
| | | | | | | $ | 7,742,414 | |
6
Portfolio of Investments (unaudited) – continued
| | | | | | | | |
| | |
| Issuer | | Shares/Par | | | Value ($) | |
| Common Stocks - continued | | | | | | |
| Chemicals - 0.8% | | | | | | |
| Mitsubishi Chemical Holdings Corp. | | | 343,200 | | | $ | 2,298,298 | |
| | |
| Computer Software - 0.6% | | | | | | |
| Check Point Software Technologies Ltd. (a) | | | 18,205 | | | $ | 1,889,679 | |
| | |
| Computer Software - Systems - 4.0% | | | | | | |
| Amadeus IT Group S.A. | | | 12,545 | | | $ | 888,848 | |
| Fujitsu Ltd. | | | 44,300 | | | | 4,675,149 | |
| Hitachi Ltd. | | | 143,100 | | | | 4,800,000 | |
| NICE Systems Ltd., ADR (a) | | | 11,937 | | | | 1,955,639 | |
| | | | | | | | |
| | | | | | | $ | 12,319,636 | |
| Conglomerates - 0.2% | | | | | | |
| First Pacific Co. Ltd. | | | 2,616,000 | | | $ | 737,921 | |
| | |
| Construction - 0.9% | | | | | | |
| Anhui Conch Cement Co. Ltd. | | | 274,500 | | | $ | 2,030,140 | |
| Techtronic Industries Co. Ltd. | | | 99,000 | | | | 809,274 | |
| | | | | | | | |
| | | | | | | $ | 2,839,414 | |
| Consumer Products - 1.9% | | | | | | |
| Essity AB | | | 103,108 | | | $ | 3,091,987 | |
| L’Oréal | | | 10,534 | | | | 2,833,072 | |
| | | | | | | | |
| | | | | | | $ | 5,925,059 | |
| Consumer Services - 1.5% | | | | | | |
| Carsales.com Ltd. | | | 186,655 | | | $ | 1,931,180 | |
| Moneysupermarket.com Group PLC | | | 503,114 | | | | 2,017,961 | |
| TUI AG | | | 62,221 | | | | 490,682 | |
| | | | | | | | |
| | | | | | | $ | 4,439,823 | |
| Containers - 0.7% | | | | | | |
| Brambles Ltd. | | | 291,759 | | | $ | 2,245,887 | |
| | |
| Electrical Equipment - 3.6% | | | | | | |
| Legrand S.A. | | | 45,098 | | | $ | 3,481,635 | |
| Philips Lighting N.V. (n) | | | 56,388 | | | | 1,685,663 | |
| Schneider Electric SE | | | 58,821 | | | | 5,995,226 | |
| | | | | | | | |
| | | | | | | $ | 11,162,524 | |
| Electronics - 4.8% | | | | | | |
| Hoya Corp. | | | 9,200 | | | $ | 815,375 | |
| Samsung Electronics Co. Ltd. | | | 150,153 | | | | 6,792,925 | |
| Taiwan Semiconductor Manufacturing Co. Ltd., ADR | | | 132,989 | | | | 7,160,128 | |
| | | | | | | | |
| | | | | | | $ | 14,768,428 | |
7
Portfolio of Investments (unaudited) – continued
| | | | | | | | |
| | |
| Issuer | | Shares/Par | | | Value ($) | |
| Common Stocks - continued | | | | | | |
| Energy - Independent - 0.2% | | | | | | |
| CNOOC Ltd. | | | 350,000 | | | $ | 482,663 | |
| | |
| Energy - Integrated - 5.0% | | | | | | |
| BP PLC | | | 926,198 | | | $ | 4,797,526 | |
| China Petroleum & Chemical Corp. | | | 5,688,000 | | | | 2,951,661 | |
| Eni S.p.A. | | | 250,406 | | | | 3,099,902 | |
| Galp Energia SGPS S.A., “B” | | | 163,361 | | | | 2,242,429 | |
| LUKOIL PJSC, ADR | | | 24,966 | | | | 2,155,564 | |
| | | | | | | | |
| | | | | | | $ | 15,247,082 | |
| Engineering - Construction - 0.3% | | | | | | |
| Bouygues S.A. | | | 26,155 | | | $ | 1,041,233 | |
| | |
| Entertainment - 0.9% | | | | | | |
| CTS Eventim AG | | | 50,378 | | | $ | 2,664,574 | |
| | |
| Food & Beverages - 2.6% | | | | | | |
| AVI Ltd. | | | 207,293 | | | $ | 972,814 | |
| JBS S.A. | | | 336,212 | | | | 1,706,660 | |
| Nestle S.A. | | | 45,077 | | | | 4,670,290 | |
| WH Group Ltd. | | | 643,000 | | | | 659,971 | |
| | | | | | | | |
| | | | | | | $ | 8,009,735 | |
| Food & Drug Stores - 2.0% | | | | | | |
| Seven & I Holdings Co. Ltd. | | | 84,100 | | | $ | 2,871,816 | |
| Tesco PLC | | | 560,746 | | | | 1,656,324 | |
| Wesfarmers Ltd. | | | 62,119 | | | | 1,621,811 | |
| | | | | | | | |
| | | | | | | $ | 6,149,951 | |
| Gaming & Lodging - 0.5% | | | | | | |
| Genting Berhad | | | 1,282,300 | | | $ | 1,505,904 | |
| | |
| Health Maintenance Organizations - 0.3% | | | | | | |
| Qualicorp S.A. | | | 129,100 | | | $ | 988,769 | |
| | |
| Insurance - 5.6% | | | | | | |
| Aegon N.V. | | | 168,955 | | | $ | 576,634 | |
| Aviva PLC | | | 292,438 | | | | 1,342,006 | |
| BB Seguridade Participacoes S.A. | | | 280,700 | | | | 1,999,216 | |
| China Pacific Insurance Co. Ltd. | | | 777,400 | | | | 2,582,745 | |
| Fairfax Financial Holdings Ltd. | | | 2,941 | | | | 1,266,914 | |
| Manulife Financial Corp. | | | 238,939 | | | | 4,015,991 | |
| Zurich Insurance Group AG | | | 14,088 | | | | 5,482,607 | |
| | | | | | | | |
| | | | | | | $ | 17,266,113 | |
8
Portfolio of Investments (unaudited) – continued
| | | | | | | | |
| | |
| Issuer | | Shares/Par | | | Value ($) | |
| Common Stocks - continued | | | | | | |
| Internet - 0.8% | | | | | | |
| Alibaba Group Holding Ltd., ADR (a) | | | 5,474 | | | $ | 1,138,592 | |
| Tencent Holdings Ltd. | | | 26,500 | | | | 1,307,123 | |
| | | | | | | | |
| | | | | | | $ | 2,445,715 | |
| Machinery & Tools - 2.3% | | | | | | |
| Atlas Copco AB, “A” | | | 91,848 | | | $ | 3,296,675 | |
| Doosan Bobcat, Inc. | | | 114,497 | | | | 2,710,741 | |
| Weichai Power Co. Ltd., “H” | | | 578,000 | | | | 1,147,860 | |
| | | | | | | | |
| | | | | | | $ | 7,155,276 | |
| Major Banks - 8.3% | | | | | | |
| ABSA Group Ltd. | | | 254,108 | | | $ | 2,176,469 | |
| Banco do Brasil S.A. | | | 130,500 | | | | 1,367,479 | |
| Bank of China Ltd. | | | 2,364,000 | | | | 940,411 | |
| BNP Paribas | | | 92,185 | | | | 4,504,314 | |
| BOC Hong Kong Holdings Ltd. | | | 334,500 | | | | 1,155,812 | |
| China Construction Bank | | | 4,608,000 | | | | 3,753,864 | |
| Gentera S.A.B. de C.V. | | | 671,835 | | | | 644,768 | |
| Industrial & Commercial Bank of China, “H” | | | 2,350,000 | | | | 1,619,329 | |
| National Australia Bank Ltd. | | | 270,295 | | | | 4,363,443 | |
| Nedbank Group Ltd. | | | 99,398 | | | | 1,158,062 | |
| Sumitomo Mitsui Financial Group, Inc. | | | 116,600 | | | | 3,747,849 | |
| | | | | | | | |
| | | | | | | $ | 25,431,800 | |
| Medical & Health Technology & Services - 0.7% | | | | | | |
| Eurofins Scientific | | | 1,400 | | | $ | 706,238 | |
| Sonic Healthcare Ltd. | | | 76,294 | | | | 1,414,154 | |
| | | | | | | | |
| | | | | | | $ | 2,120,392 | |
| Medical Equipment - 1.7% | | | | | | |
| Olympus Corp. | | | 291,400 | | | $ | 5,270,445 | |
| | |
| Metals & Mining - 2.6% | | | | | | |
| Anglo American PLC | | | 29,244 | | | $ | 679,564 | |
| Fortescue Metals Group Ltd. | | | 346,167 | | | | 2,258,209 | |
| Kumba Iron Ore Ltd. | | | 14,883 | | | | 278,144 | |
| POSCO | | | 8,912 | | | | 1,432,074 | |
| Rio Tinto PLC | | | 71,805 | | | | 3,365,447 | |
| | | | | | | | |
| | | | | | | $ | 8,013,438 | |
| Natural Gas - Distribution - 0.4% | | | | | | |
| ENGIE S.A. | | | 69,548 | | | $ | 1,163,990 | |
| | |
| Network & Telecom - 0.7% | | | | | | |
| VTech Holdings Ltd. | | | 225,600 | | | $ | 1,982,583 | |
9
Portfolio of Investments (unaudited) – continued
| | | | | | | | |
| | |
| Issuer | | Shares/Par | | | Value ($) | |
| Common Stocks - continued | | | | | | |
| Other Banks & Diversified Financials - 5.6% | | | | | | |
| Banco Macro S.A., ADR | | | 18,568 | | | $ | 538,101 | |
| DBS Group Holdings Ltd. | | | 242,900 | | | | 4,241,625 | |
| Hana Financial Group, Inc. | | | 25,602 | | | | 661,921 | |
| Intesa Sanpaolo S.p.A. | | | 1,840,108 | | | | 4,480,948 | |
| ORIX Corp. | | | 198,600 | | | | 3,169,567 | |
| REC Ltd. | | | 355,763 | | | | 578,554 | |
| Sberbank of Russia PJSC, ADR | | | 205,252 | | | | 2,911,185 | |
| Turkiye Garanti Bankasi A.S. (a) | | | 387,926 | | | | 612,952 | |
| | | | | | | | |
| | | | | | | $ | 17,194,853 | |
| Pharmaceuticals - 7.0% | | | | | | |
| Bayer AG | | | 48,914 | | | $ | 3,541,310 | |
| Novartis AG | | | 79,336 | | | | 6,660,197 | |
| Novo Nordisk A.S., “B” | | | 43,889 | | | | 2,608,475 | |
| Roche Holding AG | | | 26,285 | | | | 8,567,451 | |
| | | | | | | | |
| | | | | | | $ | 21,377,433 | |
| Precious Metals & Minerals - 0.4% | | | | | | |
| Impala Platinum Holdings Ltd. | | | 135,999 | | | $ | 1,100,642 | |
| | |
| Printing & Publishing - 0.4% | | | | | | |
| Transcontinental, Inc., “A” | | | 112,895 | | | $ | 1,364,244 | |
| | |
| Railroad & Shipping - 1.4% | | | | | | |
| East Japan Railway Co. | | | 34,300 | | | $ | 2,639,157 | |
| Sankyu, Inc. | | | 36,200 | | | | 1,536,595 | |
| | | | | | | | |
| | | | | | | $ | 4,175,752 | |
| Real Estate - 3.9% | | | | | | |
| Daito Trust Construction Co. Ltd. | | | 12,000 | | | $ | 1,235,246 | |
| Daiwa House Industry Co. Ltd. | | | 137,500 | | | | 3,785,799 | |
| Longfor Properties Co. Ltd. | | | 762,000 | | | | 3,553,947 | |
| Unibail-Rodamco-Westfield, REIT | | | 22,272 | | | | 2,688,415 | |
| Wheelock & Co. Ltd. | | | 94,000 | | | | 720,093 | |
| | | | | | | | |
| | | | | | | $ | 11,983,500 | |
| Restaurants - 0.5% | | | | | | |
| Greggs PLC | | | 53,618 | | | $ | 1,445,781 | |
| | |
| Specialty Chemicals - 1.4% | | | | | | |
| Akzo Nobel N.V. | | | 24,014 | | | $ | 1,927,925 | |
| L’Air Liquide S.A. | | | 9,905 | | | | 1,351,614 | |
| PTT Global Chemical PLC | | | 804,700 | | | | 1,051,937 | |
| | | | | | | | |
| | | | | | | $ | 4,331,476 | |
10
Portfolio of Investments (unaudited) – continued
| | | | | | | | |
| | |
| Issuer | | Shares/Par | | | Value ($) | |
| Common Stocks - continued | | | | | | |
| Specialty Stores - 0.7% | | | | | | |
| K’s Holdings Corp. | | | 61,000 | | | $ | 671,306 | |
| Vipshop Holdings Ltd., ADR (a) | | | 124,216 | | | | 1,593,691 | |
| | | | | | | | |
| | | | | | | $ | 2,264,997 | |
| Telecommunications - Wireless - 3.3% | | | | | | |
| Advanced Info Service Public Co. Ltd. | | | 203,500 | | | $ | 1,296,260 | |
| KDDI Corp. | | | 192,700 | | | | 5,445,777 | |
| Vodafone Group PLC | | | 2,011,242 | | | | 3,512,474 | |
| | | | | | | | |
| | | | | | | $ | 10,254,511 | |
| Telephone Services - 1.1% | | | | | | |
| Hellenic Telecommunications Organization S.A. | | | 171,401 | | | $ | 2,432,288 | |
| PT XL Axiata Tbk (a) | | | 4,521,900 | | | | 816,290 | |
| | | | | | | | |
| | | | | | | $ | 3,248,578 | |
| Tobacco - 2.9% | | | | | | |
| British American Tobacco PLC | | | 105,616 | | | $ | 4,197,157 | |
| Imperial Tobacco Group PLC | | | 63,482 | | | | 1,285,153 | |
| Japan Tobacco, Inc. | | | 175,700 | | | | 3,484,392 | |
| | | | | | | | |
| | | | | | | $ | 8,966,702 | |
| Utilities - Electric Power - 2.0% | | | | | | |
| Algonquin Power & Utilities Corp. | | | 57,667 | | | $ | 876,444 | |
| Iberdrola S.A. | | | 250,141 | | | | 2,863,027 | |
| NTPC Ltd. | | | 1,713,500 | | | | 2,537,843 | |
| | | | | | | | |
| | | | | | | $ | 6,277,314 | |
| Total Common Stocks (Identified Cost, $297,481,828) | | | | | | $ | 296,848,329 | |
| | |
| Preferred Stocks - 0.7% | | | | | | |
| Electronics - 0.4% | | | | | | |
| Samsung Electronics Co. Ltd. | | | 30,218 | | | $ | 1,147,252 | |
| | |
| Utilities - Electric Power - 0.3% | | | | | | |
| Companhia Paranaense de Energia | | | 62,600 | | | $ | 1,003,834 | |
| Total Preferred Stocks (Identified Cost, $1,853,235) | | | | | | $ | 2,151,086 | |
| | |
| Investment Companies (h) - 2.2% | | | | | | |
| Money Market Funds - 2.2% | | | | | | |
MFS Institutional Money Market Portfolio, 1.61% (v)
(Identified Cost, $6,718,050) | | | 6,718,021 | | | $ | 6,718,693 | |
| | |
| Other Assets, Less Liabilities - 0.4% | | | | | 1,253,340 | |
| Net Assets - 100.0% | | | | | | $ | 306,971,448 | |
11
Portfolio of Investments (unaudited) – continued
| (a) | Non-income producing security. |
| (h) | An affiliated issuer, which may be considered one in which the fund owns 5% or more of the outstanding voting securities, or a company which is under common control. At period end, the aggregate values of the fund’s investments in affiliated issuers and in unaffiliated issuers were $6,718,693 and $298,999,415, respectively. |
| (n) | Securities exempt from registration under Rule 144A of the Securities Act of 1933. These securities may be sold in the ordinary course of business in transactions exempt from registration, normally to qualified institutional buyers. At period end, the aggregate value of these securities was $1,685,663, representing 0.5% of net assets. |
| (v) | Affiliated issuer that is available only to investment companies managed by MFS. The rate quoted for the MFS Institutional Money Market Portfolio is the annualizedseven-day yield of the fund at period end. |
The following abbreviations are used in this report and are defined:
| ADR | | American Depositary Receipt |
| REIT | | Real Estate Investment Trust |
See Notes to Financial Statements
12
Financial Statements
STATEMENT OF ASSETS AND LIABILITIES
At 2/29/20 (unaudited)
This statement represents your fund’s balance sheet, which details the assets and liabilities comprising the total value of the fund.
| | | | |
| Assets | | | | |
Investments in unaffiliated issuers, at value (identified cost, $299,335,063) | | | $298,999,415 | |
Investments in affiliated issuers, at value (identified cost, $6,718,050) | | | 6,718,693 | |
Foreign currency, at value (identified cost, $653) | | | 656 | |
Receivables for | | | | |
Fund shares sold | | | 308,299 | |
Dividends | | | 1,205,124 | |
Receivable from investment adviser | | | 10,660 | |
Other assets | | | 1,279 | |
Total assets | | | $307,244,126 | |
| |
| Liabilities | | | | |
Payables for | | | | |
Fund shares reacquired | | | $108,610 | |
Payable to affiliates | | | | |
Administrative services fee | | | 425 | |
Shareholder servicing costs | | | 45,334 | |
Distribution and service fees | | | 1,732 | |
Payable for independent Trustees’ compensation | | | 776 | |
Deferred country tax expense payable | | | 361 | |
Accrued expenses and other liabilities | | | 115,440 | |
Total liabilities | | | $272,678 | |
Net assets | | | $306,971,448 | |
| |
| Net assets consist of | | | | |
Paid-in capital | | | $317,268,192 | |
Total distributable earnings (loss) | | | (10,296,744 | ) |
Net assets | | | $306,971,448 | |
Shares of beneficial interest outstanding | | | 29,741,931 | |
13
Statement of Assets and Liabilities (unaudited) – continued
| | | | | | | | | | | | |
| | | |
| | | Net assets | | | Shares
outstanding | | | Net asset value
per share (a) | |
Class A | | | $80,793,061 | | | | 7,851,459 | | | | $10.29 | |
Class B | | | 147,740 | | | | 14,397 | | | | 10.26 | |
Class C | | | 229,373 | | | | 22,399 | | | | 10.24 | |
Class I | | | 4,295,107 | | | | 415,869 | | | | 10.33 | |
Class R1 | | | 153,733 | | | | 15,081 | | | | 10.19 | |
Class R2 | | | 147,765 | | | | 14,321 | | | | 10.32 | |
Class R3 | | | 60,036 | | | | 5,787 | | | | 10.37 | |
Class R4 | | | 59,361 | | | | 5,745 | | | | 10.33 | |
Class R6 | | | 221,085,272 | | | | 21,396,873 | | | | 10.33 | |
| (a) | Maximum offering price per share was equal to the net asset value per share for all share classes, except for Class A, for which the maximum offering price per share was $10.92 [100 / 94.25 x $10.29]. On sales of $50,000 or more, the maximum offering price of Class A shares is reduced. A contingent deferred sales charge may be imposed on redemptions of Class A, Class B, and Class C shares. Redemption price per share was equal to the net asset value per share for Classes I, R1, R2, R3, R4, and R6. |
See Notes to Financial Statements
14
Financial Statements
STATEMENT OF OPERATIONS
Six months ended 2/29/20 (unaudited)
This statement describes how much your fund earned in investment income and accrued in expenses. It also describes any gains and/or losses generated by fund operations.
| | | | |
| Net investment income (loss) | | | | |
Income | | | | |
Dividends | | | $3,756,733 | |
Dividends from affiliated issuers | | | 27,174 | |
Other | | | 18,776 | |
Foreign taxes withheld | | | (290,747 | ) |
Total investment income | | | $3,511,936 | |
Expenses | | | | |
Management fee | | | $785,439 | |
Distribution and service fees | | | 112,589 | |
Shareholder servicing costs | | | 46,031 | |
Administrative services fee | | | 25,631 | |
Independent Trustees’ compensation | | | 4,886 | |
Custodian fee | | | 53,704 | |
Shareholder communications | | | 4,789 | |
Audit and tax fees | | | 43,968 | |
Legal fees | | | 1,315 | |
Registration fees | | | 63,014 | |
Miscellaneous | | | 17,765 | |
Total expenses | | | $1,159,131 | |
Reduction of expenses by investment adviser | | | (150,182 | ) |
Net expenses | | | $1,008,949 | |
Net investment income (loss) | | | $2,502,987 | |
| |
| Realized and unrealized gain (loss) | | | | |
Realized gain (loss) (identified cost basis) | | | | |
Unaffiliated issuers (net of $19,582 country tax) | | | $(2,690,938 | ) |
Affiliated issuers | | | (732 | ) |
Foreign currency | | | 4,623 | |
Net realized gain (loss) | | | $(2,687,047 | ) |
Change in unrealized appreciation or depreciation | | | | |
Unaffiliated issuers (net of $361 increase in deferred country tax) | | | $5,466,987 | |
Affiliated issuers | | | 352 | |
Translation of assets and liabilities in foreign currencies | | | (5,961 | ) |
Net unrealized gain (loss) | | | $5,461,378 | |
Net realized and unrealized gain (loss) | | | $2,774,331 | |
Change in net assets from operations | | | $5,277,318 | |
See Notes to Financial Statements
15
Financial Statements
STATEMENTS OF CHANGES IN NET ASSETS
These statements describe the increases and/or decreases in net assets resulting from operations, any distributions, and any shareholder transactions.
| | | | | | | | |
| Change in net assets | | Six months ended
2/29/20
(unaudited) | | | Year ended
8/31/19 | |
| | |
| From operations | | | | | | | | |
Net investment income (loss) | | | $2,502,987 | | | | $8,826,898 | |
Net realized gain (loss) | | | (2,687,047 | ) | | | (6,545,805 | ) |
Net unrealized gain (loss) | | | 5,461,378 | | | | (18,068,842 | ) |
Change in net assets from operations | | | $5,277,318 | | | | $(15,787,749 | ) |
Total distributions to shareholders | | | $(9,250,211 | ) | | | $(17,092,195 | ) |
Change in net assets from fund share transactions | | | $16,767,567 | | | | $28,949,353 | |
Total change in net assets | | | $12,794,674 | | | | $(3,930,591 | ) |
| | |
| Net assets | | | | | | | | |
At beginning of period | | | 294,176,774 | | | | 298,107,365 | |
At end of period | | | $306,971,448 | | | | $294,176,774 | |
See Notes to Financial Statements
16
Financial Statements
FINANCIAL HIGHLIGHTS
The financial highlights table is intended to help you understand the fund’s financial performance for the semiannual period and the past 5 fiscal years (or life of a particular share class, if shorter). Certain information reflects financial results for a single fund share. The total returns in the table represent the rate that an investor would have earned (or lost) on an investment in the fund share class (assuming reinvestment of all distributions) held for the entire period.
| | | | | | | | | | | | | | | | | | | | |
| | | Six months
ended
2/29/20 | | | Year ended | |
| Class A | | 8/31/19 | | | 8/31/18 | | | 8/31/17 | | | 8/31/16 (c) | |
| | | (unaudited) | | | | | | | | | | | | | |
Net asset value, beginning of period | | | $10.37 | | | | $11.71 | | | | $11.85 | | | | $9.82 | | | | $10.00 | |
| | |
| Income (loss) from investment operations | | | | | | | | | |
Net investment income (loss) (d) | | | $0.07 | | | | $0.30 | | | | $0.30 | | | | $0.25 | | | | $0.25 | |
Net realized and unrealized gain (loss) | | | 0.15 | | | | (1.01 | ) | | | (0.12 | ) | | | 1.82 | | | | (0.32 | ) |
Total from investment operations | | | $0.22 | | | | $(0.71 | ) | | | $0.18 | | | | $2.07 | | | | $(0.07 | ) |
| | |
| Less distributions declared to shareholders | | | | | | | | | |
From net investment income | | | $(0.30 | ) | | | $(0.26 | ) | | | $(0.18 | ) | | | $(0.04 | ) | | | $(0.06 | ) |
From net realized gain | | | — | | | | (0.37 | ) | | | (0.14 | ) | | | — | | | | (0.05 | ) |
Total distributions declared to shareholders | | | $(0.30 | ) | | | $(0.63 | ) | | | $(0.32 | ) | | | $(0.04 | ) | | | $(0.11 | ) |
Net asset value, end of period (x) | | | $10.29 | | | | $10.37 | | | | $11.71 | | | | $11.85 | | | | $9.82 | |
Total return (%) (r)(s)(t)(x) | | | 1.90 | (n) | | | (5.67 | ) | | | 1.47 | | | | 21.15 | | | | (0.64 | )(n) |
| | |
Ratios (%) (to average net assets)
and Supplemental data: | | | | | | | | | |
Expenses before expense reductions (f) | | | 0.99 | (a) | | | 1.00 | | | | 0.99 | | | | 0.98 | | | | 5.84 | (a) |
Expenses after expense reductions (f) | | | 0.89 | (a) | | | 0.89 | | | | 0.89 | | | | 0.89 | | | | 0.89 | (a) |
Net investment income (loss) | | | 1.36 | (a)(l) | | | 2.80 | | | | 2.49 | | | | 2.34 | | | | 2.70 | (a) |
Portfolio turnover | | | 29 | (n) | | | 58 | | | | 69 | | | | 63 | | | | 64 | (n) |
Net assets at end of period (000 omitted) | | | $80,793 | | | | $84,917 | | | | $88,168 | | | | $535 | | | | $139 | |
See Notes to Financial Statements
17
Financial Highlights – continued
| | | | | | | | | | | | | | | | | | | | |
| | | Six months
ended
2/29/20 | | | Year ended | |
| Class B | | 8/31/19 | | | 8/31/18 | | | 8/31/17 | | | 8/31/16 (c) | |
| | | (unaudited) | | | | | | | | | | | | | |
Net asset value, beginning of period | | | $10.32 | | | | $11.64 | | | | $11.75 | | | | $9.78 | | | | $10.00 | |
| | |
| Income (loss) from investment operations | | | | | | | | | |
Net investment income (loss) (d) | | | $0.03 | | | | $0.24 | | | | $0.20 | | | | $0.16 | | | | $0.15 | |
Net realized and unrealized gain (loss) | | | 0.15 | | | | (1.02 | ) | | | (0.11 | ) | | | 1.81 | | | | (0.28 | ) |
Total from investment operations | | | $0.18 | | | | $(0.78 | ) | | | $0.09 | | | | $1.97 | | | | $(0.13 | ) |
| | |
| Less distributions declared to shareholders | | | | | | | | | |
From net investment income | | | $(0.24 | ) | | | $(0.17 | ) | | | $(0.06 | ) | | | $— | | | | $(0.04 | ) |
From net realized gain | | | — | | | | (0.37 | ) | | | (0.14 | ) | | | — | | | | (0.05 | ) |
Total distributions declared to shareholders | | | $(0.24 | ) | | | $(0.54 | ) | | | $(0.20 | ) | | | $— | | | | $(0.09 | ) |
Net asset value, end of period (x) | | | $10.26 | | | | $10.32 | | | | $11.64 | | | | $11.75 | | | | $9.78 | |
Total return (%) (r)(s)(t)(x) | | | 1.51 | (n) | | | (6.41 | ) | | | 0.73 | | | | 20.14 | | | | (1.27 | )(n) |
| | |
Ratios (%) (to average net assets)
and Supplemental data: | | | | | | | | | |
Expenses before expense reductions (f) | | | 1.73 | (a) | | | 1.75 | | | | 1.74 | | | | 1.73 | | | | 7.12 | (a) |
Expenses after expense reductions (f) | | | 1.64 | (a) | | | 1.64 | | | | 1.64 | | | | 1.64 | | | | 1.63 | (a) |
Net investment income (loss) | | | 0.60 | (a)(l) | | | 2.28 | | | | 1.63 | | | | 1.51 | | | | 1.64 | (a) |
Portfolio turnover | | | 29 | (n) | | | 58 | | | | 69 | | | | 63 | | | | 64 | (n) |
Net assets at end of period (000 omitted) | | | $148 | | | | $152 | | | | $97 | | | | $109 | | | | $54 | |
| | |
| | | Six months
ended
2/29/20 | | | Year ended | |
| Class C | | 8/31/19 | | | 8/31/18 | | | 8/31/17 | | | 8/31/16 (c) | |
| | | (unaudited) | | | | | | | | | | | | | |
Net asset value, beginning of period | | | $10.28 | | | | $11.59 | | | | $11.75 | | | | $9.78 | | | | $10.00 | |
| | |
| Income (loss) from investment operations | | | | | | | | | |
Net investment income (loss) (d) | | | $0.03 | | | | $0.22 | | | | $0.21 | | | | $0.16 | | | | $0.16 | |
Net realized and unrealized gain (loss) | | | 0.15 | | | | (1.00 | ) | | | (0.11 | ) | | | 1.81 | | | | (0.29 | ) |
Total from investment operations | | | $0.18 | | | | $(0.78 | ) | | | $0.10 | | | | $1.97 | | | | $(0.13 | ) |
| | |
| Less distributions declared to shareholders | | | | | | | | | |
From net investment income | | | $(0.22 | ) | | | $(0.16 | ) | | | $(0.12 | ) | | | $— | | | | $(0.04 | ) |
From net realized gain | | | — | | | | (0.37 | ) | | | (0.14 | ) | | | — | | | | (0.05 | ) |
Total distributions declared to shareholders | | | $(0.22 | ) | | | $(0.53 | ) | | | $(0.26 | ) | | | $— | | | | $(0.09 | ) |
Net asset value, end of period (x) | | | $10.24 | | | | $10.28 | | | | $11.59 | | | | $11.75 | | | | $9.78 | |
Total return (%) (r)(s)(t)(x) | | | 1.52 | (n) | | | (6.42 | ) | | | 0.74 | | | | 20.14 | | | | (1.27 | )(n) |
| | |
Ratios (%) (to average net assets)
and Supplemental data: | | | | | | | | | |
Expenses before expense reductions (f) | | | 1.74 | (a) | | | 1.75 | | | | 1.75 | | | | 1.73 | | | | 7.03 | (a) |
Expenses after expense reductions (f) | | | 1.64 | (a) | | | 1.64 | | | | 1.64 | | | | 1.64 | | | | 1.63 | (a) |
Net investment income (loss) | | | 0.61 | (a)(l) | | | 2.04 | | | | 1.73 | | | | 1.54 | | | | 1.70 | (a) |
Portfolio turnover | | | 29 | (n) | | | 58 | | | | 69 | | | | 63 | | | | 64 | (n) |
Net assets at end of period (000 omitted) | | | $229 | | | | $240 | | | | $284 | | | | $133 | | | | $59 | |
See Notes to Financial Statements
18
Financial Highlights – continued
| | | | | | | | | | | | | | | | | | | | |
| | | Six months
ended
2/29/20 | | | Year ended | |
| Class I | | 8/31/19 | | | 8/31/18 | | | 8/31/17 | | | 8/31/16 (c) | |
| | | (unaudited) | | | | | | | | | | | | | |
Net asset value, beginning of period | | | $10.42 | | | | $11.77 | | | | $11.88 | | | | $9.84 | | | | $10.00 | |
| | |
| Income (loss) from investment operations | | | | | | | | | |
Net investment income (loss) (d) | | | $0.09 | | | | $0.31 | | | | $0.31 | | | | $0.29 | | | | $0.33 | |
Net realized and unrealized gain (loss) | | | 0.15 | | | | (1.00 | ) | | | (0.10 | ) | | | 1.80 | | | | (0.37 | ) |
Total from investment operations | | | $0.24 | | | | $(0.69 | ) | | | $0.21 | | | | $2.09 | | | | $(0.04 | ) |
| | |
| Less distributions declared to shareholders | | | | | | | | | |
From net investment income | | | $(0.33 | ) | | | $(0.29 | ) | | | $(0.18 | ) | | | $(0.05 | ) | | | $(0.07 | ) |
From net realized gain | | | — | | | | (0.37 | ) | | | (0.14 | ) | | | — | | | | (0.05 | ) |
Total distributions declared to shareholders | | | $(0.33 | ) | | | $(0.66 | ) | | | $(0.32 | ) | | | $(0.05 | ) | | | $(0.12 | ) |
Net asset value, end of period (x) | | | $10.33 | | | | $10.42 | | | | $11.77 | | | | $11.88 | | | | $9.84 | |
Total return (%) (r)(s)(t)(x) | | | 2.05 | (n) | | | (5.45 | ) | | | 1.74 | | | | 21.37 | | | | (0.37 | )(n) |
| | |
Ratios (%) (to average net assets)
and Supplemental data: | | | | | | | | | |
Expenses before expense reductions (f) | | | 0.74 | (a) | | | 0.75 | | | | 0.74 | | | | 0.73 | | | | 4.94 | (a) |
Expenses after expense reductions (f) | | | 0.64 | (a) | | | 0.64 | | | | 0.64 | | | | 0.64 | | | | 0.64 | (a) |
Net investment income (loss) | | | 1.58 | (a)(l) | | | 2.89 | | | | 2.50 | | | | 2.70 | | | | 3.65 | (a) |
Portfolio turnover | | | 29 | (n) | | | 58 | | | | 69 | | | | 63 | | | | 64 | (n) |
Net assets at end of period (000 omitted) | | | $4,295 | | | | $1,652 | | | | $1,760 | | | | $1,259 | | | | $640 | |
| | |
| | | Six months
ended
2/29/20 | | | Year ended | |
| Class R1 | | 8/31/19 | | | 8/31/18 | | | 8/31/17 | | | 8/31/16 (c) | |
| | | (unaudited) | | | | | | | | | | | | | |
Net asset value, beginning of period | | | $10.24 | | | | $11.63 | | | | $11.75 | | | | $9.78 | | | | $10.00 | |
| | |
| Income (loss) from investment operations | | | | | | | | | |
Net investment income (loss) (d) | | | $0.03 | | | | $0.22 | | | | $0.19 | | | | $0.15 | | | | $0.15 | |
Net realized and unrealized gain (loss) | | | 0.15 | | | | (1.01 | ) | | | (0.10 | ) | | | 1.82 | | | | (0.28 | ) |
Total from investment operations | | | $0.18 | | | | $(0.79 | ) | | | $0.09 | | | | $1.97 | | | | $(0.13 | ) |
| | |
| Less distributions declared to shareholders | | | | | | | | | |
From net investment income | | | $(0.23 | ) | | | $(0.23 | ) | | | $(0.07 | ) | | | $— | | | | $(0.04 | ) |
From net realized gain | | | — | | | | (0.37 | ) | | | (0.14 | ) | | | — | | | | (0.05 | ) |
Total distributions declared to shareholders | | | $(0.23 | ) | | | $(0.60 | ) | | | $(0.21 | ) | | | $— | | | | $(0.09 | ) |
Net asset value, end of period (x) | | | $10.19 | | | | $10.24 | | | | $11.63 | | | | $11.75 | | | | $9.78 | |
Total return (%) (r)(s)(t)(x) | | | 1.55 | (n) | | | (6.44 | ) | | | 0.72 | | | | 20.14 | | | | (1.27 | )(n) |
| | |
Ratios (%) (to average net assets)
and Supplemental data: | | | | | | | | | |
Expenses before expense reductions (f) | | | 1.73 | (a) | | | 1.75 | | | | 1.73 | | | | 1.72 | | | | 7.19 | (a) |
Expenses after expense reductions (f) | | | 1.64 | (a) | | | 1.64 | | | | 1.64 | | | | 1.64 | | | | 1.63 | (a) |
Net investment income (loss) | | | 0.58 | (a)(l) | | | 2.09 | | | | 1.54 | | | | 1.41 | | | | 1.60 | (a) |
Portfolio turnover | | | 29 | (n) | | | 58 | | | | 69 | | | | 63 | | | | 64 | (n) |
Net assets at end of period (000 omitted) | | | $154 | | | | $146 | | | | $60 | | | | $59 | | | | $49 | |
See Notes to Financial Statements
19
Financial Highlights – continued
| | | | | | | | | | | | | | | | | | | | |
| | | Six months
ended
2/29/20 | | | Year ended | |
| Class R2 | | 8/31/19 | | | 8/31/18 | | | 8/31/17 | | | 8/31/16 (c) | |
| | | (unaudited) | | | | | | | | | | | | | |
Net asset value, beginning of period | | | $10.38 | | | | $11.73 | | | | $11.84 | | | | $9.81 | | | | $10.00 | |
| | |
| Income (loss) from investment operations | | | | | | | | | |
Net investment income (loss) (d) | | | $0.06 | | | | $0.27 | | | | $0.29 | | | | $0.20 | | | | $0.19 | |
Net realized and unrealized gain (loss) | | | 0.15 | | | | (1.01 | ) | | | (0.13 | ) | | | 1.83 | | | | (0.28 | ) |
Total from investment operations | | | $0.21 | | | | $(0.74 | ) | | | $0.16 | | | | $2.03 | | | | $(0.09 | ) |
| | |
| Less distributions declared to shareholders | | | | | | | | | |
From net investment income | | | $(0.27 | ) | | | $(0.24 | ) | | | $(0.13 | ) | | | $(0.00 | )(w) | | | $(0.05 | ) |
From net realized gain | | | — | | | | (0.37 | ) | | | (0.14 | ) | | | — | | | | (0.05 | ) |
Total distributions declared to shareholders | | | $(0.27 | ) | | | $(0.61 | ) | | | $(0.27 | ) | | | $(0.00 | )(w) | | | $(0.10 | ) |
Net asset value, end of period (x) | | | $10.32 | | | | $10.38 | | | | $11.73 | | | | $11.84 | | | | $9.81 | |
Total return (%) (r)(s)(t)(x) | | | 1.83 | (n) | | | (5.95 | ) | | | 1.27 | | | | 20.74 | | | | (0.82 | )(n) |
| | |
Ratios (%) (to average net assets)
and Supplemental data: | | | | | | | | | |
Expenses before expense reductions (f) | | | 1.23 | (a) | | | 1.25 | | | | 1.25 | | | | 1.22 | | | | 6.68 | (a) |
Expenses after expense reductions (f) | | | 1.14 | (a) | | | 1.14 | | | | 1.14 | | | | 1.14 | | | | 1.13 | (a) |
Net investment income (loss) | | | 1.10 | (a)(l) | | | 2.54 | | | | 2.34 | | | | 1.90 | | | | 2.11 | (a) |
Portfolio turnover | | | 29 | (n) | | | 58 | | | | 69 | | | | 63 | | | | 64 | (n) |
Net assets at end of period (000 omitted) | | | $148 | | | | $164 | | | | $167 | | | | $60 | | | | $50 | |
| | |
| | | Six months
ended
2/29/20 | | | Year ended | |
| Class R3 | | 8/31/19 | | | 8/31/18 | | | 8/31/17 | | | 8/31/16 (c) | |
| | | (unaudited) | | | | | | | | | | | | | |
Net asset value, beginning of period | | | $10.45 | | | | $11.80 | | | | $11.91 | | | | $9.84 | | | | $10.00 | |
| | |
| Income (loss) from investment operations | | | | | | | | | |
Net investment income (loss) (d) | | | $0.07 | | | | $0.30 | | | | $0.28 | | | | $0.23 | | | | $0.29 | |
Net realized and unrealized gain (loss) | | | 0.16 | | | | (1.02 | ) | | | (0.09 | ) | | | 1.84 | | | | (0.34 | ) |
Total from investment operations | | | $0.23 | | | | $(0.72 | ) | | | $0.19 | | | | $2.07 | | | | $(0.05 | ) |
| | |
| Less distributions declared to shareholders | | | | | | | | | |
From net investment income | | | $(0.31 | ) | | | $(0.26 | ) | | | $(0.16 | ) | | | $— | | | | $(0.06 | ) |
From net realized gain | | | — | | | | (0.37 | ) | | | (0.14 | ) | | | — | | | | (0.05 | ) |
Total distributions declared to shareholders | | | $(0.31 | ) | | | $(0.63 | ) | | | $(0.30 | ) | | | $— | | | | $(0.11 | ) |
Net asset value, end of period (x) | | | $10.37 | | | | $10.45 | | | | $11.80 | | | | $11.91 | | | | $9.84 | |
Total return (%) (r)(s)(t)(x) | | | 1.91 | (n) | | | (5.72 | ) | | | 1.50 | | | | 21.04 | | | | (0.44 | )(n) |
| | |
Ratios (%) (to average net assets)
and Supplemental data: | | | | | | | | | |
Expenses before expense reductions (f) | | | 0.99 | (a) | | | 1.00 | | | | 0.98 | | | | 0.97 | | | | 5.94 | (a) |
Expenses after expense reductions (f) | | | 0.89 | (a) | | | 0.89 | | | | 0.89 | | | | 0.89 | | | | 0.87 | (a) |
Net investment income (loss) | | | 1.33 | (a)(l) | | | 2.79 | | | | 2.29 | | | | 2.15 | | | | 3.16 | (a) |
Portfolio turnover | | | 29 | (n) | | | 58 | | | | 69 | | | | 63 | | | | 64 | (n) |
Net assets at end of period (000 omitted) | | | $60 | | | | $58 | | | | $61 | | | | $60 | | | | $50 | |
See Notes to Financial Statements
20
Financial Highlights – continued
| | | | | | | | | | | | | | | | | | | | |
| | | Six months
ended
2/29/20 | | | Year ended | |
| Class R4 | | 8/31/19 | | | 8/31/18 | | | 8/31/17 | | | 8/31/16 (c) | |
| | | (unaudited) | | | | | | | | | | | | | |
Net asset value, beginning of period | | | $10.42 | | | | $11.77 | | | | $11.88 | | | | $9.84 | | | | $10.00 | |
| | |
| Income (loss) from investment operations | | | | | | | | | |
Net investment income (loss) (d) | | | $0.09 | | | | $0.33 | | | | $0.31 | | | | $0.25 | | | | $0.24 | |
Net realized and unrealized gain (loss) | | | 0.15 | | | | (1.02 | ) | | | (0.10 | ) | | | 1.84 | | | | (0.28 | ) |
Total from investment operations | | | $0.24 | | | | $(0.69 | ) | | | $0.21 | | | | $2.09 | | | | $(0.04 | ) |
| | |
| Less distributions declared to shareholders | | | | | | | | | |
From net investment income | | | $(0.33 | ) | | | $(0.29 | ) | | | $(0.18 | ) | | | $(0.05 | ) | | | $(0.07 | ) |
From net realized gain | | | — | | | | (0.37 | ) | | | (0.14 | ) | | | — | | | | (0.05 | ) |
Total distributions declared to shareholders | | | $(0.33 | ) | | | $(0.66 | ) | | | $(0.32 | ) | | | $(0.05 | ) | | | $(0.12 | ) |
Net asset value, end of period (x) | | | $10.33 | | | | $10.42 | | | | $11.77 | | | | $11.88 | | | | $9.84 | |
Total return (%) (r)(s)(t)(x) | | | 2.05 | (n) | | | (5.45 | ) | | | 1.74 | | | | 21.36 | | | | (0.37 | )(n) |
| | |
Ratios (%) (to average net assets)
and Supplemental data: | | | | | | | | | |
Expenses before expense reductions (f) | | | 0.74 | (a) | | | 0.75 | | | | 0.73 | | | | 0.72 | | | | 6.18 | (a) |
Expenses after expense reductions (f) | | | 0.64 | (a) | | | 0.64 | | | | 0.64 | | | | 0.64 | | | | 0.63 | (a) |
Net investment income (loss) | | | 1.59 | (a)(l) | | | 3.04 | | | | 2.54 | | | | 2.41 | | | | 2.60 | (a) |
Portfolio turnover | | | 29 | (n) | | | 58 | | | | 69 | | | | 63 | | | | 64 | (n) |
Net assets at end of period (000 omitted) | | | $59 | | | | $58 | | | | $62 | | | | $60 | | | | $50 | |
| | |
| | | Six months
ended
2/29/20 | | | Year ended | |
| Class R6 | | 8/31/19 | | | 8/31/18 | | | 8/31/17 | | | 8/31/16 (c) | |
| | | (unaudited) | | | | | | | | | | | | | |
Net asset value, beginning of period | | | $10.43 | | | | $11.78 | | | | $11.88 | | | | $9.84 | | | | $10.00 | |
| | |
| Income (loss) from investment operations | | | | | | | | | |
Net investment income (loss) (d) | | | $0.09 | | | | $0.34 | | | | $0.32 | | | | $0.26 | | | | $0.24 | |
Net realized and unrealized gain (loss) | | | 0.15 | | | | (1.02 | ) | | | (0.09 | ) | | | 1.84 | | | | (0.28 | ) |
Total from investment operations | | | $0.24 | | | | $(0.68 | ) | | | $0.23 | | | | $2.10 | | | | $(0.04 | ) |
| | |
| Less distributions declared to shareholders | | | | | | | | | |
From net investment income | | | $(0.34 | ) | | | $(0.30 | ) | | | $(0.19 | ) | | | $(0.06 | ) | | | $(0.07 | ) |
From net realized gain | | | — | | | | (0.37 | ) | | | (0.14 | ) | | | — | | | | (0.05 | ) |
Total distributions declared to shareholders | | | $(0.34 | ) | | | $(0.67 | ) | | | $(0.33 | ) | | | $(0.06 | ) | | | $(0.12 | ) |
Net asset value, end of period (x) | | | $10.33 | | | | $10.43 | | | | $11.78 | | | | $11.88 | | | | $9.84 | |
Total return (%) (r)(s)(t)(x) | | | 2.04 | (n) | | | (5.33 | ) | | | 1.86 | | | | 21.41 | | | | (0.36 | )(n) |
| | |
Ratios (%) (to average net assets)
and Supplemental data: | | | | | | | | | |
Expenses before expense reductions (f) | | | 0.64 | (a) | | | 0.65 | | | | 0.65 | | | | 0.68 | | | | 3.06 | (a) |
Expenses after expense reductions (f) | | | 0.54 | (a) | | | 0.54 | | | | 0.54 | | | | 0.60 | | | | 0.60 | (a) |
Net investment income (loss) | | | 1.69 | (a)(l) | | | 3.13 | | | | 2.60 | | | | 2.43 | | | | 2.61 | (a) |
Portfolio turnover | | | 29 | (n) | | | 58 | | | | 69 | | | | 63 | | | | 64 | (n) |
Net assets at end of period (000 omitted) | | | $221,085 | | | | $206,790 | | | | $207,449 | | | | $196,685 | | | | $163,355 | |
See Notes to Financial Statements
21
Financial Highlights – continued
| (c) | For the period from the commencement of the fund’s investment operations, September 15, 2015, through the stated period end. |
| (d) | Per share data is based on average shares outstanding. |
| (f) | Ratios do not reflect reductions from fees paid indirectly, if applicable. |
| (l) | Recognition of net investment income by the fund may be affected by the timing of the declaration of dividends by companies in which the fund invests and the actual annual net investment income ratio may differ. |
| (r) | Certain expenses have been reduced without which performance would have been lower. |
| (s) | From time to time the fund may receive proceeds from litigation settlements, without which performance would be lower. |
| (t) | Total returns do not include any applicable sales charges. |
| (w) | Per share amount was less than $0.01. |
| (x) | The net asset values and total returns have been calculated on net assets which include adjustments made in accordance with U.S. generally accepted accounting principles required at period end for financial reporting purposes. |
See Notes to Financial Statements
22
NOTES TO FINANCIAL STATEMENTS
(unaudited)
(1) Business and Organization
MFS Blended Research International Equity Fund (the fund) is a diversified series of MFS Series Trust IV (the trust). The trust is organized as a Massachusetts business trust and is registered under the Investment Company Act of 1940, as amended, as anopen-end management investment company.
The fund is an investment company and accordingly follows the investment company accounting and reporting guidance of the Financial Accounting Standards Board (FASB) Accounting Standards Codification Topic 946 Financial Services – Investment Companies.
(2) Significant Accounting Policies
General– The preparation of financial statements in conformity with U.S. generally accepted accounting principles requires management to make estimates and assumptions that affect the reported amounts of assets and liabilities, and disclosure of contingent assets and liabilities at the date of the financial statements and the reported amounts of increases and decreases in net assets from operations during the reporting period. Actual results could differ from those estimates. In the preparation of these financial statements, management has evaluated subsequent events occurring after the date of the fund’s Statement of Assets and Liabilities through the date that the financial statements were issued. The fund invests in foreign securities, including securities of emerging market issuers. Investments in foreign securities are vulnerable to the effects of changes in the relative values of the local currency and the U.S. dollar and to the effects of changes in each country’s market, economic, industrial, political, regulatory, geopolitical, and other conditions. Investments in emerging markets can involve additional and greater risks than the risks associated with investments in developed foreign markets. Emerging markets can have less developed markets, greater custody and operational risk, less developed legal, regulatory, and accounting systems, and greater political, social, and economic instability than developed markets.
In March 2020, the FASB issued Accounting Standards Update2020-04, Reference Rate Reform (Topic 848) – Facilitation of the Effects of Reference Rate Reform on Financial Reporting (“ASU2020-04”), which provides optional, temporary relief with respect to the financial reporting of contracts subject to certain types of modifications due to the planned discontinuation of the London Interbank Offered Rate (LIBOR) and other IBOR-based reference rates as of the end of 2021. The temporary relief provided by ASU2020-04 is effective for certain reference rate-related contract modifications that occur during the period from March 12, 2020 through December 31, 2022. Management is evaluating the impact of ASU2020-04 on the fund’s investments, derivatives, debt and other contracts that will undergo reference rate-related modifications as a result of the reference rate reform.
Balance Sheet Offsetting– The fund’s accounting policy with respect to balance sheet offsetting is that, absent an event of default by the counterparty or a termination of the agreement, the International Swaps and Derivatives Association (ISDA) Master Agreement, or similar agreement, does not result in an offset of reported amounts of financial assets and financial liabilities in the Statement of Assets and Liabilities across transactions between the fund and the applicable counterparty. The fund’s right to
23
Notes to Financial Statements (unaudited) – continued
setoff may be restricted or prohibited by the bankruptcy or insolvency laws of the particular jurisdiction to which a specific master netting agreement counterparty is subject. Balance sheet offsetting disclosures, to the extent applicable to the fund, have been included in the fund’s Significant Accounting Policies note under the captions for each of the fund’sin-scope financial instruments and transactions.
Investment Valuations– Equity securities, including restricted equity securities, are generally valued at the last sale or official closing price on their primary market or exchange as provided by a third-party pricing service. Equity securities, for which there were no sales reported that day, are generally valued at the last quoted daily bid quotation on their primary market or exchange as provided by a third-party pricing service. Short-term instruments with a maturity at issuance of 60 days or less may be valued at amortized cost, which approximates market value.Open-end investment companies are generally valued at net asset value per share. Securities and other assets generally valued on the basis of information from a third-party pricing service may also be valued at a broker/dealer bid quotation. In determining values, third-party pricing services can utilize both transaction data and market information such as yield, quality, coupon rate, maturity, type of issue, trading characteristics, and other market data. The values of foreign securities and other assets and liabilities expressed in foreign currencies are converted to U.S. dollars using the mean of bid and asked prices for rates provided by a third-party pricing service.
The Board of Trustees has delegated primary responsibility for determining or causing to be determined the value of the fund’s investments (including any fair valuation) to the adviser pursuant to valuation policies and procedures approved by the Board. If the adviser determines that reliable market quotations are not readily available, investments are valued at fair value as determined in good faith by the adviser in accordance with such procedures under the oversight of the Board of Trustees. Under the fund’s valuation policies and procedures, market quotations are not considered to be readily available for most types of debt instruments and floating rate loans and many types of derivatives. These investments are generally valued at fair value based on information from third-party pricing services. In addition, investments may be valued at fair value if the adviser determines that an investment’s value has been materially affected by events occurring after the close of the exchange or market on which the investment is principally traded (such as foreign exchange or market) and prior to the determination of the fund’s net asset value, or after the halt of trading of a specific security where trading does not resume prior to the close of the exchange or market on which the security is principally traded. Events that occur after foreign markets close (such as developments in foreign markets and significant movements in the U.S. markets) and prior to the determination of the fund’s net asset value may be deemed to have a material effect on the value of securities traded in foreign markets. Accordingly, the fund’s foreign equity securities may often be valued at fair value. The adviser generally relies on third-party pricing services or other information (such as the correlation with price movements of similar securities in the same or other markets; the type, cost and investment characteristics of the security; the business and financial condition of the issuer; and trading and other market data) to assist in determining whether to fair value and at what value to fair value an investment. The value of an investment for purposes of calculating the fund’s net asset value can differ depending on the source
24
Notes to Financial Statements (unaudited) – continued
and method used to determine value. When fair valuation is used, the value of an investment used to determine the fund’s net asset value may differ from quoted or published prices for the same investment. There can be no assurance that the fund could obtain the fair value assigned to an investment if it were to sell the investment at the same time at which the fund determines its net asset value per share.
Various inputs are used in determining the value of the fund’s assets or liabilities. These inputs are categorized into three broad levels. In certain cases, the inputs used to measure fair value may fall into different levels of the fair value hierarchy. In such cases, an investment’s level within the fair value hierarchy is based on the lowest level of input that is significant to the fair value measurement. The fund’s assessment of the significance of a particular input to the fair value measurement in its entirety requires judgment, and considers factors specific to the investment. Level 1 includes unadjusted quoted prices in active markets for identical assets or liabilities. Level 2 includes other significant observable market-based inputs (including quoted prices for similar securities, interest rates, prepayment speed, and credit risk). Level 3 includes unobservable inputs, which may include the adviser’s own assumptions in determining the fair value of investments. The following is a summary of the levels used as of February 29, 2020 in valuing the fund’s assets or liabilities:
| | | | | | | | | | | | | | | | |
| | | | |
| Financial Instruments | | Level 1 | | | Level 2 | | | Level 3 | | | Total | |
| Equity Securities: | | | | | | | | | | | | | | | | |
Japan | | | $671,306 | | | | $50,845,217 | | | | $— | | | | $51,516,523 | |
France | | | — | | | | 32,061,656 | | | | — | | | | 32,061,656 | |
United Kingdom | | | — | | | | 27,710,119 | | | | — | | | | 27,710,119 | |
Switzerland | | | — | | | | 25,380,545 | | | | — | | | | 25,380,545 | |
China | | | 2,732,283 | | | | 22,105,794 | | | | — | | | | 24,838,077 | |
Canada | | | 15,777,329 | | | | — | | | | — | | | | 15,777,329 | |
Australia | | | — | | | | 15,191,468 | | | | — | | | | 15,191,468 | |
South Korea | | | 661,921 | | | | 13,172,384 | | | | — | | | | 13,834,305 | |
Germany | | | — | | | | 10,592,180 | | | | — | | | | 10,592,180 | |
Other Countries | | | 25,028,291 | | | | 57,068,922 | | | | — | | | | 82,097,213 | |
| Mutual Funds | | | 6,718,693 | | | | — | | | | — | | | | 6,718,693 | |
| Total | | | $51,589,823 | | | | $254,128,285 | | | | $— | | | | $305,718,108 | |
For further information regarding security characteristics, see the Portfolio of Investments.
Foreign Currency Translation– Purchases and sales of foreign investments, income, and expenses are converted into U.S. dollars based upon currency exchange rates prevailing on the respective dates of such transactions or on the reporting date for foreign denominated receivables and payables. Gains and losses attributable to foreign currency exchange rates on sales of securities are recorded for financial statement purposes as net realized gains and losses on investments. Gains and losses attributable to foreign exchange rate movements on receivables, payables, income and expenses are recorded for financial statement purposes as foreign currency transaction gains and losses. That portion of both realized and unrealized gains and losses on investments that results from fluctuations in foreign currency exchange rates is not separately disclosed.
25
Notes to Financial Statements (unaudited) – continued
Indemnifications– Under the fund’s organizational documents, its officers and Trustees may be indemnified against certain liabilities and expenses arising out of the performance of their duties to the fund. Additionally, in the normal course of business, the fund enters into agreements with service providers that may contain indemnification clauses. The fund’s maximum exposure under these agreements is unknown as this would involve future claims that may be made against the fund that have not yet occurred.
Investment Transactions and Income– Investment transactions are recorded on the trade date. Dividends received in cash are recorded on theex-dividend date. Certain dividends from foreign securities will be recorded when the fund is informed of the dividend if such information is obtained subsequent to theex-dividend date. Dividend payments received in additional securities are recorded on theex-dividend date in an amount equal to the value of the security on such date.
The fund may receive proceeds from litigation settlements. Any proceeds received from litigation involving portfolio holdings are reflected in the Statement of Operations in realized gain/loss if the security has been disposed of by the fund or in unrealized gain/loss if the security is still held by the fund. Any other proceeds from litigation not related to portfolio holdings are reflected as other income in the Statement of Operations.
Tax Matters and Distributions– The fund intends to qualify as a regulated investment company, as defined under Subchapter M of the Internal Revenue Code, and to distribute all of its taxable income, including realized capital gains. As a result, no provision for federal income tax is required. The fund’s federal tax returns, when filed, will remain subject to examination by the Internal Revenue Service for a three year period. Management has analyzed the fund’s tax positions taken on federal and state tax returns for all open tax years and does not believe that there are any uncertain tax positions that require recognition of a tax liability. Foreign taxes, if any, have been accrued by the fund in the accompanying financial statements in accordance with the applicable foreign tax law. Foreign income taxes may be withheld by certain countries in which the fund invests. Additionally, capital gains realized by the fund on securities issued in or by certain foreign countries may be subject to capital gains tax imposed by those countries.
Distributions to shareholders are recorded on theex-dividend date. Income and capital gain distributions are determined in accordance with income tax regulations, which may differ from U.S. generally accepted accounting principles. Certain capital accounts in the financial statements are periodically adjusted for permanent differences in order to reflect their tax character. These adjustments have no impact on net assets or net asset value per share. Temporary differences which arise from recognizing certain items of income, expense, gain or loss in different periods for financial statement and tax purposes will reverse at some time in the future.
Book/tax differences primarily relate to wash sale loss deferrals.
26
Notes to Financial Statements (unaudited) – continued
The tax character of distributions made during the current period will be determined at fiscal year end. The tax character of distributions declared to shareholders for the last fiscal year is as follows:
| | | | |
| |
| | | Year ended
8/31/19 | |
| Ordinary income (including anyshort-term capital gains) | | | $7,500,165 | |
| Long-term capital gains | | | 9,592,030 | |
| |
| Total distributions | | | $17,092,195 | |
The federal tax cost and the tax basis components of distributable earnings were as follows:
| | | | |
| |
| As of 2/29/20 | | | |
| |
| Cost of investments | | | $306,053,113 | |
| Gross appreciation | | | 29,908,977 | |
| |
| Gross depreciation | | | (30,243,982 | ) |
| Net unrealized appreciation (depreciation) | | | $(335,005 | ) |
| |
| As of 8/31/19 | | | |
| |
| Undistributed ordinary income | | | 7,026,021 | |
| Post-October capital loss deferral | | | (4,670,339 | ) |
| Other temporary differences | | | (50,476 | ) |
| Net unrealized appreciation (depreciation) | | | (8,629,057 | ) |
The aggregate cost above includes prior fiscal year end tax adjustments, if applicable.
Multiple Classes of Shares of Beneficial Interest– The fund offers multiple classes of shares, which differ in their respective distribution and service fees. The fund’s income, realized and unrealized gain (loss), and common expenses are allocated to shareholders based on the daily net assets of each class. Dividends are declared separately for each class. Differences in per share dividend rates are generally due to differences in separate class expenses. Class B shares will convert to Class A shares approximately eight years after purchase. Class C shares will convert to Class A shares approximately ten years after purchase. The fund’s distributions declared to shareholders as reported in the Statements of Changes in Net Assets are presented by class as follows:
| | | | | | | | |
| | |
| | | Six months
ended
2/29/20 | | | Year
ended
8/31/19 | |
| Class A | | | $2,350,834 | | | | $4,798,715 | |
| Class B | | | 3,422 | | | | 4,279 | |
| Class C | | | 4,533 | | | | 10,851 | |
| Class I | | | 51,103 | | | | 97,467 | |
| Class R1 | | | 3,314 | | | | 7,783 | |
| Class R2 | | | 3,830 | | | | 8,777 | |
| Class R3 | | | 1,725 | | | | 3,262 | |
| Class R4 | | | 1,860 | | | | 3,445 | |
| Class R6 | | | 6,829,590 | | | | 12,157,616 | |
| Total | | | $9,250,211 | | | | $17,092,195 | |
27
Notes to Financial Statements (unaudited) – continued
(3) Transactions with Affiliates
Investment Adviser– The fund has an investment advisory agreement with MFS to provide overall investment management and related administrative services and facilities to the fund. The management fee is computed daily and paid monthly at the following annual rates based on the fund’s average daily net assets:
| | | | |
| Up to $1 billion | | | 0.50 | % |
| In excess of $1 billion and up to $2.5 billion | | | 0.475 | % |
| In excess of $2.5 billion | | | 0.45 | % |
MFS has agreed in writing to reduce its management fee by a specified amount if certain MFS mutual fund assets exceed thresholds agreed to by MFS and the fund’s Board of Trustees. For the six months ended February 29, 2020, this management fee reduction amounted to $15,939, which is included in the reduction of total expenses in the Statement of Operations. The management fee incurred for the six months ended February 29, 2020 was equivalent to an annual effective rate of 0.49% of the fund’s average daily net assets.
The investment adviser has agreed in writing to pay a portion of the fund’s total annual operating expenses, excluding interest, taxes, extraordinary expenses, brokerage and transaction costs, and investment-related expenses, such that total fund operating expenses do not exceed the following rates annually of each class’s average daily net assets:
| | | | | | | | | | | | | | | | | | | | | | | | | | | | | | | | |
| Classes | |
| | | | | | | | |
| A | | B | | | C | | | I | | | R1 | | | R2 | | | R3 | | | R4 | | | R6 | |
| 0.89% | | | 1.64% | | | | 1.64% | | | | 0.64% | | | | 1.64% | | | | 1.14% | | | | 0.89% | | | | 0.64% | | | | 0.60% | |
This written agreement will continue until modified by the fund’s Board of Trustees, but such agreement will continue at least until December 31, 2020. For the six months ended February 29, 2020, this reduction amounted to $134,243, which is included in the reduction of total expenses in the Statement of Operations.
Distributor– MFS Fund Distributors, Inc. (MFD), a wholly-owned subsidiary of MFS, as distributor, received $478 for the six months ended February 29, 2020, as its portion of the initial sales charge on sales of Class A shares of the fund.
The Board of Trustees has adopted a distribution plan for certain share classes pursuant to Rule12b-1 of the Investment Company Act of 1940.
The fund’s distribution plan provides that the fund will pay MFD for services provided by MFD and financial intermediaries in connection with the distribution and servicing of certain share classes. One component of the plan is a distribution fee paid to MFD and another component of the plan is a service fee paid to MFD. MFD may subsequently pay all, or a portion, of the distribution and/or service fees to financial intermediaries.
28
Notes to Financial Statements (unaudited) – continued
Distribution Plan Fee Table:
| | | | | | | | | | | | | | | | | | | | |
| | | | | |
| | | Distribution
Fee Rate (d) | | | Service
Fee Rate (d) | | | Total
Distribution
Plan (d) | | | Annual
Effective
Rate (e) | | | Distribution
and Service
Fee | |
| Class A | | | — | | | | 0.25% | | | | 0.25% | | | | 0.25% | | | | $109,322 | |
| Class B | | | 0.75% | | | | 0.25% | | | | 1.00% | | | | 1.00% | | | | 803 | |
| Class C | | | 0.75% | | | | 0.25% | | | | 1.00% | | | | 1.00% | | | | 1,191 | |
| Class R1 | | | 0.75% | | | | 0.25% | | | | 1.00% | | | | 1.00% | | | | 798 | |
| Class R2 | | | 0.25% | | | | 0.25% | | | | 0.50% | | | | 0.50% | | | | 396 | |
| Class R3 | | | — | | | | 0.25% | | | | 0.25% | | | | 0.25% | | | | 79 | |
| Total Distribution and Service Fees | | | | | | | | | | | | $112,589 | |
| (d) | In accordance with the distribution plan for certain classes, the fund pays distribution and/or service fees equal to these annual percentage rates of each class’s average daily net assets. The distribution and service fee rates disclosed by class represent the current rates in effect at the end of the reporting period. Any rate changes, if applicable, are detailed below. |
| (e) | The annual effective rates represent actual fees incurred under the distribution plan for the six months ended February 29, 2020 based on each class’s average daily net assets. MFD has voluntarily agreed to rebate a portion of each class’s 0.25% service fee attributable to accounts for which MFD retains the 0.25% service fee except for accounts attributable to MFS or its affiliates’ seed money. There were no service fee rebates for the six months ended February 29, 2020. |
Certain Class A shares are subject to a contingent deferred sales charge (CDSC) in the event of a shareholder redemption within 18 months of purchase. Class B shares are subject to a CDSC in the event of a shareholder redemption within six years of purchase. Class C shares are subject to a CDSC in the event of a shareholder redemption within 12 months of purchase. All contingent deferred sales charges are paid to MFD and during the six months ended February 29, 2020, were as follows:
| | | | |
| |
| | | Amount | |
| Class A | | | $— | |
| Class B | | | — | |
| Class C | | | 12 | |
Shareholder Servicing Agent– MFS Service Center, Inc. (MFSC), a wholly-owned subsidiary of MFS, receives a fee from the fund for its services as shareholder servicing agent calculated as a percentage of the average daily net assets of the fund as determined periodically under the supervision of the fund’s Board of Trustees. For the six months ended February 29, 2020, the fee was $486, which equated to 0.0003% annually of the fund’s average daily net assets. MFSC also receives payment from the fund forout-of-pocket expenses,sub-accounting and other shareholder servicing costs which may be paid to affiliated and unaffiliated service providers. Class R6 shares do not incursub-accounting fees. For the six months ended February 29, 2020, theseout-of-pocket expenses,sub-accounting and other shareholder servicing costs amounted to $45,545.
Administrator– MFS provides certain financial, legal, shareholder communications, compliance, and other administrative services to the fund. Under an administrative services agreement, the fund reimburses MFS the costs incurred to provide these services. The fund is charged an annual fixed amount of $17,500 plus a fee based on
29
Notes to Financial Statements (unaudited) – continued
average daily net assets. The administrative services fee incurred for the six months ended February 29, 2020 was equivalent to an annual effective rate of 0.0163% of the fund’s average daily net assets.
Trustees’ and Officers’ Compensation– The fund pays compensation to independent Trustees in the form of a retainer, attendance fees, and additional compensation to Board and Committee chairpersons. The fund does not pay compensation directly to Trustees or officers of the fund who are also officers of the investment adviser, all of whom receive remuneration from MFS for their services to the fund. Certain officers and Trustees of the fund are officers or directors of MFS, MFD, and MFSC.
Other –The fund invests in the MFS Institutional Money Market Portfolio which is managed by MFS and seeks current income consistent with preservation of capital and liquidity. This money market fund does not pay a management fee to MFS but does incur investment and operating costs.
On December 14, 2018, MFS redeemed 5,214 shares of Class A for an aggregate amount of $54,118.
At February 29, 2020, MFS held approximately 98% of the outstanding shares of Class R3 and 100% of the outstanding shares of Class R4.
The fund is permitted to engage in purchase and sale transactions with funds and accounts for which MFS serves as investment adviser orsub-adviser (“cross-trades”) pursuant to a policy adopted by the Board of Trustees. This policy has been designed to ensure that cross-trades conducted by the fund comply with Rule17a-7 under the Investment Company Act of 1940. During the six months ended February 29, 2020, the fund engaged in sale transactions pursuant to this policy, which amounted to $100,548. The sales transactions resulted in net realized gains (losses) of $(15,855).
The adviser has voluntarily undertaken to reimburse the fund from its own resources on a quarterly basis for the cost of investment research embedded in the cost of the fund’s securities trades. This agreement may be rescinded at any time. For the six months ended February 29, 2020, this reimbursement amounted to $17,901, which is included in “Other” income in the Statement of Operations.
(4) Portfolio Securities
For the six months ended February 29, 2020, purchases and sales of investments, other than short-term obligations, aggregated $95,658,138 and $88,038,908, respectively.
30
Notes to Financial Statements (unaudited) – continued
(5) Shares of Beneficial Interest
The fund’s Declaration of Trust permits the Trustees to issue an unlimited number of full and fractional shares of beneficial interest. Transactions in fund shares were as follows:
| | | | | | | | | | | | | | | | |
| | | Six months ended
2/29/20 | | | Year ended
8/31/19 | |
| | | | |
| | | Shares | | | Amount | | | Shares | | | Amount | |
| Shares sold | | | | | | | | | | | | | | | | |
Class A | | | 2,723,214 | | | | $30,322,457 | | | | 2,480,072 | | | | $25,752,781 | |
Class B | | | — | | | | — | | | | 6,820 | | | | 73,292 | |
Class C | | | 1,376 | | | | 15,383 | | | | 7,632 | | | | 77,887 | |
Class I | | | 286,766 | | | | 3,246,439 | | | | 129,773 | | | | 1,406,786 | |
Class R1 | | | 571 | | | | 6,330 | | | | 8,502 | | | | 98,823 | |
Class R2 | | | 88 | | | | 978 | | | | 654 | | | | 7,027 | |
Class R3 | | | 119 | | | | 1,318 | | | | — | | | | — | |
Class R6 | | | 2,216,101 | | | | 24,840,810 | | | | 4,783,747 | | | | 50,967,030 | |
| | | 5,228,235 | | | | $58,433,715 | | | | 7,417,200 | | | | $78,383,626 | |
| | | | |
| Shares issued to shareholders in reinvestment of distributions | | | | | | | | | | | | | | | | |
Class A | | | 3,856 | | | | $43,616 | | | | 6,468 | | | | $62,548 | |
Class B | | | 303 | | | | 3,422 | | | | 442 | | | | 4,279 | |
Class C | | | 402 | | | | 4,533 | | | | 1,126 | | | | 10,851 | |
Class I | | | 4,506 | | | | 51,103 | | | | 9,951 | | | | 96,523 | |
Class R1 | | | 295 | | | | 3,314 | | | | 811 | | | | 7,783 | |
Class R2 | | | 338 | | | | 3,830 | | | | 905 | | | | 8,777 | |
Class R3 | | | 151 | | | | 1,725 | | | | 334 | | | | 3,262 | |
Class R4 | | | 164 | | | | 1,860 | | | | 355 | | | | 3,445 | |
Class R6 | | | 601,726 | | | | 6,829,590 | | | | 1,253,362 | | | | 12,157,616 | |
| | | 611,741 | | | | $6,942,993 | | | | 1,273,754 | | | | $12,355,084 | |
| | | | |
| Shares reacquired | | | | | | | | | | | | | | | | |
Class A | | | (3,067,141 | ) | | | $(34,137,786 | ) | | | (1,822,540 | ) | | | $(19,350,684 | ) |
Class B | | | (672 | ) | | | (7,445 | ) | | | (860 | ) | | | (9,450 | ) |
Class C | | | (2,752 | ) | | | (29,758 | ) | | | (9,859 | ) | | | (104,993 | ) |
Class I | | | (33,970 | ) | | | (385,068 | ) | | | (130,649 | ) | | | (1,380,360 | ) |
Class R1 | | | — | | | | — | | | | (234 | ) | | | (2,338 | ) |
Class R2 | | | (1,891 | ) | | | (20,237 | ) | | | (24 | ) | | | (252 | ) |
Class R6 | | | (1,255,662 | ) | | | (14,028,847 | ) | | | (3,808,748 | ) | | | (40,941,280 | ) |
| | | (4,362,088 | ) | | | $(48,609,141 | ) | | | (5,772,914 | ) | | | $(61,789,357 | ) |
31
Notes to Financial Statements (unaudited) – continued
| | | | | | | | | | | | | | | | |
| | | Six months ended
2/29/20 | | | Year ended
8/31/19 | |
| | | | |
| | | Shares | | | Amount | | | Shares | | | Amount | |
| Net change | | | | | | | | | | | | | | | | |
Class A | | | (340,071 | ) | | | $(3,771,713 | ) | | | 664,000 | | | | $6,464,645 | |
Class B | | | (369 | ) | | | (4,023 | ) | | | 6,402 | | | | 68,121 | |
Class C | | | (974 | ) | | | (9,842 | ) | | | (1,101 | ) | | | (16,255 | ) |
Class I | | | 257,302 | | | | 2,912,474 | | | | 9,075 | | | | 122,949 | |
Class R1 | | | 866 | | | | 9,644 | | | | 9,079 | | | | 104,268 | |
Class R2 | | | (1,465 | ) | | | (15,429 | ) | | | 1,535 | | | | 15,552 | |
Class R3 | | | 270 | | | | 3,043 | | | | 334 | | | | 3,262 | |
Class R4 | | | 164 | | | | 1,860 | | | | 355 | | | | 3,445 | |
Class R6 | | | 1,562,165 | | | | 17,641,553 | | | | 2,228,361 | | | | 22,183,366 | |
| | | 1,477,888 | | | | $16,767,567 | | | | 2,918,040 | | | | $28,949,353 | |
Class T shares were not publicly available for sale during the period. Please see the fund’s prospectus for details.
Effective June 1, 2019, purchases of the fund’s Class B shares are closed to new and existing investors subject to certain exceptions. Please see the fund’s prospectus for details.
The fund is one of several mutual funds in which certain MFS funds may invest. The MFS funds do not invest in the underlying funds for the purpose of exercising management or control. At the end of the period, the MFS Lifetime 2040 Fund, the MFS Lifetime 2030 Fund, the MFS Lifetime 2035 Fund, the MFS Lifetime 2050 Fund, the MFS Lifetime 2045 Fund, the MFS Lifetime Income Fund, the MFS Lifetime 2025 Fund, the MFS Lifetime 2055 Fund, and the MFS Lifetime 2020 Fund were the owners of record of approximately 15%, 13%, 10%, 9%, 9%, 5%, 5%, 4%, and 3%, respectively, of the value of outstanding voting shares of the fund. In addition, the MFS Lifetime 2060 Fund was the owner of record of less than 1% of the value of outstanding voting shares of the fund.
(6) Line of Credit
The fund and certain other funds managed by MFS participate in a $1.25 billion unsecured committed line of credit, subject to a $1 billion sublimit, provided by a syndicate of banks under a credit agreement. Borrowings may be made for temporary financing needs. Interest is charged to each fund, based on its borrowings, generally at a rate equal to the highest of one month LIBOR, the Federal Funds Effective Rate and the Overnight Bank Funding Rate, plus an agreed upon spread. A commitment fee, based on the average daily, unused portion of the committed line of credit, is allocated among the participating funds. In addition, the fund and other funds managed by MFS have established unsecured uncommitted borrowing arrangements with certain banks for temporary financing needs. Interest is charged to each fund, based on its borrowings, at rates equal to customary reference rates plus an agreed upon spread. For the six months ended February 29, 2020, the fund’s commitment fee and interest expense were $824 and $0, respectively, and are included in “Miscellaneous” expense in the Statement of Operations.
32
Notes to Financial Statements (unaudited) – continued
(7) Investments in Affiliated Issuers
An affiliated issuer may be considered one in which the fund owns 5% or more of the outstanding voting securities, or a company which is under common control. For the purposes of this report, the following were affiliated issuers:
| | | | | | | | | | | | | | | | | | | | | | | | |
| | | | | | |
| Affiliated Issuers | | Beginning
Value | | | Purchases | | | Sales
Proceeds | | | Realized
Gain
(Loss) | | | Change in
Unrealized
Appreciation or
Depreciation | | | Ending
Value | |
MFS Institutional Money
Market Portfolio | | | $4,436,778 | | | | $35,489,326 | | | | $33,207,031 | | | | $(732 | ) | | | $352 | | | | $6,718,693 | |
| | | | | | |
| Affiliated Issuers | | | | | | | | | | | | | | Dividend
Income | | | Capital Gain
Distributions | |
| MFS Institutional Money Market Portfolio | | | | | | | | $27,174 | | | | $— | |
(8) Impacts of COVID-19
The pandemic related to the global spread of novel coronavirus disease (COVID-19), which was first detected in December 2019, has resulted in significant disruptions to global business activity and the global economy, as well as the economies of individual countries, the financial performance of individual companies and sectors, and the securities and commodities markets in general. This pandemic, the full effects of which are still unknown, has resulted in substantial market volatility and may have adversely impacted the prices and liquidity of the fund’s investments and the fund’s performance during the period February 29, 2020 through April 16, 2020, the date that these financial statements were issued.
33
PROXY VOTING POLICIES AND INFORMATION
MFS votes proxies on behalf of the fund pursuant to proxy voting policies and procedures that are available without charge, upon request, by calling1-800-225-2606, by visitingmfs.com/proxyvoting, or by visiting the SEC’s Web site athttp://www.sec.gov.
Information regarding how the fund voted proxies relating to portfolio securities during the most recent twelve-month period ended June 30 is available by August 31 of each year without charge by visitingmfs.com/proxyvoting, or by visiting the SEC’s Web site athttp://www.sec.gov.
QUARTERLY PORTFOLIO DISCLOSURE
The fund files a complete schedule of portfolio holdings with the SEC for the first and third quarters of each fiscal year as an exhibit to its reports onForm N-PORT. The fund’s Form N-PORT reports are available on the SEC’s website athttp://www.sec.gov.A shareholder can obtain the portfolio holdings report for the first and third quarters of the fund’s fiscal year atmfs.com/openendfunds by choosing the fund’s name and then selecting the “Resources” tab and clicking on “Prospectus and Reports”.
FURTHER INFORMATION
From time to time, MFS may post important information about the fund or the MFS funds on the MFS web site (mfs.com). This information is available athttps://www.mfs.com/en-us/what-we-do/announcements.html or atmfs.com/openendfunds by choosing the fund’s name.
INFORMATION ABOUT FUND CONTRACTS AND LEGAL CLAIMS
The fund has entered into contractual arrangements with an investment adviser, administrator, distributor, shareholder servicing agent, 529 program manager (if applicable), and custodian who each provide services to the fund. Unless expressly stated otherwise, shareholders are not parties to, or intended beneficiaries of these contractual arrangements, and these contractual arrangements are not intended to create any shareholder right to enforce them against the service providers or to seek any remedy under them against the service providers, either directly or on behalf of the fund.
Under the Trust’s By-Laws and Declaration of Trust, any claims asserted against or on behalf of the MFS Funds, including claims against Trustees and Officers, must be brought in state and federal courts located within the Commonwealth of Massachusetts.
PROVISION OF FINANCIAL REPORTS AND SUMMARY PROSPECTUSES
The fund produces financial reports every six months and updates its summary prospectus and prospectus annually. To avoid sending duplicate copies of materials to households, only one copy of the fund’s annual and semiannual report and summary prospectus may be mailed to shareholders having the same last name and residential address on the fund’s records. However, any shareholder may contact MFSC (please see back cover for address and telephone number) to request that copies of these reports and summary prospectuses be sent personally to that shareholder.
34
Save paper with eDelivery.

| MFS® will send you prospectuses, |
reports, and proxies directly viae-mail so you will get information faster with less mailbox clutter.
To sign up:
1. Go to mfs.com.
2. Log in via MFS® Access.
3. Select eDelivery.
If you own your MFS fund shares through a financial institution or a retirement plan, MFS® TALK, MFS® Access, or eDelivery may not be available to you.
CONTACT
WEB SITE
mfs.com
MFS TALK
1-800-637-8255
24 hours a day
ACCOUNT SERVICE AND LITERATURE
Shareholders
1-800-225-2606
Financial advisors
1-800-343-2829
Retirement plan services
1-800-637-1255
MAILING ADDRESS
MFS Service Center, Inc.
P.O. Box 219341
Kansas City, MO 64121-9341
OVERNIGHT MAIL
MFS Service Center, Inc.
Suite 219341
430 W 7th Street
Kansas City, MO 64105-1407
Semiannual Report
February 29, 2020

MFS® Global New Discovery Fund

Beginning on January 1, 2021, as permitted by regulations adopted by the U.S. Securities and Exchange Commission, paper copies of the fund’s annual and semiannual shareholder reports will no longer be sent by mail, unless you specifically request paper copies of the reports. Instead, the complete reports will be made available on the fund’s Web site (funds.mfs.com), and you will be notified by mail each time a report is posted and provided with a Web site link to access the report.
If you are already signed up to receive shareholder reports by email, you will not be affected by this change and you need not take any action. You may sign up to receive shareholder reports and other communications from the fund by email by contacting your financial intermediary (such as a broker-dealer or bank) or, if you hold your shares directly with the fund, by calling 1-800-225-2606 or by logging on to MFS Access at mfs.com.
Beginning on January 1, 2019, you may elect to receive all future reports in paper free of charge. Contact your financial intermediary to request that you continue to receive paper copies of your shareholder reports. If you invest directly with the fund, you can call 1-800-225-2606 or send an email request to orderliterature@mfs.com to let the fund know that you wish to continue receiving paper copies of your shareholder reports. Your election to receive reports in paper will apply to all funds held in your account if you invest through your financial intermediary or all funds held with the MFS fund complex if you invest directly.
GND-SEM
MFS® Global New Discovery Fund
CONTENTS
The report is prepared for the general information of shareholders.
It is authorized for distribution to prospective investors only when preceded or accompanied by a current prospectus.
NOT FDIC INSURED• MAY LOSE VALUE• NO BANK GUARANTEE

LETTER FROM THE EXECUTIVE CHAIR
Dear Shareholders:
During the first quarter of 2020, market volatility reached levels not seen since the global financial crisis. Optimism heading into the year — on receding trade and
geopolitical risk along with easier central bank policies — was overwhelmed in February as the health effects of a novel coronavirus,COVID-19, spread beyond China’s borders, ultimately impacting more than 200 countries. The global pandemic prompted many governments to take drastic action to slow the spread of the virus, such as quarantines, school and business closures, and prohibitions on public gatherings. While these are important steps to protect the public health, they come at a cost: rising market volatility and an abrupt decline in economic growth.
Global central banks have taken aggressive, coordinated steps to cushion the economic and market fallout related to the virus, and
governments are undertaking unprecedented levels of fiscal stimulus. As uncertainty recedes, these measures can help create a supportive environment and encourage economic recovery. In the aftermath of the crisis, there are likely to be societal changes as households, businesses and governments adjust to a new reality and these alterations could change the investment landscape. Occurrences such as the COVID-19 outbreak demonstrate the importance of having a deep understanding of company fundamentals, and our global research platform has been built to do just that.
Here at MFS®, we aim to help our clients navigate the growing complexity of the markets and world economies. Our long-term investment philosophy and commitment to the responsible allocation of capital allow us to tune out the noise and uncover what we believe are the best, most durable investment opportunities in the market. Through our powerful global investment platform, we combine collective expertise, thoughtful risk management, and long-term discipline to create sustainable value for investors.
Respectfully,

Robert J. Manning
Executive Chair
MFS Investment Management
April 16, 2020
The opinions expressed in this letter are subject to change and may not be relied upon for investment advice. No forecasts can be guaranteed.
1
PORTFOLIO COMPOSITION
Portfolio structure

| | | | |
| Top ten holdings | | | | |
| PRA Health Sciences, Inc. | | | 1.5% | |
| CACI International, Inc., “A” | | | 1.5% | |
| WNS (Holdings) Ltd., ADR | | | 1.4% | |
| SS&C Technologies Holdings, Inc. | | | 1.3% | |
| Clarivate Analytics PLC | | | 1.3% | |
| STERIS PLC | | | 1.3% | |
| Bright Horizons Family Solutions, Inc. | | | 1.3% | |
| OBIC Co. Ltd. | | | 1.3% | |
| Everbridge, Inc. | | | 1.2% | |
| QTS Realty Trust, Inc., REIT, “A” | | | 1.2% | |
| |
| GICS equity sectors (g) | | | | |
| Industrials | | | 20.1% | |
| Information Technology | | | 18.2% | |
| Consumer Discretionary | | | 13.2% | |
| Health Care | | | 12.0% | |
| Real Estate | | | 10.4% | |
| Materials | | | 8.4% | |
| Financials | | | 4.8% | |
| Communication Services | | | 4.1% | |
| Consumer Staples | | | 3.7% | |
| Energy | | | 0.4% | |
| | | | |
| Issuer country weightings (x) | | | | |
| United States | | | 53.5% | |
| United Kingdom | | | 9.2% | |
| Germany | | | 6.6% | |
| Japan | | | 5.9% | |
| India | | | 3.7% | |
| France | | | 3.5% | |
| Netherlands | | | 3.3% | |
| Norway | | | 1.5% | |
| Spain | | | 1.4% | |
| Other Countries | | | 11.4% | |
|
| Currency exposure weightings (y) | |
| United States Dollar | | | 59.1% | |
| Euro | | | 14.2% | |
| British Pound Sterling | | | 8.0% | |
| Japanese Yen | | | 5.9% | |
| Indian Rupee | | | 3.1% | |
| Norwegian Krone | | | 1.5% | |
| Swiss Franc | | | 1.1% | |
| Brazilian Real | | | 1.1% | |
| Taiwan Dollar | | | 0.8% | |
| Other Currencies | | | 5.2% | |
| (g) | The Global Industry Classification Standard (GICS®) was developed by and/or is the exclusive property of MSCI, Inc. and S&P Global Market Intelligence Inc. (“S&P Global Market Intelligence”). GICS is a service mark of MSCI and S&P Global Market Intelligence and has been licensed for use by MFS. |
| (x) | Represents the portfolio’s exposure to issuer countries as a percentage of a portfolio’s net assets. For purposes of this presentation, United States includes Cash & Cash Equivalents. |
2
Portfolio Composition – continued
| (y) | Represents the portfolio’s exposure to a particular currency as a percentage of a portfolio’s net assets. For purposes of this presentation, United States Dollar includes Cash & Cash Equivalents. |
Cash & Cash Equivalents includes any cash, investments in money market funds, short-term securities, and other assets less liabilities. Please see the Statement of Assets and Liabilities for additional information related to the fund’s cash position and other assets and liabilities.
Percentages are based on net assets as of February 29, 2020.
The portfolio is actively managed and current holdings may be different.
3
EXPENSE TABLE
Fund expenses borne by the shareholders during the period, September 1, 2019 through February 29, 2020
As a shareholder of the fund, you incur two types of costs: (1) transaction costs, including sales charges (loads) on certain purchase or redemption payments, and
(2) ongoing costs, including management fees; distribution and service(12b-1) fees; and other fund expenses. This example is intended to help you understand your ongoing costs (in dollars) of investing in the fund and to compare these costs with the ongoing costs of investing in other mutual funds.
The example is based on an investment of $1,000 invested at the beginning of the period and held for the entire period September 1, 2019 through February 29, 2020.
Actual Expenses
The first line for each share class in the following table provides information about actual account values and actual expenses. You may use the information in this line, together with the amount you invested, to estimate the expenses that you paid over the period. Simply divide your account value by $1,000 (for example, an $8,600 account value divided by $1,000 = 8.6), then multiply the result by the number in the first line under the heading entitled “Expenses Paid During Period” to estimate the expenses you paid on your account during this period.
Hypothetical Example for Comparison Purposes
The second line for each share class in the following table provides information about hypothetical account values and hypothetical expenses based on the fund’s actual expense ratio and an assumed rate of return of 5% per year before expenses, which is not the fund’s actual return. The hypothetical account values and expenses may not be used to estimate the actual ending account balance or expenses you paid for the period. You may use this information to compare the ongoing costs of investing in the fund and other funds. To do so, compare this 5% hypothetical example with the 5% hypothetical examples that appear in the shareholder reports of the other funds.
Please note that the expenses shown in the table are meant to highlight your ongoing costs only and do not reflect any transactional costs, such as sales charges (loads). Therefore, the second line for each share class in the table is useful in comparing ongoing costs only, and will not help you determine the relative total costs of owning different funds. In addition, if these transactional costs were included, your costs would have been higher.
4
Expense Table – continued
| | | | | | | | | | | | | | | | | | |
Share
Class | | | | Annualized
Expense
Ratio | | | Beginning
Account Value
9/01/19 | | | Ending
Account Value
2/29/20 | | | Expenses
Paid During
Period (p)
9/01/19-2/29/20 | |
| A | | Actual | | | 1.50% | | | | $1,000.00 | | | | $1,019.62 | | | | $7.53 | |
| | Hypothetical (h) | | | 1.50% | | | | $1,000.00 | | | | $1,017.40 | | | | $7.52 | |
| B | | Actual | | | 2.25% | | | | $1,000.00 | | | | $1,015.16 | | | | $11.27 | |
| | Hypothetical (h) | | | 2.25% | | | | $1,000.00 | | | | $1,013.67 | | | | $11.26 | |
| C | | Actual | | | 2.25% | | | | $1,000.00 | | | | $1,015.16 | | | | $11.27 | |
| | Hypothetical (h) | | | 2.25% | | | | $1,000.00 | | | | $1,013.67 | | | | $11.26 | |
| I | | Actual | | | 1.25% | | | | $1,000.00 | | | | $1,020.40 | | | | $6.28 | |
| | Hypothetical (h) | | | 1.25% | | | | $1,000.00 | | | | $1,018.65 | | | | $6.27 | |
| R1 | | Actual | | | 2.25% | | | | $1,000.00 | | | | $1,015.16 | | | | $11.27 | |
| | Hypothetical (h) | | | 2.25% | | | | $1,000.00 | | | | $1,013.67 | | | | $11.26 | |
| R2 | | Actual | | | 1.75% | | | | $1,000.00 | | | | $1,017.82 | | | | $8.78 | |
| | Hypothetical (h) | | | 1.75% | | | | $1,000.00 | | | | $1,016.16 | | | | $8.77 | |
| R3 | | Actual | | | 1.50% | | | | $1,000.00 | | | | $1,019.09 | | | | $7.53 | |
| | Hypothetical (h) | | | 1.50% | | | | $1,000.00 | | | | $1,017.40 | | | | $7.52 | |
| R4 | | Actual | | | 1.25% | | | | $1,000.00 | | | | $1,020.93 | | | | $6.28 | |
| | Hypothetical (h) | | | 1.25% | | | | $1,000.00 | | | | $1,018.65 | | | | $6.27 | |
| R6 | | Actual | | | 1.16% | | | | $1,000.00 | | | | $1,020.35 | | | | $5.83 | |
| | Hypothetical (h) | | | 1.16% | | | | $1,000.00 | | | | $1,019.10 | | | | $5.82 | |
| (h) | 5% class return per year before expenses. |
| (p) | “Expenses Paid During Period” are equal to each class’s annualized expense ratio, as shown above, multiplied by the average account value over the period, multiplied by 182/366 (to reflect theone-half year period). Expenses paid do not include any applicable sales charges (loads). If these transaction costs had been included, your costs would have been higher. |
5
PORTFOLIO OF INVESTMENTS
2/29/20 (unaudited)
The Portfolio of Investments is a complete list of all securities owned by your fund. It is categorized by broad-based asset classes.
| | | | | | | | |
| | |
| Issuer | | Shares/Par | | | Value ($) | |
| Common Stocks - 95.3% | | | | | | |
| Aerospace - 5.9% | | | | | | |
| CACI International, Inc., “A” (a) | | | 3,035 | | | $ | 743,636 | |
| FLIR Systems, Inc. | | | 10,023 | | | | 425,677 | |
| LISI Group | | | 14,590 | | | | 453,502 | |
| MTU Aero Engines Holding AG | | | 1,737 | | | | 424,495 | |
| PAE, Inc. (a) | | | 45,320 | | | | 496,254 | |
| Singapore Technologies Engineering Ltd. | | | 125,000 | | | | 377,911 | |
| | | | | | | | |
| | | | | | | $ | 2,921,475 | |
| Apparel Manufacturers - 0.8% | | | | | | |
| Levi Strauss & Co., “A” (l) | | | 24,635 | | | $ | 418,549 | |
| | |
| Automotive - 5.3% | | | | | | |
| Copart, Inc. (a) | | | 6,771 | | | $ | 572,014 | |
| Hella KGaA Hueck & Co. | | | 4,331 | | | | 178,973 | |
| IAA, Inc. (a) | | | 7,271 | | | | 310,617 | |
| Koito Manufacturing Co. Ltd. | | | 8,300 | | | | 334,490 | |
| LKQ Corp. (a) | | | 17,204 | | | | 508,894 | |
| Plastic Omnium S.A. | | | 9,956 | | | | 223,419 | |
| USS Co. Ltd. | | | 16,100 | | | | 253,774 | |
| Visteon Corp. (a) | | | 3,445 | | | | 224,063 | |
| | | | | | | | |
| | | | | | | $ | 2,606,244 | |
| Brokerage & Asset Managers - 1.8% | | | | | | |
| Euronext N.V. | | | 3,598 | | | $ | 300,376 | |
| NASDAQ, Inc. | | | 5,698 | | | | 584,330 | |
| | | | | | | | |
| | | | | | | $ | 884,706 | |
| Business Services - 6.4% | | | | | | |
| AS ONE Corp. | | | 3,800 | | | $ | 284,998 | |
| Auto Trader Group PLC | | | 28,763 | | | | 194,095 | |
| Cancom SE | | | 6,272 | | | | 306,876 | |
| Cerved Information Solutions S.p.A. | | | 26,592 | | | | 252,659 | |
| Clarivate Analytics PLC (a) | | | 31,867 | | | | 648,175 | |
| Electrocomponents PLC | | | 38,177 | | | | 300,725 | |
| EVO Payments, Inc., “A” (a) | | | 9,036 | | | | 228,430 | |
| TransUnion | | | 3,009 | | | | 267,560 | |
| WNS (Holdings) Ltd., ADR (a) | | | 10,435 | | | | 687,040 | |
| | | | | | | | |
| | | | | | | $ | 3,170,558 | |
| Cable TV - 0.5% | | | | | | |
| Cable One, Inc. | | | 168 | | | $ | 264,267 | |
6
Portfolio of Investments (unaudited) – continued
| | | | | | | | |
| | |
| Issuer | | Shares/Par | | | Value ($) | |
| Common Stocks - continued | | | | | | |
| Chemicals - 1.1% | | | | | | |
| FMC Corp. | | | 5,662 | | | $ | 527,132 | |
| | |
| Computer Software - 6.3% | | | | | | |
| Cadence Design Systems, Inc. (a) | | | 4,450 | | | $ | 294,323 | |
| Everbridge, Inc. (a) | | | 5,767 | | | | 609,341 | |
| OBIC Co. Ltd. | | | 5,100 | | | | 626,849 | |
| Paylocity Holding Corp. (a) | | | 3,772 | | | | 488,549 | |
| Rakus Co. Ltd. | | | 13,000 | | | | 185,677 | |
| Synopsys, Inc. (a) | | | 3,689 | | | | 508,824 | |
| Zendesk, Inc. (a) | | | 5,116 | | | | 405,750 | |
| | | | | | | | |
| | | | | | | $ | 3,119,313 | |
| Computer Software - Systems - 5.3% | | | | | | |
| Amadeus IT Group S.A. | | | 5,666 | | | $ | 401,452 | |
| EPAM Systems, Inc. (a) | | | 1,812 | | | | 404,438 | |
| Linx S.A. | | | 46,800 | | | | 328,403 | |
| Q2 Holdings, Inc. (a) | | | 3,144 | | | | 236,963 | |
| Rapid7, Inc. (a) | | | 7,506 | | | | 347,528 | |
| SS&C Technologies Holdings, Inc. | | | 11,882 | | | | 659,451 | |
| Tech Mahindra Ltd. | | | 22,542 | | | | 232,518 | |
| | | | | | | | |
| | | | | | | $ | 2,610,753 | |
| Construction - 4.0% | | | | | | |
| Lennox International, Inc. | | | 2,348 | | | $ | 535,649 | |
| Masco Corp. | | | 8,052 | | | | 332,709 | |
| Mid-America Apartment Communities, Inc., REIT | | | 3,039 | | | | 392,821 | |
| Somfy S.A. | | | 3,686 | | | | 345,472 | |
| Summit Materials, Inc., “A” (a) | | | 18,388 | | | | 359,301 | |
| | | | | | | | |
| | | | | | | $ | 1,965,952 | |
| Consumer Products - 0.4% | | | | | | |
| Dabur India Ltd. | | | 29,882 | | | $ | 206,299 | |
| | |
| Consumer Services - 2.8% | | | | | | |
| 51job, Inc., ADR (a) | | | 3,023 | | | $ | 226,030 | |
| Bright Horizons Family Solutions, Inc. (a) | | | 4,024 | | | | 632,371 | |
| MakeMyTrip Ltd. (a) | | | 12,779 | | | | 294,045 | |
| OneSpaWorld Holdings Ltd. (l) | | | 19,991 | | | | 244,290 | |
| | | | | | | | |
| | | | | | | $ | 1,396,736 | |
| Containers - 1.7% | | | | | | |
| Fuji Seal International, Inc. | | | 11,100 | | | $ | 199,715 | |
| Gerresheimer AG | | | 5,911 | | | | 427,098 | |
| Mayr-Melnhof Karton AG | | | 1,672 | | | | 220,389 | |
| | | | | | | | |
| | | | | | | $ | 847,202 | |
7
Portfolio of Investments (unaudited) – continued
| | | | | | | | |
| | |
| Issuer | | Shares/Par | | | Value ($) | |
| Common Stocks - continued | | | | | | |
| Electrical Equipment - 4.1% | | | | | | |
| AMETEK, Inc. | | | 4,527 | | | $ | 389,322 | |
| HD Supply Holdings, Inc. (a) | | | 12,506 | | | | 475,478 | |
| Littlefuse, Inc. | | | 3,074 | | | | 490,856 | |
| Sensata Technologies Holding PLC (a) | | | 7,710 | | | | 314,568 | |
| Voltronic Power Technology Corp. | | | 16,650 | | | | 381,849 | |
| | | | | | | | |
| | | | | | | $ | 2,052,073 | |
| Electronics - 0.7% | | | | | | |
| Kardex AG | | | 2,299 | | | $ | 361,878 | |
| | |
| Entertainment - 1.6% | | | | | | |
| CTS Eventim AG | | | 9,135 | | | $ | 483,165 | |
| Manchester United PLC, “A” | | | 16,612 | | | | 290,544 | |
| | | | | | | | |
| | | | | | | $ | 773,709 | |
| Food & Beverages - 2.6% | | | | | | |
| Bakkafrost P/f | | | 7,716 | | | $ | 487,320 | |
| Cranswick PLC | | | 13,167 | | | | 566,991 | |
| S Foods, Inc. | | | 11,600 | | | | 240,193 | |
| | | | | | | | |
| | | | | | | $ | 1,294,504 | |
| Furniture & Appliances - 0.8% | | | | | | |
| SEB S.A. | | | 2,824 | | | $ | 378,325 | |
| | |
| Gaming & Lodging - 1.2% | | | | | | |
| Shangri-La Asia Ltd. | | | 118,000 | | | $ | 102,796 | |
| Wyndham Hotels & Resorts, Inc. | | | 10,115 | | | | 515,359 | |
| | | | | | | | |
| | | | | | | $ | 618,155 | |
| General Merchandise - 0.9% | | | | | | |
| Ollie’s Bargain Outlet Holdings, Inc. (a) | | | 8,918 | | | $ | 453,659 | |
| | |
| Insurance - 1.5% | | | | | | |
| Arthur J. Gallagher & Co. | | | 4,683 | | | $ | 456,546 | |
| Sony Financial Holdings, Inc. | | | 13,200 | | | | 262,766 | |
| | | | | | | | |
| | | | | | | $ | 719,312 | |
| Internet - 1.0% | | | | | | |
| Rightmove PLC | | | 64,323 | | | $ | 514,540 | |
| | |
| Leisure & Toys - 0.6% | | | | | | |
| Thule Group AB | | | 12,826 | | | $ | 279,927 | |
8
Portfolio of Investments (unaudited) – continued
| | | | | | | | |
| | |
| Issuer | | Shares/Par | | | Value ($) | |
| Common Stocks - continued | | | | | | |
| Machinery & Tools - 3.1% | | | | | | |
| Aalberts Industries N.V. | | | 8,353 | | | $ | 316,459 | |
| IDEX Corp. | | | 2,416 | | | | 357,568 | |
| Ritchie Bros. Auctioneers, Inc. | | | 6,578 | | | | 261,146 | |
| Spirax-Sarco Engineering PLC | | | 3,602 | | | | 392,142 | |
| VAT Group AG | | | 1,470 | | | | 201,700 | |
| | | | | | | | |
| | | | | | | $ | 1,529,015 | |
| Medical & Health Technology & Services - 4.9% | | | | | | |
| Charles River Laboratories International, Inc. (a) | | | 3,294 | | | $ | 512,448 | |
| ICON PLC (a) | | | 3,274 | | | | 510,940 | |
| PRA Health Sciences, Inc. (a) | | | 8,097 | | | | 762,737 | |
| Premier, Inc., “A” (a) | | | 8,761 | | | | 257,836 | |
| Selcuk Ecza Deposu Ticaret ve Sanayi A.S. | | | 358,128 | | | | 380,599 | |
| | | | | | | | |
| | | | | | | $ | 2,424,560 | |
| Medical Equipment - 5.7% | | | | | | |
| Envista Holdings Corp. (a) | | | 8,044 | | | $ | 204,157 | |
| Masimo Corp. (a) | | | 2,549 | | | | 416,328 | |
| Nakanishi, Inc. | | | 18,500 | | | | 281,270 | |
| PerkinElmer, Inc. | | | 6,140 | | | | 530,742 | |
| QIAGEN N.V. (a) | | | 9,447 | | | | 339,147 | |
| Quidel Corp. (a) | | | 5,430 | | | | 419,413 | |
| STERIS PLC | | | 3,987 | | | | 632,418 | |
| | | | | | | | |
| | | | | | | $ | 2,823,475 | |
| Network & Telecom - 1.4% | | | | | | |
| Interxion Holding N.V. (a) | | | 1,159 | | | $ | 98,388 | |
| QTS Realty Trust, Inc., REIT, “A” | | | 10,708 | | | | 601,468 | |
| | | | | | | | |
| | | | | | | $ | 699,856 | |
| Oil Services - 0.4% | | | | | | |
| Core Laboratories N.V. | | | 8,179 | | | $ | 219,524 | |
| | |
| Printing & Publishing - 0.8% | | | | | | |
| IHS Markit Ltd. | | | 5,244 | | | $ | 373,583 | |
| | |
| Railroad & Shipping - 1.1% | | | | | | |
| DFDS A.S. | | | 6,081 | | | $ | 211,274 | |
| Kansas City Southern Co. | | | 2,204 | | | | 332,099 | |
| | | | | | | | |
| | | | | | | $ | 543,373 | |
| Real Estate - 8.4% | | | | | | |
| Big Yellow Group PLC, REIT | | | 21,027 | | | $ | 288,397 | |
| Corporacion Inmobiliaria Vesta S.A.B. de C.V. | | | 207,795 | | | | 329,698 | |
9
Portfolio of Investments (unaudited) – continued
| | | | | | | | |
| | |
| Issuer | | Shares/Par | | | Value ($) | |
| Common Stocks - continued | | | | | | |
| Real Estate - continued | | | | | | |
| Embassy Office Parks, REIT | | | 67,000 | | | $ | 415,875 | |
| Industrial Logistics Properties Trust, REIT | | | 14,791 | | | | 305,582 | |
| LEG Immobilien AG | | | 4,470 | | | | 534,127 | |
| Multiplan Empreendimentos Imobiliarios S.A. | | | 33,971 | | | | 231,847 | |
| National Storage, REIT | | | 225,106 | | | | 324,233 | |
| STAG Industrial, Inc., REIT | | | 15,924 | | | | 445,553 | |
| STORE Capital Corp., REIT | | | 16,318 | | | | 536,209 | |
| Sun Communities, Inc., REIT | | | 1,418 | | | | 216,784 | |
| Unite Group PLC, REIT | | | 34,935 | | | | 510,691 | |
| | | | | | | | |
| | | | | | | $ | 4,138,996 | |
| Restaurants - 1.3% | | | | | | |
| Performance Food Group Co. (a) | | | 8,033 | | | $ | 340,599 | |
| Yum China Holdings, Inc. | | | 7,226 | | | | 316,427 | |
| | | | | | | | |
| | | | | | | $ | 657,026 | |
| Special Products & Services - 0.7% | | | | | | |
| Boyd Group Services, Inc. | | | 2,321 | | | $ | 363,129 | |
| | |
| Specialty Chemicals - 6.7% | | | | | | |
| Axalta Coating Systems Ltd. (a) | | | 18,016 | | | $ | 448,959 | |
| Borregaard ASA | | | 24,391 | | | | 261,170 | |
| Croda International PLC | | | 8,148 | | | | 477,804 | |
| Ferro Corp. (a) | | | 31,300 | | | | 363,706 | |
| Filtrona PLC | | | 83,937 | | | | 389,108 | |
| IMCD Group N.V. | | | 5,521 | | | | 452,735 | |
| RPM International, Inc. | | | 5,186 | | | | 332,474 | |
| Symrise AG | | | 6,032 | | | | 587,511 | |
| | | | | | | | |
| | | | | | | $ | 3,313,467 | |
| Specialty Stores - 2.4% | | | | | | |
| Burlington Stores, Inc. (a) | | | 2,106 | | | $ | 455,443 | |
| Just Eat Takeaway (a) | | | 4,943 | | | | 434,453 | |
| Just Eat Takeaway (a) | | | 3,473 | | | | 303,466 | |
| | | | | | | | |
| | | | | | | $ | 1,193,362 | |
| Telecommunications - Wireless - 0.6% | | | | | | |
| Cellnex Telecom S.A. | | | 6,130 | | | $ | 299,927 | |
| | |
| Trucking - 0.5% | | | | | | |
| SG Holdings Co. Ltd. | | | 13,800 | | | $ | 269,449 | |
| Total Common Stocks (Identified Cost, $40,910,859) | | | | | | $ | 47,234,010 | |
10
Portfolio of Investments (unaudited) – continued
| | | | | | | | |
| | |
| Issuer | | Shares/Par | | | Value ($) | |
| Investment Companies (h) - 3.1% | | | | | | |
| Money Market Funds - 3.1% | | | | | | |
MFS Institutional Money Market Portfolio, 1.61% (v)
(Identified Cost, $1,539,600) | | | 1,539,600 | | | $ | 1,539,754 | |
| | |
| Collateral for Securities Loaned - 0.2% | | | | | | |
| State Street Navigator Securities Lending Government Money Market Portfolio, 1.61% (j) (Identified Cost, $86,294) | | | 86,294 | | | $ | 86,294 | |
| | |
| Other Assets, Less Liabilities - 1.4% | | | | | 694,446 | |
| Net Assets - 100.0% | | | | | | $ | 49,554,504 | |
| (a) | Non-income producing security. |
| (h) | An affiliated issuer, which may be considered one in which the fund owns 5% or more of the outstanding voting securities, or a company which is under common control. At period end, the aggregate values of the fund’s investments in affiliated issuers and in unaffiliated issuers were $1,539,754 and $47,320,304, respectively. |
| (j) | The rate quoted is the annualizedseven-day yield of the fund at period end. |
| (l) | A portion of this security is on loan. See Note 2 for additional information. |
| (v) | Affiliated issuer that is available only to investment companies managed by MFS. The rate quoted for the MFS Institutional Money Market Portfolio is the annualizedseven-day yield of the fund at period end. |
The following abbreviations are used in this report and are defined:
| ADR | | American Depositary Receipt |
| REIT | | Real Estate Investment Trust |
See Notes to Financial Statements
11
Financial Statements
STATEMENT OF ASSETS AND LIABILITIES
At 2/29/20 (unaudited)
This statement represents your fund’s balance sheet, which details the assets and liabilities comprising the total value of the fund.
| | | | |
| Assets | | | | |
Investments in unaffiliated issuers, at value, including $235,759 of securities on loan (identified cost, $40,997,153) | | | $47,320,304 | |
Investments in affiliated issuers, at value (identified cost, $1,539,600) | | | 1,539,754 | |
Foreign currency, at value (identified cost, $22,914) | | | 22,760 | |
Receivables for | | | | |
Investments sold | | | 722,771 | |
Fund shares sold | | | 434,636 | |
Interest and dividends | | | 35,650 | |
Receivable from investment adviser | | | 13,682 | |
Other assets | | | 352 | |
Total assets | | | $50,089,909 | |
| |
| Liabilities | | | | |
Payables for | | | | |
Investments purchased | | | $165,234 | |
Fund shares reacquired | | | 235,462 | |
Collateral for securities loaned, at value (c) | | | 86,294 | |
Payable to affiliates | | | | |
Administrative services fee | | | 144 | |
Shareholder servicing costs | | | 18,356 | |
Distribution and service fees | | | 755 | |
Payable for independent Trustees’ compensation | | | 116 | |
Deferred country tax expense payable | | | 25 | |
Accrued expenses and other liabilities | | | 29,019 | |
Total liabilities | | | $535,405 | |
Net assets | | | $49,554,504 | |
| |
| Net assets consist of | | | | |
Paid-in capital | | | $41,269,245 | |
Total distributable earnings (loss) | | | 8,285,259 | |
Net assets | | | $49,554,504 | |
Shares of beneficial interest outstanding | | | 2,668,361 | |
| (c) | Non-cash collateral is not included. |
12
Statement of Assets and Liabilities (unaudited) – continued
| | | | | | | | | | | | |
| | | |
| | | Net assets | | | Shares
outstanding | | | Net asset value
per share (a) | |
Class A | | | $13,784,045 | | | | 743,571 | | | | $18.54 | |
Class B | | | 2,360,464 | | | | 136,478 | | | | 17.30 | |
Class C | | | 3,265,692 | | | | 188,833 | | | | 17.29 | |
Class I | | | 15,444,622 | | | | 819,588 | | | | 18.84 | |
Class R1 | | | 102,746 | | | | 5,945 | | | | 17.28 | |
Class R2 | | | 223,314 | | | | 12,310 | | | | 18.14 | |
Class R3 | | | 156,927 | | | | 8,467 | | | | 18.53 | |
Class R4 | | | 74,934 | | | | 3,976 | | | | 18.85 | |
Class R6 | | | 14,141,760 | | | | 749,193 | | | | 18.88 | |
| (a) | Maximum offering price per share was equal to the net asset value per share for all share classes, except for Class A, for which the maximum offering price per share was $19.67 [100 / 94.25 x $18.54]. On sales of $50,000 or more, the maximum offering price of Class A shares is reduced. A contingent deferred sales charge may be imposed on redemptions of Class A, Class B, and Class C shares. Redemption price per share was equal to the net asset value per share for Classes I, R1, R2, R3, R4, and R6. |
See Notes to Financial Statements
13
Financial Statements
STATEMENT OF OPERATIONS
Six months ended 2/29/20 (unaudited)
This statement describes how much your fund earned in investment income and accrued in expenses. It also describes any gains and/or losses generated by fund operations.
| | | | |
| Net investment income (loss) | | | | |
Income | | | | |
Dividends | | | $238,004 | |
Dividends from affiliated issuers | | | 13,309 | |
Income on securities loaned | | | 9,651 | |
Other | | | 133 | |
Foreign taxes withheld | | | (11,565 | ) |
Total investment income | | | $249,532 | |
Expenses | | | | |
Management fee | | | $235,100 | |
Distribution and service fees | | | 47,407 | |
Shareholder servicing costs | | | 21,527 | |
Administrative services fee | | | 8,730 | |
Independent Trustees’ compensation | | | 657 | |
Custodian fee | | | 23,996 | |
Shareholder communications | | | 8,418 | |
Audit and tax fees | | | 32,868 | |
Legal fees | | | 220 | |
Registration fees | | | 61,188 | |
Miscellaneous | | | 16,005 | |
Total expenses | | | $456,116 | |
Reduction of expenses by investment adviser and distributor | | | (112,434 | ) |
Net expenses | | | $343,682 | |
Net investment income (loss) | | | $(94,150 | ) |
| |
| Realized and unrealized gain (loss) | | | | |
Realized gain (loss) (identified cost basis) | | | | |
Unaffiliated issuers (net of $7,795 country tax) | | | $3,225,574 | |
Affiliated issuers | | | 210 | |
Foreign currency | | | 5,036 | |
Net realized gain (loss) | | | $3,230,820 | |
Change in unrealized appreciation or depreciation | | | | |
Unaffiliated issuers (net of $12,632 decrease in deferred country tax) | | | $(2,674,106 | ) |
Affiliated issuers | | | 104 | |
Translation of assets and liabilities in foreign currencies | | | 181 | |
Net unrealized gain (loss) | | | $(2,673,821 | ) |
Net realized and unrealized gain (loss) | | | $556,999 | |
Change in net assets from operations | | | $462,849 | |
See Notes to Financial Statements
14
Financial Statements
STATEMENTS OF CHANGES IN NET ASSETS
These statements describe the increases and/or decreases in net assets resulting from operations, any distributions, and any shareholder transactions.
| | | | | | | | |
| Change in net assets | | Six months ended
2/29/20
(unaudited) | | | Year ended
8/31/19 | |
| | |
| From operations | | | | | | | | |
Net investment income (loss) | | | $(94,150 | ) | | | $(40,526 | ) |
Net realized gain (loss) | | | 3,230,820 | | | | 994,662 | |
Net unrealized gain (loss) | | | (2,673,821 | ) | | | (2,756,304 | ) |
Change in net assets from operations | | | $462,849 | | | | $(1,802,168 | ) |
Total distributions to shareholders | | | $(1,495,013 | ) | | | $(3,638,101 | ) |
Change in net assets from fund share transactions | | | $5,551,310 | | | | $(3,359,876 | ) |
Total change in net assets | | | $4,519,146 | | | | $(8,800,145 | ) |
| | |
| Net assets | | | | | | | | |
At beginning of period | | | 45,035,358 | | | | 53,835,503 | |
At end of period | | | $49,554,504 | | | | $45,035,358 | |
See Notes to Financial Statements
15
Financial Statements
FINANCIAL HIGHLIGHTS
The financial highlights table is intended to help you understand the fund’s financial performance for the semiannual period and the past 5 fiscal years. Certain information reflects financial results for a single fund share. The total returns in the table represent the rate that an investor would have earned (or lost) on an investment in the fund share class (assuming reinvestment of all distributions) held for the entire period.
| | | | | | | | | | | | | | | | | | | | | | | | |
| | | Six months
ended 2/29/20 | | | Year ended | |
| Class A | | 8/31/19 | | | 8/31/18 | | | 8/31/17 | | | 8/31/16 | | | 8/31/15 | |
| | | (unaudited) | | | | | | | | | | | | | | | | |
Net asset value, beginning of period | | | $18.72 | | | | $21.27 | | | | $18.31 | | | | $15.69 | | | | $14.85 | | | | $15.58 | |
| | | |
| Income (loss) from investment operations | | | | | | | | | | | | | |
Net investment income (loss) (d) | | | $(0.05 | ) | | | $(0.03 | ) | | | $(0.03 | ) | | | $(0.02 | ) | | | $0.01 | | | | $(0.02 | ) |
Net realized and unrealized
gain (loss) | | | 0.45 | | | | (0.62 | ) | | | 3.57 | | | | 2.66 | | | | 0.84 | | | | (0.06 | ) |
Total from investment operations | | | $0.40 | | | | $(0.65 | ) | | | $3.54 | | | | $2.64 | | | | $0.85 | | | | $(0.08 | ) |
| | | |
| Less distributions declared to shareholders | | | | | | | | | | | | | |
From net investment income | | | $— | | | | $(0.02 | ) | | | $— | | | | $(0.02 | ) | | | $(0.01 | ) | | | $— | |
From net realized gain | | | (0.58 | ) | | | (1.88 | ) | | | (0.58 | ) | | | — | | | | — | | | | (0.65 | ) |
Total distributions declared to
shareholders | | | $(0.58 | ) | | | $(1.90 | ) | | | $(0.58 | ) | | | $(0.02 | ) | | | $(0.01 | ) | | | $(0.65 | ) |
Net asset value, end of period (x) | | | $18.54 | | | | $18.72 | | | | $21.27 | | | | $18.31 | | | | $15.69 | | | | $14.85 | |
Total return (%) (r)(s)(t)(x) | | | 1.96 | (n) | | | (1.65 | ) | | | 19.70 | | | | 16.85 | | | | 5.75 | | | | (0.30 | ) |
| | | |
Ratios (%) (to average net assets)
and Supplemental data: | | | | | | | | | | | | | |
Expenses before expense reductions (f) | | | 1.97 | (a) | | | 2.04 | | | | 1.94 | | | | 2.33 | | | | 2.35 | | | | 2.34 | |
Expenses after expense reductions (f) | | | 1.50 | (a) | | | 1.51 | | | | 1.50 | | | | 1.50 | | | | 1.50 | | | | 1.50 | |
Net investment income (loss) | | | (0.48 | )(a)(l) | | | (0.16 | ) | | | (0.17 | ) | | | (0.15 | ) | | | 0.07 | | | | (0.17 | ) |
Portfolio turnover | | | 47 | (n) | | | 55 | | | | 36 | | | | 37 | | | | 37 | | | | 35 | |
Net assets at end of period
(000 omitted) | | | $13,784 | | | | $11,255 | | | | $11,581 | | | | $7,893 | | | | $11,699 | | | | $14,144 | |
See Notes to Financial Statements
16
Financial Highlights – continued
| | | | | | | | | | | | | | | | | | | | | | | | |
| | | Six months ended 2/29/20 | | | Year ended | |
| Class B | | 8/31/19 | | | 8/31/18 | | | 8/31/17 | | | 8/31/16 | | | 8/31/15 | |
| | | (unaudited) | | | | | | | | | | | | | | | | |
Net asset value, beginning of period | | | $17.57 | | | | $20.21 | | | | $17.55 | | | | $15.13 | | | | $14.42 | | | | $15.26 | |
| | | |
| Income (loss) from investment operations | | | | | | | | | | | | | |
Net investment income (loss) (d) | | | $(0.11 | ) | | | $(0.16 | ) | | | $(0.17 | ) | | | $(0.13 | ) | | | $(0.09 | ) | | | $(0.13 | ) |
Net realized and unrealized
gain (loss) | | | 0.42 | | | | (0.60 | ) | | | 3.41 | | | | 2.55 | | | | 0.80 | | | | (0.06 | ) |
Total from investment operations | | | $0.31 | | | | $(0.76 | ) | | | $3.24 | | | | $2.42 | | | | $0.71 | | | | $(0.19 | ) |
| | | |
| Less distributions declared to shareholders | | | | | | | | | | | | | |
From net investment income | | | $— | | | | $— | | | | $— | | | | $— | | | | $— | | | | $— | |
From net realized gain | | | (0.58 | ) | | | (1.88 | ) | | | (0.58 | ) | | | — | | | | — | | | | (0.65 | ) |
Total distributions declared to
shareholders | | | $(0.58 | ) | | | $(1.88 | ) | | | $(0.58 | ) | | | $— | | | | $— | | | | $(0.65 | ) |
Net asset value, end of period (x) | | | $17.30 | | | | $17.57 | | | | $20.21 | | | | $17.55 | | | | $15.13 | | | | $14.42 | |
Total return (%) (r)(s)(t)(x) | | | 1.57 | (n) | | | (2.35 | ) | | | 18.83 | | | | 15.99 | | | | 4.92 | | | | (1.05 | ) |
| | | |
Ratios (%) (to average net assets)
and Supplemental data: | | | | | | | | | | | | | |
Expenses before expense reductions (f) | | | 2.72 | (a) | | | 2.79 | | | | 2.69 | | | | 3.07 | | | | 3.09 | | | | 3.08 | |
Expenses after expense reductions (f) | | | 2.25 | (a) | | | 2.26 | | | | 2.25 | | | | 2.25 | | | | 2.25 | | | | 2.25 | |
Net investment income (loss) | | | (1.21 | )(a)(l) | | | (0.91 | ) | | | (0.90 | ) | | | (0.83 | ) | | | (0.62 | ) | | | (0.90 | ) |
Portfolio turnover | | | 47 | (n) | | | 55 | | | | 36 | | | | 37 | | | | 37 | | | | 35 | |
Net assets at end of period
(000 omitted) | | | $2,360 | | | | $2,508 | | | | $2,488 | | | | $1,513 | | | | $1,188 | | | | $769 | |
See Notes to Financial Statements
17
Financial Highlights – continued
| | | | | | | | | | | | | | | | | | | | | | | | |
| | | Six months ended 2/29/20 | | | Year ended | |
| Class C | | 8/31/19 | | | 8/31/18 | | | 8/31/17 | | | 8/31/16 | | | 8/31/15 | |
| | | (unaudited) | | | | | | | | | | | | | | | | |
Net asset value, beginning of period | | | $17.57 | | | | $20.21 | | | | $17.55 | | | | $15.13 | | | | $14.42 | | | | $15.26 | |
| | | |
| Income (loss) from investment operations | | | | | | | | | | | | | |
Net investment income (loss) (d) | | | $(0.11 | ) | | | $(0.16 | ) | | | $(0.18 | ) | | | $(0.13 | ) | | | $(0.09 | ) | | | $(0.13 | ) |
Net realized and unrealized
gain (loss) | | | 0.41 | | | | (0.60 | ) | | | 3.42 | | | | 2.55 | | | | 0.80 | | | | (0.06 | ) |
Total from investment operations | | | $0.30 | | | | $(0.76 | ) | | | $3.24 | | | | $2.42 | | | | $0.71 | | | | $(0.19 | ) |
| | | |
| Less distributions declared to shareholders | | | | | | | | | | | | | |
From net investment income | | | $— | | | | $— | | | | $— | | | | $— | | | | $— | | | | $— | |
From net realized gain | | | (0.58 | ) | | | (1.88 | ) | | | (0.58 | ) | | | — | | | | — | | | | (0.65 | ) |
Total distributions declared to
shareholders | | | $(0.58 | ) | | | $(1.88 | ) | | | $(0.58 | ) | | | $— | | | | $— | | | | $(0.65 | ) |
Net asset value, end of period (x) | | | $17.29 | | | | $17.57 | | | | $20.21 | | | | $17.55 | | | | $15.13 | | | | $14.42 | |
Total return (%) (r)(s)(t)(x) | | | 1.52 | (n) | | | (2.35 | ) | | | 18.83 | | | | 15.99 | | | | 4.92 | | | | (1.05 | ) |
| | | |
Ratios (%) (to average net assets)
and Supplemental data: | | | | | | | | | | | | | |
Expenses before expense reductions (f) | | | 2.72 | (a) | | | 2.78 | | | | 2.69 | | | | 3.08 | | | | 3.09 | | | | 3.08 | |
Expenses after expense reductions (f) | | | 2.25 | (a) | | | 2.26 | | | | 2.25 | | | | 2.25 | | | | 2.24 | | | | 2.24 | |
Net investment income (loss) | | | (1.21 | )(a)(l) | | | (0.91 | ) | | | (0.93 | ) | | | (0.84 | ) | | | (0.64 | ) | | | (0.91 | ) |
Portfolio turnover | | | 47 | (n) | | | 55 | | | | 36 | | | | 37 | | | | 37 | | | | 35 | |
Net assets at end of period
(000 omitted) | | | $3,266 | | | | $3,287 | | | | $4,470 | | | | $4,944 | | | | $5,017 | | | | $4,737 | |
See Notes to Financial Statements
18
Financial Highlights – continued
| | | | | | | | | | | | | | | | | | | | | | | | |
| | | Six months ended 2/29/20 | | | Year ended | |
| Class I | | 8/31/19 | | | 8/31/18 | | | 8/31/17 | | | 8/31/16 | | | 8/31/15 | |
| | | (unaudited) | | | | | | | | | | | | | | | | |
Net asset value, beginning of period | | | $19.00 | | | | $21.54 | | | | $18.49 | | | | $15.86 | | | | $15.00 | | | | $15.69 | |
| | | |
| Income (loss) from investment operations | | | | | | | | | | | | | |
Net investment income (loss) (d) | | | $(0.02 | ) | | | $0.01 | | | | $0.02 | | | | $0.04 | | | | $0.07 | | | | $0.01 | |
Net realized and unrealized
gain (loss) | | | 0.44 | | | | (0.62 | ) | | | 3.61 | | | | 2.67 | | | | 0.82 | | | | (0.05 | ) |
Total from investment operations | | | $0.42 | | | | $(0.61 | ) | | | $3.63 | | | | $2.71 | | | | $0.89 | | | | $(0.04 | ) |
| | | |
| Less distributions declared to shareholders | | | | | | | | | | | | | |
From net investment income | | | $— | | | | $(0.05 | ) | | | $— | | | | $(0.08 | ) | | | $(0.03 | ) | | | $— | |
From net realized gain | | | (0.58 | ) | | | (1.88 | ) | | | (0.58 | ) | | | — | | | | — | | | | (0.65 | ) |
Total distributions declared to
shareholders | | | $(0.58 | ) | | | $(1.93 | ) | | | $(0.58 | ) | | | $(0.08 | ) | | | $(0.03 | ) | | | $(0.65 | ) |
Net asset value, end of period (x) | | | $18.84 | | | | $19.00 | | | | $21.54 | | | | $18.49 | | | | $15.86 | | | | $15.00 | |
Total return (%) (r)(s)(t)(x) | | | 2.04 | (n) | | | (1.41 | ) | | | 20.01 | | | | 17.20 | | | | 5.98 | | | | (0.03 | ) |
| | | |
Ratios (%) (to average net assets)
and Supplemental data: | | | | | | | | | | | | | |
Expenses before expense reductions (f) | | | 1.72 | (a) | | | 1.76 | | | | 1.69 | | | | 2.06 | | | | 2.06 | | | | 2.08 | |
Expenses after expense reductions (f) | | | 1.25 | (a) | | | 1.26 | | | | 1.25 | | | | 1.25 | | | | 1.25 | | | | 1.25 | |
Net investment income (loss) | | | (0.23 | )(a)(l) | | | 0.05 | | | | 0.11 | | | | 0.21 | | | | 0.44 | | | | 0.08 | |
Portfolio turnover | | | 47 | (n) | | | 55 | | | | 36 | | | | 37 | | | | 37 | | | | 35 | |
Net assets at end of period
(000 omitted) | | | $15,445 | | | | $14,059 | | | | $28,463 | | | | $17,606 | | | | $5,052 | | | | $4,596 | |
See Notes to Financial Statements
19
Financial Highlights – continued
| | | | | | | | | | | | | | | | | | | | | | | | |
| | | Six months
ended 2/29/20 | | | Year ended | |
| Class R1 | | 8/31/19 | | | 8/31/18 | | | 8/31/17 | | | 8/31/16 | | | 8/31/15 | |
| | | (unaudited) | | | | | | | | | | | | | | | | |
Net asset value, beginning of period | | | $17.56 | | | | $20.20 | | | | $17.55 | | | | $15.13 | | | | $14.42 | | | | $15.26 | |
| | | |
| Income (loss) from investment operations | | | | | | | | | | | | | |
Net investment income (loss) (d) | | | $(0.11 | ) | | | $(0.16 | ) | | | $(0.18 | ) | | | $(0.14 | ) | | | $(0.10 | ) | | | $(0.13 | ) |
Net realized and unrealized
gain (loss) | | | 0.41 | | | | (0.60 | ) | | | 3.41 | | | | 2.56 | | | | 0.81 | | | | (0.06 | ) |
Total from investment operations | | | $0.30 | | | | $(0.76 | ) | | | $3.23 | | | | $2.42 | | | | $0.71 | | | | $(0.19 | ) |
| | | |
| Less distributions declared to shareholders | | | | | | | | | | | | | |
From net investment income | | | $— | | | | $— | | | | $— | | | | $— | | | | $— | | | | $— | |
From net realized gain | | | (0.58 | ) | | | (1.88 | ) | | | (0.58 | ) | | | — | | | | — | | | | (0.65 | ) |
Total distributions declared to
shareholders | | | $(0.58 | ) | | | $(1.88 | ) | | | $(0.58 | ) | | | $— | | | | $— | | | | $(0.65 | ) |
Net asset value, end of period (x) | | | $17.28 | | | | $17.56 | | | | $20.20 | | | | $17.55 | | | | $15.13 | | | | $14.42 | |
Total return (%) (r)(s)(t)(x) | | | 1.52 | (n) | | | (2.35 | ) | | | 18.77 | | | | 15.99 | | | | 4.92 | | | | (1.05 | ) |
| | | |
Ratios (%) (to average net assets)
and Supplemental data: | | | | | | | | | | | | | |
Expenses before expense reductions (f) | | | 2.72 | (a) | | | 2.79 | | | | 2.69 | | | | 3.08 | | | | 3.12 | | | | 3.08 | |
Expenses after expense reductions (f) | | | 2.25 | (a) | | | 2.26 | | | | 2.25 | | | | 2.25 | | | | 2.25 | | | | 2.25 | |
Net investment income (loss) | | | (1.21 | )(a)(l) | | | (0.92 | ) | | | (0.92 | ) | | | (0.86 | ) | | | (0.70 | ) | | | (0.92 | ) |
Portfolio turnover | | | 47 | (n) | | | 55 | | | | 36 | | | | 37 | | | | 37 | | | | 35 | |
Net assets at end of period
(000 omitted) | | | $103 | | | | $101 | | | | $73 | | | | $62 | | | | $66 | | | | $287 | |
See Notes to Financial Statements
20
Financial Highlights – continued
| | | | | | | | | | | | | | | | | | | | | | | | |
| | | Six months
ended 2/29/20 | | | Year ended | |
| Class R2 | | 8/31/19 | | | 8/31/18 | | | 8/31/17 | | | 8/31/16 | | | 8/31/15 | |
| | | (unaudited) | | | | | | | | | | | | | | | | |
Net asset value, beginning of period | | | $18.36 | | | | $20.93 | | | | $18.06 | | | | $15.50 | | | | $14.71 | | | | $15.47 | |
| | | |
| Income (loss) from investment operations | | | | | | | | | | | | | |
Net investment income (loss) (d) | | | $(0.07 | ) | | | $(0.07 | ) | | | $(0.07 | ) | | | $(0.05 | ) | | | $(0.03 | ) | | | $(0.06 | ) |
Net realized and unrealized
gain (loss) | | | 0.43 | | | | (0.62 | ) | | | 3.52 | | | | 2.62 | | | | 0.82 | | | | (0.05 | ) |
Total from investment operations | | | $0.36 | | | | $(0.69 | ) | | | $3.45 | | | | $2.57 | | | | $0.79 | | | | $(0.11 | ) |
| | | |
| Less distributions declared to shareholders | | | | | | | | | | | | | |
From net investment income | | | $— | | | | $— | | | | $— | | | | $(0.01 | ) | | | $— | | | | $— | |
From net realized gain | | | (0.58 | ) | | | (1.88 | ) | | | (0.58 | ) | | | — | | | | — | | | | (0.65 | ) |
Total distributions declared to
shareholders | | | $(0.58 | ) | | | $(1.88 | ) | | | $(0.58 | ) | | | $(0.01 | ) | | | $— | | | | $(0.65 | ) |
Net asset value, end of period (x) | | | $18.14 | | | | $18.36 | | | | $20.93 | | | | $18.06 | | | | $15.50 | | | | $14.71 | |
Total return (%) (r)(s)(t)(x) | | | 1.78 | (n) | | | (1.89 | ) | | | 19.47 | | | | 16.58 | | | | 5.37 | | | | (0.50 | ) |
| | | |
Ratios (%) (to average net assets)
and Supplemental data: | | | | | | | | | | | | | |
Expenses before expense reductions (f) | | | 2.22 | (a) | | | 2.29 | | | | 2.18 | | | | 2.57 | | | | 2.59 | | | | 2.58 | |
Expenses after expense reductions (f) | | | 1.75 | (a) | | | 1.76 | | | | 1.75 | | | | 1.75 | | | | 1.75 | | | | 1.75 | |
Net investment income (loss) | | | (0.72 | )(a)(l) | | | (0.41 | ) | | | (0.33 | ) | | | (0.32 | ) | | | (0.17 | ) | | | (0.42 | ) |
Portfolio turnover | | | 47 | (n) | | | 55 | | | | 36 | | | | 37 | | | | 37 | | | | 35 | |
Net assets at end of period
(000 omitted) | | | $223 | | | | $218 | | | | $211 | | | | $115 | | | | $89 | | | | $188 | |
See Notes to Financial Statements
21
Financial Highlights – continued
| | | | | | | | | | | | | | | | | | | | | | | | |
| | | Six months
ended 2/29/20 | | | Year ended | |
| Class R3 | | 8/31/19 | | | 8/31/18 | | | 8/31/17 | | | 8/31/16 | | | 8/31/15 | |
| | | (unaudited) | | | | | | | | | | | | | | | | |
Net asset value, beginning of period | | | $18.72 | | | | $21.26 | | | | $18.30 | | | | $15.70 | | | | $14.85 | | | | $15.58 | |
| | | |
| Income (loss) from investment operations | | | | | | | | | | | | | |
Net investment income (loss) (d) | | | $(0.05 | ) | | | $(0.03 | ) | | | $(0.04 | ) | | | $(0.02 | ) | | | $0.01 | | | | $(0.02 | ) |
Net realized and unrealized
gain (loss) | | | 0.44 | | | | (0.62 | ) | | | 3.58 | | | | 2.66 | | | | 0.84 | | | | (0.06 | ) |
Total from investment operations | | | $0.39 | | | | $(0.65 | ) | | | $3.54 | | | | $2.64 | | | | $0.85 | | | | $(0.08 | ) |
| | | |
| Less distributions declared to shareholders | | | | | | | | | | | | | |
From net investment income | | | $— | | | | $(0.01 | ) | | | $— | | | | $(0.04 | ) | | | $— | | | | $— | |
From net realized gain | | | (0.58 | ) | | | (1.88 | ) | | | (0.58 | ) | | | — | | | | — | | | | (0.65 | ) |
Total distributions declared to
shareholders | | | $(0.58 | ) | | | $(1.89 | ) | | | $(0.58 | ) | | | $(0.04 | ) | | | $— | | | | $(0.65 | ) |
Net asset value, end of period (x) | | | $18.53 | | | | $18.72 | | | | $21.26 | | | | $18.30 | | | | $15.70 | | | | $14.85 | |
Total return (%) (r)(s)(t)(x) | | | 1.91 | (n) | | | (1.63 | ) | | | 19.72 | | | | 16.87 | | | | 5.72 | | | | (0.30 | ) |
| | | |
Ratios (%) (to average net assets)
and Supplemental data: | | | | | | | | | | | | | |
Expenses before expense reductions (f) | | | 1.97 | (a) | | | 2.04 | | | | 1.94 | | | | 2.32 | | | | 2.34 | | | | 2.33 | |
Expenses after expense reductions (f) | | | 1.50 | (a) | | | 1.51 | | | | 1.50 | | | | 1.50 | | | | 1.50 | | | | 1.50 | |
Net investment income (loss) | | | (0.47 | )(a)(l) | | | (0.16 | ) | | | (0.18 | ) | | | (0.13 | ) | | | 0.07 | | | | (0.17 | ) |
Portfolio turnover | | | 47 | (n) | | | 55 | | | | 36 | | | | 37 | | | | 37 | | | | 35 | |
Net assets at end of period
(000 omitted) | | | $157 | | | | $152 | | | | $144 | | | | $116 | | | | $80 | | | | $181 | |
See Notes to Financial Statements
22
Financial Highlights – continued
| | | | | | | | | | | | | | | | | | | | | | | | |
| | | Six months
ended 2/29/20 | | | Year ended | |
| Class R4 | | 8/31/19 | | | 8/31/18 | | | 8/31/17 | | | 8/31/16 | | | 8/31/15 | |
| | | (unaudited) | | | | | | | | | | | | | | | | |
Net asset value, beginning of period | | | $19.00 | | | | $21.56 | | | | $18.50 | | | | $15.87 | | | | $15.00 | | | | $15.69 | |
| | | |
| Income (loss) from investment operations | | | | | | | | | | | | | |
Net investment income (loss) (d) | | | $(0.02 | ) | | | $0.02 | | | | $0.02 | | | | $0.03 | | | | $0.05 | | | | $0.01 | |
Net realized and unrealized
gain (loss) | | | 0.45 | | | | (0.64 | ) | | | 3.62 | | | | 2.67 | | | | 0.83 | | | | (0.05 | ) |
Total from investment operations | | | $0.43 | | | | $(0.62 | ) | | | $3.64 | | | | $2.70 | | | | $0.88 | | | | $(0.04 | ) |
| | | |
| Less distributions declared to shareholders | | | | | | | | | | | | | |
From net investment income | | | $— | | | | $(0.06 | ) | | | $— | | | | $(0.07 | ) | | | $(0.01 | ) | | | $— | |
From net realized gain | | | (0.58 | ) | | | (1.88 | ) | | | (0.58 | ) | | | — | | | | — | | | | (0.65 | ) |
Total distributions declared to
shareholders | | | $(0.58 | ) | | | $(1.94 | ) | | | $(0.58 | ) | | | $(0.07 | ) | | | $(0.01 | ) | | | $(0.65 | ) |
Net asset value, end of period (x) | | | $18.85 | | | | $19.00 | | | | $21.56 | | | | $18.50 | | | | $15.87 | | | | $15.00 | |
Total return (%) (r)(s)(t)(x) | | | 2.09 | (n) | | | (1.43 | ) | | | 20.05 | | | | 17.11 | | | | 5.91 | | | | (0.03 | ) |
| | | |
Ratios (%) (to average net assets)
and Supplemental data: | | | | | | | | | | | | | |
Expenses before expense reductions (f) | | | 1.72 | (a) | | | 1.78 | | | | 1.69 | | | | 2.08 | | | | 2.09 | | | | 2.09 | |
Expenses after expense reductions (f) | | | 1.25 | (a) | | | 1.26 | | | | 1.25 | | | | 1.25 | | | | 1.25 | | | | 1.25 | |
Net investment income (loss) | | | (0.21 | )(a)(l) | | | 0.08 | | | | 0.08 | | | | 0.18 | | | | 0.30 | | | | 0.08 | |
Portfolio turnover | | | 47 | (n) | | | 55 | | | | 36 | | | | 37 | | | | 37 | | | | 35 | |
Net assets at end of period
(000 omitted) | | | $75 | | | | $73 | | | | $74 | | | | $62 | | | | $53 | | | | $164 | |
See Notes to Financial Statements
23
Financial Highlights – continued
| | | | | | | | | | | | | | | | | | | | | | | | |
| | | Six months
ended 2/29/20 | | | Year ended | |
| Class R6 | | 8/31/19 | | | 8/31/18 | | | 8/31/17 | | | 8/31/16 | | | 8/31/15 | |
| | | (unaudited) | | | | | | | | | | | | | | | | |
Net asset value, beginning of period | | | $19.03 | | | | $21.58 | | | | $18.51 | | | | $15.87 | | | | $15.03 | | | | $15.70 | |
| | | |
| Income (loss) from investment operations | | | | | | | | | | | | | |
Net investment income (loss) (d) | | | $(0.01 | ) | | | $0.05 | | | | $0.04 | | | | $0.03 | | | | $0.07 | | | | $0.03 | |
Net realized and unrealized
gain (loss) | | | 0.44 | | | | (0.64 | ) | | | 3.61 | | | | 2.70 | | | | 0.84 | | | | (0.05 | ) |
Total from investment operations | | | $0.43 | | | | $(0.59 | ) | | | $3.65 | | | | $2.73 | | | | $0.91 | | | | $(0.02 | ) |
| | | |
| Less distributions declared to shareholders | | | | | | | | | | | | | |
From net investment income | | | $— | | | | $(0.08 | ) | | | $— | | | | $(0.09 | ) | | | $(0.07 | ) | | | $— | |
From net realized gain | | | (0.58 | ) | | | (1.88 | ) | | | (0.58 | ) | | | — | | | | — | | | | (0.65 | ) |
Total distributions declared to
shareholders | | | $(0.58 | ) | | | $(1.96 | ) | | | $(0.58 | ) | | | $(0.09 | ) | | | $(0.07 | ) | | | $(0.65 | ) |
Net asset value, end of period (x) | | | $18.88 | | | | $19.03 | | | | $21.58 | | | | $18.51 | | | | $15.87 | | | | $15.03 | |
Total return (%) (r)(s)(t)(x) | | | 2.09 | (n) | | | (1.26 | ) | | | 20.09 | | | | 17.31 | | | | 6.06 | | | | 0.10 | |
| | | |
Ratios (%) (to average net assets)
and Supplemental data: | | | | | | | | | | | | | |
Expenses before expense reductions (f) | | | 1.63 | (a) | | | 1.69 | | | | 1.60 | | | | 1.97 | | | | 1.98 | | | | 1.98 | |
Expenses after expense reductions (f) | | | 1.16 | (a) | | | 1.16 | | | | 1.16 | | | | 1.15 | | | | 1.13 | | | | 1.15 | |
Net investment income (loss) | | | (0.10 | )(a)(l) | | | 0.24 | | | | 0.18 | | | | 0.21 | | | | 0.44 | | | | 0.19 | |
Portfolio turnover | | | 47 | (n) | | | 55 | | | | 36 | | | | 37 | | | | 37 | | | | 35 | |
Net assets at end of period
(000 omitted) | | | $14,142 | | | | $13,382 | | | | $6,332 | | | | $4,609 | | | | $2,317 | | | | $128 | |
| (d) | Per share data is based on average shares outstanding. |
| (f) | Ratios do not reflect reductions from fees paid indirectly, if applicable. |
| (l) | Recognition of net investment income by the fund may be affected by the timing of the declaration of dividends by companies in which the fund invests and the actual annual net investment income ratio may differ. |
| (r) | Certain expenses have been reduced without which performance would have been lower. |
| (s) | From time to time the fund may receive proceeds from litigation settlements, without which performance would be lower. |
| (t) | Total returns do not include any applicable sales charges. |
| (x) | The net asset values and total returns have been calculated on net assets which include adjustments made in accordance with U.S. generally accepted accounting principles required at period end for financial reporting purposes. |
See Notes to Financial Statements
24
NOTES TO FINANCIAL STATEMENTS
(unaudited)
(1) Business and Organization
MFS Global New Discovery Fund (the fund) is a diversified series of MFS Series Trust IV (the trust). The trust is organized as a Massachusetts business trust and is registered under the Investment Company Act of 1940, as amended, as anopen-end management investment company.
The fund is an investment company and accordingly follows the investment company accounting and reporting guidance of the Financial Accounting Standards Board (FASB) Accounting Standards Codification Topic 946 Financial Services – Investment Companies.
(2) Significant Accounting Policies
General– The preparation of financial statements in conformity with U.S. generally accepted accounting principles requires management to make estimates and assumptions that affect the reported amounts of assets and liabilities, and disclosure of contingent assets and liabilities at the date of the financial statements and the reported amounts of increases and decreases in net assets from operations during the reporting period. Actual results could differ from those estimates. In the preparation of these financial statements, management has evaluated subsequent events occurring after the date of the fund’s Statement of Assets and Liabilities through the date that the financial statements were issued. The fund invests in foreign securities. Investments in foreign securities are vulnerable to the effects of changes in the relative values of the local currency and the U.S. dollar and to the effects of changes in each country’s market, economic, industrial, political, regulatory, geopolitical, and other conditions.
In March 2020, the FASB issued Accounting Standards Update2020-04, Reference Rate Reform (Topic 848) – Facilitation of the Effects of Reference Rate Reform on Financial Reporting (“ASU2020-04”), which provides optional, temporary relief with respect to the financial reporting of contracts subject to certain types of modifications due to the planned discontinuation of the London Interbank Offered Rate (LIBOR) and other IBOR-based reference rates as of the end of 2021. The temporary relief provided by ASU2020-04 is effective for certain reference rate-related contract modifications that occur during the period from March 12, 2020 through December 31, 2022. Management is evaluating the impact of ASU2020-04 on the fund’s investments, derivatives, debt and other contracts that will undergo reference rate-related modifications as a result of the reference rate reform.
Balance Sheet Offsetting– The fund’s accounting policy with respect to balance sheet offsetting is that, absent an event of default by the counterparty or a termination of the agreement, the International Swaps and Derivatives Association (ISDA) Master Agreement, or similar agreement, does not result in an offset of reported amounts of financial assets and financial liabilities in the Statement of Assets and Liabilities across transactions between the fund and the applicable counterparty. The fund’s right to setoff may be restricted or prohibited by the bankruptcy or insolvency laws of the particular jurisdiction to which a specific master netting agreement counterparty is subject. Balance sheet offsetting disclosures, to the extent applicable to the fund, have been included in the fund’s Significant Accounting Policies note under the captions for each of the fund’sin-scope financial instruments and transactions.
25
Notes to Financial Statements (unaudited) – continued
Investment Valuations– Equity securities, including restricted equity securities, are generally valued at the last sale or official closing price on their primary market or exchange as provided by a third-party pricing service. Equity securities, for which there were no sales reported that day, are generally valued at the last quoted daily bid quotation on their primary market or exchange as provided by a third-party pricing service. Short-term instruments with a maturity at issuance of 60 days or less may be valued at amortized cost, which approximates market value.Open-end investment companies are generally valued at net asset value per share. Securities and other assets generally valued on the basis of information from a third-party pricing service may also be valued at a broker/dealer bid quotation. In determining values, third-party pricing services can utilize both transaction data and market information such as yield, quality, coupon rate, maturity, type of issue, trading characteristics, and other market data. The values of foreign securities and other assets and liabilities expressed in foreign currencies are converted to U.S. dollars using the mean of bid and asked prices for rates provided by a third-party pricing service.
The Board of Trustees has delegated primary responsibility for determining or causing to be determined the value of the fund’s investments (including any fair valuation) to the adviser pursuant to valuation policies and procedures approved by the Board. If the adviser determines that reliable market quotations are not readily available, investments are valued at fair value as determined in good faith by the adviser in accordance with such procedures under the oversight of the Board of Trustees. Under the fund’s valuation policies and procedures, market quotations are not considered to be readily available for most types of debt instruments and floating rate loans and many types of derivatives. These investments are generally valued at fair value based on information from third-party pricing services. In addition, investments may be valued at fair value if the adviser determines that an investment’s value has been materially affected by events occurring after the close of the exchange or market on which the investment is principally traded (such as foreign exchange or market) and prior to the determination of the fund’s net asset value, or after the halt of trading of a specific security where trading does not resume prior to the close of the exchange or market on which the security is principally traded. Events that occur after foreign markets close (such as developments in foreign markets and significant movements in the U.S. markets) and prior to the determination of the fund’s net asset value may be deemed to have a material effect on the value of securities traded in foreign markets. Accordingly, the fund’s foreign equity securities may often be valued at fair value. The adviser generally relies on third-party pricing services or other information (such as the correlation with price movements of similar securities in the same or other markets; the type, cost and investment characteristics of the security; the business and financial condition of the issuer; and trading and other market data) to assist in determining whether to fair value and at what value to fair value an investment. The value of an investment for purposes of calculating the fund’s net asset value can differ depending on the source and method used to determine value. When fair valuation is used, the value of an investment used to determine the fund’s net asset value may differ from quoted or published prices for the same investment. There can be no assurance that the fund could obtain the fair value assigned to an investment if it were to sell the investment at the same time at which the fund determines its net asset value per share.
26
Notes to Financial Statements (unaudited) – continued
Various inputs are used in determining the value of the fund’s assets or liabilities. These inputs are categorized into three broad levels. In certain cases, the inputs used to measure fair value may fall into different levels of the fair value hierarchy. In such cases, an investment’s level within the fair value hierarchy is based on the lowest level of input that is significant to the fair value measurement. The fund’s assessment of the significance of a particular input to the fair value measurement in its entirety requires judgment, and considers factors specific to the investment. Level 1 includes unadjusted quoted prices in active markets for identical assets or liabilities. Level 2 includes other significant observable market-based inputs (including quoted prices for similar securities, interest rates, prepayment speed, and credit risk). Level 3 includes unobservable inputs, which may include the adviser’s own assumptions in determining the fair value of investments. The following is a summary of the levels used as of February 29, 2020 in valuing the fund’s assets or liabilities:
| | | | | | | | | | | | | | | | |
| | | | |
| Financial Instruments | | Level 1 | | | Level 2 | | | Level 3 | | | Total | |
| Equity Securities: | | | | | | | | | | | | | | | | |
United States | | | $24,185,149 | | | | $— | | | | $— | | | | $24,185,149 | |
United Kingdom | | | 938,719 | | | | 3,634,493 | | | | — | | | | 4,573,212 | |
Germany | | | 339,147 | | | | 2,942,245 | | | | — | | | | 3,281,392 | |
Japan | | | — | | | | 2,939,181 | | | | — | | | | 2,939,181 | |
India | | | 1,629,478 | | | | 206,299 | | | | — | | | | 1,835,777 | |
France | | | 345,472 | | | | 1,355,622 | | | | — | | | | 1,701,094 | |
Netherlands | | | 401,854 | | | | 1,203,647 | | | | — | | | | 1,605,501 | |
Norway | | | — | | | | 748,490 | | | | — | | | | 748,490 | |
Spain | | | — | | | | 701,379 | | | | — | | | | 701,379 | |
Other Countries | | | 2,788,009 | | | | 2,874,826 | | | | — | | | | 5,662,835 | |
| Mutual Funds | | | 1,626,048 | | | | — | | | | — | | | | 1,626,048 | |
| Total | | | $32,253,876 | | | | $16,606,182 | | | | $— | | | | $48,860,058 | |
For further information regarding security characteristics, see the Portfolio of Investments.
Foreign Currency Translation– Purchases and sales of foreign investments, income, and expenses are converted into U.S. dollars based upon currency exchange rates prevailing on the respective dates of such transactions or on the reporting date for foreign denominated receivables and payables. Gains and losses attributable to foreign currency exchange rates on sales of securities are recorded for financial statement purposes as net realized gains and losses on investments. Gains and losses attributable to foreign exchange rate movements on receivables, payables, income and expenses are recorded for financial statement purposes as foreign currency transaction gains and losses. That portion of both realized and unrealized gains and losses on investments that results from fluctuations in foreign currency exchange rates is not separately disclosed.
Security Loans– Under its Securities Lending Agency Agreement with the fund, State Street Bank and Trust Company, as lending agent, loans the securities of the fund to certain qualified institutions (the “Borrowers”) approved by the fund. Security loans can be terminated at the discretion of either the lending agent or the fund and the related securities must be returned within the earlier of the standard trade settlement
27
Notes to Financial Statements (unaudited) – continued
period for such securities or within three business days. The loans are collateralized by cash and/or U.S. Treasury and federal agency obligations in an amount typically at least equal to the market value of the securities loaned. On loans collateralized by cash, the cash collateral is invested in a money market fund. The market value of the loaned securities is determined at the close of business of the fund and any additional required collateral is delivered to the fund on the next business day. The lending agent provides the fund with indemnification against Borrower default. In the event of Borrower default, the lending agent will, for the benefit of the fund, either purchase securities identical to those loaned or, when such purchase is commercially impracticable, pay the fund the market value of the loaned securities. In return, the lending agent assumes the fund’s rights to the related collateral. If the collateral value is less than the cost to purchase identical securities, the lending agent is responsible for the shortfall, but only to the extent that such shortfall is not due to a decline in collateral value resulting from collateral reinvestment for which the fund bears the risk of loss. At period end, the fund had investment securities on loan, all of which were classified as equity securities in the fund’s Portfolio of Investments, with a fair value of $235,759. The fair value of the fund’s investment securities on loan and a related liability of $86,294 for cash collateral received on securities loaned are both presented gross in the Statement of Assets and Liabilities. Additionally, these loans were collateralized by U.S. Treasury Obligations of $162,778 held by the lending agent. The collateral on securities loaned exceeded the value of securities on loan at period end. The liability for cash collateral for securities loaned is carried at fair value, which is categorized as level 2 within the fair value hierarchy. A portion of the income generated upon investment of the collateral is remitted to the Borrowers, and the remainder is allocated between the fund and the lending agent. On loans collateralized by U.S. Treasury and/or federal agency obligations, a fee is received from the Borrower, and is allocated between the fund and the lending agent. Income from securities lending is separately reported in the Statement of Operations. The dividend and interest income earned on the securities loaned is accounted for in the same manner as other dividend and interest income.
Indemnifications– Under the fund’s organizational documents, its officers and Trustees may be indemnified against certain liabilities and expenses arising out of the performance of their duties to the fund. Additionally, in the normal course of business, the fund enters into agreements with service providers that may contain indemnification clauses. The fund’s maximum exposure under these agreements is unknown as this would involve future claims that may be made against the fund that have not yet occurred.
Investment Transactions and Income– Investment transactions are recorded on the trade date. Dividends received in cash are recorded on theex-dividend date. Certain dividends from foreign securities will be recorded when the fund is informed of the dividend if such information is obtained subsequent to theex-dividend date. Dividend payments received in additional securities are recorded on theex-dividend date in an amount equal to the value of the security on such date.
The fund may receive proceeds from litigation settlements. Any proceeds received from litigation involving portfolio holdings are reflected in the Statement of Operations in realized gain/loss if the security has been disposed of by the fund or in unrealized
28
Notes to Financial Statements (unaudited) – continued
gain/loss if the security is still held by the fund. Any other proceeds from litigation not related to portfolio holdings are reflected as other income in the Statement of Operations.
Tax Matters and Distributions– The fund intends to qualify as a regulated investment company, as defined under Subchapter M of the Internal Revenue Code, and to distribute all of its taxable income, including realized capital gains. As a result, no provision for federal income tax is required. The fund’s federal tax returns, when filed, will remain subject to examination by the Internal Revenue Service for a three year period. Management has analyzed the fund’s tax positions taken on federal and state tax returns for all open tax years and does not believe that there are any uncertain tax positions that require recognition of a tax liability. Foreign taxes, if any, have been accrued by the fund in the accompanying financial statements in accordance with the applicable foreign tax law. Foreign income taxes may be withheld by certain countries in which the fund invests. Additionally, capital gains realized by the fund on securities issued in or by certain foreign countries may be subject to capital gains tax imposed by those countries.
Distributions to shareholders are recorded on theex-dividend date. Income and capital gain distributions are determined in accordance with income tax regulations, which may differ from U.S. generally accepted accounting principles. Certain capital accounts in the financial statements are periodically adjusted for permanent differences in order to reflect their tax character. These adjustments have no impact on net assets or net asset value per share. Temporary differences which arise from recognizing certain items of income, expense, gain or loss in different periods for financial statement and tax purposes will reverse at some time in the future.
Book/tax differences primarily relate to passive foreign investment companies, wash sale loss deferrals, treating a portion of the proceeds from redemptions as a distribution for tax purposes, and partnership adjustments.
The tax character of distributions made during the current period will be determined at fiscal year end. The tax character of distributions declared to shareholders for the last fiscal year is as follows:
| | | | |
| |
| | | Year ended
8/31/19 | |
| Ordinary income (including anyshort-term capital gains) | | | $2,120,041 | |
| Long-term capital gains | | | 1,518,060 | |
| |
| Total distributions | | | $3,638,101 | |
29
Notes to Financial Statements (unaudited) – continued
The federal tax cost and the tax basis components of distributable earnings were as follows:
| | | | |
| |
| As of 2/29/20 | | | |
| |
| Cost of investments | | | $42,459,267 | |
| Gross appreciation | | | 8,201,439 | |
| |
| Gross depreciation | | | (1,800,648 | ) |
| Net unrealized appreciation (depreciation) | | | $6,400,791 | |
| |
| As of 8/31/19 | | | |
| |
| Undistributed long-term capital gain | | | 1,261,311 | |
| Post-October capital loss deferral | | | (602,627 | ) |
| Late year ordinary loss deferral | | | (9,291 | ) |
| Other temporary differences | | | 20,729 | |
| Net unrealized appreciation (depreciation) | | | 8,647,301 | |
The aggregate cost above includes prior fiscal year end tax adjustments, if applicable.
Multiple Classes of Shares of Beneficial Interest– The fund offers multiple classes of shares, which differ in their respective distribution and service fees. The fund’s income, realized and unrealized gain (loss), and common expenses are allocated to shareholders based on the daily net assets of each class. Dividends are declared separately for each class. Differences in per share dividend rates are generally due to differences in separate class expenses. Class B shares will convert to Class A shares approximately eight years after purchase. Class C shares will convert to Class A shares approximately ten years after purchase. The fund’s distributions declared to shareholders as reported in the Statements of Changes in Net Assets are presented by class as follows:
| | | | | | | | |
| | |
| | | Six months
ended
2/29/20 | | | Year
ended
8/31/19 | |
| Class A | | | $373,287 | | | | $1,059,493 | |
| Class B | | | 81,085 | | | | 233,710 | |
| Class C | | | 107,440 | | | | 376,368 | |
| Class I | | | 465,351 | | | | 1,329,173 | |
| Class R1 | | | 3,350 | | | | 9,502 | |
| Class R2 | | | 7,003 | | | | 19,586 | |
| Class R3 | | | 4,715 | | | | 12,995 | |
| Class R4 | | | 2,255 | | | | 6,720 | |
| Class R6 | | | 450,527 | | | | 590,554 | |
| Total | | | $1,495,013 | | | | $3,638,101 | |
30
Notes to Financial Statements (unaudited) – continued
(3) Transactions with Affiliates
Investment Adviser– The fund has an investment advisory agreement with MFS to provide overall investment management and related administrative services and facilities to the fund. The management fee is computed daily and paid monthly at the following annual rates based on the fund’s average daily net assets:
| | | | |
| Up to $1 billion | | | 0.975 | % |
| In excess of $1 billion and up to $2.5 billion | | | 0.90 | % |
| In excess of $2.5 billion | | | 0.85 | % |
MFS has agreed in writing to reduce its management fee by a specified amount if certain MFS mutual fund assets exceed thresholds agreed to by MFS and the fund’s Board of Trustees. For the six months ended February 29, 2020, this management fee reduction amounted to $2,447, which is included in the reduction of total expenses in the Statement of Operations. The management fee incurred for the six months ended February 29, 2020 was equivalent to an annual effective rate of 0.96% of the fund’s average daily net assets.
The investment adviser has agreed in writing to pay a portion of the fund’s total annual operating expenses, excluding interest, taxes, extraordinary expenses, brokerage and transaction costs, and investment-related expenses, such that total fund operating expenses do not exceed the following rates annually of each class’s average daily net assets:
| | | | | | | | | | | | | | | | | | | | | | | | | | | | | | | | |
| Classes | |
| A | | B | | | C | | | I | | | R1 | | | R2 | | | R3 | | | R4 | | | R6 | |
| 1.50% | | | 2.25% | | | | 2.25% | | | | 1.25% | | | | 2.25% | | | | 1.75% | | | | 1.50% | | | | 1.25% | | | | 1.22% | |
This written agreement will continue until modified by the fund’s Board of Trustees, but such agreement will continue at least until December 31, 2020. For the six months ended February 29, 2020, this reduction amounted to $109,843, which is included in the reduction of total expenses in the Statement of Operations.
Distributor– MFS Fund Distributors, Inc. (MFD), a wholly-owned subsidiary of MFS, as distributor, received $4,453 for the six months ended February 29, 2020, as its portion of the initial sales charge on sales of Class A shares of the fund.
The Board of Trustees has adopted a distribution plan for certain share classes pursuant to Rule12b-1 of the Investment Company Act of 1940.
The fund’s distribution plan provides that the fund will pay MFD for services provided by MFD and financial intermediaries in connection with the distribution and servicing of certain share classes. One component of the plan is a distribution fee paid to MFD and another component of the plan is a service fee paid to MFD. MFD may subsequently pay all, or a portion, of the distribution and/or service fees to financial intermediaries.
31
Notes to Financial Statements (unaudited) – continued
Distribution Plan Fee Table:
| | | | | | | | | | | | | | | | | | | | |
| | | | | |
| | | Distribution
Fee Rate (d) | | | Service
Fee Rate (d) | | | Total
Distribution
Plan (d) | | | Annual
Effective
Rate (e) | | | Distribution
and Service
Fee | |
| Class A | | | — | | | | 0.25% | | | | 0.25% | | | | 0.25% | | | | $15,997 | |
| Class B | | | 0.75% | | | | 0.25% | | | | 1.00% | | | | 1.00% | | | | 12,899 | |
| Class C | | | 0.75% | | | | 0.25% | | | | 1.00% | | | | 1.00% | | | | 17,188 | |
| Class R1 | | | 0.75% | | | | 0.25% | | | | 1.00% | | | | 1.00% | | | | 536 | |
| Class R2 | | | 0.25% | | | | 0.25% | | | | 0.50% | | | | 0.50% | | | | 584 | |
| Class R3 | | | — | | | | 0.25% | | | | 0.25% | | | | 0.25% | | | | 203 | |
| Total Distribution and Service Fees | | | | | | | | | | | | $47,407 | |
| (d) | In accordance with the distribution plan for certain classes, the fund pays distribution and/or service fees equal to these annual percentage rates of each class’s average daily net assets. The distribution and service fee rates disclosed by class represent the current rates in effect at the end of the reporting period. Any rate changes, if applicable, are detailed below. |
| (e) | The annual effective rates represent actual fees incurred under the distribution plan for the six months ended February 29, 2020 based on each class’s average daily net assets. MFD has voluntarily agreed to rebate a portion of each class’s 0.25% service fee attributable to accounts for which MFD retains the 0.25% service fee except for accounts attributable to MFS or its affiliates’ seed money. For the six months ended February 29, 2020, this rebate amounted to $123 and $21 for Class A and Class C, respectively, and is included in the reduction of total expenses in the Statement of Operations. |
Certain Class A shares are subject to a contingent deferred sales charge (CDSC) in the event of a shareholder redemption within 18 months of purchase. Class B shares are subject to a CDSC in the event of a shareholder redemption within six years of purchase. Class C shares are subject to a CDSC in the event of a shareholder redemption within 12 months of purchase. All contingent deferred sales charges are paid to MFD and during the six months ended February 29, 2020, were as follows:
| | | | |
| |
| | | Amount | |
| Class A | | | $— | |
| Class B | | | 292 | |
| Class C | | | 145 | |
Shareholder Servicing Agent– MFS Service Center, Inc. (MFSC), a wholly-owned subsidiary of MFS, receives a fee from the fund for its services as shareholder servicing agent calculated as a percentage of the average daily net assets of the fund as determined periodically under the supervision of the fund’s Board of Trustees. For the six months ended February 29, 2020, the fee was $2,887, which equated to 0.0120% annually of the fund’s average daily net assets. MFSC also receives payment from the fund forout-of-pocket expenses,sub-accounting and other shareholder servicing costs which may be paid to affiliated and unaffiliated service providers. Class R6 shares do not incursub-accounting fees. For the six months ended February 29, 2020, theseout-of-pocket expenses,sub-accounting and other shareholder servicing costs amounted to $18,640.
Administrator– MFS provides certain financial, legal, shareholder communications, compliance, and other administrative services to the fund. Under an administrative services agreement, the fund reimburses MFS the costs incurred to provide these
32
Notes to Financial Statements (unaudited) – continued
services. The fund is charged an annual fixed amount of $17,500 plus a fee based on average daily net assets. The administrative services fee incurred for the six months ended February 29, 2020 was equivalent to an annual effective rate of 0.0362% of the fund’s average daily net assets.
Trustees’ and Officers’ Compensation– The fund pays compensation to independent Trustees in the form of a retainer, attendance fees, and additional compensation to Board and Committee chairpersons. The fund does not pay compensation directly to Trustees or officers of the fund who are also officers of the investment adviser, all of whom receive remuneration from MFS for their services to the fund. Certain officers and Trustees of the fund are officers or directors of MFS, MFD, and MFSC.
Other –The fund invests in the MFS Institutional Money Market Portfolio which is managed by MFS and seeks current income consistent with preservation of capital and liquidity. This money market fund does not pay a management fee to MFS but does incur investment and operating costs.
On December 14, 2018, MFS redeemed 3,461 shares of Class R6 for an aggregate amount of $56,449.
At February 29, 2020, MFS held approximately 70% of the outstanding shares of Class R1 and 100% of the outstanding shares of Class R4.
The fund is permitted to engage in purchase and sale transactions with funds and accounts for which MFS serves as investment adviser orsub-adviser (“cross-trades”) pursuant to a policy adopted by the Board of Trustees. This policy has been designed to ensure that cross-trades conducted by the fund comply with Rule17a-7 under the Investment Company Act of 1940. During the six months ended February 29, 2020, the fund engaged in sale transactions pursuant to this policy, which amounted to $11,330. The sales transactions resulted in net realized gains (losses) of $367.
(4) Portfolio Securities
For the six months ended February 29, 2020, purchases and sales of investments, other than short-term obligations, aggregated $23,910,667 and $21,801,737, respectively.
33
Notes to Financial Statements (unaudited) – continued
(5) Shares of Beneficial Interest
The fund’s Declaration of Trust permits the Trustees to issue an unlimited number of full and fractional shares of beneficial interest. Transactions in fund shares were as follows:
| | | | | | | | | | | | | | | | |
| | | Six months ended
2/29/20 | | | Year ended
8/31/19 | |
| | | | |
| | | Shares | | | Amount | | | Shares | | | Amount | |
| Shares sold | | | | | | | | | | | | | | | | |
Class A | | | 169,291 | | | | $3,382,702 | | | | 140,145 | | | | $2,590,746 | |
Class B | | | 239 | | | | 4,497 | | | | 30,247 | | | | 520,891 | |
Class C | | | 14,796 | | | | 278,401 | | | | 25,712 | | | | 446,860 | |
Class I | | | 174,804 | | | | 3,516,661 | | | | 335,999 | | | | 6,158,623 | |
Class R1 | | | 33 | | | | 607 | | | | 1,486 | | | | 27,291 | |
Class R2 | | | 181 | | | | 3,509 | | | | 987 | | | | 17,440 | |
Class R3 | | | 393 | | | | 7,792 | | | | 1,803 | | | | 33,562 | |
Class R4 | | | 1 | | | | — | | | | — | | | | — | |
Class R6 | | | 582,394 | | | | 11,824,730 | | | | 829,525 | | | | 15,259,725 | |
| | | 942,132 | | | | $19,018,899 | | | | 1,365,904 | | | | $25,055,138 | |
| | | | |
| Shares issued to shareholders in reinvestment of distributions | | | | | | | | | | | | | | | | |
Class A | | | 18,847 | | | | $372,607 | | | | 65,310 | | | | $1,057,363 | |
Class B | | | 4,390 | | | | 81,085 | | | | 15,252 | | | | 233,053 | |
Class C | | | 5,817 | | | | 107,440 | | | | 24,630 | | | | 376,368 | |
Class I | | | 23,175 | | | | 465,351 | | | | 81,047 | | | | 1,329,173 | |
Class��R1 | | | 181 | | | | 3,350 | | | | 622 | | | | 9,502 | |
Class R2 | | | 362 | | | | 7,003 | | | | 1,232 | | | | 19,586 | |
Class R3 | | | 239 | | | | 4,715 | | | | 803 | | | | 12,995 | |
Class R4 | | | 112 | | | | 2,255 | | | | 409 | | | | 6,720 | |
Class R6 | | | 8,711 | | | | 175,256 | | | | 19,982 | | | | 327,900 | |
| | | 61,834 | | | | $1,219,062 | | | | 209,287 | | | | $3,372,660 | |
| | | | |
| Shares reacquired | | | | | | | | | | | | | | | | |
Class A | | | (45,722 | ) | | | $(907,251 | ) | | | (148,750 | ) | | | $(2,707,444 | ) |
Class B | | | (10,904 | ) | | | (200,263 | ) | | | (25,853 | ) | | | (441,622 | ) |
Class C | | | (18,872 | ) | | | (352,116 | ) | | | (84,383 | ) | | | (1,465,850 | ) |
Class I | | | (118,306 | ) | | | (2,356,610 | ) | | | (998,589 | ) | | | (18,788,277 | ) |
Class R1 | | | — | | | | — | | | | (2 | ) | | | (39 | ) |
Class R2 | | | (128 | ) | | | (2,539 | ) | | | (407 | ) | | | (7,426 | ) |
Class R3 | | | (309 | ) | | | (6,139 | ) | | | (1,226 | ) | | | (22,967 | ) |
Class R6 | | | (545,309 | ) | | | (10,861,733 | ) | | | (439,476 | ) | | | (8,354,049 | ) |
| | | (739,550 | ) | | | $(14,686,651 | ) | | | (1,698,686 | ) | | | $(31,787,674 | ) |
34
Notes to Financial Statements (unaudited) – continued
| | | | | | | | | | | | | | | | |
| | | Six months ended
2/29/20 | | | Year ended
8/31/19 | |
| | | | |
| | | Shares | | | Amount | | | Shares | | | Amount | |
| Net change | | | | | | | | | | | | | | | | |
Class A | | | 142,416 | | | | $2,848,058 | | | | 56,705 | | | | $940,665 | |
Class B | | | (6,275 | ) | | | (114,681 | ) | | | 19,646 | | | | 312,322 | |
Class C | | | 1,741 | | | | 33,725 | | | | (34,041 | ) | | | (642,622 | ) |
Class I | | | 79,673 | | | | 1,625,402 | | | | (581,543 | ) | | | (11,300,481 | ) |
Class R1 | | | 214 | | | | 3,957 | | | | 2,106 | | | | 36,754 | |
Class R2 | | | 415 | | | | 7,973 | | | | 1,812 | | | | 29,600 | |
Class R3 | | | 323 | | | | 6,368 | | | | 1,380 | | | | 23,590 | |
Class R4 | | | 113 | | | | 2,255 | | | | 409 | | | | 6,720 | |
Class R6 | | | 45,796 | | | | 1,138,253 | | | | 410,031 | | | | 7,233,576 | |
| | | 264,416 | | | | $5,551,310 | | | | (123,495 | ) | | | $(3,359,876 | ) |
Class T shares were not publicly available for sale during the period. Please see the fund’s prospectus for details.
Effective June 1, 2019, purchases of the fund’s Class B shares are closed to new and existing investors subject to certain exceptions. Please see the fund’s prospectus for details.
(6) Line of Credit
The fund and certain other funds managed by MFS participate in a $1.25 billion unsecured committed line of credit, subject to a $1 billion sublimit, provided by a syndicate of banks under a credit agreement. Borrowings may be made for temporary financing needs. Interest is charged to each fund, based on its borrowings, generally at a rate equal to the highest of one month LIBOR, the Federal Funds Effective Rate and the Overnight Bank Funding Rate, plus an agreed upon spread. A commitment fee, based on the average daily, unused portion of the committed line of credit, is allocated among the participating funds. In addition, the fund and other funds managed by MFS have established unsecured uncommitted borrowing arrangements with certain banks for temporary financing needs. Interest is charged to each fund, based on its borrowings, at rates equal to customary reference rates plus an agreed upon spread. For the six months ended February 29, 2020, the fund’s commitment fee and interest expense were $127 and $0, respectively, and are included in “Miscellaneous” expense in the Statement of Operations.
35
Notes to Financial Statements (unaudited) – continued
(7) Investments in Affiliated Issuers
An affiliated issuer may be considered one in which the fund owns 5% or more of the outstanding voting securities, or a company which is under common control. For the purposes of this report, the following were affiliated issuers:
| | | | | | | | | | | | | | | | | | | | | | | | |
| | | | | | |
| Affiliated Issuers | | Beginning
Value | | | Purchases | | | Sales
Proceeds | | | Realized
Gain
(Loss) | | | Change in
Unrealized
Appreciation or
Depreciation | | | Ending
Value | |
| MFS Institutional Money Market Portfolio | | | $502,374 | | | | $21,632,869 | | | | $20,595,803 | | | | $210 | | | | $104 | | | | $1,539,754 | |
| | | | | | |
| Affiliated Issuers | | | | | | | | | | | | | | Dividend
Income | | | Capital Gain
Distributions | |
| MFS Institutional Money Market Portfolio | | | | | | | | $13,309 | | | | $— | |
(8) Impacts of COVID-19
The pandemic related to the global spread of novel coronavirus disease (COVID-19), which was first detected in December 2019, has resulted in significant disruptions to global business activity and the global economy, as well as the economies of individual countries, the financial performance of individual companies and sectors, and the securities and commodities markets in general. This pandemic, the full effects of which are still unknown, has resulted in substantial market volatility and may have adversely impacted the prices and liquidity of the fund’s investments and the fund’s performance during the period February 29, 2020 through April 16, 2020, the date that these financial statements were issued.
36
PROXY VOTING POLICIES AND INFORMATION
MFS votes proxies on behalf of the fund pursuant to proxy voting policies and procedures that are available without charge, upon request, by calling1-800-225-2606, by visitingmfs.com/proxyvoting, or by visiting the SEC’s Web site athttp://www.sec.gov.
Information regarding how the fund voted proxies relating to portfolio securities during the most recent twelve-month period ended June 30 is available by August 31 of each year without charge by visitingmfs.com/proxyvoting, or by visiting the SEC’s Web site athttp://www.sec.gov.
QUARTERLY PORTFOLIO DISCLOSURE
The fund files a complete schedule of portfolio holdings with the SEC for the first and third quarters of each fiscal year as an exhibit to its reports onForm N-PORT. The fund’s Form N-PORT reports are available on the SEC’s website athttp://www.sec.gov.A shareholder can obtain the portfolio holdings report for the first and third quarters of the fund’s fiscal year atmfs.com/openendfunds by choosing the fund’s name and then selecting the “Resources” tab and clicking on “Prospectus and Reports”.
FURTHER INFORMATION
From time to time, MFS may post important information about the fund or the MFS funds on the MFS web site (mfs.com). This information is available athttps://www.mfs.com/en-us/what-we-do/announcements.html or atmfs.com/openendfunds by choosing the fund’s name.
INFORMATION ABOUT FUND CONTRACTS AND LEGAL CLAIMS
The fund has entered into contractual arrangements with an investment adviser, administrator, distributor, shareholder servicing agent, 529 program manager (if applicable), and custodian who each provide services to the fund. Unless expressly stated otherwise, shareholders are not parties to, or intended beneficiaries of these contractual arrangements, and these contractual arrangements are not intended to create any shareholder right to enforce them against the service providers or to seek any remedy under them against the service providers, either directly or on behalf of the fund.
Under the Trust’s By-Laws and Declaration of Trust, any claims asserted against or on behalf of the MFS Funds, including claims against Trustees and Officers, must be brought in state and federal courts located within the Commonwealth of Massachusetts.
PROVISION OF FINANCIAL REPORTS AND SUMMARY PROSPECTUSES
The fund produces financial reports every six months and updates its summary prospectus and prospectus annually. To avoid sending duplicate copies of materials to households, only one copy of the fund’s annual and semiannual report and summary prospectus may be mailed to shareholders having the same last name and residential address on the fund’s records. However, any shareholder may contact MFSC (please see back cover for address and telephone number) to request that copies of these reports and summary prospectuses be sent personally to that shareholder.
37
Save paper with eDelivery.

| MFS® will send you prospectuses, |
reports, and proxies directly viae-mail so you will get information faster with less mailbox clutter.
To sign up:
1. Go to mfs.com.
2. Log in via MFS® Access.
3. Select eDelivery.
If you own your MFS fund shares through a financial institution or a retirement plan, MFS® TALK, MFS® Access, or eDelivery may not be available to you.
CONTACT
WEB SITE
mfs.com
MFS TALK
1-800-637-8255
24 hours a day
ACCOUNT SERVICE AND LITERATURE
Shareholders
1-800-225-2606
Financial advisors
1-800-343-2829
Retirement plan services
1-800-637-1255
MAILING ADDRESS
MFS Service Center, Inc.
P.O. Box 219341
Kansas City, MO 64121-9341
OVERNIGHT MAIL
MFS Service Center, Inc.
Suite 219341
430 W 7th Street
Kansas City, MO 64105-1407
Semiannual Report
February 29, 2020

MFS® Mid Cap Growth Fund

Beginning on January 1, 2021, as permitted by regulations adopted by the U.S. Securities and Exchange Commission, paper copies of the fund’s annual and semiannual shareholder reports will no longer be sent by mail, unless you specifically request paper copies of the reports. Instead, the complete reports will be made available on the fund’s Web site (funds.mfs.com), and you will be notified by mail each time a report is posted and provided with a Web site link to access the report.
If you are already signed up to receive shareholder reports by email, you will not be affected by this change and you need not take any action. You may sign up to receive shareholder reports and other communications from the fund by email by contacting your financial intermediary (such as a broker-dealer or bank) or, if you hold your shares directly with the fund, by calling 1-800-225-2606 or by logging on to MFS Access at mfs.com.
Beginning on January 1, 2019, you may elect to receive all future reports in paper free of charge. Contact your financial intermediary to request that you continue to receive paper copies of your shareholder reports. If you invest directly with the fund, you can call 1-800-225-2606 or send an email request to orderliterature@mfs.com to let the fund know that you wish to continue receiving paper copies of your shareholder reports. Your election to receive reports in paper will apply to all funds held in your account if you invest through your financial intermediary or all funds held with the MFS fund complex if you invest directly.
OTC-SEM
MFS® Mid Cap Growth Fund
CONTENTS
The report is prepared for the general information of shareholders.
It is authorized for distribution to prospective investors only when preceded or accompanied by a current prospectus.
NOT FDIC INSURED• MAY LOSE VALUE• NO BANK GUARANTEE

LETTER FROM THE EXECUTIVE CHAIR
Dear Shareholders:
During the first quarter of 2020, market volatility reached levels not seen since the global financial crisis. Optimism heading into the year — on receding trade and
geopolitical risk along with easier central bank policies — was overwhelmed in February as the health effects of a novel coronavirus,COVID-19, spread beyond China’s borders, ultimately impacting more than 200 countries. The global pandemic prompted many governments to take drastic action to slow the spread of the virus, such as quarantines, school and business closures, and prohibitions on public gatherings. While these are important steps to protect the public health, they come at a cost: rising market volatility and an abrupt decline in economic growth.
Global central banks have taken aggressive, coordinated steps to cushion the economic and market fallout related to the virus, and
governments are undertaking unprecedented levels of fiscal stimulus. As uncertainty recedes, these measures can help create a supportive environment and encourage economic recovery. In the aftermath of the crisis, there are likely to be societal changes as households, businesses and governments adjust to a new reality and these alterations could change the investment landscape. Occurrences such as the COVID-19 outbreak demonstrate the importance of having a deep understanding of company fundamentals, and our global research platform has been built to do just that.
Here at MFS®, we aim to help our clients navigate the growing complexity of the markets and world economies. Our long-term investment philosophy and commitment to the responsible allocation of capital allow us to tune out the noise and uncover what we believe are the best, most durable investment opportunities in the market. Through our powerful global investment platform, we combine collective expertise, thoughtful risk management, and long-term discipline to create sustainable value for investors.
Respectfully,

Robert J. Manning
Executive Chair
MFS Investment Management
April 16, 2020
The opinions expressed in this letter are subject to change and may not be relied upon for investment advice. No forecasts can be guaranteed.
1
PORTFOLIO COMPOSITION
Portfolio structure

| | | | |
| Top ten holdings | | | | |
| Global Payments, Inc. | | | 4.0% | |
| Bright Horizons Family Solutions, Inc. | | | 3.8% | |
| PerkinElmer, Inc. | | | 2.3% | |
| Copart, Inc. | | | 2.3% | |
| Verisk Analytics, Inc., “A” | | | 2.2% | |
| Steris PLC | | | 2.2% | |
| Fidelity National Information Services, Inc. | | | 2.1% | |
| MSCI, Inc. | | | 2.1% | |
| Cadence Design Systems, Inc. | | | 2.0% | |
| AMETEK, Inc. | | | 2.0% | |
| | | | |
| GICS equity sectors (g) | | | | |
| Information Technology | | | 28.2% | |
| Industrials | | | 22.8% | |
| Health Care | | | 15.4% | |
| Consumer Discretionary | | | 14.3% | |
| Financials | | | 7.3% | |
| Communication Services | | | 4.1% | |
| Real Estate | | | 3.2% | |
| Materials | | | 2.6% | |
| Energy | | | 0.3% | |
| (g) | The Global Industry Classification Standard (GICS®) was developed by and/or is the exclusive property of MSCI, Inc. and S&P Global Market Intelligence Inc. (“S&P Global Market Intelligence”). GICS is a service mark of MSCI and S&P Global Market Intelligence and has been licensed for use by MFS. |
Cash & Cash Equivalents includes any cash, investments in money market funds, short-term securities, and other assets less liabilities. Please see the Statement of Assets and Liabilities for additional information related to the fund’s cash position and other assets and liabilities.
Percentages are based on net assets as of February 29, 2020.
The portfolio is actively managed and current holdings may be different.
2
EXPENSE TABLE
Fund expenses borne by the shareholders during the period, September 1, 2019 through February 29, 2020
As a shareholder of the fund, you incur two types of costs: (1) transaction costs, including sales charges (loads) on certain purchase or redemption payments, and (2) ongoing costs, including management fees; distribution and service(12b-1) fees; and other fund expenses. This example is intended to help you understand your ongoing costs (in dollars) of investing in the fund and to compare these costs with the ongoing costs of investing in other mutual funds.
The example is based on an investment of $1,000 invested at the beginning of the period and held for the entire period September 1, 2019 through February 29, 2020.
Actual Expenses
The first line for each share class in the following table provides information about actual account values and actual expenses. You may use the information in this line, together with the amount you invested, to estimate the expenses that you paid over the period. Simply divide your account value by $1,000 (for example, an $8,600 account value divided by $1,000 = 8.6), then multiply the result by the number in the first line under the heading entitled “Expenses Paid During Period” to estimate the expenses you paid on your account during this period.
Hypothetical Example for Comparison Purposes
The second line for each share class in the following table provides information about hypothetical account values and hypothetical expenses based on the fund’s actual expense ratio and an assumed rate of return of 5% per year before expenses, which is not the fund’s actual return. The hypothetical account values and expenses may not be used to estimate the actual ending account balance or expenses you paid for the period. You may use this information to compare the ongoing costs of investing in the fund and other funds. To do so, compare this 5% hypothetical example with the 5% hypothetical examples that appear in the shareholder reports of the other funds.
Please note that the expenses shown in the table are meant to highlight your ongoing costs only and do not reflect any transactional costs, such as sales charges (loads). Therefore, the second line for each share class in the table is useful in comparing ongoing costs only, and will not help you determine the relative total costs of owning different funds. In addition, if these transactional costs were included, your costs would have been higher.
3
Expense Table – continued
| | | | | | | | | | | | | | | | | | |
Share Class | | | | Annualized Expense Ratio | | | Beginning Account Value 9/01/19 | | | Ending Account Value 2/29/20 | | | Expenses Paid During Period (p) 9/01/19-2/29/20 | |
| A | | Actual | | | 1.05% | | | | $1,000.00 | | | | $1,013.79 | | | | $5.26 | |
| | Hypothetical (h) | | | 1.05% | | | | $1,000.00 | | | | $1,019.64 | | | | $5.27 | |
| B | | Actual | | | 1.80% | | | | $1,000.00 | | | | $1,010.21 | | | | $9.00 | |
| | Hypothetical (h) | | | 1.80% | | | | $1,000.00 | | | | $1,015.91 | | | | $9.02 | |
| C | | Actual | | | 1.80% | | | | $1,000.00 | | | | $1,009.91 | | | | $9.00 | |
| | Hypothetical (h) | | | 1.80% | | | | $1,000.00 | | | | $1,015.91 | | | | $9.02 | |
| I | | Actual | | | 0.80% | | | | $1,000.00 | | | | $1,014.83 | | | | $4.01 | |
| | Hypothetical (h) | | | 0.80% | | | | $1,000.00 | | | | $1,020.89 | | | | $4.02 | |
| R1 | | Actual | | | 1.80% | | | | $1,000.00 | | | | $1,009.64 | | | | $8.99 | |
| | Hypothetical (h) | | | 1.80% | | | | $1,000.00 | | | | $1,015.91 | | | | $9.02 | |
| R2 | | Actual | | | 1.30% | | | | $1,000.00 | | | | $1,012.57 | | | | $6.51 | |
| | Hypothetical (h) | | | 1.30% | | | | $1,000.00 | | | | $1,018.40 | | | | $6.52 | |
| R3 | | Actual | | | 1.05% | | | | $1,000.00 | | | | $1,013.88 | | | | $5.26 | |
| | Hypothetical (h) | | | 1.05% | | | | $1,000.00 | | | | $1,019.64 | | | | $5.27 | |
| R4 | | Actual | | | 0.80% | | | | $1,000.00 | | | | $1,015.19 | | | | $4.01 | |
| | Hypothetical (h) | | | 0.80% | | | | $1,000.00 | | | | $1,020.89 | | | | $4.02 | |
| R6 | | Actual | | | 0.69% | | | | $1,000.00 | | | | $1,015.65 | | | | $3.46 | |
| | Hypothetical (h) | | | 0.69% | | | | $1,000.00 | | | | $1,021.43 | | | | $3.47 | |
| 529A | | Actual | | | 1.07% | | | | $1,000.00 | | | | $1,013.72 | | | | $5.36 | |
| | Hypothetical (h) | | | 1.07% | | | | $1,000.00 | | | | $1,019.54 | | | | $5.37 | |
| 529B | | Actual | | | 1.85% | | | | $1,000.00 | | | | $1,009.86 | | | | $9.24 | |
| | Hypothetical (h) | | | 1.85% | | | | $1,000.00 | | | | $1,015.66 | | | | $9.27 | |
| 529C | | Actual | | | 1.84% | | | | $1,000.00 | | | | $1,010.19 | | | | $9.20 | |
| | Hypothetical (h) | | | 1.84% | | | | $1,000.00 | | | | $1,015.71 | | | | $9.22 | |
| (h) | 5% class return per year before expenses. |
| (p) | “Expenses Paid During Period” are equal to each class’s annualized expense ratio, as shown above, multiplied by the average account value over the period, multiplied by 182/366 (to reflect theone-half year period). Expenses paid do not include any applicable sales charges (loads). If these transaction costs had been included, your costs would have been higher. |
Notes to Expense Table
Each class with a Rule12b-1 service fee is subject to a rebate of a portion of such fee. Such rebates are included in the expense ratios above and are outside of the expense limitation arrangement. For Class 529A and Class 529C shares, this rebate reduced the expense ratios above by 0.03% and 0.01%, respectively. See Note 3 in the Notes to Financial Statements for additional information.
4
PORTFOLIO OF INVESTMENTS
2/29/20 (unaudited)
The Portfolio of Investments is a complete list of all securities owned by your fund. It is categorized by broad-based asset classes.
| | | | | | | | |
| | |
| Issuer | | Shares/Par | | | Value ($) | |
| Common Stocks - 98.2% | | | | | | |
| Aerospace - 3.3% | | | | | | |
| FLIR Systems, Inc. | | | 1,136,527 | | | $ | 48,268,302 | |
| L3Harris Technologies, Inc. | | | 582,599 | | | | 115,197,300 | |
| TransDigm Group, Inc. | | | 198,580 | | | | 110,769,910 | |
| | | | | | | | |
| | | | | | | $ | 274,235,512 | |
| Automotive - 2.7% | | | | | | |
| Copart, Inc. (a) | | | 2,212,187 | | | $ | 186,885,558 | |
| IAA, Inc. (a) | | | 847,709 | | | | 36,214,128 | |
| | | | | | | | |
| | | | | | | $ | 223,099,686 | |
| Biotechnology - 1.4% | | | | | | |
| Adaptive Biotechnologies Corp. (a) | | | 479,974 | | | $ | 13,487,269 | |
| Bio-Techne Corp. | | | 520,348 | | | | 98,288,534 | |
| | | | | | | | |
| | | | | | | $ | 111,775,803 | |
| Brokerage & Asset Managers - 2.8% | | | | | | |
| Apollo Global Management, Inc. | | | 1,547,946 | | | $ | 64,487,430 | |
| NASDAQ, Inc. | | | 1,427,362 | | | | 146,375,973 | |
| Tradeweb Markets, Inc. | | | 511,063 | | | | 24,643,458 | |
| | | | | | | | |
| | | | | | | $ | 235,506,861 | |
| Business Services - 20.3% | | | | | | |
| Clarivate Analytics PLC (a) | | | 5,733,558 | | | $ | 116,620,570 | |
| CoStar Group, Inc. (a) | | | 187,529 | | | | 125,192,485 | |
| Equifax, Inc. | | | 341,829 | | | | 48,553,391 | |
| Fidelity National Information Services, Inc. | | | 1,270,382 | | | | 177,497,773 | |
| Fiserv, Inc. (a) | | | 1,421,240 | | | | 155,426,806 | |
| FleetCor Technologies, Inc. (a) | | | 405,523 | | | | 107,783,958 | |
| Global Payments, Inc. | | | 1,787,233 | | | | 328,797,255 | |
| MSCI, Inc. | | | 590,585 | | | | 174,482,432 | |
| PPD, Inc. (a) | | | 735,771 | | | | 20,513,296 | |
| TransUnion | | | 1,642,130 | | | | 146,018,200 | |
| Tyler Technologies, Inc. (a) | | | 310,980 | | | | 97,445,583 | |
| Verisk Analytics, Inc., “A” | | | 1,173,419 | | | | 182,009,021 | |
| | | | | | | | |
| | | | | | | $ | 1,680,340,770 | |
| Cable TV - 0.9% | | | | | | |
| Altice USA, Inc., “A” (a) | | | 3,024,745 | | | $ | 78,219,906 | |
| | |
| Chemicals - 0.2% | | | | | | |
| Ingevity Corp. (a) | | | 334,658 | | | $ | 15,072,996 | |
5
Portfolio of Investments (unaudited) – continued
| | | | | | | | |
| | |
| Issuer | | Shares/Par | | | Value ($) | |
| Common Stocks - continued | | | | | | |
| Computer Software - 6.2% | | | | | | |
| Autodesk, Inc. (a) | | | 815,260 | | | $ | 155,616,829 | |
| Black Knight, Inc. (a) | | | 1,365,579 | | | | 91,097,775 | |
| Cadence Design Systems, Inc. (a) | | | 2,547,798 | | | | 168,511,360 | |
| DocuSign, Inc. (a) | | | 348,496 | | | | 30,078,690 | |
| Everbridge, Inc. (a) | | | 182,048 | | | | 19,235,191 | |
| Paylocity Holding Corp. (a) | | | 187,603 | | | | 24,298,340 | |
| RingCentral, Inc. (a) | | | 111,753 | | | | 26,345,770 | |
| | | | | | | | |
| | | | | | | $ | 515,183,955 | |
| Computer Software - Systems - 7.0% | | | | | | |
| Constellation Software, Inc. | | | 85,240 | | | $ | 86,839,064 | |
| Guidewire Software, Inc. (a) | | | 718,553 | | | | 78,760,594 | |
| NICE Systems Ltd., ADR (a) | | | 735,932 | | | | 120,567,740 | |
| ServiceNow, Inc. (a) | | | 410,699 | | | | 133,924,837 | |
| Square, Inc., “A” (a) | | | 662,621 | | | | 55,216,208 | |
| SS&C Technologies Holdings, Inc. | | | 1,206,261 | | | | 66,947,485 | |
| Wix.com Ltd. (a) | | | 294,105 | | | | 39,418,893 | |
| | | | | | | | |
| | | | | | | $ | 581,674,821 | |
| Construction - 3.1% | | | | | | |
| Lennox International, Inc. | | | 358,371 | | | $ | 81,755,176 | |
| Pool Corp. | | | 268,270 | | | | 56,594,239 | |
| Vulcan Materials Co. | | | 951,765 | | | | 114,459,259 | |
| | | | | | | | |
| | | | | | | $ | 252,808,674 | |
| Consumer Products - 0.5% | | | | | | |
| Scotts Miracle-Gro Co. | | | 390,851 | | | $ | 41,426,298 | |
| | |
| Consumer Services - 4.0% | | | | | | |
| Bright Horizons Family Solutions, Inc. (a) | | | 1,973,366 | | | $ | 310,114,467 | |
| Peloton Interactive, Inc., “A” (a)(l) | | | 827,272 | | | | 22,079,890 | |
| | | | | | | | |
| | | | | | | $ | 332,194,357 | |
| Electrical Equipment - 4.9% | | | | | | |
| AMETEK, Inc. | | | 1,933,781 | | | $ | 166,305,166 | |
| Amphenol Corp., “A” | | | 1,049,564 | | | | 96,224,028 | |
| Littlefuse, Inc. | | | 306,169 | | | | 48,889,066 | |
| Mettler-Toledo International, Inc. (a) | | | 130,276 | | | | 91,414,669 | |
| | | | | | | | |
| | | | | | | $ | 402,832,929 | |
| Electronics - 2.1% | | | | | | |
| Monolithic Power Systems, Inc. | | | 797,675 | | | $ | 126,543,162 | |
| Silicon Laboratories, Inc. (a) | | | 571,603 | | | | 50,689,754 | |
| | | | | | | | |
| | | | | | | $ | 177,232,916 | |
6
Portfolio of Investments (unaudited) – continued
| | | | | | | | |
| | |
| Issuer | | Shares/Par | | | Value ($) | |
| Common Stocks - continued | | | | | | |
| Energy - Independent - 0.3% | | | | | | |
| Diamondback Energy, Inc. | | | 365,620 | | | $ | 22,668,440 | |
| | |
| Food & Beverages - 0.5% | | | | | | |
| Chr. Hansen Holding A.S. | | | 574,749 | | | $ | 41,218,394 | |
| | |
| Gaming & Lodging - 0.9% | | | | | | |
| Flutter Entertainment PLC | | | 250,899 | | | $ | 26,775,449 | |
| Vail Resorts, Inc. | | | 134,915 | | | | 28,684,278 | |
| Wynn Resorts Ltd. | | | 172,684 | | | | 18,646,419 | |
| | | | | | | | |
| | | | | | | $ | 74,106,146 | |
| General Merchandise - 1.9% | | | | | | |
| Dollar Tree, Inc. (a) | | | 889,712 | | | $ | 73,872,787 | |
| Five Below, Inc. (a) | | | 897,140 | | | | 86,977,723 | |
| | | | | | | | |
| | | | | | | $ | 160,850,510 | |
| Insurance - 1.7% | | | | | | |
| Arthur J. Gallagher & Co. | | | 1,432,031 | | | $ | 139,608,702 | |
| | |
| Internet - 1.3% | | | | | | |
| IAC/InterActiveCorp (a) | | | 396,019 | | | $ | 80,764,115 | |
| Match Group, Inc. (a)(l) | | | 390,202 | | | | 25,363,130 | |
| | | | | | | | |
| | | | | | | $ | 106,127,245 | |
| Leisure & Toys - 1.9% | | | | | | |
| Electronic Arts, Inc. (a) | | | 441,218 | | | $ | 44,726,269 | |
| Take-Two Interactive Software, Inc. (a) | | | 1,011,761 | | | | 108,744,072 | |
| | | | | | | | |
| | | | | | | $ | 153,470,341 | |
| Machinery & Tools - 2.7% | | | | | | |
| IDEX Corp. | | | 345,856 | | | $ | 51,186,688 | |
| Roper Technologies, Inc. | | | 440,422 | | | | 154,896,418 | |
| Xylem, Inc. | | | 193,821 | | | | 14,990,116 | |
| | | | | | | | |
| | | | | | | $ | 221,073,222 | |
| Medical & Health Technology & Services - 2.7% | | | | | | |
| Charles River Laboratories International, Inc. (a) | | | 288,098 | | | $ | 44,819,406 | |
| Guardant Health, Inc. (a) | | | 245,956 | | | | 21,388,334 | |
| HealthEquity, Inc. (a) | | | 190,547 | | | | 13,526,932 | |
| ICON PLC (a) | | | 678,353 | | | | 105,863,769 | |
| IDEXX Laboratories, Inc. (a) | | | 145,818 | | | | 37,112,139 | |
| | | | | | | | |
| | | | | | | $ | 222,710,580 | |
7
Portfolio of Investments (unaudited) – continued
| | | | | | | | |
| | |
| Issuer | | Shares/Par | | | Value ($) | |
| Common Stocks - continued | | | | | | |
| Medical Equipment - 9.2% | | | | | | |
| Align Technology, Inc. (a) | | | 65,276 | | | $ | 14,253,015 | |
| Cooper Cos., Inc. | | | 219,235 | | | | 71,157,104 | |
| DexCom, Inc. (a) | | | 249,849 | | | | 68,958,324 | |
| Masimo Corp. (a) | | | 735,638 | | | | 120,151,754 | |
| PerkinElmer, Inc. | | | 2,165,938 | | | | 187,223,681 | |
| QIAGEN N.V. (a) | | | 1,615,004 | | | | 57,978,644 | |
| STERIS PLC | | | 1,143,209 | | | | 181,335,811 | |
| West Pharmaceutical Services, Inc. | | | 390,584 | | | | 58,806,327 | |
| | | | | | | | |
| | | | | | | $ | 759,864,660 | |
| Other Banks & Diversified Financials - 0.7% | | | | | | |
| First Republic Bank | | | 569,775 | | | $ | 57,302,272 | |
| | |
| Pharmaceuticals - 0.8% | | | | | | |
| Elanco Animal Health, Inc. (a) | | | 2,488,228 | | | $ | 68,177,447 | |
| | |
| Printing & Publishing - 2.6% | | | | | | |
| IHS Markit Ltd. | | | 2,305,105 | | | $ | 164,215,680 | |
| Wolters Kluwer N.V. | | | 690,891 | | | | 50,778,574 | |
| | | | | | | | |
| | | | | | | $ | 214,994,254 | |
| Railroad & Shipping - 1.6% | | | | | | |
| Kansas City Southern Co. | | | 896,103 | | | $ | 135,024,800 | |
| | |
| Real Estate - 1.2% | | | | | | |
| Extra Space Storage, Inc., REIT | | | 993,828 | | | $ | 99,740,578 | |
| | |
| Restaurants - 2.5% | | | | | | |
| Chipotle Mexican Grill, Inc., “A” (a) | | | 135,825 | | | $ | 105,071,503 | |
| Domino’s Pizza, Inc. | | | 121,018 | | | | 41,080,770 | |
| Dunkin Brands Group, Inc. | | | 904,303 | | | | 60,154,236 | |
| | | | | | | | |
| | | | | | | $ | 206,306,509 | |
| Specialty Stores - 4.3% | | | | | | |
| Burlington Stores, Inc. (a) | | | 424,516 | | | $ | 91,805,830 | |
| Chewy, Inc., “A” (a) | | | 1,028,555 | | | | 30,445,228 | |
| Lululemon Athletica, Inc. (a) | | | 409,966 | | | | 89,130,708 | |
| O’Reilly Automotive, Inc. (a) | | | 214,864 | | | | 79,224,654 | |
| Tractor Supply Co. | | | 694,501 | | | | 61,470,284 | |
| | | | | | | | |
| | | | | | | $ | 352,076,704 | |
| Telecommunications - Wireless - 2.0% | | | | | | |
| SBA Communications Corp., REIT | | | 612,980 | | | $ | 162,494,868 | |
| Total Common Stocks (Identified Cost, $6,402,048,330) | | | $ | 8,119,421,156 | |
8
Portfolio of Investments (unaudited) – continued
| | | | | | | | |
| | |
| Issuer | | Shares/Par | | | Value ($) | |
| Investment Companies (h) - 1.6% | | | | | | |
| Money Market Funds - 1.6% | | | | | | |
MFS Institutional Money Market Portfolio, 1.61% (v)
(Identified Cost, $135,625,877) | | | 135,629,131 | | | $ | 135,642,694 | |
| | |
| Collateral for Securities Loaned - 0.5% | | | | | | |
JPMorgan U.S. Government Money Market Fund, 1.51% (j)
(Identified Cost, $42,119,639) | | | 42,119,639 | | | $ | 42,119,639 | |
| | |
| Other Assets, Less Liabilities - (0.3)% | | | | | (28,468,766) | |
| Net Assets - 100.0% | | | | | | $ | 8,268,714,723 | |
| (a) | Non-income producing security. |
| (h) | An affiliated issuer, which may be considered one in which the fund owns 5% or more of the outstanding voting securities, or a company which is under common control. At period end, the aggregate values of the fund’s investments in affiliated issuers and in unaffiliated issuers were $135,642,694 and $8,161,540,795, respectively. |
| (j) | The rate quoted is the annualized seven-day yield of the fund at period end. |
| (l) | A portion of this security is on loan. See Note 2 for additional information. |
| (v) | Affiliated issuer that is available only to investment companies managed by MFS. The rate quoted for the MFS Institutional Money Market Portfolio is the annualizedseven-day yield of the fund at period end. |
The following abbreviations are used in this report and are defined:
| ADR | | American Depositary Receipt |
| REIT | | Real Estate Investment Trust |
See Notes to Financial Statements
9
Financial Statements
STATEMENT OF ASSETS AND LIABILITIES
At 2/29/20 (unaudited)
This statement represents your fund’s balance sheet, which details the assets and liabilities comprising the total value of the fund.
| | | | |
| Assets | | | | |
Investments in unaffiliated issuers, at value, including $39,870,812 of securities on loan (identified cost, $6,444,167,969) | | | $8,161,540,795 | |
Investments in affiliated issuers, at value (identified cost, $135,625,877) | | | 135,642,694 | |
Receivables for | | | | |
Fund shares sold | | | 42,507,730 | |
Interest and dividends | | | 3,225,593 | |
Other assets | | | 292,475 | |
Total assets | | | $8,343,209,287 | |
| |
| Liabilities | | | | |
Payables for | | | | |
Fund shares reacquired | | | $29,688,818 | |
Collateral for securities loaned, at value | | | 42,119,639 | |
Payable to affiliates | | | | |
Investment adviser | | | 446,809 | |
Administrative services fee | | | 4,666 | |
Shareholder servicing costs | | | 2,095,873 | |
Distribution and service fees | | | 38,425 | |
Program manager fees | | | 52 | |
Payable for independent Trustees’ compensation | | | 1,711 | |
Accrued expenses and other liabilities | | | 98,571 | |
Total liabilities | | | $74,494,564 | |
Net assets | | | $8,268,714,723 | |
| |
| Net assets consist of | | | | |
Paid-in capital | | | $6,531,300,527 | |
Total distributable earnings (loss) | | | 1,737,414,196 | |
Net assets | | | $8,268,714,723 | |
Shares of beneficial interest outstanding | | | 387,785,822 | |
10
Statement of Assets and Liabilities (unaudited) – continued
| | | | | | | | | | | | |
| | | |
| | | Net assets | | | Shares
outstanding | | | Net asset value
per share (a) | |
Class A | | | $1,152,789,978 | | | | 56,813,833 | | | | $20.29 | |
Class B | | | 16,711,812 | | | | 1,015,583 | | | | 16.46 | |
Class C | | | 88,213,208 | | | | 5,535,913 | | | | 15.93 | |
Class I | | | 2,345,385,920 | | | | 108,471,707 | | | | 21.62 | |
Class R1 | | | 4,102,108 | | | | 250,549 | | | | 16.37 | |
Class R2 | | | 10,744,634 | | | | 565,188 | | | | 19.01 | |
Class R3 | | | 350,266,106 | | | | 17,374,833 | | | | 20.16 | |
Class R4 | | | 200,122,589 | | | | 9,480,865 | | | | 21.11 | |
Class R6 | | | 4,087,777,613 | | | | 187,604,572 | | | | 21.79 | |
Class 529A | | | 10,228,471 | | | | 520,392 | | | | 19.66 | |
Class 529B | | | 334,884 | | | | 20,908 | | | | 16.02 | |
Class 529C | | | 2,037,400 | | | | 131,479 | | | | 15.50 | |
| (a) | Maximum offering price per share was equal to the net asset value per share for all share classes, except for Classes A and 529A, for which the maximum offering prices per share were $21.53 [100 / 94.25 x $20.29] and $20.86 [100 / 94.25 x $19.66], respectively. On sales of $50,000 or more, the maximum offering prices of Class A and Class 529A shares are reduced. A contingent deferred sales charge may be imposed on redemptions of Class A, Class B, Class C, Class 529B, and Class 529C shares. Redemption price per share was equal to the net asset value per share for Classes I, R1, R2, R3, R4, R6, and 529A. |
See Notes to Financial Statements
11
Financial Statements
STATEMENT OF OPERATIONS
Six months ended 2/29/20 (unaudited)
This statement describes how much your fund earned in investment income and accrued in expenses. It also describes any gains and/or losses generated by fund operations.
| | | | |
| Net investment income (loss) | | | | |
Income | | | | |
Dividends | | | $25,633,735 | |
Dividends from affiliated issuers | | | 1,361,568 | |
Income on securities loaned | | | 1,336,924 | |
Other | | | 97,733 | |
Foreign taxes withheld | �� | | (106,846 | ) |
Total investment income | | | $28,323,114 | |
Expenses | | | | |
Management fee | | | $24,680,108 | |
Distribution and service fees | | | 2,391,595 | |
Shareholder servicing costs | | | 2,380,503 | |
Program manager fees | | | 3,171 | |
Administrative services fee | | | 276,138 | |
Independent Trustees’ compensation | | | 29,637 | |
Custodian fee | | | 117,152 | |
Shareholder communications | | | 140,203 | |
Audit and tax fees | | | 29,316 | |
Legal fees | | | 22,058 | |
Miscellaneous | | | 307,352 | |
Total expenses | | | $30,377,233 | |
Fees paid indirectly | | | (545 | ) |
Reduction of expenses by investment adviser and distributor | | | (392,809 | ) |
Net expenses | | | $29,983,879 | |
Net investment income (loss) | | | $(1,660,765 | ) |
| |
| Realized and unrealized gain (loss) | | | | |
Realized gain (loss) (identified cost basis) | | | | |
Unaffiliated issuers | | | $37,604,328 | |
Affiliated issuers | | | 11,359 | |
Foreign currency | | | 15,149 | |
Net realized gain (loss) | | | $37,630,836 | |
Change in unrealized appreciation or depreciation | | | | |
Unaffiliated issuers | | | $30,423,962 | |
Affiliated issuers | | | (6,647 | ) |
Translation of assets and liabilities in foreign currencies | | | 328 | |
Net unrealized gain (loss) | | | $30,417,643 | |
Net realized and unrealized gain (loss) | | | $68,048,479 | |
Change in net assets from operations | | | $66,387,714 | |
See Notes to Financial Statements
12
Financial Statements
STATEMENTS OF CHANGES IN NET ASSETS
These statements describe the increases and/or decreases in net assets resulting from operations, any distributions, and any shareholder transactions.
| | | | | | | | |
| Change in net assets | | Six months ended 2/29/20 (unaudited) | | | Year ended 8/31/19 | |
| | |
| From operations | | | | | | | | |
Net investment income (loss) | | | $(1,660,765 | ) | | | $(5,766,982 | ) |
Net realized gain (loss) | | | 37,630,836 | | | | 75,577,283 | |
Net unrealized gain (loss) | | | 30,417,643 | | | | 523,617,842 | |
Change in net assets from operations | | | $66,387,714 | | | | $593,428,143 | |
Total distributions to shareholders | | | $(64,368,451 | ) | | | $(147,690,129 | ) |
Change in net assets from fund share transactions | | | $2,280,267,493 | | | | $2,125,633,835 | |
Total change in net assets | | | $2,282,286,756 | | | | $2,571,371,849 | |
| | |
| Net assets | | | | | | | | |
At beginning of period | | | 5,986,427,967 | | | | 3,415,056,118 | |
At end of period | | | $8,268,714,723 | | | | $5,986,427,967 | |
See Notes to Financial Statements
13
Financial Statements
FINANCIAL HIGHLIGHTS
The financial highlights table is intended to help you understand the fund’s financial performance for the semiannual period and the past 5 fiscal years. Certain information reflects financial results for a single fund share. The total returns in the table represent the rate that an investor would have earned (or lost) on an investment in the fund share class (assuming reinvestment of all distributions) held for the entire period.
| | | | | | | | | | | | | | | | | | | | | | | | |
| | | Six months ended 2/29/20 | | | Year ended | |
| Class A | | 8/31/19 | | | 8/31/18 | | | 8/31/17 | | | 8/31/16 | | | 8/31/15 | |
| | | (unaudited) | | | | | | | | | | | | | | | | |
Net asset value, beginning
of period | | | $20.19 | | | | $19.16 | | | | $16.34 | | | | $14.82 | | | | $14.40 | | | | $14.41 | |
| |
| Income (loss) from investment operations | | | | | |
Net investment income (loss) (d) | | | $(0.03 | ) | | | $(0.07 | ) | | | $(0.09 | ) | | | $(0.06 | )(c) | | | $(0.06 | ) | | | $(0.10 | ) |
Net realized and unrealized
gain (loss) | | | 0.31 | | | | 1.83 | | | | 4.32 | | | | 2.36 | | | | 0.88 | | | | 1.07 | |
Total from investment operations | | | $0.28 | | | | $1.76 | | | | $4.23 | | | | $2.30 | | | | $0.82 | | | | $0.97 | |
| |
| Less distributions declared to shareholders | | | | | |
From net realized gain | | | $(0.18 | ) | | | $(0.73 | ) | | | $(1.41 | ) | | | $(0.78 | ) | | | $(0.40 | ) | | | $(0.98 | ) |
Net asset value, end of period (x) | | | $20.29 | | | | $20.19 | | | | $19.16 | | | | $16.34 | | | | $14.82 | | | | $14.40 | |
Total return (%) (r)(s)(t)(x) | | | 1.38 | (n) | | | 10.13 | | | | 27.69 | | | | 16.44 | (c) | | | 5.87 | | | | 7.36 | |
| |
Ratios (%) (to average net assets)
and Supplemental data: | | | | | |
Expenses before expense
reductions (f) | | | 1.06 | (a) | | | 1.10 | | | | 1.17 | | | | 1.22 | (c) | | | 1.26 | | | | 1.24 | |
Expenses after expense
reductions (f) | | | 1.05 | (a) | | | 1.09 | | | | 1.16 | | | | 1.20 | (c) | | | 1.22 | | | | 1.21 | |
Net investment income (loss) | | | (0.29 | )(a) | | | (0.36 | ) | | | (0.55 | ) | | | (0.42 | )(c) | | | (0.45 | ) | | | (0.72 | ) |
Portfolio turnover | | | 8 | (n) | | | 21 | | | | 33 | | | | 30 | | | | 43 | | | | 37 | |
Net assets at end of period
(000 omitted) | | | $1,152,790 | | | | $1,065,566 | | | | $824,847 | | | | $572,338 | | | | $454,881 | | | | $295,230 | |
See Notes to Financial Statements
14
Financial Highlights – continued
| | | | | | | | | | | | | | | | | | | | | | | | |
| | | Six months ended 2/29/20 | | | Year ended | |
| Class B | | 8/31/19 | | | 8/31/18 | | | 8/31/17 | | | 8/31/16 | | | 8/31/15 | |
| | | (unaudited) | | | | | | | | | | | | | | | | |
Net asset value, beginning
of period | | | $16.47 | | | | $15.90 | | | | $13.88 | | | | $12.80 | | | | $12.58 | | | | $12.81 | |
|
| Income (loss) from investment operations | |
Net investment income (loss) (d) | | | $(0.09 | ) | | | $(0.17 | ) | | | $(0.19 | ) | | | $(0.15 | )(c) | | | $(0.15 | ) | | | $(0.19 | ) |
Net realized and unrealized
gain (loss) | | | 0.26 | | | | 1.47 | | | | 3.62 | | | | 2.01 | | | | 0.77 | | | | 0.94 | |
Total from investment operations | | | $0.17 | | | | $1.30 | | | | $3.43 | | | | $1.86 | | | | $0.62 | | | | $0.75 | |
| |
| Less distributions declared to shareholders | | | | | |
From net realized gain | | | $(0.18 | ) | | | $(0.73 | ) | | | $(1.41 | ) | | | $(0.78 | ) | | | $(0.40 | ) | | | $(0.98 | ) |
Net asset value, end of period (x) | | | $16.46 | | | | $16.47 | | | | $15.90 | | | | $13.88 | | | | $12.80 | | | | $12.58 | |
Total return (%) (r)(s)(t)(x) | | | 1.02 | (n) | | | 9.28 | | | | 26.77 | | | | 15.56 | (c) | | | 5.11 | | | | 6.51 | |
|
Ratios (%) (to average net assets)
and Supplemental data: | |
Expenses before expense
reductions (f) | | | 1.81 | (a) | | | 1.85 | | | | 1.92 | | | | 1.97 | (c) | | | 2.00 | | | �� | 1.99 | |
Expenses after expense
reductions (f) | | | 1.80 | (a) | | | 1.84 | | | | 1.91 | | | | 1.95 | (c) | | | 1.97 | | | | 1.96 | |
Net investment income (loss) | | | (1.04 | )(a) | | | (1.12 | ) | | | (1.30 | ) | | | (1.16 | )(c) | | | (1.24 | ) | | | (1.47 | ) |
Portfolio turnover | | | 8 | (n) | | | 21 | | | | 33 | | | | 30 | | | | 43 | | | | 37 | |
Net assets at end of period
(000 omitted) | | | $16,712 | | | | $18,581 | | | | $19,329 | | | | $16,326 | | | | $17,978 | | | | $17,415 | |
See Notes to Financial Statements
15
Financial Highlights – continued
| | | | | | | | | | | | | | | | | | | | | | | | |
| | | Six months
ended 2/29/20 | | | Year ended | |
| Class C | | 8/31/19 | | | 8/31/18 | | | 8/31/17 | | | 8/31/16 | | | 8/31/15 | |
| | | (unaudited) | | | | | | | | | | | | | | | | |
Net asset value, beginning
of period | | | $15.95 | | | | $15.42 | | | | $13.50 | | | | $12.48 | | | | $12.27 | | | | $12.52 | |
|
| Income (loss) from investment operations | |
Net investment income (loss) (d) | | | $(0.09 | ) | | | $(0.16 | ) | | | $(0.18 | ) | | | $(0.15 | )(c) | | | $(0.14 | ) | | | $(0.18 | ) |
Net realized and unrealized
gain (loss) | | | 0.25 | | | | 1.42 | | | | 3.51 | | | | 1.95 | | | | 0.75 | | | | 0.91 | |
Total from investment operations | | | $0.16 | | | | $1.26 | | | | $3.33 | | | | $1.80 | | | | $0.61 | | | | $0.73 | |
| |
| Less distributions declared to shareholders | | | | | |
From net realized gain | | | $(0.18 | ) | | | $(0.73 | ) | | | $(1.41 | ) | | | $(0.78 | ) | | | $(0.40 | ) | | | $(0.98 | ) |
Net asset value, end of period (x) | | | $15.93 | | | | $15.95 | | | | $15.42 | | | | $13.50 | | | | $12.48 | | | | $12.27 | |
Total return (%) (r)(s)(t)(x) | | | 0.99 | (n) | | | 9.31 | | | | 26.77 | | | | 15.48 | (c) | | | 5.16 | | | | 6.50 | |
|
Ratios (%) (to average net assets)
and Supplemental data: | |
Expenses before expense
reductions (f) | | | 1.81 | (a) | | | 1.85 | | | | 1.92 | | | | 1.97 | (c) | | | 2.00 | | | | 1.99 | |
Expenses after expense
reductions (f) | | | 1.80 | (a) | | | 1.84 | | | | 1.91 | | | | 1.95 | (c) | | | 1.97 | | | | 1.96 | |
Net investment income (loss) | | | (1.04 | )(a) | | | (1.11 | ) | | | (1.30 | ) | | | (1.17 | )(c) | | | (1.22 | ) | | | (1.47 | ) |
Portfolio turnover | | | 8 | (n) | | | 21 | | | | 33 | | | | 30 | | | | 43 | | | | 37 | |
Net assets at end of period
(000 omitted) | | | $88,213 | | | | $78,858 | | | | $54,080 | | | | $58,623 | | | | $53,862 | | | | $42,806 | |
See Notes to Financial Statements
16
Financial Highlights – continued
| | | | | | | | | | | | | | | | | | | | | | | | |
| | | Six months
ended 2/29/20 | | | Year ended | |
| Class I | | 8/31/19 | | | 8/31/18 | | | 8/31/17 | | | 8/31/16 | | | 8/31/15 | |
| | | (unaudited) | | | | | | | | | | | | | | | | |
Net asset value, beginning
of period | | | $21.48 | | | | $20.28 | | | | $17.17 | | | | $15.50 | | | | $15.00 | | | | $14.94 | |
|
| Income (loss) from investment operations | |
Net investment income (loss) (d) | | | $(0.00 | )(w) | | | $(0.02 | ) | | | $(0.06 | ) | | | $(0.03 | )(c) | | | $(0.00 | )(w) | | | $(0.07 | ) |
Net realized and unrealized
gain (loss) | | | 0.32 | | | | 1.95 | | | | 4.58 | | | | 2.48 | | | | 0.90 | | | | 1.11 | |
Total from investment operations | | | $0.32 | | | | $1.93 | | | | $4.52 | | | | $2.45 | | | | $0.90 | | | | $1.04 | |
| |
| Less distributions declared to shareholders | | | | | |
From net realized gain | | | $(0.18 | ) | | | $(0.73 | ) | | | $(1.41 | ) | | | $(0.78 | ) | | | $(0.40 | ) | | | $(0.98 | ) |
Net asset value, end of period (x) | | | $21.62 | | | | $21.48 | | | | $20.28 | | | | $17.17 | | | | $15.50 | | | | $15.00 | |
Total return (%) (r)(s)(t)(x) | | | 1.48 | (n) | | | 10.42 | | | | 28.05 | | | | 16.70 | (c) | | | 6.17 | | | | 7.57 | |
|
Ratios (%) (to average net assets)
and Supplemental data: | |
Expenses before expense
reductions (f) | | | 0.81 | (a) | | | 0.84 | | | | 0.92 | | | | 0.97 | (c) | | | 1.02 | | | | 1.00 | |
Expenses after expense
reductions (f) | | | 0.80 | (a) | | | 0.83 | | | | 0.91 | | | | 0.96 | (c) | | | 0.99 | | | | 0.97 | |
Net investment income (loss) | | | (0.01 | )(a) | | | (0.09 | ) | | | (0.30 | ) | | | (0.18 | )(c) | | | (0.01 | ) | | | (0.47 | ) |
Portfolio turnover | | | 8 | (n) | | | 21 | | | | 33 | | | | 30 | | | | 43 | | | | 37 | |
Net assets at end of period
(000 omitted) | | | $2,345,386 | | | | $1,330,368 | | | | $332,008 | | | | $100,858 | | | | $110,803 | | | | $26,931 | |
See Notes to Financial Statements
17
Financial Highlights – continued
| | | | | | | | | | | | | | | | | | | | | | | | |
| | | Six months
ended 2/29/20 | | | Year ended | |
| Class R1 | | 8/31/19 | | | 8/31/18 | | | 8/31/17 | | | 8/31/16 | | | 8/31/15 | |
| | | (unaudited) | | | | | | | | | | | | | | | | |
Net asset value, beginning
of period | | | $16.39 | | | | $15.82 | | | | $13.82 | | | | $12.75 | | | | $12.53 | | | | $12.76 | |
|
| Income (loss) from investment operations | |
Net investment income (loss) (d) | | | $(0.09 | ) | | | $(0.17 | ) | | | $(0.19 | ) | | | $(0.15 | )(c) | | | $(0.15 | ) | | | $(0.19 | ) |
Net realized and unrealized
gain (loss) | | | 0.25 | | | | 1.47 | | | | 3.60 | | | | 2.00 | | | | 0.77 | | | | 0.94 | |
Total from investment operations | | | $0.16 | | | | $1.30 | | | | $3.41 | | | | $1.85 | | | | $0.62 | | | | $0.75 | |
| |
| Less distributions declared to shareholders | | | | | |
From net realized gain | | | $(0.18 | ) | | | $(0.73 | ) | | | $(1.41 | ) | | | $(0.78 | )�� | | | $(0.40 | ) | | | $(0.98 | ) |
Net asset value, end of period (x) | | | $16.37 | | | | $16.39 | | | | $15.82 | | | | $13.82 | | | | $12.75 | | | | $12.53 | |
Total return (%) (r)(s)(t)(x) | | | 0.96 | (n) | | | 9.33 | | | | 26.73 | | | | 15.54 | (c) | | | 5.13 | | | | 6.54 | |
|
Ratios (%) (to average net assets)
and Supplemental data: | |
Expenses before expense
reductions (f) | | | 1.81 | (a) | | | 1.85 | | | | 1.92 | | | | 1.97 | (c) | | | 2.00 | | | | 1.99 | |
Expenses after expense
reductions (f) | | | 1.80 | (a) | | | 1.84 | | | | 1.91 | | | | 1.96 | (c) | | | 1.97 | | | | 1.97 | |
Net investment income (loss) | | | (1.04 | )(a) | | | (1.12 | ) | | | (1.30 | ) | | | (1.17 | )(c) | | | (1.25 | ) | | | (1.47 | ) |
Portfolio turnover | | | 8 | (n) | | | 21 | | | | 33 | | | | 30 | | | | 43 | | | | 37 | |
Net assets at end of period
(000 omitted) | | | $4,102 | | | | $3,472 | | | | $2,827 | | | | $2,348 | | | | $2,057 | | | | $2,288 | |
See Notes to Financial Statements
18
Financial Highlights – continued
| | | | | | | | | | | | | | | | | | | | | | | | |
| | | Six months
ended 2/29/20 | | | Year ended | |
| Class R2 | | 8/31/19 | | | 8/31/18 | | | 8/31/17 | | | 8/31/16 | | | 8/31/15 | |
| | | (unaudited) | | | | | | | | | | | | | | | | |
Net asset value, beginning
of period | | | $18.95 | | | | $18.08 | | | | $15.53 | | | | $14.16 | | | | $13.80 | | | | $13.89 | |
|
| Income (loss) from investment operations | |
Net investment income (loss) (d) | | | $(0.05 | ) | | | $(0.11 | ) | | | $(0.13 | ) | | | $(0.10 | )(c) | | | $(0.10 | ) | | | $(0.14 | ) |
Net realized and unrealized
gain (loss) | | | 0.29 | | | | 1.71 | | | | 4.09 | | | | 2.25 | | | | 0.86 | | | | 1.03 | |
Total from investment operations | | | $0.24 | | | | $1.60 | | | | $3.96 | | | | $2.15 | | | | $0.76 | | | | $0.89 | |
| |
| Less distributions declared to shareholders | | | | | |
From net realized gain | | | $(0.18 | ) | | | $(0.73 | ) | | | $(1.41 | ) | | | $(0.78 | ) | | | $(0.40 | ) | | | $(0.98 | ) |
Net asset value, end of period (x) | | | $19.01 | | | | $18.95 | | | | $18.08 | | | | $15.53 | | | | $14.16 | | | | $13.80 | |
Total return (%) (r)(s)(t)(x) | | | 1.26 | (n) | | | 9.84 | | | | 27.37 | | | | 16.14 | (c) | | | 5.68 | | | | 7.04 | |
|
Ratios (%) (to average net assets)
and Supplemental data: | |
Expenses before expense
reductions (f) | | | 1.31 | (a) | | | 1.35 | | | | 1.42 | | | | 1.47 | (c) | | | 1.50 | | | | 1.49 | |
Expenses after expense
reductions (f) | | | 1.30 | (a) | | | 1.34 | | | | 1.41 | | | | 1.46 | (c) | | | 1.47 | | | | 1.47 | |
Net investment income (loss) | | | (0.54 | )(a) | | | (0.61 | ) | | | (0.80 | ) | | | (0.67 | )(c) | | | (0.73 | ) | | | (0.97 | ) |
Portfolio turnover | | | 8 | (n) | | | 21 | | | | 33 | | | | 30 | | | | 43 | | | | 37 | |
Net assets at end of period
(000 omitted) | | | $10,745 | | | | $11,060 | | | | $9,069 | | | | $6,681 | | | | $5,651 | | | | $4,598 | |
See Notes to Financial Statements
19
Financial Highlights – continued
| | | | | | | | | | | | | | | | | | | | | | | | |
| | | Six months
ended
2/29/20 | | | Year ended | |
| Class R3 | | 8/31/19 | | | 8/31/18 | | | 8/31/17 | | | 8/31/16 | | | 8/31/15 | |
| | | (unaudited) | | | | | | | | | | | | | | | | |
Net asset value, beginning
of period | | | $20.06 | | | | $19.04 | | | | $16.24 | | | | $14.74 | | | | $14.32 | | | | $14.34 | |
|
| Income (loss) from investment operations | |
Net investment income (loss) (d) | | | $(0.03 | ) | | | $(0.06 | ) | | | $(0.09 | ) | | | $(0.07 | )(c) | | | $(0.06 | ) | | | $(0.10 | ) |
Net realized and unrealized
gain (loss) | | | 0.31 | | | | 1.81 | | | | 4.30 | | | | 2.35 | | | | 0.88 | | | | 1.06 | |
Total from investment operations | | | $0.28 | | | | $1.75 | | | | $4.21 | | | | $2.28 | | | | $0.82 | | | | $0.96 | |
| |
| Less distributions declared to shareholders | | | | | |
From net realized gain | | | $(0.18 | ) | | | $(0.73 | ) | | | $(1.41 | ) | | | $(0.78 | ) | | | $(0.40 | ) | | | $(0.98 | ) |
Net asset value, end of period (x) | | | $20.16 | | | | $20.06 | | | | $19.04 | | | | $16.24 | | | | $14.74 | | | | $14.32 | |
Total return (%) (r)(s)(t)(x) | | | 1.39 | (n) | | | 10.14 | | | | 27.73 | | | | 16.39 | (c) | | | 5.90 | | | | 7.32 | |
|
Ratios (%) (to average net assets)
and Supplemental data: | |
Expenses before expense
reductions (f) | | | 1.06 | (a) | | | 1.09 | | | | 1.17 | | | | 1.22 | (c) | | | 1.26 | | | | 1.25 | |
Expenses after expense
reductions (f) | | | 1.05 | (a) | | | 1.09 | | | | 1.16 | | | | 1.21 | (c) | | | 1.23 | | | | 1.22 | |
Net investment income (loss) | | | (0.29 | )(a) | | | (0.34 | ) | | | (0.55 | ) | | | (0.44 | )(c) | | | (0.42 | ) | | | (0.72 | ) |
Portfolio turnover | | | 8 | (n) | | | 21 | | | | 33 | | | | 30 | | | | 43 | | | | 37 | |
Net assets at end of period
(000 omitted) | | | $350,266 | | | | $239,505 | | | | $95,010 | | | | $32,496 | | | | $14,836 | | | | $8,440 | |
See Notes to Financial Statements
20
Financial Highlights – continued
| | | | | | | | | | | | | | | | | | | | | | | | |
| | | Six months
ended 2/29/20 | | | Year ended | |
| Class R4 | | 8/31/19 | | | 8/31/18 | | | 8/31/17 | | | 8/31/16 | | | 8/31/15 | |
| | | (unaudited) | | | | | | | | | | | | | | | | |
Net asset value, beginning
of period | | | $20.97 | | | | $19.82 | | | | $16.82 | | | | $15.20 | | | | $14.72 | | | | $14.67 | |
|
| Income (loss) from investment operations | |
Net investment income (loss) (d) | | | $(0.00 | )(w) | | | $(0.02 | ) | | | $(0.05 | ) | | | $(0.03 | )(c) | | | $(0.02 | ) | | | $(0.07 | ) |
Net realized and unrealized
gain (loss) | | | 0.32 | | | | 1.90 | | | | 4.46 | | | | 2.43 | | | | 0.90 | | | | 1.10 | |
Total from investment operations | | | $0.32 | | | | $1.88 | | | | $4.41 | | | | $2.40 | | | | $0.88 | | | | $1.03 | |
| |
| Less distributions declared to shareholders | | | | | |
From net realized gain | | | $(0.18 | ) | | | $(0.73 | ) | | | $(1.41 | ) | | | $(0.78 | ) | | | $(0.40 | ) | | | $(0.98 | ) |
Net asset value, end of period (x) | | | $21.11 | | | | $20.97 | | | | $19.82 | | | | $16.82 | | | | $15.20 | | | | $14.72 | |
Total return (%) (r)(s)(t)(x) | | | 1.52 | (n) | | | 10.40 | | | | 27.98 | | | | 16.70 | (c) | | | 6.15 | | | | 7.65 | |
|
Ratios (%) (to average net assets)
and Supplemental data: | |
Expenses before expense
reductions (f) | | | 0.81 | (a) | | | 0.84 | | | | 0.92 | | | | 0.97 | (c) | | | 1.01 | | | | 1.00 | |
Expenses after expense
reductions (f) | | | 0.80 | (a) | | | 0.83 | | | | 0.91 | | | | 0.96 | (c) | | | 0.98 | | | | 0.98 | |
Net investment income (loss) | | | (0.04 | )(a) | | | (0.08 | ) | | | (0.30 | ) | | | (0.18 | )(c) | | | (0.17 | ) | | | (0.47 | ) |
Portfolio turnover | | | 8 | (n) | | | 21 | | | | 33 | | | | 30 | | | | 43 | | | | 37 | |
Net assets at end of period
(000 omitted) | | | $200,123 | | | | $173,441 | | | | $54,141 | | | | $22,346 | | | | $13,883 | | | | $2,322 | |
See Notes to Financial Statements
21
Financial Highlights – continued
| | | | | | | | | | | | | | | | | | | | | | | | |
| | | Six months
ended 2/29/20 | | | Year ended | |
| Class R6 | | 8/31/19 | | | 8/31/18 | | | 8/31/17 | | | 8/31/16 | | | 8/31/15 | |
| | | (unaudited) | | | | | | | | | | | | | | | | |
Net asset value, beginning
of period | | | $21.63 | | | | $20.40 | | | | $17.25 | | | | $15.55 | | | | $15.03 | | | | $14.96 | |
|
| Income (loss) from investment operations | |
Net investment income (loss) (d) | | | $0.01 | | | | $(0.00 | )(w) | | | $(0.04 | ) | | | $(0.01 | )(c) | | | $(0.02 | ) | | | $(0.06 | ) |
Net realized and unrealized
gain (loss) | | | 0.33 | | | | 1.96 | | | | 4.60 | | | | 2.49 | | | | 0.94 | | | | 1.11 | |
Total from investment operations | | | $0.34 | | | | $1.96 | | | | $4.56 | | | | $2.48 | | | | $0.92 | | | | $1.05 | |
| |
| Less distributions declared to shareholders | | | | | |
From net realized gain | | | $(0.18 | ) | | | $(0.73 | ) | | | $(1.41 | ) | | | $(0.78 | ) | | | $(0.40 | ) | | | $(0.98 | ) |
Net asset value, end of period (x) | | | $21.79 | | | | $21.63 | | | | $20.40 | | | | $17.25 | | | | $15.55 | | | | $15.03 | |
Total return (%) (r)(s)(t)(x) | | | 1.57 | (n) | | | 10.51 | | | | 28.17 | | | | 16.84 | (c) | | | 6.29 | | | | 7.63 | |
|
Ratios (%) (to average net assets)
and Supplemental data: | |
Expenses before expense
reductions (f) | | | 0.70 | (a) | | | 0.75 | | | | 0.81 | | | | 0.86 | (c) | | | 0.90 | | | | 0.91 | |
Expenses after expense
reductions (f) | | | 0.69 | (a) | | | 0.74 | | | | 0.81 | | | | 0.84 | (c) | | | 0.87 | | | | 0.89 | |
Net investment income (loss) | | | 0.06 | (a) | | | (0.01 | ) | | | (0.19 | ) | | | (0.05 | )(c) | | | (0.14 | ) | | | (0.39 | ) |
Portfolio turnover | | | 8 | (n) | | | 21 | | | | 33 | | | | 30 | | | | 43 | | | | 37 | |
Net assets at end of period
(000 omitted) | | | $4,087,778 | | | | $3,053,325 | | | | $2,013,624 | | | | $1,520,339 | | | | $1,330,139 | | | | $1,329,257 | |
See Notes to Financial Statements
22
Financial Highlights – continued
| | | | | | | | | | | | | | | | | | | | | | | | |
| | | Six months
ended 2/29/20 | | | Year ended | |
| Class 529A | | 8/31/19 | | | 8/31/18 | | | 8/31/17 | | | 8/31/16 | | | 8/31/15 | |
| | | (unaudited) | | | | | | | | | | | | | | | | |
Net asset value, beginning
of period | | | $19.57 | | | | $18.60 | | | | $15.90 | | | | $14.45 | | | | $14.04 | | | | $14.08 | |
|
| Income (loss) from investment operations | |
Net investment income (loss) (d) | | | $(0.03 | ) | | | $(0.07 | ) | | | $(0.09 | ) | | | $(0.06 | )(c) | | | $(0.07 | ) | | | $(0.10 | ) |
Net realized and unrealized
gain (loss) | | | 0.30 | | | | 1.77 | | | | 4.20 | | | | 2.29 | | | | 0.88 | | | | 1.04 | |
Total from investment operations | | | $0.27 | | | | $1.70 | | | | $4.11 | | | | $2.23 | | | | $0.81 | | | | $0.94 | |
| |
| Less distributions declared to shareholders | | | | | |
From net realized gain | | | $(0.18 | ) | | | $(0.73 | ) | | | $(1.41 | ) | | | $(0.78 | ) | | | $(0.40 | ) | | | $(0.98 | ) |
Net asset value, end of period (x) | | | $19.66 | | | | $19.57 | | | | $18.60 | | | | $15.90 | | | | $14.45 | | | | $14.04 | |
Total return (%) (r)(s)(t)(x) | | | 1.37(n | ) | | | 10.11 | | | | 27.70 | | | | 16.38 | (c) | | | 5.95 | | | | 7.31 | |
|
Ratios (%) (to average net assets)
and Supplemental data: | |
Expenses before expense
reductions (f) | | | 1.11 | (a) | | | 1.15 | | | | 1.23 | | | | 1.32 | (c) | | | 1.35 | | | | 1.34 | |
Expenses after expense
reductions (f) | | | 1.07 | (a) | | | 1.10 | | | | 1.18 | | | | 1.21 | (c) | | | 1.23 | | | | 1.21 | |
Net investment income (loss) | | | (0.31 | )(a) | | | (0.38 | ) | | | (0.56 | ) | | | (0.43 | )(c) | | | (0.48 | ) | | | (0.72 | ) |
Portfolio turnover | | | 8 | (n) | | | 21 | | | | 33 | | | | 30 | | | | 43 | | | | 37 | |
Net assets at end of period
(000 omitted) | | | $10,228 | | | | $9,590 | | | | $7,582 | | | | $4,916 | | | | $3,890 | | | | $3,159 | |
See Notes to Financial Statements
23
Financial Highlights – continued
| | | | | | | | | | | | | | | | | | | | | | | | |
| | | Six months
ended 2/29/20 | | | Year ended | |
| Class 529B | | 8/31/19 | | | 8/31/18 | | | 8/31/17 | | | 8/31/16 | | | 8/31/15 | |
| | | (unaudited) | | | | | | | | | | | | | | | | |
Net asset value, beginning
of period | | | $16.04 | | | | $15.51 | | | | $13.58 | | | | $12.55 | | | | $12.34 | | | | $12.59 | |
|
| Income (loss) from investment operations | |
Net investment income (loss) (d) | | | $(0.09 | ) | | | $(0.17 | ) | | | $(0.19 | ) | | | $(0.15 | )(c) | | | $(0.15 | ) | | | $(0.19 | ) |
Net realized and unrealized
gain (loss) | | | 0.25 | | | | 1.43 | | | | 3.53 | | | | 1.96 | | | | 0.76 | | | | 0.92 | |
Total from investment operations | | | $0.16 | | | | $1.26 | | | | $3.34 | | | | $1.81 | | | | $0.61 | | | | $0.73 | |
| |
| Less distributions declared to shareholders | | | | | |
From net realized gain | | | $(0.18 | ) | | | $(0.73 | ) | | | $(1.41 | ) | | | $(0.78 | ) | | | $(0.40 | ) | | | $(0.98 | ) |
Net asset value, end of period (x) | | | $16.02 | | | | $16.04 | | | | $15.51 | | | | $13.58 | | | | $12.55 | | | | $12.34 | |
Total return (%) (r)(s)(t)(x) | | | 0.99 | (n) | | | 9.26 | | | | 26.69 | | | | 15.47 | (c) | | | 5.13 | | | | 6.46 | |
|
Ratios (%) (to average net assets)
and Supplemental data: | |
Expenses before expense
reductions (f) | | | 1.86 | (a) | | | 1.90 | | | | 1.98 | | | | 2.07 | (c) | | | 2.11 | | | | 2.09 | |
Expenses after expense
reductions (f) | | | 1.85 | (a) | | | 1.89 | | | | 1.96 | | | | 2.00 | (c) | | | 2.02 | | | | 2.02 | |
Net investment income (loss) | | | (1.09 | )(a) | | | (1.17 | ) | | | (1.35 | ) | | | (1.23 | )(c) | | | (1.26 | ) | | | (1.52 | ) |
Portfolio turnover | | | 8 | (n) | | | 21 | | | | 33 | | | | 30 | | | | 43 | | | | 37 | |
Net assets at end of period
(000 omitted) | | | $335 | | | | $361 | | | | $304 | | | | $210 | | | | $209 | | | | $347 | |
See Notes to Financial Statements
24
Financial Highlights – continued
| | | | | | | | | | | | | | | | | | | | | | | | |
| | | Six months
ended 2/29/20 | | | Year ended | |
| Class 529C | | 8/31/19 | | | 8/31/18 | | | 8/31/17 | | | 8/31/16 | | | 8/31/15 | |
| | | (unaudited) | | | | | | | | | | | | | | | | |
Net asset value, beginning
of period | | | $15.52 | | | | $15.04 | | | | $13.20 | | | | $12.22 | | | | $12.03 | | | | $12.30 | |
|
| Income (loss) from investment operations | |
Net investment income (loss) (d) | | | $(0.09 | ) | | | $(0.16 | ) | | | $(0.18 | ) | | | $(0.15 | )(c) | | | $(0.15 | ) | | | $(0.19 | ) |
Net realized and unrealized
gain (loss) | | | 0.25 | | | | 1.37 | | | | 3.43 | | | | 1.91 | | | | 0.74 | | | | 0.90 | |
Total from investment operations | | | $0.16 | | | | $1.21 | | | | $3.25 | | | | $1.76 | | | | $0.59 | | | | $0.71 | |
| |
| Less distributions declared to shareholders | | | | | |
From net realized gain | | | $(0.18 | ) | | | $(0.73 | ) | | | $(1.41 | ) | | | $(0.78 | ) | | | $(0.40 | ) | | | $(0.98 | ) |
Net asset value, end of period (x) | | | $15.50 | | | | $15.52 | | | | $15.04 | | | | $13.20 | | | | $12.22 | | | | $12.03 | |
Total return (%) (r)(s)(t)(x) | | | 1.02 | (n) | | | 9.21 | | | | 26.78 | | | | 15.48 | (c) | | | 5.09 | | | | 6.45 | |
|
Ratios (%) (to average net assets)
and Supplemental data: | |
Expenses before expense
reductions (f) | | | 1.86 | (a) | | | 1.90 | | | | 1.99 | | | | 2.07 | (c) | | | 2.10 | | | | 2.10 | |
Expenses after expense
reductions (f) | | | 1.84 | (a) | | | 1.88 | | | | 1.95 | | | | 1.99 | (c) | | | 2.01 | | | | 2.01 | |
Net investment income (loss) | | | (1.08 | )(a) | | | (1.16 | ) | | | (1.34 | ) | | | (1.21 | )(c) | | | (1.27 | ) | | | (1.52 | ) |
Portfolio turnover | | | 8 | (n) | | | 21 | | | | 33 | | | | 30 | | | | 43 | | | | 37 | |
Net assets at end of period
(000 omitted) | | | $2,037 | | | | $2,299 | | | | $2,236 | | | | $1,955 | | | | $1,641 | | | | $1,391 | |
| (c) | Amount reflects aone-time reimbursement of expenses by the custodian (or former custodian) without which net investment income and performance would be lower and expenses would be higher. |
| (d) | Per share data is based on average shares outstanding. |
| (f) | Ratios do not reflect reductions from fees paid indirectly, if applicable. |
| (r) | Certain expenses have been reduced without which performance would have been lower. |
| (s) | From time to time the fund may receive proceeds from litigation settlements, without which performance would be lower. |
| (t) | Total returns do not include any applicable sales charges. |
| (w) | Per share amount was less than $0.01. |
| (x) | The net asset values and total returns have been calculated on net assets which include adjustments made in accordance with U.S. generally accepted accounting principles required at period end for financial reporting purposes. |
See Notes to Financial Statements
25
NOTES TO FINANCIAL STATEMENTS
(unaudited)
(1) Business and Organization
MFS Mid Cap Growth Fund (the fund) is a diversified series of MFS Series Trust IV (the trust). The trust is organized as a Massachusetts business trust and is registered under the Investment Company Act of 1940, as amended, as anopen-end management investment company.
The fund is an investment company and accordingly follows the investment company accounting and reporting guidance of the Financial Accounting Standards Board (FASB) Accounting Standards Codification Topic 946 Financial Services – Investment Companies.
(2) Significant Accounting Policies
General– The preparation of financial statements in conformity with U.S. generally accepted accounting principles requires management to make estimates and assumptions that affect the reported amounts of assets and liabilities, and disclosure of contingent assets and liabilities at the date of the financial statements and the reported amounts of increases and decreases in net assets from operations during the reporting period. Actual results could differ from those estimates. In the preparation of these financial statements, management has evaluated subsequent events occurring after the date of the fund’s Statement of Assets and Liabilities through the date that the financial statements were issued.
In March 2020, the FASB issued Accounting Standards Update2020-04, Reference Rate Reform (Topic 848) – Facilitation of the Effects of Reference Rate Reform on Financial Reporting (“ASU2020-04”), which provides optional, temporary relief with respect to the financial reporting of contracts subject to certain types of modifications due to the planned discontinuation of the London Interbank Offered Rate (LIBOR) and other IBOR-based reference rates as of the end of 2021. The temporary relief provided by ASU2020-04 is effective for certain reference rate-related contract modifications that occur during the period from March 12, 2020 through December 31, 2022. Management is evaluating the impact of ASU2020-04 on the fund’s investments, derivatives, debt and other contracts that will undergo reference rate-related modifications as a result of the reference rate reform.
Balance Sheet Offsetting – The fund’s accounting policy with respect to balance sheet offsetting is that, absent an event of default by the counterparty or a termination of the agreement, the International Swaps and Derivatives Association (ISDA) Master Agreement, or similar agreement, does not result in an offset of reported amounts of financial assets and financial liabilities in the Statement of Assets and Liabilities across transactions between the fund and the applicable counterparty. The fund’s right to setoff may be restricted or prohibited by the bankruptcy or insolvency laws of the particular jurisdiction to which a specific master netting agreement counterparty is subject. Balance sheet offsetting disclosures, to the extent applicable to the fund, have been included in the fund’s Significant Accounting Policies note under the captions for each of the fund’sin-scope financial instruments and transactions.
Investment Valuations – Equity securities, including restricted equity securities, are generally valued at the last sale or official closing price on their primary market or
26
Notes to Financial Statements (unaudited) – continued
exchange as provided by a third-party pricing service. Equity securities, for which there were no sales reported that day, are generally valued at the last quoted daily bid quotation on their primary market or exchange as provided by a third-party pricing service. Short-term instruments with a maturity at issuance of 60 days or less may be valued at amortized cost, which approximates market value.Open-end investment companies are generally valued at net asset value per share. Securities and other assets generally valued on the basis of information from a third-party pricing service may also be valued at a broker/dealer bid quotation. In determining values, third-party pricing services can utilize both transaction data and market information such as yield, quality, coupon rate, maturity, type of issue, trading characteristics, and other market data. The values of foreign securities and other assets and liabilities expressed in foreign currencies are converted to U.S. dollars using the mean of bid and asked prices for rates provided by a third-party pricing service.
The Board of Trustees has delegated primary responsibility for determining or causing to be determined the value of the fund’s investments (including any fair valuation) to the adviser pursuant to valuation policies and procedures approved by the Board. If the adviser determines that reliable market quotations are not readily available, investments are valued at fair value as determined in good faith by the adviser in accordance with such procedures under the oversight of the Board of Trustees. Under the fund’s valuation policies and procedures, market quotations are not considered to be readily available for most types of debt instruments and floating rate loans and many types of derivatives. These investments are generally valued at fair value based on information from third-party pricing services. In addition, investments may be valued at fair value if the adviser determines that an investment’s value has been materially affected by events occurring after the close of the exchange or market on which the investment is principally traded (such as foreign exchange or market) and prior to the determination of the fund’s net asset value, or after the halt of trading of a specific security where trading does not resume prior to the close of the exchange or market on which the security is principally traded. Events that occur after foreign markets close (such as developments in foreign markets and significant movements in the U.S. markets) and prior to the determination of the fund’s net asset value may be deemed to have a material effect on the value of securities traded in foreign markets. Accordingly, the fund’s foreign equity securities may often be valued at fair value. The adviser generally relies on third-party pricing services or other information (such as the correlation with price movements of similar securities in the same or other markets; the type, cost and investment characteristics of the security; the business and financial condition of the issuer; and trading and other market data) to assist in determining whether to fair value and at what value to fair value an investment. The value of an investment for purposes of calculating the fund’s net asset value can differ depending on the source and method used to determine value. When fair valuation is used, the value of an investment used to determine the fund’s net asset value may differ from quoted or published prices for the same investment. There can be no assurance that the fund could obtain the fair value assigned to an investment if it were to sell the investment at the same time at which the fund determines its net asset value per share.
Various inputs are used in determining the value of the fund’s assets or liabilities. These inputs are categorized into three broad levels. In certain cases, the inputs used to
27
Notes to Financial Statements (unaudited) – continued
measure fair value may fall into different levels of the fair value hierarchy. In such cases, an investment’s level within the fair value hierarchy is based on the lowest level of input that is significant to the fair value measurement. The fund’s assessment of the significance of a particular input to the fair value measurement in its entirety requires judgment, and considers factors specific to the investment. Level 1 includes unadjusted quoted prices in active markets for identical assets or liabilities. Level 2 includes other significant observable market-based inputs (including quoted prices for similar securities, interest rates, prepayment speed, and credit risk). Level 3 includes unobservable inputs, which may include the adviser’s own assumptions in determining the fair value of investments. The following is a summary of the levels used as of February 29, 2020 in valuing the fund’s assets or liabilities:
| | | | | | | | | | | | | | | | |
| | | | |
| Financial Instruments | | Level 1 | | | Level 2 | | | Level 3 | | | Total | |
| Equity Securities: | | | | | | | | | | | | | | | | |
United States | | | $7,473,360,059 | | | | $— | | | | $— | | | | $7,473,360,059 | |
Israel | | | 159,986,633 | | | | — | | | | — | | | | 159,986,633 | |
Ireland | | | 105,863,769 | | | | 26,775,449 | | | | — | | | | 132,639,218 | |
United Kingdom | | | 116,620,570 | | | | — | | | | — | | | | 116,620,570 | |
Canada | | | 86,839,064 | | | | — | | | | — | | | | 86,839,064 | |
Germany | | | 57,978,644 | | | | — | | | | — | | | | 57,978,644 | |
Netherlands | | | — | | | | 50,778,574 | | | | — | | | | 50,778,574 | |
Denmark | | | — | | | | 41,218,394 | | | | — | | | | 41,218,394 | |
| Mutual Funds | | | 177,762,333 | | | | — | | | | — | | | | 177,762,333 | |
| Total | | | $8,178,411,072 | | | | $118,772,417 | | | | $— | | | | $8,297,183,489 | |
For further information regarding security characteristics, see the Portfolio of Investments.
Foreign Currency Translation– Purchases and sales of foreign investments, income, and expenses are converted into U.S. dollars based upon currency exchange rates prevailing on the respective dates of such transactions or on the reporting date for foreign denominated receivables and payables. Gains and losses attributable to foreign currency exchange rates on sales of securities are recorded for financial statement purposes as net realized gains and losses on investments. Gains and losses attributable to foreign exchange rate movements on receivables, payables, income and expenses are recorded for financial statement purposes as foreign currency transaction gains and losses. That portion of both realized and unrealized gains and losses on investments that results from fluctuations in foreign currency exchange rates is not separately disclosed.
Security Loans– Under its Securities Lending Agency Agreement with the fund, JPMorgan Chase and Co., as lending agent, loans the securities of the fund to certain qualified institutions (the “Borrowers”) approved by the fund. Security loans can be terminated at the discretion of either the lending agent or the fund and the related securities must be returned within the earlier of the standard trade settlement period for such securities or within three business days. The loans are collateralized by cash and/or U.S. Treasury and federal agency obligations in an amount typically at least equal to the market value of the securities loaned. On loans collateralized by cash, the cash collateral is invested in a money market fund. The market value of the loaned
28
Notes to Financial Statements (unaudited) – continued
securities is determined at the close of business of the fund and any additional required collateral is delivered to the fund on the next business day. The lending agent provides the fund with indemnification against Borrower default. In the event of Borrower default, the lending agent will, for the benefit of the fund, either purchase securities identical to those loaned or, when such purchase is commercially impracticable, pay the fund the market value of the loaned securities. In return, the lending agent assumes the fund’s rights to the related collateral. If the collateral value is less than the cost to purchase identical securities, the lending agent is responsible for the shortfall, but only to the extent that such shortfall is not due to a decline in collateral value resulting from collateral reinvestment for which the fund bears the risk of loss. At period end, the fund had investment securities on loan, all of which were classified as equity securities in the fund’s Portfolio of Investments, with a fair value of $39,870,812. The fair value of the fund’s investment securities on loan and a related liability of $42,119,639 for cash collateral received on securities loaned are both presented gross in the Statement of Assets and Liabilities. The collateral on securities loaned exceeded the value of securities on loan at period end. The liability for cash collateral for securities loaned is carried at fair value, which is categorized as level 2 within the fair value hierarchy. A portion of the income generated upon investment of the collateral is remitted to the Borrowers, and the remainder is allocated between the fund and the lending agent. On loans collateralized by U.S. Treasury and/or federal agency obligations, a fee is received from the Borrower, and is allocated between the fund and the lending agent. Income from securities lending is separately reported in the Statement of Operations. The dividend and interest income earned on the securities loaned is accounted for in the same manner as other dividend and interest income.
Indemnifications– Under the fund’s organizational documents, its officers and Trustees may be indemnified against certain liabilities and expenses arising out of the performance of their duties to the fund. Additionally, in the normal course of business, the fund enters into agreements with service providers that may contain indemnification clauses. The fund’s maximum exposure under these agreements is unknown as this would involve future claims that may be made against the fund that have not yet occurred.
Investment Transactions and Income– Investment transactions are recorded on the trade date. Dividends received in cash are recorded on theex-dividend date. Certain dividends from foreign securities will be recorded when the fund is informed of the dividend if such information is obtained subsequent to theex-dividend date. Dividend payments received in additional securities are recorded on theex-dividend date in an amount equal to the value of the security on such date.
The fund may receive proceeds from litigation settlements. Any proceeds received from litigation involving portfolio holdings are reflected in the Statement of Operations in realized gain/loss if the security has been disposed of by the fund or in unrealized gain/loss if the security is still held by the fund. Any other proceeds from litigation not related to portfolio holdings are reflected as other income in the Statement of Operations.
Fees Paid Indirectly– The fund’s custody fee may be reduced by a credit earned under an arrangement that measures the value of U.S. dollars deposited with the
29
Notes to Financial Statements (unaudited) – continued
custodian by the fund. The amount of the credit, for the six months ended February 29, 2020, is shown as a reduction of total expenses in the Statement of Operations.
Tax Matters and Distributions– The fund intends to qualify as a regulated investment company, as defined under Subchapter M of the Internal Revenue Code, and to distribute all of its taxable income, including realized capital gains. As a result, no provision for federal income tax is required. The fund’s federal tax returns, when filed, will remain subject to examination by the Internal Revenue Service for a three year period. Management has analyzed the fund’s tax positions taken on federal and state tax returns for all open tax years and does not believe that there are any uncertain tax positions that require recognition of a tax liability. Foreign taxes, if any, have been accrued by the fund in the accompanying financial statements in accordance with the applicable foreign tax law. Foreign income taxes may be withheld by certain countries in which the fund invests. Additionally, capital gains realized by the fund on securities issued in or by certain foreign countries may be subject to capital gains tax imposed by those countries.
Distributions to shareholders are recorded on theex-dividend date. Income and capital gain distributions are determined in accordance with income tax regulations, which may differ from U.S. generally accepted accounting principles. Certain capital accounts in the financial statements are periodically adjusted for permanent differences in order to reflect their tax character. These adjustments have no impact on net assets or net asset value per share. Temporary differences which arise from recognizing certain items of income, expense, gain or loss in different periods for financial statement and tax purposes will reverse at some time in the future.
Book/tax differences primarily relate to net operating losses and wash sale loss deferrals.
The tax character of distributions made during the current period will be determined at fiscal year end. The tax character of distributions declared to shareholders for the last fiscal year is as follows:
| | | | |
| |
| | | Year ended
8/31/19 | |
| Long-term capital gains | | | $147,690,129 | |
The federal tax cost and the tax basis components of distributable earnings were as follows:
| | | | |
| |
| As of 2/29/20 | | | |
| |
| Cost of investments | | | $6,584,882,396 | |
| Gross appreciation | | | 1,788,693,758 | |
| |
| Gross depreciation | | | (76,392,665 | ) |
| Net unrealized appreciation (depreciation) | | | $1,712,301,093 | |
| |
| As of 8/31/19 | | | |
| |
| Undistributed long-term capital gain | | | 58,162,779 | |
| Late year ordinary loss deferral | | | (4,641,909 | ) |
| Other temporary differences | | | (9,715 | ) |
| Net unrealized appreciation (depreciation) | | | 1,681,883,778 | |
The aggregate cost above includes prior fiscal year end tax adjustments, if applicable.
30
Notes to Financial Statements (unaudited) – continued
Multiple Classes of Shares of Beneficial Interest– The fund offers multiple classes of shares, which differ in their respective distribution, service, and program manager fees. The fund’s income, realized and unrealized gain (loss), and common expenses are allocated to shareholders based on the daily net assets of each class. Dividends are declared separately for each class. Differences in per share dividend rates are generally due to differences in separate class expenses. Class B and Class 529B shares will convert to Class A and Class 529A shares, respectively, approximately eight years after purchase. Class C and Class 529C shares will convert to Class A and Class 529A shares, respectively, approximately ten years after purchase. The fund’s distributions declared to shareholders as reported in the Statements of Changes in Net Assets are presented by class as follows:
| | | | | | | | |
| | |
| | | Six months
ended
2/29/20 | | | Year
ended
8/31/19 | |
| Class A | | | $9,859,800 | | | | $32,483,357 | |
| Class B | | | 192,285 | | | | 867,340 | |
| Class C | | | 934,695 | | | | 2,626,254 | |
| Class I | | | 18,997,911 | | | | 22,084,916 | |
| Class R1 | | | 44,903 | | | | 148,603 | |
| Class R2 | | | 100,054 | | | | 343,389 | |
| Class R3 | | | 2,828,218 | | | | 4,573,131 | |
| Class R4 | | | 1,671,984 | | | | 2,640,146 | |
| Class R6 | | | 29,619,366 | | | | 81,483,319 | |
| Class 529A | | | 90,325 | | | | 310,572 | |
| Class 529B | | | 3,816 | | | | 15,636 | |
| Class 529C | | | 25,094 | | | | 113,466 | |
| Total | | | $64,368,451 | | | | $147,690,129 | |
(3) Transactions with Affiliates
Investment Adviser– The fund has an investment advisory agreement with MFS to provide overall investment management and related administrative services and facilities to the fund. The management fee is computed daily and paid monthly at the following annual rates based on the fund’s average daily net assets:
| | | | |
| Up to $1 billion | | | 0.75 | % |
| In excess of $1 billion and up to $2.5 billion | | | 0.70 | % |
| In excess of $2.5 billion and up to $5 billion | | | 0.65 | % |
| In excess of $5 billion and up to $10 billion | | | 0.62 | % |
| In excess of $10 billion | | | 0.60 | % |
MFS has agreed in writing to reduce its management fee by a specified amount if certain MFS mutual fund assets exceed thresholds agreed to by MFS and the fund’s Board of Trustees. For the six months ended February 29, 2020, this management fee reduction amounted to $378,215, which is included in the reduction of total expenses in the Statement of Operations. The management fee incurred for the six months ended February 29, 2020 was equivalent to an annual effective rate of 0.65% of the fund’s average daily net assets.
31
Notes to Financial Statements (unaudited) – continued
The investment adviser has agreed in writing to pay a portion of the fund’s total annual operating expenses, excluding interest, taxes, extraordinary expenses, brokerage and transaction costs, and investment-related expenses, such that total fund operating expenses do not exceed the following rates annually of each class’s average daily net assets:
| | | | | | | | | | | | | | | | | | | | | | | | | | | | | | | | | | | | | | | | | | | | |
| Classes | |
| | | | | | | | | | | |
| A | | B | | | C | | | I | | | R1 | | | R2 | | | R3 | | | R4 | | | R6 | | | 529A | | | 529B | | | 529C | |
| 1.30% | | | 2.05% | | | | 2.05% | | | | 1.05% | | | | 2.05% | | | | 1.55% | | | | 1.30% | | | | 1.05% | | | | 0.95% | | | | 1.35% | | | | 2.10% | | | | 2.10% | |
This written agreement will continue until modified by the fund’s Board of Trustees, but such agreement will continue at least until December 31, 2020. For the six months ended February 29, 2020, the fund’s actual operating expenses did not exceed the limit and therefore, the investment adviser did not pay any portion of the fund’s expenses related to this agreement.
Distributor– MFS Fund Distributors, Inc. (MFD), a wholly-owned subsidiary of MFS, as distributor, received $324,567 and $4,594 for the six months ended February 29, 2020, as its portion of the initial sales charge on sales of Class A and Class 529A shares of the fund, respectively.
The Board of Trustees has adopted a distribution plan for certain share classes pursuant to Rule12b-1 of the Investment Company Act of 1940.
The fund’s distribution plan provides that the fund will pay MFD for services provided by MFD and financial intermediaries in connection with the distribution and servicing of certain share classes. One component of the plan is a distribution fee paid to MFD and another component of the plan is a service fee paid to MFD. MFD may subsequently pay all, or a portion, of the distribution and/or service fees to financial intermediaries.
Distribution Plan Fee Table:
| | | | | | | | | | | | | | | | | | | | |
| | | | | |
| | | Distribution
Fee Rate (d) | | | Service
Fee Rate (d) | | | Total
Distribution
Plan (d) | | | Annual
Effective
Rate (e) | | | Distribution
and Service
Fee | |
| Class A | | | — | | | | 0.25% | | | | 0.25% | | | | 0.25% | | | | $1,413,992 | |
| Class B | | | 0.75% | | | | 0.25% | | | | 1.00% | | | | 1.00% | | | | 90,208 | |
| Class C | | | 0.75% | | | | 0.25% | | | | 1.00% | | | | 1.00% | | | | 423,541 | |
| Class R1 | | | 0.75% | | | | 0.25% | | | | 1.00% | | | | 1.00% | | | | 19,772 | |
| Class R2 | | | 0.25% | | | | 0.25% | | | | 0.50% | | | | 0.50% | | | | 27,373 | |
| Class R3 | | | — | | | | 0.25% | | | | 0.25% | | | | 0.25% | | | | 391,188 | |
| Class 529A | | | — | | | | 0.25% | | | | 0.25% | | | | 0.22% | | | | 12,627 | |
| Class 529B | | | 0.75% | | | | 0.25% | | | | 1.00% | | | | 1.00% | | | | 1,751 | |
| Class 529C | | | 0.75% | | | | 0.25% | | | | 1.00% | | | | 0.99% | | | | 11,143 | |
| Total Distribution and Service Fees | | | | | | | | | | | | $2,391,595 | |
| (d) | In accordance with the distribution plan for certain classes, the fund pays distribution and/or service fees equal to these annual percentage rates of each class’s average daily net assets. The distribution and service fee rates disclosed by class represent the current rates in effect at the end of the reporting period. Any rate changes, if applicable, are detailed below. |
| (e) | The annual effective rates represent actual fees incurred under the distribution plan for the six months ended February 29, 2020 based on each class’s average daily net assets. MFD has voluntarily agreed to rebate a portion of each class’s 0.25% service fee attributable to |
32
Notes to Financial Statements (unaudited) – continued
| | accounts for which MFD retains the 0.25% service fee except for accounts attributable to MFS or its affiliates’ seed money. For the six months ended February 29, 2020, this rebate amounted to $12,439, $355, $88, $1,562, $4, and $146 for Class A, Class B, Class C, Class 529A, Class 529B, and Class 529C, respectively, and is included in the reduction of total expenses in the Statement of Operations. |
Certain Class A shares are subject to a contingent deferred sales charge (CDSC) in the event of a shareholder redemption within 18 months of purchase. Class B and Class 529B shares are subject to a CDSC in the event of a shareholder redemption within six years of purchase. Class C and Class 529C shares are subject to a CDSC in the event of a shareholder redemption within 12 months of purchase. All contingent deferred sales charges are paid to MFD and during the six months ended February 29, 2020, were as follows:
| | | | |
| |
| | | Amount | |
| Class A | | | $16,799 | |
| Class B | | | 7,969 | |
| Class C | | | 7,192 | |
| Class 529B | | | — | |
| Class 529C | | | 48 | |
The fund has entered into and may from time to time enter into contracts with program managers and other parties which administer the tuition programs through which an investment in the fund’s 529 share classes is made. The fund has entered into an agreement with MFD pursuant to which MFD receives an annual fee of up to 0.05% of the average daily net assets attributable to each 529 share class. The services provided by MFD, or a third party with which MFD contracts, include recordkeeping and tax reporting and account services, as well as services designed to maintain the program’s compliance with the Internal Revenue Code and other regulatory requirements. Program manager fees for the six months ended February 29, 2020, were as follows:
| | | | |
| |
| | | Fee | |
| Class 529A | | | $2,525 | |
| Class 529B | | | 88 | |
| Class 529C | | | 558 | |
| Total Program Manager Fees | | | $3,171 | |
Shareholder Servicing Agent– MFS Service Center, Inc. (MFSC), a wholly-owned subsidiary of MFS, receives a fee from the fund for its services as shareholder servicing agent calculated as a percentage of the average daily net assets of the fund as determined periodically under the supervision of the fund’s Board of Trustees. For the six months ended February 29, 2020, the fee was $159,924, which equated to 0.0043% annually of the fund’s average daily net assets. MFSC also receives payment from the fund forout-of-pocket expenses,sub-accounting and other shareholder servicing costs which may be paid to affiliated and unaffiliated service providers. Class R6 shares do not incursub-accounting fees. For the six months ended February 29, 2020, theseout-of-pocket expenses,sub-accounting and other shareholder servicing costs amounted to $2,220,579.
33
Notes to Financial Statements (unaudited) – continued
Administrator– MFS provides certain financial, legal, shareholder communications, compliance, and other administrative services to the fund. Under an administrative services agreement, the fund reimburses MFS the costs incurred to provide these services. The fund is charged an annual fixed amount of $17,500 plus a fee based on average daily net assets. The administrative services fee incurred for the six months ended February 29, 2020 was equivalent to an annual effective rate of 0.0074% of the fund’s average daily net assets.
Trustees’ and Officers’ Compensation– The fund pays compensation to independent Trustees in the form of a retainer, attendance fees, and additional compensation to Board and Committee chairpersons. The fund does not pay compensation directly to Trustees or officers of the fund who are also officers of the investment adviser, all of whom receive remuneration from MFS for their services to the fund. Certain officers and Trustees of the fund are officers or directors of MFS, MFD, and MFSC.
Other –The fund invests in the MFS Institutional Money Market Portfolio which is managed by MFS and seeks current income consistent with preservation of capital and liquidity. This money market fund does not pay a management fee to MFS but does incur investment and operating costs.
The fund is permitted to engage in purchase and sale transactions with funds and accounts for which MFS serves as investment adviser orsub-adviser (“cross-trades”) pursuant to a policy adopted by the Board of Trustees. This policy has been designed to ensure that cross-trades conducted by the fund comply with Rule17a-7 under the Investment Company Act of 1940. During the six months ended February 29, 2020, the fund engaged in purchase and sale transactions pursuant to this policy, which amounted to $8,963,654 and $3,076,988, respectively. The sales transactions resulted in net realized gains (losses) of $1,096,769.
The adviser has voluntarily undertaken to reimburse the fund from its own resources on a quarterly basis for the cost of investment research embedded in the cost of the fund’s securities trades. This agreement may be rescinded at any time. For the six months ended February 29, 2020, this reimbursement amounted to $97,733, which is included in “Other” income in the Statement of Operations.
(4) Portfolio Securities
For the six months ended February 29, 2020, purchases and sales of investments, other than short-term obligations, aggregated $2,809,397,014 and $570,617,453, respectively.
34
Notes to Financial Statements (unaudited) – continued
(5) Shares of Beneficial Interest
The fund’s Declaration of Trust permits the Trustees to issue an unlimited number of full and fractional shares of beneficial interest. Transactions in fund shares were as follows:
| | | | | | | | | | | | | | | | |
| | | Six months ended
2/29/20 | | | Year ended
8/31/19 | |
| | | | |
| | | Shares | | | Amount | | | Shares | | | Amount | |
| Shares sold | | | | | | | | | | | | | | | | |
Class A | | | 8,910,057 | | | | $186,139,864 | | | | 16,893,741 | | | | $308,308,947 | |
Class B | | | 9,728 | | | | 164,033 | | | | 167,116 | | | | 2,461,117 | |
Class C | | | 1,125,749 | | | | 18,581,636 | | | | 2,361,735 | | | | 33,981,644 | |
Class I | | | 58,380,615 | | | | 1,281,109,799 | | | | 55,660,527 | | | | 1,097,623,178 | |
Class R1 | | | 74,479 | | | | 1,260,578 | | | | 93,143 | | | | 1,378,704 | |
Class R2 | | | 140,783 | | | | 2,755,877 | | | | 310,813 | | | | 5,354,226 | |
Class R3 | | | 7,139,955 | | | | 146,217,743 | | | | 8,813,818 | | | | 159,118,047 | |
Class R4 | | | 2,266,767 | | | | 48,912,432 | | | | 6,170,894 | | | | 120,974,054 | |
Class R6 | | | 57,014,260 | | | | 1,281,355,442 | | | | 59,950,469 | | | | 1,157,462,328 | |
Class 529A | | | 50,155 | | | | 1,017,494 | | | | 116,776 | | | | 2,035,524 | |
Class 529B | | | — | | | | — | | | | 3,691 | | | | 52,714 | |
Class 529C | | | 5,316 | | | | 85,525 | | | | 27,845 | | | | 402,462 | |
| | | 135,117,864 | | | | $2,967,600,423 | | | | 150,570,568 | | | | $2,889,152,945 | |
|
Shares issued to shareholders in
reinvestment of distributions | |
Class A | | | 440,256 | | | | $9,095,685 | | | | 1,862,516 | | | | $29,949,263 | |
Class B | | | 11,390 | | | | 191,132 | | | | 64,768 | | | | 853,647 | |
Class C | | | 55,628 | | | | 903,950 | | | | 197,157 | | | | 2,517,694 | |
Class I | | | 835,857 | | | | 18,388,852 | | | | 1,256,574 | | | | 21,449,719 | |
Class R1 | | | 2,689 | | | | 44,903 | | | | 11,326 | | | | 148,603 | |
Class R2 | | | 4,761 | | | | 92,224 | | | | 19,261 | | | | 291,223 | |
Class R3 | | | 137,760 | | | | 2,828,218 | | | | 286,358 | | | | 4,573,131 | |
Class R4 | | | 75,746 | | | | 1,627,032 | | | | 151,596 | | | | 2,527,104 | |
Class R6 | | | 1,273,386 | | | | 28,230,958 | | | | 4,554,939 | | | | 78,253,843 | |
Class 529A | | | 4,510 | | | | 90,253 | | | | 19,934 | | | | 310,572 | |
Class 529B | | | 234 | | | | 3,816 | | | | 1,218 | | | | 15,636 | |
Class 529C | | | 1,587 | | | | 25,075 | | | | 9,128 | | | | 113,466 | |
| | | 2,843,804 | | | | $61,522,098 | | | | 8,434,775 | | | | $141,003,901 | |
35
Notes to Financial Statements (unaudited) – continued
| | | | | | | | | | | | | | | | |
| | | Six months ended
2/29/20 | | | Year ended
8/31/19 | |
| | | | |
| | | Shares | | | Amount | | | Shares | | | Amount | |
| | | | |
| Shares reacquired | | | | | | | | | | | | | | | | |
Class A | | | (5,313,407 | ) | | | $(110,554,028 | ) | | | (9,027,911 | ) | | | $(164,372,631 | ) |
Class B | | | (133,839 | ) | | | (2,259,979 | ) | | | (319,581 | ) | | | (4,686,479 | ) |
Class C | | | (588,684 | ) | | | (9,609,127 | ) | | | (1,121,734 | ) | | | (16,028,901 | ) |
Class I | | | (12,684,971 | ) | | | (292,052,926 | ) | | | (11,346,369 | ) | | | (221,941,074 | ) |
Class R1 | | | (38,473 | ) | | | (666,128 | ) | | | (71,287 | ) | | | (1,095,958 | ) |
Class R2 | | | (163,988 | ) | | | (3,187,984 | ) | | | (248,049 | ) | | | (4,272,767 | ) |
Class R3 | | | (1,842,252 | ) | | | (38,198,285 | ) | | | (2,149,812 | ) | | | (39,056,008 | ) |
Class R4 | | | (1,132,331 | ) | | | (24,447,285 | ) | | | (783,122 | ) | | | (14,923,200 | ) |
Class R6 | | | (11,847,429 | ) | | | (266,981,225 | ) | | | (22,054,119 | ) | | | (436,646,367 | ) |
Class 529A | | | (24,445 | ) | | | (492,500 | ) | | | (54,257 | ) | | | (949,092 | ) |
Class 529B | | | (1,865 | ) | | | (30,225 | ) | | | (1,951 | ) | | | (29,265 | ) |
Class 529C | | | (23,567 | ) | | | (375,336 | ) | | | (37,575 | ) | | | (521,269 | ) |
| | | (33,795,251 | ) | | | $(748,855,028 | ) | | | (47,215,767 | ) | | | $(904,523,011 | ) |
| | | | |
| Net change | | | | | | | | | | | | | | | | |
Class A | | | 4,036,906 | | | | $84,681,521 | | | | 9,728,346 | | | | $173,885,579 | |
Class B | | | (112,721 | ) | | | (1,904,814 | ) | | | (87,697 | ) | | | (1,371,715 | ) |
Class C | | | 592,693 | | | | 9,876,459 | | | | 1,437,158 | | | | 20,470,437 | |
Class I | | | 46,531,501 | | | | 1,007,445,725 | | | | 45,570,732 | | | | 897,131,823 | |
Class R1 | | | 38,695 | | | | 639,353 | | | | 33,182 | | | | 431,349 | |
Class R2 | | | (18,444 | ) | | | (339,883 | ) | | | 82,025 | | | | 1,372,682 | |
Class R3 | | | 5,435,463 | | | | 110,847,676 | | | | 6,950,364 | | | | 124,635,170 | |
Class R4 | | | 1,210,182 | | | | 26,092,179 | | | | 5,539,368 | | | | 108,577,958 | |
Class R6 | | | 46,440,217 | | | | 1,042,605,175 | | | | 42,451,289 | | | | 799,069,804 | |
Class 529A | | | 30,220 | | | | 615,247 | | | | 82,453 | | | | 1,397,004 | |
Class 529B | | | (1,631 | ) | | | (26,409 | ) | | | 2,958 | | | | 39,085 | |
Class 529C | | | (16,664 | ) | | | (264,736 | ) | | | (602 | ) | | | (5,341 | ) |
| | | 104,166,417 | | | | $2,280,267,493 | | | | 111,789,576 | | | | $2,125,633,835 | |
Class T shares were not publicly available for sale during the period. Please see the fund’s prospectus for details.
Effective June 1, 2019, purchases of the fund’s Class B and Class 529B shares are closed to new and existing investors subject to certain exceptions. Please see the fund’s prospectus for details.
The fund is one of several mutual funds in which certain MFS funds may invest. The MFS funds do not invest in the underlying funds for the purpose of exercising management or control. At the end of the period, the MFS Growth Allocation Fund, the MFS Moderate Allocation Fund, the MFS Aggressive Growth Allocation Fund, and the MFS Conservative Allocation Fund were the owners of record of approximately 6%, 5%, 2%, and 1%, respectively, of the value of outstanding voting shares of the fund. In addition, the MFS Lifetime Income Fund, the MFS Lifetime 2020 Fund, the MFS Lifetime 2025 Fund, the MFS Lifetime 2030 Fund, the MFS Lifetime 2035 Fund, the MFS Lifetime 2040 Fund, the MFS Lifetime 2045 Fund, the MFS Lifetime 2050 Fund,
36
Notes to Financial Statements (unaudited) – continued
the MFS Lifetime 2055 Fund, and the MFS Lifetime 2060 Fund were each the owners of record of less than 1% of the value of outstanding voting shares of the fund.
(6) Line of Credit
The fund and certain other funds managed by MFS participate in a $1.25 billion unsecured committed line of credit, subject to a $1 billion sublimit, provided by a syndicate of banks under a credit agreement. Borrowings may be made for temporary financing needs. Interest is charged to each fund, based on its borrowings, generally at a rate equal to the highest of one month LIBOR, the Federal Funds Effective Rate and the Overnight Bank Funding Rate, plus an agreed upon spread. A commitment fee, based on the average daily, unused portion of the committed line of credit, is allocated among the participating funds. In addition, the fund and other funds managed by MFS have established unsecured uncommitted borrowing arrangements with certain banks for temporary financing needs. Interest is charged to each fund, based on its borrowings, at rates equal to customary reference rates plus an agreed upon spread. For the six months ended February 29, 2020, the fund’s commitment fee and interest expense were $14,770 and $0, respectively, and are included in “Miscellaneous” expense in the Statement of Operations.
(7) Investments in Affiliated Issuers
An affiliated issuer may be considered one in which the fund owns 5% or more of the outstanding voting securities, or a company which is under common control. For the purposes of this report, the following were affiliated issuers:
| | | | | | | | | | | | | | | | | | | | | | | | |
| | | | | | |
| Affiliated Issuers | | Beginning
Value | | | Purchases | | | Sales
Proceeds | | | Realized
Gain
(Loss) | | | Change in
Unrealized
Appreciation or
Depreciation | | | Ending
Value | |
| MFS Institutional Money Market Portfolio | | | $154,554,360 | | | | $1,425,845,603 | | | | $1,444,761,981 | | | | $11,359 | | | | $(6,647 | ) | | | $135,642,694 | |
| | | | | | |
| Affiliated Issuers | | | | | | | | | | | | | | Dividend
Income | | | Capital Gain
Distributions | |
| MFS Institutional Money Market Portfolio | | | | | | | | | | | | $1,361,568 | | | | $— | |
(8) Impacts of COVID-19
The pandemic related to the global spread of novel coronavirus disease (COVID-19), which was first detected in December 2019, has resulted in significant disruptions to global business activity and the global economy, as well as the economies of individual countries, the financial performance of individual companies and sectors, and the securities and commodities markets in general. This pandemic, the full effects of which are still unknown, has resulted in substantial market volatility and may have adversely impacted the prices and liquidity of the fund’s investments and the fund’s performance during the period February 29, 2020 through April 16, 2020, the date that these financial statements were issued.
37
PROXY VOTING POLICIES AND INFORMATION
MFS votes proxies on behalf of the fund pursuant to proxy voting policies and procedures that are available without charge, upon request, by calling1-800-225-2606, by visitingmfs.com/proxyvoting, or by visiting the SEC’s Web site athttp://www.sec.gov.
Information regarding how the fund voted proxies relating to portfolio securities during the most recent twelve-month period ended June 30 is available by August 31 of each year without charge by visitingmfs.com/proxyvoting, or by visiting the SEC’s Web site athttp://www.sec.gov.
QUARTERLY PORTFOLIO DISCLOSURE
The fund files a complete schedule of portfolio holdings with the SEC for the first and third quarters of each fiscal year as an exhibit to its reports onForm N-PORT. The fund’s Form N-PORT reports are available on the SEC’s website athttp://www.sec.gov.A shareholder can obtain the portfolio holdings report for the first and third quarters of the fund’s fiscal year atmfs.com/openendfunds by choosing the fund’s name and then selecting the “Resources” tab and clicking on “Prospectus and Reports”.
FURTHER INFORMATION
From time to time, MFS may post important information about the fund or the MFS funds on the MFS web site (mfs.com). This information is available athttps://www.mfs.com/en-us/what-we-do/announcements.html or atmfs.com/openendfunds by choosing the fund’s name.
INFORMATION ABOUT FUND CONTRACTS AND LEGAL CLAIMS
The fund has entered into contractual arrangements with an investment adviser, administrator, distributor, shareholder servicing agent, 529 program manager (if applicable), and custodian who each provide services to the fund. Unless expressly stated otherwise, shareholders are not parties to, or intended beneficiaries of these contractual arrangements, and these contractual arrangements are not intended to create any shareholder right to enforce them against the service providers or to seek any remedy under them against the service providers, either directly or on behalf of the fund.
Under the Trust’s By-Laws and Declaration of Trust, any claims asserted against or on behalf of the MFS Funds, including claims against Trustees and Officers, must be brought in state and federal courts located within the Commonwealth of Massachusetts.
PROVISION OF FINANCIAL REPORTS AND SUMMARY PROSPECTUSES
The fund produces financial reports every six months and updates its summary prospectus and prospectus annually. To avoid sending duplicate copies of materials to households, only one copy of the fund’s annual and semiannual report and summary prospectus may be mailed to shareholders having the same last name and residential address on the fund’s records. However, any shareholder may contact MFSC (please see back cover for address and telephone number) to request that copies of these reports and summary prospectuses be sent personally to that shareholder.
38
Save paper with eDelivery.

| MFS® will send you prospectuses, |
reports, and proxies directly viae-mail so you will get information faster with less mailbox clutter.
To sign up:
1. Go to mfs.com.
2. Log in via MFS® Access.
3. Select eDelivery.
If you own your MFS fund shares through a financial institution or a retirement plan, MFS® TALK, MFS® Access, or eDelivery may not be available to you.
CONTACT
WEB SITE
mfs.com
MFS TALK
1-800-637-8255
24 hours a day
ACCOUNT SERVICE AND LITERATURE
Shareholders
1-800-225-2606
Financial advisors
1-800-343-2829
Retirement plan services
1-800-637-1255
MAILING ADDRESS
MFS Service Center, Inc.
P.O. Box 219341
Kansas City, MO 64121-9341
OVERNIGHT MAIL
MFS Service Center, Inc.
Suite 219341
430 W 7th Street
Kansas City, MO 64105-1407
Semiannual Report
February 29, 2020

MFS® U.S. Government Money Market Fund

Beginning on January 1, 2021, as permitted by regulations adopted by the U.S. Securities and Exchange Commission, paper copies of the fund’s annual and semiannual shareholder reports will no longer be sent by mail, unless you specifically request paper copies of the reports. Instead, the complete reports will be made available on the fund’s Web site (funds.mfs.com), and you will be notified by mail each time a report is posted and provided with a Web site link to access the report.
If you are already signed up to receive shareholder reports by email, you will not be affected by this change and you need not take any action. You may sign up to receive shareholder reports and other communications from the fund by email by contacting your financial intermediary (such as a broker-dealer or bank) or, if you hold your shares directly with the fund, by calling 1-800-225-2606 or by logging on to MFS Access at mfs.com.
Beginning on January 1, 2019, you may elect to receive all future reports in paper free of charge. Contact your financial intermediary to request that you continue to receive paper copies of your shareholder reports. If you invest directly with the fund, you can call 1-800-225-2606 or send an email request to orderliterature@mfs.com to let the fund know that you wish to continue receiving paper copies of your shareholder reports. Your election to receive reports in paper will apply to all funds held in your account if you invest through your financial intermediary or all funds held with the MFS fund complex if you invest directly.
MCM-SEM
MFS® U.S. Government Money Market Fund
CONTENTS
The report is prepared for the general information of shareholders.
It is authorized for distribution to prospective investors only when preceded or accompanied by a current prospectus.
NOT FDIC INSURED• MAY LOSE VALUE• NO BANK GUARANTEE

LETTER FROM THE EXECUTIVE CHAIR
Dear Shareholders:
During the first quarter of 2020, market volatility reached levels not seen since the global financial crisis. Optimism heading into the year — on receding trade and
geopolitical risk along with easier central bank policies — was overwhelmed in February as the health effects of a novel coronavirus,COVID-19, spread beyond China’s borders, ultimately impacting more than 200 countries. The global pandemic prompted many governments to take drastic action to slow the spread of the virus, such as quarantines, school and business closures, and prohibitions on public gatherings. While these are important steps to protect the public health, they come at a cost: rising market volatility and an abrupt decline in economic growth.
Global central banks have taken aggressive, coordinated steps to cushion the economic and market fallout related to the virus, and
governments are undertaking unprecedented levels of fiscal stimulus. As uncertainty recedes, these measures can help create a supportive environment and encourage economic recovery. In the aftermath of the crisis, there are likely to be societal changes as households, businesses and governments adjust to a new reality and these alterations could change the investment landscape. Occurrences such as the COVID-19 outbreak demonstrate the importance of having a deep understanding of company fundamentals, and our global research platform has been built to do just that.
Here at MFS®, we aim to help our clients navigate the growing complexity of the markets and world economies. Our long-term investment philosophy and commitment to the responsible allocation of capital allow us to tune out the noise and uncover what we believe are the best, most durable investment opportunities in the market. Through our powerful global investment platform, we combine collective expertise, thoughtful risk management, and long-term discipline to create sustainable value for investors.
Respectfully,

Robert J. Manning
Executive Chair
MFS Investment Management
April 16, 2020
The opinions expressed in this letter are subject to change and may not be relied upon for investment advice. No forecasts can be guaranteed.
1
PORTFOLIO COMPOSITION
Portfolio structure (u)
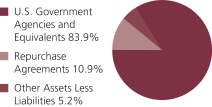
| | | | |
Composition including fixed income
credit quality (a)(u) | |
| A-1+ | | | 9.9% | |
| A-1 | | | 84.9% | |
| Other Assets Less Liabilities | | | 5.2% | |
| | | | |
| Maturity breakdown (u) | | | | |
| 0 - 7 days | | | 24.3% | |
| 8 - 29 days | | | 28.7% | |
| 30 - 59 days | | | 26.2% | |
| 60 - 89 days | | | 10.9% | |
| 90 - 365 days | | | 4.7% | |
| Other Assets Less Liabilities | | | 5.2% | |
| (a) | Ratings are assigned to portfolio securities utilizing ratings from Moody’s, Fitch, and Standard & Poor’s rating agencies and applying the following hierarchy: If all three agencies provide a rating, the middle rating (after dropping the highest and lowest ratings) is assigned; if two of the three agencies rate a security, the lower of the two is assigned. Ratings are shown in the S&P scale. All ratings are subject to change. The fund did not hold unrated securities. The fund is not rated by these agencies. |
| (u) | For purposes of this presentation, accrued interest, where applicable, is included. |
Percentages are based on net assets as of February 29, 2020.
The portfolio is actively managed and current holdings may be different.
2
EXPENSE TABLE
Fund expenses borne by the shareholders during the period, September 1, 2019 through February 29, 2020
As a shareholder of the fund, you incur two types of costs: (1) transaction costs, including sales charges (loads) on certain purchase or redemption payments, and (2) ongoing costs, including management fees; and other fund expenses. This example is intended to help you understand your ongoing costs (in dollars) of investing in the fund and to compare these costs with the ongoing costs of investing in other mutual funds.
The example is based on an investment of $1,000 invested at the beginning of the period and held for the entire period September 1, 2019 through February 29, 2020.
Actual Expenses
The first line in the following table provides information about actual account values and actual expenses. You may use the information in this line, together with the amount you invested, to estimate the expenses that you paid over the period. Simply divide your account value by $1,000 (for example, an $8,600 account value divided by $1,000 = 8.6), then multiply the result by the number in the first line under the heading entitled “Expenses Paid During Period” to estimate the expenses you paid on your account during this period.
Hypothetical Example for Comparison Purposes
The second line in the following table provides information about hypothetical account values and hypothetical expenses based on the fund’s actual expense ratio and an assumed rate of return of 5% per year before expenses, which is not the fund’s actual return. The hypothetical account values and expenses may not be used to estimate the actual ending account balance or expenses you paid for the period. You may use this information to compare the ongoing costs of investing in the fund and other funds. To do so, compare this 5% hypothetical example with the 5% hypothetical examples that appear in the shareholder reports of the other funds.
Please note that the expenses shown in the table are meant to highlight your ongoing costs only and do not reflect any transactional costs, such as sales charges (loads). Therefore, the second line in the following table is useful in comparing ongoing costs only, and will not help you determine the relative total costs of owning different funds. In addition, if these transactional costs were included, your costs would have been higher.
3
Expense Table – continued
| | | | | | | | | | | | | | | | |
| | | Annualized
Expense
Ratio | | | Beginning
Account Value
9/01/19 | | | Ending
Account Value
2/29/20 | | | Expenses
Paid During
Period (p)
9/01/19-2/29/20 | |
| Actual | | | 0.59% | | | | $1,000.00 | | | | $1,005.72 | | | | $2.94 | |
| Hypothetical (h) | | | 0.59% | | | | $1,000.00 | | | | $1,021.93 | | | | $2.97 | |
| (h) | 5% fund return per year before expenses. |
| (p) | “Expenses Paid During Period” are equal to the fund’s annualized expense ratio, as shown above, multiplied by the average account value over the period, multiplied by 182/366 (to reflect theone-half year period). Expenses paid do not include any applicable sales charges (loads). If these transaction costs had been included, your costs would have been higher. |
4
PORTFOLIO OF INVESTMENTS
2/29/20 (unaudited)
The Portfolio of Investments is a complete list of all securities owned by your fund. It is categorized by broad-based asset classes.
| | | | | | | | |
| | |
| Issuer | | Shares/Par | | | Value ($) | |
| U.S. Government Agencies and Equivalents (y) - 83.9% | |
| Fannie Mae, 1.424%, due 3/02/2020 | | $ | 16,445,000 | | | $ | 16,444,360 | |
| Fannie Mae, 1.566%, due 3/04/2020 | | | 15,701,000 | | | | 15,698,985 | |
| Fannie Mae, 1.554%, due 3/13/2020 | | | 9,555,000 | | | | 9,550,143 | |
| Fannie Mae, 1.590%, due 4/16/2020 | | | 20,000,000 | | | | 19,960,134 | |
| Federal Farm Credit Bank, 1.548%, due 3/05/2020 | | | 12,950,000 | | | | 12,947,813 | |
| Federal Farm Credit Bank, 1.568%, due 3/17/2020 | | | 39,970,000 | | | | 39,942,643 | |
| Federal Farm Credit Bank, 1.588%, due 3/19/2020 | | | 8,425,000 | | | | 8,418,428 | |
| Federal Home Loan Bank, 1.584%, due 4/03/2020 | | | 32,185,000 | | | | 32,139,123 | |
| Federal Home Loan Bank, 1.576%, due 4/08/2020 | | | 6,110,000 | | | | 6,100,036 | |
| Federal Home Loan Bank, 1.6%, due 4/15/2020 | | | 12,230,000 | | | | 12,205,999 | |
| Federal Home Loan Bank, 1.603%, due 5/06/2020 | | | 15,320,000 | | | | 15,275,904 | |
| Freddie Mac, 1.566%, due 3/09/2020 | | | 20,325,000 | | | | 20,318,044 | |
| Freddie Mac, 1.561%, due 4/08/2020 | | | 12,195,000 | | | | 12,175,305 | |
| Freddie Mac, 1.571%, due 4/30/2020 | | | 12,245,000 | | | | 12,213,571 | |
| Freddie Mac, 1.579%, due 6/17/2020 | | | 16,100,000 | | | | 16,025,376 | |
| U.S. Treasury Bill, 1.499%, due 3/12/2020 | | | 18,500,000 | | | | 18,491,690 | |
| U.S. Treasury Bill, 1.591%, due 4/14/2020 | | | 5,885,000 | | | | 5,873,772 | |
| U.S. Treasury Bill, 1.557%, due 5/14/2020 | | | 9,200,000 | | | | 9,171,161 | |
Total U.S. Government Agencies and Equivalents,
at Amortized Cost and Value | | | | | | $ | 282,952,487 | |
| | |
| Repurchase Agreements - 10.9% | | | | | | |
| JPMorgan Chase & Co. Repurchase Agreement, 1.58%, dated 2/28/2020, due 3/02/2020, total to be received $36,688,830 (secured by U.S. Treasury and Federal Agency obligations valued at $37,422,607 in a jointly traded account), at Cost and Value | | $ | 36,684,000 | | | $ | 36,684,000 | |
| | |
| Other Assets, Less Liabilities - 5.2% | | | | | 17,438,439 | |
| Net Assets - 100.0% | | | | | | $ | 337,074,926 | |
| (y) | The rate shown represents an annualized yield at time of purchase. |
See Notes to Financial Statements
5
Financial Statements
STATEMENT OF ASSETS AND LIABILITIES
At 2/29/20 (unaudited)
This statement represents your fund’s balance sheet, which details the assets and liabilities comprising the total value of the fund.
| | | | |
| Assets | | | | |
Investments in unaffiliated issuers, at cost and value | | | $282,952,487 | |
Investments in unaffiliated repurchase agreements, at cost and value | | | 36,684,000 | |
Cash | | | 569 | |
Receivables for | | | | |
Fund shares sold | | | 20,613,175 | |
Interest | | | 3,220 | |
Other assets | | | 1,283 | |
Total assets | | | $340,254,734 | |
| |
| Liabilities | | | | |
Payables for | | | | |
Distributions | | | $42,174 | |
Fund shares reacquired | | | 3,000,993 | |
Payable to affiliates | | | | |
Investment adviser | | | 10,192 | |
Administrative services fee | | | 433 | |
Shareholder servicing costs | | | 98,559 | |
Payable for independent Trustees’ compensation | | | 4,213 | |
Accrued expenses and other liabilities | | | 23,244 | |
Total liabilities | | | $3,179,808 | |
Net assets | | | $337,074,926 | |
| |
| Net assets consist of | | | | |
Paid-in capital | | | $337,048,205 | |
Total distributable earnings (loss) | | | 26,721 | |
Net assets | | | $337,074,926 | |
Shares of beneficial interest outstanding | | | 337,074,877 | |
Net asset value per share (net assets of $337,074,926 / 337,074,877 shares of beneficial interest outstanding) | | | $1.00 | |
A contingent deferred sales charge may be imposed on redemptions.
See Notes to Financial Statements
6
Financial Statements
STATEMENT OF OPERATIONS
Six months ended 2/29/20 (unaudited)
This statement describes how much your fund earned in investment income and accrued in expenses. It also describes any gains and/or losses generated by fund operations.
| | | | |
| Net investment income (loss) | | | | |
Income | | | | |
Interest | | | $2,645,994 | |
Expenses | | | | |
Management fee | | | $610,152 | |
Shareholder servicing costs | | | 198,768 | |
Administrative services fee | | | 25,021 | |
Independent Trustees’ compensation | | | 4,987 | |
Custodian fee | | | 7,267 | |
Shareholder communications | | | 7,421 | |
Audit and tax fees | | | 19,436 | |
Legal fees | | | 1,319 | |
Miscellaneous | | | 46,096 | |
Total expenses | | | $920,467 | |
Fees paid indirectly | | | (7,267 | ) |
Reduction of expenses by investment adviser | | | (15,469 | ) |
Net expenses | | | $897,731 | |
Net investment income (loss) | | | $1,748,263 | |
Change in net assets from operations | | | $1,748,263 | |
See Notes to Financial Statements
7
Financial Statements
STATEMENTS OF CHANGES IN NET ASSETS
These statements describe the increases and/or decreases in net assets resulting from operations, any distributions, and any shareholder transactions.
| | | | | | | | |
| Change in net assets | | Six months ended
2/29/20
(unaudited) | | | Year ended
8/31/19 | |
| | |
| From operations | | | | | | | | |
Net investment income (loss) | | | $1,748,263 | | | | $4,944,294 | |
Net realized gain (loss) | | | — | | | | 49 | |
Change in net assets from operations | | | $1,748,263 | | | | $4,944,343 | |
Total distributions to shareholders | | | $(1,748,263 | ) | | | $(4,944,294 | ) |
Change in net assets from fund share transactions | | | $33,276,039 | | | | $39,428,695 | |
Total change in net assets | | | $33,276,039 | | | | $39,428,744 | |
| | |
| Net assets | | | | | | | | |
At beginning of period | | | 303,798,887 | | | | 264,370,143 | |
At end of period | | | $337,074,926 | | | | $303,798,887 | |
See Notes to Financial Statements
8
Financial Statements
FINANCIAL HIGHLIGHTS
The financial highlights table is intended to help you understand the fund’s financial performance for the semiannual period and the past 5 fiscal years. Certain information reflects financial results for a single fund share. The total returns in the table represent the rate that an investor would have earned (or lost) on an investment in the fund share class (assuming reinvestment of all distributions) held for the entire period.
| | | | | | | | | | | | | | | | | | | | | | | | |
| | | Six months
ended 2/29/20 | | | Year ended | |
| | | 8/31/19 | | | 8/31/18 | | | 8/31/17 | | | 8/31/16 | | | 8/31/15 | |
| | | (unaudited) | | | | | | | | | | | | | | | | |
Net asset value, beginning of period | | | $1.00 | | | | $1.00 | | | | $1.00 | | | | $1.00 | | | | $1.00 | | | | $1.00 | |
| | | |
| Income (loss) from investment operations | | | | | | | | | | | | | |
Net investment income (loss) (d) | | | $0.01 | | | | $0.02 | | | | $0.01 | | | | $0.00 | (c)(w) | | | $0.00 | | | | $0.00 | |
Net realized and unrealized gain (loss) | | | — | | | | 0.00 | (w) | | | — | | | | (0.00 | )(w) | | | (0.00 | )(w) | | | (0.00 | )(w) |
Total from investment operations | | | $0.01 | | | | $0.02 | | | | $0.01 | | | | $0.00 | (w) | | | $(0.00 | )(w) | | | $(0.00 | )(w) |
| | | |
| Less distributions declared to shareholders | | | | | | | | | | | | | |
From net investment income | | | $(0.01 | ) | | | $(0.02 | ) | | | $(0.01 | ) | | | $(0.00 | )(w) | | | $— | | | | $— | |
Contribution from adviser | | | $— | | | | $— | | | | $(0.00 | )(w) | | | $— | | | | $— | | | | $— | |
Net asset value, end of period | | | $1.00 | | | | $1.00 | | | | $1.00 | | | | $1.00 | | | | $1.00 | | | | $1.00 | |
Total return (%) (r)(t) | | | 0.57 | (n) | | | 1.70 | | | | 0.83 | | | | 0.17 | (c) | | | 0.00 | (w) | | | 0.00 | (w) |
| | | |
Ratios (%) (to average net assets)
and Supplemental data: | | | | | | | | | | | | | |
Expenses before expense reductions (f) | | | 0.60 | (a) | | | 0.62 | | | | 0.63 | | | | 0.56 | (c) | | | 0.61 | | | | 0.62 | |
Expenses after expense reductions (f) | | | 0.59 | (a) | | | 0.61 | | | | 0.62 | | | | 0.43 | (c) | | | 0.23 | | | | 0.07 | |
Net investment income (loss) | | | 1.15 | (a) | | | 1.69 | | | | 0.81 | | | | 0.17 | (c) | | | 0.00 | | | | 0.00 | |
Net assets at end of period (000 omitted) | | | $337,075 | | | | $303,799 | | | | $264,370 | | | | $307,591 | | | | $320,847 | | | | $371,489 | |
| (c) | Amount reflects aone-time reimbursement of expenses by the custodian (or former custodian) without which net investment income and performance would be lower and expenses would be higher. |
| (d) | Per share data is based on average shares outstanding. |
| (f) | Ratios do not reflect reductions from fees paid indirectly, if applicable. |
| (r) | Certain expenses have been reduced without which performance would have been lower. |
| (t) | Total returns do not include any applicable sales charges. |
| (w) | Per share amount was less than $0.01 and total return or ratio was less than 0.01%, as applicable. |
See Notes to Financial Statements
9
NOTES TO FINANCIAL STATEMENTS
(unaudited)
(1) Business and Organization
MFS U.S. Government Money Market Fund (the fund) is a diversified series of MFS Series Trust IV (the trust). The trust is organized as a Massachusetts business trust and is registered under the Investment Company Act of 1940, as amended, as anopen-end management investment company.
The fund is an investment company and accordingly follows the investment company accounting and reporting guidance of the Financial Accounting Standards Board (FASB) Accounting Standards Codification Topic 946 Financial Services – Investment Companies.
(2) Significant Accounting Policies
General– The preparation of financial statements in conformity with U.S. generally accepted accounting principles requires management to make estimates and assumptions that affect the reported amounts of assets and liabilities, and disclosure of contingent assets and liabilities at the date of the financial statements and the reported amounts of increases and decreases in net assets from operations during the reporting period. Actual results could differ from those estimates. In the preparation of these financial statements, management has evaluated subsequent events occurring after the date of the fund’s Statement of Assets and Liabilities through the date that the financial statements were issued.
Balance Sheet Offsetting– The fund’s accounting policy with respect to balance sheet offsetting is that, absent an event of default by the counterparty or a termination of the agreement, the International Swaps and Derivatives Association (ISDA) Master Agreement, or similar agreement, does not result in an offset of reported amounts of financial assets and financial liabilities in the Statement of Assets and Liabilities across transactions between the fund and the applicable counterparty. The fund’s right to setoff may be restricted or prohibited by the bankruptcy or insolvency laws of the particular jurisdiction to which a specific master netting agreement counterparty is subject. Balance sheet offsetting disclosures, to the extent applicable to the fund, have been included in the fund’s Significant Accounting Policies note under the captions for each of the fund’sin-scope financial instruments and transactions.
Investment Valuations– Pursuant to procedures approved by the Board of Trustees, investments held by the fund are generally valued at amortized cost, which approximates market value. Amortized cost involves valuing an instrument at its cost as adjusted for amortization of premium or accretion of discount rather than its current market value. The amortized cost value of an instrument can be different from the market value of an instrument.
Various inputs are used in determining the value of the fund’s assets or liabilities. These inputs are categorized into three broad levels. In certain cases, the inputs used to measure fair value may fall into different levels of the fair value hierarchy. In such cases, an investment’s level within the fair value hierarchy is based on the lowest level of input that is significant to the fair value measurement. The fund’s assessment of the significance of a particular input to the fair value measurement in its entirety requires judgment, and considers factors specific to the investment. Level 1 includes unadjusted
10
Notes to Financial Statements (unaudited) – continued
quoted prices in active markets for identical assets or liabilities. Level 2 includes other significant observable market-based inputs (including quoted prices for similar securities, interest rates, prepayment speed, and credit risk). Level 3 includes unobservable inputs, which may include the adviser’s own assumptions in determining the fair value of investments. The following is a summary of the levels used as of February 29, 2020 in valuing the fund’s assets or liabilities:
| | | | | | | | | | | | | | | | |
| | | | |
| Financial Instruments | | Level 1 | | | Level 2 | | | Level 3 | | | Total | |
| Short-Term Securities | | | $— | | | | $319,636,487 | | | | $— | | | | $319,636,487 | |
For further information regarding security characteristics, see the Portfolio of Investments.
Repurchase Agreements– The fund enters into repurchase agreements under the terms of Master Repurchase Agreements with approved counterparties. Each repurchase agreement is recorded at cost. The fund requires that the securities collateral in a repurchase transaction be transferred to a custodian. The fund monitors, on a daily basis, the value of the collateral to ensure that its value, including accrued interest, is greater than amounts owed to the fund under each such repurchase agreement. Upon an event of default under a Master Repurchase Agreement, thenon-defaulting party may close out all transactions traded under such agreement and net amounts owed under each transaction to one net amount payable by one party to the other. Absent an event of default, the Master Repurchase Agreement does not result in an offset of reported amounts of assets and liabilities in the Statement of Assets and Liabilities across transactions between the fund and the applicable counterparty. The fund and other funds managed by MFS may utilize a joint trading account for the purpose of entering into one or more repurchase agreements. At February 29, 2020, the fund had investments in repurchase agreements with a gross value of $36,684,000 included in investments in unaffiliated repurchase agreements in the Statement of Assets and Liabilities. The value of the related collateral exceeded the value of the repurchase agreements at period end.
Indemnifications– Under the fund’s organizational documents, its officers and Trustees may be indemnified against certain liabilities and expenses arising out of the performance of their duties to the fund. Additionally, in the normal course of business, the fund enters into agreements with service providers that may contain indemnification clauses. The fund’s maximum exposure under these agreements is unknown as this would involve future claims that may be made against the fund that have not yet occurred.
Investment Transactions and Income– Investment transactions are recorded on the trade date. Interest income is recorded on the accrual basis. All premium and discount is amortized or accreted for financial statement purposes in accordance with U.S. generally accepted accounting principles.
Fees Paid Indirectly– The fund’s custody fee may be reduced by credits earned under a previous arrangement that measured the value of U.S. dollars deposited with the custodian by the fund. The amount of the credits that were used to reduce the fund’s custody fee for the six months ended February 29, 2020, is shown as a reduction of total expenses in the Statement of Operations.
11
Notes to Financial Statements (unaudited) – continued
Tax Matters and Distributions– The fund intends to qualify as a regulated investment company, as defined under Subchapter M of the Internal Revenue Code, and to distribute all of its taxable income, including realized capital gains. As a result, no provision for federal income tax is required. The fund’s federal tax returns, when filed, will remain subject to examination by the Internal Revenue Service for a three year period. Management has analyzed the fund’s tax positions taken on federal and state tax returns for all open tax years and does not believe that there are any uncertain tax positions that require recognition of a tax liability.
Distributions to shareholders are recorded on theex-dividend date. Income and capital gain distributions are determined in accordance with income tax regulations, which may differ from U.S. generally accepted accounting principles. Certain capital accounts in the financial statements are periodically adjusted for permanent differences in order to reflect their tax character. These adjustments have no impact on net assets or net asset value per share. Temporary differences which arise from recognizing certain items of income, expense, gain or loss in different periods for financial statement and tax purposes will reverse at some time in the future.
Book/tax differences primarily relate to treating a portion of the proceeds from redemptions as a distribution for tax purposes.
The tax character of distributions made during the current period will be determined at fiscal year end. The tax character of distributions declared to shareholders for the last fiscal year is as follows:
| | | | |
| |
| | | Year ended
8/31/19 | |
Ordinary income (including any
short-term capital gains) | | | $4,944,294 | |
The federal tax cost and the tax basis components of distributable earnings were as follows:
| | | | |
| |
| As of 2/29/20 | | | |
| |
| Cost of investments | | | $319,636,487 | |
| |
| As of 8/31/19 | | | |
| |
| Undistributed ordinary income | | | 99,872 | |
| Capital loss carryforwards | | | (537 | ) |
| Other temporary differences | | | (72,614 | ) |
The aggregate cost above includes prior fiscal year end tax adjustments, if applicable.
As of August 31, 2019, the fund had capital loss carryforwards available to offset future realized gains. These net capital losses may be carried forward indefinitely and their character is retained as short-term and/or long-term losses. Such losses are characterized as follows:
12
Notes to Financial Statements (unaudited) – continued
(3) Transactions with Affiliates
Investment Adviser– The fund has an investment advisory agreement with MFS to provide overall investment management and related administrative services and facilities to the fund. The management fee is computed daily and paid monthly at the following annual rates based on the fund’s average daily net assets:
| | | | |
| Up to $1 billion | | | 0.40 | % |
| In excess of $1 billion | | | 0.35 | % |
MFS has agreed in writing to reduce its management fee by a specified amount if certain MFS mutual fund assets exceed thresholds agreed to by MFS and the fund’s Board of Trustees. For the six months ended February 29, 2020, this management fee reduction amounted to $15,469, which is included in the reduction of total expenses in the Statement of Operations. The management fee incurred for the six months ended February 29, 2020 was equivalent to an annual effective rate of 0.39% of the fund’s average daily net assets.
Distributor– Certain shares acquired through an exchange may be subject to a contingent deferred sales charge upon redemption depending on when the shares exchanged were originally purchased. Contingent deferred sales charges paid to MFS Distributors, Inc. (MFD) during the six months ended February 29, 2020 were $620.
Shareholder Servicing Agent– MFS Service Center, Inc. (MFSC), a wholly-owned subsidiary of MFS, receives a fee from the fund for its services as shareholder servicing agent calculated as a percentage of the average daily net assets of the fund as determined periodically under the supervision of the fund’s Board of Trustees. For the six months ended February 29, 2020, the fee was $81,036, which equated to
0.0531% annually of the fund’s average daily net assets. MFSC also receives payment from the fund forout-of-pocket expenses,sub-accounting and other shareholder servicing costs which may be paid to affiliated and unaffiliated service providers. For the six months ended February 29, 2020, theseout-of-pocket expenses,sub-accounting and other shareholder servicing costs amounted to $117,732.
Administrator– MFS provides certain financial, legal, shareholder communications, compliance, and other administrative services to the fund. Under an administrative services agreement, the fund reimburses MFS the costs incurred to provide these services. The fund is charged an annual fixed amount of $17,500 plus a fee based on average daily net assets. The administrative services fee incurred for the six months ended February 29, 2020 was equivalent to an annual effective rate of 0.0164% of the fund’s average daily net assets.
Trustees’ and Officers’ Compensation– The fund pays compensation to independent Trustees in the form of a retainer, attendance fees, and additional compensation to Board and Committee chairpersons. The fund does not pay compensation directly to Trustees or officers of the fund who are also officers of the investment adviser, all of whom receive remuneration from MFS for their services to the fund. Certain officers and Trustees of the fund are officers or directors of MFS, MFD, and MFSC.
Prior to December 31, 2001, the fund had an unfunded defined benefit plan (“DB plan”) for independent Trustees. As of December 31, 2001, the Board took action to terminate the DB plan with respect to then-current and any future independent
13
Notes to Financial Statements (unaudited) – continued
Trustees, such that the DB plan covers only certain of those former independent Trustees who retired on or before December 31, 2001. The DB plan resulted in a pension expense of $109 and is included in “Independent Trustees’ compensation” in the Statement of Operations for the six months ended February 29, 2020. The liability for deferred retirement benefits payable to those former independent Trustees under the DB plan amounted to $3,436 at February 29, 2020, and is included in “Payable for independent Trustees’ compensation” in the Statement of Assets and Liabilities.
(4) Shares of Beneficial Interest
The fund’s Declaration of Trust permits the Trustees to issue an unlimited number of full and fractional shares of beneficial interest. The number of shares sold, reinvested and reacquired corresponds to the net proceeds from the sale of shares, reinvestment of distributions and cost of shares reacquired, respectively, since shares are sold and reacquired at $1.00 per share. Transactions in fund shares were as follows:
| | | | | | | | |
| | | Six months ended
2/29/20 | | | Year ended
8/31/19 | |
| Shares sold | | | 111,507,901 | | | | 210,809,484 | |
| Shares issued to shareholders in reinvestment of distributions | | | 1,431,453 | | | | 4,144,578 | |
| Shares reacquired | | | (79,663,315 | ) | | | (175,525,367 | ) |
| Net change | | | 33,276,039 | | | | 39,428,695 | |
(5) Line of Credit
The fund and certain other funds managed by MFS participate in a $1.25 billion unsecured committed line of credit, subject to a $1 billion sublimit, provided by a syndicate of banks under a credit agreement. Borrowings may be made for temporary financing needs. Interest is charged to each fund, based on its borrowings, generally at a rate equal to the highest of one month LIBOR, the Federal Funds Effective Rate and the Overnight Bank Funding Rate, plus an agreed upon spread. A commitment fee, based on the average daily, unused portion of the committed line of credit, is allocated among the participating funds. In addition, the fund and other funds managed by MFS have established unsecured uncommitted borrowing arrangements with certain banks for temporary financing needs. Interest is charged to each fund, based on its borrowings, at rates equal to customary reference rates plus an agreed upon spread. For the six months ended February 29, 2020, the fund’s commitment fee and interest expense were $786 and $0, respectively, and are included in “Miscellaneous” expense in the Statement of Operations.
(6) Impacts of COVID-19
The pandemic related to the global spread of novel coronavirus disease (COVID-19), which was first detected in December 2019, has resulted in significant disruptions to global business activity and the global economy, as well as the economies of individual countries, the financial performance of individual companies and sectors, and the securities and commodities markets in general. This pandemic, the full effects of which are still unknown, has resulted in substantial market volatility and may have adversely impacted the prices and liquidity of the fund’s investments and the fund’s performance during the period February 29, 2020 through April 16, 2020, the date that these financial statements were issued.
14
Notes to Financial Statements (unaudited) – continued
(7) Subsequent Event
Effective the close of business May 29, 2020, purchases of the fund are closed to new and existing investors subject to certain exceptions. Please see the fund’s prospectus for details.
15
PROXY VOTING POLICIES AND INFORMATION
MFS votes proxies on behalf of the fund pursuant to proxy voting policies and procedures that are available without charge, upon request, by calling1-800-225-2606, by visitingmfs.com/proxyvoting, or by visiting the SEC’s Web site athttp://www.sec.gov.
Information regarding how the fund voted proxies relating to portfolio securities during the most recent twelve-month period ended June 30 is available by August 31 of each year without charge by visitingmfs.com/proxyvoting, or by visiting the SEC’s Web site athttp://www.sec.gov.
PORTFOLIO HOLDINGS INFORMATION
The fund files monthly portfolio information with the SEC on Form N-MFP. The fund’s Form N-MFP reports are available on the SEC’s website athttp://www.sec.gov. A shareholder can also access the fund’s portfolio holdings as of each month end and the fund’s Form N-MFP reports atmfs.com/openendfunds after choosing “Click here for access to Money Market fund reports”.
FURTHER INFORMATION
From time to time, MFS may post important information about the fund or the MFS funds on the MFS web site (mfs.com). This information is available athttps://www.mfs.com/en-us/what-we-do/announcements.html or atmfs.com/openendfunds by choosing the fund’s name.
INFORMATION ABOUT FUND CONTRACTS AND LEGAL CLAIMS
The fund has entered into contractual arrangements with an investment adviser, administrator, distributor, shareholder servicing agent, 529 program manager (if applicable), and custodian who each provide services to the fund. Unless expressly stated otherwise, shareholders are not parties to, or intended beneficiaries of these contractual arrangements, and these contractual arrangements are not intended to create any shareholder right to enforce them against the service providers or to seek any remedy under them against the service providers, either directly or on behalf of the fund.
Under the Trust’s By-Laws and Declaration of Trust, any claims asserted against or on behalf of the MFS Funds, including claims against Trustees and Officers, must be brought in state and federal courts located within the Commonwealth of Massachusetts.
PROVISION OF FINANCIAL REPORTS AND SUMMARY PROSPECTUSES
The fund produces financial reports every six months and updates its summary prospectus and prospectus annually. To avoid sending duplicate copies of materials to households, only one copy of the fund’s annual and semiannual report and summary prospectus may be mailed to shareholders having the same last name and residential address on the fund’s records. However, any shareholder may contact MFSC (please see back cover for address and telephone number) to request that copies of these reports and summary prospectuses be sent personally to that shareholder.
16
Save paper with eDelivery.

| MFS® will send you prospectuses, |
reports, and proxies directly viae-mail so you will get information faster with less mailbox clutter.
To sign up:
1. Go to mfs.com.
2. Log in via MFS® Access.
3. Select eDelivery.
If you own your MFS fund shares through a financial institution or a retirement plan, MFS® TALK, MFS® Access, or eDelivery may not be available to you.
CONTACT
WEB SITE
mfs.com
MFS TALK
1-800-637-8255
24 hours a day
ACCOUNT SERVICE AND LITERATURE
Shareholders
1-800-225-2606
Financial advisors
1-800-343-2829
Retirement plan services
1-800-637-1255
MAILING ADDRESS
MFS Service Center, Inc.
P.O. Box 219341
Kansas City, MO 64121-9341
OVERNIGHT MAIL
MFS Service Center, Inc.
Suite 219341
430 W 7th Street
Kansas City, MO 64105-1407
During the period covered by this report, the Registrant has not amended any provision in its Code of Ethics (the “Code”) that relates to an element of the Code’s definitions enumerated in paragraph (b) of Item 2 of this FormN-CSR. During the period covered by this report, the Registrant did not grant a waiver, including an implicit waiver, from any provision of the Code.
| ITEM 3. | AUDIT COMMITTEE FINANCIAL EXPERT. |
Not applicable for semi-annual reports.
| ITEM 4. | PRINCIPAL ACCOUNTANT FEES AND SERVICES. |
Not applicable for semi-annual reports.
| ITEM 5. | AUDIT COMMITTEE OF LISTED REGISTRANTS. |
Not applicable to the Registrant.
A schedule of investments for each series of the Registrant is included as part of the report to shareholders of such series under Item 1 of this FormN-CSR.
| ITEM 7. | DISCLOSURE OF PROXY VOTING POLICIES AND PROCEDURES FORCLOSED-END MANAGEMENT INVESTMENT COMPANIES. |
Not applicable to the Registrant.
| ITEM 8. | PORTFOLIO MANAGERS OFCLOSED-END MANAGEMENT INVESTMENT COMPANIES. |
Not applicable to the Registrant.
| ITEM 9. | PURCHASES OF EQUITY SECURITIES BYCLOSED-END MANAGEMENT INVESTMENT COMPANY AND AFFILIATED PURCHASERS. |
Not applicable to the Registrant.
| ITEM 10. | SUBMISSION OF MATTERS TO A VOTE OF SECURITY HOLDERS. |
There were no material changes to the procedures by which shareholders may send recommendations to the Board for nominees to the Registrant’s Board since the Registrant last provided disclosure as to such procedures in response to the requirements of Item 407 (c)(2)(iv) of RegulationS-K or this Item.
| ITEM 11. | CONTROLS AND PROCEDURES. |
| (a) | Based upon their evaluation of the effectiveness of the registrant’s disclosure controls and procedures (as defined in Rule30a-3(c) under the Investment Company Act of 1940 (the “Act”)) as conducted within 90 days of the filing date of this report on FormN-CSR, the registrant’s principal financial officer and principal executive officer have concluded that those disclosure controls and procedures provide reasonable assurance that the material information required to be disclosed by the registrant on this report is recorded, processed, summarized and reported within the time periods specified in the Securities and Exchange Commission’s rules and forms. |
| (b) | There were no changes in the registrant’s internal controls over financial reporting (as defined in Rule30a-3(d) under the Act) that occurred during the period covered by the report that have materially affected, or are reasonably likely to materially affect, the registrant’s internal control over financial reporting. |
| ITEM 12. | DISCLOSURE OF SECURITIES LENDING ACTIVITIES FORCLOSED-END MANAGEMENT INVESTMENT COMPANIES. |
Not applicable to the Registrant.
| (a) | File the exhibits listed below as part of this form. Letter or number the exhibits in the sequence indicated. |
| | (1) | Any code of ethics, or amendment thereto, that is the subject of the disclosure required by Item 2, to the extent that the registrant intends to satisfy the Item 2 requirements through filing of an exhibit. Not applicable. |
| | (2) | A separate certification for each principal executive officer and principal financial officer of the registrant as required by Rule30a-2(a) under the Act (17 CFR270.30a-2): Attached hereto asEX-99.302CERT. |
| | (3) | Any written solicitation to purchase securities under Rule23c-1 under the Act (17 CFR270.23c-1) sent or given during the period covered by the report by or on behalf of the registrant to 10 or more persons. Not applicable. |
| | (4) | Change in the registrant’s independent public accountant. Not applicable. |
| (b) | If the report is filed under Section 13(a) or 15(d) of the Exchange Act, provide the certifications required by Rule30a-2(b) under the Act (17 CFR270.30a-2(b)), Rule13a-14(b) or Rule15d-14(b) under the Exchange Act (17 CFR240.13a-14(b) or240.15d-14(b)) and Section 1350 of Chapter 63 of Title 18 of the United States Code (18 U.S.C. 1350) as an exhibit. A certification furnished pursuant to this paragraph will not be deemed “filed” for the purposes of Section 18 of the Exchange Act (15 U.S.C. 78r), |
| | or otherwise subject to the liability of that section. Such certification will not be deemed to be incorporated by reference into any filing under the Securities Act of 1933 or the Exchange Act, except to the extent that the registrant specifically incorporates it by reference: Attached hereto asEX-99.906CERT. |
Notice
A copy of the Amended and Restated Declaration of Trust, as amended, of the Registrant is on file with the Secretary of State of The Commonwealth of Massachusetts and notice is hereby given that this instrument is executed on behalf of the Registrant by an officer of the Registrant as an officer and not individually and the obligations of or arising out of this instrument are not binding upon any of the Trustees or shareholders individually, but are binding only upon the assets and property of the respective constituent series of the Registrant.
SIGNATURES
Pursuant to the requirements of the Securities Exchange Act of 1934 and the Investment Company Act of 1940, the registrant has duly caused this report to be signed on its behalf by the undersigned, thereunto duly authorized.
(Registrant) MFS SERIES TRUST IV
| | |
| By (Signature and Title)* | | DAVID L. DILORENZO |
| | David L. DiLorenzo, President |
Date: April 16, 2020
Pursuant to the requirements of the Securities Exchange Act of 1934 and the Investment Company Act of 1940, this report has been signed below by the following persons on behalf of the registrant and in the capacities and on the dates indicated.
| | |
| By (Signature and Title)* | | DAVID L. DILORENZO |
| | David L. DiLorenzo, President (Principal Executive Officer) |
Date: April 16, 2020
| | |
| By (Signature and Title)* | | JAMES O. YOST |
| | James O. Yost, Treasurer (Principal Financial Officer and Accounting Officer) |
Date: April 16, 2020
| * | Print name and title of each signing officer under his or her signature. |