UNITED STATES
SECURITIES AND EXCHANGE COMMISSION
Washington, D.C. 20549
FORM N-CSR
CERTIFIED SHAREHOLDER REPORT OF
REGISTERED MANAGEMENT INVESTMENT COMPANIES
Investment Company Act file number 811-02594
MFS SERIES TRUST IV
(Exact name of registrant as specified in charter)
111 Huntington Avenue, Boston, Massachusetts 02199
(Address of principal executive offices) (Zip code)
Christopher R. Bohane
Massachusetts Financial Services Company
111 Huntington Avenue
Boston, Massachusetts 02199
(Name and address of agents for service)
Registrant’s telephone number, including area code: (617) 954-5000
Date of fiscal year end: August 31
Date of reporting period: February 28, 2021
| ITEM 1. | REPORTS TO STOCKHOLDERS. |
1(a):

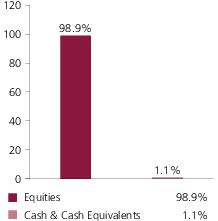
Equity Fund

Equity Fund
| 1 | |
| 2 | |
| 4 | |
| 6 | |
| 13 | |
| 15 | |
| 16 | |
| 17 | |
| 26 | |
| 37 | |
| 37 | |
| 37 | |
| 37 | |
| 37 |
| back cover |


| Taiwan Semiconductor Manufacturing Co. Ltd. | 7.5% |
| Tencent Holdings Ltd. | 6.8% |
| Samsung Electronics Co. Ltd. | 5.4% |
| Alibaba Group Holding Ltd., ADR | 4.5% |
| Infosys Ltd. | 1.9% |
| China Construction Bank | 1.9% |
| Meituan, “B” | 1.7% |
| JD.com, Inc., ADR | 1.7% |
| NetEase.com, Inc., ADR | 1.4% |
| Sberbank of Russia PJSC, ADR | 1.4% |
| Information Technology | 21.4% |
| Consumer Discretionary | 17.7% |
| Financials | 16.9% |
| Communication Services | 12.4% |
| Materials | 7.0% |
| Consumer Staples | 5.8% |
| Industrials | 4.7% |
| Energy | 4.7% |
| Health Care | 3.5% |
| Real Estate | 2.6% |
| Utilities | 1.3% |
| China | 38.6% |
| Taiwan | 14.4% |
| South Korea | 13.5% |
| India | 8.4% |
| Russia | 3.8% |
| Brazil | 3.7% |
| South Africa | 3.6% |
| Mexico | 2.6% |
| United States | 2.5% |
| Other Countries | 8.9% |
| Hong Kong Dollar | 33.9% |
| Taiwan Dollar | 14.4% |
| South Korean Won | 13.5% |
| Indian Rupee | 8.2% |
| United States Dollar | 4.3% |
| Chinese Renminbi | 4.1% |
| Russian Ruble | 3.8% |
| Brazilian Real | 3.7% |
| South African Rand | 3.6% |
| Other Currencies | 10.5% |
| (g) | The Global Industry Classification Standard (GICS®) was developed by and/or is the exclusive property of MSCI, Inc. and S&P Global Market Intelligence Inc. (“S&P Global Market Intelligence”). GICS is a service mark of MSCI and S&P Global Market Intelligence and has been licensed for use by MFS. MFS has applied its own internal sector/industry classification methodology for equity securities and non-equity securities that are unclassified by GICS. |
| (x) | Represents the portfolio’s exposure to issuer countries as a percentage of a portfolio’s net assets. For purposes of this presentation, United States includes Cash & Cash Equivalents. |
| (y) | Represents the portfolio’s exposure to a particular currency as a percentage of a portfolio's net assets. For purposes of this presentation, United States Dollar includes Cash & Cash Equivalents. |
September 1, 2020 through February 28, 2021
| Share Class | Annualized Expense Ratio | Beginning Account Value 9/01/20 | Ending Account Value 2/28/21 | Expenses Paid During Period (p) 9/01/20-2/28/21 | |
| A | Actual | 1.24% | $1,000.00 | $1,219.67 | $6.82 |
| Hypothetical (h) | 1.24% | $1,000.00 | $1,018.65 | $6.21 | |
| B | Actual | 1.99% | $1,000.00 | $1,214.94 | $10.93 |
| Hypothetical (h) | 1.99% | $1,000.00 | $1,014.93 | $9.94 | |
| C | Actual | 1.99% | $1,000.00 | $1,214.94 | $10.93 |
| Hypothetical (h) | 1.99% | $1,000.00 | $1,014.93 | $9.94 | |
| I | Actual | 0.99% | $1,000.00 | $1,221.33 | $5.45 |
| Hypothetical (h) | 0.99% | $1,000.00 | $1,019.89 | $4.96 | |
| R1 | Actual | 1.99% | $1,000.00 | $1,214.90 | $10.93 |
| Hypothetical (h) | 1.99% | $1,000.00 | $1,014.93 | $9.94 | |
| R2 | Actual | 1.49% | $1,000.00 | $1,218.16 | $8.19 |
| Hypothetical (h) | 1.49% | $1,000.00 | $1,017.41 | $7.45 | |
| R3 | Actual | 1.24% | $1,000.00 | $1,219.86 | $6.83 |
| Hypothetical (h) | 1.24% | $1,000.00 | $1,018.65 | $6.21 | |
| R4 | Actual | 0.99% | $1,000.00 | $1,221.35 | $5.45 |
| Hypothetical (h) | 0.99% | $1,000.00 | $1,019.89 | $4.96 | |
| R6 | Actual | 0.90% | $1,000.00 | $1,222.01 | $4.96 |
| Hypothetical (h) | 0.90% | $1,000.00 | $1,020.33 | $4.51 |
| (h) | 5% class return per year before expenses. |
| (p) | “Expenses Paid During Period” are equal to each class’s annualized expense ratio, as shown above, multiplied by the average account value over the period, multiplied by 181/365 (to reflect the one-half year period). Expenses paid do not include any applicable sales charges (loads). If these transaction costs had been included, your costs would have been higher. |
| Issuer | Shares/Par | Value ($) | ||
| Common Stocks – 97.3% | ||||
| Alcoholic Beverages – 0.8% | ||||
| China Resources Beer Holdings Co. Ltd. | 32,000 | $ 242,413 | ||
| Jiangsu Yanghe Brewery JSC Ltd. | 3,200 | 93,622 | ||
| Thai Beverage PLC | 163,300 | 89,655 | ||
| $425,690 | ||||
| Apparel Manufacturers – 1.4% | ||||
| Bosideng International Holdings Ltd. | 224,000 | $ 94,658 | ||
| Shenzhou International Group Holdings Ltd. | 29,800 | 624,713 | ||
| $719,371 | ||||
| Automotive – 4.0% | ||||
| BAIC Motor Corp. Ltd., “H” | 241,000 | $ 86,377 | ||
| Great Wall Motor Co. Ltd. | 32,000 | 92,737 | ||
| Hero MotoCorp Ltd. | 10,935 | 478,481 | ||
| Kia Motors Corp. | 4,105 | 290,108 | ||
| Mahindra & Mahindra Ltd. | 10,138 | 112,459 | ||
| Maruti Suzuki India Ltd. | 1,021 | 95,540 | ||
| Sinotruk Hong Kong Ltd. | 73,500 | 234,531 | ||
| Yadea Group Holdings Ltd. | 42,000 | 91,403 | ||
| Zhengzhou Yutong Bus Co. Ltd., “A” | 146,990 | 345,404 | ||
| Zhongsheng Group Holdings Ltd. | 34,500 | 213,142 | ||
| $2,040,182 | ||||
| Biotechnology – 0.9% | ||||
| Hugel, Inc. (a) | 1,091 | $ 167,024 | ||
| Seegene, Inc. | 1,004 | 111,258 | ||
| WuXi Biologics (Cayman), Inc. (a) | 13,500 | 167,174 | ||
| $445,456 | ||||
| Brokerage & Asset Managers – 0.9% | ||||
| B3 Brasil Bolsa Balcao S.A. | 22,100 | $ 214,130 | ||
| Moscow Exchange MICEX-RTS PJSC | 99,240 | 230,256 | ||
| $444,386 | ||||
| Business Services – 2.1% | ||||
| HCL Technologies Ltd. | 9,040 | $ 112,705 | ||
| Infosys Ltd. | 57,775 | 979,834 | ||
| $1,092,539 | ||||
| Computer Software – 0.6% | ||||
| Kingsoft Corp. | 45,000 | $ 316,907 | ||
| Issuer | Shares/Par | Value ($) | ||
| Common Stocks – continued | ||||
| Computer Software - Systems – 7.5% | ||||
| EPAM Systems, Inc. (a) | 595 | $ 222,298 | ||
| Hon Hai Precision Industry Co. Ltd. | 140,000 | 564,711 | ||
| Samsung Electronics Co. Ltd. | 37,893 | 2,778,935 | ||
| Wistron Corp. | 223,000 | 256,207 | ||
| $3,822,151 | ||||
| Conglomerates – 0.2% | ||||
| CITIC Pacific Ltd. | 122,000 | $ 103,198 | ||
| Construction – 2.0% | ||||
| Anhui Conch Cement Co. Ltd. | 51,000 | $ 328,101 | ||
| CEMEX S.A.B. de C.V. (a) | 328,173 | 218,667 | ||
| LG Electronics, Inc. | 3,520 | 457,556 | ||
| $1,004,324 | ||||
| Consumer Services – 1.5% | ||||
| Localiza Rent a Car S.A. | 8,000 | $ 82,795 | ||
| MakeMyTrip Ltd. (a) | 3,340 | 112,057 | ||
| Naspers Ltd. | 2,445 | 568,457 | ||
| $763,309 | ||||
| Electronics – 10.5% | ||||
| E Ink Holdings, Inc. | 181,000 | $ 329,180 | ||
| MediaTek, Inc. | 9,000 | 290,819 | ||
| Silicon Motion Technology Corp., ADR | 8,288 | 492,639 | ||
| Taiwan Semiconductor Manufacturing Co. Ltd. | 177,000 | 3,867,717 | ||
| United Microelectronics Corp. | 210,000 | 411,200 | ||
| $5,391,555 | ||||
| Energy - Independent – 1.6% | ||||
| China Shenhua Energy Co. Ltd. | 237,000 | $ 450,384 | ||
| Hindustan Petroleum Corp. Ltd. | 58,035 | 190,869 | ||
| Reliance Industries Ltd. | 7,041 | 198,928 | ||
| Reliance Industries Ltd. | 431 | 7,073 | ||
| $847,254 | ||||
| Energy - Integrated – 2.8% | ||||
| China Petroleum & Chemical Corp. | 1,242,000 | $ 685,121 | ||
| LUKOIL PJSC, ADR | 7,731 | 573,640 | ||
| PetroChina Co. Ltd. | 572,000 | 203,699 | ||
| $1,462,460 | ||||
| Issuer | Shares/Par | Value ($) | ||
| Common Stocks – continued | ||||
| Food & Beverages – 2.7% | ||||
| Abdullah Al Othaim Markets Co. | 2,634 | $ 86,384 | ||
| CJ CheilJedang Corp. | 723 | 261,593 | ||
| Gruma S.A.B. de C.V. | 19,607 | 213,699 | ||
| Inner Mongolia Yili Industrial Group Co. Ltd., “A” | 41,864 | 280,087 | ||
| Muyuan Foodstuff Co. Ltd. | 12,240 | 216,477 | ||
| Tata Consumer Products Ltd. | 26,542 | 219,180 | ||
| Wens Foodstuff Group Co. Ltd., “A” | 30,520 | 85,843 | ||
| $1,363,263 | ||||
| Food & Drug Stores – 0.5% | ||||
| Cia Brasileira de Distribuicao | 7,800 | $ 115,520 | ||
| Magnit PJSC, GDR | 11,508 | 156,164 | ||
| $271,684 | ||||
| Gaming & Lodging – 0.4% | ||||
| Genting Berhad | 200,900 | $ 228,820 | ||
| General Merchandise – 1.3% | ||||
| Bim Birlesik Magazalar A.S. | 24,328 | $ 216,525 | ||
| Walmart de Mexico S.A.B. de C.V. | 164,806 | 470,132 | ||
| $686,657 | ||||
| Insurance – 3.7% | ||||
| AIA Group Ltd. | 21,400 | $ 267,760 | ||
| China Pacific Insurance Co. Ltd. | 118,200 | 542,250 | ||
| PICC Property & Casualty Co. Ltd. | 280,000 | 211,901 | ||
| Ping An Insurance Co. of China Ltd., “H” | 36,000 | 442,316 | ||
| Samsung Fire & Marine Insurance Co. Ltd. | 2,740 | 421,914 | ||
| $1,886,141 | ||||
| Internet – 14.2% | ||||
| Alibaba Group Holding Ltd., ADR (a) | 9,759 | $ 2,320,300 | ||
| NAVER Corp. | 1,926 | 642,857 | ||
| NetEase.com, Inc., ADR | 6,671 | 732,810 | ||
| PChome Online, Inc. | 26,000 | 76,826 | ||
| Tencent Holdings Ltd. | 41,000 | 3,501,924 | ||
| $7,274,717 | ||||
| Leisure & Toys – 0.3% | ||||
| NCsoft Corp. | 170 | $ 141,364 | ||
| Machinery & Tools – 0.6% | ||||
| Sany Heavy Industry Co. Ltd., “A” | 46,300 | $ 294,643 | ||
| Issuer | Shares/Par | Value ($) | ||
| Common Stocks – continued | ||||
| Major Banks – 4.1% | ||||
| ABSA Group Ltd. | 58,877 | $ 472,145 | ||
| Bank of China Ltd. | 990,000 | 347,169 | ||
| China Construction Bank Corp. | 1,211,000 | 972,678 | ||
| Industrial & Commercial Bank of China, “H” | 312,000 | 203,536 | ||
| Nedbank Group Ltd. | 12,684 | 109,503 | ||
| $2,105,031 | ||||
| Medical Equipment – 0.6% | ||||
| Hartalega Holdings Berhad | 30,200 | $ 74,217 | ||
| Supermax Corporation Berhad | 40,060 | 47,658 | ||
| Top Glove Corp. | 128,300 | 165,218 | ||
| $287,093 | ||||
| Metals & Mining – 3.2% | ||||
| African Rainbow Minerals Ltd. | 5,390 | $ 105,073 | ||
| China Hongqiao Group Ltd. | 132,000 | 163,714 | ||
| Kumba Iron Ore Ltd. | 7,518 | 322,457 | ||
| MMC Norilsk Nickel PJSC, ADR | 5,194 | 162,936 | ||
| POSCO | 1,572 | 393,875 | ||
| Vale S.A. | 29,200 | 492,485 | ||
| $1,640,540 | ||||
| Natural Gas - Pipeline – 0.2% | ||||
| Petronet LNG Ltd. | 28,905 | $ 100,141 | ||
| Network & Telecom – 0.4% | ||||
| VTech Holdings Ltd. | 26,400 | $ 221,405 | ||
| Other Banks & Diversified Financials – 7.8% | ||||
| Banco Macro S.A., ADR (a) | 5,411 | $ 73,373 | ||
| BNK Financial Group, Inc. | 19,186 | 100,575 | ||
| Chailease Holding Co. | 61,000 | 377,137 | ||
| E.Sun Financial Holding Co. Ltd. | 499,782 | 453,635 | ||
| Grupo Financiero Inbursa S.A. de C.V. (a) | 143,238 | 129,127 | ||
| Hacı Ömer Sabancı Holding A.S. | 134,043 | 188,662 | ||
| Hana Financial Group, Inc. | 9,971 | 328,817 | ||
| HDFC Bank Ltd., ADR (a) | 6,317 | 499,927 | ||
| KB Financial Group, Inc. | 9,447 | 364,083 | ||
| Kotak Mahindra Bank Ltd. (a) | 4,100 | 99,028 | ||
| Metropolitan Bank & Trust Co. | 92,340 | 96,489 | ||
| PT Bank Central Asia Tbk | 39,000 | 91,886 | ||
| Sberbank of Russia PJSC, ADR | 49,158 | 712,791 | ||
| Textainer Group Holdings Ltd. (a) | 6,063 | 157,880 | ||
| Issuer | Shares/Par | Value ($) | ||
| Common Stocks – continued | ||||
| Other Banks & Diversified Financials – continued | ||||
| Tisco Financial Group PLC | 95,900 | $ 302,323 | ||
| $3,975,733 | ||||
| Pharmaceuticals – 2.1% | ||||
| Ajanta Pharma Ltd. | 9,728 | $ 230,769 | ||
| China Medical System Holdings Ltd. | 116,000 | 181,258 | ||
| Divi's Laboratories Ltd. (a) | 1,842 | 84,026 | ||
| Gedeon Richter PLC | 7,466 | 212,955 | ||
| Genomma Lab Internacional S.A., “B” (a) | 168,055 | 168,609 | ||
| Kalbe Farma Tbk PT | 901,300 | 93,042 | ||
| Luye Pharma Group Ltd. | 135,030 | 91,612 | ||
| $1,062,271 | ||||
| Precious Metals & Minerals – 0.2% | ||||
| Sibanye-Stillwater Ltd. | 26,106 | $ 120,806 | ||
| Railroad & Shipping – 1.9% | ||||
| Adani Ports & Special Economic Zone Ltd. | 52,548 | $ 482,135 | ||
| China Cosco Holdings (a) | 202,000 | 224,489 | ||
| Evergreen Marine Corp. (Taiwan) Ltd. (a) | 188,000 | 257,669 | ||
| $964,293 | ||||
| Real Estate – 2.8% | ||||
| Aldar Properties PJSC | 404,590 | $ 403,142 | ||
| Country Garden Services Holdings Co. Ltd. | 12,000 | 98,705 | ||
| Kaisa Group Holdings Ltd. | 239,000 | 123,681 | ||
| KWG Living Group Holdings Ltd. (a) | 27,000 | 32,269 | ||
| Longfor Properties Co. Ltd. | 99,000 | 587,124 | ||
| Shimao Property Holdings Ltd. | 62,500 | 206,555 | ||
| $1,451,476 | ||||
| Restaurants – 1.3% | ||||
| Yum China Holdings, Inc. | 10,758 | $ 643,759 | ||
| Specialty Chemicals – 2.9% | ||||
| Asian Paints Ltd. | 9,330 | $ 291,549 | ||
| Charoen Pokphand Foods Public Co. Ltd. | 109,200 | 104,181 | ||
| Kingboard Laminates Holdings Ltd. | 62,000 | 105,832 | ||
| Lotte Chemical Corp. | 1,258 | 354,741 | ||
| Orbia Advance Corp. S.A.B. de C.V. | 51,743 | 120,670 | ||
| PTT Global Chemical PLC | 236,100 | 495,547 | ||
| $1,472,520 | ||||
| Issuer | Shares/Par | Value ($) | ||
| Common Stocks – continued | ||||
| Specialty Stores – 5.1% | ||||
| Cencosud S.A. | 54,630 | $ 106,975 | ||
| China MeiDong Auto Holdings Ltd. | 26,000 | 99,524 | ||
| China Tourism Group Duty Free Corp. Ltd. | 4,700 | 224,021 | ||
| JD.com, Inc., ADR (a) | 9,234 | 866,795 | ||
| Meituan, “B” (a) | 20,100 | 886,878 | ||
| Pinduoduo, Inc., ADR (a) | 1,357 | 232,264 | ||
| Vipshop Holdings Ltd., ADR (a) | 5,143 | 191,937 | ||
| $2,608,394 | ||||
| Telecommunications - Wireless – 0.8% | ||||
| Mobile TeleSystems PJSC, ADR | 13,261 | $ 109,005 | ||
| MTN Group Ltd. | 26,673 | 128,136 | ||
| PLDT, Inc. | 7,270 | 192,988 | ||
| $430,129 | ||||
| Telephone Services – 1.8% | ||||
| Hellenic Telecommunications Organization S.A. | 38,381 | $ 589,972 | ||
| KT Corp., ADR | 9,587 | 108,237 | ||
| PT Telekom Indonesia | 921,000 | 225,723 | ||
| $923,932 | ||||
| Trucking – 0.3% | ||||
| S.F. Holding Co. Ltd. | 8,500 | $ 138,105 | ||
| Utilities - Electric Power – 1.3% | ||||
| Energisa S.A. | 39,600 | $ 308,578 | ||
| ENGIE Energía Brasil S.A. | 45,965 | 337,507 | ||
| $646,085 | ||||
| Total Common Stocks (Identified Cost, $35,259,115) | $ 49,817,784 | |||
| Preferred Stocks – 0.7% | ||||
| Major Banks – 0.7% | ||||
| Banco Bradesco S.A. (Identified Cost, $370,568) | 91,593 | $ 375,904 | ||
| Investment Companies (h) – 1.6% | ||||
| Money Market Funds – 1.6% | ||||
| MFS Institutional Money Market Portfolio, 0.07% (v) (Identified Cost, $824,060) | 824,060 | $ 824,060 | ||
| Other Assets, Less Liabilities – 0.4% | 213,401 | |||
| Net Assets – 100.0% | $ 51,231,149 | |||
| (a) | Non-income producing security. |
| (h) | An affiliated issuer, which may be considered one in which the fund owns 5% or more of the outstanding voting securities, or a company which is under common control. At period end, the aggregate values of the fund's investments in affiliated issuers and in unaffiliated issuers were $824,060 and $50,193,688, respectively. | |||
| (v) | Affiliated issuer that is available only to investment companies managed by MFS. The rate quoted for the MFS Institutional Money Market Portfolio is the annualized seven-day yield of the fund at period end. |
| The following abbreviations are used in this report and are defined: | |
| ADR | American Depositary Receipt |
| GDR | Global Depositary Receipt |
| Assets | |
| Investments in unaffiliated issuers, at value (identified cost, $35,629,683) | $50,193,688 |
| Investments in affiliated issuers, at value (identified cost, $824,060) | 824,060 |
| Foreign currency, at value (identified cost, $1,158) | 1,158 |
| Receivables for | |
| Fund shares sold | 296,731 |
| Dividends | 133,239 |
| Receivable from investment adviser | 23,546 |
| Other assets | 366 |
| Total assets | $51,472,788 |
| Liabilities | |
| Payables for | |
| Fund shares reacquired | $15,060 |
| Payable to affiliates | |
| Administrative services fee | 194 |
| Shareholder servicing costs | 11,086 |
| Distribution and service fees | 333 |
| Payable for independent Trustees' compensation | 132 |
| Deferred country tax expense payable | 109,024 |
| Accrued expenses and other liabilities | 105,810 |
| Total liabilities | $241,639 |
| Net assets | $51,231,149 |
| Net assets consist of | |
| Paid-in capital | $39,140,776 |
| Total distributable earnings (loss) | 12,090,373 |
| Net assets | $51,231,149 |
| Shares of beneficial interest outstanding | 3,277,736 |
| Net assets | Shares outstanding | Net asset value per share (a) | |
| Class A | $7,915,525 | 507,334 | $15.60 |
| Class B | 394,459 | 25,512 | 15.46 |
| Class C | 445,124 | 28,846 | 15.43 |
| Class I | 25,623,501 | 1,640,039 | 15.62 |
| Class R1 | 86,114 | 5,561 | 15.49 |
| Class R2 | 88,497 | 5,676 | 15.59 |
| Class R3 | 105,490 | 6,751 | 15.63 |
| Class R4 | 111,883 | 7,148 | 15.65 |
| Class R6 | 16,460,556 | 1,050,869 | 15.66 |
| (a) | Maximum offering price per share was equal to the net asset value per share for all share classes, except for Class A, for which the maximum offering price per share was $16.55 [100 / 94.25 x $15.60]. On sales of $50,000 or more, the maximum offering price of Class A shares is reduced. A contingent deferred sales charge may be imposed on redemptions of Class A, Class B, and Class C shares. Redemption price per share was equal to the net asset value per share for Classes I, R1, R2, R3, R4, and R6. |
| Net investment income (loss) | |
| Income | |
| Dividends | $443,684 |
| Other | 4,915 |
| Dividends from affiliated issuers | 230 |
| Foreign taxes withheld | (56,002) |
| Total investment income | $392,827 |
| Expenses | |
| Management fee | $173,893 |
| Distribution and service fees | 12,397 |
| Shareholder servicing costs | 18,307 |
| Administrative services fee | 8,715 |
| Independent Trustees' compensation | 879 |
| Custodian fee | 55,061 |
| Shareholder communications | 6,375 |
| Audit and tax fees | 39,005 |
| Legal fees | 165 |
| Registration fees | 61,698 |
| Miscellaneous | 14,741 |
| Total expenses | $391,236 |
| Reduction of expenses by investment adviser | (156,595) |
| Net expenses | $234,641 |
| Net investment income (loss) | $158,186 |
| Realized and unrealized gain (loss) | |
| Realized gain (loss) (identified cost basis) | |
| Unaffiliated issuers (net of $94 country tax) | $1,297,927 |
| Foreign currency | (4,228) |
| Net realized gain (loss) | $1,293,699 |
| Change in unrealized appreciation or depreciation | |
| Unaffiliated issuers (net of $94,813 increase in deferred country tax) | $7,807,788 |
| Translation of assets and liabilities in foreign currencies | (3,228) |
| Net unrealized gain (loss) | $7,804,560 |
| Net realized and unrealized gain (loss) | $9,098,259 |
| Change in net assets from operations | $9,256,445 |
| Six months ended | Year ended | |
| 2/28/21 (unaudited) | 8/31/20 | |
| Change in net assets | ||
| From operations | ||
| Net investment income (loss) | $158,186 | $720,764 |
| Net realized gain (loss) | 1,293,699 | (2,119,090) |
| Net unrealized gain (loss) | 7,804,560 | 5,450,826 |
| Change in net assets from operations | $9,256,445 | $4,052,500 |
| Total distributions to shareholders | $(745,103) | $(465,097) |
| Change in net assets from fund share transactions | $346,345 | $18,110,671 |
| Total change in net assets | $8,857,687 | $21,698,074 |
| Net assets | ||
| At beginning of period | 42,373,462 | 20,675,388 |
| At end of period | $51,231,149 | $42,373,462 |
| Class A | Six months ended | Year ended | ||||
| 2/28/21 (unaudited) | 8/31/20 | 8/31/19 | 8/31/18 | 8/31/17 | 8/31/16(c) | |
| Net asset value, beginning of period | $12.97 | $12.12 | $13.66 | $14.37 | $11.37 | $10.00 |
| Income (loss) from investment operations | ||||||
| Net investment income (loss) (d) | $0.03 | $0.24 | $0.25 | $0.24 | $0.28 | $0.24 |
| Net realized and unrealized gain (loss) | 2.80 | 0.81 | (1.20) | (0.32) | 2.86 | 1.18 |
| Total from investment operations | $2.83 | $1.05 | $(0.95) | $(0.08) | $3.14 | $1.42 |
| Less distributions declared to shareholders | ||||||
| From net investment income | $(0.20) | $(0.20) | $(0.22) | $(0.16) | $(0.06) | $(0.04) |
| From net realized gain | — | — | (0.37) | (0.47) | (0.08) | (0.01) |
| Total distributions declared to shareholders | $(0.20) | $(0.20) | $(0.59) | $(0.63) | $(0.14) | $(0.05) |
| Net asset value, end of period (x) | $15.60 | $12.97 | $12.12 | $13.66 | $14.37 | $11.37 |
| Total return (%) (r)(s)(t)(x) | 21.97(n) | 8.63 | (6.77) | (0.77) | 28.01 | 14.33(n) |
| Ratios (%) (to average net assets) and Supplemental data: | ||||||
| Expenses before expense reductions (f) | 1.91(a) | 2.39 | 2.95 | 2.94 | 3.23 | 6.30(a) |
| Expenses after expense reductions (f) | 1.24(a) | 1.24 | 1.24 | 1.23 | 1.23 | 1.24(a) |
| Net investment income (loss) | 0.47(a)(l) | 1.98 | 2.01 | 1.65 | 2.22 | 2.36(a) |
| Portfolio turnover | 31(n) | 63 | 64 | 58 | 92 | 64(n) |
| Net assets at end of period (000 omitted) | $7,916 | $5,702 | $5,174 | $7,145 | $4,982 | $957 |
| Class B | Six months ended | Year ended | ||||
| 2/28/21 (unaudited) | 8/31/20 | 8/31/19 | 8/31/18 | 8/31/17 | 8/31/16(c) | |
| Net asset value, beginning of period | $12.81 | $11.99 | $13.54 | $14.27 | $11.31 | $10.00 |
| Income (loss) from investment operations | ||||||
| Net investment income (loss) (d) | $(0.02) | $0.15 | $0.21 | $0.12 | $0.12 | $0.09 |
| Net realized and unrealized gain (loss) | 2.77 | 0.80 | (1.25) | (0.30) | 2.92 | 1.25 |
| Total from investment operations | $2.75 | $0.95 | $(1.04) | $(0.18) | $3.04 | $1.34 |
| Less distributions declared to shareholders | ||||||
| From net investment income | $(0.10) | $(0.13) | $(0.14) | $(0.08) | $(0.00)(w) | $(0.02) |
| From net realized gain | — | — | (0.37) | (0.47) | (0.08) | (0.01) |
| Total distributions declared to shareholders | $(0.10) | $(0.13) | $(0.51) | $(0.55) | $(0.08) | $(0.03) |
| Net asset value, end of period (x) | $15.46 | $12.81 | $11.99 | $13.54 | $14.27 | $11.31 |
| Total return (%) (r)(s)(t)(x) | 21.49(n) | 7.88 | (7.51) | (1.47) | 27.09 | 13.46(n) |
| Ratios (%) (to average net assets) and Supplemental data: | ||||||
| Expenses before expense reductions (f) | 2.67(a) | 3.19 | 3.70 | 3.67 | 4.04 | 7.64(a) |
| Expenses after expense reductions (f) | 1.99(a) | 1.99 | 1.99 | 1.98 | 1.99 | 1.98(a) |
| Net investment income (loss) | (0.29)(a)(l) | 1.22 | 1.63 | 0.79 | 0.97 | 0.93(a) |
| Portfolio turnover | 31(n) | 63 | 64 | 58 | 92 | 64(n) |
| Net assets at end of period (000 omitted) | $394 | $312 | $391 | $318 | $213 | $86 |
| Class C | Six months ended | Year ended | ||||
| 2/28/21 (unaudited) | 8/31/20 | 8/31/19 | 8/31/18 | 8/31/17 | 8/31/16(c) | |
| Net asset value, beginning of period | $12.78 | $11.95 | $13.50 | $14.23 | $11.31 | $10.00 |
| Income (loss) from investment operations | ||||||
| Net investment income (loss) (d) | $(0.02) | $0.15 | $0.16 | $0.11 | $0.14 | $0.09 |
| Net realized and unrealized gain (loss) | 2.77 | 0.78 | (1.19) | (0.29) | 2.89 | 1.25 |
| Total from investment operations | $2.75 | $0.93 | $(1.03) | $(0.18) | $3.03 | $1.34 |
| Less distributions declared to shareholders | ||||||
| From net investment income | $(0.10) | $(0.10) | $(0.15) | $(0.08) | $(0.03) | $(0.02) |
| From net realized gain | — | — | (0.37) | (0.47) | (0.08) | (0.01) |
| Total distributions declared to shareholders | $(0.10) | $(0.10) | $(0.52) | $(0.55) | $(0.11) | $(0.03) |
| Net asset value, end of period (x) | $15.43 | $12.78 | $11.95 | $13.50 | $14.23 | $11.31 |
| Total return (%) (r)(s)(t)(x) | 21.59(n) | 7.78 | (7.51) | (1.48) | 27.06 | 13.48(n) |
| Ratios (%) (to average net assets) and Supplemental data: | ||||||
| Expenses before expense reductions (f) | 2.67(a) | 3.19 | 3.70 | 3.64 | 4.02 | 7.63(a) |
| Expenses after expense reductions (f) | 1.99(a) | 1.99 | 1.99 | 1.99 | 1.99 | 1.98(a) |
| Net investment income (loss) | (0.30)(a)(l) | 1.22 | 1.31 | 0.75 | 1.16 | 0.95(a) |
| Portfolio turnover | 31(n) | 63 | 64 | 58 | 92 | 64(n) |
| Net assets at end of period (000 omitted) | $445 | $344 | $420 | $453 | $438 | $91 |
| Class I | Six months ended | Year ended | ||||
| 2/28/21 (unaudited) | 8/31/20 | 8/31/19 | 8/31/18 | 8/31/17 | 8/31/16(c) | |
| Net asset value, beginning of period | $13.00 | $12.16 | $13.71 | $14.41 | $11.38 | $10.00 |
| Income (loss) from investment operations | ||||||
| Net investment income (loss) (d) | $0.05 | $0.29 | $0.29 | $0.34 | $0.28 | $0.23 |
| Net realized and unrealized gain (loss) | 2.81 | 0.80 | (1.22) | (0.39) | 2.91 | 1.21 |
| Total from investment operations | $2.86 | $1.09 | $(0.93) | $(0.05) | $3.19 | $1.44 |
| Less distributions declared to shareholders | ||||||
| From net investment income | $(0.24) | $(0.25) | $(0.25) | $(0.18) | $(0.08) | $(0.05) |
| From net realized gain | — | — | (0.37) | (0.47) | (0.08) | (0.01) |
| Total distributions declared to shareholders | $(0.24) | $(0.25) | $(0.62) | $(0.65) | $(0.16) | $(0.06) |
| Net asset value, end of period (x) | $15.62 | $13.00 | $12.16 | $13.71 | $14.41 | $11.38 |
| Total return (%) (r)(s)(t)(x) | 22.13(n) | 8.89 | (6.55) | (0.55) | 28.44 | 14.51(n) |
| Ratios (%) (to average net assets) and Supplemental data: | ||||||
| Expenses before expense reductions (f) | 1.67(a) | 1.91 | 2.70 | 2.78 | 3.05 | 6.27(a) |
| Expenses after expense reductions (f) | 0.99(a) | 0.99 | 0.99 | 0.99 | 0.99 | 0.99(a) |
| Net investment income (loss) | 0.70(a)(l) | 2.46 | 2.26 | 2.30 | 2.28 | 2.27(a) |
| Portfolio turnover | 31(n) | 63 | 64 | 58 | 92 | 64(n) |
| Net assets at end of period (000 omitted) | $25,624 | $21,273 | $1,811 | $2,343 | $669 | $436 |
| Class R1 | Six months ended | Year ended | ||||
| 2/28/21 (unaudited) | 8/31/20 | 8/31/19 | 8/31/18 | 8/31/17 | 8/31/16(c) | |
| Net asset value, beginning of period | $12.84 | $12.01 | $13.57 | $14.27 | $11.31 | $10.00 |
| Income (loss) from investment operations | ||||||
| Net investment income (loss) (d) | $(0.02) | $0.15 | $0.17 | $0.10 | $0.11 | $0.07 |
| Net realized and unrealized gain (loss) | 2.78 | 0.80 | (1.20) | (0.28) | 2.93 | 1.27 |
| Total from investment operations | $2.76 | $0.95 | $(1.03) | $(0.18) | $3.04 | $1.34 |
| Less distributions declared to shareholders | ||||||
| From net investment income | $(0.11) | $(0.12) | $(0.16) | $(0.05) | $— | $(0.02) |
| From net realized gain | — | — | (0.37) | (0.47) | (0.08) | (0.01) |
| Total distributions declared to shareholders | $(0.11) | $(0.12) | $(0.53) | $(0.52) | $(0.08) | $(0.03) |
| Net asset value, end of period (x) | $15.49 | $12.84 | $12.01 | $13.57 | $14.27 | $11.31 |
| Total return (%) (r)(s)(t)(x) | 21.57(n) | 7.84 | (7.47) | (1.49) | 27.08 | 13.46(n) |
| Ratios (%) (to average net assets) and Supplemental data: | ||||||
| Expenses before expense reductions (f) | 2.67(a) | 3.14 | 3.70 | 3.64 | 4.06 | 7.86(a) |
| Expenses after expense reductions (f) | 1.99(a) | 1.99 | 1.99 | 1.99 | 1.99 | 1.97(a) |
| Net investment income (loss) | (0.30)(a)(l) | 1.25 | 1.32 | 0.70 | 0.88 | 0.69(a) |
| Portfolio turnover | 31(n) | 63 | 64 | 58 | 92 | 64(n) |
| Net assets at end of period (000 omitted) | $86 | $71 | $66 | $71 | $72 | $57 |
| Class R2 | Six months ended | Year ended | ||||
| 2/28/21 (unaudited) | 8/31/20 | 8/31/19 | 8/31/18 | 8/31/17 | 8/31/16(c) | |
| Net asset value, beginning of period | $12.95 | $12.11 | $13.66 | $14.36 | $11.35 | $10.00 |
| Income (loss) from investment operations | ||||||
| Net investment income (loss) (d) | $0.01 | $0.21 | $0.23 | $0.18 | $0.17 | $0.12 |
| Net realized and unrealized gain (loss) | 2.80 | 0.81 | (1.20) | (0.30) | 2.94 | 1.28 |
| Total from investment operations | $2.81 | $1.02 | $(0.97) | $(0.12) | $3.11 | $1.40 |
| Less distributions declared to shareholders | ||||||
| From net investment income | $(0.17) | $(0.18) | $(0.21) | $(0.11) | $(0.02) | $(0.04) |
| From net realized gain | — | — | (0.37) | (0.47) | (0.08) | (0.01) |
| Total distributions declared to shareholders | $(0.17) | $(0.18) | $(0.58) | $(0.58) | $(0.10) | $(0.05) |
| Net asset value, end of period (x) | $15.59 | $12.95 | $12.11 | $13.66 | $14.36 | $11.35 |
| Total return (%) (r)(s)(t)(x) | 21.82(n) | 8.35 | (6.97) | (1.03) | 27.71 | 14.04(n) |
| Ratios (%) (to average net assets) and Supplemental data: | ||||||
| Expenses before expense reductions (f) | 2.17(a) | 2.64 | 3.20 | 3.14 | 3.56 | 7.36(a) |
| Expenses after expense reductions (f) | 1.49(a) | 1.49 | 1.49 | 1.49 | 1.49 | 1.47(a) |
| Net investment income (loss) | 0.21(a)(l) | 1.75 | 1.82 | 1.20 | 1.38 | 1.19(a) |
| Portfolio turnover | 31(n) | 63 | 64 | 58 | 92 | 64(n) |
| Net assets at end of period (000 omitted) | $88 | $73 | $67 | $72 | $73 | $57 |
| Class R3 | Six months ended | Year ended | ||||
| 2/28/21 (unaudited) | 8/31/20 | 8/31/19 | 8/31/18 | 8/31/17 | 8/31/16(c) | |
| Net asset value, beginning of period | $12.98 | $12.14 | $13.69 | $14.39 | $11.37 | $10.00 |
| Income (loss) from investment operations | ||||||
| Net investment income (loss) (d) | $0.03 | $0.21 | $0.24 | $0.24 | $0.20 | $0.14 |
| Net realized and unrealized gain (loss) | 2.82 | 0.83 | (1.19) | (0.32) | 2.95 | 1.28 |
| Total from investment operations | $2.85 | $1.04 | $(0.95) | $(0.08) | $3.15 | $1.42 |
| Less distributions declared to shareholders | ||||||
| From net investment income | $(0.20) | $(0.20) | $(0.23) | $(0.15) | $(0.05) | $(0.04) |
| From net realized gain | — | — | (0.37) | (0.47) | (0.08) | (0.01) |
| Total distributions declared to shareholders | $(0.20) | $(0.20) | $(0.60) | $(0.62) | $(0.13) | $(0.05) |
| Net asset value, end of period (x) | $15.63 | $12.98 | $12.14 | $13.69 | $14.39 | $11.37 |
| Total return (%) (r)(s)(t)(x) | 22.06(n) | 8.52 | (6.75) | (0.80) | 28.05 | 14.32(n) |
| Ratios (%) (to average net assets) and Supplemental data: | ||||||
| Expenses before expense reductions (f) | 1.91(a) | 2.43 | 2.95 | 2.94 | 3.31 | 7.11(a) |
| Expenses after expense reductions (f) | 1.24(a) | 1.24 | 1.24 | 1.24 | 1.24 | 1.22(a) |
| Net investment income (loss) | 0.46(a)(l) | 1.71 | 1.89 | 1.66 | 1.63 | 1.44(a) |
| Portfolio turnover | 31(n) | 63 | 64 | 58 | 92 | 64(n) |
| Net assets at end of period (000 omitted) | $105 | $81 | $71 | $102 | $73 | $57 |
| Class R4 | Six months ended | Year ended | ||||
| 2/28/21 (unaudited) | 8/31/20 | 8/31/19 | 8/31/18 | 8/31/17 | 8/31/16(c) | |
| Net asset value, beginning of period | $13.02 | $12.17 | $13.72 | $14.41 | $11.38 | $10.00 |
| Income (loss) from investment operations | ||||||
| Net investment income (loss) (d) | $0.05 | $0.28 | $0.30 | $0.26 | $0.23 | $0.17 |
| Net realized and unrealized gain (loss) | 2.81 | 0.81 | (1.23) | (0.30) | 2.96 | 1.27 |
| Total from investment operations | $2.86 | $1.09 | $(0.93) | $(0.04) | $3.19 | $1.44 |
| Less distributions declared to shareholders | ||||||
| From net investment income | $(0.23) | $(0.24) | $(0.25) | $(0.18) | $(0.08) | $(0.05) |
| From net realized gain | — | — | (0.37) | (0.47) | (0.08) | (0.01) |
| Total distributions declared to shareholders | $(0.23) | $(0.24) | $(0.62) | $(0.65) | $(0.16) | $(0.06) |
| Net asset value, end of period (x) | $15.65 | $13.02 | $12.17 | $13.72 | $14.41 | $11.38 |
| Total return (%) (r)(s)(t)(x) | 22.14(n) | 8.90 | (6.55) | (0.50) | 28.42 | 14.51(n) |
| Ratios (%) (to average net assets) and Supplemental data: | ||||||
| Expenses before expense reductions (f) | 1.67(a) | 2.14 | 2.70 | 2.66 | 3.06 | 6.86(a) |
| Expenses after expense reductions (f) | 0.99(a) | 0.99 | 0.99 | 0.99 | 0.99 | 0.97(a) |
| Net investment income (loss) | 0.70(a)(l) | 2.25 | 2.36 | 1.76 | 1.89 | 1.69(a) |
| Portfolio turnover | 31(n) | 63 | 64 | 58 | 92 | 64(n) |
| Net assets at end of period (000 omitted) | $112 | $97 | $85 | $82 | $74 | $57 |
| Class R6 | Six months ended | Year ended | ||||
| 2/28/21 (unaudited) | 8/31/20 | 8/31/19 | 8/31/18 | 8/31/17 | 8/31/16(c) | |
| Net asset value, beginning of period | $13.03 | $12.19 | $13.73 | $14.42 | $11.39 | $10.00 |
| Income (loss) from investment operations | ||||||
| Net investment income (loss) (d) | $0.06 | $0.29 | $0.31 | $0.27 | $0.24 | $0.16 |
| Net realized and unrealized gain (loss) | 2.81 | 0.81 | (1.22) | (0.30) | 2.95 | 1.29 |
| Total from investment operations | $2.87 | $1.10 | $(0.91) | $(0.03) | $3.19 | $1.45 |
| Less distributions declared to shareholders | ||||||
| From net investment income | $(0.24) | $(0.26) | $(0.26) | $(0.19) | $(0.08) | $(0.05) |
| From net realized gain | — | — | (0.37) | (0.47) | (0.08) | (0.01) |
| Total distributions declared to shareholders | $(0.24) | $(0.26) | $(0.63) | $(0.66) | $(0.16) | $(0.06) |
| Net asset value, end of period (x) | $15.66 | $13.03 | $12.19 | $13.73 | $14.42 | $11.39 |
| Total return (%) (r)(s)(t)(x) | 22.20(n) | 8.91 | (6.40) | (0.42) | 28.45 | 14.62(n) |
| Ratios (%) (to average net assets) and Supplemental data: | ||||||
| Expenses before expense reductions (f) | 1.57(a) | 2.05 | 2.58 | 2.56 | 2.98 | 6.84(a) |
| Expenses after expense reductions (f) | 0.90(a) | 0.92 | 0.87 | 0.90 | 0.91 | 0.94(a) |
| Net investment income (loss) | 0.80(a)(l) | 2.36 | 2.44 | 1.81 | 1.97 | 1.59(a) |
| Portfolio turnover | 31(n) | 63 | 64 | 58 | 92 | 64(n) |
| Net assets at end of period (000 omitted) | $16,461 | $14,422 | $12,590 | $13,322 | $12,127 | $12,031 |
| (a) | Annualized. |
| (c) | For the period from the commencement of the fund’s investment operations, September 15, 2015, through the stated period end. |
| (d) | Per share data is based on average shares outstanding. |
| (f) | Ratios do not reflect reductions from fees paid indirectly, if applicable. |
| (l) | Recognition of net investment income by the fund may be affected by the timing of the declaration of dividends by companies in which the fund invests and the actual annual net investment income ratio may differ. |
| (n) | Not annualized. |
| (r) | Certain expenses have been reduced without which performance would have been lower. |
| (s) | From time to time the fund may receive proceeds from litigation settlements, without which performance would be lower. |
| (t) | Total returns do not include any applicable sales charges. |
| (w) | Per share amount was less than $0.01. |
| (x) | The net asset values and total returns have been calculated on net assets which include adjustments made in accordance with U.S. generally accepted accounting principles required at period end for financial reporting purposes. |
| Financial Instruments | Level 1 | Level 2 | Level 3 | Total |
| Equity Securities: | ||||
| China | $15,038,356 | $4,743,566 | $— | $19,781,922 |
| Taiwan | 825,672 | 6,552,068 | — | 7,377,740 |
| South Korea | 2,725,683 | 4,197,253 | — | 6,922,936 |
| India | 611,984 | 3,682,717 | — | 4,294,701 |
| Russia | 1,714,536 | 230,256 | — | 1,944,792 |
| Brazil | 1,926,920 | — | — | 1,926,920 |
| South Africa | 1,826,576 | — | — | 1,826,576 |
| Mexico | 1,320,904 | — | — | 1,320,904 |
| Thailand | 495,547 | 496,159 | — | 991,706 |
| Other Countries | 3,329,736 | 475,755 | — | 3,805,491 |
| Mutual Funds | 824,060 | — | — | 824,060 |
| Total | $30,639,974 | $20,377,774 | $— | $51,017,748 |
| Year ended 8/31/20 | |
| Ordinary income (including any short-term capital gains) | $465,097 |
| As of 2/28/21 | |
| Cost of investments | $37,178,509 |
| Gross appreciation | 14,883,582 |
| Gross depreciation | (1,044,343) |
| Net unrealized appreciation (depreciation) | $13,839,239 |
| As of 8/31/20 | |
| Undistributed ordinary income | 743,667 |
| Capital loss carryforwards | (3,090,340) |
| Other temporary differences | (10,929) |
| Net unrealized appreciation (depreciation) | 5,936,633 |
| Short-Term | $(2,399,467) |
| Long-Term | (690,873) |
| Total | $(3,090,340) |
| Six months ended 2/28/21 | Year ended 8/31/20 | ||
| Class A | $88,077 | $83,064 | |
| Class B | 2,417 | 3,860 | |
| Class C | 2,784 | 3,499 | |
| Class I | 385,053 | 103,204 | |
| Class R1 | 607 | 633 | |
| Class R2 | 956 | 982 | |
| Class R3 | 1,232 | 1,187 | |
| Class R4 | 1,721 | 1,710 | |
| Class R6 | 262,256 | 266,958 | |
| Total | $745,103 | $465,097 |
| Up to $1 billion | 0.75% |
| In excess of $1 billion and up to $2.5 billion | 0.70% |
| In excess of $2.5 billion | 0.675% |
| Classes | ||||||||
| A | B | C | I | R1 | R2 | R3 | R4 | R6 |
| 1.24% | 1.99% | 1.99% | 0.99% | 1.99% | 1.49% | 1.24% | 0.99% | 0.95% |
| Distribution Fee Rate (d) | Service Fee Rate (d) | Total Distribution Plan (d) | Annual Effective Rate (e) | Distribution and Service Fee | |
| Class A | — | 0.25% | 0.25% | 0.25% | $ 8,015 |
| Class B | 0.75% | 0.25% | 1.00% | 1.00% | 1,756 |
| Class C | 0.75% | 0.25% | 1.00% | 1.00% | 1,922 |
| Class R1 | 0.75% | 0.25% | 1.00% | 1.00% | 390 |
| Class R2 | 0.25% | 0.25% | 0.50% | 0.50% | 200 |
| Class R3 | — | 0.25% | 0.25% | 0.25% | 114 |
| Total Distribution and Service Fees | $12,397 |
| (d) | In accordance with the distribution plan for certain classes, the fund pays distribution and/or service fees equal to these annual percentage rates of each class’s average daily net assets. The distribution and service fee rates disclosed by class represent the current rates in effect at the end of the reporting period. Any rate changes, if applicable, are detailed below. |
| (e) | The annual effective rates represent actual fees incurred under the distribution plan for the six months ended February 28, 2021 based on each class's average daily net assets.MFD has voluntarily agreed to rebate a portion of each class's 0.25% service fee attributable to accounts for which there is no financial intermediary specified on the account except for accounts attributable to MFS or its affiliates' seed money. There were no service fee rebates for the six months ended February 28, 2021. |
| Amount | |
| Class A | $— |
| Class B | 160 |
| Class C | 8 |
| Six months ended 2/28/21 | Year ended 8/31/20 | ||||
| Shares | Amount | Shares | Amount | ||
| Shares sold | |||||
| Class A | 92,943 | $1,443,912 | 158,992 | $1,991,029 | |
| Class B | 1,766 | 25,022 | — | — | |
| Class C | 5,180 | 76,290 | 12,555 | 155,137 | |
| Class I | 78,993 | 1,161,579 | 1,547,126 | 17,809,134 | |
| Class R3 | 454 | 6,788 | 10,400 | 136,453 | |
| Class R4 | 233 | 3,402 | 448 | 5,544 | |
| Class R6 | 102,386 | 1,436,719 | 419,437 | 5,112,047 | |
| 281,955 | $4,153,712 | 2,148,958 | $25,209,344 | ||
| Shares issued to shareholders in reinvestment of distributions | |||||
| Class A | 6,019 | $86,377 | 6,053 | $81,347 | |
| Class B | 170 | 2,417 | 289 | 3,860 | |
| Class C | 196 | 2,784 | 262 | 3,499 | |
| Class I | 25,673 | 368,920 | 6,268 | 84,301 | |
| Class R1 | 43 | 607 | 47 | 633 | |
| Class R2 | 67 | 956 | 73 | 982 | |
| Class R3 | 86 | 1,232 | 88 | 1,187 | |
| Class R4 | 120 | 1,720 | 127 | 1,710 | |
| Class R6 | 18,212 | 262,256 | 19,804 | 266,958 | |
| 50,586 | $727,269 | 33,011 | $444,477 | ||
| Shares reacquired | |||||
| Class A | (31,338) | $(446,277) | (152,238) | $(1,808,610) | |
| Class B | (756) | (10,591) | (8,568) | (106,675) | |
| Class C | (3,424) | (47,906) | (21,085) | (257,158) | |
| Class I | (100,977) | (1,492,694) | (65,957) | (745,548) | |
| Class R3 | (19) | (312) | (10,071) | (129,033) | |
| Class R4 | (654) | (9,372) | (126) | (1,490) | |
| Class R6 | (176,465) | (2,527,484) | (365,637) | (4,494,636) | |
| (313,633) | $(4,534,636) | (623,682) | $(7,543,150) | ||
| Six months ended 2/28/21 | Year ended 8/31/20 | ||||
| Shares | Amount | Shares | Amount | ||
| Net change | |||||
| Class A | 67,624 | $1,084,012 | 12,807 | $263,766 | |
| Class B | 1,180 | 16,848 | (8,279) | (102,815) | |
| Class C | 1,952 | 31,168 | (8,268) | (98,522) | |
| Class I | 3,689 | 37,805 | 1,487,437 | 17,147,887 | |
| Class R1 | 43 | 607 | 47 | 633 | |
| Class R2 | 67 | 956 | 73 | 982 | |
| Class R3 | 521 | 7,708 | 417 | 8,607 | |
| Class R4 | (301) | (4,250) | 449 | 5,764 | |
| Class R6 | (55,867) | (828,509) | 73,604 | 884,369 | |
| 18,908 | $346,345 | 1,558,287 | $18,110,671 | ||
| Affiliated Issuers | Beginning Value | Purchases | Sales Proceeds | Realized Gain (Loss) | Change in Unrealized Appreciation or Depreciation | Ending Value |
| MFS Institutional Money Market Portfolio | $538,721 | $7,031,838 | $6,746,499 | $— | $— | $824,060 |
| Affiliated Issuers | Dividend Income | Capital Gain Distributions |
| MFS Institutional Money Market Portfolio | $230 | $— |


International Equity Fund

International Equity Fund
| 1 | |
| 2 | |
| 4 | |
| 6 | |
| 13 | |
| 15 | |
| 16 | |
| 17 | |
| 26 | |
| 37 | |
| 37 | |
| 37 | |
| 37 | |
| 37 |
| back cover |


| Taiwan Semiconductor Manufacturing Co. Ltd., ADR | 3.1% |
| Tencent Holdings Ltd. | 2.4% |
| Samsung Electronics Co. Ltd. | 2.4% |
| Roche Holding AG | 2.1% |
| LVMH Moet Hennessy Louis Vuitton SE | 1.9% |
| Hitachi Ltd. | 1.8% |
| Novartis AG | 1.7% |
| Schneider Electric SE | 1.6% |
| UBS Group AG | 1.5% |
| DBS Group Holdings Ltd. | 1.5% |
| Financials | 18.4% |
| Information Technology | 13.6% |
| Consumer Discretionary | 13.3% |
| Industrials | 10.7% |
| Health Care | 9.1% |
| Consumer Staples | 8.1% |
| Communication Services | 7.8% |
| Materials | 7.5% |
| Energy | 4.4% |
| Utilities | 3.5% |
| Real Estate | 2.5% |
| Japan | 14.7% |
| China | 11.1% |
| United Kingdom | 8.8% |
| Switzerland | 7.4% |
| France | 7.3% |
| Canada | 7.2% |
| South Korea | 5.4% |
| Taiwan | 4.1% |
| Australia | 3.8% |
| Other Countries | 30.2% |
| Euro | 18.6% |
| Japanese Yen | 14.7% |
| Hong Kong Dollar | 13.1% |
| British Pound Sterling | 8.5% |
| Swiss Franc | 7.4% |
| Canadian Dollar | 5.8% |
| South Korean Won | 5.4% |
| Taiwan Dollar | 4.1% |
| Australian Dollar | 3.8% |
| Other Currencies | 18.6% |
| (g) | The Global Industry Classification Standard (GICS®) was developed by and/or is the exclusive property of MSCI, Inc. and S&P Global Market Intelligence Inc. (“S&P Global Market Intelligence”). GICS is a service mark of MSCI and S&P Global Market Intelligence and has been licensed for use by MFS. MFS has applied its own internal sector/industry classification methodology for equity securities and non-equity securities that are unclassified by GICS. |
| (x) | Represents the portfolio’s exposure to issuer countries as a percentage of a portfolio’s net assets. For purposes of this presentation, United States (included in Other Countries) includes Cash & Cash Equivalents. |
| (y) | Represents the portfolio’s exposure to a particular currency as a percentage of a portfolio's net assets. For purposes of this presentation, United States Dollar (included in Other Currencies) includes Cash & Cash Equivalents. |
September 1, 2020 through February 28, 2021
| Share Class | Annualized Expense Ratio | Beginning Account Value 9/01/20 | Ending Account Value 2/28/21 | Expenses Paid During Period (p) 9/01/20-2/28/21 | |
| A | Actual | 0.89% | $1,000.00 | $1,186.51 | $4.82 |
| Hypothetical (h) | 0.89% | $1,000.00 | $1,020.38 | $4.46 | |
| B | Actual | 1.64% | $1,000.00 | $1,182.35 | $8.87 |
| Hypothetical (h) | 1.64% | $1,000.00 | $1,016.66 | $8.20 | |
| C | Actual | 1.64% | $1,000.00 | $1,181.69 | $8.87 |
| Hypothetical (h) | 1.64% | $1,000.00 | $1,016.66 | $8.20 | |
| I | Actual | 0.64% | $1,000.00 | $1,188.05 | $3.47 |
| Hypothetical (h) | 0.64% | $1,000.00 | $1,021.62 | $3.21 | |
| R1 | Actual | 1.64% | $1,000.00 | $1,182.43 | $8.87 |
| Hypothetical (h) | 1.64% | $1,000.00 | $1,016.66 | $8.20 | |
| R2 | Actual | 1.14% | $1,000.00 | $1,185.54 | $6.18 |
| Hypothetical (h) | 1.14% | $1,000.00 | $1,019.14 | $5.71 | |
| R3 | Actual | 0.89% | $1,000.00 | $1,185.80 | $4.82 |
| Hypothetical (h) | 0.89% | $1,000.00 | $1,020.38 | $4.46 | |
| R4 | Actual | 0.64% | $1,000.00 | $1,187.96 | $3.47 |
| Hypothetical (h) | 0.64% | $1,000.00 | $1,021.62 | $3.21 | |
| R6 | Actual | 0.54% | $1,000.00 | $1,188.95 | $2.93 |
| Hypothetical (h) | 0.54% | $1,000.00 | $1,022.12 | $2.71 |
| (h) | 5% class return per year before expenses. |
| (p) | “Expenses Paid During Period” are equal to each class’s annualized expense ratio, as shown above, multiplied by the average account value over the period, multiplied by 181/365 (to reflect the one-half year period). Expenses paid do not include any applicable sales charges (loads). If these transaction costs had been included, your costs would have been higher. |
| Issuer | Shares/Par | Value ($) | ||
| Common Stocks – 98.2% | ||||
| Alcoholic Beverages – 0.3% | ||||
| China Resources Beer Holdings Co. Ltd. | 148,000 | $ 1,121,162 | ||
| Apparel Manufacturers – 3.4% | ||||
| Burberry Group PLC (a) | 42,598 | $ 1,077,455 | ||
| Compagnie Financiere Richemont S.A. | 23,980 | 2,308,765 | ||
| LVMH Moet Hennessy Louis Vuitton SE | 11,620 | 7,360,562 | ||
| Pandora A/S | 7,485 | 728,194 | ||
| Shenzhou International Group Holdings Ltd. | 81,000 | 1,698,044 | ||
| $13,173,020 | ||||
| Automotive – 4.7% | ||||
| Bridgestone Corp. | 66,300 | $ 2,613,504 | ||
| BYD Co. Ltd. | 24,500 | 620,545 | ||
| Compagnie Generale des Etablissements Michelin | 7,824 | 1,130,446 | ||
| Continental AG | 8,171 | 1,172,202 | ||
| D'Ieteren S.A. | 20,653 | 1,746,814 | ||
| Hero MotoCorp Ltd. | 52,733 | 2,307,428 | ||
| Magna International, Inc. | 63,687 | 5,362,445 | ||
| Stellantis N.V. (a) | 201,624 | 3,265,651 | ||
| $18,219,035 | ||||
| Brokerage & Asset Managers – 1.5% | ||||
| 3i Group PLC | 90,293 | $ 1,392,564 | ||
| B3 Brasil Bolsa Balcao S.A. | 102,800 | 996,046 | ||
| IG Group Holdings PLC | 297,580 | 3,229,644 | ||
| $5,618,254 | ||||
| Business Services – 2.3% | ||||
| Eurofins Scientific SE (a) | 36,801 | $ 3,269,783 | ||
| Infosys Ltd. | 210,505 | 3,570,056 | ||
| Tech Mahindra Ltd. | 165,497 | 2,062,283 | ||
| $8,902,122 | ||||
| Chemicals – 0.6% | ||||
| Mitsubishi Chemical Holdings Corp. | 340,400 | $ 2,400,215 | ||
| Computer Software – 0.6% | ||||
| Kingsoft Corp. | 277,000 | $ 1,950,737 | ||
| Topicus.com, Inc. (a) | 3,725 | 193,363 | ||
| $2,144,100 | ||||
| Issuer | Shares/Par | Value ($) | ||
| Common Stocks – continued | ||||
| Computer Software - Systems – 7.2% | ||||
| Constellation Software, Inc. | 2,884 | $ 3,734,107 | ||
| Fujitsu Ltd. | 37,900 | 5,461,269 | ||
| Hitachi Ltd. | 153,800 | 7,099,429 | ||
| Hon Hai Precision Industry Co. Ltd. | 276,000 | 1,113,287 | ||
| NICE Systems Ltd., ADR (a) | 5,580 | 1,280,833 | ||
| Samsung Electronics Co. Ltd. | 126,211 | 9,255,857 | ||
| $27,944,782 | ||||
| Construction – 1.5% | ||||
| Anhui Conch Cement Co. Ltd. | 262,500 | $ 1,688,756 | ||
| Ashtead Group PLC | 26,050 | 1,408,163 | ||
| LG Electronics, Inc. | 6,146 | 798,903 | ||
| Techtronic Industries Co. Ltd. | 135,000 | 2,060,736 | ||
| $5,956,558 | ||||
| Consumer Products – 1.1% | ||||
| L'Oréal | 12,041 | $ 4,399,101 | ||
| Consumer Services – 0.7% | ||||
| Carsales.com Ltd. | 131,933 | $ 1,896,315 | ||
| REA Group Ltd. | 8,280 | 873,156 | ||
| $2,769,471 | ||||
| Containers – 1.0% | ||||
| Brambles Ltd. | 295,510 | $ 2,268,641 | ||
| Viscofan S.A. | 24,711 | 1,736,728 | ||
| $4,005,369 | ||||
| Electrical Equipment – 2.1% | ||||
| Philips Lighting N.V. (n) | 43,120 | $ 1,875,554 | ||
| Schneider Electric SE | 42,945 | 6,365,511 | ||
| $8,241,065 | ||||
| Electronics – 4.9% | ||||
| Hoya Corp. | 9,700 | $ 1,101,084 | ||
| Legrand S.A. | 35,663 | 3,094,661 | ||
| NXP Semiconductors N.V. | 6,190 | 1,129,985 | ||
| Taiwan Semiconductor Manufacturing Co. Ltd., ADR | 95,828 | 12,068,578 | ||
| United Microelectronics Corp. | 799,000 | 1,564,519 | ||
| $18,958,827 | ||||
| Energy - Independent – 1.9% | ||||
| Aker BP ASA | 47,180 | $ 1,225,942 | ||
| China Shenhua Energy Co. Ltd. | 1,546,500 | 2,938,897 | ||
| Norsk Hydro ASA | 158,173 | 875,638 | ||
| Issuer | Shares/Par | Value ($) | ||
| Common Stocks – continued | ||||
| Energy - Independent – continued | ||||
| Tourmaline Oil Corp. | 117,113 | $ 2,131,335 | ||
| $7,171,812 | ||||
| Energy - Integrated – 2.5% | ||||
| China Petroleum & Chemical Corp. | 5,834,000 | $ 3,218,191 | ||
| Eni S.p.A. | 107,719 | 1,232,361 | ||
| Galp Energia SGPS S.A., “B” | 155,668 | 1,743,733 | ||
| LUKOIL PJSC, ADR | 45,239 | 3,370,305 | ||
| $9,564,590 | ||||
| Food & Beverages – 1.3% | ||||
| CJ CheilJedang Corp. | 2,381 | $ 861,483 | ||
| Coca-Cola European Partners PLC | 19,836 | 1,010,644 | ||
| Gruma S.A.B. de C.V. | 130,009 | 1,416,981 | ||
| Inner Mongolia Yili Industrial Group Co. Ltd., “A” | 106,600 | 713,197 | ||
| Nestle S.A. | 10,971 | 1,145,765 | ||
| $5,148,070 | ||||
| Food & Drug Stores – 1.9% | ||||
| Seven & I Holdings Co. Ltd. (l) | 96,700 | $ 3,693,123 | ||
| Sugi Holdings Co. Ltd. (l) | 28,600 | 1,990,825 | ||
| Tesco PLC | 475,981 | 1,490,731 | ||
| $7,174,679 | ||||
| Gaming & Lodging – 0.9% | ||||
| Flutter Entertainment PLC (a) | 18,228 | $ 3,506,785 | ||
| General Merchandise – 1.3% | ||||
| B&M European Value Retail S.A. | 320,661 | $ 2,441,014 | ||
| Bim Birlesik Magazalar A.S. | 133,768 | 1,190,570 | ||
| Walmart de Mexico S.A.B. de C.V. | 511,499 | 1,459,121 | ||
| $5,090,705 | ||||
| Insurance – 4.2% | ||||
| Aviva PLC | 314,427 | $ 1,585,338 | ||
| China Pacific Insurance Co. Ltd. | 835,400 | 3,832,453 | ||
| Manulife Financial Corp. | 256,907 | 5,121,586 | ||
| NN Group N.V. | 37,296 | 1,718,981 | ||
| PICC Property & Casualty Co. Ltd. | 1,228,000 | 929,338 | ||
| Samsung Fire & Marine Insurance Co. Ltd. | 18,712 | 2,881,332 | ||
| $16,069,028 | ||||
| Issuer | Shares/Par | Value ($) | ||
| Common Stocks – continued | ||||
| Internet – 4.2% | ||||
| Alibaba Group Holding Ltd., ADR (a) | 15,639 | $ 3,718,329 | ||
| NAVER Corp. | 7,077 | 2,362,149 | ||
| Scout24 AG | 11,621 | 875,632 | ||
| Tencent Holdings Ltd. | 109,100 | 9,318,535 | ||
| $16,274,645 | ||||
| Leisure & Toys – 1.3% | ||||
| DeNA Co. Ltd. | 44,000 | $ 872,796 | ||
| GungHo Online Entertainment, Inc. | 136,300 | 2,786,226 | ||
| Nintendo Co. Ltd. | 2,500 | 1,518,598 | ||
| $5,177,620 | ||||
| Machinery & Tools – 3.0% | ||||
| AirTAC International Group | 26,000 | $ 907,697 | ||
| Epiroc AB, “A” | 263,027 | 5,582,070 | ||
| GEA Group AG | 92,507 | 3,194,404 | ||
| Ritchie Bros. Auctioneers, Inc. | 19,593 | 1,069,255 | ||
| Volvo Group | 30,280 | 775,656 | ||
| $11,529,082 | ||||
| Major Banks – 9.1% | ||||
| ABSA Group Ltd. | 273,216 | $ 2,190,964 | ||
| Bank of China Ltd. | 2,540,000 | 890,717 | ||
| BNP Paribas | 42,038 | 2,499,276 | ||
| BOC Hong Kong Holdings Ltd. | 769,000 | 2,557,897 | ||
| China Construction Bank Corp. | 4,955,000 | 3,979,868 | ||
| Credit Suisse Group AG | 114,723 | 1,655,295 | ||
| DBS Group Holdings Ltd. | 286,600 | 5,680,575 | ||
| Industrial & Commercial Bank of China, “H” | 1,392,000 | 908,086 | ||
| Mitsubishi UFJ Financial Group, Inc. | 297,000 | 1,572,227 | ||
| National Australia Bank Ltd. | 127,762 | 2,429,106 | ||
| Sumitomo Mitsui Financial Group, Inc. | 132,700 | 4,703,510 | ||
| UBS Group AG | 380,909 | 5,904,268 | ||
| $34,971,789 | ||||
| Medical & Health Technology & Services – 0.7% | ||||
| Miraca Holdings, Inc. | 57,100 | $ 1,765,040 | ||
| Sonic Healthcare Ltd. | 43,700 | 1,066,920 | ||
| $2,831,960 | ||||
| Medical Equipment – 0.5% | ||||
| Olympus Corp. | 37,500 | $ 789,492 | ||
| Top Glove Corp. | 822,100 | 1,058,654 | ||
| $1,848,146 | ||||
| Issuer | Shares/Par | Value ($) | ||
| Common Stocks – continued | ||||
| Metals & Mining – 3.7% | ||||
| Fortescue Metals Group Ltd. | 200,235 | $ 3,724,799 | ||
| POSCO | 8,623 | 2,160,547 | ||
| Rio Tinto PLC | 60,744 | 5,235,968 | ||
| Tata Steel Ltd. | 155,390 | 1,506,407 | ||
| Vale S.A. | 100,300 | 1,691,652 | ||
| $14,319,373 | ||||
| Natural Gas - Distribution – 0.4% | ||||
| Italgas S.p.A. | 261,961 | $ 1,543,050 | ||
| Natural Gas - Pipeline – 0.3% | ||||
| Pembina Pipeline Corp. (l) | 44,501 | $ 1,131,583 | ||
| Network & Telecom – 0.6% | ||||
| LM Ericsson Telephone Co., “B” | 58,030 | $ 724,353 | ||
| VTech Holdings Ltd. | 171,300 | 1,436,619 | ||
| $2,160,972 | ||||
| Other Banks & Diversified Financials – 3.1% | ||||
| Hana Financial Group, Inc. | 49,195 | $ 1,622,318 | ||
| Julius Baer Group Ltd. | 51,290 | 3,146,245 | ||
| KB Financial Group, Inc. | 25,016 | 964,105 | ||
| ORIX Corp. | 74,700 | 1,284,574 | ||
| Sberbank of Russia PJSC, ADR | 220,687 | 3,199,962 | ||
| Tisco Financial Group PLC | 614,900 | 1,938,460 | ||
| $12,155,664 | ||||
| Pharmaceuticals – 6.7% | ||||
| Bayer AG | 75,688 | $ 4,577,029 | ||
| Kyowa Kirin Co. Ltd. | 57,400 | 1,605,008 | ||
| Novartis AG | 75,288 | 6,471,466 | ||
| Novo Nordisk A.S., “B” | 73,822 | 5,245,707 | ||
| Roche Holding AG | 24,608 | 8,060,192 | ||
| $25,959,402 | ||||
| Precious Metals & Minerals – 0.5% | ||||
| Impala Platinum Holdings Ltd. (a) | 55,033 | $ 894,967 | ||
| Sibanye-Stillwater Ltd. | 203,365 | 941,073 | ||
| $1,836,040 | ||||
| Printing & Publishing – 1.6% | ||||
| Transcontinental, Inc., “A” | 162,379 | $ 2,790,530 | ||
| Wolters Kluwer N.V. | 41,579 | 3,294,980 | ||
| $6,085,510 | ||||
| Issuer | Shares/Par | Value ($) | ||
| Common Stocks – continued | ||||
| Railroad & Shipping – 1.3% | ||||
| Canadian Pacific Railway Ltd. | 7,817 | $ 2,785,766 | ||
| Sankyu, Inc. | 54,200 | 2,280,877 | ||
| $5,066,643 | ||||
| Real Estate – 2.5% | ||||
| Agile Property Holdings Ltd. | 750,000 | $ 1,059,763 | ||
| Aldar Properties PJSC | 2,260,632 | 2,252,539 | ||
| Goodman Group, REIT | 200,560 | 2,555,553 | ||
| LEG Immobilien AG | 11,735 | 1,601,935 | ||
| Longfor Properties Co. Ltd. | 161,000 | 954,818 | ||
| Shimao Property Holdings Ltd. | 400,000 | 1,321,955 | ||
| $9,746,563 | ||||
| Specialty Chemicals – 2.1% | ||||
| Akzo Nobel N.V. | 20,285 | $ 2,094,071 | ||
| Linde PLC | 4,214 | 1,038,235 | ||
| Nitto Denko Corp. | 43,400 | 3,729,359 | ||
| Orbia Advance Corp. S.A.B. de C.V. | 513,254 | 1,196,963 | ||
| $8,058,628 | ||||
| Specialty Stores – 2.5% | ||||
| HelloFresh SE (a) | 9,382 | $ 730,131 | ||
| JD.com, Inc., ADR (a) | 21,870 | 2,052,937 | ||
| NEXT PLC (a) | 26,729 | 2,815,257 | ||
| Ocado Group PLC (a) | 34,547 | 1,058,879 | ||
| Zalando SE (a) | 6,501 | 666,878 | ||
| ZOZO, Inc. | 73,300 | 2,289,873 | ||
| $9,613,955 | ||||
| Telecommunications - Wireless – 2.1% | ||||
| KDDI Corp. | 30,400 | $ 938,280 | ||
| SoftBank Group Corp. | 22,100 | 2,051,499 | ||
| Vodafone Group PLC | 3,077,228 | 5,231,234 | ||
| $8,221,013 | ||||
| Telephone Services – 0.3% | ||||
| Hellenic Telecommunications Organization S.A. | 85,905 | $ 1,320,485 | ||
| Tobacco – 2.3% | ||||
| British American Tobacco PLC | 113,558 | $ 3,932,285 | ||
| Imperial Tobacco Group PLC | 113,495 | 2,107,756 | ||
| Japan Tobacco, Inc. | 164,900 | 2,989,363 | ||
| $9,029,404 | ||||
| Issuer | Shares/Par | Value ($) | ||
| Common Stocks – continued | ||||
| Trucking – 0.4% | ||||
| Yamato Holdings Co. Ltd. | 53,700 | $ 1,411,580 | ||
| Utilities - Electric Power – 3.1% | ||||
| AltaGas Ltd. | 149,702 | $ 2,269,175 | ||
| Boralex, Inc., “A” | 38,988 | 1,356,584 | ||
| CLP Holdings Ltd. | 230,500 | 2,248,106 | ||
| E.ON SE | 130,918 | 1,334,755 | ||
| Energisa S.A. | 178,800 | 1,393,276 | ||
| Iberdrola S.A. | 268,949 | 3,382,918 | ||
| $11,984,814 | ||||
| Total Common Stocks (Identified Cost, $304,583,125) | $ 379,856,671 | |||
| Preferred Stocks – 0.7% | ||||
| Major Banks – 0.7% | ||||
| Banco Bradesco S.A. (Identified Cost, $2,662,343) | 603,500 | $ 2,476,803 | ||
| Investment Companies (h) – 0.4% | ||||
| Money Market Funds – 0.4% | ||||
| MFS Institutional Money Market Portfolio, 0.07% (v) (Identified Cost, $1,671,509) | 1,671,510 | $ 1,671,510 | ||
| Other Assets, Less Liabilities – 0.7% | 2,675,468 | |||
| Net Assets – 100.0% | $ 386,680,452 | |||
| (a) | Non-income producing security. | |||
| (h) | An affiliated issuer, which may be considered one in which the fund owns 5% or more of the outstanding voting securities, or a company which is under common control. At period end, the aggregate values of the fund's investments in affiliated issuers and in unaffiliated issuers were $1,671,510 and $382,333,474, respectively. | |||
| (l) | A portion of this security is on loan. See Note 2 for additional information. | |||
| (n) | Securities exempt from registration under Rule 144A of the Securities Act of 1933. These securities may be sold in the ordinary course of business in transactions exempt from registration, normally to qualified institutional buyers. At period end, the aggregate value of these securities was $1,875,554, representing 0.5% of net assets. | |||
| (v) | Affiliated issuer that is available only to investment companies managed by MFS. The rate quoted for the MFS Institutional Money Market Portfolio is the annualized seven-day yield of the fund at period end. |
| The following abbreviations are used in this report and are defined: | |
| ADR | American Depositary Receipt |
| REIT | Real Estate Investment Trust |
| Assets | |
| Investments in unaffiliated issuers, at value, including $2,897,501 of securities on loan (identified cost, $307,245,468) | $382,333,474 |
| Investments in affiliated issuers, at value (identified cost, $1,671,509) | 1,671,510 |
| Foreign currency, at value (identified cost, $430,646) | 427,810 |
| Receivables for | |
| Investments sold | 343,268 |
| Fund shares sold | 742,826 |
| Interest and dividends | 1,517,664 |
| Receivable from investment adviser | 10,411 |
| Other assets | 1,366 |
| Total assets | $387,048,329 |
| Liabilities | |
| Payables for | |
| Fund shares reacquired | $114,723 |
| Payable to affiliates | |
| Administrative services fee | 657 |
| Shareholder servicing costs | 29,042 |
| Distribution and service fees | 2,891 |
| Payable for independent Trustees' compensation | 576 |
| Deferred country tax expense payable | 85,281 |
| Accrued expenses and other liabilities | 134,707 |
| Total liabilities | $367,877 |
| Net assets | $386,680,452 |
| Net assets consist of | |
| Paid-in capital | $321,544,769 |
| Total distributable earnings (loss) | 65,135,683 |
| Net assets | $386,680,452 |
| Shares of beneficial interest outstanding | 30,749,957 |
| Net assets | Shares outstanding | Net asset value per share (a) | |
| Class A | $100,559,574 | 8,024,672 | $12.53 |
| Class B | 168,557 | 13,497 | 12.49 |
| Class C | 237,073 | 19,007 | 12.47 |
| Class I | 9,620,652 | 764,562 | 12.58 |
| Class R1 | 203,155 | 16,389 | 12.40 |
| Class R2 | 182,502 | 14,527 | 12.56 |
| Class R3 | 75,875 | 6,004 | 12.64 |
| Class R4 | 74,045 | 5,882 | 12.59 |
| Class R6 | 275,559,019 | 21,885,417 | 12.59 |
| (a) | Maximum offering price per share was equal to the net asset value per share for all share classes, except for Class A, for which the maximum offering price per share was $13.29 [100 / 94.25 x $12.53]. On sales of $50,000 or more, the maximum offering price of Class A shares is reduced. A contingent deferred sales charge may be imposed on redemptions of Class A, Class B, and Class C shares. Redemption price per share was equal to the net asset value per share for Classes I, R1, R2, R3, R4, and R6. |
| Net investment income (loss) | |
| Income | |
| Dividends | $4,773,210 |
| Other | 20,379 |
| Income on securities loaned | 1,546 |
| Dividends from affiliated issuers | 894 |
| Foreign taxes withheld | (408,433) |
| Total investment income | $4,387,596 |
| Expenses | |
| Management fee | $923,488 |
| Distribution and service fees | 126,963 |
| Shareholder servicing costs | 56,864 |
| Administrative services fee | 28,573 |
| Independent Trustees' compensation | 4,050 |
| Custodian fee | 81,463 |
| Shareholder communications | 5,742 |
| Audit and tax fees | 52,836 |
| Legal fees | 1,404 |
| Registration fees | 63,213 |
| Miscellaneous | 17,170 |
| Total expenses | $1,361,766 |
| Reduction of expenses by investment adviser | (186,978) |
| Net expenses | $1,174,788 |
| Net investment income (loss) | $3,212,808 |
| Realized and unrealized gain (loss) | |
| Realized gain (loss) (identified cost basis) | |
| Unaffiliated issuers (net of $36 country tax) | $19,270,745 |
| Foreign currency | 8,652 |
| Net realized gain (loss) | $19,279,397 |
| Change in unrealized appreciation or depreciation | |
| Unaffiliated issuers (net of $85,281 increase in deferred country tax) | $41,918,201 |
| Affiliated issuers | 1 |
| Translation of assets and liabilities in foreign currencies | (27,555) |
| Net unrealized gain (loss) | $41,890,647 |
| Net realized and unrealized gain (loss) | $61,170,044 |
| Change in net assets from operations | $64,382,852 |
| Six months ended | Year ended | |
| 2/28/21 (unaudited) | 8/31/20 | |
| Change in net assets | ||
| From operations | ||
| Net investment income (loss) | $3,212,808 | $8,341,490 |
| Net realized gain (loss) | 19,279,397 | (22,018,905) |
| Net unrealized gain (loss) | 41,890,647 | 38,954,335 |
| Change in net assets from operations | $64,382,852 | $25,276,920 |
| Total distributions to shareholders | $(8,950,027) | $(9,250,211) |
| Change in net assets from fund share transactions | $(15,931,662) | $36,975,806 |
| Total change in net assets | $39,501,163 | $53,002,515 |
| Net assets | ||
| At beginning of period | 347,179,289 | 294,176,774 |
| At end of period | $386,680,452 | $347,179,289 |
| Class A | Six months ended | Year ended | ||||
| 2/28/21 (unaudited) | 8/31/20 | 8/31/19 | 8/31/18 | 8/31/17 | 8/31/16(c) | |
| Net asset value, beginning of period | $10.79 | $10.37 | $11.71 | $11.85 | $9.82 | $10.00 |
| Income (loss) from investment operations | ||||||
| Net investment income (loss) (d) | $0.09 | $0.25 | $0.30 | $0.30 | $0.25 | $0.25 |
| Net realized and unrealized gain (loss) | 1.91 | 0.47 | (1.01) | (0.12) | 1.82 | (0.32) |
| Total from investment operations | $2.00 | $0.72 | $(0.71) | $0.18 | $2.07 | $(0.07) |
| Less distributions declared to shareholders | ||||||
| From net investment income | $(0.26) | $(0.30) | $(0.26) | $(0.18) | $(0.04) | $(0.06) |
| From net realized gain | — | — | (0.37) | (0.14) | — | (0.05) |
| Total distributions declared to shareholders | $(0.26) | $(0.30) | $(0.63) | $(0.32) | $(0.04) | $(0.11) |
| Net asset value, end of period (x) | $12.53 | $10.79 | $10.37 | $11.71 | $11.85 | $9.82 |
| Total return (%) (r)(s)(t)(x) | 18.65(n) | 6.85 | (5.67) | 1.47 | 21.15 | (0.64)(n) |
| Ratios (%) (to average net assets) and Supplemental data: | ||||||
| Expenses before expense reductions (f) | 0.99(a) | 0.99 | 1.00 | 0.99 | 0.98 | 5.84(a) |
| Expenses after expense reductions (f) | 0.89(a) | 0.89 | 0.89 | 0.89 | 0.89 | 0.89(a) |
| Net investment income (loss) | 1.48(a)(l) | 2.39 | 2.80 | 2.49 | 2.34 | 2.70(a) |
| Portfolio turnover | 34(n) | 72 | 58 | 69 | 63 | 64(n) |
| Net assets at end of period (000 omitted) | $100,560 | $93,455 | $84,917 | $88,168 | $535 | $139 |
| Class B | Six months ended | Year ended | ||||
| 2/28/21 (unaudited) | 8/31/20 | 8/31/19 | 8/31/18 | 8/31/17 | 8/31/16(c) | |
| Net asset value, beginning of period | $10.72 | $10.32 | $11.64 | $11.75 | $9.78 | $10.00 |
| Income (loss) from investment operations | ||||||
| Net investment income (loss) (d) | $0.04 | $0.17 | $0.24 | $0.20 | $0.16 | $0.15 |
| Net realized and unrealized gain (loss) | 1.91 | 0.47 | (1.02) | (0.11) | 1.81 | (0.28) |
| Total from investment operations | $1.95 | $0.64 | $(0.78) | $0.09 | $1.97 | $(0.13) |
| Less distributions declared to shareholders | ||||||
| From net investment income | $(0.18) | $(0.24) | $(0.17) | $(0.06) | $— | $(0.04) |
| From net realized gain | — | — | (0.37) | (0.14) | — | (0.05) |
| Total distributions declared to shareholders | $(0.18) | $(0.24) | $(0.54) | $(0.20) | $— | $(0.09) |
| Net asset value, end of period (x) | $12.49 | $10.72 | $10.32 | $11.64 | $11.75 | $9.78 |
| Total return (%) (r)(s)(t)(x) | 18.24(n) | 6.06 | (6.41) | 0.73 | 20.14 | (1.27)(n) |
| Ratios (%) (to average net assets) and Supplemental data: | ||||||
| Expenses before expense reductions (f) | 1.74(a) | 1.74 | 1.75 | 1.74 | 1.73 | 7.12(a) |
| Expenses after expense reductions (f) | 1.64(a) | 1.64 | 1.64 | 1.64 | 1.64 | 1.63(a) |
| Net investment income (loss) | 0.73(a)(l) | 1.61 | 2.28 | 1.63 | 1.51 | 1.64(a) |
| Portfolio turnover | 34(n) | 72 | 58 | 69 | 63 | 64(n) |
| Net assets at end of period (000 omitted) | $169 | $148 | $152 | $97 | $109 | $54 |
| Class C | Six months ended | Year ended | ||||
| 2/28/21 (unaudited) | 8/31/20 | 8/31/19 | 8/31/18 | 8/31/17 | 8/31/16(c) | |
| Net asset value, beginning of period | $10.70 | $10.28 | $11.59 | $11.75 | $9.78 | $10.00 |
| Income (loss) from investment operations | ||||||
| Net investment income (loss) (d) | $0.04 | $0.17 | $0.22 | $0.21 | $0.16 | $0.16 |
| Net realized and unrealized gain (loss) | 1.90 | 0.47 | (1.00) | (0.11) | 1.81 | (0.29) |
| Total from investment operations | $1.94 | $0.64 | $(0.78) | $0.10 | $1.97 | $(0.13) |
| Less distributions declared to shareholders | ||||||
| From net investment income | $(0.17) | $(0.22) | $(0.16) | $(0.12) | $— | $(0.04) |
| From net realized gain | — | — | (0.37) | (0.14) | — | (0.05) |
| Total distributions declared to shareholders | $(0.17) | $(0.22) | $(0.53) | $(0.26) | $— | $(0.09) |
| Net asset value, end of period (x) | $12.47 | $10.70 | $10.28 | $11.59 | $11.75 | $9.78 |
| Total return (%) (r)(s)(t)(x) | 18.17(n) | 6.08 | (6.42) | 0.74 | 20.14 | (1.27)(n) |
| Ratios (%) (to average net assets) and Supplemental data: | ||||||
| Expenses before expense reductions (f) | 1.74(a) | 1.74 | 1.75 | 1.75 | 1.73 | 7.03(a) |
| Expenses after expense reductions (f) | 1.64(a) | 1.64 | 1.64 | 1.64 | 1.64 | 1.63(a) |
| Net investment income (loss) | 0.73(a)(l) | 1.64 | 2.04 | 1.73 | 1.54 | 1.70(a) |
| Portfolio turnover | 34(n) | 72 | 58 | 69 | 63 | 64(n) |
| Net assets at end of period (000 omitted) | $237 | $220 | $240 | $284 | $133 | $59 |
| Class I | Six months ended | Year ended | ||||
| 2/28/21 (unaudited) | 8/31/20 | 8/31/19 | 8/31/18 | 8/31/17 | 8/31/16(c) | |
| Net asset value, beginning of period | $10.84 | $10.42 | $11.77 | $11.88 | $9.84 | $10.00 |
| Income (loss) from investment operations | ||||||
| Net investment income (loss) (d) | $0.10 | $0.31 | $0.31 | $0.31 | $0.29 | $0.33 |
| Net realized and unrealized gain (loss) | 1.92 | 0.44 | (1.00) | (0.10) | 1.80 | (0.37) |
| Total from investment operations | $2.02 | $0.75 | $(0.69) | $0.21 | $2.09 | $(0.04) |
| Less distributions declared to shareholders | ||||||
| From net investment income | $(0.28) | $(0.33) | $(0.29) | $(0.18) | $(0.05) | $(0.07) |
| From net realized gain | — | — | (0.37) | (0.14) | — | (0.05) |
| Total distributions declared to shareholders | $(0.28) | $(0.33) | $(0.66) | $(0.32) | $(0.05) | $(0.12) |
| Net asset value, end of period (x) | $12.58 | $10.84 | $10.42 | $11.77 | $11.88 | $9.84 |
| Total return (%) (r)(s)(t)(x) | 18.80(n) | 7.09 | (5.45) | 1.74 | 21.37 | (0.37)(n) |
| Ratios (%) (to average net assets) and Supplemental data: | ||||||
| Expenses before expense reductions (f) | 0.74(a) | 0.75 | 0.75 | 0.74 | 0.73 | 4.94(a) |
| Expenses after expense reductions (f) | 0.64(a) | 0.64 | 0.64 | 0.64 | 0.64 | 0.64(a) |
| Net investment income (loss) | 1.73(a)(l) | 3.06 | 2.89 | 2.50 | 2.70 | 3.65(a) |
| Portfolio turnover | 34(n) | 72 | 58 | 69 | 63 | 64(n) |
| Net assets at end of period (000 omitted) | $9,621 | $5,183 | $1,652 | $1,760 | $1,259 | $640 |
| Class R1 | Six months ended | Year ended | ||||
| 2/28/21 (unaudited) | 8/31/20 | 8/31/19 | 8/31/18 | 8/31/17 | 8/31/16(c) | |
| Net asset value, beginning of period | $10.65 | $10.24 | $11.63 | $11.75 | $9.78 | $10.00 |
| Income (loss) from investment operations | ||||||
| Net investment income (loss) (d) | $0.04 | $0.17 | $0.22 | $0.19 | $0.15 | $0.15 |
| Net realized and unrealized gain (loss) | 1.89 | 0.47 | (1.01) | (0.10) | 1.82 | (0.28) |
| Total from investment operations | $1.93 | $0.64 | $(0.79) | $0.09 | $1.97 | $(0.13) |
| Less distributions declared to shareholders | ||||||
| From net investment income | $(0.18) | $(0.23) | $(0.23) | $(0.07) | $— | $(0.04) |
| From net realized gain | — | — | (0.37) | (0.14) | — | (0.05) |
| Total distributions declared to shareholders | $(0.18) | $(0.23) | $(0.60) | $(0.21) | $— | $(0.09) |
| Net asset value, end of period (x) | $12.40 | $10.65 | $10.24 | $11.63 | $11.75 | $9.78 |
| Total return (%) (r)(s)(t)(x) | 18.24(n) | 6.13 | (6.44) | 0.72 | 20.14 | (1.27)(n) |
| Ratios (%) (to average net assets) and Supplemental data: | ||||||
| Expenses before expense reductions (f) | 1.74(a) | 1.74 | 1.75 | 1.73 | 1.72 | 7.19(a) |
| Expenses after expense reductions (f) | 1.64(a) | 1.64 | 1.64 | 1.64 | 1.64 | 1.63(a) |
| Net investment income (loss) | 0.73(a)(l) | 1.63 | 2.09 | 1.54 | 1.41 | 1.60(a) |
| Portfolio turnover | 34(n) | 72 | 58 | 69 | 63 | 64(n) |
| Net assets at end of period (000 omitted) | $203 | $166 | $146 | $60 | $59 | $49 |
| Class R2 | Six months ended | Year ended | ||||
| 2/28/21 (unaudited) | 8/31/20 | 8/31/19 | 8/31/18 | 8/31/17 | 8/31/16(c) | |
| Net asset value, beginning of period | $10.80 | $10.38 | $11.73 | $11.84 | $9.81 | $10.00 |
| Income (loss) from investment operations | ||||||
| Net investment income (loss) (d) | $0.07 | $0.22 | $0.27 | $0.29 | $0.20 | $0.19 |
| Net realized and unrealized gain (loss) | 1.92 | 0.47 | (1.01) | (0.13) | 1.83 | (0.28) |
| Total from investment operations | $1.99 | $0.69 | $(0.74) | $0.16 | $2.03 | $(0.09) |
| Less distributions declared to shareholders | ||||||
| From net investment income | $(0.23) | $(0.27) | $(0.24) | $(0.13) | $(0.00)(w) | $(0.05) |
| From net realized gain | — | — | (0.37) | (0.14) | — | (0.05) |
| Total distributions declared to shareholders | $(0.23) | $(0.27) | $(0.61) | $(0.27) | $(0.00)(w) | $(0.10) |
| Net asset value, end of period (x) | $12.56 | $10.80 | $10.38 | $11.73 | $11.84 | $9.81 |
| Total return (%) (r)(s)(t)(x) | 18.55(n) | 6.56 | (5.95) | 1.27 | 20.74 | (0.82)(n) |
| Ratios (%) (to average net assets) and Supplemental data: | ||||||
| Expenses before expense reductions (f) | 1.24(a) | 1.24 | 1.25 | 1.25 | 1.22 | 6.68(a) |
| Expenses after expense reductions (f) | 1.14(a) | 1.14 | 1.14 | 1.14 | 1.14 | 1.13(a) |
| Net investment income (loss) | 1.23(a)(l) | 2.12 | 2.54 | 2.34 | 1.90 | 2.11(a) |
| Portfolio turnover | 34(n) | 72 | 58 | 69 | 63 | 64(n) |
| Net assets at end of period (000 omitted) | $183 | $156 | $164 | $167 | $60 | $50 |
| Class R3 | Six months ended | Year ended | ||||
| 2/28/21 (unaudited) | 8/31/20 | 8/31/19 | 8/31/18 | 8/31/17 | 8/31/16(c) | |
| Net asset value, beginning of period | $10.88 | $10.45 | $11.80 | $11.91 | $9.84 | $10.00 |
| Income (loss) from investment operations | ||||||
| Net investment income (loss) (d) | $0.09 | $0.25 | $0.30 | $0.28 | $0.23 | $0.29 |
| Net realized and unrealized gain (loss) | 1.93 | 0.49 | (1.02) | (0.09) | 1.84 | (0.34) |
| Total from investment operations | $2.02 | $0.74 | $(0.72) | $0.19 | $2.07 | $(0.05) |
| Less distributions declared to shareholders | ||||||
| From net investment income | $(0.26) | $(0.31) | $(0.26) | $(0.16) | $— | $(0.06) |
| From net realized gain | — | — | (0.37) | (0.14) | — | (0.05) |
| Total distributions declared to shareholders | $(0.26) | $(0.31) | $(0.63) | $(0.30) | $— | $(0.11) |
| Net asset value, end of period (x) | $12.64 | $10.88 | $10.45 | $11.80 | $11.91 | $9.84 |
| Total return (%) (r)(s)(t)(x) | 18.67(n) | 6.92 | (5.72) | 1.50 | 21.04 | (0.44)(n) |
| Ratios (%) (to average net assets) and Supplemental data: | ||||||
| Expenses before expense reductions (f) | 0.99(a) | 0.99 | 1.00 | 0.98 | 0.97 | 5.94(a) |
| Expenses after expense reductions (f) | 0.89(a) | 0.89 | 0.89 | 0.89 | 0.89 | 0.87(a) |
| Net investment income (loss) | 1.48(a)(l) | 2.37 | 2.79 | 2.29 | 2.15 | 3.16(a) |
| Portfolio turnover | 34(n) | 72 | 58 | 69 | 63 | 64(n) |
| Net assets at end of period (000 omitted) | $76 | $64 | $58 | $61 | $60 | $50 |
| Class R4 | Six months ended | Year ended | ||||
| 2/28/21 (unaudited) | 8/31/20 | 8/31/19 | 8/31/18 | 8/31/17 | 8/31/16(c) | |
| Net asset value, beginning of period | $10.85 | $10.42 | $11.77 | $11.88 | $9.84 | $10.00 |
| Income (loss) from investment operations | ||||||
| Net investment income (loss) (d) | $0.10 | $0.27 | $0.33 | $0.31 | $0.25 | $0.24 |
| Net realized and unrealized gain (loss) | 1.92 | 0.49 | (1.02) | (0.10) | 1.84 | (0.28) |
| Total from investment operations | $2.02 | $0.76 | $(0.69) | $0.21 | $2.09 | $(0.04) |
| Less distributions declared to shareholders | ||||||
| From net investment income | $(0.28) | $(0.33) | $(0.29) | $(0.18) | $(0.05) | $(0.07) |
| From net realized gain | — | — | (0.37) | (0.14) | — | (0.05) |
| Total distributions declared to shareholders | $(0.28) | $(0.33) | $(0.66) | $(0.32) | $(0.05) | $(0.12) |
| Net asset value, end of period (x) | $12.59 | $10.85 | $10.42 | $11.77 | $11.88 | $9.84 |
| Total return (%) (r)(s)(t)(x) | 18.80(n) | 7.18 | (5.45) | 1.74 | 21.36 | (0.37)(n) |
| Ratios (%) (to average net assets) and Supplemental data: | ||||||
| Expenses before expense reductions (f) | 0.74(a) | 0.74 | 0.75 | 0.73 | 0.72 | 6.18(a) |
| Expenses after expense reductions (f) | 0.64(a) | 0.64 | 0.64 | 0.64 | 0.64 | 0.63(a) |
| Net investment income (loss) | 1.73(a)(l) | 2.62 | 3.04 | 2.54 | 2.41 | 2.60(a) |
| Portfolio turnover | 34(n) | 72 | 58 | 69 | 63 | 64(n) |
| Net assets at end of period (000 omitted) | $74 | $62 | $58 | $62 | $60 | $50 |
| Class R6 | Six months ended | Year ended | ||||
| 2/28/21 (unaudited) | 8/31/20 | 8/31/19 | 8/31/18 | 8/31/17 | 8/31/16(c) | |
| Net asset value, beginning of period | $10.85 | $10.43 | $11.78 | $11.88 | $9.84 | $10.00 |
| Income (loss) from investment operations | ||||||
| Net investment income (loss) (d) | $0.11 | $0.29 | $0.34 | $0.32 | $0.26 | $0.24 |
| Net realized and unrealized gain (loss) | 1.92 | 0.47 | (1.02) | (0.09) | 1.84 | (0.28) |
| Total from investment operations | $2.03 | $0.76 | $(0.68) | $0.23 | $2.10 | $(0.04) |
| Less distributions declared to shareholders | ||||||
| From net investment income | $(0.29) | $(0.34) | $(0.30) | $(0.19) | $(0.06) | $(0.07) |
| From net realized gain | — | — | (0.37) | (0.14) | — | (0.05) |
| Total distributions declared to shareholders | $(0.29) | $(0.34) | $(0.67) | $(0.33) | $(0.06) | $(0.12) |
| Net asset value, end of period (x) | $12.59 | $10.85 | $10.43 | $11.78 | $11.88 | $9.84 |
| Total return (%) (r)(s)(t)(x) | 18.90(n) | 7.18 | (5.33) | 1.86 | 21.41 | (0.36)(n) |
| Ratios (%) (to average net assets) and Supplemental data: | ||||||
| Expenses before expense reductions (f) | 0.64(a) | 0.65 | 0.65 | 0.65 | 0.68 | 3.06(a) |
| Expenses after expense reductions (f) | 0.54(a) | 0.55 | 0.54 | 0.54 | 0.60 | 0.60(a) |
| Net investment income (loss) | 1.84(a)(l) | 2.76 | 3.13 | 2.60 | 2.43 | 2.61(a) |
| Portfolio turnover | 34(n) | 72 | 58 | 69 | 63 | 64(n) |
| Net assets at end of period (000 omitted) | $275,559 | $247,726 | $206,790 | $207,449 | $196,685 | $163,355 |
| (a) | Annualized. |
| (c) | For the period from the commencement of the fund’s investment operations, September 15, 2015, through the stated period end. |
| (d) | Per share data is based on average shares outstanding. |
| (f) | Ratios do not reflect reductions from fees paid indirectly, if applicable. |
| (l) | Recognition of net investment income by the fund may be affected by the timing of the declaration of dividends by companies in which the fund invests and the actual annual net investment income ratio may differ. |
| (n) | Not annualized. |
| (r) | Certain expenses have been reduced without which performance would have been lower. |
| (s) | From time to time the fund may receive proceeds from litigation settlements, without which performance would be lower. |
| (t) | Total returns do not include any applicable sales charges. |
| (w) | Per share amount was less than $0.01. |
| (x) | The net asset values and total returns have been calculated on net assets which include adjustments made in accordance with U.S. generally accepted accounting principles required at period end for financial reporting purposes. |
| Financial Instruments | Level 1 | Level 2 | Level 3 | Total |
| Equity Securities: | ||||
| Japan | $21,314,274 | $35,633,477 | $— | $56,947,751 |
| China | 29,153,241 | 13,763,087 | — | 42,916,328 |
| United Kingdom | 34,016,932 | — | — | 34,016,932 |
| Switzerland | 28,691,996 | — | — | 28,691,996 |
| France | 28,119,340 | — | — | 28,119,340 |
| Canada | 27,945,729 | — | — | 27,945,729 |
| South Korea | 9,887,829 | 11,018,865 | — | 20,906,694 |
| Taiwan | 12,068,578 | 3,585,503 | — | 15,654,081 |
| Australia | 5,518,788 | 9,295,702 | — | 14,814,490 |
| Other Countries | 94,196,270 | 18,123,863 | — | 112,320,133 |
| Mutual Funds | 1,671,510 | — | — | 1,671,510 |
| Total | $292,584,487 | $91,420,497 | $— | $384,004,984 |
| Year ended 8/31/20 | |
| Ordinary income (including any short-term capital gains) | $9,250,211 |
| As of 2/28/21 | |
| Cost of investments | $308,916,977 |
| Gross appreciation | 85,359,285 |
| Gross depreciation | (10,271,278) |
| Net unrealized appreciation (depreciation) | $ 75,088,007 |
| As of 8/31/20 | |
| Undistributed ordinary income | 6,758,565 |
| Capital loss carryforwards | (23,361,368) |
| Other temporary differences | (3,879) |
| Net unrealized appreciation (depreciation) | 26,309,540 |
| Short-Term | $(7,847,623) |
| Long-Term | (15,513,745) |
| Total | $(23,361,368) |
| Six months ended 2/28/21 | Year ended 8/31/20 | ||
| Class A | $2,240,921 | $2,350,834 | |
| Class B | 2,386 | 3,422 | |
| Class C | 3,123 | 4,533 | |
| Class I | 110,356 | 51,103 | |
| Class R1 | 2,896 | 3,314 | |
| Class R2 | 3,338 | 3,830 | |
| Class R3 | 1,512 | 1,725 | |
| Class R4 | 1,633 | 1,860 | |
| Class R6 | 6,583,862 | 6,829,590 | |
| Total | $8,950,027 | $9,250,211 |
| Up to $1 billion | 0.50% |
| In excess of $1 billion and up to $2.5 billion | 0.475% |
| In excess of $2.5 billion | 0.45% |
| Classes | ||||||||
| A | B | C | I | R1 | R2 | R3 | R4 | R6 |
| 0.89% | 1.64% | 1.64% | 0.64% | 1.64% | 1.14% | 0.89% | 0.64% | 0.60% |
| Distribution Fee Rate (d) | Service Fee Rate (d) | Total Distribution Plan (d) | Annual Effective Rate (e) | Distribution and Service Fee | |
| Class A | — | 0.25% | 0.25% | 0.25% | $ 123,679 |
| Class B | 0.75% | 0.25% | 1.00% | 1.00% | 789 |
| Class C | 0.75% | 0.25% | 1.00% | 1.00% | 1,072 |
| Class R1 | 0.75% | 0.25% | 1.00% | 1.00% | 915 |
| Class R2 | 0.25% | 0.25% | 0.50% | 0.50% | 422 |
| Class R3 | — | 0.25% | 0.25% | 0.25% | 86 |
| Total Distribution and Service Fees | $126,963 |
| (d) | In accordance with the distribution plan for certain classes, the fund pays distribution and/or service fees equal to these annual percentage rates of each class’s average daily net assets. The distribution and service fee rates disclosed by class represent the current rates in effect at the end of the reporting period. Any rate changes, if applicable, are detailed below. |
| (e) | The annual effective rates represent actual fees incurred under the distribution plan for the six months ended February 28, 2021 based on each class's average daily net assets.MFD has voluntarily agreed to rebate a portion of each class's 0.25% service fee attributable to accounts for which there is no financial intermediary specified on the account except for accounts attributable to MFS or its affiliates' seed money. There were no service fee rebates for the six months ended February 28, 2021. |
| Amount | |
| Class A | $1 |
| Class B | — |
| Class C | 16 |
| Six months ended 2/28/21 | Year ended 8/31/20 | ||||
| Shares | Amount | Shares | Amount | ||
| Shares sold | |||||
| Class A | 1,120,399 | $12,994,343 | 5,001,865 | $51,610,948 | |
| Class C | 2,127 | 26,444 | 4,359 | 43,607 | |
| Class I | 411,961 | 5,222,413 | 711,263 | 7,109,625 | |
| Class R1 | 594 | 6,874 | 1,039 | 10,850 | |
| Class R2 | 156 | 1,782 | 203 | 2,087 | |
| Class R3 | 77 | 900 | 175 | 1,846 | |
| Class R6 | 1,407,042 | 19,689,991 | 7,300,536 | 74,505,088 | |
| 2,942,356 | $37,942,747 | 13,019,440 | $133,284,051 | ||
| Shares issued to shareholders in reinvestment of distributions | |||||
| Class A | 21,163 | $251,839 | 3,856 | $43,616 | |
| Class B | 201 | 2,386 | 303 | 3,422 | |
| Class C | 263 | 3,123 | 402 | 4,533 | |
| Class I | 9,235 | 110,356 | 4,506 | 51,103 | |
| Class R1 | 246 | 2,896 | 295 | 3,314 | |
| Class R2 | 280 | 3,338 | 338 | 3,830 | |
| Class R3 | 86 | 1,512 | 151 | 1,725 | |
| Class R4 | 137 | 1,633 | 164 | 1,860 | |
| Class R6 | 550,951 | 6,583,862 | 601,726 | 6,829,590 | |
| 582,562 | $6,960,945 | 611,741 | $6,942,993 | ||
| Six months ended 2/28/21 | Year ended 8/31/20 | ||||
| Shares | Amount | Shares | Amount | ||
| Shares reacquired | |||||
| Class A | (1,779,064) | $(21,290,726) | (4,535,077) | $(48,597,862) | |
| Class B | (556) | (6,537) | (1,217) | (12,710) | |
| Class C | (3,953) | (45,161) | (7,564) | (78,575) | |
| Class I | (134,675) | (1,501,218) | (396,295) | (3,652,420) | |
| Class R2 | (345) | (4,048) | (1,891) | (20,237) | |
| Class R3 | (1) | (10) | (1) | (7) | |
| Class R6 | (2,900,654) | (37,987,654) | (4,908,892) | (50,889,427) | |
| (4,819,248) | $(60,835,354) | (9,850,937) | $(103,251,238) | ||
| Net change | |||||
| Class A | (637,502) | $(8,044,544) | 470,644 | $3,056,702 | |
| Class B | (355) | (4,151) | (914) | (9,288) | |
| Class C | (1,563) | (15,594) | (2,803) | (30,435) | |
| Class I | 286,521 | 3,831,551 | 319,474 | 3,508,308 | |
| Class R1 | 840 | 9,770 | 1,334 | 14,164 | |
| Class R2 | 91 | 1,072 | (1,350) | (14,320) | |
| Class R3 | 162 | 2,402 | 325 | 3,564 | |
| Class R4 | 137 | 1,633 | 164 | 1,860 | |
| Class R6 | (942,661) | (11,713,801) | 2,993,370 | 30,445,251 | |
| (1,294,330) | $(15,931,662) | 3,780,244 | $36,975,806 | ||
| Affiliated Issuers | Beginning Value | Purchases | Sales Proceeds | Realized Gain (Loss) | Change in Unrealized Appreciation or Depreciation | Ending Value |
| MFS Institutional Money Market Portfolio | $2,791,445 | $39,792,020 | $40,911,956 | $— | $1 | $1,671,510 |
| Affiliated Issuers | Dividend Income | Capital Gain Distributions |
| MFS Institutional Money Market Portfolio | $894 | $— |


Discovery Fund

Discovery Fund
| 1 | |
| 2 | |
| 4 | |
| 6 | |
| 12 | |
| 14 | |
| 15 | |
| 16 | |
| 25 | |
| 36 | |
| 36 | |
| 36 | |
| 36 | |
| 36 |
| back cover |


| PRA Health Sciences, Inc. | 1.8% |
| Arthur J. Gallagher & Co. | 1.7% |
| ASM International N.V. | 1.6% |
| Cranswick PLC | 1.5% |
| GFL Environmental, Inc. | 1.5% |
| Gerresheimer AG | 1.5% |
| Electrocomponents PLC | 1.4% |
| PerkinElmer, Inc. | 1.4% |
| Cellnex Telecom S.A. | 1.3% |
| Clarivate PLC | 1.3% |
| Industrials | 22.9% |
| Information Technology | 19.3% |
| Consumer Discretionary | 13.0% |
| Health Care | 10.6% |
| Real Estate | 9.3% |
| Materials | 8.8% |
| Financials | 5.4% |
| Communication Services | 4.1% |
| Consumer Staples | 3.4% |
| United States | 45.3% |
| United Kingdom | 14.7% |
| Japan | 6.2% |
| Germany | 5.2% |
| Netherlands | 4.5% |
| Canada | 4.0% |
| France | 2.5% |
| India | 2.5% |
| Spain | 2.1% |
| Other Countries | 13.0% |
| United States Dollar | 51.6% |
| Euro | 15.7% |
| British Pound Sterling | 13.4% |
| Japanese Yen | 6.2% |
| Indian Rupee | 2.5% |
| Swiss Franc | 1.8% |
| Australian Dollar | 1.6% |
| Norwegian Krone | 1.6% |
| Brazilian Real | 1.0% |
| Other Currencies | 4.6% |
| (g) | The Global Industry Classification Standard (GICS®) was developed by and/or is the exclusive property of MSCI, Inc. and S&P Global Market Intelligence Inc. (“S&P Global Market Intelligence”). GICS is a service mark of MSCI and S&P Global Market Intelligence and has been licensed for use by MFS. MFS has applied its own internal sector/industry classification methodology for equity securities and non-equity securities that are unclassified by GICS. |
| (x) | Represents the portfolio’s exposure to issuer countries as a percentage of a portfolio’s net assets. For purposes of this presentation, United States includes Cash & Cash Equivalents. |
| (y) | Represents the portfolio’s exposure to a particular currency as a percentage of a portfolio's net assets. For purposes of this presentation, United States Dollar includes Cash & Cash Equivalents. |
September 1, 2020 through February 28, 2021
| Share Class | Annualized Expense Ratio | Beginning Account Value 9/01/20 | Ending Account Value 2/28/21 | Expenses Paid During Period (p) 9/01/20-2/28/21 | |
| A | Actual | 1.35% | $1,000.00 | $1,121.93 | $7.10 |
| Hypothetical (h) | 1.35% | $1,000.00 | $1,018.10 | $6.76 | |
| B | Actual | 2.10% | $1,000.00 | $1,117.62 | $11.03 |
| Hypothetical (h) | 2.10% | $1,000.00 | $1,014.38 | $10.49 | |
| C | Actual | 2.10% | $1,000.00 | $1,117.64 | $11.03 |
| Hypothetical (h) | 2.10% | $1,000.00 | $1,014.38 | $10.49 | |
| I | Actual | 1.10% | $1,000.00 | $1,122.98 | $5.79 |
| Hypothetical (h) | 1.10% | $1,000.00 | $1,019.34 | $5.51 | |
| R1 | Actual | 2.10% | $1,000.00 | $1,117.18 | $11.02 |
| Hypothetical (h) | 2.10% | $1,000.00 | $1,014.38 | $10.49 | |
| R2 | Actual | 1.60% | $1,000.00 | $1,119.93 | $8.41 |
| Hypothetical (h) | 1.60% | $1,000.00 | $1,016.86 | $8.00 | |
| R3 | Actual | 1.35% | $1,000.00 | $1,121.47 | $7.10 |
| Hypothetical (h) | 1.35% | $1,000.00 | $1,018.10 | $6.76 | |
| R4 | Actual | 1.10% | $1,000.00 | $1,122.96 | $5.79 |
| Hypothetical (h) | 1.10% | $1,000.00 | $1,019.34 | $5.51 | |
| R6 | Actual | 1.00% | $1,000.00 | $1,123.61 | $5.27 |
| Hypothetical (h) | 1.00% | $1,000.00 | $1,019.84 | $5.01 |
| (h) | 5% class return per year before expenses. |
| (p) | “Expenses Paid During Period” are equal to each class’s annualized expense ratio, as shown above, multiplied by the average account value over the period, multiplied by 181/365 (to reflect the one-half year period). Expenses paid do not include any applicable sales charges (loads). If these transaction costs had been included, your costs would have been higher. |
| Issuer | Shares/Par | Value ($) | ||
| Common Stocks – 96.8% | ||||
| Aerospace – 1.3% | ||||
| CACI International, Inc., “A” (a) | 3,203 | $ 708,952 | ||
| Singapore Technologies Engineering Ltd. | 172,600 | 484,295 | ||
| $1,193,247 | ||||
| Apparel Manufacturers – 1.9% | ||||
| Burberry Group PLC (a) | 31,245 | $ 790,297 | ||
| Skechers USA, Inc., “A” (a) | 25,567 | 935,752 | ||
| $1,726,049 | ||||
| Automotive – 2.3% | ||||
| Copart, Inc. (a) | 5,191 | $ 566,649 | ||
| Koito Manufacturing Co. Ltd. | 8,800 | 586,144 | ||
| LKQ Corp. (a) | 23,285 | 917,196 | ||
| $2,069,989 | ||||
| Biotechnology – 0.8% | ||||
| Abcam PLC | 29,549 | $ 698,204 | ||
| Brokerage & Asset Managers – 3.7% | ||||
| B3 Brasil Bolsa Balcao S.A. | 91,500 | $ 886,558 | ||
| Cboe Global Markets, Inc. | 7,349 | 727,257 | ||
| Euronext N.V. | 8,854 | 952,906 | ||
| NASDAQ, Inc. | 5,177 | 715,927 | ||
| $3,282,648 | ||||
| Business Services – 8.0% | ||||
| Auto Trader Group PLC (a) | 76,962 | $ 589,944 | ||
| Cancom SE | 8,684 | 555,317 | ||
| Clarivate PLC (a) | 49,355 | 1,122,826 | ||
| Electrocomponents PLC | 94,223 | 1,273,334 | ||
| Foley Trasimene Acquisition Corp. (a) | 40,367 | 681,181 | ||
| Keywords Studios PLC (a) | 20,813 | 728,976 | ||
| NS Solutions Corp. | 18,400 | 539,425 | ||
| Nuvei Corp. (a) | 16,582 | 863,093 | ||
| WNS (Holdings) Ltd., ADR (a) | 9,670 | 722,446 | ||
| $7,076,542 | ||||
| Cable TV – 0.7% | ||||
| Cable One, Inc. | 327 | $ 626,156 | ||
| Issuer | Shares/Par | Value ($) | ||
| Common Stocks – continued | ||||
| Chemicals – 1.6% | ||||
| IMCD Group N.V. | 5,936 | $ 730,174 | ||
| UPL Ltd. | 92,611 | 704,765 | ||
| $1,434,939 | ||||
| Computer Software – 7.5% | ||||
| Cadence Design Systems, Inc. (a) | 3,290 | $ 464,186 | ||
| Dun & Bradstreet Holdings, Inc. (a) | 27,605 | 603,445 | ||
| Everbridge, Inc. (a) | 6,812 | 1,043,803 | ||
| OBIC Co. Ltd. | 4,900 | 826,512 | ||
| Oracle Corp. | 5,800 | 591,998 | ||
| Ping Identity Holding Corp. (a) | 36,628 | 858,194 | ||
| Qualtrics International, “A” (a) | 10,217 | 388,246 | ||
| Synopsys, Inc. (a) | 1,639 | 401,899 | ||
| VERTEX, Inc. (a) | 20,114 | 618,505 | ||
| Zendesk, Inc. (a) | 6,078 | 888,239 | ||
| $6,685,027 | ||||
| Computer Software - Systems – 5.0% | ||||
| Amadeus IT Group S.A. (a) | 10,080 | $ 699,317 | ||
| Nagarro SE (a) | 6,018 | 647,683 | ||
| Q2 Holdings, Inc. (a) | 6,667 | 812,574 | ||
| Rapid7, Inc. (a) | 9,908 | 755,386 | ||
| SimCorp A/S | 5,540 | 673,264 | ||
| TransUnion | 10,522 | 886,057 | ||
| $4,474,281 | ||||
| Construction – 6.1% | ||||
| AZEK Co. LLC (a) | 19,366 | $ 854,234 | ||
| Marshalls PLC (a) | 73,702 | 700,289 | ||
| Masco Corp. | 17,614 | 937,417 | ||
| Mid-America Apartment Communities, Inc., REIT | 5,640 | 759,877 | ||
| Otis Worldwide Corp. | 11,097 | 706,990 | ||
| Somfy S.A. | 4,388 | 730,619 | ||
| Summit Materials, Inc., “A” (a) | 25,108 | 695,743 | ||
| $5,385,169 | ||||
| Consumer Products – 0.4% | ||||
| Dabur India Ltd. | 48,285 | $ 329,710 | ||
| Consumer Services – 2.5% | ||||
| 51job, Inc., ADR (a) | 7,170 | $ 470,352 | ||
| Boyd Group Services, Inc. | 3,220 | 532,846 | ||
| Bright Horizons Family Solutions, Inc. (a) | 4,487 | 716,394 | ||
| Issuer | Shares/Par | Value ($) | ||
| Common Stocks – continued | ||||
| Consumer Services – continued | ||||
| On the Beach Group PLC (a) | 90,132 | $ 497,265 | ||
| $2,216,857 | ||||
| Containers – 2.7% | ||||
| Gerresheimer AG | 12,578 | $ 1,299,065 | ||
| Mayr-Melnhof Karton AG | 2,220 | 484,281 | ||
| SIG Combibloc Group AG | 26,428 | 585,126 | ||
| $2,368,472 | ||||
| Electrical Equipment – 2.3% | ||||
| AMETEK, Inc. | 6,163 | $ 727,049 | ||
| Halma PLC | 17,757 | 560,834 | ||
| Sensata Technologies Holding PLC (a) | 13,774 | 789,113 | ||
| $2,076,996 | ||||
| Electronics – 2.3% | ||||
| ASM International N.V. | 5,256 | $ 1,417,988 | ||
| Kardex AG | 2,954 | 626,749 | ||
| $2,044,737 | ||||
| Entertainment – 0.8% | ||||
| CTS Eventim AG (a) | 10,388 | $ 706,898 | ||
| Food & Beverages – 3.0% | ||||
| Bakkafrost P/f | 12,563 | $ 892,534 | ||
| Cranswick PLC | 28,734 | 1,361,896 | ||
| S Foods, Inc. | 14,500 | 444,815 | ||
| $2,699,245 | ||||
| Furniture & Appliances – 0.6% | ||||
| SEB S.A. | 3,037 | $ 544,881 | ||
| Gaming & Lodging – 0.9% | ||||
| Penn National Gaming, Inc. (a) | 6,893 | $ 798,071 | ||
| Insurance – 1.7% | ||||
| Arthur J. Gallagher & Co. | 12,276 | $ 1,470,665 | ||
| Internet – 0.9% | ||||
| Allegro.eu S.A. (a) | 43,937 | $ 754,110 | ||
| Leisure & Toys – 1.5% | ||||
| Take-Two Interactive Software, Inc. (a) | 3,147 | $ 580,496 | ||
| Thule Group AB | 17,042 | 712,446 | ||
| $1,292,942 | ||||
| Issuer | Shares/Par | Value ($) | ||
| Common Stocks – continued | ||||
| Machinery & Tools – 4.3% | ||||
| Azbil Corp. | 15,400 | $ 653,736 | ||
| IDEX Corp. | 3,628 | 708,077 | ||
| Ingersoll Rand, Inc. (a) | 15,435 | 715,258 | ||
| Ritchie Bros. Auctioneers, Inc. | 14,906 | 809,694 | ||
| Spirax-Sarco Engineering PLC | 3,292 | 491,205 | ||
| VAT Group AG | 1,581 | 439,374 | ||
| $3,817,344 | ||||
| Medical & Health Technology & Services – 5.1% | ||||
| AS ONE Corp. | 4,100 | $ 527,094 | ||
| Charles River Laboratories International, Inc. (a) | 3,541 | 1,013,222 | ||
| ICON PLC (a) | 4,983 | 900,328 | ||
| PRA Health Sciences, Inc. (a) | 11,083 | 1,633,745 | ||
| Selcuk Ecza Deposu Ticaret ve Sanayi A.S. | 277,190 | 427,350 | ||
| $4,501,739 | ||||
| Medical Equipment – 3.3% | ||||
| Maravai Lifesciences Holdings, Inc., “A” (a) | 21,536 | $ 700,351 | ||
| PerkinElmer, Inc. | 9,607 | 1,211,346 | ||
| STERIS PLC | 5,971 | 1,043,731 | ||
| $2,955,428 | ||||
| Metals & Mining – 0.8% | ||||
| Howmet Aerospace, Inc. (a) | 25,112 | $ 705,898 | ||
| Network & Telecom – 1.5% | ||||
| CoreSite Realty Corp., REIT | 6,139 | $ 747,178 | ||
| QTS Realty Trust, Inc., REIT, “A” | 9,351 | 580,884 | ||
| $1,328,062 | ||||
| Pollution Control – 2.2% | ||||
| Daiseki Co. Ltd. | 20,500 | $ 645,318 | ||
| GFL Environmental, Inc. | 43,177 | 1,339,351 | ||
| $1,984,669 | ||||
| Printing & Publishing – 1.0% | ||||
| Wolters Kluwer N.V. | 11,083 | $ 878,286 | ||
| Railroad & Shipping – 1.0% | ||||
| Kansas City Southern Co. | 4,135 | $ 878,026 | ||
| Real Estate – 6.9% | ||||
| Big Yellow Group PLC, REIT | 44,377 | $ 701,726 | ||
| Embassy Office Parks, REIT | 105,400 | 459,939 | ||
| Goodman Group, REIT | 60,876 | 775,687 | ||
| Issuer | Shares/Par | Value ($) | ||
| Common Stocks – continued | ||||
| Real Estate – continued | ||||
| Industrial Logistics Properties Trust, REIT | 22,249 | $ 473,236 | ||
| LEG Immobilien AG | 5,600 | 764,451 | ||
| National Storage, REIT | 477,141 | 688,380 | ||
| Sun Communities, Inc., REIT | 3,807 | 578,474 | ||
| Tritax Big Box PLC, REIT | 294,711 | 739,475 | ||
| Unite Group PLC, REIT (a) | 73,041 | 988,097 | ||
| $6,169,465 | ||||
| Restaurants – 0.6% | ||||
| Yum China Holdings, Inc. | 9,323 | $ 557,888 | ||
| Specialty Chemicals – 5.3% | ||||
| Axalta Coating Systems Ltd. (a) | 22,262 | $ 608,643 | ||
| Borregaard ASA | 26,222 | 495,371 | ||
| Croda International PLC | 8,595 | 738,591 | ||
| Essentra PLC (a) | 255,751 | 1,043,995 | ||
| Ferro Corp. (a) | 41,157 | 653,162 | ||
| RPM International, Inc. | 5,574 | 443,913 | ||
| Symrise AG | 5,971 | 696,801 | ||
| $4,680,476 | ||||
| Specialty Stores – 4.2% | ||||
| Burlington Stores, Inc. (a) | 4,031 | $ 1,043,303 | ||
| Just Eat Takeaway (a) | 10,309 | 993,574 | ||
| Leslie's, Inc. (a) | 40,174 | 975,425 | ||
| Musti Group OY | 21,075 | 679,438 | ||
| $3,691,740 | ||||
| Telecommunications - Wireless – 1.3% | ||||
| Cellnex Telecom S.A. | 21,430 | $ 1,164,830 | ||
| Trucking – 0.8% | ||||
| SG Holdings Co. Ltd. | 29,800 | $ 684,370 | ||
| Total Common Stocks (Identified Cost, $67,443,840) | $ 85,954,056 | |||
| Investment Companies (h) – 3.4% | ||||
| Money Market Funds – 3.4% | ||||
| MFS Institutional Money Market Portfolio, 0.07% (v) (Identified Cost, $3,000,601) | 3,000,601 | $ 3,000,600 | ||
| Other Assets, Less Liabilities – (0.2)% | (134,084) | |||
| Net Assets – 100.0% | $ 88,820,572 | |||
| (a) | Non-income producing security. |
| (h) | An affiliated issuer, which may be considered one in which the fund owns 5% or more of the outstanding voting securities, or a company which is under common control. At period end, the aggregate values of the fund's investments in affiliated issuers and in unaffiliated issuers were $3,000,600 and $85,954,056, respectively. | |||
| (v) | Affiliated issuer that is available only to investment companies managed by MFS. The rate quoted for the MFS Institutional Money Market Portfolio is the annualized seven-day yield of the fund at period end. |
| The following abbreviations are used in this report and are defined: | |
| ADR | American Depositary Receipt |
| REIT | Real Estate Investment Trust |
| Assets | |
| Investments in unaffiliated issuers, at value (identified cost, $67,443,840) | $85,954,056 |
| Investments in affiliated issuers, at value (identified cost, $3,000,601) | 3,000,600 |
| Foreign currency, at value (identified cost, $6,371) | 6,319 |
| Receivables for | |
| Investments sold | 4,615 |
| Fund shares sold | 227,938 |
| Dividends | 50,482 |
| Receivable from investment adviser | 18,155 |
| Other assets | 57,449 |
| Total assets | $89,319,614 |
| Liabilities | |
| Payables for | |
| Investments purchased | $366,683 |
| Fund shares reacquired | 59,342 |
| Payable to affiliates | |
| Administrative services fee | 246 |
| Shareholder servicing costs | 20,673 |
| Distribution and service fees | 1,403 |
| Payable for independent Trustees' compensation | 114 |
| Accrued expenses and other liabilities | 50,581 |
| Total liabilities | $499,042 |
| Net assets | $88,820,572 |
| Net assets consist of | |
| Paid-in capital | $68,795,258 |
| Total distributable earnings (loss) | 20,025,314 |
| Net assets | $88,820,572 |
| Shares of beneficial interest outstanding | 3,789,525 |
| Net assets | Shares outstanding | Net asset value per share (a) | |
| Class A | $23,774,355 | 1,021,418 | $23.28 |
| Class B | 2,739,401 | 127,484 | 21.49 |
| Class C | 3,747,462 | 174,412 | 21.49 |
| Class I | 40,566,370 | 1,709,035 | 23.74 |
| Class R1 | 135,843 | 6,326 | 21.47 |
| Class R2 | 241,908 | 10,657 | 22.70 |
| Class R3 | 235,931 | 10,139 | 23.27 |
| Class R4 | 98,047 | 4,130 | 23.74 |
| Class R6 | 17,281,255 | 725,924 | 23.81 |
| (a) | Maximum offering price per share was equal to the net asset value per share for all share classes, except for Class A, for which the maximum offering price per share was $24.70 [100 / 94.25 x $23.28]. On sales of $50,000 or more, the maximum offering price of Class A shares is reduced. A contingent deferred sales charge may be imposed on redemptions of Class A, Class B, and Class C shares. Redemption price per share was equal to the net asset value per share for Classes I, R1, R2, R3, R4, and R6. |
| Net investment income (loss) | |
| Income | |
| Dividends | $228,397 |
| Dividends from affiliated issuers | 1,505 |
| Income on securities loaned | 61 |
| Interest | 24 |
| Other | 16 |
| Foreign taxes withheld | (9,776) |
| Total investment income | $220,227 |
| Expenses | |
| Management fee | $340,231 |
| Distribution and service fees | 58,545 |
| Shareholder servicing costs | 34,521 |
| Administrative services fee | 9,923 |
| Independent Trustees' compensation | 933 |
| Custodian fee | 13,582 |
| Shareholder communications | 8,620 |
| Audit and tax fees | 34,685 |
| Legal fees | 208 |
| Registration fees | 65,986 |
| Miscellaneous | 14,936 |
| Total expenses | $582,170 |
| Reduction of expenses by investment adviser and distributor | (146,711) |
| Net expenses | $435,459 |
| Net investment income (loss) | $(215,232) |
| Realized and unrealized gain (loss) | |
| Realized gain (loss) (identified cost basis) | |
| Unaffiliated issuers | $3,256,464 |
| Affiliated issuers | (67) |
| Foreign currency | (124) |
| Net realized gain (loss) | $3,256,273 |
| Change in unrealized appreciation or depreciation | |
| Unaffiliated issuers | $3,670,046 |
| Affiliated issuers | 66 |
| Translation of assets and liabilities in foreign currencies | (936) |
| Net unrealized gain (loss) | $3,669,176 |
| Net realized and unrealized gain (loss) | $6,925,449 |
| Change in net assets from operations | $6,710,217 |
| Six months ended | Year ended | |
| 2/28/21 (unaudited) | 8/31/20 | |
| Change in net assets | ||
| From operations | ||
| Net investment income (loss) | $(215,232) | $(118,775) |
| Net realized gain (loss) | 3,256,273 | 2,518,082 |
| Net unrealized gain (loss) | 3,669,176 | 5,846,297 |
| Change in net assets from operations | $6,710,217 | $8,245,604 |
| Total distributions to shareholders | $(2,554,040) | $(1,495,013) |
| Change in net assets from fund share transactions | $28,825,160 | $4,053,286 |
| Total change in net assets | $32,981,337 | $10,803,877 |
| Net assets | ||
| At beginning of period | 55,839,235 | 45,035,358 |
| At end of period | $88,820,572 | $55,839,235 |
| Class A | Six months ended | Year ended | ||||
| 2/28/21 (unaudited) | 8/31/20 | 8/31/19 | 8/31/18 | 8/31/17 | 8/31/16 | |
| Net asset value, beginning of period | $21.57 | $18.72 | $21.27 | $18.31 | $15.69 | $14.85 |
| Income (loss) from investment operations | ||||||
| Net investment income (loss) (d) | $(0.08) | $(0.06) | $(0.03) | $(0.03) | $(0.02) | $0.01 |
| Net realized and unrealized gain (loss) | 2.70 | 3.49 | (0.62) | 3.57 | 2.66 | 0.84 |
| Total from investment operations | $2.62 | $3.43 | $(0.65) | $3.54 | $2.64 | $0.85 |
| Less distributions declared to shareholders | ||||||
| From net investment income | $— | $— | $(0.02) | $— | $(0.02) | $(0.01) |
| From net realized gain | (0.91) | (0.58) | (1.88) | (0.58) | — | — |
| Total distributions declared to shareholders | $(0.91) | $(0.58) | $(1.90) | $(0.58) | $(0.02) | $(0.01) |
| Net asset value, end of period (x) | $23.28 | $21.57 | $18.72 | $21.27 | $18.31 | $15.69 |
| Total return (%) (r)(s)(t)(x) | 12.19(n) | 18.63 | (1.65) | 19.70 | 16.85 | 5.75 |
| Ratios (%) (to average net assets) and Supplemental data: | ||||||
| Expenses before expense reductions (f) | 1.77(a) | 1.97 | 2.04 | 1.94 | 2.33 | 2.35 |
| Expenses after expense reductions (f) | 1.35(a) | 1.49 | 1.51 | 1.50 | 1.50 | 1.50 |
| Net investment income (loss) | (0.71)(a)(l) | (0.32) | (0.16) | (0.17) | (0.15) | 0.07 |
| Portfolio turnover | 17(n) | 84 | 55 | 36 | 37 | 37 |
| Net assets at end of period (000 omitted) | $23,774 | $17,029 | $11,255 | $11,581 | $7,893 | $11,699 |
| Class B | Six months ended | Year ended | ||||
| 2/28/21 (unaudited) | 8/31/20 | 8/31/19 | 8/31/18 | 8/31/17 | 8/31/16 | |
| Net asset value, beginning of period | $20.05 | $17.57 | $20.21 | $17.55 | $15.13 | $14.42 |
| Income (loss) from investment operations | ||||||
| Net investment income (loss) (d) | $(0.15) | $(0.19) | $(0.16) | $(0.17) | $(0.13) | $(0.09) |
| Net realized and unrealized gain (loss) | 2.50 | 3.25 | (0.60) | 3.41 | 2.55 | 0.80 |
| Total from investment operations | $2.35 | $3.06 | $(0.76) | $3.24 | $2.42 | $0.71 |
| Less distributions declared to shareholders | ||||||
| From net investment income | $— | $— | $— | $— | $— | $— |
| From net realized gain | (0.91) | (0.58) | (1.88) | (0.58) | — | — |
| Total distributions declared to shareholders | $(0.91) | $(0.58) | $(1.88) | $(0.58) | $— | $— |
| Net asset value, end of period (x) | $21.49 | $20.05 | $17.57 | $20.21 | $17.55 | $15.13 |
| Total return (%) (r)(s)(t)(x) | 11.76(n) | 17.72 | (2.35) | 18.83 | 15.99 | 4.92 |
| Ratios (%) (to average net assets) and Supplemental data: | ||||||
| Expenses before expense reductions (f) | 2.53(a) | 2.72 | 2.79 | 2.69 | 3.07 | 3.09 |
| Expenses after expense reductions (f) | 2.10(a) | 2.24 | 2.26 | 2.25 | 2.25 | 2.25 |
| Net investment income (loss) | (1.44)(a)(l) | (1.08) | (0.91) | (0.90) | (0.83) | (0.62) |
| Portfolio turnover | 17(n) | 84 | 55 | 36 | 37 | 37 |
| Net assets at end of period (000 omitted) | $2,739 | $2,678 | $2,508 | $2,488 | $1,513 | $1,188 |
| Class C | Six months ended | Year ended | ||||
| 2/28/21 (unaudited) | 8/31/20 | 8/31/19 | 8/31/18 | 8/31/17 | 8/31/16 | |
| Net asset value, beginning of period | $20.05 | $17.57 | $20.21 | $17.55 | $15.13 | $14.42 |
| Income (loss) from investment operations | ||||||
| Net investment income (loss) (d) | $(0.15) | $(0.19) | $(0.16) | $(0.18) | $(0.13) | $(0.09) |
| Net realized and unrealized gain (loss) | 2.50 | 3.25 | (0.60) | 3.42 | 2.55 | 0.80 |
| Total from investment operations | $2.35 | $3.06 | $(0.76) | $3.24 | $2.42 | $0.71 |
| Less distributions declared to shareholders | ||||||
| From net investment income | $— | $— | $— | $— | $— | $— |
| From net realized gain | (0.91) | (0.58) | (1.88) | (0.58) | — | — |
| Total distributions declared to shareholders | $(0.91) | $(0.58) | $(1.88) | $(0.58) | $— | $— |
| Net asset value, end of period (x) | $21.49 | $20.05 | $17.57 | $20.21 | $17.55 | $15.13 |
| Total return (%) (r)(s)(t)(x) | 11.76(n) | 17.72 | (2.35) | 18.83 | 15.99 | 4.92 |
| Ratios (%) (to average net assets) and Supplemental data: | ||||||
| Expenses before expense reductions (f) | 2.53(a) | 2.72 | 2.78 | 2.69 | 3.08 | 3.09 |
| Expenses after expense reductions (f) | 2.10(a) | 2.24 | 2.26 | 2.25 | 2.25 | 2.24 |
| Net investment income (loss) | (1.45)(a)(l) | (1.08) | (0.91) | (0.93) | (0.84) | (0.64) |
| Portfolio turnover | 17(n) | 84 | 55 | 36 | 37 | 37 |
| Net assets at end of period (000 omitted) | $3,747 | $3,422 | $3,287 | $4,470 | $4,944 | $5,017 |
| Class I | Six months ended | Year ended | ||||
| 2/28/21 (unaudited) | 8/31/20 | 8/31/19 | 8/31/18 | 8/31/17 | 8/31/16 | |
| Net asset value, beginning of period | $21.96 | $19.00 | $21.54 | $18.49 | $15.86 | $15.00 |
| Income (loss) from investment operations | ||||||
| Net investment income (loss) (d) | $(0.06) | $(0.02) | $0.01 | $0.02 | $0.04 | $0.07 |
| Net realized and unrealized gain (loss) | 2.75 | 3.56 | (0.62) | 3.61 | 2.67 | 0.82 |
| Total from investment operations | $2.69 | $3.54 | $(0.61) | $3.63 | $2.71 | $0.89 |
| Less distributions declared to shareholders | ||||||
| From net investment income | $— | $— | $(0.05) | $— | $(0.08) | $(0.03) |
| From net realized gain | (0.91) | (0.58) | (1.88) | (0.58) | — | — |
| Total distributions declared to shareholders | $(0.91) | $(0.58) | $(1.93) | $(0.58) | $(0.08) | $(0.03) |
| Net asset value, end of period (x) | $23.74 | $21.96 | $19.00 | $21.54 | $18.49 | $15.86 |
| Total return (%) (r)(s)(t)(x) | 12.30(n) | 18.94 | (1.41) | 20.01 | 17.20 | 5.98 |
| Ratios (%) (to average net assets) and Supplemental data: | ||||||
| Expenses before expense reductions (f) | 1.51(a) | 1.72 | 1.76 | 1.69 | 2.06 | 2.06 |
| Expenses after expense reductions (f) | 1.10(a) | 1.24 | 1.26 | 1.25 | 1.25 | 1.25 |
| Net investment income (loss) | (0.49)(a)(l) | (0.09) | 0.05 | 0.11 | 0.21 | 0.44 |
| Portfolio turnover | 17(n) | 84 | 55 | 36 | 37 | 37 |
| Net assets at end of period (000 omitted) | $40,566 | $18,688 | $14,059 | $28,463 | $17,606 | $5,052 |
| Class R1 | Six months ended | Year ended | ||||
| 2/28/21 (unaudited) | 8/31/20 | 8/31/19 | 8/31/18 | 8/31/17 | 8/31/16 | |
| Net asset value, beginning of period | $20.04 | $17.56 | $20.20 | $17.55 | $15.13 | $14.42 |
| Income (loss) from investment operations | ||||||
| Net investment income (loss) (d) | $(0.15) | $(0.19) | $(0.16) | $(0.18) | $(0.14) | $(0.10) |
| Net realized and unrealized gain (loss) | 2.49 | 3.25 | (0.60) | 3.41 | 2.56 | 0.81 |
| Total from investment operations | $2.34 | $3.06 | $(0.76) | $3.23 | $2.42 | $0.71 |
| Less distributions declared to shareholders | ||||||
| From net investment income | $— | $— | $— | $— | $— | $— |
| From net realized gain | (0.91) | (0.58) | (1.88) | (0.58) | — | — |
| Total distributions declared to shareholders | $(0.91) | $(0.58) | $(1.88) | $(0.58) | $— | $— |
| Net asset value, end of period (x) | $21.47 | $20.04 | $17.56 | $20.20 | $17.55 | $15.13 |
| Total return (%) (r)(s)(t)(x) | 11.72(n) | 17.73 | (2.35) | 18.77 | 15.99 | 4.92 |
| Ratios (%) (to average net assets) and Supplemental data: | ||||||
| Expenses before expense reductions (f) | 2.53(a) | 2.72 | 2.79 | 2.69 | 3.08 | 3.12 |
| Expenses after expense reductions (f) | 2.10(a) | 2.24 | 2.26 | 2.25 | 2.25 | 2.25 |
| Net investment income (loss) | (1.45)(a)(l) | (1.08) | (0.92) | (0.92) | (0.86) | (0.70) |
| Portfolio turnover | 17(n) | 84 | 55 | 36 | 37 | 37 |
| Net assets at end of period (000 omitted) | $136 | $120 | $101 | $73 | $62 | $66 |
| Class R2 | Six months ended | Year ended | ||||
| 2/28/21 (unaudited) | 8/31/20 | 8/31/19 | 8/31/18 | 8/31/17 | 8/31/16 | |
| Net asset value, beginning of period | $21.09 | $18.36 | $20.93 | $18.06 | $15.50 | $14.71 |
| Income (loss) from investment operations | ||||||
| Net investment income (loss) (d) | $(0.10) | $(0.11) | $(0.07) | $(0.07) | $(0.05) | $(0.03) |
| Net realized and unrealized gain (loss) | 2.62 | 3.42 | (0.62) | 3.52 | 2.62 | 0.82 |
| Total from investment operations | $2.52 | $3.31 | $(0.69) | $3.45 | $2.57 | $0.79 |
| Less distributions declared to shareholders | ||||||
| From net investment income | $— | $— | $— | $— | $(0.01) | $— |
| From net realized gain | (0.91) | (0.58) | (1.88) | (0.58) | — | — |
| Total distributions declared to shareholders | $(0.91) | $(0.58) | $(1.88) | $(0.58) | $(0.01) | $— |
| Net asset value, end of period (x) | $22.70 | $21.09 | $18.36 | $20.93 | $18.06 | $15.50 |
| Total return (%) (r)(s)(t)(x) | 11.99(n) | 18.33 | (1.89) | 19.47 | 16.58 | 5.37 |
| Ratios (%) (to average net assets) and Supplemental data: | ||||||
| Expenses before expense reductions (f) | 2.03(a) | 2.22 | 2.29 | 2.18 | 2.57 | 2.59 |
| Expenses after expense reductions (f) | 1.60(a) | 1.74 | 1.76 | 1.75 | 1.75 | 1.75 |
| Net investment income (loss) | (0.94)(a)(l) | (0.58) | (0.41) | (0.33) | (0.32) | (0.17) |
| Portfolio turnover | 17(n) | 84 | 55 | 36 | 37 | 37 |
| Net assets at end of period (000 omitted) | $242 | $178 | $218 | $211 | $115 | $89 |
| Class R3 | Six months ended | Year ended | ||||
| 2/28/21 (unaudited) | 8/31/20 | 8/31/19 | 8/31/18 | 8/31/17 | 8/31/16 | |
| Net asset value, beginning of period | $21.57 | $18.72 | $21.26 | $18.30 | $15.70 | $14.85 |
| Income (loss) from investment operations | ||||||
| Net investment income (loss) (d) | $(0.08) | $(0.06) | $(0.03) | $(0.04) | $(0.02) | $0.01 |
| Net realized and unrealized gain (loss) | 2.69 | 3.49 | (0.62) | 3.58 | 2.66 | 0.84 |
| Total from investment operations | $2.61 | $3.43 | $(0.65) | $3.54 | $2.64 | $0.85 |
| Less distributions declared to shareholders | ||||||
| From net investment income | $— | $— | $(0.01) | $— | $(0.04) | $— |
| From net realized gain | (0.91) | (0.58) | (1.88) | (0.58) | — | — |
| Total distributions declared to shareholders | $(0.91) | $(0.58) | $(1.89) | $(0.58) | $(0.04) | $— |
| Net asset value, end of period (x) | $23.27 | $21.57 | $18.72 | $21.26 | $18.30 | $15.70 |
| Total return (%) (r)(s)(t)(x) | 12.15(n) | 18.63 | (1.63) | 19.72 | 16.87 | 5.72 |
| Ratios (%) (to average net assets) and Supplemental data: | ||||||
| Expenses before expense reductions (f) | 1.78(a) | 1.97 | 2.04 | 1.94 | 2.32 | 2.34 |
| Expenses after expense reductions (f) | 1.35(a) | 1.49 | 1.51 | 1.50 | 1.50 | 1.50 |
| Net investment income (loss) | (0.70)(a)(l) | (0.31) | (0.16) | (0.18) | (0.13) | 0.07 |
| Portfolio turnover | 17(n) | 84 | 55 | 36 | 37 | 37 |
| Net assets at end of period (000 omitted) | $236 | $206 | $152 | $144 | $116 | $80 |
| Class R4 | Six months ended | Year ended | ||||
| 2/28/21 (unaudited) | 8/31/20 | 8/31/19 | 8/31/18 | 8/31/17 | 8/31/16 | |
| Net asset value, beginning of period | $21.96 | $19.00 | $21.56 | $18.50 | $15.87 | $15.00 |
| Income (loss) from investment operations | ||||||
| Net investment income (loss) (d) | $(0.05) | $(0.02) | $0.02 | $0.02 | $0.03 | $0.05 |
| Net realized and unrealized gain (loss) | 2.74 | 3.56 | (0.64) | 3.62 | 2.67 | 0.83 |
| Total from investment operations | $2.69 | $3.54 | $(0.62) | $3.64 | $2.70 | $0.88 |
| Less distributions declared to shareholders | ||||||
| From net investment income | $— | $— | $(0.06) | $— | $(0.07) | $(0.01) |
| From net realized gain | (0.91) | (0.58) | (1.88) | (0.58) | — | — |
| Total distributions declared to shareholders | $(0.91) | $(0.58) | $(1.94) | $(0.58) | $(0.07) | $(0.01) |
| Net asset value, end of period (x) | $23.74 | $21.96 | $19.00 | $21.56 | $18.50 | $15.87 |
| Total return (%) (r)(s)(t)(x) | 12.30(n) | 18.94 | (1.43) | 20.05 | 17.11 | 5.91 |
| Ratios (%) (to average net assets) and Supplemental data: | ||||||
| Expenses before expense reductions (f) | 1.53(a) | 1.72 | 1.78 | 1.69 | 2.08 | 2.09 |
| Expenses after expense reductions (f) | 1.10(a) | 1.24 | 1.26 | 1.25 | 1.25 | 1.25 |
| Net investment income (loss) | (0.45)(a)(l) | (0.08) | 0.08 | 0.08 | 0.18 | 0.30 |
| Portfolio turnover | 17(n) | 84 | 55 | 36 | 37 | 37 |
| Net assets at end of period (000 omitted) | $98 | $87 | $73 | $74 | $62 | $53 |
| Class R6 | Six months ended | Year ended | ||||
| 2/28/21 (unaudited) | 8/31/20 | 8/31/19 | 8/31/18 | 8/31/17 | 8/31/16 | |
| Net asset value, beginning of period | $22.01 | $19.03 | $21.58 | $18.51 | $15.87 | $15.03 |
| Income (loss) from investment operations | ||||||
| Net investment income (loss) (d) | $(0.04) | $0.01 | $0.05 | $0.04 | $0.03 | $0.07 |
| Net realized and unrealized gain (loss) | 2.75 | 3.55 | (0.64) | 3.61 | 2.70 | 0.84 |
| Total from investment operations | $2.71 | $3.56 | $(0.59) | $3.65 | $2.73 | $0.91 |
| Less distributions declared to shareholders | ||||||
| From net investment income | $— | $— | $(0.08) | $— | $(0.09) | $(0.07) |
| From net realized gain | (0.91) | (0.58) | (1.88) | (0.58) | — | — |
| Total distributions declared to shareholders | $(0.91) | $(0.58) | $(1.96) | $(0.58) | $(0.09) | $(0.07) |
| Net asset value, end of period (x) | $23.81 | $22.01 | $19.03 | $21.58 | $18.51 | $15.87 |
| Total return (%) (r)(s)(t)(x) | 12.36(n) | 19.01 | (1.26) | 20.09 | 17.31 | 6.06 |
| Ratios (%) (to average net assets) and Supplemental data: | ||||||
| Expenses before expense reductions (f) | 1.43(a) | 1.62 | 1.69 | 1.60 | 1.97 | 1.98 |
| Expenses after expense reductions (f) | 1.00(a) | 1.15 | 1.16 | 1.16 | 1.15 | 1.13 |
| Net investment income (loss) | (0.36)(a)(l) | 0.03 | 0.24 | 0.18 | 0.21 | 0.44 |
| Portfolio turnover | 17(n) | 84 | 55 | 36 | 37 | 37 |
| Net assets at end of period (000 omitted) | $17,281 | $13,432 | $13,382 | $6,332 | $4,609 | $2,317 |
| (a) | Annualized. |
| (d) | Per share data is based on average shares outstanding. |
| (f) | Ratios do not reflect reductions from fees paid indirectly, if applicable. |
| (l) | Recognition of net investment income by the fund may be affected by the timing of the declaration of dividends by companies in which the fund invests and the actual annual net investment income ratio may differ. |
| (n) | Not annualized. |
| (r) | Certain expenses have been reduced without which performance would have been lower. |
| (s) | From time to time the fund may receive proceeds from litigation settlements, without which performance would be lower. |
| (t) | Total returns do not include any applicable sales charges. |
| (x) | The net asset values and total returns have been calculated on net assets which include adjustments made in accordance with U.S. generally accepted accounting principles required at period end for financial reporting purposes. |
| Financial Instruments | Level 1 | Level 2 | Level 3 | Total |
| Equity Securities: | ||||
| United States | $37,349,525 | $— | $— | $37,349,525 |
| United Kingdom | 13,026,954 | — | — | 13,026,954 |
| Japan | 3,735,002 | 1,764,410 | — | 5,499,412 |
| Germany | 4,670,215 | — | — | 4,670,215 |
| Netherlands | 4,020,022 | — | — | 4,020,022 |
| Canada | 3,544,984 | — | — | 3,544,984 |
| France | 2,228,406 | — | — | 2,228,406 |
| India | 1,182,385 | 1,034,475 | — | 2,216,860 |
| Spain | 1,864,147 | — | — | 1,864,147 |
| Other Countries | 11,049,236 | 484,295 | — | 11,533,531 |
| Mutual Funds | 3,000,600 | — | — | 3,000,600 |
| Total | $85,671,476 | $3,283,180 | $— | $88,954,656 |
| Year ended 8/31/20 | |
| Long-term capital gains | $1,495,013 |
| As of 2/28/21 | |
| Cost of investments | $70,458,986 |
| Gross appreciation | 19,132,881 |
| Gross depreciation | (637,211) |
| Net unrealized appreciation (depreciation) | $18,495,670 |
| As of 8/31/20 | |
| Undistributed long-term capital gain | 1,498,102 |
| Late year ordinary loss deferral | (140,496) |
| Other temporary differences | 1,935 |
| Net unrealized appreciation (depreciation) | 14,509,596 |
| Six months ended 2/28/21 | Year ended 8/31/20 | ||
| Class A | $767,556 | $373,287 | |
| Class B | 114,415 | 81,085 | |
| Class C | 155,692 | 107,440 | |
| Class I | 926,902 | 465,351 | |
| Class R1 | 5,483 | 3,350 | |
| Class R2 | 8,332 | 7,003 | |
| Class R3 | 8,753 | 4,715 | |
| Class R4 | 3,603 | 2,255 | |
| Class R6 | 563,304 | 450,527 | |
| Total | $2,554,040 | $1,495,013 |
| Up to $1 billion | 0.975% |
| In excess of $1 billion and up to $2.5 billion | 0.90% |
| In excess of $2.5 billion | 0.85% |
| Classes | ||||||||
| A | B | C | I | R1 | R2 | R3 | R4 | R6 |
| 1.35% | 2.10% | 2.10% | 1.10% | 2.10% | 1.60% | 1.35% | 1.10% | 1.01% |
| Distribution Fee Rate (d) | Service Fee Rate (d) | Total Distribution Plan (d) | Annual Effective Rate (e) | Distribution and Service Fee | |
| Class A | — | 0.25% | 0.25% | 0.25% | $ 25,263 |
| Class B | 0.75% | 0.25% | 1.00% | 1.00% | 13,662 |
| Class C | 0.75% | 0.25% | 1.00% | 1.00% | 18,183 |
| Class R1 | 0.75% | 0.25% | 1.00% | 1.00% | 649 |
| Class R2 | 0.25% | 0.25% | 0.50% | 0.50% | 508 |
| Class R3 | — | 0.25% | 0.25% | 0.25% | 280 |
| Total Distribution and Service Fees | $58,545 |
| (d) | In accordance with the distribution plan for certain classes, the fund pays distribution and/or service fees equal to these annual percentage rates of each class’s average daily net assets. The distribution and service fee rates disclosed by class represent the current rates in effect at the end of the reporting period. Any rate changes, if applicable, are detailed below. |
| (e) | The annual effective rates represent actual fees incurred under the distribution plan for the six months ended February 28, 2021 based on each class's average daily net assets.MFD has voluntarily agreed to rebate a portion of each class's 0.25% service fee attributable to accounts for which there is no financial intermediary specified on the account except for accounts attributable to MFS or its affiliates' seed money. For the six months ended February 28, 2021, this rebate amounted to $16 for Class A and is included in the reduction of total expenses in the Statement of Operations. |
| Amount | |
| Class A | $341 |
| Class B | 1,936 |
| Class C | 32 |
| Six months ended 2/28/21 | Year ended 8/31/20 | ||||
| Shares | Amount | Shares | Amount | ||
| Shares sold | |||||
| Class A | 265,532 | $6,161,351 | 338,113 | $6,494,965 | |
| Class B | 1,072 | 22,450 | 1,276 | 24,857 | |
| Class C | 35,737 | 773,623 | 34,254 | 609,703 | |
| Class I | 919,827 | 22,115,631 | 449,581 | 8,714,037 | |
| Class R1 | 76 | 1,584 | 80 | 1,390 | |
| Class R2 | 3,486 | 80,190 | 1,098 | 19,039 | |
| Class R3 | 223 | 5,139 | 3,130 | 54,410 | |
| Class R6 | 211,421 | 5,026,514 | 866,050 | 17,065,262 | |
| 1,437,374 | $34,186,482 | 1,693,582 | $32,983,663 | ||
| Shares issued to shareholders in reinvestment of distributions | |||||
| Class A | 33,474 | $767,556 | 18,847 | $372,607 | |
| Class B | 5,394 | 114,415 | 4,390 | 81,085 | |
| Class C | 7,344 | 155,692 | 5,817 | 107,440 | |
| Class I | 39,662 | 926,902 | 23,175 | 465,351 | |
| Class R1 | 260 | 5,483 | 181 | 3,350 | |
| Class R2 | 372 | 8,332 | 362 | 7,003 | |
| Class R3 | 382 | 8,753 | 239 | 4,715 | |
| Class R4 | 154 | 3,603 | 113 | 2,255 | |
| Class R6 | 19,296 | 452,291 | 8,711 | 175,256 | |
| 106,338 | $2,443,027 | 61,835 | $1,219,062 | ||
| Shares reacquired | |||||
| Class A | (66,864) | $(1,548,147) | (168,839) | $(3,111,028) | |
| Class B | (12,527) | (261,174) | (14,874) | (270,825) | |
| Class C | (39,316) | (848,048) | (56,516) | (973,290) | |
| Class I | (101,504) | (2,400,423) | (361,621) | (6,686,741) | |
| Class R1 | (1) | (8) | (1) | (10) | |
| Class R2 | (1,620) | (37,897) | (4,936) | (102,205) | |
| Class R3 | (7) | (172) | (1,972) | (36,791) | |
| Class R6 | (115,075) | (2,708,480) | (967,876) | (18,968,549) | |
| (336,914) | $(7,804,349) | (1,576,635) | $(30,149,439) | ||
| Six months ended 2/28/21 | Year ended 8/31/20 | ||||
| Shares | Amount | Shares | Amount | ||
| Net change | |||||
| Class A | 232,142 | $5,380,760 | 188,121 | $3,756,544 | |
| Class B | (6,061) | (124,309) | (9,208) | (164,883) | |
| Class C | 3,765 | 81,267 | (16,445) | (256,147) | |
| Class I | 857,985 | 20,642,110 | 111,135 | 2,492,647 | |
| Class R1 | 335 | 7,059 | 260 | 4,730 | |
| Class R2 | 2,238 | 50,625 | (3,476) | (76,163) | |
| Class R3 | 598 | 13,720 | 1,397 | 22,334 | |
| Class R4 | 154 | 3,603 | 113 | 2,255 | |
| Class R6 | 115,642 | 2,770,325 | (93,115) | (1,728,031) | |
| 1,206,798 | $28,825,160 | 178,782 | $4,053,286 | ||
| Affiliated Issuers | Beginning Value | Purchases | Sales Proceeds | Realized Gain (Loss) | Change in Unrealized Appreciation or Depreciation | Ending Value |
| MFS Institutional Money Market Portfolio | $2,190,378 | $26,017,849 | $25,207,626 | $(67) | $66 | $3,000,600 |
| Affiliated Issuers | Dividend Income | Capital Gain Distributions |
| MFS Institutional Money Market Portfolio | $1,505 | $— |


| 1 | |
| 2 | |
| 3 | |
| 6 | |
| 12 | |
| 14 | |
| 15 | |
| 16 | |
| 23 | |
| 37 | |
| 37 | |
| 37 | |
| 37 | |
| 37 |
| back cover |


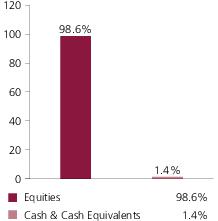
| Cadence Design Systems, Inc. | 3.0% |
| Monolithic Power Systems, Inc. | 2.5% |
| Bright Horizons Family Solutions, Inc. | 2.4% |
| PerkinElmer, Inc. | 2.2% |
| Take-Two Interactive Software, Inc. | 2.2% |
| Match Group, Inc. | 2.1% |
| MSCI, Inc. | 2.1% |
| Charles River Laboratories International, Inc. | 1.9% |
| AMETEK, Inc. | 1.8% |
| Copart, Inc. | 1.7% |
| Information Technology | 29.7% |
| Health Care | 20.0% |
| Industrials | 16.2% |
| Consumer Discretionary | 14.1% |
| Communication Services | 7.6% |
| Financials | 5.7% |
| Materials | 3.5% |
| Real Estate | 1.8% |
| (g) | The Global Industry Classification Standard (GICS®) was developed by and/or is the exclusive property of MSCI, Inc. and S&P Global Market Intelligence Inc. (“S&P Global Market Intelligence”). GICS is a service mark of MSCI and S&P Global Market Intelligence and has been licensed for use by MFS. MFS has applied its own internal sector/industry classification methodology for equity securities and non-equity securities that are unclassified by GICS. |
September 1, 2020 through February 28, 2021
| Share Class | Annualized Expense Ratio | Beginning Account Value 9/01/20 | Ending Account Value 2/28/21 | Expenses Paid During Period (p) 9/01/20-2/28/21 | |
| A | Actual | 1.01% | $1,000.00 | $1,131.50 | $5.34 |
| Hypothetical (h) | 1.01% | $1,000.00 | $1,019.79 | $5.06 | |
| B | Actual | 1.76% | $1,000.00 | $1,127.62 | $9.28 |
| Hypothetical (h) | 1.76% | $1,000.00 | $1,016.07 | $8.80 | |
| C | Actual | 1.76% | $1,000.00 | $1,127.65 | $9.28 |
| Hypothetical (h) | 1.76% | $1,000.00 | $1,016.07 | $8.80 | |
| I | Actual | 0.76% | $1,000.00 | $1,132.76 | $4.02 |
| Hypothetical (h) | 0.76% | $1,000.00 | $1,021.03 | $3.81 | |
| R1 | Actual | 1.76% | $1,000.00 | $1,127.25 | $9.28 |
| Hypothetical (h) | 1.76% | $1,000.00 | $1,016.07 | $8.80 | |
| R2 | Actual | 1.26% | $1,000.00 | $1,130.15 | $6.65 |
| Hypothetical (h) | 1.26% | $1,000.00 | $1,018.55 | $6.31 | |
| R3 | Actual | 1.01% | $1,000.00 | $1,131.54 | $5.34 |
| Hypothetical (h) | 1.01% | $1,000.00 | $1,019.79 | $5.06 | |
| R4 | Actual | 0.76% | $1,000.00 | $1,132.90 | $4.02 |
| Hypothetical (h) | 0.76% | $1,000.00 | $1,021.03 | $3.81 | |
| R6 | Actual | 0.65% | $1,000.00 | $1,133.59 | $3.44 |
| Hypothetical (h) | 0.65% | $1,000.00 | $1,021.57 | $3.26 | |
| 529A | Actual | 1.03% | $1,000.00 | $1,131.13 | $5.44 |
| Hypothetical (h) | 1.03% | $1,000.00 | $1,019.69 | $5.16 | |
| 529B | Actual | 1.30% | $1,000.00 | $1,129.59 | $6.86 |
| Hypothetical (h) | 1.30% | $1,000.00 | $1,018.35 | $6.51 | |
| 529C | Actual | 1.79% | $1,000.00 | $1,127.52 | $9.44 |
| Hypothetical (h) | 1.79% | $1,000.00 | $1,015.92 | $8.95 |
| (h) | 5% class return per year before expenses. |
| (p) | “Expenses Paid During Period” are equal to each class’s annualized expense ratio, as shown above, multiplied by the average account value over the period, multiplied by 181/365 (to reflect the one-half year period). Expenses paid do not include any applicable sales charges (loads). If these transaction costs had been included, your costs would have been higher. |
| Issuer | Shares/Par | Value ($) | ||
| Common Stocks – 98.6% | ||||
| Automotive – 1.7% | ||||
| Copart, Inc. (a) | 2,160,339 | $ 235,822,605 | ||
| Biotechnology – 2.2% | ||||
| Adaptive Biotechnologies Corp. (a) | 1,422,100 | $ 80,448,197 | ||
| Alnylam Pharmaceuticals, Inc. (a) | 591,155 | 87,550,055 | ||
| Exelixis, Inc. (a) | 2,187,821 | 47,388,203 | ||
| Seagen, Inc. (a) | 551,962 | 83,406,978 | ||
| $298,793,433 | ||||
| Brokerage & Asset Managers – 1.6% | ||||
| NASDAQ, Inc. | 1,012,347 | $ 139,997,467 | ||
| Tradeweb Markets, Inc. | 1,048,548 | 76,323,809 | ||
| $216,321,276 | ||||
| Business Services – 10.1% | ||||
| Clarivate PLC (a) | 8,424,430 | $ 191,655,783 | ||
| CoStar Group, Inc. (a) | 219,268 | 180,624,208 | ||
| Equifax, Inc. | 700,971 | 113,473,185 | ||
| Foley Trasimene Acquisition Corp. (a) | 2,101,688 | 35,465,354 | ||
| Global Payments, Inc. | 532,586 | 105,446,702 | ||
| IHS Markit Ltd. | 480,856 | 43,353,977 | ||
| MSCI, Inc. | 690,542 | 286,243,470 | ||
| Tyler Technologies, Inc. (a) | 427,150 | 197,949,853 | ||
| Verisk Analytics, Inc., “A” | 1,372,312 | 224,853,321 | ||
| $1,379,065,853 | ||||
| Cable TV – 0.3% | ||||
| Cable One, Inc. | 23,397 | $ 44,801,745 | ||
| Computer Software – 15.2% | ||||
| Autodesk, Inc. (a) | 654,408 | $ 180,616,608 | ||
| Black Knight, Inc. (a) | 2,124,473 | 162,925,834 | ||
| Bumble, Inc., “A” (a) | 985,768 | 66,352,044 | ||
| Cadence Design Systems, Inc. (a) | 2,959,420 | 417,544,568 | ||
| Coupa Software, Inc. (a) | 530,682 | 183,753,949 | ||
| DocuSign, Inc. (a) | 408,149 | 92,511,052 | ||
| Dragoneer Growth Opportunities Corp. (a)(zz) | 1,830,990 | 20,049,341 | ||
| Dragoneer Growth Opportunities Corp. (a) | 776,934 | 8,204,423 | ||
| Dragoneer Growth Opportunities Corp. (PIPE) (a)(u)(w)(z) | 452,972 | 4,346,097 | ||
| Dun & Bradstreet Holdings, Inc. (a) | 3,570,675 | 78,054,956 | ||
| Eventbrite, Inc. (a) | 2,015,505 | 40,048,084 | ||
| Issuer | Shares/Par | Value ($) | ||
| Common Stocks – continued | ||||
| Computer Software – continued | ||||
| Everbridge, Inc. (a) | 751,636 | $ 115,173,184 | ||
| Okta, Inc. (a) | 653,727 | 170,916,924 | ||
| Paylocity Holding Corp. (a) | 698,727 | 133,589,615 | ||
| Qualtrics International, “A” (a) | 709,402 | 26,957,276 | ||
| RingCentral, Inc. (a) | 480,148 | 181,572,768 | ||
| Synopsys, Inc. (a) | 636,192 | 156,000,640 | ||
| Topicus.Com, Inc. (a) | 197,536 | 10,253,991 | ||
| Unity Software, Inc. (a)(l) | 357,325 | 38,458,890 | ||
| $2,087,330,244 | ||||
| Computer Software - Systems – 7.9% | ||||
| Constellation Software, Inc. | 105,106 | $ 136,087,740 | ||
| Guidewire Software, Inc. (a) | 123,745 | 13,734,458 | ||
| NICE Systems Ltd., ADR (a) | 811,551 | 186,283,417 | ||
| Reinvent Technology Partners (a) | 2,412,003 | 30,150,037 | ||
| ServiceNow, Inc. (a) | 358,669 | 191,335,565 | ||
| Square, Inc., “A” (a) | 664,686 | 152,897,721 | ||
| SS&C Technologies Holdings, Inc. | 1,104,578 | 73,211,430 | ||
| TransUnion | 1,997,573 | 168,215,622 | ||
| Wix.com Ltd. (a) | 363,125 | 126,574,481 | ||
| $1,078,490,471 | ||||
| Construction – 4.0% | ||||
| AZEK Co. LLC (a) | 1,076,023 | $ 47,463,375 | ||
| Builders FirstSource, Inc. (a) | 963,005 | 41,664,411 | ||
| Lennox International, Inc. | 351,511 | 98,342,233 | ||
| Pool Corp. | 493,803 | 165,310,430 | ||
| Vulcan Materials Co. | 1,167,307 | 194,928,596 | ||
| $547,709,045 | ||||
| Consumer Products – 1.5% | ||||
| Scotts Miracle-Gro Co. | 959,801 | $ 204,581,583 | ||
| Consumer Services – 3.2% | ||||
| Bright Horizons Family Solutions, Inc. (a) | 2,040,450 | $ 325,778,247 | ||
| Peloton Interactive, Inc., “A” (a) | 967,289 | 116,529,306 | ||
| $442,307,553 | ||||
| Containers – 0.6% | ||||
| Ball Corp. | 885,217 | $ 75,588,680 | ||
| Electrical Equipment – 2.5% | ||||
| AMETEK, Inc. | 2,128,362 | $ 251,082,865 | ||
| Littlefuse, Inc. | 372,173 | 96,846,858 | ||
| $347,929,723 | ||||
| Issuer | Shares/Par | Value ($) | ||
| Common Stocks – continued | ||||
| Electronics – 5.9% | ||||
| ASM International N.V. | 297,043 | $ 80,137,622 | ||
| Entegris, Inc. | 2,018,738 | 212,391,425 | ||
| MKS Instruments, Inc. | 704,250 | 116,130,825 | ||
| Monolithic Power Systems, Inc. | 927,095 | 347,215,619 | ||
| Silicon Laboratories, Inc. (a) | 354,114 | 55,149,714 | ||
| $811,025,205 | ||||
| Gaming & Lodging – 2.0% | ||||
| Caesars Entertainment, Inc. (a) | 910,672 | $ 85,093,192 | ||
| DraftKings, Inc. (a) | 496,504 | 30,549,891 | ||
| Penn National Gaming, Inc. (a) | 959,001 | 111,033,136 | ||
| Vail Resorts, Inc. | 157,750 | 48,773,145 | ||
| $275,449,364 | ||||
| General Merchandise – 0.6% | ||||
| Five Below, Inc. (a) | 410,908 | $ 76,478,197 | ||
| Insurance – 1.5% | ||||
| Arthur J. Gallagher & Co. | 1,757,143 | $ 210,505,731 | ||
| Internet – 3.7% | ||||
| Affirm Holdings, Inc. (a) | 173,884 | $ 16,181,645 | ||
| IAC/InterActiveCorp (a) | 839,284 | 205,481,902 | ||
| Match Group, Inc. (a) | 1,890,958 | 289,032,930 | ||
| $510,696,477 | ||||
| Leisure & Toys – 2.7% | ||||
| Electronic Arts, Inc. | 515,896 | $ 69,114,587 | ||
| Take-Two Interactive Software, Inc. (a) | 1,598,314 | 294,825,001 | ||
| $363,939,588 | ||||
| Machinery & Tools – 1.5% | ||||
| IDEX Corp. | 878,154 | $ 171,389,316 | ||
| Roper Technologies, Inc. | 94,784 | 35,792,334 | ||
| $207,181,650 | ||||
| Medical & Health Technology & Services – 6.2% | ||||
| Charles River Laboratories International, Inc. (a) | 928,629 | $ 265,717,902 | ||
| Guardant Health, Inc. (a) | 717,275 | 105,568,534 | ||
| HealthEquity, Inc. (a) | 428,853 | 35,316,045 | ||
| ICON PLC (a) | 893,387 | 161,417,163 | ||
| IDEXX Laboratories, Inc. (a) | 203,200 | 105,698,544 | ||
| PRA Health Sciences, Inc. (a) | 213,121 | 31,416,167 | ||
| Quest Diagnostics, Inc. | 347,741 | 40,195,382 | ||
| Issuer | Shares/Par | Value ($) | ||
| Common Stocks – continued | ||||
| Medical & Health Technology & Services – continued | ||||
| Teladoc Health, Inc. (a) | 464,568 | $ 102,711,339 | ||
| $848,041,076 | ||||
| Medical Equipment – 11.0% | ||||
| Agilent Technologies, Inc. | 1,127,830 | $ 137,674,208 | ||
| Align Technology, Inc. (a) | 242,718 | 137,647,805 | ||
| Bio-Techne Corp. | 587,946 | 212,654,189 | ||
| Maravai Lifesciences Holdings, Inc., “A” (a) | 2,327,313 | 75,684,219 | ||
| Masimo Corp. (a) | 763,436 | 191,416,308 | ||
| Mettler-Toledo International, Inc. (a) | 47,724 | 53,262,370 | ||
| PerkinElmer, Inc. | 2,434,487 | 306,964,466 | ||
| STERIS PLC | 1,348,812 | 235,772,338 | ||
| West Pharmaceutical Services, Inc. | 539,799 | 151,494,589 | ||
| $1,502,570,492 | ||||
| Metals & Mining – 0.7% | ||||
| Howmet Aerospace, Inc. (a) | 3,197,119 | $ 89,871,015 | ||
| Network & Telecom – 1.0% | ||||
| CoreSite Realty Corp., REIT | 1,140,243 | $ 138,778,976 | ||
| Other Banks & Diversified Financials – 0.5% | ||||
| Altimeter Growth Corp. (a) | 2,185,156 | $ 29,477,754 | ||
| Altimeter Growth Corp. 2 (a) | 2,017,875 | 23,528,423 | ||
| Cohn Robbins Holdings Corp. (a) | 1,730,958 | 19,179,015 | ||
| $72,185,192 | ||||
| Pharmaceuticals – 0.6% | ||||
| Ascendis Pharma (a) | 568,513 | $ 88,102,460 | ||
| Printing & Publishing – 1.4% | ||||
| Warner Music Group Corp. | 1,061,010 | $ 37,634,025 | ||
| Wolters Kluwer N.V. | 1,967,081 | 155,883,703 | ||
| $193,517,728 | ||||
| Railroad & Shipping – 0.7% | ||||
| Kansas City Southern Co. | 466,554 | $ 99,068,076 | ||
| Restaurants – 2.0% | ||||
| Chipotle Mexican Grill, Inc., “A” (a) | 124,142 | $ 179,012,764 | ||
| Domino's Pizza, Inc. | 279,501 | 96,849,891 | ||
| $275,862,655 | ||||
| Issuer | Shares/Par | Value ($) | ||
| Common Stocks – continued | ||||
| Specialty Stores – 5.1% | ||||
| Burlington Stores, Inc. (a) | 664,633 | $ 172,020,313 | ||
| Chewy, Inc., “A” (a) | 1,174,376 | 119,269,626 | ||
| Lululemon Athletica, Inc. (a) | 479,354 | 149,405,055 | ||
| O'Reilly Automotive, Inc. (a) | 146,747 | 65,644,335 | ||
| Petco Health & Wellness Co., Inc. (a) | 614,720 | 12,251,370 | ||
| Tractor Supply Co. | 372,285 | 59,178,424 | ||
| Ulta Beauty, Inc. (a) | 388,891 | 125,351,236 | ||
| $703,120,359 | ||||
| Telecommunications - Wireless – 0.7% | ||||
| SBA Communications Corp., REIT | 399,179 | $ 101,842,538 | ||
| Total Common Stocks (Identified Cost, $8,598,300,798) | $13,526,978,990 | |||
| Investment Companies (h) – 1.2% | ||||
| Money Market Funds – 1.2% | ||||
| MFS Institutional Money Market Portfolio, 0.07% (v) (Identified Cost, $157,009,868) | 157,009,868 | $ 157,009,868 | ||
| Other Assets, Less Liabilities – 0.2% | 33,782,532 | |||
| Net Assets – 100.0% | $13,717,771,390 | |||
| (a) | Non-income producing security. |
| (h) | An affiliated issuer, which may be considered one in which the fund owns 5% or more of the outstanding voting securities, or a company which is under common control. At period end, the aggregate values of the fund's investments in affiliated issuers and in unaffiliated issuers were $157,009,868 and $13,526,978,990, respectively. |
| (l) | A portion of this security is on loan. See Note 2 for additional information. |
| (u) | The security was valued using significant unobservable inputs and is considered level 3 under the fair value hierarchy. For further information about the fund’s level 3 holdings, please see Note 2 in the Notes to Financial Statements. |
| (v) | Affiliated issuer that is available only to investment companies managed by MFS. The rate quoted for the MFS Institutional Money Market Portfolio is the annualized seven-day yield of the fund at period end. |
| (w) | When-issued security. |
| (z) | Restricted securities are not registered under the Securities Act of 1933 and are subject to legal restrictions on resale. These securities generally may be resold in transactions exempt from registration or to the public if the securities are subsequently registered. Disposal of these securities may involve time-consuming negotiations and prompt sale at an acceptable price may be difficult. The fund holds the following restricted securities: |
| Restricted Securities | Acquisition Date | Cost | Value |
| Dragoneer Growth Opportunities Corp. (PIPE) | 2/02/21 | $4,529,720 | $4,346,097 |
| % of Net assets | 0.0% |
| (zz) | Securities subject to a restriction on resale, based on an agreement between the fund and the issuer, in conjunction with a business combination. |
| The following abbreviations are used in this report and are defined: | |
| ADR | American Depositary Receipt |
| PIPE | Private Investment in Public Equity |
| REIT | Real Estate Investment Trust |
| Assets | |
| Investments in unaffiliated issuers, at value, including $18,478,672 of securities on loan (identified cost, $8,598,300,798) | $13,526,978,990 |
| Investments in affiliated issuers, at value (identified cost, $157,009,868) | 157,009,868 |
| Cash | 2,953 |
| Receivables for | |
| Fund shares sold | 62,522,634 |
| Interest and dividends | 3,290,530 |
| Other assets | 34,191 |
| Total assets | $13,749,839,166 |
| Liabilities | |
| Payables for | |
| Fund shares reacquired | $23,641,004 |
| When-issued investments purchased | 4,529,720 |
| Payable to affiliates | |
| Investment adviser | 947,173 |
| Administrative services fee | 5,872 |
| Shareholder servicing costs | 2,393,632 |
| Distribution and service fees | 86,946 |
| Program manager fees | 110 |
| Payable for independent Trustees' compensation | 7,376 |
| Accrued expenses and other liabilities | 455,943 |
| Total liabilities | $32,067,776 |
| Net assets | $13,717,771,390 |
| Net assets consist of | |
| Paid-in capital | $8,505,753,317 |
| Total distributable earnings (loss) | 5,212,018,073 |
| Net assets | $13,717,771,390 |
| Shares of beneficial interest outstanding | 470,609,316 |
| Net assets | Shares outstanding | Net asset value per share (a) | |
| Class A | $1,848,499,296 | 66,862,407 | $27.65 |
| Class B | 17,959,239 | 808,710 | 22.21 |
| Class C | 121,558,348 | 5,654,741 | 21.50 |
| Class I | 4,064,595,724 | 137,552,881 | 29.55 |
| Class R1 | 4,120,241 | 186,488 | 22.09 |
| Class R2 | 26,679,481 | 1,033,196 | 25.82 |
| Class R3 | 681,767,925 | 24,822,001 | 27.47 |
| Class R4 | 320,952,155 | 11,128,013 | 28.84 |
| Class R6 | 6,611,673,841 | 221,790,896 | 29.81 |
| Class 529A | 17,591,196 | 657,086 | 26.77 |
| Class 529B | 425,058 | 19,632 | 21.65 |
| Class 529C | 1,948,886 | 93,265 | 20.90 |
| (a) | Maximum offering price per share was equal to the net asset value per share for all share classes, except for Classes A and 529A, for which the maximum offering prices per share were $29.34 [100 / 94.25 x $27.65] and $28.40 [100 / 94.25 x $26.77], respectively. On sales of $50,000 or more, the maximum offering prices of Class A and Class 529A shares are reduced. A contingent deferred sales charge may be imposed on redemptions of Class A, Class B, Class C, Class 529B, and Class 529C shares. Redemption price per share was equal to the net asset value per share for Classes I, R1, R2, R3, R4, R6, and 529A. |
| Net investment income (loss) | |
| Income | |
| Dividends | $23,476,905 |
| Other | 261,746 |
| Dividends from affiliated issuers | 106,782 |
| Income on securities loaned | 35,561 |
| Foreign taxes withheld | (177,500) |
| Total investment income | $23,703,494 |
| Expenses | |
| Management fee | $41,644,162 |
| Distribution and service fees | 3,525,919 |
| Shareholder servicing costs | 4,033,624 |
| Program manager fees | 4,542 |
| Administrative services fee | 267,417 |
| Independent Trustees' compensation | 47,137 |
| Custodian fee | 179,356 |
| Shareholder communications | 295,026 |
| Audit and tax fees | 30,313 |
| Legal fees | 38,545 |
| Miscellaneous | 433,768 |
| Total expenses | $50,499,809 |
| Fees paid indirectly | (136) |
| Reduction of expenses by investment adviser and distributor | (723,538) |
| Net expenses | $49,776,135 |
| Net investment income (loss) | $(26,072,641) |
| Realized and unrealized gain (loss) | |
| Realized gain (loss) (identified cost basis) | |
| Unaffiliated issuers | $400,575,572 |
| Affiliated issuers | 2,711 |
| Foreign currency | (1,381) |
| Net realized gain (loss) | $400,576,902 |
| Change in unrealized appreciation or depreciation | |
| Unaffiliated issuers | $1,247,663,997 |
| Affiliated issuers | (2,712) |
| Translation of assets and liabilities in foreign currencies | (2,447) |
| Net unrealized gain (loss) | $1,247,658,838 |
| Net realized and unrealized gain (loss) | $1,648,235,740 |
| Change in net assets from operations | $1,622,163,099 |
| Six months ended | Year ended | |
| 2/28/21 (unaudited) | 8/31/20 | |
| Change in net assets | ||
| From operations | ||
| Net investment income (loss) | $(26,072,641) | $(9,640,845) |
| Net realized gain (loss) | 400,576,902 | 43,890,779 |
| Net unrealized gain (loss) | 1,247,658,838 | 1,994,075,707 |
| Change in net assets from operations | $1,622,163,099 | $2,028,325,641 |
| Total distributions to shareholders | $(110,534,297) | $(64,368,451) |
| Change in net assets from fund share transactions | $684,011,283 | $3,571,746,148 |
| Total change in net assets | $2,195,640,085 | $5,535,703,338 |
| Net assets | ||
| At beginning of period | 11,522,131,305 | 5,986,427,967 |
| At end of period | $13,717,771,390 | $11,522,131,305 |
| Class A | Six months ended | Year ended | ||||
| 2/28/21 (unaudited) | 8/31/20 | 8/31/19 | 8/31/18 | 8/31/17 | 8/31/16 | |
| Net asset value, beginning of period | $24.65 | $20.19 | $19.16 | $16.34 | $14.82 | $14.40 |
| Income (loss) from investment operations | ||||||
| Net investment income (loss) (d) | $(0.09) | $(0.07) | $(0.07) | $(0.09) | $(0.06)(c) | $(0.06) |
| Net realized and unrealized gain (loss) | 3.32 | 4.71 | 1.83 | 4.32 | 2.36 | 0.88 |
| Total from investment operations | $3.23 | $4.64 | $1.76 | $4.23 | $2.30 | $0.82 |
| Less distributions declared to shareholders | ||||||
| From net realized gain | $(0.23) | $(0.18) | $(0.73) | $(1.41) | $(0.78) | $(0.40) |
| Net asset value, end of period (x) | $27.65 | $24.65 | $20.19 | $19.16 | $16.34 | $14.82 |
| Total return (%) (r)(s)(t)(x) | 13.15(n) | 23.16 | 10.13 | 27.69 | 16.44(c) | 5.87 |
| Ratios (%) (to average net assets) and Supplemental data: | ||||||
| Expenses before expense reductions (f) | 1.02(a) | 1.05 | 1.10 | 1.17 | 1.22(c) | 1.26 |
| Expenses after expense reductions (f) | 1.01(a) | 1.04 | 1.09 | 1.16 | 1.20(c) | 1.22 |
| Net investment income (loss) | (0.64)(a) | (0.35) | (0.36) | (0.55) | (0.42)(c) | (0.45) |
| Portfolio turnover | 14(n) | 34 | 21 | 33 | 30 | 43 |
| Net assets at end of period (000 omitted) | $1,848,499 | $1,483,320 | $1,065,566 | $824,847 | $572,338 | $454,881 |
| Class B | Six months ended | Year ended | ||||
| 2/28/21 (unaudited) | 8/31/20 | 8/31/19 | 8/31/18 | 8/31/17 | 8/31/16 | |
| Net asset value, beginning of period | $19.91 | $16.47 | $15.90 | $13.88 | $12.80 | $12.58 |
| Income (loss) from investment operations | ||||||
| Net investment income (loss) (d) | $(0.15) | $(0.19) | $(0.17) | $(0.19) | $(0.15)(c) | $(0.15) |
| Net realized and unrealized gain (loss) | 2.68 | 3.81 | 1.47 | 3.62 | 2.01 | 0.77 |
| Total from investment operations | $2.53 | $3.62 | $1.30 | $3.43 | $1.86 | $0.62 |
| Less distributions declared to shareholders | ||||||
| From net realized gain | $(0.23) | $(0.18) | $(0.73) | $(1.41) | $(0.78) | $(0.40) |
| Net asset value, end of period (x) | $22.21 | $19.91 | $16.47 | $15.90 | $13.88 | $12.80 |
| Total return (%) (r)(s)(t)(x) | 12.76(n) | 22.20 | 9.28 | 26.77 | 15.56(c) | 5.11 |
| Ratios (%) (to average net assets) and Supplemental data: | ||||||
| Expenses before expense reductions (f) | 1.77(a) | 1.80 | 1.85 | 1.92 | 1.97(c) | 2.00 |
| Expenses after expense reductions (f) | 1.76(a) | 1.79 | 1.84 | 1.91 | 1.95(c) | 1.97 |
| Net investment income (loss) | (1.39)(a) | (1.10) | (1.12) | (1.30) | (1.16)(c) | (1.24) |
| Portfolio turnover | 14(n) | 34 | 21 | 33 | 30 | 43 |
| Net assets at end of period (000 omitted) | $17,959 | $17,725 | $18,581 | $19,329 | $16,326 | $17,978 |
| Class C | Six months ended | Year ended | ||||
| 2/28/21 (unaudited) | 8/31/20 | 8/31/19 | 8/31/18 | 8/31/17 | 8/31/16 | |
| Net asset value, beginning of period | $19.28 | $15.95 | $15.42 | $13.50 | $12.48 | $12.27 |
| Income (loss) from investment operations | ||||||
| Net investment income (loss) (d) | $(0.14) | $(0.18) | $(0.16) | $(0.18) | $(0.15)(c) | $(0.14) |
| Net realized and unrealized gain (loss) | 2.59 | 3.69 | 1.42 | 3.51 | 1.95 | 0.75 |
| Total from investment operations | $2.45 | $3.51 | $1.26 | $3.33 | $1.80 | $0.61 |
| Less distributions declared to shareholders | ||||||
| From net realized gain | $(0.23) | $(0.18) | $(0.73) | $(1.41) | $(0.78) | $(0.40) |
| Net asset value, end of period (x) | $21.50 | $19.28 | $15.95 | $15.42 | $13.50 | $12.48 |
| Total return (%) (r)(s)(t)(x) | 12.76(n) | 22.23 | 9.31 | 26.77 | 15.48(c) | 5.16 |
| Ratios (%) (to average net assets) and Supplemental data: | ||||||
| Expenses before expense reductions (f) | 1.77(a) | 1.80 | 1.85 | 1.92 | 1.97(c) | 2.00 |
| Expenses after expense reductions (f) | 1.76(a) | 1.79 | 1.84 | 1.91 | 1.95(c) | 1.97 |
| Net investment income (loss) | (1.39)(a) | (1.10) | (1.11) | (1.30) | (1.17)(c) | (1.22) |
| Portfolio turnover | 14(n) | 34 | 21 | 33 | 30 | 43 |
| Net assets at end of period (000 omitted) | $121,558 | $109,521 | $78,858 | $54,080 | $58,623 | $53,862 |
| Class I | Six months ended | Year ended | ||||
| 2/28/21 (unaudited) | 8/31/20 | 8/31/19 | 8/31/18 | 8/31/17 | 8/31/16 | |
| Net asset value, beginning of period | $26.30 | $21.48 | $20.28 | $17.17 | $15.50 | $15.00 |
| Income (loss) from investment operations | ||||||
| Net investment income (loss) (d) | $(0.06) | $(0.02) | $(0.02) | $(0.06) | $(0.03)(c) | $(0.00)(w) |
| Net realized and unrealized gain (loss) | 3.54 | 5.02 | 1.95 | 4.58 | 2.48 | 0.90 |
| Total from investment operations | $3.48 | $5.00 | $1.93 | $4.52 | $2.45 | $0.90 |
| Less distributions declared to shareholders | ||||||
| From net realized gain | $(0.23) | $(0.18) | $(0.73) | $(1.41) | $(0.78) | $(0.40) |
| Net asset value, end of period (x) | $29.55 | $26.30 | $21.48 | $20.28 | $17.17 | $15.50 |
| Total return (%) (r)(s)(t)(x) | 13.28(n) | 23.45 | 10.42 | 28.05 | 16.70(c) | 6.17 |
| Ratios (%) (to average net assets) and Supplemental data: | ||||||
| Expenses before expense reductions (f) | 0.77(a) | 0.80 | 0.84 | 0.92 | 0.97(c) | 1.02 |
| Expenses after expense reductions (f) | 0.76(a) | 0.79 | 0.83 | 0.91 | 0.96(c) | 0.99 |
| Net investment income (loss) | (0.40)(a) | (0.10) | (0.09) | (0.30) | (0.18)(c) | (0.01) |
| Portfolio turnover | 14(n) | 34 | 21 | 33 | 30 | 43 |
| Net assets at end of period (000 omitted) | $4,064,596 | $3,837,781 | $1,330,368 | $332,008 | $100,858 | $110,803 |
| Class R1 | Six months ended | Year ended | ||||
| 2/28/21 (unaudited) | 8/31/20 | 8/31/19 | 8/31/18 | 8/31/17 | 8/31/16 | |
| Net asset value, beginning of period | $19.81 | $16.39 | $15.82 | $13.82 | $12.75 | $12.53 |
| Income (loss) from investment operations | ||||||
| Net investment income (loss) (d) | $(0.15) | $(0.18) | $(0.17) | $(0.19) | $(0.15)(c) | $(0.15) |
| Net realized and unrealized gain (loss) | 2.66 | 3.78 | 1.47 | 3.60 | 2.00 | 0.77 |
| Total from investment operations | $2.51 | $3.60 | $1.30 | $3.41 | $1.85 | $0.62 |
| Less distributions declared to shareholders | ||||||
| From net realized gain | $(0.23) | $(0.18) | $(0.73) | $(1.41) | $(0.78) | $(0.40) |
| Net asset value, end of period (x) | $22.09 | $19.81 | $16.39 | $15.82 | $13.82 | $12.75 |
| Total return (%) (r)(s)(t)(x) | 12.73(n) | 22.18 | 9.33 | 26.73 | 15.54(c) | 5.13 |
| Ratios (%) (to average net assets) and Supplemental data: | ||||||
| Expenses before expense reductions (f) | 1.77(a) | 1.80 | 1.85 | 1.92 | 1.97(c) | 2.00 |
| Expenses after expense reductions (f) | 1.76(a) | 1.79 | 1.84 | 1.91 | 1.96(c) | 1.97 |
| Net investment income (loss) | (1.39)(a) | (1.09) | (1.12) | (1.30) | (1.17)(c) | (1.25) |
| Portfolio turnover | 14(n) | 34 | 21 | 33 | 30 | 43 |
| Net assets at end of period (000 omitted) | $4,120 | $4,187 | $3,472 | $2,827 | $2,348 | $2,057 |
| Class R2 | Six months ended | Year ended | ||||
| 2/28/21 (unaudited) | 8/31/20 | 8/31/19 | 8/31/18 | 8/31/17 | 8/31/16 | |
| Net asset value, beginning of period | $23.06 | $18.95 | $18.08 | $15.53 | $14.16 | $13.80 |
| Income (loss) from investment operations | ||||||
| Net investment income (loss) (d) | $(0.11) | $(0.12) | $(0.11) | $(0.13) | $(0.10)(c) | $(0.10) |
| Net realized and unrealized gain (loss) | 3.10 | 4.41 | 1.71 | 4.09 | 2.25 | 0.86 |
| Total from investment operations | $2.99 | $4.29 | $1.60 | $3.96 | $2.15 | $0.76 |
| Less distributions declared to shareholders | ||||||
| From net realized gain | $(0.23) | $(0.18) | $(0.73) | $(1.41) | $(0.78) | $(0.40) |
| Net asset value, end of period (x) | $25.82 | $23.06 | $18.95 | $18.08 | $15.53 | $14.16 |
| Total return (%) (r)(s)(t)(x) | 13.01(n) | 22.83 | 9.84 | 27.37 | 16.14(c) | 5.68 |
| Ratios (%) (to average net assets) and Supplemental data: | ||||||
| Expenses before expense reductions (f) | 1.27(a) | 1.30 | 1.35 | 1.42 | 1.47(c) | 1.50 |
| Expenses after expense reductions (f) | 1.26(a) | 1.29 | 1.34 | 1.41 | 1.46(c) | 1.47 |
| Net investment income (loss) | (0.90)(a) | (0.60) | (0.61) | (0.80) | (0.67)(c) | (0.73) |
| Portfolio turnover | 14(n) | 34 | 21 | 33 | 30 | 43 |
| Net assets at end of period (000 omitted) | $26,679 | $15,176 | $11,060 | $9,069 | $6,681 | $5,651 |
| Class R3 | Six months ended | Year ended | ||||
| 2/28/21 (unaudited) | 8/31/20 | 8/31/19 | 8/31/18 | 8/31/17 | 8/31/16 | |
| Net asset value, beginning of period | $24.49 | $20.06 | $19.04 | $16.24 | $14.74 | $14.32 |
| Income (loss) from investment operations | ||||||
| Net investment income (loss) (d) | $(0.09) | $(0.07) | $(0.06) | $(0.09) | $(0.07)(c) | $(0.06) |
| Net realized and unrealized gain (loss) | 3.30 | 4.68 | 1.81 | 4.30 | 2.35 | 0.88 |
| Total from investment operations | $3.21 | $4.61 | $1.75 | $4.21 | $2.28 | $0.82 |
| Less distributions declared to shareholders | ||||||
| From net realized gain | $(0.23) | $(0.18) | $(0.73) | $(1.41) | $(0.78) | $(0.40) |
| Net asset value, end of period (x) | $27.47 | $24.49 | $20.06 | $19.04 | $16.24 | $14.74 |
| Total return (%) (r)(s)(t)(x) | 13.15(n) | 23.16 | 10.14 | 27.73 | 16.39(c) | 5.90 |
| Ratios (%) (to average net assets) and Supplemental data: | ||||||
| Expenses before expense reductions (f) | 1.02(a) | 1.05 | 1.09 | 1.17 | 1.22(c) | 1.26 |
| Expenses after expense reductions (f) | 1.01(a) | 1.04 | 1.09 | 1.16 | 1.21(c) | 1.23 |
| Net investment income (loss) | (0.65)(a) | (0.35) | (0.34) | (0.55) | (0.44)(c) | (0.42) |
| Portfolio turnover | 14(n) | 34 | 21 | 33 | 30 | 43 |
| Net assets at end of period (000 omitted) | $681,768 | $451,972 | $239,505 | $95,010 | $32,496 | $14,836 |
| Class R4 | Six months ended | Year ended | ||||
| 2/28/21 (unaudited) | 8/31/20 | 8/31/19 | 8/31/18 | 8/31/17 | 8/31/16 | |
| Net asset value, beginning of period | $25.67 | $20.97 | $19.82 | $16.82 | $15.20 | $14.72 |
| Income (loss) from investment operations | ||||||
| Net investment income (loss) (d) | $(0.05) | $(0.02) | $(0.02) | $(0.05) | $(0.03)(c) | $(0.02) |
| Net realized and unrealized gain (loss) | 3.45 | 4.90 | 1.90 | 4.46 | 2.43 | 0.90 |
| Total from investment operations | $3.40 | $4.88 | $1.88 | $4.41 | $2.40 | $0.88 |
| Less distributions declared to shareholders | ||||||
| From net realized gain | $(0.23) | $(0.18) | $(0.73) | $(1.41) | $(0.78) | $(0.40) |
| Net asset value, end of period (x) | $28.84 | $25.67 | $20.97 | $19.82 | $16.82 | $15.20 |
| Total return (%) (r)(s)(t)(x) | 13.29(n) | 23.45 | 10.40 | 27.98 | 16.70(c) | 6.15 |
| Ratios (%) (to average net assets) and Supplemental data: | ||||||
| Expenses before expense reductions (f) | 0.77(a) | 0.80 | 0.84 | 0.92 | 0.97(c) | 1.01 |
| Expenses after expense reductions (f) | 0.76(a) | 0.79 | 0.83 | 0.91 | 0.96(c) | 0.98 |
| Net investment income (loss) | (0.39)(a) | (0.10) | (0.08) | (0.30) | (0.18)(c) | (0.17) |
| Portfolio turnover | 14(n) | 34 | 21 | 33 | 30 | 43 |
| Net assets at end of period (000 omitted) | $320,952 | $242,937 | $173,441 | $54,141 | $22,346 | $13,883 |
| Class R6 | Six months ended | Year ended | ||||
| 2/28/21 (unaudited) | 8/31/20 | 8/31/19 | 8/31/18 | 8/31/17 | 8/31/16 | |
| Net asset value, beginning of period | $26.51 | $21.63 | $20.40 | $17.25 | $15.55 | $15.03 |
| Income (loss) from investment operations | ||||||
| Net investment income (loss) (d) | $(0.04) | $(0.00)(w) | $(0.00)(w) | $(0.04) | $(0.01)(c) | $(0.02) |
| Net realized and unrealized gain (loss) | 3.57 | 5.06 | 1.96 | 4.60 | 2.49 | 0.94 |
| Total from investment operations | $3.53 | $5.06 | $1.96 | $4.56 | $2.48 | $0.92 |
| Less distributions declared to shareholders | ||||||
| From net realized gain | $(0.23) | $(0.18) | $(0.73) | $(1.41) | $(0.78) | $(0.40) |
| Net asset value, end of period (x) | $29.81 | $26.51 | $21.63 | $20.40 | $17.25 | $15.55 |
| Total return (%) (r)(s)(t)(x) | 13.36(n) | 23.57 | 10.51 | 28.17 | 16.84(c) | 6.29 |
| Ratios (%) (to average net assets) and Supplemental data: | ||||||
| Expenses before expense reductions (f) | 0.67(a) | 0.70 | 0.75 | 0.81 | 0.86(c) | 0.90 |
| Expenses after expense reductions (f) | 0.65(a) | 0.69 | 0.74 | 0.81 | 0.84(c) | 0.87 |
| Net investment income (loss) | (0.29)(a) | (0.01) | (0.01) | (0.19) | (0.05)(c) | (0.14) |
| Portfolio turnover | 14(n) | 34 | 21 | 33 | 30 | 43 |
| Net assets at end of period (000 omitted) | $6,611,674 | $5,343,295 | $3,053,325 | $2,013,624 | $1,520,339 | $1,330,139 |
| Class 529A | Six months ended | Year ended | ||||
| 2/28/21 (unaudited) | 8/31/20 | 8/31/19 | 8/31/18 | 8/31/17 | 8/31/16 | |
| Net asset value, beginning of period | $23.88 | $19.57 | $18.60 | $15.90 | $14.45 | $14.04 |
| Income (loss) from investment operations | ||||||
| Net investment income (loss) (d) | $(0.09) | $(0.08) | $(0.07) | $(0.09) | $(0.06)(c) | $(0.07) |
| Net realized and unrealized gain (loss) | 3.21 | 4.57 | 1.77 | 4.20 | 2.29 | 0.88 |
| Total from investment operations | $3.12 | $4.49 | $1.70 | $4.11 | $2.23 | $0.81 |
| Less distributions declared to shareholders | ||||||
| From net realized gain | $(0.23) | $(0.18) | $(0.73) | $(1.41) | $(0.78) | $(0.40) |
| Net asset value, end of period (x) | $26.77 | $23.88 | $19.57 | $18.60 | $15.90 | $14.45 |
| Total return (%) (r)(s)(t)(x) | 13.11(n) | 23.13 | 10.11 | 27.70 | 16.38(c) | 5.95 |
| Ratios (%) (to average net assets) and Supplemental data: | ||||||
| Expenses before expense reductions (f) | 1.07(a) | 1.10 | 1.15 | 1.23 | 1.32(c) | 1.35 |
| Expenses after expense reductions (f) | 1.03(a) | 1.06 | 1.10 | 1.18 | 1.21(c) | 1.23 |
| Net investment income (loss) | (0.67)(a) | (0.38) | (0.38) | (0.56) | (0.43)(c) | (0.48) |
| Portfolio turnover | 14(n) | 34 | 21 | 33 | 30 | 43 |
| Net assets at end of period (000 omitted) | $17,591 | $13,593 | $9,590 | $7,582 | $4,916 | $3,890 |
| Class 529B | Six months ended | Year ended | ||||
| 2/28/21 (unaudited) | 8/31/20 | 8/31/19 | 8/31/18 | 8/31/17 | 8/31/16 | |
| Net asset value, beginning of period | $19.38 | $16.04 | $15.51 | $13.58 | $12.55 | $12.34 |
| Income (loss) from investment operations | ||||||
| Net investment income (loss) (d) | $(0.10) | $(0.19) | $(0.17) | $(0.19) | $(0.15)(c) | $(0.15) |
| Net realized and unrealized gain (loss) | 2.60 | 3.71 | 1.43 | 3.53 | 1.96 | 0.76 |
| Total from investment operations | $2.50 | $3.52 | $1.26 | $3.34 | $1.81 | $0.61 |
| Less distributions declared to shareholders | ||||||
| From net realized gain | $(0.23) | $(0.18) | $(0.73) | $(1.41) | $(0.78) | $(0.40) |
| Net asset value, end of period (x) | $21.65 | $19.38 | $16.04 | $15.51 | $13.58 | $12.55 |
| Total return (%) (r)(s)(t)(x) | 12.96(n) | 22.17 | 9.26 | 26.69 | 15.47(c) | 5.13 |
| Ratios (%) (to average net assets) and Supplemental data: | ||||||
| Expenses before expense reductions (f) | 1.31(a) | 1.85 | 1.90 | 1.98 | 2.07(c) | 2.11 |
| Expenses after expense reductions (f) | 1.30(a) | 1.84 | 1.89 | 1.96 | 2.00(c) | 2.02 |
| Net investment income (loss) | (0.93)(a) | (1.15) | (1.17) | (1.35) | (1.23)(c) | (1.26) |
| Portfolio turnover | 14(n) | 34 | 21 | 33 | 30 | 43 |
| Net assets at end of period (000 omitted) | $425 | $407 | $361 | $304 | $210 | $209 |
| Class 529C | Six months ended | Year ended | ||||
| 2/28/21 (unaudited) | 8/31/20 | 8/31/19 | 8/31/18 | 8/31/17 | 8/31/16 | |
| Net asset value, beginning of period | $18.75 | $15.52 | $15.04 | $13.20 | $12.22 | $12.03 |
| Income (loss) from investment operations | ||||||
| Net investment income (loss) (d) | $(0.14) | $(0.18) | $(0.16) | $(0.18) | $(0.15)(c) | $(0.15) |
| Net realized and unrealized gain (loss) | 2.52 | 3.59 | 1.37 | 3.43 | 1.91 | 0.74 |
| Total from investment operations | $2.38 | $3.41 | $1.21 | $3.25 | $1.76 | $0.59 |
| Less distributions declared to shareholders | ||||||
| From net realized gain | $(0.23) | $(0.18) | $(0.73) | $(1.41) | $(0.78) | $(0.40) |
| Net asset value, end of period (x) | $20.90 | $18.75 | $15.52 | $15.04 | $13.20 | $12.22 |
| Total return (%) (r)(s)(t)(x) | 12.75(n) | 22.20 | 9.21 | 26.78 | 15.48(c) | 5.09 |
| Ratios (%) (to average net assets) and Supplemental data: | ||||||
| Expenses before expense reductions (f) | 1.82(a) | 1.85 | 1.90 | 1.99 | 2.07(c) | 2.10 |
| Expenses after expense reductions (f) | 1.79(a) | 1.83 | 1.88 | 1.95 | 1.99(c) | 2.01 |
| Net investment income (loss) | (1.42)(a) | (1.14) | (1.16) | (1.34) | (1.21)(c) | (1.27) |
| Portfolio turnover | 14(n) | 34 | 21 | 33 | 30 | 43 |
| Net assets at end of period (000 omitted) | $1,949 | $2,217 | $2,299 | $2,236 | $1,955 | $1,641 |
| (a) | Annualized. |
| (c) | Amount reflects a one-time reimbursement of expenses by the custodian (or former custodian) without which net investment income and performance would be lower and expenses would be higher. |
| (d) | Per share data is based on average shares outstanding. |
| (f) | Ratios do not reflect reductions from fees paid indirectly, if applicable. |
| (n) | Not annualized. |
| (r) | Certain expenses have been reduced without which performance would have been lower. |
| (s) | From time to time the fund may receive proceeds from litigation settlements, without which performance would be lower. |
| (t) | Total returns do not include any applicable sales charges. |
| (w) | Per share amount was less than $0.01. |
| (x) | The net asset values and total returns have been calculated on net assets which include adjustments made in accordance with U.S. generally accepted accounting principles required at period end for financial reporting purposes. |
| Financial Instruments | Level 1 | Level 2 | Level 3 | Total |
| Equity Securities: | ||||
| United States | $12,386,236,533 | $— | $4,346,097 | $12,390,582,630 |
| Israel | 312,857,898 | — | — | 312,857,898 |
| Netherlands | 236,021,325 | — | — | 236,021,325 |
| United Kingdom | 191,655,783 | — | — | 191,655,783 |
| Ireland | 161,417,163 | — | — | 161,417,163 |
| Canada | 146,341,731 | — | — | 146,341,731 |
| Denmark | 88,102,460 | — | — | 88,102,460 |
| Mutual Funds | 157,009,868 | — | — | 157,009,868 |
| Total | $13,679,642,761 | $— | $4,346,097 | $13,683,988,858 |
| Equity Securities | |
| Balance as of 8/31/20 | $— |
| Change in unrealized appreciation or depreciation | (183,623) |
| Purchases | 4,529,720 |
| Balance as of 2/28/21 | $4,346,097 |
| Year ended 8/31/20 | |
| Long-term capital gains | $64,368,451 |
| As of 2/28/21 | |
| Cost of investments | $8,779,359,473 |
| Gross appreciation | 4,939,034,093 |
| Gross depreciation | (34,404,708) |
| Net unrealized appreciation (depreciation) | $4,904,629,385 |
| As of 8/31/20 | |
| Undistributed long-term capital gain | 57,529,602 |
| Late year ordinary loss deferral | (14,129,844) |
| Other temporary differences | 21,413 |
| Net unrealized appreciation (depreciation) | 3,656,968,100 |
| Six months ended 2/28/21 | Year ended 8/31/20 | |
| Class A | $14,608,056 | $9,859,800 |
| Class B | 199,879 | 192,285 |
| Class C | 1,338,598 | 934,695 |
| Class I | 37,451,689 | 18,997,911 |
| Class R1 | 44,908 | 44,903 |
| Class R2 | 158,195 | 100,054 |
| Class R3 | 4,810,101 | 2,828,218 |
| Class R4 | 2,303,508 | 1,671,984 |
| Class R6 | 49,446,575 | 29,619,366 |
| Class 529A | 140,412 | 90,325 |
| Class 529B | 4,840 | 3,816 |
| Class 529C | 27,536 | 25,094 |
| Total | $110,534,297 | $64,368,451 |
| Up to $1 billion | 0.75% |
| In excess of $1 billion and up to $2.5 billion | 0.70% |
| In excess of $2.5 billion and up to $5 billion | 0.65% |
| In excess of $5 billion and up to $10 billion | 0.62% |
| In excess of $10 billion | 0.60% |
| Classes | |||||||||||
| A | B | C | I | R1 | R2 | R3 | R4 | R6 | 529A | 529B | 529C |
| 1.30% | 2.05% | 2.05% | 1.05% | 2.05% | 1.55% | 1.30% | 1.05% | 0.95% | 1.35% | 2.10% | 2.10% |
| Distribution Fee Rate (d) | Service Fee Rate (d) | Total Distribution Plan (d) | Annual Effective Rate (e) | Distribution and Service Fee | |
| Class A | — | 0.25% | 0.25% | 0.25% | $ 2,069,397 |
| Class B | 0.75% | 0.25% | 1.00% | 1.00% | 90,959 |
| Class C | 0.75% | 0.25% | 1.00% | 1.00% | 584,079 |
| Class R1 | 0.75% | 0.25% | 1.00% | 1.00% | 21,297 |
| Class R2 | 0.25% | 0.25% | 0.50% | 0.50% | 48,276 |
| Class R3 | — | 0.25% | 0.25% | 0.25% | 680,479 |
| Class 529A | — | 0.25% | 0.25% | 0.22% | 19,448 |
| Class 529B | 0.75% | 0.25% | 1.00% | 0.49% | 1,038 |
| Class 529C | 0.75% | 0.25% | 1.00% | 0.99% | 10,946 |
| Total Distribution and Service Fees | $3,525,919 |
| (d) | In accordance with the distribution plan for certain classes, the fund pays distribution and/or service fees equal to these annual percentage rates of each class’s average daily net assets. The distribution and service fee rates disclosed by class represent the current rates in effect at the end of the reporting period. Any rate changes, if applicable, are detailed below. |
| (e) | The annual effective rates represent actual fees incurred under the distribution plan for the six months ended February 28, 2021 based on each class's average daily net assets.MFD has voluntarily agreed to rebate a portion of each class's 0.25% service fee attributable to accounts for which there is no financial intermediary specified on the account except for accounts attributable to MFS or its affiliates' seed money. For the six months ended February 28, 2021, this rebate amounted to $1,124, $10, $12, $2,124, and $146 for Class A, Class B, Class C, Class 529A, and Class 529C, respectively, and is included in the reduction of total expenses in the Statement of Operations. For the period from November 1, 2020 through February 28, 2021, the 0.75% distribution fee was not imposed for Class 529B shares due to the sales charge limitations contained in Financial Industry Regulatory Authority (“FINRA”) Rule 2341. |
| Amount | |
| Class A | $7,406 |
| Class B | 3,989 |
| Class C | 8,717 |
| Class 529B | — |
| Class 529C | 27 |
| Fee | |
| Class 529A | $3,890 |
| Class 529B | 106 |
| Class 529C | 546 |
| Total Program Manager Fees | $4,542 |
| Six months ended 2/28/21 | Year ended 8/31/20 | ||||
| Shares | Amount | Shares | Amount | ||
| Shares sold | |||||
| Class A | 12,129,128 | $325,559,888 | 19,150,294 | $397,151,871 | |
| Class B | 27,971 | 593,122 | 40,035 | 659,617 | |
| Class C | 765,469 | 15,997,642 | 2,088,030 | 34,325,371 | |
| Class I | 34,149,702 | 957,102,198 | 118,050,630 | 2,647,030,965 | |
| Class R1 | 27,050 | 587,237 | 95,610 | 1,623,960 | |
| Class R2 | 486,953 | 12,587,656 | 320,112 | 6,206,067 | |
| Class R3 | 9,295,381 | 251,313,611 | 10,948,478 | 226,467,798 | |
| Class R4 | 2,820,441 | 81,086,984 | 3,758,366 | 81,341,594 | |
| Class R6 | 43,763,588 | 1,268,041,239 | 97,278,087 | 2,184,427,324 | |
| Class 529A | 114,137 | 3,020,926 | 128,965 | 2,618,266 | |
| Class 529B | 318 | 6,083 | 1,265 | 18,728 | |
| Class 529C | 17,704 | 351,326 | 14,594 | 240,063 | |
| 103,597,842 | $2,916,247,912 | 251,874,466 | $5,582,111,624 | ||
| Shares issued to shareholders in reinvestment of distributions | |||||
| Class A | 503,774 | $13,541,443 | 440,258 | $9,095,745 | |
| Class B | 9,179 | 198,546 | 11,391 | 191,132 | |
| Class C | 62,251 | 1,302,918 | 55,628 | 903,950 | |
| Class I | 1,266,483 | 36,360,734 | 835,859 | 18,388,907 | |
| Class R1 | 2,087 | 44,908 | 2,689 | 44,903 | |
| Class R2 | 6,253 | 157,065 | 4,761 | 92,224 | |
| Class R3 | 180,154 | 4,810,101 | 137,760 | 2,828,218 | |
| Class R4 | 80,098 | 2,245,140 | 75,746 | 1,627,032 | |
| Class R6 | 1,626,951 | 47,116,499 | 1,273,386 | 28,230,957 | |
| Class 529A | 5,058 | 131,661 | 4,510 | 90,253 | |
| Class 529B | 230 | 4,840 | 234 | 3,816 | |
| Class 529C | 1,278 | 26,019 | 1,587 | 25,075 | |
| 3,743,796 | $105,939,874 | 2,843,809 | $61,522,212 | ||
| Six months ended 2/28/21 | Year ended 8/31/20 | ||||
| Shares | Amount | Shares | Amount | ||
| Shares reacquired | |||||
| Class A | (5,955,474) | $(158,689,323) | (12,182,500) | $(250,900,560) | |
| Class B | (118,586) | (2,561,231) | (289,584) | (4,807,304) | |
| Class C | (852,869) | (17,911,756) | (1,406,988) | (22,690,262) | |
| Class I | (43,810,289) | (1,311,188,900) | (34,879,710) | (775,106,805) | |
| Class R1 | (53,985) | (1,168,728) | (98,817) | (1,558,161) | |
| Class R2 | (118,061) | (2,974,802) | (250,454) | (4,821,076) | |
| Class R3 | (3,111,707) | (82,684,515) | (4,567,435) | (93,853,569) | |
| Class R4 | (1,236,015) | (34,553,478) | (2,641,306) | (56,676,069) | |
| Class R6 | (25,142,293) | (724,658,932) | (38,173,178) | (859,598,802) | |
| Class 529A | (31,450) | (832,934) | (54,306) | (1,084,906) | |
| Class 529B | (1,920) | (40,703) | (3,034) | (46,375) | |
| Class 529C | (43,948) | (911,201) | (46,093) | (743,799) | |
| (80,476,597) | $(2,338,176,503) | (94,593,405) | $(2,071,887,688) | ||
| Net change | |||||
| Class A | 6,677,428 | $180,412,008 | 7,408,052 | $155,347,056 | |
| Class B | (81,436) | (1,769,563) | (238,158) | (3,956,555) | |
| Class C | (25,149) | (611,196) | 736,670 | 12,539,059 | |
| Class I | (8,394,104) | (317,725,968) | 84,006,779 | 1,890,313,067 | |
| Class R1 | (24,848) | (536,583) | (518) | 110,702 | |
| Class R2 | 375,145 | 9,769,919 | 74,419 | 1,477,215 | |
| Class R3 | 6,363,828 | 173,439,197 | 6,518,803 | 135,442,447 | |
| Class R4 | 1,664,524 | 48,778,646 | 1,192,806 | 26,292,557 | |
| Class R6 | 20,248,246 | 590,498,806 | 60,378,295 | 1,353,059,479 | |
| Class 529A | 87,745 | 2,319,653 | 79,169 | 1,623,613 | |
| Class 529B | (1,372) | (29,780) | (1,535) | (23,831) | |
| Class 529C | (24,966) | (533,856) | (29,912) | (478,661) | |
| 26,865,041 | $684,011,283 | 160,124,870 | $3,571,746,148 | ||
| Affiliated Issuers | Beginning Value | Purchases | Sales Proceeds | Realized Gain (Loss) | Change in Unrealized Appreciation or Depreciation | Ending Value |
| MFS Institutional Money Market Portfolio | $321,141,622 | $1,413,493,271 | $1,577,625,024 | $2,711 | $(2,712) | $157,009,868 |
| Affiliated Issuers | Dividend Income | Capital Gain Distributions |
| MFS Institutional Money Market Portfolio | $106,782 | $— |


Money Market Fund

Money Market Fund
| 1 | |
| 2 | |
| 3 | |
| 5 | |
| 7 | |
| 8 | |
| 9 | |
| 10 | |
| 11 | |
| 17 | |
| 17 | |
| 17 | |
| 17 | |
| 17 |
| back cover |


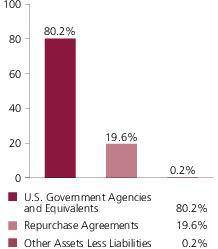
| 0 - 7 days | 30.3% |
| 8 - 29 days | 25.1% |
| 30 - 59 days | 31.8% |
| 60 - 89 days | 12.6% |
| Other Assets Less Liabilities | 0.2% |
| A-1+ | 59.0% |
| A-1 | 40.8% |
| Other Assets Less Liabilities | 0.2% |
| (a) | Ratings are assigned to portfolio securities utilizing ratings from Moody’s, Fitch, and Standard & Poor’s rating agencies and applying the following hierarchy: If all three agencies provide a rating, the middle rating (after dropping the highest and lowest ratings) is assigned; if two of the three agencies rate a security, the lower of the two is assigned. Ratings are shown in the S&P scale. All ratings are subject to change. The fund is not rated by these agencies. |
| (u) | For purposes of this presentation, accrued interest, where applicable, is included. |
September 1, 2020 through February 28, 2021
| Annualized Expense Ratio | Beginning Account Value 9/01/20 | Ending Account Value 2/28/21 | Expenses Paid During Period (p) 9/01/20-2/28/21 | |
| Actual | 0.08% | $1,000.00 | $1,000.00 | $0.40 |
| Hypothetical (h) | 0.08% | $1,000.00 | $1,024.40 | $0.40 |
| (h) | 5% fund return per year before expenses. |
| (p) | “Expenses Paid During Period” are equal to the fund's annualized expense ratio, as shown above, multiplied by the average account value over the period, multiplied by 181/365 (to reflect the one-half year period). Expenses paid do not include any applicable sales charges (loads). If these transaction costs had been included, your costs would have been higher. |
| Issuer | Shares/Par | Value ($) | ||
| U.S. Government Agencies and Equivalents (y) – 80.2% | ||||
| Federal Farm Credit Bank, 0.112%, due 3/16/2021 | $ 10,546,000 | $ 10,545,517 | ||
| Federal Farm Credit Bank, 0.02%, due 3/23/2021 | 11,968,000 | 11,967,854 | ||
| Federal Farm Credit Bank, 0.03%, due 4/01/2021 | 9,032,000 | 9,031,767 | ||
| Federal Farm Credit Bank, 0.03%, due 4/12/2021 | 19,946,000 | 19,945,302 | ||
| Federal Home Loan Bank, 0.015%, due 3/05/2021 | 11,914,000 | 11,913,980 | ||
| Federal Home Loan Bank, 0.03%, due 4/09/2021 | 19,044,000 | 19,043,381 | ||
| Federal Home Loan Bank, 0.035%, due 4/14/2021 | 5,046,000 | 5,045,784 | ||
| Federal Home Loan Bank, 0.025%, due 4/21/2021 | 18,000,000 | 17,999,363 | ||
| U.S. Treasury Bill, 0.071%, due 3/02/2021 | 13,888,000 | 13,887,973 | ||
| U.S. Treasury Bill, 0.076%, due 3/04/2021 | 27,647,000 | 27,646,827 | ||
| U.S. Treasury Bill, 0.074%, due 3/09/2021 | 15,936,000 | 15,935,743 | ||
| U.S. Treasury Bill, 0.076%, due 3/11/2021 | 48,840,000 | 48,838,982 | ||
| U.S. Treasury Bill, 0.02%, due 3/16/2021 | 19,170,000 | 19,169,840 | ||
| U.S. Treasury Bill, 0.066%, due 3/18/2021 | 10,551,000 | 10,550,676 | ||
| U.S. Treasury Bill, 0.071%, due 3/23/2021 | 8,000,000 | 7,999,658 | ||
| U.S. Treasury Bill, 0.076%, due 4/06/2021 | 13,689,000 | 13,687,973 | ||
| U.S. Treasury Bill, 0.076%, due 4/08/2021 | 15,285,000 | 15,283,790 | ||
| U.S. Treasury Bill, 0.076%, due 4/13/2021 | 34,000,000 | 33,996,954 | ||
| U.S. Treasury Bill, 0.056%, due 4/20/2021 | 8,700,000 | 8,699,335 | ||
| U.S. Treasury Bill, 0.035%, due 4/22/2021 | 8,505,000 | 8,504,570 | ||
| U.S. Treasury Bill, 0.035%, due 4/27/2021 | 6,803,000 | 6,802,623 | ||
| U.S. Treasury Bill, 0.035%, due 5/04/2021 | 6,810,000 | 6,809,576 | ||
| U.S. Treasury Bill, 0.02%, due 5/06/2021 | 23,763,000 | 23,762,129 | ||
| U.S. Treasury Bill, 0.035%, due 5/06/2021 | 7,252,000 | 7,251,535 | ||
| U.S. Treasury Bill, 0.03%, due 5/11/2021 | 14,745,000 | 14,744,128 | ||
| U.S. Treasury Bill, 0.041%, due 5/18/2021 | 10,080,000 | 10,079,126 | ||
| Total U.S. Government Agencies and Equivalents, at Amortized Cost and Value | $399,144,386 | |||
| Issuer | Shares/Par | Value ($) | ||
| Repurchase Agreements – 19.6% | ||||
| Bank of America Corp. Repurchase Agreement, 0.01%, dated 2/26/2021, due 3/01/2021, total to be received $48,765,041 (secured by U.S. Treasury and Federal Agency obligations valued at $49,880,015 in a jointly traded account) | $ 48,765,000 | $ 48,765,000 | ||
| JPMorgan Chase & Co. Repurchase Agreement, 0.01%, dated 2/26/2021, due 3/01/2021, total to be received $48,667,041 (secured by U.S. Treasury and Federal Agency obligations valued at $49,640,414 in a jointly traded account) | 48,667,000 | 48,667,000 | ||
| Total Repurchase Agreements, at Cost and Value | $ 97,432,000 | |||
| Other Assets, Less Liabilities – 0.2% | 1,007,823 | |||
| Net Assets – 100.0% | $497,584,209 | |||
| (y) | The rate shown represents an annualized yield at time of purchase. |
| Assets | |
| Investments in unaffiliated issuers, at cost and value | $399,144,386 |
| Investments in unaffiliated repurchase agreements, at cost and value | 97,432,000 |
| Cash | 95 |
| Receivables for | |
| Fund shares sold | 2,647,695 |
| Interest | 81 |
| Receivable from investment adviser and distributor | 39,758 |
| Other assets | 4,529 |
| Total assets | $499,268,544 |
| Liabilities | |
| Payables for | |
| Fund shares reacquired | $1,544,518 |
| Payable to affiliates | |
| Administrative services fee | 797 |
| Shareholder servicing costs | 98,147 |
| Payable for independent Trustees' compensation | 2,893 |
| Accrued expenses and other liabilities | 37,980 |
| Total liabilities | $1,684,335 |
| Net assets | $497,584,209 |
| Net assets consist of | |
| Paid-in capital | $497,584,646 |
| Total distributable earnings (loss) | (437) |
| Net assets | $497,584,209 |
| Shares of beneficial interest outstanding | 497,584,059 |
| Net asset value per share (net assets of $497,584,209 / 497,584,059 shares of beneficial interest outstanding) | $1.00 |
| Net investment income (loss) | |
| Income | |
| Interest | $199,739 |
| Other | 57 |
| Total investment income | $199,796 |
| Expenses | |
| Management fee | $1,053,082 |
| Shareholder servicing costs | 249,040 |
| Administrative services fee | 38,362 |
| Independent Trustees' compensation | 4,764 |
| Custodian fee | 11,345 |
| Shareholder communications | 7,879 |
| Audit and tax fees | 19,512 |
| Legal fees | 2,057 |
| Miscellaneous | 58,714 |
| Total expenses | $1,444,755 |
| Fees paid indirectly | (11,355) |
| Reduction of expenses by investment adviser and distributor | (1,233,604) |
| Net expenses | $199,796 |
| Net investment income (loss) | $0 |
| Change in net assets from operations | $0 |
| Six months ended | Year ended | |
| 2/28/21 (unaudited) | 8/31/20 | |
| Change in net assets | ||
| From operations | ||
| Net investment income (loss) | $0 | $1,868,799 |
| Net realized gain (loss) | — | 100 |
| Change in net assets from operations | $0 | $1,868,899 |
| Total distributions to shareholders | $— | $(1,868,799) |
| Change in net assets from fund share transactions | $(21,066,638) | $214,851,860 |
| Total change in net assets | $(21,066,638) | $214,851,960 |
| Net assets | ||
| At beginning of period | 518,650,847 | 303,798,887 |
| At end of period | $497,584,209 | $518,650,847 |
| Six months ended | Year ended | |||||
| 2/28/21 (unaudited) | 8/31/20 | 8/31/19 | 8/31/18 | 8/31/17 | 8/31/16 | |
| Net asset value, beginning of period | $1.00 | $1.00 | $1.00 | $1.00 | $1.00 | $1.00 |
| Income (loss) from investment operations | ||||||
| Net investment income (loss) (d) | $0.00 | $0.00(w) | $0.02 | $0.01 | $0.00(c)(w) | $0.00 |
| Net realized and unrealized gain (loss) | — | 0.01 | 0.00(w) | — | (0.00)(w) | (0.00)(w) |
| Total from investment operations | $0.00 | $0.01 | $0.02 | $0.01 | $0.00(w) | $(0.00)(w) |
| Less distributions declared to shareholders | ||||||
| From net investment income | $— | $(0.01) | $(0.02) | $(0.01) | $(0.00)(w) | $— |
| Contribution from adviser | $— | $— | $— | $(0.00)(w) | $— | $— |
| Net asset value, end of period | $1.00 | $1.00 | $1.00 | $1.00 | $1.00 | $1.00 |
| Total return (%) (r)(t) | 0.00(n) | 0.61 | 1.70 | 0.83 | 0.17(c) | 0.00(w) |
| Ratios (%) (to average net assets) and Supplemental data: | ||||||
| Expenses before expense reductions (f) | 0.55(a) | 0.60 | 0.62 | 0.63 | 0.56(c) | 0.61 |
| Expenses after expense reductions (f) | 0.08(a) | 0.36 | 0.61 | 0.62 | 0.43(c) | 0.23 |
| Net investment income (loss) | 0.00(a) | 0.45 | 1.69 | 0.81 | 0.17(c) | 0.00 |
| Net assets at end of period (000 omitted) | $497,584 | $518,651 | $303,799 | $264,370 | $307,591 | $320,847 |
| (a) | Annualized. |
| (c) | Amount reflects a one-time reimbursement of expenses by the custodian (or former custodian) without which net investment income and performance would be lower and expenses would be higher. |
| (d) | Per share data is based on average shares outstanding. |
| (f) | Ratios do not reflect reductions from fees paid indirectly, if applicable. |
| (n) | Not annualized. |
| (r) | Certain expenses have been reduced without which performance would have been lower. |
| (t) | Total returns do not include any applicable sales charges. |
| (w) | Per share amount was less than $0.01 and total return or ratio was less than 0.01%, as applicable. |
| Financial Instruments | Level 1 | Level 2 | Level 3 | Total |
| Short-Term Securities | $— | $496,576,386 | $— | $496,576,386 |
| Year ended 8/31/20 | |
| Ordinary income (including any short-term capital gains) | $1,868,799 |
| As of 2/28/21 | |
| Cost of investments | $496,576,386 |
| As of 8/31/20 | |
| Undistributed ordinary income | 2,749 |
| Capital loss carryforwards | (437) |
| Other temporary differences | (2,749) |
| Short-Term | $(437) |
| Up to $1 billion | 0.40% |
| In excess of $1 billion | 0.35% |
| Six months ended 2/28/21 | Year ended 8/31/20 | ||
| Shares sold | 171,753,101 | 532,195,804 | |
| Shares issued to shareholders in reinvestment of distributions | — | 1,528,478 | |
| Shares reacquired | (192,819,739) | (318,872,422) | |
| Net change | (21,066,638) | 214,851,860 |

| 1(b): |
Not applicable.
| ITEM 2. | CODE OF ETHICS. |
During the period covered by this report, the Registrant has not amended any provision in its Code of Ethics (the “Code”) that relates to an element of the Code’s definitions enumerated in paragraph (b) of Item 2 of this Form N-CSR. During the period covered by this report, the Registrant did not grant a waiver, including an implicit waiver, from any provision of the Code.
| ITEM 3. | AUDIT COMMITTEE FINANCIAL EXPERT. |
Not applicable for semi-annual reports.
| ITEM 4. | PRINCIPAL ACCOUNTANT FEES AND SERVICES. |
Not applicable for semi-annual reports.
| ITEM 5. | AUDIT COMMITTEE OF LISTED REGISTRANTS. |
Not applicable to the Registrant.
| ITEM 6. | INVESTMENTS |
A schedule of investments for each series of the Registrant is included as part of the report to shareholders of such series under Item 1(a) of this Form N-CSR.
| ITEM 7. | DISCLOSURE OF PROXY VOTING POLICIES AND PROCEDURES FOR CLOSED-END MANAGEMENT INVESTMENT COMPANIES. |
Not applicable to the Registrant.
| ITEM 8. | PORTFOLIO MANAGERS OF CLOSED-END MANAGEMENT INVESTMENT COMPANIES. |
Not applicable to the Registrant.
| ITEM 9. | PURCHASES OF EQUITY SECURITIES BY CLOSED-END MANAGEMENT INVESTMENT COMPANY AND AFFILIATED PURCHASERS. |
Not applicable to the Registrant.
| ITEM 10. | SUBMISSION OF MATTERS TO A VOTE OF SECURITY HOLDERS. |
There were no material changes to the procedures by which shareholders may send recommendations to the Board for nominees to the Registrant’s Board since the Registrant last provided disclosure as to such procedures in response to the requirements of Item 407 (c)(2)(iv) of Regulation S-K or this Item.
| ITEM 11. | CONTROLS AND PROCEDURES. |
| (a) | Based upon their evaluation of the effectiveness of the registrant’s disclosure controls and procedures (as defined in Rule 30a-3(c) under the Investment Company Act of 1940 (the “Act”)) as conducted within 90 days of the filing date of this report on Form N-CSR, the registrant’s principal financial officer and principal executive officer have concluded that those disclosure controls and procedures provide reasonable assurance that the material information required to be disclosed by the registrant on this report is recorded, processed, summarized and reported within the time periods specified in the Securities and Exchange Commission’s rules and forms. |
| (b) | There were no changes in the registrant’s internal controls over financial reporting (as defined in Rule 30a-3(d) under the Act) that occurred during the period covered by the report that have materially affected, or are reasonably likely to materially affect, the registrant’s internal control over financial reporting. |
| ITEM 12. | DISCLOSURE OF SECURITIES LENDING ACTIVITIES FOR CLOSED-END MANAGEMENT INVESTMENT COMPANIES. |
Not applicable to the Registrant.
| ITEM 13. | EXHIBITS. |
| (a) | File the exhibits listed below as part of this form. Letter or number the exhibits in the sequence indicated. |
| (1) | Any code of ethics, or amendment thereto, that is the subject of the disclosure required by Item 2, to the extent that the registrant intends to satisfy the Item 2 requirements through filing of an exhibit. Not applicable. |
| (2) | A separate certification for each principal executive officer and principal financial officer of the registrant as required by Rule 30a-2(a) under the Act (17 CFR 270.30a-2): Attached hereto as EX-99.302CERT. |
| (3) | Any written solicitation to purchase securities under Rule 23c-1 under the Act (17 CFR 270.23c-1) sent or given during the period covered by the report by or on behalf of the registrant to 10 or more persons. Not applicable. |
| (4) | Change in the registrant’s independent public accountant. Not applicable. |
| (b) | If the report is filed under Section 13(a) or 15(d) of the Exchange Act, provide the certifications required by Rule 30a-2(b) under the Act (17 CFR 270.30a-2(b)), Rule 13a-14(b) or Rule 15d-14(b) under the Exchange Act (17 CFR 240.13a-14(b) or 240.15d-14(b)) and Section 1350 of Chapter 63 of Title 18 of the United States Code (18 U.S.C. 1350) as an exhibit. A certification furnished pursuant to this paragraph will not be deemed “filed” for the purposes of Section 18 of the Exchange Act (15 U.S.C. 78r), or otherwise subject to the liability of that section. Such certification will not be deemed to be incorporated by reference into any filing under the Securities Act of 1933 or the Exchange Act, except to the extent that the registrant specifically incorporates it by reference: Attached hereto as EX-99.906CERT. |
Notice
A copy of the Amended and Restated Declaration of Trust, as amended, of the Registrant is on file with the Secretary of State of The Commonwealth of Massachusetts and notice is hereby given that this instrument is executed on behalf of the Registrant by an officer of the Registrant as an officer and not individually and the obligations of or arising out of this instrument are not binding upon any of the Trustees or shareholders individually, but are binding only upon the assets and property of the respective constituent series of the Registrant.
SIGNATURES
Pursuant to the requirements of the Securities Exchange Act of 1934 and the Investment Company Act of 1940, the registrant has duly caused this report to be signed on its behalf by the undersigned, thereunto duly authorized.
(Registrant) MFS SERIES TRUST IV
| By (Signature and Title)* | /S/ DAVID L. DILORENZO | |
| David L. DiLorenzo, President |
Date: April 15, 2021
Pursuant to the requirements of the Securities Exchange Act of 1934 and the Investment Company Act of 1940, this report has been signed below by the following persons on behalf of the registrant and in the capacities and on the dates indicated.
| By (Signature and Title)* | /S/ DAVID L. DILORENZO | |
David L. DiLorenzo, President (Principal Executive Officer) |
Date: April 15, 2021
| By (Signature and Title)* | /S/ JAMES O. YOST | |
James O. Yost, Treasurer (Principal Financial Officer and Accounting Officer) |
Date: April 15, 2021
| * | Print name and title of each signing officer under his or her signature. |