UNITED STATES
SECURITIES AND EXCHANGE COMMISSION
Washington, D.C. 20549
FORM N-CSR
CERTIFIED SHAREHOLDER REPORT OF
REGISTERED MANAGEMENT INVESTMENT COMPANIES
Investment Company Act file number 811-02464
MFS SERIES TRUST IX
(Exact name of registrant as specified in charter)
111 Huntington Avenue, Boston, Massachusetts 02199
(Address of principal executive offices) (Zip code)
Susan S. Newton
Massachusetts Financial Services Company
111 Huntington Avenue
Boston, Massachusetts 02199
(Name and address of agents for service)
Registrant’s telephone number, including area code: (617) 954-5000
Date of fiscal year end: April 30*
Date of reporting period: April 30, 2014
| * | This Form N-CSR pertains to the following series of the Registrant: MFS Bond Fund, MFS Limited Maturity Fund, MFS Municipal Limited Maturity Fund, and MFS Research Bond Fund. The remaining series of the Registrant, MFS Inflation-Adjusted Bond Fund, has a fiscal year end of October 31. |
| ITEM 1. | REPORTS TO STOCKHOLDERS. |
ANNUAL REPORT
April 30, 2014

MFS® BOND FUND

MFB-ANN
MFS® BOND FUND
CONTENTS
The report is prepared for the general information of shareholders. It is authorized for distribution to prospective investors only when preceded or accompanied by a current prospectus.
NOT FDIC INSURED Ÿ MAY LOSE VALUE Ÿ NO BANK GUARANTEE

LETTER FROM THE CHAIRMAN AND CEO
Dear Shareholders:
After gaining momentum late last year, the U.S. economy slipped this winter, as severe weather curtailed activity. More recently, however, labor market data, consumer
confidence, retail sales and industrial output have indicated that the U.S. economy could be regaining traction.
Europe emerged from its recession midway through 2013. However, its pace of growth has been slow, high unemployment persists and the risk of deflation exists. Asia remains vulnerable. China’s economic growth has slowed, and Japan’s early progress toward an economic turnaround continues to face obstacles. Emerging markets have also displayed much higher volatility, affected by the early transition from aggressive central bank monetary easing.
With so much uncertainty, global financial markets began 2014 with much greater volatility than last year’s broad-based rally. For equity investors, attention to company fundamentals has taken on more importance. Bond investors have been attuned to heightened risks from possible interest rate increases.
As always at MFS®, active risk management is an integral part of how we manage your investments. We use a collaborative process, sharing insights across asset classes, regions and economic sectors. Our global team of investment professionals uses a multidisciplined, long-term, diversified investment approach.
We understand that these are challenging economic times. We believe that we can serve you best by applying proven principles, such as asset allocation and diversification, over the long term. We are confident that this approach can serve you well as you work with your financial advisors to reach your goals in the years ahead.
Respectfully,

Robert J. Manning
Chairman and Chief Executive Officer
MFS Investment Management
June 13, 2014
The opinions expressed in this letter are subject to change, may not be relied upon for investment advice, and no forecasts can be guaranteed.
1
PORTFOLIO COMPOSITION
Portfolio structure (i)

| | | | |
| Fixed income sectors (i) | | | | |
| High Grade Corporates | | | 70.3% | |
| High Yield Corporates | | | 21.5% | |
| Emerging Markets Bonds | | | 2.1% | |
| Commercial Mortgage-Backed Securities | | | 0.6% | |
| Non-U.S. Government Bonds | | | 0.2% | |
| Collateralized Debt Obligations | | | 0.2% | |
| Asset-Backed Securities (o) | | | 0.0% | |
| Residential Mortgage-Backed Securities (o) | | | 0.0% | |
| | | | |
| Composition including fixed income credit quality (a)(i) | |
| AA | | | 0.5% | |
| A | | | 14.0% | |
| BBB | | | 57.9% | |
| BB | | | 18.2% | |
| B | | | 4.2% | |
| CCC (o) | | | 0.0% | |
| CC (o) | | | 0.0% | |
| C | | | 0.1% | |
| D (o) | | | 0.0% | |
| Not Rated (o) | | | 0.0% | |
| Cash & Other | | | 5.1% | |
| |
| Portfolio facts (i) | | | | |
| Average Duration (d) | | | 5.4 | |
| Average Effective Maturity (m) | | | 8.0 yrs. | |
| (a) | For all securities other than those specifically described below, ratings are assigned to underlying securities utilizing ratings from Moody’s, Fitch, and Standard & Poor’s rating agencies and applying the following hierarchy: If all three agencies provide a rating, the middle rating (after dropping the highest and lowest ratings) is assigned; if two of the three agencies rate a security, the lower of the two is assigned. Ratings are shown in the S&P and Fitch scale (e.g., AAA). Securities rated BBB or higher are considered investment grade. All ratings are subject to change. Not Rated includes fixed income securities, including fixed income futures contracts, which have not been rated by any rating agency. The fund may not hold all of these instruments. The fund is not rated by these agencies. |
| (d) | Duration is a measure of how much a bond’s price is likely to fluctuate with general changes in interest rates, e.g., if rates rise 1.00%, a bond with a 5-year duration is likely to lose about 5.00% of its value due to the interest rate move. |
2
Portfolio Composition – continued
| (i) | For purposes of this presentation, the components include the market value of securities, and reflect the impact of the equivalent exposure of derivative positions, if any. These amounts may be negative from time to time. Equivalent exposure is a calculated amount that translates the derivative position into a reasonable approximation of the amount of the underlying asset that the portfolio would have to hold at a given point in time to have the same price sensitivity that results from the portfolio’s ownership of the derivative contract. When dealing with derivatives, equivalent exposure is a more representative measure of the potential impact of a position on portfolio performance than market value. The bond component will include any accrued interest amounts. |
| (m) | In determining an instrument’s effective maturity for purposes of calculating the fund’s dollar-weighted average effective maturity, MFS uses the instrument’s stated maturity or, if applicable, an earlier date on which MFS believes it is probable that a maturity-shortening device (such as a put, pre-refunding or prepayment) will cause the instrument to be repaid. Such an earlier date can be substantially shorter than the instrument’s stated maturity. |
Where the fund holds convertible bonds, these are treated as part of the equity portion of the portfolio.
Cash & Other includes cash, other assets less liabilities, offsets to derivative positions, and short-term securities.
Percentages are based on net assets as of 4/30/14.
The portfolio is actively managed and current holdings may be different.
3
MANAGEMENT REVIEW
Summary of Results
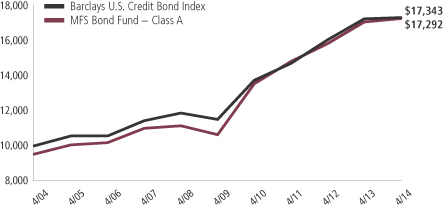
For the twelve months ended April 30, 2014, Class A shares of the MFS Bond Fund (“fund”) provided a total return of 1.18%, at net asset value. This compares with a return of 0.41% for the fund’s benchmark, the Barclays U.S. Credit Bond Index.
Market Environment
Early in the period, jitters over a banking crisis in Cyprus were more than offset by ongoing accommodative global monetary policy and improving economic data, resulting in gains in both equity and fixed income markets. As the period progressed, concerns that the US Federal Reserve (“Fed”) would begin tapering its quantitative easing (“QE”) program caused sovereign bond yields to spike, credit spreads to widen, and equity valuations to fall. Equities subsequently outperformed fixed income in response to the improved economic fundamentals. A general theme in the market was a rotation in investor allocations from fixed income to equities and emerging markets to developed markets, reflecting an anticipated acceleration in developed market growth rates relative to emerging markets as well as a more equity-friendly macro backdrop.
Toward the middle of the period, the Fed’s decision to postpone QE tapering surprised markets. Favorable market reactions were tempered, however, by tense negotiations over US fiscal policy which resulted in a 16-day partial shutdown of the federal government and a short-term extension in the debt ceiling. The volatility was short-lived, however, as an extension of budget and debt ceiling deadlines allowed the government to re-open, and subsequent economic data reflected moderate but resilient US growth. Also well-received was the decision by the European Central Bank to cut its policy rate as inflation pressures waned in the region. In addition, equity investors appeared to have concluded that there would be no major change in US monetary policy as a result of the nomination of Janet Yellen as the new Fed Chair for a term beginning in early 2014.
During the period, emerging market (“EM”) stresses surfaced as markets focused on imbalances and stagflationary conditions in certain EM countries. In addition, political instability increased in certain areas, notably in the Ukraine where tensions escalated following a change in government and Russia’s annexation of Crimea. Later in the period, markets were forced to contend with some unexpected weakness in the US economy due largely to weather-related interruptions to hiring and spending plans as well as production schedules. Once again, the setback was short-lived as the major US equity indexes traded near their all-time highs by the end of the period.
Factors Affecting Performance
Relative to the Barclays U.S. Credit Bond Index, the fund’s lesser exposure to shifts in the long end (maturities of 10 years or greater) of the yield curve (y) benefited relative results as the yield curve flattened during the reporting period.
The fund’s greater exposure to “BBB” and “BB” rated (r) securities and strong bond selection within the industrials sector were other positive factors that benefited relative performance.
4
Management Review – continued
The fund’s lesser exposure to “A” rated securities was a key factor that had a negative impact on relative performance.
Respectfully,
| | |
| Richard Hawkins | | Robert Persons |
| Portfolio Manager | | Portfolio Manager |
| (r) | Bonds rated “BBB”, “Baa”, or higher are considered investment grade; bonds rated “BB”, “Ba”, or below are considered non-investment grade. The sources for bond quality ratings are Moody’s Investors Service, Standard & Poor’s and Fitch, Inc. and are applied using the following hierarchy: If all three agencies provide a rating, the middle rating (after dropping the highest and lowest ratings) is assigned; if two of the three agencies rate a security, the lower of the two is assigned. Ratings are shown in the S&P and Fitch scale (e.g., AAA). For securities which are not rated by any of the three agencies, the security is considered Not Rated. |
| (y) | A yield curve graphically depicts the yields of different maturity bonds of the same credit quality and type; a normal yield curve is upward sloping, with short-term rates lower than long-term rates. |
The views expressed in this report are those of the portfolio managers only through the end of the period of the report as stated on the cover and do not necessarily reflect the views of MFS or any other person in the MFS organization. These views are subject to change at any time based on market or other conditions, and MFS disclaims any responsibility to update such views. These views may not be relied upon as investment advice or an indication of trading intent on behalf of any MFS portfolio. References to specific securities are not recommendations of such securities, and may not be representative of any MFS portfolio’s current or future investments.
5
PERFORMANCE SUMMARY THROUGH 4/30/14
The following chart illustrates a representative class of the fund’s historical performance in comparison to its benchmark(s). Performance results include the deduction of the maximum applicable sales charge and reflect the percentage change in net asset value, including reinvestment of dividends and capital gains distributions. The performance of other share classes will be greater than or less than that of the class depicted below. Benchmarks are unmanaged and may not be invested in directly. Benchmark returns do not reflect sales charges, commissions or expenses. (See Notes to Performance Summary.)
Performance data shown represents past performance and is no guarantee of future results. Investment return and principal value fluctuate so your shares, when sold, may be worth more or less than the original cost; current performance may be lower or higher than quoted. The performance shown does not reflect the deduction of taxes, if any, that a shareholder would pay on fund distributions or the redemption of fund shares.
Growth of a Hypothetical $10,000 Investment
6
Performance Summary – continued
Total Returns through 4/30/14
Average annual without sales charge
| | | | | | | | | | | | | | |
| | | Share class | | Class inception date | | 1-yr | | 5-yr | | 10-yr | | Life (t) | | |
| | | A | | 5/08/74 | | 1.18% | | 10.21% | | 6.14% | | N/A | | |
| | | B | | 9/07/93 | | 0.42% | | 9.43% | | 5.39% | | N/A | | |
| | | C | | 1/03/94 | | 0.42% | | 9.42% | | 5.38% | | N/A | | |
| | | I | | 1/02/97 | | 1.36% | | 10.47% | | 6.42% | | N/A | | |
| | | R1 | | 4/01/05 | | 0.42% | | 9.41% | | N/A | | 5.47% | | |
| | | R2 | | 10/31/03 | | 0.93% | | 9.96% | | 5.83% | | N/A | | |
| | | R3 | | 4/01/05 | | 1.18% | | 10.23% | | N/A | | 6.23% | | |
| | | R4 | | 4/01/05 | | 1.43% | | 10.48% | | N/A | | 6.52% | | |
| | | R5 | | 6/01/12 | | 1.47% | | N/A | | N/A | | 4.93% | | |
| Comparative benchmark | | | | | | | | | | |
| | | Barclays U.S. Credit Bond Index (f) | | 0.41% | | 8.56% | | 5.66% | | N/A | | |
| Average annual with sales charge | | | | | | | | | | |
| | | A
With initial Sales Charge (4.75%) | | (3.62)% | | 9.14% | | 5.63% | | N/A | | |
| | | B
With CDSC (Declining over six years from 4% to 0%) (v) | | (3.48)% | | 9.15% | | 5.39% | | N/A | | |
| | | C
With CDSC (1% for 12 months) (v) | | (0.56)% | | 9.42% | | 5.38% | | N/A | | |
CDSC – Contingent Deferred Sales Charge.
Class I, R1, R2, R3, R4, and R5 shares do not have a sales charge.
| (f) | Source: FactSet Research Systems Inc. |
| (t) | For the period from the class inception date through the stated period end (for those share classes with less than 10 years of performance history). No comparative benchmark performance information is provided for “life” periods. (See Notes to Performance Summary.) |
| (v) | Assuming redemption at the end of the applicable period. |
Benchmark Definition
Barclays U.S. Credit Bond Index – a market capitalization-weighted index that measures the performance of publicly issued, SEC-registered, U.S. corporate and specified foreign debentures and secured notes that meet specified maturity, liquidity, and quality requirements.
It is not possible to invest directly in an index.
Notes to Performance Summary
Average annual total return represents the average annual change in value for each share class for the periods presented. Life returns are presented where the share class has less than 10 years of performance history and represent the average annual total return from the class inception date to the stated period end date. As the fund’s share
7
Performance Summary – continued
classes may have different inception dates, the life returns may represent different time periods and may not be comparable. As a result, no comparative benchmark performance information is provided for life periods.
Performance results reflect any applicable expense subsidies and waivers in effect during the periods shown. Without such subsidies and waivers the fund’s performance results would be less favorable. Please see the prospectus and financial statements for complete details.
Performance results do not include adjustments made for financial reporting purposes in accordance with U.S. generally accepted accounting principles and may differ from amounts reported in the financial highlights.
From time to time the fund may receive proceeds from litigation settlements, without which performance would be lower.
8
EXPENSE TABLE
Fund expenses borne by the shareholders during the period,
November 1, 2013 through April 30, 2014
As a shareholder of the fund, you incur two types of costs: (1) transaction costs, including sales charges (loads) on certain purchase or redemption payments, and (2) ongoing costs, including management fees; distribution and service (12b-1) fees; and other fund expenses. This example is intended to help you understand your ongoing costs (in dollars) of investing in the fund and to compare these costs with the ongoing costs of investing in other mutual funds.
The example is based on an investment of $1,000 invested at the beginning of the period and held for the entire period November 1, 2013 through April 30, 2014.
Actual Expenses
The first line for each share class in the following table provides information about actual account values and actual expenses. You may use the information in this line, together with the amount you invested, to estimate the expenses that you paid over the period. Simply divide your account value by $1,000 (for example, an $8,600 account value divided by $1,000 = 8.6), then multiply the result by the number in the first line under the heading entitled “Expenses Paid During Period” to estimate the expenses you paid on your account during this period.
Hypothetical Example for Comparison Purposes
The second line for each share class in the following table provides information about hypothetical account values and hypothetical expenses based on the fund’s actual expense ratio and an assumed rate of return of 5% per year before expenses, which is not the fund’s actual return. The hypothetical account values and expenses may not be used to estimate the actual ending account balance or expenses you paid for the period. You may use this information to compare the ongoing costs of investing in the fund and other funds. To do so, compare this 5% hypothetical example with the 5% hypothetical examples that appear in the shareholder reports of the other funds.
Please note that the expenses shown in the table are meant to highlight your ongoing costs only and do not reflect any transactional costs, such as sales charges (loads). Therefore, the second line for each share class in the table is useful in comparing ongoing costs only, and will not help you determine the relative total costs of owning different funds. In addition, if these transactional costs were included, your costs would have been higher.
9
Expense Table – continued
| | | | | | | | | | | | | | | | | | |
Share
Class | | | | Annualized
Expense Ratio | | | Beginning
Account Value
11/01/13 | | | Ending Account Value
4/30/14 | | | Expenses Paid During
Period (p)
11/01/13-4/30/14 | |
| A | | Actual | | | 0.81% | | | | $1,000.00 | | | | $1,031.75 | | | | $4.08 | |
| | Hypothetical (h) | | | 0.81% | | | | $1,000.00 | | | | $1,020.78 | | | | $4.06 | |
| B | | Actual | | | 1.57% | | | | $1,000.00 | | | | $1,028.69 | | | | $7.90 | |
| | Hypothetical (h) | | | 1.57% | | | | $1,000.00 | | | | $1,017.01 | | | | $7.85 | |
| C | | Actual | | | 1.57% | | | | $1,000.00 | | | | $1,027.96 | | | | $7.89 | |
| | Hypothetical (h) | | | 1.57% | | | | $1,000.00 | | | | $1,017.01 | | | | $7.85 | |
| I | | Actual | | | 0.57% | | | | $1,000.00 | | | | $1,033.04 | | | | $2.87 | |
| | Hypothetical (h) | | | 0.57% | | | | $1,000.00 | | | | $1,021.97 | | | | $2.86 | |
| R1 | | Actual | | | 1.57% | | | | $1,000.00 | | | | $1,027.95 | | | | $7.89 | |
| | Hypothetical (h) | | | 1.57% | | | | $1,000.00 | | | | $1,017.01 | | | | $7.85 | |
| R2 | | Actual | | | 1.07% | | | | $1,000.00 | | | | $1,030.47 | | | | $5.39 | |
| | Hypothetical (h) | | | 1.07% | | | | $1,000.00 | | | | $1,019.49 | | | | $5.36 | |
| R3 | | Actual | | | 0.81% | | | | $1,000.00 | | | | $1,031.75 | | | | $4.08 | |
| | Hypothetical (h) | | | 0.81% | | | | $1,000.00 | | | | $1,020.78 | | | | $4.06 | |
| R4 | | Actual | | | 0.57% | | | | $1,000.00 | | | | $1,033.03 | | | | $2.87 | |
| | Hypothetical (h) | | | 0.57% | | | | $1,000.00 | | | | $1,021.97 | | | | $2.86 | |
| R5 | | Actual | | | 0.46% | | | | $1,000.00 | | | | $1,033.59 | | | | $2.32 | |
| | Hypothetical (h) | | | 0.46% | | | | $1,000.00 | | | | $1,022.51 | | | | $2.31 | |
| (h) | 5% class return per year before expenses. |
| (p) | “Expenses Paid During Period” are equal to each class’s annualized expense ratio, as shown above, multiplied by the average account value over the period, multiplied by 181/365 (to reflect the one-half year period). Expenses paid do not include any applicable sales charges (loads). If these transaction costs had been included, your costs would have been higher. |
10
PORTFOLIO OF INVESTMENTS
4/30/14
The Portfolio of Investments is a complete list of all securities owned by your fund. It is categorized by broad-based asset classes.
| | | | | | | | |
| Bonds - 93.9% | | | | | | | | |
| Issuer | | Shares/Par | | | Value ($) | |
| | | | | | | | |
| Aerospace - 0.3% | | | | | | | | |
| BE Aerospace, Inc., 5.25%, 4/01/22 | | $ | 7,977,000 | | | $ | 8,256,194 | |
| | |
| Apparel Manufacturers - 0.5% | | | | | | | | |
| Hanesbrands, Inc., 6.375%, 12/15/20 | | $ | 8,254,000 | | | $ | 8,996,860 | |
| PVH Corp., 4.5%, 12/15/22 | | | 3,190,000 | | | | 3,138,163 | |
| | | | | | | | |
| | | | | | | $ | 12,135,023 | |
| Asset-Backed & Securitized - 0.8% | | | | | | | | |
| Bayview Financial Revolving Mortgage Loan Trust, FRN, 1.752%, 12/28/40 (z) | | $ | 1,761,291 | | | $ | 1,165,509 | |
| BlackRock Capital Finance LP, 7.75%, 9/25/26 (z) | | | 291,569 | | | | 35,080 | |
| Capital Trust Realty Ltd., CDO, 5.16%, 6/25/35 (n) | | | 188,654 | | | | 193,695 | |
| Citigroup/Deutsche Bank Commercial Mortgage Trust, FRN, 5.366%, 12/11/49 | | | 2,920,000 | | | | 3,070,380 | |
| Falcon Franchise Loan LLC, FRN, 14.91%, 1/05/25 (i)(z) | | | 984,397 | | | | 315,007 | |
| G-Force LLC, CDO, “A2”, 4.83%, 8/22/36 (z) | | | 86,025 | | | | 88,036 | |
| GMAC LLC, FRN, 8.34%, 4/15/34 (d)(n)(q) | | | 2,040,244 | | | | 1,652,681 | |
| Greenwich Capital Commercial Funding Corp., FRN, 5.82%, 7/10/38 | | | 2,125,000 | | | | 2,315,748 | |
| JPMorgan Chase Commercial Mortgage Securities Corp., “A4”, FRN, 5.989%, 6/15/49 | | | 1,467,768 | | | | 1,621,316 | |
| JPMorgan Chase Commercial Mortgage Securities Corp., FRN, 5.62%, 7/15/42 (n) | | | 4,734,928 | | | | 1,123,125 | |
| KKR Financial CLO Ltd., “C”, FRN, 1.686%, 5/15/21 (n) | | | 3,651,630 | | | | 3,538,576 | |
| LB Commercial Conduit Mortgage Trust, FRN, 1.248%, 2/18/30 (i) | | | 1,982,027 | | | | 50,560 | |
| LB Commercial Conduit Mortgage Trust, FRN, 2.178%, 9/15/30 (i) | | | 2,046,094 | | | | 85,390 | |
| Merrill Lynch/Countrywide Commercial Mortgage Trust, FRN, 5.81%, 6/12/50 | | | 3,070,000 | | | | 3,392,768 | |
| Morgan Stanley Capital I, Inc., FRN, 1.117%, 11/15/30 (i)(n) | | | 6,574,195 | | | | 175,709 | |
| Spirit Master Funding LLC, 5.05%, 7/20/23 (z) | | | 1,615,049 | | | | 1,655,425 | |
| | | | | | | | |
| | | | | | | $ | 20,479,005 | |
| Automotive - 4.2% | | | | | | | | |
| American Honda Finance Corp., 2.125%, 2/28/17 (n) | | $ | 3,328,000 | | | $ | 3,401,552 | |
| Delphi Corp., 6.125%, 5/15/21 | | | 10,729,000 | | | | 11,949,424 | |
| Ford Motor Credit Co. LLC, 8%, 6/01/14 | | | 5,635,000 | | | | 5,665,688 | |
| Ford Motor Credit Co. LLC, 4.207%, 4/15/16 | | | 3,610,000 | | | | 3,827,456 | |
| General Motors Financial Co., 2.75%, 5/15/16 | | | 1,740,000 | | | | 1,766,100 | |
| Harley Davidson Financial Services, 1.15%, 9/15/15 (n) | | | 9,393,000 | | | | 9,442,717 | |
11
Portfolio of Investments – continued
| | | | | | | | |
| Issuer | | Shares/Par | | | Value ($) | |
| | | | | | | | |
| Bonds - continued | | | | | | | | |
| Automotive - continued | | | | | | | | |
| Harley-Davidson Financial Services, 3.875%, 3/15/16 (n) | | $ | 10,410,000 | | | $ | 10,960,741 | |
| Harley-Davidson Financial Services, Inc., 2.7%, 3/15/17 (n) | | | 1,815,000 | | | | 1,878,158 | |
| Lear Corp., 8.125%, 3/15/20 | | | 9,538,000 | | | | 10,396,420 | |
| Lear Corp., 4.75%, 1/15/23 (n) | | | 1,350,000 | | | | 1,326,375 | |
| Lear Corp., 5.375%, 3/15/24 | | | 5,835,000 | | | | 5,980,875 | |
| Nissan Motor Acceptance Corp., 1.95%, 9/12/17 (n) | | | 15,896,000 | | | | 16,007,479 | |
| TRW Automotive, Inc., 4.5%, 3/01/21 (n) | | | 9,060,000 | | | | 9,422,400 | |
| TRW Automotive, Inc., 7.25%, 3/15/17 (n) | | | 13,320,000 | | | | 15,318,000 | |
| Volkswagen International Finance N.V., 2.375%, 3/22/17 (n) | | | 3,117,000 | | | | 3,213,244 | |
| | | | | | | | |
| | | | | | | $ | 110,556,629 | |
| Biotechnology - 1.2% | | | | | | | | |
| Life Technologies Corp., 6%, 3/01/20 | | $ | 26,623,000 | | | $ | 30,889,176 | |
| | |
| Broadcasting - 2.6% | | | | | | | | |
| 21st Century Fox America, Inc., 5.4%, 10/01/43 | | $ | 6,056,000 | | | $ | 6,665,088 | |
| CBS Corp., 8.875%, 5/15/19 | | | 4,240,000 | | | | 5,467,645 | |
| CBS Corp., 5.75%, 4/15/20 | | | 1,010,000 | | | | 1,162,510 | |
| Discovery Communications, Inc., 4.875%, 4/01/43 | | | 8,325,000 | | | | 8,368,839 | |
| News America, Inc., 8.5%, 2/23/25 | | | 4,931,000 | | | | 6,494,517 | |
| News America, Inc., 6.15%, 2/15/41 | | | 3,000,000 | | | | 3,616,515 | |
| Omnicom Group, Inc., 3.625%, 5/01/22 | | | 13,717,000 | | | | 13,771,155 | |
| SES Global Americas Holdings GP, 2.5%, 3/25/19 (n) | | | 5,075,000 | | | | 5,079,430 | |
| SES S.A., 3.6%, 4/04/23 (n) | | | 1,680,000 | | | | 1,638,319 | |
| SIRIUS XM Radio, Inc., 5.875%, 10/01/20 (n) | | | 280,000 | | | | 292,250 | |
| SIRIUS XM Radio, Inc., 5.75%, 8/01/21 (n) | | | 12,925,000 | | | | 13,248,125 | |
| WPP Finance, 8%, 9/15/14 | | | 2,744,000 | | | | 2,816,321 | |
| | | | | | | | |
| | | | | | | $ | 68,620,714 | |
| Brokerage & Asset Managers - 0.1% | | | | | | | | |
| Franklin Resources, Inc., 1.375%, 9/15/17 | | $ | 3,705,000 | | | $ | 3,685,812 | |
| | |
| Building - 1.9% | | | | | | | | |
| CEMEX Finance LLC, 6%, 4/01/24 (z) | | $ | 7,576,000 | | | $ | 7,585,470 | |
| Mohawk Industries, Inc., 6.125%, 1/15/16 | | | 18,582,000 | | | | 20,068,560 | |
| Mohawk Industries, Inc., 3.85%, 2/01/23 | | | 11,265,000 | | | | 11,180,513 | |
| Owens Corning, Inc., 6.5%, 12/01/16 | | | 3,021,000 | | | | 3,326,656 | |
| Owens Corning, Inc., 4.2%, 12/15/22 | | | 8,216,000 | | | | 8,193,521 | |
| | | | | | | | |
| | | | | | | $ | 50,354,720 | |
| Business Services - 0.7% | | | | | | | | |
| Fidelity National Information Services, Inc., 2%, 4/15/18 | | $ | 1,475,000 | | | $ | 1,455,068 | |
| Fidelity National Information Services, Inc., 5%, 3/15/22 | | | 11,230,000 | | | | 11,756,519 | |
12
Portfolio of Investments – continued
| | | | | | | | |
| Issuer | | Shares/Par | | | Value ($) | |
| | | | | | | | |
| Bonds - continued | | | | | | | | |
| Business Services - continued | | | | | | | | |
| Fidelity National Information Services, Inc., 3.5%, 4/15/23 | | $ | 4,532,000 | | | $ | 4,380,260 | |
| Tencent Holdings Ltd., 3.375%, 5/02/19 (z) | | | 1,316,000 | | | | 1,322,872 | |
| | | | | | | | |
| | | | | | | $ | 18,914,719 | |
| Cable TV - 3.4% | | | | | | | | |
| CCO Holdings LLC, 5.25%, 9/30/22 | | $ | 18,106,000 | | | $ | 18,106,000 | |
| Comcast Corp., 4.65%, 7/15/42 | | | 1,789,000 | | | | 1,834,213 | |
| Comcast Corp., 4.75%, 3/01/44 | | | 10,775,000 | | | | 11,230,976 | |
| Cox Communications, Inc., 6.25%, 6/01/18 (n) | | | 1,735,000 | | | | 1,975,957 | |
| DIRECTV Holdings LLC, 5.875%, 10/01/19 | | | 3,310,000 | | | | 3,806,328 | |
| DIRECTV Holdings LLC, 6.375%, 3/01/41 | | | 4,310,000 | | | | 4,834,820 | |
| DIRECTV Holdings LLC, 5.15%, 3/15/42 | | | 9,250,000 | | | | 9,047,647 | |
| Lynx I Corp., 5.375%, 4/15/21 (n) | | | 2,635,000 | | | | 2,700,875 | |
| NBCUniversal Enterprise, Inc., 1.974%, 4/15/19 (n) | | | 2,215,000 | | | | 2,178,295 | |
| Time Warner Cable, Inc., 8.25%, 4/01/19 | | | 6,150,000 | | | | 7,788,877 | |
| Time Warner Cable, Inc., 5%, 2/01/20 | | | 1,480,000 | | | | 1,656,394 | |
| Time Warner Cable, Inc., 4.5%, 9/15/42 | | | 700,000 | | | | 677,015 | |
| Time Warner Entertainment Co. LP, 8.375%, 7/15/33 | | | 1,734,000 | | | | 2,505,462 | |
| Videotron Ltd., 5.375%, 6/15/24 (z) | | | 4,025,000 | | | | 4,055,188 | |
| Videotron Ltd., 5%, 7/15/22 | | | 13,220,000 | | | | 13,319,150 | |
| Virgin Media Secured Finance PLC, 5.25%, 1/15/21 | | | 2,990,000 | | | | 3,072,225 | |
| | | | | | | | |
| | | | | | | $ | 88,789,422 | |
| Chemicals - 3.2% | | | | | | | | |
| Celanese U.S. Holdings LLC, 4.625%, 11/15/22 | | $ | 10,884,000 | | | $ | 10,938,420 | |
| CF Industries, Inc., 5.15%, 3/15/34 | | | 6,667,000 | | | | 6,980,042 | |
| CF Industries, Inc., 3.45%, 6/01/23 | | | 717,000 | | | | 700,696 | |
| CF Industries, Inc., 4.95%, 6/01/43 | | | 5,244,000 | | | | 5,243,255 | |
| Dow Chemical Co., 8.55%, 5/15/19 | | | 14,554,000 | | | | 18,657,457 | |
| FMC Corp., 4.1%, 2/01/24 | | | 9,000,000 | | | | 9,294,696 | |
| LYB International Finance B.V., 4.875%, 3/15/44 | | | 8,684,000 | | | | 8,910,670 | |
| LyondellBasell Industries N.V., 5%, 4/15/19 | | | 4,761,000 | | | | 5,337,033 | |
| LyondellBasell Industries N.V., 6%, 11/15/21 | | | 9,720,000 | | | | 11,472,429 | |
| NOVA Chemicals Corp., 5.25%, 8/01/23 (n) | | | 6,391,000 | | | | 6,838,370 | |
| | | | | | | | |
| | | | | | | $ | 84,373,068 | |
| Computer Software - 0.0% | | | | | | | | |
| Seagate Technology HDD Holdings, 6.8%, 10/01/16 | | $ | 370,000 | | | $ | 416,250 | |
| VeriSign, Inc., 4.625%, 5/01/23 | | | 325,000 | | | | 311,187 | |
| | | | | | | | |
| | | | | | | $ | 727,437 | |
| Computer Software - Systems - 0.2% | | | | | | | | |
| Seagate HDD Cayman, 3.75%, 11/15/18 (n) | | $ | 4,052,000 | | | $ | 4,193,820 | |
13
Portfolio of Investments – continued
| | | | | | | | |
| Issuer | | Shares/Par | | | Value ($) | |
| | | | | | | | |
| Bonds - continued | | | | | | | | |
| Conglomerates - 0.5% | | | | | | | | |
| Roper Industries, Inc., 1.85%, 11/15/17 | | $ | 12,204,000 | | | $ | 12,264,935 | |
| | |
| Consumer Products - 0.9% | | | | | | | | |
| Mattel, Inc., 1.7%, 3/15/18 | | $ | 2,812,000 | | | $ | 2,785,885 | |
| Mattel, Inc., 5.45%, 11/01/41 | | | 7,865,000 | | | | 8,385,293 | |
| Newell Rubbermaid, Inc., 2.05%, 12/01/17 | | | 6,178,000 | | | | 6,200,556 | |
| Newell Rubbermaid, Inc., 4.7%, 8/15/20 | | | 5,052,000 | | | | 5,396,461 | |
| | | | | | | | |
| | | | | | | $ | 22,768,195 | |
| Consumer Services - 1.7% | | | | | | | | |
| ADT Corp., 4.125%, 6/15/23 | | $ | 10,022,000 | | | $ | 9,019,800 | |
| Experian Finance PLC, 2.375%, 6/15/17 (n) | | | 18,068,000 | | | | 18,340,429 | |
| Service Corp. International, 7%, 5/15/19 | | | 5,550,000 | | | | 5,924,070 | |
| Service Corp. International, 5.375%, 1/15/22 | | | 1,705,000 | | | | 1,739,100 | |
| Service Corp. International, 5.375%, 5/15/24 (z) | | | 10,365,000 | | | | 10,442,738 | |
| | | | | | | | |
| | | | | | | $ | 45,466,137 | |
| Containers - 1.0% | | | | | | | | |
| Ball Corp., 5%, 3/15/22 | | $ | 9,522,000 | | | $ | 9,736,245 | |
| Crown American LLC, 4.5%, 1/15/23 | | | 16,055,000 | | | | 15,332,525 | |
| | | | | | | | |
| | | | | | | $ | 25,068,770 | |
| Defense Electronics - 0.4% | | | | | | | | |
| BAE Systems Holdings, Inc., 6.375%, 6/01/19 (n) | | $ | 10,202,000 | | | $ | 11,768,781 | |
| | |
| Electronics - 1.0% | | | | | | | | |
| Flextronics International Ltd., 4.625%, 2/15/20 | | $ | 7,770,000 | | | $ | 7,808,850 | |
| Jabil Circuit, Inc., 4.7%, 9/15/22 | | | 3,601,000 | | | | 3,573,993 | |
| Tyco Electronics Group S.A., 6.55%, 10/01/17 | | | 2,450,000 | | | | 2,837,999 | |
| Tyco Electronics Group S.A., 2.375%, 12/17/18 | | | 1,303,000 | | | | 1,296,149 | |
| Tyco Electronics Group S.A., 3.5%, 2/03/22 | | | 11,088,000 | | | | 11,156,723 | |
| | | | | | | | |
| | | | | | | $ | 26,673,714 | |
| Emerging Market Quasi-Sovereign - 0.2% | | | | | | | | |
| Petroleos Mexicanos, 4.875%, 1/18/24 (n) | | $ | 18,000 | | | $ | 18,626 | |
| State Grid Overseas Investment (2014) Ltd., 4.125%, 5/07/24 (z) | | | 6,383,000 | | | | 6,374,957 | |
| | | | | | | | |
| | | | | | | $ | 6,393,583 | |
| Energy - Independent - 3.0% | | | | | | | | |
| Anadarko Petroleum Corp., 6.375%, 9/15/17 | | $ | 4,953,000 | | | $ | 5,723,182 | |
| Canadian Natural Resources Ltd., 3.8%, 4/15/24 | | | 462,000 | | | | 470,899 | |
| Concho Resources, Inc., 5.5%, 4/01/23 | | | 8,338,000 | | | | 8,681,942 | |
| Continental Resources, Inc., 4.5%, 4/15/23 | | | 5,093,000 | | | | 5,351,984 | |
| EQT Corp., 4.875%, 11/15/21 | | | 7,176,000 | | | | 7,682,805 | |
14
Portfolio of Investments – continued
| | | | | | | | |
| Issuer | | Shares/Par | | | Value ($) | |
| | | | | | | | |
| Bonds - continued | | | | | | | | |
| Energy - Independent - continued | | | | | | | | |
| Hess Corp., 8.125%, 2/15/19 | | $ | 1,452,000 | | | $ | 1,828,737 | |
| Noble Energy, Inc., 4.15%, 12/15/21 | | | 13,080,000 | | | | 13,960,794 | |
| Pioneer Natural Resources Co., 6.65%, 3/15/17 | | | 6,900,000 | | | | 7,830,299 | |
| Pioneer Natural Resources Co., 7.5%, 1/15/20 | | | 9,237,000 | | | | 11,315,704 | |
| Pioneer Natural Resources Co., 3.95%, 7/15/22 | | | 5,000,000 | | | | 5,155,635 | |
| Southwestern Energy Co., 7.5%, 2/01/18 | | | 8,649,000 | | | | 10,315,939 | |
| | | | | | | | |
| | | | | | | $ | 78,317,920 | |
| Energy - Integrated - 0.6% | | | | | | | | |
| Murphy Oil Corp., 2.5%, 12/01/17 | | $ | 13,691,000 | | | $ | 14,009,795 | |
| Pacific Rubiales Energy Corp., 5.125%, 3/28/23 (n) | | | 684,000 | | | | 660,915 | |
| | | | | | | | |
| | | | $ | 14,670,710 | |
| Entertainment - 0.4% | | | | | | | | |
| Time Warner, Inc., 5.35%, 12/15/43 | | $ | 6,056,000 | | | $ | 6,629,430 | |
| Viacom, Inc., 3.5%, 4/01/17 | | | 4,200,000 | | | | 4,462,156 | |
| | | | | | | | |
| | | | $ | 11,091,586 | |
| Financial Institutions - 4.1% | | | | | | | | |
| CIT Group, Inc., 5%, 5/15/17 | | $ | 2,500,000 | | | $ | 2,671,875 | |
| CIT Group, Inc., 4.25%, 8/15/17 | | | 9,647,000 | | | | 10,105,232 | |
| CIT Group, Inc., 5.25%, 3/15/18 | | | 2,885,000 | | | | 3,094,162 | |
| CIT Group, Inc., 6.625%, 4/01/18 (n) | | | 7,448,000 | | | | 8,313,830 | |
| CIT Group, Inc., 5.5%, 2/15/19 (n) | | | 5,815,000 | | | | 6,265,662 | |
| General Electric Capital Corp., 1%, 1/08/16 | | | 3,232,000 | | | | 3,253,603 | |
| General Electric Capital Corp., 1.6%, 11/20/17 | | | 9,117,000 | | | | 9,166,068 | |
| General Electric Capital Corp., 5.5%, 1/08/20 | | | 8,500,000 | | | | 9,806,688 | |
| General Electric Capital Corp., 3.15%, 9/07/22 | | | 3,815,000 | | | | 3,815,530 | |
| International Lease Finance Corp., 7.125%, 9/01/18 (n) | | | 3,221,000 | | | | 3,736,360 | |
| International Lease Finance Corp., 6.25%, 5/15/19 | | | 3,853,000 | | | | 4,252,749 | |
| International Lease Finance Corp., 5.875%, 8/15/22 | | | 15,000,000 | | | | 15,825,000 | |
| SLM Corp., 6.25%, 1/25/16 | | | 4,180,000 | | | | 4,509,175 | |
| SLM Corp., 6%, 1/25/17 | | | 15,703,000 | | | | 17,096,641 | |
| SLM Corp., 4.875%, 6/17/19 | | | 1,385,000 | | | | 1,424,824 | |
| SLM Corp., 8%, 3/25/20 | | | 2,532,000 | | | | 2,924,460 | |
| | | | | | | | |
| | | | $ | 106,261,859 | |
| Food & Beverages - 4.8% | | | | | | | | |
| Anheuser-Busch Inbev S.A., 4.625%, 2/01/44 | | $ | 8,128,000 | | | $ | 8,497,450 | |
| Conagra Foods, Inc., 1.9%, 1/25/18 | | | 6,517,000 | | | | 6,495,833 | |
| Constellation Brands, Inc., 7.25%, 9/01/16 | | | 18,881,000 | | | | 21,241,125 | |
| Grupo Bimbo S.A.B. de C.V., 4.5%, 1/25/22 (n) | | | 12,661,000 | | | | 13,121,860 | |
| Heineken N.V., 1.4%, 10/01/17 (n) | | | 290,000 | | | | 289,006 | |
| J.M. Smucker Co., 3.5%, 10/15/21 | | | 12,140,000 | | | | 12,462,317 | |
15
Portfolio of Investments – continued
| | | | | | | | |
| Issuer | | Shares/Par | | | Value ($) | |
| | | | | | | | |
| Bonds - continued | | | | | | | | |
| Food & Beverages - continued | | | | | | | | |
| Kraft Foods Group, Inc., 6.5%, 2/09/40 | | $ | 3,950,000 | | | $ | 4,990,916 | |
| Pernod Ricard S.A., 5.75%, 4/07/21 (n) | | | 4,451,000 | | | | 5,080,087 | |
| SABMiller Holdings, Inc., 3.75%, 1/15/22 (n) | | | 11,234,000 | | | | 11,599,577 | |
| Smithfield Foods, Inc., 7.75%, 7/01/17 | | | 8,630,000 | | | | 9,989,225 | |
| Smithfield Foods, Inc., 6.625%, 8/15/22 | | | 4,652,000 | | | | 5,076,495 | |
| Tyson Foods, Inc., 6.6%, 4/01/16 | | | 12,881,000 | | | | 14,169,783 | |
| Tyson Foods, Inc., 4.5%, 6/15/22 | | | 8,026,000 | | | | 8,495,513 | |
| Wm. Wrigley Jr. Co., 2.9%, 10/21/19 (n) | | | 4,831,000 | | | | 4,908,030 | |
| | | | | | | | |
| | | | $ | 126,417,217 | |
| Food & Drug Stores - 0.5% | | | | | | | | |
| CVS Caremark Corp., 3.25%, 5/18/15 | | $ | 1,743,000 | | | $ | 1,789,017 | |
| CVS Caremark Corp., 5.75%, 6/01/17 | | | 978,000 | | | | 1,106,950 | |
| CVS Caremark Corp., 2.75%, 12/01/22 | | | 3,513,000 | | | | 3,357,595 | |
| CVS Caremark Corp., 5.75%, 5/15/41 | | | 3,147,000 | | | | 3,736,033 | |
| Walgreen Co., 1.8%, 9/15/17 | | | 3,680,000 | | | | 3,719,232 | |
| | | | | | | | |
| | | | $ | 13,708,827 | |
| Forest & Paper Products - 1.6% | | | | | | | | |
| Georgia-Pacific LLC, 5.4%, 11/01/20 (n) | | $ | 13,758,000 | | | $ | 15,665,120 | |
| Graphic Packaging Holding Co., 7.875%, 10/01/18 | | | 5,343,000 | | | | 5,676,938 | |
| International Paper Co., 6%, 11/15/41 | | | 5,640,000 | | | | 6,610,356 | |
| Packaging Corp. of America, 3.9%, 6/15/22 | | | 13,788,000 | | | | 13,967,396 | |
| | | | | | | | |
| | | | $ | 41,919,810 | |
| Gaming & Lodging - 1.8% | | | | | | | | |
| Carnival Corp., 1.2%, 2/05/16 | | $ | 13,000,000 | | | $ | 13,076,960 | |
| Carnival Corp., 1.875%, 12/15/17 | | | 4,565,000 | | | | 4,581,101 | |
| Host Hotels & Resorts, Inc., REIT, 4.75%, 3/01/23 | | | 2,843,000 | | | | 3,005,364 | |
| Wyndham Worldwide Corp., 2.5%, 3/01/18 | | | 7,176,000 | | | | 7,239,773 | |
| Wyndham Worldwide Corp., 4.25%, 3/01/22 | | | 18,435,000 | | | | 18,736,117 | |
| | | | | | | | |
| | | | $ | 46,639,315 | |
| General Merchandise - 0.1% | | | | | | | | |
| Wal-Mart Stores, Inc., 4.3%, 4/22/44 | | $ | 2,470,000 | | | $ | 2,457,312 | |
| | |
| Insurance - 1.7% | | | | | | | | |
| American International Group, Inc., 3.8%, 3/22/17 | | $ | 7,167,000 | | | $ | 7,666,941 | |
| American International Group, Inc., 6.4%, 12/15/20 | | | 8,987,000 | | | | 10,848,208 | |
| Prudential Financial, Inc., 4.75%, 9/17/15 | | | 1,745,000 | | | | 1,840,987 | |
| Unum Group, 7.125%, 9/30/16 | | | 12,200,000 | | | | 13,888,590 | |
| Unum Group, 4%, 3/15/24 | | | 1,537,000 | | | | 1,561,048 | |
| UnumProvident Corp., 6.85%, 11/15/15 (n) | | | 8,751,000 | | | | 9,484,920 | |
| | | | | | | | |
| | | | $ | 45,290,694 | |
16
Portfolio of Investments – continued
| | | | | | | | |
| Issuer | | Shares/Par | | | Value ($) | |
| | | | | | | | |
| Bonds - continued | | | | | | | | |
| Insurance - Health - 1.3% | | | | | | | | |
| Aetna, Inc., 1.5%, 11/15/17 | | $ | 3,281,000 | | | $ | 3,290,515 | |
| CIGNA Corp., 2.75%, 11/15/16 | | | 9,534,000 | | | | 9,949,844 | |
| Humana, Inc., 7.2%, 6/15/18 | | | 10,075,000 | | | | 12,009,108 | |
| Wellpoint, Inc., 1.875%, 1/15/18 | | | 9,382,000 | | | | 9,330,174 | |
| | | | | | | | |
| | | | $ | 34,579,641 | |
| Insurance - Property & Casualty - 2.0% | | | | | | | | |
| Aon Corp., 6.25%, 9/30/40 | | $ | 1,832,000 | | | $ | 2,268,294 | |
| AXIS Capital Holdings Ltd., 5.875%, 6/01/20 | | | 1,810,000 | | | | 2,064,444 | |
| AXIS Specialty Finance LLC, 2.65%, 4/01/19 | | | 492,000 | | | | 494,228 | |
| Chubb Corp., 6.375% to 4/15/17, FRN to 3/29/67 | | | 1,838,000 | | | | 2,040,180 | |
| CNA Financial Corp., 5.875%, 8/15/20 | | | 6,010,000 | | | | 6,987,725 | |
| CNA Financial Corp., 3.95%, 5/15/24 | | | 4,827,000 | | | | 4,926,325 | |
| Marsh & McLennan Cos., Inc., 2.55%, 10/15/18 | | | 4,402,000 | | | | 4,472,978 | |
| Marsh & McLennan Cos., Inc., 4.8%, 7/15/21 | | | 8,500,000 | | | | 9,319,893 | |
| Swiss Re Ltd., 4.25%, 12/06/42 (n) | | | 1,842,000 | | | | 1,753,857 | |
| XL Group PLC, 5.75%, 10/01/21 | | | 6,890,000 | | | | 8,006,676 | |
| XL Group PLC, 6.5% to 4/15/17, FRN to 12/29/49 | | | 2,655,000 | | | | 2,615,175 | |
| ZFS Finance USA Trust II, 6.45% to 6/15/16, FRN to 12/15/65 (n) | | | 1,048,000 | | | | 1,126,600 | |
| ZFS Finance USA Trust V, 6.5% to 5/09/17, FRN to 5/09/67 (n) | | | 4,913,000 | | | | 5,269,193 | |
| | | | | | | | |
| | | | $ | 51,345,568 | |
| International Market Quasi-Sovereign - 0.2% | | | | | | | | |
| Israel Electric Corp. Ltd., 6.875%, 6/21/23 (n) | | $ | 5,524,000 | | | $ | 6,104,020 | |
| | |
| Machinery & Tools - 0.4% | | | | | | | | |
| Case New Holland, Inc., 7.875%, 12/01/17 | | $ | 4,401,000 | | | $ | 5,171,175 | |
| United Rentals North America, Inc., 5.75%, 11/15/24 | | | 5,750,000 | | | | 5,965,625 | |
| | | | | | | | |
| | | | $ | 11,136,800 | |
| Major Banks - 7.4% | | | | | | | | |
| Bank of America Corp., 2%, 1/11/18 | | $ | 25,000,000 | | | $ | 25,043,375 | |
| Bank of America Corp., 7.625%, 6/01/19 | | | 1,290,000 | | | | 1,591,949 | |
| Bank of America Corp., 5.625%, 7/01/20 | | | 360,000 | | | | 411,421 | |
| Bank of America Corp., 4.125%, 1/22/24 | | | 16,866,000 | | | | 17,104,468 | |
| Bank of America Corp., 4.875%, 4/01/44 | | | 4,051,000 | | | | 4,117,777 | |
| Bank of America Corp., FRN, 5.2%, 12/31/49 | | | 6,497,000 | | | | 6,107,180 | |
| Goldman Sachs Group, Inc., 5.625%, 1/15/17 | | | 7,771,000 | | | | 8,565,670 | |
| JPMorgan Chase & Co., 2%, 8/15/17 | | | 13,489,000 | | | | 13,689,271 | |
| JPMorgan Chase & Co., 4.25%, 10/15/20 | | | 6,107,000 | | | | 6,565,801 | |
| JPMorgan Chase & Co., 4.5%, 1/24/22 | | | 9,500,000 | | | | 10,279,133 | |
| JPMorgan Chase & Co., 3.25%, 9/23/22 | | | 3,915,000 | | | | 3,868,278 | |
| JPMorgan Chase & Co., 6.75% to 2/01/24, FRN to 8/29/49 | | | 10,747,000 | | | | 11,391,820 | |
| Merrill Lynch & Co., Inc., 6.05%, 5/16/16 | | | 3,281,000 | | | | 3,579,948 | |
17
Portfolio of Investments – continued
| | | | | | | | |
| Issuer | | Shares/Par | | | Value ($) | |
| | | | | | | | |
| Bonds - continued | | | | | | | | |
| Major Banks - continued | | | | | | | | |
| Morgan Stanley, 3.875%, 4/29/24 | | $ | 9,255,000 | | | $ | 9,199,840 | |
| Morgan Stanley, 1.75%, 2/25/16 | | | 4,591,000 | | | | 4,652,579 | |
| Morgan Stanley, 5.75%, 10/18/16 | | | 5,924,000 | | | | 6,558,591 | |
| Morgan Stanley, 5.5%, 7/28/21 | | | 13,755,000 | | | | 15,566,025 | |
| PNC Funding Corp., 5.625%, 2/01/17 | | | 7,355,000 | | | | 8,165,219 | |
| Regions Financial Corp., 2%, 5/15/18 | | | 15,862,000 | | | | 15,679,508 | |
| Wachovia Corp., 6.605%, 10/01/25 | | | 7,936,000 | | | | 9,414,969 | |
| Wells Fargo & Co., 5.375%, 11/02/43 | | | 2,314,000 | | | | 2,491,822 | |
| Wells Fargo & Co., 5.90% to 6/15/24, FRN to 12/29/49 | | | 9,738,000 | | | | 9,972,686 | |
| | | | | | | | |
| | | | $ | 194,017,330 | |
| Medical & Health Technology & Services - 2.6% | | | | | | | | |
| Davita, Inc., 6.625%, 11/01/20 | | $ | 15,982,000 | | | $ | 17,040,807 | |
| Express Scripts Holding Co., 2.65%, 2/15/17 | | | 5,000,000 | | | | 5,187,200 | |
| Fresenius Medical Care AG & Co. KGaA, 9%, 7/15/15 (n) | | | 10,225,000 | | | | 11,145,250 | |
| Fresenius Medical Care US Finance II, Inc., 6.5%, 9/15/18 (n) | | | 7,266,000 | | | | 8,156,085 | |
| Fresenius US Finance II, Inc., 4.25%, 2/01/21 (n) | | | 1,610,000 | | | | 1,618,050 | |
| HCA, Inc., 4.75%, 5/01/23 | | | 13,591,000 | | | | 13,353,158 | |
| McKesson Corp., 5.7%, 3/01/17 | | | 5,010,000 | | | | 5,559,286 | |
| McKesson Corp., 7.5%, 2/15/19 | | | 920,000 | | | | 1,131,462 | |
| McKesson Corp., 2.7%, 12/15/22 | | | 2,842,000 | | | | 2,688,853 | |
| Thermo Fisher Scientific, Inc., 3.15%, 1/15/23 | | | 1,177,000 | | | | 1,144,783 | |
| | | | | | | | |
| | | | $ | 67,024,934 | |
| Metals & Mining - 2.7% | | | | | | | | |
| Consol Energy, Inc., 5.875%, 4/15/22 (n) | | $ | 11,858,000 | | | $ | 12,213,740 | |
| Freeport-McMoRan Copper & Gold, Inc., 3.55%, 3/01/22 | | | 3,016,000 | | | | 2,916,086 | |
| Glencore Funding LLC, 4.625%, 4/29/24 (z) | | | 12,195,000 | | | | 12,192,561 | |
| Kinross Gold Corp., 5.95%, 3/15/24 (n) | | | 3,553,000 | | | | 3,597,469 | |
| Plains Exploration & Production Co., 6.875%, 2/15/23 | | | 18,800,000 | | | | 21,056,000 | |
| Rio Tinto Finance (USA) PLC, 3.5%, 3/22/22 | | | 3,322,000 | | | | 3,354,403 | |
| Southern Copper Corp., 6.75%, 4/16/40 | | | 13,609,000 | | | | 14,475,322 | |
| Southern Copper Corp., 5.25%, 11/08/42 | | | 1,909,000 | | | | 1,709,666 | |
| | | | | | | | |
| | | | $ | 71,515,247 | |
| Natural Gas - Distribution - 0.9% | | | | | | | | |
| AmeriGas Finance LLC, 7%, 5/20/22 | | $ | 16,552,000 | | | $ | 18,207,200 | |
| ONEOK, Inc., 4.25%, 2/01/22 | | | 6,520,000 | | | | 6,332,022 | |
| | | | | | | | |
| | | | $ | 24,539,222 | |
| Natural Gas - Pipeline - 5.5% | | | | | | | | |
| Access Midstream Partner LP, 4.875%, 3/15/24 | | $ | 10,475,000 | | | $ | 10,422,625 | |
| El Paso Pipeline Partners LP, 6.5%, 4/01/20 | | | 5,018,000 | | | | 5,834,840 | |
| Energy Transfer Partners LP, 9.7%, 3/15/19 | | | 1,560,000 | | | | 2,026,878 | |
18
Portfolio of Investments – continued
| | | | | | | | |
| Issuer | | Shares/Par | | | Value ($) | |
| | | | | | | | |
| Bonds - continued | | | | | | | | |
| Natural Gas - Pipeline - continued | | | | | | | | |
| Energy Transfer Partners LP, 5.2%, 2/01/22 | | $ | 2,477,000 | | | $ | 2,708,282 | |
| Energy Transfer Partners LP, 6.5%, 2/01/42 | | | 2,418,000 | | | | 2,806,154 | |
| Energy Transfer Partners LP, 5.15%, 2/01/43 | | | 8,888,000 | | | | 8,794,294 | |
| EnLink Midstream Partners LP, 2.7%, 4/01/19 | | | 2,252,000 | | | | 2,268,165 | |
| Enterprise Products Operating LLC, 3.9%, 2/15/24 | | | 2,924,000 | | | | 2,957,012 | |
| Enterprise Products Operating LP, 5.2%, 9/01/20 | | | 2,000,000 | | | | 2,266,286 | |
| Enterprise Products Partners LP, 6.3%, 9/15/17 | | | 2,590,000 | | | | 2,997,474 | |
| Enterprise Products Partners LP, 4.45%, 2/15/43 | | | 4,527,000 | | | | 4,334,919 | |
| Enterprise Products Partners LP, 7.034% to 1/15/18, FRN to 1/15/68 | | | 1,472,000 | | | | 1,667,040 | |
| Kinder Morgan Energy Partners LP, 6.85%, 2/15/20 | | | 4,303,000 | | | | 5,117,584 | |
| Kinder Morgan Energy Partners LP, 5.3%, 9/15/20 | | | 3,745,000 | | | | 4,164,489 | |
| Kinder Morgan Energy Partners LP, 7.4%, 3/15/31 | | | 3,627,000 | | | | 4,450,111 | |
| Kinder Morgan Energy Partners LP, 6.5%, 9/01/39 | | | 1,000,000 | | | | 1,161,370 | |
| MarkWest Energy Partners LP, 4.5%, 7/15/23 | | | 11,978,000 | | | | 11,678,550 | |
| NiSource Finance Corp., 3.85%, 2/15/23 | | | 10,894,000 | | | | 11,014,270 | |
| NiSource Finance Corp., 4.8%, 2/15/44 | | | 4,239,000 | | | | 4,165,687 | |
| ONEOK Partners LP, 2%, 10/01/17 | | | 7,668,000 | | | | 7,732,703 | |
| Plains All American Pipeline, LP, 3.95%, 9/15/15 | | | 3,710,000 | | | | 3,869,500 | |
| Sabine Pass Liquefaction LLC, 5.625%, 4/15/23 | | | 8,650,000 | | | | 8,736,500 | |
| Spectra Energy Capital LLC, 8%, 10/01/19 | | | 5,750,000 | | | | 7,116,045 | |
| Sunoco Logistics Partners LP, 5.3%, 4/01/44 | | | 6,108,000 | | | | 6,339,689 | |
| Williams Cos., Inc., 3.7%, 1/15/23 | | | 13,106,000 | | | | 12,101,137 | |
| Williams Partners LP, 5.4%, 3/04/44 | | | 6,408,000 | | | | 6,750,623 | |
| | | | | | | | |
| | | | $ | 143,482,227 | |
| Network & Telecom - 2.1% | | | | | | | | |
| AT&T, Inc., 1.4%, 12/01/17 | | $ | 3,016,000 | | | $ | 3,004,129 | |
| Verizon Communications, Inc., 3.65%, 9/14/18 | | | 10,496,000 | | | | 11,205,855 | |
| Verizon Communications, Inc., 4.5%, 9/15/20 | | | 12,714,000 | | | | 13,856,162 | |
| Verizon Communications, Inc., 5.05%, 3/15/34 | | | 8,076,000 | | | | 8,469,277 | |
| Verizon Communications, Inc., 6%, 4/01/41 | | | 4,310,000 | | | | 4,971,150 | |
| Verizon Communications, Inc., 6.55%, 9/15/43 | | | 10,881,000 | | | | 13,421,648 | |
| | | | | | | | |
| | | | $ | 54,928,221 | |
| Other Banks & Diversified Financials - 3.7% | | | | | | | | |
| American Express Co., 2.65%, 12/02/22 | | $ | 1,650,000 | | | $ | 1,583,866 | |
| American Express Credit Corp., 2.8%, 9/19/16 | | | 2,500,000 | | | | 2,610,728 | |
| American Express Credit Corp., 2.375%, 3/24/17 | | | 6,255,000 | | | | 6,480,273 | |
| BB&T Corp., 3.95%, 4/29/16 | | | 2,500,000 | | | | 2,655,245 | |
| Capital One Bank (USA) N.A., 3.375%, 2/15/23 | | | 8,400,000 | | | | 8,297,327 | |
| Capital One Financial Corp., 3.75%, 4/24/24 | | | 7,016,000 | | | | 7,028,846 | |
| Capital One Financial Corp., 1%, 11/06/15 | | | 12,000,000 | | | | 12,027,132 | |
| Citigroup, Inc., 1.25%, 1/15/16 | | | 2,586,000 | | | | 2,600,383 | |
19
Portfolio of Investments – continued
| | | | | | | | |
| Issuer | | Shares/Par | | | Value ($) | |
| | | | | | | | |
| Bonds - continued | | | | | | | | |
| Other Banks & Diversified Financials - continued | | | | | | | | |
| Discover Bank, 7%, 4/15/20 | | $ | 17,724,000 | | | $ | 21,204,710 | |
| Fifth Third Bancorp, 2.3%, 3/01/19 | | | 1,175,000 | | | | 1,172,815 | |
| Groupe BPCE S.A., 12.5% to 9/30/19, FRN to 8/29/49 (n) | | | 3,146,000 | | | | 4,184,180 | |
| Macquarie Group Ltd., 3%, 12/03/18 (n) | | | 8,905,000 | | | | 9,039,466 | |
| Swedbank AB, 2.125%, 9/29/17 (n) | | | 12,318,000 | | | | 12,517,355 | |
| U.S. Bancorp, 3%, 3/15/22 | | | 2,601,000 | | | | 2,592,323 | |
| U.S. Bancorp, 2.95%, 7/15/22 | | | 3,423,000 | | | | 3,314,080 | |
| | | | | | | | |
| | | | $ | 97,308,729 | |
| Personal Computers & Peripherals - 0.6% | | | | | | | | |
| Equifax, Inc., 3.3%, 12/15/22 | | $ | 14,996,000 | | | $ | 14,537,617 | |
| | |
| Pharmaceuticals - 4.8% | | | | | | | | |
| AbbVie, Inc., 1.75%, 11/06/17 | | $ | 15,000,000 | | | $ | 15,089,865 | |
| Amgen, Inc., 2.3%, 6/15/16 | | | 3,000,000 | | | | 3,083,274 | |
| Celgene Corp., 2.45%, 10/15/15 | | | 3,438,000 | | | | 3,515,881 | |
| Celgene Corp., 1.9%, 8/15/17 | | | 16,532,000 | | | | 16,767,300 | |
| Forest Laboratories, Inc., 4.375%, 2/01/19 (n) | | | 24,838,000 | | | | 26,421,423 | |
| Gilead Sciences, Inc., 3.7%, 4/01/24 | | | 10,392,000 | | | | 10,545,625 | |
| Hospira, Inc., 6.05%, 3/30/17 | | | 5,884,000 | | | | 6,499,390 | |
| Hospira, Inc., 5.2%, 8/12/20 | | | 3,239,000 | | | | 3,506,447 | |
| Mylan, Inc., 2.55%, 3/28/19 | | | 3,618,000 | | | | 3,629,458 | |
| Mylan, Inc., 3.125%, 1/15/23 (n) | | | 3,000,000 | | | | 2,853,780 | |
| Teva Pharmaceutical Finance B.V., 2.95%, 12/18/22 | | | 8,150,000 | | | | 7,761,555 | |
| Valeant Pharmaceuticals International, Inc., 5.625%, 12/01/21 (n) | | | 3,540,000 | | | | 3,681,600 | |
| Valeant Pharmaceuticals International, Inc., 7.25%, 7/15/22 (n) | | | 10,827,000 | | | | 11,801,430 | |
| Watson Pharmaceuticals, Inc., 1.875%, 10/01/17 | | | 3,180,000 | | | | 3,207,427 | |
| Watson Pharmaceuticals, Inc., 3.25%, 10/01/22 | | | 4,118,000 | | | | 3,991,540 | |
| Watson Pharmaceuticals, Inc., 4.625%, 10/01/42 | | | 4,240,000 | | | | 4,124,981 | |
| | | | | | | | |
| | | | $ | 126,480,976 | |
| Pollution Control - 0.3% | | | | | | | | |
| Republic Services, Inc., 5.25%, 11/15/21 | | $ | 6,200,000 | | | $ | 6,979,011 | |
| | |
| Printing & Publishing - 1.0% | | | | | | | | |
| Gannett Co., Inc., 5.125%, 10/15/19 (n) | | $ | 10,610,000 | | | $ | 11,047,663 | |
| Nielsen Finance LLC, 7.75%, 10/15/18 | | | 5,234,001 | | | | 5,567,668 | |
| Pearson PLC, 4%, 5/17/16 (n) | | | 9,720,000 | | | | 10,261,365 | |
| | | | | | | | |
| | | | $ | 26,876,696 | |
| Railroad & Shipping - 1.2% | | | | | | | | |
| Canadian Pacific Railway Co., 7.25%, 5/15/19 | | $ | 11,151,000 | | | $ | 13,591,296 | |
| Canadian Pacific Railway Co., 4.5%, 1/15/22 | | | 6,058,000 | | | | 6,506,534 | |
20
Portfolio of Investments – continued
| | | | | | | | |
| Issuer | | Shares/Par | | | Value ($) | |
| | | | | | | | |
| Bonds - continued | | | | | | | | |
| Railroad & Shipping - continued | | | | | | | | |
| CSX Corp., 7.375%, 2/01/19 | | $ | 5,360,000 | | | $ | 6,563,449 | |
| CSX Corp., 4.4%, 3/01/43 | | | 4,000,000 | | | | 3,916,120 | |
| | | | | | | | |
| | | | $ | 30,577,399 | |
| Real Estate - 2.0% | | | | | | | | |
| Boston Properties LP, REIT, 3.7%, 11/15/18 | | $ | 5,912,000 | | | $ | 6,297,013 | |
| Boston Properties LP, REIT, 3.85%, 2/01/23 | | | 3,562,000 | | | | 3,635,046 | |
| ERP Operating LP, REIT, 5.375%, 8/01/16 | | | 2,950,000 | | | | 3,240,646 | |
| Simon Property Group, Inc., REIT, 5.75%, 12/01/15 | | | 2,560,000 | | | | 2,733,811 | |
| Simon Property Group, Inc., REIT, 1.5%, 2/01/18 (n) | | | 9,465,000 | | | | 9,352,319 | |
| Simon Property Group, Inc., REIT, 10.35%, 4/01/19 | | | 5,828,000 | | | | 7,906,504 | |
| Simon Property Group, Inc., REIT, 4.375%, 3/01/21 | | | 7,340,000 | | | | 8,030,613 | |
| WEA Finance LLC, 6.75%, 9/02/19 (n) | | | 9,872,000 | | | | 11,950,885 | |
| | | | | | | | |
| | | | $ | 53,146,837 | |
| Retailers - 3.0% | | | | | | | | |
| Dollar General Corp., 4.125%, 7/15/17 | | $ | 21,009,000 | | | $ | 22,448,327 | |
| Dollar General Corp., 3.25%, 4/15/23 | | | 5,000,000 | | | | 4,721,090 | |
| Gap, Inc., 5.95%, 4/12/21 | | | 23,607,000 | | | | 26,864,081 | |
| Home Depot, Inc., 4.875%, 2/15/44 | | | 4,000,000 | | | | 4,345,080 | |
| Limited Brands, Inc., 7%, 5/01/20 | | | 11,059,000 | | | | 12,607,260 | |
| Limited Brands, Inc., 5.625%, 2/15/22 | | | 7,521,000 | | | | 7,906,451 | |
| | | | | | | | |
| | | | $ | 78,892,289 | |
| Specialty Chemicals - 0.7% | | | | | | | | |
| Ecolab, Inc., 3%, 12/08/16 | | $ | 6,728,000 | | | $ | 7,073,449 | |
| Ecolab, Inc., 4.35%, 12/08/21 | | | 4,000,000 | | | | 4,353,404 | |
| Mexichem S.A.B. de C.V., 6.75%, 9/19/42 (n) | | | 7,533,000 | | | | 7,636,579 | |
| | | | | | | | |
| | | | $ | 19,063,432 | |
| Specialty Stores - 0.7% | | | | | | | | |
| Advance Auto Parts, Inc., 5.75%, 5/01/20 | | $ | 4,332,000 | | | $ | 4,919,424 | |
| Advance Auto Parts, Inc., 4.5%, 1/15/22 | | | 5,239,000 | | | | 5,510,307 | |
| Advance Auto Parts, Inc., 4.5%, 12/01/23 | | | 6,528,000 | | | | 6,838,139 | |
| | | | | | | | |
| | | | | | | $ | 17,267,870 | |
| Telecommunications - Wireless - 1.9% | | | | | | | | |
| American Tower Corp., REIT, 4.625%, 4/01/15 | | $ | 10,110,000 | | | $ | 10,466,741 | |
| American Tower Corp., REIT, 4.5%, 1/15/18 | | | 5,760,000 | | | | 6,227,309 | |
| American Tower Corp., REIT, 4.7%, 3/15/22 | | | 7,973,000 | | | | 8,369,123 | |
| American Tower Corp., REIT, 3.5%, 1/31/23 | | | 3,999,000 | | | | 3,844,699 | |
| CC Holdings GS V LLC, 2.381%, 12/15/17 | | | 5,000,000 | | | | 5,056,655 | |
| Crown Castle International Corp., 5.25%, 1/15/23 | | | 4,570,000 | | | | 4,695,675 | |
| Crown Castle Towers LLC, 6.113%, 1/15/20 (n) | | | 1,615,000 | | | | 1,869,228 | |
21
Portfolio of Investments – continued
| | | | | | | | |
| Issuer | | Shares/Par | | | Value ($) | |
| | | | | | | | |
| Bonds - continued | | | | | | | | |
| Telecommunications - Wireless - continued | | | | | | | | |
| Crown Castle Towers LLC, 4.883%, 8/15/20 (n) | | $ | 1,400,000 | | | $ | 1,552,312 | |
| Rogers Communications, Inc., 5%, 3/15/44 | | | 5,381,000 | | | | 5,506,662 | |
| Vodafone Group PLC, 5.625%, 2/27/17 | | | 1,452,000 | | | | 1,626,329 | |
| | | | | | | | |
| | | | $ | 49,214,733 | |
| Tobacco - 2.4% | | | | | | | | |
| Altria Group, Inc., 4%, 1/31/24 | | $ | 3,204,000 | | | $ | 3,263,758 | |
| B.A.T. International Finance PLC, 2.125%, 6/07/17 (n) | | | 8,948,000 | | | | 9,145,169 | |
| Lorillard Tobacco Co., 2.3%, 8/21/17 | | | 9,055,000 | | | | 9,241,841 | |
| Lorillard Tobacco Co., 8.125%, 6/23/19 | | | 17,790,000 | | | | 22,115,372 | |
| Lorillard Tobacco Co., 6.875%, 5/01/20 | | | 5,000,000 | | | | 5,904,420 | |
| Reynolds American, Inc., 6.75%, 6/15/17 | | | 7,310,000 | | | | 8,427,823 | |
| Reynolds American, Inc., 4.75%, 11/01/42 | | | 4,190,000 | | | | 3,934,628 | |
| | | | | | | | |
| | | | $ | 62,033,011 | |
| Transportation - Services - 0.2% | | | | | | | | |
| ERAC USA Finance Co., 6.375%, 10/15/17 (n) | | $ | 1,400,000 | | | $ | 1,607,732 | |
| ERAC USA Finance Co., 5.625%, 3/15/42 (n) | | | 2,420,000 | | | | 2,704,517 | |
| | | | | | | | |
| | | | $ | 4,312,249 | |
| Utilities - Electric Power - 2.9% | | | | | | | | |
| American Electric Power Co., Inc., 1.65%, 12/15/17 | | $ | 8,244,000 | | | $ | 8,234,305 | |
| Calpine Corp., 7.875%, 7/31/20 (n) | | | 12,450,000 | | | | 13,648,312 | |
| CenterPoint Energy, Inc., 5.95%, 2/01/17 | | | 4,600,000 | | | | 5,171,808 | |
| CMS Energy Corp., 6.25%, 2/01/20 | | | 6,891,000 | | | | 8,130,684 | |
| CMS Energy Corp., 5.05%, 3/15/22 | | | 5,159,000 | | | | 5,806,934 | |
| Duke Energy Corp., 1.625%, 8/15/17 | | | 3,267,000 | | | | 3,296,370 | |
| Empresa Nacional de Electricidad S.A., 4.25%, 4/15/24 | | | 2,663,000 | | | | 2,667,719 | |
| NRG Energy, Inc., 6.25%, 7/15/22 (n) | | | 9,885,000 | | | | 10,218,619 | |
| PPL Capital Funding, Inc., 5%, 3/15/44 | | | 5,193,000 | | | | 5,440,732 | |
| PPL Corp., 4.2%, 6/15/22 | | | 2,500,000 | | | | 2,630,203 | |
| PPL WEM Holdings PLC, 5.375%, 5/01/21 (n) | | | 5,693,000 | | | | 6,276,350 | |
| PSEG Power LLC, 5.32%, 9/15/16 | | | 1,727,000 | | | | 1,899,007 | |
| Waterford 3 Funding Corp., 8.09%, 1/02/17 | | | 2,634,501 | | | | 2,632,030 | |
| | | | | | | | |
| | | | $ | 76,053,073 | |
| Total Bonds (Identified Cost, $2,366,329,883) | | | $ | 2,460,572,236 | |
| | |
| Money Market Funds - 5.4% | | | | | | | | |
MFS Institutional Money Market Portfolio, 0.09%,
at Cost and Net Asset Value (v) | | | 139,940,086 | | | $ | 139,940,086 | |
| Total Investments (Identified Cost, $2,506,269,969) | | | $ | 2,600,512,322 | |
| |
| Other Assets, Less Liabilities - 0.7% | | | | 19,236,604 | |
| Net Assets - 100.0% | | | $ | 2,619,748,926 | |
22
Portfolio of Investments – continued
| (d) | In default. Interest and/or scheduled principal payment(s) have been missed. |
| (i) | Interest only security for which the fund receives interest on notional principal (Par amount). Par amount shown is the notional principal and does not reflect the cost of the security. |
| (n) | Securities exempt from registration under Rule 144A of the Securities Act of 1933. These securities may be sold in the ordinary course of business in transactions exempt from registration, normally to qualified institutional buyers. At period end, the aggregate value of these securities was $443,807,644 representing 16.9% of net assets. |
| (q) | Interest received was less than stated coupon rate. |
| (v) | Underlying affiliated fund that is available only to investment companies managed by MFS. The rate quoted for the MFS Institutional Money Market Portfolio is the annualized seven-day yield of the fund at period end. |
| (z) | Restricted securities are not registered under the Securities Act of 1933 and are subject to legal restrictions on resale. These securities generally may be resold in transactions exempt from registration or to the public if the securities are subsequently registered. Disposal of these securities may involve time-consuming negotiations and prompt sale at an acceptable price may be difficult. The fund holds the following restricted securities: |
| | | | | | | | | | |
| Restricted Securities | | Acquisition Date | | Cost | | | Value | |
| Bayview Financial Revolving Mortgage Loan Trust, FRN, 1.752%, 12/28/40 | | 3/01/06 | | | $1,761,291 | | | | $1,165,509 | |
| BlackRock Capital Finance LP, 7.75%, 9/25/26 | | 10/10/96-1/03/97 | | | 284,257 | | | | 35,080 | |
| CEMEX Finance LLC, 6%, 4/01/24 | | 3/25/14 | | | 7,576,000 | | | | 7,585,470 | |
| Falcon Franchise Loan LLC, FRN, 14.91%, 1/05/25 | | 1/29/03 | | | 72,991 | | | | 315,007 | |
| G-Force LLC, CDO, “A2”, 4.83%, 8/22/36 | | 1/20/11 | | | 83,620 | | | | 88,036 | |
| Glencore Funding LLC, 4.625%, 4/29/24 | | 4/22/14 | | | 12,145,753 | | | | 12,192,561 | |
| Service Corp. International, 5.375%, 5/15/24 | | 4/28/14 | | | 10,365,000 | | | | 10,442,738 | |
| Spirit Master Funding LLC, 5.05%, 7/20/23 | | 10/04/05 | | | 1,601,962 | | | | 1,655,425 | |
| State Grid Overseas Investment (2014) Ltd., 4.125%, 5/07/24 | | 4/28/14 | | | 6,313,425 | | | | 6,374,957 | |
| Tencent Holdings Ltd., 3.375%, 5/02/19 | | 4/22/14 | | | 1,314,620 | | | | 1,322,872 | |
| Videotron Ltd., 5.375%, 6/15/24 | | 3/26/14 | | | 4,025,000 | | | | 4,055,188 | |
| Total Restricted Securities | | | | $45,232,843 | |
| % of Net assets | | | | 1.7% | |
The following abbreviations are used in this report and are defined:
| CDO | | Collateralized Debt Obligation |
| CLO | | Collateralized Loan Obligation |
| FRN | | Floating Rate Note. Interest rate resets periodically and may not be the rate reported at period end. |
| PLC | | Public Limited Company |
| REIT | | Real Estate Investment Trust |
See Notes to Financial Statements
23
Financial Statements
STATEMENT OF ASSETS AND LIABILITIES
At 4/30/14
This statement represents your fund’s balance sheet, which details the assets and liabilities comprising the total value of the fund.
| | | | |
| Assets | | | | |
Investments- | | | | |
Non-affiliated issuers, at value (identified cost, $2,366,329,883) | | | $2,460,572,236 | |
Underlying affiliated funds, at cost and value | | | 139,940,086 | |
Total investments, at value (identified cost, $2,506,269,969) | | | $2,600,512,322 | |
Receivables for | | | | |
Investments sold | | | 16,513,311 | |
Fund shares sold | | | 6,201,556 | |
Interest and dividends | | | 26,600,200 | |
Other assets | | | 10,000 | |
Total assets | | | $2,649,837,389 | |
| Liabilities | | | | |
Payables for | | | | |
Distributions | | | $813,196 | |
Investments purchased | | | 21,529,257 | |
Fund shares reacquired | | | 5,729,445 | |
Payable to affiliates | | | | |
Investment adviser | | | 45,806 | |
Shareholder servicing costs | | | 1,466,573 | |
Distribution and service fees | | | 44,297 | |
Payable for independent Trustees’ compensation | | | 43,183 | |
Accrued expenses and other liabilities | | | 416,706 | |
Total liabilities | | | $30,088,463 | |
Net assets | | | $2,619,748,926 | |
| Net assets consist of | | | | |
Paid-in capital | | | $2,550,437,237 | |
Unrealized appreciation (depreciation) on investments | | | 94,242,353 | |
Accumulated distributions in excess of net realized gain on investments | | | (22,363,265 | ) |
Accumulated distributions in excess of net investment income | | | (2,567,399 | ) |
Net assets | | | $2,619,748,926 | |
Shares of beneficial interest outstanding | | | 186,981,021 | |
24
Statement of Assets and Liabilities – continued
| | | | | | | | | | | | |
| | | Net assets | | | Shares
outstanding | | | Net asset value
per share (a) | |
Class A | | | $1,489,744,457 | | | | 106,273,825 | | | | $14.02 | |
Class B | | | 87,093,904 | | | | 6,227,427 | | | | 13.99 | |
Class C | | | 276,007,854 | | | | 19,757,128 | | | | 13.97 | |
Class I | | | 446,377,280 | | | | 31,854,606 | | | | 14.01 | |
Class R1 | | | 21,547,944 | | | | 1,541,296 | | | | 13.98 | |
Class R2 | | | 77,290,290 | | | | 5,513,845 | | | | 14.02 | |
Class R3 | | | 63,348,819 | | | | 4,519,122 | | | | 14.02 | |
Class R4 | | | 139,924,255 | | | | 9,979,365 | | | | 14.02 | |
Class R5 | | | 18,414,123 | | | | 1,314,407 | | | | 14.01 | |
| (a) | Maximum offering price per share was equal to the net asset value per share for all share classes, except for Class A, for which the maximum offering price per share was $14.72 [100 / 95.25 x $14.02]. On sales of $50,000 or more, the maximum offering price of Class A shares is reduced. A contingent deferred sales charge may be imposed on redemptions of Class A, Class B, and Class C shares. Redemption price per share was equal to the net asset value per share for Classes I, R1, R2, R3, R4, and R5. |
See Notes to Financial Statements
25
Financial Statements
STATEMENT OF OPERATIONS
Year ended 4/30/14
This statement describes how much your fund earned in investment income and accrued in expenses. It also describes any gains and/or losses generated by fund operations.
| | | | |
| Net investment income | | | | |
Income | | | | |
Interest | | | $110,175,965 | |
Dividends from underlying affiliated funds | | | 123,528 | |
Total investment income | | | $110,299,493 | |
Expenses | | | | |
Management fee | | | $10,583,264 | |
Distribution and service fees | | | 8,728,066 | |
Shareholder servicing costs | | | 3,597,356 | |
Administrative services fee | | | 338,610 | |
Independent Trustees’ compensation | | | 47,215 | |
Custodian fee | | | 236,839 | |
Shareholder communications | | | 517,791 | |
Audit and tax fees | | | 70,498 | |
Legal fees | | | 27,627 | |
Miscellaneous | | | 308,855 | |
Total expenses | | | $24,456,121 | |
Fees paid indirectly | | | (117 | ) |
Reduction of expenses by investment adviser and distributor | | | (124,939 | ) |
Net expenses | | | $24,331,065 | |
Net investment income | | | $85,968,428 | |
| Realized and unrealized gain (loss) on investments | | | | |
Realized gain (loss) on investments (identified cost basis) | | | $4,611,412 | |
Change in unrealized appreciation (depreciation) on investments | | | $(83,546,950 | ) |
Net realized and unrealized gain (loss) on investments | | | $(78,935,538 | ) |
Change in net assets from operations | | | $7,032,890 | |
See Notes to Financial Statements
26
Financial Statements
STATEMENTS OF CHANGES IN NET ASSETS
These statements describe the increases and/or decreases in net assets resulting from operations, any distributions, and any shareholder transactions.
| | | | | | | | |
| | | Years ended 4/30 | |
| | | 2014 | | | 2013 | |
| Change in net assets | | | | | | |
| From operations | | | | | | | | |
Net investment income | | | $85,968,428 | | | | $91,764,933 | |
Net realized gain (loss) on investments | | | 4,611,412 | | | | 38,515,984 | |
Net unrealized gain (loss) on investments | | | (83,546,950 | ) | | | 81,168,561 | |
Change in net assets from operations | | | $7,032,890 | | | | $211,449,478 | |
| Distributions declared to shareholders | | | | | | | | |
From net investment income | | | $(93,111,965 | ) | | | $(108,799,618 | ) |
From net realized gain on investments | | | (6,847,311 | ) | | | — | |
Total distributions declared to shareholders | | | $(99,959,276 | ) | | | $(108,799,618 | ) |
Change in net assets from fund share transactions | | | $(541,774,012 | ) | | | $800,568,084 | |
Total change in net assets | | | $(634,700,398 | ) | | | $903,217,944 | |
| Net assets | | | | | | | | |
At beginning of period | | | 3,254,449,324 | | | | 2,351,231,380 | |
At end of period (including accumulated distributions in excess of net investment income of $2,567,399 and $5,645,096, respectively) | | | $2,619,748,926 | | | | $3,254,449,324 | |
See Notes to Financial Statements
27
Financial Statements
FINANCIAL HIGHLIGHTS
The financial highlights table is intended to help you understand the fund’s financial performance for the past 5 years (or life of a particular share class, if shorter). Certain information reflects financial results for a single fund share. The total returns in the table represent the rate by which an investor would have earned (or lost) on an investment in the fund share class (assuming reinvestment of all distributions) held for the entire period.
| | | | | | | | | | | | | | | | | | | | |
| Class A | | Years ended 4/30 | |
| | | 2014 | | | 2013 | | | 2012 | | | 2011 | | | 2010 | |
Net asset value, beginning of period | | | $14.38 | | | | $13.86 | | | | $13.64 | | | | $13.17 | | | | $10.95 | |
| Income (loss) from investment operations | | | | | | | | | | | | | | | | | |
Net investment income (d) | | | $0.44 | | | | $0.46 | | | | $0.59 | | | | $0.68 | | | | $0.71 | |
Net realized and unrealized gain (loss) on
investments and foreign currency | | | (0.28 | ) | | | 0.61 | | | | 0.32 | | | | 0.53 | | | | 2.23 | |
Total from investment operations | | | $0.16 | | | | $1.07 | | | | $0.91 | | | | $1.21 | | | | $2.94 | |
| Less distributions declared to shareholders | | | | | | | | | | | | | | | | | |
From net investment income | | | $(0.48 | ) | | | $(0.55 | ) | | | $(0.69 | ) | | | $(0.74 | ) | | | $(0.72 | ) |
From net realized gain on investments | | | (0.04 | ) | | | — | | | | — | | | | — | | | | — | |
Total distributions declared to shareholders | | | $(0.52 | ) | | | $(0.55 | ) | | | $(0.69 | ) | | | $(0.74 | ) | | | $(0.72 | ) |
Net asset value, end of period (x) | | | $14.02 | | | | $14.38 | | | | $13.86 | | | | $13.64 | | | | $13.17 | |
Total return (%) (r)(s)(t)(x) | | | 1.18 | | | | 7.82 | | | | 6.92 | | | | 9.46 | | | | 27.35 | |
Ratios (%) (to average net assets) and Supplemental data: | | | | | | | | | | | | | | | | | | | | |
Expenses before expense reductions (f) | | | 0.82 | | | | 0.83 | | | | 0.84 | | | | 0.85 | | | | 0.87 | |
Expenses after expense reductions (f) | | | 0.81 | | | | 0.83 | | | | 0.84 | | | | 0.85 | | | | 0.87 | |
Net investment income | | | 3.19 | | | | 3.24 | | | | 4.38 | | | | 5.09 | | | | 5.72 | |
Portfolio turnover | | | 31 | | | | 47 | | | | 47 | | | | 58 | | | | 91 | |
Net assets at end of period (000 omitted) | | | $1,489,744 | | | | $1,766,159 | | | | $1,350,525 | | | | $884,807 | | | | $781,496 | |
See Notes to Financial Statements
28
Financial Highlights – continued
| | | | | | | | | | | | | | | | | | | | |
| Class B | | Years ended 4/30 | |
| | | 2014 | | | 2013 | | | 2012 | | | 2011 | | | 2010 | |
Net asset value, beginning of period | | | $14.35 | | | | $13.82 | | | | $13.60 | | | | $13.14 | | | | $10.91 | |
| Income (loss) from investment operations | | | | | | | | | | | | | | | | | |
Net investment income (d) | | | $0.34 | | | | $0.35 | | | | $0.49 | | | | $0.58 | | | | $0.62 | |
Net realized and unrealized gain (loss) on
investments and foreign currency | | | (0.29 | ) | | | 0.62 | | | | 0.32 | | | | 0.52 | | | | 2.23 | |
Total from investment operations | | | $0.05 | | | | $0.97 | | | | $0.81 | | | | $1.10 | | | | $2.85 | |
| Less distributions declared to shareholders | | | | | | | | | | | | | | | | | |
From net investment income | | | $(0.37 | ) | | | $(0.44 | ) | | | $(0.59 | ) | | | $(0.64 | ) | | | $(0.62 | ) |
From net realized gain on investments | | | (0.04 | ) | | | — | | | | — | | | | — | | | | — | |
Total distributions declared to shareholders | | | $(0.41 | ) | | | $(0.44 | ) | | | $(0.59 | ) | | | $(0.64 | ) | | | $(0.62 | ) |
Net asset value, end of period (x) | | | $13.99 | | | | $14.35 | | | | $13.82 | | | | $13.60 | | | | $13.14 | |
Total return (%) (r)(s)(t)(x) | | | 0.42 | | | | 7.11 | | | | 6.13 | | | | 8.58 | | | | 26.60 | |
Ratios (%) (to average net assets) and Supplemental data: | | | | | | | | | | | | | | | | | | | | |
Expenses before expense reductions (f) | | | 1.57 | | | | 1.58 | | | | 1.60 | | | | 1.60 | | | | 1.62 | |
Expenses after expense reductions (f) | | | 1.57 | | | | 1.58 | | | | 1.60 | | | | 1.60 | | | | 1.62 | |
Net investment income | | | 2.44 | | | | 2.51 | | | | 3.64 | | | | 4.35 | | | | 5.00 | |
Portfolio turnover | | | 31 | | | | 47 | | | | 47 | | | | 58 | | | | 91 | |
Net assets at end of period (000 omitted) | | | $87,094 | | | | $112,822 | | | | $89,789 | | | | $63,614 | | | | $62,341 | |
| |
| Class C | | Years ended 4/30 | |
| | | 2014 | | | 2013 | | | 2012 | | | 2011 | | | 2010 | |
Net asset value, beginning of period | | | $14.33 | | | | $13.81 | | | | $13.58 | | | | $13.12 | | | | $10.90 | |
| Income (loss) from investment operations | | | | | | | | | | | | | | | | | |
Net investment income (d) | | | $0.34 | | | | $0.35 | | | | $0.49 | | | | $0.58 | | | | $0.62 | |
Net realized and unrealized gain (loss) on
investments and foreign currency | | | (0.29 | ) | | | 0.61 | | | | 0.33 | | | | 0.52 | | | | 2.22 | |
Total from investment operations | | | $0.05 | | | | $0.96 | | | | $0.82 | | | | $1.10 | | | | $2.84 | |
| Less distributions declared to shareholders | | | | | | | | | | | | | | | | | |
From net investment income | | | $(0.37 | ) | | | $(0.44 | ) | | | $(0.59 | ) | | | $(0.64 | ) | | | $(0.62 | ) |
From net realized gain on investments | | | (0.04 | ) | | | — | | | | — | | | | — | | | | — | |
Total distributions declared to shareholders | | | $(0.41 | ) | | | $(0.44 | ) | | | $(0.59 | ) | | | $(0.64 | ) | | | $(0.62 | ) |
Net asset value, end of period (x) | | | $13.97 | | | | $14.33 | | | | $13.81 | | | | $13.58 | | | | $13.12 | |
Total return (%) (r)(s)(t)(x) | | | 0.42 | | | | 7.04 | | | | 6.21 | | | | 8.59 | | | | 26.52 | |
Ratios (%) (to average net assets) and Supplemental data: | | | | | | | | | | | | | | | | | | | | |
Expenses before expense reductions (f) | | | 1.57 | | | | 1.58 | | | | 1.60 | | | | 1.60 | | | | 1.62 | |
Expenses after expense reductions (f) | | | 1.57 | | | | 1.58 | | | | 1.60 | | | | 1.60 | | | | 1.62 | |
Net investment income | | | 2.45 | | | | 2.49 | | | | 3.62 | | | | 4.35 | | | | 4.97 | |
Portfolio turnover | | | 31 | | | | 47 | | | | 47 | | | | 58 | | | | 91 | |
Net assets at end of period (000 omitted) | | | $276,008 | | | | $412,671 | | | | $280,260 | | | | $152,326 | | | | $117,744 | |
See Notes to Financial Statements
29
Financial Highlights – continued
| | | | | | | | | | | | | | | | | | | | |
| Class I | | Years ended 4/30 | |
| | | 2014 | | | 2013 | | | 2012 | | | 2011 | | | 2010 | |
Net asset value, beginning of period | | | $14.38 | | | | $13.86 | | | | $13.64 | | | | $13.18 | | | | $10.95 | |
| Income (loss) from investment operations | | | | | | | | | | | | | | | | | |
Net investment income (d) | | | $0.47 | | | | $0.49 | | | | $0.62 | | | | $0.71 | | | | $0.74 | |
Net realized and unrealized gain (loss) on
investments and foreign currency | | | (0.29 | ) | | | 0.61 | | | | 0.33 | | | | 0.53 | | | | 2.24 | |
Total from investment operations | | | $0.18 | | | | $1.10 | | | | $0.95 | | | | $1.24 | | | | $2.98 | |
| Less distributions declared to shareholders | | | | | | | | | | | | | | | | | |
From net investment income | | | $(0.51 | ) | | | $(0.58 | ) | | | $(0.73 | ) | | | $(0.78 | ) | | | $(0.75 | ) |
From net realized gain on investments | | | (0.04 | ) | | | — | | | | — | | | | — | | | | — | |
Total distributions declared to shareholders | | | $(0.55 | ) | | | $(0.58 | ) | | | $(0.73 | ) | | | $(0.78 | ) | | | $(0.75 | ) |
Net asset value, end of period (x) | | | $14.01 | | | | $14.38 | | | | $13.86 | | | | $13.64 | | | | $13.18 | |
Total return (%) (r)(s)(x) | | | 1.36 | | | | 8.09 | | | | 7.18 | | | | 9.65 | | | | 27.76 | |
Ratios (%) (to average net assets) and Supplemental data: | | | | | | | | | | | | | | | | | | | | |
Expenses before expense reductions (f) | | | 0.57 | | | | 0.58 | | | | 0.60 | | | | 0.60 | | | | 0.62 | |
Expenses after expense reductions (f) | | | 0.57 | | | | 0.58 | | | | 0.60 | | | | 0.60 | | | | 0.62 | |
Net investment income | | | 3.43 | | | | 3.44 | | | | 4.58 | | | | 5.31 | | | | 5.98 | |
Portfolio turnover | | | 31 | | | | 47 | | | | 47 | | | | 58 | | | | 91 | |
Net assets at end of period (000 omitted) | | | $446,377 | | | | $666,992 | | | | $361,290 | | | | $114,736 | | | | $43,990 | |
| |
| Class R1 | | Years ended 4/30 | |
| | | 2014 | | | 2013 | | | 2012 | | | 2011 | | | 2010 | |
Net asset value, beginning of period | | | $14.34 | | | | $13.82 | | | | $13.59 | | | | $13.13 | | | | $10.91 | |
| Income (loss) from investment operations | | | | | | | | | | | | | | | | | |
Net investment income (d) | | | $0.34 | | | | $0.36 | | | | $0.50 | | | | $0.58 | | | | $0.62 | |
Net realized and unrealized gain (loss) on
investments and foreign currency | | | (0.29 | ) | | | 0.60 | | | | 0.32 | | | | 0.52 | | | | 2.22 | |
Total from investment operations | | | $0.05 | | | | $0.96 | | | | $0.82 | | | | $1.10 | | | | $2.84 | |
| Less distributions declared to shareholders | | | | | | | | | | | | | | | | | |
From net investment income | | | $(0.37 | ) | | | $(0.44 | ) | | | $(0.59 | ) | | | $(0.64 | ) | | | $(0.62 | ) |
From net realized gain on investments | | | (0.04 | ) | | | — | | | | — | | | | — | | | | — | |
Total distributions declared to shareholders | | | $(0.41 | ) | | | $(0.44 | ) | | | $(0.59 | ) | | | $(0.64 | ) | | | $(0.62 | ) |
Net asset value, end of period (x) | | | $13.98 | | | | $14.34 | | | | $13.82 | | | | $13.59 | | | | $13.13 | |
Total return (%) (r)(s)(x) | | | 0.42 | | | | 7.04 | | | | 6.21 | | | | 8.59 | | | | 26.50 | |
Ratios (%) (to average net assets) and Supplemental data: | | | | | | | | | | | | | | | | | | | | |
Expenses before expense reductions (f) | | | 1.57 | | | | 1.58 | | | | 1.60 | | | | 1.61 | | | | 1.62 | |
Expenses after expense reductions (f) | | | 1.57 | | | | 1.58 | | | | 1.60 | | | | 1.61 | | | | 1.62 | |
Net investment income | | | 2.44 | | | | 2.58 | | | | 3.67 | | | | 4.38 | | | | 4.99 | |
Portfolio turnover | | | 31 | | | | 47 | | | | 47 | | | | 58 | | | | 91 | |
Net assets at end of period (000 omitted) | | | $21,548 | | | | $8,672 | | | | $10,894 | | | | $9,492 | | | | $10,941 | |
See Notes to Financial Statements
30
Financial Highlights – continued
| | | | | | | | | | | | | | | | | | | | |
| Class R2 | | Years ended 4/30 | |
| | | 2014 | | | 2013 | | | 2012 | | | 2011 | | | 2010 | |
Net asset value, beginning of period | | | $14.38 | | | | $13.86 | | | | $13.63 | | | | $13.17 | | | | $10.94 | |
| Income (loss) from investment operations | | | | | | | | | | | | | | | | | |
Net investment income (d) | | | $0.41 | | | | $0.43 | | | | $0.56 | | | | $0.65 | | | | $0.68 | |
Net realized and unrealized gain (loss) on
investments and foreign currency | | | (0.29 | ) | | | 0.60 | | | | 0.33 | | | | 0.52 | | | | 2.24 | |
Total from investment operations | | | $0.12 | | | | $1.03 | | | | $0.89 | | | | $1.17 | | | | $2.92 | |
| Less distributions declared to shareholders | | | | | | | | | | | | | | | | | |
From net investment income | | | $(0.44 | ) | | | $(0.51 | ) | | | $(0.66 | ) | | | $(0.71 | ) | | | $(0.69 | ) |
From net realized gain on investments | | | (0.04 | ) | | | — | | | | — | | | | — | | | | — | |
Total distributions declared to shareholders | | | $(0.48 | ) | | | $(0.51 | ) | | | $(0.66 | ) | | | $(0.71 | ) | | | $(0.69 | ) |
Net asset value, end of period (x) | | | $14.02 | | | | $14.38 | | | | $13.86 | | | | $13.63 | | | | $13.17 | |
Total return (%) (r)(s)(x) | | | 0.93 | | | | 7.56 | | | | 6.73 | | | | 9.11 | | | | 27.16 | |
Ratios (%) (to average net assets) and Supplemental data: | | | | | | | | | | | | | | | | | | | | |
Expenses before expense reductions (f) | | | 1.07 | | | | 1.08 | | | | 1.10 | | | | 1.10 | | | | 1.12 | |
Expenses after expense reductions (f) | | | 1.07 | | | | 1.08 | | | | 1.10 | | | | 1.10 | | | | 1.12 | |
Net investment income | | | 2.94 | | | | 3.03 | | | | 4.15 | | | | 4.85 | | | | 5.47 | |
Portfolio turnover | | | 31 | | | | 47 | | | | 47 | | | | 58 | | | | 91 | |
Net assets at end of period (000 omitted) | | | $77,290 | | | | $73,594 | | | | $112,858 | | | | $66,050 | | | | $65,141 | |
| |
| Class R3 | | Years ended 4/30 | |
| | | 2014 | | | 2013 | | | 2012 | | | 2011 | | | 2010 | |
Net asset value, beginning of period | | | $14.38 | | | | $13.86 | | | | $13.63 | | | | $13.17 | | | | $10.94 | |
| Income (loss) from investment operations | | | | | | | | | | | | | | | | | |
Net investment income (d) | | | $0.44 | | | | $0.46 | | | | $0.60 | | | | $0.68 | | | | $0.71 | |
Net realized and unrealized gain (loss) on
investments and foreign currency | | | (0.28 | ) | | | 0.61 | | | | 0.32 | | | | 0.52 | | | | 2.24 | |
Total from investment operations | | | $0.16 | | | | $1.07 | | | | $0.92 | | | | $1.20 | | | | $2.95 | |
| Less distributions declared to shareholders | | | | | | | | | | | | | | | | | |
From net investment income | | | $(0.48 | ) | | | $(0.55 | ) | | | $(0.69 | ) | | | $(0.74 | ) | | | $(0.72 | ) |
From net realized gain on investments | | | (0.04 | ) | | | — | | | | — | | | | — | | | | — | |
Total distributions declared to shareholders | | | $(0.52 | ) | | | $(0.55 | ) | | | $(0.69 | ) | | | $(0.74 | ) | | | $(0.72 | ) |
Net asset value, end of period (x) | | | $14.02 | | | | $14.38 | | | | $13.86 | | | | $13.63 | | | | $13.17 | |
Total return (%) (r)(s)(x) | | | 1.18 | | | | 7.82 | | | | 6.99 | | | | 9.38 | | | | 27.47 | |
Ratios (%) (to average net assets) and Supplemental data: | | | | | | | | | | | | | | | | | | | | |
Expenses before expense reductions (f) | | | 0.82 | | | | 0.83 | | | | 0.85 | | | | 0.85 | | | | 0.87 | |
Expenses after expense reductions (f) | | | 0.82 | | | | 0.83 | | | | 0.84 | | | | 0.85 | | | | 0.87 | |
Net investment income | | | 3.19 | | | | 3.26 | | | | 4.40 | | | | 5.11 | | | | 5.73 | |
Portfolio turnover | | | 31 | | | | 47 | | | | 47 | | | | 58 | | | | 91 | |
Net assets at end of period (000 omitted) | | | $63,349 | | | | $68,674 | | | | $63,099 | | | | $50,351 | | | | $49,555 | |
See Notes to Financial Statements
31
Financial Highlights – continued
| | | | | | | | | | | | | | | | | | | | |
| Class R4 | | Years ended 4/30 | |
| | | 2014 | | | 2013 | | | 2012 | | | 2011 | | | 2010 | |
Net asset value, beginning of period | | | $14.38 | | | | $13.87 | | | | $13.64 | | | | $13.18 | | | | $10.95 | |
| Income (loss) from investment operations | | | | | | | | | | | | | | | | | |
Net investment income (d) | | | $0.48 | | | | $0.49 | | | | $0.63 | | | | $0.72 | | | | $0.74 | |
Net realized and unrealized gain (loss) on
investments and foreign currency | | | (0.29 | ) | | | 0.60 | | | | 0.33 | | | | 0.52 | | | | 2.24 | |
Total from investment operations | | | $0.19 | | | | $1.09 | | | | $0.96 | | | | $1.24 | | | | $2.98 | |
| Less distributions declared to shareholders | | | | | | | | | | | | | | | | | |
From net investment income | | | $(0.51 | ) | | | $(0.58 | ) | | | $(0.73 | ) | | | $(0.78 | ) | | | $(0.75 | ) |
From net realized gain on investments | | | (0.04 | ) | | | — | | | | — | | | | — | | | | — | |
Total distributions declared to shareholders | | | $(0.55 | ) | | | $(0.58 | ) | | | $(0.73 | ) | | | $(0.78 | ) | | | $(0.75 | ) |
Net asset value, end of period (x) | | | $14.02 | | | | $14.38 | | | | $13.87 | | | | $13.64 | | | | $13.18 | |
Total return (%) (r)(s)(x) | | | 1.43 | | | | 8.01 | | | | 7.26 | | | | 9.65 | | | | 27.76 | |
Ratios (%) (to average net assets) and Supplemental data: | | | | | | | | | | | | | | | | | | | | |
Expenses before expense reductions (f) | | | 0.57 | | | | 0.58 | | | | 0.59 | | | | 0.60 | | | | 0.62 | |
Expenses after expense reductions (f) | | | 0.57 | | | | 0.58 | | | | 0.59 | | | | 0.60 | | | | 0.62 | |
Net investment income | | | 3.44 | | | | 3.46 | | | | 4.65 | | | | 5.34 | | | | 5.97 | |
Portfolio turnover | | | 31 | | | | 47 | | | | 47 | | | | 58 | | | | 91 | |
Net assets at end of period (000 omitted) | | | $139,924 | | | | $144,755 | | | | $82,516 | | | | $71,481 | | | | $61,604 | |
| | | | | | | | |
| Class R5 | | Years ended 4/30 | |
| | | 2014 | | | 2013 (i) | |
Net asset value, beginning of period | | | $14.38 | | | | $13.82 | |
| Income (loss) from investment operations | | | | | | | | |
Net investment income (d) | | | $0.49 | | | | $0.46 | |
Net realized and unrealized gain (loss) on investments and foreign currency | | | (0.29 | ) | | | 0.64 | |
Total from investment operations | | | $0.20 | | | | $1.10 | |
| Less distributions declared to shareholders | | | | | | | | |
From net investment income | | | $(0.53 | ) | | | $(0.54 | ) |
From net realized gain on investments | | | (0.04 | ) | | | — | |
Total distributions declared to shareholders | | | $(0.57 | ) | | | $(0.54 | ) |
Net asset value, end of period (x) | | | $14.01 | | | | $14.38 | |
Total return (%) (r)(s)(x) | | | 1.47 | | | | 8.06 | (n) |
Ratios (%) (to average net assets) and Supplemental data: | | | | | | | | |
Expenses before expense reductions (f) | | | 0.46 | | | | 0.49 | (a) |
Expenses after expense reductions (f) | | | 0.46 | | | | 0.49 | (a) |
Net investment income | | | 3.57 | | | | 3.52 | (a) |
Portfolio turnover | | | 31 | | | | 47 | |
Net assets at end of period (000 omitted) | | | $18,414 | | | | $110 | |
See Notes to Financial Statements
32
Financial Highlights – continued
| (d) | Per share data is based on average shares outstanding. |
| (f) | Ratios do not reflect reductions from fees paid indirectly, if applicable. |
| (i) | For the period from the class inception, June 1, 2012, through the stated period end. |
| (r) | Certain expenses have been reduced without which performance would have been lower. |
| (s) | From time to time the fund may receive proceeds from litigation settlements, without which performance would be lower. |
| (t) | Total returns do not include any applicable sales charges. |
| (x) | The net asset values per share and total returns have been calculated on net assets which include adjustments made in accordance with U.S. generally accepted accounting principles required at period end for financial reporting purposes. |
See Notes to Financial Statements
33
NOTES TO FINANCIAL STATEMENTS
(1) Business and Organization
MFS Bond Fund (the fund) is a diversified series of MFS Series Trust IX (the trust). The trust is organized as a Massachusetts business trust and is registered under the Investment Company Act of 1940, as amended, as an open-end management investment company.
The fund is an investment company and accordingly follows the investment company accounting and reporting guidance of the Financial Accounting Standards Board (FASB) Accounting Standard Codification Topic 946 Financial Services – Investment Companies.
(2) Significant Accounting Policies
General – The preparation of financial statements in conformity with U.S. generally accepted accounting principles requires management to make estimates and assumptions that affect the reported amounts of assets and liabilities, and disclosure of contingent assets and liabilities at the date of the financial statements and the reported amounts of increases and decreases in net assets from operations during the reporting period. Actual results could differ from those estimates. In the preparation of these financial statements, management has evaluated subsequent events occurring after the date of the fund’s Statement of Assets and Liabilities through the date that the financial statements were issued. The fund invests in high-yield securities rated below investment grade. Investments in high-yield securities involve greater degrees of credit and market risk than investments in higher-rated securities and tend to be more sensitive to economic conditions. The fund invests in foreign securities. Investments in foreign securities are vulnerable to the effects of changes in the relative values of the local currency and the U.S. dollar and to the effects of changes in each country’s legal, political, and economic environment.
In this reporting period, the fund adopted the disclosure provisions of FASB Accounting Standards Update 2011-11 (“ASU 2011-11”), Balance Sheet (Topic 210) – Disclosures about Offsetting Assets and Liabilities along with the related scope clarification provisions of FASB Accounting Standards Update 2013-01 (“ASU 2013-01”) entitled Balance Sheet (Topic 210) – Clarifying the Scope of Disclosures about Offsetting Assets and Liabilities. ASU 2011-11 is intended to enhance disclosures on the offsetting of financial assets and liabilities by requiring entities to disclose both gross and net information about financial instruments and transactions that are either offset in the statement of financial position or subject to an enforceable Master Netting Agreement or similar arrangement. ASU 2013-01 limits the scope of ASU 2011-11’s disclosure requirements on offsetting to financial assets and financial liabilities related to derivatives, repurchase and reverse repurchase agreements, and securities lending and securities borrowing transactions. The disclosures required by ASU 2011-11, to the extent applicable to the fund, have been included in the fund’s Significant Accounting Policies note under the captions for each of the fund’s in-scope financial instruments and transactions.
The fund’s accounting policy with respect to balance sheet offsetting is that, absent an event of default by the counterparty or a termination of the agreement, the ISDA Master Agreement does not result in an offset of reported amounts of financial assets
34
Notes to Financial Statements – continued
and financial liabilities in the Statement of Assets and Liabilities across transactions between the fund and the applicable counterparty. The fund’s right to setoff may be restricted or prohibited by the bankruptcy or insolvency laws of the particular jurisdiction to which a specific master netting agreement counterparty is subject. Balance sheet offsetting disclosures, to the extent applicable to the fund, have been included in the fund’s Significant Accounting Policies note under the captions for each of the fund’s in-scope financial instruments and transactions.
Investment Valuations – Debt instruments and floating rate loans (other than short-term instruments), including restricted debt instruments, are generally valued at an evaluated or composite bid as provided by a third-party pricing service. Short-term instruments with a maturity at issuance of 60 days or less generally are valued at amortized cost, which approximates market value. Open-end investment companies are generally valued at net asset value per share. Securities and other assets generally valued on the basis of information from a third-party pricing service may also be valued at a broker/dealer bid quotation. Values obtained from third-party pricing services can utilize both transaction data and market information such as yield, quality, coupon rate, maturity, type of issue, trading characteristics, and other market data. The values of foreign securities and other assets and liabilities expressed in foreign currencies are converted to U.S. dollars using the mean of bid and asked prices for rates provided by a third-party pricing service.
The Board of Trustees has delegated primary responsibility for determining or causing to be determined the value of the fund’s investments (including any fair valuation) to the adviser pursuant to valuation policies and procedures approved by the Board. If the adviser determines that reliable market quotations are not readily available, investments are valued at fair value as determined in good faith by the adviser in accordance with such procedures under the oversight of the Board of Trustees. Under the fund’s valuation policies and procedures, market quotations are not considered to be readily available for most types of debt instruments and floating rate loans and many types of derivatives. These investments are generally valued at fair value based on information from third-party pricing services. In addition, investments may be valued at fair value if the adviser determines that an investment’s value has been materially affected by events occurring after the close of the exchange or market on which the investment is principally traded (such as foreign exchange or market) and prior to the determination of the fund’s net asset value, or after the halting of trading of a specific security where trading does not resume prior to the close of the exchange or market on which the security is principally traded. The adviser generally relies on third-party pricing services or other information (such as the correlation with price movements of similar securities in the same or other markets; the type, cost and investment characteristics of the security; the business and financial condition of the issuer; and trading and other market data) to assist in determining whether to fair value and at what value to fair value an investment. The value of an investment for purposes of calculating the fund’s net asset value can differ depending on the source and method used to determine value. When fair valuation is used, the value of an investment used to determine the fund’s net asset value may differ from quoted or published prices for the same
35
Notes to Financial Statements – continued
investment. There can be no assurance that the fund could obtain the fair value assigned to an investment if it were to sell the investment at the same time at which the fund determines its net asset value per share.
Various inputs are used in determining the value of the fund’s assets or liabilities. These inputs are categorized into three broad levels. In certain cases, the inputs used to measure fair value may fall into different levels of the fair value hierarchy. In such cases, an investment’s level within the fair value hierarchy is based on the lowest level of input that is significant to the fair value measurement. The fund’s assessment of the significance of a particular input to the fair value measurement in its entirety requires judgment, and considers factors specific to the investment. Level 1 includes unadjusted quoted prices in active markets for identical assets or liabilities. Level 2 includes other significant observable market-based inputs (including quoted prices for similar securities, interest rates, prepayment speed, and credit risk). Level 3 includes unobservable inputs, which may include the adviser’s own assumptions in determining the fair value of investments. The following is a summary of the levels used as of April 30, 2014 in valuing the fund’s assets or liabilities:
| | | | | | | | | | | | | | | | |
| Investments at Value | | Level 1 | | | Level 2 | | | Level 3 | | | Total | |
| Non-U.S. Sovereign Debt | | | $— | | | | $12,497,603 | | | | $— | | | | $12,497,603 | |
| U.S. Corporate Bonds | | | — | | | | 2,132,418,784 | | | | — | | | | 2,132,418,784 | |
| Residential Mortgage-Backed Securities | | | — | | | | 35,080 | | | | — | | | | 35,080 | |
| Commercial Mortgage-Backed Securities | | | — | | | | 15,458,107 | | | | — | | | | 15,458,107 | |
| Asset-Backed Securities (including CDOs) | | | — | | | | 4,985,815 | | | | — | | | | 4,985,815 | |
| Foreign Bonds | | | — | | | | 295,176,847 | | | | — | | | | 295,176,847 | |
| Mutual Funds | | | 139,940,086 | | | | — | | | | — | | | | 139,940,086 | |
| Total Investments | | | $139,940,086 | | | | $2,460,572,236 | | | | $— | | | | $2,600,512,322 | |
For further information regarding security characteristics, see the Portfolio of Investments.
Foreign Currency Translation – Purchases and sales of foreign investments, income, and expenses are converted into U.S. dollars based upon currency exchange rates prevailing on the respective dates of such transactions or on the reporting date for foreign denominated receivables and payables. Gains and losses attributable to foreign currency exchange rates on sales of securities are recorded for financial statement purposes as net realized gains and losses on investments. Gains and losses attributable to foreign exchange rate movements on receivables, payables, income and expenses are recorded for financial statement purposes as foreign currency transaction gains and losses. That portion of both realized and unrealized gains and losses on investments that results from fluctuations in foreign currency exchange rates is not separately disclosed.
Indemnifications – Under the fund’s organizational documents, its officers and Trustees may be indemnified against certain liabilities and expenses arising out of the performance of their duties to the fund. Additionally, in the normal course of business,
36
Notes to Financial Statements – continued
the fund enters into agreements with service providers that may contain indemnification clauses. The fund’s maximum exposure under these agreements is unknown as this would involve future claims that may be made against the fund that have not yet occurred.
Investment Transactions and Income – Investment transactions are recorded on the trade date. Interest income is recorded on the accrual basis. All premium and discount is amortized or accreted for financial statement purposes in accordance with U.S. generally accepted accounting principles. Interest payments received in additional securities are recorded on the ex-interest date in an amount equal to the value of the security on such date. Debt obligations may be placed on non-accrual status or set to accrue at a rate of interest less than the contractual coupon when the collection of all or a portion of interest has become doubtful. Interest income for those debt obligations may be further reduced by the write-off of the related interest receivables when deemed uncollectible.
The fund may receive proceeds from litigation settlements. Any proceeds received from litigation involving portfolio holdings are reflected in the Statement of Operations in realized gain/loss if the security has been disposed of by the fund or in unrealized gain/loss if the security is still held by the fund. Any other proceeds from litigation not related to portfolio holdings are reflected as other income in the Statement of Operations.
Fees Paid Indirectly – The fund’s custody fee may be reduced according to an arrangement that measures the value of cash deposited with the custodian by the fund. This amount, for the year ended April 30, 2014, is shown as a reduction of total expenses in the Statement of Operations.
Tax Matters and Distributions – The fund intends to qualify as a regulated investment company, as defined under Subchapter M of the Internal Revenue Code, and to distribute all of its taxable income, including realized capital gains. As a result, no provision for federal income tax is required. The fund’s federal tax returns, when filed, will remain subject to examination by the Internal Revenue Service for a three year period. Management has analyzed the fund’s tax positions taken on federal and state tax returns for all open tax years and does not believe that there are any uncertain tax positions that require recognition of a tax liability. Foreign taxes, if any, have been accrued by the fund in the accompanying financial statements in accordance with the applicable foreign tax law. Foreign income taxes may be withheld by certain countries in which the fund invests. Additionally, capital gains realized by the fund on securities issued in or by certain foreign countries may be subject to capital gains tax imposed by those countries.
Distributions to shareholders are recorded on the ex-dividend date. Income and capital gain distributions are determined in accordance with income tax regulations, which may differ from U.S. generally accepted accounting principles. Certain capital accounts in the financial statements are periodically adjusted for permanent differences in order to reflect their tax character. These adjustments have no impact on net assets or net asset value per share. Temporary differences which arise from recognizing certain items of income, expense, gain or loss in different periods for financial statement and tax purposes will reverse at some time in the future. Distributions in excess of net
37
Notes to Financial Statements – continued
investment income or net realized gains are temporary overdistributions for financial statement purposes resulting from differences in the recognition or classification of income or distributions for financial statement and tax purposes.
Book/tax differences primarily relate to amortization and accretion of debt securities and treating a portion of the proceeds from redemptions as a distribution for tax purposes.
The tax character of distributions declared to shareholders for the last two fiscal years is as follows:
| | | | | | | | |
| | | 4/30/14 | | | 4/30/13 | |
| Ordinary income (including any short-term capital gains) | | | $93,943,452 | | | | $108,799,618 | |
| Long-term capital gains | | | 6,015,824 | | | | — | |
| Total distributions | | | $99,959,276 | | | | $108,799,618 | |
The federal tax cost and the tax basis components of distributable earnings were as follows:
| | | | |
| As of 4/30/14 | | | |
| Cost of investments | | | $2,525,637,628 | |
| Gross appreciation | | | 91,506,221 | |
| Gross depreciation | | | (16,631,527 | ) |
| Net unrealized appreciation (depreciation) | | | $74,874,694 | |
| Undistributed ordinary income | | | 5,371,520 | |
| Post-October capital loss deferral | | | (2,995,606 | ) |
| Other temporary differences | | | (7,938,919 | ) |
Multiple Classes of Shares of Beneficial Interest – The fund offers multiple classes of shares, which differ in their respective distribution and service fees. The fund’s income and common expenses are allocated to shareholders based on the value of settled shares outstanding of each class. The fund’s realized and unrealized gain (loss) are allocated to shareholders based on the daily net assets of each class. Dividends are declared separately for each class. Differences in per share dividend rates are generally due to differences in separate class expenses. Class B shares will convert to Class A
38
Notes to Financial Statements – continued
shares approximately eight years after purchase. The fund’s distributions declared to shareholders as reported in the Statements of Changes in Net Assets are presented by class as follows:
| | | | | | | | | | | | | | | | |
| | | From net investment
income | | | From net realized gain on
investments | |
| | | Year
ended
4/30/14 | | | Year
ended
4/30/13 (i) | | | Year
ended
4/30/14 | | | Year
ended
4/30/13 (i) | |
| Class A | | | $53,148,200 | | | | $61,809,378 | | | | $3,871,277 | | | | $— | |
| Class B | | | 2,582,791 | | | | 3,363,369 | | | | 239,402 | | | | — | |
| Class C | | | 8,682,243 | | | | 11,230,629 | | | | 781,584 | | | | — | |
| Class I | | | 18,422,661 | | | | 21,903,996 | | | | 1,190,840 | | | | — | |
| Class R1 | | | 420,365 | | | | 308,039 | | | | 56,140 | | | | — | |
| Class R2 | | | 2,348,500 | | | | 2,499,375 | | | | 197,280 | | | | — | |
| Class R3 | | | 2,202,412 | | | | 2,644,011 | | | | 161,162 | | | | — | |
| Class R4 | | | 5,036,516 | | | | 5,036,770 | | | | 341,464 | | | | — | |
| Class R5 | | | 268,277 | | | | 4,051 | | | | 8,162 | | | | — | |
| Total | | | $93,111,965 | | | | $108,799,618 | | | | $6,847,311 | | | | $— | |
| (i) | For Class R5, the period is from inception, June 1, 2012, through the stated period end. |
(3) Transactions with Affiliates
Investment Adviser – The fund has an investment advisory agreement with MFS to provide overall investment management and related administrative services and facilities to the fund. The management fee is computed daily and paid monthly at the following annual rates:
| | | | |
| First $1.1 billion of average daily net assets | | | 0.39 | % |
| Average daily net assets in excess of $1.1 billion | | | 0.38 | % |
MFS has agreed in writing to reduce its management fee by a specified amount if certain MFS mutual fund assets exceed thresholds agreed to by MFS and the fund’s Board of Trustees. For the year ended April 30, 2014, this management fee reduction amounted to $50,665, which is included in the reduction of total expenses in the Statement of Operations. The management fee incurred for the year ended April 30, 2014 was equivalent to an annual effective rate of 0.38% of the fund’s average daily net assets.
Distributor – MFS Fund Distributors, Inc. (MFD), a wholly-owned subsidiary of MFS, as distributor, received $1,219,506 for the year ended April 30, 2014, as its portion of the initial sales charge on sales of Class A shares of the fund.
The Board of Trustees has adopted a distribution plan for certain share classes pursuant to Rule 12b-1 of the Investment Company Act of 1940.
The fund’s distribution plan provides that the fund will pay MFD for services provided by MFD and financial intermediaries in connection with the distribution and servicing of certain share classes. One component of the plan is a distribution fee paid to MFD and another component of the plan is a service fee paid to MFD. MFD may subsequently pay all, or a portion, of the distribution and/or service fees to financial intermediaries.
39
Notes to Financial Statements – continued
Distribution Plan Fee Table:
| | | | | | | | | | | | |
| | | Distribution
Fee Rate (d) | | Service
Fee Rate (d) | | Total
Distribution
Plan (d) | | Annual
Effective
Rate (e) | | Distribution
and Service
Fee | |
| Class A | | — | | 0.25% | | 0.25% | | 0.25% | | | $3,855,457 | |
| Class B | | 0.75% | | 0.25% | | 1.00% | | 1.00% | | | 960,029 | |
| Class C | | 0.75% | | 0.25% | | 1.00% | | 1.00% | | | 3,235,715 | |
| Class R1 | | 0.75% | | 0.25% | | 1.00% | | 1.00% | | | 151,824 | |
| Class R2 | | 0.25% | | 0.25% | | 0.50% | | 0.50% | | | 365,482 | |
| Class R3 | | — | | 0.25% | | 0.25% | | 0.25% | | | 159,559 | |
| Total Distribution and Service Fees | | | $8,728,066 | |
| (d) | In accordance with the distribution plan for certain classes, the fund pays distribution and/or service fees equal to these annual percentage rates of each class’s average daily net assets. The distribution and service fee rates disclosed by class represent the current rates in effect at the end of the reporting period. Any rate changes, if applicable, are detailed below. |
| (e) | The annual effective rates represent actual fees incurred under the distribution plan for the year ended April 30, 2014 based on each class’s average daily net assets. MFD has voluntarily agreed to rebate a portion of each class’s 0.25% service fee attributable to accounts for which MFD retains the 0.25% service fee except for accounts attributable to MFS or its affiliates’ seed money. For the year ended April 30, 2014, this rebate amounted to $67,227, $193, $332, and $776 for Class A, Class B, Class C, and Class R3, respectively, and is included in the reduction of total expenses in the Statement of Operations. |
Certain Class A shares are subject to a contingent deferred sales charge (CDSC) in the event of a shareholder redemption within 18 months of purchase for shares purchased on or after August 1, 2012, and within 24 months of purchase for shares purchased prior to August 1, 2012. Class C shares are subject to a CDSC in the event of a shareholder redemption within 12 months of purchase. Class B shares are subject to a CDSC in the event of a shareholder redemption within six years of purchase. All contingent deferred sales charges are paid to MFD and during the year ended April 30, 2014, were as follows:
| | | | |
| | | Amount | |
| Class A | | | $158,545 | |
| Class B | | | 229,268 | |
| Class C | | | 99,083 | |
Shareholder Servicing Agent – MFS Service Center, Inc. (MFSC), a wholly-owned subsidiary of MFS, receives a fee from the fund for its services as shareholder servicing agent calculated as a percentage of the average daily net assets of the fund as determined periodically under the supervision of the fund’s Board of Trustees. For the year ended April 30, 2014, the fee was $433,875, which equated to 0.0157% annually of the fund’s average daily net assets. MFSC also receives payment from the fund for out-of-pocket expenses, sub-accounting and other shareholder servicing costs which may be paid to affiliated and unaffiliated service providers. Class R5 shares do not incur sub-accounting fees. For the year ended April 30, 2014, these out-of-pocket expenses, sub-accounting and other shareholder servicing costs amounted to $3,163,481.
Administrator – MFS provides certain financial, legal, shareholder communications, compliance, and other administrative services to the fund. Under an administrative
40
Notes to Financial Statements – continued
services agreement, the fund partially reimburses MFS the costs incurred to provide these services. The fund is charged an annual fixed amount of $17,500 plus a fee based on average daily net assets. The administrative services fee incurred for the year ended April 30, 2014 was equivalent to an annual effective rate of 0.0123% of the fund’s average daily net assets.
Trustees’ and Officers’ Compensation – The fund pays compensation to independent Trustees in the form of a retainer, attendance fees, and additional compensation to Board and Committee chairpersons. The fund does not pay compensation directly to Trustees or officers of the fund who are also officers of the investment adviser, all of whom receive remuneration for their services to the fund from MFS. Certain officers and Trustees of the fund are officers or directors of MFS, MFD, and MFSC.
Prior to December 31, 2001, the fund had an unfunded defined benefit plan (“DB plan”) for independent Trustees. As of December 31, 2001, the Board took action to terminate the DB plan with respect to then-current and any future independent Trustees, such that the DB plan covers only certain of those former independent Trustees who retired on or before December 31, 2001. Effective January 1, 2002, accrued benefits under the DB plan for then-current independent Trustees who continued were credited to an unfunded retirement deferral plan (the “Retirement Deferral plan”), which was established for and exists solely with respect to these credited amounts, and is not available for other deferrals by these or other independent Trustees. Although the Retirement Deferral plan is unfunded, amounts deferred under the plan are periodically adjusted for investment experience as if they had been invested in shares of the fund. The DB plan resulted in a pension expense of $1,972 and the Retirement Deferral plan resulted in an expense of $539. Both amounts are included in independent Trustees’ compensation for the year ended April 30, 2014. The liability for deferred retirement benefits payable to certain independent Trustees under both plans amounted to $43,177 at April 30, 2014, and is included in “Payable for independent Trustees’ compensation” in the Statement of Assets and Liabilities.
Other – This fund and certain other funds managed by MFS (the funds) have entered into services agreements (the Agreements) which provide for payment of fees by the funds to Tarantino LLC and Griffin Compliance LLC in return for the provision of services of an Independent Chief Compliance Officer (ICCO) and Assistant ICCO, respectively, for the funds. The ICCO and Assistant ICCO are officers of the funds and the sole members of Tarantino LLC and Griffin Compliance LLC, respectively. The funds can terminate the Agreements with Tarantino LLC and Griffin Compliance LLC at any time under the terms of the Agreements. For the year ended April 30, 2014, the aggregate fees paid by the fund to Tarantino LLC and Griffin Compliance LLC were $16,144 and are included in “Miscellaneous” expense in the Statement of Operations. MFS has agreed to reimburse the fund for a portion of the payments made by the fund in the amount of $5,746, which is included in the reduction of total expenses in the Statement of Operations. Additionally, MFS has agreed to bear all expenses associated with office space, other administrative support, and supplies provided to the ICCO and Assistant ICCO.
The fund invests in the MFS Institutional Money Market Portfolio which is managed by MFS and seeks current income consistent with preservation of capital and liquidity.
41
Notes to Financial Statements – continued
Income earned on this investment is included in “Dividends from underlying affiliated funds” in the Statement of Operations. This money market fund does not pay a management fee to MFS.
On May 31, 2012, MFS purchased 7,236 shares of Class R5 for an aggregate amount of $100,000.
(4) Portfolio Securities
Purchases and sales of investments, other than short-term obligations, were as follows:
| | | | | | | | |
| | | Purchases | | | Sales | |
| U.S. Government securities | | | $26,194,134 | | | | $27,255,737 | |
| Investments (non-U.S. Government securities) | | | $783,493,314 | | | | $1,377,765,068 | |
(5) Shares of Beneficial Interest
The fund’s Declaration of Trust permits the Trustees to issue an unlimited number of full and fractional shares of beneficial interest. Transactions in fund shares were as follows:
| | | | | | | | | | | | | | | | |
| | | Year ended
4/30/14 | | | Year ended
4/30/13 (i) | |
| | | Shares | | | Amount | | | Shares | | | Amount | |
| Shares sold | | | | | | | | | | | | | | | | |
Class A | | | 24,759,690 | | | | $343,206,554 | | | | 51,565,173 | | | | $729,587,077 | |
Class B | | | 446,283 | | | | 6,190,909 | | | | 2,786,462 | | | | 39,092,197 | |
Class C | | | 2,936,389 | | | | 40,649,612 | | | | 13,341,388 | | | | 187,844,986 | |
Class I | | | 12,777,304 | | | | 176,816,182 | | | | 33,709,066 | | | | 477,244,469 | |
Class R1 | | | 1,310,320 | | | | 18,045,204 | | | | 213,324 | | | | 3,001,252 | |
Class R2 | | | 2,113,552 | | | | 29,226,264 | | | | 2,164,750 | | | | 30,632,152 | |
Class R3 | | | 1,197,626 | | | | 16,502,944 | | | | 1,770,089 | | | | 25,048,300 | |
Class R4 | | | 2,212,960 | | | | 30,612,467 | | | | 7,579,598 | | | | 106,499,050 | |
Class R5 | | | 1,390,309 | | | | 19,168,868 | | | | 7,511 | | | | 103,860 | |
| | | 49,144,433 | | | | $680,419,004 | | | | 113,137,361 | | | | $1,599,053,343 | |
| | | | |
| Shares issued to shareholders in reinvestment of distributions | | | | | | | | | | | | | | | | |
Class A | | | 3,806,918 | | | | $52,628,224 | | | | 3,906,110 | | | | $55,361,501 | |
Class B | | | 189,931 | | | | 2,619,314 | | | | 213,972 | | | | 3,024,529 | |
Class C | | | 525,823 | | | | 7,242,351 | | | | 557,364 | | | | 7,873,429 | |
Class I | | | 1,032,533 | | | | 14,269,198 | | | | 976,810 | | | | 13,861,152 | |
Class R1 | | | 34,364 | | | | 474,437 | | | | 21,830 | | | | 307,940 | |
Class R2 | | | 174,120 | | | | 2,407,755 | | | | 165,716 | | | | 2,346,490 | |
Class R3 | | | 170,907 | | | | 2,362,624 | | | | 186,591 | | | | 2,643,360 | |
Class R4 | | | 388,839 | | | | 5,377,959 | | | | 354,870 | | | | 5,036,770 | |
Class R5 | | | 19,889 | | | | 276,439 | | | | 285 | | | | 4,051 | |
| | | 6,343,324 | | | | $87,658,301 | | | | 6,383,548 | | | | $90,459,222 | |
42
Notes to Financial Statements – continued
| | | | | | | | | | | | | | | | |
| | | Year ended
4/30/14 | | | Year ended
4/30/13 (i) | |
| | | Shares | | | Amount | | | Shares | | | Amount | |
| Shares reacquired | | | | | | | | | | | | | | | | |
Class A | | | (45,113,417 | ) | | | $(622,809,502 | ) | | | (30,097,466 | ) | | | $(426,940,848 | ) |
Class B | | | (2,273,542 | ) | | | (31,308,059 | ) | | | (1,630,664 | ) | | | (23,032,523 | ) |
Class C | | | (12,505,742 | ) | | | (171,810,327 | ) | | | (5,394,843 | ) | | | (76,227,956 | ) |
Class I | | | (28,352,689 | ) | | | (391,125,550 | ) | | | (14,361,648 | ) | | | (203,662,129 | ) |
Class R1 | | | (408,018 | ) | | | (5,622,560 | ) | | | (418,811 | ) | | | (5,907,123 | ) |
Class R2 | | | (1,891,749 | ) | | | (26,167,164 | ) | | | (5,356,107 | ) | | | (74,793,827 | ) |
Class R3 | | | (1,625,073 | ) | | | (22,422,443 | ) | | | (1,734,246 | ) | | | (24,552,717 | ) |
Class R4 | | | (2,686,117 | ) | | | (37,149,430 | ) | | | (3,822,042 | ) | | | (53,825,230 | ) |
Class R5 | | | (103,437 | ) | | | (1,436,282 | ) | | | (150 | ) | | | (2,128 | ) |
| | | (94,959,784 | ) | | | $(1,309,851,317 | ) | | | (62,815,977 | ) | | | $(888,944,481 | ) |
| | | | |
| Net change | | | | | | | | | | | | | | | | |
Class A | | | (16,546,809 | ) | | | $(226,974,724 | ) | | | 25,373,817 | | | | $358,007,730 | |
Class B | | | (1,637,328 | ) | | | (22,497,836 | ) | | | 1,369,770 | | | | 19,084,203 | |
Class C | | | (9,043,530 | ) | | | (123,918,364 | ) | | | 8,503,909 | | | | 119,490,459 | |
Class I | | | (14,542,852 | ) | | | (200,040,170 | ) | | | 20,324,228 | | | | 287,443,492 | |
Class R1 | | | 936,666 | | | | 12,897,081 | | | | (183,657 | ) | | | (2,597,931 | ) |
Class R2 | | | 395,923 | | | | 5,466,855 | | | | (3,025,641 | ) | | | (41,815,185 | ) |
Class R3 | | | (256,540 | ) | | | (3,556,875 | ) | | | 222,434 | | | | 3,138,943 | |
Class R4 | | | (84,318 | ) | | | (1,159,004 | ) | | | 4,112,426 | | | | 57,710,590 | |
Class R5 | | | 1,306,761 | | | | 18,009,025 | | | | 7,646 | | | | 105,783 | |
| | | (39,472,027 | ) | | | $(541,774,012 | ) | | | 56,704,932 | | | | $800,568,084 | |
| (i) | For Class R5, the period is from inception, June 1, 2012, through the stated period end. |
(6) Line of Credit
The fund and certain other funds managed by MFS participate in a $1.1 billion unsecured committed line of credit, subject to a $1 billion sublimit, provided by a syndication of banks under a credit agreement. Borrowings may be made for temporary financing needs. Interest is charged to each fund, based on its borrowings, generally at a rate equal to the higher of the Federal Reserve funds rate or one month LIBOR plus an agreed upon spread. A commitment fee, based on the average daily, unused portion of the committed line of credit, is allocated among the participating funds at the end of each calendar quarter. In addition, the fund and other funds managed by MFS have established unsecured uncommitted borrowing arrangements with certain banks for temporary financing needs. Interest is charged to each fund, based on its borrowings, at a rate equal to the Federal Reserve funds rate plus an agreed upon spread. For the year ended April 30, 2014, the fund’s commitment fee and interest expense were $12,512 and $0, respectively, and are included in “Miscellaneous” expense in the Statement of Operations.
43
Notes to Financial Statements – continued
(7) Transactions in Underlying Affiliated Funds-Affiliated Issuers
An affiliated issuer may be considered one in which the fund owns 5% or more of the outstanding voting securities, or a company which is under common control. For the purposes of this report, the fund assumes the following to be an affiliated issuer:
| | | | | | | | | | | | | | | | |
| Underlying Affiliated Fund | | Beginning Shares/Par Amount | | | Acquisitions Shares/Par Amount | | | Dispositions Shares/Par Amount | | | Ending Shares/Par Amount | |
MFS Institutional Money
Market Portfolio | | | 104,114,588 | | | | 950,825,438 | | | | (914,999,940 | ) | | | 139,940,086 | |
| | | | |
| Underlying Affiliated Fund | | Realized Gain (Loss) | | | Capital Gain Distributions | | | Dividend Income | | | Ending Value | |
MFS Institutional Money
Market Portfolio | | | $— | | | | $— | | | | $123,528 | | | | $139,940,086 | |
44
REPORT OF INDEPENDENT REGISTERED PUBLIC ACCOUNTING FIRM
To the Board of Trustees of MFS Series Trust IX and the Shareholders of MFS Bond Fund:
We have audited the accompanying statement of assets and liabilities, including the portfolio of investments, of MFS Bond Fund (one of the series of MFS Series Trust IX) (the “Fund”) as of April 30, 2014, and the related statement of operations for the year then ended, the statements of changes in net assets for each of the two years in the period then ended, and the financial highlights for each of the periods presented. These financial statements and financial highlights are the responsibility of the Fund’s management. Our responsibility is to express an opinion on these financial statements and financial highlights based on our audits.
We conducted our audits in accordance with the standards of the Public Company Accounting Oversight Board (United States). Those standards require that we plan and perform the audit to obtain reasonable assurance about whether the financial statements and financial highlights are free of material misstatement. The Fund is not required to have, nor were we engaged to perform, an audit of its internal control over financial reporting. Our audits included consideration of internal control over financial reporting as a basis for designing audit procedures that are appropriate in the circumstances, but not for the purpose of expressing an opinion on the effectiveness of the Fund’s internal control over financial reporting. Accordingly, we express no such opinion. An audit also includes examining, on a test basis, evidence supporting the amounts and disclosures in the financial statements, assessing the accounting principles used and significant estimates made by management, as well as evaluating the overall financial statement presentation. Our procedures included confirmation of securities owned as of April 30, 2014, by correspondence with the custodian and brokers; where replies were not received from brokers, we performed other auditing procedures. We believe that our audits provide a reasonable basis for our opinion.
In our opinion, the financial statements and financial highlights referred to above present fairly, in all material respects, the financial position of MFS Bond Fund as of April 30, 2014, the results of its operations for the year then ended, the changes in its net assets for each of the two years in the period then ended, and the financial highlights for each of the periods presented, in conformity with accounting principles generally accepted in the United States of America.
DELOITTE & TOUCHE LLP
Boston, Massachusetts
June 17, 2014
45
TRUSTEES AND OFFICERS — IDENTIFICATION AND BACKGROUND
The Trustees and Officers of the Trust, as of June 1, 2014, are listed below, together with their principal occupations during the past five years. (Their titles may have varied during that period.) The address of each Trustee and Officer is 111 Huntington Avenue, Boston, Massachusetts 02199-7618. It is expected that the Board will appoint Mr. Timothy M. Fagan as Chief Compliance Officer of the MFS Funds on November 1, 2014.
| | | | | | | | |
Name, Age | | Position(s) Held with Fund | | Trustee/Officer
Since (h) | | Principal
Occupations During the Past Five Years | | Other Directorships (j) |
| INTERESTED TRUSTEES |
Robert J. Manning (k) (age 50) | | Trustee | | February 2004 | | Massachusetts Financial Services Company, Chairman, Chief Executive Officer and Director; President (until 2009); Chief Investment Officer (until 2010) | | N/A |
Robin A. Stelmach (k) (age 52) | | Trustee | | January 2014 | | Massachusetts Financial Services Company, Executive Vice President and Chief Operating Officer | | N/A |
| INDEPENDENT TRUSTEES |
David H. Gunning
(age 72) | | Trustee and Chair of Trustees | | January 2004 | | Private investor | | Lincoln Electric Holdings, Inc. (welding equipment manufacturer), Director; Development Alternatives, Inc. (consulting), Director/Non-Executive Chairman |
Steven E. Buller (age 62) | | Trustee | | February 2014 | | Chairman, Financial Accounting Standards Advisory Council; Standing Advisory Group, Public Company Accounting Oversight Board, Member; BlackRock, Inc. (investment management), Managing Director (until 2014), BlackRock Finco (investment management), UK, Director (until 2014) | | N/A |
46
Trustees and Officers – continued
| | | | | | | | |
Name, Age | | Position(s) Held with Fund | | Trustee/Officer
Since (h) | | Principal
Occupations During the Past Five Years | | Other Directorships (j) |
Robert E. Butler
(age 72) | | Trustee | | January 2006 | | Consultant – investment company industry regulatory and compliance matters | | N/A |
Maureen R. Goldfarb (age 59) | | Trustee | | January 2009 | | Private investor | | N/A |
William R. Gutow
(age 72) | | Trustee | | December 1993 | | Private investor and real estate consultant; Capitol Entertainment Management Company (video franchise), Vice Chairman | | Texas Donuts (donut franchise), Vice Chairman (until 2010) |
Michael Hegarty
(age 69) | | Trustee | | December 2004 | | Private investor | | Brookfield Office Properties, Inc. (real estate), Director; Rouse Properties Inc. (real estate), Director; Capmark Financial Group Inc. (real estate), Director |
John P. Kavanaugh (age 59) | | Trustee | | January 2009 | | Private investor | | N/A |
Maryanne L. Roepke (age 58) | | Trustee | | May 2014 | | American Century Investments (investment management), Senior Vice President and Chief Compliance Officer (until 2014) | | N/A |
Laurie J. Thomsen
(age 56) | | Trustee | | March 2005 | | Private investor; New Profit, Inc. (venture philanthropy), Executive Partner (until 2010) | | The Travelers Companies (insurance), Director |
Robert W. Uek
(age 73) | | Trustee | | January 2006 | | Consultant to investment company industry | | N/A |
| OFFICERS | | | | | | | | |
John M. Corcoran (k) (age 49) | | President | | October 2008 | | Massachusetts Financial Services Company, Senior Vice President | | N/A |
Christopher R. Bohane (k) (age 40) | | Assistant Secretary and Assistant Clerk | | July 2005 | | Massachusetts Financial Services Company, Vice President and Assistant General Counsel | | N/A |
47
Trustees and Officers – continued
| | | | | | | | |
Name, Age | | Position(s) Held with Fund | | Trustee/Officer
Since (h) | | Principal
Occupations During the Past Five Years | | Other Directorships (j) |
Kino Clark (k) (age 45) | | Assistant Treasurer | | January 2012 | | Massachusetts Financial Services Company, Vice President | | N/A |
Thomas H. Connors (k) (age 54) | | Assistant Secretary and Assistant Clerk | | September 2012 | | Massachusetts Financial Services Company, Vice President and Senior Counsel; Deutsche Investment Management Americas Inc. (financial service provider), Director and Senior Counsel (until 2012) | | N/A |
Ethan D. Corey (k)
(age 50) | | Assistant
Secretary and Assistant Clerk | | July 2005 | | Massachusetts Financial Services Company, Senior Vice President and Associate General Counsel | | N/A |
David L. DiLorenzo (k) (age 45) | | Treasurer | | July 2005 | | Massachusetts Financial Services Company, Senior Vice President | | N/A |
Brian E. Langenfeld (k) (age 41) | | Assistant
Secretary and Assistant Clerk | | June 2006 | | Massachusetts Financial Services Company, Vice President and Senior Counsel | | N/A |
Susan S. Newton (k) (age 64) | | Assistant
Secretary and Assistant Clerk | | May 2005 | | Massachusetts Financial Services Company, Senior Vice President and Associate General Counsel | | N/A |
Susan A. Pereira (k)
(age 43) | | Assistant
Secretary and Assistant Clerk | | July 2005 | | Massachusetts Financial Services Company, Vice President and Senior Counsel | | N/A |
Kasey L. Phillips (k) (age 43) | | Assistant Treasurer | | September 2012 | | Massachusetts Financial Services Company, Vice President; Wells Fargo Funds Management, LLC, Senior Vice President, Fund Treasurer (until 2012) | | N/A |
48
Trustees and Officers – continued
| | | | | | | | |
Name, Age | | Position(s) Held with Fund | | Trustee/Officer
Since (h) | | Principal
Occupations During the Past Five Years | | Other Directorships (j) |
Mark N. Polebaum (k) (age 62) | | Secretary and
Clerk | | January 2006 | | Massachusetts Financial Services Company, Executive Vice President, General Counsel and Secretary | | N/A |
Frank L. Tarantino (l)
(age 70) | | Independent
Chief Compliance Officer | | June 2004 | | Tarantino LLC (provider of compliance services), Principal | | N/A |
Richard S. Weitzel (k)
(age 43) | | Assistant Secretary and Assistant Clerk | | October 2007 | | Massachusetts Financial Services Company, Senior Vice President and Associate General Counsel | | N/A |
James O. Yost (k)
(age 53) | | Deputy Treasurer | | September 1990 | | Massachusetts Financial Services Company, Senior Vice President | | N/A |
| (h) | Date first appointed to serve as Trustee/officer of an MFS Fund. Each Trustee has served continuously since appointment unless indicated otherwise. For the period from December 15, 2004 until February 22, 2005, Mr. Manning served as Advisory Trustee. For the period October 2008, until January 2012, Mr. Corcoran served as Treasurer of the Funds. Prior to January 2012, Messrs. DiLorenzo and Yost served as Assistant Treasurers of the Funds. |
| (j) | Directorships or trusteeships of companies required to report to the Securities and Exchange Commission (i.e., “public companies”). |
| (k) | “Interested person” of the Trust within the meaning of the Investment Company Act of 1940 (referred to as the 1940 Act), which is the principal federal law governing investment companies like the fund, as a result of position with MFS. The address of MFS is 111 Huntington Avenue, Boston, Massachusetts 02199-7618. |
| (l) | Mr. Tarantino will retire as Independent Chief Compliance Officer of the MFS Funds on October 31, 2014. It is expected that Mr. Tarantino will continue after that date as an Independent Senior Officer of the MFS Funds. |
Each Trustee (except Ms. Stelmach, Mr. Buller and Ms. Roepke) has been elected by shareholders and each Trustee and officer holds office until his or her successor is chosen and qualified or until his or her earlier death, resignation, retirement or removal. The Trust does not hold annual meetings for the purpose of electing Trustees, and Trustees are not elected for fixed terms. Messrs. Butler, Kavanaugh, Uek and Mses. Thomsen and Roepke are members of the Trust’s Audit Committee.
Each of the Fund’s Trustees and officers holds comparable positions with certain other funds of which MFS or a subsidiary is the investment adviser or distributor, and, in the case of the officers, with certain affiliates of MFS. As of January 1, 2014, the Trustees served as board members of 142 funds within the MFS Family of Funds.
49
Trustees and Officers – continued
The Statement of Additional Information for the Fund includes further information about the Trustees and is available without charge upon request by calling 1-800-225-2606.
| | |
| Investment Adviser | | Custodian |
Massachusetts Financial Services Company
111 Huntington Avenue
Boston, MA 02199-7618 | | JPMorgan Chase Bank, NA 4 Metrotech Center New York, NY 11245 |
| Distributor | | Independent Registered Public Accounting Firm |
MFS Fund Distributors, Inc.
111 Huntington Avenue
Boston, MA 02199-7618 | | Deloitte & Touche LLP 200 Berkeley Street Boston, MA 02116 |
| Portfolio Managers | | |
Richard Hawkins Robert Persons | | |
50
BOARD REVIEW OF INVESTMENT ADVISORY AGREEMENT
A discussion regarding the Board’s most recent review and renewal of the fund’s Investment Advisory Agreement with MFS is available by clicking on the fund’s name under “Mutual Funds” in the “Products” section of the MFS Web site (mfs.com).
PROXY VOTING POLICIES AND INFORMATION
MFS votes proxies on behalf of the fund pursuant to proxy voting policies and procedures that are available without charge, upon request, by calling 1-800-225-2606, by visiting the Proxy Voting section of mfs.com or by visiting the SEC’s Web site at http://www.sec.gov.
Information regarding how the fund voted proxies relating to portfolio securities during the twelve-month period ended June 30, 2013 is available without charge by visiting the Proxy Voting section of mfs.com or by visiting the SEC’s Web site at http://www.sec.gov.
QUARTERLY PORTFOLIO DISCLOSURE
The fund will file a complete schedule of portfolio holdings with the Securities and Exchange Commission (the Commission) for the first and third quarters of each fiscal year on Form N-Q. A shareholder can obtain the quarterly portfolio holdings report at mfs.com. The fund’s Form N-Q is also available on the EDGAR database on the Commission’s Internet Web site at http://www.sec.gov, and may be reviewed and copied at the:
Public Reference Room
Securities and Exchange Commission
100 F Street, NE, Room 1580
Washington, D.C. 20549
Information on the operation of the Public Reference Room may be obtained by calling the Commission at 1-800-SEC-0330. Copies of the fund’s Form N-Q also may be obtained, upon payment of a duplicating fee, by electronic request at the following e-mail address: publicinfo@sec.gov or by writing the Public Reference Section at the above address.
FURTHER INFORMATION
From time to time, MFS may post important information about the fund or the MFS funds on the MFS web site (mfs.com). This information is available by visiting the “Commentary & Announcements” and “Market Outlooks” sections of mfs.com or by clicking on the fund’s name under “Mutual Funds” in the “Products” section of mfs.com.
FEDERAL TAX INFORMATION (unaudited)
The fund will notify shareholders of amounts for use in preparing 2014 income tax forms in January 2015.
The following information is provided pursuant to provisions of the Internal Revenue Code.
The fund designates $9,121,000 as capital gain dividends paid during the fiscal year.
51
rev. 3/11
| | | | |
| | | |
FACTS | | WHAT DOES MFS DO WITH YOUR PERSONAL INFORMATION? | |  |
| | |
| Why? | | Financial companies choose how they share your personal information. Federal law gives consumers the right to limit some but not all sharing. Federal law also requires us to tell you how we collect, share, and protect your personal information. Please read this notice carefully to understand what we do. |
| | |
| What? | | The types of personal information we collect and share depend on the product or service you have with us. This information can include: • Social Security number and account balances • Account transactions and transaction history • Checking account information and wire transfer instructions When you are no longer our customer, we continue to share your information as described in this notice. |
| | |
| How? | | All financial companies need to share customers’ personal information to run their everyday business. In the section below, we list the reasons financial companies can share their customers’ personal information; the reasons MFS chooses to share; and whether you can limit this sharing. |
| | | | |
Reasons we can share your
personal information | | Does MFS
share? | | Can you limit
this sharing? |
For our everyday business purposes – such as to process your transactions, maintain your account(s), respond to court orders and legal investigations, or report to credit bureaus | | Yes | | No |
For our marketing purposes – to offer our products and services to you | | No | | We don’t share |
| For joint marketing with other financial companies | | No | | We don’t share |
For our affiliates’ everyday business purposes – information about your transactions and experiences | | No | | We don’t share |
For our affiliates’ everyday business purposes – information about your creditworthiness | | No | | We don’t share |
| For nonaffiliates to market to you | | No | | We don’t share |
| | |
| Questions? | | Call 800-225-2606 or go to mfs.com. |
52
| | |
| Who we are |
| Who is providing this notice? | | MFS Funds, MFS Investment Management, MFS Institutional Advisors, Inc., MFS Fund Distributors, Inc., MFS Heritage Trust Company, and MFS Service Center, Inc. |
| | |
| What we do |
| How does MFS protect my personal information? | | To protect your personal information from unauthorized access and use, we use security measures that comply with federal law. These measures include procedural, electronic, and physical safeguards for the protection of the personal information we collect about you. |
| How does MFS collect my personal information? | | We collect your personal information, for example, when you •open an account or provide account information •direct us to buy securities or direct us to sell your securities •make a wire transfer We also collect your personal information from others, such as credit bureaus, affiliates and other companies. |
| Why can’t I limit all sharing? | | Federal law gives you the right to limit only •sharing for affiliates’ everyday business purposes – information about your creditworthiness •affiliates from using your information to market to you •sharing for nonaffiliates to market to you State laws and individual companies may give you additional rights to limit sharing. |
| | |
| Definitions |
| Affiliates | | Companies related by common ownership or control. They can be financial and nonfinancial companies. •MFS does not share personal information with affiliates, except for everyday business purposes as described on page one of this notice. |
| Nonaffiliates | | Companies not related by common ownership or control. They can be financial and nonfinancial companies. •MFS does not share with nonaffiliates so they can market to you. |
| Joint Marketing | | A formal agreement between nonaffiliated financial companies that together market financial products or services to you. •MFS doesn’t jointly market. |
| | |
| Other important information |
| If you own an MFS product or receive an MFS service in the name of a third party such as a bank or broker-dealer, their privacy policy may apply to you instead of ours. |
53
Save paper with eDelivery.

| MFS® will send you prospectuses, |
reports, and proxies directly via e-mail so you will get information faster with less mailbox clutter.
To sign up:
1. Go to mfs.com.
2. Log in via MFS® Access.
3. Select eDelivery.
If you own your MFS fund shares through a financial institution or a retirement plan, MFS® TALK, MFS® Access, or eDelivery may not be available to you.
CONTACT
WEB SITE
mfs.com
MFS TALK
1-800-637-8255
24 hours a day
ACCOUNT SERVICE AND LITERATURE
Shareholders
1-800-225-2606
Financial advisors
1-800-343-2829
Retirement plan services
1-800-637-1255
MAILING ADDRESS
MFS Service Center, Inc.
P.O. Box 55824
Boston, MA 02205-5824
OVERNIGHT MAIL
MFS Service Center, Inc.
c/o Boston Financial Data Services
30 Dan Road
Canton, MA 02021-2809
ANNUAL REPORT
April 30, 2014

MFS® LIMITED MATURITY FUND

MQL-ANN
MFS® LIMITED MATURITY FUND
CONTENTS
The report is prepared for the general information of shareholders. It is authorized for distribution to prospective investors only when preceded or accompanied by a current prospectus.
NOT FDIC INSURED Ÿ MAY LOSE VALUE Ÿ NO BANK GUARANTEE

LETTER FROM THE CHAIRMAN AND CEO
Dear Shareholders:
After gaining momentum late last year, the U.S. economy slipped this winter, as severe weather curtailed activity. More recently, however, labor market data, consumer
confidence, retail sales and industrial output have indicated that the U.S. economy could be regaining traction.
Europe emerged from its recession midway through 2013. However, its pace of growth has been slow, high unemployment persists and the risk of deflation exists. Asia remains vulnerable. China’s economic growth has slowed, and Japan’s early progress toward an economic turnaround continues to face obstacles. Emerging markets have also displayed much higher volatility, affected by the early transition from aggressive central bank monetary easing.
With so much uncertainty, global financial markets began 2014 with much greater volatility than last year’s broad-based rally. For equity investors, attention to company fundamentals has taken on more importance. Bond investors have been attuned to heightened risks from possible interest rate increases.
As always at MFS®, active risk management is an integral part of how we manage your investments. We use a collaborative process, sharing insights across asset classes, regions and economic sectors. Our global team of investment professionals uses a multidisciplined, long-term, diversified investment approach.
We understand that these are challenging economic times. We believe that we can serve you best by applying proven principles, such as asset allocation and diversification, over the long term. We are confident that this approach can serve you well as you work with your financial advisors to reach your goals in the years ahead.
Respectfully,

Robert J. Manning
Chairman and Chief Executive Officer
MFS Investment Management
June 13, 2014
The opinions expressed in this letter are subject to change, may not be relied upon for investment advice, and no forecasts can be guaranteed.
1
PORTFOLIO COMPOSITION
Portfolio structure (i)

| | | | |
| Fixed income sectors (i) | | | | |
| High Grade Corporates | | | 66.0% | |
| Asset-Backed Securities | | | 11.1% | |
| Non-U.S. Government Bonds | | | 9.1% | |
| U.S. Treasury Securities | | | 4.5% | |
| Emerging Markets Bonds | | | 3.0% | |
| Mortgage-Backed Securities | | | 2.0% | |
| Commercial Mortgage-Backed Securities | | | 1.0% | |
| Collateralized Debt Obligations | | | 0.7% | |
| Municipal Bonds | | | 0.5% | |
| U.S. Government Agencies | | | 0.4% | |
| | | | |
| Composition including fixed income credit quality (a)(i) | |
| AAA | | | 17.7% | |
| AA | | | 13.8% | |
| A | | | 31.5% | |
| BBB | | | 25.9% | |
| BB | | | 0.4% | |
| B | | | 0.1% | |
| CCC | | | 0.1% | |
| CC | | | 0.1% | |
| C | | | 0.3% | |
| D | | | 0.2% | |
| U.S. Government | | | 5.3% | |
| Federal Agencies | | | 2.4% | |
| Not Rated | | | 0.5% | |
| Cash & Other | | | 1.7% | |
| |
| Portfolio facts (i) | | | | |
| Average Duration (d) | | | 1.4 | |
| Average Effective Maturity (m) | | | 2.0 yrs. | |
|
| Issuer country weightings (i)(x) | |
| United States | | | 59.8% | |
| United Kingdom | | | 6.7% | |
| France | | | 4.4% | |
| Canada | | | 3.5% | |
| Netherlands | | | 3.5% | |
| Sweden | | | 3.3% | |
| Australia | | | 3.2% | |
| Japan | | | 2.9% | |
| Norway | | | 2.5% | |
| Other Countries | | | 10.2% | |
2
Portfolio Composition – continued
| (a) | For all securities other than those specifically described below, ratings are assigned to underlying securities utilizing ratings from Moody’s, Fitch, and Standard & Poor’s rating agencies and applying the following hierarchy: If all three agencies provide a rating, the middle rating (after dropping the highest and lowest ratings) is assigned; if two of the three |
| | agencies rate a security, the lower of the two is assigned. Ratings are shown in the S&P and Fitch scale (e.g., AAA). Securities rated BBB or higher are considered investment grade. All ratings are subject to change. U.S. Government includes securities issued by the U.S. Department of the Treasury. Federal Agencies includes rated and unrated U.S. Agency fixed-income securities, U.S. Agency mortgage-backed securities, and collateralized mortgage obligations of U.S. Agency mortgage-backed securities. Not Rated includes fixed income securities, including fixed income futures contracts, which have not been rated by any rating agency. The fund may not hold all of these instruments. The fund is not rated by these agencies. |
| (d) | Duration is a measure of how much a bond’s price is likely to fluctuate with general changes in interest rates, e.g., if rates rise 1.00%, a bond with a 5-year duration is likely to lose about 5.00% of its value due to the interest rate move. |
| (i) | For purposes of this presentation, the components include the market value of securities, and reflect the impact of the equivalent exposure of derivative positions, if any. These amounts may be negative from time to time. Equivalent exposure is a calculated amount that translates the derivative position into a reasonable approximation of the amount of the underlying asset that the portfolio would have to hold at a given point in time to have the same price sensitivity that results from the portfolio’s ownership of the derivative contract. When dealing with derivatives, equivalent exposure is a more representative measure of the potential impact of a position on portfolio performance than market value. The bond component will include any accrued interest amounts. |
| (m) | In determining an instrument’s effective maturity for purposes of calculating the fund’s dollar-weighted average effective maturity, MFS uses the instrument’s stated maturity or, if applicable, an earlier date on which MFS believes it is probable that a maturity-shortening device (such as a put, pre-refunding or prepayment) will cause the instrument to be repaid. Such an earlier date can be substantially shorter than the instrument’s stated maturity. |
| (x) | Represents the portfolio’s exposure to issuer countries as a percentage of a portfolio’s net assets. For purposes of this presentation, United States includes Cash & Other. |
Where the fund holds convertible bonds, these are treated as part of the equity portion of the portfolio.
Cash & Other includes cash, other assets less liabilities, offsets to derivative positions, and short-term securities.
Percentages are based on net assets as of 4/30/14.
The portfolio is actively managed and current holdings may be different.
3
MANAGEMENT REVIEW
Summary of Results
For the twelve months ended April 30, 2014, Class A shares of the MFS Limited Maturity Fund (“fund”) provided a total return of 0.44%, at net asset value. This compares with a return of 0.69% for the fund’s benchmark, the Barclays 1-3 Year U.S. Government/Credit Bond Index.
Market Environment
Early in the period, jitters over a banking crisis in Cyprus were more than offset by ongoing accommodative global monetary policy and improving economic data, resulting in gains in both equity and fixed income markets. As the period progressed, concerns that the US Federal Reserve (“Fed”) would begin tapering its quantitative easing (“QE”) program caused sovereign bond yields to spike, credit spreads to widen, and equity valuations to fall. Equities subsequently outperformed fixed income in response to the improved economic fundamentals. A general theme in the market was a rotation in investor allocations from fixed income to equities and emerging markets to developed markets, reflecting an anticipated acceleration in developed market growth rates relative to emerging markets as well as a more equity-friendly macro backdrop.
Toward the middle of the period, the Fed’s decision to postpone QE tapering surprised markets. Favorable market reactions were tempered, however, by tense negotiations over US fiscal policy which resulted in a 16-day partial shutdown of the federal government and a short-term extension in the debt ceiling. The volatility was short-lived, however, as an extension of budget and debt ceiling deadlines allowed the government to re-open, and subsequent economic data reflected moderate but resilient US growth. Also well-received was the decision by the European Central Bank to cut its policy rate as inflation pressures waned in the region. In addition, equity investors appeared to have concluded that there would be no major change in US monetary policy as a result of the nomination of Janet Yellen as the new Fed Chair for a term beginning in early 2014.
During the period, emerging market (“EM”) stresses surfaced as markets focused on imbalances and stagflationary conditions in certain EM countries. In addition, political instability increased in certain areas, notably in the Ukraine where tensions escalated following a change in government and Russia’s annexation of Crimea. Later in the period, markets were forced to contend with some unexpected weakness in the US economy due largely to weather-related interruptions to hiring and spending plans as well as production schedules. Once again, the setback was short-lived as the major US equity indexes traded near their all-time highs by the end of the period.
Factors Affecting Performance
Relative to the Barclays 1-3 Year U.S. Government/Credit Bond Index, the fund’s exposure to holdings with cash flows beyond 3 years, in particular Fannie Mae Mortgage backed securities, held back relative returns.
A greater exposure to corporate bonds in both the finance and industrial sectors strengthened relative performance. Additionally, the fund benefited from a greater relative exposure to “A” and “BBB” rated (r) securities. The portion of the fund’s return
4
Management Review – continued
derived from yield, which was greater than that of the benchmark, further supported relative performance as short-term corporate debt out-yielded short-term government bonds during the reporting period.
Respectfully,
James Calmas
Portfolio Manager
| (r) | Bonds rated “BBB”, “Baa”, or higher are considered investment grade; bonds rated “BB”, “Ba”, or below are considered non-investment grade. The source for bond quality ratings is Moody’s Investors Service, Standard & Poor’s and Fitch, Inc. and are applied using the following hierarchy: If all three agencies provide a rating, the middle rating (after dropping the highest and lowest ratings) is assigned; if two of the three agencies rate a security, the lower of the two is assigned. Ratings are shown in the S&P and Fitch scale (e.g., AAA). For securities which are not rated by any of the three agencies, the security is considered Not Rated. |
The views expressed in this report are those of the portfolio manager only through the end of the period of the report as stated on the cover and do not necessarily reflect the views of MFS or any other person in the MFS organization. These views are subject to change at any time based on market or other conditions, and MFS disclaims any responsibility to update such views. These views may not be relied upon as investment advice or an indication of trading intent on behalf of any MFS portfolio. References to specific securities are not recommendations of such securities, and may not be representative of any MFS portfolio’s current or future investments.
5
PERFORMANCE SUMMARY THROUGH 4/30/14
The following chart illustrates a representative class of the fund’s historical performance in comparison to its benchmark(s). Performance results include the deduction of the maximum applicable sales charge and reflect the percentage change in net asset value, including reinvestment of dividends and capital gains distributions. The performance of other share classes will be greater than or less than that of the class depicted below. Benchmarks are unmanaged and may not be invested in directly. Benchmark returns do not reflect sales charges, commissions or expenses. (See Notes to Performance Summary.)
Performance data shown represents past performance and is no guarantee of future results. Investment return and principal value fluctuate so your shares, when sold, may be worth more or less than the original cost; current performance may be lower or higher than quoted. The performance shown does not reflect the deduction of taxes, if any, that a shareholder would pay on fund distributions or the redemption of fund shares.
Growth of a Hypothetical $10,000 Investment
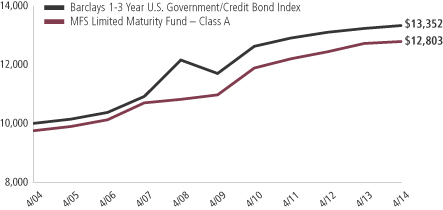
6
Performance Summary – continued
Total Returns through 4/30/14
Average annual without sales charge
| | | | | | | | | | | | | | |
| | | Share class | | Class inception date | | 1-yr | | 5-yr | | 10-yr | | Life (t) | | |
| | | A | | 2/26/92 | | 0.44% | | 3.41% | | 2.76% | | N/A | | |
| | | B | | 9/07/93 | | (0.32)% | | 2.64% | | 1.98% | | N/A | | |
| | | C | | 7/01/94 | | (0.41)% | | 2.54% | | 1.89% | | N/A | | |
| | | I | | 1/02/97 | | 0.59% | | 3.53% | | 2.89% | | N/A | | |
| | | R1 | | 4/01/05 | | (0.41)% | | 2.54% | | N/A | | 2.03% | | |
| | | R2 | | 10/31/03 | | 0.19% | | 3.15% | | 2.43% | | N/A | | |
| | | R3 | | 4/01/05 | | 0.34% | | 3.31% | | N/A | | 2.76% | | |
| | | R4 | | 4/01/05 | | 0.59% | | 3.57% | | N/A | | 3.05% | | |
| | | R5 | | 9/04/12 | | 0.66% | | N/A | | N/A | | 1.23% | | |
| | | 529A | | 7/31/02 | | 0.39% | | 3.34% | | 2.56% | | N/A | | |
| | | 529B | | 7/31/02 | | (0.21)% | | 2.59% | | 1.85% | | N/A | | |
| | | 529C | | 7/31/02 | | (0.46)% | | 2.50% | | 1.76% | | N/A | | |
| Comparative benchmark | | | | | | | | | | |
| | | Barclays 1-3 Year U.S. Government/
Credit Bond Index (f) | | 0.69% | | 1.87% | | 2.93% | | N/A | | |
| Average annual with sales charge | | | | | | | | | | |
| | | A
With initial Sales Charge (2.50%) | | (2.07)% | | 2.89% | | 2.50% | | N/A | | |
| | | B
With CDSC (Declining over six years from 4% to 0%) (v) | | (4.27)% | | 2.28% | | 1.98% | | N/A | | |
| | | C
With CDSC (1% for 12 months) (v) | | (1.40)% | | 2.54% | | 1.89% | | N/A | | |
| | | 529A
With initial Sales Charge (2.50%) | | (2.12)% | | 2.82% | | 2.30% | | N/A | | |
| | | 529B
With CDSC (Declining over six years from 4% to 0%) (v) | | (4.17)% | | 2.23% | | 1.85% | | N/A | | |
| | | 529C
With CDSC (1% for 12 months) (v) | | (1.45)% | | 2.50% | | 1.76% | | N/A | | |
CDSC – Contingent Deferred Sales Charge.
Class I, R1, R2, R3, R4, and R5 shares do not have a sales charge.
| (f) | Source: FactSet Research Systems Inc. |
| (t) | For the period from the class inception date through the stated period end (for those share classes with less than 10 years of performance history). No comparative benchmark performance information is provided for “life” periods. (See Notes to Performance Summary.) |
| (v) | Assuming redemption at the end of the applicable period. |
7
Performance Summary – continued
Benchmark Definition
Barclays 1-3 Year U.S. Government/Credit Bond Index – a market capitalization-weighted index that measures the performance of the short-term (1 to 3 years) investment-grade corporate and U.S. government bond markets.
It is not possible to invest directly in an index.
Notes to Performance Summary
Class 529 shares are only available in conjunction with qualified tuition programs, such as the MFS 529 Savings Plan. There also is an additional fee, which is detailed in the program description, on qualified tuition programs. If this fee was reflected, the performance for Class 529 shares would have been lower. This annual fee is waived for Oregon residents and for those accounts with assets of $25,000 or more.
Average annual total return represents the average annual change in value for each share class for the periods presented. Life returns are presented where the share class has less than 10 years of performance history and represent the average annual total return from the class inception date to the stated period end date. As the fund’s share classes may have different inception dates, the life returns may represent different time periods and may not be comparable. As a result, no comparative benchmark performance information is provided for life periods.
Performance results reflect any applicable expense subsidies and waivers in effect during the periods shown. Without such subsidies and waivers the fund’s performance results would be less favorable. Please see the prospectus and financial statements for complete details.
Performance results do not include adjustments made for financial reporting purposes in accordance with U.S. generally accepted accounting principles and may differ from amounts reported in the financial highlights.
From time to time the fund may receive proceeds from litigation settlements, without which performance would be lower.
8
EXPENSE TABLE
Fund expenses borne by the shareholders during the period, November 1, 2013 through April 30, 2014
As a shareholder of the fund, you incur two types of costs: (1) transaction costs, including sales charges (loads) on certain purchase or redemption payments, and (2) ongoing costs, including management fees; distribution and service (12b-1) fees; and other fund expenses. This example is intended to help you understand your ongoing costs (in dollars) of investing in the fund and to compare these costs with the ongoing costs of investing in other mutual funds.
The example is based on an investment of $1,000 invested at the beginning of the period and held for the entire period November 1, 2013 through April 30, 2014.
The expenses include the payment of a portion of the transfer-agent-related expenses of MFS funds that invest in the fund. For further information, please see the Notes to the Financial Statements.
Actual Expenses
The first line for each share class in the following table provides information about actual account values and actual expenses. You may use the information in this line, together with the amount you invested, to estimate the expenses that you paid over the period. Simply divide your account value by $1,000 (for example, an $8,600 account value divided by $1,000 = 8.6), then multiply the result by the number in the first line under the heading entitled “Expenses Paid During Period” to estimate the expenses you paid on your account during this period.
Hypothetical Example for Comparison Purposes
The second line for each share class in the following table provides information about hypothetical account values and hypothetical expenses based on the fund’s actual expense ratio and an assumed rate of return of 5% per year before expenses, which is not the fund’s actual return. The hypothetical account values and expenses may not be used to estimate the actual ending account balance or expenses you paid for the period. You may use this information to compare the ongoing costs of investing in the fund and other funds. To do so, compare this 5% hypothetical example with the 5% hypothetical examples that appear in the shareholder reports of the other funds.
Please note that the expenses shown in the table are meant to highlight your ongoing costs only and do not reflect any transactional costs, such as sales charges (loads). Therefore, the second line for each share class in the table is useful in comparing ongoing costs only, and will not help you determine the relative total costs of owning different funds. In addition, if these transactional costs were included, your costs would have been higher.
9
Expense Table – continued
| | | | | | | | | | | | | | | | | | |
Share
Class | | | | Annualized Expense Ratio | | | Beginning Account Value 11/01/13 | | | Ending Account Value 4/30/14 | | | Expenses Paid During Period (p) 11/01/13-4/30/14 | |
| A | | Actual | | | 0.73% | | | | $1,000.00 | | | | $1,005.79 | | | | $3.63 | |
| | Hypothetical (h) | | | 0.73% | | | | $1,000.00 | | | | $1,021.17 | | | | $3.66 | |
| B | | Actual | | | 1.49% | | | | $1,000.00 | | | | $1,000.33 | | | | $7.39 | |
| | Hypothetical (h) | | | 1.49% | | | | $1,000.00 | | | | $1,017.41 | | | | $7.45 | |
| C | | Actual | | | 1.59% | | | | $1,000.00 | | | | $999.87 | | | | $7.88 | |
| | Hypothetical (h) | | | 1.59% | | | | $1,000.00 | | | | $1,016.91 | | | | $7.95 | |
| I | | Actual | | | 0.59% | | | | $1,000.00 | | | | $1,006.53 | | | | $2.94 | |
| | Hypothetical (h) | | | 0.59% | | | | $1,000.00 | | | | $1,021.87 | | | | $2.96 | |
| R1 | | Actual | | | 1.59% | | | | $1,000.00 | | | | $1,001.52 | | | | $7.89 | |
| | Hypothetical (h) | | | 1.59% | | | | $1,000.00 | | | | $1,016.91 | | | | $7.95 | |
| R2 | | Actual | | | 0.99% | | | | $1,000.00 | | | | $1,004.54 | | | | $4.92 | |
| | Hypothetical (h) | | | 0.99% | | | | $1,000.00 | | | | $1,019.89 | | | | $4.96 | |
| R3 | | Actual | | | 0.84% | | | | $1,000.00 | | | | $1,003.63 | | | | $4.17 | |
| | Hypothetical (h) | | | 0.84% | | | | $1,000.00 | | | | $1,020.63 | | | | $4.21 | |
| R4 | | Actual | | | 0.59% | | | | $1,000.00 | | | | $1,006.54 | | | | $2.94 | |
| | Hypothetical (h) | | | 0.59% | | | | $1,000.00 | | | | $1,021.87 | | | | $2.96 | |
| R5 | | Actual | | | 0.52% | | | | $1,000.00 | | | | $1,005.22 | | | | $2.59 | |
| | Hypothetical (h) | | | 0.52% | | | | $1,000.00 | | | | $1,022.22 | | | | $2.61 | |
| 529A | | Actual | | | 0.78% | | | | $1,000.00 | | | | $1,005.54 | | | | $3.88 | |
| | Hypothetical (h) | | | 0.78% | | | | $1,000.00 | | | | $1,020.93 | | | | $3.91 | |
| 529B | | Actual | | | 1.54% | | | | $1,000.00 | | | | $1,001.72 | | | | $7.64 | |
| | Hypothetical (h) | | | 1.54% | | | | $1,000.00 | | | | $1,017.16 | | | | $7.70 | |
| 529C | | Actual | | | 1.63% | | | | $1,000.00 | | | | $1,001.28 | | | | $8.09 | |
| | Hypothetical (h) | | | 1.63% | | | | $1,000.00 | | | | $1,016.71 | | | | $8.15 | |
| (h) | 5% class return per year before expenses. |
| (p) | “Expenses Paid During Period” are equal to each class’s annualized expense ratio, as shown above, multiplied by the average account value over the period, multiplied by 181/365 (to reflect the one-half year period). Expenses paid do not include any applicable sales charges (loads). If these transaction costs had been included, your costs would have been higher. |
Notes to Expense Table
Each class with a Rule 12b-1 service fee is subject to a rebate of a portion of such fee. Such rebates are included in the expense ratios above. For Class 529C shares, this rebate reduced the expense ratio above by 0.01%. See Note 3 in the Notes to Financial Statements for additional information.
10
PORTFOLIO OF INVESTMENTS
4/30/14
The Portfolio of Investments is a complete list of all securities owned by your fund. It is categorized by broad-based asset classes.
| | | | | | | | |
| Bonds - 97.2% | | | | | | | | |
| Issuer | | Shares/Par | | | Value ($) | |
| | | | | | | | |
| Asset-Backed & Securitized - 12.8% | | | | | | | | |
| AmeriCredit Automobile Receivables Trust, “A2”, 0.74%, 11/08/16 | | $ | 3,933,009 | | | $ | 3,938,142 | |
| ARI Fleet Lease Trust, “A”, FRN, 0.702%, 3/15/20 (n) | | | 1,289,184 | | | | 1,290,523 | |
| ARI Fleet Lease Trust, “A”, FRN, 0.452%, 1/15/21 (n) | | | 3,262,409 | | | | 3,259,933 | |
| ARI Fleet Lease Trust, “A2”, 0.81%, 11/15/22 (z) | | | 2,560,000 | | | | 2,559,936 | |
| Babson Ltd., CLO, “A1”, FRN, 0.478%, 7/20/19 (n) | | | 560,702 | | | | 557,474 | |
| Bayview Commercial Asset Trust, FRN, 0.462%, 8/25/35 (z) | | | 885,588 | | | | 785,015 | |
| Bayview Commercial Asset Trust, FRN, 0.422%, 4/25/36 (z) | | | 767,771 | | | | 666,228 | |
| Bayview Commercial Asset Trust, FRN, 0%, 7/25/36 (i)(z) | | | 3,790,534 | | | | 0 | |
| Bayview Financial Acquisition Trust, FRN, 5.638%, 11/28/36 | | | 1,982,663 | | | | 1,939,382 | |
| Bayview Financial Acquisition Trust, FRN, 5.483%, 2/28/41 | | | 649,570 | | | | 665,510 | |
| Bayview Financial Revolving Mortgage Loan Trust, FRN, 1.752%, 12/28/40 (z) | | | 843,374 | | | | 558,090 | |
| BMW Vehicle Lease Trust, “A2”, 0.45%, 3/21/16 | | | 5,000,000 | | | | 5,000,555 | |
| Capital Auto Receivables Asset Trust, 2013-4, “A1”, FRN, 0.532%, 3/21/16 | | | 5,030,000 | | | | 5,036,534 | |
| Capital Trust Realty Ltd., CDO, 5.16%, 6/25/35 (n) | | | 91,770 | | | | 94,222 | |
| Cent CDO XI Ltd., “A1”, FRN, 0.489%, 4/25/19 (n) | | | 3,430,225 | | | | 3,390,215 | |
| Chesapeake Funding LLC, “A”, FRN, 0.902%, 11/07/23 (n) | | | 3,591,530 | | | | 3,604,571 | |
| Chesapeake Funding LLC, “A”, FRN, 0.602%, 1/07/25 (n) | | | 5,140,000 | | | | 5,146,183 | |
| Chrysler Capital Auto Receivables Trust, 2013-AA, “A2”, 0.61%, 11/15/16 (n) | | | 6,310,000 | | | | 6,316,575 | |
| Citigroup/Deutsche Bank Commercial Mortgage Trust, 5.322%, 12/11/49 | | | 1,520,000 | | | | 1,661,807 | |
| CNH Equipment Trust, “A2”, 0.45%, 4/15/16 | | | 547,940 | | | | 548,004 | |
| CNH Equipment Trust, “A2”, 0.63%, 1/17/17 | | | 4,220,000 | | | | 4,224,579 | |
| CNH Wholesale Master Note Trust, “A”, FRN, 0.752%, 8/15/19 (n) | | | 8,000,000 | | | | 8,009,222 | |
| Commercial Mortgage Asset Trust, FRN, 0.811%, 1/17/32 (i)(z) | | | 3,562,448 | | | | 20,748 | |
| Credit Acceptance Auto Loan Trust, “A”, 2.2%, 9/16/19 (n) | | | 1,046,221 | | | | 1,053,062 | |
| Credit Suisse Commercial Mortgage Trust, “A4”, FRN, 6.053%, 9/15/15 | | | 2,708,691 | | | | 2,962,246 | |
| Credit-Based Asset Servicing & Securitization LLC, 4.332%, 12/25/35 | | | 719,192 | | | | 674,461 | |
| Credit-Based Asset Servicing & Securitization LLC, FRN, 4.246%, 1/25/37 (d)(q) | | | 2,541,526 | | | | 1,198,551 | |
| Credit-Based Asset Servicing & Securitization LLC, FRN, 4.261%, 3/25/37 (d)(q) | | | 3,641,023 | | | | 2,196,094 | |
| CWCapital Cobalt Ltd., “A4”, FRN, 5.963%, 5/15/46 | | | 2,929,962 | | | | 3,248,765 | |
11
Portfolio of Investments – continued
| | | | | | | | |
| Issuer | | Shares/Par | | | Value ($) | |
| | | | | | | | |
| Bonds - continued | | | | | | | | |
| Asset-Backed & Securitized - continued | | | | | | | | |
| Enterprise Fleet Financing LLC, 2014-1, “A2”, 0.87%, 9/20/19 (z) | | $ | 6,070,000 | | | $ | 6,069,448 | |
| Ford Credit Auto Lease Trust, 2013-B, “A2A”, 0.59%, 1/15/16 | | | 2,100,000 | | | | 2,102,216 | |
| Ford Credit Floorplan Master Owner Trust, “A”, FRN, 0.502%, 9/15/16 | | | 5,090,000 | | | | 5,093,823 | |
| GE Equipment Small Ticket LLC, “A2”, 0.73%, 1/25/16 (n) | | | 1,840,000 | | | | 1,843,498 | |
| GE Equipment Transportation LLC, 2013-2, “A2”, 0.61%, 6/24/16 | | | 7,373,000 | | | | 7,381,169 | |
| Gramercy Real Estate Ltd., CDO, FRN, 0.549%, 7/25/35 (z) | | | 353,375 | | | | 349,894 | |
| Hertz Fleet Lease Funding LP, 2013-3, “A”, FRN, 0.7%, 12/10/27 (n) | | | 7,120,000 | | | | 7,134,333 | |
| HLSS Servicer Advance Receivables Trust, 2014-T1, “A1”, 1.244%, 1/17/45 (n) | | | 2,220,000 | | | | 2,221,776 | |
| Honda Auto Receivables Owner Trust, “A2”, 0.54%, 1/15/16 | | | 6,213,550 | | | | 6,219,838 | |
| Hyundai Auto Lease Securitization Trust, “A2” , 0.51%, 9/15/15 (n) | | | 2,427,525 | | | | 2,428,226 | |
| Hyundai Auto Lease Securitization Trust, “A2”, 0.75%, 3/15/16 (n) | | | 8,097,201 | | | | 8,114,310 | |
| IMPAC CMB Trust, FRN, 0.892%, 11/25/34 | | | 283,876 | | | | 270,350 | |
| IMPAC CMB Trust, FRN, 1.072%, 11/25/34 | | | 298,817 | | | | 273,801 | |
| IMPAC Secured Assets Corp., FRN, 0.502%, 5/25/36 | | | 762,016 | | | | 747,419 | |
| Interstar Millennium Trust, FRN, 0.634%, 3/14/36 | | | 253,062 | | | | 243,874 | |
| John Deere Owner Trust, “A2”, 0.55%, 1/15/16 | | | 2,179,686 | | | | 2,181,445 | |
| JPMorgan Chase Commercial Mortgage Securities Corp., 5.42%, 1/15/49 | | | 3,874,000 | | | | 4,245,834 | |
| JPMorgan Chase Commercial Mortgage Securities Corp., FRN, 5.464%, 9/12/37 | | | 817,940 | | | | 822,732 | |
| Kingsland III Ltd., “A1”, CDO, FRN, 0.451%, 8/24/21 (n) | | | 2,407,300 | | | | 2,386,985 | |
| Kubota Credit Owner Trust, “A2”, 0.58%, 2/15/17 (z) | | | 2,650,000 | | | | 2,649,701 | |
| LB Commercial Conduit Mortgage Trust, FRN, 1.557%, 10/15/35 (i) | | | 2,571,890 | | | | 112,639 | |
| Mercedes-Benz Auto Lease Trust, 2013-B, “A2”, 0.53%, 9/15/15 | | | 5,480,000 | | | | 5,483,151 | |
| Mercedes-Benz Master Owner Trust, FRN, 0.422%, 11/15/16 (n) | | | 7,280,000 | | | | 7,282,031 | |
| Merrill Lynch Mortgage Investors, Inc., 5.12%, 2/25/37 (d)(q) | | | 2,004,171 | | | | 465,485 | |
| Morgan Stanley Capital I, Inc., FRN, 1.715%, 3/15/31 (i)(z) | | | 321,542 | | | | 13 | |
| Motor PLC, “A1”, FRN, 0.645%, 8/25/21 (n) | | | 4,760,000 | | | | 4,759,962 | |
| New Residential Advance Receivables Tust, 2014-T1, “A1”, 1.274%, 3/15/45 (z) | | | 3,200,000 | | | | 3,200,640 | |
| Nissan Auto Lease Trust, 2013-B, “A2B”, FRN, 0.422%, 1/15/16 | | | 4,200,000 | | | | 4,204,061 | |
| Nissan Master Owner Trust Receivables 2013, “A”, FRN, 0.452%, 2/15/18 | | | 7,030,000 | | | | 7,032,552 | |
| Option One Mortgage Loan Trust, FRN, 5.611%, 1/25/37 | | | 1,990,000 | | | | 1,967,533 | |
| Ownit Mortgage Loan Asset-Backed Certificates, FRN, 3.456%, 12/25/36 (d)(q) | | | 1,983,909 | | | | 885,659 | |
| Porsche Innovative Lease Owner Trust, 2013-1, “A2”, 0.54%, 1/22/16 (n) | | | 5,000,000 | | | | 5,004,370 | |
12
Portfolio of Investments – continued
| | | | | | | | |
| Issuer | | Shares/Par | | | Value ($) | |
| | | | | | | | |
| Bonds - continued | | | | | | | | |
| Asset-Backed & Securitized - continued | | | | | | | | |
| Race Point CLO Ltd., “A1A”, FRN, 0.425%, 8/01/21 (n) | | $ | 3,553,646 | | | $ | 3,516,670 | |
| Santander Drive Auto Receivable Trust, “A2”, 0.47%, 3/15/16 | | | 413,287 | | | | 413,298 | |
| Santander Drive Auto Receivable Trust, “A2”, 0.66%, 6/15/17 | | | 6,810,000 | | | | 6,818,764 | |
| Smart Trust, “A2B”, FRN, 0.483%, 6/14/15 (n) | | | 1,332,868 | | | | 1,333,065 | |
| Smart Trust, “A2B”, FRN, 0.401%, 9/14/15 | | | 1,470,285 | | | | 1,470,474 | |
| Thornburg Mortgage Securities Trust, FRN, 0.832%, 4/25/43 | | | 975,891 | | | | 972,068 | |
| Volkswagen Auto Lease Trust, 2014-A, “A2B”, FRN, 0.362%, 10/20/16 | | | 4,100,000 | | | | 4,100,316 | |
| Volvo Financial Equipment LLC, “A2”, 0.53%, 11/16/15 (n) | | | 1,142,329 | | | | 1,142,596 | |
| | | | | | | | |
| | | | | | | $ | 193,552,646 | |
| Automotive - 3.8% | | | | | | | | |
| American Honda Finance Corp., 1.6%, 2/16/18 (n) | | $ | 2,146,000 | | | $ | 2,139,669 | |
| American Honda Finance Corp., 1.85%, 9/19/14 (n) | | | 1,700,000 | | | | 1,708,340 | |
| American Honda Finance Corp., 1%, 8/11/15 (n) | | | 3,060,000 | | | | 3,080,520 | |
| American Honda Finance Corp., FRN, 0.609%, 5/26/16 (n) | | | 3,570,000 | | | | 3,585,844 | |
| American Honda Finance Corp., FRN, 0.73%, 10/07/16 | | | 3,010,000 | | | | 3,034,014 | |
| Daimler Finance North America LLC, 2.4%, 4/10/17 (n) | | | 2,680,000 | | | | 2,756,399 | |
| Daimler Finance North America LLC, FRN, 0.905%, 8/01/16 (n) | | | 5,040,000 | | | | 5,085,980 | |
| Ford Motor Credit Co. LLC, 4.207%, 4/15/16 | | | 3,170,000 | | | | 3,360,951 | |
| Harley-Davidson Financial Services, 3.875%, 3/15/16 (n) | | | 4,620,000 | | | | 4,864,421 | |
| Hyundai Capital America, 1.625%, 10/02/15 (n) | | | 4,490,000 | | | | 4,539,341 | |
| Nissan Motor Acceptance Corp., FRN, 0.935%, 9/26/16 (n) | | | 5,500,000 | | | | 5,535,250 | |
| Nissan Motor Acceptance Corp., FRN, 0.786%, 3/03/17 (n) | | | 3,030,000 | | | | 3,036,818 | |
| Toyota Motor Credit Corp., 1.25%, 11/17/14 | | | 2,660,000 | | | | 2,674,239 | |
| Toyota Motor Credit Corp., 3.2%, 6/17/15 | | | 1,270,000 | | | | 1,309,168 | |
| Toyota Motor Credit Corp., FRN, 0.616%, 1/17/19 | | | 5,320,000 | | | | 5,322,623 | |
| Volkswagen International Finance N.V., 1.125%, 11/18/16 (n) | | | 2,580,000 | | | | 2,583,651 | |
| Volkswagen International Finance N.V., FRN, 0.835%, 11/20/14 (n) | | | 3,740,000 | | | | 3,751,205 | |
| | | | | | | | |
| | | | | | | $ | 58,368,433 | |
| Banks & Diversified Financials (Covered Bonds) - 1.4% | | | | | | | | |
| Australia & New Zealand Banking Group, FRN, 0.84%, 10/06/15 (n) | | $ | 1,940,000 | | | $ | 1,951,396 | |
| BNP Paribas Home Loan, 2.2%, 11/02/15 (n) | | | 4,260,000 | | | | 4,359,130 | |
| Commonwealth Bank of Australia, 0.75%, 1/15/16 (n) | | | 2,540,000 | | | | 2,545,563 | |
| Credit Mutuel-CIC Home Loan, 1.5%, 11/16/17 (n) | | | 3,800,000 | | | | 3,794,338 | |
| Norddeutsche Landesbank, 0.875%, 10/16/15 (n) | | | 2,400,000 | | | | 2,411,568 | |
| Royal Bank of Canada, 1.125%, 7/22/16 | | | 3,700,000 | | | | 3,718,892 | |
| SpareBank 1 Boligkreditt A.S., 2.625%, 5/27/16 (n) | | | 2,260,000 | | | | 2,344,366 | |
| | | | | | | | |
| | | | | | | $ | 21,125,253 | |
13
Portfolio of Investments – continued
| | | | | | | | |
| Issuer | | Shares/Par | | | Value ($) | |
| | | | | | | | |
| Bonds - continued | | | | | | | | |
| Broadcasting - 0.4% | | | | | | | | |
| SES Global Americas Holdings GP, 2.5%, 3/25/19 (n) | | $ | 1,862,000 | | | $ | 1,863,626 | |
| WPP Finance, 8%, 9/15/14 | | | 4,550,000 | | | | 4,669,920 | |
| | | | | | | | |
| | | | | | | $ | 6,533,546 | |
| Brokerage & Asset Managers - 0.4% | | | | | | | | |
| BlackRock, Inc., 3.5%, 12/10/14 | | $ | 3,700,000 | | | $ | 3,772,838 | |
| BlackRock, Inc., 1.375%, 6/01/15 | | | 1,740,000 | | | | 1,756,666 | |
| Franklin Resources, Inc., 1.375%, 9/15/17 | | | 1,222,000 | | | | 1,215,671 | |
| | | | | | | | |
| | | | | | | $ | 6,745,175 | |
| Business Services - 0.4% | | | | | | | | |
| Cisco Systems, Inc., FRN, 0.516%, 3/03/17 | | $ | 6,150,000 | | | $ | 6,174,237 | |
| | |
| Cable TV - 0.3% | | | | | | | | |
| DIRECTV Holdings LLC, 2.4%, 3/15/17 | | $ | 3,360,000 | | | $ | 3,447,824 | |
| NBCUniversal Enterprise Co., FRN, 0.763%, 4/15/16 (n) | | | 1,450,000 | | | | 1,455,358 | |
| | | | | | | | |
| | | | | | | $ | 4,903,182 | |
| Computer Software - 0.3% | | | | | | | | |
| Adobe Systems, Inc., 3.25%, 2/01/15 | | $ | 4,085,000 | | | $ | 4,166,251 | |
| | |
| Computer Software - Systems - 0.3% | | | | | | | | |
| Apple, Inc., FRN, 0.472%, 5/03/18 | | $ | 4,470,000 | | | $ | 4,471,770 | |
| | |
| Conglomerates - 0.9% | | | | | | | | |
| ABB Finance (USA), Inc., 1.625%, 5/08/17 | | $ | 1,659,000 | | | $ | 1,671,253 | |
| ABB Treasury Center (USA), Inc., 2.5%, 6/15/16 (n) | | | 3,907,000 | | | | 4,025,929 | |
| General Electric Co., 0.85%, 10/09/15 | | | 1,260,000 | | | | 1,267,016 | |
| Pentair Finance S.A., 1.35%, 12/01/15 | | | 4,610,000 | | | | 4,646,041 | |
| United Technologies Corp., FRN, 0.736%, 6/01/15 | | | 2,560,000 | | | | 2,572,782 | |
| | | | | | | | |
| | | | | | | $ | 14,183,021 | |
| Consumer Products - 1.2% | | | | | | | | |
| Clorox Co., 5.95%, 10/15/17 | | $ | 1,305,000 | | | $ | 1,494,324 | |
| LVMH Moet Hennessy Louis Vuitton S.A., 1.625%, 6/29/17 (n) | | | 3,150,000 | | | | 3,181,135 | |
| Mattel, Inc., 1.7%, 3/15/18 | | | 1,041,000 | | | | 1,031,332 | |
| Mattel, Inc., 2.5%, 11/01/16 | | | 2,030,000 | | | | 2,096,125 | |
| Newell Rubbermaid, Inc., 2%, 6/15/15 | | | 2,337,000 | | | | 2,371,389 | |
| Newell Rubbermaid, Inc., 2.05%, 12/01/17 | | | 2,748,000 | | | | 2,758,033 | |
| Procter & Gamble Co., 0.75%, 11/04/16 | | | 3,410,000 | | | | 3,401,738 | |
| Reckitt Benckiser PLC, 2.125%, 9/21/18 (n) | | | 1,820,000 | | | | 1,825,982 | |
| | | | | | | | |
| | | | | | | $ | 18,160,058 | |
14
Portfolio of Investments – continued
| | | | | | | | |
| Issuer | | Shares/Par | | | Value ($) | |
| | | | | | | | |
| Bonds - continued | | | | | | | | |
| Consumer Services - 0.8% | | | | | | | | |
| eBay, Inc., 1.35%, 7/15/17 | | $ | 3,482,000 | | | $ | 3,489,204 | |
| Experian Finance PLC, 2.375%, 6/15/17 (n) | | | 3,189,000 | | | | 3,237,084 | |
| Western Union Co., 2.375%, 12/10/15 | | | 1,970,000 | | | | 2,013,809 | |
| Western Union Co., FRN, 1.234%, 8/21/15 | | | 3,800,000 | | | | 3,821,082 | |
| | | | | | | | |
| | | | | | | $ | 12,561,179 | |
| Defense Electronics - 0.2% | | | | | | | | |
| BAE Systems Holdings, Inc., 4.95%, 6/01/14 (n) | | $ | 2,640,000 | | | $ | 2,648,073 | |
| | |
| Electrical Equipment - 0.1% | | | | | | | | |
| Arrow Electronics, Inc., 3%, 3/01/18 | | $ | 1,326,000 | | | $ | 1,359,720 | |
| | |
| Electronics - 1.0% | | | | | | | | |
| Applied Materials, Inc., 2.65%, 6/15/16 | | $ | 1,670,000 | | | $ | 1,729,607 | |
| Intel Corp., 1.35%, 12/15/17 | | | 6,765,000 | | | | 6,754,636 | |
| Tyco Electronics Group S.A., 1.6%, 2/03/15 | | | 3,160,000 | | | | 3,185,002 | |
| Tyco Electronics Group S.A., 2.375%, 12/17/18 | | | 1,500,000 | | | | 1,492,113 | |
| Xilinx, Inc., 2.125%, 3/15/19 | | | 2,410,000 | | | | 2,392,800 | |
| | | | | | | | |
| | | | | | | $ | 15,554,158 | |
| Emerging Market Quasi-Sovereign - 1.9% | | | | | | | | |
| CNOOC Finance (2013) Ltd., 1.125%, 5/09/16 | | $ | 3,570,000 | | | $ | 3,576,858 | |
| Corporacion Nacional del Cobre de Chile, 4.75%, 10/15/14 (n) | | | 5,420,000 | | | | 5,506,492 | |
| Korea Development Bank, 1%, 1/22/16 | | | 3,000,000 | | | | 2,996,523 | |
| Korea Expressway Corp., 4.5%, 3/23/15 (n) | | | 2,479,000 | | | | 2,554,684 | |
| Korea Gas Corp., 2.25%, 7/25/17 (n) | | | 2,750,000 | | | | 2,786,096 | |
| Mubadala Development Co., 5.75%, 5/06/14 (n) | | | 3,197,000 | | | | 3,197,000 | |
| National Agricultural Co., 5%, 9/30/14 (n) | | | 2,541,000 | | | | 2,580,911 | |
| Petroleos Mexicanos, 3.125%, 1/23/19 (z) | | | 2,522,000 | | | | 2,581,898 | |
| State Grid International Development Co. Ltd., 1.75%, 5/22/18 (n) | | | 3,010,000 | | | | 2,937,158 | |
| | | | | | | | |
| | | | | | | $ | 28,717,620 | |
| Energy - Independent - 0.5% | | | | | | | | |
| Canadian Natural Resources Ltd., FRN, 0.609%, 3/30/16 | | $ | 1,560,000 | | | $ | 1,561,942 | |
| Devon Energy Corp., 1.2%, 12/15/16 | | | 2,400,000 | | | | 2,408,114 | |
| Encana Corp., 5.9%, 12/01/17 | | | 3,360,000 | | | | 3,849,125 | |
| Petrohawk Energy Corp., 7.25%, 8/15/18 | | | 387,000 | | | | 408,511 | |
| | | | | | | | |
| | | | | | | $ | 8,227,692 | |
| Energy - Integrated - 2.2% | | | | | | | | |
| BG Energy Capital PLC, 2.875%, 10/15/16 (n) | | $ | 4,300,000 | | | $ | 4,476,334 | |
| BP Capital Markets PLC, 3.125%, 10/01/15 | | | 5,300,000 | | | | 5,494,738 | |
| BP Capital Markets PLC, 0.7%, 11/06/15 | | | 1,142,000 | | | | 1,144,932 | |
| Chevron Corp., 0.889%, 6/24/16 | | | 1,770,000 | | | | 1,780,905 | |
15
Portfolio of Investments – continued
| | | | | | | | |
| Issuer | | Shares/Par | | | Value ($) | |
| | | | | | | | |
| Bonds - continued | | | | | | | | |
| Energy - Integrated - continued | | | | | | | | |
| Chevron Corp., 1.104%, 12/05/17 | | $ | 3,658,000 | | | $ | 3,635,064 | |
| Husky Energy, Inc., 5.9%, 6/15/14 | | | 2,965,000 | | | | 2,983,092 | |
| Petro-Canada Financial Partnership, 5%, 11/15/14 | | | 2,950,000 | | | | 3,018,620 | |
| Shell International Finance B.V., 1.125%, 8/21/17 | | | 3,430,000 | | | | 3,422,416 | |
| Shell International Finance B.V., FRN, 0.433%, 11/15/16 | | | 2,740,000 | | | | 2,745,524 | |
| Total Capital International S.A., 1.5%, 2/17/17 | | | 1,670,000 | | | | 1,695,462 | |
| Total Capital S.A., 3%, 6/24/15 | | | 2,810,000 | | | | 2,893,687 | |
| | | | | | | | |
| | | | | | | $ | 33,290,774 | |
| Entertainment - 0.1% | | | | | | | | |
| Viacom, Inc., 1.25%, 2/27/15 | | $ | 2,100,000 | | | $ | 2,114,297 | |
| | |
| Financial Institutions - 2.1% | | | | | | | | |
| Capital One Financial Corp., 2.45%, 4/24/19 | �� | $ | 1,880,000 | | | $ | 1,884,264 | |
| Citigroup, Inc., FRN, 1%, 4/08/19 | | | 6,530,000 | | | | 6,526,918 | |
| General Electric Capital Corp., 2.15%, 1/09/15 | | | 2,180,000 | | | | 2,208,124 | |
| General Electric Capital Corp., FRN, 0.836%, 12/11/15 | | | 2,500,000 | | | | 2,518,555 | |
| General Electric Capital Corp., FRN, 0.83%, 1/08/16 | | | 3,270,000 | | | | 3,291,759 | |
| General Electric Capital Corp., FRN, 0.457%, 1/14/16 | | | 6,750,000 | | | | 6,755,879 | |
| LeasePlan Corp. N.V., 3%, 10/23/17 (n) | | | 3,370,000 | | | | 3,440,130 | |
| LeasePlan Corp. N.V., 2.5%, 5/16/18 (n) | | | 1,208,000 | | | | 1,205,884 | |
| NYSE Euronext, 2%, 10/05/17 | | | 3,266,000 | | | | 3,320,882 | |
| | | | | | | | |
| | | | | | | $ | 31,152,395 | |
| Food & Beverages - 4.3% | | | | | | | | |
| Anheuser-Busch InBev S.A., 3.625%, 4/15/15 | | $ | 1,350,000 | | | $ | 1,391,541 | |
| Anheuser-Busch InBev S.A., 0.8%, 1/15/16 | | | 1,260,000 | | | | 1,265,554 | |
| Anheuser-Busch InBev S.A., 1.375%, 7/15/17 | | | 5,370,000 | | | | 5,412,235 | |
| Campbell Soup Co., FRN, 0.525%, 8/01/14 | | | 4,570,000 | | | | 4,571,965 | |
| Coca-Cola Co., 1.15%, 4/01/18 | | | 2,480,000 | | | | 2,443,408 | |
| Coca-Cola Co., FRN, 0.325%, 11/01/16 | | | 3,120,000 | | | | 3,121,548 | |
| Diageo Capital PLC, 1.5%, 5/11/17 | | | 2,750,000 | | | | 2,780,621 | |
| General Mills, Inc., 5.2%, 3/17/15 | | | 1,990,000 | | | | 2,071,689 | |
| Heineken N.V., 0.8%, 10/01/15 (n) | | | 2,810,000 | | | | 2,814,381 | |
| Ingredion, Inc., 3.2%, 11/01/15 | | | 1,025,000 | | | | 1,055,649 | |
| Ingredion, Inc., 1.8%, 9/25/17 | | | 2,092,000 | | | | 2,054,474 | |
| Kellogg Co., 4.45%, 5/30/16 | | | 1,209,000 | | | | 1,294,515 | |
| Kraft Foods Group, Inc., 1.625%, 6/04/15 | | | 5,170,000 | | | | 5,229,884 | |
| Molson Coors Brewing Co., 2%, 5/01/17 | | | 3,330,000 | | | | 3,381,076 | |
| PepsiCo, Inc., 2.5%, 5/10/16 | | | 3,400,000 | | | | 3,524,375 | |
| Pernod-Ricard S.A., 2.95%, 1/15/17 (n) | | | 5,000,000 | | | | 5,203,695 | |
| SABMiller Holdings, Inc., 1.85%, 1/15/15 (n) | | | 2,630,000 | | | | 2,652,955 | |
| SABMiller Holdings, Inc., 2.45%, 1/15/17 (n) | | | 2,060,000 | | | | 2,125,638 | |
| SABMiller Holdings, Inc., FRN, 0.915%, 8/01/18 (n) | | | 5,700,000 | | | | 5,742,824 | |
16
Portfolio of Investments – continued
| | | | | | | | |
| Issuer | | Shares/Par | | | Value ($) | |
| | | | | | | | |
| Bonds - continued | | | | | | | | |
| Food & Beverages - continued | | | | | | | | |
| Want Want China Finance Co., 1.875%, 5/14/18 (n) | | $ | 3,190,000 | | | $ | 3,084,245 | |
| Wm. Wrigley Jr. Co., 1.4%, 10/21/16 (n) | | | 3,712,000 | | | | 3,740,022 | |
| Wm. Wrigley Jr. Co., 2.4%, 10/21/18 (n) | | | 525,000 | | | | 531,983 | |
| | | | | | | | |
| | | | | | | $ | 65,494,277 | |
| Food & Drug Stores - 0.6% | | | | | | | | |
| CVS Caremark Corp., 3.25%, 5/18/15 | | $ | 2,372,000 | | | $ | 2,434,623 | |
| CVS Caremark Corp., 1.2%, 12/05/16 | | | 2,800,000 | | | | 2,816,512 | |
| Walgreen Co., 1%, 3/13/15 | | | 4,120,000 | | | | 4,138,680 | |
| | | | | | | | |
| | | | | | | $ | 9,389,815 | |
| Gaming & Lodging - 0.2% | | | | | | | | |
| Wyndham Worldwide Corp., 2.95%, 3/01/17 | | $ | 3,473,000 | | | $ | 3,596,851 | |
| | |
| Insurance - 2.6% | | | | | | | | |
| Aflac, Inc., 3.45%, 8/15/15 | | $ | 3,840,000 | | | $ | 3,984,173 | |
| American International Group, Inc., 3%, 3/20/15 | | | 3,360,000 | | | | 3,433,678 | |
| American International Group, Inc., 5.85%, 1/16/18 | | | 1,525,000 | | | | 1,740,762 | |
| Lincoln National Corp., 4.3%, 6/15/15 | | | 2,060,000 | | | | 2,141,496 | |
| MetLife Global Funding I, FRN, 0.607%, 4/10/17 (n) | | | 4,820,000 | | | | 4,817,243 | |
| MetLife, Inc., 1.756%, 12/15/17 | | | 1,199,000 | | | | 1,209,196 | |
| Metropolitan Life Global Funding I, 5.125%, 6/10/14 (n) | | | 1,450,000 | | | | 1,456,834 | |
| Metropolitan Life Global Funding I, 0.756%, 7/15/16 (n) | | | 4,570,000 | | | | 4,599,321 | |
| New York Life Global Funding, 1.3%, 1/12/15 (n) | | | 4,590,000 | | | | 4,619,693 | |
| PRICOA Global Funding I, FRN, 0.505%, 8/19/15 (n) | | | 2,590,000 | | | | 2,595,040 | |
| Prudential Financial, Inc., FRN, 1.003%, 8/15/18 | | | 3,690,000 | | | | 3,694,668 | |
| UnumProvident Corp., 6.85%, 11/15/15 (n) | | | 2,590,000 | | | | 2,807,216 | |
| Voya Financial, Inc., 2.9%, 2/15/18 | | | 2,515,000 | | | | 2,595,007 | |
| | | | | | | | |
| | | | | | | $ | 39,694,327 | |
| Insurance - Health - 0.2% | | | | | | | | |
| Aetna, Inc., 1.5%, 11/15/17 | | $ | 674,000 | | | $ | 675,955 | |
| WellPoint, Inc., 5%, 12/15/14 | | | 120,000 | | | | 123,404 | |
| Wellpoint, Inc., 1.25%, 9/10/15 | | | 2,400,000 | | | | 2,419,334 | |
| | | | | | | | |
| | | | | | | $ | 3,218,693 | |
| Insurance - Property & Casualty - 1.2% | | | | | | | | |
| ACE Ltd., 2.6%, 11/23/15 | | $ | 2,890,000 | | | $ | 2,978,662 | |
| Allstate Corp., 6.2%, 5/16/14 | | | 1,490,000 | | | | 1,492,612 | |
| Aon Corp., 3.5%, 9/30/15 | | | 3,200,000 | | | | 3,319,888 | |
| AXIS Capital Holdings Ltd., 5.75%, 12/01/14 | | | 3,480,000 | | | | 3,584,463 | |
| AXIS Specialty Finance LLC, 2.65%, 4/01/19 | | | 982,000 | | | | 986,447 | |
| Berkshire Hathaway, Inc., FRN, 0.923%, 8/15/14 | | | 3,210,000 | | | | 3,216,462 | |
| QBE Insurance Group Ltd., 2.4%, 5/01/18 (n) | | | 2,969,000 | | | | 2,915,564 | |
| | | | | | | | |
| | | | | | | $ | 18,494,098 | |
17
Portfolio of Investments – continued
| | | | | | | | |
| Issuer | | Shares/Par | | | Value ($) | |
| | | | | | | | |
| Bonds - continued | | | | | | | | |
| International Market Quasi-Sovereign - 6.1% | | | | | | | | |
| Achmea Hypotheekbank N.V., FRN, 0.572%, 11/03/14 (n) | | $ | 2,500,000 | | | $ | 2,503,827 | |
| Bank Nederlandse Gemeenten N.V., 1.375%, 3/19/18 (n) | | | 4,070,000 | | | | 4,043,871 | |
| Dexia Credit Local S.A., 1.25%, 10/18/16 (n) | | | 5,210,000 | | | | 5,229,861 | |
| Dexia Credit Local S.A., 2.25%, 1/30/19 (n) | | | 2,070,000 | | | | 2,076,394 | |
| Eksportfinans A.S.A., 3%, 11/17/14 | | | 5,000,000 | | | | 5,030,000 | |
| Electricite de France, 2.15%, 1/22/19 (n) | | | 3,953,000 | | | | 3,970,508 | |
| FMS Wertmanagement, 0.625%, 4/18/16 | | | 3,360,000 | | | | 3,367,610 | |
| KfW Bankengruppe, 0.5%, 9/30/15 | | | 3,400,000 | | | | 3,409,792 | |
| Kommunalbanken A.S., 1%, 6/16/14 (n) | | | 2,080,000 | | | | 2,081,976 | |
| Kommunalbanken A.S., 1%, 2/09/15 (n) | | | 3,000,000 | | | | 3,017,640 | |
| Kommunalbanken A.S., 1.75%, 10/05/15 (n) | | | 1,000,000 | | | | 1,019,760 | |
| Kommunalbanken A.S., 0.75%, 11/21/16 (n) | | | 3,860,000 | | | | 3,847,741 | |
| Kommunalbanken A.S., FRN, 0.355%, 10/31/16 (n) | | | 4,360,000 | | | | 4,365,398 | |
| Kreditanstalt für Wiederaufbau, FRN, 0.202%, 1/23/15 | | | 4,670,000 | | | | 4,670,472 | |
| Landwirtschaftliche Rentenbank, 3.125%, 1/15/16 (n) | | | 1,700,000 | | | | 1,776,058 | |
| Municipality Finance PLC, 2.375%, 5/16/16 | | | 3,410,000 | | | | 3,531,294 | |
| Nederlandse Waterschapsbank N.V., 1.375%, 5/16/14 (n) | | | 1,550,000 | | | | 1,550,140 | |
| Nederlandse Waterschapsbank N.V., 0.75%, 3/29/16 (n) | | | 3,480,000 | | | | 3,494,463 | |
| Nederlandse Waterschapsbank N.V., 1.5%, 4/16/18 (n) | | | 3,160,000 | | | | 3,147,527 | |
| Societe Financement de l’ Economie Francaise, 3.375%, 5/05/14 (n) | | | 7,550,000 | | | | 7,550,000 | |
| Statoil A.S.A., 2.9%, 10/15/14 | | | 4,380,000 | | | | 4,432,131 | |
| Statoil A.S.A., 1.8%, 11/23/16 | | | 2,350,000 | | | | 2,408,101 | |
| Statoil A.S.A., FRN, 0.513%, 5/15/18 | | | 1,205,000 | | | | 1,205,499 | |
| Statoil A.S.A., FRN, 0.684%, 11/08/18 | | | 3,010,000 | | | | 3,031,446 | |
| Swedish Export Credit Corp., FRN, 0.986%, 8/14/14 | | | 8,640,000 | | | | 8,656,157 | |
| Westpac Banking Corp., 3.45%, 7/28/14 (n) | | | 3,370,000 | | | | 3,395,443 | |
| | | | | | | | |
| | | | | | | $ | 92,813,109 | |
| International Market Sovereign - 1.1% | | | | | | | | |
| Kingdom of Belgium, 2.875%, 9/15/14 | | $ | 2,500,000 | | | $ | 2,522,965 | |
| Kingdom of Denmark, 0.875%, 3/20/17 (z) | | | 6,840,000 | | | | 6,876,341 | |
| Kingdom of Sweden, 1%, 2/27/18 (n) | | | 3,500,000 | | | | 3,447,836 | |
| Republic of Iceland, 4.875%, 6/16/16 (n) | | | 3,494,000 | | | | 3,668,700 | |
| | | | | | | | |
| | | | | | | $ | 16,515,842 | |
| Internet - 0.1% | | | | | | | | |
| Baidu, Inc., 3.25%, 8/06/18 | | $ | 892,000 | | | $ | 911,178 | |
| | |
| Local Authorities - 1.3% | | | | | | | | |
| Kommuninvest i Sverige AB, 0.5%, 6/15/16 (n) | | $ | 5,440,000 | | | $ | 5,426,008 | |
| Kommuninvest i Sverige AB, 0.875%, 12/13/16 (n) | | | 6,350,000 | | | | 6,351,397 | |
| Province of Ontario, 2.3%, 5/10/16 | | | 4,700,000 | | | | 4,860,646 | |
18
Portfolio of Investments – continued
| | | | | | | | |
| Issuer | | Shares/Par | | | Value ($) | |
| | | | | | | | |
| Bonds - continued | | | | | | | | |
| Local Authorities - continued | | | | | | | | |
| State of Illinois, 4.961%, 3/01/16 | | $ | 3,275,000 | | | $ | 3,495,080 | |
| | | | | | | | |
| | | | | | | $ | 20,133,131 | |
| Machinery & Tools - 0.1% | | | | | | | | |
| Caterpillar Financial Services Corp., 1.1%, 5/29/15 | | $ | 1,260,000 | | | $ | 1,270,524 | |
| | |
| Major Banks - 13.0% | | | | | | | | |
| ABN AMRO Bank N.V., 1.375%, 1/22/16 (n) | | $ | 6,820,000 | | | $ | 6,877,424 | |
| Bank of America Corp., 7.375%, 5/15/14 | | | 1,075,000 | | | | 1,077,104 | |
| Bank of America Corp., 4.5%, 4/01/15 | | | 1,000,000 | | | | 1,034,994 | |
| Bank of America Corp., 1.5%, 10/09/15 | | | 3,060,000 | | | | 3,089,110 | |
| Bank of America Corp., 1.25%, 1/11/16 | | | 5,250,000 | | | | 5,280,765 | |
| Bank of America Corp., 6.5%, 8/01/16 | | | 2,625,000 | | | | 2,928,376 | |
| Bank of America Corp., FRN, 0.513%, 6/15/16 | | | 1,910,000 | | | | 1,895,283 | |
| Bank of Montreal, FRN, 0.829%, 4/09/18 | | | 1,990,000 | | | | 2,001,751 | |
| Bank of Nova Scotia, FRN, 0.633%, 3/15/16 | | | 5,890,000 | | | | 5,906,722 | |
| Bank of Nova Scotia, FRN, 0.746%, 7/15/16 | | | 1,990,000 | | | | 1,998,854 | |
| Barclays Bank PLC, 5.2%, 7/10/14 | | | 3,660,000 | | | | 3,692,391 | |
| Barclays Bank PLC, 2.5%, 2/20/19 | | | 4,500,000 | | | | 4,544,487 | |
| BNP Paribas, 2.7%, 8/20/18 | | | 4,370,000 | | | | 4,475,068 | |
| BNP Paribas, FRN, 0.824%, 12/12/16 | | | 1,280,000 | | | | 1,287,963 | |
| BNP Paribas, FRN, 0.713%, 3/17/17 | | | 3,010,000 | | | | 3,018,563 | |
| Canadian Imperial Bank of Commerce, FRN, 0.748%, 7/18/16 | | | 2,270,000 | | | | 2,284,128 | |
| Commonwealth Bank of Australia, 3.75%, 10/15/14 (n) | | | 4,574,000 | | | | 4,642,610 | |
| Commonwealth Bank of Australia, FRN, 0.735%, 9/20/16 (n) | | | 4,820,000 | | | | 4,844,028 | |
| Commonwealth Bank of Australia, FRN, 0.593%, 3/13/17 (z) | | | 1,510,000 | | | | 1,510,435 | |
| Credit Suisse New York, 5.5%, 5/01/14 | | | 4,630,000 | | | | 4,630,000 | |
| DBS Bank Ltd., 2.35%, 2/28/17 (n) | | | 4,010,000 | | | | 4,124,104 | |
| DNB Bank A.S.A., 3.2%, 4/03/17 (n) | | | 4,190,000 | | | | 4,409,807 | |
| Goldman Sachs Group, Inc., 5.125%, 1/15/15 | | | 3,930,000 | | | | 4,052,506 | |
| Goldman Sachs Group, Inc., 1.6%, 11/23/15 | | | 3,690,000 | | | | 3,728,623 | |
| Goldman Sachs Group, Inc., FRN, 1.234%, 11/21/14 | | | 2,000,000 | | | | 2,008,236 | |
| Goldman Sachs Group, Inc., FRN, 1.425%, 4/30/18 | | | 2,310,000 | | | | 2,342,689 | |
| Goldman Sachs Group, Inc., FRN, 1.323%, 11/15/18 | | | 3,020,000 | | | | 3,050,653 | |
| HSBC Bank PLC, 3.1%, 5/24/16 (n) | | | 2,520,000 | | | | 2,634,814 | |
| HSBC Bank PLC, FRN, 0.863%, 5/15/18 (n) | | | 3,872,000 | | | | 3,901,257 | |
| HSBC USA, Inc., 2.375%, 2/13/15 | | | 1,650,000 | | | | 1,676,209 | |
| Huntington National Bank, FRN, 0.654%, 4/24/17 | | | 7,240,000 | | | | 7,251,005 | |
| ING Bank N.V., 3.75%, 3/07/17 (n) | | | 2,644,000 | | | | 2,812,989 | |
| ING Bank N.V., FRN, 1.184%, 3/07/16 (n) | | | 1,450,000 | | | | 1,464,374 | |
| ING Bank N.V., FRN, 1.873%, 9/25/15 (n) | | | 3,680,000 | | | | 3,749,449 | |
| JPMorgan Chase & Co., 2%, 8/15/17 | | | 2,087,000 | | | | 2,117,986 | |
| JPMorgan Chase & Co., FRN, 0.983%, 5/02/14 | | | 4,620,000 | | | | 4,620,000 | |
19
Portfolio of Investments – continued
| | | | | | | | |
| Issuer | | Shares/Par | | | Value ($) | |
| | | | | | | | |
| Bonds - continued | | | | | | | | |
| Major Banks - continued | | | | | | | | |
| JPMorgan Chase & Co., FRN, 0.854%, 2/26/16 | | $ | 2,500,000 | | | $ | 2,513,130 | |
| KeyCorp, 3.75%, 8/13/15 | | | 3,850,000 | | | | 3,998,025 | |
| Kookmin Bank, 7.25%, 5/14/14 (n) | | | 2,200,000 | | | | 2,203,577 | |
| Morgan Stanley, 6%, 5/13/14 | | | 2,060,000 | | | | 2,062,550 | |
| Morgan Stanley, 6%, 4/28/15 | | | 3,290,000 | | | | 3,461,475 | |
| Morgan Stanley, FRN, 1.485%, 2/25/16 | | | 3,410,000 | | | | 3,459,036 | |
| National Australia Bank Ltd., 2%, 3/09/15 | | | 4,810,000 | | | | 4,876,647 | |
| Nordea Bank AB, FRN, 0.684%, 5/13/16 (n) | | | 2,802,000 | | | | 2,817,271 | |
| Nordea Bank AB, FRN, 0.59%, 4/04/17 (n) | | | 2,900,000 | | | | 2,901,699 | |
| PNC Bank N.A., 1.3%, 10/03/16 | | | 3,180,000 | | | | 3,207,895 | |
| PNC Bank N.A., 1.15%, 11/01/16 | | | 4,550,000 | | | | 4,570,707 | |
| PNC Funding Corp., 3.625%, 2/08/15 | | | 2,300,000 | | | | 2,357,362 | |
| Royal Bank of Canada, 0.8%, 10/30/15 | | | 3,000,000 | | | | 3,013,830 | |
| Royal Bank of Canada, FRN, 0.695%, 9/09/16 | | | 2,920,000 | | | | 2,934,390 | |
| Royal Bank of Scotland PLC, 2.55%, 9/18/15 | | | 1,000,000 | | | | 1,021,323 | |
| Royal Bank of Scotland PLC, 4.375%, 3/16/16 | | | 4,880,000 | | | | 5,191,925 | |
| Standard Chartered PLC, 3.85%, 4/27/15 (n) | | | 3,730,000 | | | | 3,841,564 | |
| Standard Chartered PLC, FRN, 1.184%, 5/12/14 (n) | | | 2,700,000 | | | | 2,700,610 | |
| State Street Corp., 4.3%, 5/30/14 | | | 3,750,000 | | | | 3,760,219 | |
| Sumitomo Mitsui Banking Corp., 1.35%, 7/18/15 | | | 3,770,000 | | | | 3,805,725 | |
| Wells Fargo & Co., 3.75%, 10/01/14 | | | 1,350,000 | | | | 1,369,104 | |
| Wells Fargo & Co., 1.25%, 2/13/15 | | | 5,320,000 | | | | 5,357,969 | |
| Wells Fargo & Co., FRN, 0.758%, 7/20/16 | | | 3,550,000 | | | | 3,569,848 | |
| Westpac Banking Corp., 2%, 8/14/17 | | | 1,780,000 | | | | 1,813,854 | |
| | | | | | | | |
| | | | | | | $ | 197,774,492 | |
| Medical & Health Technology & Services - 1.7% | | | | | | | | |
| Baxter International, Inc., 1.85%, 1/15/17 | | $ | 2,610,000 | | | $ | 2,662,967 | |
| Becton, Dickinson & Co., 1.75%, 11/08/16 | | | 2,030,000 | | | | 2,074,317 | |
| Catholic Health Initiatives, 1.6%, 11/01/17 | | | 2,480,000 | | | | 2,432,458 | |
| Covidien International Finance S.A., 1.35%, 5/29/15 | | | 2,440,000 | | | | 2,462,111 | |
| Express Scripts Holding Co., 2.1%, 2/12/15 | | | 4,225,000 | | | | 4,273,562 | |
| McKesson Corp., 0.95%, 12/04/15 | | | 3,090,000 | | | | 3,098,803 | |
| McKesson Corp., 3.25%, 3/01/16 | | | 4,190,000 | | | | 4,369,998 | |
| McKesson Corp., FRN, 0.635%, 9/10/15 | | | 1,280,000 | | | | 1,281,564 | |
| Thermo Fisher Scientific, Inc., 2.25%, 8/15/16 | | | 2,960,000 | | | | 3,042,543 | |
| | | | | | | | |
| | | | | | | $ | 25,698,323 | |
| Metals & Mining - 1.4% | | | | | | | | |
| Barrick Gold Corp., 2.5%, 5/01/18 | | $ | 1,770,000 | | | $ | 1,781,353 | |
| Barrick International (Barbados) Corp., 5.75%, 10/15/16 (n) | | | 1,307,000 | | | | 1,437,790 | |
| Freeport-McMoRan Copper & Gold, Inc., 2.15%, 3/01/17 | | | 4,750,000 | | | | 4,821,298 | |
| Freeport-McMoRan Copper & Gold, Inc., 2.375%, 3/15/18 | | | 1,620,000 | | | | 1,629,182 | |
| Glencore Funding LLC, FRN, 1.394%, 5/27/16 (n) | | | 5,690,000 | | | | 5,720,220 | |
20
Portfolio of Investments – continued
| | | | | | | | |
| Issuer | | Shares/Par | | | Value ($) | |
| | | | | | | | |
| Bonds - continued | | | | | | | | |
| Metals & Mining - continued | | | | | | | | |
| Rio Tinto Finance (USA) Ltd., 2.5%, 5/20/16 | | $ | 2,210,000 | | | $ | 2,284,183 | |
| Rio Tinto Finance (USA) Ltd., FRN, 1.073%, 6/17/16 | | | 4,020,000 | | | | 4,061,631 | |
| | | | | | | | |
| | | | | | | $ | 21,735,657 | |
| Mortgage-Backed - 2.1% | | | | | | | | |
| Fannie Mae, 5.5%, 12/01/14 - 2/01/19 | | $ | 1,024,654 | | | $ | 1,090,337 | |
| Fannie Mae, 7%, 3/01/15 - 9/01/16 | | | 162,109 | | | | 168,311 | |
| Fannie Mae, 5.132%, 2/01/16 | | | 645,820 | | | | 681,825 | |
| Fannie Mae, 6.5%, 3/01/16 - 6/01/17 | | | 517,339 | | | | 544,497 | |
| Fannie Mae, 5.732%, 7/01/16 | | | 1,889,046 | | | | 2,058,264 | |
| Fannie Mae, 1.114%, 2/25/17 | | | 4,070,000 | | | | 4,059,829 | |
| Fannie Mae, 6%, 3/01/17 - 12/01/17 | | | 534,277 | | | | 559,124 | |
| Fannie Mae, 5%, 2/01/18 - 7/01/23 | | | 1,285,322 | | | | 1,385,547 | |
| Fannie Mae, 4.5%, 10/01/18 - 3/01/23 | | | 1,625,467 | | | | 1,730,091 | |
| Fannie Mae, 5%, 12/01/20 (f) | | | 1,419,425 | | | | 1,529,128 | |
| Fannie Mae, FRN, 2.335%, 2/01/33 | | | 113,183 | | | | 119,192 | |
| Fannie Mae, FRN, 2.23%, 3/01/33 | | | 105,789 | | | | 107,134 | |
| Fannie Mae, FRN, 2.326%, 5/01/33 | | | 616,334 | | | | 661,790 | |
| Freddie Mac, 7.5%, 5/01/15 | | | 23,038 | | | | 23,009 | |
| Freddie Mac, 6%, 4/01/16 - 8/01/17 | | | 310,107 | | | | 321,675 | |
| Freddie Mac, 1.655%, 11/25/16 | | | 281,484 | | | | 286,316 | |
| Freddie Mac, 1.426%, 8/25/17 | | | 1,039,000 | | | | 1,046,834 | |
| Freddie Mac, 5.5%, 9/01/17 - 6/01/25 | | | 1,665,018 | | | | 1,812,997 | |
| Freddie Mac, 5%, 5/01/18 - 8/01/20 | | | 1,392,515 | | | | 1,494,978 | |
| Freddie Mac, 2.5%, 7/01/28 | | | 11,338,889 | | | | 11,418,422 | |
| Ginnie Mae, FRN, 1.625%, 7/20/32 | | | 140,435 | | | | 145,345 | |
| | | | | | | | |
| | | | | | | $ | 31,244,645 | |
| Municipals - 0.5% | | | | | | | | |
| Florida Hurricane Catastrophe Fund Finance Corp. Rev., “A”, 1.298%, 7/01/16 | | $ | 7,060,000 | | | $ | 7,136,460 | |
| | |
| Natural Gas - Distribution - 0.3% | | | | | | | | |
| GDF Suez, 1.625%, 10/10/17 (n) | | $ | 4,630,000 | | | $ | 4,650,266 | |
| | |
| Natural Gas - Pipeline - 1.1% | | | | | | | | |
| EnLink Midstream Partners LP, 2.7%, 4/01/19 | | $ | 2,163,000 | | | $ | 2,178,526 | |
| Enterprise Products Operating LP, 3.7%, 6/01/15 | | | 4,320,000 | | | | 4,460,625 | |
| Enterprise Products Operating LP, 3.2%, 2/01/16 | | | 740,000 | | | | 770,625 | |
| Enterprise Products Operating LP, 6.5%, 1/31/19 | | | 1,280,000 | | | | 1,512,893 | |
| ONEOK Partners LP, 3.2%, 9/15/18 | | | 2,400,000 | | | | 2,493,086 | |
| TransCanada PipeLines Ltd., 3.4%, 6/01/15 | | | 4,100,000 | | | | 4,224,816 | |
| TransCanada PipeLines Ltd., FRN, 0.914%, 6/30/16 | | | 1,390,000 | | | | 1,401,698 | |
| | | | | | | | |
| | | | | | | $ | 17,042,269 | |
21
Portfolio of Investments – continued
| | | | | | | | |
| Issuer | | Shares/Par | | | Value ($) | |
| | | | | | | | |
| Bonds - continued | | | | | | | | |
| Network & Telecom - 2.7% | | | | | | | | |
| AT&T, Inc., 0.8%, 12/01/15 | | $ | 4,010,000 | | | $ | 4,024,524 | |
| AT&T, Inc., 2.4%, 8/15/16 | | | 2,750,000 | | | | 2,837,211 | |
| AT&T, Inc., FRN, 0.619%, 2/12/16 | | | 2,330,000 | | | | 2,336,394 | |
| AT&T, Inc., FRN, 1.144%, 11/27/18 | | | 3,850,000 | | | | 3,924,255 | |
| BellSouth Corp., 5.2%, 9/15/14 | | | 2,207,000 | | | | 2,244,941 | |
| British Telecommunications PLC, 2.35%, 2/14/19 | | | 2,970,000 | | | | 2,975,206 | |
| France Telecom, 2.125%, 9/16/15 | | | 1,900,000 | | | | 1,931,778 | |
| Verizon Communications, Inc., 0.7%, 11/02/15 | | | 3,210,000 | | | | 3,215,319 | |
| Verizon Communications, Inc., 2%, 11/01/16 | | | 2,610,000 | | | | 2,673,462 | |
| Verizon Communications, Inc., FRN, 1.763%, 9/15/16 | | | 7,500,000 | | | | 7,718,183 | |
| Verizon Communications, Inc., FRN, 1.003%, 6/17/19 | | | 6,730,000 | | | | 6,811,029 | |
| | | | | | | | |
| | | | | | | $ | 40,692,302 | |
| Oil Services - 0.5% | | | | | | | | |
| Noble Corp., 3.45%, 8/01/15 | | $ | 2,270,000 | | | $ | 2,344,613 | |
| Transocean, Inc., 5.05%, 12/15/16 | | | 3,533,000 | | | | 3,843,597 | |
| Transocean, Inc., 2.5%, 10/15/17 | | | 1,970,000 | | | | 2,003,703 | |
| | | | | | | | |
| | | | | | | $ | 8,191,913 | |
| Oils - 0.2% | | | | | | | | |
| Phillips 66, 1.95%, 3/05/15 | | $ | 2,680,000 | | | $ | 2,712,983 | |
| | |
| Other Banks & Diversified Financials - 8.7% | | | | | | | | |
| Abbey National Treasury Services PLC, 3.05%, 8/23/18 | | $ | 2,403,000 | | | $ | 2,502,787 | |
| American Express Centurion Bank, FRN, 0.674%, 11/13/15 | | | 2,750,000 | | | | 2,761,731 | |
| American Express Credit Corp., FRN, 1.334%, 6/12/15 | | | 2,400,000 | | | | 2,426,206 | |
| Banco Santander Chile, FRN, 1.126%, 4/11/17 (z) | | | 3,830,000 | | | | 3,830,034 | |
| Bank of Tokyo-Mitsubishi UFJ Ltd., FRN, 0.684%, 2/26/16 (n) | | | 2,100,000 | | | | 2,103,841 | |
| Bank of Tokyo-Mitsubishi UFJ Ltd., FRN, 0.845%, 9/09/16 (n) | | | 6,220,000 | | | | 6,256,325 | |
| Banque Federative du Credit Mutuel, FRN, 1.078%, 10/28/16 (n) | | | 2,780,000 | | | | 2,795,774 | |
| Banque Federative du Credit Mutuel, FRN, 1.078%, 1/20/17 (n) | | | 1,150,000 | | | | 1,156,186 | |
| BBVA Senior Finance S.A. Unipersonal, FRN, 2.361%, 5/16/14 | | | 3,500,000 | | | | 3,502,019 | |
| Capital One Financial Corp., 2.15%, 3/23/15 | | | 1,752,000 | | | | 1,777,860 | |
| Capital One Financial Corp., FRN, 1.376%, 7/15/14 | | | 4,550,000 | | | | 4,559,500 | |
| Capital One Financial Corp., FRN, 0.862%, 11/06/15 | | | 2,000,000 | | | | 2,009,576 | |
| Citigroup, Inc., 6.375%, 8/12/14 | | | 2,380,000 | | | | 2,417,787 | |
| Citigroup, Inc., 6.01%, 1/15/15 | | | 1,880,000 | | | | 1,950,030 | |
| Citigroup, Inc., 1.25%, 1/15/16 | | | 6,000,000 | | | | 6,033,372 | |
| Danske Bank A.S., 3.75%, 4/01/15 (n) | | | 360,000 | | | | 370,181 | |
| Fifth Third Bancorp, 1.35%, 6/01/17 | | | 7,000,000 | | | | 6,999,216 | |
| Fifth Third Bancorp, 2.3%, 3/01/19 | | | 1,859,000 | | | | 1,855,542 | |
| Groupe BPCE S.A., 2.5%, 12/10/18 | | | 2,520,000 | | | | 2,538,043 | |
| Groupe BPCE S.A., FRN, 1.479%, 4/25/16 | | | 6,800,000 | | | | 6,903,999 | |
22
Portfolio of Investments – continued
| | | | | | | | |
| Issuer | | Shares/Par | | | Value ($) | |
| | | | | | | | |
| Bonds - continued | | | | | | | | |
| Other Banks & Diversified Financials - continued | | | | | | | | |
| Intesa Sanpaolo S.p.A., 3.125%, 1/15/16 | | $ | 3,600,000 | | | $ | 3,704,303 | |
| Intesa Sanpaolo S.p.A., 2.375%, 1/13/17 | | | 1,950,000 | | | | 1,969,867 | |
| Lloyds Bank PLC, 2.3%, 11/27/18 | | | 1,700,000 | | | | 1,711,701 | |
| Lloyds TSB Bank PLC, 4.375%, 1/12/15 (n) | | | 5,110,000 | | | | 5,246,744 | |
| Macquarie Bank Ltd., 5%, 2/22/17 (n) | | | 6,790,000 | | | | 7,416,106 | |
| National Bank of Canada, 1.5%, 6/26/15 | | | 2,970,000 | | | | 3,002,462 | |
| Rabobank Nederland N.V., 4.2%, 5/13/14 (n) | | | 3,770,000 | | | | 3,773,016 | |
| Rabobank Nederland N.V., 3.375%, 1/19/17 | | | 3,967,000 | | | | 4,208,685 | |
| Rabobank Nederland N.V., FRN, 0.715%, 3/18/16 | | | 1,990,000 | | | | 2,001,550 | |
| Santander Holdings USA, Inc., 3.45%, 8/27/18 | | | 2,280,000 | | | | 2,381,189 | |
| Santander UK PLC, 3.875%, 11/10/14 (n) | | | 4,525,000 | | | | 4,603,658 | |
| Skandinaviska Enskilda, 1.75%, 3/19/18 (n) | | | 2,500,000 | | | | 2,480,775 | |
| SunTrust Banks, Inc., 3.5%, 1/20/17 | | | 4,907,000 | | | | 5,192,833 | |
| Svenska Handelsbanken AB, 4.875%, 6/10/14 (n) | | | 3,330,000 | | | | 3,344,985 | |
| Svenska Handelsbanken AB, 2.875%, 4/04/17 | | | 3,548,000 | | | | 3,714,163 | |
| Svenska Handelsbanken AB, FRN, 0.684%, 3/21/16 | | | 1,000,000 | | | | 1,004,743 | |
| Svenska Handelsbanken AB, FRN, 0.704%, 9/23/16 | | | 4,500,000 | | | | 4,522,509 | |
| Swedbank AB, 2.125%, 9/29/17 (n) | | | 4,637,000 | | | | 4,712,045 | |
| Union Bank, 3%, 6/06/16 | | | 1,910,000 | | | | 1,993,985 | |
| | | | | | | | |
| | | | | | | $ | 131,735,328 | |
| Personal Computers & Peripherals - 0.3% | | | | | | | | |
| Hewlett-Packard Co., 2.625%, 12/09/14 | | $ | 4,120,000 | | | $ | 4,168,476 | |
| | |
| Pharmaceuticals - 1.9% | | | | | | | | |
| AbbVie, Inc., FRN, 0.996%, 11/06/15 | | $ | 4,440,000 | | | $ | 4,481,243 | |
| Amgen, Inc., 2.3%, 6/15/16 | | | 3,570,000 | | | | 3,669,096 | |
| Bristol-Myers Squibb Co., 0.875%, 8/01/17 | | | 3,507,000 | | | | 3,477,131 | |
| Celgene Corp., 2.45%, 10/15/15 | | | 5,312,000 | | | | 5,432,333 | |
| Mylan, Inc., 1.8%, 6/24/16 | | | 2,710,000 | | | | 2,747,151 | |
| Mylan, Inc., 1.35%, 11/29/16 | | | 1,785,000 | | | | 1,790,921 | |
| Sanofi, 1.2%, 9/30/14 | | | 650,000 | | | | 652,518 | |
| Sanofi, 1.25%, 4/10/18 | | | 5,060,000 | | | | 4,985,041 | |
| Watson Pharmaceuticals, Inc., 1.875%, 10/01/17 | | | 2,240,000 | | | | 2,259,320 | |
| | | | | | | | |
| | | | | | | $ | 29,494,754 | |
| Printing & Publishing - 0.6% | | | | | | | | |
| Pearson Dollar Finance PLC, 5.7%, 6/01/14 (n) | | $ | 4,900,000 | | | $ | 4,916,121 | |
| Thomson Reuters Corp., 0.875%, 5/23/16 | | | 3,530,000 | | | | 3,526,315 | |
| | | | | | | | |
| | | | | | | $ | 8,442,436 | |
| Real Estate - 0.8% | | | | | | | | |
| ERP Operating, REIT, 5.125%, 3/15/16 | | $ | 2,738,000 | | | $ | 2,951,616 | |
| Health Care REIT, Inc., 2.25%, 3/15/18 | | | 1,686,000 | | | | 1,705,923 | |
23
Portfolio of Investments – continued
| | | | | | | | |
| Issuer | | Shares/Par | | | Value ($) | |
| | | | | | | | |
| Bonds - continued | | | | | | | | |
| Real Estate - continued | | | | | | | | |
| Mack-Cali Realty LP, 2.5%, 12/15/17 | | $ | 2,000,000 | | | $ | 2,022,734 | |
| Simon Property Group, Inc., REIT, 4.2%, 2/01/15 | | | 1,000,000 | | | | 1,018,332 | |
| Simon Property Group, Inc., REIT, 1.5%, 2/01/18 (n) | | | 1,935,000 | | | | 1,911,964 | |
| Ventas Realty LP, 1.55%, 9/26/16 | | | 2,160,000 | | | | 2,182,963 | |
| | | | | | | | |
| | | | | | | $ | 11,793,532 | |
| Retailers - 0.3% | | | | | | | | |
| Wesfarmers Ltd., 2.983%, 5/18/16 (n) | | $ | 2,900,000 | | | $ | 3,017,511 | |
| Wesfarmers Ltd., 1.874%, 3/20/18 (n) | | | 2,068,000 | | | | 2,051,084 | |
| | | | | | | | |
| | | | | | | $ | 5,068,595 | |
| Specialty Chemicals - 0.7% | | | | | | | | |
| Airgas, Inc., 4.5%, 9/15/14 | | $ | 5,480,000 | | | $ | 5,553,547 | |
| Ecolab, Inc., 2.375%, 12/08/14 | | | 2,570,000 | | | | 2,598,147 | |
| Ecolab, Inc., 1%, 8/09/15 | | | 2,520,000 | | | | 2,531,743 | |
| | | | | | | | |
| | | | | | | $ | 10,683,437 | |
| Supermarkets - 0.4% | | | | | | | | |
| Tesco PLC, 2%, 12/05/14 (n) | | $ | 3,510,000 | | | $ | 3,537,866 | |
| Woolworths Ltd., 2.55%, 9/22/15 (n) | | | 1,900,000 | | | | 1,945,068 | |
| | | | | | | | |
| | | | | | | $ | 5,482,934 | |
| Supranational - 0.7% | | | | | | | | |
| Central American Bank for Economic Integration, 5.375%, 9/24/14 (n) | | $ | 4,240,000 | | | $ | 4,307,611 | |
| International Bank for Reconstruction and Development, 0.5%, 4/15/16 | | | 6,860,000 | | | | 6,863,650 | |
| | | | | | | | |
| | | | | | | $ | 11,171,261 | |
| Telecommunications - Wireless - 0.5% | | | | | | | | |
| America Movil S.A.B. de C.V., 2.375%, 9/08/16 | | $ | 1,564,000 | | | $ | 1,607,826 | |
| American Tower Trust I, REIT, 1.551%, 3/15/18 (n) | | | 2,840,000 | | | | 2,783,101 | |
| Crown Castle Towers LLC, 3.214%, 8/15/15 (n) | | | 2,730,000 | | | | 2,779,831 | |
| | | | | | | | |
| | | | | | | $ | 7,170,758 | |
| Tobacco - 0.7% | | | | | | | | |
| B.A.T. International Finance PLC, 1.4%, 6/05/15 (n) | | $ | 2,820,000 | | | $ | 2,844,069 | |
| Imperial Tobacco Finance PLC, 2.05%, 2/11/18 (n) | | | 2,206,000 | | | | 2,200,507 | |
| Lorillard Tobacco Co., 3.5%, 8/04/16 | | | 2,590,000 | | | | 2,730,637 | |
| Reynolds American, Inc., 1.05%, 10/30/15 | | | 2,650,000 | | | | 2,655,141 | |
| | | | | | | | |
| | | | | | | $ | 10,430,354 | |
| Transportation - Services - 0.2% | | | | | | | | |
| ERAC USA Finance Co., 2.75%, 3/15/17 (n) | | $ | 2,408,000 | | | $ | 2,483,508 | |
24
Portfolio of Investments – continued
| | | | | | | | |
| Issuer | | Shares/Par | | | Value ($) | |
| | | | | | | | |
| Bonds - continued | | | | | | | | |
| U.S. Government Agencies and Equivalents - 0.4% | | | | | | | | |
| Private Export Funding Corp., 1.875%, 7/15/18 | | $ | 5,240,000 | | | $ | 5,289,198 | |
| Small Business Administration, 5.1%, 1/01/16 | | | 320,169 | | | | 327,444 | |
| Small Business Administration, 5.46%, 3/01/16 | | | 233,154 | | | | 239,350 | |
| Small Business Administration, 5.68%, 5/01/16 | | | 286,602 | | | | 294,868 | |
| Small Business Administration, 5.94%, 7/01/16 | | | 123,053 | | | | 127,284 | |
| Small Business Administration, 5.37%, 9/01/16 | | | 139,332 | | | | 144,076 | |
| | | | | | | | |
| | | | | | | $ | 6,422,220 | |
| U.S. Treasury Obligations - 5.3% | | | | | | | | |
| U.S. Treasury Notes, 0.375%, 3/15/16 | | $ | 15,000,000 | | | $ | 15,002,925 | |
| U.S. Treasury Notes, 1.5%, 6/30/16 (f) | | | 64,000,000 | | | | 65,379,968 | |
| | | | | | | | |
| | | | | | | $ | 80,382,893 | |
| Utilities - Electric Power - 3.3% | | | | | | | | |
| American Electric Power Co., Inc., 1.65%, 12/15/17 | | $ | 2,570,000 | | | $ | 2,566,978 | |
| Duke Energy Corp., 3.35%, 4/01/15 | | | 960,000 | | | | 984,801 | |
| Duke Energy Corp., 1.625%, 8/15/17 | | | 1,410,000 | | | | 1,422,676 | |
| Duke Energy Corp., FRN, 0.61%, 4/03/17 | | | 1,800,000 | | | | 1,806,255 | |
| Duke Energy Indiana, Inc., FRN, 0.578%, 7/11/16 | | | 1,760,000 | | | | 1,762,436 | |
| Enel Finance International S.A., 3.875%, 10/07/14 (n) | | | 3,300,000 | | | | 3,342,709 | |
| Enel Finance International S.A., 6.25%, 9/15/17 (n) | | | 670,000 | | | | 761,261 | |
| Iberdrola Finance Ireland Ltd., 3.8%, 9/11/14 (n) | | | 5,150,000 | | | | 5,205,357 | |
| ITC Holdings Corp., 5.875%, 9/30/16 (n) | | | 2,216,000 | | | | 2,424,727 | |
| NextEra Energy Capital Co., 1.2%, 6/01/15 | | | 3,610,000 | | | | 3,631,245 | |
| NextEra Energy Capital Holdings, Inc., 1.611%, 6/01/14 | | | 2,600,000 | | | | 2,602,382 | |
| NextEra Energy Capital Holdings, Inc., 1.339%, 9/01/15 | | | 950,000 | | | | 957,870 | |
| Niagara Mohawk Power Corp., 3.553%, 10/01/14 (n) | | | 3,280,000 | | | | 3,321,423 | |
| PG&E Corp., 2.4%, 3/01/19 | | | 3,378,000 | | | | 3,388,566 | |
| PPL WEM Holdings PLC, 3.9%, 5/01/16 (n) | | | 4,710,000 | | | | 4,942,227 | |
| PSEG Power LLC, 2.75%, 9/15/16 | | | 2,570,000 | | | | 2,668,043 | |
| Southern Co., 4.15%, 5/15/14 | | | 2,260,000 | | | | 2,262,375 | |
| Southern Co., 2.375%, 9/15/15 | | | 2,530,000 | | | | 2,590,836 | |
| Southern Co., 2.45%, 9/01/18 | | | 2,700,000 | | | | 2,757,845 | |
| | | | | | | | |
| | | | | | | $ | 49,400,012 | |
| Total Bonds (Identified Cost, $1,468,456,673) | | | | | | $ | 1,476,751,133 | |
| | |
| Money Market Funds - 2.2% | | | | | | | | |
MFS Institutional Money Market Portfolio, 0.09%,
at Cost and Net Asset Value (v) | | | 33,030,122 | | | $ | 33,030,122 | |
| Total Investments (Identified Cost, $1,501,486,795) | | | | | | $ | 1,509,781,255 | |
| | |
| Other Assets, Less Liabilities - 0.6% | | | | | | | 8,621,132 | |
| Net Assets - 100.0% | | | | | | $ | 1,518,402,387 | |
25
Portfolio of Investments – continued
| (d) | In default. Interest and/or scheduled principal payment(s) have been missed. |
| (f) | All or a portion of the security has been segregated as collateral for open futures contracts and cleared swap agreements. |
| (i) | Interest only security for which the fund receives interest on notional principal (Par amount). Par amount shown is the notional principal and does not reflect the cost of the security. |
| (n) | Securities exempt from registration under Rule 144A of the Securities Act of 1933. These securities may be sold in the ordinary course of business in transactions exempt from registration, normally to qualified institutional buyers. At period end, the aggregate value of these securities was $473,326,113 representing 31.2% of net assets. |
| (q) | Interest received was less than stated coupon rate. |
| (v) | Underlying affiliated fund that is available only to investment companies managed by MFS. The rate quoted for the MFS Institutional Money Market Portfolio is the annualized seven-day yield of the fund at period end. |
| (z) | Restricted securities are not registered under the Securities Act of 1933 and are subject to legal restrictions on resale. These securities generally may be resold in transactions exempt from registration or to the public if the securities are subsequently registered. Disposal of these securities may involve time-consuming negotiations and prompt sale at an acceptable price may be difficult. The fund holds the following restricted securities: |
| | | | | | | | | | |
| Restricted Securities | | Acquisition
Date | | Cost | | | Value | |
| ARI Fleet Lease Trust, “A2”, 0.81%, 11/15/22 | | 4/01/14 | | | $2,559,936 | | | | $2,559,936 | |
| Banco Santander Chile, FRN, 1.126%, 4/11/17 | | 4/08/14 | | | 3,830,000 | | | | 3,830,034 | |
| Bayview Commercial Asset Trust, FRN, 0.462%, 8/25/35 | | 6/09/05 | | | 885,588 | | | | 785,015 | |
| Bayview Commercial Asset Trust, FRN, 0.422%, 4/25/36 | | 2/23/06 | | | 767,771 | | | | 666,228 | |
| Bayview Commercial Asset Trust, FRN, 0%, 7/25/36 | | 5/16/06 | | | 287,044 | | | | 0 | |
| Bayview Financial Revolving Mortgage Loan Trust, FRN, 1.752%, 12/28/40 | | 3/01/06 | | | 843,374 | | | | 558,090 | |
| Commercial Mortgage Asset Trust, FRN, 0.811%, 1/17/32 | | 8/25/03 | | | 23,561 | | | | 20,748 | |
| Commonwealth Bank of Australia, FRN, 0.593%, 3/13/17 | | 3/05/14 | | | 1,510,000 | | | | 1,510,435 | |
| Enterprise Fleet Financing LLC, 2014-1, “A2”, 0.87%, 9/20/19 | | 2/11/14 | | | 6,069,744 | | | | 6,069,448 | |
| Gramercy Real Estate Ltd., CDO, FRN, 0.549%, 7/25/35 | | 6/21/05-1/18/07 | | | 353,400 | | | | 349,894 | |
| Kingdom of Denmark, 0.875%, 3/20/17 | | 3/11/14 | | | 6,834,743 | | | | 6,876,341 | |
| Kubota Credit Owner Trust, “A2”, 0.58%, 2/15/17 | | 4/15/14 | | | 2,649,764 | | | | 2,649,701 | |
| Morgan Stanley Capital I, Inc., FRN, 1.715%, 3/15/31 | | 6/10/03 | | | 12,724 | | | | 13 | |
| New Residential Advance Receivables Tust, 2014-T1, “A1”, 1.274%, 3/15/45 | | 3/13/14 | | | 3,200,000 | | | | 3,200,640 | |
| Petroleos Mexicanos, 3.125%, 1/23/19 | | 1/15/14 | | | 2,522,000 | | | | 2,581,898 | |
| Total Restricted Securities | | | | $31,658,421 | |
| % of Net assets | | | | 2.1% | |
26
Portfolio of Investments – continued
The following abbreviations are used in this report and are defined:
| CDO | | Collateralized Debt Obligation |
| CLO | | Collateralized Loan Obligation |
| FRN | | Floating Rate Note. Interest rate resets periodically and may not be the rate reported at period end. |
| PLC | | Public Limited Company |
| REIT | | Real Estate Investment Trust |
Derivative Contracts at 4/30/14
Futures Contracts at 4/30/14
| | | | | | | | | | | | | | | | | | |
| Description | | Currency | | | Contracts | | | Value | | Expiration
Date | | | Unrealized
Appreciation
(Depreciation) | |
| Asset Derivatives | | | | | | | | | | | | | | | | | | |
| Interest Rate Futures | | | | | | | | | | | | | | | | | | |
| U.S. Treasury Note 5 yr (Short) | | | USD | | | | 101 | | | $12,064,766 | | | June - 2014 | | | | $50,453 | |
| | | | | | | | | | | | | | | | | | |
Cleared Swap Agreements at 4/30/14
| | | | | | | | | | | | | | | | | | |
| Expiration | | | Notional
Amount | | | Counterparty | | Cash Flows to
Receive | | Cash Flows
to Pay | | Fair
Value | |
| Asset Derivatives | | | | | | | | | | | |
| Credit Default Swap Agreements | | | | | | | | |
| 12/20/18 | | | USD | | | | 20,000,000 | | | Merrill Lynch International (a) | | 1.00% (fixed rate) | | (1) | | | $413,571 | |
| | | | | | | | | | | | | | | | | | |
| (1) | Fund, as protection seller, to pay notional amount upon a defined credit event by a reference obligation specified in the Markit CDX North America Investment Grade Index, a BBB+ rated credit default index. The fund entered into the contract to manage market/sector exposure. |
| (a) | Net unamortized premiums paid by the fund amounted to $146,189. |
The credit ratings presented here are an indicator of the current payment/performance risk of the related swap agreement, the reference obligation for which may be either a single security or, in the case of a credit default index, a basket of securities issued by corporate or sovereign issuers. Ratings are assigned to each reference security, including each individual security within a reference basket of securities, utilizing ratings from Moody’s, Fitch, and Standard & Poor’s rating agencies and applying the following hierarchy: If all three agencies provide a rating, the middle rating (after dropping the highest and lowest ratings) is assigned; if two of the three agencies rate a security, the lower of the two is assigned. Ratings are shown in the S&P and Fitch scale (e.g., AAA). The ratings for a credit default index are calculated by MFS as a weighted average of the external credit ratings of the individual securities that compose the index’s reference basket of securities.
At April 30, 2014, the fund had liquid securities with an aggregate value of $492,531 to cover any commitments for certain derivative contracts.
See Notes to Financial Statements
27
Financial Statements
STATEMENT OF ASSETS AND LIABILITIES
At 4/30/14
This statement represents your fund’s balance sheet, which details the assets and liabilities comprising the total value of the fund.
| | | | |
| Assets | | | | |
Investments- | | | | |
Non-affiliated issuers, at value (identified cost, $1,468,456,673) | | | $1,476,751,133 | |
Underlying affiliated funds, at cost and value | | | 33,030,122 | |
Total investments, at value (identified cost, $1,501,486,795) | | | $1,509,781,255 | |
Cash | | | 14,308 | |
Receivables for | | | | |
Daily variation margin on open cleared swap agreements | | | 13,892 | |
Investments sold | | | 3,729,999 | |
Fund shares sold | | | 2,427,147 | |
Interest and dividends | | | 6,957,786 | |
Other assets | | | 6,162 | |
Total assets | | | $1,522,930,549 | |
| Liabilities | | | | |
Payables for | | | | |
Distributions | | | $307,237 | |
Daily variation margin on open futures contracts | | | 30,773 | |
Due to brokers (net unamortized premiums paid, $146,189) | | | 5,807 | |
Fund shares reacquired | | | 2,891,935 | |
Payable to affiliates | | | | |
Investment adviser | | | 28,004 | |
Shareholder servicing costs | | | 1,025,078 | |
Distribution and service fees | | | 17,418 | |
Program manager fees | | | 186 | |
Payable for independent Trustees’ compensation | | | 5,308 | |
Accrued expenses and other liabilities | | | 216,416 | |
Total liabilities | | | $4,528,162 | |
Net assets | | | $1,518,402,387 | |
| Net assets consist of | | | | |
Paid-in capital | | | $1,589,413,885 | |
Unrealized appreciation (depreciation) on investments | | | 8,612,295 | |
Accumulated net realized gain (loss) on investments | | | (77,788,057 | ) |
Accumulated distributions in excess of net investment income | | | (1,835,736 | ) |
Net assets | | | $1,518,402,387 | |
Shares of beneficial interest outstanding | | | 251,034,299 | |
28
Statement of Assets and Liabilities – continued
| | | | | | | | | | | | |
| | | Net assets | | | Shares
outstanding | | | Net asset value
per share (a) | |
Class A | | | $576,711,735 | | | | 95,198,489 | | | | $6.06 | |
Class B | | | 7,814,061 | | | | 1,293,359 | | | | 6.04 | |
Class C | | | 171,276,163 | | | | 28,298,498 | | | | 6.05 | |
Class I | | | 237,785,364 | | | | 39,432,789 | | | | 6.03 | |
Class R1 | | | 711,810 | | | | 117,835 | | | | 6.04 | |
Class R2 | | | 4,519,584 | | | | 746,254 | | | | 6.06 | |
Class R3 | | | 8,527,771 | | | | 1,409,330 | | | | 6.05 | |
Class R4 | | | 923,206 | | | | 152,349 | | | | 6.06 | |
Class R5 | | | 442,445,841 | | | | 73,208,906 | | | | 6.04 | |
Class 529A | | | 41,642,179 | | | | 6,875,220 | | | | 6.06 | |
Class 529B | | | 1,911,962 | | | | 316,754 | | | | 6.04 | |
Class 529C | | | 24,132,711 | | | | 3,984,516 | | | | 6.06 | |
| (a) | Maximum offering price per share was equal to the net asset value per share for all share classes, except for Classes A and 529A, for which the maximum offering prices per share were $6.22 [100 / 97.5 x $6.06] and $6.22 [100 / 97.5 x $6.06], respectively. On sales of $50,000 or more, the maximum offering prices of Class A and Class 529A shares are reduced. A contingent deferred sales charge may be imposed on redemptions of Class A, Class B, Class C, Class 529B, and Class 529C shares. Redemption price per share was equal to the net asset value per share for Classes I, R1, R2, R3, R4, R5, and 529A. |
See Notes to Financial Statements
29
Financial Statements
STATEMENT OF OPERATIONS
Year ended 4/30/14
This statement describes how much your fund earned in investment income and accrued in expenses. It also describes any gains and/or losses generated by fund operations.
| | | | |
| Net investment income | |
Income | | | | |
Interest | | | $29,447,782 | |
Dividends from underlying affiliated funds | | | 47,444 | |
Total investment income | | | $29,495,226 | |
Expenses | | | | |
Management fee | | | $5,834,171 | |
Distribution and service fees | | | 3,896,673 | |
Program manager fees | | | 61,356 | |
Shareholder servicing costs | | | 1,592,429 | |
Administrative services fee | | | 184,125 | |
Independent Trustees’ compensation | | | 25,842 | |
Custodian fee | | | 201,481 | |
Shareholder communications | | | 175,761 | |
Audit and tax fees | | | 61,976 | |
Legal fees | | | 13,739 | |
Miscellaneous | | | 234,797 | |
Total expenses | | | $12,282,350 | |
Fees paid indirectly | | | (77 | ) |
Reduction of expenses by investment adviser and distributor | | | (724,895 | ) |
Net expenses | | | $11,557,378 | |
Net investment income | | | $17,937,848 | |
| Realized and unrealized gain (loss) on investments | | | | |
Realized gain (loss) (identified cost basis) | | | | |
Investments | | | $779,432 | |
Futures contracts | | | 64,708 | |
Swap agreements | | | 128,041 | |
Net realized gain (loss) on investments | | | $972,181 | |
Change in unrealized appreciation (depreciation) | | | | |
Investments | | | $(12,181,851 | ) |
Futures contracts | | | 116,315 | |
Swap agreements | | | 267,382 | |
Net unrealized gain (loss) on investments | | | $(11,798,154 | ) |
Net realized and unrealized gain (loss) on investments | | | $(10,825,973 | ) |
Change in net assets from operations | | | $7,111,875 | |
See Notes to Financial Statements
30
Financial Statements
STATEMENTS OF CHANGES IN NET ASSETS
These statements describe the increases and/or decreases in net assets resulting from operations, any distributions, and any shareholder transactions.
| | | | | | | | |
| | | Years ended 4/30 | |
| | | 2014 | | | 2013 | |
| Change in net assets | | | | | | |
| From operations | | | | | | | | |
Net investment income | | | $17,937,848 | | | | $22,760,079 | |
Net realized gain (loss) on investments | | | 972,181 | | | | 1,538,676 | |
Net unrealized gain (loss) on investments | | | (11,798,154 | ) | | | 3,477,842 | |
Change in net assets from operations | | | $7,111,875 | | | | $27,776,597 | |
| Distributions declared to shareholders | | | | | | | | |
From net investment income | | | $(22,309,355 | ) | | | $(27,672,264 | ) |
Change in net assets from fund share transactions | | | $188,844,957 | | | | $103,612,059 | |
Total change in net assets | | | $173,647,477 | | | | $103,716,392 | |
| Net assets | | | | | | | | |
At beginning of period | | | 1,344,754,910 | | | | 1,241,038,518 | |
At end of period (including accumulated distributions in excess of net investment income of $1,835,736 and $1,737,211, respectively) | | | $1,518,402,387 | | | | $1,344,754,910 | |
See Notes to Financial Statements
31
Financial Statements
FINANCIAL HIGHLIGHTS
The financial highlights table is intended to help you understand the fund’s financial performance for the past 5 years (or life of a particular share class, if shorter). Certain information reflects financial results for a single fund share. The total returns in the table represent the rate by which an investor would have earned (or lost) on an investment in the fund share class (assuming reinvestment of all distributions) held for the entire period.
| | | | | | | | | | | | | | | | | | | | |
| Class A | | Years ended 4/30 | |
| | | 2014 | | | 2013 | | | 2012 | | | 2011 | | | 2010 | |
Net asset value, beginning of period | | | $6.13 | | | | $6.13 | | | | $6.19 | | | | $6.23 | | | | $5.90 | |
| Income (loss) from investment operations | | | | | | | | | | | | | | | | | |
Net investment income (d) | | | $0.08 | | | | $0.12 | | | | $0.14 | | | | $0.17 | | | | $0.21 | |
Net realized and unrealized gain (loss) on
investments and foreign currency | | | (0.05 | ) | | | 0.02 | | | | (0.02 | ) | | | 0.00 | (w) | | | 0.36 | |
Total from investment operations | | | $0.03 | | | | $0.14 | | | | $0.12 | | | | $0.17 | | | | $0.57 | |
| Less distributions declared to shareholders | | | | | | | | | | | | | | | | | |
From net investment income | | | $(0.10 | ) | | | $(0.14 | ) | | | $(0.18 | ) | | | $(0.21 | ) | | | $(0.24 | ) |
Net asset value, end of period (x) | | | $6.06 | | | | $6.13 | | | | $6.13 | | | | $6.19 | | | | $6.23 | |
Total return (%) (r)(s)(t)(x) | | | 0.44 | | | | 2.33 | | | | 1.96 | | | | 2.72 | | | | 9.87 | |
Ratios (%) (to average net assets)
and Supplemental data: | | | | | | | | | | | | | | | | | | | | |
Expenses before expense reductions (f) | | | 0.84 | | | | 0.85 | | | | 0.85 | | | | 0.85 | | | | 0.84 | |
Expenses after expense reductions (f) | | | 0.73 | | | | 0.75 | | | | 0.75 | | | | 0.75 | | | | 0.75 | |
Net investment income | | | 1.29 | | | | 1.92 | | | | 2.34 | | | | 2.75 | | | | 3.39 | |
Portfolio turnover | | | 29 | | | | 34 | | | | 27 | | | | 26 | | | | 28 | |
Net assets at end of period (000 omitted) | | | $576,712 | | | | $583,224 | | | | $632,661 | | | | $702,266 | | | | $705,470 | |
See Notes to Financial Statements
32
Financial Highlights – continued
| | | | | | | | | | | | | | | | | | | | |
| Class B | | Years ended 4/30 | |
| | | 2014 | | | 2013 | | | 2012 | | | 2011 | | | 2010 | |
Net asset value, beginning of period | | | $6.11 | | | | $6.11 | | | | $6.18 | | | | $6.21 | | | | $5.88 | |
| Income (loss) from investment operations | | | | | | | | | | | | | | | | | |
Net investment income (d) | | | $0.03 | | | | $0.07 | | | | $0.10 | | | | $0.13 | | | | $0.17 | |
Net realized and unrealized gain (loss) on
investments and foreign currency | | | (0.05 | ) | | | 0.03 | (g) | | | (0.04 | )(g) | | | 0.00 | (w) | | | 0.36 | |
Total from investment operations | | | $(0.02 | ) | | | $0.10 | | | | $0.06 | | | | $0.13 | | | | $0.53 | |
| Less distributions declared to shareholders | | | | | | | | | | | | | | | | | |
From net investment income | | | $(0.05 | ) | | | $(0.10 | ) | | | $(0.13 | ) | | | $(0.16 | ) | | | $(0.20 | ) |
Net asset value, end of period (x) | | | $6.04 | | | | $6.11 | | | | $6.11 | | | | $6.18 | | | | $6.21 | |
Total return (%) (r)(s)(t)(x) | | | (0.32 | ) | | | 1.57 | | | | 1.02 | | | | 2.12 | | | | 9.06 | |
Ratios (%) (to average net assets)
and Supplemental data: | | | | | | | | | | | | | |
Expenses before expense reductions (f) | | | 1.59 | | | | 1.60 | | | | 1.60 | | | | 1.60 | | | | 1.59 | |
Expenses after expense reductions (f) | | | 1.49 | | | | 1.50 | | | | 1.51 | | | | 1.51 | | | | 1.51 | |
Net investment income | | | 0.54 | | | | 1.18 | | | | 1.61 | | | | 2.06 | | | | 2.71 | |
Portfolio turnover | | | 29 | | | | 34 | | | | 27 | | | | 26 | | | | 28 | |
Net assets at end of period (000 omitted) | | | $7,814 | | | | $7,585 | | | | $10,056 | | | | $16,641 | | | | $35,642 | |
| |
| Class C | | Years ended 4/30 | |
| | | 2014 | | | 2013 | | | 2012 | | | 2011 | | | 2010 | |
Net asset value, beginning of period | | | $6.12 | | | | $6.12 | | | | $6.19 | | | | $6.22 | | | | $5.89 | |
| Income (loss) from investment operations | | | | | | | | | | | | | | | | | |
Net investment income (d) | | | $0.03 | | | | $0.07 | | | | $0.09 | | | | $0.12 | | | | $0.15 | |
Net realized and unrealized gain (loss) on
investments and foreign currency | | | (0.06 | ) | | | 0.02 | | | | (0.03 | )(g) | | | 0.00 | (w) | | | 0.37 | |
Total from investment operations | | | $(0.03 | ) | | | $0.09 | | | | $0.06 | | | | $0.12 | | | | $0.52 | |
| Less distributions declared to shareholders | | | | | | | | | | | | | | | | | |
From net investment income | | | $(0.04 | ) | | | $(0.09 | ) | | | $(0.13 | ) | | | $(0.15 | ) | | | $(0.19 | ) |
Net asset value, end of period (x) | | | $6.05 | | | | $6.12 | | | | $6.12 | | | | $6.19 | | | | $6.22 | |
Total return (%) (r)(s)(t)(x) | | | (0.41 | ) | | | 1.46 | | | | 0.93 | | | | 2.02 | | | | 8.95 | |
Ratios (%) (to average net assets)
and Supplemental data: | | | | | | | | | | | | | |
Expenses before expense reductions (f) | | | 1.59 | | | | 1.60 | | | | 1.60 | | | | 1.60 | | | | 1.62 | |
Expenses after expense reductions (f) | | | 1.59 | | | | 1.60 | | | | 1.60 | | | | 1.60 | | | | 1.60 | |
Net investment income | | | 0.46 | | | | 1.07 | | | | 1.49 | | | | 1.90 | | | | 2.51 | |
Portfolio turnover | | | 29 | | | | 34 | | | | 27 | | | | 26 | | | | 28 | |
Net assets at end of period (000 omitted) | | | $171,276 | | | | $212,060 | | | | $224,122 | | | | $234,829 | | | | $234,584 | |
See Notes to Financial Statements
33
Financial Highlights – continued
| | | | | | | | | | | | | | | | | | | | |
| Class I | | Years ended 4/30 | |
| | | 2014 | | | 2013 | | | 2012 | | | 2011 | | | 2010 | |
Net asset value, beginning of period | | | $6.10 | | | | $6.11 | | | | $6.17 | | | | $6.21 | | | | $5.88 | |
| Income (loss) from investment operations | | | | | | | | | | | | | | | | | |
Net investment income (d) | | | $0.09 | | | | $0.13 | | | | $0.15 | | | | $0.18 | | | | $0.22 | |
Net realized and unrealized gain (loss) on
investments and foreign currency | | | (0.05 | ) | | | 0.01 | (g) | | | (0.02 | ) | | | 0.00 | (w) | | | 0.36 | |
Total from investment operations | | | $0.04 | | | | $0.14 | | | | $0.13 | | | | $0.18 | | | | $0.58 | |
| Less distributions declared to shareholders | | | | | | | | | | | | | | | | | |
From net investment income | | | $(0.11 | ) | | | $(0.15 | ) | | | $(0.19 | ) | | | $(0.22 | ) | | | $(0.25 | ) |
Net asset value, end of period (x) | | | $6.03 | | | | $6.10 | | | | $6.11 | | | | $6.17 | | | | $6.21 | |
Total return (%) (r)(s)(x) | | | 0.59 | | | | 2.31 | | | | 2.11 | | | | 2.87 | | | | 10.05 | |
Ratios (%) (to average net assets)
and Supplemental data: | | | | | | | | | | | | | |
Expenses before expense reductions (f) | | | 0.59 | | | | 0.60 | | | | 0.60 | | | | 0.60 | | | | 0.62 | |
Expenses after expense reductions (f) | | | 0.59 | | | | 0.60 | | | | 0.60 | | | | 0.60 | | | | 0.60 | |
Net investment income | | | 1.41 | | | | 2.14 | | | | 2.48 | | | | 2.88 | | | | 3.52 | |
Portfolio turnover | | | 29 | | | | 34 | | | | 27 | | | | 26 | | | | 28 | |
Net assets at end of period (000 omitted) | | | $237,785 | | | | $130,703 | | | | $310,572 | | | | $212,086 | | | | $147,616 | |
| |
| Class R1 | | Years ended 4/30 | |
| | | 2014 | | | 2013 | | | 2012 | | | 2011 | | | 2010 | |
Net asset value, beginning of period | | | $6.11 | | | | $6.11 | | | | $6.17 | | | | $6.21 | | | | $5.88 | |
| Income (loss) from investment operations | | | | | | | | | | | | | | | | | |
Net investment income (d) | | | $0.03 | | | | $0.07 | | | | $0.09 | | | | $0.12 | | | | $0.16 | |
Net realized and unrealized gain (loss) on
investments and foreign currency | | | (0.06 | ) | | | 0.02 | | | | (0.02 | ) | | | (0.01 | )(g) | | | 0.36 | |
Total from investment operations | | | $(0.03 | ) | | | $0.09 | | | | $0.07 | | | | $0.11 | | | | $0.52 | |
| Less distributions declared to shareholders | | | | | | | | | | | | | | | | | |
From net investment income | | | $(0.04 | ) | | | $(0.09 | ) | | | $(0.13 | ) | | | $(0.15 | ) | | | $(0.19 | ) |
Net asset value, end of period (x) | | | $6.04 | | | | $6.11 | | | | $6.11 | | | | $6.17 | | | | $6.21 | |
Total return (%) (r)(s)(x) | | | (0.41 | ) | | | 1.46 | | | | 1.09 | | | | 1.85 | | | | 8.96 | |
| Ratios (%) (to average net assets) and Supplemental data: | | | | | | | | | | | | | | | | | | | | |
Expenses before expense reductions (f) | | | 1.59 | | | | 1.60 | | | | 1.60 | | | | 1.60 | | | | 1.62 | |
Expenses after expense reductions (f) | | | 1.59 | | | | 1.60 | | | | 1.60 | | | | 1.60 | | | | 1.60 | |
Net investment income | | | 0.44 | | | | 1.08 | | | | 1.51 | | | | 1.93 | | | | 2.57 | |
Portfolio turnover | | | 29 | | | | 34 | | | | 27 | | | | 26 | | | | 28 | |
Net assets at end of period (000 omitted) | | | $712 | | | | $616 | | | | $675 | | | | $963 | | | | $1,164 | |
See Notes to Financial Statements
34
Financial Highlights – continued
| | | | | | | | | | | | | | | | | | | | |
| Class R2 | | Years ended 4/30 | |
| | | 2014 | | | 2013 | | | 2012 | | | 2011 | | | 2010 | |
Net asset value, beginning of period | | | $6.13 | | | | $6.12 | | | | $6.19 | | | | $6.23 | | | | $5.90 | |
| Income (loss) from investment operations | | | | | | | | | | | | | | | | | |
Net investment income (d) | | | $0.06 | | | | $0.10 | | | | $0.13 | | | | $0.16 | | | | $0.19 | |
Net realized and unrealized gain (loss) on
investments and foreign currency | | | (0.05 | ) | | | 0.04 | (g) | | | (0.04 | )(g) | | | (0.01 | )(g) | | | 0.37 | |
Total from investment operations | | | $0.01 | | | | $0.14 | | | | $0.09 | | | | $0.15 | | | | $0.56 | |
| Less distributions declared to shareholders | | | | | | | | | | | | | | | | | |
From net investment income | | | $(0.08 | ) | | | $(0.13 | ) | | | $(0.16 | ) | | | $(0.19 | ) | | | $(0.23 | ) |
Net asset value, end of period (x) | | | $6.06 | | | | $6.13 | | | | $6.12 | | | | $6.19 | | | | $6.23 | |
Total return (%) (r)(s)(x) | | | 0.19 | | | | 2.24 | | | | 1.54 | | | | 2.46 | | | | 9.59 | |
Ratios (%) (to average net assets)
and Supplemental data: | | | | | | | | | | | | | | | | | | | | |
Expenses before expense reductions (f) | | | 1.09 | | | | 1.10 | | | | 1.10 | | | | 1.10 | | | | 1.12 | |
Expenses after expense reductions (f) | | | 0.99 | | | | 1.00 | | | | 1.00 | | | | 1.00 | | | | 1.00 | |
Net investment income | | | 1.04 | | | | 1.67 | | | | 2.10 | | | | 2.51 | | | | 3.16 | |
Portfolio turnover | | | 29 | | | | 34 | | | | 27 | | | | 26 | | | | 28 | |
Net assets at end of period (000 omitted) | | | $4,520 | | | | $4,189 | | | | $4,869 | | | | $6,134 | | | | $5,999 | |
| |
| Class R3 | | Years ended 4/30 | |
| | | 2014 | | | 2013 | | | 2012 | | | 2011 | | | 2010 | |
Net asset value, beginning of period | | | $6.12 | | | | $6.12 | | | | $6.19 | | | | $6.22 | | | | $5.89 | |
| Income (loss) from investment operations | | | | | | | | | | | | | | | | | |
Net investment income (d) | | | $0.07 | | | | $0.11 | | | | $0.14 | | | | $0.16 | | | | $0.19 | |
Net realized and unrealized gain (loss) on
investments and foreign currency | | | (0.05 | ) | | | 0.02 | | | | (0.04 | )(g) | | | 0.01 | | | | 0.38 | |
Total from investment operations | | | $0.02 | | | | $0.13 | | | | $0.10 | | | | $0.17 | | | | $0.57 | |
| Less distributions declared to shareholders | | | | | | | | | | | | | | | | | |
From net investment income | | | $(0.09 | ) | | | $(0.13 | ) | | | $(0.17 | ) | | | $(0.20 | ) | | | $(0.24 | ) |
Net asset value, end of period (x) | | | $6.05 | | | | $6.12 | | | | $6.12 | | | | $6.19 | | | | $6.22 | |
Total return (%) (r)(s)(x) | | | 0.34 | | | | 2.22 | | | | 1.69 | | | | 2.78 | | | | 9.77 | |
Ratios (%) (to average net assets)
and Supplemental data: | | | | | | | | | | | | | | | | | | | | |
Expenses before expense reductions (f) | | | 0.84 | | | | 0.85 | | | | 0.85 | | | | 0.85 | | | | 0.89 | |
Expenses after expense reductions (f) | | | 0.84 | | | | 0.85 | | | | 0.85 | | | | 0.85 | | | | 0.85 | |
Net investment income | | | 1.19 | | | | 1.81 | | | | 2.23 | | | | 2.64 | | | | 3.14 | |
Portfolio turnover | | | 29 | | | | 34 | | | | 27 | | | | 26 | | | | 28 | |
Net assets at end of period (000 omitted) | | | $8,528 | | | | $8,014 | | | | $8,109 | | | | $6,714 | | | | $5,757 | |
See Notes to Financial Statements
35
Financial Highlights – continued
| | | | | | | | | | | | | | | | | | | | |
| Class R4 | | Years ended 4/30 | |
| | | 2014 | | | 2013 | | | 2012 | | | 2011 | | | 2010 | |
Net asset value, beginning of period | | | $6.13 | | | | $6.13 | | | | $6.19 | | | | $6.23 | | | | $5.90 | |
| Income (loss) from investment operations | | | | | | | | | | | | | | | | | |
Net investment income (d) | | | $0.09 | | | | $0.13 | | | | $0.15 | | | | $0.18 | | | | $0.21 | |
Net realized and unrealized gain (loss) on
investments and foreign currency | | | (0.05 | ) | | | 0.02 | | | | (0.02 | ) | | | 0.00 | (w) | | | 0.37 | |
Total from investment operations | | | $0.04 | | | | $0.15 | | | | $0.13 | | | | $0.18 | | | | $0.58 | |
| Less distributions declared to shareholders | | | | | | | | | | | | | | | | | |
From net investment income | | | $(0.11 | ) | | | $(0.15 | ) | | | $(0.19 | ) | | | $(0.22 | ) | | | $(0.25 | ) |
Net asset value, end of period (x) | | | $6.06 | | | | $6.13 | | | | $6.13 | | | | $6.19 | | | | $6.23 | |
Total return (%) (r)(s)(x) | | | 0.59 | | | | 2.48 | | | | 2.11 | | | | 2.87 | | | | 10.03 | |
Ratios (%) (to average net assets)
and Supplemental data: | | | | | | | | | | | | | | | | | | | | |
Expenses before expense reductions (f) | | | 0.59 | | | | 0.60 | | | | 0.60 | | | | 0.60 | | | | 0.63 | |
Expenses after expense reductions (f) | | | 0.59 | | | | 0.60 | | | | 0.60 | | | | 0.60 | | | | 0.60 | |
Net investment income | | | 1.44 | | | | 2.06 | | | | 2.49 | | | | 2.88 | | | | 3.37 | |
Portfolio turnover | | | 29 | | | | 34 | | | | 27 | | | | 26 | | | | 28 | |
Net assets at end of period (000 omitted) | | | $923 | | | | $904 | | | | $839 | | | | $855 | | | | $691 | |
| | | | | | | | |
| Class R5 | | Years ended 4/30 | |
| | | 2014 | | | 2013 (i) | |
Net asset value, beginning of period | | | $6.11 | | | | $6.12 | |
| Income (loss) from investment operations | | | | | | | | |
Net investment income (d) | | | $0.09 | | | | $0.08 | |
Net realized and unrealized gain (loss) on investments and foreign currency | | | (0.05 | ) | | | 0.00 | (w) |
Total from investment operations | | | $0.04 | | | | $0.08 | |
| Less distributions declared to shareholders | | | | | | | | |
From net investment income | | | $(0.11 | ) | | | $(0.09 | ) |
Net asset value, end of period (x) | | | $6.04 | | | | $6.11 | |
Total return (%) (r)(s)(x) | | | 0.66 | | | | 1.39 | (n) |
Ratios (%) (to average net assets)
and Supplemental data: | | | | | | | | |
Expenses before expense reductions (f) | | | 0.52 | | | | 0.53 | (a) |
Expenses after expense reductions (f) | | | 0.52 | | | | 0.53 | (a) |
Net investment income | | | 1.50 | | | | 1.99 | (a) |
Portfolio turnover | | | 29 | | | | 34 | |
Net assets at end of period (000 omitted) | | | $442,446 | | | | $337,605 | |
See Notes to Financial Statements
36
Financial Highlights – continued
| | | | | | | | | | | | | | | | | | | | |
| Class 529A | | Years ended 4/30 | |
| | | 2014 | | | 2013 | | | 2012 | | | 2011 | | | 2010 | |
Net asset value, beginning of period | | | $6.13 | | | | $6.13 | | | | $6.19 | | | | $6.23 | | | | $5.90 | |
| Income (loss) from investment operations | | | | | | | | | | | | | | | | | |
Net investment income (d) | | | $0.08 | | | | $0.11 | | | | $0.14 | | | | $0.16 | | | | $0.20 | |
Net realized and unrealized gain (loss) on
investments and foreign currency | | | (0.06 | ) | | | 0.03 | (g) | | | (0.02 | ) | | | 0.00 | (w) | | | 0.37 | |
Total from investment operations | | | $0.02 | | | | $0.14 | | | | $0.12 | | | | $0.16 | | | | $0.57 | |
| Less distributions declared to shareholders | | | | | | | | | | | | | | | | | |
From net investment income | | | $(0.09 | ) | | | $(0.14 | ) | | | $(0.18 | ) | | | $(0.20 | ) | | | $(0.24 | ) |
Net asset value, end of period (x) | | | $6.06 | | | | $6.13 | | | | $6.13 | | | | $6.19 | | | | $6.23 | |
Total return (%) (r)(s)(t)(x) | | | 0.39 | | | | 2.27 | | | | 1.90 | | | | 2.62 | | | | 9.76 | |
Ratios (%) (to average net assets)
and Supplemental data: | | | | | | | | | | | | | | | | | | | | |
Expenses before expense reductions (f) | | | 0.94 | | | | 0.95 | | | | 0.95 | | | | 0.95 | | | | 0.97 | |
Expenses after expense reductions (f) | | | 0.78 | | | | 0.80 | | | | 0.81 | | | | 0.85 | | | | 0.85 | |
Net investment income | | | 1.24 | | | | 1.85 | | | | 2.27 | | | | 2.64 | | | | 3.28 | |
Portfolio turnover | | | 29 | | | | 34 | | | | 27 | | | | 26 | | | | 28 | |
Net assets at end of period (000 omitted) | | | $41,642 | | | | $35,126 | | | | $28,311 | | | | $22,743 | | | | $16,907 | |
| |
| Class 529B | | Years ended 4/30 | |
| | | 2014 | | | 2013 | | | 2012 | | | 2011 | | | 2010 | |
Net asset value, beginning of period | | | $6.10 | | | | $6.10 | | | | $6.17 | | | | $6.20 | | | | $5.87 | |
| Income (loss) from investment operations | | | | | | | | | | | | | | | | | |
Net investment income (d) | | | $0.03 | | | | $0.07 | | | | $0.09 | | | | $0.12 | | | | $0.16 | |
Net realized and unrealized gain (loss) on
investments and foreign currency | | | (0.04 | ) | | | 0.02 | | | | (0.03 | )(g) | | | 0.00 | (w) | | | 0.36 | |
Total from investment operations | | | $(0.01 | ) | | | $0.09 | | | | $0.06 | | | | $0.12 | | | | $0.52 | |
| Less distributions declared to shareholders | | | | | | | | | | | | | | | | | |
From net investment income | | | $(0.05 | ) | | | $(0.09 | ) | | | $(0.13 | ) | | | $(0.15 | ) | | | $(0.19 | ) |
Net asset value, end of period (x) | | | $6.04 | | | | $6.10 | | | | $6.10 | | | | $6.17 | | | | $6.20 | |
Total return (%) (r)(s)(t)(x) | �� | | (0.21 | ) | | | 1.50 | | | | 0.96 | | | | 2.00 | | | | 8.96 | |
Ratios (%) (to average net assets)
and Supplemental data: | | | | | | | | | | | | | | | | | | | | |
Expenses before expense reductions (f) | | | 1.69 | | | | 1.70 | | | | 1.70 | | | | 1.70 | | | | 1.69 | |
Expenses after expense reductions (f) | | | 1.54 | | | | 1.56 | | | | 1.57 | | | | 1.61 | | | | 1.61 | |
Net investment income | | | 0.49 | | | | 1.12 | | | | 1.53 | | | | 1.93 | | | | 2.56 | |
Portfolio turnover | | | 29 | | | | 34 | | | | 27 | | | | 26 | | | | 28 | |
Net assets at end of period (000 omitted) | | | $1,912 | | | | $1,849 | | | | $1,915 | | | | $1,735 | | | | $2,008 | |
See Notes to Financial Statements
37
Financial Highlights – continued
| | | | | | | | | | | | | | | | | | | | |
| Class 529C | | Years ended 4/30 | |
| | | 2014 | | | 2013 | | | 2012 | | | 2011 | | | 2010 | |
Net asset value, beginning of period | | | $6.13 | | | | $6.12 | | | | $6.19 | | | | $6.23 | | | | $5.89 | |
| Income (loss) from investment operations | | | | | | | | | | | | | | | | | |
Net investment income (d) | | | $0.02 | | | | $0.06 | | | | $0.09 | | | | $0.11 | | | | $0.15 | |
Net realized and unrealized gain (loss) on
investments and foreign currency | | | (0.05 | ) | | | 0.04 | (g) | | | (0.04 | )(g) | | | 0.00 | (w) | | | 0.38 | |
Total from investment operations | | | $(0.03 | ) | | | $0.10 | | | | $0.05 | | | | $0.11 | | | | $0.53 | |
| Less distributions declared to shareholders | | | | | | | | | | | | | | | | | |
From net investment income | | | $(0.04 | ) | | | $(0.09 | ) | | | $(0.12 | ) | | | $(0.15 | ) | | | $(0.19 | ) |
Net asset value, end of period (x) | | | $6.06 | | | | $6.13 | | | | $6.12 | | | | $6.19 | | | | $6.23 | |
Total return (%) (r)(s)(t)(x) | | | (0.46 | ) | | | 1.58 | | | | 0.87 | | | | 1.75 | | | | 9.02 | |
Ratios (%) (to average net assets)
and Supplemental data: | | | | | | | | | | | | | | | | | | | | |
Expenses before expense reductions (f) | | | 1.69 | | | | 1.70 | | | | 1.70 | | | | 1.70 | | | | 1.72 | |
Expenses after expense reductions (f) | | | 1.63 | | | | 1.65 | | | | 1.66 | | | | 1.70 | | | | 1.70 | |
Net investment income | | | 0.40 | | | | 1.01 | | | | 1.43 | | | | 1.79 | | | | 2.43 | |
Portfolio turnover | | | 29 | | | | 34 | | | | 27 | | | | 26 | | | | 28 | |
Net assets at end of period (000 omitted) | | | $24,133 | | | | $22,880 | | | | $18,909 | | | | $16,254 | | | | $12,364 | |
| (d) | Per share data is based on average shares outstanding. |
| (f) | Ratios do not reflect reductions from fees paid indirectly, if applicable. |
| (g) | The per share amount varies from the net realized and unrealized gain/loss for the period because of the timing of sales of fund shares and the per share amount of realized and unrealized gains and losses at such time. |
| (i) | For the period from the class inception, September 4, 2012, through the stated period end. |
| (r) | Certain expenses have been reduced without which performance would have been lower. |
| (s) | From time to time the fund may receive proceeds from litigation settlements, without which performance would be lower. |
| (t) | Total returns do not include any applicable sales charges. |
| (w) | Per share amount was less than $0.01. |
| (x) | The net asset values per share and total returns have been calculated on net assets which include adjustments made in accordance with U.S. generally accepted accounting principles required at period end for financial reporting purposes. |
See Notes to Financial Statements
38
NOTES TO FINANCIAL STATEMENTS
(1) Business and Organization
MFS Limited Maturity Fund (the fund) is a diversified series of MFS Series Trust IX (the trust). The trust is organized as a Massachusetts business trust and is registered under the Investment Company Act of 1940, as amended, as an open-end management investment company.
The fund is an investment company and accordingly follows the investment company accounting and reporting guidance of the Financial Accounting Standards Board (FASB) Accounting Standard Codification Topic 946 Financial Services – Investment Companies.
(2) Significant Accounting Policies
General – The preparation of financial statements in conformity with U.S. generally accepted accounting principles requires management to make estimates and assumptions that affect the reported amounts of assets and liabilities, and disclosure of contingent assets and liabilities at the date of the financial statements and the reported amounts of increases and decreases in net assets from operations during the reporting period. Actual results could differ from those estimates. In the preparation of these financial statements, management has evaluated subsequent events occurring after the date of the fund’s Statement of Assets and Liabilities through the date that the financial statements were issued. The fund invests in foreign securities. Investments in foreign securities are vulnerable to the effects of changes in the relative values of the local currency and the U.S. dollar and to the effects of changes in each country’s legal, political, and economic environment.
In this reporting period, the fund adopted the disclosure provisions of FASB Accounting Standards Update 2011-11 (“ASU 2011-11”), Balance Sheet (Topic 210) – Disclosures about Offsetting Assets and Liabilities along with the related scope clarification provisions of FASB Accounting Standards Update 2013-01 (“ASU 2013-01”) entitled Balance Sheet (Topic 210) – Clarifying the Scope of Disclosures about Offsetting Assets and Liabilities. ASU 2011-11 is intended to enhance disclosures on the offsetting of financial assets and liabilities by requiring entities to disclose both gross and net information about financial instruments and transactions that are either offset in the statement of financial position or subject to an enforceable Master Netting Agreement or similar arrangement. ASU 2013-01 limits the scope of ASU 2011-11’s disclosure requirements on offsetting to financial assets and financial liabilities related to derivatives, repurchase and reverse repurchase agreements, and securities lending and securities borrowing transactions. The disclosures required by ASU 2011-11, to the extent applicable to the fund, have been included in the fund’s Significant Accounting Policies note under the captions for each of the fund’s in-scope financial instruments and transactions.
The fund’s accounting policy with respect to balance sheet offsetting is that, absent an event of default by the counterparty or a termination of the agreement, the ISDA Master Agreement does not result in an offset of reported amounts of financial assets and financial liabilities in the Statement of Assets and Liabilities across transactions between the fund and the applicable counterparty. The fund’s right to setoff may be restricted or prohibited by the bankruptcy or insolvency laws of the particular
39
Notes to Financial Statements – continued
jurisdiction to which a specific master netting agreement counterparty is subject. Balance sheet offsetting disclosures, to the extent applicable to the fund, have been included in the fund’s Significant Accounting Policies note under the captions for each of the fund’s in-scope financial instruments and transactions.
Investment Valuations – Debt instruments and floating rate loans (other than short-term instruments), including restricted debt instruments, are generally valued at an evaluated or composite bid as provided by a third-party pricing service. Short-term instruments with a maturity at issuance of 60 days or less generally are valued at amortized cost, which approximates market value. Futures contracts are generally valued at last posted settlement price as provided by a third-party pricing service on the market on which they are primarily traded. Futures contracts for which there were no trades that day for a particular position are generally valued at the closing bid quotation as provided by a third-party pricing service on the market on which such futures contracts are primarily traded. Swap agreements are generally valued at valuations provided by a third-party pricing service, which for cleared swaps includes an evaluation of any trading activity at the clearinghouses. Open-end investment companies are generally valued at net asset value per share. Securities and other assets generally valued on the basis of information from a third-party pricing service may also be valued at a broker/dealer bid quotation. Values obtained from third-party pricing services can utilize both transaction data and market information such as yield, quality, coupon rate, maturity, type of issue, trading characteristics, and other market data. The values of foreign securities and other assets and liabilities expressed in foreign currencies are converted to U.S. dollars using the mean of bid and asked prices for rates provided by a third-party pricing service.
The Board of Trustees has delegated primary responsibility for determining or causing to be determined the value of the fund’s investments (including any fair valuation) to the adviser pursuant to valuation policies and procedures approved by the Board. If the adviser determines that reliable market quotations are not readily available, investments are valued at fair value as determined in good faith by the adviser in accordance with such procedures under the oversight of the Board of Trustees. Under the fund’s valuation policies and procedures, market quotations are not considered to be readily available for most types of debt instruments and floating rate loans and many types of derivatives. These investments are generally valued at fair value based on information from third-party pricing services. In addition, investments may be valued at fair value if the adviser determines that an investment’s value has been materially affected by events occurring after the close of the exchange or market on which the investment is principally traded (such as foreign exchange or market) and prior to the determination of the fund’s net asset value, or after the halting of trading of a specific security where trading does not resume prior to the close of the exchange or market on which the security is principally traded. The adviser generally relies on third-party pricing services or other information (such as the correlation with price movements of similar securities in the same or other markets; the type, cost and investment characteristics of the security; the business and financial condition of the issuer; and trading and other market data) to assist in determining whether to fair value and at what value to fair value an investment. The value of an investment for purposes of calculating the fund’s net asset value can differ depending on the source and method used to determine
40
Notes to Financial Statements – continued
value. When fair valuation is used, the value of an investment used to determine the fund’s net asset value may differ from quoted or published prices for the same investment. There can be no assurance that the fund could obtain the fair value assigned to an investment if it were to sell the investment at the same time at which the fund determines its net asset value per share.
Various inputs are used in determining the value of the fund’s assets or liabilities. These inputs are categorized into three broad levels. In certain cases, the inputs used to measure fair value may fall into different levels of the fair value hierarchy. In such cases, an investment’s level within the fair value hierarchy is based on the lowest level of input that is significant to the fair value measurement. The fund’s assessment of the significance of a particular input to the fair value measurement in its entirety requires judgment, and considers factors specific to the investment. Level 1 includes unadjusted quoted prices in active markets for identical assets or liabilities. Level 2 includes other significant observable market-based inputs (including quoted prices for similar securities, interest rates, prepayment speed, and credit risk). Level 3 includes unobservable inputs, which may include the adviser’s own assumptions in determining the fair value of investments. Other financial instruments are derivative instruments not reflected in total investments, such as futures contracts and swap agreements. The following is a summary of the levels used as of April 30, 2014 in valuing the fund’s assets or liabilities:
| | | | | | | | | | | | | | | | |
| Investments at Value | | Level 1 | | | Level 2 | | | Level 3 | | | Total | |
| U.S. Treasury Bonds & U.S. Government Agency & Equivalents | | | $— | | | | $86,805,113 | | | | $— | | | | $86,805,113 | |
| Non-U.S. Sovereign Debt | | | — | | | | 149,217,830 | | | | — | | | | 149,217,830 | |
| Municipal Bonds | | | — | | | | 7,136,460 | | | | — | | | | 7,136,460 | |
| U.S. Corporate Bonds | | | — | | | | 558,556,397 | | | | — | | | | 558,556,397 | |
| Residential Mortgage-Backed Securities | | | — | | | | 42,753,540 | | | | — | | | | 42,753,540 | |
| Commercial Mortgage-Backed Securities | | | — | | | | 15,273,447 | | | | — | | | | 15,273,447 | |
| Asset-Backed Securities (including CDOs) | | | — | | | | 166,770,316 | | | | — | | | | 166,770,316 | |
| Foreign Bonds | | | — | | | | 450,238,030 | | | | — | | | | 450,238,030 | |
| Mutual Funds | | | 33,030,122 | | | | — | | | | — | | | | 33,030,122 | |
| Total Investments | | | $33,030,122 | | | | $1,476,751,133 | | | | $— | | | | $1,509,781,255 | |
| | | | |
| Other Financial Instruments | | | | | | | | | | | | |
| Futures Contracts | | | $50,453 | | | | $— | | | | $— | | | | $50,453 | |
| Swap Agreements | | | — | | | | 413,571 | | | | — | | | | 413,571 | |
For further information regarding security characteristics, see the Portfolio of Investments.
Derivatives – The fund uses derivatives for different purposes, primarily to increase or decrease exposure to a particular market or segment of the market, or security, to increase or decrease interest rate or currency exposure, or as alternatives to direct investments. Derivatives are used for hedging or non-hedging purposes. While hedging
41
Notes to Financial Statements – continued
can reduce or eliminate losses, it can also reduce or eliminate gains. When the fund uses derivatives as an investment to increase market exposure, or for hedging purposes, gains and losses from derivative instruments may be substantially greater than the derivative’s original cost.
The derivative instruments used by the fund were futures contracts and swap agreements. The fund’s period end derivatives, as presented in the Portfolio of Investments and the associated Derivative Contract tables, generally are indicative of the volume of its derivative activity during the period.
The following table presents, by major type of derivative contract, the fair value, on a gross basis, of the asset and liability components of derivatives held by the fund at April 30, 2014 as reported in the Statement of Assets and Liabilities:
| | | | | | |
| | | | | Fair Value (a) | |
| Risk | | Derivative Contracts | | Asset Derivatives | |
| Interest Rate | | Interest Rate Futures | | | $50,453 | |
| Credit | | Credit Default Swaps | | | 413,571 | |
| Total | | | | | $464,024 | |
| (a) | The value of futures contracts and cleared swap agreements outstanding includes cumulative appreciation (depreciation) as reported in the fund’s Portfolio of Investments. The current day variation margin for futures contracts and cleared swaps is separately reported within the fund’s Statement of Assets and Liabilities. |
The following table presents, by major type of derivative contract, the realized gain (loss) on derivatives held by the fund for the year ended April 30, 2014 as reported in the Statement of Operations:
| | | | | | | | |
| Risk | | Futures
Contracts | | | Swap
Agreements | |
| Interest Rate | | | $64,708 | | | | $— | |
| Credit | | | — | | | | 128,041 | |
| Total | | | $64,708 | | | | $128,041 | |
The following table presents, by major type of derivative contract, the change in unrealized appreciation (depreciation) on derivatives held by the fund for the year ended April 30, 2014 as reported in the Statement of Operations:
| | | | | | | | |
| Risk | | Futures
Contracts | | | Swap
Agreements | |
| Interest Rate | | | $116,315 | | | | $— | |
| Credit | | | — | | | | 267,382 | |
| Total | | | $116,315 | | | | $267,382 | |
Derivative counterparty credit risk is managed through formal evaluation of the creditworthiness of all potential counterparties. On certain, but not all, over-the-counter derivatives, the fund attempts to reduce its exposure to counterparty credit risk whenever possible by entering into an International Swaps and Derivatives Association (ISDA) Master Agreement on a bilateral basis with each of the counterparties with whom it undertakes a significant volume of transactions. The ISDA Master Agreement gives each party to the agreement the right to terminate all transactions traded under such agreement if there is a certain deterioration in the
42
Notes to Financial Statements – continued
credit quality of the other party. Upon an event of default or a termination of the ISDA Master Agreement, the non-defaulting party has the right to close out all transactions traded under such agreement and to net amounts owed under each transaction to one net amount payable by one party to the other. This right to close out and net payments across all transactions traded under the ISDA Master Agreement could result in a reduction of the fund’s credit risk to such counterparty equal to any amounts payable by the fund under the applicable transactions, if any. The fund’s right to setoff may be restricted or prohibited by the bankruptcy or insolvency laws of the particular jurisdiction to which a specific ISDA counterparty is subject.
Collateral and margin requirements differ by type of derivative. Margin requirements are set by the broker or clearing house for cleared derivatives (i.e., futures contracts, cleared swaps, and exchange-traded options) while collateral terms are contract specific for over-the-counter traded derivatives (i.e., forward foreign currency exchange contracts, uncleared swap agreements, and over-the-counter options). For derivatives traded under an ISDA Master Agreement, the collateral requirements are netted across all transactions traded under such agreement and one amount is posted from one party to the other to collateralize such obligations. Cash that has been segregated to cover the fund’s collateral or margin obligations under derivative contracts, if any, will be reported separately in the Statement of Assets and Liabilities as “Restricted cash” or “Deposits with brokers.” Securities pledged as collateral or margin for the same purpose, if any, are noted in the Portfolio of Investments.
Futures Contracts – The fund entered into futures contracts which may be used to hedge against or obtain broad market exposure, interest rate exposure, currency exposure, or to manage duration. A futures contract represents a commitment for the future purchase or sale of an asset at a specified price on a specified date.
Upon entering into a futures contract, the fund is required to deposit with the broker, either in cash or securities, an initial margin in an amount equal to a certain percentage of the notional amount of the contract. Subsequent payments (variation margin) are made or received by the fund each day, depending on the daily fluctuations in the value of the contract, and are recorded for financial statement purposes as unrealized gain or loss by the fund until the contract is closed or expires at which point the gain or loss on futures contracts is realized.
The fund bears the risk of interest rates, exchange rates or securities prices moving unexpectedly, in which case, the fund may not achieve the anticipated benefits of the futures contracts and may realize a loss. While futures contracts may present less counterparty risk to the fund since the contracts are exchange traded and the exchange’s clearinghouse guarantees payments to the broker, there is still counterparty credit risk due to the insolvency of the broker. The fund’s maximum risk of loss due to counterparty credit risk is equal to the margin posted by the fund to the broker plus any gains or minus any losses on the outstanding futures contracts.
Swap Agreements – During the period the fund entered into swap agreements. Effective June 10, 2013, certain types of swaps (“cleared swaps”) are required to be centrally cleared under provisions of the Dodd-Frank Regulatory Reform Bill. In a cleared swap transaction, the swap agreement is novated to a central counterparty (the “clearinghouse”) immediately following execution of the swap contract with an
43
Notes to Financial Statements – continued
executing broker. Thereafter, throughout the term of the cleared swap, the fund interfaces indirectly with the clearinghouse through a clearing broker.
A swap agreement is generally an exchange of cash payments, at specified intervals or upon the occurrence of specified events, between the fund and a counterparty. The net cash payments exchanged are recorded as a realized gain or loss on swap agreements in the Statement of Operations. The value of the swap agreement, which is adjusted daily and includes any related interest accruals to be paid or received by the fund, is recorded in the Statement of Assets and Liabilities, as “Swaps, at value” for uncleared swaps and is included in “Due from brokers” or “Due to brokers” for cleared swaps. The daily change in value, including any related interest accruals to be paid or received, is recorded as unrealized appreciation or depreciation on swap agreements in the Statement of Operations. The daily change in valuation of cleared swaps is recorded as a receivable or payable for variation margin in the Statement of Assets and Liabilities. Amounts paid or received at the inception of the swap agreement are reflected as premiums paid or received in the Statement of Assets and Liabilities and are amortized using the effective interest method over the term of the agreement. A liquidation payment received or made upon early termination is recorded as a realized gain or loss on swap agreements in the Statement of Operations.
Risks related to swap agreements include the possible lack of a liquid market, unfavorable market and interest rate movements of the underlying instrument and the failure of the counterparty to perform under the terms of the agreements. To address counterparty risk, swap agreements are limited to only highly-rated counterparties. For uncleared swaps, that risk is further reduced by having an ISDA Master Agreement between the fund and the counterparty providing for netting as described above and by the posting of collateral by the counterparty to the fund to cover the fund’s exposure to the counterparty under such ISDA Master Agreement. Although not covered by an ISDA Master Agreement, the fund’s counterparty risk due to cleared swaps is mitigated by the clearinghouses’ margining requirements and financial safeguards in the event of a clearing broker default.
The fund entered into credit default swap agreements in order to manage its exposure to the market or certain sectors of the market, to reduce its credit risk exposure to defaults of corporate and sovereign issuers or to create exposure to corporate or sovereign issuers to which it is not otherwise exposed. In a credit default swap agreement, the protection buyer can make an upfront payment and will make a stream of payments to the protection seller based on a fixed percentage applied to the agreement notional amount in exchange for the right to receive a specified return upon the occurrence of a defined credit event on the reference obligation (which may be either a single security or a basket of securities issued by corporate or sovereign issuers) and, with respect to the rare cases where physical settlement applies, the delivery by the buyer to the seller of a defined deliverable obligation. Although agreement-specific, credit events generally consist of a combination of the following: bankruptcy, failure to pay, restructuring, obligation acceleration, obligation default, or repudiation/moratorium, each as defined in the 2003 ISDA Credit Derivatives Definitions as amended by the relevant agreement. Restructuring is generally not applicable when the reference obligation is issued by a North American corporation and obligation acceleration, obligation default, or repudiation/moratorium are generally
44
Notes to Financial Statements – continued
only applicable when the reference obligation is issued by a sovereign entity or an entity in an emerging country. Upon determination of the final price for the deliverable obligation (or upon delivery of the deliverable obligation in the case of physical settlement), the difference between the value of the deliverable obligation and the swap agreement’s notional amount is recorded as realized gain or loss on swap agreements in the Statement of Operations.
Credit default swap agreements are considered to have credit-risk-related contingent features since they trigger payment by the protection seller to the protection buyer upon the occurrence of a defined credit event. The maximum amount of future, undiscounted payments that the fund, as protection seller, could be required to make is equal to the swap agreement’s notional amount. The protection seller’s payment obligation would be offset to the extent of the value of the agreement’s deliverable obligation. At April 30, 2014, the fund did not hold any credit default swap agreements at an unrealized loss where it is the protection seller.
The fund’s maximum risk of loss from counterparty risk, either as the protection seller or as the protection buyer, is the fair value of the agreement. For uncleared swaps, counterparty risk is reduced by having an ISDA Master Agreement between the fund and the counterparty providing for netting as described above and by the posting of collateral by the counterparty to the fund to cover the fund’s exposure to the counterparty under such ISDA Master Agreement. For cleared swaps, the fund’s counterparty risk is mitigated by the clearinghouses’ margining requirements and financial safeguards in the event of a clearing broker default.
Dollar Roll Transactions – The fund enters into dollar roll transactions, with respect to mortgage backed securities issued by Ginnie Mae, Fannie Mae, and Freddie Mac, in which the fund sells mortgage backed securities to financial institutions and simultaneously agrees to purchase similar (same issuer, type and coupon) securities at a later date at an agreed-upon price. During the period between the sale and repurchase in a dollar roll transaction the fund will not be entitled to receive interest and principal payments on the securities sold but is compensated by interest earned on the proceeds of the initial sale and by a lower purchase price on the securities to be repurchased which enhances the fund’s total return. The fund accounts for dollar roll transactions as purchases and sales and realizes gains and losses on these transactions.
Indemnifications – Under the fund’s organizational documents, its officers and Trustees may be indemnified against certain liabilities and expenses arising out of the performance of their duties to the fund. Additionally, in the normal course of business, the fund enters into agreements with service providers that may contain indemnification clauses. The fund’s maximum exposure under these agreements is unknown as this would involve future claims that may be made against the fund that have not yet occurred.
Investment Transactions and Income – Investment transactions are recorded on the trade date. Interest income is recorded on the accrual basis. All premium and discount is amortized or accreted for financial statement purposes in accordance with U.S. generally accepted accounting principles. Interest payments received in additional securities are recorded on the ex-interest date in an amount equal to the value of the security on such date. Debt obligations may be placed on non-accrual status or set to
45
Notes to Financial Statements – continued
accrue at a rate of interest less than the contractual coupon when the collection of all or a portion of interest has become doubtful. Interest income for those debt obligations may be further reduced by the write-off of the related interest receivables when deemed uncollectible.
The fund may receive proceeds from litigation settlements. Any proceeds received from litigation involving portfolio holdings are reflected in the Statement of Operations in realized gain/loss if the security has been disposed of by the fund or in unrealized gain/loss if the security is still held by the fund. Any other proceeds from litigation not related to portfolio holdings are reflected as other income in the Statement of Operations.
The fund invests a significant portion of its assets in asset-backed and/or mortgage-backed securities. The value of these securities may depend, in part, on the issuer’s or borrower’s credit quality or ability to pay principal and interest when due and may fall if an issuer or borrower defaults on its obligation to pay principal or interest or if the instrument’s credit rating is downgraded by a credit rating agency. U.S. Government securities not supported as to the payment of principal or interest by the U.S. Treasury, such as those issued by Fannie Mae, Freddie Mac, and the Federal Home Loan Banks, are subject to greater credit risk than are U.S. Government securities supported by the U.S. Treasury, such as those issued by Ginnie Mae.
The fund purchased or sold debt securities on a when-issued or delayed delivery basis, or in a “To Be Announced” (TBA) or “forward commitment” transaction with delivery or payment to occur at a later date beyond the normal settlement period. At the time a fund enters into a commitment to purchase or sell a security, the transaction is recorded and the value of the security acquired is reflected in the fund’s net asset value. The price of such security and the date that the security will be delivered and paid for are fixed at the time the transaction is negotiated. The value of the security may vary with market fluctuations. No interest accrues to the fund until payment takes place. At the time that a fund enters into this type of transaction, the fund is required to have sufficient cash and/or liquid securities to cover its commitments. Losses may arise due to changes in the value of the underlying securities or if the counterparty does not perform under the contract’s terms, or if the issuer does not issue the securities due to political, economic or other factors. Additionally, losses may arise due to declines in the value of the securities prior to settlement date.
To mitigate this risk of loss on TBA securities and other types of forward settling mortgage-backed securities, the fund whenever possible enters into a Master Securities Forward Transaction Agreement (“MSFTA”) on a bilateral basis with each of the counterparties with whom it undertakes a significant volume of transactions. The MSFTA gives each party to the agreement the right to terminate all transactions traded under such agreement if there is a certain deterioration in the credit quality of the other party. Upon an event of default or a termination of the MSFTA, the non-defaulting party has the right to close out all transactions traded under such agreement and to net amounts owed under each transaction to one net amount payable by one party to the other. This right to close out and net payments across all transactions traded under the MSFTA could result in a reduction of the fund’s credit risk to such counterparty equal to any amounts payable by the fund under the applicable transactions, if any.
46
Notes to Financial Statements – continued
For mortgage backed securities traded under a MSFTA, the collateral and margining requirements are contract specific. Collateral amounts across all transactions traded under such agreement are netted and one amount is posted from one party to the other to collateralize such obligations. Cash that has been pledged to cover the fund’s collateral or margin obligations under a MSFTA, if any, will be reported separately on the Statement of Assets and Liabilities as restricted cash. Securities pledged as collateral or margin for the same purpose, if any, are noted in the Portfolio of Investments.
Fees Paid Indirectly – The fund’s custody fee may be reduced according to an arrangement that measures the value of cash deposited with the custodian by the fund. This amount, for the year ended April 30, 2014, is shown as a reduction of total expenses in the Statement of Operations.
Tax Matters and Distributions – The fund intends to qualify as a regulated investment company, as defined under Subchapter M of the Internal Revenue Code, and to distribute all of its taxable income, including realized capital gains. As a result, no provision for federal income tax is required. The fund’s federal tax returns, when filed, will remain subject to examination by the Internal Revenue Service for a three year period. Management has analyzed the fund’s tax positions taken on federal and state tax returns for all open tax years and does not believe that there are any uncertain tax positions that require recognition of a tax liability. Foreign taxes, if any, have been accrued by the fund in the accompanying financial statements in accordance with the applicable foreign tax law. Foreign income taxes may be withheld by certain countries in which the fund invests. Additionally, capital gains realized by the fund on securities issued in or by certain foreign countries may be subject to capital gains tax imposed by those countries.
Distributions to shareholders are recorded on the ex-dividend date. Income and capital gain distributions are determined in accordance with income tax regulations, which may differ from U.S. generally accepted accounting principles. Certain capital accounts in the financial statements are periodically adjusted for permanent differences in order to reflect their tax character. These adjustments have no impact on net assets or net asset value per share. Temporary differences which arise from recognizing certain items of income, expense, gain or loss in different periods for financial statement and tax purposes will reverse at some time in the future. Distributions in excess of net investment income or net realized gains are temporary overdistributions for financial statement purposes resulting from differences in the recognition or classification of income or distributions for financial statement and tax purposes.
Book/tax differences primarily relate to expiration of capital loss carryforwards and amortization and accretion of debt securities.
The tax character of distributions declared to shareholders for the last two fiscal years is as follows:
| | | | | | | | |
| | | 4/30/14 | | | 4/30/13 | |
Ordinary income (including any
short-term capital gains) | | | $22,309,355 | | | | $27,672,264 | |
47
Notes to Financial Statements – continued
The federal tax cost and the tax basis components of distributable earnings were as follows:
| | | | |
| As of 4/30/14 | | | |
| Cost of investments | | | $1,506,968,539 | |
| Gross appreciation | | | 14,939,855 | |
| Gross depreciation | | | (12,127,139 | ) |
| Net unrealized appreciation (depreciation) | | | $2,812,716 | |
| Undistributed ordinary income | | | 277,278 | |
| Capital loss carryforwards | | | (66,507,890 | ) |
| Post-October capital loss deferral | | | (5,724,637 | ) |
| Other temporary differences | | | (1,868,965 | ) |
Under the Regulated Investment Company Modernization Act of 2010 (the “Act”), net capital losses recognized for fund fiscal years beginning after April 30, 2011 may be carried forward indefinitely, and their character is retained as short-term and/or long-term losses (“post-enactment losses”). Previously, net capital losses were carried forward for eight years and treated as short-term losses (“pre-enactment losses”). As a transition rule, the Act requires that all post-enactment net capital losses be used before pre-enactment net capital losses.
As of April 30, 2014, the fund had capital loss carryforwards available to offset future realized gains as follows:
| | | | |
Pre-enactment losses which expire as
follows: | |
| 4/30/15 | | | $(11,871,035 | ) |
| 4/30/16 | | | (12,189,538 | ) |
| 4/30/17 | | | (11,740,197 | ) |
| 4/30/18 | | | (9,393,942 | ) |
| 4/30/19 | | | (9,431,348 | ) |
| Total | | | $(54,626,060 | ) |
|
Post-enactment losses which are
characterized as follows: | |
| Short-Term | | | $(586,793 | ) |
| Long-Term | | | (11,295,037 | ) |
| Total | | | $(11,881,830 | ) |
Multiple Classes of Shares of Beneficial Interest – The fund offers multiple classes of shares, which differ in their respective distribution, service, and program manager fees. The fund’s income and common expenses are allocated to shareholders based on the value of settled shares outstanding of each class. The fund’s realized and unrealized gain (loss) are allocated to shareholders based on the daily net assets of each class. Dividends are declared separately for each class. Differences in per share dividend rates are generally due to differences in separate class expenses. Class B and Class 529B shares will convert to Class A and Class 529A shares, respectively, approximately eight years after purchase.
48
Notes to Financial Statements – continued
The fund’s distributions declared to shareholders as reported in the Statements of Changes in Net Assets are presented by class as follows:
| | | | | | | | |
| | | From net investment
income | |
| | | Year
ended
4/30/14 | | | Year
ended
4/30/13 (i) | |
| Class A | | | $9,445,996 | | | | $13,867,693 | |
| Class B | | | 69,717 | | | | 137,692 | |
| Class C | | | 1,455,089 | | | | 3,154,673 | |
| Class I | | | 3,654,809 | | | | 4,890,360 | |
| Class R1 | | | 4,554 | | | | 9,397 | |
| Class R2 | | | 55,448 | | | | 95,807 | |
| Class R3 | | | 123,605 | | | | 184,247 | |
| Class R4 | | | 15,611 | | | | 21,052 | |
| Class R5 | | | 6,748,763 | | | | 4,315,528 | |
| Class 529A | | | 565,430 | | | | 692,401 | |
| Class 529B | | | 14,446 | | | | 28,021 | |
| Class 529C | | | 155,887 | | | | 275,393 | |
| Total | | | $22,309,355 | | | | $27,672,264 | |
| (i) | For Class R5, the period is from inception, September 4, 2012, through the stated period end. |
(3) Transactions with Affiliates
Investment Adviser – The fund has an investment advisory agreement with MFS to provide overall investment management and related administrative services and facilities to the fund. The management fee is computed daily and paid monthly at an annual rate of 0.40% of the fund’s average daily net assets.
MFS has agreed in writing to reduce its management fee by a specified amount if certain MFS mutual fund assets exceed thresholds agreed to by MFS and the fund’s Board of Trustees. For the year ended April 30, 2014, this management fee reduction amounted to $28,364, which is included in the reduction of total expenses in the Statement of Operations. The management fee incurred for the year ended April 30, 2014 was equivalent to an annual effective rate of 0.40% of the fund’s average daily net assets.
Distributor – MFS Fund Distributors, Inc. (MFD), a wholly-owned subsidiary of MFS, as distributor, received $145,960 and $151,867 for the year ended April 30, 2014, as its portion of the initial sales charge on sales of Class A and Class 529A shares of the fund, respectively.
The Board of Trustees has adopted a distribution plan for certain share classes pursuant to Rule 12b-1 of the Investment Company Act of 1940.
The fund’s distribution plan provides that the fund will pay MFD for services provided by MFD and financial intermediaries in connection with the distribution and servicing of certain share classes. One component of the plan is a distribution fee paid to MFD and another component of the plan is a service fee paid to MFD. MFD may subsequently pay all, or a portion, of the distribution and/or service fees to financial intermediaries.
49
Notes to Financial Statements – continued
Distribution Plan Fee Table:
| | | | | | | | | | | | | | | | | | | | |
| | | Distribution
Fee Rate (d) | | | Service
Fee Rate (d) | | | Total
Distribution
Plan (d) | | | Annual
Effective
Rate (e) | | | Distribution
and Service
Fee | |
| Class A | | | — | | | | 0.25% | | | | 0.25% | | | | 0.15% | | | | $1,485,236 | |
| Class B | | | 0.75% | | | | 0.25% | | | | 1.00% | | | | 0.90% | | | | 84,145 | |
| Class C | | | 0.75% | | | | 0.25% | | | | 1.00% | | | | 1.00% | | | | 1,942,400 | |
| Class R1 | | | 0.75% | | | | 0.25% | | | | 1.00% | | | | 1.00% | | | | 6,209 | |
| Class R2 | | | 0.25% | | | | 0.25% | | | | 0.50% | | | | 0.40% | | | | 20,720 | |
| Class R3 | | | — | | | | 0.25% | | | | 0.25% | | | | 0.25% | | | | 20,758 | |
| Class 529A | | | — | | | | 0.25% | | | | 0.25% | | | | 0.15% | | | | 92,121 | |
| Class 529B | | | 0.75% | | | | 0.25% | | | | 1.00% | | | | 0.91% | | | | 18,592 | |
| Class 529C | | | 0.75% | | | | 0.25% | | | | 1.00% | | | | 0.99% | | | | 226,492 | |
| Total Distribution and Service Fees | | | | $3,896,673 | |
| (d) | In accordance with the distribution plan for certain classes, the fund pays distribution and/or service fees equal to these annual percentage rates of each class’s average daily net assets. The distribution and service fee rates disclosed by class represent the current rates in effect at the end of the reporting period. Any rate changes, if applicable, are detailed below. |
| (e) | The annual effective rates represent actual fees incurred under the distribution plan for the year ended April 30, 2014 based on each class’s average daily net assets. 0.10% of the Class A and Class 529A service fee is currently being waived under a written waiver arrangement. For the year ended April 30, 2014, this waiver amounted to $630,938 and is included in the reduction of total expenses in the Statement of Operations. For one year from the date of sale of Class B and Class 529B shares, assets attributable to such Class B and Class 529B shares are subject to the 0.25% annual Class B and Class 529B service fee. On assets attributable to all other Class B and Class 529B shares, 0.15% of the Class B and Class 529B service fee is being paid by the fund and 0.10% of the Class B and Class 529B service fee is currently being waived under a written waiver agreement. For the year ended April 30, 2014, this waiver amounted to $10,050 for Class B and Class 529B shares, and is included in the reduction of total expenses in the Statement of Operations. 0.10% of the Class R2 distribution fee is currently being waived under a written waiver agreement. For the year ended April 30, 2014, this waiver amounted to $4,144 and is included in the reduction of total expenses in the Statement of Operations. These written waiver agreements will continue until modified by the fund’s Board of Trustees, but such agreements will continue at least until August 31, 2014. MFD has voluntarily agreed to rebate a portion of each class’s 0.25% service fee attributable to accounts for which MFD retains the 0.25% service fee except for accounts attributable to MFS or its affiliates’ seed money. For the year ended April 30, 2014, this rebate amounted to $14,265, $1, $207, $1,443, $61, and $1,925, for Class A, Class B, Class C, Class 529A, Class 529B, and Class 529C, respectively, and is included in the reduction of total expenses in the Statement of Operations. |
Certain Class A shares are subject to a contingent deferred sales charge (CDSC) in the event of a shareholder redemption within 18 months of purchase for shares purchased on or after August 1, 2012, and within 24 months of purchase for shares purchased prior to August 1, 2012. Class C and Class 529C shares are subject to a CDSC in the event of a shareholder redemption within 12 months of purchase. Class B and
50
Notes to Financial Statements – continued
Class 529B shares are subject to a CDSC in the event of a shareholder redemption within six years of purchase. All contingent deferred sales charges are paid to MFD and during the year ended April 30, 2014, were as follows:
| | | | |
| | | Amount | |
| Class A | | | $46,929 | |
| Class B | | | 10,484 | |
| Class C | | | 41,445 | |
| Class 529B | | | 76 | |
| Class 529C | | | 125 | |
The fund has entered into and may from time to time enter into contracts with program managers and other parties which administer the tuition programs through which an investment in the fund’s 529 share classes is made. The fund has entered into an agreement with MFD pursuant to which MFD receives an annual fee of up to 0.10% of the average daily net assets attributable to each 529 share class. MFD has agreed to waive a portion of this fee in an amount equal to 0.05% of the average daily net assets for each 529 share class. This waiver agreement will expire on August 31, 2015, unless MFD elects to extend the waiver. For the year ended April 30, 2014, this waiver amounted to $30,680 and is included in the reduction of total expenses in the Statement of Operations. The program manager fee incurred for the year ended April 30, 2014 was equivalent to an annual effective rate of 0.05% of the average daily net assets attributable to each 529 share class. The services provided by MFD, or a third party with which MFD contracts, include recordkeeping and tax reporting and account services, as well as services designed to maintain the program’s compliance with the Internal Revenue Code and other regulatory requirements. Program manager fees and waivers for the year ended April 30, 2014, were as follows:
| | | | | | | | |
| | | Fee | | | Waiver | |
| Class 529A | | | $36,848 | | | | $18,425 | |
| Class 529B | | | 1,859 | | | | 930 | |
| Class 529C | | | 22,649 | | | | 11,325 | |
| Total Program Manager Fees and Waivers | | | $61,356 | | | | $30,680 | |
Shareholder Servicing Agent – MFS Service Center, Inc. (MFSC), a wholly-owned subsidiary of MFS, receives a fee from the fund for its services as shareholder servicing agent calculated as a percentage of the average daily net assets of the fund as determined periodically under the supervision of the fund’s Board of Trustees. For the year ended April 30, 2014, the fee was $323,069, which equated to 0.0222% annually of the fund’s average daily net assets. MFSC also receives payment from the fund for out-of-pocket expenses, sub-accounting and other shareholder servicing costs which may be paid to affiliated and unaffiliated service providers. Class R5 shares do not incur sub-accounting fees. For the year ended April 30, 2014, these out-of-pocket expenses, sub-accounting and other shareholder servicing costs amounted to $931,009.
Under a Special Servicing Agreement among MFS, each MFS fund which invests in other MFS funds (“MFS fund-of-funds”) and certain underlying funds in which a MFS fund-of-funds invests (“underlying funds”), each underlying fund may pay a portion of each MFS fund-of-fund’s transfer agent-related expenses, including sub-accounting
51
Notes to Financial Statements – continued
fees payable to financial intermediaries, to the extent such payments do not exceed the benefits realized or expected to be realized by the underlying fund from the investment in the underlying fund by the MFS fund-of-fund. For the year ended April 30, 2014, these costs for the fund amounted to $338,351 and are included in “Shareholder servicing costs” in the Statement of Operations.
Administrator – MFS provides certain financial, legal, shareholder communications, compliance, and other administrative services to the fund. Under an administrative services agreement, the fund partially reimburses MFS the costs incurred to provide these services. The fund is charged an annual fixed amount of $17,500 plus a fee based on average daily net assets. The administrative services fee incurred for the year ended April 30, 2014 was equivalent to an annual effective rate of 0.0126% of the fund’s average daily net assets.
Trustees’ and Officers’ Compensation – The fund pays compensation to independent Trustees in the form of a retainer, attendance fees, and additional compensation to Board and Committee chairpersons. The fund does not pay compensation directly to Trustees or officers of the fund who are also officers of the investment adviser, all of whom receive remuneration for their services to the fund from MFS. Certain officers and Trustees of the fund are officers or directors of MFS, MFD, and MFSC.
Prior to December 31, 2001, the fund had an unfunded defined benefit plan (“DB plan”) for independent Trustees. As of December 31, 2001, the Board took action to terminate the DB plan with respect to then-current and any future independent Trustees, such that the DB plan covers only certain of those former independent Trustees who retired on or before December 31, 2001. The DB plan resulted in a pension expense of $149 and is included in independent Trustees’ compensation for the year ended April 30, 2014. The liability for deferred retirement benefits payable to certain independent Trustees under the DB plan amounted to $5,293 at April 30, 2014, and is included in “Payable for independent Trustees’ compensation” in the Statement of Assets and Liabilities.
Other – This fund and certain other funds managed by MFS (the funds) have entered into services agreements (the Agreements) which provide for payment of fees by the funds to Tarantino LLC and Griffin Compliance LLC in return for the provision of services of an Independent Chief Compliance Officer (ICCO) and Assistant ICCO, respectively, for the funds. The ICCO and Assistant ICCO are officers of the funds and the sole members of Tarantino LLC and Griffin Compliance LLC, respectively. The funds can terminate the Agreements with Tarantino LLC and Griffin Compliance LLC at any time under the terms of the Agreements. For the year ended April 30, 2014, the aggregate fees paid by the fund to Tarantino LLC and Griffin Compliance LLC were $8,192 and are included in “Miscellaneous” expense in the Statement of Operations. MFS has agreed to reimburse the fund for a portion of the payments made by the fund in the amount of $2,817, which is included in the reduction of total expenses in the Statement of Operations. Additionally, MFS has agreed to bear all expenses associated with office space, other administrative support, and supplies provided to the ICCO and Assistant ICCO.
52
Notes to Financial Statements – continued
The fund invests in the MFS Institutional Money Market Portfolio which is managed by MFS and seeks current income consistent with preservation of capital and liquidity. Income earned on this investment is included in “Dividends from underlying affiliated funds” in the Statement of Operations. This money market fund does not pay a management fee to MFS.
(4) Portfolio Securities
Purchases and sales of investments, other and short-term obligations, were as follows:
| | | | | | | | |
| | | Purchases | | | Sales | |
| U.S. Government securities | | | $93,137,428 | | | | $19,263,879 | |
| Investments (non-U.S. Government securities) | | | $494,255,445 | | | | $391,212,210 | |
(5) Shares of Beneficial Interest
The fund’s Declaration of Trust permits the Trustees to issue an unlimited number of full and fractional shares of beneficial interest. Transactions in fund shares were as follows:
| | | | | | | | | | | | | | | | |
| | | Year ended
4/30/14 | | | Year ended
4/30/13 (i) | |
| | | Shares | | | Amount | | | Shares | | | Amount | |
| Shares sold | | | | | | | | | | | | | | | | |
Class A | | | 41,548,442 | | | | $252,133,623 | | | | 27,796,786 | | | | $170,293,730 | |
Class B | | | 810,918 | | | | 4,903,890 | | | | 492,292 | | | | 3,008,299 | |
Class C | | | 8,203,472 | | | | 49,746,958 | | | | 8,657,142 | | | | 52,997,594 | |
Class I | | | 44,840,651 | | | | 270,634,378 | | | | 24,488,550 | | | | 149,433,735 | |
Class R1 | | | 42,746 | | | | 258,602 | | | | 24,951 | | | | 152,353 | |
Class R2 | | | 297,206 | | | | 1,802,164 | | | | 357,204 | | | | 2,187,124 | |
Class R3 | | | 274,238 | | | | 1,661,272 | | | | 264,364 | | | | 1,618,415 | |
Class R4 | | | 65,231 | | | | 395,741 | | | | 18,143 | | | | 111,292 | |
Class R5 | | | 19,140,680 | | | | 115,768,115 | | | | 54,888,478 | | | | 335,868,553 | |
Class 529A | | | 3,284,203 | | | | 19,900,347 | | | | 2,738,371 | | | | 16,770,217 | |
Class 529B | | | 259,873 | | | | 1,569,086 | | | | 217,671 | | | | 1,328,939 | |
Class 529C | | | 1,804,783 | | | | 10,936,865 | | | | 1,742,076 | | | | 10,669,278 | |
| | | 120,572,443 | | | | $729,711,041 | | | | 121,686,028 | | | | $744,439,529 | |
| | | | |
Shares issued to shareholders in
reinvestment of distributions | | | | | | | | | | | | | | | | |
Class A | | | 1,311,068 | | | | $7,949,649 | | | | 1,853,606 | | | | $11,358,643 | |
Class B | | | 10,171 | | | | 61,530 | | | | 19,610 | | | | 119,822 | |
Class C | | | 202,301 | | | | 1,226,321 | | | | 401,618 | | | | 2,458,718 | |
Class I | | | 268,883 | | | | 1,623,429 | | | | 649,216 | | | | 3,961,647 | |
Class R1 | | | 753 | | | | 4,553 | | | | 1,538 | | | | 9,395 | |
Class R2 | | | 7,405 | | | | 44,901 | | | | 14,140 | | | | 86,609 | |
Class R3 | | | 20,362 | | | | 123,362 | | | | 30,094 | | | | 184,198 | |
Class R4 | | | 2,403 | | | | 14,583 | | | | 2,923 | | | | 17,909 | |
Class R5 | | | 1,115,373 | | | | 6,748,750 | | | | 705,485 | | | | 4,315,528 | |
Class 529A | | | 91,936 | | | | 557,376 | | | | 112,316 | | | | 688,314 | |
Class 529B | | | 2,350 | | | | 14,199 | | | | 4,522 | | | | 27,592 | |
Class 529C | | | 25,479 | | | | 154,483 | | | | 44,697 | | | | 273,783 | |
| | | 3,058,484 | | | | $18,523,136 | | | | 3,839,765 | | | | $23,502,158 | |
53
Notes to Financial Statements – continued
| | | | | | | | | | | | | | | | |
| | | Year ended
4/30/14 | | | Year ended
4/30/13 (i) | |
| | | Shares | | | Amount | | | Shares | | | Amount | |
| Shares reacquired | | | | | | | | | | | | | | | | |
Class A | | | (42,856,982 | ) | | | $(260,054,259 | ) | | | (37,732,675 | ) | | | $(231,160,582 | ) |
Class B | | | (769,239 | ) | | | (4,654,299 | ) | | | (916,878 | ) | | | (5,598,641 | ) |
Class C | | | (14,751,133 | ) | | | (89,411,753 | ) | | | (11,034,867 | ) | | | (67,562,803 | ) |
Class I | | | (27,105,045 | ) | | | (163,609,334 | ) | | | (54,561,331 | ) | | | (333,648,528 | ) |
Class R1 | | | (26,509 | ) | | | (160,509 | ) | | | (36,246 | ) | | | (221,327 | ) |
Class R2 | | | (242,325 | ) | | | (1,469,719 | ) | | | (482,471 | ) | | | (2,953,630 | ) |
Class R3 | | | (194,789 | ) | | | (1,181,292 | ) | | | (310,094 | ) | | | (1,898,581 | ) |
Class R4 | | | (62,783 | ) | | | (381,277 | ) | | | (10,469 | ) | | | (63,972 | ) |
Class R5 | | | (2,286,052 | ) | | | (13,831,757 | ) | | | (355,058 | ) | | | (2,173,018 | ) |
Class 529A | | | (2,234,937 | ) | | | (13,548,688 | ) | | | (1,738,597 | ) | | | (10,651,005 | ) |
Class 529B | | | (248,344 | ) | | | (1,500,563 | ) | | | (233,198 | ) | | | (1,423,425 | ) |
Class 529C | | | (1,581,181 | ) | | | (9,585,770 | ) | | | (1,138,797 | ) | | | (6,974,116 | ) |
| | | (92,359,319 | ) | | | $(559,389,220 | ) | | | (108,550,681 | ) | | | $(664,329,628 | ) |
| | | | |
| Net change | | | | | | | | | | | | | | | | |
Class A | | | 2,528 | | | | $29,013 | | | | (8,082,283 | ) | | | $(49,508,209 | ) |
Class B | | | 51,850 | | | | 311,121 | | | | (404,976 | ) | | | (2,470,520 | ) |
Class C | | | (6,345,360 | ) | | | (38,438,474 | ) | | | (1,976,107 | ) | | | (12,106,491 | ) |
Class I | | | 18,004,489 | | | | 108,648,473 | | | | (29,423,565 | ) | | | (180,253,146 | ) |
Class R1 | | | 16,990 | | | | 102,646 | | | | (9,757 | ) | | | (59,579 | ) |
Class R2 | | | 62,286 | | | | 377,346 | | | | (111,127 | ) | | | (679,897 | ) |
Class R3 | | | 99,811 | | | | 603,342 | | | | (15,636 | ) | | | (95,968 | ) |
Class R4 | | | 4,851 | | | | 29,047 | | | | 10,597 | | | | 65,229 | |
Class R5 | | | 17,970,001 | | | | 108,685,108 | | | | 55,238,905 | | | | 338,011,063 | |
Class 529A | | | 1,141,202 | | | | 6,909,035 | | | | 1,112,090 | | | | 6,807,526 | |
Class 529B | | | 13,879 | | | | 82,722 | | | | (11,005 | ) | | | (66,894 | ) |
Class 529C | | | 249,081 | | | | 1,505,578 | | | | 647,976 | | | | 3,968,945 | |
| | | 31,271,608 | | | | $188,844,957 | | | | 16,975,112 | | | | $103,612,059 | |
| (i) | For Class R5, the period is from inception, September 4, 2012, through the stated period end. |
Effective May 1, 2006, the sale of Class B shares of the fund have been suspended except in certain circumstances. Please see the fund’s prospectus for details.
The fund is one of several mutual funds in which the MFS funds-of-funds may invest. The MFS funds-of-funds do not invest in the underlying funds for the purpose of exercising management or control. At the end of the period, the MFS Conservative Allocation Fund, the MFS Lifetime Retirement Income Fund, the MFS Lifetime 2020 Fund, and the MFS Lifetime 2010 Fund were the owners of record of approximately 18%, 4%, 2% and 1%, respectively, of the value of outstanding voting shares of the fund. In addition, the MFS Lifetime 2015 Fund was the owner of record of less than 1% of the value of outstanding voting shares of the fund.
(6) Line of Credit
The fund and certain other funds managed by MFS participate in a $1.1 billion unsecured committed line of credit, subject to a $1 billion sublimit, provided by a
54
Notes to Financial Statements – continued
syndication of banks under a credit agreement. Borrowings may be made for temporary financing needs. Interest is charged to each fund, based on its borrowings, generally at a rate equal to the higher of the Federal Reserve funds rate or one month LIBOR plus an agreed upon spread. A commitment fee, based on the average daily, unused portion of the committed line of credit, is allocated among the participating funds at the end of each calendar quarter. In addition, the fund and other funds managed by MFS have established unsecured uncommitted borrowing arrangements with certain banks for temporary financing needs. Interest is charged to each fund, based on its borrowings, at a rate equal to the Federal Reserve funds rate plus an agreed upon spread. For the year ended April 30, 2014, the fund’s commitment fee and interest expense were $5,988 and $0, respectively, and are included in “Miscellaneous” expense in the Statement of Operations.
(7) Transactions in Underlying Affiliated Funds-Affiliated Issuers
An affiliated issuer may be considered one in which the fund owns 5% or more of the outstanding voting securities, or a company which is under common control. For the purposes of this report, the fund assumes the following to be an affiliated issuer:
| | | | | | | | | | | | | | | | |
| Underlying Affiliated Fund | | Beginning
Shares/Par
Amount | | | Acquisitions
Shares/Par
Amount | | | Dispositions
Shares/Par
Amount | | | Ending
Shares/Par
Amount | |
MFS Institutional Money
Market Portfolio | | | 41,336,989 | | | | 490,486,535 | | | | (498,793,402 | ) | | | 33,030,122 | |
| | | | |
| Underlying Affiliated Fund | | Realized Gain (Loss) | | | Capital Gain Distributions | | | Dividend Income | | | Ending Value | |
MFS Institutional Money
Market Portfolio | | | $— | | | | $— | | | | $47,444 | | | | $33,030,122 | |
55
REPORT OF INDEPENDENT REGISTERED PUBLIC ACCOUNTING FIRM
To the Board of Trustees of MFS Series Trust IX and the Shareholders of
MFS Limited Maturity Fund:
We have audited the accompanying statement of assets and liabilities, including the portfolio of investments, of MFS Limited Maturity Fund (one of the series of MFS Series Trust IX) (the “Fund”) as of April 30, 2014, and the related statement of operations for the year then ended, the statements of changes in net assets for each of the two years in the period then ended, and the financial highlights for each of the periods presented. These financial statements and financial highlights are the responsibility of the Fund’s management. Our responsibility is to express an opinion on these financial statements and financial highlights based on our audits.
We conducted our audits in accordance with the standards of the Public Company Accounting Oversight Board (United States). Those standards require that we plan and perform the audit to obtain reasonable assurance about whether the financial statements and financial highlights are free of material misstatement. The Fund is not required to have, nor were we engaged to perform, an audit of its internal control over financial reporting. Our audits included consideration of internal control over financial reporting as a basis for designing audit procedures that are appropriate in the circumstances, but not for the purpose of expressing an opinion on the effectiveness of the Fund’s internal control over financial reporting. Accordingly, we express no such opinion. An audit also includes examining, on a test basis, evidence supporting the amounts and disclosures in the financial statements, assessing the accounting principles used and significant estimates made by management, as well as evaluating the overall financial statement presentation. Our procedures included confirmation of securities owned as of April 30, 2014, by correspondence with the custodian and brokers; where replies were not received from brokers, we performed other auditing procedures. We believe that our audits provide a reasonable basis for our opinion.
In our opinion, the financial statements and financial highlights referred to above present fairly, in all material respects, the financial position of MFS Limited Maturity Fund as of April 30, 2014, the results of its operations for the year then ended, the changes in its net assets for each of the two years in the period then ended, and the financial highlights for each of the periods presented, in conformity with accounting principles generally accepted in the United States of America.
DELOITTE & TOUCHE LLP
Boston, Massachusetts
June 17, 2014
56
TRUSTEES AND OFFICERS — IDENTIFICATION AND BACKGROUND
The Trustees and Officers of the Trust, as of June 1, 2014, are listed below, together with their principal occupations during the past five years. (Their titles may have varied during that period.) The address of each Trustee and Officer is 111 Huntington Avenue, Boston, Massachusetts 02199-7618. It is expected that the Board will appoint Mr. Timothy M. Fagan as Chief Compliance Officer of the MFS Funds on November 1, 2014.
| | | | | | | | |
Name, Age | | Position(s) Held with Fund | | Trustee/Officer
Since (h) | | Principal
Occupations During the Past Five Years | | Other Directorships (j) |
| INTERESTED TRUSTEES |
Robert J. Manning (k) (age 50) | | Trustee | | February 2004 | | Massachusetts Financial Services Company, Chairman, Chief Executive Officer and Director; President (until 2009); Chief Investment Officer (until 2010) | | N/A |
Robin A. Stelmach (k) (age 52) | | Trustee | | January 2014 | | Massachusetts Financial Services Company, Executive Vice President and Chief Operating Officer | | N/A |
| INDEPENDENT TRUSTEES |
David H. Gunning
(age 72) | | Trustee and Chair of Trustees | | January 2004 | | Private investor | | Lincoln Electric Holdings, Inc. (welding equipment manufacturer), Director; Development Alternatives, Inc. (consulting), Director/Non-Executive Chairman |
Steven E. Buller (age 62) | | Trustee | | February 2014 | | Chairman, Financial Accounting Standards Advisory Council; Standing Advisory Group, Public Company Accounting Oversight Board, Member; BlackRock, Inc. (investment management), Managing Director (until 2014), BlackRock Finco (investment management), UK, Director (until 2014) | | N/A |
57
Trustees and Officers – continued
| | | | | | | | |
Name, Age | | Position(s) Held with Fund | | Trustee/Officer
Since (h) | | Principal
Occupations During the Past Five Years | | Other Directorships (j) |
Robert E. Butler
(age 72) | | Trustee | | January 2006 | | Consultant – investment company industry regulatory and compliance matters | | N/A |
Maureen R. Goldfarb (age 59) | | Trustee | | January 2009 | | Private investor | | N/A |
William R. Gutow
(age 72) | | Trustee | | December 1993 | | Private investor and real estate consultant; Capitol Entertainment Management Company (video franchise), Vice Chairman | | Texas Donuts (donut franchise), Vice Chairman (until 2010) |
Michael Hegarty
(age 69) | | Trustee | | December 2004 | | Private investor | | Brookfield Office Properties, Inc. (real estate), Director; Rouse Properties Inc. (real estate), Director; Capmark Financial Group Inc. (real estate), Director |
John P. Kavanaugh (age 59) | | Trustee | | January 2009 | | Private investor | | N/A |
Maryanne L. Roepke (age 58) | | Trustee | | May 2014 | | American Century Investments (investment management), Senior Vice President and Chief Compliance Officer (until 2014) | | N/A |
Laurie J. Thomsen
(age 56) | | Trustee | | March 2005 | | Private investor; New Profit, Inc. (venture philanthropy), Executive Partner (until 2010) | | The Travelers Companies (insurance), Director |
Robert W. Uek
(age 73) | | Trustee | | January 2006 | | Consultant to investment company industry | | N/A |
| OFFICERS | | | | | | | | |
John M. Corcoran (k) (age 49) | | President | | October 2008 | | Massachusetts Financial Services Company, Senior Vice President | | N/A |
Christopher R. Bohane (k) (age 40) | | Assistant Secretary and Assistant Clerk | | July 2005 | | Massachusetts Financial Services Company, Vice President and Assistant General Counsel | | N/A |
58
Trustees and Officers – continued
| | | | | | | | |
Name, Age | | Position(s) Held with Fund | | Trustee/Officer
Since (h) | | Principal
Occupations During the Past Five Years | | Other Directorships (j) |
Kino Clark (k) (age 45) | | Assistant Treasurer | | January 2012 | | Massachusetts Financial Services Company, Vice President | | N/A |
Thomas H. Connors (k) (age 54) | | Assistant Secretary and Assistant Clerk | | September 2012 | | Massachusetts Financial Services Company, Vice President and Senior Counsel; Deutsche Investment Management Americas Inc. (financial service provider), Director and Senior Counsel (until 2012) | | N/A |
Ethan D. Corey (k)
(age 50) | | Assistant
Secretary and Assistant Clerk | | July 2005 | | Massachusetts Financial Services Company, Senior Vice President and Associate General Counsel | | N/A |
David L. DiLorenzo (k) (age 45) | | Treasurer | | July 2005 | | Massachusetts Financial Services Company, Senior Vice President | | N/A |
Brian E. Langenfeld (k) (age 41) | | Assistant
Secretary and Assistant Clerk | | June 2006 | | Massachusetts Financial Services Company, Vice President and Senior Counsel | | N/A |
Susan S. Newton (k) (age 64) | | Assistant
Secretary and Assistant Clerk | | May 2005 | | Massachusetts Financial Services Company, Senior Vice President and Associate General Counsel | | N/A |
Susan A. Pereira (k)
(age 43) | | Assistant
Secretary and Assistant Clerk | | July 2005 | | Massachusetts Financial Services Company, Vice President and Senior Counsel | | N/A |
Kasey L. Phillips (k) (age 43) | | Assistant Treasurer | | September 2012 | | Massachusetts Financial Services Company, Vice President; Wells Fargo Funds Management, LLC, Senior Vice President, Fund Treasurer (until 2012) | | N/A |
59
Trustees and Officers – continued
| | | | | | | | |
Name, Age | | Position(s) Held with Fund | | Trustee/Officer
Since (h) | | Principal
Occupations During the Past Five Years | | Other Directorships (j) |
Mark N. Polebaum (k) (age 62) | | Secretary and
Clerk | | January 2006 | | Massachusetts Financial Services Company, Executive Vice President, General Counsel and Secretary | | N/A |
Frank L. Tarantino (l)
(age 70) | | Independent
Chief Compliance Officer | | June 2004 | | Tarantino LLC (provider of compliance services), Principal | | N/A |
Richard S. Weitzel (k)
(age 43) | | Assistant Secretary and Assistant Clerk | | October 2007 | | Massachusetts Financial Services Company, Senior Vice President and Associate General Counsel | | N/A |
James O. Yost (k)
(age 53) | | Deputy Treasurer | | September 1990 | | Massachusetts Financial Services Company, Senior Vice President | | N/A |
| (h) | Date first appointed to serve as Trustee/officer of an MFS Fund. Each Trustee has served continuously since appointment unless indicated otherwise. For the period from December 15, 2004 until February 22, 2005, Mr. Manning served as Advisory Trustee. For the period October 2008, until January 2012, Mr. Corcoran served as Treasurer of the Funds. Prior to January 2012, Messrs. DiLorenzo and Yost served as Assistant Treasurers of the Funds. |
| (j) | Directorships or trusteeships of companies required to report to the Securities and Exchange Commission (i.e., “public companies”). |
| (k) | “Interested person” of the Trust within the meaning of the Investment Company Act of 1940 (referred to as the 1940 Act), which is the principal federal law governing investment companies like the fund, as a result of position with MFS. The address of MFS is 111 Huntington Avenue, Boston, Massachusetts 02199-7618. |
| (l) | Mr. Tarantino will retire as Independent Chief Compliance Officer of the MFS Funds on October 31, 2014. It is expected that Mr. Tarantino will continue after that date as an Independent Senior Officer of the MFS Funds. |
Each Trustee (except Ms. Stelmach, Mr. Buller and Ms. Roepke) has been elected by shareholders and each Trustee and officer holds office until his or her successor is chosen and qualified or until his or her earlier death, resignation, retirement or removal. The Trust does not hold annual meetings for the purpose of electing Trustees, and Trustees are not elected for fixed terms. Messrs. Butler, Kavanaugh, Uek and Mses. Thomsen and Roepke are members of the Trust’s Audit Committee.
Each of the Fund’s Trustees and officers holds comparable positions with certain other funds of which MFS or a subsidiary is the investment adviser or distributor, and, in the case of the officers, with certain affiliates of MFS. As of January 1, 2014, the Trustees served as board members of 142 funds within the MFS Family of Funds.
60
Trustees and Officers – continued
The Statement of Additional Information for the Fund includes further information about the Trustees and is available without charge upon request by calling 1-800-225-2606.
| | |
| Investment Adviser | | Custodian |
Massachusetts Financial Services Company
111 Huntington Avenue
Boston, MA 02199-7618 | | JPMorgan Chase Bank, NA 4 Metrotech Center New York, NY 11245 |
| Distributor | | Independent Registered Public Accounting Firm |
MFS Fund Distributors, Inc.
111 Huntington Avenue
Boston, MA 02199-7618 | | Deloitte & Touche LLP 200 Berkeley Street Boston, MA 02116 |
| Portfolio Manager | | |
| James Calmas | | |
61
BOARD REVIEW OF INVESTMENT ADVISORY AGREEMENT
A discussion regarding the Board’s most recent review and renewal of the fund’s Investment Advisory Agreement with MFS is available by clicking on the fund’s name under “Mutual Funds” in the “Products” section of the MFS Web site (mfs.com).
PROXY VOTING POLICIES AND INFORMATION
MFS votes proxies on behalf of the fund pursuant to proxy voting policies and procedures that are available without charge, upon request, by calling 1-800-225-2606, by visiting the Proxy Voting section of mfs.com or by visiting the SEC’s Web site at http://www.sec.gov.
Information regarding how the fund voted proxies relating to portfolio securities during the twelve-month period ended June 30, 2013 is available without charge by visiting the Proxy Voting section of mfs.com or by visiting the SEC’s Web site at http://www.sec.gov.
QUARTERLY PORTFOLIO DISCLOSURE
The fund will file a complete schedule of portfolio holdings with the Securities and Exchange Commission (the Commission) for the first and third quarters of each fiscal year on Form N-Q. A shareholder can obtain the quarterly portfolio holdings report at mfs.com. The fund’s Form N-Q is also available on the EDGAR database on the Commission’s Internet Web site at http://www.sec.gov, and may be reviewed and copied at the:
Public Reference Room
Securities and Exchange Commission
100 F Street, NE, Room 1580
Washington, D.C. 20549
Information on the operation of the Public Reference Room may be obtained by calling the Commission at 1-800-SEC-0330. Copies of the fund’s Form N-Q also may be obtained, upon payment of a duplicating fee, by electronic request at the following e-mail address: publicinfo@sec.gov or by writing the Public Reference Section at the above address.
FURTHER INFORMATION
From time to time, MFS may post important information about the fund or the MFS funds on the MFS web site (mfs.com). This information is available by visiting the “Commentary & Announcements” and “Market Outlooks” sections of mfs.com or by clicking on the fund’s name under “Mutual Funds” in the “Products” section of mfs.com.
FEDERAL TAX INFORMATION (unaudited)
The fund will notify shareholders of amounts for use in preparing 2014 income tax forms in January 2015.
62
rev. 3/11
| | | | |
| | | |
FACTS | | WHAT DOES MFS DO WITH YOUR PERSONAL INFORMATION? | |  |
| | |
| Why? | | Financial companies choose how they share your personal information. Federal law gives consumers the right to limit some but not all sharing. Federal law also requires us to tell you how we collect, share, and protect your personal information. Please read this notice carefully to understand what we do. |
| | |
| What? | | The types of personal information we collect and share depend on the product or service you have with us. This information can include: • Social Security number and account balances • Account transactions and transaction history • Checking account information and wire transfer instructions When you are no longer our customer, we continue to share your information as described in this notice. |
| | |
| How? | | All financial companies need to share customers’ personal information to run their everyday business. In the section below, we list the reasons financial companies can share their customers’ personal information; the reasons MFS chooses to share; and whether you can limit this sharing. |
| | | | |
Reasons we can share your
personal information | | Does MFS
share? | | Can you limit
this sharing? |
For our everyday business purposes – such as to process your transactions, maintain your account(s), respond to court orders and legal investigations, or report to credit bureaus | | Yes | | No |
For our marketing purposes – to offer our products and services to you | | No | | We don’t share |
| For joint marketing with other financial companies | | No | | We don’t share |
For our affiliates’ everyday business purposes – information about your transactions and experiences | | No | | We don’t share |
For our affiliates’ everyday business purposes – information about your creditworthiness | | No | | We don’t share |
| For nonaffiliates to market to you | | No | | We don’t share |
| | |
| Questions? | | Call 800-225-2606 or go to mfs.com. |
63
| | |
| Who we are |
| Who is providing this notice? | | MFS Funds, MFS Investment Management, MFS Institutional Advisors, Inc., MFS Fund Distributors, Inc., MFS Heritage Trust Company, and MFS Service Center, Inc. |
| | |
| What we do |
| How does MFS protect my personal information? | | To protect your personal information from unauthorized access and use, we use security measures that comply with federal law. These measures include procedural, electronic, and physical safeguards for the protection of the personal information we collect about you. |
| How does MFS collect my personal information? | | We collect your personal information, for example, when you •open an account or provide account information •direct us to buy securities or direct us to sell your securities •make a wire transfer We also collect your personal information from others, such as credit bureaus, affiliates and other companies. |
| Why can’t I limit all sharing? | | Federal law gives you the right to limit only •sharing for affiliates’ everyday business purposes – information about your creditworthiness •affiliates from using your information to market to you •sharing for nonaffiliates to market to you State laws and individual companies may give you additional rights to limit sharing. |
| | |
| Definitions |
| Affiliates | | Companies related by common ownership or control. They can be financial and nonfinancial companies. •MFS does not share personal information with affiliates, except for everyday business purposes as described on page one of this notice. |
| Nonaffiliates | | Companies not related by common ownership or control. They can be financial and nonfinancial companies. •MFS does not share with nonaffiliates so they can market to you. |
| Joint Marketing | | A formal agreement between nonaffiliated financial companies that together market financial products or services to you. •MFS doesn’t jointly market. |
| | |
| Other important information |
| If you own an MFS product or receive an MFS service in the name of a third party such as a bank or broker-dealer, their privacy policy may apply to you instead of ours. |
64
Save paper with eDelivery.

| MFS® will send you prospectuses, |
reports, and proxies directly via e-mail so you will get information faster with less mailbox clutter.
To sign up:
1. Go to mfs.com.
2. Log in via MFS® Access.
3. Select eDelivery.
If you own your MFS fund shares through a financial institution or a retirement plan, MFS® TALK, MFS® Access, or eDelivery may not be available to you.
CONTACT
WEB SITE
mfs.com
MFS TALK
1-800-637-8255
24 hours a day
ACCOUNT SERVICE AND LITERATURE
Shareholders
1-800-225-2606
Financial advisors
1-800-343-2829
Retirement plan services
1-800-637-1255
MAILING ADDRESS
MFS Service Center, Inc.
P.O. Box 55824
Boston, MA 02205-5824
OVERNIGHT MAIL
MFS Service Center, Inc.
c/o Boston Financial Data Services
30 Dan Road
Canton, MA 02021-2809
ANNUAL REPORT
April 30, 2014

MFS® MUNICIPAL LIMITED MATURITY FUND

MTL-ANN
MFS® MUNICIPAL LIMITED MATURITY FUND
CONTENTS
The report is prepared for the general information of shareholders. It is authorized for distribution to prospective investors only when preceded or accompanied by a current prospectus.
NOT FDIC INSURED Ÿ MAY LOSE VALUE Ÿ NO BANK GUARANTEE

LETTER FROM THE CHAIRMAN AND CEO
Dear Shareholders:
After gaining momentum late last year, the U.S. economy slipped this winter, as severe weather curtailed activity. More recently, however, labor market data, consumer
confidence, retail sales and industrial output have indicated that the U.S. economy could be regaining traction.
Europe emerged from its recession midway through 2013. However, its pace of growth has been slow, high unemployment persists and the risk of deflation exists. Asia remains vulnerable. China’s economic growth has slowed, and Japan’s early progress toward an economic turnaround continues to face obstacles. Emerging markets have also displayed much higher volatility, affected by the early transition from aggressive central bank monetary easing.
With so much uncertainty, global financial markets began 2014 with much greater volatility than last year’s broad-based rally. For equity investors, attention to company fundamentals has taken on more importance. Bond investors have been attuned to heightened risks from possible interest rate increases.
As always at MFS®, active risk management is an integral part of how we manage your investments. We use a collaborative process, sharing insights across asset classes, regions and economic sectors. Our global team of investment professionals uses a multidisciplined, long-term, diversified investment approach.
We understand that these are challenging economic times. We believe that we can serve you best by applying proven principles, such as asset allocation and diversification, over the long term. We are confident that this approach can serve you well as you work with your financial advisors to reach your goals in the years ahead.
Respectfully,

Robert J. Manning
Chairman and Chief Executive Officer
MFS Investment Management
June 13, 2014
The opinions expressed in this letter are subject to change, may not be relied upon for investment advice, and no forecasts can be guaranteed.
1
PORTFOLIO COMPOSITION
Portfolio structure (i)

| | | | |
| Top ten industries (i) | | | | |
| General Obligations-General Purpose | | | 19.2% | |
| Universities-Colleges | | | 9.1% | |
| Healthcare Revenue-Hospitals | | | 8.4% | |
| Water & Sewer Utility Revenue | | | 7.8% | |
| General Obligations-Schools | | | 4.9% | |
| State & Local Agencies | | | 4.8% | |
| Utilities-Investor Owned | | | 4.8% | |
| Airport Revenue | | | 4.6% | |
| Utilities-Municipal Owned | | | 4.4% | |
| Miscellaneous Revenue-Other | | | 4.2% | |
| | | | |
| Composition including fixed income credit quality (a)(i) | |
| AAA | | | 14.6% | |
| AA | | | 35.4% | |
| A | | | 33.0% | |
| BBB | | | 13.4% | |
| BB | | | 0.7% | |
| B | | | 1.0% | |
| Not Rated | | | 1.1% | |
| Cash & Other | | | 0.8% | |
| |
| Portfolio facts (i) | | | | |
| Average Duration (d) | | | 3.5 | |
| Average Effective Maturity (m) | | | 4.5 yrs. | |
| (a) | For all securities other than those specifically described below, ratings are assigned to underlying securities utilizing ratings from Moody’s, Fitch, and Standard & Poor’s rating agencies and applying the following hierarchy: If all three agencies provide a rating, the middle rating (after dropping the highest and lowest ratings) is assigned; if two of the three agencies rate a security, the lower of the two is assigned. Ratings are shown in the S&P and Fitch scale (e.g., AAA). Securities rated BBB or higher are considered investment grade. All ratings are subject to change. Not Rated includes fixed income securities, including fixed income futures contracts, which have not been rated by any rating agency. The fund may not hold all of these instruments. The fund is not rated by these agencies. |
| (d) | Duration is a measure of how much a bond’s price is likely to fluctuate with general changes in interest rates, e.g., if rates rise 1.00%, a bond with a 5-year duration is likely to lose about 5.00% of its value due to the interest rate move. |
2
Portfolio Composition – continued
| (i) | For purposes of this presentation, the components include the market value of securities, and reflect the impact of the equivalent exposure of derivative positions, if any. These amounts may be negative from time to time. Equivalent exposure is a calculated amount that translates the derivative position into a reasonable approximation of the amount of the underlying asset that the portfolio would have to hold at a given point in time to have the same price sensitivity that results from the portfolio’s ownership of the derivative contract. When dealing with derivatives, equivalent exposure is a more representative measure of the potential impact of a position on portfolio performance than market value. The bond component will include any accrued interest amounts. |
| (m) | In determining an instrument’s effective maturity for purposes of calculating the fund’s dollar-weighted average effective maturity, MFS uses the instrument’s stated maturity or, if applicable, an earlier date on which MFS believes it is probable that a maturity-shortening device (such as a put, pre-refunding or prepayment) will cause the instrument to be repaid. Such an earlier date can be substantially shorter than the instrument’s stated maturity. |
Where the fund holds convertible bonds, these are treated as part of the equity portion of the portfolio.
Cash & Other includes cash, other assets less liabilities, offsets to derivative positions, and short-term securities.
Percentages are based on net assets as of 4/30/14.
The portfolio is actively managed and current holdings may be different.
3
MANAGEMENT REVIEW
Summary of Results
For the twelve months ended April 30, 2014, Class A shares of the MFS Municipal Limited Maturity Fund (“fund”) provided a total return of –0.13%, at net asset value. This compares with returns of 1.19% and 1.07% for the fund’s benchmarks, the Barclays 3- Year Municipal Bond Index (“3-Year Index”) and the Barclays 5-Year Municipal Bond Index (“5-Year Index”), respectively.
Market Environment
Early in the period, jitters over a banking crisis in Cyprus were more than offset by ongoing accommodative global monetary policy and improving economic data, resulting in gains in both equity and fixed income markets. As the period progressed, concerns that the US Federal Reserve (“Fed”) would begin tapering its quantitative easing (“QE”) program caused sovereign bond yields to spike, credit spreads to widen, and equity valuations to fall. Equities subsequently outperformed fixed income in response to the improved economic fundamentals. A general theme in the market was a rotation in investor allocations from fixed income to equities and emerging markets to developed markets, reflecting an anticipated acceleration in developed market growth rates relative to emerging markets as well as a more equity-friendly macro backdrop.
Toward the middle of the period, the Fed’s decision to postpone QE tapering surprised markets. Favorable market reactions were tempered, however, by tense negotiations over US fiscal policy which resulted in a 16-day partial shutdown of the federal government and a short-term extension in the debt ceiling. The volatility was short-lived, however, as an extension of budget and debt ceiling deadlines allowed the government to re-open, and subsequent economic data reflected moderate but resilient US growth. Also well-received was the decision by the European Central Bank to cut its policy rate as inflation pressures waned in the region. In addition, equity investors appeared to have concluded that there would be no major change in US monetary policy as a result of the nomination of Janet Yellen as the new Fed Chair for a term beginning in early 2014.
During the period, emerging market (“EM”) stresses surfaced as markets focused on imbalances and stagflationary conditions in certain EM countries. In addition, political instability increased in certain areas, notably in the Ukraine where tensions escalated following a change in government and Russia’s annexation of Crimea. Later in the period, markets were forced to contend with some unexpected weakness in the US economy due largely to weather-related interruptions to hiring and spending plans as well as production schedules. Once again, the setback was short-lived as the major US equity indexes traded near their all-time highs by the end of the period.
Over the twelve months ended April 30, 2014, municipal bond yields generally increased as fixed income market activity was led by the Fed’s signal last June 2013 that it would begin to reduce monthly purchases of US Treasury and mortgage-backed securities; the reduction in the size of the purchase program actually began in December 2013, when 10-year US Treasury yields peaked at 3%. Municipal bond prices fell accordingly during this time frame after the Fed announced it might taper asset purchases.
4
Management Review – continued
Further, more flames were fanned by credit concerns, first by Detroit’s Chapter 9 filing in July, and then by increased scrutiny of Puerto Rico’s weakened fiscal position in late August. Since January 2014, municipal market supply/demand dynamics have improved enough to enable municipal bonds to rally as retail investors and hedge funds emerged as the market’s primary source of demand. The supply/demand dynamics were further supported by a reduced level of issuance during Q1 2014 as well as a more stable trend in mutual fund flows.
With the risks of a restructuring of Puerto Rico debt deferred after the Commonwealth successfully issued a $3.5 billion General Obligation bond deal, concerns regarding negative headline risk in the municipal market have also waned for the time being.
Factors Affecting Performance
Relative to the 5-Year Index, the fund’s security selection in “BBB” rated (r) bonds held back relative returns and outweighed the positive impact from an overweight allocation to this credit quality segment. Security selection in “A” rated securities also held back relative returns. Security selection within both the general obligation and utilities sectors was another factor that weakened relative performance.
Relative to the 3-Year Index, the fund’s longer duration (d) stance hindered relative performance during the reporting period, particularly in the “A” and “AAA” rated credit quality segments, both of which were also hampered by weak security selection. Unfavorable security selection in both the general obligation and industrial sectors were also negative factors for the fund’s relative results.
Respectfully,
Geoffrey Schechter
Portfolio Manager
| (d) | Duration is a measure of how much a bond’s price is likely to fluctuate with general changes in interest rates, e.g., if rates rise 1.00%, a bond with a 5-year duration is likely to lose about 5.00% of its value. |
| (r) | Bonds rated “BBB”, “Baa”, or higher are considered investment grade; bonds rated “BB”, “Ba”, or below are considered non-investment grade. The source for bond quality ratings is Moody’s Investors Service, Standard & Poor’s and Fitch, Inc. and are applied using the following hierarchy: If all three agencies provide a rating, the middle rating (after dropping the highest and lowest ratings) is assigned; if two of the three agencies rate a security, the lower of the two is assigned. Ratings are shown in the S&P and Fitch scale (e.g., AAA). For securities which are not rated by any of the three agencies, the security is considered Not Rated. |
Note to Shareholders: Effective May 31, 2014, Jason Kosty is also a Portfolio Manager of the Fund.
The views expressed in this report are those of the portfolio manager only through the end of the period of the report as stated on the cover and do not necessarily reflect the views of MFS or any other person in the MFS organization. These views are subject to change at any time based on market or other conditions, and MFS disclaims any responsibility to update such views. These views may not be relied upon as investment advice or an indication of trading intent on behalf of any MFS portfolio. References to specific securities are not recommendations of such securities, and may not be representative of any MFS portfolio’s current or future investments.
5
PERFORMANCE SUMMARY THROUGH 4/30/14
The following chart illustrates a representative class of the fund’s historical performance in comparison to its benchmark(s). Performance results include the deduction of the maximum applicable sales charge and reflect the percentage change in net asset value, including reinvestment of dividends and capital gains distributions. The performance of other share classes will be greater than or less than that of the class depicted below. Benchmarks are unmanaged and may not be invested in directly. Benchmark returns do not reflect sales charges, commissions or expenses. (See Notes to Performance Summary.)
Performance data shown represents past performance and is no guarantee of future results. Investment return and principal value fluctuate so your shares, when sold, may be worth more or less than the original cost; current performance may be lower or higher than quoted. The performance shown does not reflect the deduction of taxes, if any, that a shareholder would pay on fund distributions or the redemption of fund shares.
Growth of a Hypothetical $10,000 Investment
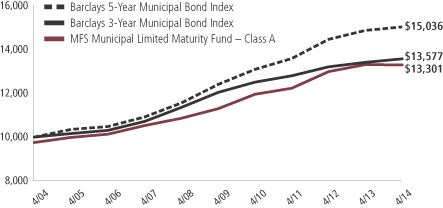
6
Performance Summary – continued
Total Returns through 4/30/14
Average annual without sales charge
| | | | | | | | | | | | | | |
| | | Share class | | Class inception date | | 1-yr | | 5-yr | | 10-yr | | Life (t) | | |
| | | A | | 3/17/92 | | (0.13)% | | 3.33% | | 3.15% | | N/A | | |
| | | B | | 9/07/93 | | (0.86)% | | 2.57% | | 2.39% | | N/A | | |
| | | C | | 7/01/94 | | (0.97)% | | 2.46% | | 2.28% | | N/A | | |
| | | I | | 8/30/10 | | 0.02% | | N/A | | N/A | | 2.30% | | |
| Comparative benchmarks | | | | | | | | | | |
| | | Barclays 3-Year Municipal Bond Index (f) | | 1.19% | | 2.43% | | 3.11% | | N/A | | |
| | | Barclays 5-Year Municipal Bond Index (f) | | 1.07% | | 3.93% | | 4.16% | | N/A | | |
| Average annual with sales charge | | | | | | | | | | |
| | | A
With initial Sales Charge (2.50%) | | (2.62)% | | 2.81% | | 2.89% | | N/A | | |
| | | B
With CDSC (Declining over six years from 4% to 0%) (v) | | (4.79)% | | 2.21% | | 2.39% | | N/A | | |
| | | C
With CDSC (1% for 12 months) (v) | | (1.95)% | | 2.46% | | 2.28% | | N/A | | |
CDSC – Contingent Deferred Sales Charge.
Class I shares do not have a sales charge.
| (f) | Source: FactSet Research Systems Inc. |
| (t) | For the period from the class inception date through the stated period end (for those share classes with less than 10 years of performance history). No comparative benchmark performance information is provided for “life” periods. (See Notes to Performance Summary.) |
| (v) | Assuming redemption at the end of the applicable period. |
Benchmark Definitions
Barclays 3-Year Municipal Bond Index – a market capitalization-weighted index that measures the performance of the medium-term (2 to 4 years) tax-exempt bond market.
Barclays 5-Year Municipal Bond Index – a market capitalization-weighted index that measures the performance of the medium-term (4 to 6 years) tax-exempt bond market.
It is not possible to invest directly in an index.
Notes to Performance Summary
Average annual total return represents the average annual change in value for each share class for the periods presented. Life returns are presented where the share class has less than 10 years of performance history and represent the average annual total return from the class inception date to the stated period end date. As the fund’s share classes may have different inception dates, the life returns may represent different time periods and may not be comparable. As a result, no comparative benchmark performance information is provided for life periods.
7
Performance Summary – continued
Performance results reflect any applicable expense subsidies and waivers in effect during the periods shown. Without such subsidies and waivers the fund’s performance results would be less favorable. Please see the prospectus and financial statements for complete details.
Performance results do not include adjustments made for financial reporting purposes in accordance with U.S. generally accepted accounting principles and may differ from amounts reported in the financial highlights.
From time to time the fund may receive proceeds from litigation settlements, without which performance would be lower.
A portion of income may be subject to state, federal, and/or alternative minimum tax. Capital gains, if any, are subject to a capital gains tax.
8
EXPENSE TABLE
Fund expenses borne by the shareholders during the period,
November 1, 2013 through April 30, 2014
As a shareholder of the fund, you incur two types of costs: (1) transaction costs, including sales charges (loads) on certain purchase or redemption payments, and (2) ongoing costs, including management fees; distribution and service (12b-1) fees; and other fund expenses. This example is intended to help you understand your ongoing costs (in dollars) of investing in the fund and to compare these costs with the ongoing costs of investing in other mutual funds.
The example is based on an investment of $1,000 invested at the beginning of the period and held for the entire period November 1, 2013 through April 30, 2014.
Actual Expenses
The first line for each share class in the following table provides information about actual account values and actual expenses. You may use the information in this line, together with the amount you invested, to estimate the expenses that you paid over the period. Simply divide your account value by $1,000 (for example, an $8,600 account value divided by $1,000 = 8.6), then multiply the result by the number in the first line under the heading entitled “Expenses Paid During Period” to estimate the expenses you paid on your account during this period.
Hypothetical Example for Comparison Purposes
The second line for each share class in the following table provides information about hypothetical account values and hypothetical expenses based on the fund’s actual expense ratio and an assumed rate of return of 5% per year before expenses, which is not the fund’s actual return. The hypothetical account values and expenses may not be used to estimate the actual ending account balance or expenses you paid for the period. You may use this information to compare the ongoing costs of investing in the fund and other funds. To do so, compare this 5% hypothetical example with the 5% hypothetical examples that appear in the shareholder reports of the other funds.
Please note that the expenses shown in the table are meant to highlight your ongoing costs only and do not reflect any transactional costs, such as sales charges (loads). Therefore, the second line for each share class in the table is useful in comparing ongoing costs only, and will not help you determine the relative total costs of owning different funds. In addition, if these transactional costs were included, your costs would have been higher.
9
Expense Table – continued
| | | | | | | | | | | | | | | | | | |
Share Class | | | | Annualized Expense Ratio | | | Beginning Account Value
11/01/13 | | | Ending Account Value
4/30/14 | | | Expenses Paid During
Period (p) 11/01/13-4/30/14 | |
| A | | Actual | | | 0.69% | | | | $1,000.00 | | | | $1,014.46 | | | | $3.45 | |
| | Hypothetical (h) | | | 0.69% | | | | $1,000.00 | | | | $1,021.37 | | | | $3.46 | |
| B | | Actual | | | 1.44% | | | | $1,000.00 | | | | $1,010.74 | | | | $7.18 | |
| | Hypothetical (h) | | | 1.44% | | | | $1,000.00 | | | | $1,017.65 | | | | $7.20 | |
| C | | Actual | | | 1.54% | | | | $1,000.00 | | | | $1,008.95 | | | | $7.67 | |
| | Hypothetical (h) | | | 1.54% | | | | $1,000.00 | | | | $1,017.16 | | | | $7.70 | |
| I | | Actual | | | 0.54% | | | | $1,000.00 | | | | $1,015.19 | | | | $2.70 | |
| | Hypothetical (h) | | | 0.54% | | | | $1,000.00 | | | | $1,022.12 | | | | $2.71 | |
| (h) | 5% class return per year before expenses. |
| (p) | “Expenses Paid During Period” are equal to each class’s annualized expense ratio, as shown above, multiplied by the average account value over the period, multiplied by 181/365 (to reflect the one-half year period). Expenses paid do not include any applicable sales charges (loads). If these transaction costs had been included, your costs would have been higher. |
10
PORTFOLIO OF INVESTMENTS
4/30/14
The Portfolio of Investments is a complete list of all securities owned by your fund. It is categorized by jurisdiction.
| | | | | | | | |
| Municipal Bonds - 98.1% | | | | | | | | |
| Issuer | | Shares/Par | | | Value ($) | |
| | | | | | | | |
| Alabama - 1.5% | | | | | | | | |
| Alabama 21st Century Authority, Tobacco Settlement Rev., “A”, 4%, 6/01/15 | | $ | 1,000,000 | | | $ | 1,038,564 | |
| Alabama 21st Century Authority, Tobacco Settlement Rev., “A”, 5%, 6/01/18 | | | 2,335,000 | | | | 2,682,565 | |
| Alabama Building Renovation Finance Authority Rev., 4%, 9/01/17 | | | 1,815,000 | | | | 1,973,813 | |
| Alabama Building Renovation Finance Authority Rev., 4%, 9/01/18 | | | 1,000,000 | | | | 1,095,000 | |
| Alabama Building Renovation Finance Authority Rev., 4%, 9/01/19 | | | 1,615,000 | | | | 1,780,699 | |
| Alabama Private Colleges (Tuskegee University), “N”, ASSD GTY, 5%, 9/01/15 | | | 430,000 | | | | 452,941 | |
| Alabama Public School & College Authority, “A”, 5%, 5/01/15 | | | 2,000,000 | | | | 2,095,400 | |
| Auburn University, General Fee Rev., “A”, 5%, 6/01/21 | | | 2,170,000 | | | | 2,576,832 | |
| Birmingham, AL, Special Care Facilities Financing Rev. (Baptist Health Systems, Inc.), “A”, 5%, 11/15/14 | | | 2,000,000 | | | | 2,043,600 | |
| Birmingham, AL, Waterworks Board Water Rev., 3%, 7/01/15 | | | 3,730,000 | | | | 3,840,371 | |
| Mobile, AL, Industrial Development Board, Pollution Control Rev. (Alabama Power Co.), 1.65%, 6/01/34 (b) | | | 1,000,000 | | | | 999,990 | |
| Pell City, AL, Special Care Facilities, Financing Authority Rev. (Noland Health Services, Inc.), 4%, 12/01/16 | | | 1,810,000 | | | | 1,944,664 | |
| | | | | | | | |
| | | | | | | $ | 22,524,439 | |
| Alaska - 0.3% | | | | | | | | |
| Valdez, AK, Marine Terminal Rev. (BP Pipelines Project), “B”, 5%, 1/01/21 | | $ | 4,000,000 | | | $ | 4,687,080 | |
| | |
| Arizona - 1.4% | | | | | | | | |
| Arizona Board of Regents (Arizona State University), “A”, 4%, 7/01/17 | | $ | 300,000 | | | $ | 329,655 | |
| Arizona Health Facilities Authority Rev. (Phoenix Children’s Hospital), “A-1”, FRN, 1.97%, 2/01/48 (b) | | | 3,000,000 | | | | 2,998,470 | |
| Chandler, AZ, 5%, 7/01/22 | | | 1,000,000 | | | | 1,145,260 | |
| Maricopa County, AZ, Pollution Control Corp., Pollution Control Rev. (Arizona Public Service Co.), “C”, 1.75%, 5/01/29 (b) | | | 5,000,000 | | | | 4,980,450 | |
| Navajo County, AZ, Pollution Control Corp. Rev. (Arizona Public Service Co.), “C”, 5.5%, 6/01/34 (b) | | | 1,000,000 | | | | 1,003,680 | |
| Phoenix, AZ, Civic Improvement Corp., Water System Rev., FGIC, 5.5%, 7/01/21 | | | 1,260,000 | | | | 1,557,360 | |
| Pima County, AZ, Industrial Development Authority Pollution Control Rev. (Tucson Electric Power Co.), “A”, 4.95%, 10/01/20 | | | 3,275,000 | | | | 3,630,469 | |
11
Portfolio of Investments – continued
| | | | | | | | |
| Issuer | | Shares/Par | | | Value ($) | |
| | | | | | | | |
| Municipal Bonds - continued | | | | | | | | |
| Arizona - continued | | | | | | | | |
| Yavapai County, AZ, Industrial Development Authority Rev. (Regional Medical Center), “A”, 5%, 8/01/16 | | $ | 400,000 | | | $ | 429,692 | |
| Yavapai County, AZ, Industrial Development Authority Rev. (Regional Medical Center), “A”, 5%, 8/01/17 | | | 375,000 | | | | 411,214 | |
| Yavapai County, AZ, Industrial Development Authority Rev. (Regional Medical Center), “A”, 5%, 8/01/18 | | | 525,000 | | | | 584,168 | |
| Yavapai County, AZ, Industrial Development Authority Rev. (Waste Management, Inc.), 2.125%, 6/01/27 (b) | | | 3,000,000 | | | | 3,051,120 | |
| Yavapai County, AZ, Industrial Development Authority Rev. (Waste Management, Inc.), “A-2”, 0.625%, 3/01/28 (b) | | | 1,250,000 | | | | 1,250,250 | |
| | | | | | | | |
| | | | | | | $ | 21,371,788 | |
| Arkansas - 0.6% | | | | | | | | |
| Arkansas Four-Lane Highway Construction & Improvement Rev., 5%, 6/15/21 | | $ | 5,000,000 | | | $ | 6,048,550 | |
| Independence County, AR, Pollution Control Rev. (Entergy Arkansas, Inc. Project), 2.375%, 1/01/21 | | | 3,250,000 | | | | 3,235,050 | |
| | | | | | | | |
| | | | | | | $ | 9,283,600 | |
| California - 10.0% | | | | | | | | |
| ABAG Finance Authority for Non-Profit Corps., CA, Rev. (Eskaton Properties, Inc.), 2%, 11/15/14 | | $ | 1,150,000 | | | $ | 1,154,336 | |
| California Department of Water Resources, Power Supply Rev., “L”, 5%, 5/01/18 | | | 3,510,000 | | | | 4,062,158 | |
| California Department of Water Resources, Power Supply Rev., “M”, 4%, 5/01/19 | | | 3,000,000 | | | | 3,400,920 | |
| California Economic Recovery, “B”, 5%, 7/01/23 (b) | | | 1,500,000 | | | | 1,511,355 | |
| California Educational Facilities Authority Rev. (Chapman University), 5%, 4/01/19 | | | 1,000,000 | | | | 1,153,650 | |
| California Educational Facilities Authority Rev. (Chapman University), 5%, 4/01/20 | | | 1,250,000 | | | | 1,455,613 | |
| California Educational Facilities Authority Rev. (Loyola Marymount), “B”, FRN, 0.92%, 10/01/15 | | | 1,640,000 | | | | 1,644,838 | |
| California Educational Facilities Authority Rev. (Pitzer College), 5%, 4/01/16 | | | 1,395,000 | | | | 1,512,501 | |
| California Educational Facilities Authority Rev. (University of San Francisco), 5%, 10/01/21 | | | 500,000 | | | | 579,255 | |
| California Health Facilities Financing Authority Rev. (Catholic Healthcare West), “I”, 4.95%, 7/01/26 (b) | | | 3,000,000 | | | | 3,022,320 | |
| California Health Facilities Financing Authority Rev. (Memorial Health Services), “A”, 4%, 10/01/16 | | | 570,000 | | | | 617,213 | |
| California Health Facilities Financing Authority Rev. (Memorial Health Services), “A”, 4%, 10/01/17 | | | 1,100,000 | | | | 1,207,107 | |
12
Portfolio of Investments – continued
| | | | | | | | |
| Issuer | | Shares/Par | | | Value ($) | |
| | | | | | | | |
| Municipal Bonds - continued | | | | | | | | |
| California - continued | | | | | | | | |
| California Health Facilities Financing Authority Rev. (St. Joseph Health System), “C”, 5%, 7/01/43 (b) | | $ | 2,750,000 | | | $ | 3,224,650 | |
| California Health Facilities Financing Authority Rev. (St. Joseph Health System), “D”, 5%, 7/01/43 (b) | | | 2,400,000 | | | | 2,833,296 | |
| California Housing Finance Agency Rev. (Home Mortgage), “G”, 4.95%, 8/01/23 | | | 9,900,000 | | | | 10,040,976 | |
| California Housing Finance Agency Rev. (Home Mortgage), “K”, 4.55%, 8/01/21 | | | 90,000 | | | | 93,853 | |
| California Infrastructure & Economic Development Bank Rev., “A”, ETM, 4%, 2/01/15 (c) | | | 1,260,000 | | | | 1,295,998 | |
| California Municipal Finance Authority Rev. (Biola University), 5%, 10/01/18 | | | 650,000 | | | | 721,676 | |
| California Pollution Control Financing Authority, Solid Waste Disposal Rev. (Republic Services, Inc.), “B”, 5.25%, 6/01/23 (b) | | | 135,000 | | | | 147,609 | |
| California Pollution Control Financing Authority, Solid Waste Disposal Rev. (Republic Services, Inc.), “C”, 5.25%, 6/01/23 (b) | | | 3,045,000 | | | | 3,329,403 | |
| California Pollution Control Financing Authority, Solid Waste Disposal Rev. (Waste Management, Inc.), “A”, FRN, 0.7%, 11/01/38 (b) | | | 5,000,000 | | | | 5,000,000 | |
| California Pollution Control Financing Authority, Solid Waste Disposal Rev. (Waste Management, Inc.), “A-1”, 1.875%, 4/01/25 (b) | | | 2,000,000 | | | | 2,022,620 | |
| California Public Works Board Lease Rev. (Various Capital Projects), “G”, 4%, 11/01/15 | | | 1,000,000 | | | | 1,055,080 | |
| California Public Works Board Lease Rev. (Various Capital Projects), “G”, 4%, 11/01/16 | | | 3,840,000 | | | | 4,162,061 | |
| California Public Works Board Lease Rev. (Various Capital Projects), “I”, 5%, 11/01/17 | | | 415,000 | | | | 471,930 | |
| California Public Works Board Lease Rev. (Various Capital Projects), “I”, 5%, 11/01/18 | | | 485,000 | | | | 561,164 | |
| California Public Works Board Lease Rev., Department of Corrections and Rehabilitation (State Prison - Lassen County, Susanville), “I”, 5%, 6/01/16 | | | 5,000,000 | | | | 5,465,450 | |
| California Public Works Board Lease Rev., Department of Public Health (Richmond Laboratory), “J”, 4%, 11/01/15 | | | 1,000,000 | | | | 1,053,080 | |
| California State University Rev., “A”, 5%, 11/01/22 | | | 5,000,000 | | | | 6,027,100 | |
| California Statewide Communities Development Authority Rev. (Kaiser Permanente), “C”, 5%, 11/01/29 (b) | | | 1,500,000 | | | | 1,689,495 | |
| California Statewide Communities Development Authority Student Housing (University of California-Irvine), 5%, 5/15/14 | | | 1,000,000 | | | | 1,001,330 | |
| Chula Vista, CA, Industrial Development Rev. (San Diego Gas & Electric Co.), “A”, 1.65%, 7/01/18 | | | 3,500,000 | | | | 3,508,435 | |
| Contra Costa, CA, Transportation Authority Sales Tax Rev., FRN, 0.472%, 3/01/34 (b) | | | 2,500,000 | | | | 2,502,075 | |
13
Portfolio of Investments – continued
| | | | | | | | |
| Issuer | | Shares/Par | | | Value ($) | |
| | | | | | | | |
| Municipal Bonds - continued | | | | | | | | |
| California - continued | | | | | | | | |
| Corona-Norco, CA, Unified School District, Public Financing Authority Special Tax Rev. (Riverside County), “A”, 2%, 9/01/14 | | $ | 280,000 | | | $ | 280,888 | |
| Corona-Norco, CA, Unified School District, Public Financing Authority Special Tax Rev. (Riverside County), “A”, 2%, 9/01/15 | | | 530,000 | | | | 536,100 | |
| Corona-Norco, CA, Unified School District, Public Financing Authority Special Tax Rev. (Riverside County), “A”, 3%, 9/01/16 | | | 605,000 | | | | 626,756 | |
| Corona-Norco, CA, Unified School District, Public Financing Authority Special Tax Rev. (Riverside County), “A”, 4%, 9/01/18 | | | 400,000 | | | | 431,580 | |
| East Bay, CA, Municipal Utility District, Wastewater System Rev., “A”, 0.4%, 6/01/38 (b) | | | 3,890,000 | | | | 3,887,744 | |
| Irvine, CA, Improvement Bond Act 1915, 3%, 9/02/14 | | | 500,000 | | | | 503,445 | |
| Long Beach, CA, Bond Finance Authority, Natural Gas Purchase Rev., “A”, 5.25%, 11/15/20 | | | 930,000 | | | | 1,038,605 | |
| Los Angeles County, CA, Public Works Financing Authority Lease Rev. (Multiple Capital Project II), 5%, 8/01/18 | | | 500,000 | | | | 575,155 | |
| Los Angeles County, CA, Redevelopment Refunding Authority Tax Allocation Rev. “D”, 5%, 9/01/22 | | | 1,865,000 | | | | 2,096,894 | |
| Los Angeles County, CA, Redevelopment Refunding Authority Tax Allocation Rev. “D”, 5%, 9/01/23 | | | 1,865,000 | | | | 2,095,272 | |
| Los Angeles County, CA, Sanitation Districts Financing Authority Rev. (Capital Projects), “A”, 5%, 10/01/20 | | | 5,000,000 | | | | 5,977,200 | |
| Los Angeles, CA, Community College District, “E”, AGM, 5%, 8/01/22 | | | 1,000,000 | | | | 1,096,760 | |
| Los Angeles, CA, Department of Water & Power Rev., “A”, 5%, 7/01/19 | | | 1,000,000 | | | | 1,183,910 | |
| Los Angeles, CA, Regional Airports Improvement Corp., Facilities Lease Rev. (LAXFUEL Corp.), 5%, 1/01/15 | | | 1,105,000 | | | | 1,139,133 | |
| Los Angeles, CA, Regional Airports Improvement Corp., Facilities Lease Rev. (LAXFUEL Corp.), 5%, 1/01/17 | | | 350,000 | | | | 381,290 | |
| Los Angeles, CA, Regional Airports Improvement Corp., Facilities Lease Rev. (LAXFUEL Corp.), ASSD GTY, 5%, 1/01/18 | | | 2,450,000 | | | | 2,500,005 | |
| Los Angeles, CA, Regional Airports Improvement Corp., Facilities Lease Rev. (LAXFUEL Corp.), 5%, 1/01/18 | | | 310,000 | | | | 341,698 | |
| Los Angeles, CA, Regional Airports Improvement Corp., Facilities Lease Rev. (LAXFUEL Corp.), ASSD GTY, 5%, 1/01/19 | | | 2,575,000 | | | | 2,622,947 | |
| Los Angeles, CA, Regional Airports Improvement Corp., Facilities Lease Rev. (LAXFUEL Corp.), ASSD GTY, 5%, 1/01/20 | | | 2,705,000 | | | | 2,752,689 | |
| Mt. San Antonio, CA, Community College District, Capital Appreciation, 0%, 5/01/15 | | | 3,170,000 | | | | 3,161,251 | |
| Sacramento, CA, City Financing Authority, Special Tax Rev. (Westlake and Regency Park), “A”, AGM, 3%, 9/01/17 | | | 1,140,000 | | | | 1,210,463 | |
| Sacramento, CA, City Financing Authority, Special Tax Rev. (Westlake and Regency Park), “A”, AGM, 4%, 9/01/18 | | | 1,210,000 | | | | 1,336,118 | |
14
Portfolio of Investments – continued
| | | | | | | | |
| Issuer | | Shares/Par | | | Value ($) | |
| | | | | | | | |
| Municipal Bonds - continued | | | | | | | | |
| California - continued | | | | | | | | |
| Sacramento, CA, City Financing Authority, Special Tax Rev. (Westlake and Regency Park), “A”, AGM, 4%, 9/01/19 | | $ | 1,300,000 | | | $ | 1,440,322 | |
| Sacramento, CA, Municipal Utility District, “X”, 5%, 8/15/20 | | | 1,750,000 | | | | 2,088,993 | |
| San Bernardino, CA, City Unified School District, “A”, 5%, 8/01/20 | | | 750,000 | | | | 879,893 | |
| San Bernardino, CA, City Unified School District, “A”, 5%, 8/01/21 | | | 1,200,000 | | | | 1,407,888 | |
| San Bernardino, CA, City Unified School District, “A”, 5%, 8/01/22 | | | 1,500,000 | | | | 1,756,890 | |
| San Bernardino, CA, City Unified School District, “A”, 5%, 8/01/23 | | | 1,100,000 | | | | 1,283,084 | |
| San Diego County, CA, Regional Airport Authority Rev., “B”, 5%, 7/01/20 | | | 500,000 | | | | 580,170 | |
| San Francisco, CA, Bay Area Rapid Transit District, Sales Tax Rev., “A”, 3%, 7/01/15 | | | 400,000 | | | | 412,968 | |
| San Francisco, CA, Bay Area Toll Authority, Bridge Rev., “C”, 1.45%, 4/01/45 (b) | | | 2,500,000 | | | | 2,510,725 | |
| San Francisco, CA, City & County Airports Commission, International Airport Rev., “D”, 5%, 5/01/25 | | | 1,000,000 | | | | 1,131,980 | |
| San Francisco, CA, Redevelopment Successor Agency Tax Allocation (Mission Bay South Redevelopment), 5%, 8/01/17 | | | 300,000 | | | | 334,884 | |
| San Francisco, CA, Redevelopment Successor Agency Tax Allocation (Mission Bay South Redevelopment) , 4%, 8/01/15 | | | 420,000 | | | | 437,329 | |
| Santa Cruz County, CA, Redevelopment Successor Agency Tax Allocation , 4%, 9/01/16 | | | 820,000 | | | | 879,261 | |
| Santa Cruz County, CA, Redevelopment Successor Agency Tax Allocation , 5%, 9/01/17 | | | 575,000 | | | | 643,747 | |
| Santa Cruz County, CA, Redevelopment Successor Agency Tax Allocation , 5%, 9/01/18 | | | 600,000 | | | | 680,820 | |
| Santa Cruz County, CA, Redevelopment Successor Agency Tax Allocation , 5%, 9/01/19 | | | 625,000 | | | | 714,788 | |
| Santa Cruz County, CA, Redevelopment Successor Agency Tax Allocation , 5%, 9/01/20 | | | 985,000 | | | | 1,130,632 | |
| Santa Cruz County, CA, Redevelopment Successor Agency Tax Allocation , 5%, 9/01/21 | | | 1,350,000 | | | | 1,548,234 | |
| Southern California Metropolitan Water District Rev., “E-3”, 3.5%, 7/01/37 (b) | | | 4,000,000 | | | | 4,269,440 | |
| State of California, 5%, 4/01/17 | | | 7,000,000 | | | | 7,864,220 | |
| University of California, “AK”, 5%, 5/15/48 (b) | | | 5,000,000 | | | | 6,045,000 | |
| | | | | | | | |
| | | | | | | $ | 151,345,718 | |
| Colorado - 0.9% | | | | | | | | |
| Colorado Educational & Cultural Facilities Authority Rev. (Liberty Common Charter School), 3%, 1/15/15 | | $ | 215,000 | | | $ | 218,208 | |
| Colorado Educational & Cultural Facilities Authority Rev. (Liberty Common Charter School), 3%, 1/15/18 | | | 100,000 | | | | 104,855 | |
| Colorado Educational & Cultural Facilities Authority Rev. (Liberty Common Charter School), 4%, 1/15/19 | | | 155,000 | | | | 168,821 | |
15
Portfolio of Investments – continued
| | | | | | | | |
| Issuer | | Shares/Par | | | Value ($) | |
| | | | | | | | |
| Municipal Bonds - continued | | | | | | | | |
| Colorado - continued | | | | | | | | |
| Colorado Educational & Cultural Facilities Authority Rev. (Montessori Charter School Project), 2.25%, 7/15/17 | | $ | 175,000 | | | $ | 172,814 | |
| Colorado Educational & Cultural Facilities Authority Rev. (Montessori Charter School Project), 3.25%, 7/15/22 | | | 1,460,000 | | | | 1,396,899 | |
| Colorado Educational & Cultural Facilities Authority Rev. (Pinnacle Charter School, Inc. K-8 Facility Project), 4%, 6/01/18 | | | 300,000 | | | | 315,531 | |
| Colorado Educational & Cultural Facilities Authority Rev. (Pinnacle Charter School, Inc. K-8 Facility Project), 4%, 6/01/20 | | | 310,000 | | | | 325,330 | |
| Colorado Educational & Cultural Facilities Authority Rev. (Pinnacle Charter School, Inc. K-8 Facility Project), 4%, 6/01/22 | | | 545,000 | | | | 571,046 | |
| Colorado Health Facilities Authority Rev. (Evangelical Lutheran Good Samaritan Society), “B”, 5%, 6/01/39 (b) | | | 1,000,000 | | | | 1,022,060 | |
| Colorado Health Facilities Authority Rev. (National Jewish Health Project), 4%, 1/01/15 | | | 500,000 | | | | 507,195 | |
| Colorado Housing & Finance Authority Rev. (Colorado Employment Compensation), “A”, 5%, 5/15/14 | | | 4,000,000 | | | | 4,007,440 | |
| Denver, CO, City & County Airport Systems Rev., “A”, 5%, 11/15/16 | | | 1,000,000 | | | | 1,104,090 | |
| Denver, CO, City & County Airport Systems Rev., “A”, 4%, 11/15/17 | | | 1,250,000 | | | | 1,362,838 | |
| Denver, CO, City & County Airport Systems Rev., “B”, 5%, 11/15/18 | | | 300,000 | | | | 345,939 | |
| Denver, CO, City & County Airport Systems Rev., “B”, 5%, 11/15/19 | | | 445,000 | | | | 517,571 | |
| Denver, CO, City & County Excise Tax Rev., “A”, ASSD GTY, 6%, 9/01/21 | | | 1,500,000 | | | | 1,818,330 | |
| | | | | | | | |
| | | | | | | $ | 13,958,967 | |
| Connecticut - 0.1% | | | | | | | | |
| Connecticut Development Authority, Pollution Control Rev. (Connecticut Light & Power Co.), “A”, 1.55%, 5/01/31 (b) | | $ | 2,000,000 | | | $ | 2,017,500 | |
| | |
| Florida - 4.7% | | | | | | | | |
| Broward County, FL, Airport System Rev., “Q-1”, 3%, 10/01/15 | | $ | 550,000 | | | $ | 571,049 | |
| Broward County, FL, Airport System Rev., “Q-1”, 5%, 10/01/15 | | | 1,000,000 | | | | 1,066,310 | |
| Broward County, FL, Airport System Rev., “Q-1”, 4%, 10/01/16 | | | 150,000 | | | | 162,050 | |
| Broward County, FL, Airport System Rev., “Q-1”, 5%, 10/01/16 | | | 850,000 | | | | 939,616 | |
| Broward County, FL, Airport System Rev., “Q-1”, 4%, 10/01/17 | | | 250,000 | | | | 275,403 | |
| Broward County, FL, Airport System Rev., “Q-1”, 5%, 10/01/17 | | | 700,000 | | | | 795,788 | |
| Citizens Property Insurance Corp., FL, “A-1”, 5%, 6/01/15 | | | 5,000,000 | | | | 5,249,700 | |
| Escambia County, FL, Solid Waste Disposal Rev. (Gulf Power Co.), 1.35%, 4/01/39 (b) | | | 2,500,000 | | | | 2,507,725 | |
| Florida Citizens Property Insurance Corp., “A-1”, 5%, 6/01/19 | | | 4,000,000 | | | | 4,619,880 | |
| Florida Citizens Property Insurance Corp., “A-1”, 5%, 6/01/20 | | | 1,435,000 | | | | 1,671,058 | |
16
Portfolio of Investments – continued
| | | | | | | | |
| Issuer | | Shares/Par | | | Value ($) | |
| | | | | | | | |
| Municipal Bonds - continued | | | | | | | | |
| Florida - continued | | | | | | | | |
| Florida Department Management Services Rev. “A”, AGM, 5.25%, 9/01/15 | | $ | 1,875,000 | | | $ | 1,984,238 | |
| Florida Higher Educational Facilities, Financial Authority Rev. (University of Tampa Project), “A”, 5%, 4/01/21 | | | 1,300,000 | | | | 1,446,471 | |
| Florida Higher Educational Facilities, Financial Authority Rev. (University of Tampa Project), “A”, 5%, 4/01/22 | | | 600,000 | | | | 668,682 | |
| Florida Mid Bay Bridge Authority Rev., Capital Appreciation, “A”, 0%, 10/01/19 | | | 275,000 | | | | 218,647 | |
| Florida Mid Bay Bridge Authority Rev., Capital Appreciation, “A”, 0%, 10/01/23 | | | 215,000 | | | | 132,698 | |
| Florida Mid Bay Bridge Authority Rev., Capital Appreciation, “A”, 0%, 10/01/24 | | | 150,000 | | | | 87,198 | |
| Florida Municipal Power Agency Rev. (St. Lucie Project), “A”, 5%, 10/01/19 | | | 2,365,000 | | | | 2,773,081 | |
| Florida Municipal Power Agency Rev. (St. Lucie Project), “A”, 5%, 10/01/20 | | | 1,330,000 | | | | 1,550,474 | |
| Florida State Board of Education, Lottery Rev., “A” , 5%, 7/01/18 | | | 14,780,000 | | | | 17,101,938 | |
| Miami Beach, FL, Health Facilities Authority Rev. (Mount Sinai Medical Center), 6.75%, 11/15/21 | | | 5,165,000 | | | | 5,313,649 | |
| Miami-Dade County, FL, Aviation Rev., “A”, 5%, 10/01/18 | | | 2,000,000 | | | | 2,278,060 | |
| Miami-Dade County, FL, Aviation Rev., “A”, 5%, 10/01/19 | | | 1,875,000 | | | | 2,129,888 | |
| Miami-Dade County, FL, Aviation Rev., “A”, 5%, 10/01/20 | | | 1,750,000 | | | | 1,987,475 | |
| Miami-Dade County, FL, Transit Sales Surtax Rev., AGM, 5%, 7/01/17 | | | 1,500,000 | | | | 1,694,400 | |
| Miami-Dade County, FL, Water & Sewer Rev., 4%, 10/01/14 | | | 1,000,000 | | | | 1,015,600 | |
| Palm Beach County, FL, Health Facilities Authority Hospital Rev. (Jupiter Medical Center, Inc., Project), “A”, 4%, 11/01/15 | | | 1,135,000 | | | | 1,174,237 | |
| Palm Beach County, FL, Health Facilities Authority Hospital Rev. (Jupiter Medical Center, Inc., Project), “A”, 4%, 11/01/16 | | | 1,030,000 | | | | 1,084,137 | |
| Pinellas County, FL, Educational Facilities Authority Rev. (Barry University), 4%, 10/01/15 | | | 400,000 | | | | 415,504 | |
| Pinellas County, FL, Educational Facilities Authority Rev. (Barry University), 4%, 10/01/16 | | | 390,000 | | | | 412,472 | |
| Pinellas County, FL, Educational Facilities Authority Rev. (Barry University), 4%, 10/01/17 | | | 870,000 | | | | 926,994 | |
| South Miami, FL, Health Facilities Baptist Authority Hospital Rev. (Baptist Health South Florida Group), 5%, 8/15/21 | | | 290,000 | | | | 324,713 | |
| St. Johns County, FL, Water & Sewer Rev., Capital Appreciation, “B”, 0%, 6/01/22 | | | 1,755,000 | | | | 1,381,115 | |
| St. Johns County, FL, Water & Sewer Rev., Capital Appreciation, “B”, 0%, 6/01/23 | | | 2,655,000 | | | | 1,992,365 | |
| Sumter County, FL, Industrial Development Authority Hospital Rev. (Central Florida Health Alliance Projects), “A”, 4%, 7/01/16 | | | 265,000 | | | | 279,750 | |
17
Portfolio of Investments – continued
| | | | | | | | |
| Issuer | | Shares/Par | | | Value ($) | |
| | | | | | | | |
| Municipal Bonds - continued | | | | | | | | |
| Florida - continued | | | | | | | | |
| Sumter County, FL, Industrial Development Authority Hospital Rev. (Central Florida Health Alliance Projects), “A”, 5%, 7/01/19 | | $ | 500,000 | | | $ | 561,125 | |
| Sumter County, FL, Industrial Development Authority Hospital Rev. (Central Florida Health Alliance Projects), “A”, 5%, 7/01/18 | | | 200,000 | | | | 223,044 | |
| Tampa, FL, Solid Waste System Rev., “A”, 5%, 10/01/20 | | | 3,000,000 | | | | 3,414,660 | |
| | | | | | | | |
| | | | | | | $ | 70,431,194 | |
| Georgia - 2.7% | | | | | | | | |
| Atlanta, GA, Airport Passenger Facility Charge Rev., “B”, 5%, 1/01/18 | | $ | 2,000,000 | | | $ | 2,273,300 | |
| Atlanta, GA, Airport Rev., “A”, AGM, 5.375%, 1/01/15 | | | 1,000,000 | | | | 1,007,800 | |
| Atlanta, GA, Airport Rev., “B”, 5%, 1/01/18 | | | 700,000 | | | | 797,006 | |
| Atlanta, GA, Airport Rev., “B”, 5%, 1/01/20 | | | 400,000 | | | | 466,884 | |
| Atlanta, GA, Water & Wastewater Rev., “A”, FGIC, 5.5%, 11/01/14 | | | 1,185,000 | | | | 1,215,917 | |
| Burke County, GA, Development Authority Pollution Control Rev. (Georgia Power Company Plant Vogtle), 5th Series, 1.8%, 10/01/32 (b) | | | 2,500,000 | | | | 2,504,700 | |
| DeKalb County, GA, Water & Sewer Rev., “A”, 5%, 10/01/21 | | | 1,000,000 | | | | 1,188,110 | |
| Fulton County, GA, “A”, 3%, 7/01/17 | | | 2,515,000 | | | | 2,672,464 | |
| Fulton County, GA, Development Authority Rev. (Georgia Tech Athletic Association), “A”, 5%, 10/01/19 | | | 5,000,000 | | | | 5,803,750 | |
| Fulton County, GA, Water & Sewer Rev., 5%, 1/01/21 | | | 5,030,000 | | | | 6,007,379 | |
| Georgia Main Street Natural Gas, Inc., Gas Project Rev., “A”, 5%, 3/15/15 | | | 190,000 | | | | 195,301 | |
| Georgia Main Street Natural Gas, Inc., Gas Project Rev., “A”, 5%, 3/15/16 | | | 1,340,000 | | | | 1,413,043 | |
| Georgia Main Street Natural Gas, Inc., Gas Project Rev., “A”, 5.125%, 9/15/16 | | | 1,045,000 | | | | 1,124,441 | |
| Georgia Main Street Natural Gas, Inc., Gas Project Rev., “A”, 5%, 3/15/22 | | | 8,135,000 | | | | 9,260,477 | |
| Georgia Municipal Electric Authority Power Rev., “GG”, 5%, 1/01/20 | | | 500,000 | | | | 583,315 | |
| Georgia Municipal Gas Authority Rev. (Gas Portfolio III Project), “Q”, 5%, 10/01/21 | | | 1,750,000 | | | | 2,031,225 | |
| Gwinnett County, GA, School District, 5%, 2/01/21 | | | 790,000 | | | | 949,738 | |
| Henry County, GA, 5%, 7/01/14 | | | 1,080,000 | | | | 1,088,726 | |
| | | | | | | | |
| | | | | | | $ | 40,583,576 | |
| Guam - 0.3% | | | | | | | | |
| Guam Government Business Privilege Tax Rev., “C”, 5%, 11/15/16 | | $ | 955,000 | | | $ | 1,045,840 | |
| Guam Government Business Privilege Tax Rev., “C”, 5%, 11/15/17 | | | 1,080,000 | | | | 1,205,453 | |
| Guam International Airport Authority Rev., “C”, 4%, 10/01/15 | | | 500,000 | | | | 512,100 | |
| Guam International Airport Authority Rev., “C”, 5%, 10/01/16 | | | 255,000 | | | | 268,808 | |
18
Portfolio of Investments – continued
| | | | | | | | |
| Issuer | | Shares/Par | | | Value ($) | |
| | | | | | | | |
| Municipal Bonds - continued | | | | | | | | |
| Guam - continued | | | | | | | | |
| Guam International Airport Authority Rev., “C”, 5%, 10/01/17 | | $ | 420,000 | | | $ | 445,309 | |
| Guam Power Authority Rev., “A”, AGM, 5%, 10/01/21 | | | 1,500,000 | | | | 1,750,950 | |
| | | | | | | | |
| | | | | | | $ | 5,228,460 | |
| Hawaii - 0.7% | | | | | | | | |
| State of Hawaii, “EE”, 5%, 11/01/20 | | $ | 9,000,000 | | | $ | 10,762,380 | |
| | |
| Illinois - 7.7% | | | | | | | | |
| Chicago, IL, Midway Airport Rev., Second Lien, “B”, 5%, 1/01/19 | | $ | 5,375,000 | | | $ | 5,526,951 | |
| Chicago, IL, Midway Airport Rev., Second Lien, “B”, 5%, 1/01/20 | | | 5,640,000 | | | | 5,803,616 | |
| Chicago, IL, O’Hare International Airport Rev., “B”, 4%, 1/01/15 | | | 11,850,000 | | | | 12,133,689 | |
| Chicago, IL, O’Hare International Airport Rev., “B”, 4%, 1/01/16 | | | 7,460,000 | | | | 7,877,163 | |
| Chicago, IL, Transit Authority Capital Grant Receipts Rev., AMBAC, 5%, 6/01/14 | | | 2,000,000 | | | | 2,007,560 | |
| Illinois Educational Facilities Authority Rev. (The Art Institute of Chicago), “A”, 4.3%, 3/01/30 (b) | | | 500,000 | | | | 524,240 | |
| Illinois Educational Facilities Authority Rev. (University of Chicago), “B-1”, FRN, 1.1%, 7/01/36 (b) | | | 2,000,000 | | | | 1,986,000 | |
| Illinois Finance Authority Gas Supply Rev. (Peoples Gas Light & Coke Co.), 2.125%, 3/01/30 (b) | | | 1,900,000 | | | | 1,904,636 | |
| Illinois Finance Authority Rev. (Central DuPage Health), 5%, 11/01/14 | | | 1,820,000 | | | | 1,857,492 | |
| Illinois Finance Authority Rev. (Depaul University), “B”, 5%, 10/01/20 | | | 3,335,000 | | | | 3,874,870 | |
| Illinois Finance Authority Rev. (Franciscan Communities, Inc.), “A”, 2.15%, 5/15/14 | | | 275,000 | | | | 274,970 | |
| Illinois Finance Authority Rev. (Franciscan Communities, Inc.), “A”, 2.4%, 5/15/15 | | | 300,000 | | | | 301,884 | |
| Illinois Finance Authority Rev. (Franciscan Communities, Inc.), “A”, 2.7%, 5/15/16 | | | 375,000 | | | | 378,848 | |
| Illinois Finance Authority Rev. (Franciscan Communities, Inc.), “A”, 2.95%, 5/15/17 | | | 940,000 | | | | 950,613 | |
| Illinois Finance Authority Rev. (Franciscan Communities, Inc.), “A”, 3.2%, 5/15/18 | | | 1,405,000 | | | | 1,418,235 | |
| Illinois Finance Authority Rev. (Franciscan Communities, Inc.), “A”, 4%, 5/15/23 | | | 1,000,000 | | | | 969,000 | |
| Illinois Finance Authority Rev. (IIlinois Institute of Technology), “A”, 5%, 4/01/16 | | | 1,000,000 | | | | 1,042,790 | |
| Illinois Finance Authority Rev. (Illinois Institute of Technology), “A”, 5%, 4/01/17 | | | 2,000,000 | | | | 2,092,060 | |
| Illinois Finance Authority Rev. (OSF Healthcare System), “A”, 4%, 5/15/14 | | | 600,000 | | | | 600,744 | |
| Illinois Finance Authority Rev. (OSF Healthcare System), “A”, 5%, 11/15/14 (c) | | | 500,000 | | | | 512,790 | |
19
Portfolio of Investments – continued
| | | | | | | | |
| Issuer | | Shares/Par | | | Value ($) | |
| | | | | | | | |
| Municipal Bonds - continued | | | | | | | | |
| Illinois - continued | | | | | | | | |
| Illinois Finance Authority Rev. (OSF Healthcare System), “A”, ETM, 5%, 11/15/14 (c) | | $ | 500,000 | | | $ | 512,790 | |
| Illinois Finance Authority Rev. (Resurrection Health), 5.25%, 5/15/15 | | | 2,195,000 | | | | 2,271,540 | |
| Illinois Finance Authority Rev. (Resurrection Health), ASSD GTY, 5%, 5/15/24 | | | 5,000,000 | | | | 5,298,700 | |
| Illinois Finance Authority Rev. (Roosevelt University Project), 5%, 4/01/15 | | | 1,000,000 | | | | 1,022,680 | |
| Illinois Finance Authority Rev. (Roosevelt University Project), 5.25%, 4/01/19 | | | 570,000 | | | | 612,989 | |
| Illinois Finance Authority Rev. (Silver Cross Hospital & Medical Centers), 6.75%, 8/15/21 | | | 1,460,000 | | | | 1,685,993 | |
| Illinois Finance Authority Rev. (The Art Institute of Chicago), “A”, 5%, 3/01/15 | | | 900,000 | | | | 934,020 | |
| Illinois Finance Authority Rev. (University of Chicago), “B”, 5%, 7/01/17 | | | 1,000,000 | | | | 1,127,600 | |
| Illinois Finance Authority Rev., Clean Water Initiative Revolving Fund, 5%, 1/01/17 | | | 2,165,000 | | | | 2,403,431 | |
| Illinois Finance Authority Rev., Clean Water Initiative Revolving Fund, 5%, 1/01/18 | | | 1,200,000 | | | | 1,363,980 | |
| Illinois Finance Authority Rev., Clean Water Initiative Revolving Fund, 5%, 1/01/19 | | | 1,000,000 | | | | 1,154,850 | |
| Illinois Railsplitter Tobacco Settlement Authority, 6.25%, 6/01/24 | | | 7,190,000 | | | | 7,940,205 | |
| Illinois Sales Tax Rev., “B”, 3%, 6/15/14 | | | 5,000,000 | | | | 5,017,150 | |
| Illinois Toll Highway Authority Rev., “B”, 5%, 12/01/18 | | | 6,000,000 | | | | 6,962,040 | |
| Kane, Cook & DuPage Counties, IL, School District Rev., Capital Appreciation, 0%, 1/01/21 | | | 7,445,000 | | | | 6,102,518 | |
| Metropolitan Pier & Exposition Authority, Dedicated State Tax Rev. Capital Appreciation, NATL, 0%, 6/15/18 | | | 7,090,000 | | | | 6,522,375 | |
| Quad Cities, IL, Regional Economic Development Authority Rev. (Augustana College), 3%, 10/01/15 | | | 410,000 | | | | 413,600 | |
| Quad Cities, IL, Regional Economic Development Authority Rev. (Augustana College), 3%, 10/01/16 | | | 400,000 | | | | 403,328 | |
| Quad Cities, IL, Regional Economic Development Authority Rev. (Augustana College), 3%, 10/01/18 | | | 620,000 | | | | 615,939 | |
| Quad Cities, IL, Regional Economic Development Authority Rev. (Augustana College), 4%, 10/01/20 | | | 500,000 | | | | 506,760 | |
| State of Illinois, AGM, 5%, 1/01/15 | | | 2,000,000 | | | | 2,061,240 | |
| State of Illinois, AGM, 5%, 1/01/16 | | | 2,750,000 | | | | 2,944,755 | |
| State of Illinois, 5%, 7/01/21 | | | 1,500,000 | | | | 1,719,915 | |
| State of Illinois, 5%, 7/01/22 | | | 1,250,000 | | | | 1,431,575 | |
| State of Illinois, 5%, 7/01/23 | | | 1,300,000 | | | | 1,482,169 | |
| Will County, IL, Forest Preservation District, 5%, 12/15/19 | | | 1,250,000 | | | | 1,459,638 | |
| | | | | | | | |
| | | | | | | $ | 116,009,931 | |
20
Portfolio of Investments – continued
| | | | | | | | |
| Issuer | | Shares/Par | | | Value ($) | |
| | | | | | | | |
| Municipal Bonds - continued | | | | | | | | |
| Indiana - 2.2% | | | | | | | | |
| Hamilton Heights School Building Corp., First Mortgage, “N”, AGM, 5%, 7/15/14 | | $ | 940,000 | | | $ | 949,419 | |
| Indiana Bond Bank Special Program, Gas Rev., “A”, 5.25%, 10/15/16 | | | 270,000 | | | | 290,828 | |
| Indiana Bond Bank Special Program, Gas Rev., “A”, 5%, 10/15/17 | | | 1,350,000 | | | | 1,488,875 | |
| Indiana Bond Bank Special Program, Gas Rev., “A”, 5.25%, 10/15/18 | | | 355,000 | | | | 403,663 | |
| Indiana Bond Bank Special Program, Gas Rev., “A”, 5.25%, 10/15/21 | | | 1,000,000 | | | | 1,169,450 | |
| Indiana Economic Development Finance Authority Rev. (Republic Services, Inc. Project), “A”, FRN, 0.47%, 5/01/34 (b) | | | 2,455,000 | | | | 2,455,025 | |
| Indiana Economic Development Finance Authority Rev. (Republic Services, Inc. Project), “B”, FRN, 0.32%, 5/01/28 (b) | | | 1,530,000 | | | | 1,530,000 | |
| Indiana Finance Authority Environmental Facilities Rev. (Indianapolis Power & Light Co.), “B”, 4.9%, 1/01/16 | | | 1,000,000 | | | | 1,057,400 | |
| Indiana Finance Authority Rev. (Butler University), “A”, 5%, 2/01/22 | | | 1,000,000 | | | | 1,134,210 | |
| Indiana Finance Authority Rev. (Ohio River Bridges East End Crossing Project), “B”, 5%, 1/01/19 | | | 6,195,000 | | | | 6,688,184 | |
| Indiana Finance Authority Rev., “A”, 5%, 2/01/17 | | | 3,700,000 | | | | 4,132,974 | |
| Indiana Health Facility Financing Authority Rev. (Ascension Health), “A-5”, 2%, 11/01/27 (b) | | | 1,580,000 | | | | 1,618,505 | |
| Indiana University Rev., “A”, 5%, 6/01/20 | | | 1,000,000 | | | | 1,190,250 | |
| Knox County, IN, Economic Development Rev. (Good Samaritan Hospital), “A”, 4%, 4/01/18 | | | 515,000 | | | | 549,304 | |
| Knox County, IN, Economic Development Rev. (Good Samaritan Hospital), “A”, 3%, 4/01/19 | | | 525,000 | | | | 532,182 | |
| Knox County, IN, Economic Development Rev. (Good Samaritan Hospital), “A”, 5%, 4/01/20 | | | 1,690,000 | | | | 1,875,494 | |
| State of Indiana Finance Authority, Environmental Rev. (Duke Energy Indiana, Inc.), “A-2”, 3.375%, 3/01/19 | | | 3,000,000 | | | | 3,187,260 | |
| University of Southern Indiana Rev., “J”, ASSD GTY, 4%, 10/01/16 | | | 1,000,000 | | | | 1,062,020 | |
| Valparaiso, IN, Exempt Facilities Rev. (Pratt Paper LLC Project), 5.875%, 1/01/24 | | | 1,500,000 | | | | 1,608,945 | |
| | | | | | | | |
| | | | | | | $ | 32,923,988 | |
| Iowa - 0.7% | | | | | | | | |
| Iowa Finance Authority Midwestern Disaster Area Rev. (Iowa Fertilizer Co.), 5%, 12/01/19 | | $ | 1,630,000 | | | $ | 1,657,661 | |
| Iowa Finance Authority Pollution Control Facilities Rev. (Interstate Power & Light), FGIC, 5%, 7/01/14 | | | 1,000,000 | | | | 1,007,500 | |
| Iowa Finance Authority, Health Care Facilities Rev. (Genesis Health System), 5%, 7/01/17 | | | 3,000,000 | | | | 3,313,560 | |
| Iowa Student Loan Liquidity Corp. Rev., “A-1”, 4.875%, 12/01/20 | | | 4,130,000 | | | | 4,310,233 | |
| | | | | | | | |
| | | | | | | $ | 10,288,954 | |
21
Portfolio of Investments – continued
| | | | | | | | |
| Issuer | | Shares/Par | | | Value ($) | |
| | | | | | | | |
| Municipal Bonds - continued | | | | | | | | |
| Kansas - 0.5% | | | | | | | | |
| Johnson County, KS, Unified School District, General Obligation, “A”, 4%, 10/01/16 | | $ | 3,650,000 | | | $ | 3,955,980 | |
| Wyandotte County/Kansas City, KS, Unified Government Special Obligation Rev., Capital Appreciation, “B”, 0%, 6/01/21 | | | 5,000,000 | | | | 3,454,650 | |
| | | | | | | | |
| | | | | | | $ | 7,410,630 | |
| Kentucky - 1.5% | | | | | | | | |
| Kentucky Economic Development Finance Authority Rev. (Baptist Healthcare System), “A”, 5%, 8/15/18 | | $ | 1,000,000 | | | $ | 1,133,810 | |
| Kentucky Economic Development Finance Authority, Hospital Facilities Rev. (Owensboro Medical Health System), “A”, 5%, 6/01/16 | | | 2,000,000 | | | | 2,127,900 | |
| Kentucky Property & Buildings Commission Rev. (Project Number 100), “A”, 5%, 8/01/20 | | | 5,000,000 | | | | 5,894,800 | |
| Kentucky Public Transportation Infrastructure Authority Rev. (Downtown Crossing Project), Subordinate Toll Rev., “A”, 5%, 7/01/17 | | | 4,465,000 | | | | 4,965,259 | |
| Kentucky Turnpike Authority, Economic Development Rev., “A”, 5%, 7/01/16 | | | 4,000,000 | | | | 4,384,520 | |
| Louisville & Jefferson County, KY, Metropolitan Government Pollution Control Rev. (Louisville Gas & Electric Co.), “A”, 1.15%, 6/01/33 (b) | | | 2,000,000 | | | | 1,989,800 | |
| Louisville & Jefferson County, KY, Metropolitan Government Pollution Control Rev. (Louisville Gas & Electric Co.), “A”, 1.65%, 10/01/33 (b) | | | 2,700,000 | | | | 2,724,597 | |
| | | | | | | | |
| | | | | | | $ | 23,220,686 | |
| Louisiana - 1.3% | | | | | | | | |
| De Soto Parish, LA, Pollution Control Rev. (Southwestern Electric Power Co.), 3.25%, 1/01/19 (b) | | $ | 2,500,000 | | | $ | 2,518,650 | |
| Louisiana Gas & Fuels Tax Rev., “A-1”, 5%, 5/01/18 | | | 2,525,000 | | | | 2,909,356 | |
| Louisiana Public Facilities Authority Rev. (Entergy Gulf States Louisiana LLC), “B”, 2.875%, 11/01/15 | | | 2,000,000 | | | | 2,039,140 | |
| Louisiana Stadium & Exposition District Rev., “A”, 5%, 7/01/20 | | | 335,000 | | | | 386,007 | |
| Louisiana Stadium & Exposition District Rev., “A”, 5%, 7/01/21 | | | 420,000 | | | | 486,007 | |
| Louisiana Stadium & Exposition District Rev., “A”, 5%, 7/01/22 | | | 250,000 | | | | 289,450 | |
| Louisiana Tobacco Settlement Authority Rev., “2013-A”, 5%, 5/15/23 | | | 2,160,000 | | | | 2,442,852 | |
| New Orleans, LA, 5%, 12/01/19 | | | 4,000,000 | | | | 4,477,320 | |
| St. Charles Parish, LA, Gulf Zone Opportunity Zone Rev. (Valero Energy Corp.), 4%, 12/01/40 (b) | | | 4,335,000 | | | | 4,567,269 | |
| | | | | | | | |
| | | | | | | $ | 20,116,051 | |
22
Portfolio of Investments – continued
| | | | | | | | |
| Issuer | | Shares/Par | | | Value ($) | |
| | | | | | | | |
| Municipal Bonds - continued | | | | | | | | |
| Maine - 0.1% | | | | | | | | |
| Portland, ME, General Airport Rev., 4%, 7/01/18 | | $ | 440,000 | | | $ | 468,754 | |
| Portland, ME, General Airport Rev., 4%, 7/01/20 | | | 200,000 | | | | 212,430 | |
| Portland, ME, General Airport Rev., 5%, 7/01/22 | | | 300,000 | | | | 335,283 | |
| | | | | | | | |
| | | | | | | $ | 1,016,467 | |
| Maryland - 2.3% | | | | | | | | |
| Maryland Department of Housing & Community Development, “A”, 3.875%, 9/01/16 | | $ | 1,575,000 | | | $ | 1,678,289 | |
| Maryland Economic Development Corp., Pollution Control Rev. (Potomac Electric Power Co.), 6.2%, 9/01/22 | | | 1,045,000 | | | | 1,226,851 | |
| State of Maryland, “B”, 5%, 3/15/17 | | | 10,000,000 | | | | 11,249,300 | |
| State of Maryland, “B”, 4.5%, 8/01/17 | | | 10,000,000 | | | | 11,221,600 | |
| State of Maryland, “C”, 4%, 11/01/15 | | | 1,000,000 | | | | 1,056,160 | |
| University System of Maryland, Auxiliary Facility & Tuition Rev., “D”, 5%, 10/01/22 | | | 1,000,000 | | | | 1,208,670 | |
| Washington Suburban Sanitary District, MD, Consolidated Public Improvement, 5%, 6/01/21 | | | 5,500,000 | | | | 6,619,195 | |
| | | | | | | | |
| | | | | | | $ | 34,260,065 | |
| Massachusetts - 5.7% | | | | | | | | |
| Boston, MA, Housing Authority Capital Program Rev., AGM, 5%, 4/01/15 | | $ | 1,750,000 | | | $ | 1,826,283 | |
| Boston, MA, Housing Authority Capital Program Rev., AGM, 5%, 4/01/17 | | | 1,770,000 | | | | 1,950,257 | |
| Commonwealth of Massachusetts Consolidated Loan, “A”, 5%, 3/01/15 (c) | | | 2,500,000 | | | | 2,600,025 | |
| Commonwealth of Massachusetts Consolidated Loan, “A”, 5%, 3/01/16 | | | 1,000,000 | | | | 1,039,160 | |
| Commonwealth of Massachusetts Consolidated Loan, “C”, 5%, 9/01/15 (c) | | | 5,000,000 | | | | 5,316,750 | |
| Commonwealth of Massachusetts Consolidated Loan, “D”, 0.51%, 1/01/18 | | | 1,500,000 | | | | 1,498,290 | |
| Commonwealth of Massachusetts Highway Grant Anticipation, “A”, 5%, 6/15/22 | | | 5,000,000 | | | | 6,080,250 | |
| Commonwealth of Massachusetts, General Obligation, “B”, 5%, 8/01/21 | | | 6,185,000 | | | | 7,438,761 | |
| Massachusetts Department of Transportation, Metropolitan Highway System Rev., “B”, 5%, 1/01/17 | | | 1,000,000 | | | | 1,107,060 | |
| Massachusetts Development Finance Agency Rev. (Boston University), “V-2”, 2.875%, 10/01/14 | | | 2,250,000 | | | | 2,273,918 | |
| Massachusetts Development Finance Agency Rev. (Brandeis University), “O-2”, 3%, 10/01/14 | | | 2,675,000 | | | | 2,704,800 | |
| Massachusetts Development Finance Agency Rev. (Hampshire College), 5.15%, 10/01/14 | | | 30,000 | | | | 30,440 | |
23
Portfolio of Investments – continued
| | | | | | | | |
| Issuer | | Shares/Par | | | Value ($) | |
| | | | | | | | |
| Municipal Bonds - continued | | | | | | | | |
| Massachusetts - continued | | | | | | | | |
| Massachusetts Development Finance Agency Rev. (Partners Healthcare), “K-4”, 3%, 7/01/35 (b) | | $ | 2,000,000 | | | $ | 2,066,580 | |
| Massachusetts Development Finance Agency Rev. (Simmons College), “H”, SYNCORA, 5.25%, 10/01/18 | | | 1,485,000 | | | | 1,676,149 | |
| Massachusetts Development Finance Agency Rev. (Simmons College), “H”, SYNCORA, 5.25%, 10/01/19 | | | 1,605,000 | | | | 1,806,090 | |
| Massachusetts Development Finance Agency Rev. (Tufts University), “P”, 3%, 2/15/36 (b) | | | 3,000,000 | | | | 3,136,050 | |
| Massachusetts Development Finance Agency Rev. (Wheelock), “C”, 5%, 10/01/17 | | | 1,520,000 | | | | 1,663,062 | |
| Massachusetts Development Finance Agency, Solid Waste Disposal Rev. (Dominion Energy Brayton), 5.75%, 5/01/19 (c) | | | 220,000 | | | | 267,617 | |
| Massachusetts Educational Financing Authority Rev., “A”, 5.5%, 1/01/17 | | | 2,800,000 | | | | 3,090,444 | |
| Massachusetts Educational Financing Authority Rev., “J”, 4.75%, 7/01/19 | | | 1,235,000 | | | | 1,375,617 | |
| Massachusetts Educational Financing Authority Rev., “J”, 5%, 7/01/20 | | | 4,400,000 | | | | 4,938,648 | |
| Massachusetts Health & Educational Facilities Authority Rev. (Baystate Medical Center), “K”, 5%, 7/01/39 (b) | | | 1,000,000 | | | | 1,035,940 | |
| Massachusetts Health & Educational Facilities Authority Rev. (Springfield College), 5%, 10/15/14 | | | 1,010,000 | | | | 1,027,322 | |
| Massachusetts Health & Educational Facilities Authority Rev. (Springfield College), 5%, 10/15/16 | | | 1,115,000 | | | | 1,194,399 | |
| Massachusetts Housing Finance Agency, Rental Housing Rev., “A”, AGM, 5.05%, 7/01/18 | | | 1,125,000 | | | | 1,127,486 | |
| Massachusetts School Building Authority, Senior Dedicated Sals Tax Rev., “A”, 5%, 8/15/22 | | | 13,405,000 | | | | 16,242,168 | |
| Massachusetts Water Resources Authority, “A”, 4%, 8/01/17 | | | 5,855,000 | | | | 6,470,653 | |
| State of Massachusetts, “C”, 5.25%, 8/01/17 (c) | | | 4,085,000 | | | | 4,687,660 | |
| | | | | | | | |
| | | | | | | $ | 85,671,879 | |
| Michigan - 3.5% | | | | | | | | |
| Central Michigan University Rev., 5%, 10/01/17 | | $ | 1,760,000 | | | $ | 1,971,200 | |
| Detroit, MI, District Aid, 5%, 11/01/14 | | | 3,000,000 | | | | 3,058,380 | |
| Detroit, MI, Sewage Disposal System Rev., Senior Lien, “B”, NATL, 5.25%, 7/01/22 | | | 3,000,000 | | | | 3,017,100 | |
| Detroit, MI, Water & Sewerage Department, Senior Lien Sewage Disposal System Rev., “A”, AGM, 5%, 7/01/16 | | | 3,735,000 | | | | 3,757,485 | |
| Detroit, MI, Water Supply System Rev., Senior Lien, “A”, AGM, 5%, 7/01/23 | | | 620,000 | | | | 624,743 | |
| Michigan Finance Authority Rev. (Unemployment Obligation Assessment), “A”, 5%, 1/01/16 | | | 4,600,000 | | | | 4,953,556 | |
24
Portfolio of Investments – continued
| | | | | | | | |
| Issuer | | Shares/Par | | | Value ($) | |
| | | | | | | | |
| Municipal Bonds - continued | | | | | | | | |
| Michigan - continued | | | | | | | | |
| Michigan Finance Authority Rev. (Unemployment Obligation Assessment), “B”, 5%, 7/01/20 | | $ | 9,000,000 | | | $ | 10,552,140 | |
| Michigan Finance Authority Rev. (Unemployment Obligation Assessment), “B”, 5%, 7/01/22 | | | 5,000,000 | | | | 5,496,550 | |
| Michigan Hospital Finance Authority Rev. (Henry Ford Health System), 4%, 11/15/14 | | | 2,000,000 | | | | 2,032,040 | |
| Michigan Housing Development Authority Rev. (Parkway Meadows Project), 4.2%, 10/15/18 | | | 6,180,000 | | | | 6,217,636 | |
| Michigan Strategic Fund Ltd. Obligation Rev. (Detroit Edison Co.), 5.625%, 7/01/20 | | | 1,000,000 | | | | 1,190,430 | |
| Michigan Strategic Fund Ltd. Obligation Rev. (Detroit Edison Co.), 5.25%, 8/01/29 (b) | | | 1,000,000 | | | | 1,011,240 | |
| Michigan Strategic Fund Ltd. Obligation Rev. (Dow Chemical Co.), 6.25%, 6/01/14 | | | 1,000,000 | | | | 1,004,120 | |
| Regents of the University of Michigan General Rev., “C”, 5%, 4/01/17 | | | 3,720,000 | | | | 4,185,000 | |
| Royal Oak, MI, Hospital Finance Authority Rev. (William Beaumont Hospital), “D”, 5%, 9/01/21 | | | 2,460,000 | | | | 2,842,382 | |
| Western Michigan University Rev., ASSD GTY, 5.25%, 11/15/14 | | | 1,000,000 | | | | 1,025,060 | |
| | | | | | | | |
| | | | | | | $ | 52,939,062 | |
| Minnesota - 2.2% | | | | | | | | |
| Minnesota Public Facilities Authority, Revolving Fund Rev., “C”, 5%, 3/01/19 | | $ | 9,215,000 | | | $ | 10,808,274 | |
| State of Minnesota, “B”, 5%, 8/01/21 | | | 5,000,000 | | | | 6,039,750 | |
| State of Minnesota, “H”, 5%, 11/01/16 | | | 3,000,000 | | | | 3,339,030 | |
| State of Minnesota, “H”, 5%, 11/01/17 | | | 2,600,000 | | | | 2,979,808 | |
| State of Minnesota, Trunk Highway Bonds, General Obligation, “B”, 5%, 8/01/15 | | | 10,000,000 | | | | 10,592,300 | |
| | | | | | | | |
| | | | | | | $ | 33,759,162 | |
| Mississippi - 0.5% | | | | | | | | |
| Jackson State University, MS, Educational Building Corp. Rev. “A-1”, 5%, 3/01/15 | | $ | 1,490,000 | | | $ | 1,538,529 | |
| Medical Center, Educational Building Corp. Rev. (University of Mississippi), 4%, 6/01/14 | | | 1,240,000 | | | | 1,243,980 | |
| Medical Center, Educational Building Corp. Rev. (University of Mississippi), 4%, 6/01/15 | | | 2,330,000 | | | | 2,424,016 | |
| Mississippi Development Bank Special Obligation (Hattiesburg Water & Sewer), “N”, AMBAC, 5%, 8/01/15 | | | 1,000,000 | | | | 1,036,750 | |
| Mississippi Development Bank Special Obligation (Marshall County Industrial Development Authority Mississippi Highway Construction Project), 5%, 1/01/21 | | | 1,685,000 | | | | 1,987,003 | |
| | | | | | | | |
| | | | | | | $ | 8,230,278 | |
25
Portfolio of Investments – continued
| | | | | | | | |
| Issuer | | Shares/Par | | | Value ($) | |
| | | | | | | | |
| Municipal Bonds - continued | | | | | | | | |
| Missouri - 1.1% | | | | | | | | |
| Missouri Environmental Improvement & Energy Resources Authority Rev. (Kansas City Power & Light Co. Project), 1.25%, 7/01/17 | | $ | 2,000,000 | | | $ | 1,980,360 | |
| Missouri Health & Educational Facilities Authority Rev. (A.T. Still University of Health Services), 3%, 10/01/16 | | | 315,000 | | | | 331,015 | |
| Missouri Health & Educational Facilities Authority Rev. (A.T. Still University of Health Services), 4%, 10/01/17 | | | 650,000 | | | | 709,865 | |
| Missouri Health & Educational Facilities Authority Rev. (A.T. Still University of Health Services), 4%, 10/01/18 | | | 675,000 | | | | 741,825 | |
| Missouri Health & Educational Facilities Authority Rev. (A.T. Still University of Health Services), 2%, 10/01/15 | | | 200,000 | | | | 204,282 | |
| Missouri Health & Educational Facilities Authority Rev. (St. Louis College of Pharmacy), 3%, 5/01/16 | | | 360,000 | | | | 374,288 | |
| Missouri Health & Educational Facilities Authority Rev. (St. Louis College of Pharmacy), 5%, 5/01/17 | | | 400,000 | | | | 443,496 | |
| Missouri Health & Educational Facilities Authority Rev. (St. Louis College of Pharmacy), 5%, 5/01/18 | | | 400,000 | | | | 450,700 | |
| Missouri Health & Educational Facilities Authority Rev. (St. Louis College of Pharmacy), 5%, 5/01/19 | | | 450,000 | | | | 511,502 | |
| Missouri Highways & Transit Commission State Road Rev. (Federal Reimbursement), “A”, 5%, 5/01/15 | | | 3,000,000 | | | | 3,143,100 | |
| Missouri Housing Development Commission, Single Family Mortgage Rev. (Home Loan Program), “B”, GNMA, 6.05%, 3/01/37 | | | 105,000 | | | | 108,334 | |
| St. Louis County, MO, Industrial Development Authority Rev., (Friendship Village Sunset Hills), “B”, 2.85%, 9/01/18 | | | 1,500,000 | | | | 1,512,330 | |
| University of Missouri Curators Facilities Rev, “A”, 5%, 11/01/19 | | | 5,000,000 | | | | 5,921,650 | |
| | | | | | | | |
| | | | | | | $ | 16,432,747 | |
| Nebraska - 0.9% | | | | | | | | |
| Central Plains Energy Project, NE, Gas Project Rev. (Project No.1), “A”, 5.25%, 12/01/18 | | $ | 2,345,000 | | | $ | 2,658,831 | |
| Nebraska Central Plains Energy Project, Gas Project Rev., 5%, 9/01/20 | | | 1,710,000 | | | | 1,900,340 | |
| Nebraska Central Plains Energy Project, Gas Project Rev., 5%, 9/01/21 | | | 2,000,000 | | | | 2,218,100 | |
| Nebraska Public Power District Rev., “C”, 5%, 1/01/18 | | | 5,935,000 | | | | 6,324,751 | |
| | | | | | | | |
| | | | | | | $ | 13,102,022 | |
| Nevada - 0.5% | | | | | | | | |
| Clark County, NV, School District, 5%, 6/15/17 | | $ | 2,845,000 | | | $ | 3,184,323 | |
| Director of the State of Nevada Department of Business & Industry Rev. (Republic Services, Inc.), 5.625%, 12/01/26 (b) | | | 1,950,000 | | | | 2,162,960 | |
| Nevada Unemployment Compensation Rev., 5%, 12/01/17 | | | 2,500,000 | | | | 2,864,275 | |
| | | | | | | | |
| | | | | | | $ | 8,211,558 | |
26
Portfolio of Investments – continued
| | | | | | | | |
| Issuer | | Shares/Par | | | Value ($) | |
| | | | | | | | |
| Municipal Bonds - continued | | | | | | | | |
| New Hampshire - 0.1% | | | | | | | | |
| New Hampshire Business Finance Authority, Pollution Control Rev. (United Illuminating Co.), 4.5%, 7/01/27 (b) | | $ | 1,960,000 | | | $ | 2,026,385 | |
| New Hampshire Health & Education Facilities Authority Rev. (Covenant Health), 5%, 7/01/14 | | | 155,000 | | | | 156,043 | |
| | | | | | | | |
| | | | | | | $ | 2,182,428 | |
| New Jersey - 3.1% | | | | | | | | |
| New Jersey Economic Development Authority (Waste Management, Inc.), “A”, 5.3%, 6/01/15 (b) | | $ | 1,000,000 | | | $ | 1,003,480 | |
| New Jersey Economic Development Authority Rev., AGM, 5%, 9/01/14 (c) | | | 1,000,000 | | | | 1,015,620 | |
| New Jersey Economic Development Authority Rev., 5%, 6/15/18 | | | 4,000,000 | | | | 4,530,440 | |
| New Jersey Economic Development Authority Rev. (The Goethals Bridge Replacement Project), 5%, 7/01/20 | | | 500,000 | | | | 568,750 | |
| New Jersey Economic Development Authority Rev. (The Goethals Bridge Replacement Project), 5%, 1/01/21 | | | 300,000 | | | | 337,098 | |
| New Jersey Economic Development Authority Rev. (The Goethals Bridge Replacement Project), 5%, 7/01/21 | | | 425,000 | | | | 477,611 | |
| New Jersey Economic Development Authority Rev., Cigarette Tax, ETM, 5.375%, 6/15/15 (c) | | | 2,730,000 | | | | 2,888,285 | |
| New Jersey Economic Development Authority, Special Facilities Rev. (Continental Airlines, Inc.), 4.875%, 9/15/19 | | | 1,320,000 | | | | 1,339,510 | |
| New Jersey Educational Facilities Authority Rev. (University of Medicine & Dentistry), “B”, ETM, 6%, 12/01/17 (c) | | | 1,710,000 | | | | 1,978,025 | |
| New Jersey Health Care Facilities, Financing Authority Rev. (Holy Name Medical Center), 5%, 7/01/16 | | | 1,000,000 | | | | 1,064,490 | |
New Jersey Health Care Facilities, Financing Authority Rev.
(St. Barnabas Health), “A”, 4%, 7/01/15 | | | 935,000 | | | | 968,239 | |
New Jersey Health Care Facilities, Financing Authority Rev.
(St. Barnabas Health), “A”, 5%, 7/01/16 | | | 865,000 | | | | 936,847 | |
New Jersey Health Care Facilities, Financing Authority Rev.
(St. Barnabas Health), “A”, 5%, 7/01/17 | | | 700,000 | | | | 776,825 | |
| New Jersey Tobacco Settlement Financing Corp., “1-A”, 4.5%, 6/01/23 | | | 11,960,000 | | | | 11,587,087 | |
| New Jersey Tobacco Settlement Financing Corp., Capital Appreciation, “1-B”, 0%, 6/01/41 | | | 21,795,000 | | | | 5,278,749 | |
| New Jersey Tobacco Settlement Financing Corp., Capital Appreciation, “1-C”, 0%, 6/01/41 | | | 290,000 | | | | 68,472 | |
| New Jersey Transportation Trust Fund Authority, “D”, 5%, 12/15/18 | | | 2,500,000 | | | | 2,884,775 | |
| North Hudson, NJ, Sewerage Authority, Gross Rev. Lease Certificates, “A”, 4%, 6/01/17 | | | 775,000 | | | | 830,056 | |
| North Hudson, NJ, Sewerage Authority, Gross Rev. Lease Certificates, “A”, 4%, 6/01/18 | | | 2,250,000 | | | | 2,427,863 | |
27
Portfolio of Investments – continued
| | | | | | | | |
| Issuer | | Shares/Par | | | Value ($) | |
| | | | | | | | |
| Municipal Bonds - continued | | | | | | | | |
| New Jersey - continued | | | | | | | | |
| North Hudson, NJ, Sewerage Authority, Gross Rev. Lease Certificates, “A”, 5%, 6/01/19 | | $ | 3,580,000 | | | $ | 4,042,035 | |
| South Jersey, NJ, Port Corp. Rev. (Marine Terminal), “P-2”, 4%, 1/01/15 | | | 2,420,000 | | | | 2,479,242 | |
| | | | | | | | |
| | | | | | | $ | 47,483,499 | |
| New Mexico - 1.1% | | | | | | | | |
| Farmington, NM, Pollution Control Rev. (El Paso Electric Company Four Corners Project), “A”, 1.875%, 6/01/32 (b) | | $ | 2,500,000 | | | $ | 2,477,175 | |
| Farmington, NM, Pollution Control Rev. (Public Service Co. of New Mexico), “B”, 4.75%, 6/01/40 (b) | | | 2,000,000 | | | | 2,131,640 | |
| Farmington, NM, Pollution Control Rev. (Southern California Edison Co.), “A”, 2.875%, 4/01/29 (b) | | | 2,400,000 | | | | 2,451,432 | |
| New Mexico Educational Assistance Foundation, “A-1”, 5%, 12/01/19 | | | 2,000,000 | | | | 2,317,140 | |
| New Mexico Educational Assistance Foundation, “A-1”, 4%, 12/01/20 | | | 1,500,000 | | | | 1,657,590 | |
| New Mexico Educational Assistance Foundation, “B”, 4%, 9/01/15 | | | 3,000,000 | | | | 3,138,600 | |
| New Mexico Finance Authority State Transportation Rev., 5%, 6/15/18 | | | 2,000,000 | | | | 2,313,540 | |
| | | | | | | | |
| | | | | | | $ | 16,487,117 | |
| New York - 6.8% | | | | | | | | |
| Brooklyn, NY, Arena Local Development Corp. (Barclays Center Project), 5.75%, 7/15/15 | | $ | 1,075,000 | | | $ | 1,116,205 | |
| Hempstead, NY, Local Development Corp. Rev. (Adelphi University Project), 5%, 6/01/22 | | | 1,140,000 | | | | 1,303,807 | |
| Nassau County, NY, Industrial Development Agency, Civic Facilities Rev. (New York Institute of Technology), “A”, 5.25%, 3/01/17 | | | 430,000 | | | | 458,019 | |
| Nassau County, NY, Local Economic Assistance Corp. Rev. (Winthrop-University Hospital Association Project), 4%, 7/01/15 | | | 500,000 | | | | 518,245 | |
| New York City, NY, Trust for Cultural Resources Rev. (Museum of Modern Art), “1A”, 5%, 10/01/17 | | | 2,000,000 | | | | 2,268,620 | |
| New York Dormitory Authority Rev. (Bronx-Lebanon Hospital Center), 6.25%, 8/15/22 | | | 1,000,000 | | | | 1,003,570 | |
| New York Dormitory Authority Rev. (Fordham University), 2%, 7/01/14 | | | 1,170,000 | | | | 1,173,498 | |
| New York Dormitory Authority Rev. (Fordham University), 4%, 7/01/15 | | | 1,000,000 | | | | 1,043,240 | |
| New York Dormitory Authority Rev. (NYSARC, Inc.), “A”, 5%, 7/01/15 | | | 1,500,000 | | | | 1,579,455 | |
| New York Dormitory Authority Rev. (Pace University), “A”, 4%, 5/01/18 | | | 2,000,000 | | | | 2,116,340 | |
28
Portfolio of Investments – continued
| | | | | | | | |
| Issuer | | Shares/Par | | | Value ($) | |
| | | | | | | | |
| Municipal Bonds - continued | | | | | | | | |
| New York - continued | | | | | | | | |
| New York Dormitory Authority Rev., Non-State Supported Debt (Mount Sinai Hospital), “A”, 5%, 7/01/18 | | $ | 1,000,000 | | | $ | 1,145,690 | |
| New York Dormitory Authority Rev., Non-State Supported Debt (North Shore Long Island Jewish Health Care, Inc.), “A”, 5%, 5/01/15 | | | 2,000,000 | | | | 2,088,060 | |
| New York Dormitory Authority Rev., Non-State Supported Debt (North Shore Long Island Jewish Health Care, Inc.), “A”, 5%, 5/01/16 | | | 1,000,000 | | | | 1,083,330 | |
| New York Dormitory Authority Rev., Non-State Supported Debt (North Shore Long Island Jewish Health Care, Inc.), “A”, 5%, 5/01/17 | | | 1,500,000 | | | | 1,670,130 | |
| New York Energy Research & Development Authority, Pollution Control Rev. (New York Electric & Gas Corp.), “A”, 2.125%, 3/15/15 | | | 2,500,000 | | | | 2,522,750 | |
| New York Energy Research & Development Authority, Pollution Control Rev. (Rochester Gas & Electric Corp.), “A”, NATL, 4.75%, 5/15/32 (b) | | | 1,130,000 | | | | 1,218,106 | |
| New York Environmental Facilities Corp. Rev., “C”, 5%, 5/15/20 | | | 3,395,000 | | | | 4,062,219 | |
| New York Environmental Facilities Corp. Rev., “C”, 5%, 11/15/20 | | | 2,825,000 | | | | 3,394,803 | |
| New York Housing Finance Agency Affordable Housing Rev., “D”, 0.8%, 11/01/16 | | | 1,170,000 | | | | 1,174,247 | |
| New York Housing Finance Agency Affordable Housing Rev., “D”, 0.8%, 11/01/16 | | | 1,040,000 | | | | 1,044,129 | |
| New York Housing Finance Agency Rev., “E”, 1.1%, 11/01/16 | | | 3,000,000 | | | | 3,021,300 | |
| New York Municipal Bond Bank Agency, Special School Purpose Rev., 5%, 12/01/16 | | | 5,500,000 | | | | 6,115,285 | |
| New York Thruway Authority General Rev., Junior Indebtedness Obligation, “A”, 5%, 5/01/19 | | | 2,675,000 | | | | 3,089,973 | |
| New York Thruway Authority, Second General Highway & Bridge Trust Fund, “A-1”, 5%, 4/01/19 | | | 1,350,000 | | | | 1,565,015 | |
| New York Tobacco Settlement Financing Corp., Asset-Backed Rev., “B”, 5%, 6/01/21 | | | 4,525,000 | | | | 4,915,779 | |
| New York Urban Development Corp. Rev., “A”, 5.125%, 7/01/15 | | | 675,000 | | | | 680,191 | |
| New York Utility Debt Securitization Authority Rev., “TE”, 5%, 12/15/18 | | | 220,000 | | | | 245,223 | |
| New York, NY, “B”, 5%, 8/01/17 | | | 7,120,000 | | | | 8,076,572 | |
| New York, NY, “C”, 5%, 8/01/17 | | | 1,000,000 | | | | 1,134,350 | |
| New York, NY, “J-4”, FRN, 0.67%, 8/01/25 | | | 1,035,000 | | | | 1,035,104 | |
| New York, NY, City Housing Development Corp., “B1”, 5%, 7/01/18 | | | 3,250,000 | | | | 3,689,660 | |
| New York, NY, City Housing Development Corp., “B1”, 5%, 7/01/19 | | | 1,250,000 | | | | 1,438,750 | |
29
Portfolio of Investments – continued
| | | | | | | | |
| Issuer | | Shares/Par | | | Value ($) | |
| | | | | | | | |
| Municipal Bonds - continued | | | | | | | | |
| New York - continued | | | | | | | | |
| New York, NY, City Transitional Finance Authority Rev., Future Tax Secured, “A”, 5%, 11/01/14 | | $ | 515,000 | | | $ | 527,355 | |
| New York, NY, City Transitional Finance Authority Rev., Future Tax Secured, “A”, ETM, 5%, 11/01/14 (c) | | | 485,000 | | | | 496,441 | |
| New York, NY, City Transitional Finance Authority Rev., Future Tax Secured, “C”, 5%, 11/01/16 | | | 4,000,000 | | | | 4,454,160 | |
| New York, NY, Housing Development Corp., Multi-Family Housing Rev., “E-1-A”, 0.75%, 11/01/16 | | | 2,240,000 | | | | 2,240,470 | |
| New York, NY, Housing Development Corp., Multi-Family Housing Rev., “E-1-B”, 1.2%, 11/01/17 | | | 2,085,000 | | | | 2,090,734 | |
| New York, NY, Municipal Water Finance Authority, Water & Sewer Systems Rev., “CC”, 5%, 6/15/18 | | | 3,555,000 | | | | 3,949,818 | |
| New York, NY, Municipal Water Finance Authority, Water & Sewer Systems Rev., “CC”, 5%, 6/15/19 | | | 2,205,000 | | | | 2,513,656 | |
| New York, NY, Trust for Cultural Resources Rev. (Juilliard School), 2.1%, 4/01/36 (b) | | | 2,000,000 | | | | 2,038,460 | |
| New York, NY, Trust for Cultural Resources Rev. (Juilliard School), “B”, 1.35%, 1/01/36 (b) | | | 5,000,000 | | | | 5,042,850 | |
| Niagara, NY, Area Development Corp. Rev. (Niagara University), “A”, 5%, 5/01/17 | | | 200,000 | | | | 217,202 | |
| Niagara, NY, Area Development Corp. Rev. (Niagara University), “A”, 5%, 5/01/18 | | | 250,000 | | | | 275,385 | |
| Onondaga, NY, Civic Development Corp. Rev. (St. Joseph’s Hospital Health Center), “A”, 5%, 7/01/19 | | | 250,000 | | | | 259,170 | |
| Port Authority of NY & NJ, (170th Series), 5%, 12/01/16 | | | 1,460,000 | | | | 1,617,373 | |
| Port Authority of NY & NJ, (170th Series), 5%, 12/01/17 | | | 1,440,000 | | | | 1,631,851 | |
| Port Authority of NY & NJ, (170th Series), 5%, 12/01/18 | | | 825,000 | | | | 947,405 | |
| Port Authority of NY & NJ, (170th Series), 5%, 12/01/19 | | | 1,410,000 | | | | 1,635,205 | |
| St. Lawrence County, NY, Industrial Development Agency (St. Lawrence University), 5%, 10/01/16 | | | 1,000,000 | | | | 1,102,140 | |
| Suffolk County, NY, Industrial Development Agency, Civic Facilities Rev. (New York Institute of Technology), 5.25%, 3/01/17 | | | 500,000 | | | | 512,095 | |
| Tompkins County, NY, Industrial Development Agency Rev. (Ithaca College), 5%, 7/01/16 | | | 3,000,000 | | | | 3,160,350 | |
| Westchester County, NY, Local Development Corp. Rev. (Kendal on Hudson Project), 2%, 1/01/15 | | | 250,000 | | | | 250,045 | |
| Westchester County, NY, Local Development Corp. Rev. (Kendal on Hudson Project), 2%, 1/01/16 | | | 450,000 | | | | 446,657 | |
| | | | | | | | |
| | | | | | | $ | 102,400,487 | |
| North Carolina - 1.5% | | | | | | | | |
| Durham County, NC, 5%, 4/01/19 | | $ | 1,000,000 | | | $ | 1,174,760 | |
| North Carolina Medical Care Commission, Health Care Facilities Rev. (Wake Forest Baptist Obligated Group), “C”, FRN, 0.86%, 12/01/33 (b) | | | 2,900,000 | | | | 2,885,906 | |
30
Portfolio of Investments – continued
| | | | | | | | |
| Issuer | | Shares/Par | | | Value ($) | |
| | | | | | | | |
| Municipal Bonds - continued | | | | | | | | |
| North Carolina - continued | | | | | | | | |
| North Carolina Municipal Power Agency No. 1, Catawba Electric Rev., “A”, 3%, 1/01/16 | | $ | 2,050,000 | | | $ | 2,134,727 | |
| North Carolina Public Improvement, “A”, 5%, 5/01/16 | | | 8,505,000 | | | | 9,289,926 | |
| Orange County, NC, Public Facilities Co., Limited Obligation, 5%, 10/01/20 | | | 500,000 | | | | 586,800 | |
| State of North Carolina, “A”, 5%, 3/01/17 | | | 3,500,000 | | | | 3,932,390 | |
| Wake County, NC, Annual Appropriation Ltd., Obligation Bonds, 5%, 6/01/14 | | | 1,890,000 | | | | 1,897,692 | |
| | | | | | | | |
| | | | | | | $ | 21,902,201 | |
| North Dakota - 0.2% | | | | | | | | |
| Burleigh County, ND, Health Care Rev. (Alexius Medical Center Project), “A”, 3%, 7/01/17 | | $ | 1,335,000 | | | $ | 1,362,848 | |
| Burleigh County, ND, Health Care Rev. (Alexius Medical Center Project), “A”, 3%, 7/01/18 | | | 1,180,000 | | | | 1,200,792 | |
| | | | | | | | |
| | | | | | | $ | 2,563,640 | |
| Ohio - 1.9% | | | | | | | | |
| American Municipal Power, Inc. Rev. (AMP Fremont Energy Center Project), “B”, 5%, 2/15/17 | | $ | 1,260,000 | | | $ | 1,393,686 | |
| Buckeye, OH, Tobacco Settlement Financing Authority, “A-2”, 5.125%, 6/01/24 | | | 1,775,000 | | | | 1,527,973 | |
| Cleveland, OH, Airport System Rev., “A”, AMBAC, 5.25%, 1/01/17 | | | 1,000,000 | | | | 1,103,310 | |
| Columbus, OH, 5%, 7/01/22 | | | 2,350,000 | | | | 2,836,779 | |
| Ohio Air Quality Development Authority Rev. (FirstEnergy Generation Project), 2.25%, 8/01/29 (b) | | | 1,500,000 | | | | 1,509,630 | |
| Ohio Higher Education, “B”, 5%, 8/01/16 | | | 5,275,000 | | | | 5,814,000 | |
| Ohio Higher Education, “C”, 5%, 8/01/21 | | | 8,000,000 | | | | 9,609,680 | |
| Ohio Higher Educational Facility Rev. (University Hospital), “A”, 5%, 1/15/15 (c) | | | 620,000 | | | | 640,727 | |
| Ohio Higher Educational Facility Rev. (University Hospital), “A”, 5.2%, 1/15/15 (c) | | | 620,000 | | | | 641,588 | |
| Ohio Solid Waste Rev. (Republic Services, Inc. Project), FRN, 0.32%, 11/01/35 (b) | | | 1,225,000 | | | | 1,225,000 | |
| Ohio Water Development Authority, Water Pollution Control Rev., 5.25%, 6/01/20 | | | 2,000,000 | | | | 2,420,800 | |
| | | | | | | | |
| | | | | | | $ | 28,723,173 | |
| Oklahoma - 0.3% | | | | | | | | |
| Oklahoma Capitol Improvement Authority, State Facilities Rev. (Higher Education Projects), “A”, 2.25%, 7/01/17 | | $ | 2,500,000 | | | $ | 2,604,750 | |
| Oklahoma Industries Authority Rev. (Oklahoma Medical Research Foundation), 4.75%, 7/01/14 | | | 1,060,000 | | | | 1,065,353 | |
31
Portfolio of Investments – continued
| | | | | | | | |
| Issuer | | Shares/Par | | | Value ($) | |
| | | | | | | | |
| Municipal Bonds - continued | | | | | | | | |
| Oklahoma - continued | | | | | | | | |
Tulsa, OK, Industrial Authority Rev. (University of Tulsa),
5.5%, 10/01/22 | | $ | 1,000,000 | | | $ | 1,119,100 | |
| | | | | | | | |
| | | | | | | $ | 4,789,203 | |
| Oregon - 1.0% | | | | | | | | |
| Clackamas County, OR, Hospital Facility Authority Rev. (Legacy Health System), “C”, 5%, 7/15/37 (b) | | $ | 1,000,000 | | | $ | 1,007,360 | |
| Lake Oswego, OR , 4%, 6/01/19 | | | 1,195,000 | | | | 1,332,329 | |
| Lake Oswego, OR , 4%, 6/01/20 | | | 1,830,000 | | | | 2,044,934 | |
| Lake Oswego, OR , 4%, 6/01/21 | | | 2,330,000 | | | | 2,603,262 | |
| Oregon Health & Science University Rev., “A”, 5%, 7/01/18 | | | 785,000 | | | | 886,807 | |
| Portland, OR, Sewer System Rev. , “A”, 5%, 3/01/18 | | | 5,000,000 | | | | 5,735,950 | |
| Washington County, OR, School District, AGM, 5.25%, 6/15/18 | | | 1,000,000 | | | | 1,142,510 | |
| | | | | | | | |
| | | | | | | $ | 14,753,152 | |
| Pennsylvania - 4.3% | | | | | | | | |
| Allegheny County, PA, Higher Education Building Authority Rev. (Chatham University), “A”, 5%, 9/01/16 | | $ | 475,000 | | | $ | 505,604 | |
| Allegheny County, PA, Hospital Development Authority Rev. (University of Pittsburgh Medical Center), 4%, 8/15/14 | | | 1,000,000 | | | | 1,010,690 | |
| Allegheny County, PA, Hospital Development Authority Rev. (University of Pittsburgh Medical Center), “A1”, FRN, 0.879%, 2/01/21 | | | 2,150,000 | | | | 2,129,360 | |
| Beaver County, PA, Industrial Development Authority, Pollution Control Rev. (Duquesne Light Co.), “C”, 4.75%, 8/01/33 (b) | | | 2,000,000 | | | | 2,166,660 | |
| Berks County, PA, Municipal Authority Rev. (Reading Hospital & Medical Center), “A-3”, 5%, 11/01/15 | | | 1,000,000 | | | | 1,068,060 | |
| Butler County, PA, Hospital Authority Rev. (Butler Health System), 5.375%, 7/01/17 | | | 1,465,000 | | | | 1,614,957 | |
| Clairton, PA, Municipal Authority, “B”, 2%, 12/01/14 | | | 435,000 | | | | 437,971 | |
| Clairton, PA, Municipal Authority, “B”, 4%, 12/01/15 | | | 375,000 | | | | 391,481 | |
| Clarion County, PA, Industrial Development Authority, Student Housing Rev. (Clarion University Foundation, Inc.), “C-1, 1.05%, 5/01/16 | | | 2,500,000 | | | | 2,500,000 | |
| Commonwealth of Pennsylvania, AGM, 5%, 9/01/14 | | | 2,000,000 | | | | 2,031,420 | |
Commonwealth of Pennsylvania, State Public School Building Authority Lease Rev. (School District of Philadelphia Project),
5%, 4/01/17 | | | 2,000,000 | | | | 2,197,660 | |
Commonwealth of Pennsylvania, State Public School Building Authority Lease Rev. (School District of Philadelphia Project),
5%, 4/01/18 | | | 3,200,000 | | | | 3,563,968 | |
Commonwealth of Pennsylvania, State Public School Building Authority Lease Rev. (School District of Philadelphia Project),
5%, 4/01/19 | | | 1,500,000 | | | | 1,688,310 | |
32
Portfolio of Investments – continued
| | | | | | | | |
| Issuer | | Shares/Par | | | Value ($) | |
| | | | | | | | |
| Municipal Bonds - continued | | | | | | | | |
| Pennsylvania - continued | | | | | | | | |
| Cumberland County, PA, Municipal Authority Rev. (Presbyterian Homes, Inc.), “C”, 4%, 12/01/26 | | $ | 1,400,000 | | | $ | 1,332,016 | |
| Dauphin County, PA, General Authority Health System Rev. (Pinnacle Health System), “A”, 5.25%, 6/01/17 | | | 1,500,000 | | | | 1,643,130 | |
| Delaware County, PA, Authority Rev. (Elwyn Inc.), 4%, 6/01/18 | | | 1,795,000 | | | | 1,861,182 | |
| Delaware County, PA, Authority University Rev. (Villanova University), 4%, 8/01/16 | | | 250,000 | | | | 266,733 | |
| Delaware County, PA, Authority University Rev. (Villanova University), 5%, 8/01/17 | | | 425,000 | | | | 474,564 | |
| Delaware County, PA, Authority University Rev. (Villanova University), 5%, 8/01/18 | | | 305,000 | | | | 345,721 | |
| Delaware County, PA, Authority University Rev. (Villanova University), 5%, 8/01/19 | | | 250,000 | | | | 286,853 | |
| Delaware River Port Authority, Pennsylvania & New Jersey Refunding (Port District Project), 5%, 1/01/18 | | | 1,230,000 | | | | 1,341,696 | |
| Delaware Valley, PA, Regional Finance Authority, 5.75%, 7/01/17 | | | 2,575,000 | | | | 2,893,193 | |
| Lehigh County, PA, Water and Sewer Authority Rev. (Allentown Concession), Capital Appreciation, “B”, 0%, 12/01/21 | | | 1,295,000 | | | | 984,006 | |
| Lehigh County, PA, Water and Sewer Authority Rev. (Allentown Concession), Capital Appreciation, “B”, 0%, 12/01/22 | | | 1,345,000 | | | | 967,512 | |
| Lehigh County, PA, Water and Sewer Authority Rev. (Allentown Concession), Capital Appreciation, “B”, 0%, 12/01/23 | | | 1,060,000 | | | | 718,765 | |
| Lycoming County, PA, Authority Health System Rev. (Susquehanna Health System), “A”, 5%, 7/01/16 | | | 3,195,000 | | | | 3,399,640 | |
| Monroe County, PA, Hospital Authority Rev. (Pocono Medical Center), “A”, 5%, 1/01/23 | | | 1,225,000 | | | | 1,345,687 | |
| Pennsylvania Economic Development Finance Authority Rev, Solid Waste Disposal Rev. (Waste Management, Inc.), 1.75%, 12/01/33 (b) | | | 2,000,000 | | | | 2,041,320 | |
| Pennsylvania Economic Development Financing Authority (PPL Energy Supply LLC), 3%, 12/01/38 (b) | | | 3,000,000 | | | | 3,071,400 | |
| Pennsylvania Economic Development Financing Authority Rev., Resource Recovery Rev. (Colver), “G”, 5.125%, 12/01/15 | | | 755,000 | | | | 783,456 | |
| Pennsylvania Economic Development Financing Authority Unemployment Compensation Rev., “B”, 5.25%, 9/01/17 | | | 1,000,000 | | | | 1,117,270 | |
| Pennsylvania Economic Development Financing Authority Unemployment Compensation Rev., “B”, 5%, 1/01/23 | | | 1,770,000 | | | | 1,898,697 | |
| Pennsylvania Economic Development Financing Authority Unemployment Compensation Rev., “B”, 5%, 7/01/23 | | | 1,060,000 | | | | 1,118,438 | |
| Pennsylvania Economic Development Financing Authority, Exempt Facilities Rev. (Amtrak Project), “A”, 3%, 11/01/18 | | | 265,000 | | | | 273,212 | |
| Pennsylvania Economic Development Financing Authority, Exempt Facilities Rev. (Amtrak Project), “A”, 5%, 11/01/19 | | | 1,325,000 | | | | 1,496,813 | |
33
Portfolio of Investments – continued
| | | | | | | | |
| Issuer | | Shares/Par | | | Value ($) | |
| | | | | | | | |
| Municipal Bonds - continued | | | | | | | | |
| Pennsylvania - continued | | | | | | | | |
| Pennsylvania Higher Educational Facilities Authority Rev. (Drexel University), 5%, 5/01/17 | | $ | 1,000,000 | | | $ | 1,104,710 | |
| Pennsylvania Higher Educational Facilities Authority Rev. (Edinboro University Foundation), 5%, 7/01/17 | | | 825,000 | | | | 851,408 | |
| Pennsylvania Higher Educational Facilities Authority Rev. (Edinboro University Foundation), 5%, 7/01/18 | | | 1,005,000 | | | | 1,036,085 | |
| Pennsylvania Higher Educational Facilities Authority Rev. (Temple University), 3%, 4/01/15 | | | 500,000 | | | | 512,660 | |
| Pennsylvania Higher Educational Facilities Authority Rev. (Temple University), 4%, 4/01/16 | | | 350,000 | | | | 373,895 | |
| Pennsylvania Higher Educational Facilities Authority Rev. (Temple University), 4%, 4/01/17 | | | 500,000 | | | | 542,695 | |
| Pennsylvania Industrial Development Authority Rev. (Economic Development), 5%, 7/01/16 | | | 2,000,000 | | | | 2,180,040 | |
| Philadelphia, PA, Airport Rev., “B”, AGM, 5%, 6/15/16 | | | 1,265,000 | | | | 1,374,321 | |
| Philadelphia, PA, Redevelopment Authority Rev. (Transformation Initiative), 3%, 4/15/15 | | | 1,000,000 | | | | 1,019,420 | |
| Philadelphia, PA, Redevelopment Authority Rev. (Transformation Initiative), 5%, 4/15/15 | | | 730,000 | | | | 757,871 | |
| Philadelphia, PA, Water & Wastewater Rev., “A”, 5%, 7/01/16 | | | 375,000 | | | | 411,218 | |
| Philadelphia, PA, Water & Wastewater Rev., “A”, 5%, 7/01/22 | | | 1,510,000 | | | | 1,778,372 | |
| Pittsburgh, PA, “N”, AGM, 5.25%, 9/01/15 | | | 1,000,000 | | | | 1,061,690 | |
| Southcentral, PA, General Authority Hospital Rev. (Hanover Hospital, Inc.), 5%, 12/01/18 | | | 1,330,000 | | | | 1,455,924 | |
| | | | | | | | |
| | | | | | | $ | 65,427,754 | |
| Puerto Rico - 0.3% | | | | | | | | |
| Commonwealth of Puerto Rico Aqueduct & Sewer Authority Rev., “A”, 5%, 7/01/17 | | $ | 1,000,000 | | | $ | 867,360 | |
Puerto Rico Industrial, Tourist, Educational, Medical, & Environmental Control Facilities Financing Authority, Higher Education Rev. (Ana G. Mendez University System Project),
5%, 4/01/17 | | | 340,000 | | | | 349,132 | |
Puerto Rico Industrial, Tourist, Educational, Medical, & Environmental Control Facilities Financing Authority, Higher Education Rev. (Ana G. Mendez University System Project),
5%, 4/01/18 | | | 220,000 | | | | 225,553 | |
Puerto Rico Industrial, Tourist, Educational, Medical, & Environmental Control Facilities Financing Authority, Higher Education Rev. (Ana G. Mendez University System Project),
4%, 4/01/20 | | | 110,000 | | | | 105,136 | |
Puerto Rico Industrial, Tourist, Educational, Medical, & Environmental Control Facilities Financing Authority, Higher Education Rev. (Ana G. Mendez University System Project),
5%, 4/01/21 | | | 380,000 | | | | 376,922 | |
34
Portfolio of Investments – continued
| | | | | | | | |
| Issuer | | Shares/Par | | | Value ($) | |
| | | | | | | | |
| Municipal Bonds - continued | | | | | | | | |
| Puerto Rico - continued | | | | | | | | |
| Puerto Rico Industrial, Tourist, Educational, Medical, & Environmental Control Facilities Financing Authority, Higher Education Rev. (Ana G. Mendez University System Project), 5%, 4/01/22 | | $ | 295,000 | | | $ | 287,917 | |
| Puerto Rico Industrial, Tourist, Educational, Medical, & Environmental Control Facilities Financing Authority, Higher Education Rev. (International American University of Puerto Rico Project), 4%, 10/01/14 | | | 1,000,000 | | | | 1,006,960 | |
| Puerto Rico Sales Tax Financing Corp., Sales Tax Rev., “C”, 5%, 8/01/22 | | | 1,500,000 | | | | 1,498,875 | |
| | | | | | | | |
| | | | | | | $ | 4,717,855 | |
| Rhode Island - 1.3% | | | | | | | | |
| Providence, RI , “A”, 5%, 1/15/20 | | $ | 1,625,000 | | | $ | 1,850,420 | |
| Providence, RI , “A”, 5%, 1/15/21 | | | 1,000,000 | | | | 1,131,450 | |
| Rhode Island Health & Educational Building Corp Rev., “A”, 5%, 5/15/19 | | | 2,000,000 | | | | 2,268,200 | |
| Rhode Island Health & Educational Building Corp. Rev, “A”, 5%, 5/15/21 | | | 2,240,000 | | | | 2,555,459 | |
| Rhode Island Student Loan Program Authority Rev., “A”, 3%, 12/01/14 | | | 500,000 | | | | 506,670 | |
| Rhode Island Student Loan Program Authority Rev., “A”, 4%, 12/01/15 | | | 500,000 | | | | 524,465 | |
| Rhode Island Student Loan Program Authority Rev., “A”, 5%, 12/01/16 | | | 500,000 | | | | 547,180 | |
| Rhode Island Student Loan Program Authority Rev., “A”, 2.125%, 12/01/18 | | | 3,200,000 | | | | 3,179,936 | |
| Rhode Island Student Loan Program Authority Rev., “A”, 2.5%, 12/01/19 | | | 4,590,000 | | | | 4,549,792 | |
| Rhode Island Student Loan Program Authority Rev., “A”, 5%, 12/01/20 | | | 2,000,000 | | | | 2,218,060 | |
| | | | | | | | |
| | | | | | | $ | 19,331,632 | |
| South Carolina - 1.0% | | | | | | | | |
| Beaufort County, SC, School District, “B”, 5%, 3/01/17 | | $ | 2,500,000 | | | $ | 2,800,625 | |
| Berkeley County, SC, School District Rev., 5%, 12/01/18 | | | 630,000 | | | | 718,691 | |
| Berkeley County, SC, School District Rev., 5%, 12/01/17 | | | 500,000 | | | | 565,300 | |
| Charleston County, SC, Transportation Sales Tax, 5%, 11/01/22 | | | 3,095,000 | | | | 3,776,086 | |
| Piedmont, SC, Municipal Power Agency Electric Rev., “A-2”, 5%, 1/01/18 | | | 750,000 | | | | 847,598 | |
| Richland County, SC, Environmental Improvement Rev. (International Paper), “A”, 3.875%, 4/01/23 | | | 4,545,000 | | | | 4,667,306 | |
| Richland County, SC, School District No. 1, 4%, 3/01/19 | | | 1,270,000 | | | | 1,424,064 | |
| | | | | | | | |
| | | | | | | $ | 14,799,670 | |
35
Portfolio of Investments – continued
| | | | | | | | |
| Issuer | | Shares/Par | | | Value ($) | |
| | | | | | | | |
| Municipal Bonds - continued | | | | | | | | |
| Tennessee - 2.3% | | | | | | | | |
| Chattanooga, TN, Industrial Development Board, Lease Rental Rev. (Southside Redevelopment Corp.), 5%, 10/01/18 | | $ | 5,120,000 | | | $ | 5,810,842 | |
| Clarksville, TN, Sub Lien Water, Sewer & Gas Rev., 5%, 2/01/18 | | | 1,000,000 | | | | 1,119,800 | |
| Clarksville, TN, Sub Lien Water, Sewer & Gas Rev., 5%, 2/01/19 | | | 920,000 | | | | 1,048,193 | |
| Clarksville, TN, Water, Sewer & Gas Rev., 5%, 2/01/21 | | | 720,000 | | | | 840,204 | |
| Clarksville, TN, Water, Sewer & Gas Rev., 5%, 2/01/22 | | | 1,680,000 | | | | 1,967,347 | |
| Memphis, TN, Electric System Rev., 5%, 12/01/14 | | | 1,500,000 | | | | 1,541,685 | |
| Metropolitan Government of Nashville & Davidson County, TN, “A”, 4%, 7/01/17 | | | 4,000,000 | | | | 4,400,680 | |
| Metropolitan Government of Nashville & Davidson County, TN, Electric System Rev., “B”, 5%, 5/15/21 | | | 7,500,000 | | | | 8,962,875 | |
| Metropolitan Government of Nashville & Davidson County, TN, Health & Educational Facilities Board Rev. (Meharry Medical College), AMBAC, 6%, 12/01/16 | | | 1,970,000 | | | | 2,086,289 | |
| Metropolitan Nashville, TN, Airport Authority Rev., “A”, ASSD GTY, 4.5%, 7/01/14 | | | 1,500,000 | | | | 1,510,740 | |
| Metropolitan Nashville, TN, Airport Authority Rev., “B”, AGM, 4%, 7/01/15 | | | 1,500,000 | | | | 1,551,375 | |
| Nashville & Davidson County, TN, Metropolitan Government Water & Sewer Rev., “A”, AGM, 5%, 1/01/17 | | | 1,000,000 | | | | 1,110,690 | |
| Shelby County, TN, Public Improvement & School, “B”, 5%, 4/01/18 | | | 1,100,000 | | | | 1,264,461 | |
| Sullivan County, TN, Health Educational & Housing Facilities Board Rev. (Wellmont Health System), RADIAN, 5%, 9/01/16 | | | 1,000,000 | | | | 1,001,400 | |
| Tennessee Energy Acquisition Corp., Gas Rev., “A”, 5.25%, 9/01/19 | | | 1,000,000 | | | | 1,131,420 | |
| | | | | | | | |
| | | | | | | $ | 35,348,001 | |
| Texas - 6.5% | | | | | | | | |
| Austin, TX, Convention Center (Convention Enterprises, Inc.), “A”, SYNCORA, 5.25%, 1/01/19 | | $ | 1,000,000 | | | $ | 1,059,080 | |
| Austin, TX, Public Improvement Rev., 5%, 9/01/22 | | | 5,000,000 | | | | 6,093,200 | |
| Bastrop, TX, Independent School District, Capital Appreciation, “N”, PSF, 0%, 2/15/20 | | | 1,000,000 | | | | 798,100 | |
| Brazos River, TX, Authority Rev. (Centerpoint Energy), “B”, FGIC, 4.25%, 12/01/17 | | | 1,260,000 | | | | 1,263,730 | |
| Brownsville, TX, Independent School District, “A”, PSF, 5%, 2/15/21 | | | 6,595,000 | | | | 7,884,586 | |
| Central Texas Regional Mobility Authority Senior Lien Rev., “A”, 5%, 1/01/16 | | | 750,000 | | | | 790,980 | |
| Central Texas Regional Mobility Authority Senior Lien Rev., “A”, 5%, 1/01/17 | | | 450,000 | | | | 486,194 | |
| Conroe, TX, Independent School District, School Building, PSF, 5%, 2/15/16 | | | 750,000 | | | | 812,310 | |
| Corpus Christi, TX, General Improvement, ASSD GTY, 4%, 3/01/17 | | | 2,000,000 | | | | 2,164,780 | |
| Dallas Fort Worth, TX, International Airport Rev., “F”, 5%, 11/01/14 | | | 600,000 | | | | 613,884 | |
| Dallas Fort Worth, TX, International Airport Rev., “F”, 4%, 11/01/15 | | | 300,000 | | | | 316,155 | |
36
Portfolio of Investments – continued
| | | | | | | | |
| Issuer | | Shares/Par | | | Value ($) | |
| | | | | | | | |
| Municipal Bonds - continued | | | | | | | | |
| Texas - continued | | | | | | | | |
| Dallas Fort Worth, TX, International Airport Rev., “F”, 4%, 11/01/18 | | $ | 5,415,000 | | | $ | 5,970,796 | |
| Dallas, TX, Independent School District, PSF, 4%, 2/15/15 | | | 2,000,000 | | | | 2,059,980 | |
| Dallas, TX, Independent School District, PSF, 5%, 2/15/15 | | | 2,500,000 | | | | 2,594,400 | |
| Dallas, TX, Independent School District, PSF, 5.25%, 2/15/18 | | | 795,000 | | | | 921,222 | |
| Dallas, TX, Waterworks & Sewer Systems Rev., 3%, 10/01/17 | | | 1,000,000 | | | | 1,074,110 | |
| Ennis, TX, Independent School District, Capital Appreciation, “N”, PSF, 0%, 8/15/21 | | | 2,865,000 | | | | 2,155,311 | |
| Fort Worth, TX, Water & Sewer Rev., Refunding & Improvement, 5%, 2/15/20 | | | 2,940,000 | | | | 3,487,693 | |
| Grand Parkway Transportation Corp, TX, System Subordinate Tier Toll Rev., Refunding & Anticipation Notes, “A”, 3%, 12/15/16 | | | 6,000,000 | | | | 6,369,300 | |
| Harris County, TX, Cultural Education Facilities Finance Corp. Rev. (YMCA Greater Houston Area), “A”, 5%, 6/01/16 | | | 360,000 | | | | 381,809 | |
| Harris County, TX, Cultural Education Facilities Finance Corp. Rev. (YMCA Greater Houston Area), “A”, 5%, 6/01/17 | | | 400,000 | | | | 431,852 | |
| Harris County, TX, Cultural Education Facilities Finance Corp. Rev. (YMCA Greater Houston Area), “A”, 5%, 6/01/18 | | | 430,000 | | | | 469,801 | |
| Harris County, TX, Cultural Education Facilities Finance Corp., Medical Facilities Rev. (Baylor College Medicine), “D”, 5%, 11/15/16 | | | 750,000 | | | | 818,783 | |
| Harris County, TX, Cultural Education Facilities Finance Corp., Medical Facilities Rev. (Baylor College Medicine), “D”, 5%, 11/15/18 | | | 470,000 | | | | 526,630 | |
| Harris County, TX, Cultural Education Facilities Finance Corp., Medical Facilities Rev. (Baylor College Medicine), “D”, 5%, 11/15/19 | | | 600,000 | | | | 665,190 | |
| Harris County, TX, Cultural Education Facilities Finance Corp., Thermal Utilities Rev. (Teco Project), “A”, 5%, 11/15/14 | | | 1,000,000 | | | | 1,025,520 | |
| Houston, TX, Airport System Rev., “B”, 5%, 7/01/20 | | | 1,000,000 | | | | 1,147,930 | |
| Houston, TX, Airport System Rev., Subordinate Lien, “A”, 5%, 7/01/16 | | | 1,020,000 | | | | 1,112,279 | |
| Houston, TX, Independent School District, AGM, 5%, 7/15/15 | | | 1,120,000 | | | | 1,179,942 | |
| Houston, TX, Utilities Systems Rev., NATL, 5.25%, 5/15/14 | | | 1,485,000 | | | | 1,487,940 | |
| Klein, TX, Independent School District, “A”, PSF, 5%, 8/01/21 | | | 1,000,000 | | | | 1,155,230 | |
| Leander, TX, Independent School District, School Refunding, “A”, PSF, 5%, 8/15/16 | | | 6,145,000 | | | | 6,779,348 | |
| Lone Star College System, TX, “A”, 5%, 8/15/18 | | | 4,250,000 | | | | 4,913,680 | |
| Lubbock, TX, Health Facilities Development Rev. (St. Joseph Health System), “A”, 1.125%, 7/01/30 (b) | | | 5,810,000 | | | | 5,784,146 | |
| Pflugerville, TX, Independent School District, PSF, 5%, 2/15/24 | | | 1,000,000 | | | | 1,098,010 | |
| Plano, TX, Independent School District, “A”, 5%, 2/15/17 | | | 1,000,000 | | | | 1,112,800 | |
| Sam Rayburn, TX, Municipal Power Agency, Power Supply System Rev., 5%, 10/01/14 | | | 1,000,000 | | | | 1,018,290 | |
| San Leanna, TX, Educational Facilities Corp., Higher Education Rev. (St. Edwards University), 5%, 6/01/19 | | | 1,250,000 | | | | 1,324,713 | |
| San Marcos, TX, Consolidated Independent School District, PSF, 5.25%, 8/01/14 (c) | | | 1,000,000 | | | | 1,012,300 | |
37
Portfolio of Investments – continued
| | | | | | | | |
| Issuer | | Shares/Par | | | Value ($) | |
| | | | | | | | |
| Municipal Bonds - continued | | | | | | | | |
| Texas - continued | | | | | | | | |
| Tarrant County, TX, 5%, 7/15/18 | | $ | 2,770,000 | | | $ | 3,204,198 | |
| Tarrant County, TX, Cultural Education Facilities Finance Corp. (Buckner Retirement), 5%, 11/15/16 | | | 500,000 | | | | 528,290 | |
| Tarrant County, TX, Cultural Education Facilities Finance Corp. Hospital Rev. (Scott & White Healthcare Project), “A”, 5%, 8/15/18 | | | 500,000 | | | | 567,345 | |
| Tarrant County, TX, Cultural Education Facilities Finance Corp. Hospital Rev. (Scott & White Healthcare Project), “A”, 5%, 8/15/22 | | | 1,160,000 | | | | 1,327,980 | |
| Tarrant County, TX, Cultural Education Facilities Finance Corp. Retirement Facility (Air Force Village Foundation, Inc.), 5.75%, 11/15/19 | | | 850,000 | | | | 945,353 | |
| Tarrant County, TX, Cultural Education Facilities Finance Corp. Rev. (Texas Health Resources), 5%, 2/15/19 | | | 500,000 | | | | 549,435 | |
| Texas Municipal Gas Acquisition & Supply Corp. III, Gas Supply Rev., 5%, 12/15/19 | | | 5,000,000 | | | | 5,608,750 | |
| Texas Tech University Rev., Refunding & Improvement, “A”, 4.25%, 8/15/21 | | | 2,000,000 | | | | 2,271,400 | |
| University of Texas, Permanent University Fund, “B”, 5%, 7/01/14 (c) | | | 2,000,000 | | | | 2,015,240 | |
| University of Texas, Permanent University Fund, “C”, 5%, 7/01/21 | | | 1,000,000 | | | | 1,085,970 | |
| | | | | | | | |
| | | | | | | $ | 98,465,965 | |
| U.S. Virgin Islands - 0.1% | | | | | | | | |
| Virgin Islands Public Finance Authority Rev., Matching Fund Loan Note, “B”, 3%, 10/01/15 | | $ | 1,750,000 | | | $ | 1,798,475 | |
| | |
| Utah - 0.7% | | | | | | | | |
| Intermountain Power Agency, UT, Power Supply Rev., “A”, 5%, 7/01/22 | | $ | 750,000 | | | $ | 845,663 | |
| State of Utah, “C”, 5%, 7/01/15 | | | 3,000,000 | | | | 3,166,830 | |
| Utah Board of Regents Auxiliary & Campus Facilities System Rev., “A”, NATL, 5%, 4/01/18 | | | 1,090,000 | | | | 1,137,513 | |
| Utah Board of Regents Student Loan Rev., “EE-2”, 5%, 11/01/17 | | | 5,000,000 | | | | 5,718,900 | |
| | | | | | | | |
| | | | | | | $ | 10,868,906 | |
| Virginia - 3.5% | | | | | | | | |
| Commonwealth of Virginia, Transportation Board Grant Anticipation Rev., 5%, 9/15/18 | | $ | 500,000 | | | $ | 581,645 | |
| Commonwealth of Virginia, Transportation Board Grant Anticipation Rev., A”, 5%, 3/15/18 | | | 6,825,000 | | | | 7,828,412 | |
| Commonwealth of Virginia, Transportation Board Rev., Capital Projects, 5%, 5/15/20 | | | 2,175,000 | | | | 2,584,553 | |
| Fairfax County, VA, Public Improvement Rev., “A”, 4%, 10/01/16 | | | 21,060,000 | | | | 22,851,995 | |
| Louisa, VA, Industrial Development Authority, Pollution Control Rev. (VEPCO), “C”, 1.5%, 11/01/35 (b) | | | 2,000,000 | | | | 2,006,480 | |
38
Portfolio of Investments – continued
| | | | | | | | |
| Issuer | | Shares/Par | | | Value ($) | |
| | | | | | | | |
| Municipal Bonds - continued | | | | | | | | |
| Virginia - continued | | | | | | | | |
| Portsmouth, VA, Refunding and Public Improvement, “A”, 5%, 2/01/21 | | $ | 1,375,000 | | | $ | 1,630,956 | |
| Richmond, VA, Public Improvement Rev., “A”, 5%, 3/01/22 | | | 5,370,000 | | | | 6,487,819 | |
| Virginia Housing Development Authority, Commonwealth Mortgage, “A-5”, 4.4%, 1/01/15 | | | 230,000 | | | | 234,073 | |
| Virginia Housing Development Authority, Commonwealth Mortgage, “A-5”, 4.4%, 7/01/15 | | | 295,000 | | | | 304,104 | |
| Virginia Public Building Authority, Public Facilities Rev., “A”, 5%, 8/01/16 | | | 1,250,000 | | | | 1,375,663 | |
| Virginia Public School Authority, “C”, 5%, 8/01/18 | | | 1,000,000 | | | | 1,160,170 | |
| Virginia Resources Authority, Clean Water Rev., 5%, 10/01/17 (c) | | | 1,980,000 | | | | 2,270,347 | |
| Washington County, VA, Hospital Facilities Industrial Development Authority Rev. (Mountain States Health Alliance), “C”, 7.25%, 7/01/19 | | | 1,165,000 | | | | 1,258,654 | |
| York County, VA, Economic Development Authority Pollution Control Rev. (Virginia Electric & Power Co.), “A”, 1.875%, 5/01/33 (b) | | | 2,300,000 | | | | 2,300,000 | |
| | | | | | | | |
| | | | | | | $ | 52,874,871 | |
| Washington - 5.6% | | | | | | | | |
| Energy Northwest, WA, Wind Project Rev. , 4%, 7/01/15 | | $ | 1,000,000 | | | $ | 1,041,700 | |
| Energy Northwest, WA, Wind Project Rev. , 5%, 7/01/18 | | | 1,400,000 | | | | 1,586,382 | |
| Energy Northwest, WA, Wind Project Rev. , 5%, 7/01/19 | | | 2,025,000 | | | | 2,311,538 | |
| Energy Northwest, WA, Wind Project Rev. , 5%, 7/01/20 | | | 2,230,000 | | | | 2,558,501 | |
| Energy Northwest, WA, Wind Project Rev. , 5%, 7/01/21 | | | 2,455,000 | | | | 2,821,802 | |
| Energy Northwest, WA, Wind Project Rev. , 5%, 7/01/22 | | | 2,000,000 | | | | 2,296,760 | |
| Energy Northwest, WA, Wind Project Rev. , 5%, 7/01/23 | | | 1,500,000 | | | | 1,721,730 | |
| Pierce County, WA, “A”, 5%, 7/01/22 | | | 3,290,000 | | | | 3,914,705 | |
| Port of Seattle, WA, Rev., “B”, 3%, 8/01/15 | | | 2,285,000 | | | | 2,358,349 | |
| Port of Seattle, WA, Special Facilities Rev. (Seatac Fuel Facilities LLC), 5%, 6/01/19 | | | 700,000 | | | | 797,538 | |
| Port of Seattle, WA, Special Facilities Rev. (Seatac Fuel Facilities LLC), 5%, 6/01/20 | | | 1,175,000 | | | | 1,341,650 | |
| Port of Seattle, WA, Special Facilities Rev. (Seatac Fuel Facilities LLC), 5%, 6/01/22 | | | 1,740,000 | | | | 1,997,207 | |
| Seattle, WA, 5%, 5/01/16 | | | 3,780,000 | | | | 4,108,331 | |
| Seattle, WA, Municipal Light & Power Rev., “B”, 5%, 2/01/18 | | | 4,000,000 | | | | 4,579,320 | |
| Skagit County, WA, Public Hospital District No. 001 Rev. (Skagit Valley Hospital), 5.375%, 12/01/22 | | | 870,000 | | | | 892,707 | |
| State of Washington, 5%, 7/01/15 | | | 3,540,000 | | | | 3,736,435 | |
| State of Washington, “A”, AGM, 5%, 7/01/15 (c) | | | 9,025,000 | | | | 9,524,714 | |
| State of Washington, Various Purposes, “R-A”, 5%, 7/01/15 | | | 3,000,000 | | | | 3,166,470 | |
| Washington Health Care Facilities Authority Rev. (Central Washington Health), 6%, 7/01/15 | | | 1,900,000 | | | | 1,988,787 | |
39
Portfolio of Investments – continued
| | | | | | | | |
| Issuer | | Shares/Par | | | Value ($) | |
| | | | | | | | |
| Municipal Bonds - continued | | | | | | | | |
| Washington - continued | | | | | | | | |
| Washington Health Care Facilities Authority Rev. (Providence Health & Services), “B”, 5%, 10/01/42 (b) | | $ | 1,000,000 | | | $ | 1,174,680 | |
| Washington Housing Finance Commission Nonprofit Housing Rev. (Emerald Heights Project), 3%, 7/01/17 | | | 1,030,000 | | | | 1,045,203 | |
| Washington Housing Finance Commission Nonprofit Housing Rev. (Emerald Heights Project), 5%, 7/01/20 | | | 1,175,000 | | | | 1,297,799 | |
| Washington Motor Vehicle Fuel Tax, “E”, 6%, 2/01/15 | | | 5,575,000 | | | | 5,815,729 | |
| Washington Motor Vehicle Fuel Tax, “E”, 6%, 2/01/16 | | | 2,760,000 | | | | 3,031,612 | |
| Washington Motor Vehicle Fuel Tax, “E”, 5%, 2/01/20 | | | 7,070,000 | | | | 8,387,141 | |
| Washington Motor Vehicle Fuel Tax, “E”, 5%, 2/01/21 | | | 7,420,000 | | | | 8,883,818 | |
| Yakima County, WA, “A”, AGM, 4%, 12/01/17 | | | 2,300,000 | | | | 2,538,970 | |
| | | | | | | | |
| | | | | | | $ | 84,919,578 | |
| West Virginia - 0.5% | | | | | | | | |
| Mason County, WV, Pollution Control Rev. (Appalachian Power Co.), “L”, 2%, 10/01/22 (b) | | $ | 3,000,000 | | | $ | 3,014,670 | |
| West Virginia Housing Development Fund, “B”, 1.6%, 11/01/14 | | | 2,000,000 | | | | 2,005,260 | |
| West Virginia Housing Development Fund, “B”, 2%, 5/01/15 | | | 1,085,000 | | | | 1,092,118 | |
| West Virginia Housing Development Fund, “B”, 2.1%, 11/01/15 | | | 1,750,000 | | | | 1,767,203 | |
| | | | | | | | |
| | | | | | | $ | 7,879,251 | |
| Wisconsin - 2.1% | | | | | | | | |
| Wisconsin General Obligation, “A”, 5%, 5/01/18 | | $ | 10,100,000 | | | $ | 11,675,903 | |
| Wisconsin Health & Educational Facilities Authority Rev. (Ascension Health Alliance Senior Credit Group), “B”, 5%, 11/15/43 (b) | | | 5,000,000 | | | | 5,781,050 | |
| Wisconsin Health & Educational Facilities Authority Rev. (Aurora Healthcare, Inc.), “A”, 5%, 7/15/22 | | | 6,000,000 | | | | 6,791,820 | |
| Wisconsin Health & Educational Facilities Authority Rev. (Wheaton Franciscan Healthcare), 5%, 8/15/14 | | | 1,100,000 | | | | 1,113,057 | |
| Wisconsin Health & Educational Facilities Authority Rev. (Wheaton Franciscan Healthcare), 5.25%, 8/15/18 | | | 1,500,000 | | | | 1,617,915 | |
| Wisconsin Public Finance Authority, Airport Facilities Rev. (Transportation Infrastructure Properties LLC), “B”, 5%, 7/01/22 | | | 4,165,000 | | | | 4,614,070 | |
| | | | | | | | |
| | | | | | | $ | 31,593,815 | |
| Total Municipal Bonds (Identified Cost, $1,453,969,834) | | | $ | 1,485,098,855 | |
| | |
| Money Market Funds - 0.8% | | | | | | | | |
MFS Institutional Money Market Portfolio, 0.09%,
at Cost and Net Asset Value (v) | | | 12,945,371 | | | $ | 12,945,371 | |
| Total Investments (Identified Cost, $1,466,915,205) | | | | | | $ | 1,498,044,226 | |
| | |
| Other Assets, Less Liabilities - 1.1% | | | | | | | 16,300,646 | |
| Net Assets - 100.0% | | | | | | $ | 1,514,344,872 | |
40
Portfolio of Investments – continued
| (b) | Mandatory tender date is earlier than stated maturity date. |
| (v) | Underlying affiliated fund that is available only to investment companies managed by MFS. The rate quoted for the MFS Institutional Money Market Portfolio is the annualized seven-day yield of the fund at period end. |
The following abbreviations are used in this report and are defined:
| FRN | | Floating Rate Note. Interest rate resets periodically and may not be the rate reported at period end. |
| | |
| Insurers | | |
| AGM | | Assured Guaranty Municipal |
| AMBAC | | AMBAC Indemnity Corp. |
| ASSD GTY | | Assured Guaranty Insurance Co. |
| FGIC | | Financial Guaranty Insurance Co. |
| GNMA | | Government National Mortgage Assn. |
| NATL | | National Public Finance Guarantee Corp. |
| PSF | | Permanent School Fund |
| RADIAN | | Radian Asset Assurance, Inc. |
| SYNCORA | | Syncora Guarantee Inc. |
See Notes to Financial Statements
41
Financial Statements
STATEMENT OF ASSETS AND LIABILITIES
At 4/30/14
This statement represents your fund’s balance sheet, which details the assets and liabilities comprising the total value of the fund.
| | | | |
| Assets | | | | |
Investments- | | | | |
Non-affiliated issuers, at value (identified cost, $1,453,969,834) | | | $1,485,098,855 | |
Underlying affiliated funds, at cost and value | | | 12,945,371 | |
Total investments, at value (identified cost, $1,466,915,205) | | | $1,498,044,226 | |
Receivables for | | | | |
Investments sold | | | 8,343,030 | |
Fund shares sold | | | 7,649,929 | |
Interest and dividends | | | 17,658,012 | |
Other assets | | | 5,629 | |
Total assets | | | $1,531,700,826 | |
| Liabilities | | | | |
Payables for | | | | |
Distributions | | | $372,091 | |
Investments purchased | | | 12,641,300 | |
Fund shares reacquired | | | 3,451,603 | |
Payable to affiliates | | | | |
Investment adviser | | | 27,863 | |
Shareholder servicing costs | | | 676,769 | |
Distribution and service fees | | | 14,016 | |
Payable for independent Trustees’ compensation | | | 3,065 | |
Accrued expenses and other liabilities | | | 169,247 | |
Total liabilities | | | $17,355,954 | |
Net assets | | | $1,514,344,872 | |
| Net assets consist of | | | | |
Paid-in capital | | | $1,491,280,136 | |
Unrealized appreciation (depreciation) on investments | | | 31,129,021 | |
Accumulated net realized gain (loss) on investments | | | (7,091,993 | ) |
Accumulated distributions in excess of net investment income | | | (972,292 | ) |
Net assets | | | $1,514,344,872 | |
Shares of beneficial interest outstanding | | | 186,333,200 | |
| | | | | | | | | | | | |
| | | Net assets | | | Shares
outstanding | | | Net asset value
per share (a) | |
Class A | | | $685,308,889 | | | | 84,293,757 | | | | $8.13 | |
Class B | | | 1,971,550 | | | | 242,759 | | | | 8.12 | |
Class C | | | 148,207,003 | | | | 18,219,257 | | | | 8.13 | |
Class I | | | 678,857,430 | | | | 83,577,427 | | | | 8.12 | |
| (a) | Maximum offering price per share was equal to the net asset value per share for all share classes, except for Class A, for which the maximum offering price per share was $8.34 [100 / 97.5 x $8.13]. On sales of $50,000 or more, the maximum offering price of Class A shares is reduced. A contingent deferred sales charge may be imposed on redemptions of Class A, Class B, and Class C shares. Redemption price per share was equal to the net asset value per share for Class I. |
See Notes to Financial Statements
42
Financial Statements
STATEMENT OF OPERATIONS
Year ended 4/30/14
This statement describes how much your fund earned in investment income and accrued in expenses. It also describes any gains and/or losses generated by fund operations.
| | | | |
| Net investment income | |
Income | | | | |
Interest | | | $33,675,392 | |
Dividends from underlying affiliated funds | | | 55,232 | |
Total investment income | | | $33,730,624 | |
Expenses | | | | |
Management fee | | | $5,545,332 | |
Distribution and service fees | | | 3,444,571 | |
Shareholder servicing costs | | | 1,154,976 | |
Administrative services fee | | | 175,508 | |
Independent Trustees’ compensation | | | 25,410 | |
Custodian fee | | | 183,363 | |
Shareholder communications | | | 60,686 | |
Audit and tax fees | | | 52,048 | |
Legal fees | | | 16,103 | |
Miscellaneous | | | 307,384 | |
Total expenses | | | $10,965,381 | |
Fees paid indirectly | | | (11 | ) |
Reduction of expenses by investment adviser and distributor | | | (747,045 | ) |
Net expenses | | | $10,218,325 | |
Net investment income | | | $23,512,299 | |
| Realized and unrealized gain (loss) on investments | | | | |
Realized gain (loss) on investments (identified cost basis) | | | $(10,241,072 | ) |
Change in unrealized appreciation (depreciation) on investments | | | $(11,830,077 | ) |
Net realized and unrealized gain (loss) on investments | | | $(22,071,149 | ) |
Change in net assets from operations | | | $1,441,150 | |
See Notes to Financial Statements
43
Financial Statements
STATEMENTS OF CHANGES IN NET ASSETS
These statements describe the increases and/or decreases in net assets resulting from operations, any distributions, and any shareholder transactions.
| | | | | | | | |
| | | Years ended 4/30 | |
| | | 2014 | | | 2013 | |
| Change in net assets | | | | | | |
| From operations | | | | | | | | |
Net investment income | | | $23,512,299 | | | | $20,833,219 | |
Net realized gain (loss) on investments | | | (10,241,072 | ) | | | 453,859 | |
Net unrealized gain (loss) on investments | | | (11,830,077 | ) | | | 3,522,025 | |
Change in net assets from operations | | | $1,441,150 | | | | $24,809,103 | |
| Distributions declared to shareholders | | | | | | | | |
From net investment income | | | $(22,848,767 | ) | | | $(19,245,199 | ) |
Change in net assets from fund share transactions | | | $242,721,327 | | | | $367,302,685 | |
Total change in net assets | | | $221,313,710 | | | | $372,866,589 | |
| Net assets | | | | | | | | |
At beginning of period | | | 1,293,031,162 | | | | 920,164,573 | |
At end of period (including accumulated distributions in excess of net investment income of $972,292 and $185,123, respectively) | | | $1,514,344,872 | | | | $1,293,031,162 | |
See Notes to Financial Statements
44
Financial Statements
FINANCIAL HIGHLIGHTS
The financial highlights table is intended to help you understand the fund’s financial performance for the past 5 years (or life of a particular share class, if shorter). Certain information reflects financial results for a single fund share. The total returns in the table represent the rate by which an investor would have earned (or lost) on an investment in the fund share class (assuming reinvestment of all distributions) held for the entire period.
| | | | | | | | | | | | | | | | | | | | |
| Class A | | Years ended 4/30 | |
| | | 2014 | | | 2013 | | | 2012 | | | 2011 | | | 2010 | |
Net asset value, beginning of period | | | $8.28 | | | | $8.23 | | | | $7.93 | | | | $7.93 | | | | $7.71 | |
| Income (loss) from investment operations | | | | | | | | | | | | | | | | | |
Net investment income (d) | | | $0.14 | | | | $0.17 | | | | $0.19 | | | | $0.19 | | | | $0.22 | |
Net realized and unrealized gain (loss)
on investments | | | (0.15 | ) | | | 0.03 | | | | 0.30 | | | | (0.00 | )(w) | | | 0.22 | |
Total from investment operations | | | $(0.01 | ) | | | $0.20 | | | | $0.49 | | | | $0.19 | | | | $0.44 | |
| Less distributions declared to shareholders | | | | | | | | | | | | | | | | | |
From net investment income | | | $(0.14 | ) | | | $(0.15 | ) | | | $(0.19 | ) | | | $(0.19 | ) | | | $(0.22 | ) |
Net asset value, end of period (x) | | | $8.13 | | | | $8.28 | | | | $8.23 | | | | $7.93 | | | | $7.93 | |
Total return (%) (r)(s)(t)(x) | | | (0.13 | ) | | | 2.51 | | | | 6.20 | | | | 2.41 | | | | 5.80 | |
Ratios (%) (to average net assets)
and Supplemental data: | | | | | | | | | | | | | | | | | |
Expenses before expense reductions (f) | | | 0.79 | | | | 0.81 | | | | 0.80 | | | | 0.81 | | | | 0.80 | |
Expenses after expense reductions (f) | | | 0.69 | | | | 0.70 | | | | 0.70 | | | | 0.70 | | | | 0.70 | |
Net investment income | | | 1.75 | | | | 2.00 | | | | 2.33 | | | | 2.41 | | | | 2.84 | |
Portfolio turnover | | | 34 | | | | 11 | | | | 17 | | | | 9 | | | | 8 | |
Net assets at end of period (000 omitted) | | | $685,309 | | | | $737,158 | | | | $563,330 | | | | $589,476 | | | | $482,962 | |
See Notes to Financial Statements
45
Financial Highlights – continued
| | | | | | | | | | | | | | | | | | | | |
| Class B | | Years ended 4/30 | |
| | | 2014 | | | 2013 | | | 2012 | | | 2011 | | | 2010 | |
Net asset value, beginning of period | | | $8.27 | | | | $8.22 | | | | $7.92 | | | | $7.92 | | | | $7.70 | |
| Income (loss) from investment operations | | | | | | | | | | | | | | | | | |
Net investment income (d) | | | $0.08 | | | | $0.11 | | | | $0.13 | | | | $0.13 | | | | $0.17 | |
Net realized and unrealized gain (loss)
on investments | | | (0.15 | ) | | | 0.03 | | | | 0.30 | | | | (0.00 | )(w) | | | 0.21 | |
Total from investment operations | | | $(0.07 | ) | | | $0.14 | | | | $0.43 | | | | $0.13 | | | | $0.38 | |
| Less distributions declared to shareholders | | | | | | | | | | | | | | | | | |
From net investment income | | | $(0.08 | ) | | | $(0.09 | ) | | | $(0.13 | ) | | | $(0.13 | ) | | | $(0.16 | ) |
Net asset value, end of period (x) | | | $8.12 | | | | $8.27 | | | | $8.22 | | | | $7.92 | | | | $7.92 | |
Total return (%) (r)(s)(t)(x) | | | (0.86 | ) | | | 1.75 | | | | 5.42 | | | | 1.65 | | | | 5.03 | |
Ratios (%) (to average net assets)
and Supplemental data: | | | | | | | | | | | | | | | | | |
Expenses before expense reductions (f) | | | 1.55 | | | | 1.55 | | | | 1.55 | | | | 1.55 | | | | 1.54 | |
Expenses after expense reductions (f) | | | 1.44 | | | | 1.45 | | | | 1.45 | | | | 1.46 | | | | 1.46 | |
Net investment income | | | 1.01 | | | | 1.29 | | | | 1.60 | | | | 1.68 | | | | 2.19 | |
Portfolio turnover | | | 34 | | | | 11 | | | | 17 | | | | 9 | | | | 8 | |
Net assets at end of period (000 omitted) | | | $1,972 | | | | $1,394 | | | | $1,856 | | | | $3,312 | | | | $6,231 | |
| |
| Class C | | Years ended 4/30 | |
| | | 2014 | | | 2013 | | | 2012 | | | 2011 | | | 2010 | |
Net asset value, beginning of period | | | $8.28 | | | | $8.24 | | | | $7.94 | | | | $7.93 | | | | $7.71 | |
| Income (loss) from investment operations | | | | | | | | | | | | | | | | | |
Net investment income (d) | | | $0.07 | | | | $0.10 | | | | $0.12 | | | | $0.12 | | | | $0.16 | |
Net realized and unrealized gain (loss)
on investments | | | (0.15 | ) | | | 0.02 | (g) | | | 0.30 | | | | 0.01 | (g) | | | 0.21 | |
Total from investment operations | | | $(0.08 | ) | | | $0.12 | | | | $0.42 | | | | $0.13 | | | | $0.37 | |
| Less distributions declared to shareholders | | | | | | | | | | | | | | | | | |
From net investment income | | | $(0.07 | ) | | | $(0.08 | ) | | | $(0.12 | ) | | | $(0.12 | ) | | | $(0.15 | ) |
Net asset value, end of period (x) | | | $8.13 | | | | $8.28 | | | | $8.24 | | | | $7.94 | | | | $7.93 | |
Total return (%) (r)(s)(t)(x) | | | (0.97 | ) | | | 1.52 | | | | 5.29 | | | | 1.67 | | | | 4.90 | |
Ratios (%) (to average net assets)
and Supplemental data: | | | | | | | | | | | | | | | | | |
Expenses before expense reductions (f) | | | 1.54 | | | | 1.55 | | | | 1.55 | | | | 1.55 | | | | 1.57 | |
Expenses after expense reductions (f) | | | 1.54 | | | | 1.55 | | | | 1.55 | | | | 1.55 | | | | 1.55 | |
Net investment income | | | 0.91 | | | | 1.16 | | | | 1.47 | | | | 1.56 | | | | 1.98 | |
Portfolio turnover | | | 34 | | | | 11 | | | | 17 | | | | 9 | | | | 8 | |
Net assets at end of period (000 omitted) | | | $148,207 | | | | $183,295 | | | | $150,584 | | | | $121,803 | | | | $111,259 | |
See Notes to Financial Statements
46
Financial Highlights – continued
| | | | | | | | | | | | | | | | |
| Class I | | Years ended 4/30 | |
| | | 2014 | | | 2013 | | | 2012 | | | 2011 (i) | |
Net asset value, beginning of period | | | $8.27 | | | | $8.23 | | | | $7.93 | | | | $8.09 | |
| Income (loss) from investment operations | | | | | | | | | | | | | |
Net investment income (d) | | | $0.15 | | | | $0.18 | | | | $0.20 | | | | $0.13 | |
Net realized and unrealized gain (loss)
on investments | | | (0.15 | ) | | | 0.03 | | | | 0.30 | | | | (0.16 | )(g) |
Total from investment operations | | | $0.00 | | | | $0.21 | | | | $0.50 | | | | $(0.03 | ) |
| Less distributions declared to shareholders | | | | | | | | | | | | | |
From net investment income | | | $(0.15 | ) | | | $(0.17 | ) | | | $(0.20 | ) | | | $(0.13 | ) |
Net asset value, end of period (x) | | | $8.12 | | | | $8.27 | | | | $8.23 | | | | $7.93 | |
Total return (%) (r)(s)(x) | | | 0.02 | | | | 2.54 | | | | 6.35 | | | | (0.32 | )(n) |
Ratios (%) (to average net assets)
and Supplemental data: | | | | | | | | | | | | | |
Expenses before expense reductions (f) | | | 0.54 | | | | 0.56 | | | | 0.54 | | | | 0.56 | (a) |
Expenses after expense reductions (f) | | | 0.54 | | | | 0.55 | | | | 0.54 | | | | 0.53 | (a) |
Net investment income | | | 1.88 | | | | 2.14 | | | | 2.40 | | | | 2.55 | (a) |
Portfolio turnover | | | 34 | | | | 11 | | | | 17 | | | | 9 | |
Net assets at end of period (000 omitted) | | | $678,857 | | | | $371,184 | | | | $204,394 | | | | $14,138 | |
| (d) | Per share data is based on average shares outstanding. |
| (f) | Ratios do not reflect reductions from fees paid indirectly, if applicable. |
| (g) | The per share amount varies from the net realized and unrealized gain/loss for the period because of the timing of sales of fund shares and the per share amount of realized and unrealized gains and losses at such time. |
| (i) | For the period from the class inception, August 30, 2010, through the stated period end. |
| (r) | Certain expenses have been reduced without which performance would have been lower. |
| (s) | From time to time the fund may receive proceeds from litigation settlements, without which performance would be lower. |
| (t) | Total returns do not include any applicable sales charges. |
| (w) | Per share amount was less than $0.01. |
| (x) | The net asset values per share and total returns have been calculated on net asset values which include adjustments made in accordance with the U.S. generally accepted accounting principles required at period end for financial reporting purposes. |
See Notes to Financial Statements
47
NOTES TO FINANCIAL STATEMENTS
(1) Business and Organization
MFS Municipal Limited Maturity Fund (the fund) is a diversified series of MFS Series Trust IX (the trust). The trust is organized as a Massachusetts business trust and is registered under the Investment Company Act of 1940, as amended, as an open-end management investment company.
The fund is an investment company and accordingly follows the investment company accounting and reporting guidance of the Financial Accounting Standards Board (FASB) Accounting Standard Codification Topic 946 Financial Services – Investment Companies.
(2) Significant Accounting Policies
General – The preparation of financial statements in conformity with U.S. generally accepted accounting principles requires management to make estimates and assumptions that affect the reported amounts of assets and liabilities, and disclosure of contingent assets and liabilities at the date of the financial statements and the reported amounts of increases and decreases in net assets from operations during the reporting period. Actual results could differ from those estimates. In the preparation of these financial statements, management has evaluated subsequent events occurring after the date of the fund’s Statement of Assets and Liabilities through the date that the financial statements were issued. The fund invests primarily in municipal instruments. The value of municipal instruments can be affected by changes in their actual or perceived credit quality. The credit quality of municipal instruments can be affected by, among other things, the financial condition of the issuer or guarantor, the issuer’s future borrowing plans and sources of revenue, the economic feasibility of the revenue bond project or general borrowing purpose, political or economic developments in the region where the instrument is issued and the liquidity of the security. Municipal instruments generally trade in the over-the-counter market. Municipal instruments backed by current and anticipated revenues from a specific project or specific assets can be negatively affected by the discontinuance of the taxation supporting the projects or assets or the inability to collect revenues for the project or from the assets. If the Internal Revenue Service determines an issuer of a municipal instrument has not complied with the applicable tax requirements, interest from the security could become taxable, the security could decline in value, and distributions made by the fund could be taxable to shareholders.
In this reporting period, the fund adopted the disclosure provisions of FASB Accounting Standards Update 2011-11 (“ASU 2011-11”), Balance Sheet (Topic 210) – Disclosures about Offsetting Assets and Liabilities along with the related scope clarification provisions of FASB Accounting Standards Update 2013-01 (“ASU 2013-01”) entitled Balance Sheet (Topic 210) – Clarifying the Scope of Disclosures about Offsetting Assets and Liabilities. ASU 2011-11 is intended to enhance disclosures on the offsetting of financial assets and liabilities by requiring entities to disclose both gross and net information about financial instruments and transactions that are either offset in the statement of financial position or subject to an enforceable Master Netting Agreement or similar arrangement. ASU 2013-01 limits the scope of ASU 2011-11’s disclosure requirements on offsetting to financial assets and financial liabilities related to
48
Notes to Financial Statements – continued
derivatives, repurchase and reverse repurchase agreements, and securities lending and securities borrowing transactions. The disclosures required by ASU 2011-11, to the extent applicable to the fund, have been included in the fund’s Significant Accounting Policies note under the captions for each of the fund’s in-scope financial instruments and transactions.
The fund’s accounting policy with respect to balance sheet offsetting is that, absent an event of default by the counterparty or a termination of the agreement, the ISDA Master Agreement does not result in an offset of reported amounts of financial assets and financial liabilities in the Statement of Assets and Liabilities across transactions between the fund and the applicable counterparty. The fund’s right to setoff may be restricted or prohibited by the bankruptcy or insolvency laws of the particular jurisdiction to which a specific master netting agreement counterparty is subject. Balance sheet offsetting disclosures, to the extent applicable to the fund, have been included in the fund’s Significant Accounting Policies note under the captions for each of the fund’s in-scope financial instruments and transactions.
Investment Valuations – Debt instruments and floating rate loans (other than short-term instruments), including restricted debt instruments, are generally valued at an evaluated or composite bid as provided by a third-party pricing service. Short-term instruments with a maturity at issuance of 60 days or less generally are valued at amortized cost, which approximates market value. Open-end investment companies are generally valued at net asset value per share. Securities and other assets generally valued on the basis of information from a third-party pricing service may also be valued at a broker/dealer bid quotation. Values obtained from third-party pricing services can utilize both transaction data and market information such as yield, quality, coupon rate, maturity, type of issue, trading characteristics, and other market data.
The Board of Trustees has delegated primary responsibility for determining or causing to be determined the value of the fund’s investments (including any fair valuation) to the adviser pursuant to valuation policies and procedures approved by the Board. If the adviser determines that reliable market quotations are not readily available, investments are valued at fair value as determined in good faith by the adviser in accordance with such procedures under the oversight of the Board of Trustees. Under the fund’s valuation policies and procedures, market quotations are not considered to be readily available for most types of debt instruments and floating rate loans and many types of derivatives. These investments are generally valued at fair value based on information from third-party pricing services. In addition, investments may be valued at fair value if the adviser determines that an investment’s value has been materially affected by events occurring after the close of the exchange or market on which the investment is principally traded (such as foreign exchange or market) and prior to the determination of the fund’s net asset value, or after the halting of trading of a specific security where trading does not resume prior to the close of the exchange or market on which the security is principally traded. The adviser generally relies on third-party pricing services or other information (such as the correlation with price movements of similar securities in the same or other markets; the type, cost and investment characteristics of the security; the business and financial condition of the issuer; and trading and other market data) to assist in determining whether to fair value and at what value to fair value an investment. The value of an investment for purposes of calculating the fund’s
49
Notes to Financial Statements – continued
net asset value can differ depending on the source and method used to determine value. When fair valuation is used, the value of an investment used to determine the fund’s net asset value may differ from quoted or published prices for the same investment. There can be no assurance that the fund could obtain the fair value assigned to an investment if it were to sell the investment at the same time at which the fund determines its net asset value per share.
Various inputs are used in determining the value of the fund’s assets or liabilities. These inputs are categorized into three broad levels. In certain cases, the inputs used to measure fair value may fall into different levels of the fair value hierarchy. In such cases, an investment’s level within the fair value hierarchy is based on the lowest level of input that is significant to the fair value measurement. The fund’s assessment of the significance of a particular input to the fair value measurement in its entirety requires judgment, and considers factors specific to the investment. Level 1 includes unadjusted quoted prices in active markets for identical assets or liabilities. Level 2 includes other significant observable market-based inputs (including quoted prices for similar securities, interest rates, prepayment speed, and credit risk). Level 3 includes unobservable inputs, which may include the adviser’s own assumptions in determining the fair value of investments. The following is a summary of the levels used as of April 30, 2014 in valuing the fund’s assets or liabilities:
| | | | | | | | | | | | | | | | |
| Investments at Value | | Level 1 | | | Level 2 | | | Level 3 | | | Total | |
| Municipal Bonds | | | $— | | | | $1,485,098,855 | | | | $— | | | | $1,485,098,855 | |
| Mutual Funds | | | 12,945,371 | | | | — | | | | — | | | | 12,945,371 | |
| Total Investments | | | $12,945,371 | | | | $1,485,098,855 | | | | $— | | | | $1,498,044,226 | |
For further information regarding security characteristics, see the Portfolio of Investments.
Indemnifications – Under the fund’s organizational documents, its officers and Trustees may be indemnified against certain liabilities and expenses arising out of the performance of their duties to the fund. Additionally, in the normal course of business, the fund enters into agreements with service providers that may contain indemnification clauses. The fund’s maximum exposure under these agreements is unknown as this would involve future claims that may be made against the fund that have not yet occurred.
Investment Transactions and Income – Investment transactions are recorded on the trade date. Interest income is recorded on the accrual basis. All premium and discount is amortized or accreted for financial statement purposes in accordance with U.S. generally accepted accounting principles. Interest payments received in additional securities are recorded on the ex-interest date in an amount equal to the value of the security on such date.
The fund may receive proceeds from litigation settlements. Any proceeds received from litigation involving portfolio holdings are reflected in the Statement of Operations in realized gain/loss if the security has been disposed of by the fund or in unrealized gain/loss if the security is still held by the fund. Any other proceeds from litigation not related to portfolio holdings are reflected as other income in the Statement of Operations.
50
Notes to Financial Statements – continued
Fees Paid Indirectly – The fund’s custody fee may be reduced according to an arrangement that measures the value of cash deposited with the custodian by the fund. This amount, for the year ended April 30, 2014, is shown as a reduction of total expenses in the Statement of Operations.
Tax Matters and Distributions – The fund intends to qualify as a regulated investment company, as defined under Subchapter M of the Internal Revenue Code, and to distribute all of its taxable and tax-exempt income, including realized capital gains. As a result, no provision for federal income tax is required. The fund’s federal tax returns, when filed, will remain subject to examination by the Internal Revenue Service for a three year period. Management has analyzed the fund’s tax positions taken on federal and state tax returns for all open tax years and does not believe that there are any uncertain tax positions that require recognition of a tax liability.
Distributions to shareholders are recorded on the ex-dividend date. Income and capital gain distributions are determined in accordance with income tax regulations, which may differ from U.S. generally accepted accounting principles. Certain capital accounts in the financial statements are periodically adjusted for permanent differences in order to reflect their tax character. These adjustments have no impact on net assets or net asset value per share. Temporary differences which arise from recognizing certain items of income, expense, gain or loss in different periods for financial statement and tax purposes will reverse at some time in the future. Distributions in excess of net investment income or net realized gains are temporary overdistributions for financial statement purposes resulting from differences in the recognition or classification of income or distributions for financial statement and tax purposes.
Book/tax differences primarily relate to amortization and accretion of debt securities.
The tax character of distributions declared to shareholders for the last two fiscal years is as follows:
| | | | | | | | |
| | | 4/30/14 | | | 4/30/13 | |
| Tax-exempt income | | | $22,848,767 | | | | $19,245,199 | |
The federal tax cost and the tax basis components of distributable earnings were as follows:
| | | | |
| As of 4/30/14 | | | |
| Cost of investments | | | $1,463,768,675 | |
| Gross appreciation | | | 36,790,232 | |
| Gross depreciation | | | (2,514,681 | ) |
| Net unrealized appreciation (depreciation) | | | $34,275,551 | |
| Undistributed tax-exempt income | | | 1,029,013 | |
| Capital loss carryforwards | | | (9,148,555 | ) |
| Post-October capital loss deferral | | | (1,089,968 | ) |
| Other temporary differences | | | (2,001,305 | ) |
Under the Regulated Investment Company Modernization Act of 2010 (the “Act”), net capital losses recognized for fund fiscal years beginning after April 30, 2011 may be carried forward indefinitely, and their character is retained as short-term and/or long-term losses (“post-enactment losses”). Previously, net capital losses were carried
51
Notes to Financial Statements – continued
forward for eight years and treated as short-term losses (“pre-enactment losses”). As a transition rule, the Act requires that all post-enactment net capital losses be used before pre-enactment net capital losses.
As of April 30, 2014, the fund had capital loss carryforwards available to offset future realized gains as follows:
| | | | |
Pre-enactment losses which expire as
follows: | |
| 4/30/18 | | | $(126,716 | ) |
|
Post-enactment losses which are
characterized as follows: | |
| Short-Term | | | $(7,398,778 | ) |
| Long-Term | | | (1,623,061 | ) |
| Total | | | $(9,021,839 | ) |
Multiple Classes of Shares of Beneficial Interest – The fund offers multiple classes of shares, which differ in their respective distribution and service fees. The fund’s income and common expenses are allocated to shareholders based on the value of settled shares outstanding of each class. The fund’s realized and unrealized gain (loss) are allocated to shareholders based on the daily net assets of each class. Dividends are declared separately for each class. Differences in per share dividend rates are generally due to differences in separate class expenses. Class B shares will convert to Class A shares approximately eight years after purchase. The fund’s distributions declared to shareholders as reported in the Statements of Changes in Net Assets are presented by class as follows:
| | | | | | | | |
| | | From net investment
income | |
| | | Year
ended
4/30/14 | | | Year
ended
4/30/13 | |
| Class A | | | $12,098,484 | | | | $11,771,758 | |
| Class B | | | 19,797 | | | | 18,870 | |
| Class C | | | 1,413,699 | | | | 1,730,332 | |
| Class I | | | 9,316,787 | | | | 5,724,239 | |
| Total | | | $22,848,767 | | | | $19,245,199 | |
(3) Transactions with Affiliates
Investment Adviser – The fund has an investment advisory agreement with MFS to provide overall investment management and related administrative services and facilities to the fund. The management fee is computed daily and paid monthly at an annual rate of 0.40% of the fund’s average daily net assets.
MFS has agreed in writing to reduce its management fee by a specified amount if certain MFS mutual fund assets exceed thresholds agreed to by MFS and the fund’s Board of Trustees. For the year ended April 30, 2014, this management fee reduction amounted to $27,435, which is included in the reduction of total expenses in the Statement of Operations. The management fee incurred for the year ended April 30, 2014 was equivalent to an annual effective rate of 0.40% of the fund’s average daily net assets.
52
Notes to Financial Statements – continued
The investment adviser has agreed in writing to pay a portion of the fund’s operating expenses, exclusive of management fee, distribution and service fees, interest, taxes, extraordinary expenses, brokerage and transaction costs and investment-related expenses, such that fund operating expenses do not exceed 0.15% annually of the fund’s average daily net assets. This written agreement will continue until modified by the fund’s Board of Trustees, but such agreement will continue at least until August 31, 2014. For the year ended April 30, 2014, the fund’s actual operating expenses did not exceed the limit and therefore, the investment adviser did not pay any portion of the fund’s expenses related to this agreement.
Distributor – MFS Fund Distributors, Inc. (MFD), a wholly-owned subsidiary of MFS, as distributor, received $133,313 for the year ended April 30, 2014, as its portion of the initial sales charge on sales of Class A shares of the fund.
The Board of Trustees has adopted a distribution plan for certain share classes pursuant to Rule 12b-1 of the Investment Company Act of 1940.
The fund’s distribution plan provides that the fund will pay MFD for services provided by MFD and financial intermediaries in connection with the distribution and servicing of certain share classes. One component of the plan is a distribution fee paid to MFD and another component of the plan is a service fee paid to MFD. MFD may subsequently pay all, or a portion, of the distribution and/or service fees to financial intermediaries.
Distribution Plan Fee Table:
| | | | | | | | | | | | | | | | | | | | |
| | | Distribution
Fee Rate (d) | | | Service
Fee Rate (d) | | | Total
Distribution
Plan (d) | | | Annual
Effective
Rate (e) | | | Distribution
and Service
Fee | |
| Class A | | | — | | | | 0.25% | | | | 0.25% | | | | 0.15% | | | | $1,776,163 | |
| Class B | | | 0.75% | | | | 0.25% | | | | 1.00% | | | | 0.90% | | | | 20,573 | |
| Class C | | | 0.75% | | | | 0.25% | | | | 1.00% | | | | 1.00% | | | | 1,647,835 | |
| Total Distribution and Service Fees | | | | $3,444,571 | |
| (d) | In accordance with the distribution plan for certain classes, the fund pays distribution and/or service fees equal to these annual percentage rates of each class’s average daily net assets. The distribution and service fee rates disclosed by class represent the current rates in effect at the end of the reporting period. Any rate changes, if applicable, are detailed below. |
| (e) | The annual effective rates represent actual fees incurred under the distribution plan for the year ended April 30, 2014 based on each class’s average daily net assets. 0.10% of the Class A service fee is currently being waived under a written waiver agreement. For the year ended April 30, 2014, this waiver amounted to $710,460 and is included in the reduction of total expenses in the Statement of Operations. For one year from date of purchase of Class B shares, assets attributable to such Class B shares are subject to the 0.25% annual Class B service fee. On assets attributable to all other Class B shares, 0.15% of the Class B service fee is being paid by the fund and 0.10% of the Class B service fee is currently being waived under a written waiver agreement. For the year ended April 30, 2014, this waiver amounted to $2,098 and is included in the reduction of total expenses in the Statement of Operations. These written waiver agreements will continue until modified by the fund’s Board of Trustees, but such agreements will continue at least until August 31, 2014. MFD has voluntarily agreed to rebate a portion of each class’s 0.25% service fee attributable to accounts for which MFD retains the 0.25% service fee except for accounts attributable to MFS or its affiliates’ seed money. For the year ended April 30, 2014, this rebate amounted to $4,311 and $15 for Class A and Class C, respectively, and is included in the reduction of total expenses in the Statement of Operations. |
53
Notes to Financial Statements – continued
Certain Class A shares are subject to a contingent deferred sales charge (CDSC) in the event of a shareholder redemption within 18 months of purchase for shares purchased on or after August 1, 2012, and within 24 months of purchase for shares purchased prior to August 1, 2012. Class C shares are subject to a CDSC in the event of a shareholder redemption within 12 months of purchase. Class B shares are subject to a CDSC in the event of a shareholder redemption within six years of purchase. All contingent deferred sales charges are paid to MFD and during the year ended April 30, 2014, were as follows:
| | | | |
| | | Amount | |
| Class A | | | $150,326 | |
| Class B | | | 2,396 | |
| Class C | | | 49,655 | |
Shareholder Servicing Agent – MFS Service Center, Inc. (MFSC), a wholly-owned subsidiary of MFS, receives a fee from the fund for its services as shareholder servicing agent calculated as a percentage of the average daily net assets of the fund as determined periodically under the supervision of the fund’s Board of Trustees. For the year ended April 30, 2014, the fee was $99,220, which equated to 0.0072% annually of the fund’s average daily net assets. MFSC also receives payment from the fund for out-of-pocket expenses, sub-accounting and other shareholder servicing costs which may be paid to affiliated and unaffiliated service providers. For the year ended April 30, 2014, these out-of-pocket expenses, sub-accounting and other shareholder servicing costs amounted to $1,055,756.
Administrator – MFS provides certain financial, legal, shareholder communications, compliance, and other administrative services to the fund. Under an administrative services agreement, the fund partially reimburses MFS the costs incurred to provide these services. The fund is charged an annual fixed amount of $17,500 plus a fee based on average daily net assets. The administrative services fee incurred for the year ended April 30, 2014 was equivalent to an annual effective rate of 0.0127% of the fund’s average daily net assets.
Trustees’ and Officers’ Compensation – The fund pays compensation to independent Trustees in the form of a retainer, attendance fees, and additional compensation to Board and Committee chairpersons. The fund does not pay compensation directly to Trustees or officers of the fund who are also officers of the investment adviser, all of whom receive remuneration for their services to the fund from MFS. Certain officers and Trustees of the fund are officers or directors of MFS, MFD, and MFSC.
Prior to December 31, 2001, the fund had an unfunded defined benefit plan (“DB plan”) for independent Trustees. As of December 31, 2001, the Board took action to terminate the DB plan with respect to then-current and any future independent Trustees, such that the DB plan covers only certain of those former independent Trustees who retired on or before December 31, 2001. The DB plan resulted in a pension expense of $45 and is included in independent Trustees’ compensation for the year ended April 30, 2014. The liability for deferred retirement benefits payable to certain independent Trustees under the DB plan amounted to $3,058 at April 30, 2014, and is included in “Payable for independent Trustees’ compensation” in the Statement of Assets and Liabilities.
54
Notes to Financial Statements – continued
Other – This fund and certain other funds managed by MFS (the funds) have entered into services agreements (the Agreements) which provide for payment of fees by the funds to Tarantino LLC and Griffin Compliance LLC in return for the provision of services of an Independent Chief Compliance Officer (ICCO) and Assistant ICCO, respectively, for the funds. The ICCO and Assistant ICCO are officers of the funds and the sole members of Tarantino LLC and Griffin Compliance LLC, respectively. The funds can terminate the Agreements with Tarantino LLC and Griffin Compliance LLC at any time under the terms of the Agreements. For the year ended April 30, 2014, the aggregate fees paid by the fund to Tarantino LLC and Griffin Compliance LLC were $7,780 and are included in “Miscellaneous” expense in the Statement of Operations. MFS has agreed to reimburse the fund for a portion of the payments made by the fund in the amount of $2,726, which is included in the reduction of total expenses in the Statement of Operations. Additionally, MFS has agreed to bear all expenses associated with office space, other administrative support, and supplies provided to the ICCO and Assistant ICCO.
The fund invests in the MFS Institutional Money Market Portfolio which is managed by MFS and seeks current income consistent with preservation of capital and liquidity. Income earned on this investment is included in “Dividends from underlying affiliated funds” in the Statement of Operations. This money market fund does not pay a management fee to MFS.
(4) Portfolio Securities
Purchases and sales of investments, other than short-term obligations, aggregated $743,736,483 and $450,502,425, respectively.
(5) Shares of Beneficial Interest
The fund’s Declaration of Trust permits the Trustees to issue an unlimited number of full and fractional shares of beneficial interest. Transactions in fund shares were as follows:
| | | | | | | | | | | | | | | | |
| | | Year ended
4/30/14 | | | Year ended
4/30/13 | |
| | | Shares | | | Amount | | | Shares | | | Amount | |
| Shares sold | | | | | | | | | | | | | | | | |
Class A | | | 36,697,026 | | | | $296,611,765 | | | | 44,098,027 | | | | $364,540,625 | |
Class B | | | 185,798 | | | | 1,497,118 | | | | 22,327 | | | | 184,258 | |
Class C | | | 3,914,362 | | | | 31,710,399 | | | | 8,506,543 | | | | 70,365,122 | |
Class I | | | 77,204,006 | | | | 622,461,274 | | | | 31,594,846 | | | | 260,926,478 | |
| | | 118,001,192 | | | | $952,280,556 | | | | 84,221,743 | | | | $696,016,483 | |
| | | | |
Shares issued to shareholders in
reinvestment of distributions | | | | | | | | | | | | | | | | |
Class A | | | 1,381,583 | | | | $11,166,600 | | | | 1,236,717 | | | | $10,224,409 | |
Class B | | | 1,819 | | | | 14,677 | | | | 1,640 | | | | 13,539 | |
Class C | | | 140,832 | | | | 1,138,341 | | | | 155,791 | | | | 1,288,747 | |
Class I | | | 763,746 | | | | 6,168,433 | | | | 519,222 | | | | 4,288,447 | |
| | | 2,287,980 | | | | $18,488,051 | | | | 1,913,370 | | | | $15,815,142 | |
55
Notes to Financial Statements – continued
| | | | | | | | | | | | | | | | |
| | | Year ended
4/30/14 | | | Year ended
4/30/13 | |
| | | Shares | | | Amount | | | Shares | | | Amount | |
| Shares reacquired | | | | | | | | | | | | | | | | |
Class A | | | (42,824,985 | ) | | | $(345,845,878 | ) | | | (24,717,584 | ) | | | $(204,256,982 | ) |
Class B | | | (113,390 | ) | | | (913,684 | ) | | | (81,123 | ) | | | (669,913 | ) |
Class C | | | (7,963,651 | ) | | | (64,352,927 | ) | | | (4,814,439 | ) | | | (39,812,026 | ) |
Class I | | | (39,268,534 | ) | | | (316,934,791 | ) | | | (12,084,546 | ) | | | (99,790,019 | ) |
| | | (90,170,560 | ) | | | $(728,047,280 | ) | | | (41,697,692 | ) | | | $(344,528,940 | ) |
| | | | |
| Net change | | | | | | | | | | | | | | | | |
Class A | | | (4,746,376 | ) | | | $(38,067,513 | ) | | | 20,617,160 | | | | $170,508,052 | |
Class B | | | 74,227 | | | | 598,111 | | | | (57,156 | ) | | | (472,116 | ) |
Class C | | | (3,908,457 | ) | | | (31,504,187 | ) | | | 3,847,895 | | | | 31,841,843 | |
Class I | | | 38,699,218 | | | | 311,694,916 | | | | 20,029,522 | | | | 165,424,906 | |
| | | 30,118,612 | | | | $242,721,327 | | | | 44,437,421 | | | | $367,302,685 | |
Effective May 1, 2006, the sale of Class B shares of the fund have been suspended except in certain circumstances. Please see the fund’s prospectus for details.
(6) Line of Credit
The fund and certain other funds managed by MFS participate in a $1.1 billion unsecured committed line of credit, subject to a $1 billion sublimit, provided by a syndication of banks under a credit agreement. Borrowings may be made for temporary financing needs. Interest is charged to each fund, based on its borrowings, generally at a rate equal to the higher of the Federal Reserve funds rate or one month LIBOR plus an agreed upon spread. A commitment fee, based on the average daily, unused portion of the committed line of credit, is allocated among the participating funds at the end of each calendar quarter. In addition, the fund and other funds managed by MFS have established unsecured uncommitted borrowing arrangements with certain banks for temporary financing needs. Interest is charged to each fund, based on its borrowings, at a rate equal to the Federal Reserve funds rate plus an agreed upon spread. For the year ended April 30, 2014, the fund’s commitment fee and interest expense were $5,800 and $0, respectively, and are included in “Miscellaneous” expense in the Statement of Operations.
56
Notes to Financial Statements – continued
(7) Transactions in Underlying Affiliated Funds-Affiliated Issuers
An affiliated issuer may be considered one in which the fund owns 5% or more of the outstanding voting securities, or a company which is under common control. For the purposes of this report, the fund assumes the following to be an affiliated issuer:
| | | | | | | | | | | | | | | | |
| Underlying Affiliated Fund | | Beginning
Shares/Par
Amount | | | Acquisitions
Shares/Par
Amount | | | Dispositions
Shares/Par
Amount | | | Ending
Shares/Par
Amount | |
MFS Institutional Money
Market Portfolio | | | 41,493,574 | | | | 697,484,636 | | | | (726,032,839 | ) | | | 12,945,371 | |
| | | | |
| Underlying Affiliated Fund | | Realized
Gain (Loss) | | | Capital Gain
Distributions | | | Dividend
Income | | | Ending Value | |
MFS Institutional Money
Market Portfolio | | | $— | | | | $— | | | | $55,232 | | | | $12,945,371 | |
57
REPORT OF INDEPENDENT REGISTERED PUBLIC ACCOUNTING FIRM
To the Board of Trustees of MFS Series Trust IX and the Shareholders of MFS Municipal Limited Maturity Fund:
We have audited the accompanying statement of assets and liabilities, including the portfolio of investments, of MFS Municipal Limited Maturity Fund (one of the series of MFS Series Trust IX) (the “Fund”) as of April 30, 2014, and the related statement of operations for the year then ended, the statements of changes in net assets for each of the two years in the period then ended, and the financial highlights for each of the periods presented. These financial statements and financial highlights are the responsibility of the Fund’s management. Our responsibility is to express an opinion on these financial statements and financial highlights based on our audits.
We conducted our audits in accordance with the standards of the Public Company Accounting Oversight Board (United States). Those standards require that we plan and perform the audit to obtain reasonable assurance about whether the financial statements and financial highlights are free of material misstatement. The Fund is not required to have, nor were we engaged to perform, an audit of its internal control over financial reporting. Our audits included consideration of internal control over financial reporting as a basis for designing audit procedures that are appropriate in the circumstances, but not for the purpose of expressing an opinion on the effectiveness of the Fund’s internal control over financial reporting. Accordingly, we express no such opinion. An audit also includes examining, on a test basis, evidence supporting the amounts and disclosures in the financial statements, assessing the accounting principles used and significant estimates made by management, as well as evaluating the overall financial statement presentation. Our procedures included confirmation of securities owned as of April 30, 2014, by correspondence with the custodian and brokers; where replies were not received from brokers, we performed other auditing procedures. We believe that our audits provide a reasonable basis for our opinion.
In our opinion, the financial statements and financial highlights referred to above present fairly, in all material respects, the financial position of MFS Municipal Limited Maturity Fund as of April 30, 2014, the results of its operations for the year then ended, the changes in its net assets for each of the two years in the period then ended, and the financial highlights for each of the periods presented, in conformity with accounting principles generally accepted in the United States of America.
DELOITTE & TOUCHE LLP
Boston, Massachusetts
June 17, 2014
58
TRUSTEES AND OFFICERS — IDENTIFICATION AND BACKGROUND
The Trustees and Officers of the Trust, as of June 1, 2014, are listed below, together with their principal occupations during the past five years. (Their titles may have varied during that period.) The address of each Trustee and Officer is 111 Huntington Avenue, Boston, Massachusetts 02199-7618. It is expected that the Board will appoint Mr. Timothy M. Fagan as Chief Compliance Officer of the MFS Funds on November 1, 2014.
| | | | | | | | |
Name, Age | | Position(s) Held with Fund | | Trustee/Officer
Since (h) | | Principal
Occupations During the Past Five Years | | Other Directorships (j) |
| INTERESTED TRUSTEES |
Robert J. Manning (k) (age 50) | | Trustee | | February 2004 | | Massachusetts Financial Services Company, Chairman, Chief Executive Officer and Director; President (until 2009); Chief Investment Officer (until 2010) | | N/A |
Robin A. Stelmach (k) (age 52) | | Trustee | | January 2014 | | Massachusetts Financial Services Company, Executive Vice President and Chief Operating Officer | | N/A |
| INDEPENDENT TRUSTEES |
David H. Gunning
(age 72) | | Trustee and Chair of Trustees | | January 2004 | | Private investor | | Lincoln Electric Holdings, Inc. (welding equipment manufacturer), Director; Development Alternatives, Inc. (consulting), Director/Non-Executive Chairman |
Steven E. Buller (age 62) | | Trustee | | February 2014 | | Chairman, Financial Accounting Standards Advisory Council; Standing Advisory Group, Public Company Accounting Oversight Board, Member; BlackRock, Inc. (investment management), Managing Director (until 2014), BlackRock Finco (investment management), UK, Director (until 2014) | | N/A |
59
Trustees and Officers – continued
| | | | | | | | |
Name, Age | | Position(s) Held with Fund | | Trustee/Officer
Since (h) | | Principal
Occupations During the Past Five Years | | Other Directorships (j) |
Robert E. Butler
(age 72) | | Trustee | | January 2006 | | Consultant – investment company industry regulatory and compliance matters | | N/A |
Maureen R. Goldfarb (age 59) | | Trustee | | January 2009 | | Private investor | | N/A |
William R. Gutow
(age 72) | | Trustee | | December 1993 | | Private investor and real estate consultant; Capitol Entertainment Management Company (video franchise), Vice Chairman | | Texas Donuts (donut franchise), Vice Chairman (until 2010) |
Michael Hegarty
(age 69) | | Trustee | | December 2004 | | Private investor | | Brookfield Office Properties, Inc. (real estate), Director; Rouse Properties Inc. (real estate), Director; Capmark Financial Group Inc. (real estate), Director |
John P. Kavanaugh (age 59) | | Trustee | | January 2009 | | Private investor | | N/A |
Maryanne L. Roepke (age 58) | | Trustee | | May 2014 | | American Century Investments (investment management), Senior Vice President and Chief Compliance Officer (until 2014) | | N/A |
Laurie J. Thomsen
(age 56) | | Trustee | | March 2005 | | Private investor; New Profit, Inc. (venture philanthropy), Executive Partner (until 2010) | | The Travelers Companies (insurance), Director |
Robert W. Uek
(age 73) | | Trustee | | January 2006 | | Consultant to investment company industry | | N/A |
| OFFICERS | | | | | | | | |
John M. Corcoran (k) (age 49) | | President | | October 2008 | | Massachusetts Financial Services Company, Senior Vice President | | N/A |
Christopher R. Bohane (k) (age 40) | | Assistant Secretary and Assistant Clerk | | July 2005 | | Massachusetts Financial Services Company, Vice President and Assistant General Counsel | | N/A |
60
Trustees and Officers – continued
| | | | | | | | |
Name, Age | | Position(s) Held with Fund | | Trustee/Officer
Since (h) | | Principal
Occupations During the Past Five Years | | Other Directorships (j) |
Kino Clark (k) (age 45) | | Assistant Treasurer | | January 2012 | | Massachusetts Financial Services Company, Vice President | | N/A |
Thomas H. Connors (k) (age 54) | | Assistant Secretary and Assistant Clerk | | September 2012 | | Massachusetts Financial Services Company, Vice President and Senior Counsel; Deutsche Investment Management Americas Inc. (financial service provider), Director and Senior Counsel (until 2012) | | N/A |
Ethan D. Corey (k)
(age 50) | | Assistant
Secretary and Assistant Clerk | | July 2005 | | Massachusetts Financial Services Company, Senior Vice President and Associate General Counsel | | N/A |
David L. DiLorenzo (k) (age 45) | | Treasurer | | July 2005 | | Massachusetts Financial Services Company, Senior Vice President | | N/A |
Brian E. Langenfeld (k) (age 41) | | Assistant
Secretary and Assistant Clerk | | June 2006 | | Massachusetts Financial Services Company, Vice President and Senior Counsel | | N/A |
Susan S. Newton (k) (age 64) | | Assistant
Secretary and Assistant Clerk | | May 2005 | | Massachusetts Financial Services Company, Senior Vice President and Associate General Counsel | | N/A |
Susan A. Pereira (k)
(age 43) | | Assistant
Secretary and Assistant Clerk | | July 2005 | | Massachusetts Financial Services Company, Vice President and Senior Counsel | | N/A |
Kasey L. Phillips (k) (age 43) | | Assistant Treasurer | | September 2012 | | Massachusetts Financial Services Company, Vice President; Wells Fargo Funds Management, LLC, Senior Vice President, Fund Treasurer (until 2012) | | N/A |
61
Trustees and Officers – continued
| | | | | | | | |
Name, Age | | Position(s) Held with Fund | | Trustee/Officer
Since (h) | | Principal
Occupations During the Past Five Years | | Other Directorships (j) |
Mark N. Polebaum (k) (age 62) | | Secretary and
Clerk | | January 2006 | | Massachusetts Financial Services Company, Executive Vice President, General Counsel and Secretary | | N/A |
Frank L. Tarantino (l)
(age 70) | | Independent
Chief Compliance Officer | | June 2004 | | Tarantino LLC (provider of compliance services), Principal | | N/A |
Richard S. Weitzel (k)
(age 43) | | Assistant Secretary and Assistant Clerk | | October 2007 | | Massachusetts Financial Services Company, Senior Vice President and Associate General Counsel | | N/A |
James O. Yost (k)
(age 53) | | Deputy Treasurer | | September 1990 | | Massachusetts Financial Services Company, Senior Vice President | | N/A |
| (h) | Date first appointed to serve as Trustee/officer of an MFS Fund. Each Trustee has served continuously since appointment unless indicated otherwise. For the period from December 15, 2004 until February 22, 2005, Mr. Manning served as Advisory Trustee. For the period October 2008, until January 2012, Mr. Corcoran served as Treasurer of the Funds. Prior to January 2012, Messrs. DiLorenzo and Yost served as Assistant Treasurers of the Funds. |
| (j) | Directorships or trusteeships of companies required to report to the Securities and Exchange Commission (i.e., “public companies”). |
| (k) | “Interested person” of the Trust within the meaning of the Investment Company Act of 1940 (referred to as the 1940 Act), which is the principal federal law governing investment companies like the fund, as a result of position with MFS. The address of MFS is 111 Huntington Avenue, Boston, Massachusetts 02199-7618. |
| (l) | Mr. Tarantino will retire as Independent Chief Compliance Officer of the MFS Funds on October 31, 2014. It is expected that Mr. Tarantino will continue after that date as an Independent Senior Officer of the MFS Funds. |
Each Trustee (except Ms. Stelmach, Mr. Buller and Ms. Roepke) has been elected by shareholders and each Trustee and officer holds office until his or her successor is chosen and qualified or until his or her earlier death, resignation, retirement or removal. The Trust does not hold annual meetings for the purpose of electing Trustees, and Trustees are not elected for fixed terms. Messrs. Butler, Kavanaugh, Uek and Mses. Thomsen and Roepke are members of the Trust’s Audit Committee.
Each of the Fund’s Trustees and officers holds comparable positions with certain other funds of which MFS or a subsidiary is the investment adviser or distributor, and, in the case of the officers, with certain affiliates of MFS. As of January 1, 2014, the Trustees served as board members of 142 funds within the MFS Family of Funds.
62
Trustees and Officers – continued
The Statement of Additional Information for the Fund includes further information about the Trustees and is available without charge upon request by calling 1-800-225-2606.
| | |
| Investment Adviser | | Custodian |
Massachusetts Financial Services Company
111 Huntington Avenue
Boston, MA 02199-7618 | | JPMorgan Chase Bank, NA 4 Metrotech Center New York, NY 11245 |
| Distributor | | Independent Registered Public Accounting Firm |
MFS Fund Distributors, Inc.
111 Huntington Avenue
Boston, MA 02199-7618 | | Deloitte & Touche LLP 200 Berkeley Street Boston, MA 02116 |
| Portfolio Manager | | |
| Geoffrey Schechter | | |
63
BOARD REVIEW OF INVESTMENT ADVISORY AGREEMENT
A discussion regarding the Board’s most recent review and renewal of the fund’s Investment Advisory Agreement with MFS is available by clicking on the fund’s name under “Mutual Funds” in the “Products” section of the MFS Web site (mfs.com).
PROXY VOTING POLICIES AND INFORMATION
MFS votes proxies on behalf of the fund pursuant to proxy voting policies and procedures that are available without charge, upon request, by calling 1-800-225-2606, by visiting the Proxy Voting section of mfs.com or by visiting the SEC’s Web site at http://www.sec.gov.
Information regarding how the fund voted proxies relating to portfolio securities during the twelve-month period ended June 30, 2013 is available without charge by visiting the Proxy Voting section of mfs.com or by visiting the SEC’s Web site at http://www.sec.gov.
QUARTERLY PORTFOLIO DISCLOSURE
The fund will file a complete schedule of portfolio holdings with the Securities and Exchange Commission (the Commission) for the first and third quarters of each fiscal year on Form N-Q. A shareholder can obtain the quarterly portfolio holdings report at mfs.com. The fund’s Form N-Q is also available on the EDGAR database on the Commission’s Internet Web site at http://www.sec.gov, and may be reviewed and copied at the:
Public Reference Room
Securities and Exchange Commission
100 F Street, NE, Room 1580
Washington, D.C. 20549
Information on the operation of the Public Reference Room may be obtained by calling the Commission at 1-800-SEC-0330. Copies of the fund’s Form N-Q also may be obtained, upon payment of a duplicating fee, by electronic request at the following e-mail address: publicinfo@sec.gov or by writing the Public Reference Section at the above address.
FURTHER INFORMATION
From time to time, MFS may post important information about the fund or the MFS funds on the MFS web site (mfs.com). This information is available by visiting the “Commentary & Announcements” and “Market Outlooks” sections of mfs.com or by clicking on the fund’s name under “Mutual Funds” in the “Products” section of mfs.com.
FEDERAL TAX INFORMATION (unaudited)
The fund will notify shareholders of amounts for use in preparing 2014 income tax forms in January 2015. The following information is provided pursuant to provisions of the Internal Revenue Code.
Of the dividends paid from net investment income during the fiscal year, 100% is designated as exempt interest dividends for federal income tax purposes. If the fund has earned income on private activity bonds, a portion of the dividends paid may be considered a tax preference item for purposes of computing a shareholder’s alternative minimum tax.
64
rev. 3/11
| | | | |
| | | |
FACTS | | WHAT DOES MFS DO WITH YOUR PERSONAL INFORMATION? | |  |
| | |
| Why? | | Financial companies choose how they share your personal information. Federal law gives consumers the right to limit some but not all sharing. Federal law also requires us to tell you how we collect, share, and protect your personal information. Please read this notice carefully to understand what we do. |
| | |
| What? | | The types of personal information we collect and share depend on the product or service you have with us. This information can include: • Social Security number and account balances • Account transactions and transaction history • Checking account information and wire transfer instructions When you are no longer our customer, we continue to share your information as described in this notice. |
| | |
| How? | | All financial companies need to share customers’ personal information to run their everyday business. In the section below, we list the reasons financial companies can share their customers’ personal information; the reasons MFS chooses to share; and whether you can limit this sharing. |
| | | | |
Reasons we can share your
personal information | | Does MFS
share? | | Can you limit
this sharing? |
For our everyday business purposes – such as to process your transactions, maintain your account(s), respond to court orders and legal investigations, or report to credit bureaus | | Yes | | No |
For our marketing purposes – to offer our products and services to you | | No | | We don’t share |
| For joint marketing with other financial companies | | No | | We don’t share |
For our affiliates’ everyday business purposes – information about your transactions and experiences | | No | | We don’t share |
For our affiliates’ everyday business purposes – information about your creditworthiness | | No | | We don’t share |
| For nonaffiliates to market to you | | No | | We don’t share |
| | |
| Questions? | | Call 800-225-2606 or go to mfs.com. |
65
| | |
| Who we are |
| Who is providing this notice? | | MFS Funds, MFS Investment Management, MFS Institutional Advisors, Inc., MFS Fund Distributors, Inc., MFS Heritage Trust Company, and MFS Service Center, Inc. |
| | |
| What we do |
| How does MFS protect my personal information? | | To protect your personal information from unauthorized access and use, we use security measures that comply with federal law. These measures include procedural, electronic, and physical safeguards for the protection of the personal information we collect about you. |
| How does MFS collect my personal information? | | We collect your personal information, for example, when you •open an account or provide account information •direct us to buy securities or direct us to sell your securities •make a wire transfer We also collect your personal information from others, such as credit bureaus, affiliates and other companies. |
| Why can’t I limit all sharing? | | Federal law gives you the right to limit only •sharing for affiliates’ everyday business purposes – information about your creditworthiness •affiliates from using your information to market to you •sharing for nonaffiliates to market to you State laws and individual companies may give you additional rights to limit sharing. |
| | |
| Definitions |
| Affiliates | | Companies related by common ownership or control. They can be financial and nonfinancial companies. •MFS does not share personal information with affiliates, except for everyday business purposes as described on page one of this notice. |
| Nonaffiliates | | Companies not related by common ownership or control. They can be financial and nonfinancial companies. •MFS does not share with nonaffiliates so they can market to you. |
| Joint Marketing | | A formal agreement between nonaffiliated financial companies that together market financial products or services to you. •MFS doesn’t jointly market. |
| | |
| Other important information |
| If you own an MFS product or receive an MFS service in the name of a third party such as a bank or broker-dealer, their privacy policy may apply to you instead of ours. |
66
Save paper with eDelivery.

| MFS® will send you prospectuses, |
reports, and proxies directly via e-mail so you will get information faster with less mailbox clutter.
To sign up:
1. Go to mfs.com.
2. Log in via MFS® Access.
3. Select eDelivery.
If you own your MFS fund shares through a financial institution or a retirement plan, MFS® TALK, MFS® Access, or eDelivery may not be available to you.
CONTACT
WEB SITE
mfs.com
MFS TALK
1-800-637-8255
24 hours a day
ACCOUNT SERVICE AND LITERATURE
Shareholders
1-800-225-2606
Financial advisors
1-800-343-2829
Retirement plan services
1-800-637-1255
MAILING ADDRESS
MFS Service Center, Inc.
P.O. Box 55824
Boston, MA 02205-5824
OVERNIGHT MAIL
MFS Service Center, Inc.
c/o Boston Financial Data Services
30 Dan Road
Canton, MA 02021-2809
ANNUAL REPORT
April 30, 2014

MFS® RESEARCH BOND FUND

RBF-ANN
MFS® RESEARCH BOND FUND
CONTENTS
The report is prepared for the general information of shareholders. It is authorized for distribution to prospective investors only when preceded or accompanied by a current prospectus.
NOT FDIC INSURED Ÿ MAY LOSE VALUE Ÿ NO BANK GUARANTEE

LETTER FROM THE CHAIRMAN AND CEO
Dear Shareholders:
After gaining momentum late last year, the U.S. economy slipped this winter, as severe weather curtailed activity. More recently, however, labor market data, consumer
confidence, retail sales and industrial output have indicated that the U.S. economy could be regaining traction.
Europe emerged from its recession midway through 2013. However, its pace of growth has been slow, high unemployment persists and the risk of deflation exists. Asia remains vulnerable. China’s economic growth has slowed, and Japan’s early progress toward an economic turnaround continues to face obstacles. Emerging markets have also displayed much higher volatility, affected by the early transition from aggressive central bank monetary easing.
With so much uncertainty, global financial markets began 2014 with much greater volatility than last year’s broad-based rally. For equity investors, attention to company fundamentals has taken on more importance. Bond investors have been attuned to heightened risks from possible interest rate increases.
As always at MFS®, active risk management is an integral part of how we manage your investments. We use a collaborative process, sharing insights across asset classes, regions and economic sectors. Our global team of investment professionals uses a multidisciplined, long-term, diversified investment approach.
We understand that these are challenging economic times. We believe that we can serve you best by applying proven principles, such as asset allocation and diversification, over the long term. We are confident that this approach can serve you well as you work with your financial advisors to reach your goals in the years ahead.
Respectfully,

Robert J. Manning
Chairman and Chief Executive Officer
MFS Investment Management
June 13, 2014
The opinions expressed in this letter are subject to change, may not be relied upon for investment advice, and no forecasts can be guaranteed.
1
PORTFOLIO COMPOSITION
Portfolio structure (i)
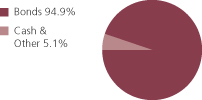
| | | | |
| Fixed income sectors (i) | | | | |
| High Grade Corporates | | | 39.4% | |
| Mortgage-Backed Securities | | | 17.6% | |
| U.S. Treasury Securities | | | 12.7% | |
| Commercial Mortgage-Backed Securities | | | 8.3% | |
| High Yield Corporates | | | 5.9% | |
| Asset-Backed Securities | | | 3.0% | |
| U.S. Government Agencies | | | 2.8% | |
| Emerging Markets Bonds | | | 2.7% | |
| Collateralized Debt Obligations | | | 1.4% | |
| Non-U.S. Government Bonds | | | 1.0% | |
| Municipal Bonds | | | 0.1% | |
| | | | |
| Composition including fixed income credit quality (a)(i) | |
| AAA | | | 5.0% | |
| AA | | | 2.0% | |
| A | | | 14.3% | |
| BBB | | | 31.3% | |
| BB | | | 5.2% | |
| B | | | 3.6% | |
| CCC | | | 0.1% | |
| CC | | | 0.2% | |
| C | | | 0.1% | |
| D (o) | | | 0.0% | |
| U.S. Government | | | 16.0% | |
| Federal Agencies | | | 20.4% | |
| Not Rated | | | (3.3)% | |
| Cash & Other | | | 5.1% | |
| |
| Portfolio facts (i) | | | | |
| Average Duration (d) | | | 5.2 | |
| Average Effective Maturity (m) | | | 7.3 yrs. | |
| (a) | For all securities other than those specifically described below, ratings are assigned to underlying securities utilizing ratings from Moody’s, Fitch, and Standard & Poor’s rating agencies and applying the following hierarchy: If all three agencies provide a rating, the middle rating (after dropping the highest and lowest ratings) is assigned; if two of the three agencies rate a security, the lower of the two is assigned. Ratings are shown in the S&P and Fitch scale (e.g., AAA). Securities rated BBB or higher are considered investment grade. All ratings are subject to change. U.S. Government includes securities issued by the U.S. Department of the Treasury. Federal Agencies includes rated and unrated U.S. Agency fixed-income securities, U.S. Agency mortgage-backed securities, and collateralized mortgage obligations of U.S. Agency mortgage-backed securities. Not Rated includes fixed income securities, including fixed income futures contracts, which have not been rated by any rating agency. The fund may not hold all of these instruments. The fund is not rated by these agencies. |
2
Portfolio Composition – continued
| (d) | Duration is a measure of how much a bond’s price is likely to fluctuate with general changes in interest rates, e.g., if rates rise 1.00%, a bond with a 5-year duration is likely to lose about 5.00% of its value due to the interest rate move. |
| (i) | For purposes of this presentation, the components include the market value of securities, and reflect the impact of the equivalent exposure of derivative positions, if any. These amounts may be negative from time to time. Equivalent exposure is a calculated amount that translates the derivative position into a reasonable approximation of the amount of the underlying asset that the portfolio would have to hold at a given point in time to have the same price sensitivity that results from the portfolio’s ownership of the derivative contract. When dealing with derivatives, equivalent exposure is a more representative measure of the potential impact of a position on portfolio performance than market value. The bond component will include any accrued interest amounts. |
| (m) | In determining an instrument’s effective maturity for purposes of calculating the fund’s dollar-weighted average effective maturity, MFS uses the instrument’s stated maturity or, if applicable, an earlier date on which MFS believes it is probable that a maturity-shortening device (such as a put, pre-refunding or prepayment) will cause the instrument to be repaid. Such an earlier date can be substantially shorter than the instrument’s stated maturity. |
Where the fund holds convertible bonds, these are treated as part of the equity portion of the portfolio.
Cash & Other includes cash, other assets less liabilities, offsets to derivative positions, and short-term securities.
Percentages are based on net assets as of 4/30/14.
The portfolio is actively managed and current holdings may be different.
3
MANAGEMENT REVIEW
Summary of Results
For the twelve months ended April 30, 2014, Class A shares of the MFS Research Bond Fund (“fund”) provided a total return of 0.92%, at net asset value. This compares with a return of –0.26% for the fund’s benchmark, the Barclays U.S. Aggregate Bond Index.
Market Environment
Early in the period, jitters over a banking crisis in Cyprus were more than offset by ongoing accommodative global monetary policy and improving economic data, resulting in gains in both equity and fixed income markets. As the period progressed, concerns that the US Federal Reserve (“Fed”) would begin tapering its quantitative easing (“QE”) program caused sovereign bond yields to spike, credit spreads to widen, and equity valuations to fall. Equities subsequently outperformed fixed income in response to the improved economic fundamentals. A general theme in the market was a rotation in investor allocations from fixed income to equities and emerging markets to developed markets, reflecting an anticipated acceleration in developed market growth rates relative to emerging markets as well as a more equity-friendly macro backdrop.
Toward the middle of the period, the Fed’s decision to postpone QE tapering surprised markets. Favorable market reactions were tempered, however, by tense negotiations over US fiscal policy which resulted in a 16-day partial shutdown of the federal government and a short-term extension in the debt ceiling. The volatility was short-lived, however, as an extension of budget and debt ceiling deadlines allowed the government to re-open, and subsequent economic data reflected moderate but resilient US growth. Also well-received was the decision by the European Central Bank to cut its policy rate as inflation pressures waned in the region. In addition, equity investors appeared to have concluded that there would be no major change in US monetary policy as a result of the nomination of Janet Yellen as the new Fed Chair for a term beginning in early 2014.
During the period, emerging market (“EM”) stresses surfaced as markets focused on imbalances and stagflationary conditions in certain EM countries. In addition, political instability increased in certain areas, notably in the Ukraine where tensions escalated following a change in government and Russia’s annexation of Crimea. Later in the period, markets were forced to contend with some unexpected weakness in the US economy due largely to weather-related interruptions to hiring and spending plans as well as production schedules. Once again, the setback was short-lived as the major US equity indexes traded near their all-time highs by the end of the period.
Factors Affecting Performance
During the reporting period, strong bond selection, most notably within the industrial sector, benefited relative performance. The fund’s return from yield, which was greater than that of the Barclays U.S. Aggregate Bond Index, was also a positive factor for relative results.
4
Management Review – continued
A greater exposure to the finance sector strengthened relative returns. Credit quality, particularly the fund’s greater relative exposure to “BBB” and “BB” rated (r) securities, was another positive contributor to relative performance as bonds within these quality tiers performed well over the reporting period.
The fund’s greater exposure to shifts in the middle portion (centered around maturities of 7 years) of the yield curve (y) was an area of relative weakness during the reporting period.
Respectfully,
| | | | |
| Joshua Marston | | Robert Persons | | Jeffrey Wakelin |
| Portfolio Manager | | Portfolio Manager | | Portfolio Manager |
| (r) | Bonds rated “BBB”, “Baa”, or higher are considered investment grade; bonds rated “BB”, “Ba”, or below are considered non-investment grade. The sources for bond quality ratings are Moody’s Investors Service, Standard & Poor’s and Fitch, Inc. and are applied using the following hierarchy: If all three agencies provide a rating, the middle rating (after dropping the highest and lowest ratings) is assigned; if two of the three agencies rate a security, the lower of the two is assigned. Ratings are shown in the S&P and Fitch scale (e.g., AAA). For securities which are not rated by any of the three agencies, the security is considered Not Rated. |
| (y) | A yield curve graphically depicts the yields of different maturity bonds of the same credit quality and type; a normal yield curve is upward sloping, with short-term rates lower than long-term rates. |
The views expressed in this report are those of the portfolio managers only through the end of the period of the report as stated on the cover and do not necessarily reflect the views of MFS or any other person in the MFS organization. These views are subject to change at any time based on market or other conditions, and MFS disclaims any responsibility to update such views. These views may not be relied upon as investment advice or an indication of trading intent on behalf of any MFS portfolio. References to specific securities are not recommendations of such securities, and may not be representative of any MFS portfolio’s current or future investments.
5
PERFORMANCE SUMMARY THROUGH 4/30/14
The following chart illustrates a representative class of the fund’s historical performance in comparison to its benchmark(s). Performance results include the deduction of the maximum applicable sales charge and reflect the percentage change in net asset value, including reinvestment of dividends and capital gains distributions. The performance of other share classes will be greater than or less than that of the class depicted below. Benchmarks are unmanaged and may not be invested in directly. Benchmark returns do not reflect sales charges, commissions or expenses. (See Notes to Performance Summary.)
Performance data shown represents past performance and is no guarantee of future results. Investment return and principal value fluctuate so your shares, when sold, may be worth more or less than the original cost; current performance may be lower or higher than quoted. The performance shown does not reflect the deduction of taxes, if any, that a shareholder would pay on fund distributions or the redemption of fund shares.
Growth of a Hypothetical $10,000 Investment
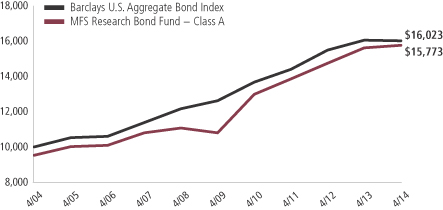
6
Performance Summary – continued
Total Returns through 4/30/14
Average annual without sales charge
| | | | | | | | | | | | | | |
| | | Share class | | Class inception date | | 1-yr | | 5-yr | | 10-yr | | Life (t) | | |
| | | A | | 1/04/99 | | 0.92% | | 7.88% | | 5.17% | | N/A | | |
| | | B | | 12/29/00 | | 0.08% | | 7.05% | | 4.32% | | N/A | | |
| | | C | | 12/29/00 | | (0.03)% | | 6.97% | | 4.28% | | N/A | | |
| | | I | | 1/04/99 | | 0.98% | | 8.04% | | 5.33% | | N/A | | |
| | | R1 | | 4/01/05 | | (0.03)% | | 6.97% | | N/A | | 4.32% | | |
| | | R2 | | 10/31/03 | | 0.47% | | 7.51% | | 4.72% | | N/A | | |
| | | R3 | | 4/01/05 | | 0.72% | | 7.78% | | N/A | | 5.10% | | |
| | | R4 | | 4/01/05 | | 0.97% | | 8.05% | | N/A | | 5.38% | | |
| | | R5 | | 5/01/06 | | 1.07% | | 8.01% | | N/A | | 5.86% | | |
| | | 529A | | 7/31/02 | | 0.86% | | 7.84% | | 4.98% | | N/A | | |
| | | 529B | | 7/31/02 | | (0.08)% | | 6.89% | | 4.13% | | N/A | | |
| | | 529C | | 7/31/02 | | (0.08)% | | 6.92% | | 4.13% | | N/A | | |
| Comparative benchmark | | | | | | |
| | | Barclays U.S. Aggregate Bond Index (f) | | (0.26)% | | 4.88% | | 4.83% | | N/A | | |
| Average annual with sales charge | | | | | | | | |
| | | A
With initial Sales Charge (4.75%) | | (3.88)% | | 6.84% | | 4.66% | | N/A | | |
| | | B
With CDSC (Declining over six years from 4% to 0%) (v) | | (3.83)% | | 6.75% | | 4.32% | | N/A | | |
| | | C
With CDSC (1% for 12 months) (v) | | (1.00)% | | 6.97% | | 4.28% | | N/A | | |
| | | 529A
With initial Sales Charge (4.75%) | | (3.93)% | | 6.79% | | 4.47% | | N/A | | |
| | | 529B
With CDSC (Declining over six years from 4% to 0%) (v) | | (3.99)% | | 6.59% | | 4.13% | | N/A | | |
| | | 529C
With CDSC (1% for 12 months) (v) | | (1.06)% | | 6.92% | | 4.13% | | N/A | | |
As further discussed in Note 5 in the Notes to Financial Statements, on May 10, 2012, sales of Class W shares (including exchanges) were suspended. On May 11, 2012, certain Class W shares were automatically converted to Class I shares. Shareholders of certain Class W shares became shareholders of Class I and received Class I shares with a total net asset value equal to their Class W shares at the time of the conversion. On May 30, 2012, remaining Class W shares, which represented MFS seed money, were redesignated Class R5. Class R5 shares are generally available only to certain eligible retirement plans and to funds distributed by MFD. Class R5 shares do not pay a 12b-1 distribution fee or sub-accounting costs. Class W shares had different fees and expenses than Class R5 shares. On June 1, 2012, Class R5 shares were offered for sale to the public.
7
Performance Summary – continued
CDSC – Contingent Deferred Sales Charge.
Class I, R1, R2, R3, R4, and R5 shares do not have a sales charge.
| (f) | Source: FactSet Research Systems Inc. |
| (t) | For the period from the class inception date through the stated period end (for those share classes with less than 10 years of performance history). No comparative benchmark performance information is provided for “life” periods. (See Notes to Performance Summary.) |
| (v) | Assuming redemption at the end of the applicable period. |
Benchmark Definition
Barclays U.S. Aggregate Bond Index – a market capitalization-weighted index that measures the performance of the U.S. investment-grade, fixed rate bond market, with index components for government and corporate securities, mortgage pass-through securities, and asset-backed securities with at least one year to final maturity.
It is not possible to invest directly in an index.
Notes to Performance Summary
Class 529 shares are only available in conjunction with qualified tuition programs, such as the MFS 529 Savings Plan. There also is an additional fee, which is detailed in the program description, on qualified tuition programs. If this fee was reflected, the performance for Class 529 shares would have been lower. This annual fee is waived for Oregon residents and for those accounts with assets of $25,000 or more.
Average annual total return represents the average annual change in value for each share class for the periods presented. Life returns are presented where the share class has less than 10 years of performance history and represent the average annual total return from the class inception date to the stated period end date. As the fund’s share classes may have different inception dates, the life returns may represent different time periods and may not be comparable. As a result, no comparative benchmark performance information is provided for life periods.
Performance results reflect any applicable expense subsidies and waivers in effect during the periods shown. Without such subsidies and waivers the fund’s performance results would be less favorable. Please see the prospectus and financial statements for complete details.
Performance results do not include adjustments made for financial reporting purposes in accordance with U.S. generally accepted accounting principles and may differ from amounts reported in the financial highlights.
From time to time the fund may receive proceeds from litigation settlements, without which performance would be lower.
8
EXPENSE TABLE
Fund expenses borne by the shareholders during the period, November 1, 2013 through April 30, 2014
As a shareholder of the fund, you incur two types of costs: (1) transaction costs, including sales charges (loads) on certain purchase or redemption payments, and (2) ongoing costs, including management fees; distribution and service (12b-1) fees; and other fund expenses. This example is intended to help you understand your ongoing costs (in dollars) of investing in the fund and to compare these costs with the ongoing costs of investing in other mutual funds.
The example is based on an investment of $1,000 invested at the beginning of the period and held for the entire period November 1, 2013 through April 30, 2014.
Actual Expenses
The first line for each share class in the following table provides information about actual account values and actual expenses. You may use the information in this line, together with the amount you invested, to estimate the expenses that you paid over the period. Simply divide your account value by $1,000 (for example, an $8,600 account value divided by $1,000 = 8.6), then multiply the result by the number in the first line under the heading entitled “Expenses Paid During Period” to estimate the expenses you paid on your account during this period.
Hypothetical Example for Comparison Purposes
The second line for each share class in the following table provides information about hypothetical account values and hypothetical expenses based on the fund’s actual expense ratio and an assumed rate of return of 5% per year before expenses, which is not the fund’s actual return. The hypothetical account values and expenses may not be used to estimate the actual ending account balance or expenses you paid for the period. You may use this information to compare the ongoing costs of investing in the fund and other funds. To do so, compare this 5% hypothetical example with the 5% hypothetical examples that appear in the shareholder reports of the other funds.
Please note that the expenses shown in the table are meant to highlight your ongoing costs only and do not reflect any transactional costs, such as sales charges (loads). Therefore, the second line for each share class in the table is useful in comparing ongoing costs only, and will not help you determine the relative total costs of owning different funds. In addition, if these transactional costs were included, your costs would have been higher.
9
Expense Table – continued
| | | | | | | | | | | | | | | | | | |
Share Class | | | | Annualized
Expense Ratio | | | Beginning
Account Value
11/01/13 | | | Ending Account Value 4/30/14 | | | Expenses Paid During Period (p) 11/01/13-4/30/14 | |
| A | | Actual | | | 0.78% | | | | $1,000.00 | | | | $1,025.05 | | | | $3.92 | |
| | Hypothetical (h) | | | 0.78% | | | | $1,000.00 | | | | $1,020.93 | | | | $3.91 | |
| B | | Actual | | | 1.52% | | | | $1,000.00 | | | | $1,021.22 | | | | $7.62 | |
| | Hypothetical (h) | | | 1.52% | | | | $1,000.00 | | | | $1,017.26 | | | | $7.60 | |
| C | | Actual | | | 1.63% | | | | $1,000.00 | | | | $1,020.72 | | | | $8.17 | |
| | Hypothetical (h) | | | 1.63% | | | | $1,000.00 | | | | $1,016.71 | | | | $8.15 | |
| I | | Actual | | | 0.63% | | | | $1,000.00 | | | | $1,025.82 | | | | $3.16 | |
| | Hypothetical (h) | | | 0.63% | | | | $1,000.00 | | | | $1,021.67 | | | | $3.16 | |
| R1 | | Actual | | | 1.63% | | | | $1,000.00 | | | | $1,020.72 | | | | $8.17 | |
| | Hypothetical (h) | | | 1.63% | | | | $1,000.00 | | | | $1,016.71 | | | | $8.15 | |
| R2 | | Actual | | | 1.13% | | | | $1,000.00 | | | | $1,023.27 | | | | $5.67 | |
| | Hypothetical (h) | | | 1.13% | | | | $1,000.00 | | | | $1,019.19 | | | | $5.66 | |
| R3 | | Actual | | | 0.88% | | | | $1,000.00 | | | | $1,024.55 | | | | $4.42 | |
| | Hypothetical (h) | | | 0.88% | | | | $1,000.00 | | | | $1,020.43 | | | | $4.41 | |
| R4 | | Actual | | | 0.63% | | | | $1,000.00 | | | | $1,025.83 | | | | $3.16 | |
| | Hypothetical (h) | | | 0.63% | | | | $1,000.00 | | | | $1,021.67 | | | | $3.16 | |
| R5 | | Actual | | | 0.55% | | | | $1,000.00 | | | | $1,026.23 | | | | $2.76 | |
| | Hypothetical (h) | | | 0.55% | | | | $1,000.00 | | | | $1,022.07 | | | | $2.76 | |
| 529A | | Actual | | | 0.82% | | | | $1,000.00 | | | | $1,024.81 | | | | $4.12 | |
| | Hypothetical (h) | | | 0.82% | | | | $1,000.00 | | | | $1,020.73 | | | | $4.11 | |
| 529B | | Actual | | | 1.68% | | | | $1,000.00 | | | | $1,020.46 | | | | $8.42 | |
| | Hypothetical (h) | | | 1.68% | | | | $1,000.00 | | | | $1,016.46 | | | | $8.40 | |
| 529C | | Actual | | | 1.68% | | | | $1,000.00 | | | | $1,020.46 | | | | $8.42 | |
| | Hypothetical (h) | | | 1.68% | | | | $1,000.00 | | | | $1,016.46 | | | | $8.40 | |
| (h) | 5% class return per year before expenses. |
| (p) | “Expenses Paid During Period” are equal to each class’s annualized expense ratio, as shown above, multiplied by the average account value over the period, multiplied by 181/365 (to reflect the one-half year period). Expenses paid do not include any applicable sales charges (loads). If these transaction costs had been included, your costs would have been higher. |
Notes to Expense Table
Each class with a Rule 12b-1 service fee is subject to a rebate of a portion of such fee. Such rebates are included in the expense ratios above. For Class 529A shares, this rebate reduced the expense ratio above by 0.01%. See Note 3 in the Notes to Financial Statements for additional information.
10
PORTFOLIO OF INVESTMENTS
4/30/14
The Portfolio of Investments is a complete list of all securities owned by your fund. It is categorized by broad-based asset classes.
| | | | | | | | |
| Bonds - 97.5% | | | | | | | | |
| Issuer | | Shares/Par | | | Value ($) | |
| | | | | | | | |
| Aerospace - 0.2% | | | | | | | | |
| Bombardier, Inc., 7.75%, 3/15/20 (n) | | $ | 8,145,000 | | | $ | 9,285,300 | |
| | |
| Apparel Manufacturers - 0.0% | | | | | | | | |
| PVH Corp., 4.5%, 12/15/22 | | $ | 200,000 | | | $ | 196,740 | |
| | |
| Asset-Backed & Securitized - 12.7% | | | | | | | | |
| Anthracite Ltd., CDO III, 6.077%, 3/23/39 (a)(p)(z) | | $ | 6,058,066 | | | $ | 302,903 | |
| ARI Fleet Lease Trust, “A”, FRN, 0.702%, 3/15/20 (n) | | | 2,454,960 | | | | 2,457,511 | |
| ARI Fleet Lease Trust, “A”, FRN, 0.452%, 1/15/21 (n) | | | 3,667,923 | | | | 3,665,139 | |
| Babson Ltd., CLO, “A1”, FRN, 0.478%, 7/20/19 (n) | | | 654,087 | | | | 650,322 | |
| Babson Ltd., CLO, FRN, 1.328%, 4/20/25 (z) | | | 9,464,922 | | | | 9,335,035 | |
Banc of America Commercial Mortgage, Inc.,
5.338%, 12/15/43 (n) | | | 9,482,898 | | | | 10,329,560 | |
| Banc of America Commercial Mortgage, Inc., FRN, 5.776%, 4/24/49 (n) | | | 2,193,253 | | | | 2,388,260 | |
| Banc of America Large Loan, Inc., FRN, 5.325%, 2/24/44 (n) | | | 6,339,268 | | | | 6,755,511 | |
| Bayview Commercial Asset Trust, FRN, 0.462%, 8/25/35 (z) | | | 453,054 | | | | 401,603 | |
| Bayview Commercial Asset Trust, FRN, 0%, 4/25/36 (i)(z) | | | 11,215,483 | | | | 1 | |
| Bayview Commercial Asset Trust, FRN, 0.422%, 4/25/36 (z) | | | 363,243 | | | | 315,202 | |
| Bayview Commercial Asset Trust, FRN, 0%, 7/25/36 (i)(z) | | | 10,647,891 | | | | 1 | |
| Bayview Commercial Asset Trust, FRN, 0%, 10/25/36 (i)(z) | | | 17,857,426 | | | | 2 | |
| Bayview Commercial Asset Trust, FRN, 0%, 12/25/36 (i)(z) | | | 8,493,236 | | | | 1 | |
| Bayview Commercial Asset Trust, FRN, 0%, 3/25/37 (i)(z) | | | 19,574,186 | | | | 2 | |
| Bayview Financial Acquisition Trust, FRN, 5.638%, 11/28/36 | | | 1,254,850 | | | | 1,227,457 | |
| Bayview Financial Acquisition Trust, FRN, 5.483%, 2/28/41 | | | 1,110,835 | | | | 1,138,093 | |
| Bayview Financial Revolving Mortgage Loan Trust, FRN, 1.752%, 12/28/40 (z) | | | 2,996,429 | | | | 1,982,843 | |
| Capital Trust Realty Ltd., CDO, 5.16%, 6/25/35 (n) | | | 213,435 | | | | 219,138 | |
| Capital Trust Realty Ltd., CDO, 5.26%, 6/25/35 (z) | | | 7,074,200 | | | | 7,163,335 | |
| Cent CDO XI Ltd., “A1”, FRN, 0.489%, 4/25/19 (n) | | | 5,393,678 | | | | 5,330,766 | |
| Chesapeake Funding LLC, “A”, FRN, 0.902%, 11/07/23 (n) | | | 4,981,218 | | | | 4,999,304 | |
| Chesapeake Funding LLC, “A”, FRN, 0.602%, 1/07/25 (n) | | | 16,383,000 | | | | 16,402,709 | |
| Citigroup/Deutsche Bank Commercial Mortgage Trust, 5.322%, 12/11/49 | | | 21,251,642 | | | | 23,234,293 | |
| Citigroup/Deutsche Bank Commercial Mortgage Trust, FRN, 5.402%, 7/15/44 | | | 400,000 | | | | 422,372 | |
| Citigroup/Deutsche Bank Commercial Mortgage Trust, FRN, 5.366%, 12/11/49 | | | 12,940,000 | | | | 13,606,410 | |
CNH Wholesale Master Note Trust, “A”, FRN,
0.752%, 8/15/19 (n) | | | 14,837,000 | | | | 14,854,122 | |
11
Portfolio of Investments – continued
| | | | | | | | |
| Issuer | | Shares/Par | | | Value ($) | |
| | | | | | | | |
| Bonds - continued | | | | | | | | |
| Asset-Backed & Securitized - continued | | | | | | | | |
| Commercial Mortgage Asset Trust, FRN, 0.811%, 1/17/32 (i)(z) | | $ | 3,121,781 | | | $ | 18,181 | |
| Countrywide Asset-Backed Certificates, FRN, 5.062%, 4/25/36 | | | 711,859 | | | | 608,465 | |
| Credit Acceptance Auto Loan Trust, “A”, 2.2%, 9/16/19 (n) | | | 3,198,079 | | | | 3,218,988 | |
| Credit Acceptance Auto Loan Trust, “A”, 1.52%, 3/16/20 (n) | | | 5,595,000 | | | | 5,624,592 | |
| Credit Suisse Commercial Mortgage Trust, “A4”, FRN, 6.053%, 9/15/39 | | | 18,235,102 | | | | 19,942,053 | |
| Credit Suisse Commercial Mortgage Trust, “AM”, FRN, 5.866%, 6/15/39 | | | 18,890,966 | | | | 20,095,190 | |
| Credit Suisse Commercial Mortgage Trust, FRN, “C4”, 6.053%, 9/15/39 | | | 6,516,581 | | | | 7,082,096 | |
| Credit Suisse Mortgage Capital Certificate, 5.311%, 12/15/39 | | | 7,531,000 | | | | 8,156,751 | |
| Credit Suisse Mortgage Capital Certificate, FRN, 5.694%, 9/15/40 | | | 1,228,261 | | | | 1,239,369 | |
| Credit-Based Asset Servicing & Securitization LLC, 4.332%, 12/25/35 | | | 1,061,400 | | | | 995,385 | |
| Credit-Based Asset Servicing & Securitization LLC, FRN, 4.246%, 1/25/37 (d)(q) | | | 1,724,286 | | | | 813,151 | |
| Credit-Based Asset Servicing & Securitization LLC, FRN, 4.261%, 3/25/37 (d)(q) | | | 2,093,588 | | | | 1,262,754 | |
| CWCapital Cobalt Ltd., “A4”, FRN, 5.963%, 5/15/46 | | | 7,687,053 | | | | 8,523,466 | |
| CWCapital LLC, 5.223%, 8/15/48 | | | 6,150,453 | | | | 6,587,202 | |
| Falcon Franchise Loan LLC, FRN, 11.06%, 1/05/23 (i)(z) | | | 67,448 | | | | 5,679 | |
| Falcon Franchise Loan LLC, FRN, 14.914%, 1/05/25 (i)(z) | | | 660,447 | | | | 211,343 | |
| First Union National Bank Commercial Mortgage, FRN, 1.902%, 1/12/43 (i)(z) | | | 1,498,110 | | | | 1,991 | |
First Union-Lehman Brothers Bank of America, FRN,
0.706%, 11/18/35 (i) | | | 2,288,915 | | | | 42,965 | |
| Ford Credit Floorplan Master Owner Trust, “A”, FRN, 0.502%, 9/15/16 | | | 14,401,000 | | | | 14,411,815 | |
| GE Capital Commercial Mortgage Corp., “A”, 5.543%, 12/10/49 | | | 3,400,691 | | | | 3,707,739 | |
| GE Equipment Transportation LLC, 2013-2, “A2”, 0.61%, 6/24/16 | | | 1,259,000 | | | | 1,260,395 | |
| GMAC Mortgage Corp. Loan Trust, FRN, 5.805%, 10/25/36 | | | 1,402,768 | | | | 1,327,060 | |
| Goldman Sachs Mortgage Securities Corp., FRN, 5.997%, 8/10/45 | | | 21,748,944 | | | | 24,151,397 | |
| Gramercy Real Estate Ltd., CDO, FRN, 0.549%, 7/25/35 (z) | | | 190,506 | | | | 188,630 | |
| Greenwich Capital Commercial Funding Corp., 5.475%, 3/10/39 | | | 13,871,121 | | | | 14,944,676 | |
Hertz Fleet Lease Funding LP, 2013-3, “A”, FRN,
0.7%, 12/10/27 (n) | | | 8,437,000 | | | | 8,453,984 | |
| Hertz Fleet Lease Funding LP, 2014-1, FRN, 0.55%, 4/10/28 (z) | | | 9,576,000 | | | | 9,576,000 | |
| IMPAC CMB Trust, FRN, 0.892%, 11/25/34 | | | 149,408 | | | | 142,289 | |
| IMPAC CMB Trust, FRN, 1.072%, 11/25/34 | | | 74,704 | | | | 68,450 | |
| IMPAC Secured Assets Corp., FRN, 0.502%, 5/25/36 | | | 520,401 | | | | 510,433 | |
12
Portfolio of Investments – continued
| | | | | | | | |
| Issuer | | Shares/Par | | | Value ($) | |
| | | | | | | | |
| Bonds - continued | | | | | | | | |
| Asset-Backed & Securitized - continued | | | | | | | | |
| JPMorgan Chase Commercial Mortgage Securities Corp., “A3”, FRN, 5.989%, 6/15/49 | | $ | 15,661,513 | | | $ | 16,002,104 | |
| JPMorgan Chase Commercial Mortgage Securities Corp., “A3”, FRN, 6.135%, 2/15/51 | | | 11,428,765 | | | | 11,462,823 | |
| JPMorgan Chase Commercial Mortgage Securities Corp., “A4”, FRN, 5.989%, 6/15/49 | | | 9,433,747 | | | | 10,420,640 | |
| JPMorgan Chase Commercial Mortgage Securities Corp., FRN, 5.62%, 7/15/42 (n) | | | 4,180,000 | | | | 991,496 | |
| JPMorgan Chase Commercial Mortgage Securities Corp., FRN, 5.895%, 2/12/49 | | | 2,662,741 | | | | 2,947,242 | |
| JPMorgan Chase Commercial Mortgage Trust, 2007-LD11, “AM”, FRN, 5.989%, 6/15/49 | | | 14,758,106 | | | | 15,490,595 | |
| Kingsland III Ltd., “A1”, CDO, FRN, 0.451%, 8/24/21 (n) | | | 4,245,170 | | | | 4,209,345 | |
| KKR Financial CLO Ltd., “A1”, FRN, 0.498%, 4/26/17 (n) | | | 196,431 | | | | 196,012 | |
| KKR Financial CLO Ltd., “C”, FRN, 1.686%, 5/15/21 (n) | | | 7,811,290 | | | | 7,569,452 | |
| LB Commercial Conduit Mortgage Trust, FRN, 1.557%, 10/15/35 (i) | | | 1,319,448 | | | | 57,787 | |
| Merrill Lynch Mortgage Investors, Inc., 5.12%, 2/25/37 (d)(q) | | | 2,371,602 | | | | 550,824 | |
| Merrill Lynch Mortgage Trust, “A3”, FRN, 6.032%, 6/12/50 | | | 5,919,627 | | | | 6,074,260 | |
| Merrill Lynch/Countrywide Commercial Mortgage Trust, FRN, 5.81%, 6/12/50 | | | 22,016,127 | | | | 24,330,815 | |
| Morgan Stanley Capital I Trust, “AM”, FRN, 5.869%, 4/15/49 | | | 16,012,000 | | | | 16,895,270 | |
| Morgan Stanley Capital I, Inc., FRN, 1.715%, 3/15/31 (i)(z) | | | 222,014 | | | | 9 | |
| Morgan Stanley Re-REMIC Trust, FRN, 5.997%, 8/15/45 (n) | | | 17,036,082 | | | | 18,738,634 | |
| Nissan Auto Lease Trust, 2013-B, “A3”, 0.75%, 6/15/16 | | | 6,181,000 | | | | 6,195,346 | |
| Option One Mortgage Loan Trust, FRN, 5.611%, 1/25/37 | | | 1,280,000 | | | | 1,265,549 | |
| Ownit Mortgage Loan Asset-Backed Certificates, FRN, 3.456%, 12/25/36 (d)(q) | | | 1,007,625 | | | | 449,825 | |
| Preferred Term Securities XIX Ltd., CDO, FRN, 0.583%, 12/22/35 (z) | | | 6,365,105 | | | | 4,979,167 | |
| Race Point CLO Ltd., “A1A”, FRN, 0.425%, 8/01/21 (n) | | | 16,084,075 | | | | 15,916,720 | |
| Residential Funding Mortgage Securities, Inc., FRN, 5.32%, 12/25/35 | | | 6,933,930 | | | | 5,554,973 | |
| Smart Trust, “A2B”, FRN, 0.483%, 6/14/15 (n) | | | 4,278,628 | | | | 4,279,257 | |
| Smart Trust, “A2B”, FRN, 0.401%, 9/14/15 | | | 5,544,485 | | | | 5,545,198 | |
| Thornburg Mortgage Securities Trust, FRN, 0.832%, 4/25/43 | | | 19,699 | | | | 19,622 | |
| Wachovia Bank Commercial Mortgage Trust, “A4”, FRN, 6.132%, 2/15/51 | | | 10,682,873 | | | | 11,731,215 | |
| Wachovia Bank Commercial Mortgage Trust, FRN, 5.934%, 6/15/49 | | | 21,096,007 | | | | 23,262,040 | |
| | | | | | | | |
| | | | | | | $ | 505,490,604 | |
13
Portfolio of Investments – continued
| | | | | | | | |
| Issuer | | Shares/Par | | | Value ($) | |
| | | | | | | | |
| Bonds - continued | | | | | | | | |
| Automotive - 0.8% | | | | | | | | |
| Delphi Corp., 5%, 2/15/23 | | $ | 9,490,000 | | | $ | 10,059,400 | |
| Harley-Davidson Financial Services, 3.875%, 3/15/16 (n) | | | 6,172,000 | | | | 6,498,530 | |
| Lear Corp., 8.125%, 3/15/20 | | | 4,500,000 | | | | 4,905,000 | |
| TRW Automotive, Inc., 4.5%, 3/01/21 (n) | | | 7,077,000 | | | | 7,360,080 | |
| TRW Automotive, Inc., 4.45%, 12/01/23 (n) | | | 4,454,000 | | | | 4,543,080 | |
| | | | | | | | |
| | | | | | | $ | 33,366,090 | |
| Biotechnology - 0.6% | | | | | | | | |
| Life Technologies Corp., 5%, 1/15/21 | | $ | 20,509,000 | | | $ | 22,876,785 | |
| | |
| Broadcasting - 0.8% | | | | | | | | |
| Discovery Communications, Inc., 4.95%, 5/15/42 | | $ | 5,225,000 | | | $ | 5,303,981 | |
| Myriad International Holdings B.V., 6%, 7/18/20 (n) | | | 7,438,000 | | | | 8,126,015 | |
| News America, Inc., 8.5%, 2/23/25 | | | 120,000 | | | | 158,049 | |
| SES Global Americas Holdings GP, 5.3%, 3/25/44 (n) | | | 3,585,000 | | | | 3,721,915 | |
| SES S.A., 3.6%, 4/04/23 (n) | | | 3,480,000 | | | | 3,393,661 | |
| SES S.A., 5.3%, 4/04/43 (z) | | | 4,082,000 | | | | 4,248,386 | |
| SIRIUS XM Radio, Inc., 4.25%, 5/15/20 (n) | | | 8,785,000 | | | | 8,433,600 | |
| | | | | | | | |
| | | | | | | $ | 33,385,607 | |
| Brokerage & Asset Managers - 0.6% | | | | | | | | |
| Affiliated Managers Group, Inc., 4.25%, 2/15/24 | | $ | 2,926,000 | | | $ | 2,977,972 | |
| E*TRADE Financial Corp., 6%, 11/15/17 | | | 8,640,000 | | | | 9,061,200 | |
| Invesco Finance PLC, 3.125%, 11/30/22 | | | 3,588,000 | | | | 3,523,585 | |
| TD Ameritrade Holding Corp., 5.6%, 12/01/19 | | | 5,512,000 | | | | 6,401,565 | |
| | | | | | | | |
| | | | | | | $ | 21,964,322 | |
| Building - 0.5% | | | | | | | | |
| CEMEX Finance LLC, 9.375%, 10/12/22 | | $ | 5,383,000 | | | $ | 6,203,908 | |
| Mohawk Industries, Inc., 6.125%, 1/15/16 | | | 6,391,000 | | | | 6,902,280 | |
| Mohawk Industries, Inc., 3.85%, 2/01/23 | | | 3,818,000 | | | | 3,789,365 | |
| Owens Corning, Inc., 6.5%, 12/01/16 | | | 1,822,000 | | | | 2,006,344 | |
| | | | | | | | |
| | | | | | | $ | 18,901,897 | |
| Business Services - 0.4% | | | | | | | | |
| Equinix, Inc., 4.875%, 4/01/20 | | $ | 5,020,000 | | | $ | 5,120,400 | |
| Tencent Holdings Ltd., 3.375%, 3/05/18 | | | 4,606,000 | | | | 4,698,037 | |
| Tencent Holdings Ltd., 3.375%, 5/02/19 (z) | | | 4,112,000 | | | | 4,133,473 | |
| | | | | | | | |
| | | | | | | $ | 13,951,910 | |
| Cable TV - 0.6% | | | | | | | | |
| Comcast Corp., 4.75%, 3/01/44 | | $ | 3,027,000 | | | $ | 3,155,097 | |
| NBCUniversal Enterprise, Inc., 1.974%, 4/15/19 (n) | | | 2,540,000 | | | | 2,497,910 | |
| Time Warner Cable, Inc., 4.5%, 9/15/42 | | | 1,075,000 | | | | 1,039,702 | |
| Time Warner Entertainment Co. LP, 8.375%, 7/15/33 | | | 5,117,000 | | | | 7,393,569 | |
14
Portfolio of Investments – continued
| | | | | | | | |
| Issuer | | Shares/Par | | | Value ($) | |
| | | | | | | | |
| Bonds - continued | | | | | | | | |
| Cable TV - continued | | | | | | | | |
| Videotron Ltd., 5%, 7/15/22 | | $ | 10,755,000 | | | $ | 10,835,663 | |
| | | | | | | | |
| | | | | | | $ | 24,921,941 | |
| Chemicals - 1.5% | | | | | | | | |
| Celanese U.S. Holdings LLC, 4.625%, 11/15/22 | | $ | 9,376,000 | | | $ | 9,422,880 | |
| CF Industries Holdings, Inc., 7.125%, 5/01/20 | | | 7,265,000 | | | | 8,754,855 | |
| CF Industries Holdings, Inc., 5.375%, 3/15/44 | | | 3,874,000 | | | | 4,066,367 | |
| Dow Chemical Co., 8.55%, 5/15/19 | | | 10,900,000 | | | | 13,973,222 | |
| FMC Corp., 4.1%, 2/01/24 | | | 8,914,000 | | | | 9,205,880 | |
| LYB International Finance B.V., 4%, 7/15/23 | | | 3,779,000 | | | | 3,914,942 | |
| LyondellBasell Industries N.V., 6%, 11/15/21 | | | 290,000 | | | | 342,284 | |
| LyondellBasell Industries N.V., 5.75%, 4/15/24 | | | 8,237,000 | | | | 9,602,925 | |
| | | | | | | | |
| | | | | | | $ | 59,283,355 | |
| Computer Software - 0.0% | | | | | | | | |
| VeriSign, Inc., 4.625%, 5/01/23 | | $ | 585,000 | | | $ | 560,138 | |
| | |
| Computer Software - Systems - 0.0% | | | | | | | | |
| Seagate HDD Cayman, 3.75%, 11/15/18 (n) | | $ | 962,000 | | | $ | 995,670 | |
| | |
| Consumer Products - 0.4% | | | | | | | | |
| Mattel, Inc., 5.45%, 11/01/41 | | $ | 7,642,000 | | | $ | 8,147,541 | |
| Newell Rubbermaid, Inc., 4.7%, 8/15/20 | | | 5,894,000 | | | | 6,295,871 | |
| | | | | | | | |
| | | | | | | $ | 14,443,412 | |
| Consumer Services - 0.4% | | | | | | | | |
| ADT Corp., 6.25%, 10/15/21 (n) | | $ | 4,800,000 | | | $ | 5,004,000 | |
| eBay, Inc., 2.6%, 7/15/22 | | | 3,990,000 | | | | 3,819,172 | |
| Experian Finance PLC, 2.375%, 6/15/17 (n) | | | 5,923,000 | | | | 6,012,307 | |
| | | | | | | | |
| | | | | | | $ | 14,835,479 | |
| Containers - 0.4% | | | | | | | | |
| Crown American LLC, 4.5%, 1/15/23 | | $ | 9,930,000 | | | $ | 9,483,150 | |
| Greif, Inc., 7.75%, 8/01/19 | | | 5,615,000 | | | | 6,401,100 | |
| | | | | | | | |
| | | | | | | $ | 15,884,250 | |
| Defense Electronics - 0.1% | | | | | | | | |
| BAE Systems Holdings, Inc., 6.375%, 6/01/19 (n) | | $ | 2,705,000 | | | $ | 3,120,423 | |
| | |
| Electrical Equipment - 0.2% | | | | | | | | |
| Ericsson, Inc., 4.125%, 5/15/22 | | $ | 6,066,000 | | | $ | 6,253,063 | |
| | |
| Electronics - 0.3% | | | | | | | | |
| NXP B.V., 5.75%, 2/15/21 (n) | | $ | 3,960,000 | | | $ | 4,187,700 | |
| NXP B.V./NXP Funding LLC, 3.75%, 6/01/18 (z) | | | 2,115,000 | | | | 2,112,356 | |
15
Portfolio of Investments – continued
| | | | | | | | |
| Issuer | | Shares/Par | | | Value ($) | |
| | | | | | | | |
| Bonds - continued | | | | | | | | |
| Electronics - continued | | | | | | | | |
| Tyco Electronics Group S.A., 6.55%, 10/01/17 | | $ | 3,194,000 | | | $ | 3,699,824 | |
| Tyco Electronics Group S.A., 2.375%, 12/17/18 | | | 1,643,000 | | | | 1,634,361 | |
| Tyco Electronics Group S.A., 3.5%, 2/03/22 | | | 1,340,000 | | | | 1,348,305 | |
| | | | | | | | |
| | | | | | | $ | 12,982,546 | |
| Emerging Market Quasi-Sovereign - 0.3% | | | | | | | | |
| KazAgro National Management Holding, 4.625%, 5/24/23 (n) | | $ | 4,278,000 | | | $ | 3,978,540 | |
| State Grid Overseas Investment (2014) Ltd., 4.125%, 5/07/24 (z) | | | 9,739,000 | | | | 9,726,729 | |
| | | | | | | | |
| | | | | | | $ | 13,705,269 | |
| Energy - Independent - 1.0% | | | | | | | | |
| Anadarko Petroleum Corp., 6.375%, 9/15/17 | | $ | 1,604,000 | | | $ | 1,853,419 | |
| EOG Resources, Inc., 2.625%, 3/15/23 | | | 4,541,000 | | | | 4,331,437 | |
| EQT Corp., 4.875%, 11/15/21 | | | 5,460,000 | | | | 5,845,613 | |
| Noble Energy, Inc., 4.15%, 12/15/21 | | | 9,910,000 | | | | 10,577,329 | |
| Petrohawk Energy Corp., 7.25%, 8/15/18 | | | 1,500,000 | | | | 1,583,378 | |
| Pioneer Natural Resources Co., 6.65%, 3/15/17 | | | 7,190,000 | | | | 8,159,399 | |
| Southwestern Energy Co., 7.5%, 2/01/18 | | | 6,187,000 | | | | 7,379,433 | |
| | | | | | | | |
| | | | | | | $ | 39,730,008 | |
| Energy - Integrated - 0.7% | | | | | | | | |
| BG Energy Capital PLC, 2.875%, 10/15/16 (n) | | $ | 6,908,000 | | | $ | 7,191,283 | |
| BP Capital Markets PLC, 2.237%, 5/10/19 | | | 8,693,000 | | | | 8,691,505 | |
| Chevron Corp., 1.104%, 12/05/17 | | | 4,990,000 | | | | 4,958,713 | |
| Pacific Rubiales Energy Corp., 5.125%, 3/28/23 (n) | | | 9,177,000 | | | | 8,867,276 | |
| | | | | | | | |
| | | | | | | $ | 29,708,777 | |
| Entertainment - 0.2% | | | | | | | | |
| Six Flags Entertainment Corp., 5.25%, 1/15/21 (n) | | $ | 9,550,000 | | | $ | 9,645,500 | |
| | |
| Financial Institutions - 1.8% | | | | | | | | |
| CIT Group, Inc., 5.5%, 2/15/19 (n) | | $ | 7,342,000 | | | $ | 7,911,005 | |
| General Electric Capital Corp., 2.1%, 12/11/19 | | | 3,604,000 | | | | 3,588,726 | |
| General Electric Capital Corp., 4.65%, 10/17/21 | | | 6,757,000 | | | | 7,478,357 | |
| General Electric Capital Corp., 3.15%, 9/07/22 | | | 8,589,000 | | | | 8,590,194 | |
| General Electric Capital Corp., 6.375% to 11/15/17, FRN to 11/15/67 | | | 5,150,000 | | | | 5,729,375 | |
| International Lease Finance Corp., 7.125%, 9/01/18 (n) | | | 5,888,000 | | | | 6,830,080 | |
| Nationstar Mortgage LLC/Capital Corp., 6.5%, 7/01/21 | | | 10,620,000 | | | | 10,128,825 | |
| NYSE Euronext, 2%, 10/05/17 | | | 4,518,000 | | | | 4,593,920 | |
| SLM Corp., 4.625%, 9/25/17 | | | 11,437,000 | | | | 12,008,850 | |
| SLM Corp., 8%, 3/25/20 | | | 5,422,000 | | | | 6,262,410 | |
| | | | | | | | |
| | | | | | | $ | 73,121,742 | |
16
Portfolio of Investments – continued
| | | | | | | | |
| Issuer | | Shares/Par | | | Value ($) | |
| | | | | | | | |
| Bonds - continued | | | | | | | | |
| Food & Beverages - 1.3% | | | | | | | | |
| BRF S.A., 3.95%, 5/22/23 (n) | | $ | 7,821,000 | | | $ | 7,175,768 | |
| Embotelladora Andina S.A., 5%, 10/01/23 (n) | | | 3,397,000 | | | | 3,606,856 | |
| Kraft Foods Group, Inc., 5%, 6/04/42 | | | 4,384,000 | | | | 4,658,259 | |
| Mead Johnson Nutrition Co., “A”, 4.9%, 11/01/19 | | | 3,146,000 | | | | 3,474,804 | |
| Smithfield Foods, Inc., 6.625%, 8/15/22 | | | 9,195,000 | | | | 10,034,044 | |
| Tyson Foods, Inc., 6.6%, 4/01/16 | | | 8,949,000 | | | | 9,844,374 | |
| Tyson Foods, Inc., 4.5%, 6/15/22 | | | 5,686,000 | | | | 6,018,625 | |
| Wm. Wrigley Jr. Co., 3.375%, 10/21/20 (n) | | | 7,930,000 | | | | 8,154,831 | |
| | | | | | | | |
| | | | | | | $ | 52,967,561 | |
| Forest & Paper Products - 0.5% | | | | | | | | |
| Fibria Overseas Finance Ltd., 6.75%, 3/03/21 | | $ | 3,841,000 | | | $ | 4,215,498 | |
| Georgia-Pacific LLC, 5.4%, 11/01/20 (n) | | | 5,083,000 | | | | 5,787,600 | |
| Georgia-Pacific LLC, 3.734%, 7/15/23 (n) | | | 11,057,000 | | | | 11,113,313 | |
| | | | | | | | |
| | | | | | | $ | 21,116,411 | |
| Gaming & Lodging - 0.6% | | | | | | | | |
| Carnival Corp., 3.95%, 10/15/20 | | $ | 12,226,000 | | | $ | 12,661,735 | |
| Wyndham Worldwide Corp., 5.625%, 3/01/21 | | | 2,221,000 | | | | 2,434,809 | |
| Wyndham Worldwide Corp., 4.25%, 3/01/22 | | | 6,558,000 | | | | 6,665,118 | |
| | | | | | | | |
| | | | | | | $ | 21,761,662 | |
| Insurance - 1.9% | | | | | | | | |
| American International Group, Inc., 4.875%, 9/15/16 | | $ | 4,739,000 | | | $ | 5,156,132 | |
| American International Group, Inc., 6.4%, 12/15/20 | | | 12,214,000 | | | | 14,743,519 | |
| American International Group, Inc., 4.125%, 2/15/24 | | | 3,397,000 | | | | 3,554,818 | |
| Five Corners Funding Trust, 4.419%, 11/15/23 (n) | | | 6,006,000 | | | | 6,272,594 | |
| Genworth Holdings, Inc., 4.9%, 8/15/23 | | | 4,152,000 | | | | 4,449,757 | |
| Metropolitan Life Global Funding I, 5.125%, 6/10/14 (n) | | | 2,570,000 | | | | 2,582,112 | |
| Pacific Lifecorp, 5.125%, 1/30/43 (n) | | | 7,926,000 | | | | 7,954,264 | |
| Unum Group, 7.125%, 9/30/16 | | | 2,220,000 | | | | 2,527,268 | |
| Unum Group, 4%, 3/15/24 | | | 8,486,000 | | | | 8,618,772 | |
| UnumProvident Corp., 6.85%, 11/15/15 (n) | | | 11,413,000 | | | | 12,370,174 | |
| Voya Financial, Inc., 2.9%, 2/15/18 | | | 3,264,000 | | | | 3,367,834 | |
| Voya Financial, Inc., 5.7%, 7/15/43 | | | 2,205,000 | | | | 2,552,850 | |
| | | | | | | | |
| | | | | | | $ | 74,150,094 | |
| Insurance - Health - 0.3% | | | | | | | | |
| Humana, Inc., 7.2%, 6/15/18 | | $ | 9,203,000 | | | $ | 10,969,709 | |
| | |
| Insurance - Property & Casualty - 2.4% | | | | | | | | |
| Allied World Assurance, 5.5%, 11/15/20 | | $ | 3,670,000 | | | $ | 4,099,390 | |
| Allstate Corp., 5.75%, 8/15/53 | | | 3,811,000 | | | | 4,077,770 | |
| AXIS Capital Holdings Ltd., 5.75%, 12/01/14 | | | 5,360,000 | | | | 5,520,896 | |
17
Portfolio of Investments – continued
| | | | | | | | |
| Issuer | | Shares/Par | | | Value ($) | |
| | | | | | | | |
| Bonds - continued | | | | | | | | |
| Insurance - Property & Casualty - continued | | | | | | | | |
| AXIS Specialty Finance LLC, 2.65%, 4/01/19 | | $ | 1,113,000 | | | $ | 1,118,040 | |
| CNA Financial Corp., 5.875%, 8/15/20 | | | 6,990,000 | | | | 8,127,154 | |
| CNA Financial Corp., 3.95%, 5/15/24 | | | 3,926,000 | | | | 4,006,785 | |
| Liberty Mutual Group, Inc., 4.25%, 6/15/23 (n) | | | 13,005,000 | | | | 13,353,066 | |
| Marsh & McLennan Cos., Inc., 4.8%, 7/15/21 | | | 10,943,000 | | | | 11,998,540 | |
| Marsh & McLennan Cos., Inc., 4.05%, 10/15/23 | | | 2,935,000 | | | | 3,026,572 | |
| PartnerRe Ltd., 5.5%, 6/01/20 | | | 4,882,000 | | | | 5,425,752 | |
| QBE Capital Funding III Ltd., FRN, 7.25%, 5/24/41 (n) | | | 7,155,000 | | | | 7,673,738 | |
| QBE Insurance Group Ltd., 2.4%, 5/01/18 (n) | | | 3,721,000 | | | | 3,654,029 | |
| Swiss Re Ltd., 4.25%, 12/06/42 (n) | | | 2,967,000 | | | | 2,825,023 | |
| XL Group PLC, 6.5% to 4/15/17, FRN to 12/29/49 | | | 9,289,000 | | | | 9,149,665 | |
| ZFS Finance USA Trust II, 6.45% to 6/15/16, FRN to 12/15/65 (n) | | | 2,405,000 | | | | 2,585,375 | |
| ZFS Finance USA Trust V, 6.5% to 5/09/17, FRN to 5/09/67 (n) | | | 6,524,000 | | | | 6,996,990 | |
| | | | | | | | |
| | | | | | | $ | 93,638,785 | |
| International Market Quasi-Sovereign - 1.0% | | | | | | | | |
| Achmea Hypotheekbank N.V., 3.2%, 11/03/14 (n) | | $ | 381,000 | | | $ | 386,563 | |
| Electricite de France, 5.25% to 1/29/13, FRN to 12/29/49 (n) | | | 7,217,000 | | | | 7,364,949 | |
| Israel Electric Corp. Ltd., 6.875%, 6/21/23 (n) | | | 9,265,000 | | | | 10,237,825 | |
| Societe Financement de l’ Economie Francaise, 3.375%, 5/05/14 (n) | | | 7,905,000 | | | | 7,905,000 | |
| Statoil A.S.A., 2.45%, 1/17/23 | | | 3,936,000 | | | | 3,722,559 | |
| Statoil A.S.A., 3.7%, 3/01/24 | | | 10,559,000 | | | | 10,858,897 | |
| | | | | | | | |
| | | | | | | $ | 40,475,793 | |
| Local Authorities - 0.8% | | | | | | | | |
| State of California (Build America Bonds), 7.625%, 3/01/40 | | $ | 1,360,000 | | | $ | 1,932,206 | |
| State of California (Build America Bonds), 7.6%, 11/01/40 | | | 10,440,000 | | | | 15,010,006 | |
| State of Illinois (Build America Bonds), 6.63%, 2/01/35 | | | 7,235,000 | | | | 8,248,479 | |
| State of Illinois (Build America Bonds), 6.9%, 3/01/35 | | | 5,360,000 | | | | 6,070,575 | |
| State of Illinois (Build America Bonds), 6.725%, 4/01/35 | | | 1,560,000 | | | | 1,787,152 | |
| | | | | | | | |
| | | | | | | $ | 33,048,418 | |
| Machinery & Tools - 0.2% | | | | | | | | |
| United Rentals North America, Inc., 7.375%, 5/15/20 | | $ | 6,755,000 | | | $ | 7,481,163 | |
| | |
| Major Banks - 7.7% | | | | | | | | |
| ABN AMRO Bank N.V., 4.25%, 2/02/17 (n) | | $ | 7,822,000 | | | $ | 8,400,437 | |
| Banco Santander U.S. Debt S.A.U., 3.781%, 10/07/15 (n) | | | 7,100,000 | | | | 7,370,247 | |
| Bank of America Corp., 6.5%, 8/01/16 | | | 1,460,000 | | | | 1,628,735 | |
| Bank of America Corp., 5.625%, 7/01/20 | | | 2,505,000 | | | | 2,862,804 | |
| Bank of America Corp., 5.875%, 1/05/21 | | | 4,930,000 | | | | 5,716,582 | |
| Bank of America Corp., 3.3%, 1/11/23 | | | 15,044,000 | | | | 14,602,519 | |
| Bank of America Corp., 4.125%, 1/22/24 | | | 13,877,000 | | | | 14,073,207 | |
18
Portfolio of Investments – continued
| | | | | | | | |
| Issuer | | Shares/Par | | | Value ($) | |
| | | | | | | | |
| Bonds - continued | | | | | | | | |
| Major Banks - continued | | | | | | | | |
| Bank of America Corp., 4.875%, 4/01/44 | | $ | 4,316,000 | | | $ | 4,387,145 | |
| Credit Suisse Group AG, 6.5%, 8/08/23 (n) | | | 7,462,000 | | | | 8,329,756 | |
| DBS Bank Ltd., 3.625% to 9/21/17, FRN to 9/21/22 (n) | | | 5,702,000 | | | | 5,836,248 | |
| Goldman Sachs Group, Inc., 5.625%, 1/15/17 | | | 4,693,000 | | | | 5,172,911 | |
| Goldman Sachs Group, Inc., 2.375%, 1/22/18 | | | 7,171,000 | | | | 7,253,660 | |
| Goldman Sachs Group, Inc., 3.625%, 1/22/23 | | | 16,972,000 | | | | 16,830,131 | |
| Goldman Sachs Group, Inc., 4%, 3/03/24 | | | 10,498,000 | | | | 10,533,389 | |
| HSBC Holdings PLC, 4%, 3/30/22 | | | 7,694,000 | | | | 8,088,910 | |
| HSBC Holdings PLC, 5.25%, 3/14/44 | | | 2,564,000 | | | | 2,626,172 | |
| HSBC USA, Inc., 4.875%, 8/24/20 | | | 5,500,000 | | | | 6,044,671 | |
| ING Bank N.V., 2%, 9/25/15 (n) | | | 6,554,000 | | | | 6,661,636 | |
| ING Bank N.V., 3.75%, 3/07/17 (n) | | | 2,945,000 | | | | 3,133,227 | |
| ING Bank N.V., 5.8%, 9/25/23 (n) | | | 11,506,000 | | | | 12,614,948 | |
| JPMorgan Chase & Co., 2%, 8/15/17 | | | 3,141,000 | | | | 3,187,634 | |
| JPMorgan Chase & Co., 4.25%, 10/15/20 | | | 5,000,000 | | | | 5,375,635 | |
| JPMorgan Chase & Co., 4.5%, 1/24/22 | | | 6,850,000 | | | | 7,411,796 | |
| JPMorgan Chase & Co., 3.25%, 9/23/22 | | | 4,744,000 | | | | 4,687,385 | |
| JPMorgan Chase & Co., 3.2%, 1/25/23 | | | 9,726,000 | | | | 9,488,141 | |
| JPMorgan Chase & Co., 6.75% to 2/01/24, FRN to 8/29/49 | | | 9,765,000 | | | | 10,350,900 | |
| JPMorgan Chase Bank N.A., 5.875%, 6/13/16 | | | 4,250,000 | | | | 4,679,794 | |
| Merrill Lynch & Co., Inc., 6.05%, 5/16/16 | | | 6,749,000 | | | | 7,363,935 | |
| Morgan Stanley, 3.875%, 4/29/24 | | | 10,543,000 | | | | 10,480,164 | |
| Morgan Stanley, 5.75%, 10/18/16 | | | 7,752,000 | | | | 8,582,410 | |
| Morgan Stanley, 5.5%, 7/24/20 | | | 4,790,000 | | | | 5,435,323 | |
| Morgan Stanley, 5.5%, 7/28/21 | | | 20,255,000 | | | | 22,921,834 | |
| PNC Bank N.A., 3.8%, 7/25/23 | | | 19,691,000 | | | | 20,029,154 | |
| PNC Funding Corp., 5.625%, 2/01/17 | | | 8,496,000 | | | | 9,431,911 | |
| Regions Financial Corp., 2%, 5/15/18 | | | 3,688,000 | | | | 3,645,570 | |
| Royal Bank of Scotland PLC, 2.55%, 9/18/15 | | | 4,259,000 | | | | 4,349,815 | |
| Royal Bank of Scotland PLC, 6%, 12/19/23 | | | 8,880,000 | | | | 9,276,670 | |
| Wachovia Corp., 6.605%, 10/01/25 | | | 2,393,000 | | | | 2,838,964 | |
| Wells Fargo & Co., 5.375%, 11/02/43 | | | 2,610,000 | | | | 2,810,568 | |
| Wells Fargo & Co., 5.90% to 6/15/24, FRN to 12/29/49 | | | 4,047,000 | | | | 4,144,533 | |
| | | | | | | | |
| | | | | | | $ | 308,659,471 | |
| Medical & Health Technology & Services - 0.4% | | | | | | | | |
| Catholic Health Initiatives, 2.95%, 11/01/22 | | $ | 9,909,000 | | | $ | 9,394,208 | |
| Express Scripts Holding Co., 2.65%, 2/15/17 | | | 6,827,000 | | | | 7,082,603 | |
| | | | | | | | |
| | | | | | | $ | 16,476,811 | |
| Metals & Mining - 1.6% | | | | | | | | |
| Barrick International (Barbados) Corp., 5.75%, 10/15/16 (n) | | $ | 5,766,000 | | | $ | 6,342,998 | |
| Barrick North America Finance LLC, 5.75%, 5/01/43 | | | 8,843,000 | | | | 8,954,793 | |
| Freeport-McMoRan Copper & Gold, Inc., 3.875%, 3/15/23 | | | 3,357,000 | | | | 3,267,687 | |
19
Portfolio of Investments – continued
| | | | | | | | |
| Issuer | | Shares/Par | | | Value ($) | |
| | | | | | | | |
| Bonds - continued | | | | | | | | |
| Metals & Mining - continued | | | | | | | | |
| Kinross Gold Corp., 5.95%, 3/15/24 (n) | | $ | 8,317,000 | | | $ | 8,421,096 | |
| Plains Exploration & Production Co., 6.875%, 2/15/23 | | | 17,930,000 | | | | 20,081,600 | |
| Rio Tinto Finance (USA) PLC, 3.5%, 3/22/22 | | | 10,481,000 | | | | 10,583,232 | |
| Southern Copper Corp., 6.75%, 4/16/40 | | | 5,359,000 | | | | 5,700,143 | |
| | | | | | | | |
| | | | | | | $ | 63,351,549 | |
| Mortgage-Backed - 17.5% | | | | | | | | |
| Fannie Mae, 3.5%, 7/01/43 | | $ | 7,672,633 | | | $ | 7,794,126 | |
| Fannie Mae, 4.77%, 7/01/14 | | | 1,619,986 | | | | 1,624,574 | |
| Fannie Mae, 4.787%, 8/01/14 | | | 771,214 | | | | 773,452 | |
| Fannie Mae, 5.39%, 9/01/14 | | | 319,154 | | | | 320,893 | |
| Fannie Mae, 4.62%, 11/01/14 - 1/01/15 | | | 4,000,068 | | | | 4,022,751 | |
| Fannie Mae, 5.05%, 11/01/14 | | | 1,127,131 | | | | 1,130,032 | |
| Fannie Mae, 4.86%, 12/01/14 | | | 1,479,912 | | | | 1,488,946 | |
| Fannie Mae, 4.85%, 2/01/15 | | | 1,336,807 | | | | 1,354,247 | |
| Fannie Mae, 4.56%, 3/01/15 | | | 21,154 | | | | 21,682 | |
| Fannie Mae, 4.665%, 3/01/15 | | | 1,106,224 | | | | 1,123,870 | |
| Fannie Mae, 4.908%, 4/01/15 | | | 2,075,580 | | | | 2,116,951 | |
| Fannie Mae, 4.815%, 6/01/15 | | | 1,756,447 | | | | 1,798,741 | |
| Fannie Mae, 4.53%, 8/01/15 | | | 1,093,810 | | | | 1,125,183 | |
| Fannie Mae, 4.6%, 8/01/15 | | | 1,750,186 | | | | 1,801,293 | |
| Fannie Mae, 4.7%, 8/01/15 | | | 26,500 | | | | 27,424 | |
| Fannie Mae, 4.78%, 8/01/15 | | | 2,408,318 | | | | 2,481,613 | |
| Fannie Mae, 4.94%, 8/01/15 | | | 2,641,000 | | | | 2,723,671 | |
| Fannie Mae, 4.89%, 10/01/15 | | | 351,601 | | | | 364,712 | |
| Fannie Mae, 5.09%, 2/01/16 | | | 2,643,537 | | | | 2,804,097 | |
| Fannie Mae, 5.132%, 2/01/16 | | | 463,053 | | | | 488,868 | |
| Fannie Mae, 5.432%, 2/01/16 | | | 4,298,746 | | | | 4,579,972 | |
| Fannie Mae, 5.732%, 7/01/16 | | | 1,913,793 | | | | 2,085,228 | |
| Fannie Mae, 5.93%, 9/01/16 | | | 1,163,488 | | | | 1,248,148 | |
| Fannie Mae, 5.395%, 12/01/16 | | | 2,275,084 | | | | 2,490,714 | |
| Fannie Mae, 5.5%, 12/01/16 - 8/01/38 | | | 42,101,166 | | | | 46,605,215 | |
| Fannie Mae, 5.012%, 1/01/17 | | | 2,340,951 | | | | 2,386,518 | |
| Fannie Mae, 5.28%, 3/01/17 | | | 2,561,290 | | | | 2,767,620 | |
| Fannie Mae, 5.54%, 4/01/17 | | | 1,421,715 | | | | 1,540,424 | |
| Fannie Mae, 5.478%, 6/01/17 | | | 1,068,596 | | | | 1,196,922 | |
| Fannie Mae, 2.71%, 11/01/17 | | | 1,476,874 | | | | 1,539,659 | |
| Fannie Mae, 5%, 2/01/18 - 6/01/40 | | | 29,667,838 | | | | 32,521,922 | |
| Fannie Mae, 3.84%, 3/01/18 | | | 1,392,000 | | | | 1,498,127 | |
| Fannie Mae, 3.99%, 4/01/18 | | | 2,450,000 | | | | 2,650,845 | |
| Fannie Mae, 3.849%, 7/01/18 | | | 3,662,918 | | | | 3,950,510 | |
| Fannie Mae, 2.578%, 9/25/18 | | | 11,000,000 | | | | 11,368,412 | |
| Fannie Mae, 2.43%, 1/01/19 | | | 1,939,145 | | | | 1,991,915 | |
| Fannie Mae, 5.18%, 3/01/19 | | | 518,272 | | | | 565,923 | |
20
Portfolio of Investments – continued
| | | | | | | | |
| Issuer | | Shares/Par | | | Value ($) | |
| | | | | | | | |
| Bonds - continued | | | | | | | | |
| Mortgage-Backed - continued | | | | | | | | |
| Fannie Mae, 4.88%, 3/01/20 | | $ | 553,204 | | | $ | 599,808 | |
| Fannie Mae, 5.19%, 9/01/20 | | | 2,694,691 | | | | 2,931,037 | |
| Fannie Mae, 2.41%, 5/01/23 | | | 2,701,978 | | | | 2,597,803 | |
| Fannie Mae, 2.55%, 5/01/23 | | | 1,388,849 | | | | 1,349,194 | |
| Fannie Mae, 4.5%, 5/01/25 | | | 1,181,720 | | | | 1,266,646 | |
| Fannie Mae, 3%, 3/01/27 - 4/01/27 | | | 17,409,628 | | | | 17,981,814 | |
| Fannie Mae, 6.5%, 11/01/31 - 1/01/33 | | | 285,752 | | | | 327,745 | |
| Fannie Mae, 4.5%, 3/01/34 - 10/01/40 | | | 7,932,487 | | | | 8,550,163 | |
| Fannie Mae, 6%, 5/01/34 - 10/01/38 | | | 15,845,042 | | | | 17,731,045 | |
| Fannie Mae, 4%, 2/01/41 | | | 18,948,036 | | | | 19,862,085 | |
| Fannie Mae, 3.5%, 11/01/41 - 1/01/42 | | | 11,611,417 | | | | 11,807,473 | |
| Fannie Mae, 3.5%, 4/01/43 | | | 8,313,595 | | | | 8,447,305 | |
| Fannie Mae, TBA, 4%, 6/25/44 | | | 12,200,000 | | | | 12,738,039 | |
| Fannie Mae, TBA, 4%, 5/25/44 | | | 63,555,000 | | | | 66,586,275 | |
| Fannie Mae, TBA, 4.5%, 5/25/44 | | | 8,740,000 | | | | 9,383,210 | |
| Federal Home Loan Bank, 3%, 5/01/43 | | | 3,986,462 | | | | 3,904,583 | |
| Freddie Mac, 3.034%, 10/25/20 | | | 3,415,000 | | | | 3,537,250 | |
| Freddie Mac, 3.5%, 7/01/42 | | | 10,945,820 | | | | 11,115,826 | |
| Freddie Mac, 1.655%, 11/25/16 | | | 6,270,432 | | | | 6,378,064 | |
| Freddie Mac, 1.426%, 8/25/17 | | | 6,993,000 | | | | 7,045,727 | |
| Freddie Mac, 5.5%, 9/01/17 - 1/01/38 | | | 9,224,021 | | | | 10,195,019 | |
| Freddie Mac, 3.882%, 11/25/17 | | | 8,787,000 | | | | 9,462,290 | |
| Freddie Mac, 3.154%, 2/25/18 | | | 3,479,000 | | | | 3,663,199 | |
| Freddie Mac, 5%, 5/01/18 - 4/01/40 | | | 9,643,476 | | | | 10,575,950 | |
| Freddie Mac, 2.412%, 8/25/18 | | | 4,630,000 | | | | 4,753,908 | |
| Freddie Mac, 2.303%, 9/25/18 | | | 2,159,711 | | | | 2,204,225 | |
| Freddie Mac, 2.323%, 10/25/18 | | | 5,437,000 | | | | 5,548,719 | |
| Freddie Mac, 2.13%, 1/25/19 | | | 14,841,000 | | | | 14,980,565 | |
| Freddie Mac, 1.869%, 11/25/19 | | | 8,154,000 | | | | 8,033,883 | |
| Freddie Mac, 4.251%, 1/25/20 | | | 4,741,000 | | | | 5,230,741 | |
| Freddie Mac, 2.313%, 3/25/20 | | | 9,101,000 | | | | 9,131,215 | |
| Freddie Mac, 3.32%, 7/25/20 - 2/25/23 | | | 7,707,781 | | | | 7,949,558 | |
| Freddie Mac, 2.682%, 10/25/22 | | | 3,790,000 | | | | 3,710,406 | |
| Freddie Mac, 3.25%, 4/25/23 | | | 8,549,000 | | | | 8,681,672 | |
| Freddie Mac, 3.06%, 7/25/23 | | | 5,785,000 | | | | 5,770,086 | |
| Freddie Mac, 3.531%, 7/25/23 | | | 3,060,000 | | | | 3,164,738 | |
| Freddie Mac, 3.458%, 8/25/23 | | | 17,774,000 | | | | 18,274,463 | |
| Freddie Mac, 4%, 7/01/25 - 11/01/43 | | | 32,154,011 | | | | 33,748,001 | |
| Freddie Mac, 4.5%, 7/01/25 - 6/01/41 | | | 2,700,322 | | | | 2,902,257 | |
| Freddie Mac, 3.5%, 8/01/26 - 3/01/43 | | | 19,910,870 | | | | 20,308,423 | |
| Freddie Mac, 6%, 11/01/33 - 7/01/38 | | | 3,938,156 | | | | 4,424,142 | |
| Freddie Mac, 3%, 4/01/43 - 5/01/43 | | | 5,365,830 | | | | 5,252,318 | |
| Freddie Mac, TBA, 4%, 5/15/44 | | | 7,244,000 | | | | 7,579,318 | |
21
Portfolio of Investments – continued
| | | | | | | | |
| Issuer | | Shares/Par | | | Value ($) | |
| | | | | | | | |
| Bonds - continued | | | | | | | | |
| Mortgage-Backed - continued | | | | | | | | |
| Ginnie Mae, 4.5%, 6/20/41 | | $ | 3,308,079 | | | $ | 3,586,364 | |
| Ginnie Mae, 6%, 2/15/34 - 1/15/38 | | | 5,072,451 | | | | 5,714,821 | |
| Ginnie Mae, 5.5%, 4/15/38 - 1/20/42 | | | 7,038,737 | | | | 7,810,867 | |
| Ginnie Mae, 4.5%, 4/15/39 - 2/20/42 | | | 52,647,029 | | | | 57,314,762 | |
| Ginnie Mae, 4%, 10/20/40 - 2/20/41 | | | 16,338,774 | | | | 17,317,849 | |
| Ginnie Mae, 3.5%, 11/15/40 - 4/15/42 | | | 21,988,450 | | | | 22,653,460 | |
| Ginnie Mae, TBA, 4.5%, 5/15/44 | | | 8,000,000 | | | | 8,671,250 | |
| | | | | | | | |
| | | | | | | $ | 699,130,761 | |
| Municipals - 0.1% | | | | | | | | |
| Florida Hurricane Catastrophe Fund Finance Corp. Rev., “A”, 1.298%, 7/01/16 | | $ | 2,565,000 | | | $ | 2,592,779 | |
| | |
| Natural Gas - Distribution - 0.1% | | | | | | | | |
| Centrica PLC, 4%, 10/16/23 (z) | | $ | 5,134,000 | | | $ | 5,114,830 | |
| | |
| Natural Gas - Pipeline - 2.9% | | | | | | | | |
| APT Pipelines Ltd., 3.875%, 10/11/22 (n) | | $ | 12,507,000 | | | $ | 12,179,167 | |
| DCP Midstream LLC, 3.875%, 3/15/23 | | | 3,064,000 | | | | 3,054,165 | |
| El Paso Corp., 7.75%, 1/15/32 | | | 8,840,000 | | | | 9,551,753 | |
| El Paso Pipeline Partners Operating Co. LLC, 4.3%, 5/01/24 | | | 7,843,000 | | | | 7,863,282 | |
| Energy Transfer Partners LP, 4.65%, 6/01/21 | | | 8,511,000 | | | | 9,076,590 | |
| Energy Transfer Partners LP, 5.15%, 2/01/43 | | | 5,108,000 | | | | 5,054,146 | |
| EnLink Midstream Partners LP, 4.4%, 4/01/24 | | | 9,220,000 | | | | 9,492,156 | |
| Enterprise Products Operating LLC, 3.9%, 2/15/24 | | | 2,581,000 | | | | 2,610,139 | |
| Kinder Morgan Energy Partners LP, 6.375%, 3/01/41 | | | 7,490,000 | | | | 8,540,210 | |
| MarkWest Energy Partners LP, 5.5%, 2/15/23 | | | 3,745,000 | | | | 3,885,438 | |
| ONEOK Partners LP, 6.2%, 9/15/43 | | | 7,052,000 | | | | 8,309,477 | |
| Sabine Pass Liquefaction LLC, 5.625%, 2/01/21 | | | 5,320,000 | | | | 5,492,900 | |
| Spectra Energy Capital LLC, 8%, 10/01/19 | | | 8,284,000 | | | | 10,252,055 | |
| Sunoco Logistics Partners LP, 4.25%, 4/01/24 | | | 1,391,000 | | | | 1,420,012 | |
| Williams Cos., Inc., 3.7%, 1/15/23 | | | 13,535,000 | | | | 12,497,244 | |
| Williams Partners LP, 4.3%, 3/04/24 | | | 6,835,000 | | | | 6,978,945 | |
| | | | | | | | |
| | | | | | | $ | 116,257,679 | |
| Network & Telecom - 1.2% | | | | | | | | |
| Empresa Nacional de Telecomunicaciones S.A., 4.875%, 10/30/24 (n) | | $ | 6,726,000 | | | $ | 7,056,435 | |
| Verizon Communications, Inc., 3.45%, 3/15/21 | | | 5,862,000 | | | | 5,993,532 | |
| Verizon Communications, Inc., 5.15%, 9/15/23 | | | 9,431,000 | | | | 10,396,131 | |
| Verizon Communications, Inc., 6.55%, 9/15/43 | | | 18,245,000 | | | | 22,505,098 | |
| | | | | | | | |
| | | | | | | $ | 45,951,196 | |
22
Portfolio of Investments – continued
| | | | | | | | |
| Issuer | | Shares/Par | | | Value ($) | |
| | | | | | | | |
| Bonds - continued | | | | | | | | |
| Oil Services - 0.7% | | | | | | | | |
| Odebrecht Offshore Drilling Finance Ltd., 6.75%, 10/01/22 (n) | | $ | 8,952,626 | | | $ | 9,366,685 | |
| Rowan Cos., Inc., 5.4%, 12/01/42 | | | 8,898,000 | | | | 8,719,070 | |
| Schlumberger Norge A.S., 1.25%, 8/01/17 (n) | | | 11,361,000 | | | | 11,291,607 | |
| | | | | | | | |
| | | | | | | $ | 29,377,362 | |
| Other Banks & Diversified Financials - 2.6% | | | | | | | | |
| Abbey National Treasury Services PLC, 3.05%, 8/23/18 | | $ | 4,205,000 | | | $ | 4,379,617 | |
| Bank of Tokyo-Mitsubishi UFJ Ltd., 2.7%, 9/09/18 (n) | | | 9,565,000 | | | | 9,793,690 | |
| BBVA Bancomer S.A. de C.V., 6.75%, 9/30/22 (n) | | | 3,587,000 | | | | 3,999,505 | |
| Capital One Bank (USA) N.A., 3.375%, 2/15/23 | | | 4,224,000 | | | | 4,172,370 | |
| Capital One Financial Corp., 3.75%, 4/24/24 | | | 5,974,000 | | | | 5,984,938 | |
| Capital One Financial Corp., 6.15%, 9/01/16 | | | 6,690,000 | | | | 7,441,407 | |
| Citigroup, Inc., 8.5%, 5/22/19 | | | 7,251,000 | | | | 9,238,274 | |
| Discover Bank, 7%, 4/15/20 | | | 9,837,000 | | | | 11,768,829 | |
| Fifth Third Bancorp, 2.3%, 3/01/19 | | | 1,307,000 | | | | 1,304,569 | |
| Fifth Third Bancorp, 3.5%, 3/15/22 | | | 4,075,000 | | | | 4,131,092 | |
| Groupe BPCE S.A., 12.5% to 9/30/19, FRN to 8/29/49 (n) | | | 12,290,000 | | | | 16,345,700 | |
| Macquarie Group Ltd., 3%, 12/03/18 (n) | | | 1,406,000 | | | | 1,427,231 | |
| Macquarie Group Ltd., 6%, 1/14/20 (n) | | | 6,932,000 | | | | 7,762,454 | |
| Rabobank Nederland N.V., 3.95%, 11/09/22 | | | 6,203,000 | | | | 6,239,691 | |
| Santander Holdings USA, Inc., 4.625%, 4/19/16 | | | 3,739,000 | | | | 3,999,436 | |
| SunTrust Banks, Inc., 3.5%, 1/20/17 | | | 3,701,000 | | | | 3,916,583 | |
| | | | | | | | |
| | | | | | | $ | 101,905,386 | |
| Personal Computers & Peripherals - 0.2% | | | | | | | | |
| Equifax, Inc., 3.3%, 12/15/22 | | $ | 8,758,000 | | | $ | 8,490,294 | |
| | |
| Pharmaceuticals - 1.8% | | | | | | | | |
| Celgene Corp., 2.45%, 10/15/15 | | $ | 7,103,000 | | | $ | 7,263,904 | |
| Celgene Corp., 1.9%, 8/15/17 | | | 7,253,000 | | | | 7,356,232 | |
| Forest Laboratories, Inc., 4.875%, 2/15/21 (n) | | | 27,617,000 | | | | 29,446,626 | |
| Gilead Sciences, Inc., 4.8%, 4/01/44 | | | 8,306,000 | | | | 8,736,292 | |
| Teva Pharmaceutical Finance B.V., 2.95%, 12/18/22 | | | 12,560,000 | | | | 11,961,365 | |
| VPII Escrow Corp., 6.75%, 8/15/18 (z) | | | 5,225,000 | | | | 5,656,063 | |
| | | | | | | | |
| | | | | | | $ | 70,420,482 | |
| Railroad & Shipping - 0.0% | | | | | | | | |
| Canadian Pacific Railway Co., 4.45%, 3/15/23 | | $ | 1,366,000 | | | $ | 1,453,613 | |
| | |
| Real Estate - 1.7% | | | | | | | | |
| Alexandria Real Estate Equities, Inc., REIT, 4.6%, 4/01/22 | | $ | 4,863,000 | | | $ | 5,087,218 | |
| Boston Properties LP, REIT, 3.7%, 11/15/18 | | | 5,442,000 | | | | 5,796,405 | |
| Boston Properties LP, REIT, 3.8%, 2/01/24 | | | 5,543,000 | | | | 5,570,294 | |
| DDR Corp., REIT, 4.625%, 7/15/22 | | | 4,107,000 | | | | 4,372,875 | |
23
Portfolio of Investments – continued
| | | | | | | | |
| Issuer | | Shares/Par | | | Value ($) | |
| | | | | | | | |
| Bonds - continued | | | | | | | | |
| Real Estate - continued | | | | | | | | |
| DDR Corp., REIT, 3.375%, 5/15/23 | | $ | 7,861,000 | | | $ | 7,533,354 | |
| ERP Operating LP, REIT, 3%, 4/15/23 | | | 1,065,000 | | | | 1,018,244 | |
| HCP, Inc., REIT, 3.75%, 2/01/19 | | | 4,862,000 | | | | 5,160,896 | |
| HCP, Inc., REIT, 5.375%, 2/01/21 | | | 4,940,000 | | | | 5,590,470 | |
| Kimco Realty Corp., REIT, 5.783%, 3/15/16 | | | 7,684,000 | | | | 8,357,241 | |
| Liberty Property LP, REIT, 5.5%, 12/15/16 | | | 4,563,000 | | | | 5,009,061 | |
| Mid-America Apartment Communities, Inc., REIT, 4.3%, 10/15/23 | | | 3,139,000 | | | | 3,216,317 | |
| Simon Property Group, Inc., REIT, 10.35%, 4/01/19 | | | 4,593,000 | | | | 6,231,052 | |
| WEA Finance LLC, 6.75%, 9/02/19 (n) | | | 5,009,000 | | | | 6,063,815 | |
| | | | | | | | |
| | | | | | | $ | 69,007,242 | |
| Restaurants - 0.2% | | | | | | | | |
| YUM! Brands, Inc., 5.35%, 11/01/43 | | $ | 7,927,000 | | | $ | 8,500,828 | |
| | |
| Retailers - 0.8% | | | | | | | | |
| Cencosud S.A., 5.5%, 1/20/21 | | $ | 4,672,000 | | | $ | 4,857,941 | |
| Gap, Inc., 5.95%, 4/12/21 | | | 14,755,000 | | | | 16,790,762 | |
| Home Depot, Inc., 5.95%, 4/01/41 | | | 3,217,000 | | | | 3,957,360 | |
| Kohl’s Corp., 3.25%, 2/01/23 | | | 7,173,000 | | | | 6,805,843 | |
| | | | | | | | |
| | | | | | | $ | 32,411,906 | |
| Specialty Chemicals - 0.4% | | | | | | | | |
| Ecolab, Inc., 4.35%, 12/08/21 | | $ | 10,052,000 | | | $ | 10,940,104 | |
| Mexichem S.A.B. de C.V., 6.75%, 9/19/42 (n) | | | 4,462,000 | | | | 4,523,353 | |
| | | | | | | | |
| | | | | | | $ | 15,463,457 | |
| Specialty Stores - 0.3% | | | | | | | | |
| Advance Auto Parts, Inc., 5.75%, 5/01/20 | | $ | 4,783,000 | | | $ | 5,431,580 | |
| Advance Auto Parts, Inc., 4.5%, 1/15/22 | | | 630,000 | | | | 662,625 | |
| Advance Auto Parts, Inc., 4.5%, 12/01/23 | | | 3,964,000 | | | | 4,152,326 | |
| | | | | | | | |
| | | | | | | $ | 10,246,531 | |
| Supermarkets - 0.1% | | | | | | | | |
| Delhaize Group, 4.125%, 4/10/19 | | $ | 1,082,000 | | | $ | 1,123,259 | |
| Kroger Co., 3.85%, 8/01/23 | | | 3,285,000 | | | | 3,335,497 | |
| | | | | | | | |
| | | | | | | $ | 4,458,756 | |
| Telecommunications - Wireless - 1.2% | | | | | | | | |
| American Tower Corp., REIT, 3.5%, 1/31/23 | | $ | 7,629,000 | | | $ | 7,334,635 | |
| American Tower Corp., REIT, 5%, 2/15/24 | | | 11,493,000 | | | | 12,225,529 | |
| Crown Castle Towers LLC, 6.113%, 1/15/20 (n) | | | 7,264,000 | | | | 8,407,477 | |
| Crown Castle Towers LLC, 4.883%, 8/15/20 (n) | | | 3,480,000 | | | | 3,858,603 | |
| MTS International Funding Ltd., 5%, 5/30/23 (n) | | | 6,018,000 | | | | 5,356,020 | |
| Rogers Communications, Inc., 4.1%, 10/01/23 | | | 7,700,000 | | | | 7,956,348 | |
24
Portfolio of Investments – continued
| | | | | | | | |
| Issuer | | Shares/Par | | | Value ($) | |
| | | | | | | | |
| Bonds - continued | | | | | | | | |
| Telecommunications - Wireless - continued | | | | | | | | |
| Rogers Communications, Inc., 5%, 3/15/44 | | $ | 4,403,000 | | | $ | 4,505,823 | |
| | | | | | | | |
| | | | | | | $ | 49,644,435 | |
| Tobacco - 0.8% | | | | | | | | |
| Altria Group, Inc., 2.85%, 8/09/22 | | $ | 10,322,000 | | | $ | 9,824,139 | |
| Altria Group, Inc., 2.95%, 5/02/23 | | | 2,970,000 | | | | 2,779,724 | |
| Lorillard Tobacco Co., 8.125%, 6/23/19 | | | 6,897,000 | | | | 8,573,902 | |
| Reynolds American, Inc., 6.75%, 6/15/17 | | | 10,032,000 | | | | 11,566,063 | |
| | | | | | | | |
| | | | | | | $ | 32,743,828 | |
| Transportation - Services - 0.3% | | | | | | | | |
| ERAC USA Finance Co., 7%, 10/15/37 (n) | | $ | 3,033,000 | | | $ | 3,924,663 | |
| Navios Maritime Holding, Inc., 7.375%, 1/15/22 (n) | | | 8,955,000 | | | | 9,044,550 | |
| | | | | | | | |
| | | | | | | $ | 12,969,213 | |
| U.S. Government Agencies and Equivalents - 2.8% | | | | | | | | |
| National Credit Union Administration Guaranteed Note, 2.9%, 10/29/20 | | $ | 5,600,000 | | | $ | 5,812,934 | |
| Small Business Administration, 5.94%, 7/01/16 | | | 52,566 | | | | 54,374 | |
| Small Business Administration, 5.37%, 9/01/16 | | | 107,082 | | | | 110,727 | |
| Small Business Administration, 6.35%, 4/01/21 | | | 6,733 | | | | 7,363 | |
| Small Business Administration, 6.34%, 5/01/21 | | | 10,348 | | | | 11,252 | |
| Small Business Administration, 6.44%, 6/01/21 | | | 11,113 | | | | 12,214 | |
| Small Business Administration, 5.34%, 11/01/21 | | | 66,975 | | | | 72,365 | |
| Small Business Administration, 6.07%, 3/01/22 | | | 38,486 | | | | 41,946 | |
| Small Business Administration, 4.35%, 7/01/23 | | | 448,952 | | | | 475,197 | |
| Small Business Administration, 4.98%, 11/01/23 | | | 637,022 | | | | 691,592 | |
| Small Business Administration, 4.89%, 12/01/23 | | | 631,154 | | | | 683,974 | |
| Small Business Administration, 4.93%, 1/01/24 | | | 821,933 | | | | 886,254 | |
| Small Business Administration, 4.34%, 3/01/24 | | | 785,988 | | | | 827,309 | |
| Small Business Administration, 5.18%, 5/01/24 | | | 816,617 | | | | 885,761 | |
| Small Business Administration, 5.52%, 6/01/24 | | | 888,547 | | | | 972,871 | |
| Small Business Administration, 5.19%, 7/01/24 | | | 988,140 | | | | 1,073,676 | |
| Small Business Administration, 4.86%, 10/01/24 | | | 613,332 | | | | 656,908 | |
| Small Business Administration, 4.57%, 6/01/25 | | | 1,304,818 | | | | 1,383,447 | |
| Small Business Administration, 4.76%, 9/01/25 | | | 3,788,261 | | | | 4,038,649 | |
| Small Business Administration, 5.39%, 12/01/25 | | | 369,776 | | | | 406,875 | |
| Small Business Administration, 5.35%, 2/01/26 | | | 2,180,607 | | | | 2,383,618 | |
| Small Business Administration, 3.25%, 11/01/30 | | | 3,939,322 | | | | 4,024,959 | |
| Small Business Administration, 2.85%, 9/01/31 | | | 6,113,528 | | | | 6,018,163 | |
| Small Business Administration, 2.37%, 8/01/32 | | | 4,733,170 | | | | 4,518,234 | |
| Small Business Administration, 2.13%, 1/01/33 | | | 6,604,504 | | | | 6,215,623 | |
| Small Business Administration, 2.21%, 2/01/33 | | | 1,652,631 | | | | 1,561,752 | |
| Small Business Administration, 2.22%, 3/01/33 | | | 6,031,388 | | | | 5,694,099 | |
25
Portfolio of Investments – continued
| | | | | | | | |
| Issuer | | Shares/Par | | | Value ($) | |
| | | | | | | | |
| Bonds - continued | | | | | | | | |
| U.S. Government Agencies and Equivalents - continued | | | | | |
| Small Business Administration, 2.08%, 4/01/33 | | $ | 9,483,765 | | | $ | 8,955,659 | |
| Small Business Administration, 2.45%, 6/01/33 | | | 12,662,282 | | | | 12,150,514 | |
| Small Business Administration, 3.15%, 7/01/33 | | | 15,558,704 | | | | 15,536,837 | |
| Small Business Administration, 3.16%, 8/01/33 | | | 15,272,634 | | | | 15,325,201 | |
| Small Business Administration, 3.62%, 9/01/33 | | | 7,854,245 | | | | 8,065,892 | |
| | | | | | | | |
| | | | | | | $ | 109,556,239 | |
| U.S. Treasury Obligations - 16.0% | | | | | | | | |
| U.S. Treasury Bonds, 6%, 2/15/26 | | $ | 840,000 | | | $ | 1,111,819 | |
| U.S. Treasury Bonds, 4.5%, 2/15/36 (f) | | | 1,967,000 | | | | 2,344,725 | |
| U.S. Treasury Bonds, 5%, 5/15/37 | | | 9,893,000 | | | | 12,607,392 | |
| U.S. Treasury Bonds, 4.5%, 8/15/39 | | | 124,998,100 | | | | 149,411,729 | |
| U.S. Treasury Notes, 0.375%, 2/15/16 | | | 389,700,000 | | | | 390,004,356 | |
| U.S. Treasury Notes, 5.125%, 5/15/16 | | | 6,351,000 | | | | 6,954,345 | |
| U.S. Treasury Notes, 0.875%, 12/31/16 | | | 48,741,000 | | | | 48,923,779 | |
| U.S. Treasury Notes, 2.75%, 2/15/19 | | | 8,725,900 | | | | 9,186,732 | |
| U.S. Treasury Notes, TIPS, 1.625%, 1/15/15 | | | 5,842,917 | | | | 5,983,053 | |
| U.S. Treasury Notes, TIPS, 2%, 1/15/16 | | | 10,350,463 | | | | 10,974,720 | |
| | | | | | | | |
| | | | | | | $ | 637,502,650 | |
| Utilities - Electric Power - 2.6% | | | | | | | | |
| Berkshire Hathaway Energy Co., 5.15%, 11/15/43 | | $ | 8,174,000 | | | $ | 8,951,176 | |
| CenterPoint Energy, Inc., 5.95%, 2/01/17 | | | 3,300,000 | | | | 3,710,210 | |
| CMS Energy Corp., 6.25%, 2/01/20 | | | 4,272,000 | | | | 5,040,529 | |
| CMS Energy Corp., 5.05%, 3/15/22 | | | 4,239,000 | | | | 4,771,389 | |
| Constellation Energy Group, Inc., 5.15%, 12/01/20 | | | 3,366,000 | | | | 3,724,721 | |
| Duke Energy Corp., 5.05%, 9/15/19 | | | 6,505,000 | | | | 7,373,918 | |
| Duke Energy Corp., 3.75%, 4/15/24 | | | 3,587,000 | | | | 3,638,204 | |
| Empresa Nacional de Electricidad S.A., 4.25%, 4/15/24 | | | 6,757,000 | | | | 6,768,973 | |
| Enel Finance International S.A., 6.25%, 9/15/17 (n) | | | 5,360,000 | | | | 6,090,086 | |
| Enel Finance International S.A., 6%, 10/07/39 (n) | | | 5,000,000 | | | | 5,392,150 | |
| Exelon Corp., 4.9%, 6/15/15 | | | 6,177,000 | | | | 6,449,622 | |
| Exelon Generation Co. LLC, 4.25%, 6/15/22 | | | 5,938,000 | | | | 6,082,062 | |
| ITC Holdings Corp., 4.05%, 7/01/23 | | | 8,197,000 | | | | 8,260,551 | |
| Pacific Gas & Electric Co., 3.25%, 6/15/23 | | | 6,368,000 | | | | 6,279,924 | |
| PPL Capital Funding, Inc., 5%, 3/15/44 | | | 4,282,000 | | | | 4,486,273 | |
| PPL Corp., 3.5%, 12/01/22 | | | 3,600,000 | | | | 3,587,328 | |
| PPL WEM Holdings PLC, 5.375%, 5/01/21 (n) | | | 11,511,000 | | | | 12,690,509 | |
| | | | | | | | |
| | | | | | | $ | 103,297,625 | |
| Total Bonds (Identified Cost, $3,796,526,581) | | | | | | $ | 3,889,205,347 | |
26
Portfolio of Investments – continued
| | | | | | | | |
| Money Market Funds - 4.8% | | | | | | | | |
| Issuer | | Shares/Par | | | Value ($) | |
| | | | | | | | |
MFS Institutional Money Market Portfolio, 0.09%,
at Cost and Net Asset Value (v) | | | 193,273,464 | | | $ | 193,273,464 | |
| Total Investments (Identified Cost, $3,989,800,045) | | | | | | $ | 4,082,478,811 | |
| | |
| Other Assets, Less Liabilities - (2.3)% | | | | | | | (91,724,034 | ) |
| Net Assets - 100.0% | | | | | | $ | 3,990,754,777 | |
| (a) | Non-income producing security. |
| (d) | In default. Interest and/or scheduled principal payment(s) have been missed. |
| (f) | All or a portion of the security has been segregated as collateral for open futures contracts. |
| (i) | Interest only security for which the fund receives interest on notional principal (Par amount). Par amount shown is the notional principal and does not reflect the cost of the security. |
| (n) | Securities exempt from registration under Rule 144A of the Securities Act of 1933. These securities may be sold in the ordinary course of business in transactions exempt from registration, normally to qualified institutional buyers. At period end, the aggregate value of these securities was $623,985,686, representing 15.6% of net assets. |
| (p) | Payment-in-kind security for which interest income may be received in additional securities and/or cash. During the period, the following amount of interest income was received in additional securities and/or cash: |
| | | | | | | | |
| Payment-in-kind Securities | | Cash | | | Additional Securities | |
| Anthracite Ltd., CDO III, 6.077%, 3/23/39 | | | $— | | | | $356,311 | |
| (q) | Interest received was less than stated coupon rate. |
| (v) | Underlying affiliated fund that is available only to investment companies managed by MFS. The rate quoted for the MFS Institutional Money Market Portfolio is the annualized seven-day yield of the fund at period end. |
| (z) | Restricted securities are not registered under the Securities Act of 1933 and are subject to legal restrictions on resale. These securities generally may be resold in transactions exempt from registration or to the public if the securities are subsequently registered. Disposal of these securities may involve time-consuming negotiations and prompt sale at an acceptable price may be difficult. The fund holds the following restricted securities: |
| | | | | | | | | | |
| Restricted Securities | | Acquisition Date | | Cost | | | Value | |
| Anthracite Ltd., CDO III, 6.077%, 3/23/39 | | 10/25/06-1/01/14 | | | $5,152,237 | | | | $302,903 | |
| Babson Ltd., CLO, FRN, 1.328%, 4/20/25 | | 3/12/14 | | | 9,337,072 | | | | 9,335,035 | |
| Bayview Commercial Asset Trust, FRN, 0.462%, 8/25/35 | | 6/09/05 | | | 453,054 | | | | 401,603 | |
| Bayview Commercial Asset Trust, FRN, 0%, 4/25/36 | | 2/28/06 | | | 1,006,617 | | | | 1 | |
| Bayview Commercial Asset Trust, FRN, 0.422%, 4/25/36 | | 2/23/06 | | | 363,243 | | | | 315,202 | |
| Bayview Commercial Asset Trust, FRN, 0%, 7/25/36 | | 5/16/06-5/29/09 | | | 809,938 | | | | 1 | |
| Bayview Commercial Asset Trust, FRN, 0%, 10/25/36 | | 9/11/06 | | | 1,450,328 | | | | 2 | |
| Bayview Commercial Asset Trust, FRN, 0%, 12/25/36 | | 10/25/06 | | | 920,789 | | | | 1 | |
| Bayview Commercial Asset Trust, FRN, 0%, 3/25/37 | | 1/26/07-5/29/09 | | | 0 | | | | 2 | |
Bayview Financial Revolving Mortgage Loan Trust, FRN,
1.752%, 12/28/40 | | 3/01/06 | | | 2,996,429 | | | | 1,982,843 | |
| Capital Trust Realty Ltd., CDO, 5.26%, 6/25/35 | | 9/14/10 | | | 6,499,607 | | | | 7,163,335 | |
| Centrica PLC, 4%, 10/16/23 | | 10/10/13 | | | 5,099,264 | | | | 5,114,830 | |
| Commercial Mortgage Asset Trust, FRN, 0.811%, 1/17/32 | | 8/25/03-4/09/12 | | | 20,472 | | | | 18,181 | |
27
Portfolio of Investments – continued
| | | | | | | | | | |
| Restricted Securities – continued | | Acquisition Date | | Cost | | | Value | |
| Falcon Franchise Loan LLC, FRN, 11.06%, 1/05/23 | | 1/18/02-3/23/11 | | | $2,213 | | | | $5,679 | |
| Falcon Franchise Loan LLC, FRN, 14.914%, 1/05/25 | | 1/29/03-3/23/11 | | | 48,461 | | | | 211,343 | |
First Union National Bank Commercial Mortgage, FRN,
1.902%, 1/12/43 | | 12/11/03-4/09/12 | | | 4,965 | | | | 1,991 | |
| Gramercy Real Estate Ltd., CDO, FRN, 0.549%, 7/25/35 | | 6/21/05 | | | 190,506 | | | | 188,630 | |
Hertz Fleet Lease Funding LP, 2014-1, FRN,
0.55%, 4/10/28 | | 3/25/14 | | | 9,576,000 | | | | 9,576,000 | |
| Morgan Stanley Capital I, Inc., FRN, 1.715%, 3/15/31 | | 6/10/03 | | | 8,861 | | | | 9 | |
| NXP B.V./NXP Funding LLC, 3.75%, 6/01/18 | | 5/06/13 | | | 2,115,000 | | | | 2,112,356 | |
Preferred Term Securities XIX Ltd., CDO, FRN,
0.583%, 12/22/35 | | 9/08/05-3/28/11 | | | 6,303,532 | | | | 4,979,167 | |
| SES S.A., 5.3%, 4/04/43 | | 1/08/14 | | | 3,964,649 | | | | 4,248,386 | |
| State Grid Overseas Investment (2014) Ltd., 4.125%, 5/07/24 | | 4/28/14 | | | 9,632,845 | | | | 9,726,729 | |
| Tencent Holdings Ltd., 3.375%, 5/02/19 | | 4/22/14 | | | 4,107,687 | | | | 4,133,473 | |
| VPII Escrow Corp., 6.75%, 8/15/18 | | 6/27/13 | | | 5,225,000 | | | | 5,656,063 | |
| Total Restricted Securities | | | | $65,473,765 | |
| % of Net assets | | | | 1.6% | |
The following abbreviations are used in this report and are defined:
| CDO | | Collateralized Debt Obligation |
| CLO | | Collateralized Loan Obligation |
| FRN | | Floating Rate Note. Interest rate resets periodically and may not be the rate reported at period end. |
| PLC | | Public Limited Company |
| REIT | | Real Estate Investment Trust |
| TIPS | | Treasury Inflation Protected Security |
Derivative Contracts at 4/30/14
Futures Contracts at 4/30/14
| | | | | | | | | | | | | | | | | | |
| Description | | Currency | | | Contracts | | | Value | | Expiration
Date | | | Unrealized Appreciation (Depreciation) | |
| Asset Derivatives | | | | | | | | | | | | | | | | | | |
| Interest Rate Futures | | | | | | | | | | | | | | | | | | |
| U.S. Treasury Bond 30 yr (Long) | | | USD | | | | 400 | | | $53,975,000 | | | June - 2014 | | | | $1,038,537 | |
| | | | | | | | | | | | | | | | | | |
| Liability Derivatives | | | | | | | | | | | | | | | | | | |
| Interest Rate Futures | | | | | | | | | | | | | | | | | | |
| U.S. Treasury Note 5 yr (Long) | | | USD | | | | 150 | | | $17,917,969 | | | June - 2014 | | | | $(62,622 | ) |
| U.S. Treasury Note 10 yr (Short) | | | USD | | | | 1,625 | | | 202,185,547 | | | June - 2014 | | | | (33,371 | ) |
| | | | | | | | | | | | | | | | | | |
| | | | | | | | | | | | | | | | | $(95,993 | ) |
| | | | | | | | | | | | | | | | | | |
At April 30, 2014, the fund had liquid securities with an aggregate value of $1,715,331 to cover any commitments for certain derivative contracts.
See Notes to Financial Statements
28
Financial Statements
STATEMENT OF ASSETS AND LIABILITIES
At 4/30/14
This statement represents your fund’s balance sheet, which details the assets and liabilities comprising the total value of the fund.
| | | | |
| Assets | | | | |
Investments- | | | | |
Non-affiliated issuers, at value (identified cost, $3,796,526,581) | | | $3,889,205,347 | |
Underlying affiliated funds, at cost and value | | | 193,273,464 | |
Total investments, at value (identified cost, $3,989,800,045) | | | $4,082,478,811 | |
Cash | | | 164,079 | |
Receivables for | | | | |
Investments sold | | | 7,613,854 | |
Fund shares sold | | | 5,689,865 | |
Interest and dividends | | | 28,982,808 | |
Other assets | | | 14,758 | |
Total assets | | | $4,124,944,175 | |
| Liabilities | | | | |
Payables for | | | | |
Distributions | | | $2,447,818 | |
Daily variation margin on open futures contracts | | | 414,845 | |
Investments purchased | | | 17,605,795 | |
TBA purchase commitments | | | 104,263,536 | |
Fund shares reacquired | | | 7,618,786 | |
Payable to affiliates | | | | |
Investment adviser | | | 94,954 | |
Shareholder servicing costs | | | 1,312,745 | |
Distribution and service fees | | | 22,857 | |
Program manager fees | | | 20 | |
Payable for independent Trustees’ compensation | | | 6 | |
Accrued expenses and other liabilities | | | 408,036 | |
Total liabilities | | | $134,189,398 | |
Net assets | | | $3,990,754,777 | |
| Net assets consist of | | | | |
Paid-in capital | | | $3,917,969,455 | |
Unrealized appreciation (depreciation) on investments | | | 93,621,310 | |
Accumulated net realized gain (loss) on investments | | | (21,150,821 | ) |
Undistributed net investment income | | | 314,833 | |
Net assets | | | $3,990,754,777 | |
Shares of beneficial interest outstanding | | | 366,538,564 | |
29
Statement of Assets and Liabilities – continued
| | | | | | | | | | | | |
| | | Net assets | | | Shares
outstanding | | | Net asset value
per share (a) | |
Class A | | | $1,153,059,471 | | | | 105,925,475 | | | | $10.89 | |
Class B | | | 33,000,345 | | | | 3,027,620 | | | | 10.90 | |
Class C | | | 115,495,196 | | | | 10,596,521 | | | | 10.90 | |
Class I | | | 976,837,530 | | | | 89,698,650 | | | | 10.89 | |
Class R1 | | | 3,092,723 | | | | 283,649 | | | | 10.90 | |
Class R2 | | | 42,232,970 | | | | 3,882,086 | | | | 10.88 | |
Class R3 | | | 48,841,923 | | | | 4,487,770 | | | | 10.88 | |
Class R4 | | | 68,289,219 | | | | 6,273,807 | | | | 10.88 | |
Class R5 | | | 1,542,573,505 | | | | 141,689,160 | | | | 10.89 | |
Class 529A | | | 4,031,697 | | | | 370,990 | | | | 10.87 | |
Class 529B | | | 395,410 | | | | 36,273 | | | | 10.90 | |
Class 529C | | | 2,904,788 | | | | 266,563 | | | | 10.90 | |
| (a) | Maximum offering price per share was equal to the net asset value per share for all share classes, except for Classes A and 529A, for which the maximum offering prices per share were $11.43 [100 / 95.25 x $10.89] and $11.41 [100 / 95.25 x $10.87], respectively. On sales of $50,000 or more, the maximum offering prices of Class A and Class 529A shares are reduced. A contingent deferred sales charge may be imposed on redemptions of Class A, Class B, Class C, Class 529B, and Class 529C shares. Redemption price per share was equal to the net asset value per share for Classes I, R1, R2, R3, R4, R5, and 529A. |
See Notes to Financial Statements
30
Financial Statements
STATEMENT OF OPERATIONS
Year ended 4/30/14
This statement describes how much your fund earned in investment income and accrued in expenses. It also describes any gains and/or losses generated by fund operations.
| | | | |
| Net investment income | |
Income | | | | |
Interest | | | $134,517,017 | |
Dividends from underlying affiliated funds | | | 94,814 | |
Total investment income | | | $134,611,831 | |
Expenses | | | | |
Management fee | | | $19,023,784 | |
Distribution and service fees | | | 4,827,159 | |
Program manager fees | | | 7,961 | |
Shareholder servicing costs | | | 2,611,248 | |
Administrative services fee | | | 461,875 | |
Independent Trustees’ compensation | | | 48,049 | |
Custodian fee | | | 264,182 | |
Shareholder communications | | | 439,312 | |
Audit and tax fees | | | 75,432 | |
Legal fees | | | 36,731 | |
Miscellaneous | | | 336,471 | |
Total expenses | | | $28,132,204 | |
Reduction of expenses by investment adviser and distributor | | | (1,233,584 | ) |
Net expenses | | | $26,898,620 | |
Net investment income | | | $107,713,211 | |
| Realized and unrealized gain (loss) on investments | | | | |
Realized gain (loss) (identified cost basis) | | | | |
Investments | | | $(490,382 | ) |
Futures contracts | | | 4,350,231 | |
Net realized gain (loss) on investments | | | $3,859,849 | |
Change in unrealized appreciation (depreciation) | | | | |
Investments | | | $(75,264,972 | ) |
Futures contracts | | | 3,010,587 | |
Net unrealized gain (loss) on investments | | | $(72,254,385 | ) |
Net realized and unrealized gain (loss) on investments | | | $(68,394,536 | ) |
Change in net assets from operations | | | $39,318,675 | |
See Notes to Financial Statements
31
Financial Statements
STATEMENTS OF CHANGES IN NET ASSETS
These statements describe the increases and/or decreases in net assets resulting from operations, any distributions, and any shareholder transactions.
| | | | | | | | |
| | | Years ended 4/30 | |
| | | 2014 | | | 2013 | |
| Change in net assets | | | | | | |
| From operations | | | | | | | | |
Net investment income | | | $107,713,211 | | | | $92,733,532 | |
Net realized gain (loss) on investments | | | 3,859,849 | | | | 44,556,547 | |
Net unrealized gain (loss) on investments | | | (72,254,385 | ) | | | 63,278,405 | |
Change in net assets from operations | | | $39,318,675 | | | | $200,568,484 | |
| Distributions declared to shareholders | | | | | | | | |
From net investment income | | | $(119,482,366 | ) | | | $(111,315,407 | ) |
From net realized gain on investments | | | (1,648,141 | ) | | | — | |
Total distributions declared to shareholders | | | $(121,130,507 | ) | | | $(111,315,407 | ) |
Change in net assets from fund share transactions | | | $288,467,418 | | | | $452,331,810 | |
Total change in net assets | | | $206,655,586 | | | | $541,584,887 | |
| Net assets | | | | | | | | |
At beginning of period | | | 3,784,099,191 | | | | 3,242,514,304 | |
At end of period (including undistributed net investment income of $314,833 and accumulated distributions in excess of net investment income of $3,275,181, respectively) | | | $3,990,754,777 | | | | $3,784,099,191 | |
See Notes to Financial Statements
32
Financial Statements
FINANCIAL HIGHLIGHTS
The financial highlights table is intended to help you understand the fund’s financial performance for the past 5 years. Certain information reflects financial results for a single fund share. The total returns in the table represent the rate by which an investor would have earned (or lost) on an investment in the fund share class (assuming reinvestment of all distributions) held for the entire period.
| | | | | | | | | | | | | | | | | | | | |
| Class A | | Years ended 4/30 | |
| | | 2014 | | | 2013 | | | 2012 | | | 2011 | | | 2010 | |
Net asset value, beginning of period | | | $11.13 | | | | $10.84 | | | | $10.57 | | | | $10.30 | | | | $8.99 | |
| Income (loss) from investment operations | | | | | | | | | | | | | |
Net investment income (d) | | | $0.30 | | | | $0.29 | | | | $0.35 | | | | $0.39 | | | | $0.44 | |
Net realized and unrealized gain (loss)
on investments and foreign currency | | | (0.21 | ) | | | 0.35 | | | | 0.32 | | | | 0.29 | | | | 1.35 | |
Total from investment operations | | | $0.09 | | | | $0.64 | | | | $0.67 | | | | $0.68 | | | | $1.79 | |
| Less distributions declared to shareholders | | | | | | | | | | | | | |
From net investment income | | | $(0.33 | ) | | | $(0.35 | ) | | | $(0.40 | ) | | | $(0.41 | ) | | | $(0.48 | ) |
From net realized gain on investments | | | (0.00 | )(w) | | | — | | | | — | | | | — | | | | — | |
Total distributions declared to shareholders | | | $(0.33 | ) | | | $(0.35 | ) | | | $(0.40 | ) | | | $(0.41 | ) | | | $(0.48 | ) |
Net asset value, end of period (x) | | | $10.89 | | | | $11.13 | | | | $10.84 | | | | $10.57 | | | | $10.30 | |
Total return (%) (r)(s)(t)(x) | | | 0.92 | | | | 5.97 | | | | 6.42 | | | | 6.73 | | | | 20.30 | |
Ratios (%) (to average net assets)
and Supplemental data: | | | | | | | | | | | | | | | | | |
Expenses before expense reductions (f) | | | 0.90 | | | | 0.91 | | | | 0.92 | | | | 0.91 | | | | 0.92 | |
Expenses after expense reductions (f) | | | 0.79 | | | | 0.81 | | | | 0.82 | | | | 0.81 | | | | 0.79 | |
Net investment income | | | 2.74 | | | | 2.63 | | | | 3.27 | | | | 3.72 | | | | 4.45 | |
Portfolio turnover | | | 52 | | | | 95 | | | | 59 | | | | 67 | | | | 90 | |
Net assets at end of period (000 omitted) | | | $1,153,059 | | | | $1,133,559 | | | | $1,009,130 | | | | $900,575 | | | | $918,742 | |
See Notes to Financial Statements
33
Financial Highlights – continued
| | | | | | | | | | | | | | | | | | | | |
| Class B | | Years ended 4/30 | |
| | | 2014 | | | 2013 | | | 2012 | | | 2011 | | | 2010 | |
Net asset value, beginning of period | | | $11.15 | | | | $10.86 | | | | $10.58 | | | | $10.31 | | | | $9.00 | |
| Income (loss) from investment operations | | | | | | | | | | | | | |
Net investment income (d) | | | $0.22 | | | | $0.21 | | | | $0.27 | | | | $0.30 | | | | $0.36 | |
Net realized and unrealized gain (loss)
on investments and foreign currency | | | (0.22 | ) | | | 0.35 | | | | 0.32 | | | | 0.30 | | | | 1.36 | |
Total from investment operations | | | $— | | | | $0.56 | | | | $0.59 | | | | $0.60 | | | | $1.72 | |
| Less distributions declared to shareholders | | | | | | | | | | | | | |
From net investment income | | | $(0.25 | ) | | | $(0.27 | ) | | | $(0.31 | ) | | | $(0.33 | ) | | | $(0.41 | ) |
From net realized gain on investments | | | (0.00 | )(w) | | | — | | | | — | | | | — | | | | — | |
Total distributions declared to shareholders | | | $(0.25 | ) | | | $(0.27 | ) | | | $(0.31 | ) | | | $(0.33 | ) | | | $(0.41 | ) |
Net asset value, end of period (x) | | | $10.90 | | | | $11.15 | | | | $10.86 | | | | $10.58 | | | | $10.31 | |
Total return (%) (r)(s)(t)(x) | | | 0.08 | | | | 5.18 | | | | 5.70 | | | | 5.88 | | | | 19.34 | |
Ratios (%) (to average net assets)
and Supplemental data: | | | | | | | | | | | | | | | | | |
Expenses before expense reductions (f) | | | 1.65 | | | | 1.66 | | | | 1.67 | | | | 1.66 | | | | 1.65 | |
Expenses after expense reductions (f) | | | 1.54 | | | | 1.56 | | | | 1.60 | | | | 1.61 | | | | 1.58 | |
Net investment income | | | 2.00 | | | | 1.88 | | | | 2.48 | | | | 2.91 | | | | 3.66 | |
Portfolio turnover | | | 52 | | | | 95 | | | | 59 | | | | 67 | | | | 90 | |
Net assets at end of period (000 omitted) | | | $33,000 | | | | $43,999 | | | | $43,939 | | | | $41,493 | | | | $45,472 | |
| |
| Class C | | Years ended 4/30 | |
| | | 2014 | | | 2013 | | | 2012 | | | 2011 | | | 2010 | |
Net asset value, beginning of period | | | $11.15 | | | | $10.86 | | | | $10.58 | | | | $10.31 | | | | $9.00 | |
| Income (loss) from investment operations | | | | | | | | | | | | | |
Net investment income (d) | | | $0.20 | | | | $0.20 | | | | $0.26 | | | | $0.30 | | | | $0.35 | |
Net realized and unrealized gain (loss)
on investments and foreign currency | | | (0.21 | ) | | | 0.35 | | | | 0.33 | | | | 0.29 | | | | 1.36 | |
Total from investment operations | | | $(0.01 | ) | | | $0.55 | | | | $0.59 | | | | $0.59 | | | | $1.71 | |
| Less distributions declared to shareholders | | | | | | | | | | | | | |
From net investment income | | | $(0.24 | ) | | | $(0.26 | ) | | | $(0.31 | ) | | | $(0.32 | ) | | | $(0.40 | ) |
From net realized gain on investments | | | (0.00 | )(w) | | | — | | | | — | | | | — | | | | — | |
Total distributions declared to shareholders | | | $(0.24 | ) | | | $(0.26 | ) | | | $(0.31 | ) | | | $(0.32 | ) | | | $(0.40 | ) |
Net asset value, end of period (x) | | | $10.90 | | | | $11.15 | | | | $10.86 | | | | $10.58 | | | | $10.31 | |
Total return (%) (r)(s)(t)(x) | | | (0.03 | ) | | | 5.08 | | | | 5.62 | | | | 5.83 | | | | 19.28 | |
Ratios (%) (to average net assets)
and Supplemental data: | | | | | | | | | | | | | | | | | |
Expenses before expense reductions (f) | | | 1.65 | | | | 1.66 | | | | 1.67 | | | | 1.66 | | | | 1.66 | |
Expenses after expense reductions (f) | | | 1.65 | | | | 1.66 | | | | 1.67 | | | | 1.66 | | | | 1.64 | |
Net investment income | | | 1.90 | | | | 1.78 | | | | 2.41 | | | | 2.86 | | | | 3.51 | |
Portfolio turnover | | | 52 | | | | 95 | | | | 59 | | | | 67 | | | | 90 | |
Net assets at end of period (000 omitted) | | | $115,495 | | | | $161,290 | | | | $153,898 | | | | $135,007 | | | | $141,966 | |
See Notes to Financial Statements
34
Financial Highlights – continued
| | | | | | | | | | | | | | | | | | | | |
| Class I | | Years ended 4/30 | |
| | | 2014 | | | 2013 | | | 2012 | | | 2011 | | | 2010 | |
Net asset value, beginning of period | | | $11.14 | | | | $10.85 | | | | $10.57 | | | | $10.30 | | | | $8.99 | |
| Income (loss) from investment operations | | | | | | | | | | | | | |
Net investment income (d) | | | $0.31 | | | | $0.31 | | | | $0.37 | | | | $0.40 | | | | $0.45 | |
Net realized and unrealized gain (loss)
on investments and foreign currency | | | (0.21 | ) | | | 0.35 | | | | 0.32 | | | | 0.30 | | | | 1.36 | |
Total from investment operations | | | $0.10 | | | | $0.66 | | | | $0.69 | | | | $0.70 | | | | $1.81 | |
| Less distributions declared to shareholders | | | | | | | | | | | | | |
From net investment income | | | $(0.35 | ) | | | $(0.37 | ) | | | $(0.41 | ) | | | $(0.43 | ) | | | $(0.50 | ) |
From net realized gain on investments | | | (0.00 | )(w) | | | — | | | | — | | | | — | | | | — | |
Total distributions declared to shareholders | | | $(0.35 | ) | | | $(0.37 | ) | | | $(0.41 | ) | | | $(0.43 | ) | | | $(0.50 | ) |
Net asset value, end of period (x) | | | $10.89 | | | | $11.14 | | | | $10.85 | | | | $10.57 | | | | $10.30 | |
Total return (%) (r)(s)(x) | | | 0.98 | | | | 6.13 | | | | 6.68 | | | | 6.89 | | | | 20.47 | |
Ratios (%) (to average net assets)
and Supplemental data: | | | | | | | | | | | | | | | | | |
Expenses before expense reductions (f) | | | 0.65 | | | | 0.66 | | | | 0.67 | | | | 0.66 | | | | 0.67 | |
Expenses after expense reductions (f) | | | 0.64 | | | | 0.66 | | | | 0.67 | | | | 0.66 | | | | 0.64 | |
Net investment income | | | 2.89 | | | | 2.80 | | | | 3.41 | | | | 3.87 | | | | 4.54 | |
Portfolio turnover | | | 52 | | | | 95 | | | | 59 | | | | 67 | | | | 90 | |
Net assets at end of period (000 omitted) | | | $976,838 | | | | $1,028,060 | | | | $1,883,416 | | | | $1,470,218 | | | | $1,291,881 | |
| |
| Class R1 | | Years ended 4/30 | |
| | | 2014 | | | 2013 | | | 2012 | | | 2011 | | | 2010 | |
Net asset value, beginning of period | | | $11.15 | | | | $10.86 | | | | $10.59 | | | | $10.31 | | | | $9.00 | |
| Income (loss) from investment operations | | | | | | | | | | | | | |
Net investment income (d) | | | $0.20 | | | | $0.20 | | | | $0.26 | | | | $0.30 | | | | $0.36 | |
Net realized and unrealized gain (loss)
on investments and foreign currency | | | (0.21 | ) | | | 0.35 | | | | 0.32 | | | | 0.30 | | | | 1.35 | |
Total from investment operations | | | $(0.01 | ) | | | $0.55 | | | | $0.58 | | | | $0.60 | | | | $1.71 | |
| Less distributions declared to shareholders | | | | | | | | | | | | | |
From net investment income | | | $(0.24 | ) | | | $(0.26 | ) | | | $(0.31 | ) | | | $(0.32 | ) | | | $(0.40 | ) |
From net realized gain on investments | | | (0.00 | )(w) | | | — | | | | — | | | | — | | | | — | |
Total distributions declared to shareholders | | | $(0.24 | ) | | | $(0.26 | ) | | | $(0.31 | ) | | | $(0.32 | ) | | | $(0.40 | ) |
Net asset value, end of period (x) | | | $10.90 | | | | $11.15 | | | | $10.86 | | | | $10.59 | | | | $10.31 | |
Total return (%) (r)(s)(x) | | | (0.03 | ) | | | 5.07 | | | | 5.52 | | | | 5.93 | | | | 19.28 | |
Ratios (%) (to average net assets)
and Supplemental data: | | | | | | | | | | | | | | | | | |
Expenses before expense reductions (f) | | | 1.65 | | | | 1.66 | | | | 1.67 | | | | 1.66 | | | | 1.67 | |
Expenses after expense reductions (f) | | | 1.64 | | | | 1.66 | | | | 1.67 | | | | 1.66 | | | | 1.64 | |
Net investment income | | | 1.89 | | | | 1.78 | | | | 2.42 | | | | 2.86 | | | | 3.61 | |
Portfolio turnover | | | 52 | | | | 95 | | | | 59 | | | | 67 | | | | 90 | |
Net assets at end of period (000 omitted) | | | $3,093 | | | | $3,310 | | | | $3,117 | | | | $2,969 | | | | $2,985 | |
See Notes to Financial Statements
35
Financial Highlights – continued
| | | | | | | | | | | | | | | | | | | | |
| Class R2 | | Years ended 4/30 | |
| | | 2014 | | | 2013 | | | 2012 | | | 2011 | | | 2010 | |
Net asset value, beginning of period | | | $11.13 | | | | $10.84 | | | | $10.56 | | | | $10.29 | | | | $8.98 | |
| Income (loss) from investment operations | | | | | | | | | | | | | |
Net investment income (d) | | | $0.26 | | | | $0.25 | | | | $0.31 | | | | $0.35 | | | | $0.40 | |
Net realized and unrealized gain (loss)
on investments and foreign currency | | | (0.22 | ) | | | 0.35 | | | | 0.33 | | | | 0.30 | | | | 1.36 | |
Total from investment operations | | | $0.04 | | | | $0.60 | | | | $0.64 | | | | $0.65 | | | | $1.76 | |
| Less distributions declared to shareholders | | | | | | | | | | | | | |
From net investment income | | | $(0.29 | ) | | | $(0.31 | ) | | | $(0.36 | ) | | | $(0.38 | ) | | | $(0.45 | ) |
From net realized gain on investments | | | (0.00 | )(w) | | | — | | | | — | | | | — | | | | — | |
Total distributions declared to shareholders | | | $(0.29 | ) | | | $(0.31 | ) | | | $(0.36 | ) | | | $(0.38 | ) | | | $(0.45 | ) |
Net asset value, end of period (x) | | | $10.88 | | | | $11.13 | | | | $10.84 | | | | $10.56 | | | | $10.29 | |
Total return (%) (r)(s)(x) | | | 0.47 | | | | 5.60 | | | | 6.15 | | | | 6.36 | | | | 19.90 | |
Ratios (%) (to average net assets)
and Supplemental data: | | | | | | | | | | | | | | | | | |
Expenses before expense reductions (f) | | | 1.15 | | | | 1.16 | | | | 1.17 | | | | 1.16 | | | | 1.17 | |
Expenses after expense reductions (f) | | | 1.15 | | | | 1.16 | | | | 1.17 | | | | 1.16 | | | | 1.14 | |
Net investment income | | | 2.40 | | | | 2.29 | | | | 2.93 | | | | 3.37 | | | | 4.08 | |
Portfolio turnover | | | 52 | | | | 95 | | | | 59 | | | | 67 | | | | 90 | |
Net assets at end of period (000 omitted) | | | $42,233 | | | | $43,889 | | | | $45,433 | | | | $41,076 | | | | $41,092 | |
| |
| Class R3 | | Years ended 4/30 | |
| | | 2014 | | | 2013 | | | 2012 | | | 2011 | | | 2010 | |
Net asset value, beginning of period | | | $11.13 | | | | $10.84 | | | | $10.57 | | | | $10.29 | | | | $8.98 | |
| Income (loss) from investment operations | | | | | | | | | | | | | |
Net investment income (d) | | | $0.29 | | | | $0.28 | | | | $0.34 | | | | $0.38 | | | | $0.43 | |
Net realized and unrealized gain (loss)
on investments and foreign currency | | | (0.22 | ) | | | 0.35 | | | | 0.32 | | | | 0.30 | | | | 1.35 | |
Total from investment operations | | | $0.07 | | | | $0.63 | | | | $0.66 | | | | $0.68 | | | | $1.78 | |
| Less distributions declared to shareholders | | | | | | | | | | | | | |
From net investment income | | | $(0.32 | ) | | | $(0.34 | ) | | | $(0.39 | ) | | | $(0.40 | ) | | | $(0.47 | ) |
From net realized gain on investments | | | (0.00 | )(w) | | | — | | | | — | | | | — | | | | — | |
Total distributions declared to shareholders | | | $(0.32 | ) | | | $(0.34 | ) | | | $(0.39 | ) | | | $(0.40 | ) | | | $(0.47 | ) |
Net asset value, end of period (x) | | | $10.88 | | | | $11.13 | | | | $10.84 | | | | $10.57 | | | | $10.29 | |
Total return (%) (r)(s)(x) | | | 0.72 | | | | 5.87 | | | | 6.32 | | | | 6.73 | | | | 20.20 | |
Ratios (%) (to average net assets)
and Supplemental data: | | | | | | | | | | | | | | | | | |
Expenses before expense reductions (f) | | | 0.90 | | | | 0.91 | | | | 0.92 | | | | 0.91 | | | | 0.92 | |
Expenses after expense reductions (f) | | | 0.89 | | | | 0.91 | | | | 0.92 | | | | 0.91 | | | | 0.89 | |
Net investment income | | | 2.65 | | | | 2.52 | | | | 3.16 | | | | 3.62 | | | | 4.35 | |
Portfolio turnover | | | 52 | | | | 95 | | | | 59 | | | | 67 | | | | 90 | |
Net assets at end of period (000 omitted) | | | $48,842 | | | | $53,863 | | | | $41,177 | | | | $29,493 | | | | $31,165 | |
See Notes to Financial Statements
36
Financial Highlights – continued
| | | | | | | | | | | | | | | | | | | | |
| Class R4 | | Years ended 4/30 | |
| | | 2014 | | | 2013 | | | 2012 | | | 2011 | | | 2010 | |
Net asset value, beginning of period | | | $11.13 | | | | $10.84 | | | | $10.57 | | | | $10.30 | | | | $8.98 | |
| Income (loss) from investment operations | | | | | | | | | | | | | |
Net investment income (d) | | | $0.31 | | | | $0.30 | | | | $0.36 | | | | $0.40 | | | | $0.45 | |
Net realized and unrealized gain (loss)
on investments and foreign currency | | | (0.22 | ) | | | 0.36 | | | | 0.32 | | | | 0.30 | | | | 1.37 | |
Total from investment operations | | | $0.09 | | | | $0.66 | | | | $0.68 | | | | $0.70 | | | | $1.82 | |
| Less distributions declared to shareholders | | | | | | | | | | | | | |
From net investment income | | | $(0.34 | ) | | | $(0.37 | ) | | | $(0.41 | ) | | | $(0.43 | ) | | | $(0.50 | ) |
From net realized gain on investments | | | (0.00 | )(w) | | | — | | | | — | | | | — | | | | — | |
Total distributions declared to shareholders | | | $(0.34 | ) | | | $(0.37 | ) | | | $(0.41 | ) | | | $(0.43 | ) | | | $(0.50 | ) |
Net asset value, end of period (x) | | | $10.88 | | | | $11.13 | | | | $10.84 | | | | $10.57 | | | | $10.30 | |
Total return (%) (r)(s)(x) | | | 0.97 | | | | 6.13 | | | | 6.58 | | | | 6.89 | | | | 20.61 | |
Ratios (%) (to average net assets)
and Supplemental data: | | | | | | | | | | | | | | | | | |
Expenses before expense reductions (f) | | | 0.65 | | | | 0.67 | | | | 0.67 | | | | 0.66 | | | | 0.67 | |
Expenses after expense reductions (f) | | | 0.65 | | | | 0.67 | | | | 0.67 | | | | 0.66 | | | | 0.64 | |
Net investment income | | | 2.90 | | | | 2.75 | | | | 3.40 | | | | 3.87 | | | | 4.53 | |
Portfolio turnover | | | 52 | | | | 95 | | | | 59 | | | | 67 | | | | 90 | |
Net assets at end of period (000 omitted) | | | $68,289 | | | | $84,048 | | | | $46,209 | | | | $32,336 | | | | $26,315 | |
| |
| Class R5 (y) | | Years ended 4/30 | |
| | | 2014 | | | 2013 | | | 2012 | | | 2011 | | | 2010 | |
Net asset value, beginning of period | | | $11.14 | | | | $10.85 | | | | $10.57 | | | | $10.30 | | | | $8.99 | |
| Income (loss) from investment operations | | | | | | | | | | | | | |
Net investment income (d) | | | $0.32 | | | | $0.31 | | | | $0.35 | | | | $0.40 | | | | $0.45 | |
Net realized and unrealized gain (loss)
on investments and foreign currency | | | (0.22 | ) | | | 0.32 | | | | 0.33 | | | | 0.29 | | | | 1.35 | |
Total from investment operations | | | $0.10 | | | | $0.63 | | | | $0.68 | | | | $0.69 | | | | $1.80 | |
| Less distributions declared to shareholders | | | | | | | | | | | | | |
From net investment income | | | $(0.35 | ) | | | $(0.34 | ) | | | $(0.40 | ) | | | $(0.42 | ) | | | $(0.49 | ) |
From net realized gain on investments | | | (0.00 | )(w) | | | — | | | | — | | | | — | | | | — | |
Total distributions declared to shareholders | | | $(0.35 | ) | | | $(0.34 | ) | | | $(0.40 | ) | | | $(0.42 | ) | | | $(0.49 | ) |
Net asset value, end of period (x) | | | $10.89 | | | | $11.14 | | | | $10.85 | | | | $10.57 | | | | $10.30 | |
Total return (%) (r)(s)(x) | | | 1.07 | | | | 6.21 | | | | 6.57 | | | | 6.78 | | | | 20.36 | |
Ratios (%) (to average net assets)
and Supplemental data: | | | | | | | | | | | | | |
Expenses before expense reductions (f) | | | 0.55 | | | | 0.57 | | | | 0.77 | | | | 0.76 | | | | 0.77 | |
Expenses after expense reductions (f) | | | 0.55 | | | | 0.57 | | | | 0.77 | | | | 0.76 | | | | 0.73 | |
Net investment income | | | 2.99 | | | | 2.82 | | | | 3.30 | | | | 3.78 | | | | 4.56 | |
Portfolio turnover | | | 52 | | | | 95 | | | | 59 | | | | 67 | | | | 90 | |
Net assets at end of period (000 omitted) | | | $1,542,574 | | | | $1,222,616 | | | | $8,217 | | | | $5,643 | | | | $9,582 | |
See Notes to Financial Statements
37
Financial Highlights – continued
| | | | | | | | | | | | | | | | | | | | |
| Class 529A | | Years ended 4/30 | |
| | | 2014 | | | 2013 | | | 2012 | | | 2011 | | | 2010 | |
Net asset value, beginning of period | | | $11.11 | | | | $10.82 | | | | $10.55 | | | | $10.27 | | | | $8.96 | |
| Income (loss) from investment operations | | | | | | | | | | | | | |
Net investment income (d) | | | $0.29 | | | | $0.29 | | | | $0.34 | | | | $0.38 | | | | $0.43 | |
Net realized and unrealized gain (loss)
on investments and foreign currency | | | (0.21 | ) | | | 0.34 | | | | 0.32 | | | | 0.30 | | | | 1.35 | |
Total from investment operations | | | $0.08 | | | | $0.63 | | | | $0.66 | | | | $0.68 | | | | $1.78 | |
| Less distributions declared to shareholders | | | | | | | | | | | | | |
From net investment income | | | $(0.32 | ) | | | $(0.34 | ) | | | $(0.39 | ) | | | $(0.40 | ) | | | $(0.47 | ) |
From net realized gain on investments | | | (0.00 | )(w) | | | — | | | | — | | | | — | | | | — | |
Total distributions declared to shareholders | | | $(0.32 | ) | | | $(0.34 | ) | | | $(0.39 | ) | | | $(0.40 | ) | | | $(0.47 | ) |
Net asset value, end of period (x) | | | $10.87 | | | | $11.11 | | | | $10.82 | | | | $10.55 | | | | $10.27 | |
Total return (%) (r)(s)(t)(x) | | | 0.86 | | | | 5.92 | | | | 6.37 | | | | 6.73 | | | | 20.23 | |
Ratios (%) (to average net assets)
and Supplemental data: | | | | | | | | | | | | | | | | | |
Expenses before expense reductions (f) | | | 1.00 | | | | 1.02 | | | | 1.02 | | | | 1.02 | | | | 1.02 | |
Expenses after expense reductions (f) | | | 0.84 | | | | 0.87 | | | | 0.88 | | | | 0.92 | | | | 0.89 | |
Net investment income | | | 2.72 | | | | 2.59 | | | | 3.21 | | | | 3.63 | | | | 4.31 | |
Portfolio turnover | | | 52 | | | | 95 | | | | 59 | | | | 67 | | | | 90 | |
Net assets at end of period (000 omitted) | | | $4,032 | | | | $4,909 | | | | $3,934 | | | | $2,593 | | | | $2,066 | |
| |
| Class 529B | | Years ended 4/30 | |
| | | 2014 | | | 2013 | | | 2012 | | | 2011 | | | 2010 | |
Net asset value, beginning of period | | | $11.15 | | | | $10.86 | | | | $10.59 | | | | $10.31 | | | | $9.00 | |
| Income (loss) from investment operations | | | | | | | | | | | | | |
Net investment income (d) | | | $0.20 | | | | $0.19 | | | | $0.26 | | | | $0.29 | | | | $0.34 | |
Net realized and unrealized gain (loss)
on investments and foreign currency | | | (0.22 | ) | | | 0.35 | | | | 0.31 | | | | 0.30 | | | | 1.36 | |
Total from investment operations | | | $(0.02 | ) | | | $0.54 | | | | $0.57 | | | | $0.59 | | | | $1.70 | |
| Less distributions declared to shareholders | | | | | | | | | | | | | |
From net investment income | | | $(0.23 | ) | | | $(0.25 | ) | | | $(0.30 | ) | | | $(0.31 | ) | | | $(0.39 | ) |
From net realized gain on investments | | | (0.00 | )(w) | | | — | | | | — | | | | — | | | | — | |
Total distributions declared to shareholders | | | $(0.23 | ) | | | $(0.25 | ) | | | $(0.30 | ) | | | $(0.31 | ) | | | $(0.39 | ) |
Net asset value, end of period (x) | | | $10.90 | | | | $11.15 | | | | $10.86 | | | | $10.59 | | | | $10.31 | |
Total return (%) (r)(s)(t)(x) | | | (0.08 | ) | | | 5.02 | | | | 5.46 | | | | 5.82 | | | | 19.17 | |
Ratios (%) (to average net assets)
and Supplemental data: | | | | | | | | | | | | | | | | | |
Expenses before expense reductions (f) | | | 1.75 | | | | 1.76 | | | | 1.77 | | | | 1.76 | | | | 1.77 | |
Expenses after expense reductions (f) | | | 1.69 | | | | 1.71 | | | | 1.73 | | | | 1.76 | | | | 1.74 | |
Net investment income | | | 1.84 | | | | 1.73 | | | | 2.39 | | | | 2.76 | | | | 3.47 | |
Portfolio turnover | | | 52 | | | | 95 | | | | 59 | | | | 67 | | | | 90 | |
Net assets at end of period (000 omitted) | | | $395 | | | | $458 | | | | $428 | | | | $590 | | | | $700 | |
See Notes to Financial Statements
38
Financial Highlights – continued
| | | | | | | | | | | | | | | | | | | | |
| Class 529C | | Years ended 4/30 | |
| | | 2014 | | | 2013 | | | 2012 | | | 2011 | | | 2010 | |
Net asset value, beginning of period | | | $11.15 | | | | $10.85 | | | | $10.58 | | | | $10.31 | | | | $8.99 | |
| Income (loss) from investment operations | | | | | | | | | | | | | |
Net investment income (d) | | | $0.20 | | | | $0.19 | | | | $0.25 | | | | $0.29 | | | | $0.34 | |
Net realized and unrealized gain (loss)
on investments and foreign currency | | | (0.22 | ) | | | 0.36 | | | | 0.32 | | | | 0.29 | | | | 1.37 | |
Total from investment operations | | | $(0.02 | ) | | | $0.55 | | | | $0.57 | | | | $0.58 | | | | $1.71 | |
| Less distributions declared to shareholders | | | | | | | | | | | | | |
From net investment income | | | $(0.23 | ) | | | $(0.25 | ) | | | $(0.30 | ) | | | $(0.31 | ) | | | $(0.39 | ) |
From net realized gain on investments | | | (0.00 | )(w) | | | — | | | | — | | | | — | | | | — | |
Total distributions declared to shareholders | | | $(0.23 | ) | | | $(0.25 | ) | | | $(0.30 | ) | | | $(0.31 | ) | | | $(0.39 | ) |
Net asset value, end of period (x) | | | $10.90 | | | | $11.15 | | | | $10.85 | | | | $10.58 | | | | $10.31 | |
Total return (%) (r)(s)(t)(x) | | | (0.08 | ) | | | 5.12 | | | | 5.47 | | | | 5.72 | | | | 19.30 | |
Ratios (%) (to average net assets)
and Supplemental data: | | | | | | | | | | | | | | | | | |
Expenses before expense reductions (f) | | | 1.75 | | | | 1.76 | | | | 1.77 | | | | 1.76 | | | | 1.77 | |
Expenses after expense reductions (f) | | | 1.70 | | | | 1.71 | | | | 1.73 | | | | 1.76 | | | | 1.74 | |
Net investment income | | | 1.84 | | | | 1.73 | | | | 2.34 | | | | 2.77 | | | | 3.46 | |
Portfolio turnover | | | 52 | | | | 95 | | | | 59 | | | | 67 | | | | 90 | |
Net assets at end of period (000 omitted) | | | $2,905 | | | | $4,097 | | | | $3,617 | | | | $2,284 | | | | $1,550 | |
| (d) | Per share data is based on average shares outstanding. |
| (f) | Ratios do not reflect reductions from fees paid indirectly, if applicable. |
| (r) | Certain expenses have been reduced without which performance would have been lower. |
| (s) | From time to time the fund may receive proceeds from litigation settlements, without which performance would be lower. |
| (t) | Total returns do not include any applicable sales charges. |
| (w) | Per share amount was less than $0.01. |
| (x) | The net asset values per share and total returns have been calculated on net assets which include adjustments made in accordance with U.S. generally accepted accounting principles required at period end for financial reporting purposes. |
| (y) | As further discussed in Note 5 in the Notes to Financial Statements, on May 10, 2012, sales of Class W shares (including exchanges) were suspended. On May 11, 2012, certain Class W shares were automatically converted to Class I shares. Shareholders of certain Class W shares became shareholders of Class I and received Class I shares with a total net asset value equal to their Class W shares at the time of the conversion. On May 30, 2012, remaining Class W shares, which represented MFS seed money, were redesignated as Class R5. Class R5 shares are generally available only to certain eligible retirement plans and to funds distributed by MFD. Class R5 shares do not pay a 12b-1 distribution fee or sub-accounting costs. On June 1, 2012, Class R5 shares were offered for sale to the public. |
See Notes to Financial Statements
39
NOTES TO FINANCIAL STATEMENTS
(1) Business and Organization
MFS Research Bond Fund (the fund) is a diversified series of MFS Series Trust IX (the trust). The trust is organized as a Massachusetts business trust and is registered under the Investment Company Act of 1940, as amended, as an open-end management investment company.
The fund is an investment company and accordingly follows the investment company accounting and reporting guidance of the Financial Accounting Standards Board (FASB) Accounting Standard Codification Topic 946 Financial Services – Investment Companies.
(2) Significant Accounting Policies
General – The preparation of financial statements in conformity with U.S. generally accepted accounting principles requires management to make estimates and assumptions that affect the reported amounts of assets and liabilities, and disclosure of contingent assets and liabilities at the date of the financial statements and the reported amounts of increases and decreases in net assets from operations during the reporting period. Actual results could differ from those estimates. In the preparation of these financial statements, management has evaluated subsequent events occurring after the date of the fund’s Statement of Assets and Liabilities through the date that the financial statements were issued. The fund invests in foreign securities. Investments in foreign securities are vulnerable to the effects of changes in the relative values of the local currency and the U.S. dollar and to the effects of changes in each country’s legal, political, and economic environment.
In this reporting period, the fund adopted the disclosure provisions of FASB Accounting Standards Update 2011-11 (“ASU 2011-11”), Balance Sheet (Topic 210) – Disclosures about Offsetting Assets and Liabilities along with the related scope clarification provisions of FASB Accounting Standards Update 2013-01 (“ASU 2013-01”) entitled Balance Sheet (Topic 210) – Clarifying the Scope of Disclosures about Offsetting Assets and Liabilities. ASU 2011-11 is intended to enhance disclosures on the offsetting of financial assets and liabilities by requiring entities to disclose both gross and net information about financial instruments and transactions that are either offset in the statement of financial position or subject to an enforceable Master Netting Agreement or similar arrangement. ASU 2013-01 limits the scope of ASU 2011-11’s disclosure requirements on offsetting to financial assets and financial liabilities related to derivatives, repurchase and reverse repurchase agreements, and securities lending and securities borrowing transactions. The disclosures required by ASU 2011-11, to the extent applicable to the fund, have been included in the fund’s Significant Accounting Policies note under the captions for each of the fund’s in-scope financial instruments and transactions.
The fund’s accounting policy with respect to balance sheet offsetting is that, absent an event of default by the counterparty or a termination of the agreement, the ISDA Master Agreement does not result in an offset of reported amounts of financial assets and financial liabilities in the Statement of Assets and Liabilities across transactions between the fund and the applicable counterparty. The fund’s right to setoff may be restricted or prohibited by the bankruptcy or insolvency laws of the particular
40
Notes to Financial Statements – continued
jurisdiction to which a specific master netting agreement counterparty is subject. Balance sheet offsetting disclosures, to the extent applicable to the fund, have been included in the fund’s Significant Accounting Policies note under the captions for each of the fund’s in-scope financial instruments and transactions.
Investment Valuations – Debt instruments and floating rate loans (other than short-term instruments), including restricted debt instruments, are generally valued at an evaluated or composite bid as provided by a third-party pricing service. Short-term instruments with a maturity at issuance of 60 days or less generally are valued at amortized cost, which approximates market value. Futures contracts are generally valued at last posted settlement price as provided by a third-party pricing service on the market on which they are primarily traded. Futures contracts for which there were no trades that day for a particular position are generally valued at the closing bid quotation as provided by a third-party pricing service on the market on which such futures contracts are primarily traded. Open-end investment companies are generally valued at net asset value per share. Securities and other assets generally valued on the basis of information from a third-party pricing service may also be valued at a broker/dealer bid quotation. Values obtained from third-party pricing services can utilize both transaction data and market information such as yield, quality, coupon rate, maturity, type of issue, trading characteristics, and other market data. The values of foreign securities and other assets and liabilities expressed in foreign currencies are converted to U.S. dollars using the mean of bid and asked prices for rates provided by a third-party pricing service.
The Board of Trustees has delegated primary responsibility for determining or causing to be determined the value of the fund’s investments (including any fair valuation) to the adviser pursuant to valuation policies and procedures approved by the Board. If the adviser determines that reliable market quotations are not readily available, investments are valued at fair value as determined in good faith by the adviser in accordance with such procedures under the oversight of the Board of Trustees. Under the fund’s valuation policies and procedures, market quotations are not considered to be readily available for most types of debt instruments and floating rate loans and many types of derivatives. These investments are generally valued at fair value based on information from third-party pricing services. In addition, investments may be valued at fair value if the adviser determines that an investment’s value has been materially affected by events occurring after the close of the exchange or market on which the investment is principally traded (such as foreign exchange or market) and prior to the determination of the fund’s net asset value, or after the halting of trading of a specific security where trading does not resume prior to the close of the exchange or market on which the security is principally traded. The adviser generally relies on third-party pricing services or other information (such as the correlation with price movements of similar securities in the same or other markets; the type, cost and investment characteristics of the security; the business and financial condition of the issuer; and trading and other market data) to assist in determining whether to fair value and at what value to fair value an investment. The value of an investment for purposes of calculating the fund’s net asset value can differ depending on the source and method used to determine value. When fair valuation is used, the value of an investment used to determine the fund’s net asset value may differ from quoted or published prices for the same
41
Notes to Financial Statements – continued
investment. There can be no assurance that the fund could obtain the fair value assigned to an investment if it were to sell the investment at the same time at which the fund determines its net asset value per share.
Various inputs are used in determining the value of the fund’s assets or liabilities. These inputs are categorized into three broad levels. In certain cases, the inputs used to measure fair value may fall into different levels of the fair value hierarchy. In such cases, an investment’s level within the fair value hierarchy is based on the lowest level of input that is significant to the fair value measurement. The fund’s assessment of the significance of a particular input to the fair value measurement in its entirety requires judgment, and considers factors specific to the investment. Level 1 includes unadjusted quoted prices in active markets for identical assets or liabilities. Level 2 includes other significant observable market-based inputs (including quoted prices for similar securities, interest rates, prepayment speed, and credit risk). Level 3 includes unobservable inputs, which may include the adviser’s own assumptions in determining the fair value of investments. Other financial instruments are derivative instruments not reflected in total investments, such as futures contracts. The following is a summary of the levels used as of April 30, 2014 in valuing the fund’s assets or liabilities:
| | | | | | | | | | | | | | | | |
| Investments at Value | | Level 1 | | | Level 2 | | | Level 3 | | | Total | |
| U.S. Treasury Bonds & U.S. Government Agency & Equivalents | | | $— | | | | $747,058,889 | | | | $— | | | | $747,058,889 | |
| Non-U.S. Sovereign Debt | | | — | | | | 54,181,062 | | | | — | | | | 54,181,062 | |
| Municipal Bonds | | | — | | | | 2,592,779 | | | | — | | | | 2,592,779 | |
| U.S. Corporate Bonds | | | — | | | | 1,466,802,685 | | | | — | | | | 1,466,802,685 | |
| Residential Mortgage-Backed Securities | | | — | | | | 714,554,654 | | | | — | | | | 714,554,654 | |
| Commercial Mortgage-Backed Securities | | | — | | | | 331,078,679 | | | | — | | | | 331,078,679 | |
| Asset-Backed Securities (including CDOs) | | | — | | | | 158,988,028 | | | | — | | | | 158,988,028 | |
| Foreign Bonds | | | — | | | | 413,948,571 | | | | — | | | | 413,948,571 | |
| Mutual Funds | | | 193,273,464 | | | | — | | | | — | | | | 193,273,464 | |
| Total Investments | | | $193,273,464 | | | | $3,889,205,347 | | | | $— | | | | $4,082,478,811 | |
| | | |
| Other Financial Instruments | | | | | | | | | | |
| Futures Contracts | | | $942,544 | | | | $— | | | | $— | | | | $942,544 | |
For further information regarding security characteristics, see the Portfolio of Investments.
Inflation-Adjusted Debt Securities – The fund invests in inflation-adjusted debt securities issued by the U.S. Treasury. The principal value of these debt securities is adjusted through income according to changes in the Consumer Price Index. These debt securities typically pay a fixed rate of interest, but this fixed rate is applied to the inflation-adjusted principal amount. The principal paid at maturity of the debt security is typically equal to the inflation-adjusted principal amount, or the security’s original par value, whichever is greater. Other types of inflation-adjusted securities may use other methods to adjust for other measures of inflation.
42
Notes to Financial Statements – continued
Derivatives – The fund uses derivatives for different purposes, primarily to increase or decrease exposure to a particular market or segment of the market, or security, to increase or decrease interest rate or currency exposure, or as alternatives to direct investments. Derivatives are used for hedging or non-hedging purposes. While hedging can reduce or eliminate losses, it can also reduce or eliminate gains. When the fund uses derivatives as an investment to increase market exposure, or for hedging purposes, gains and losses from derivative instruments may be substantially greater than the derivative’s original cost.
The derivative instruments used by the fund were futures contracts. The fund’s period end derivatives, as presented in the Portfolio of Investments and the associated Derivative Contract tables, generally are indicative of the volume of its derivative activity during the period.
The following table presents, by major type of derivative contract, the fair value, on a gross basis, of the asset and liability components of derivatives held by the fund at April 30, 2014 as reported in the Statement of Assets and Liabilities:
| | | | | | | | | | |
| | | | | Fair Value (a) | |
| Risk | | Derivative Contracts | | Asset Derivatives | | | Liability Derivatives | |
| Interest Rate | | Interest Rate Futures | | | $1,038,537 | | | | $(95,993) | |
| (a) | The value of futures contracts outstanding includes cumulative appreciation (depreciation) as reported in the fund’s Portfolio of Investments. Only the current day variation margin for futures contracts is separately reported within the fund’s Statement of Assets and Liabilities. |
The following table presents, by major type of derivative contract, the realized gain (loss) on derivatives held by the fund for the year ended April 30, 2014 as reported in the Statement of Operations:
| | | | |
| Risk | | Futures Contracts | |
| Interest Rate | | | $4,350,231 | |
The following table presents, by major type of derivative contract, the change in unrealized appreciation (depreciation) on derivatives held by the fund for the year ended April 30, 2014 as reported in the Statement of Operations:
| | | | |
| Risk | | Futures Contracts | |
| Interest Rate | | | $3,010,587 | |
Derivative counterparty credit risk is managed through formal evaluation of the creditworthiness of all potential counterparties. On certain, but not all, over-the-counter derivatives, the fund attempts to reduce its exposure to counterparty credit risk whenever possible by entering into an International Swaps and Derivatives Association (ISDA) Master Agreement on a bilateral basis with each of the counterparties with whom it undertakes a significant volume of transactions. The ISDA Master Agreement gives each party to the agreement the right to terminate all transactions traded under such agreement if there is a certain deterioration in the credit quality of the other party. Upon an event of default or a termination of the ISDA Master Agreement, the non-defaulting party has the right to close out all transactions traded under such agreement and to net amounts owed under each transaction to one net amount payable by one party to the other. This right to close out and net payments
43
Notes to Financial Statements – continued
across all transactions traded under the ISDA Master Agreement could result in a reduction of the fund’s credit risk to such counterparty equal to any amounts payable by the fund under the applicable transactions, if any. The fund’s right to setoff may be restricted or prohibited by the bankruptcy or insolvency laws of the particular jurisdiction to which a specific ISDA counterparty is subject.
Collateral and margin requirements differ by type of derivative. Margin requirements are set by the broker or clearing house for cleared derivatives (i.e., futures contracts, cleared swaps, and exchange-traded options) while collateral terms are contract specific for over-the-counter traded derivatives (i.e., forward foreign currency exchange contracts, uncleared swap agreements, and over-the-counter options). For derivatives traded under an ISDA Master Agreement, the collateral requirements are netted across all transactions traded under such agreement and one amount is posted from one party to the other to collateralize such obligations. Cash that has been segregated to cover the fund’s collateral or margin obligations under derivative contracts, if any, will be reported separately in the Statement of Assets and Liabilities as “Restricted cash” or “Deposits with brokers.” Securities pledged as collateral or margin for the same purpose, if any, are noted in the Portfolio of Investments.
Futures Contracts – The fund entered into futures contracts which may be used to hedge against or obtain broad market exposure, interest rate exposure, currency exposure, or to manage duration. A futures contract represents a commitment for the future purchase or sale of an asset at a specified price on a specified date.
Upon entering into a futures contract, the fund is required to deposit with the broker, either in cash or securities, an initial margin in an amount equal to a certain percentage of the notional amount of the contract. Subsequent payments (variation margin) are made or received by the fund each day, depending on the daily fluctuations in the value of the contract, and are recorded for financial statement purposes as unrealized gain or loss by the fund until the contract is closed or expires at which point the gain or loss on futures contracts is realized.
The fund bears the risk of interest rates, exchange rates or securities prices moving unexpectedly, in which case, the fund may not achieve the anticipated benefits of the futures contracts and may realize a loss. While futures contracts may present less counterparty risk to the fund since the contracts are exchange traded and the exchange’s clearinghouse guarantees payments to the broker, there is still counterparty credit risk due to the insolvency of the broker. The fund’s maximum risk of loss due to counterparty credit risk is equal to the margin posted by the fund to the broker plus any gains or minus any losses on the outstanding futures contracts.
Dollar Roll Transactions – The fund enters into dollar roll transactions, with respect to mortgage backed securities issued by Ginnie Mae, Fannie Mae, and Freddie Mac, in which the fund sells mortgage backed securities to financial institutions and simultaneously agrees to purchase similar (same issuer, type and coupon) securities at a later date at an agreed-upon price. During the period between the sale and repurchase in a dollar roll transaction the fund will not be entitled to receive interest and principal payments on the securities sold but is compensated by interest earned on the proceeds of the initial sale and by a lower purchase price on the securities to be repurchased
44
Notes to Financial Statements – continued
which enhances the fund’s total return. The fund accounts for dollar roll transactions as purchases and sales and realizes gains and losses on these transactions.
Indemnifications – Under the fund’s organizational documents, its officers and Trustees may be indemnified against certain liabilities and expenses arising out of the performance of their duties to the fund. Additionally, in the normal course of business, the fund enters into agreements with service providers that may contain indemnification clauses. The fund’s maximum exposure under these agreements is unknown as this would involve future claims that may be made against the fund that have not yet occurred.
Investment Transactions and Income – Investment transactions are recorded on the trade date. Interest income is recorded on the accrual basis. All premium and discount is amortized or accreted for financial statement purposes in accordance with U.S. generally accepted accounting principles. Inflation-indexed bonds are fixed-income securities whose principal value is periodically adjusted upward or downward based on the rate of inflation. Interest is accrued based on the principal value, which is adjusted for inflation. Any increase or decrease in the principal amount of an inflation-indexed bond is generally recorded as an increase or decrease in interest income, respectively, even though the adjusted principal is not received until maturity. Interest payments received in additional securities are recorded on the ex-interest date in an amount equal to the value of the security on such date. Debt obligations may be placed on non-accrual status or set to accrue at a rate of interest less than the contractual coupon when the collection of all or a portion of interest has become doubtful. Interest income for those debt obligations may be further reduced by the write-off of the related interest receivables when deemed uncollectible.
The fund may receive proceeds from litigation settlements. Any proceeds received from litigation involving portfolio holdings are reflected in the Statement of Operations in realized gain/loss if the security has been disposed of by the fund or in unrealized gain/loss if the security is still held by the fund. Any other proceeds from litigation not related to portfolio holdings are reflected as other income in the Statement of Operations.
The fund invests a significant portion of its assets in asset-backed and/or mortgage-backed securities. The value of these securities may depend, in part, on the issuer’s or borrower’s credit quality or ability to pay principal and interest when due and may fall if an issuer or borrower defaults on its obligation to pay principal or interest or if the instrument’s credit rating is downgraded by a credit rating agency. U.S. Government securities not supported as to the payment of principal or interest by the U.S. Treasury, such as those issued by Fannie Mae, Freddie Mac, and the Federal Home Loan Banks, are subject to greater credit risk than are U.S. Government securities supported by the U.S. Treasury, such as those issued by Ginnie Mae.
The fund purchased or sold debt securities on a when-issued or delayed delivery basis, or in a “To Be Announced” (TBA) or “forward commitment” transaction with delivery or payment to occur at a later date beyond the normal settlement period. At the time a fund enters into a commitment to purchase or sell a security, the transaction is recorded and the value of the security acquired is reflected in the fund’s net asset value. The price of such security and the date that the security will be delivered and
45
Notes to Financial Statements – continued
paid for are fixed at the time the transaction is negotiated. The value of the security may vary with market fluctuations. TBA securities resulting from these transactions are included in the Portfolio of Investments. TBA purchase commitments are held at carrying amount, which approximates fair value and are categorized as level 2 within the fair value hierarchy. No interest accrues to the fund until payment takes place. At the time that a fund enters into this type of transaction, the fund is required to have sufficient cash and/or liquid securities to cover its commitments. Losses may arise due to changes in the value of the underlying securities or if the counterparty does not perform under the contract’s terms, or if the issuer does not issue the securities due to political, economic or other factors. Additionally, losses may arise due to declines in the value of the securities prior to settlement date.
To mitigate this risk of loss on TBA securities and other types of forward settling mortgage-backed securities, the fund whenever possible enters into a Master Securities Forward Transaction Agreement (“MSFTA”) on a bilateral basis with each of the counterparties with whom it undertakes a significant volume of transactions. The MSFTA gives each party to the agreement the right to terminate all transactions traded under such agreement if there is a certain deterioration in the credit quality of the other party. Upon an event of default or a termination of the MSFTA, the non-defaulting party has the right to close out all transactions traded under such agreement and to net amounts owed under each transaction to one net amount payable by one party to the other. This right to close out and net payments across all transactions traded under the MSFTA could result in a reduction of the fund’s credit risk to such counterparty equal to any amounts payable by the fund under the applicable transactions, if any.
For mortgage backed securities traded under a MSFTA, the collateral and margining requirements are contract specific. Collateral amounts across all transactions traded under such agreement are netted and one amount is posted from one party to the other to collateralize such obligations. Cash that has been pledged to cover the fund’s collateral or margin obligations under a MSFTA, if any, will be reported separately on the Statement of Assets and Liabilities as restricted cash. Securities pledged as collateral or margin for the same purpose, if any, are noted in the Portfolio of Investments.
Fees Paid Indirectly – The fund’s custody fee may be reduced according to an arrangement that measures the value of cash deposited with the custodian by the fund. For the year ended April 30, 2014, custody fees were not reduced.
Tax Matters and Distributions – The fund intends to qualify as a regulated investment company, as defined under Subchapter M of the Internal Revenue Code, and to distribute all of its taxable income, including realized capital gains. As a result, no provision for federal income tax is required. The fund’s federal tax returns, when filed, will remain subject to examination by the Internal Revenue Service for a three year period. Management has analyzed the fund’s tax positions taken on federal and state tax returns for all open tax years and does not believe that there are any uncertain tax positions that require recognition of a tax liability. Foreign taxes, if any, have been accrued by the fund in the accompanying financial statements in accordance with the applicable foreign tax law. Foreign income taxes may be withheld by certain countries in which the fund invests. Additionally, capital gains realized by the fund on securities
46
Notes to Financial Statements – continued
issued in or by certain foreign countries may be subject to capital gains tax imposed by those countries.
Distributions to shareholders are recorded on the ex-dividend date. Income and capital gain distributions are determined in accordance with income tax regulations, which may differ from U.S. generally accepted accounting principles. Certain capital accounts in the financial statements are periodically adjusted for permanent differences in order to reflect their tax character. These adjustments have no impact on net assets or net asset value per share. Temporary differences which arise from recognizing certain items of income, expense, gain or loss in different periods for financial statement and tax purposes will reverse at some time in the future. Distributions in excess of net investment income or net realized gains are temporary overdistributions for financial statement purposes resulting from differences in the recognition or classification of income or distributions for financial statement and tax purposes.
Book/tax differences primarily relate to amortization and accretion of debt securities.
The tax character of distributions declared to shareholders for the last two fiscal years is as follows:
| | | | | | | | |
| | | 4/30/14 | | | 4/30/13 | |
| Ordinary income (including any short-term capital gains) | | | $119,485,702 | | | | $111,315,407 | |
| Long-term capital gain | | | 1,644,805 | | | | — | |
| Total distributions | | | $121,130,507 | | | | $111,315,407 | |
The federal tax cost and the tax basis components of distributable earnings were as follows:
| | | | |
| As of 4/30/14 | | | |
| Cost of investments | | | $4,005,144,873 | |
| Gross appreciation | | | 119,431,875 | |
| Gross depreciation | | | (42,097,937 | ) |
| Net unrealized appreciation (depreciation) | | | $77,333,938 | |
| Undistributed ordinary income | | | 11,461,332 | |
| Capital loss carryforwards | | | (1,201,779 | ) |
| Post-October capital loss deferral | | | (1,859,788 | ) |
| Other temporary differences | | | (12,948,381 | ) |
As of April 30, 2014, the fund had capital loss carryforwards available to offset future realized gains. Such losses are characterized as follows:
Under the Regulated Investment Company Modernization Act of 2010 (the “Act”), the above net capital losses may be carried forward indefinitely, and their character is retained as short-term and/or long-term losses. Previously, net capital losses were carried forward for eight years and treated as short-term losses.
47
Notes to Financial Statements – continued
Multiple Classes of Shares of Beneficial Interest – The fund offers multiple classes of shares, which differ in their respective distribution, service, and program manager fees. The fund’s income and common expenses are allocated to shareholders based on the value of settled shares outstanding of each class. The fund’s realized and unrealized gain (loss) are allocated to shareholders based on the daily net assets of each class. Dividends are declared separately for each class. Differences in per share dividend rates are generally due to differences in separate class expenses. Class B and Class 529B shares will convert to Class A and Class 529A shares, respectively, approximately eight years after purchase. The fund’s distributions declared to shareholders as reported in the Statements of Changes in Net Assets are presented by class as follows:
| | | | | | | | | | | | | | | | |
| | | From net investment
income | | | From net realized gain on
investments | |
| | | Year
ended
4/30/14 | | | Year
ended
4/30/13 | | | Year
ended
4/30/14 | | | Year
ended
4/30/13 | |
| Class A | | | $33,669,942 | | | | $33,638,535 | | | | $475,007 | | | | $— | |
| Class B | | | 843,574 | | | | 1,109,125 | | | | 15,388 | | | | — | |
| Class C | | | 2,834,151 | | | | 3,742,474 | | | | 52,994 | | | | — | |
| Class I | | | 31,952,667 | | | | 37,063,289 | | | | 425,791 | | | | — | |
| Class R1 | | | 64,655 | | | | 73,629 | | | | 1,189 | | | | — | |
| Class R2 | | | 1,105,767 | | | | 1,314,556 | | | | 17,447 | | | | — | |
| Class R3 | | | 1,368,544 | | | | 1,437,104 | | | | 18,423 | | | | — | |
| Class R4 | | | 2,142,480 | | | | 2,154,733 | | | | 28,448 | | | | — | |
| Class R5 (formerly Class W) | | | 45,294,343 | | | | 30,549,704 | | | | 610,109 | | | | — | |
| Class 529A | | | 128,399 | | | | 133,993 | | | | 1,838 | | | | — | |
| Class 529B | | | 8,733 | | | | 9,736 | | | | 166 | | | | — | |
| Class 529C | | | 69,111 | | | | 88,529 | | | | 1,341 | | | | — | |
| Total | | | $119,482,366 | | | | $111,315,407 | | | | $1,648,141 | | | | $— | |
On May 30, 2012, Class W shares were redesignated Class R5. See Note 5 for additional information.
(3) Transactions with Affiliates
Investment Adviser – The fund has an investment advisory agreement with MFS to provide overall investment management and related administrative services and facilities to the fund. The management fee is computed daily and paid monthly at an annual rate of 0.50% of the fund’s average daily net assets.
MFS has agreed in writing to reduce its management fee by a specified amount if certain MFS mutual fund assets exceed thresholds agreed to by MFS and the fund’s Board of Trustees. For the year ended April 30, 2014, this management fee reduction amounted to $73,631, which is included in the reduction of total expenses in the Statement of Operations. The management fee incurred for the year ended April 30, 2014 was equivalent to an annual effective rate of 0.50% of the fund’s average daily net assets.
Distributor – MFS Fund Distributors, Inc. (MFD), a wholly-owned subsidiary of MFS, as distributor, received $1,331,797 and $2,104 for the year ended April 30, 2014, as its portion of the initial sales charge on sales of Class A and Class 529A shares of the fund, respectively.
48
Notes to Financial Statements – continued
The Board of Trustees has adopted a distribution plan for certain share classes pursuant to Rule 12b-1 of the Investment Company Act of 1940.
The fund’s distribution plan provides that the fund will pay MFD for services provided by MFD and financial intermediaries in connection with the distribution and servicing of certain share classes. One component of the plan is a distribution fee paid to MFD and another component of the plan is a service fee paid to MFD. MFD may subsequently pay all, or a portion, of the distribution and/or service fees to financial intermediaries.
Distribution Plan Fee Table:
| | | | | | | | | | | | |
| | | Distribution Fee Rate (d) | | Service Fee Rate (d) | | Total
Distribution
Plan (d) | | Annual Effective Rate (e) | | Distribution and Service Fee | |
| Class A | | — | | 0.25% | | 0.25% | | 0.15% | | | $2,762,263 | |
| Class B | | 0.75% | | 0.25% | | 1.00% | | 0.90% | | | 368,331 | |
| Class C | | 0.75% | | 0.25% | | 1.00% | | 1.00% | | | 1,298,673 | |
| Class R1 | | 0.75% | | 0.25% | | 1.00% | | 1.00% | | | 29,527 | |
| Class R2 | | 0.25% | | 0.25% | | 0.50% | | 0.50% | | | 204,870 | |
| Class R3 | | — | | 0.25% | | 0.25% | | 0.25% | | | 116,125 | |
| Class 529A | | — | | 0.25% | | 0.25% | | 0.14% | | | 10,748 | |
| Class 529B | | 0.75% | | 0.25% | | 1.00% | | 1.00% | | | 4,081 | |
| Class 529C | | 0.75% | | 0.25% | | 1.00% | | 1.00% | | | 32,541 | |
| Total Distribution and Service Fees | | | | | | | $4,827,159 | |
| (d) | In accordance with the distribution plan for certain classes, the fund pays distribution and/or service fees equal to these annual percentage rates of each class’s average daily net assets. The distribution and service fee rates disclosed by class represent the current rates in effect at the end of the reporting period. Any rate changes, if applicable, are detailed below. |
| (e) | The annual effective rates represent actual fees incurred under the distribution plan for the year ended April 30, 2014 based on each class’s average daily net assets. 0.10% of the Class A and Class 529A service fee is currently being waived under a written waiver arrangement. For the year ended April 30, 2014, this waiver amounted to $1,109,196 and is included in the reduction of total expenses in the Statement of Operations. Assets attributable to Class B shares purchased prior to May 1, 2006 are subject to the 0.25% annual Class B service fee. On assets attributable to all other Class B shares, 0.15% of the Class B service fee is being paid by the fund and 0.10% of the Class B service fee is being waived under a written waiver agreement. For the year ended April 30, 2014, this waiver amounted to $37,569 and is included in the reduction of total expenses in the Statement of Operations. These written waiver agreements will continue until modified by the fund’s Board of Trustees, but such agreements will continue at least until August 31, 2014. MFD has voluntarily agreed to rebate a portion of each class’s 0.25% service fee attributable to accounts for which MFD retains the 0.25% service fee except for accounts attributable to MFS or its affiliates’ seed money. For the year ended April 30, 2014, this rebate amounted to $17, $153, $962, $471, $2, and $23 for Class B, Class C, Class R3, Class 529A, Class 529B, and Class 529C, respectively, and is included in the reduction of total expenses in the Statement of Operations. |
Certain Class A shares are subject to a contingent deferred sales charge (CDSC) in the event of a shareholder redemption within 18 months of purchase for shares purchased on or after August 1, 2012, and within 24 months of purchase for shares purchased prior to August 1, 2012. Class C and Class 529C shares are subject to a CDSC in the event of a shareholder redemption within 12 months of purchase. Class B and
49
Notes to Financial Statements – continued
Class 529B shares are subject to a CDSC in the event of a shareholder redemption within six years of purchase. All contingent deferred sales charges are paid to MFD and during the year ended April 30, 2014, were as follows:
| | | | |
| | | Amount | |
| Class A | | | $92,607 | |
| Class B | | | 98,945 | |
| Class C | | | 24,644 | |
| Class 529B | | | — | |
| Class 529C | | | 7 | |
The fund has entered into and may from time to time enter into contracts with program managers and other parties which administer the tuition programs through which an investment in the fund’s 529 share classes is made. The fund has entered into an agreement with MFD pursuant to which MFD receives an annual fee of up to 0.10% of the average daily net assets attributable to each 529 share class. MFD has agreed to waive a portion of this fee in an amount equal to 0.05% of the average daily net assets for each 529 share class. This waiver agreement will expire on August 31, 2015, unless MFD elects to extend the waiver. For the year ended April 30, 2014, this waiver amounted to $3,981 and is included in the reduction of total expenses in the Statement of Operations. The program manager fee incurred for the year ended April 30, 2014 was equivalent to an annual effective rate of 0.05% of the average daily net assets attributable to each 529 share class. The services provided by MFD, or a third party with which MFD contracts, include recordkeeping and tax reporting and account services, as well as services designed to maintain the program’s compliance with the Internal Revenue Code and other regulatory requirements. Program manager fees and waivers for the year ended April 30, 2014, were as follows:
| | | | | | | | |
| | | Fee | | | Waiver | |
| Class 529A | | | $4,299 | | | | $2,150 | |
| Class 529B | | | 408 | | | | 204 | |
| Class 529C | | | 3,254 | | | | 1,627 | |
| Total Program Manager Fees and Waivers | | | $7,961 | | | | $3,981 | |
Shareholder Servicing Agent – MFS Service Center, Inc. (MFSC), a wholly-owned subsidiary of MFS, receives a fee from the fund for its services as shareholder servicing agent calculated as a percentage of the average daily net assets of the fund as determined periodically under the supervision of the fund’s Board of Trustees. For the year ended April 30, 2014, the fee was $228,101, which equated to 0.0060% annually of the fund’s average daily net assets. MFSC also receives payment from the fund for out-of-pocket expenses, sub-accounting and other shareholder servicing costs which may be paid to affiliated and unaffiliated service providers. Class R5 shares do not incur sub-accounting fees. For the year ended April 30, 2014, these out-of-pocket expenses, sub-accounting and other shareholder servicing costs amounted to $2,383,147.
Administrator – MFS provides certain financial, legal, shareholder communications, compliance, and other administrative services to the fund. Under an administrative services agreement, the fund partially reimburses MFS the costs incurred to provide these services. The fund is charged an annual fixed amount of $17,500 plus a fee
50
Notes to Financial Statements – continued
based on average daily net assets. The administrative services fee incurred for the year ended April 30, 2014 was equivalent to an annual effective rate of 0.0121% of the fund’s average daily net assets.
Trustees’ and Officers’ Compensation – The fund pays compensation to independent Trustees in the form of a retainer, attendance fees, and additional compensation to Board and Committee chairpersons. The fund does not pay compensation directly to Trustees or officers of the fund who are also officers of the investment adviser, all of whom receive remuneration for their services to the fund from MFS. Certain officers and Trustees of the fund are officers or directors of MFS, MFD, and MFSC.
Other – This fund and certain other funds managed by MFS (the funds) have entered into services agreements (the Agreements) which provide for payment of fees by the funds to Tarantino LLC and Griffin Compliance LLC in return for the provision of services of an Independent Chief Compliance Officer (ICCO) and Assistant ICCO, respectively, for the funds. The ICCO and Assistant ICCO are officers of the funds and the sole members of Tarantino LLC and Griffin Compliance LLC, respectively. The funds can terminate the Agreements with Tarantino LLC and Griffin Compliance LLC at any time under the terms of the Agreements. For the year ended April 30, 2014, the aggregate fees paid by the fund to Tarantino LLC and Griffin Compliance LLC were $21,585 and are included in “Miscellaneous” expense in the Statement of Operations. MFS has agreed to reimburse the fund for a portion of the payments made by the fund in the amount of $7,579, which is included in the reduction of total expenses in the Statement of Operations. Additionally, MFS has agreed to bear all expenses associated with office space, other administrative support, and supplies provided to the ICCO and Assistant ICCO.
The fund invests in the MFS Institutional Money Market Portfolio which is managed by MFS and seeks current income consistent with preservation of capital and liquidity. Income earned on this investment is included in “Dividends from underlying affiliated funds” in the Statement of Operations. This money market fund does not pay a management fee to MFS.
On May 9, 2012, MFS purchased 9,200 shares of Class W for an aggregate amount of $100,000. On May 31, 2012, MFS purchased 9,191 shares of Class R5 for an aggregate amount of $100,000. On September 11, 2013, MFS redeemed 9,501 shares of Class R5 for an aggregate amount of $100,331.
(4) Portfolio Securities
Purchases and sales of investments, other than short-term obligations, were as follows:
| | | | | | | | |
| | | Purchases | | | Sales | |
| U.S. Government securities | | | $1,187,127,322 | | | | $1,013,872,753 | |
| Investments (non-U.S. Government securities) | | | $1,282,032,359 | | | | $845,112,737 | |
51
Notes to Financial Statements – continued
(5) Shares of Beneficial Interest
The fund’s Declaration of Trust permits the Trustees to issue an unlimited number of full and fractional shares of beneficial interest. Transactions in fund shares were as follows:
| | | | | | | | | | | | | | | | |
| | | Year ended
4/30/14 | | | Year ended
4/30/13 | |
| | | Shares | | | Amount | | | Shares | | | Amount | |
| Shares sold | | | | | | | | | | | | | | | | |
Class A | | | 34,884,855 | | | | $376,493,679 | | | | 33,996,548 | | | | $375,285,386 | |
Class B | | | 235,047 | | | | 2,538,092 | | | | 815,882 | | | | 8,976,439 | |
Class C | | | 1,552,586 | | | | 16,771,938 | | | | 3,398,006 | | | | 37,538,702 | |
Class I | | | 29,239,545 | | | | 314,596,919 | | | | 30,649,064 | | | | 338,112,058 | |
Class R1 | | | 79,772 | | | | 860,782 | | | | 72,520 | | | | 801,721 | |
Class R2 | | | 1,013,334 | | | | 10,906,417 | | | | 825,782 | | | | 9,081,039 | |
Class R3 | | | 1,706,914 | | | | 18,359,500 | | | | 2,248,371 | | | | 24,779,076 | |
Class R4 | | | 1,622,242 | | | | 17,458,899 | | | | 4,382,056 | | | | 48,416,509 | |
Class R5 (formerly Class W) | | | 29,938,405 | | | | 322,147,095 | | | | 111,147,287 | | | | 1,211,816,308 | |
Class 529A | | | 64,986 | | | | 700,418 | | | | 137,962 | | | | 1,520,802 | |
Class 529B | | | 4,647 | | | | 50,056 | | | | 11,722 | | | | 129,212 | |
Class 529C | | | 27,452 | | | | 296,846 | | | | 87,786 | | | | 968,955 | |
| | | 100,369,785 | | | | $1,081,180,641 | | | | 187,772,986 | | | | $2,057,426,207 | |
| | | | |
| Shares issued to shareholders in reinvestment of distributions | | | | | | | | | | | | | | | | |
Class A | | | 2,648,244 | | | | $28,510,669 | | | | 2,508,323 | | | | $27,710,545 | |
Class B | | | 65,940 | | | | 710,777 | | | | 81,094 | | | | 897,321 | |
Class C | | | 178,107 | | | | 1,920,069 | | | | 199,672 | | | | 2,208,649 | |
Class I | | | 1,024,422 | | | | 11,034,262 | | | | 1,150,198 | | | | 12,688,551 | |
Class R1 | | | 6,102 | | | | 65,805 | | | | 6,647 | | | | 73,551 | |
Class R2 | | | 101,692 | | | | 1,094,262 | | | | 114,563 | | | | 1,264,447 | |
Class R3 | | | 128,156 | | | | 1,379,837 | | | | 130,069 | | | | 1,437,104 | |
Class R4 | | | 200,618 | | | | 2,159,819 | | | | 194,297 | | | | 2,148,293 | |
Class R5 (formerly Class W) | | | 4,261,902 | | | | 45,904,402 | | | | 2,758,225 | | | | 30,542,174 | |
Class 529A | | | 11,975 | | | | 128,687 | | | | 12,084 | | | | 133,279 | |
Class 529B | | | 819 | | | | 8,826 | | | | 873 | | | | 9,665 | |
Class 529C | | | 6,449 | | | | 69,504 | | | | 7,987 | | | | 88,329 | |
| | | 8,634,426 | | | | $92,986,919 | | | | 7,164,032 | | | | $79,201,908 | |
52
Notes to Financial Statements – continued
| | | | | | | | | | | | | | | | |
| | | Year ended
4/30/14 | | | Year ended
4/30/13 | |
| | | Shares | | | Amount | | | Shares | | | Amount | |
| Shares reacquired | | | | | | | | | | | | | | | | |
Class A | | | (33,412,909 | ) | | | $(359,480,098 | ) | | | (27,759,003 | ) | | | $(306,104,540 | ) |
Class B | | | (1,219,823 | ) | | | (13,135,475 | ) | | | (997,231 | ) | | | (11,020,215 | ) |
Class C | | | (5,601,611 | ) | | | (60,290,229 | ) | | | (3,304,063 | ) | | | (36,512,269 | ) |
Class I | | | (32,850,302 | ) | | | (354,422,821 | ) | | | (113,144,334 | ) | | | (1,232,817,775 | ) |
Class R1 | | | (99,035 | ) | | | (1,067,944 | ) | | | (69,358 | ) | | | (767,258 | ) |
Class R2 | | | (1,177,316 | ) | | | (12,656,265 | ) | | | (1,188,714 | ) | | | (13,128,477 | ) |
Class R3 | | | (2,186,040 | ) | | | (23,524,796 | ) | | | (1,338,048 | ) | | | (14,791,925 | ) |
Class R4 | | | (3,097,938 | ) | | | (33,233,393 | ) | | | (1,288,951 | ) | | | (14,222,670 | ) |
Class R5 (formerly Class W) | | | (2,300,120 | ) | | | (24,751,983 | ) | | | (4,873,927 | ) | | | (53,341,034 | ) |
Class 529A | | | (147,707 | ) | | | (1,578,556 | ) | | | (71,809 | ) | | | (790,430 | ) |
Class 529B | | | (10,303 | ) | | | (110,730 | ) | | | (10,929 | ) | | | (120,127 | ) |
Class 529C | | | (134,891 | ) | | | (1,447,852 | ) | | | (61,443 | ) | | | (679,585 | ) |
| | | (82,237,995 | ) | | | $(885,700,142 | ) | | | (154,107,810 | ) | | | $(1,684,296,305 | ) |
| | | | |
| Net change | | | | | | | | | | | | | | | | |
Class A | | | 4,120,190 | | | | $45,524,250 | | | | 8,745,868 | | | | $96,891,391 | |
Class B | | | (918,836 | ) | | | (9,886,606 | ) | | | (100,255 | ) | | | (1,146,455 | ) |
Class C | | | (3,870,918 | ) | | | (41,598,222 | ) | | | 293,615 | | | | 3,235,082 | |
Class I | | | (2,586,335 | ) | | | (28,791,640 | ) | | | (81,345,072 | ) | | | (882,017,166 | ) |
Class R1 | | | (13,161 | ) | | | (141,357 | ) | | | 9,809 | | | | 108,014 | |
Class R2 | | | (62,290 | ) | | | (655,586 | ) | | | (248,369 | ) | | | (2,782,991 | ) |
Class R3 | | | (350,970 | ) | | | (3,785,459 | ) | | | 1,040,392 | | | | 11,424,255 | |
Class R4 | | | (1,275,078 | ) | | | (13,614,675 | ) | | | 3,287,402 | | | | 36,342,132 | |
Class R5 (formerly Class W) | | | 31,900,187 | | | | 343,299,514 | | | | 109,031,585 | | | | 1,189,017,448 | |
Class 529A | | | (70,746 | ) | | | (749,451 | ) | | | 78,237 | | | | 863,651 | |
Class 529B | | | (4,837 | ) | | | (51,848 | ) | | | 1,666 | | | | 18,750 | |
Class 529C | | | (100,990 | ) | | | (1,081,502 | ) | | | 34,330 | | | | 377,699 | |
| | | 26,766,216 | | | | $288,467,418 | | | | 40,829,208 | | | | $452,331,810 | |
The fund is one of several mutual funds in which the MFS funds-of-funds may invest. The MFS funds-of-funds do not invest in the underlying MFS funds for the purpose of exercising management or control. At the end of the period, the MFS Moderate Allocation Fund, the MFS Conservative Allocation Fund, the MFS Growth Allocation Fund, the MFS Lifetime Retirement Income Fund, the MFS Lifetime 2020 Fund, and the MFS Lifetime 2010 Fund were the owners of record of approximately 18%, 12%, 4%, 2%, 1%, and 1%, respectively, of the value of outstanding voting shares of the fund. In addition, the MFS Lifetime 2015 Fund, the MFS Lifetime 2025 Fund, the MFS Lifetime 2030 Fund, the MFS Lifetime 2035 Fund, the MFS Lifetime 2040 Fund, the MFS Lifetime 2045 Fund, the MFS Lifetime 2050 Fund, and the MFS Lifetime 2055 Fund were each the owners of record of less than 1% of the value of outstanding voting shares of the fund.
Redesignation of Class W to Class R5 – On May 10, 2012, sales of Class W shares (including exchanges) were suspended. On May 11, 2012, certain Class W shares were
53
Notes to Financial Statements – continued
automatically converted to Class I shares. Shareholders of certain Class W shares became shareholders of Class I and received Class I shares with a total net asset value equal to their Class W shares at the time of the conversion. On May 30, 2012, remaining Class W shares, which represented MFS seed money, were redesignated Class R5. Class R5 shares are generally available only to certain eligible retirement plans and to funds distributed by MFD. Class R5 shares do not pay a 12b-1 distribution fee or sub-accounting costs. On June 1, 2012, Class R5 shares were offered for sale to the public.
(6) Line of Credit
The fund and certain other funds managed by MFS participate in a $1.1 billion unsecured committed line of credit, subject to a $1 billion sublimit, provided by a syndication of banks under a credit agreement. Borrowings may be made for temporary financing needs. Interest is charged to each fund, based on its borrowings, generally at a rate equal to the higher of the Federal Reserve funds rate or one month LIBOR plus an agreed upon spread. A commitment fee, based on the average daily, unused portion of the committed line of credit, is allocated among the participating funds at the end of each calendar quarter. In addition, the fund and other funds managed by MFS have established unsecured uncommitted borrowing arrangements with certain banks for temporary financing needs. Interest is charged to each fund, based on its borrowings, at a rate equal to the Federal Reserve funds rate plus an agreed upon spread. For the year ended April 30, 2014, the fund’s commitment fee and interest expense were $15,888 and $0, respectively, and are included in “Miscellaneous” expense in the Statement of Operations.
(7) Transactions in Underlying Affiliated Funds-Affiliated Issuers
An affiliated issuer may be considered one in which the fund owns 5% or more of the outstanding voting securities, or a company which is under common control. For the purposes of this report, the fund assumes the following to be an affiliated issuer:
| | | | | | | | | | | | | | | | |
| Underlying Affiliated Fund | | Beginning Shares/Par Amount | | | Acquisitions Shares/Par Amount | | | Dispositions Shares/Par Amount | | | Ending Shares/Par Amount | |
MFS Institutional Money
Market Portfolio | | | 207,008,266 | | | | 1,083,993,776 | | | | (1,097,728,578 | ) | | | 193,273,464 | |
| | | | |
| Underlying Affiliated Fund | | Realized Gain (Loss) | | | Capital Gain Distributions | | | Dividend Income | | | Ending Value | |
MFS Institutional Money
Market Portfolio | | | $— | | | | $— | | | | $94,814 | | | | $193,273,464 | |
54
REPORT OF INDEPENDENT REGISTERED PUBLIC ACCOUNTING FIRM
To the Board of Trustees of MFS Series Trust IX and the Shareholders of MFS Research Bond Fund:
We have audited the accompanying statement of assets and liabilities, including the portfolio of investments, of MFS Research Bond Fund (one of the series of MFS Series Trust IX) (the “Fund”) as of April 30, 2014, and the related statement of operations for the year then ended, the statements of changes in net assets for each of the two years in the period then ended, and the financial highlights for each of the five years in the period then ended. These financial statements and financial highlights are the responsibility of the Fund’s management. Our responsibility is to express an opinion on these financial statements and financial highlights based on our audits.
We conducted our audits in accordance with the standards of the Public Company Accounting Oversight Board (United States). Those standards require that we plan and perform the audit to obtain reasonable assurance about whether the financial statements and financial highlights are free of material misstatement. The Fund is not required to have, nor were we engaged to perform, an audit of its internal control over financial reporting. Our audits included consideration of internal control over financial reporting as a basis for designing audit procedures that are appropriate in the circumstances, but not for the purpose of expressing an opinion on the effectiveness of the Fund’s internal control over financial reporting. Accordingly, we express no such opinion. An audit also includes examining, on a test basis, evidence supporting the amounts and disclosures in the financial statements, assessing the accounting principles used and significant estimates made by management, as well as evaluating the overall financial statement presentation. Our procedures included confirmation of securities owned as of April 30, 2014, by correspondence with the custodian and brokers; where replies were not received from brokers, we performed other auditing procedures. We believe that our audits provide a reasonable basis for our opinion.
In our opinion, the financial statements and financial highlights referred to above present fairly, in all material respects, the financial position of MFS Research Bond Fund as of April 30, 2014, the results of its operations for the year then ended, the changes in its net assets for each of the two years in the period then ended, and the financial highlights for each of the five years in the period then ended, in conformity with accounting principles generally accepted in the United States of America.
DELOITTE & TOUCHE LLP
Boston, Massachusetts
June 17, 2014
55
TRUSTEES AND OFFICERS — IDENTIFICATION AND BACKGROUND
The Trustees and Officers of the Trust, as of June 1, 2014, are listed below, together with their principal occupations during the past five years. (Their titles may have varied during that period.) The address of each Trustee and Officer is 111 Huntington Avenue, Boston, Massachusetts 02199-7618. It is expected that the Board will appoint Mr. Timothy M. Fagan as Chief Compliance Officer of the MFS Funds on November 1, 2014.
| | | | | | | | |
Name, Age | | Position(s) Held with Fund | | Trustee/Officer
Since (h) | | Principal
Occupations During the Past Five Years | | Other Directorships (j) |
| INTERESTED TRUSTEES |
Robert J. Manning (k) (age 50) | | Trustee | | February 2004 | | Massachusetts Financial Services Company, Chairman, Chief Executive Officer and Director; President (until 2009); Chief Investment Officer (until 2010) | | N/A |
Robin A. Stelmach (k) (age 52) | | Trustee | | January 2014 | | Massachusetts Financial Services Company, Executive Vice President and Chief Operating Officer | | N/A |
| INDEPENDENT TRUSTEES |
David H. Gunning
(age 72) | | Trustee and Chair of Trustees | | January 2004 | | Private investor | | Lincoln Electric Holdings, Inc. (welding equipment manufacturer), Director; Development Alternatives, Inc. (consulting), Director/Non-Executive Chairman |
Steven E. Buller (age 62) | | Trustee | | February 2014 | | Chairman, Financial Accounting Standards Advisory Council; Standing Advisory Group, Public Company Accounting Oversight Board, Member; BlackRock, Inc. (investment management), Managing Director (until 2014), BlackRock Finco (investment management), UK, Director (until 2014) | | N/A |
56
Trustees and Officers – continued
| | | | | | | | |
Name, Age | | Position(s) Held with Fund | | Trustee/Officer
Since (h) | | Principal
Occupations During the Past Five Years | | Other Directorships (j) |
Robert E. Butler
(age 72) | | Trustee | | January 2006 | | Consultant – investment company industry regulatory and compliance matters | | N/A |
Maureen R. Goldfarb (age 59) | | Trustee | | January 2009 | | Private investor | | N/A |
William R. Gutow
(age 72) | | Trustee | | December 1993 | | Private investor and real estate consultant; Capitol Entertainment Management Company (video franchise), Vice Chairman | | Texas Donuts (donut franchise), Vice Chairman (until 2010) |
Michael Hegarty
(age 69) | | Trustee | | December 2004 | | Private investor | | Brookfield Office Properties, Inc. (real estate), Director; Rouse Properties Inc. (real estate), Director; Capmark Financial Group Inc. (real estate), Director |
John P. Kavanaugh (age 59) | | Trustee | | January 2009 | | Private investor | | N/A |
Maryanne L. Roepke (age 58) | | Trustee | | May 2014 | | American Century Investments (investment management), Senior Vice President and Chief Compliance Officer (until 2014) | | N/A |
Laurie J. Thomsen
(age 56) | | Trustee | | March 2005 | | Private investor; New Profit, Inc. (venture philanthropy), Executive Partner (until 2010) | | The Travelers Companies (insurance), Director |
Robert W. Uek
(age 73) | | Trustee | | January 2006 | | Consultant to investment company industry | | N/A |
| OFFICERS | | | | | | | | |
John M. Corcoran (k) (age 49) | | President | | October 2008 | | Massachusetts Financial Services Company, Senior Vice President | | N/A |
Christopher R. Bohane (k) (age 40) | | Assistant Secretary and Assistant Clerk | | July 2005 | | Massachusetts Financial Services Company, Vice President and Assistant General Counsel | | N/A |
57
Trustees and Officers – continued
| | | | | | | | |
Name, Age | | Position(s) Held with Fund | | Trustee/Officer
Since (h) | | Principal
Occupations During the Past Five Years | | Other Directorships (j) |
Kino Clark (k) (age 45) | | Assistant Treasurer | | January 2012 | | Massachusetts Financial Services Company, Vice President | | N/A |
Thomas H. Connors (k) (age 54) | | Assistant Secretary and Assistant Clerk | | September 2012 | | Massachusetts Financial Services Company, Vice President and Senior Counsel; Deutsche Investment Management Americas Inc. (financial service provider), Director and Senior Counsel (until 2012) | | N/A |
Ethan D. Corey (k)
(age 50) | | Assistant
Secretary and Assistant Clerk | | July 2005 | | Massachusetts Financial Services Company, Senior Vice President and Associate General Counsel | | N/A |
David L. DiLorenzo (k) (age 45) | | Treasurer | | July 2005 | | Massachusetts Financial Services Company, Senior Vice President | | N/A |
Brian E. Langenfeld (k) (age 41) | | Assistant
Secretary and Assistant Clerk | | June 2006 | | Massachusetts Financial Services Company, Vice President and Senior Counsel | | N/A |
Susan S. Newton (k) (age 64) | | Assistant
Secretary and Assistant Clerk | | May 2005 | | Massachusetts Financial Services Company, Senior Vice President and Associate General Counsel | | N/A |
Susan A. Pereira (k)
(age 43) | | Assistant
Secretary and Assistant Clerk | | July 2005 | | Massachusetts Financial Services Company, Vice President and Senior Counsel | | N/A |
Kasey L. Phillips (k) (age 43) | | Assistant Treasurer | | September 2012 | | Massachusetts Financial Services Company, Vice President; Wells Fargo Funds Management, LLC, Senior Vice President, Fund Treasurer (until 2012) | | N/A |
58
Trustees and Officers – continued
| | | | | | | | |
Name, Age | | Position(s) Held with Fund | | Trustee/Officer
Since (h) | | Principal
Occupations During the Past Five Years | | Other Directorships (j) |
Mark N. Polebaum (k) (age 62) | | Secretary and
Clerk | | January 2006 | | Massachusetts Financial Services Company, Executive Vice President, General Counsel and Secretary | | N/A |
Frank L. Tarantino (l)
(age 70) | | Independent
Chief Compliance Officer | | June 2004 | | Tarantino LLC (provider of compliance services), Principal | | N/A |
Richard S. Weitzel (k)
(age 43) | | Assistant Secretary and Assistant Clerk | | October 2007 | | Massachusetts Financial Services Company, Senior Vice President and Associate General Counsel | | N/A |
James O. Yost (k)
(age 53) | | Deputy Treasurer | | September 1990 | | Massachusetts Financial Services Company, Senior Vice President | | N/A |
| (h) | Date first appointed to serve as Trustee/officer of an MFS Fund. Each Trustee has served continuously since appointment unless indicated otherwise. For the period from December 15, 2004 until February 22, 2005, Mr. Manning served as Advisory Trustee. For the period October 2008, until January 2012, Mr. Corcoran served as Treasurer of the Funds. Prior to January 2012, Messrs. DiLorenzo and Yost served as Assistant Treasurers of the Funds. |
| (j) | Directorships or trusteeships of companies required to report to the Securities and Exchange Commission (i.e., “public companies”). |
| (k) | “Interested person” of the Trust within the meaning of the Investment Company Act of 1940 (referred to as the 1940 Act), which is the principal federal law governing investment companies like the fund, as a result of position with MFS. The address of MFS is 111 Huntington Avenue, Boston, Massachusetts 02199-7618. |
| (l) | Mr. Tarantino will retire as Independent Chief Compliance Officer of the MFS Funds on October 31, 2014. It is expected that Mr. Tarantino will continue after that date as an Independent Senior Officer of the MFS Funds. |
Each Trustee (except Ms. Stelmach, Mr. Buller and Ms. Roepke) has been elected by shareholders and each Trustee and officer holds office until his or her successor is chosen and qualified or until his or her earlier death, resignation, retirement or removal. The Trust does not hold annual meetings for the purpose of electing Trustees, and Trustees are not elected for fixed terms. Messrs. Butler, Kavanaugh, Uek and Mses. Thomsen and Roepke are members of the Trust’s Audit Committee.
Each of the Fund’s Trustees and officers holds comparable positions with certain other funds of which MFS or a subsidiary is the investment adviser or distributor, and, in the case of the officers, with certain affiliates of MFS. As of January 1, 2014, the Trustees served as board members of 142 funds within the MFS Family of Funds.
59
Trustees and Officers – continued
The Statement of Additional Information for the Fund includes further information about the Trustees and is available without charge upon request by calling 1-800-225-2606.
| | |
| Investment Adviser | | Custodian |
Massachusetts Financial Services Company
111 Huntington Avenue
Boston, MA 02199-7618 | | JPMorgan Chase Bank, NA 4 Metrotech Center New York, NY 11245 |
| Distributor | | Independent Registered Public Accounting Firm |
MFS Fund Distributors, Inc.
111 Huntington Avenue
Boston, MA 02199-7618 | | Deloitte & Touche LLP 200 Berkeley Street Boston, MA 02116 |
| Portfolio Managers | | |
Joshua Marston
Robert Persons
Jeffrey Wakelin | | |
60
BOARD REVIEW OF INVESTMENT ADVISORY AGREEMENT
A discussion regarding the Board’s most recent review and renewal of the fund’s Investment Advisory Agreement with MFS is available by clicking on the fund’s name under “Mutual Funds” in the “Products” section of the MFS Web site (mfs.com).
PROXY VOTING POLICIES AND INFORMATION
MFS votes proxies on behalf of the fund pursuant to proxy voting policies and procedures that are available without charge, upon request, by calling 1-800-225-2606, by visiting the Proxy Voting section of mfs.com or by visiting the SEC’s Web site at http://www.sec.gov.
Information regarding how the fund voted proxies relating to portfolio securities during the twelve-month period ended June 30, 2013 is available without charge by visiting the Proxy Voting section of mfs.com or by visiting the SEC’s Web site at http://www.sec.gov.
QUARTERLY PORTFOLIO DISCLOSURE
The fund will file a complete schedule of portfolio holdings with the Securities and Exchange Commission (the Commission) for the first and third quarters of each fiscal year on Form N-Q. A shareholder can obtain the quarterly portfolio holdings report at mfs.com. The fund’s Form N-Q is also available on the EDGAR database on the Commission’s Internet Web site at http://www.sec.gov, and may be reviewed and copied at the:
Public Reference Room
Securities and Exchange Commission
100 F Street, NE, Room 1580
Washington, D.C. 20549
Information on the operation of the Public Reference Room may be obtained by calling the Commission at 1-800-SEC-0330. Copies of the fund’s Form N-Q also may be obtained, upon payment of a duplicating fee, by electronic request at the following e-mail address: publicinfo@sec.gov or by writing the Public Reference Section at the above address.
FURTHER INFORMATION
From time to time, MFS may post important information about the fund or the MFS funds on the MFS web site (mfs.com). This information is available by visiting the “Commentary & Announcements” and “Market Outlooks” sections of mfs.com or by clicking on the fund’s name under “Mutual Funds” in the “Products” section of mfs.com.
FEDERAL TAX INFORMATION (unaudited)
The fund will notify shareholders of amounts for use in preparing 2014 income tax forms in January 2015. The following information is provided pursuant to provisions of the Internal Revenue Code.
The fund designates $1,810,000 as capital gain dividends paid during the fiscal year.
61
rev. 3/11
| | | | |
| | | |
FACTS | | WHAT DOES MFS DO WITH YOUR PERSONAL INFORMATION? | |  |
| | |
| Why? | | Financial companies choose how they share your personal information. Federal law gives consumers the right to limit some but not all sharing. Federal law also requires us to tell you how we collect, share, and protect your personal information. Please read this notice carefully to understand what we do. |
| | |
| What? | | The types of personal information we collect and share depend on the product or service you have with us. This information can include: • Social Security number and account balances • Account transactions and transaction history • Checking account information and wire transfer instructions When you are no longer our customer, we continue to share your information as described in this notice. |
| | |
| How? | | All financial companies need to share customers’ personal information to run their everyday business. In the section below, we list the reasons financial companies can share their customers’ personal information; the reasons MFS chooses to share; and whether you can limit this sharing. |
| | | | |
Reasons we can share your
personal information | | Does MFS
share? | | Can you limit
this sharing? |
For our everyday business purposes – such as to process your transactions, maintain your account(s), respond to court orders and legal investigations, or report to credit bureaus | | Yes | | No |
For our marketing purposes – to offer our products and services to you | | No | | We don’t share |
| For joint marketing with other financial companies | | No | | We don’t share |
For our affiliates’ everyday business purposes – information about your transactions and experiences | | No | | We don’t share |
For our affiliates’ everyday business purposes – information about your creditworthiness | | No | | We don’t share |
| For nonaffiliates to market to you | | No | | We don’t share |
| | |
| Questions? | | Call 800-225-2606 or go to mfs.com. |
62
| | |
| Who we are |
| Who is providing this notice? | | MFS Funds, MFS Investment Management, MFS Institutional Advisors, Inc., MFS Fund Distributors, Inc., MFS Heritage Trust Company, and MFS Service Center, Inc. |
| | |
| What we do |
| How does MFS protect my personal information? | | To protect your personal information from unauthorized access and use, we use security measures that comply with federal law. These measures include procedural, electronic, and physical safeguards for the protection of the personal information we collect about you. |
| How does MFS collect my personal information? | | We collect your personal information, for example, when you •open an account or provide account information •direct us to buy securities or direct us to sell your securities •make a wire transfer We also collect your personal information from others, such as credit bureaus, affiliates and other companies. |
| Why can’t I limit all sharing? | | Federal law gives you the right to limit only •sharing for affiliates’ everyday business purposes – information about your creditworthiness •affiliates from using your information to market to you •sharing for nonaffiliates to market to you State laws and individual companies may give you additional rights to limit sharing. |
| | |
| Definitions |
| Affiliates | | Companies related by common ownership or control. They can be financial and nonfinancial companies. •MFS does not share personal information with affiliates, except for everyday business purposes as described on page one of this notice. |
| Nonaffiliates | | Companies not related by common ownership or control. They can be financial and nonfinancial companies. •MFS does not share with nonaffiliates so they can market to you. |
| Joint Marketing | | A formal agreement between nonaffiliated financial companies that together market financial products or services to you. •MFS doesn’t jointly market. |
| | |
| Other important information |
| If you own an MFS product or receive an MFS service in the name of a third party such as a bank or broker-dealer, their privacy policy may apply to you instead of ours. |
63
Save paper with eDelivery.

| MFS® will send you prospectuses, |
reports, and proxies directly via e-mail so you will get information faster with less mailbox clutter.
To sign up:
1. Go to mfs.com.
2. Log in via MFS® Access.
3. Select eDelivery.
If you own your MFS fund shares through a financial institution or a retirement plan, MFS® TALK, MFS® Access, or eDelivery may not be available to you.
CONTACT
WEB SITE
mfs.com
MFS TALK
1-800-637-8255
24 hours a day
ACCOUNT SERVICE AND LITERATURE
Shareholders
1-800-225-2606
Financial advisors
1-800-343-2829
Retirement plan services
1-800-637-1255
MAILING ADDRESS
MFS Service Center, Inc.
P.O. Box 55824
Boston, MA 02205-5824
OVERNIGHT MAIL
MFS Service Center, Inc.
c/o Boston Financial Data Services
30 Dan Road
Canton, MA 02021-2809
The Registrant has adopted a Code of Ethics pursuant to Section 406 of the Sarbanes-Oxley Act and as defined in Form N-CSR that applies to the Registrant’s principal executive officer and principal financial and accounting officer. During the period covered by this report, the Registrant has not amended any provision in its Code of Ethics (the “Code”) that relates to an element of the Code’s definitions enumerated in paragraph (b) of Item 2 of this Form N-CSR. During the period covered by this report, the Registrant did not grant a waiver, including an implicit waiver, from any provision of the Code.
A copy of the Code of Ethics is filed as an exhibit to this Form N-CSR.
| ITEM 3. | AUDIT COMMITTEE FINANCIAL EXPERT. |
Messrs. Robert E. Butler, John P. Kavanaugh and Robert W. Uek and Messes. Maryanne L. Roepke and Laurie J. Thomsen, members of the Audit Committee, have been determined by the Board of Trustees in their reasonable business judgment to meet the definition of “audit committee financial expert” as such term is defined in Form N-CSR. In addition, Messrs. Butler, Kavanaugh and Uek and Mses. Roepke and Thomsen are “independent” members of the Audit Committee (as such term has been defined by the Securities and Exchange Commission in regulations implementing Section 407 of the Sarbanes-Oxley Act of 2002). The Securities and Exchange Commission has stated that the designation of a person as an audit committee financial expert pursuant to this Item 3 on the Form N-CSR does not impose on such a person any duties, obligations or liability that are greater than the duties, obligations or liability imposed on such person as a member of the Audit Committee and the Board of Trustees in the absence of such designation or identification.
| ITEM 4. | PRINCIPAL ACCOUNTANT FEES AND SERVICES. |
Items 4(a) through 4(d) and 4(g):
The Board of Trustees has appointed Deloitte & Touche LLP (“Deloitte”) to serve as independent accountants to each series of the Registrant (collectively, the “Funds”). The tables below set forth the audit fees billed to the Funds as well as fees for non-audit services provided to the Funds and/or to the Funds’ investment adviser, Massachusetts Financial Services Company (“MFS”) and to various entities either controlling, controlled by, or under common control with MFS that provide ongoing services to the Funds (“MFS Related Entities”).
For the fiscal years ended April 30, 2014 and 2013, audit fees billed to the Funds by Deloitte were as follows:
| | | | | | | | |
| | | Audit Fees | |
| | 2014 | | | 2013 | |
Fees billed by Deloitte: | | | | | | | | |
MFS Bond Fund | | | 60,958 | | | | 60,245 | |
MFS Limited Maturity Fund | | | 52,816 | | | | 52,199 | |
MFS Municipal Limited Maturity Fund | | | 43,701 | | | | 43,192 | |
MFS Research Bond Fund | | | 64,005 | | | | 63,256 | |
| | | | | | | | |
Total | | | 221,480 | | | | 218,892 | |
For the fiscal years ended April 30, 2014 and 2013, fees billed by Deloitte for audit-related, tax and other services provided to the Funds and for audit-related, tax and other services provided to MFS and MFS Related Entities were as follows:
| | | | | | | | | | | | | | | | | | | | | | | | |
| | | Audit-Related Fees1 | | | Tax Fees2 | | | All Other Fees3 | |
| | 2014 | | | 2013 | | | 2014 | | | 2013 | | | 2014 | | | 2013 | |
Fees billed by Deloitte: | | | | | | | | | | | | | | | | | | | | | | | | |
To MFS Bond Fund | | | 0 | | | | 0 | | | | 6,770 | | | | 6,690 | | | | 1,388 | | | | 1,233 | |
To MFS Limited Maturity Fund | | | 0 | | | | 0 | | | | 6,676 | | | | 6,597 | | | | 1,183 | | | | 1,114 | |
To MFS Municipal Limited Maturity Fund | | | 0 | | | | 0 | | | | 6,117 | | | | 6,044 | | | | 1,169 | | | | 1,090 | |
To MFS Research Bond Fund | | | 0 | | | | 0 | | | | 6,676 | | | | 6,597 | | | | 1,487 | | | | 1,300 | |
Total fees billed by Deloitte To above Funds: | | | 0 | | | | 0 | | | | 26,239 | | | | 25,928 | | | | 5,227 | | | | 4,737 | |
| | | |
| | | Audit-Related Fees1 | | | Tax Fees2 | | | All Other Fees3 | |
| | 2014 | | | 2013 | | | 2014 | | | 2013 | | | 2014 | | | 2013 | |
Fees billed by Deloitte: | | | | | | | | | | | | | | | | | | | | | | | | |
To MFS and MFS Related Entities of MFS Bond Fund* | | | 1,872,706 | | | | 1,276,472 | | | | 0 | | | | 0 | | | | 0 | | | | 0 | |
To MFS and MFS Related Entities of MFS Limited Maturity Fund* | | | 1,872,706 | | | | 1,276,472 | | | | 0 | | | | 0 | | | | 0 | | | | 0 | |
To MFS and MFS Related Entities of MFS Municipal Limited Maturity Fund* | | | 1,872,706 | | | | 1,276,472 | | | | 0 | | | | 0 | | | | 0 | | | | 0 | |
To MFS and MFS Related Entities of MFS Research Bond Fund* | | | 1,872,706 | | | | 1,276,472 | | | | 0 | | | | 0 | | | | 0 | | | | 0 | |
| | | | | | | | |
| | | Aggregate Fees for Non-audit
Services | |
| | 2014 | | | 2013 | |
Fees billed by Deloitte: | | | | | | | | |
To MFS Bond Fund, MFS and MFS Related Entities# | | | 1,884,322 | | | | 1,402,415 | |
To MFS Limited Maturity Fund, MFS and MFS Related Entities# | | | 1,884,023 | | | | 1,402,203 | |
To MFS Municipal Limited Maturity Fund, MFS and MFS Related Entities# | | | 1,883,450 | | | | 1,401,626 | |
To MFS Research Bond Fund, MFS and MFS Related Entities# | | | 1,884,327 | | | | 1,402,389 | |
| * | This amount reflects the fees billed to MFS and MFS Related Entities for non-audit services relating directly to the operations and financial reporting of the Funds (portions of which services also related to the operations and financial reporting of other funds within the MFS Funds complex). |
| # | This amount reflects the aggregate fees billed by Deloitte for non-audit services rendered to the Funds and for non-audit services rendered to MFS and the MFS Related Entities. |
| 1 | The fees included under “Audit-Related Fees” are fees related to assurance and related services that are reasonably related to the performance of the audit or review of financial statements, but not reported under ‘‘Audit Fees,’’ including accounting consultations, agreed-upon procedure reports, attestation reports, comfort letters and internal control reviews. |
| 2 | The fees included under “Tax Fees” are fees associated with tax compliance, tax advice and tax planning, including services relating to the filing or amendment of federal, state or local income tax returns, regulated investment company qualification reviews and tax distribution and analysis. |
| 3 | The fees included under “All Other Fees” are fees for products and services provided by Deloitte other than those reported under “Audit Fees,” “Audit-Related Fees” and “Tax Fees,” including fees for services related to review of internal controls and review of Rule 38a-1 compliance program. |
Item 4(e)(1):
Set forth below are the policies and procedures established by the Audit Committee of the Board of Trustees relating to the pre-approval of audit and non-audit related services:
To the extent required by applicable law, pre-approval by the Audit Committee of the Board is needed for all audit and permissible non-audit services rendered to the Funds and all permissible non-audit services rendered to MFS or MFS Related Entities if the services relate directly to the operations and financial reporting of the Registrant. Pre-approval is currently on an engagement-by-engagement basis. In the event pre-approval of such services is necessary between regular meetings of the Audit Committee and it is not practical to wait to seek pre-approval at the next regular meeting of the Audit Committee, pre-approval of such services may be referred to the Chair of the Audit Committee for approval; provided that the Chair may not pre-approve any individual engagement for such services exceeding $50,000 or multiple engagements for such services in the aggregate exceeding $100,000 in each period between regular meetings of the Audit Committee. Any engagement pre-approved by the Chair between regular meetings of the Audit Committee shall be presented for ratification by the entire Audit Committee at its next regularly scheduled meeting.
Item 4(e)(2):
None, or 0%, of the services relating to the Audit-Related Fees, Tax Fees and All Other Fees paid by the Fund and MFS and MFS Related Entities relating directly to the operations and financial reporting of the Registrant disclosed above were approved by the audit committee pursuant to paragraphs (c)(7)(i)(C) of Rule 2-01 of Regulation S-X (which permits audit committee approval after the start of the engagement with respect to services other than audit, review or attest services, if certain conditions are satisfied).
Item 4(f): Not applicable.
Item 4(h): The Registrant’s Audit Committee has considered whether the provision by a Registrant’s independent registered public accounting firm of non-audit services to MFS and MFS Related Entities that were not pre-approved by the Committee (because such services did not relate directly to the operations and financial reporting of the Registrant) was compatible with maintaining the independence of the independent registered public accounting firm as the Registrant’s principal auditors.
| ITEM 5. | AUDIT COMMITTEE OF LISTED REGISTRANTS. |
Not applicable to the Registrant.
A schedule of investments of the Registrant is included as part of the report to shareholders of such series under Item 1 of this Form N-CSR.
| ITEM 7. | DISCLOSURE OF PROXY VOTING POLICIES AND PROCEDURES FOR CLOSED-END MANAGEMENT INVESTMENT COMPANIES. |
Not applicable to the Registrant.
| ITEM 8. | PORTFOLIO MANAGERS OF CLOSED-END MANAGEMENT INVESTMENT COMPANIES. |
Not applicable to the Registrant.
| ITEM 9. | PURCHASES OF EQUITY SECURITIES BY CLOSED-END MANAGEMENT INVESTMENT COMPANY AND AFFILIATED PURCHASERS. |
Not applicable to the Registrant.
| ITEM 10. | SUBMISSION OF MATTERS TO A VOTE OF SECURITY HOLDERS. |
There were no material changes to the procedures by which shareholders may send recommendations to the Board for nominees to the Registrant’s Board since the Registrant last provided disclosure as to such procedures in response to the requirements of Item 407 (c)(2)(iv) of Regulation S-K or this Item.
| ITEM 11. | CONTROLS AND PROCEDURES. |
| (a) | Based upon their evaluation of the effectiveness of the registrant’s disclosure controls and procedures (as defined in Rule 30a-3(c) under the Investment Company Act of 1940 (the “Act”)) as conducted within 90 days of the filing date of this report on Form N-CSR, the registrant’s principal financial officer and principal executive officer have concluded that those disclosure controls and procedures provide reasonable assurance that the material information required to be disclosed by the registrant on this report is recorded, processed, summarized and reported within the time periods specified in the Securities and Exchange Commission’s rules and forms. |
| (b) | There were no changes in the registrant’s internal controls over financial reporting (as defined in Rule 30a-3(d) under the Act) that occurred during the second fiscal quarter of the period covered by the report that have materially affected, or are reasonably likely to materially affect, the registrant’s internal control over financial reporting. |
| (a) | File the exhibits listed below as part of this form. Letter or number the exhibits in the sequence indicated. |
| | (1) | Any code of ethics, or amendment thereto, that is the subject of the disclosure required by Item 2, to the extent that the registrant intends to satisfy the Item 2 requirements through filing of an exhibit: Code of Ethics attached hereto. |
| | (2) | A separate certification for each principal executive officer and principal financial officer of the registrant as required by Rule 30a-2(a) under the Act (17 CFR 270.30a-2): Attached hereto. |
| (b) | If the report is filed under Section 13(a) or 15(d) of the Exchange Act, provide the certifications required by Rule 30a-2(b) under the Act (17 CFR 270.30a-2(b)), Rule 13a-14(b) or Rule 15d-14(b) under the Exchange Act (17 CFR 240.13a-14(b) or 240.15d-14(b)) and Section 1350 of Chapter 63 of Title 18 of the United States Code (18 U.S.C. 1350) as an exhibit. A certification furnished pursuant to this paragraph will not be deemed “filed” for the purposes of Section 18 of the Exchange Act (15 U.S.C. 78r), or otherwise subject to the liability of that section. Such certification will not be deemed to be incorporated by reference into any filing under the Securities Act of 1933 or the Exchange Act, except to the extent that the registrant specifically incorporates it by reference: Attached hereto. |
Notice
A copy of the Amended and Restated Declaration of Trust, as amended, of the Registrant is on file with the Secretary of State of The Commonwealth of Massachusetts and notice is hereby given that this instrument is executed on behalf of the Registrant by an officer of the Registrant as an officer and not individually and the obligations of or arising out of this instrument are not binding upon any of the Trustees or shareholders individually, but are binding only upon the assets and property of the respective constituent series of the Registrant.
SIGNATURES
Pursuant to the requirements of the Securities Exchange Act of 1934 and the Investment Company Act of 1940, the registrant has duly caused this report to be signed on its behalf by the undersigned, thereunto duly authorized.
(Registrant) MFS SERIES TRUST IX
| | |
| By (Signature and Title)* | | JOHN M. CORCORAN |
| | John M. Corcoran, President |
Date: June 17, 2014
Pursuant to the requirements of the Securities Exchange Act of 1934 and the Investment Company Act of 1940, this report has been signed below by the following persons on behalf of the registrant and in the capacities and on the dates indicated.
| | |
| By (Signature and Title)* | | JOHN M. CORCORAN |
| | John M. Corcoran, President |
| | (Principal Executive Officer) |
Date: June 17, 2014
| | |
| By (Signature and Title)* | | DAVID L. DILORENZO |
| | David L. DiLorenzo, Treasurer |
| | (Principal Financial Officer and Accounting Officer) |
Date: June 17, 2014
| * | Print name and title of each signing officer under his or her signature. |