| UNITED STATES |
| SECURITIES AND EXCHANGE COMMISSION |
| Washington, D.C. 20549 |
| |
| FORM 10-Q |
| |
| (Mark One) |
| [X] | QUARTERLY REPORT PURSUANT TO SECTION 13 OR 15(d) OF THE |
| SECURITIES EXCHANGE ACT OF 1934 |
| For the quarterly period ended June 30, 2010 |
| OR |
| [ ] | TRANSITION REPORT PURSUANT TO SECTION 13 OR 15(d) OF THE |
| SECURITIES EXCHANGE ACT OF 1934 |
| For the transition period from | | To |
| Commission File Number: 001-07791 |
| |
|
| |
| McMoRan Exploration Co. |
| (Exact name of registrant as specified in its charter) |
| Delaware | 72-1424200 |
(State or other jurisdiction of incorporation or organization) | (IRS Employer Identification No.) |
| | |
| 1615 Poydras Street | |
| New Orleans, Louisiana | 70112 |
| (Address of principal executive offices) | (Zip Code) |
| |
| (504) 582-4000 |
| (Registrant's telephone number, including area code) |
| |
Indicate by check mark whether the registrant (1) has filed all reports required to be filed by Section 13 or 15(d) of the Securities Exchange Act of 1934 during the preceding 12 months (or for such shorter period that the registrant was required to file such reports), and (2) has been subject to such filing requirements for the past 90 days. SYes o No
Indicate by check mark whether the registrant has submitted electronically and posted on its corporate Web site, if any, every Interactive Data File required to be submitted and posted pursuant to Rule 405 of Regulation S-T (§ 232.405 of this chapter) during the preceding 12 months (or for such shorter period that the registrant was required to submit and post such files). oYes oNo
Indicate by check mark whether the registrant is a large accelerated filer, an accelerated filer, a non-accelerated filer, or a smaller reporting company. See definition of “large accelerated filer,” “ accelerated filer,” and “smaller reporting company” in Rule 12b-2 of the Exchange Act:
Large accelerated filer o | Accelerated filer T |
Non-accelerated filer o (Do not check if a smaller | Smaller reporting company o |
| reporting company) | |
Indicate by check mark whether the registrant is a shell company (as defined in Rule 12b-2 of the Exchange Act. oYes S No
On June 30, 2010, there were issued and outstanding 94,441,086 shares of the registrant’s Common Stock, par value $0.01 per share.
| |
| McMoRan Exploration Co. |
|
| |
| | Page |
| | |
| |
| | |
| |
| | |
| 3 |
| | |
| 4 |
| | |
| 5 |
| | |
| 6 |
| | |
| 22 |
| | |
| |
| 23 |
| | |
| 34 |
| | |
| 34 |
| | |
| |
| | |
| 34 |
| | |
| 34 |
| | |
| 35 |
| | |
| 35 |
| | |
| 36 |
| | |
| E-1 |
| | | June 30, | | December 31, | |
| | | 2010 | | 2009 | |
| | | (In Thousands) | |
| ASSETS | | | | | | | |
| Cash and cash equivalents | | $ | 217,028 | | $ | 241,418 | |
| Accounts receivable | | | 88,119 | | | 79,681 | |
| Inventories | | | 40,934 | | | 47,818 | |
| Prepaid expenses | | | 4,564 | | | 14,457 | |
| Fair value of oil and gas derivative contracts | | | 3,475 | | | 8,693 | |
| Current assets from discontinued operations, including restricted cash | | | | | | | |
| of $3,600 and $470, respectively | | | 3,692 | | | 825 | |
| Total current assets | | | 357,812 | | | 392,892 | |
| Property, plant and equipment, net | | | 726,952 | | | 796,223 | |
| Restricted cash | | | 49,183 | | | 41,677 | |
| Deferred financing costs and other assets | | | 10,067 | | | 11,931 | |
| Long-term assets from discontinued operations | | | 2,992 | | | 6,159 | |
| Total assets | | $ | 1,147,006 | | $ | 1,248,882 | |
| | | | | | | | |
| LIABILITIES AND STOCKHOLDERS’ EQUITY | | | | | | | |
| Accounts payable | | $ | 67,180 | | $ | 66,544 | |
| Accrued liabilities | | | 69,812 | | | 51,945 | |
| Accrued interest and dividends payable | | | 8,989 | | | 8,535 | |
| Current portion of accrued oil and gas reclamation costs | | | 157,818 | | | 106,791 | |
| Fair value of oil and gas derivative contracts | | | 128 | | | 1,237 | |
| Current portion of accrued sulphur reclamation costs (discontinued | | | | | | | |
| operations) | | | 9,500 | | | 8,300 | |
| Current liabilities from discontinued operations | | | 1,709 | | | 1,183 | |
| Total current liabilities | | | 315,136 | | | 244,535 | |
| 5¼% convertible senior notes | | | 74,720 | | | 74,720 | |
| 11.875% senior notes | | | 300,000 | | | 300,000 | |
| Accrued oil and gas reclamation costs | | | 224,964 | | | 321,920 | |
| Other long-term liabilities | | | 17,173 | | | 16,602 | |
| Accrued sulphur reclamation costs (discontinued operations) | | | 18,146 | | | 19,152 | |
| Other long-term liabilities from discontinued operations | | | 6,143 | | | 6,145 | |
| Total liabilities | | | 956,282 | | | 983,074 | |
| Stockholders' equity | | | 190,724 | | | 265,808 | |
| Total liabilities and stockholders' equity | | $ | 1,147,006 | | $ | 1,248,882 | |
| | | | | | | | |
The accompanying notes are an integral part of these consolidated financial statements.
TABLE OF CONTENTSMcMoRan EXPLORATION CO.
| | Three Months Ended | | Six Months Ended | |
| | June 30, | | June 30, | |
| | 2010 | | 2009 | | 2010 | | 2009 | |
| | (In Thousands, Except Per Share Amounts) | |
| Revenues: | | | | | | | | | | | | |
| Oil and natural gas | $ | 104,103 | | $ | 94,065 | | $ | 232,949 | | $ | 189,147 | |
| Service | | 3,938 | | | 2,487 | | | 7,580 | | | 4,781 | |
| Total revenues | | 108,041 | | | 96,552 | | | 240,529 | | | 193,928 | |
| Costs and expenses: | | | | | | | | | | | | |
| Production and delivery costs | | 46,439 | | | 48,800 | | | 89,224 | | | 97,846 | |
| Depletion, depreciation and amortization expense | | 57,887 | | | 73,970 | | | 166,132 | | | 167,367 | |
| Exploration expenses | | 10,434 | | | 46,836 | | | 22,843 | | | 75,262 | |
| (Gain) loss on oil and gas derivative contracts | | 477 | | | 2,972 | | | (3,268 | ) | | (15,886 | ) |
| General and administrative expenses | | 10,376 | | | 10,916 | | | 24,119 | | | 23,362 | |
Main Pass Energy Hub™ costs | | 242 | | | 351 | | | 575 | | | 1,116 | |
| Insurance recoveries | | (9,171 | ) | | (35 | ) | | (9,171 | ) | | (18,742 | ) |
| Gain on sale of oil and gas property | | (3,455 | ) | | - | | | (3,455 | ) | | - | |
| Total costs and expenses | | 113,229 | | | 183,810 | | | 286,999 | | | 330,325 | |
| Operating loss | | (5,188 | ) | | (87,258 | ) | | (46,470 | ) | | (136,397 | ) |
| Interest expense, net | | (9,873 | ) | | (10,275 | ) | | (20,406 | ) | | (20,941 | ) |
| Other income, net | | 44 | | | 2,843 | | | 105 | | | 3,172 | |
| Loss from continuing operations before income taxes | | (15,017 | ) | | (94,690 | ) | | (66,771 | ) | | (154,166 | ) |
| Income tax expense | | - | | | (17 | ) | | - | | | (33 | ) |
| Loss from continuing operations | | (15,017 | ) | | (94,707 | ) | | (66,771 | ) | | (154,199 | ) |
| Loss from discontinued operations | | (1,436 | ) | | (3,050 | ) | | (3,076 | ) | | (4,117 | ) |
| Net loss | | (16,453 | ) | | (97,757 | ) | | (69,847 | ) | | (158,316 | ) |
| Preferred dividends and inducement payments for early | | | | | | | | | | | | |
| conversion of convertible preferred stock | | (5,293 | ) | | (2,855 | ) | | (18,059 | ) | | (5,537 | ) |
| Net loss applicable to common stock | $ | (21,746 | ) | $ | (100,612 | ) | $ | (87,906 | ) | $ | (163,853 | ) |
| | | | | | | | | | | | | |
| Basic and diluted net loss per share of common | | | | | | | | | | | | |
| stock: | | | | | | | | | | | | |
| Continuing operations | | $(0.22 | ) | | $(1.36 | ) | | $(0.93 | ) | | $(2.24 | ) |
| Discontinued operations | | (0.01 | ) | | (0.04 | ) | | (0.03 | ) | | (0.06 | ) |
| Net loss per share of common stock | | $(0.23 | ) | | $(1.40 | ) | | $(0.96 | ) | | $(2.30 | ) |
| | | | | | | | | | | | | |
| Average common shares outstanding: | | | | | | | | | | | | |
| Basic and diluted | | 93,101 | | | 71,943 | | | 91,428 | | | 71,209 | |
The accompanying notes are an integral part of these consolidated financial statements.
TABLE OF CONTENTSMcMoRan EXPLORATION CO.
| | | Six Months Ended | |
| | | June 30, | |
| | | 2010 | | 2009 | |
| | | (In Thousands) | |
| Cash flow from operating activities: | | | | | | | |
| Net loss | | $ | (69,847 | ) | $ | (158,316 | ) |
| Adjustments to reconcile net loss to net cash provided by | | | | | | | |
| operating activities: | | | | | | | |
| Loss from discontinued operations | | | 3,076 | | | 4,117 | |
| Depletion, depreciation and amortization expense | | | 166,132 | | | 167,367 | |
| Exploration drilling and related expenditures | | | 7,471 | | | 54,370 | |
| Compensation expense associated with stock-based awards | | | 12,657 | | | 9,180 | |
| Amortization of deferred financing costs | | | 1,862 | | | 1,862 | |
| Change in fair value of oil and gas derivative contracts | | | 4,110 | | | 18,986 | |
| Reclamation expenditures, net of prepayments by third parties | | | (41,632 | ) | | (25,522 | ) |
| Increase in restricted cash | | | (7,506 | ) | | (7,537 | ) |
| Gain on sale of oil and gas property | | | (3,455 | ) | | - | |
| Other | | | 556 | | | (47 | ) |
| (Increase) decrease in working capital: | | | | | | | |
| Accounts receivable | | | (7,588 | ) | | 5,461 | |
| Accounts payable and accrued liabilities | | | 11,086 | | | (10,007 | ) |
| Prepaid expenses and inventories | | | 16,775 | | | (4,728 | ) |
| Net cash provided by continuing operations | | | 93,697 | | | 55,186 | |
| Net cash used in discontinued operations | | | (2,164 | ) | | (1,655 | ) |
| Net cash provided by operating activities | | | 91,533 | | | 53,531 | |
| | | | | | | | |
| Cash flow from investing activities: | | | | | | | |
| Exploration, development and other capital expenditures | | | (101,436 | ) | | (84,331 | ) |
| Proceeds from sale of oil and gas property | | | 2,920 | | | - | |
| Net cash used in continuing operations | | | (98,516 | ) | | (84,331 | ) |
| Net cash from discontinued operations | | | - | | | - | |
| Net cash used in investing activities | | | (98,516 | ) | | (84,331 | ) |
| | | | | | | | |
Cash flow from financing activities: | | | | | | | |
| Dividends paid and inducement payments on early conversion of | | | | | | | |
| convertible preferred stock | | | (17,589 | ) | | (5,365 | ) |
| Proceeds from exercise of stock options and other | | | 182 | | | - | |
| Net proceeds from the sale of common stock | | | - | | | 84,934 | |
| Net proceeds from the sale of 8% convertible perpetual | | | | | | | |
| preferred stock | | | - | | | 83,228 | |
| Net cash (used in) provided by continuing operations | | | (17,407 | ) | | 162,797 | |
| Net cash from discontinued operations | | | - | | | - | |
| Net cash (used in) provided by financing activities | | | (17,407 | ) | | 162,797 | |
| Net (decrease) increase in cash and cash equivalents | | | (24,390 | ) | | 131,997 | |
| Cash and cash equivalents at beginning of year | | | 241,418 | | | 93,486 | |
| Cash and cash equivalents at end of period | | $ | 217,028 | | $ | 225,483 | |
The accompanying notes are an integral part of these consolidated financial statements.
TABLE OF CONTENTSMcMoRan EXPLORATION CO.
The consolidated financial statements of McMoRan Exploration Co. (McMoRan), a Delaware corporation, are prepared in accordance with U.S. generally accepted accounting principles. McMoRan’s consolidated financial statements include the accounts of those subsidiaries where McMoRan directly or indirectly has more than 50 percent of the voting rights and where the right to participate in significant management decisions is not shared with other shareholders, including its two wholly owned subsidiaries, McMoRan Oil & Gas LLC (MOXY) and Freeport-McMoRan Energy LLC (Freeport Energy). MOXY conducts all of McMoRan’s oil and gas operations. The long-term business objective of Freeport Energy is to maximize the value of the offshore structures used in the former sulphur operations which may include th e pursuit of a multifaceted energy services facility, including the potential development of a liquefied natural gas (LNG) regasification and storage facility at the Main Pass Energy Hub (MPEH™) project. McMoRan’s previously discontinued sulphur operations are presented as discontinued operations, and the major classes of assets and liabilities related to its former sulphur business are separately shown for the periods presented.
The accompanying unaudited consolidated financial statements should be read in conjunction with the consolidated financial statements and notes included in McMoRan’s Annual Report on Form 10-K for the year ended December 31, 2009 (2009 Form 10-K). The information furnished herein reflects all adjustments which are, in the opinion of management, necessary for a fair presentation of the results for the periods presented. All such adjustments are, in the opinion of management, of a normal recurring nature.
2. LONG-TERM DEBT
McMoRan’s long-term debt is summarized below (in thousands):
| | June 30, | | December 31, | |
| | 2010 | | 2009 | |
| Senior secured revolving credit facility | $ | - | | $ | - | |
| 11.875% senior notes due 2014 | | 300,000 | | | 300,000 | |
| 5¼% convertible senior notes due 2011 | | 74,720 | | | 74,720 | |
| Total debt | | 374,720 | | | 374,720 | |
| Less current maturities | | - | | | - | |
| Long-term debt | $ | 374,720 | | $ | 374,720 | |
Senior Secured Revolving Credit Facility
McMoRan’s variable rate senior secured revolving credit facility (credit facility) is secured by substantially all of MOXY’s oil and gas properties and matures in August 2012. The borrowing capacity was $175 million at June 30, 2010. Although McMoRan had no borrowings outstanding under the credit facility during the quarter ended June 30, 2010, a letter of credit in the amount of $100 million is outstanding under the credit facility to support the reclamation obligations assumed in the 2007 oil and gas property acquisition, reducing the remaining availability under the facility to $75 million (Note 9 of the 2009 Form 10-K).
Availability under the credit facility is subject to a borrowing base, which is determined semi-annually each April 1 and October 1. McMoRan’s bank group completed its redetermination of the borrowing base during the second quarter of 2010, and the borrowing capacity was maintained at $175 million.
Interest expense includes amortization expense associated with the credit facility’s deferred financing costs and other facility fees. During the second quarter and six months ended June 30, 2010, interest expense on the credit facility totaled $1.5 million and $2.9 million, respectively. Interest expense on the credit facility totaled $1.4 million and $2.8 million for the second quarter and six months ended June 30, 2009, respectively.
The credit facility contains covenants and other restrictions customary for oil and gas borrowing base credit facilities. McMoRan was in compliance with these covenants at June 30, 2010.
Fair Value of Debt
The fair value of McMoRan’s 5¼% convertible senior notes due 2011 (5¼% notes) and 11.875% senior notes due 2014 (11.875% senior notes) is determined at the end of each reporting period using inputs based upon quoted prices for such instruments in active markets. The following table provides the estimated fair value of the 5¼% notes and the 11.875% senior notes as of June 30, 2010 and December 31, 2009 (in thousands):
| | June 30, | | December 31, | |
| | 2010 | | 2009 | |
| 5¼% convertible senior notes | $ | 75,087 | | $ | 70,302 | |
| 11.875% senior notes | | 306,750 | | | 307,125 | |
3. EARNINGS PER SHARE
Basic net loss per share of common stock has been calculated by dividing the net loss applicable to continuing operations, net loss from discontinued operations and net loss applicable to common stock by the weighted-average number of common shares outstanding during the periods presented. For purposes of the earnings per share computations, the net loss applicable to continuing operations includes preferred stock dividends and early conversion inducement payments.
McMoRan had a net loss from continuing operations in both the second quarter and six months ended June 30, 2010 and 2009. Accordingly, the assumed exercise of stock options and stock warrants, as well as the assumed conversion of McMoRan’s 8% convertible perpetual preferred stock (8% preferred stock), 6¾% mandatorily convertible preferred stock (6¾% preferred stock) and 5¼% notes, have been excluded from the diluted net loss per share calculations. These instruments were excluded because they are considered to be anti-dilutive, meaning their inclusion would have decreased the reported net loss per share from continuing operations during these periods. The excluded share amounts are summarized below (in thousands):
| | | Second Quarter | | | Six Months | |
| | | 2010 | | | 2009 | | | 2010 | | | 2009 | |
Stock options a | | | 1,057 | | | | 9 | | | | 1,162 | | | | - | |
| Shares issuable upon assumed | | | | | | | | | | | | | | | | |
| conversion of: | | | | | | | | | | | | | | | | |
6¾% preferred stock b | | | 12,817 | | | | 12,817 | | | | 12,817 | | | | 12,817 | |
8% preferred stock b | | | 1,722 | | | | 1,108 | | | | 6,033 | | | | 557 | |
5¼% notes c | | | 4,508 | | | | 4,508 | | | | 4,508 | | | | 4,508 | |
| a. | McMoRan uses the treasury stock method to determine total shares related to in-the-money stock options for purposes of its diluted earnings per share calculation. The amount represents stock options with an exercise price less than the average market price for McMoRan’s common stock for the periods presented. |
| b. | McMoRan induced conversion of approximately 9,600 shares and 57,200 shares of its 8% preferred stock in the second quarter and six months ended June 30, 2010, respectively (Note 7). Preferred dividends and inducement payments for the early conversion of shares of McMoRan’s convertible preferred stock totaled $5.3 million and $2.9 million for the quarters ended June 30, 2010 and 2009, respectively, and $18.1 million and $5.5 million for the six months ended June 30, 2010 and 2009, respectively. See Note 8 of the 2009 Form 10-K for information regarding McMoRan’s 8% and 6¾% preferred stock. |
| c. | Net interest expense on the 5¼% notes totaled $0.9 million and $1.0 million during the second quarters of 2010 and 2009, respectively, and $1.9 million and $2.0 million for the six months ended June 30, 2010 and 2009, respectively. Additional information regarding McMoRan’s 5¼% notes is disclosed in Note 6 of the 2009 Form 10-K. |
Outstanding stock options excluded from the computation of diluted net income (loss) per share of common stock because their exercise prices were greater than the average market price of McMoRan’s common stock during the periods presented are as follows:
| | | Second Quarter | | | Six Months | |
| | | 2010 | | | 2009 | | | 2010 | | | 2009 | |
| Outstanding options (in thousands) | | | 9,124 | | | | 10,642 | | | | 7,849 | | | | 10,230 | |
| Average exercise price | | $ | 15.92 | | | $ | 13.54 | | | $ | 16.51 | | | $ | 13.84 | |
In connection with the 2007 oil and gas property acquisition and related financing (Note 9 of the 2009 Form 10-K), MOXY entered into derivative contracts for a portion of the anticipated production from its proved developed producing oil and gas properties at the time of the acquisition for the years 2008 through 2010. See Note 1 of the 2009 Form 10-K for McMoRan’s accounting policies regarding derivative contracts.
At June 30, 2010, McMoRan’s outstanding oil and gas derivative contracts (all of which relate to remaining 2010 production) were as follows:
| | Open Swap Positions a | | Put Options b | |
| | | | Average | | | | Average | |
| | Volumes | | Swap Price | | Volumes | | Floor Price | |
| | | | | | | | | | | |
| Natural gas positions (million MMbtu) | 0.5 | | $ | 8.61 | c | 1.2 | | $ | 6.00 | c |
| | | | | | | | | | | |
| Oil positions (thousand bbls) | 18 | | $ | 70.64 | d | 50 | | $ | 50.00 | d |
| a. | Covering periods November-December. |
| b. | Covering periods July-October. |
| c. | Price per MMbtu of natural gas. |
| d. | Price per barrel of oil. |
Because these oil and gas derivative contracts were not designated as hedges for accounting purposes, unrealized (gains) losses representing changes in the related fair values along with realized (gains) losses representing cash settlements are recognized immediately in McMoRan’s operating results at each reporting period. McMoRan’s realized and unrealized (gains) losses on these contracts were as follows (in thousands):
| | Second Quarter | | Six Months | |
| | 2010 | | 2009 | | 2010 | | 2009 | |
| Realized (gain) loss | | | | | | | | | | | | |
| Gas puts | $ | - | | $ | - | | $ | - | | $ | - | |
| Oil puts | | - | | | - | | | - | | | - | |
| Gas swaps | | (4,402 | ) | | (15,171 | ) | | (8,134 | ) | | (28,887 | ) |
| Oil swaps | | 327 | | | (1,621 | ) | | 756 | | | (5,985 | ) |
| Total realized gain | | (4,075 | ) | | (16,792 | ) | | (7,378 | ) | | (34,872 | ) |
| | | | | | | | | | | | | |
| Unrealized (gain) loss | | | | | | | | | | | | |
| Gas puts | | 616 | | | (226 | ) | | (467 | ) | | (4,467 | ) |
| Oil puts | | - | | | 692 | | | 42 | | | 1,050 | |
| Gas swaps | | 4,675 | | | 14,561 | | | 5,643 | | | 14,574 | |
| Oil swaps | | (739 | ) | | 4,737 | | | (1,108 | ) | | 7,829 | |
| Total unrealized loss | | 4,552 | | | 19,764 | | | 4,110 | | | 18,986 | |
| (Gain) loss on oil and gas derivative contracts | $ | 477 | | $ | 2,972 | | $ | (3,268 | ) | $ | (15,886 | ) |
The original cost of the put options entered into for the 2008-2010 periods was $4.6 million. There was no cost for entering into the swap contracts. The derivative contracts are reported at fair value on McMoRan’s balance sheets. The fair value of McMoRan’s swaps and puts is based on transaction counterparty acknowledgments and is corroborated using quoted market prices and internal valuation
model analyses. McMoRan has classified the fair value measurement of its derivative instruments as being derived from Level 2 inputs, as defined under U.S. generally accepted accounting principles (Note 7 of the 2009 Form 10-K). The following tables provide fair value measurement information for these instruments as of June 30, 2010 and December 31, 2009 (in thousands):
| | June 30, 2010 | |
| | Puts | | Swaps | | | | |
| | Gas | | Oil | | Gas | | Oil | | Total | |
| Current assets | $ | 1,580 | | $ | 4 | | $ | 1,891 | | $ | - | | $ | 3,475 | |
| Current liabilities | | - | | | - | | | - | | | (128 | ) | | (128 | ) |
| Fair value of contracts | $ | 1,580 | | $ | 4 | | $ | 1,891 | | $ | (128 | ) | $ | 3,347 | |
| | December 31, 2009 | |
| | Puts | | Swaps | | | | |
| | Gas | | Oil | | Gas | | Oil | | Total | |
| Current assets | $ | 1,113 | | $ | 45 | | $ | 7,535 | | $ | - | | $ | 8,693 | |
| Current liabilities | | - | | | - | | | - | | | (1,237 | ) | | (1,237 | ) |
| Fair value of contracts | $ | 1,113 | | $ | 45 | | $ | 7,535 | | $ | (1,237 | ) | $ | 7,456 | |
5. INCOME TAXES
As of June 30, 2010 and December 31, 2009, McMoRan had approximately $439.4 million and $415.0 million, respectively, of unrecognized tax benefits relating to its reported net losses and other temporary differences from operations. McMoRan recorded a full valuation allowance against these deferred tax assets (Note 13 of the 2009 Form 10-K). If future circumstances permit the allowance to be reversed, McMoRan’s effective tax rate would be positively affected in future periods to the extent these deferred tax assets are recognized.
Interest or penalties associated with income taxes are recorded as components of the provision for income taxes, although no such amounts have been recognized in the accompanying financial statements. Currently, McMoRan’s major taxing jurisdictions are the United States (federal) and Louisiana. Tax periods open to audit for McMoRan include federal and Louisiana income tax returns subsequent to 2005. Net operating loss amounts prior to this time are also subject to audit.
6. OIL AND GAS ACTIVITIES
Exploration and Operations.
McMoRan has investments in six in-progress or unproved properties totaling $121.0 million at June 30, 2010, including $14.7 million for the Blueberry Hill exploratory well, $9.3 million for the Hurricane Deep sidetrack well, $19.3 million for the Blackbeard East well, $31.3 million for the South Timbalier Block 168 No. 1 (Blackbeard West) well, $13.1 million for the Davy Jones offset appraisal well and $33.3 million for the initial Davy Jones well. McMoRan announced positive drilling results at the initial Davy Jones well during the first quarter of 2010.
The operator of the Hurricane Deep sidetrack well encountered an underground flow event at approximately 18,450 feet in February 2010 which resulted in the termination of drilling and abandonment of the well. McMoRan plans to re-drill the well during 2010, and its existing working interest share of well control costs and the costs to re-drill the well to 18,450 feet are covered under its insurance program.
If current or future well assessment, stimulation, or completion efforts are not successful in generating production that will allow McMoRan to recover all or a portion of its investment in any of the respective wells referenced above, McMoRan may be required to write down its investment in such properties to their estimated fair value. See Note 1 of the 2009 Form 10-K for additional information regarding the periodic assessment of potential impairments to McMoRan’s properties.
As also discussed in Note 1 of the 2009 Form 10-K, when events and circumstances indicate that proved oil and gas property carrying amounts might not be recoverable from estimated future undiscounted cash flows, a reduction of the carrying amount to estimated fair value is required. McMoRan estimates the fair value of its properties using estimated future cash flows based on proved and risk-
adjusted probable oil and natural gas reserves as estimated by independent reserve engineers. Future cash flows are determined using published period-end forward market prices adjusted for property-specific price basis differentials, net of estimated future production and development costs and excluding estimated asset retirement and abandonment expenditures. If the undiscounted cash flows indicate that the property is impaired, McMoRan discounts the future cash flows using a discount factor that considers market participants’ expected rates of return for similar type assets if acquired under current market conditions.
The determination of oil and gas reserve estimates is a subjective process, and the accuracy of any reserve estimate depends on the quality of available data and the application of engineering and geological interpretation and judgment. Estimates of economically recoverable reserves and future net cash flows depend on a number of variable factors and assumptions that are difficult to predict and may vary considerably from actual results. In particular, reserve estimates for wells with limited or no production history are less reliable than those based on actual production. Subsequent evaluation of the same reserves may result in variations in estimated reserves and related estimates of future cash flows, and these variations may be substantial. If the capitalized costs of an individual oil and gas propert y exceed the related estimated future net cash flows, an impairment charge to reduce the capitalized costs to the property’s estimated fair value is required.
McMoRan recorded impairment charges of $13.7 and $70.7 million, respectively, during the second quarter and six months ended June 30, 2010 following impairment assessments of the carrying value of its oil and gas properties. These charges reflect the impact of declines in the market prices of natural gas during the first quarter of 2010 and negative reserve revisions resulting from well performance issues encountered at certain properties during the second quarter of 2010. McMoRan also recorded impairment charges of $14.6 million and $53.5 million, respectively, during the second quarter and six months ended June 30, 2009. McMoRan considers the fair value measurements used in its impairment evaluations to be derived from Level 3 inputs.
Since the fourth quarter of 2008, the decline in market prices for oil and natural gas coupled with other operational factors triggered impairment assessments that ultimately resulted in significant impairment charges for several of McMoRan’s oil and gas property investments. Additional impairment charges may be recorded in future periods if prices weaken, or if other unforeseen operational issues occur that negatively impact McMoRan’s ability to fully recover its current investments in oil and gas properties.
For more information regarding the risks associated with the declines in the future market prices of oil and natural gas and the other factors that could impact current reserve estimates, see Part I, Item 1A. “Risk Factors” located in the 2009 Form 10-K.
2008 Hurricane Activity.
Hurricanes Gustav and Ike impacted Gulf of Mexico operations prior to making landfall on the Louisiana and Texas coasts in September 2008. Although there was no significant damage to McMoRan’s properties resulting from Hurricane Gustav, Hurricane Ike caused significant structural damage to several platforms in which McMoRan had an investment interest. Since the third quarter of 2008, McMoRan has recorded charges totaling in excess of $180 million related to incurred repair costs, property impairments and additional estimated reclamation costs associated with the damaged properties. While a portion of these costs has been funded to date, a significant amount of the remaining expenditures, particularly for asset retirement obligations, will be funded by McMoRan over the next several years. McMoRan expects to realize a substantial recovery in future periods under its insurance program for a large portion of these hurricane related costs, reimbursement for which is received after damage-related expenditures are funded and related claims are approved. McMoRan recognized net insurance proceeds of $9.2 million in the second quarter and six months ended June 30, 2010. McMoRan recognized net insurance proceeds of $18.7 million in the six months ended June 30, 2009 as the initial payment associated with certain of McMoRan’s insured losses resulting from these hurricanes.
Accrued Reclamation Obligations.
For more information regarding McMoRan’s accounting policies for asset retirement obligations see Notes 1 and 16 of the 2009 Form 10-K. A summary of changes in McMoRan’s asset retirement obligations (including both current and long-term obligations) since December 31, 2009 follows (in thousands):
| | Oil and | | | |
| | Natural Gas | | Sulphur | |
| Asset retirement obligation at beginning of year | $ | 428,711 | | $ | 27,452 | |
| Liabilities settled | | (55,756 | ) | | (514 | ) |
| Accretion expense | | 8,557 | | | 708 | |
| Reclamation costs assumed from third parties | | 1,271 | | | - | |
| Reclamation costs assumed by third parties | | (411 | ) | | - | |
| Incurred liabilities | | - | | | - | |
| Revision for changes in estimates | | 410 | | | - | |
| Asset retirement obligations at June 30, 2010 | $ | 382,782 | | $ | 27,646 | |
Inventory.
Product inventories totaled $0.6 million at June 30, 2010 and December 31, 2009, consisting entirely of oil production from Main Pass Block 299. Materials and supplies inventory totaled $40.3 million at June 30, 2010 and $47.2 million at December 31, 2009, representing the cost of supplies to be used in McMoRan’s drilling activities, primarily drilling pipe and tubulars. These costs will be partially reimbursed by third party participants in wells supplied with these materials. There were no lower of cost or market adjustments charged to operations with respect to McMoRan’s inventories during the quarter or six months ended June 30, 2010. McMoRan charged $2.2 million and $1.1 million to operations for inventory lower of cost or market adjustments during the quarter and six months ended June 30, 2009, respectively.
Recent Events in the Gulf of Mexico.
On April 20, 2010, the Deepwater Horizon, an offshore drilling rig located in the deepwater of the Gulf of Mexico, sank following a catastrophic explosion and fire, which has significantly and adversely disrupted oil and gas exploration activities in the Gulf of Mexico. The duration of this disruption is currently unknown. The President has appointed a commission that is studying the causes of the catastrophe for the purpose of recommending to the President what legislative or regulatory measures should be taken in order to minimize the possibility of a reoccurrence of a disastrous oil spill. Pending the completion of that report, the United States government has imposed a suspension of all deepwater drilling and exploration activity in the Gulf of M exico through November 30, 2010. McMoRan does not operate in the deepwater Gulf of Mexico; consequently, its exploration activities are not subject to the suspension imposed by the Department of the Interior on deepwater drilling operations. However, new regulations and enhanced safety certifications have been issued for all operations in the Gulf of Mexico, and more detailed information is being required of parties seeking new drilling permits. McMoRan completed the necessary certifications and is providing required information to secure permits for future drilling. Additionally, legislation has been introduced in Congress, that if enacted, could have an impact on all operators in the Gulf of Mexico.
Delays in obtaining permits from the Department of the Interior may impact the timing of drilling new wells scheduled during 2010. McMoRan's in-process drilling operations, including the wells currently drilling at Davy Jones, Blackbeard East and Blueberry Hill have not been affected. The extent to which these recent events may impact McMoRan’s future operations and results is uncertain.
7. OTHER MATERS
8% Preferred Stock Conversions.
During the second quarter ended June 30, 2010, McMoRan privately negotiated the induced conversion of approximately 9,600 shares of its 8% preferred stock with a liquidation preference of $9.6 million into approximately 1.4 million shares of McMoRan common stock (at a conversion rate equal to 146.1454 shares of common stock per share of 8% preferred stock). To induce the early conversions of these shares of 8% preferred stock, McMoRan paid an aggregate of $1.9 million in cash to the holders of these shares which is included as a charge in McMoRan’s consolidated statements of operations within preferred dividends and inducement payments for early conversion of convertible preferred stock.
McMoRan induced conversion of approximately 57,200 shares of its 8% preferred stock with a liquidation preference of $57.2 million into approximately 8.4 million shares of its common stock during the six months ended June 30, 2010. McMoRan paid an aggregate of $10.8 million in cash to the holders of these shares during the six months ended June 30, 2010 to induce the early conversions of these shares. Subsequent to June 30, 2010, McMoRan induced the conversion of an additional 7,000 shares of its 8% preferred stock into approximately 1.0 million shares of McMoRan common stock. Following these transactions, approximately 22,100 shares of McMoRan’s 8% preferred stock remain outstanding.
Capitalized Interest.
Interest expense capitalized by McMoRan totaled $1.9 million in the second quarter of 2010 and $3.1 million for the six months ended June 30, 2010. Capitalized interest totaled $1.5 million in the second quarter of 2009 and $2.4 million for the six months ended June 30, 2009.
Pension Plan.
McMoRan provides certain health care and life insurance benefits (Other Benefits) to retired employees. See Note 12 of the 2009 Form 10-K for more information regarding the Other Benefits plan. The components of net periodic benefit cost for McMoRan’s Other Benefits plan follows (in thousands):
| | Second Quarter | | Six Months | |
| | 2010 | | 2009 | | 2010 | | 2009 | |
| Service cost | $ | 17 | | $ | 13 | | $ | 34 | | $ | 26 | |
| Interest cost | | 60 | | | 72 | | | 120 | | | 144 | |
| Return on plan assets | | - | | | - | | | - | | | - | |
| Amortization of prior service costs | | | | | | | | | | | | |
| and actuarial gains | | (9 | ) | | (10 | ) | | (18 | ) | | (20 | ) |
| Net periodic benefit expense | $ | 68 | | $ | 75 | | $ | 136 | | $ | 150 | |
Stock-Based Compensation.
For information regarding McMoRan’s accounting for stock-based awards, see Note 1 of the 2009 Form 10-K. Compensation cost charged to expense for stock-based awards follows (in thousands):
| | Second Quarter | | | Six Months | |
| | 2010 | | 2009 | | | 2010 | | 2009 | |
| Cost of options awarded to employees (including | | | | | | | | | | | | | |
| directors) | $ | 2,681 | | $ | 2,602 | | | $ | 11,947 | | $ | 8,615 | |
| Cost of options awarded to non-employees | | 178 | | | 147 | | | | 510 | | | 400 | |
| Cost of restricted stock units | | 110 | | | 84 | | | | 200 | | | 165 | |
| Total compensation cost | $ | 2,969 | | $ | 2,833 | | | $ | 12,657 | | $ | 9,180 | |
On February 1, 2010, McMoRan’s Board of Directors granted a total of 1,766,500 stock options to its employees at an exercise price of $15.73 per share, including immediately exercisable options for an aggregate of 445,000 shares. Options representing 400,000 of these 445,000 shares were issued to McMoRan’s Co-Chairmen in lieu of cash compensation in 2010. McMoRan recorded $6.7 million in charges related to immediately vested stock options in the first quarter of 2010. These charges included the compensation costs associated with the immediately exercisable options and the compensation costs related to stock options granted to retiree-eligible employees, which resulted in one-year’s compensation expense being immediately recognized at the effective date of the stock option grant. � 60;The weighted average per share value of the 1,816,500 options granted during the six months ended June 30, 2010 was $10.18.
McMoRan’s Board of Directors granted a total of 1,815,500 stock options to its employees at an exercise price of $6.44 per share on February 2, 2009. McMoRan recorded $2.9 million in charges related to immediately vested stock options in the first quarter of 2009. The weighted average per share value of the 1,855,500 options granted in the six months ended June 30, 2009 was $3.98.
As of June 30, 2010, total compensation cost related to unvested, approved stock option awards not yet recognized in earnings was approximately $21.4 million, which is expected to be recognized over a weighted average period of approximately one year.
Comprehensive loss.
McMoRan’s comprehensive loss follows (in thousands):
| | Second Quarter | | | Six Months | |
| | 2010 | | 2009 | | | 2010 | | 2009 | |
| Net loss | $ | (16,453 | ) | $ | (97,757 | ) | | $ | (69,847 | ) | $ | (158,316 | ) |
| Other comprehensive loss: | | | | | | | | | | | | | |
| Amortization of previously unrecognized pension | | | | | | | | | | | | | |
| components, net | | (9 | ) | | (10 | ) | | | (18 | ) | | (20 | ) |
| Comprehensive loss | $ | (16,462 | ) | $ | (97,767 | ) | | $ | (69,865 | ) | $ | (158,336 | ) |
Subsequent Events Evaluation.
McMoRan evaluated subsequent events for purposes of its June 30, 2010 financial reporting through the date of filing of its quarterly report on Form 10-Q with the Securities and Exchange Commission.
8. NEW ACCOUNTING STANDARDS
In January 2010, the Financial Accounting Standards Board (FASB) issued guidance which added new requirements for fair value disclosures about transfers into and out of Levels 1 and 2 and separate disclosures about purchases, sales, issuances and settlements relating to Level 3 measurements. The guidance also clarified existing requirements regarding the level of disaggregation as well as inputs and valuation techniques used to measure fair value. The guidance is effective for the first reporting period beginning after December 31, 2009, except for the requirement to provide the Level 3 activity of purchases, sales, issuances, and settlements on a gross basis, which will be effective for fiscal years beginning after December 31, 2010. The adoption of this guidance had no material impact on McMoRan’s fair value disclosures.
9. GUARANTOR FINANCIAL STATEMENTS
MOXY is an unconditional guarantor of McMoRan’s 11.875% senior notes. See Notes 6 and 19 of the 2009 Form 10-K for additional information regarding these senior notes and MOXY’s guarantee.
The following unaudited consolidating financial information includes information regarding McMoRan, as parent, MOXY and its subsidiaries, as guarantors, and Freeport Energy, as the non-guarantor subsidiary. Included are the condensed consolidating balance sheets at June 30, 2010 and December 31, 2009 and the related condensed consolidating statements of operations and cash flow for the quarter and six months ended June 30, 2010 and 2009, which should be read in conjunction with the Notes to these condensed consolidated financial statements:
CONDENSED CONSOLIDATING BALANCE SHEET (UNAUDITED)
June 30, 2010
| | | | | | | Freeport | | | | Consolidated | |
| | | Parent | | MOXY | | Energy | | Eliminations | | McMoRan | |
| | | (In Thousands) | |
| ASSETS | | | | | | | | | | | | | | | | |
| Current assets: | | | | | | | | | | | | | | | | |
| Cash and cash equivalents | | $ | 1,029 | | $ | 215,944 | | $ | 55 | | $ | - | | $ | 217,028 | |
| Accounts receivable | | | 316 | | | 87,803 | | | - | | | - | | | 88,119 | |
| Inventories | | | - | | | 40,934 | | | - | | | - | | | 40,934 | |
| Prepaid expenses | | | 2,728 | | | 1,836 | | | - | | | - | | | 4,564 | |
| Fair value of derivative contracts | | | - | | | 3,475 | | | - | | | - | | | 3,475 | |
| Current assets from discontinued | | | | | | | | | | | | | | | | |
| operations | | | - | | | - | | | 3,692 | | | - | | | 3,692 | |
| Total current assets | | | 4,073 | | | 349,992 | | | 3,747 | | | - | | | 357,812 | |
| Property, plant and equipment, net | | | - | | | 726,921 | | | 31 | | | - | | | 726,952 | |
| Investment in subsidiaries | | | 662,516 | | | - | | | - | | | (662,516 | ) | | - | |
| Amounts due from affiliates | | | - | | | 95,349 | | | - | | | (95,349 | ) | | - | |
| Deferred financing costs and other assets | | | 5,580 | | | 53,670 | | | - | | | - | | | 59,250 | |
| Discontinued sulphur assets | | | - | | | - | | | 2,992 | | | - | | | 2,992 | |
| Total assets | | $ | 672,169 | | $ | 1,225,932 | | $ | 6,770 | | $ | (757,865 | ) | $ | 1,147,006 | |
| | | | | | | | | | | | | | | | | |
| LIABILITIES AND STOCKHOLDERS’ EQUITY | | | | | | | | | | |
Current liabilities: | | | | | | | | | | | | | | | | |
| Accounts payable | | $ | 257 | | $ | 66,834 | | $ | 89 | | $ | - | | $ | 67,180 | |
| Accrued liabilities | | | 959 | | | 68,904 | | | (51 | ) | | - | | | 69,812 | |
| Current portion of oil and gas | | | | | | | | | | | | | | | | |
| accrued reclamation costs | | | - | | | 157,818 | | | - | | | - | | | 157,818 | |
| Other current liabilities | | | 8,167 | | | 950 | | | - | | | - | | | 9,117 | |
| Current liabilities from discontinued | | | | | | | | | | | | | | | | |
| operations | | | - | | | - | | | 11,209 | | | - | | | 11,209 | |
| Total current liabilities | | | 9,383 | | | 294,506 | | | 11,247 | | | - | | | 315,136 | |
| Long-term debt | | | 374,720 | | | - | | | - | | | - | | | 374,720 | |
| Amounts due to affiliates | | | 90,875 | | | - | | | 4,474 | | | (95,349 | ) | | - | |
| Accrued oil and gas reclamation costs | | | - | | | 224,964 | | | - | | | - | | | 224,964 | |
| Other long-term liabilities | | | 6,467 | | | 9,090 | | | 1,616 | | | - | | | 17,173 | |
| Long-term liabilities from discontinued | | | | | | | | | | | | | | | | |
| operations | | | - | | | - | | | 24,289 | | | - | | | 24,289 | |
| Total liabilities | | | 481,445 | | | 528,560 | | | 41,626 | | | (95,349 | ) | | 956,282 | |
| Commitments and contingencies | | | | | | | | | | | | | | | | |
| Stockholders’ equity (deficit) | | | 190,724 | | | 697,372 | | | (34,856 | ) | | (662,516 | ) | | 190,724 | |
| Total liabilities and stockholders’ equity | | | | | | | | | | | | | | | | |
| (deficit) | | $ | 672,169 | | $ | 1,225,932 | | $ | 6,770 | | $ | (757,865 | ) | $ | 1,147,006 | |
CONDENSED CONSOLIDATING BALANCE SHEET
December 31, 2009
| | | | | | | Freeport | | | | Consolidated | |
| | | Parent | | MOXY | | Energy | | Eliminations | | McMoRan | |
| | | (In Thousands) | |
| ASSETS | | | | | | | | | | | | | | | | |
| Current assets: | | | | | | | | | | | | | | | | |
| Cash and cash equivalents | | $ | 16 | | $ | 241,400 | | $ | 2 | | $ | - | | $ | 241,418 | |
| Accounts receivable | | | - | | | 79,681 | | | - | | | - | | | 79,681 | |
| Inventories | | | - | | | 47,818 | | | - | | | - | | | 47,818 | |
| Prepaid expenses | | | 2,919 | | | 11,538 | | | - | | | - | | | 14,457 | |
| Fair value of derivative contracts | | | - | | | 8,693 | | | - | | | - | | | 8,693 | |
| Current assets from discontinued | | | | | | | | | | | | | | | | |
| operations | | | - | | | - | | | 825 | | | - | | | 825 | |
| Total current assets | | | 2,935 | | | 389,130 | | | 827 | | | - | | | 392,892 | |
| Property, plant and equipment, net | | | - | | | 796,192 | | | 31 | | | - | | | 796,223 | |
| Investment in subsidiaries | | | 694,820 | | | - | | | - | | | (694,820 | ) | | - | |
| Amounts due from affiliates | | | | | | 53,173 | | | - | | | (53,173 | ) | | - | |
| Deferred financing costs and other assets | | | 6,374 | | | 47,234 | | | - | | | - | | | 53,608 | |
| Discontinued sulphur assets | | | - | | | - | | | 6,159 | | | - | | | 6,159 | |
| Total assets | | $ | 704,129 | | $ | 1,285,729 | | $ | 7,017 | | $ | (747,993 | ) | $ | 1,248,882 | |
| | | | | | | | | | | | | | | | | |
| LIABILITIES AND STOCKHOLDERS’ EQUITY | | | | | | | | | | |
Current liabilities: | | | | | | | | | | | | | | | | |
| Accounts payable | | $ | 188 | | $ | 66,209 | | $ | 147 | | $ | - | | $ | 66,544 | |
| Accrued liabilities | | | 728 | | | 51,217 | | | | | | - | | | 51,945 | |
| Current portion of oil and gas | | | | | | | | | | | | | | | | |
| accrued reclamation costs | | | - | | | 106,791 | | | - | | | - | | | 106,791 | |
| Other current liabilities | | | 7,698 | | | 2,074 | | | - | | | - | | | 9,772 | |
| Current liabilities from discontinued | | | | | | | | | | | | | | | | |
| operations | | | - | | | - | | | 9,483 | | | - | | | 9,483 | |
| Total current liabilities | | | 8,614 | | | 226,291 | | | 9,630 | | | - | | | 244,535 | |
| Long-term debt | | | 374,720 | | | - | | | - | | | - | | | 374,720 | |
| Amounts due to affiliates | | | 48,977 | | | - | | | 4,196 | | | (53,173 | ) | | - | |
| Accrued oil and gas reclamation costs | | | - | | | 321,920 | | | - | | | - | | | 321,920 | |
| Other long-term liabilities | | | 6,010 | | | 8,975 | | | 1,617 | | | - | | | 16,602 | |
| Long-term liabilities from discontinued | | | | | | | | | | | | | | | | |
| operations | | | - | | | - | | | 25,297 | | | - | | | 25,297 | |
| Total liabilities | | | 438,321 | | | 557,186 | | | 40,740 | | | (53,173 | ) | | 983,074 | |
| Commitments and contingencies | | | | | | | | | | | | | | | | |
| Stockholders’ equity (deficit) | | | 265,808 | | | 728,543 | | | (33,723 | ) | | (694,820 | ) | | 265,808 | |
| Total liabilities and stockholders’ equity | | | | | | | | | | | | | | | | |
| (deficit) | | $ | 704,129 | | $ | 1,285,729 | | $ | 7,017 | | $ | (747,993 | ) | $ | 1,248,882 | |
CONDENSED CONSOLIDATING STATEMENT OF OPERATIONS (UNAUDITED)
Three Months Ended June 30, 2010
| | | | | | | Freeport | | | | Consolidated | |
| | | Parent | | MOXY | | Energy | | Eliminations | | McMoRan | |
| | | (In Thousands) | |
| Revenues: | | | | | | | | | | | | | | | | |
| Oil and natural gas | | $ | - | | $ | 104,103 | | $ | - | | $ | - | | $ | 104,103 | |
| Service | | | - | | | 3,938 | | | - | | | - | | | 3,938 | |
| Total revenues | | | - | | | 108,041 | | | - | | | - | | | 108,041 | |
| Costs and expenses: | | | | | | | | | | | | | | | | |
| Production and delivery costs | | | - | | | 46,452 | | | (13 | ) | | - | | | 46,439 | |
| Depletion, depreciation and amortization | | | | | | | | | | | | | | | | |
| expense | | | - | | | 57,887 | | | - | | | - | | | 57,887 | |
| Exploration expenses | | | - | | | 10,434 | | | - | | | - | | | 10,434 | |
| Loss on oil and gas derivative contracts | | | - | | | 477 | | | - | | | - | | | 477 | |
| General and administrative expenses | | | 1,380 | | | 8,996 | | | - | | | - | | | 10,376 | |
Main Pass Energy HubTM costs | | | - | | | - | | | 242 | | | - | | | 242 | |
| Insurance recoveries | | | - | | | (9,171 | ) | | - | | | - | | | (9,171 | ) |
| Gain on sale of oil and gas property | | | - | | | (3,455 | ) | | - | | | - | | | (3,455 | ) |
| Total costs and expenses | | | 1,380 | | | 111,620 | | | 229 | | | - | | | 113,229 | |
| Operating loss | | | (1,380 | ) | | (3,579 | ) | | (229 | ) | | - | | | (5,188 | ) |
| Interest expense, net | | | (10,122 | ) | | 249 | | | - | | | - | | | (9,873 | ) |
| Equity in losses of consolidated | | | | | | | | | | | | | | | - | |
| subsidiaries | | | (4,946 | ) | | - | | | - | | | 4,946 | | | - | |
| Other income (expense), net | | | (5 | ) | | 49 | | | - | | | - | | | 44 | |
| Loss from continuing operations before | | | | | | | | | | | | | | | | |
| income taxes | | | (16,453 | ) | | (3,281 | ) | | (229 | ) | | 4,946 | | | (15,017 | ) |
| Income tax expense | | | - | | | - | | | - | | | - | | | - | |
| Loss from continuing operations | | | (16,453 | ) | | (3,281 | ) | | (229 | ) | | 4,946 | | | (15,017 | ) |
| Loss from discontinued operations | | | - | | | - | | | (1,436 | ) | | - | | | (1,436 | ) |
| Net loss | | | (16,453 | ) | | (3,281 | ) | | (1,665 | ) | | 4,946 | | | (16,453 | ) |
| Preferred dividends and other related | | | | | | | | | | | | | | | | |
| preferred stock costs | | | (5,293 | ) | | - | | | - | | | - | | | (5,293 | ) |
| Net loss applicable to common stock | | $ | (21,746 | ) | $ | (3,281 | ) | $ | (1,665 | ) | $ | 4,946 | | $ | (21,746 | ) |
| | | | | | | | | | | | | | | | | |
CONDENSED CONSOLIDATING STATEMENT OF OPERATIONS (UNAUDITED)
Six Months Ended June 30, 2010
| | | | | | | Freeport | | | | Consolidated | |
| | | Parent | | MOXY | | Energy | | Eliminations | | McMoRan | |
| | | (In Thousands) | |
| Revenues: | | | | | | | | | | | | | | | | |
| Oil and natural gas | | $ | - | | $ | 232,949 | | $ | - | | $ | - | | $ | 232,949 | |
| Service | | | - | | | 7,580 | | | - | | | - | | | 7,580 | |
| Total revenues | | | - | | | 240,529 | | | - | | | - | | | 240,529 | |
| Costs and expenses: | | | | | | | | | | | | | | | | |
| Production and delivery costs | | | - | | | 88,249 | | | (25 | ) | | - | | | 89,224 | |
| Depletion, depreciation and amortization | | | | | | | | | | | | | | | | |
| expense | | | - | | | 166,132 | | | - | | | - | | | 166,132 | |
| Exploration expenses | | | - | | | 22,843 | | | - | | | - | | | 22,843 | |
| Gain on oil and gas derivative contracts | | | - | | | (3,268 | ) | | - | | | - | | | (3,268 | ) |
| General and administrative expenses | | | 2,911 | | | 21,208 | | | - | | | - | | | 24,119 | |
Main Pass Energy HubTM costs | | | - | | | - | | | 575 | | | - | | | 575 | |
| Insurance recoveries | | | - | | | (9,171 | ) | | - | | | - | | | (9,171 | ) |
| Gain on sale of oil and gas property | | | - | | | (3,455 | ) | | - | | | - | | | (3,455 | ) |
| Total costs and expenses | | | 2,911 | | | 283,538 | | | 550 | | | - | | | 286,999 | |
| Operating loss | | | (2,911 | ) | | (43,009 | ) | | (550 | ) | | - | | | (46,470 | ) |
| Interest expense, net | | | (20,406 | ) | | - | | | - | | | - | | | (20,406 | ) |
| Equity in losses of consolidated | | | | | | | | | | | | | | | - | |
| subsidiaries | | | (46,529 | ) | | - | | | - | | | 46,529 | | | - | |
| Other income (expense), net | | | (1 | ) | | 106 | | | - | | | - | | | 105 | |
| Loss from continuing operations before | | | | | | | | | | | | | | | | |
| income taxes | | | (69,847 | ) | | (42,903 | ) | | (550 | ) | | 46,529 | | | (66,771 | ) |
| Income tax expense | | | - | | | - | | | - | | | - | | | - | |
| Loss from continuing operations | | | (69,847 | ) | | (42,903 | ) | | (550 | ) | | 46,529 | | | (66,771 | ) |
| Loss from discontinued operations | | | - | | | - | | | (3,076 | ) | | - | | | (3,076 | ) |
| Net loss | | | (69,847 | ) | | (42,903 | ) | | (3,626 | ) | | 46,529 | | | (69,847 | ) |
| Preferred dividends and other related | | | | | | | | | | | | | | | | |
| preferred stock costs | | | (18,059 | ) | | - | | | - | | | - | | | (18,059 | ) |
| Net loss applicable to common stock | | $ | (87,906 | ) | $ | (42,903 | ) | $ | (3,626 | ) | $ | 46,529 | | $ | (87,906 | ) |
| | | | | | | | | | | | | | | | | |
CONDENSED CONSOLIDATING STATEMENT OF OPERATIONS (UNAUDITED)
Three Months Ended June 30, 2009
| | | | | | | Freeport | | | | Consolidated | |
| | | Parent | | MOXY | | Energy | | Eliminations | | McMoRan | |
| | | (In Thousands) | |
| Revenues: | | | | | | | | | | | | | | | | |
| Oil and natural gas | | $ | - | | $ | 94,065 | | $ | - | | $ | - | | $ | 94,065 | |
| Service | | | - | | | 2,487 | | | - | | | - | | | 2,487 | |
| Total revenues | | | - | | | 96,552 | | | - | | | - | | | 96,552 | |
| Costs and expenses: | | | | | | | | | | | | | | | | |
| Production and delivery costs | | | - | | | 48,815 | | | (15 | ) | | - | | | 48,800 | |
| Depletion, depreciation and | | | | | | | | | | | | | | | | |
| amortization expense | | | - | | | 73,970 | | | - | | | - | | | 73,970 | |
| Exploration expenses | | | - | | | 46,836 | | | - | | | - | | | 46,836 | |
| Loss on oil and gas derivative contracts | | | - | | | 2,972 | | | - | | | - | | | 2,972 | |
| General and administrative expenses | | | 1,508 | | | 9,401 | | | 7 | | | - | | | 10,916 | |
Main Pass Energy Hub™ costs | | | - | | | - | | | 351 | | | - | | | 351 | |
| Insurance recoveries | | | - | | | (35 | ) | | - | | | - | | | (35 | ) |
| Total costs and expenses | | | 1,508 | | | 181,959 | | | 343 | | | - | | | 183,810 | |
| Operating loss | | | (1,508 | ) | | (85,407 | ) | | (343 | ) | | - | | | (87,258 | ) |
| Interest expense, net | | | (10,284 | ) | | 9 | | | - | | | - | | | (10,275 | ) |
| Equity in losses of consolidated | | | | | | | | | | | | | | | - | |
| subsidiaries | | | (85,937 | ) | | - | | | - | | | 85,937 | | | - | |
| Other income (expense), net | | | (11 | ) | | 2,854 | | | - | | | - | | | 2,843 | |
| Loss from continuing operations before | | | | | | | | | | | | | | | | |
| income taxes | | | (97,740 | ) | | (82,544 | ) | | (343 | ) | | 85,937 | | | (94,690 | ) |
| Income tax expense | | | (17 | ) | | - | | | - | | | - | | | (17 | ) |
| Loss from continuing operations | | | (97,757 | ) | | (82,544 | ) | | (343 | ) | | 85,937 | | | (94,707 | ) |
| Loss from discontinued operations | | | - | | | - | | | (3,050 | ) | | - | | | (3,050 | ) |
| Net loss | | | (97,757 | ) | | (82,544 | ) | | (3,393 | ) | | 85,937 | | | (97,757 | ) |
| Preferred dividends and other related | | | | | | | | | | | | | | | | |
| costs | | | (2,855 | ) | | - | | | - | | | - | | | (2,855 | ) |
| Net loss applicable to common stock | | $ | (100,612 | ) | $ | (82,544 | ) | $ | (3,393 | ) | $ | 85,937 | | $ | (100,612 | ) |
| | | | | | | | | | | | | | | | | |
CONDENSED CONSOLIDATING STATEMENT OF OPERATIONS (UNAUDITED)
Six Months Ended June 30, 2009
| | | | | | | Freeport | | | | Consolidated | |
| | | Parent | | MOXY | | Energy | | Eliminations | | McMoRan | |
| | | (In Thousands) | |
| Revenues: | | | | | | | | | | | | | | | | |
| Oil and natural gas | | $ | - | | $ | 189,147 | | $ | - | | $ | - | | $ | 189,147 | |
| Service | | | - | | | 4,781 | | | - | | | - | | | 4,781 | |
| Total revenues | | | - | | | 193,928 | | | - | | | - | | | 193,928 | |
| Costs and expenses: | | | | | | | | | | | | | | | | |
| Production and delivery costs | | | - | | | 97,873 | | | (27 | ) | | - | | | 97,846 | |
| Depletion, depreciation and | | | | | | | | | | | | | | | | |
| amortization expense | | | - | | | 167,367 | | | - | | | - | | | 167,367 | |
| Exploration expenses | | | - | | | 75,262 | | | - | | | - | | | 75,262 | |
| Gain on oil and gas derivative contracts | | | - | | | (15,886 | ) | | - | | | - | | | (15,886 | ) |
| General and administrative expenses | | | 3,285 | | | 20,049 | | | 28 | | | - | | | 23,362 | |
Main Pass Energy Hub™ costs | | | - | | | - | | | 1,116 | | | - | | | 1,116 | |
| Insurance recoveries | | | - | | | (18,742 | ) | | - | | | - | | | (18,742 | ) |
| Total costs and expenses | | | 3,285 | | | 325,923 | | | 1,117 | | | - | | | 330,325 | |
| Operating loss | | | (3,285 | ) | | (131,995 | ) | | (1,117 | ) | | - | | | (136,397 | ) |
| Interest expense | | | (20,568 | ) | | (373 | ) | | - | | | - | | | (20,941 | ) |
| Equity in losses of consolidated | | | | | | | | | | | | | | | - | |
| subsidiaries | | | (134,413 | ) | | - | | | - | | | 134,413 | | | - | |
| Other income (expense), net | | | (17 | ) | | 3,189 | | | - | | | - | | | 3,172 | |
| Loss from continuing operations before | | | | | | | | | | | | | | | | |
| income taxes | | | (158,283 | ) | | (129,179 | ) | | (1,117 | ) | | 134,413 | | | (154,166 | ) |
| Income tax expense | | | (33 | ) | | - | | | - | | | - | | | (33 | ) |
| Loss from continuing operations | | | (158,316 | ) | | (129,179 | ) | | (1,117 | ) | | 134,413 | | | (154,199 | ) |
| Loss from discontinued operations | | | - | | | - | | | (4,117 | ) | | - | | | (4,117 | ) |
| Net loss | | | (158,316 | ) | | (129,179 | ) | | (5,234 | ) | | 134,413 | | | (158,316 | ) |
| Preferred dividends and other related | | | | | | | | | | | | | | | | |
| preferred stock costs | | | (5,537 | ) | | - | | | - | | | - | | | (5,537 | ) |
| Net loss applicable to common stock | | $ | (163,853 | ) | $ | (129,179 | ) | $ | (5,234 | ) | $ | 134,413 | | $ | (163,853 | ) |
| | | | | | | | | | | | | | | | | |
CONDENSED CONSOLIDATING STATEMENT OF CASH FLOW (UNAUDITED)
Six Months Ended June 30, 2010
| | | | | | | Freeport | | Consolidated | |
| | | Parent | | MOXY | | Energy | | McMoRan | |
| | | (In Thousands) | |
| | | | | | | | | | | | | | |
| Cash flow from operating activities: | | | | | | | | | | | | | |
| Net cash provided by (used in) continuing | | | | | | | | | | | | | |
| operations | | $ | 20,720 | | $ | 73,060 | | $ | (83 | ) | $ | 93,697 | |
| Net cash used in discontinued operations | | | - | | | - | | | (2,164 | ) | | (2,164 | ) |
| Net cash provided by (used in) operating | | | | | | | | | | | | | |
| activities | | | 20,720 | | | 73,060 | | | (2,247 | ) | | 91,533 | |
| | | | | | | | | | | | | | |
| Cash flow from investing activities: | | | | | | | | | | | | | |
| Exploration, development and other | | | | | | | | | | | | | |
| capital expenditures | | | - | | | (101,436 | ) | | - | | | (101,436 | ) |
| Gain on sale of oil and gas property | | | - | | | 2,920 | | | - | | | 2,920 | |
| Net cash used in investing activities | | | - | | | (98,516 | ) | | - | | | (98,516 | ) |
| | | | | | | | | | | | | | |
| Cash flow from financing activities: | | | | | | | | | | | | | |
| Dividends paid and conversion inducement | | | (17,589 | ) | | - | | | - | | | (17,589 | ) |
| payments on convertible preferred stock | | | | | | | | | | | | | |
| Proceeds from exercise of stock options | | | 182 | | | - | | | - | | | 182 | |
| Investment from parent | | | (2,300 | ) | | - | | | 2,300 | | | - | |
| Net cash (used in) provided by financing | | | | | | | | | | | | | |
| activities | | | (19,707 | ) | | - | | | 2,300 | | | (17,407 | ) |
| | | | | | | | | | | | | | |
| Net increase (decrease) in cash and cash | | | 1,013 | | | (25,456 | ) | | 53 | | | (24,390 | ) |
| equivalents | | | | | | | | | | | | | |
| Cash and cash equivalents at beginning | | | 16 | | | 241,400 | | | 2 | | | 241,418 | |
| of year | | | | | | | | | | | | | |
| Cash and cash equivalents at end of year | | $ | 1,029 | | $ | 215,944 | | $ | 55 | | $ | 217,028 | |
| | | | | | | | | | | | | | |
CONDENSED CONSOLIDATING STATEMENT OF CASH FLOW (UNAUDITED)
Six Months Ended June 30, 2009
| | | | | | | Freeport | | Consolidated | |
| | | Parent | | MOXY | | Energy | | McMoRan | |
| | | (In Thousands) | |
| | | | | | | | | | | | | | |
| Cash flow from operating activities: | | | | | | | | | | | | | |
| Net cash provided by (used in) continuing | | | | | | | | | | | | | |
| operations | | $ | (160,217 | ) | $ | 216,358 | | $ | (955 | ) | $ | 55,186 | |
| Net cash used in discontinued operations | | | - | | | - | | | (1,655 | ) | | (1,655 | ) |
| Net cash provided by (used in) operating | | | | | | | | | | | | | |
| activities | | | (160,217 | ) | | 216,358 | | | (2,610 | ) | | 53,531 | |
| | | | | | | | | | | | | | |
| Cash flow from investing activities: | | | | | | | | | | | | | |
| Exploration, development and other | | | | | | | | | | | | | |
| capital expenditures | | | - | | | (84,331 | ) | | - | | | (84,331 | ) |
| Net cash used in investing activities | | | - | | | (84,331 | ) | | - | | | (84,331 | ) |
| | | | | | | | | | | | | | |
| Cash flow from financing activities: | | | | | | | | | | | | | |
| Dividends paid on convertible preferred stock | | | (5,365 | ) | | - | | | - | | | (5,365 | ) |
| Proceeds from the sale of common stock | | | 84,934 | | | - | | | - | | | 84,934 | |
| Proceeds from the sale of 8% preferred stock | | | 83,228 | | | - | | | - | | | 83,228 | |
| Investment from parent | | | (2,605 | ) | | - | | | 2,605 | | | - | |
| Net cash provided by financing activities | | | 160,192 | | | - | | | 2,605 | | | 162,797 | |
| | | | | | | | | | | | | | |
| Net increase (decrease) in cash and cash | | | | | | | | | | | | | |
| equivalents | | | (25 | ) | | 132,027 | | | (5 | ) | | 131,997 | |
| Cash and cash equivalents at beginning | | | | | | | | | | | | | |
| of year | | | 35 | | | 93,442 | | | 9 | | | 93,486 | |
| Cash and cash equivalents at end of year | | $ | 10 | | $ | 225,469 | | $ | 4 | | $ | 225,483 | |
| | | | | | | | | | | | | | |
11. RATIO OF EARNINGS TO FIXED CHARGES
McMoRan sustained losses from continuing operations totaling $66.8 million for the six months ended June 30, 2010, and thus did not cover its fixed charges of $23.6 million for the six months ended June 30, 2010. McMoRan sustained losses from continuing operations totaling $154.2 million for the six months ended June 30, 2009, and thus did not cover its fixed charges of $23.1 million for the six months ended June 30, 2009. For this calculation, earnings consist of losses from continuing operations and fixed charges. Fixed charges include interest and that portion of rent deemed representative of interest.
To the Board of Directors and Stockholders of McMoRan Exploration Co.:
We have reviewed the condensed consolidated balance sheet of McMoRan Exploration Co. (a Delaware corporation) as of June 30, 2010, and the related consolidated statements of operations and cash flow for the three-and six-month periods ended June 30, 2010 and 2009. These financial statements are the responsibility of the Company’s management.
We conducted our review in accordance with the standards of the Public Company Accounting Oversight Board (United States). A review of interim financial information consists principally of applying analytical procedures and making inquiries of persons responsible for financial and accounting matters. It is substantially less in scope than an audit conducted in accordance with the standards of the Public Company Accounting Oversight Board, the objective of which is the expression of an opinion regarding the financial statements taken as a whole. Accordingly, we do not express such an opinion.
Based on our review, we are not aware of any material modifications that should be made to the condensed consolidated financial statements referred to above for them to be in conformity with U.S. generally accepted accounting principles.
We have previously audited in accordance with the standards of the Public Company Accounting Oversight Board (United States), the consolidated balance sheet of McMoRan Exploration Co. as of December 31, 2009, and the related consolidated statements of operations, cash flow and changes in stockholders’ equity (deficit) for the year then ended (not presented herein), and in our report dated March 12, 2010, we expressed an unqualified opinion on those consolidated financial statements. In our opinion, the information set forth in the accompanying condensed consolidated balance sheet as of December 31, 2009, is fairly stated, in all material respects, in relation to the consolidated balance sheet from which it has been derived.
/s/ ERNST & YOUNG LLP
New Orleans, Louisiana
August 9, 2010
OVERVIEW
In management’s discussion and analysis “we,” “us,” and “our” refer to McMoRan Exploration Co. and its wholly owned consolidated subsidiaries, McMoRan Oil & Gas LLC (MOXY) and Freeport-McMoRan Energy LLC (Freeport Energy). You should read the following discussions in conjunction with our consolidated financial statements, the related discussion and analysis of financial condition and results of operations and our discussion of “Business and Properties” in our Annual Report on Form 10-K for the year ended December 31, 2009 (2009 Form 10-K) filed with the Securities and Exchange Commission. The results of operations reported and summarized below are not necessarily indicative of future operating results. Unless otherwise specified, all refere nces to Notes refers to Notes to Consolidated Financial Statements included elsewhere in this Form 10-Q. Also see the 2009 Form 10-K for a glossary of definitions for some of the oil and gas industry terms we use in this Form 10-Q.
We engage in the exploration, development and production of oil and natural gas in the shallow waters of the Gulf of Mexico and onshore in the Gulf Coast area. Our exploration strategy is focused on the “deep gas play,” drilling to depths of 15,000 to 25,000 feet in the shallow waters of the Gulf of Mexico and Gulf Coast area to target large structures in the Deep Miocene, and on the “ultra-deep play” in the shallow waters at depths below 25,000 feet. We have one of the largest acreage positions in the shallow waters of these areas, which are our regions of focus. We do not operate in the deepwater Gulf of Mexico. Our focused strategy enables us to make efficient use of our geological, engineering and production strengths in these areas where we have more than 35 years of operating experience. We a lso believe that the scale of our operations in the Gulf of Mexico allows us to realize certain operating synergies and provides a strong platform from which to pursue our business strategy. Our oil and gas operations are conducted through MOXY, our principal operating subsidiary.
We will continue to focus on managing our capital and operating needs while pursuing opportunities within our deep gas and ultra-deep gas exploration program, including the active development and exploitation of our Davy Jones ultra-deep discovery. The implementation of our business strategy will require significant expenditures for the remainder of 2010 and beyond. During the six months ended June 30, 2010, we invested $101.4 million on capital-related projects primarily associated with our exploration activities. Our exploration, development and other capital expenditures for 2010 are expected to approximate $240 million, including approximately $170 million in exploration costs and $70 million in development costs. During the six months ended June 30, 2010, we incurred $41.6 million of net abandonment expenditures . We plan to spend approximately $130 million in 2010 for the abandonment and removal of oil and gas structures in the Gulf of Mexico, including $50 million associated with hurricane damage reclamation for which we expect reimbursement under our insurance program.
Capital spending will continue to be driven by exploration and development opportunities and managed based on market conditions. We will require significant capital to further evaluate and develop the Davy Jones prospect and to fund our ongoing exploration and development program. We plan to fund our capital spending through available cash, cash flow from operations, participation by partners in exploration and development projects and new financings. We continue to monitor the global financial and credit markets, as well as the fluctuations in oil and natural gas market prices, all of which have been widely publicized and may ultimately have a material effect on one or more facets of our business and overall business strategy. For additional information, see Part 1, Item 1A. “Risk Factors” included in our 2009 Form 10-K. We will continue to evaluate and respond to any impact these conditions may have on our operations.
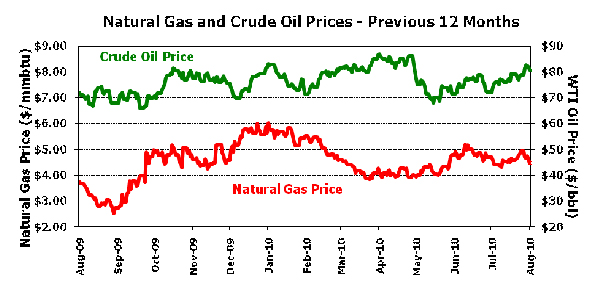
North American Natural Gas and Oil Market Environment
Our current production volume is comprised of approximately 75 percent natural gas and 25 percent oil. As a result, our revenues are generally more sensitive to changes in the market price of natural gas than to changes in the market price of oil. North American natural gas averaged $4.35 per MMbtu during the second quarter of 2010. The spot price for natural gas was $4.47 per MMbtu on August 6, 2010. The average oil price for the second quarter of 2010 was $78.12 per barrel and the spot price for oil was $80.70 per barrel on August 6, 2010. Future oil and natural gas prices are subject to change and
these changes are not within our control (see Part 1, Item 1A. “Risk Factors” included in our 2009 Form 10-K).
OPERATIONAL ACTIVITIES
Production Update
Second-quarter 2010 production averaged 165 MMcfe/d net to us, compared with 187 MMcfe/d in the second quarter of 2009. Production in the second quarter of 2010 was lower than publicly reported estimates in April 2010 of 170 MMcfe/d primarily because of unscheduled downtime for maintenance on pipelines and other facilities. Production is expected to average approximately 145 MMcfe/d in the second half of 2010 and 160 MMcfe/d for the year, lower than the previous estimate of 170 MMcfe/d primarily resulting from the timing of development activities and increased downtime for pipeline and facility maintenance. Our estimated production rates are dependent on the timing of planned recompletions, production performance and other factors and do not consider possible curtailments caused by storm activity in the G ulf of Mexico.
Following the Flatrock discovery in OCS 310 on South Marsh Island Block 212 in July 2007, we have drilled five additional successful wells in the field. Production from these six Flatrock wells averaged a gross rate of approximately 187 MMcfe/d (35 MMcfe/d net to us) in the second quarter of 2010. The operator plans to recomplete the #229 & #230 wells in 2010. We have a 25.0 percent working interest in Flatrock.
Oil and Gas Activities
We do not operate in the deepwater Gulf of Mexico; consequently, our exploration activities are not subject to the suspension imposed by the Department of the Interior on deepwater drilling operations. New regulations and enhanced safety certifications have been issued for all operations in the Gulf of Mexico. We completed the necessary certifications and are providing required information to secure permits for future drilling.
Shallow Water, Deep Gas Exploration Activities.
The Blueberry Hill #9 STK1, located on Louisiana State Lease 340 in 10 feet of water, commenced drilling on April 26, 2010 and has been drilled to a true vertical depth (TVD) of 23,630 feet (24,385 feet measured depth). The gamma ray and resistivity information from log-while-drilling tools indicate a possible hydrocarbon bearing zone in a high quality sand measuring 105 feet. Wireline logs will be required to fully evaluate this section. We are continuing to deepen the well.
We own a 42.9 percent working interest and a 29.7 percent net revenue interest in the Blueberry Hill well. Our investment in the Blueberry Hill field totaled $21.5 million at June 30, 2010, including $14.7 million in costs associated with the #9 STK1 well currently in progress.
Our deep gas exploratory drilling plans in 2010 also include the Boudin, Hurricane Deep and Platte prospects. Boudin is located in 20 feet of water on Eugene Island Block 26. The well has a proposed total depth of 23,050 feet and will test Miocene objectives. Hurricane Deep is located on the southern flank of the Flatrock structure in twelve feet of water on South Marsh Island Block 217. The well has a proposed total depth of 21,750 feet and is targeting the significant Gyro sand encountered in the Hurricane Deep well (No. 226) in 2007 and deeper potential. We are the operator of the well and hold a 25 percent working interest. Our investment in Hurricane Deep totaled $21.9 million at June 30, 2010, and our share of costs to re-drill to 18,450 feet is expected to be covere d under our insurance program. Platte, which is located in Vermilion Parish, Louisiana, has a proposed total depth of 18,700 feet.
Shallow Water, Ultra-deep Exploration Activities.
The data received to date from ultra-deep drilling on the Shelf confirm our geologic modeling, which correlates objective sections on the Shelf below the salt weld (i.e. listric fault) in the Miocene and older age sections to those productive sections seen in deepwater discoveries by other industry participants. In addition to Davy Jones and Blackbeard West, we have identified approximately 15 ultra-deep prospects in shallow water. Our ultra-deep drilling plans in 2010 include the Blackbeard East and Lafitte exploratory wells and delineation drilling at Davy Jones. Future plans also include the John Paul Jones prospect located north of Davy Jones.
In February 2010, the Davy Jones discovery well on South Marsh Island Block 230 was drilled to a total depth of 29,000 feet. As reported in January 2010, we logged 200 net feet of pay in multiple Eocene/Paleocene (Wilcox) sands in the well. In March 2010, a production liner was set and the well was temporarily abandoned until necessary equipment for the completion is available. Flow testing will be required to confirm the ultimate hydrocarbon flow rates from the well. We completed the well design in the second quarter of 2010 and are procuring the long-lead equipment needed to complete, test and produce the well. The completion and flow test are expected to be performed in the third quarter of 2011.
On April 7, 2010, we commenced drilling the Davy Jones offset appraisal well on South Marsh Island Block 234, two and a half miles southwest of the discovery well. The well is currently drilling below 12,000 feet towards a proposed total depth of 29,950 feet. The offset appraisal well (Davy Jones #2) is expected to test similar sections up-dip to the discovery well, as well as deeper objectives, including potential additional Wilcox and possibly Cretaceous (Tuscaloosa) sections.
Davy Jones involves a large ultra-deep structure encompassing four OCS lease blocks (20,000 acres). We are funding 28.7 percent of the drilling costs and hold a 32.7 percent working interest and 25.9 percent net revenue interest. Our investment in Davy Jones totaled $46.4 million at June 30, 2010, including $13.1 million in costs associated with the offset appraisal well in progress.
The Blackbeard East ultra-deep exploration well commenced drilling on March 8, 2010 and is currently drilling below 19,100 feet. The well, which is located in 80 feet of water on South Timbalier Block 144, has a proposed total depth of 29,950 feet and will target Middle and Deep Miocene objectives seen below 30,000 feet in Blackbeard West, nine miles away, as well as younger Miocene objectives. We are funding 32.0 percent of the exploratory costs and hold a 38.5 percent working interest and 30.7 percent net revenue interest. Our investment in Blackbeard East totaled $19.3 million at June 30, 2010.
The Lafitte ultra-deep exploration well is expected to commence drilling in the second half of 2010. Like Blackbeard East, Lafitte will target Middle and Deep Miocene objectives. Lafitte is located on Eugene Island Block 223 in 140 feet of water.
The information gained from the Blackbeard East and Lafitte wells will enable us to develop plans for future operations at Blackbeard West. As previously reported, the Blackbeard West ultra-deep exploratory well on South Timbalier Block 168 was drilled to 32,997 feet in 2008. Logs indicated four potential hydrocarbon bearing zones that require further evaluation, and the well was temporarily abandoned. In May 2009, the Bureau of Ocean Energy Management granted our request for a
geophysical Suspension of Operations (SOO) to extend our Blackbeard West leases in the Blackbeard area. The SOO is allowing us to evaluate whether to drill deeper at Blackbeard West, drill an offset location or complete the well to test the existing zones. Our investment in the Blackbeard West well totaled $31.3 million at June 30, 2010.
Acreage Position
As of June 30, 2010, we owned or controlled interests in 328 oil and gas leases in the Gulf of Mexico and onshore Louisiana and Texas covering 0.99 million gross acres (0.48 million acres net to our interest). Our acreage position on the outer continental shelf of the Gulf of Mexico includes 0.80 million gross acres (0.42 million acres net to our interest). Less than 0.1 million of our net leasehold interests are scheduled to expire in the remainder of 2010. A portion of these expirations are held under SOO approvals from the MMS. We also hold potential reversionary interests in oil and gas leases that we have farmed-out or sold to other oil and gas exploration companies. Interest in these leases will partially revert to us upon the achievement of specified production thresholds or the achievemen t of specified net production proceeds.
RESULTS OF OPERATIONS
Our second quarter 2010 operating loss of $5.2 million reflects (a) impairment charges of $13.7 million for certain fields to reduce their net carrying value to fair value; (b) $2.9 million in charges to exploration expense primarily related to the Blueberry Hill appraisal well; (c) $1.9 million of inducement payments related to our 8% Convertible Perpetual Preferred Stock (8% preferred stock); and (d) $0.5 million of net losses on oil and gas derivative contracts (Note 4). These charges are partially offset by (a) a $9.2 million gain associated with our share of a partial payment for insured losses related to the September 2008 hurricanes and (b) a $3.5 million gain on the sale of an oil and gas property.
Our operating loss of $46.5 million for the six months ended June 30, 2010 reflects (a) impairment charges of $70.7 million for certain fields to reduce their net carrying value to fair value; (b) $10.8 million of inducement payments related to our 8% preferred stock; and (c) $7.5 million in charges to exploration expense primarily related to the Blueberry Hill appraisal well. These charges are offset by (a) a $9.2 million gain associated with our share of a partial payment for insured losses related to the September 2008 hurricanes; (b) a $3.5 million gain on the sale of an oil and gas property; and (c) $3.3 million of net gains on oil and gas derivative contracts (Note 4).
Our second quarter 2009 operating loss of $87.3 million reflects (a) $38.1 million in charges to exploration expense primarily relating to the Ammazzo and Cordage exploration wells which were determined to be non-productive; (b) impairment charges of $14.6 million for certain fields to reduce their net carrying value to fair value; and (c) $3.0 million of net losses on oil and gas derivative contracts (Note 4).
Our operating loss for the six months ended June 30, 2009 of $136.4 million reflects (a) $54.4 million in charges to exploration expense primarily relating to exploration wells which were determined to be non-productive; and (b) impairment charges of $53.5 million for certain fields to reduce their net carrying value to fair value. These charges are offset by (a) an $18.7 million gain associated with our share of the initial receipt of insurance proceeds related to the September 2008 hurricanes and (b) $15.9 million of net gains on oil and gas derivative contracts (Note 4).
Summarized operating data are as follows:
| | Second Quarter | | Six Months | |
| | 2010 | | 2009 | | 2010 | | 2009 | |
| Sales volumes: | | | | | | | | |
| Gas (thousand cubic feet, or Mcf) | 9,802,800 | | 11,206,000 | | 21,041,600 | | 23,371,600 | |
| Oil (barrels) | 626,400 | | 751,500 | | 1,317,900 | | 1,500,700 | |
Plant products (per Mcf equivalent) a | 1,447,600 | | 1,301,700 | | 3,196,600 | | 2,419,800 | |
Average realizations b | | | | | | | | |
| Gas (per Mcf) | $ 4.66 | | $ 3.92 | | $ 5.12 | | $ 4.42 | |
| Oil (per barrel) | 76.20 | | 58.24 | | 76.28 | | 49.59 | |
| a. | Results include approximately $10.6 million and $24.5 million of revenues associated with plant products (ethane, propane, butane, etc.) during the second quarter and six months ended June 30, 2010, respectively. Plant product revenues for the comparable prior year periods totaled $6.2 million and $11.2 million. One Mcf equivalent is determined using the ratio of six Mcf of natural gas to one barrel of crude oil, condensate or natural gas liquids. |
| b. | Excludes the impact of gains and losses on derivative contracts. |
Oil and Gas Operations
Revenues. A summary of increases (decreases) in our oil and natural gas revenues between the periods follows (in thousands):
| | Second | | | Six | |
| | Quarter | | | Months | |
| Oil and natural gas revenues – prior year period | $ | 94,065 | | $ | 189,147 | |
| Increase (decrease) | | | | | | |
| Price realizations: | | | | | | |
| Natural gas | | 7,254 | | | 14,729 | |
| Oil and condensate | | 11,250 | | | 35,175 | |
| Sales volumes: | | | | | | |
| Natural gas | | (5,501 | ) | | (10,299 | ) |
| Oil and condensate | | (7,286 | ) | | (9,065 | ) |
| Plant products revenues | | 4,410 | | | 13,301 | |
| Other | | (89 | ) | | (39 | ) |
| Oil and natural gas revenues – current year period | $ | 104,103 | | $ | 232,949 | |
Our oil and natural gas sales volumes totaled 15.0 billion cubic feet of natural gas equivalent (Bcfe) in the second quarter of 2010, a 12 percent decrease from the 17.0 Bcfe of sales volume generated in the second quarter of 2009. Average realizations received for both oil and natural gas sold during the second quarter of 2010 increased 31 percent for oil and 19 percent for natural gas compared to amounts received in 2009 (see “—North American Natural Gas and Oil Market Environment” above). Revenues from plant products totaled $10.6 million in the second quarter of 2010 compared with $6.2 million in the prior year period. Our service revenues totaled $3.9 million in the second quarter of 2010 and $2.5 million in the same period for 2009.
Our oil and natural gas sales volumes totaled 32.1 Bcfe and 34.8 Bcfe in the six months ended June 30, 2010 and 2009, respectively. Average realizations received for both oil and natural gas sold during the six months ended June 30, 2010 increased 54 percent for oil and 16 percent for natural gas compared to amounts received in 2009 (see “—North American Natural Gas and Oil Market Environment” above). Revenues from plant products totaled $24.5 million in the six months ended June 30, 2010 compared with $11.2 million in the prior year period. Our service revenues totaled $7.6 million in the six months ended June 30, 2010 and $4.8 million in the same period for 2009.
Production and delivery costs. The following table reflects our production and delivery costs for the second quarter and six months ended June 30, 2010 and 2009 (in millions, except per Mcfe amounts):
| | Second Quarter | | Six Months | |
| | | | Per | | | | Per | | | | Per | | | | Per | |
| | 2010 | | Mcfe | | 2009 | | Mcfe | | 2010 | | Mcfe | | 2009 | | Mcfe | |
| Lease operating expense | $26.8 | | $1.79 | | $29.1 | | $1.71 | | $53.8 | | $1.67 | | $56.0 | | $1.60 | |
| Workover costs | 5.3 | | 0.35 | | 5.1 | | 0.30 | | 7.6 | | 0.24 | | 7.0 | | 0.20 | |
| Hurricane related expenses | 2.1 | | 0.14 | | 3.8 | | 0.23 | | 2.6 | | 0.08 | | 14.7 | | 0.42 | |
| Insurance | 6.5 | | 0.43 | | 5.6 | | 0.33 | | 13.3 | | 0.41 | | 11.3 | | 0.33 | |
| Transportation and production taxes | 5.3 | | 0.35 | | 4.8 | | 0.28 | | 11.7 | | 0.37 | | 9.2 | | 0.27 | |
| Other | 0.4 | | 0.03 | | 0.4 | | 0.02 | | 0.2 | | 0.01 | | (0.4 | ) | (0.01 | ) |
| Total production and delivery costs | $46.4 | | $3.09 | | $48.8 | | $2.87 | | $89.2 | | $2.78 | | $97.8 | | $2.81 | |
Lease operating expense declined approximately $2.3 million and $2.2 million, respectively, in the second quarter and six months ended June 30, 2010 from the comparable prior periods primarily related to the 12 percent decline in second quarter 2010 sales volumes. Hurricane related expenses declined from the prior periods because of the significant amount of hurricane repair work completed in early 2009 following the September 2008 hurricane events. Transportation and production taxes increased over the prior periods primarily related to increased production at larger fields which have higher transportation charges as well as the timing of revised cost allocations received from third party processors.
Insurance premium rates associated with our operations in the Gulf of Mexico have increased in recent years because of the impact of hurricanes and other operational risks on the insurance market. We recently renewed our property insurance program for coverage through May 2011 and purchased similar coverage to the previous year for a nominal increase in costs. The policy includes coverage for damages caused by Named Windstorms subject to recovery of 50 percent of any loss up to an annual aggregate limit of $100 million, in excess of a $50 million deductible. We also purchased operational risk coverage for losses resulting from perils other than Named Windstorms such as well blowouts, fire and explosion. The control of well coverage, subject to a $5 million deductible, has a limit of $150 millio n for all wells except ultra-deep wells which have a $250 million limit. We also renewed our Oil Spill Financial Responsibility policy coverage which has a $150 million limit. For additional information related to risks associated with our insurance coverage, see Item 1A. “Risk Factors” included in our 2009 Form 10-K.
Depletion, depreciation and amortization expense. The following table reflects the components of our depletion, depreciation and amortization (DD&A) expense for the second quarter and six months ended June 30, 2010 and 2009 (in millions, except per Mcfe amounts):
| | Second Quarter | | Six Months |
| | | | Per | | | | Per | | | | Per | | | | Per |
| | 2010 | | Mcfe | | 2009 | | Mcfe | | 2010 | | Mcfe | | 2009 | | Mcfe |
| Depletion and depreciation expense | $39.9 | | $2.66 | | $51.0 | | $2.99 | | $86.4 | | $2.69 | | $97.4 | | $2.80 |
| Accretion expense | 4.3 | | 0.28 | | 8.4 | | 0.50 | | 9.0 | | 0.28 | | 16.5 | | 0.47 |
| Impairment charges/losses | 13.7 | | 0.92 | | 14.6 | | 0.86 | | 70.7 | | 2.20 | | 53.5 | | 1.54 |
| Total | $57.9 | | $3.86 | | $74.0 | | $4.35 | | $166.1 | | $5.17 | | $167.4 | | $4.81 |
Our depletion, depreciation and amortization rates are directly affected by estimates of proved reserve quantities, which are subject to revisions over time as changes in reserve estimates and fluctuations in the recorded amounts of property, plant and equipment and asset retirement obligations occur. Reductions in the amounts of depletion and depreciation expense for the second quarter and six months ended June 30, 2010 from the comparable prior periods primarily reflect the impact of lower sales volumes in the second quarter of 2010.
Accounting rules require the carrying value of proved oil and gas property costs to be assessed for possible impairment under certain circumstances and reduced to fair value by a charge to earnings if impairment is deemed to have occurred. Conditions affecting current and estimated future cash flows that could require impairment charges include, but are not limited to, lower than anticipated oil and natural gas prices, decreased production, increased development, production and reclamation costs and downward revisions of reserve estimates. Due to the decline in market prices for oil and natural gas and negative reserve revisions resulting from well performance issues encountered at certain properties, we recorded
impairment charges of $13.7 million and $70.7 million, respectively, in the second quarter and six months ended June 30, 2010 (Note 6). We recorded impairment charges of $14.6 million and $53.5 million, respectively, in the second quarter and six months ended June 30, 2009.
As more fully explained in Part I, Item 1A, “Risk Factors” in our 2009 Form 10-K any one or more of the conditions described above could require additional impairment charges to be recorded in future periods.
Exploration Expenses. Summarized exploration expenses are as follows (in millions):
| | Second Quarter | | Six Months | |
| | 2010 | | 2009 | | 2010 | | 2009 | |
| Geological and geophysical | | | | | | | | | | | | |
including 3-D seismic purchases a | $ | 2.0 | | $ | 6.9 | | $ | 9.0 | | $ | 16.8 | |
| Non-productive exploratory costs, including | | | | | | | | | | | | |
| related lease costs | | 2.9 | b | | 38.1 | c | | 7.5 | b | | 54.4 | c |
| Other | | 5.5 | d | | 1.8 | | | 6.3 | d | | 4.1 | |
| | $ | 10.4 | | $ | 46.8 | | $ | 22.8 | | $ | 75.3 | |
| a. | Includes compensation costs associated with outstanding stock-based awards totaling $1.3 million in the second quarter of 2010 and $5.9 million in the six months ended June 30, 2010 compared with $1.3 million and $4.4 million of compensation costs during comparable periods in 2009 (see “Stock-Based Compensation” below). |
| b. | Includes costs of the Blueberry Hill offset appraisal well incurred below 19,000 feet. Results below 19,000 feet were determined to be non-commercial, and we commenced sidetracking efforts in April 2010 to a location southwest of the pay sands seen in 2009. |
| c. | Includes non-productive well costs of $24.4 million related to the Ammazzo well and $11.0 million related to the Cordage well in the second quarter of 2009 as well as $10.8 million related to the Tom Sauk well and $5.4 million related to the Gladstone East well in the first quarter of 2009. |
| d. | Includes $4.4 million of insurance costs attributable to our exploration drilling activities. |
Other Financial Results
Operating
General and administrative expense totaled $10.4 million in the second quarter of 2010 and $24.1 million for the six months ended June 30, 2010 compared with $10.9 million in the second quarter of 2009 and $23.4 million for the six months ended June 30, 2009. We charged $1.6 million of related stock-based compensation costs to general and administrative expense during the second quarter of 2010 and $6.5 million for the six months ended June 30, 2010 compared to $1.4 million and $4.6 million for the comparable periods in 2009 (see “Stock-Based Compensation” below).
In the second quarter and six months ended June 30, 2010, we recorded net $0.5 million in losses and $3.3 million in gains, respectively, associated with our oil and gas derivative contracts as compared to net $3.0 million in losses and $15.9 million in gains, respectively, in the same periods of 2009. The variance resulted from changes in commodity prices and the resulting mark-to-market impact that such changes had with respect to our derivative contract positions during the respective periods.
Hurricanes Gustav and Ike disrupted our Gulf of Mexico operations prior to making landfall on the Louisiana and Texas coasts in September 2008. There was no significant damage to our properties resulting from Hurricane Gustav. Assessments following Hurricane Ike identified several platforms with significant structural damage. We expect to realize a substantial recovery in future periods under our insurance program for a large portion of these hurricane related costs, reimbursement for which is received after damage-related expenditures are funded and related claims are approved. We received net insurance proceeds of $9.2 million in the second quarter and six months ended June 30, 2010 and $18.7 million in the six months ended June 30, 2009.
In the second quarter and six months ended June 30, 2010, we recorded a $3.5 million gain on the sale of one of our Gulf of Mexico oil and gas properties.
Stock-Based Compensation. Compensation cost charged against earnings for stock-based awards is as follows (in thousands):
| | Second Quarter | | Six Months | |
| | 2010 | | 2009 | | 2010 | | 2009 | |
| General and administrative expenses | $ | 1,594 | | $ | 1,446 | | $ | 6,524 | | $ | 4,566 | |
| Exploration expenses | | 1,324 | | | 1,309 | | | 5,919 | | | 4,355 | |
Main Pass Energy Hub™ start-up costs | | 51 | | | 78 | | | 214 | | | 259 | |
| Total stock-based compensation cost | $ | 2,969 | | $ | 2,833 | | $ | 12,657 | | $ | 9,180 | |
| | | | | | | | | | | | | |
On February 1, 2010, our Board of Directors granted a total of 1,766,500 stock options to our employees at an exercise price of $15.73 per share, including immediately exercisable options for an aggregate of 445,000 shares. Options representing 400,000 of these 445,000 shares were issued to our Co-Chairmen in lieu of cash compensation in 2010. We recorded $6.7 million in charges related to immediately vested stock options in the first quarter of 2010. These charges included the compensation costs associated with the immediately exercisable options and the compensation costs related to stock options granted to retiree-eligible employees, which resulted in one-year’s compensation expense being immediately recognized at the effective date of the stock option grant. The weighted average per s hare value of the 1,816,500 options granted during the six months ended June 30, 2010 was $10.18.
Our Board of Directors granted a total of 1,815,500 stock options to our employees at an exercise price of $6.44 per share on February 2, 2009. We recorded $2.9 million in charges related to immediately vested stock options in the first quarter of 2009. The weighted average per share value of the 1,855,500 options granted in the six months ended June 30, 2009 was $3.98.
As of June 30, 2010, total compensation cost related to unvested, approved stock option awards not yet recognized in earnings was approximately $21.4 million, which is expected to be recognized over a weighted average period of approximately one year.
Non-Operating
Interest expense, net of capitalized interest, totaled $9.9 million in the second quarter of 2010 and $20.4 million for the six months ended June 30, 2010 compared with $10.3 million in the second quarter of 2009 and $20.9 million for the six months ended June 30, 2009. Capitalized interest totaled $1.9 million in the second quarter of 2010, $1.5 million in the second quarter of 2009, $3.1 million for the six months ended June 30, 2010 and $2.4 million for the six months ended June 30, 2009.
Other income totaled less than $0.1 million in the second quarter of 2010 and $0.1 million for the six months ended June 30, 2010. Other income totaled $2.8 million in the second quarter of 2009 and $3.2 million for six months ended June 30, 2009. Other income in 2009 includes a $2.7 million gain related to the settlement of a contingency associated with the 2007 oil and gas property acquisition.
In February 2010, the Obama Administration released its fiscal year 2011 budget including proposals that, if enacted, could result in significant changes with respect to oil and gas income taxation. See our 2009 Form 10-K for further discussion on the Administration’s fiscal year 2011 budget proposal.
Discontinued Operations
Our discontinued operations resulted in a net loss of $1.4 million in the second quarter of 2010 and $3.1 million for the six months ended June 30, 2010 compared with losses of $3.1 million in the second quarter of 2009 and $4.1 million for the six months ended June 30, 2009. We recorded $2.0 million in the second quarter and six months ended June 30, 2009 related to certain environmental remediation activities at our inactive Port Sulphur, Louisiana facility. Future estimated closure costs for these facilities approximate $14.6 million, the funds for which are expected to be expended over the next two years.
CAPITAL RESOURCES AND LIQUIDITY
The table below summarizes our cash flow information by categorizing the information as cash provided by or (used in) operating activities, investing activities and financing activities and distinguishing between our continuing operations and discontinued operations (in millions):
| | Six Months Ended | |
| | June 30, | |
| | 2010 | | 2009 | |
| Continuing operations | | | | | | |
| Operating | $ | 93.7 | | $ | 55.2 | |
| Investing | | (98.5 | ) | | (84.3 | ) |
| Financing | | (17.4 | ) | | 162.8 | |
| | | | | | | |
| Discontinued operations | | | | | | |
| Operating | | (2.2 | ) | | (1.7 | ) |
| Investing | | - | | | - | |
| Financing | | - | | | - | |
| | | | | | | |
| Total cash flow | | | | | | |
| Operating | | 91.5 | | | 53.5 | |
| Investing | | (98.5 | ) | | (84.3 | ) |
| Financing | | (17.4 | ) | | 162.8 | |
Six-Month 2010 Cash Flows Compared with Six-Month 2009
Operating Cash Flows
Operating cash flow increased $38.0 million for the six months ended June 30, 2010 compared to the same period in 2009 primarily because of $46.6 million of higher revenue realizations, $8.6 million of lower production and delivery costs, $5.5 million of lower geological, geophysical and other costs, and $29.5 million of positive working capital fluctuations between comparable periods. These cash inflows were partially offset by $27.5 million of lower realized derivative gains, $16.1 million of higher reclamation expenditures and $17.8 million of lower insurance reimbursements received in the six months ended June 30, 2010.
Investing Cash Flows
Our investing cash flows reflect exploration, development and other capital expenditures associated with our oil and gas activities (see “Oil and Gas Activities” above). Our exploration, development and other capital expenditures totaled $101.4 million for the first half of 2010 and $84.3 million for the first half of 2009. We received proceeds of $2.9 million from the sale of an oil and gas property during the six months ended June 30, 2010.
Financing Cash Flows
Our financing cash flows included payments of dividends and inducement payments on our 8% preferred stock and 6¾% mandatory convertible preferred stock (6¾% preferred stock) totaling $17.6 million during the six months ended June 30, 2010. During this period, we agreed through privately negotiated transactions to induce the conversion of approximately 57,200 shares of 8% preferred stock into approximately 8.4 million shares of common stock (see “Equity Transactions” below).
Our financing cash flows during the first half of 2009 reflect the net proceeds of $168.2 million from the sale of 15.5 million shares of our common stock and 86,250 shares of $1,000 par value 8% preferred stock. We paid dividends on preferred stock of $5.4 million in the six months ended June 30, 2009.
Senior Secured Revolving Credit Facility
Our variable rate senior secured revolving credit facility (credit facility) is secured by substantially all of MOXY’s oil and gas properties and matures in August 2012. The borrowing capacity was $175
million at June 30, 2010. Although we had no borrowings outstanding under the credit facility during the quarter ended June 30, 2010, a letter of credit in the amount of $100 million is outstanding under the credit facility to support the reclamation obligations assumed in the 2007 oil and gas property acquisition, reducing the remaining availability under the facility to $75 million (Note 9 of the 2009 Form 10-K).
Availability under the credit facility is subject to a borrowing base, which is determined semi-annually each April 1 and October 1. Our bank group completed its redetermination of the borrowing base during the second quarter of 2010 and the borrowing capacity was maintained at $175 million.
The credit facility contains covenants and other restrictions customary for oil and gas borrowing base credit facilities. We were in compliance with these covenants at June 30, 2010.
Equity Transactions
During the second quarter ended June 30, 2010, we privately negotiated the induced conversion of approximately 9,600 shares of our 8% preferred stock with a liquidation preference of $9.6 million into approximately 1.4 million shares of our common stock (at a conversion rate equal to 146.1454 shares of common stock per share of 8% preferred stock). To induce the early conversions of these shares of 8% preferred stock, we paid an aggregate of $1.9 million in cash to the holders of these shares which is included as a charge in our consolidated statements of operations as preferred dividends and inducement payments for early conversion of convertible preferred stock. We induced conversion of approximately 57,200 shares of our 8% preferred stock with a liquidation preference of $57.2 million into approximately 8.4 milli on shares of our common stock during the six months ended June 30, 2010. We paid an aggregate of $10.8 million in cash to the holders of these shares during the six months ended June 30, 2010 to induce the early conversions of these shares. Subsequent to June 30, 2010, we induced the conversion of an additional 7,000 shares of our 8% preferred stock which converted into approximately 1.0 million shares of our common stock. Following these transactions, approximately 22,100 shares of our 8% preferred stock remain outstanding. Annual preferred dividend savings following transactions in the second quarter of 2010 and the transactions occurring subsequent to June 30, 2010 approximate $1.3 million.
We have 1,589,340 shares of our 6¾% preferred stock ($158.9 million liquidation preference) which will automatically convert on November 15, 2010 into between approximately 10.7 million and 12.8 million common shares. The conversion rate depends on the applicable average closing market price of our common stock over the 20-trading-day period beginning on October 14, 2010, and ending on November 10, 2010. If the applicable average closing market price of our common stock is above $14.88, then the conversion rate per $100 face amount of the 6¾% preferred stock will be 6.7204. The conversion rate would be 8.0645 if the applicable average closing market price of our common stock is below $12.40. For average common stock prices greater than or equal to $12.40 and equal to or less than $14.88, the conversion rate will be equal to $10 0 divided by our average closing common stock price during the 20-trading-day period.
MAIN PASS ENERGY HUBTM PROJECT
Our long-term business objectives may include the pursuit of a multifaceted energy services development of the MPEHtm project, including the potential development of an LNG regasification and storage facility through Freeport Energy. As of June 30, 2010, we have incurred approximately $52.1 million of cumulative cash costs associated with our pursuit of the establishment of MPEHtm, including $0.4 million in the six months ended June 30, 2010. As of June 30, 2010, we have recognized a liability of $11.6 million relating to the future reclamation of the MPEHtm related facilities. The actual amount and timing of the obligation for reclamation of these structures is dependent on the success of our efforts to use these facilities at the MPEHtm project.
We will require commercial arrangements for the MPEHtm project to obtain financing, which may be in the form of additional debt and/or equity transactions. The ultimate outcome of our efforts to enter into commercial arrangements on reasonable terms to develop the MPEHtm project and obtain additional financing is subject to various uncertainties, many of which are beyond our control. Commercialization of the project has been adversely affected by increased domestic supplies of natural gas, excess LNG re-gasification capacity and general market conditions.
For additional information regarding the MPEHtm project, see “Main Pass Energy Hubtm Project” in Part 1, Items 1. and 2. “Business and Properties” in our 2009 Form 10-K.
NEW ACCOUNTING STANDARDS
See Note 8 for information regarding our adoption of new accounting standards. We do not expect the adoption of any accounting standards in 2010 to have a material impact to our financial statements.
CAUTIONARY STATEMENT
Management’s Discussion and Analysis of Financial Condition and Results of Operations contain forward-looking statements in which we discuss certain of our expectations regarding future operational and financial performance. Forward-looking statements are all statements other than statements of historical facts, such as those statements regarding potential oil and gas discoveries, projected oil and gas exploration, development and production activities and costs, amounts and timing of capital expenditures, reclamation, indemnification and environmental obligations and costs, potential quarterly and annual production rates, reserve estimates, and projected operating cash flows and liquidity. The words “anticipates,” “may,” “can,” “pl ans,” “believes,” “estimates,” “expects,” “projects,” “intends,” “likely,” “will,” “should,” “to be,” and any similar expressions and/or statements that are not historical facts, in each case as they relate to us or our management, are intended to identify those assertions as forward-looking statements.
In making any forward-looking statements, the person making them believes that the expectations are based on reasonable assumptions. We caution readers that those statements are not guarantees of future performance, and our actual results may differ materially from those anticipated, projected or assumed in the forward-looking statements. Important factors that can cause our actual results to differ materially from those anticipated in the forward-looking statements include adverse conditions such as high temperature and pressure that could lead to mechanical failures or increased costs, variations in the market prices of oil and natural gas, drilling results, unanticipated fluctuations in flow rates of producing wells due to mechanical or operational issues (including those experienced by wells operated by third parties where McMoRan is a participant), oil and natural gas reserve expectations, the potential adoption of new governmental regulations, failure of third party partners to fulfill their commitments, the ability to hold current or future lease acreage rights, the ability to satisfy future cash obligations and environmental costs, access to capital to fund drilling activities, other general exploration and development risks and hazards inherent in the production of oil and natural gas and other factors described in more detail in Part I, Item 1A. “Risk Factors” included in our 2009 Form 10-K.
Investors are cautioned that many of the assumptions upon which our forward-looking statements are based are likely to change after our forward-looking statements are made, including for example the market prices of oil and natural gas, which we cannot control, and production volumes and costs, some aspects of which we may or may not be able to control. Further, during the quarter, we may make changes to our business plans that could or will affect our results for the quarter. We caution investors that we do not intend to update our forward-looking statements more frequently than quarterly, notwithstanding any changes in our assumptions, changes in our business plans, our actual experience, or other changes, and we undertake no obligation to update any forward-looking statements.
–––––––––––––––––––––––––
There have been no significant changes in these disclosures since the year ended December 31, 2009.
(a) Evaluation of disclosure controls and procedures. Our chief executive officer and chief financial officer, with the participation of management, have evaluated the effectiveness of our “disclosure controls and procedures” (as defined in Rules 13a-15(e) and 15d-15(e) under the Securities Exchange Act of 1934) as of the end of the period covered by this quarterly report on Form 10-Q. Based on their evaluation, they have concluded that our disclosure controls and procedures are effective as of the end of the period covered by this report.
(b) Changes in internal controls. There has been no change in our internal control over financial reporting that occurred during the second quarter ended June 30, 2010 that has materially affected, or is reasonably likely to materially affect our internal controls over financial reporting.
We may from time to time be involved in various legal proceedings of a character normally incident to the ordinary course of our business. We believe that potential liability from any of these pending or threatened proceedings will not have a material adverse effect on our financial condition or results of operations. We maintain liability insurance to cover some, but not all, of the potential liabilities normally incident to the ordinary course of our businesses as well as other insurance coverage customary in our business, with coverage limits as we deem prudent at an acceptable cost.
There have been no material changes from the risk factors disclosed in Part 1, Item 1A. Risk Factors of our 2009 Form 10-K, other than the following:
The catastrophic explosion of the Deepwater Horizon in the Gulf of Mexico will likely result in new governmental regulations relating to drilling, exploration and production activities in U.S. coastal waters, which could adversely affect our operations.
In April 2010, the Deepwater Horizon, an offshore drilling rig located in the deepwater of the Gulf of Mexico, sank following a catastrophic explosion and fire, which has significantly and adversely disrupted oil & gas exploration activities in the Gulf of Mexico. The duration of this disruption is currently unknown. The President has appointed a commission that is studying the causes of the catastrophe for the purpose of recommending to the President what legislative or regulatory measures should be taken in order to minimize the possibility of a reoccurrence of a disastrous oil spill. Pending the completion of that report, the United States government has imposed a suspension of all deepwater drilling and exploration activity in the Gulf of Mexico through November 30, 2010. V arious bills are being considered by Congress which, if enacted, could either significantly increase the costs of conducting drilling and exploration activities in the Gulf of Mexico, particularly in deepwater, or substantially curtail Gulf of Mexico drilling and operation activity.
Our operations are focused on the shelf of the Gulf of Mexico and Gulf Coast areas, where we maintain one of the largest acreage positions in the shallow waters of this region and have a significant number of ongoing exploration and development projects. We do not operate in the deepwater of the Gulf of Mexico. However, although exploration activity in the shallow waters of the Gulf of Mexico has been allowed to re-commence, a de facto suspension has existed in that market, as new safety and permitting requirements have been imposed on shallow water operators, and only a limited number of new drilling permits have been issued to shallow water operators since the catastrophe.
There are a number of uncertainties affecting the oil and gas industry in the aftermath of the Deepwater Horizon events, including the possible increase or elimination of the current $75 million cap for non-reclamation liabilities under the Oil Pollution Act of 1990, the continued availability and affordability of insurance for drilling and exploration activities, the overall legislative and regulatory response to the
catastrophe, and the ability to obtain drilling permits in the shallow water on a timely basis. Although the eventual outcome of these developments is currently unknown, additional regulatory and operational costs could have an adverse effect on our financial position and results of operations.
(a) The information regarding the induced conversions of our 8% preferred stock during the second quarter of 2010 included in Note 7- “8% Preferred Stock Conversions” is incorporated herein by reference.
(c) Our Board of Directors has approved an open market share purchase program for up to 2.5 million shares. The program does not have an expiration date. No shares were purchased during the three-month period ended June 30, 2010 and 0.3 million shares remain available for purchase.
The exhibits to this report are listed in the Exhibit Index appearing on page E-1 hereof.
McMoRan Exploration Co.
Pursuant to the requirements of the Securities Exchange Act of 1934, the registrant has duly caused this report to be signed on its behalf by the undersigned thereunto duly authorized.
| | McMoRan Exploration Co. |
| | |
| | By: /s/ Nancy D. Parmelee |
| | Nancy D. Parmelee |
| | Senior Vice President, Chief Financial Officer |
| | and Secretary |
| | (authorized signatory and Principal |
| | Financial Officer) |
| | |
| | |
| | |
| Date: August 9, 2010 | |
McMoRan Exploration Co.
| | | Filed | | | |
| Exhibit | | with this | Incorporated by Reference |
| Number | Exhibit Title | Form 10-Q | Form | File No. | Date Filed |
| 3.1 | Composite Certificate of Incorporation of McMoRan | | 10-Q | 001-07791 | 05/10/2010 |
| 3.2 | Amended and Restated By-Laws of McMoRan as amended effective February 1, 2010 | | 8-K | 001-07791 | 02/03/2010 |
| 10.1 | McMoRan Exploration Co. Amended and Restated 2008 Stock Incentive Plan | | 8-K | 001-07791 | 05/04/2010 |
| McMoRan Exploration Co. Amended and Restated 2004 Director Compensation Plan | X | | | |
| Letter dated August 9, 2010 from Ernst & Young LLP regarding unaudited interim financial statements | X | | | |
| Certification of Principal Executive Officer pursuant to Rule 13a–14(a)/15d-14(a) | X | | | |
| Certification of Principal Financial Officer pursuant to Rule 13a–14(a)/15d-14(a) | X | | | |
| Certification of Principal Executive Officer pursuant to 18 U.S.C. Section 1350 | X | | | |
| Certification of Principal Financial Officer pursuant to 18 U.S.C. Section 1350 | X | | | |
–––––––––––––––––––––––––
* Indicates management contract or compensatory plan or agreement.