| UNITED STATES | |||
| SECURITIES AND EXCHANGE COMMISSION | |||
| Washington, D.C. 20549 | |||
| FORM 10-Q/A | |||
| (Amendment No. 1) | |||
| (Mark One) | |||
| [X] | QUARTERLY REPORT PURSUANT TO SECTION 13 OR 15(d) OF THE | ||
| SECURITIES EXCHANGE ACT OF 1934 | |||
| For the quarterly period ended September 30, 2010 | |||
| OR | |||
| [ ] | TRANSITION REPORT PURSUANT TO SECTION 13 OR 15(d) OF THE | ||
| SECURITIES EXCHANGE ACT OF 1934 | |||
| For the transition period from | To | ||
| Commission File Number: 001-07791 | |||
| McMoRan Exploration Co. | |||
| (Exact name of registrant as specified in its charter) | |||
| Delaware | 72-1424200 |
(State or other jurisdiction of incorporation or organization) | (IRS Employer Identification No.) |
| 1615 Poydras Street | |
| New Orleans, Louisiana | 70112 |
| (Address of principal executive offices) | (Zip Code) |
| (504) 582-4000 | |
| (Registrant's telephone number, including area code) | |
Indicate by check mark whether the registrant (1) has filed all reports required to be filed by Section 13 or 15(d) of the Securities Exchange Act of 1934 during the preceding 12 months (or for such shorter period that the registrant was required to file such reports), and (2) has been subject to such filing requirements for the past 90 days. SYes o No
Indicate by check mark whether the registrant has submitted electronically and posted on its corporate Web site, if any, every Interactive Data File required to be submitted and posted pursuant to Rule 405 of Regulation S-T (§ 232.405 of this chapter) during the preceding 12 months (or for such shorter period that the registrant was required to submit and post such files). oYes oNo
Indicate by check mark whether the registrant is a large accelerated filer, an accelerated filer, a non-accelerated filer, or a smaller reporting company. See definition of “large accelerated filer,” “ accelerated filer,” and “smaller reporting company” in Rule 12b-2 of the Exchange Act:
Large accelerated filer o | Accelerated filer T |
Non-accelerated filer o (Do not check if a smaller | Smaller reporting company o |
| reporting company) |
Indicate by check mark whether the registrant is a shell company (as defined in Rule 12b-2 of the Exchange Act. oYes S No
On October 31, 2010, there were issued and outstanding 95,477,937 shares of the registrant’s Common Stock, par value $0.01 per share.
Explanatory Note
McMoRan Exploration Co. (McMoRan) is filing this Amendment No. 1 on Form 10-Q/A (this Amendment) to its Quarterly Report on Form 10-Q for the quarter ended September 30, 2010 (the Form 10-Q). The Form 10-Q was originally filed with the Securities and Exchange Commission (SEC) on November 9, 2010. The purpose of this Amendment is to correct inadvertent typographical errors related to drilling depths of McMoRan’s Blackbeard East ultra-deep exploration well previously disclosed in the fifth paragraph under Item 2. “Management’s Discussion and Analysis of Financial Condition and Results of Operations– Operational Activities – Oil and Gas Activities–Shallow Water, Ultra-deep Exploration Activities” of Part I of the Form 10-Q.
As required by Rule 12b-15 under the Securities Exchange Act of 1934, McMoRan has set forth in this Amendment the complete text of Part I, Item 2, as amended. This Amendment does not change any other information set forth in the Form 10-Q.
As a result of this Amendment, McMoRan is also including updated exhibits with respect to the certifications required under Section 302 and Section 906 of the Sarbanes-Oxley Act of 2002 and the acknowledgement letter from Ernst & Young LLP regarding unaudited interim financial information.
This Amendment does not reflect events occurring after the date of the Form 10-Q nor does it modify or update the disclosure contained in the Form 10-Q in any way other than as required to reflect the amendments discussed above and reflected below. Accordingly, this Amendment should be read in conjunction with the Form 10-Q.
McMoRan Exploration Co.
Quarterly Report on Form 10-Q/A for
the Quarter ended September 30, 2010
| Page | |
| Part I | |
| 1 | |
| Part II | |
| 16 | |
| 17 | |
| 18 | |
2
OVERVIEW
In management’s discussion and analysis “we,” “us,” and “our” refer to McMoRan Exploration Co. and its wholly owned consolidated subsidiaries, McMoRan Oil & Gas LLC (MOXY) and Freeport-McMoRan Energy LLC (Freeport Energy). You should read the following discussions in conjunction with our consolidated financial statements, the related discussion and analysis of financial condition and results of operations and our discussion of “Business and Properties” in our Annual Report on Form 10-K for the year ended December 31, 2009 (2009 Form 10-K) filed with the Securities and Exchange Commission. The results of operations reported and summarized below are not necessarily indicative of future operating results. Unless otherwise specified, all refere nces to Notes refers to Notes to Consolidated Financial Statements included elsewhere in this Form 10-Q. Also see the 2009 Form 10-K for a glossary of definitions for some of the oil and gas industry terms we use in this Form 10-Q.
We engage in the exploration, development and production of oil and natural gas in the shallow waters of the Gulf of Mexico and onshore in the Gulf Coast area. Our exploration strategy is focused on the “deep gas play,” drilling to depths of 15,000 to 25,000 feet in the shallow waters of the Gulf of Mexico and Gulf Coast area to target large structures in the Deep Miocene, and on the “ultra-deep play” in the shallow waters at depths below 25,000 feet. We are one of the largest acreage holders on the Shelf of the Gulf of Mexico and onshore in the Gulf Coast area and have rights to approximately 1.0 million gross acres, including over 200,000 gross acres associated with the ultra-deep gas play below the salt weld. We do not operate in the deepwater Gulf of Mexico. Our focused strategy enables u s to make efficient use of our geological, engineering and production strengths in these areas where we have more than 35 years of operating experience. We also believe that the scale of our operations in the Gulf of Mexico allows us to realize certain operating synergies and provides a strong platform from which to pursue our business strategy. Our oil and gas operations are conducted through MOXY, our principal operating subsidiary.
On September 20, 2010, we announced an agreement to acquire Plains Exploration and Production Company’s (PXP) shallow water Gulf of Mexico Shelf assets for a combination of stock and cash. Under the terms of the transaction, we will issue 51 million shares of our common stock and pay $75 million in cash to PXP to acquire all of PXP’s interests and exploration rights in the shallow waters of the Shelf of the Gulf of Mexico.
The transaction will increase our scale of operations on the Gulf of Mexico shelf, consolidate our ownership in core focus areas, expand our participation in future production from our deep gas and ultra-deep exploration and development programs and increase current reserves and production. In addition, we will continue to benefit from our positive relationship with PXP through PXP’s significant shareholding position in our company.
The closing of the acquisition is subject to our stockholder approval of the issuance of common stock to PXP, as required by New York Stock Exchange (NYSE) rules, the completion of financing transactions, receipt of regulatory approvals and other customary closing conditions. Early termination of the waiting period under the Hart-Scott-Rodino Act was granted in mid-October. Preliminary proxy materials related to our stockholder meeting were filed with the Securities and Exchange Commission (SEC) on October 5, 2010. We expect to hold the stockholder meeting and close the acquisition by year-end 2010.
We also announced that we will privately issue $900 million in equity-linked securities to fund future capital expenditures associated with our expanded asset base and for general corporate purposes. The financing includes $400 million in investments from institutional investors and $500 million from Freeport-McMoRan Copper & Gold Inc. (FCX). We are a party to a services agreement with FM Services Company (Services Company), a wholly owned subsidiary of FCX, under which the Services Company provides us with executive, technical, administrative, accounting, financial, tax and other services pursuant to a fixed fee arrangement. See Footnote 15 of our 2009 Form 10-K for more information regarding transactions with the Services Company.
3
During the nine months ended September 30, 2010, we invested $160.3 million on capital-related projects primarily associated with our exploration activities. Our exploration, development and other capital expenditures for 2010 are expected to approximate $220 million, including approximately $140 million in exploration costs and $80 million in development costs. During the nine months ended September 30, 2010, we incurred $70.8 million of abandonment expenditures, net of prepayments by third parties. We plan to spend approximately $110 million in 2010 for the abandonment and removal of oil and gas structures in the Gulf of Mexico, including $50 million associated with hurricane damage reclamation for which we expect reimbursement under our insurance program.
Capital spending will continue to be driven by exploration and development opportunities and managed based on market conditions. We plan to fund our capital spending through available cash, cash flow from operations, participation by partners in exploration and development projects and the recently announced new financings. We continue to monitor the global financial and credit markets, as well as the fluctuations in oil and natural gas market prices, all of which have been widely publicized and may ultimately have a material effect on one or more facets of our business and overall business strategy. For additional information, see Part 1, Item 1A. “Risk Factors” included in our 2009 Form 10-K and Part II, Item 1A. “Risk Factors” included in this report on Form 10-Q.
North American Natural Gas and Oil Market Environment
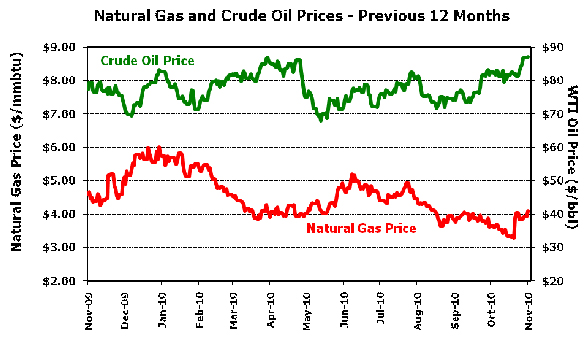
Our current production volume is comprised of approximately 75 percent natural gas and 25 percent oil. As a result, our revenues are generally more sensitive to changes in the market price of natural gas than to changes in the market price of oil. North American natural gas averaged $4.24 per MMbtu during the third quarter of 2010. The spot price for natural gas was $4.09 per MMbtu on November 8, 2010. The average oil price for the third quarter of 2010 was $76.09 per barrel and the spot price for oil was $87.06 per barrel on November 8, 2010. Future oil and natural gas prices are subject to change and these changes are not within our control (see Part 1, Item 1A. “Risk Factors” included in our 2009 Form 10-K).
OPERATIONAL ACTIVITIES
Production Update
Third-quarter 2010 production averaged 146 MMcfe/d net to us, compared with 215 MMcfe/d in the third quarter of 2009. Production is expected to average approximately 140 MMcfe/d in the fourth quarter of 2010 and 160 MMcfe/d for the year. These estimates exclude production from recent discoveries and from the properties to be acquired from PXP, which averaged 45 MMcfe/d in
4
the third quarter of 2010. Our estimated production rates are dependent on the timing of planned recompletions, production performance and other factors.
Production from the Flatrock field averaged a gross rate of approximately 182 MMcfe/d (34 MMcfe/d net to us) in the third quarter of 2010. The operator successfully recompleted the #230 well to an up hole zone in the third quarter of 2010 and plans to recomplete the #229 well in the fourth quarter of 2010. We currently own a 25.0 percent working interest in Flatrock. Upon completion of the PXP property acquisition, our working interest in Flatrock would increase from 25.0 percent to 55.0 percent.
Oil and Gas Activities
On April 20, 2010, the Deepwater Horizon, an offshore drilling rig located in the deepwater of the Gulf of Mexico, sank following a catastrophic explosion and fire. This event significantly and adversely disrupted oil and gas exploration activities in the Gulf of Mexico and ultimately resulted in the temporary suspension of all deepwater drilling and exploration activity in the Gulf of Mexico. The suspension previously imposed by the U.S. government was lifted on October 13, 2010; however, delays in obtaining drilling permits and compliance with new safety regulations could slow activity by Gulf of Mexico operators. We have continued to advance our exploration and development activities despite a challenging regu latory environment.
While the suspension did not apply to any of our current operations or prospects, new regulations and enhanced safety certifications have been issued for all operations in the Gulf of Mexico. We completed the necessary initial certifications in June 2010 and are providing required information to secure permits for future drilling. The processing of permits has been slower than previously experienced, and continued delays in obtaining permits from the Department of the Interior could impact the timing of drilling new wells scheduled during the remainder of 2010 and beyond. Our in-progress drilling operations, including the wells currently drilling at Davy Jones and Blackbeard East have not been affected. Additionally, we were recently successful in obta ining a permit to drill our Lafitte ultra-deep exploratory well and operations have commenced. Other permits submitted to the Department of the Interior are still under review.
The events described above have heightened the challenges to us of managing and deploying available resources to ensure that our commitments are effectively managed and met. We have significant drilling and other commitments associated with our business strategy. Although the current operating environment has had no significant impact on our ability to effectively manage our commitments to date, uncertainties associated with our ability to obtain necessary permits could impact future financial results.
Shallow Water, Deep Gas Exploration Activities.
The Blueberry Hill #9 STK1, located on Louisiana State Lease 340 in 10 feet of water, commenced drilling on April 26, 2010 and was drilled to a true vertical depth (TVD) of 24,200 feet in August 2010. As previously reported, wireline logs indicated that the well encountered 105 net feet of hydrocarbon bearing sands with exceptional porosity in the Miocene. We are currently completing the well and expect to begin production from the well in the first quarter of 2011.
We currently own a 42.9 percent working interest and a 29.7 percent net revenue interest in the Blueberry Hill well. Upon completion of the PXP property acquisition, we would own a 90.8 percent working interest and a 62.8 percent net revenue interest in Blueberry Hill. Our investment in the Blueberry Hill field totaled $31.2 million at September 30, 2010, including $24.5 million in costs associated with the #9 STK1 well currently being completed for production.
The Laphroaig No. 2 well in St. Mary Parish, Louisiana commenced drilling on September 24, 2010, and is currently drilling below 15,500 feet with a planned total depth of 20,000 feet. The well is targeting proven undeveloped reserves identified by the discovery well as well as additional exploration potential. The Laphroaig discovery well was drilled in 2007. We have a 37.3 percent working interest and a 28.5 percent net revenue interest in the Laphroaig prospect. Our investment in the Laphroaig No. 2 well totaled $0.5 million at September 30, 2010.
5
Our near-term deep gas exploratory drilling plans also include the Boudin, Hurricane Deep and Platte prospects. Boudin is located in 20 feet of water on Eugene Island Block 26. The well has a proposed total depth of 23,050 feet and will test Miocene objectives. We hold a 37.1 percent working interest in Boudin and upon completion of the PXP property acquisition would hold a 74.2 percent working interest in Boudin. We hold a 29.4 percent net revenue interest in Boudin and upon completion of the PXP acquisition would hold a 58.8 percent net revenue interest. Hurricane Deep is located on the southern flank of the Flatrock structure in 12 feet of water on South Marsh Island Block 217. The well has a proposed total depth of 20,000 feet and is targeting the significant Gyro s and encountered in the Hurricane Deep well (No. 226) in 2007. The location also offers the opportunity to evaluate deeper potential Gyro zones. We currently hold a 25 percent working interest and upon completion of the PXP property acquisition would hold a 55 percent working interest in Hurricane Deep. We currently hold a 17.7 percent net revenue interest and upon completion of the PXP property acquisition would hold a 38.9 percent net revenue interest in Hurricane Deep. Our investment in Hurricane Deep field totaled $13.3 million at September 30, 2010, and our share of costs to re-drill to 18,450 feet is expected to be covered under our insurance program. Platte, which is located in Vermilion Parish, Louisiana, has a proposed total depth of 18,700 feet. We hold a 50.0 percent working interest and a 36 percent net revenue interest in Platte.
Shallow Water, Ultra-deep Exploration Activities.
The data received to date from ultra-deep drilling on the Shelf confirm our geologic modeling, which correlates objective sections on the Shelf below the salt weld (i.e. listric fault) in the Miocene and older age sections to those productive sections seen in deepwater discoveries by other industry participants. We have identified 15 ultra-deep prospects in shallow water, including Davy Jones, Blackbeard West, Blackbeard East and Lafitte. Our in-progress ultra-deep activities include delineation drilling at Davy Jones as well as exploratory drilling at Blackbeard East and Lafitte.
In February 2010, the Davy Jones discovery well on South Marsh Island Block 230 was drilled to a total depth of 29,000 feet. As reported in January 2010, we logged 200 net feet of pay in multiple Eocene/Paleocene (Wilcox) sands in the well. In March 2010, a production liner was set and the well was temporarily abandoned to prepare for completion. Completion equipment is being procured and completion and flow testing activities are expected to commence in the third quarter of 2011.
On April 7, 2010, we commenced drilling the Davy Jones offset appraisal well on South Marsh Island Block 234, two and a half miles southwest of the Davy Jones discovery well. The well is currently drilling below 22,600 feet towards a proposed total depth of 29,950 feet. The offset appraisal well (Davy Jones #2) is expected to test similar sections up-dip to the discovery well, as well as deeper objectives, including potential additional Wilcox and possibly Cretaceous (Tuscaloosa) sections.
Davy Jones involves a large ultra-deep structure encompassing four OCS lease blocks (20,000 acres). We hold a 32.7 percent working interest and 25.9 percent net revenue interest. Upon completion of the PXP transaction, we would hold a 60.4 percent working interest and 47.9 percent net revenue interest in Davy Jones. Our investment in Davy Jones totaled $63.1 million at September 30, 2010, including $25.9 million in costs associated with the offset appraisal well in progress.
The Blackbeard East ultra-deep exploration well, located in 80 feet of water on South Timbalier Block 144, commenced drilling on March 8, 2010. As previously reported on September 20, 2010, the well encountered several sands below 24,100 feet in the Middle Miocene as indicated by log-while-drilling tools and mud logs. Subsequently, we deepened the well to 26,000 feet and have obtained data from wireline logs, side wall cores and formation tests. Analysis of the information obtained to date indicates hydrocarbons in quality reservoir rocks with good porosity and permeability in the Upper and Middle Miocene below the salt weld. The pressure and temperature data below the salt weld between 19,500 feet and 24,600 feet indicates that a completion could utilize conventional equipment and technologie s. We are continuing to evaluate the data to determine the optimum production take point for the zones drilled to date and are evaluating potential offset
6
locations in the Blackbeard East area. We are currently drilling below 27,100 feet and intend to deepen the well to a proposed total depth of 29,950 feet to evaluate deeper Miocene objectives.
We hold a 38.5 percent working interest and 30.7 percent net revenue interest. Upon completion of the PXP property acquisition, we would hold a 70.0 percent working interest and 56.2 percent net revenue interest in Blackbeard East. Our investment in the Blackbeard East well totaled $31.5 million at September 30, 2010.
The Lafitte ultra-deep exploration well commenced drilling on October 3, 2010 and is currently drilling below 5,200 feet towards a proposed total depth of 29,950 feet. Lafitte is located on Eugene Island Block 223 in 140 feet of water. The well is targeting Middle and Deep Miocene objectives below the salt weld. We hold a 40.5 percent working interest and 32.8 percent net revenue interest in the prospect. Upon completion of the PXP property acquisition, we would hold a 72.0 percent working interest and 58.3 percent net revenue interest in Lafitte. Our investment in the Lafitte well totaled $5.7 million at September 30, 2010.
The information gained from the Blackbeard East and Lafitte wells will enable us to develop plans for future operations at Blackbeard West. As previously reported, the Blackbeard West ultra-deep exploratory well on South Timbalier Block 168 was drilled to 32,997 feet in 2008. Logs indicated four potential hydrocarbon bearing zones that require further evaluation and the well was temporarily abandoned. We are evaluating whether to drill deeper at Blackbeard West, drill an offset location or complete the well to test the existing zones. We hold a 32.3 percent working interest and 26.3 percent net revenue interest in Blackbeard West. Upon completion of the PXP transaction, we would hold a 67.3 percent working interest and 54.8 percent net revenue interest. Our in vestment in the Blackbeard West well totaled $31.2 million at September 30, 2010.
We currently hold the rights to the Blackbeard West lease under a Suspension of Operations (SOO) agreement with the Bureau of Ocean Energy Management Regulation and Enforcement Agency (BOEMRE), the term of which extends through November 30, 2010. We are pursuing a new SOO to provide additional time for us to complete our assessment and to secure the commercial arrangements necessary to facilitate further development of this property. While we believe it is reasonably likely that an extension of time will be obtained, there are no assurances that our efforts will be successful, which could result in us being required to relinquish our ownership rights in this property.
Acreage Position
As of September 30, 2010, we owned or controlled interests in 338 oil and gas leases in the Gulf of Mexico and onshore Louisiana and Texas covering 0.98 million gross acres (0.48 million acres net to our interest). Our acreage position on the outer continental Shelf of the Gulf of Mexico includes 0.88 million gross acres (0.43 million acres net to our interest). Less than 0.1 million of our net leasehold interests are scheduled to expire in the remainder of 2010. A portion of these expirations are held under SOO approvals from the Bureau of Ocean Energy Management, Regulation and Enforcement (formerly MMS). We also hold potential reversionary interests in oil and gas leases that we have farmed-out or sold to other oil and gas exploration companies. Interest in these leases will partially revert t o us upon the achievement of specified production thresholds or the achievement of specified net production proceeds.
RESULTS OF OPERATIONS
Our third quarter 2010 operating loss of $10.9 million reflects impairment charges of $11.3 million for certain fields to reduce their net carrying value to fair value which were partially offset by (a) a $5.6 million gain associated with our share of a partial payment for insured losses related to the September 2008 hurricanes and (b) $0.9 million of net gains on oil and gas derivative contracts (Note 4).
Our operating loss of $57.4 million for the nine months ended September 30, 2010 reflects (a) impairment charges of $82.0 million for certain fields to reduce their net carrying value to fair value; and (b) $7.5 million in charges to exploration expense primarily related to the Blueberry Hill appraisal well. These charges are offset by (a) a $14.8 million gain associated with our share of a partial payment for insured losses related to the September 2008 hurricanes; (b) $4.2 million of net gains on oil and gas derivative contracts (Note 4); and (c) a $3.5 million gain on the sale of an oil and gas property.
7
Our third quarter 2009 operating loss of $35.5 million reflects (a) impairment charges of $11.2 million for certain fields to reduce their net carrying value to fair value and (b) $7.3 million in charges to exploration expense primarily relating to the Sherwood exploration well which was determined to be non-productive. These charges are offset by $0.7 million of net gains on oil and gas derivative contracts (Note 4).
Our operating loss for the nine months ended September 30, 2009 of $171.9 million reflects (a) impairment charges of $64.8 million for certain fields to reduce their net carrying value to fair value and (b) $61.7 million in charges to exploration expense primarily relating to exploration wells which were determined to be non-productive. These charges are offset by (a) an $18.7 million gain associated with our share of the initial receipt of insurance proceeds related to the September 2008 hurricanes and (b) $16.6 million of net gains on oil and gas derivative contracts (Note 4).
Summarized operating data are as follows:
| Third Quarter | Nine Months | |||||||
| 2010 | 2009 | 2010 | 2009 | |||||
| Sales volumes: | ||||||||
| Gas (thousand cubic feet, or Mcf) | 8,754,300 | 13,619,300 | 29,795,900 | 36,990,900 | ||||
| Oil (barrels) | 534,000 | 761,600 | 1,851,900 | 2,262,300 | ||||
Plant products (Mcf equivalent) a | 1,484,700 | 1,568,300 | 4,681,300 | 3,988,100 | ||||
Average realizations b | ||||||||
| Gas (per Mcf) | $ 4.61 | $ 3.39 | $ 4.97 | $ 4.04 | ||||
| Oil (per barrel) | 75.78 | 66.81 | 76.13 | 55.39 | ||||
| a. | Results include approximately $9.8 million and $34.3 million of revenues associated with plant products (ethane, propane, butane, etc.) during the third quarter and nine months ended September 30, 2010, respectively. Plant product revenues for the comparable prior year periods totaled $8.6 million and $19.8 million. One Mcf equivalent is determined using the ratio of six Mcf of natural gas to one barrel of crude oil, condensate or natural gas liquids. |
| b. | Excludes the impact of gains and losses on derivative contracts. |
Oil and Gas Operations
Revenues. A summary of increases (decreases) in our oil and natural gas revenues between the periods follows (in thousands):
| Third | Nine | |||||
| Quarter | Months | |||||
| Oil and natural gas revenues – prior year period | $ | 105,822 | $ | 294,969 | ||
| Increase (decrease) | ||||||
| Price realizations: | ||||||
| Natural gas | 10,680 | 27,710 | ||||
| Oil and condensate | 4,790 | 38,408 | ||||
| Sales volumes: | ||||||
| Natural gas | (16,492 | ) | (29,068 | ) | ||
| Oil and condensate | (15,206 | ) | (22,732 | ) | ||
| Plant products revenues | 1,216 | 14,518 | ||||
| Other | (32 | ) | (78 | ) | ||
| Oil and natural gas revenues – current year period | $ | 90,778 | $ | 323,727 | ||
Our oil and natural gas sales volumes totaled 13.4 billion cubic feet of natural gas equivalent (Bcfe) in the third quarter of 2010, a 32 percent decrease from the 19.8 Bcfe of sales volume generated in the third quarter of 2009. The decrease in sales volume is primarily related to the declining production curve associated with maturing properties acquired in the 2007 property acquisition as well as timing delays for certain well recompletion and development activities. Average realizations received for both oil and natural gas sold during the third quarter of 2010 increased 13 percent for oil and 36 percent for
8
natural gas compared to amounts received in 2009 (see “—North American Natural Gas and Oil Market Environment” above). Revenues from plant products totaled $9.8 million in the third quarter of 2010 compared with $8.6 million in the prior year period. Our service revenues totaled $4.1 million in the third quarter of 2010 and $3.7 million in the same period for 2009.
Our oil and natural gas sales volumes totaled 45.6 Bcfe and 54.6 Bcfe in the nine months ended September 30, 2010 and 2009, respectively. The decrease in sales volume is primarily related to the anticipated declining production curve associated with maturing properties as well as timing delays for certain well recompletion and development activities. Average realizations received for both oil and natural gas sold during the nine months ended September 30, 2010 increased 37 percent for oil and 23 percent for natural gas compared to amounts received in 2009 (see “—North American Natural Gas and Oil Market Environment” above). Revenues from plant products totaled $34.3 million in the nine months ended September 30, 2010 compared with $19.8 million in the prior year period. Our service revenues to taled $11.6 million in the nine months ended September 30, 2010 and $8.5 million in the same period for 2009.
Production and delivery costs. The following table reflects our production and delivery costs for the third quarter and nine months ended September 30, 2010 and 2009 (in millions, except per Mcfe amounts):
| Third Quarter | Nine Months | |||||||||||||||
| Per | Per | Per | Per | |||||||||||||
| 2010 | Mcfe | 2009 | Mcfe | 2010 | Mcfe | 2009 | Mcfe | |||||||||
| Lease operating expense | $25.2 | $1.87 | $31.5 | $1.59 | $78.9 | $1.73 | $87.4 | $1.59 | ||||||||
| Workover costs | 9.6 | 0.71 | 5.5 | 0.27 | 17.3 | 0.38 | 12.5 | 0.23 | ||||||||
| Hurricane related expenses | 1.2 | 0.09 | (0.5 | ) | (0.02 | ) | 3.9 | 0.09 | 14.2 | 0.26 | ||||||
| Insurance | 6.5 | 0.48 | 6.5 | 0.33 | 19.7 | 0.43 | 17.8 | 0.33 | ||||||||
| Transportation and production taxes | 4.8 | 0.36 | 5.8 | 0.29 | 16.5 | 0.36 | 15.1 | 0.28 | ||||||||
| Other | (0.2 | ) | (0.01 | ) | 0.3 | 0.02 | - | - | (0.1 | ) | - | |||||
| Total production and delivery costs | $47.1 | $3.50 | $49.1 | $2.48 | $136.3 | $2.99 | $146.9 | $2.69 | ||||||||
Lease operating expense declined approximately $6.3 million and $8.5 million, respectively, in the third quarter and nine months ended September 30, 2010 from the comparable prior periods primarily related to the 32 percent decline in third quarter 2010 sales volumes offset by increases of 18 percent in the third quarter 2010 per Mcfe amounts. Hurricane related expenses fluctuated from the prior periods because of the significant amount of hurricane repair work completed in early 2009 following the September 2008 hurricane events.
Insurance premium rates associated with our operations in the Gulf of Mexico have increased in recent years. We renewed our property insurance program for coverage through May 2011 and purchased similar coverage to the previous year for a nominal increase in costs. The policy includes coverage of our ownership interest for damages caused by Named Windstorms subject to recovery of 50 percent of any loss up to an annual aggregate limit of $100 million, in excess of a $50 million deductible. We also purchased operational risk coverage for losses resulting from perils other than Named Windstorms such as well blowouts, fires and explosions with limits and deductibles scaled to our working interest in the covered property. The control of well coverage, subject to a $5 million deductible, has a limit of $150 million for all wells except ultra-deep wells which have a $250 million limit. We also renewed our Oil Spill Financial Responsibility policy coverage which has a $150 million limit. For additional information related to risks associated with our insurance coverage, see Item 1A. “Risk Factors” included in our 2009 Form 10-K.
Depletion, depreciation and amortization expense. The following table reflects the components of our depletion, depreciation and amortization (DD&A) expense for the third quarter and nine months ended September 30, 2010 and 2009 (in millions, except per Mcfe amounts):
9
| Third Quarter | Nine Months | ||||||||||||||
| Per | Per | Per | Per | ||||||||||||
| 2010 | Mcfe | 2009 | Mcfe | 2010 | Mcfe | 2009 | Mcfe | ||||||||
| Depletion and depreciation expense | $30.7 | $2.28 | $56.4 | $2.86 | $117.1 | $2.57 | $153.6 | $2.82 | |||||||
| Accretion expense | 6.6 | 0.49 | 8.4 | 0.42 | 15.6 | 0.34 | 24.9 | 0.45 | |||||||
| Impairment charges/losses | 11.3 | 0.84 | 11.2 | 0.57 | 82.0 | 1.80 | 64.8 | 1.19 | |||||||
| Total | $48.6 | $3.61 | $76.0 | $3.85 | $214.7 | $4.71 | $243.3 | $4.46 | |||||||
Our depletion, depreciation and amortization rates are directly affected by estimates of proved reserve quantities, which are subject to revisions over time as changes in reserve estimates and fluctuations in the recorded amounts of property, plant and equipment and asset retirement obligations occur. Reductions in the amounts of depletion and depreciation expense for the third quarter and nine months ended September 30, 2010 from the comparable prior periods primarily reflect the impact of lower sales volumes in 2010.
Accounting rules require the carrying value of proved oil and gas property costs to be assessed for possible impairment under certain circumstances and reduced to fair value by a charge to earnings if impairment is deemed to have occurred. Conditions affecting current and estimated future cash flows that could require impairment charges include, but are not limited to, lower than anticipated oil and natural gas prices, decreased production, increased development, production and reclamation costs and downward revisions of reserve estimates. Due to the decline in market prices for oil and natural gas and negative reserve revisions resulting from well performance issues encountered at certain properties, we recorded impairment charges of $11.3 million and $82.0 million, respectively, in the third quarter and nine months ended September 30, 2010 (Note 6). We recorded impairment charges of $11.2 million and $64.8 million, respectively, in the third quarter and nine months ended September 30, 2009.
As more fully explained in Part I, Item 1A, “Risk Factors” in our 2009 Form 10-K, any one or more of the conditions described above could require additional impairment charges to be recorded in future periods.
Exploration Expenses. Summarized exploration expenses are as follows (in millions):
| Third Quarter | Nine Months | |||||||||||
| 2010 | 2009 | 2010 | 2009 | |||||||||
| Geological and geophysical | ||||||||||||
including 3-D seismic purchases a | $ | 4.9 | $ | 2.6 | $ | 13.9 | $ | 19.4 | ||||
| Non-productive exploratory costs, including | ||||||||||||
| related lease costs | 0.1 | 7.3 | b | 7.5 | c | 61.7 | d | |||||
| Other | 0.3 | 0.9 | 6.7 | 5.0 | ||||||||
| $ | 5.3 | $ | 10.8 | $ | 28.1 | $ | 86.1 | |||||
| a. | Includes compensation costs associated with outstanding stock-based awards totaling $1.4 million in the third quarter of 2010 and $7.3 million in the nine months ended September 30, 2010 compared with $1.3 million and $5.6 million of compensation costs during comparable periods in 2009 (see “Stock-Based Compensation” below). The nine months ended September 30, 2010 amounts includes reimbursements of seismic data from our partners totaling $1.8 million. |
| b. | Includes non-productive well costs of $6.3 million related to the Sherwood well. |
| c. | Includes costs of the Blueberry Hill offset appraisal well incurred below 19,000 feet. Results below 19,000 feet were determined to be non-commercial, and we commenced sidetracking efforts in April 2010 to a location southwest of the pay sands seen in 2009. |
| d. | Includes non-productive well costs of $6.3 million related to the Sherwood well, $25.5 million related to the Ammazzo well, $11.0 million related to the Cordage well, $11.1 million related to the Tom Sauk well and $6.2 million related to the Gladstone East well. |
Other Financial Results
Operating
General and administrative expense totaled $11.1 million in the third quarter of 2010 and $35.3
10
million for the nine months ended September 30, 2010 compared with $9.6 million in the third quarter of 2009 and $33.0 million for the nine months ended September 30, 2009. We charged $1.6 million of related stock-based compensation costs to general and administrative expense during the third quarter of 2010 and $8.2 million for the nine months ended September 30, 2010 compared to $1.4 million and $6.0 million for the comparable periods in 2009 (see “Stock-Based Compensation” below). Additionally, the third quarter of 2010 general and administrative expense includes $1.4 million in transaction related costs for the pending acquisition of certain oil and gas property interests from Plains Exploration & Production Company.
In the third quarter and nine months ended September 30, 2010, we recorded net $0.9 million and $4.2 million in gains, respectively, associated with our oil and gas derivative contracts as compared to net $0.7 million and $16.6 million in gains, respectively, in the same periods of 2009. The variance resulted from changes in commodity prices and the resulting mark-to-market impact that such changes had with respect to our derivative contract positions during the respective periods.
Hurricanes Gustav and Ike disrupted our Gulf of Mexico operations prior to making landfall on the Louisiana and Texas coasts in September 2008. Assessments following these hurricanes identified several platforms with significant structural damage. Consistent with our claims experience to date, we expect to realize a substantial recovery in future periods under our insurance program for a large portion of these hurricane related costs, reimbursement for which is received after damage-related expenditures are funded and related claims are approved. We received net insurance proceeds of $5.6 million and $14.8 million in the third quarter and nine months ended September 30, 2010 and $18.7 million in the nine months ended September 30, 2009. Since 200 9, we have recognized net insurance proceeds of $39.3 million related to the 2008 hurricane events in the Gulf of Mexico.
In the nine months ended September 30, 2010, we recorded a $3.5 million gain on the sale of one of our Gulf of Mexico oil and gas properties.
Stock-Based Compensation. Compensation cost charged against earnings for stock-based awards included within the respective captions in the statements of operations follows (in thousands):
| Third Quarter | Nine Months | |||||||||||
| 2010 | 2009 | 2010 | 2009 | |||||||||
| General and administrative expenses | $ | 1,629 | $ | 1,432 | $ | 8,153 | $ | 5,998 | ||||
| Exploration expenses | 1,363 | 1,278 | 7,282 | 5,633 | ||||||||
Main Pass Energy Hub™ start-up costs | 52 | 76 | 266 | 335 | ||||||||
| Total stock-based compensation cost | $ | 3,044 | $ | 2,786 | $ | 15,701 | $ | 11,966 | ||||
On February 1, 2010, our Board of Directors granted a total of 1,766,500 stock options to our employees at an exercise price of $15.73 per share, including immediately exercisable options for an aggregate of 445,000 shares. Options representing 400,000 of these 445,000 shares were issued to our Co-Chairmen in lieu of cash compensation in 2010. We recorded $6.7 million in charges related to immediately vested stock options in the first quarter of 2010. These charges included the compensation costs associated with the immediately exercisable options and the compensation costs related to stock options granted to retiree-eligible employees, which resulted in one-year’s compensation expense being immediately recognized at the effective date of the stock option grant. The weighted average fair value per share of the 1,816,500 options granted during the nine months ended September 30, 2010 was $10.18.
Our Board of Directors granted a total of 1,815,500 stock options to our employees at an exercise price of $6.44 per share on February 2, 2009. We recorded $2.9 million in charges related to immediately vested stock options in the first quarter of 2009. The weighted average fair value per share of the 1,855,500 options granted in the nine months ended September 30, 2009 was $3.98.
As of September 30, 2010, total compensation cost related to unvested, approved stock option awards not yet recognized in earnings was approximately $18.1 million, which is expected to be recognized over a weighted average period of approximately one year.
11
Non-Operating
Interest expense, net of capitalized interest, totaled $8.7 million in the third quarter of 2010 and $29.1 million for the nine months ended September 30, 2010 compared with $10.9 million in the third quarter of 2009 and $31.9 million for the nine months ended September 30, 2009. Capitalized interest totaled $3.1 million in the third quarter of 2010, $0.8 million in the third quarter of 2009, $6.3 million for the nine months ended September 30, 2010 and $3.2 million for the nine months ended September 30, 2009. The increase in capitalized interest is related to our increased costs associated with our current drilling activities during the third quarter of 2010.
Other income totaled less than $0.1 million in the third quarter of 2010 and $0.2 million for the nine months ended September 30, 2010. Other income totaled $0.3 million in the third quarter of 2009 and $3.5 million for nine months ended September 30, 2009. Other income in 2009 includes a $2.7 million gain related to the settlement of a contingency associated with the 2007 oil and gas property acquisition.
In February 2010, the Obama Administration released its fiscal year 2011 budget including proposals that, if enacted, could result in significant changes with respect to oil and gas income taxation. See our 2009 Form 10-K for further discussion on the Administration’s fiscal year 2011 budget proposal.
Discontinued Operations
Our discontinued operations resulted in a net loss of $1.2 million in the third quarter of 2010 and $4.3 million for the nine months ended September 30, 2010 compared with losses of $1.6 million in the third quarter of 2009 and $5.7 million for the nine months ended September 30, 2009. We recorded $2.0 million in the nine months ended September 30, 2009 related to certain environmental remediation activities at our inactive Port Sulphur, Louisiana facility. Future estimated closure costs for these facilities approximate $13.9 million, the funds for which are expected to be expended through 2011.
CAPITAL RESOURCES AND LIQUIDITY
The table below summarizes our cash flow information by categorizing the information as cash provided by or (used in) operating activities, investing activities and financing activities and distinguishing between our continuing operations and discontinued operations (in millions):
| Nine Months Ended | ||||||
| September 30, | ||||||
| 2010 | 2009 | |||||
| Continuing operations | ||||||
| Operating | $ | 120.3 | $ | 89.8 | ||
| Investing | (157.3 | ) | (113.4 | ) | ||
| Financing | (23.6 | ) | 159.1 | |||
| Discontinued operations | ||||||
| Operating | (0.6 | ) | (4.4 | ) | ||
| Investing | - | - | ||||
| Financing | - | - | ||||
| Total cash flow | ||||||
| Operating | 119.7 | 85.4 | ||||
| Investing | (157.3 | ) | (113.4 | ) | ||
| Financing | (23.6 | ) | 159.1 |
Nine-Month 2010 Cash Flows Compared with Nine-Month 2009
Operating Cash Flows
Operating cash flow increased $34.3 million for the nine months ended September 30, 2010 compared to the same period in 2009 primarily because of $31.9 million of higher revenue realizations, $10.6 million of lower production and delivery costs, $3.8 million of lower geological, geophysical and other costs, and $49.0 million of positive working capital fluctuations between comparable periods. These cash inflows were partially offset by $31.9 million of lower realized derivative gains, $31.2 million of higher reclamation expenditures and $4.0 million of lower insurance reimbursements received in the nine
12
months ended September 30, 2010.
Investing Cash Flows
Our investing cash flows reflect exploration, development and other capital expenditures associated with our oil and gas activities (see “Oil and Gas Activities” above). Our exploration, development and other capital expenditures totaled $160.3 million for the nine months ended September 30, 2010 and $113.4 million for the same period of 2009. We received proceeds of $2.9 million from the sale of an oil and gas property during the nine months ended September 30, 2010.
Financing Cash Flows
Our financing cash flows included payments of dividends and inducement payments on our 8% preferred stock and 6¾% mandatory convertible preferred stock (6¾% preferred stock) totaling $23.1 million during the nine months ended September 30, 2010. During this period, we agreed through privately negotiated transactions to induce the conversion of approximately 64,200 shares of 8% preferred stock into approximately 9.4 million shares of common stock (see “Equity Transactions” below).
Our financing cash flows during the nine months ended September 30, 2009 reflect the net proceeds of $168.2 million from the sale of 15.5 million shares of our common stock and 86,250 shares of $1,000 par value 8% preferred stock. We paid dividends on preferred stock of $9.1 million in the nine months ended September 30, 2009.
Senior Secured Revolving Credit Facility
Our variable rate senior secured revolving credit facility (credit facility) is secured by substantially all of MOXY’s oil and gas properties and matures in August 2012. The borrowing capacity was $175 million at September 30, 2010. Although we had no borrowings outstanding under the credit facility during the quarter ended September 30, 2010, a letter of credit in the amount of $100 million is outstanding under the credit facility to support the reclamation obligations assumed in the 2007 oil and gas property acquisition, reducing the remaining availability under the facility to $75 million (Note 9 of our 2009 Form 10-K).
Availability under the credit facility is subject to a borrowing base, which is determined semi-annually each April and October. Our lenders are currently reviewing the borrowing base in connection with the October redetermination.
The credit facility contains covenants and other restrictions customary for oil and gas borrowing base credit facilities. We were in compliance with these covenants at September 30, 2010.
Equity Transactions
During the third quarter ended September 30, 2010, we privately negotiated the induced conversion of approximately 7,000 shares of our 8% preferred stock with a liquidation preference of $7.0 million into approximately 1.0 million shares of our common stock (at a conversion rate equal to 146.1454 shares of common stock per share of 8% preferred stock). To induce the early conversions of these shares of 8% preferred stock, we paid an aggregate of $1.4 million in cash to the holders of these shares, which amount is included as a charge in our consolidated statements of operations within preferred dividends and inducement payments for early conversion of convertible preferred stock. We induced conversion of approximately 64,200 shares of our 8% preferred stock with a liquidation preference of $64.2 million into approxi mately 9.4 million shares of our common stock during the nine months ended September 30, 2010. We paid an aggregate of $12.2 million in cash to the holders of these shares during the nine months ended September 30, 2010 to induce the early conversions of these shares. Following these transactions, approximately 22,100 shares of our 8% preferred stock remain outstanding.
We have 1.6 million shares of our 6¾% preferred stock ($158.9 million liquidation preference), which will automatically convert on November 15, 2010 into between approximately 10.7 million and 12.8 million common shares of our common stock. The conversion rate depends on the applicable average closing market price of our common stock over the 20-trading-day period beginning on October 14, 2010, and ending on November 10, 2010. If the applicable average closing market price of our common stock is above $14.88, then the conversion rate per $100 face amount of the 6¾% preferred stock will be 6.7204. The conversion rate would be 8.0645 if the applicable average closing market price of our common stock is below $12.40. For average common stock prices greater than or equal to $12.40 and equal to or less
13
than $14.88, the conversion rate will be equal to $100 divided by our average closing common stock price during the 20-trading-day period. The average closing market price of our common stock from October 14, 2010 through November 8, 2010 was $16.50 per share.
Pending Acquisition of Plains Exploration & Production Company’s Shallow Water Gulf of Mexico Assets & Related Financing Transactions
On September 20, 2010, we announced an agreement to acquire Plains Exploration and Production Company’s (PXP) shallow water Gulf of Mexico shelf assets for a combination of stock and cash (Acquisition). Under the terms of the transaction, we will issue 51 million shares of our common stock and pay $75 million in cash to PXP to acquire all of PXP’s interests and exploration rights in the shallow waters of the shelf of the Gulf of Mexico. The closing of the acquisition is expected by year-end 2010 and is subject to our shareholder approval of the issuance of common stock to PXP, as required by New York Stock Exchange (NYSE) rules, the completion of financing transactions, receipt of regulatory approvals and other customary closing conditions.
We also announced that, upon concurrent completion of the PXP transaction, we will privately issue $900 million in equity-linked securities to fund future capital expenditures associated with our expanded asset base and for general corporate purposes. The financing includes $200 million of 7-year 4% Convertible Senior Notes, which will be sold to institutional investors (Institutional Investors), and $700 million of 5¾% Convertible Perpetual Preferred Stock, of which $500 million of one series will be sold to Freeport-McMoRan Copper & Gold Inc. (FCX) and $200 million of another series will be sold to the Institutional Investors. The closing of the financing transactions are conditioned upon concurrent completion of the PXP transaction, our shareholder approval of the issuance of securities to FCX, and othe r customary closing conditions.
The total value (purchase price) of the Acquisition will be determined at the date of closing, and it will be subject to adjustment based on final settlement of certain items. Based on the value of our common stock as of the day prior to the Acquisition’s September 20, 2010 announcement date ($14.57 per share), the aggregate value of the cash and stock portions of the estimated purchase consideration approximated $820 million. The effective date for the Acquisition is August 1, 2010. Changes related to the impact of movements in the trading value of our common stock through the closing date of the Acquisition, and estimated closing adjustments to reflect the August 1, 2010 effective date, including post August 1, 2010 revenues, operating expenses and capital and reclamation expenditures relating to the acquired properties all will be factors in determining the final recorded purchase price. Because a significant portion of the purchase consideration is comprised of a fixed amount of our common stock, changes in our common stock value through the date of closing could materially impact the total recorded purchase price.
We currently have approximately 95.5 million shares of common stock outstanding. Assuming conversion of our remaining outstanding 8% preferred stock, 5.25% notes and 6¾% preferred stock, we would have approximately 114 million common shares outstanding. Upon completion of the PXP transaction and the private placement of equity-linked securities, on a pro forma basis, we would have approximately 221 million common shares outstanding on a fully converted basis.
For more information regarding the pending PXP transaction and related financing transactions see Note 6 herein. For more information regarding our current plans to address our long-term capital needs, see Item 1A “Risk Factors” of Part II herein.
MAIN PASS ENERGY HUBTM PROJECT
Our long-term business objectives may include the pursuit of a multifaceted energy services development of the MPEHtm project, including the potential development of an LNG regasification and storage facility through Freeport Energy. As of September 30, 2010, we have incurred approximately $52.3 million of cumulative cash costs associated with our pursuit of the establishment of MPEHtm, including $0.5 million in the nine months ended September 30, 2010. As of September 30, 2010, we have recognized a liability of $11.8 million relating to the future reclamation of the MPEHtm related facilities. The actual amount and timing of the obligation for reclamation of these structures is dependent on the success of our efforts to use these facilities at the MPEHtm project.
14
We will require commercial arrangements for the MPEHtm project to obtain financing, which may be in the form of additional debt and/or equity transactions. The ultimate outcome of our efforts to enter into commercial arrangements on reasonable terms to develop the MPEHtm project and obtain additional financing is subject to various uncertainties, many of which are beyond our control. Commercialization of the project has been adversely affected by increased domestic supplies of natural gas, excess LNG re-gasification capacity and general market conditions.
For additional information regarding the MPEHtm project, see “Main Pass Energy Hubtm Project” in Part 1, Items 1. and 2. “Business and Properties” in our 2009 Form 10-K.
NEW ACCOUNTING STANDARDS
See Note 8 for information regarding our adoption of new accounting standards. We do not expect the adoption of any accounting standards in 2010 to have a material impact to our financial statements.
CAUTIONARY STATEMENT
Management’s Discussion and Analysis of Financial Condition and Results of Operations contain forward-looking statements in which we discuss certain of our expectations regarding future operational and financial performance. Forward-looking statements are all statements other than statements of historical facts, such as those statements regarding potential oil and gas discoveries, projected oil and gas exploration, development and production activities and costs, amounts and timing of capital expenditures, reclamation, indemnification and environmental obligations and costs, potential quarterly and annual production rates, reserve estimates, projected operating cash flows and liquidity, statements about the potential opportunities and benefits presented by the proposed prop erty acquisition, including expectations regarding reserve estimates and production rates, and statements about the proposed financing transactions. The words “anticipates,” “may,” “can,” “plans,” “believes,” “estimates,” “expects,” “projects,” “intends,” “likely,” “will,” “should,” “to be,” and any similar expressions and/or statements that are not historical facts are intended to identify those assertions as forward-looking statements.
In making any forward-looking statements, the person making them believes that the expectations are based on reasonable assumptions. We caution readers that those statements are not guarantees of future performance or exploration and development success, and our actual exploration experience and future financial results may differ materially from those anticipated, projected or assumed in the forward-looking statements. Important factors that can cause our actual results to differ materially from those anticipated by the forward-looking statements include, but are not limited to, those associated with general economic and business conditions, variations in the market demand for, and prices of, oil and natural gas, drilling results, unanticipated fluctuations in flow rates of producing wells due to mechanical or operational issues (includ ing those experienced by wells operated by third parties where McMoRan is a participant), oil and natural gas reserve expectations, the potential adoption of new governmental regulations, failure of third party partners to fulfill their commitments, the ability to hold current or future lease acreage rights, the ability to satisfy future cash obligations and environmental costs, adverse conditions, such as high temperatures and pressure that could lead to mechanical failures or increased costs, access to capital to fund drilling activities, other general exploration and development risks and hazards inherent in the production of oil and natural gas, the closing of the property acquisition, the exercise of preferential rights by third parties, the closing of the financing transactions, each of which depends on the satisfaction of various closing conditions, including, but not limited to, obtaining stockholder approval of the issuances of securities as required under New York Stock Exchange rules and obtaining regulatory approvals, and other factors described in more detail in Part I, Item 1A. “Risk Factors” included in our 2009 Form 10-K, as updated by our subsequent filings with the SEC.
Investors are cautioned that many of the assumptions upon which our forward-looking statements are based are likely to change after our forward-looking statements are made, including for example the market prices of oil and natural gas, which we cannot control, and production volumes and costs, some aspects of which we may or may not be able to control. Further, during the quarter, we may make changes to our business plans that could or will affect our results for the quarter. We caution investors that we do not intend to update our forward-looking statements more frequently than quarterly,
15
notwithstanding any changes in our assumptions, changes in our business plans, our actual experience, or other changes, and we undertake no obligation to update any forward-looking statements.
–––––––––––––––––––––––––
The exhibits to this report are listed in the Exhibit Index appearing on page E-1 hereof.
16
McMoRan Exploration Co.
Pursuant to the requirements of the Securities Exchange Act of 1934, the registrant has duly caused this report to be signed on its behalf by the undersigned thereunto duly authorized.
| McMoRan Exploration Co. | |
| By: /s/ Nancy D. Parmelee | |
| Nancy D. Parmelee | |
| Senior Vice President, Chief Financial Officer | |
| and Secretary | |
| (authorized signatory and Principal | |
| Financial Officer) | |
| Date: November 10, 2010 |
17
MCMORAN EXPLORATION CO.
| Filed | |||||||
| Exhibit | with this | Incorporated by Reference | |||||
| Number | Exhibit Title | Form 10-Q/A | Form | File No. | Date Filed | ||
| Letter dated November 10, 2010 from Ernst & Young LLP regarding unaudited interim financial statements | X | ||||||
| Certification of Principal Executive Officer pursuant to Rule 13a–14(a)/15d-14(a) | X | ||||||
| Certification of Principal Financial Officer pursuant to Rule 13a–14(a)/15d-14(a) | X | ||||||
| Certification of Principal Executive Officer pursuant to 18 U.S.C. Section 1350 | X | ||||||
| Certification of Principal Financial Officer pursuant to 18 U.S.C. Section 1350 | X | ||||||
18