Indicate by check mark if the registrant is a well-known seasoned issuer, as defined in Rule 405 of the Securities Act.
Indicate by check mark if the registrant is not required to file reports pursuant to Section 13 or Section 15(d) of the Act.
Indicate by check mark whether the registrant is a large accelerated filer, an accelerated filer, a non-accelerated filer, or a smaller reporting company. See definitions of “accelerated filer,” “large accelerated filer” and “smaller reporting company” in Rule 12b-2 of the Exchange Act (Check one):
The aggregate market value of classes of common stock held by non-affiliates of the registrant was approximately $1.7 billion on February 11, 2011, and approximately $857.3 million on June 30, 2010.
On February 11, 2011, there were outstanding 158,381,575 shares of the registrant’s Common Stock and on June 30, 2010, there were outstanding 94,441,086 shares.
McMoRan Exploration Co.
All of our periodic report filings with the Securities and Exchange Commission (SEC) pursuant to Section 13(a) or 15(d) of the Securities Exchange Act of 1934, as amended, are available, free of charge, through our website located at www.mcmoran.com, including our annual reports on Form 10-K, quarterly reports on Form 10-Q, and current reports on Form 8-K, and any amendments to those reports. These reports and amendments are available through our website as soon as reasonably practicable after we electronically file or furnish such materials with the SEC. All references to Notes in this report refer to the Notes to the Consolidated Financial Statements located in Item 8. of this Form 10-K. We have also provided a glossary of definitions for some of the oil and gas industry terms we use in this Form 10-K beginning on page 92.
Our technical and operational expertise is primarily in the Gulf of Mexico and onshore in the Gulf Coast area. We leverage our expertise by attempting to identify exploration opportunities with high potential. Our exploration strategy is focused on the “deep gas play,” drilling to depths of between 15,000 to 25,000 feet in the shallow waters of the Gulf of Mexico and Gulf Coast area and on the “ultra-deep gas play” of depths generally below 25,000 feet. Deep gas prospects target large structures above the salt weld (i.e. listric fault) in the Deep Miocene. Ultra-deep prospects target objectives below the salt weld in the Miocene and older age sections that have been correlated to those productive sections seen onshore and in deepwater discoveries by other industry participants. � 60;When we find commercially exploitable oil or natural gas, a significant advantage to our exploration strategy is that there is substantial infrastructure in our focus area to support the production and delivery of product. We believe this presents us with a material competitive advantage in bringing our discoveries on line and lowering related development costs.
We also have significant expertise in various exploration and production technologies, including the incorporation of 3-D seismic interpretation capabilities with traditional structural geological techniques, offshore drilling to significant total depths and horizontal drilling. We employ 64 oil and gas technical professionals, including geophysicists, geologists, petroleum engineers, production and reservoir engineers and technical professionals, most of whom have considerable experience in their respective fields. We also own or have rights to an extensive seismic database, including 3-D seismic data on substantially all of our acreage. We continue to focus on enhancing reserve and production growth in the Gulf of Mexico by applying these technologies.
We use our expertise and a rigorous analytical process in conducting our exploration and development activities. While implementing our drilling plans, among other things, we focus on:
Our experience and recognition as an industry leader in drilling deep wells in the Gulf of Mexico also provides us with opportunities to partner with other established oil and gas companies. We have taken, and expect to continue to take, advantage of desirable partnering opportunities as they arise. These partnerships, which typically involve the exploration of our identified prospects or prospects that are brought to us by third parties, allow us to diversify our risks and better manage costs.
On December 30, 2010, we completed the acquisition of Plains Exploration & Production Company’s (PXP) shallow water Gulf of Mexico shelf assets (PXP Acquisition). Under the terms of the transaction, we issued 51 million shares of common stock and paid $75.0 million cash to PXP. Total consideration for the transaction was approximately $1 billion based on the value of our common stock on the closing date. Concurrent with the PXP Acquisition, in separate private placement transactions we issued $700 million of 5.75% Convertible Perpetual Preferred Stock (5.75% preferred stock) and $200 million of 4% Convertible Senior Notes (4% senior notes) to certain investors. Freeport-McMoRan Copper & Gold Inc. purchased $500 million of the 5.75% preferred stock and the remaining $400 million of convertible securities were purc hased by other institutional investors (Notes 2, 6 and 8).
The PXP Acquisition increased our scale of operations on the Gulf of Mexico shelf, consolidated our ownership in core focus areas, expanded our participation in future production from our deep gas and ultra-deep exploration and development programs and increased our reserves and production. In addition, we expect to continue to benefit from our positive relationship with PXP through PXP’s significant shareholding position in our company, including by having two PXP nominees serve on our expanded board of directors.
We intend to continue to focus on pursuing opportunities within our expanded asset base and actively develop and exploit our Davy Jones ultra-deep discovery. Capital spending will continue to be driven by opportunities and will be managed based on available cash and cash flow, including potential participation by new partners in projects.
All of our proved reserve estimates were prepared by Ryder Scott Company, L.P. (Ryder Scott), an independent petroleum engineering firm, in accordance with the current definitions and guidelines established by the SEC. To achieve reasonable certainty, Ryder Scott employed technologies that have been demonstrated to yield results with consistency and repeatability. The technologies and economic data used in the estimation of our proved reserves include, but are not limited to, well logs, geologic maps, seismic data, well test data, production data, historical price and cost information and property ownership interests. Among other things, the accuracy of the estimates of our reserves is a function of:
The scope and results of the procedures employed by Ryder Scott are summarized in a letter that is filed as an exhibit to this Annual Report on Form 10-K. There is a primary technical person from Ryder Scott who is responsible for overseeing the preparation of our reserve estimates. He has a Bachelor of Science degree in Petroleum Engineering, is a Licensed Professional Engineer in the State of Texas and is a Registered Professional Engineer in the State of Louisiana. He also has over 40 years of experience in the estimation and evaluation of petroleum reserves and has attained the professional qualifications as a Reserve Estimator set forth in the Standards Pertaining to the Estimating and Auditing of Oil and Gas Reserves Information promulgated by the Society of Petroleum Engineers.
We also maintain an internal staff of reservoir engineers and geoscientists who work closely with Ryder Scott in connection with their preparation of our reserve estimates, including assessing the integrity, accuracy and timeliness of the methods and assumptions used in this process. The activities of our internal staff are led and overseen by an Executive Vice President with over 40 years of technical experience involving petroleum reserve assessment and estimation and geoscience-based evaluation. He is assisted by our Vice President of Reservoir Engineering, who has over 25 years of technical experience in petroleum engineering and reservoir evaluation and analysis. Together, these individuals direct the activities of our internal reservoir engineering staff who coordinate with our land, marke ting, accounting and other departments to provide the appropriate data to Ryder Scott in support of the reserve estimation process. This process is coordinated and completed on a semi-annual basis (as of June 30 and December 31). To the extent any operational or other matters occur during periods between these semi-annual assessments that significantly impact previous reserve estimates, adjustments to those estimates are recognized at that time.
Because these estimates depend on many assumptions, any or all of which may differ substantially from actual results, reserve estimates may be different from the quantities of oil and natural gas that we ultimately recover.
The following table discloses our estimated proved reserves as of December 31, 2010. The reserve volumes were determined using the methods prescribed by the SEC, which require the use of an average price, calculated as the twelve-month average of the first day of the month prices as adjusted for location and quality differentials (twelve-month average price).
Our proved undeveloped reserves are 20 percent of our total proved reserves as of December 31, 2010. As of December 31, 2010, none of our proved reserves had been classified as proved undeveloped for more than five years, and the majority of the properties for which we have proved undeveloped reserves have ongoing production from currently developed zones. The following table represents a summary of activity within our proved undeveloped reserve category in 2010.
The following table presents the present value of estimated future net cash flows before income taxes from the production and sale of our estimated proved reserves reconciled to the standardized measure of discounted net cash flows as of December 31, 2010 (in thousands).
The following table illustrates the sensitivity of our estimated proved oil and natural gas reserves and PV-10 to changes in product price levels. The reserve quantities and PV-10 shown below were prepared on the same basis as in the table above, except for the use of year-end market pricing based on closing forward prices on the New York Mercantile Exchange (NYMEX) for oil and natural gas on December 31, 2010 rather than monthly average prices specified by SEC rules. Based on this forward price curve, natural gas average realizations were $5.85 per Mcf and oil average realizations were $90.70 per barrel over the life of the properties.
The following table shows production volumes, average sales prices and average production (lifting) costs for our oil and natural gas sales for each period indicated. The relationship between our sales prices and production (lifting) costs depicted in the table is not necessarily indicative of our present or future results of operations.
acres associated with our ultra-deep gas play. Less than 0.1 million of our net leasehold interests are scheduled to expire in 2011 (absent the initiation of exploratory drilling or extensions through other means prior to expiration). We hold potential reversionary interests in oil and gas leases that we have farmed-out or sold to other oil and gas exploration companies but that will partially revert to us upon the achievement of specified production quantity thresholds or the achievement of specified net production proceeds.
The following table shows the oil and gas acreage in which we held interests as of December 31, 2010. The table does not account for our gross acres associated with our farm-in, or certain other farm-out arrangements.
The following table identifies our top ten producing properties as of December 31, 2010.
Oil and Gas Activities.
The Davy Jones offset appraisal well (Davy Jones #2), which is located on South Marsh Island Block 234 two and a half miles southwest of the Davy Jones No. 1 well, commenced drilling on April 7, 2010. The well is currently drilling below 29,300 feet and we have applied for a revised permit to deepen the well to a new proposed total depth of 32,000 feet. As reported in February 2011, preliminary data from wireline logs over the interval from 25,400 feet to 27,300 feet, which continue to be evaluated, indicated a potential of over 200 feet of gross sand and approximately 100 net feet of sand, based on intermittent porosity data available, in multiple Wilcox zones that appear to be hydrocarbon bearing. Additional data will be required to complete the evaluation. Paleo and log data
indicate the offset well to be approximately 1,300 feet structurally high (up dip) to the Davy Jones discovery well and confirm the major structural features of the Davy Jones prospect, and all but one of the sands in the discovery well appear to be present in the offset well. We are currently deepening the Davy Jones No. 2 well to evaluate additional objectives, including possibly the Upper Cretaceous (Tuscaloosa) sections.
Davy Jones involves a large ultra-deep structure encompassing four OCS lease blocks (20,000 acres). We hold a 60.4 percent working interest and 47.9 percent net revenue interest in Davy Jones. Our investment in Davy Jones totaled $522.0 million at December 31, 2010, a substantial majority of which is related to allocated PXP Acquisition costs.
The Blackbeard East ultra-deep exploration well commenced drilling on March 8, 2010 and is currently drilling below 32,500 feet. In January 2011, we were granted a permit by BOEMRE to deepen the well to 34,000 feet. As reported in January 2011, wireline logs have indicated that Blackbeard East has encountered hydrocarbon bearing sands in the Oligocene (Frio) with good porosity below 30,000 feet. We are considering down dip drilling opportunities on the flanks of the structure to evaluate this section further. We believe that this is the first hydrocarbon bearing Frio sand encountered either on the GOM Shelf or in the deepwater offshore Louisiana.
The Frio sand section below 30,000 feet is in addition to the 178 net feet of hydrocarbons in the Miocene previously announced in December 2010 above 25,000 feet at Blackbeard East. The pressure and temperature data below the salt weld between 19,500 feet and 24,600 feet indicate that a completion could utilize conventional equipment and technologies. In 2011, we plan to drill a 25,000 foot offset appraisal well to further evaluate and delineate these zones in the Miocene.
Blackbeard East is located in 80 feet of water on South Timbalier Block 144. We hold a 70.0 percent working interest and 56.2 percent net revenue interest in the well. Our investment in Blackbeard East totaled $168.3 million at December 31, 2010, a substantial majority of which is related to allocated PXP Acquisition costs.
The Lafitte ultra-deep exploration well commenced drilling on October 3, 2010 and is currently drilling below 18,700 feet towards a proposed total depth of 29,950 feet. Lafitte is located on Eugene Island Block 223 in 140 feet of water. The well is targeting Middle and Deep Miocene objectives and possibly Oligocene (Frio) sections below the salt weld. We hold a 72.0 percent working interest and 58.3 percent net revenue interest in Lafitte. Our investment in Lafitte totaled $51.3 million at December 31, 2010, a substantial majority of which is related to allocated PXP Acquisition costs.
The information gained from the Blackbeard East and Lafitte wells is expected to assist us in developing plans for future operations at Blackbeard West. As previously reported, the Blackbeard West ultra-deep exploratory well on South Timbalier Block 168 was drilled to 32,997 feet in 2008. Logs indicated four potential hydrocarbon bearing zones that require further evaluation and the well was temporarily abandoned. We are evaluating whether to drill deeper at Blackbeard West, drill an offset location or complete the well to test the existing zones. In January 2011, we were granted a new Suspension of Operations (SOO) from the BOEMRE at Blackbeard West. Under the new SOO we are required to advise BOEMRE of our decision to either deepen the existing well or drill an appraisal well by M ay 31, 2011 and commence operations by September 30, 2011. We hold a 67.3 percent working interest and 54.8 percent net revenue interest in the well. Our investment in Blackbeard West totaled $59.1 million at December 31, 2010, including allocated PXP Acquisition costs.
interval. We hold a 37.3 percent working interest and a 28.5 percent net revenue interest in the Laphroaig field. Our costs incurred in the Laphroaig No. 2 well totaled $7.5 million at December 31, 2010.
Boudin is located in 20 feet of water on Eugene Island Block 26. The well commenced drilling on February 27, 2011 and is drilling below 800 feet . Boudin has a proposed total depth of 23,100 feet and will test Miocene objectives. We hold a 74.1 percent working interest and a 58.8 percent net revenue interest in Boudin. Our investment in Boudin totaled $17.7 million at December 31, 2010, a substantial majority of which is related to allocated PXP Acquisition costs.
The Brazos A-23 well commenced drilling on February 13, 2011, and is currently drilling below 4,600 feet with a planned total depth of 16,120 feet. This traditional shelf well is targeting proven undeveloped reserves updip from logged pay zones. We hold a 100.0 percent working interest and a 81.25 percent net revenue interest in the well. Our investment in Brazos A-23, principally associated with lease acquisition costs, totaled $3.7 million at December 31, 2010.
As previously reported, a production test was performed in November 2010 on the Blueberry Hill #9 STK1 well. Results from the production test indicated a range of rates and pressures. The well flowed at a gross rate as high as approximately 22 million cubic feet of natural gas per day (MMcf/d) and 1,250 barrels of condensate on a 22/64th choke with flowing tubing pressure of 13,090 pounds per square inch (PSI) and the rate at the end of the testing period approximated 16 MMcf/d and 838 barrels of condensate on a 23/64th choke with flowing tubing pressure of 7,750 PSI. The well has been shut in pending plans for additional testing and evaluation of the well.
Blueberry Hill is located on Louisiana State Lease 340 in approximately 10 feet of water. We hold a 90.8 percent working interest and a 62.8 percent net revenue interest in the well. Our costs incurred in the Blueberry Hill #9 STK1 well totaled $33.0 million at December 31, 2010.
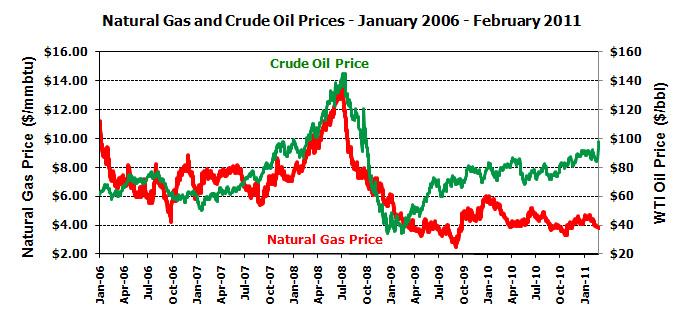
We currently sell our natural gas in the spot market at prevailing prices. Prices on the spot market fluctuate with demand as a result of related industry variables. We generally sell our crude oil and condensate one month at a time at then prevailing market prices. Oil and natural gas prices have fluctuated significantly over the past two years and we are unable to predict the future trend of oil and gas prices (see “North American Natural Gas and Oil Market Environment” in Items 7. and 7a.). We have entered, and may continue to enter, into transactions that fix the future prices for portions of our oil and natural gas sales volumes, through the issuance of oil and gas derivative contracts. See Note 7 for information regarding our oil and natural gas derivative contracts.
arrangements on reasonable terms to develop the MPEH™ project and obtain additional financing is subject to various uncertainties, many of which are beyond our control. For additional information on these and other risks, including without limitation, risks related to our reclamation obligations associated with the former assets and operations of the Main Pass facilities, see “Risk Factors” included in Item 1A. of this Form 10-K.
The BOEMRE has regulations governing the plugging and abandonment of wells located offshore and the installation and removal of all fixed drilling and production facilities. The BOEMRE generally requires that lessees have substantial net worth or post supplemental bonds or other acceptable assurances that the obligations will be met. The cost of these bonds or other surety can be substantial, and there is no assurance that supplemental bonds or other surety can be obtained in all cases. We are currently satisfying the supplemental bonding requirements of the BOEMRE by providing financial assurances from MOXY. We and our subsidiaries’ ongoing compliance with applicable BOEMRE requirements will be subject to meeting certain financial and other criteria. Under some circumstances, the BOEMRE could require any of our operations on feder al leases to be suspended or terminated. Any suspension or termination of our operations for a prolonged duration would likely have a material adverse affect on our financial condition and results of operations.
The Oil Pollution Act also requires a responsible party to submit proof of its financial responsibility to cover environmental cleanup and restoration costs that could be incurred in connection with an oil spill. The Oil Pollution Act requires parties responsible for offshore facilities to provide financial assurance in amounts that vary from $35 million to $150 million depending on a company’s calculation of its “worst case” oil spill. Both Freeport Energy and MOXY currently have insurance to cover its facilities’ “worst case” oil spill under the Oil Pollution Act regulations. As a result, we believe that we are in compliance with the Oil Pollution Act.
At December 31, 2010, we had a total of 120 employees located at our New Orleans, Louisiana headquarters and our Houston, Texas and Lafayette, Louisiana offices. These employees are primarily devoted to production, regulatory, engineering, land, geological and various administrative functions. None of our employees are represented by any union or covered by a collective bargaining agreement, and we believe our relations with our employees are satisfactory.
Additionally, numerous services necessary for our business and operations, including certain executive, technical, administrative, accounting, financial, tax and other services, are performed by FM Services Company (FM Services) pursuant to a services agreement. FM Services is a wholly owned subsidiary of Freeport-McMoRan Copper & Gold Inc. Either party may terminate the services agreement at any time upon 90 days notice.
We also use contract personnel to perform various professional and technical services, including but not limited to drilling, construction, well site surveillance, environmental assessment, and field and on-site production operating services. These services are intended to minimize our development and operating costs as well as allow our management staff to focus on directing our oil and gas operations.
property acquisition, including expectations regarding reserve estimates and production rates. The words “anticipates,” “may,” “can,” “plans,” “believes,” “estimates,” “expects,” “projects,” “intends,” “likely,” “will,” “should,” “to be,” and any similar expressions and/or statements that are not historical facts are intended to identify those assertions as forward-looking statements.
We believe that our forward-looking statements are based on reasonable assumptions. However, we caution readers that these statements are not guarantees of future performance or exploration and development success, and our actual exploration experience and future financial results may differ materially from those anticipated, projected or assumed in the forward-looking statements. Important factors that may cause our actual results to differ materially from those anticipated by the forward-looking statements include, but are not limited to, those associated with general economic and business conditions, failure to realize expected value creation from property acquisitions, including the recent acquisition of assets from PXP, exercise of preferential rights to purchase, variations in the market demand for, and prices of, oil and natural ga s, drilling results, unanticipated fluctuations in flow rates of producing wells due to mechanical or operational issues (including those experienced by wells operated by third parties where we are a participant), oil and natural gas reserve expectations, the potential adoption of new governmental regulations (including any enhanced regulatory oversight attributable to the governmental response to the Deepwater Horizon incident), failure of third party partners to fulfill their commitments, the ability to satisfy future cash obligations and environmental costs, adverse conditions, such as high temperatures and pressure that could lead to mechanical failures or increased costs, the ability to hold current or future lease acreage rights, the ability to satisfy future cash obligations and environmental costs, access to capital to fund drilling activities, as well as other general exploration and development risks and hazards, and other factors.
Investors are cautioned that many of the assumptions upon which our forward-looking statements are based are likely to change after our forward-looking statements are made, including for example the market prices of oil and natural gas, which we cannot control, and production volumes and costs, some aspects of which we may or may not be able to control. Further, we may make changes to our business plans that could or will affect our results. We caution investors that we do not intend to update our forward-looking statements more frequently than quarterly, notwithstanding any changes in our assumptions, changes in our business plans, our actual experience, or other changes, and we undertake no obligation to update any forward-looking statements.
Important factors that could cause actual results to differ materially from our expectations include, without limitation, the following:
Risks Relating to Financial Matters
We need significant amounts of cash to service our debt. If we are unable to generate sufficient cash to service our debt, our financial condition and results of operations could be negatively affected.
As of December 31, 2010 our outstanding debt totaled $560.0 million, including $185.3 million of our 4% senior notes due December 30, 2017, $300 million of our 11.875% Senior Notes due November 15, 2014 and $74.7 million of our 5¼% Senior Notes due October 6, 2011 as further described in Note 6. We must generate sufficient amounts of cash to service and repay our debt and to conduct our planned exploration and development activities. Our ability to generate cash will be affected by general economic, financial, competitive, legislative, regulatory and other factors that are beyond our control. Future borrowings may not be available to us under our amended and restated credit facility or from the capital markets in amounts sufficient to pay our obligations as they mature or to fund other liquidity needs. In addition, disrup tions in the credit and financial markets, such as those beginning in late 2008, can constrain our access to capital and increase its cost. The inability to service, repay or refinance our indebtedness would have a negative impact on our financial condition and results of operations.
Agreements governing our indebtedness restrict our ability to incur additional debt and may limit our ability to respond to opportunities as they arise or execute our capital spending and related initiatives.
The terms of our amended and restated credit facility and other financing agreements governing our indebtedness restrict our ability to incur additional debt. Additionally, because the availability under
our credit facility is subject to a borrowing base determined by the estimated future cash flows from our oil and natural gas reserves, a decline in the pricing for these commodities may result in a reduction in our borrowing base, which reduction could be significant, and as a result, would reduce the capital available to us.
If future debt financing is not available to us when required (as a result of limited access to the credit markets or otherwise), or is not available on acceptable terms, we may be unable to invest needed capital for our drilling and exploration activities, take advantage of business opportunities, respond to competitive pressures or refinance maturing debt, or be forced to sell some of our assets on an untimely basis or under unfavorable terms, any of which could have a material adverse effect on our financial condition and results of operations.
Our credit facility contains covenants and other restrictions customary for oil and gas borrowing base credit facilities, including limitations on debt, liens, dividends, voluntary redemptions of debt, investments, asset sales and transactions with affiliates. In addition, our credit facility requires that we maintain certain financial tests, including a leverage test (Total Debt to EBITDAX, as those terms are defined in the facility, for the preceding four quarters) and a secured leverage test (First Lien Debt to EBITDAX, as those terms are defined in the facility, for the preceding four quarters), and a current ratio test (current assets to current liabilities, subject to certain adjustments as of the end of the quarter). During periods in which crude oil and natural gas prices or other conditions reflect the adverse impact of cyclical market trends or other factors, we may not be able to comply with the applicable financial covenants, which could have a material adverse effect on our financial condition.
Volatile oil and gas prices could adversely affect our financial condition and results of operations.
Our success is largely dependent on oil and natural gas prices, which are extremely volatile. Any substantial or extended decline in the price of oil and gas will have a negative impact on our business operations and future revenues. Moreover, oil and gas prices depend on factors we cannot control, such as:
| | • | | supply and demand for oil and gas and expectations regarding supply and demand; |
| | • | | actions by OPEC and other major producing companies; |
| | • | | political conditions in other oil-producing and gas-producing countries, including the possibility of insurgency, terrorism or war in such areas; |
| | • | | the prices of foreign exports and the availability of alternate fuel sources; |
| | • | | general economic conditions in the United States and worldwide, including the value of the U.S. dollar relative to other major currencies; and |
| | • | | governmental regulations. |
With respect to our business, prices of oil and gas will affect:
| | • | | our revenues, cash flows, profitability and earnings; |
| | • | | our ability to attract capital to finance our operations and the cost of such capital; |
| | • | | the amount that we are allowed to borrow; and |
| | • | | the value of our oil and gas properties and our oil and gas reserve volumes. |
If crude oil and natural gas prices decrease or our exploration efforts are unsuccessful, we may be required to write down the capitalized costs of individual oil and natural gas properties.
From time to time, declines in the market price for oil and natural gas coupled with certain other operational factors could trigger impairment assessments that may ultimately result in impairment charges to reduce the carrying values of our properties. Additional write-downs of the capitalized costs of individual oil and natural gas properties may occur if information comes to our attention to warrant a downward adjustment to our estimated proved oil and gas reserves, to increase in our estimates of development costs or to conclude that the results of exploratory drilling will be unproductive. A write-down could adversely affect our results of operations and financial condition and the trading prices of our securities.
We use the successful efforts accounting method which requires all property acquisition costs and costs of exploratory and development wells to be capitalized when incurred, pending the determination of whether proved reserves are discovered. Additionally, we assess our properties for impairment periodically, based on future estimates of proved and risk-adjusted probable reserves, oil and natural gas prices, production rates and operating, development and reclamation costs based on operating budget forecasts.
If the capitalized costs of our oil and natural gas properties, on a field-by-field basis exceed the estimated future net cash flows of that field, we record impairment charges to reduce the capitalized costs of each such field to our revised estimate of the field’s fair market value. We also record charges if proved reserves are not discovered at exploratory wells. These impairment charges will reduce our earnings and stockholders’ equity. Once incurred, an impairment charge cannot be reversed at a later date even if we experience subsequent increases in the price of oil or natural gas, or both, or increases in the amount of our estimated proved reserves.
Increasing domestic production and availability of unconventional sources of gas, including liquefied natural gas and gas extracted from shale formations, may reduce the price of natural gas, and could have an adverse effect on our financial condition and results of operations.
Over the recent past, there has been an increase in the worldwide supply of unconventional gas, including liquefied natural gas (LNG) and gas extracted from shale formations utilizing advances in techniques for horizontal drilling and the fracturing of rock formations. While production of gas from unconventional sources is a relatively small portion of current North American gas production, it has been increasing and is expected to continue to increase in the future.
As described more fully in Items 7. and 7A. “Management’s Discussion and Analysis of Financial Condition and Results of Operation and Quantitative and Qualitative Disclosures About Market Risk,” our production volume for 2010 is comprised of approximately 75 percent natural gas and our revenues are generally more sensitive to changes in the market price of natural gas than to changes in the market price of oil. As a result, any significant or prolonged increase in the domestic or worldwide supply of unconventional gas may result in a reduction in the volume and price of the natural gas we produce, which could have an adverse effect on our financial position and results of operations.
Our ability to collect our accounts receivable depends on the continuing creditworthiness of our customers.
The majority of our accounts receivable result from oil and natural gas sales or joint interest billings to third parties in the energy industry. Our credit risk associated with these third parties may increase as we produce and sell oil and natural gas on a larger scale. Additionally, economic conditions and the price of oil and natural gas may, among other things, impair our ability to timely collect our receivables from these parties, result in downgrades to the credit ratings of our customers or other third parties that do business with us, or have other adverse consequences. While we sell oil and natural gas to third parties that we believe are reasonable credit risks, there is no guarantee, especially in light of these factors, that the risk associated with the creditworthiness of these parties will not increase.
Our future revenues will be reduced as a result of agreements that we have entered into and may enter into in the future with third parties. Any failure of our partners to fulfill their obligations and commitments to us could have an adverse effect on our financial condition and results of operations.
We currently have agreements with third parties to support the funding of the exploration and development of certain of our properties and we may seek to enter into additional farm-out or similar arrangements with other third parties in the future.
Our ownership interest in prospects subject to farm-out or other exploration arrangements revert to us only upon the achievement of a specified production threshold or the receipt by our partners and co-ventures of specified net production proceeds. Consequently, even if exploration and development of our prospects is successful, we cannot give assurance that such exploration and development will result in an increase in our revenues or our proved oil and gas reserves or when such increases might occur.
Additionally, our ability to enter into future beneficial relationships with third parties for our exploration and production activities may be limited, and as a result, may have an adverse effect on our current operational strategy and related business initiatives. Our farm-out partners and working interest co-owners may also be unwilling or unable to pay their share of the costs of projects as they become due. In the case of a farm-out partner, we would either have to find a new farm-out partner or obtain alternative funding in order to complete the exploration and development of the prospects subject to the farm-out agreement. In the case of a working interest owner, we could be required to pay the working interest owner’s share of the project costs. The degree to which these and other factors may adversely impact our partners and third-party operators (and the extent of any associated affect on us) is uncertain.
We enter into contractual commitments with third parties related to our planned oil and gas exploration and development activities, including costs related to projects currently in progress, inventory purchase commitments and other exploration expenditures, some of which may be substantial. Additionally, a portion of our exploration program involves the sharing of certain costs associated with these expenditures with our partners.
At December 31, 2010, we had $385.1 million of contractual commitments related to our planned oil and gas exploration and development activities, including $176.7 million of expenditures for drilling rig contract charges, portions of which we expect to share with our partners in our exploration program. A failure of our partners to fulfill their obligations or commitments to us, would have an adverse effect on our operating results and financial condition.
We have incurred losses from our operations in the past and may continue to do so in the future. Our failure to achieve profitability in the future could adversely affect the trading price of our securities and our ability to raise additional capital, especially in the current market.
Our losses from continuing operations were $117.0 million in 2010, $204.9 million in 2009 and $211.2 million in 2008. No assurance can be given that we will achieve profitability or positive cash flows from our operations in the future. Our failure to achieve profitability in the future could adversely affect the trading price of our securities and our ability to raise additional capital. In addition, while there are signs that the global economy has improved, the potential remains for further volatility and disruption in the capital and credit markets. During the recent global recession, the markets produced downward pressure on stock prices and credit capacity for certain issuers without regard to those issuers’ underlying financial strength. If these levels of market disruption and volatility return, our business, fin ancial condition and results of operations, as well as our ability to access capital, may all be negatively impacted.
We are responsible for reclamation, environmental indemnification and other obligations associated with our oil and gas properties and our former sulphur operations.
As of December 31, 2010, we had accrued $358.6 million relating to reclamation liabilities with respect to our oil and gas properties. Among these reclamation obligations are the plugging and abandonment of wells, the reclamation and removal of platforms, facilities and pipelines and the repair and replacement of wells, equipment and facilities, including obligations associated with damages sustained from Hurricanes Katrina, Rita and Ike. The scope and cost of these obligations may ultimately be materially greater than currently estimated.
As of December 31, 2010, we had $12.0 million relating to accrued reclamation liabilities with respect to our discontinued sulphur operations at Main Pass and $13.2 million relating to accrued reclamation liabilities with respect to our other discontinued sulphur operations, including $11.8 million for the Port Sulphur facilities. We are continuing to conduct closure activities at the Port Sulphur facilities following damages sustained by the facilities from Hurricanes Katrina and Rita in 2005.
We cannot assure you that actual reclamation costs ultimately incurred will not exceed our current and future accruals for reclamation costs, that we will have the necessary resources to satisfy these obligations in the future, or that we will be able to satisfy applicable bonding requirements.
In addition, we are responsible for indemnification obligations related to the former sulphur operations previously engaged in by us and our predecessor companies. We have also assumed, and agreed to indemnify IMC Global Inc. (now a subsidiary of Mosaic Company) from certain potential obligations, including environmental obligations relating to historical oil and gas operations conducted by the Freeport-McMoRan companies prior to the 1997 merger of Freeport-McMoRan Inc. and IMC Global. We have also assumed and agreed to indemnify Newfield Exploration Company (Newfield) from certain potential obligations, including environmental obligations relating to our 2007 oil and gas property acquisition. The scope and cost of these obligations may ultimately be materially greater than estimated at the time such indemnifications were granted and the related obligations were assumed. Our liabilities with respect to those obligations could adversely affect our operations and liquidity.
Risks Relating to our Operations
The high-rate production characteristics of our Gulf of Mexico properties subject us to high reserve replacement needs. If we are unable to replace the reserves that we have produced, our reserves and revenues will decline.
Our future success depends in large part on our ability to find, develop and produce oil and natural gas reserves, and we cannot give assurance that we will be able to do so profitably. Unless we conduct successful exploration and development activities, acquire properties with proved reserves, or meet certain production and related thresholds with respect to our prospects subject to farm-out arrangements, our proved reserves will be depleted as they are produced.
Producing natural gas and oil reservoirs are generally characterized by declining production rates that vary depending on reservoir characteristics and other factors. Production from the Gulf of Mexico shelf generally declines at a faster rate than in other producing regions of the world. Reservoirs in the Gulf of Mexico shelf are generally sandstone reservoirs characterized by high porosity and high permeability that results in an accelerated recovery of production in a relatively short period of time, with a generally more rapid decline near the end of the life of the reservoir. This results in recovery of a relatively higher percentage of reserves during the initial years of production, and a corresponding need to replace these reserves with discoveries at new prospects within a relatively short time frame. There can be no assurance that we will be able to replenish our reserves at attractive prices or within a suitable timeframe.
We will require additional capital to fund our future drilling activities and the development of other projects. If we fail to obtain additional capital, we may not be able to continue our operations or the development of these projects.
Historically, we have funded our operations and capital expenditures through:
| | • | our cash flow from operations; |
| | • | entering into exploration arrangements with third parties; |
| | • | selling oil and gas properties; |
| | • | borrowing money from banks; |
• issuing senior notes; and
| | • | selling preferred stock, common stock and securities convertible into common stock. |
We incurred $217.3 million in capital expenditures in 2010. Depending on drilling results and follow on development opportunities, we expect 2011 capital expenditures to be at least $300 million and potentially as high as $500 million. The low end of the range includes approximately $200 million in exploration and $100 million in development spending. These expenditures could fluctuate depending on the success of our drilling efforts and market conditions. Although we intend to fund our near-term expenditures with available cash, operating cash flows and borrowings under our senior secured revolving credit facility, we may need to consider the availability of raising additional capital through future equity or debt transactions to continue our drilling activities and other project developments.
In the near-term, we plan to continue to pursue the drilling of our exploration prospects, although we have and will continue to adjust our drilling plan and capital expenditures as necessary. However, without adequate capital resources, our drilling and other activities may be limited and our business, financial condition and results of operations may be adversely affected.
Our exploration and development activities may not be commercially successful.
Oil and natural gas exploration and development activities involve a high degree of risk that hydrocarbons will not be found, that they will not be found in commercial quantities, or that the value produced will be less than the related drilling, completion and operating costs. The 3-D seismic data and other technologies that we use provide no assurance prior to drilling a well that oil or natural gas is present or economically producible. The cost of drilling, completing and operating a well is often uncertain, especially when drilling offshore and when drilling deep and ultra-deep wells. Our drilling operations may be changed, delayed or canceled as a result of numerous factors that we cannot control, including:
| | • | continued economic uncertainty the global financial and credit markets; |
| | • | the market price of oil and natural gas; |
| | • | unexpected drilling conditions; |
| | • | unexpected pressure or irregularities in geologic formations; |
| | • | equipment failures or accidents; |
| | • | tropical storms, hurricanes and other adverse weather conditions, which are common in the Gulf of Mexico during certain times of the year; |
| | • | regulatory requirements; and |
| | • | equipment and labor shortages resulting in cost overruns. |
Additionally, completion of a well does not guarantee that it will be profitable or even that it will result in recovery of the related drilling, completion and operating costs.
We anticipate that any of our near-term exploration and development activities will take place on deep and ultra-deep shelf prospects in the shallow waters of the Gulf of Mexico, an area that has had limited historical drilling activity due, in part, to its geologic complexity. Deeper targets are more difficult to
detect with traditional seismic processing and the expense of drilling deep shelf wells and the risk of mechanical failure is significantly higher because of the higher temperatures and pressures found at greater depths. Our exploratory wells require significant capital expenditures (typically ranging between $10-$50 million, net to our interests) before we can ascertain whether they contain commercially recoverable oil and natural gas reserves. Prior experience also suggests that the gross drilling costs for deep shelf exploratory wells can potentially exceed as much as $100 million per well. We cannot assure you that we will have, or be able to obtain, sufficient capital to pursue these expenditures or that our oil and natural gas exploration activities, either on the deep or ultra-deep shelf or elsewhere, will be commerc ially successful.
Our Davy Jones ultra-deep prospect has not yet been fully evaluated, and the ultimate impact of this potentially significant discovery will depend on, among other things, the volume of recoverable resources from the Davy Jones location and our ability to fund its commercial development through internally generated cash or third party funding.
In January 2010 we announced a potentially significant discovery at our Davy Jones ultra-deep prospect, with preliminary results indicating that certain hydrocarbon bearing sands may be of exceptional quality. However, flow testing is required to confirm the ultimate hydrocarbon flow rates from the separate zones within this prospect. While we are working to complete the flow test of this site as quickly as possible, the timing of completion and flow testing is dependent upon, among other things, the availability of necessary equipment required to handle the pressures and temperatures encountered in the well. As a result, there is no assurance as to when we will be able to complete flow testing of this prospect, or that once completed, our previously expressed expectations as to the size of the discovery in terms of recoverable product w ill be confirmed. There has been no production of oil and natural gas from ultra-deep reservoirs on the shelf of the Gulf of Mexico and such production may present technical challenges.
The commercial development and exploitation of the Davy Jones prospect will also require significant additional capital expenditures. As stated elsewhere in this Form 10-K, we have historically funded our operations and capital expenditures from, among other things, cash flow from operations and partnering arrangements with third parties. If we are unable to generate sufficient cash flow to appropriately fund the anticipated capital expenditures associated with the exploitation of this prospect, are unable to secure appropriate partners to share in these costs, or are otherwise unable to access capital in amounts sufficient to cover any projected shortfall, our ability to fully exploit this prospect may be adversely affected.
In the event we are unable to procure or maintain the suspension of operations (SOO) granted by the BOEMRE with respect to certain of our ultra-deep gas play acreage, our ability to fully realize value associated with such acreage could be adversely affected.
Our interests in the offshore leases located in federal waters on the Gulf of Mexico’s outer continental shelf are administered by the BOEMRE and require compliance with BOEMRE regulations and the Outer Continental Shelf Lands Act (OCSLA). Under the OCSLA, we are required to promptly and efficiently explore and develop any block or blocks to which these federal leases pertain within the initial term of such lease.
During the term of the initial term of a lease, our ability to drill, rework, or produce a particular well in paying quantities may, despite our diligent efforts, be delayed. In this case, we have the ability to request that the BOEMRE extend the lease term beyond its scheduled expiration or termination. Provided our request in this regard is made timely and in accordance with regulatory guidelines, the BOEMRE may grant or direct an SOO on the condition that we commit to undertake or complete certain specified actions during the extended term. While the decision of the BOEMRE to grant or direct an SOO is made on a case-by-case basis, an SOO, if granted, is of limited duration.
At December 31, 2010, approximately 24,500 of the 200,000 (or approximately 12%) of the gross acres associated with our ultra-deep gas play were held under SOO’s issued by the BOEMRE effective through May 31, 2011. In addition, we have an additional 6,300 gross acres associated with our ultra-deep gas play which are scheduled to expire in 2011.
While it is not uncommon for companies in our industry to continue to operate leases under an SOO granted by the BOEMRE, in the event (1) we fail to satisfy any obligations or conditions set forth in
an SOO with respect to a particular lease, (2) we are unable to procure an SOO from the BOEMRE prior to the expiration of a primary lease term, (3) the BOEMRE denies a request to grant an additional SOO (or an extension of an existing SOO) with respect to a particular lease, or (4) the BOEMRE terminates an SOO previously granted based on a determination that either the circumstances justifying the SOO no longer exist or that the lease otherwise now warrants termination, our ability to exploit some of the potentially valuable acreage associated with our ultra-deep gas play (including certain acreage contiguous to our Davy Jones and Blackbeard discoveries) could be adversely affected.
The accounting methods we use to record our exploration results may result in losses.
We use the successful efforts accounting method for our oil and natural gas exploration and development activities. This method requires us to expense geologic and geophysical costs and the costs of unsuccessful exploration wells as they are incurred, rather than capitalizing these costs up to a specified limit as permitted pursuant to the full cost accounting method. Because the timing difference between incurring exploration costs and realizing revenues from successful properties can be significant, losses may be reported even though exploration activities may be successful during a reporting period. Accordingly, depending on our exploration results, we may incur significant additional losses as we continue to pursue our exploration activities. We cannot assure you that our oil and gas operations will enable us to achieve or sustain po sitive earnings or cash flows from operations in the future.
To sell our natural gas and oil we depend upon the availability, proximity and capacity of natural gas gathering systems, pipelines and processing facilities, which are owned by third parties.
To sell our natural gas and oil we depend upon the availability, operation and capacity of natural gas gathering systems, pipelines and processing facilities, which are owned by third parties. If, among other things, these systems and facilities are unavailable, lack available capacity due to hurricane damage, or are (or become) affected by financial crisis and unpredictable pricing of oil and gas, we could be forced to shut in producing wells or delay or discontinue development plans. Additionally, federal and state regulation of oil and natural gas production and transportation, general economic conditions and changes in supply and demand could also adversely affect our ability to produce and market our oil and natural gas.
The amount of oil and natural gas that we produce and the net cash flow that we receive from that production may differ materially from the amounts reflected in our reserve estimates.
Our estimates of proved oil and natural gas reserves are based on reserve engineering estimates using guidelines established by the SEC. Reserve engineering is a subjective process of estimating recoveries from underground accumulations of oil and natural gas that cannot be measured with complete accuracy. The accuracy of any reserve estimate depends on the quality of available data and the application of engineering and geological interpretation and judgment. Estimates of economically recoverable reserves and future net cash flows depend on a number of variable factors and assumptions, such as:
| | • | historical production from the area compared with production from other producing areas; |
| | • | assumptions concerning future oil and natural gas prices, future operating and development costs, workover, remediation and abandonment costs and severance and excise taxes; |
| | • | the effects that hedging contracts may have on our sales of oil and natural gas; and |
| | • | the assumed effects of government regulation and taxation. |
These factors and assumptions are difficult to predict and may vary considerably from actual results. In addition, reserve engineers may make varying estimates of reserve quantities and cash flows based on different interpretations of the same available data. Also, estimates of proved reserves for wells with limited or no production history are less reliable than those based on actual production. Subsequent evaluation of the same reserves may result in variations in our estimated reserves, which may be substantial. As a result, all reserve estimates are imprecise.
You should not construe the estimated present values of future net cash flows from proved oil and natural gas reserves as the current market value of our estimated proved oil and natural gas reserves. As required by the SEC, we have estimated the discounted future net cash flows from proved reserves based on average prices, calculated as the twelve-month average of the first day of the month prices as adjusted for location and quality differentials, and costs prevailing at December 31, 2010. There are no adjustments to normalize those costs based on variations over time either before or after that year. Future prices and costs may be materially higher or lower. Future net cash flows also will be affected by such factors as:
| | • | the actual amount and timing of production; |
| | • | changes in consumption by oil and gas purchasers; and |
| | • | changes in governmental regulations and taxation. |
In addition, the 10 percent discount factor, which is required by the SEC to be used in calculating discounted future net cash flows for reporting purposes, is not necessarily the most appropriate discount factor to be used in determining market values of proved oil and gas reserves. Changes in market interest rates at various times and the risks associated with our business or the oil and gas industry can vary significantly.
We cannot control the activities related to properties we do not operate.
Other companies operate several of the properties in which we have an interest. We have a limited ability to exercise influence over the operation of these properties or their associated costs. The success and timing of our drilling and development activities on properties operated by others therefore depend upon a number of factors outside of our control, including:
| | • | timing and amount of capital expenditures; |
| | • | the operator’s expertise, financial resources, and ability to sustain operations through periods of distressed or adverse economic conditions; |
| | • | approval of operators or other participants in drilling wells; and |
| | • | selection of technology. |
Hedging our production may expose us to various risks.
We may enter into hedging transactions to reduce our exposure to fluctuations in the market prices of oil and natural gas. These positions may also limit our potential profits if oil and natural gas prices were to rise significantly over the stated price in these contracts.
Hedging will expose us to risk of financial loss in some circumstances, including if:
| | • | production is delayed or less than expected; |
| | • | the counterparty to the hedging contract is unable to satisfy its obligations; or |
| | • | there is an adverse change in the expected differential between the underlying price in the hedging agreement and actual prices received for our production. |
Additionally, the ability of the financial institution counterparties to our hedging contracts to meet their obligations under such contracts may be adversely affected by market conditions. This may expose us to additional risks in realizing any benefits associated with our hedge positions. The level of derivative activity depends on or view of market conditions, available derivative prices and our operating stategy.
Compliance with environmental and other government regulations could be costly and could negatively affect production.
Our operations are subject to numerous laws and regulations governing the discharge of materials into the environment or otherwise relating to environmental protection, including without limitation, the Oil Pollution Act of 1990 (which imposes a variety of legal requirements on “responsible parties” related to the prevention of oil spills). These laws and regulations may:
| | • | require the acquisition of a permit before drilling commences; |
| | • | restrict the types, quantities and concentration of various substances that can be released into the environment from drilling and production activities; |
| | • | limit or prohibit drilling activities on certain lands lying within wilderness, wetlands and other protected areas; |
| | • | require remedial measures to address or mitigate pollution from former operations, such as plugging abandoned wells; |
| | • | require bonds or the assumption of other financial responsibility requirements to cover drilling contingencies and well plugging and abandonment costs; |
| | • | impose substantial liabilities for pollution resulting from our operations; and |
| | • | require capital expenditures for pollution control equipment. |
Additionally, new environmental laws or changes in existing laws (or their enforcement) may be enacted, and such new laws or changes may adversely affect the demand for our products or require significant additional expenditures by us to appropriately comply.
For example, recent scientific studies have suggested that emissions from the combustion of carbon-based fuels contribute to greenhouse effects and global climate change. In response to these findings, both federal and state governments have introduced or are contemplating regulatory changes regarding greenhouse gas emissions. The potential impacts of the passage of new climate change legislation or regulations to address, regulate or restrict the release of greenhouse gases are uncertain, and any such future laws could have an adverse effect on the general demand for the oil and natural gas that we produce or result in increased expenditures or additional operating expenditures.
Our operations could also result in liability for personal injury, property damage, oil spills, natural resource damages, discharge of hazardous materials, remediation and clean-up costs and other environmental damages. Liability under environmental laws can be imposed retroactively and without regard to whether we knew of, or were responsible for, the presence of contamination on properties that we own or operate. Such liability may also be joint and several, meaning that the entire liability may be imposed on a party without regard to contribution. We could also be liable for environmental damages caused by previous property owners. As a result, substantial liabilities to third parties or governmental entities may be incurred, which could have a material adverse effect on our results of operations and financial condition. We could also be held liable for any and all consequences arising out of human exposure to hazardous substances, including without limitation, asbestos-containing materials or other environmental damage which liability could be substantial.
The catastrophic explosion of the Deepwater Horizon in the Gulf of Mexico will likely result in new governmental regulations relating to drilling, exploration and production activities in U.S. coastal waters, which could adversely affect our operations.
In April 2010, the Deepwater Horizon, an offshore drilling rig located in the deepwater of the Gulf of Mexico, sank following a catastrophic explosion and fire, which significantly and adversely disrupted oil & gas exploration activities in the Gulf of Mexico. The commission appointed by the President to study the causes of the catastrophe released its report and has recommended to the President certain legislative and regulatory measures that should be taken in order to minimize the possibility of a reoccurrence of a disastrous spill. In response to the Deepwater Horizon spill and the release of the commission report,
various bills are being considered by Congress which, if enacted, could either significantly increase the costs of conducting drilling and exploration activities in the Gulf of Mexico, particularly in deepwater, or substantially curtail Gulf of Mexico drilling and operation activity.
Our operations are focused on the shelf of the Gulf of Mexico and Gulf Coast areas, where we maintain one of the largest acreage positions in the shallow waters of this region and have a significant number of ongoing exploration and development projects. In response to the catastrophe, the United States government imposed a suspension of all deepwater drilling and exploration activity in the Gulf of Mexico that expired on November 30, 2010. We do not operate in the deepwater of the Gulf of Mexico. However, although exploration activity in the shallow waters of the Gulf of Mexico has been allowed to re-commence, a de facto suspension has existed in that market, as new safety and permitting requirements have been imposed on shallow water operators, and only a limited number of new drilling permits have been issued to shallow wat er operators since the catastrophe.
There are a number of uncertainties affecting the oil and gas industry that continue to exist in the aftermath of the Deepwater Horizon events and the release of the commission report, including the possible increase or elimination of the current $75 million cap for non-reclamation liabilities under the Oil Pollution Act of 1990, the uncertainty as to the continued availability and affordability of insurance for drilling and exploration activities, the uncertain overall legislative and regulatory response to the catastrophe, and the continuing difficulty and delay in obtaining drilling permits in the shallow water on a timely basis. Although the eventual outcome of these developments is currently unknown, additional regulatory and operational costs could have an adverse effect on o ur financial condition and results of operations.
The oil and gas industry is highly competitive and we face strong competition.
The business of oil and natural gas exploration, development and production is very competitive. Competition is particularly intense for prospective undeveloped acreage and purchases of proved oil and gas reserves. There is also competition for the rigs and related equipment and services that are necessary for us to develop and operate our oil and natural gas properties. Our competitive position is also highly dependent on our ability to recruit and retain geological, geophysical and engineering expertise. We compete for prospects, proved reserves, field services and qualified oil and gas professionals with major integrated oil and gas companies and numerous independent oil and gas companies, individual producers and operators. Many of our competitors have significantly greater financial and other resources than we h ave and may be better positioned to:
| | • | access capital at a lower cost; |
| | • | adapt to fluctuations in the credit markets and periods of distressed or adverse economic conditions; |
| | • | adapt to an increasingly burdensome regulatory environment, particularly with respect to bearing increased compliance costs, in response to the Deepwater Horizon or other catastrophic events and uncertainties; |
| | • | define, evaluate, bid for and purchase properties and prospects; |
| | • | obtain equipment, supplies and labor on favorable terms; |
| | • | develop, or buy, and implement new technologies; and |
| | • | access more information relating to prospects. |
Offshore operations are hazardous, and the hazards are not fully insurable at commercially reasonable costs.
Our operations are subject to the hazards and risks inherent in drilling for, producing and transporting oil and natural gas. These hazards and risks include:
| | • | abnormal pressures in geologic formations; |
If any of these or similar events occur, we could incur substantial losses as a result of death, personal injury, property damage, pollution, lost production, remediation and clean-up costs and other environmental or catastrophic damages.
We have historically maintained insurance for our operations, including liability, property damage, control of well, business interruption (when economically feasible), limited coverage for sudden and accidental environmental damages and other insurance. Due to increased claims made by insureds for losses experienced in recent years from hurricanes in the Gulf of Mexico, and disruption in the domestic and global financial markets, the windstorm component of property damage and control of well insurance coverage has become more limited in scope and amount and the cost of coverage has increased. The reduced windstorm component of our property damage and control of well insurance coverage may increase our risks of casualty loss which could have a material adverse effect on our results of operations and financial condition. & #160;We no longer carry windstorm business interruption insurance as the increased level of hurricane activity in the Gulf of Mexico in recent years increased premiums to levels that are currently no longer cost effective. Any insurance that we purchase will not provide protection against all potential liabilities incident to the ordinary conduct of our business. Moreover, any insurance we maintain will be subject to coverage exclusions, limits, deductibles and other conditions. In addition, our insurance will not cover damages caused by war or environmental damages that occur over time. The occurrence of a material casualty loss that is not covered by insurance would adversely affect our results of operations and financial condition.
We are vulnerable to risks associated with operating in the Gulf of Mexico because we currently explore and produce exclusively in that area.
Our strategy of concentrating our exploration and production activities on the Gulf of Mexico makes us more vulnerable to the risks associated with operating in that area than our competitors with more geographically diverse operations. These risks include:
| | • | tropical storms and hurricanes, which are common in the Gulf of Mexico during the summer and early fall of each year; |
| | • | extensive governmental regulation (including regulations that may, in certain circumstances, impose strict liability for pollution damage); and |
| | • | interruption or termination of operations by governmental authorities based on environmental, safety or other considerations. |
These exposures in the Gulf of Mexico could have a material adverse effect on our results of operations and financial condition.
Shortages of supplies, equipment and personnel may adversely affect our operations.
Our ability to conduct operations in a timely and cost effective manner depends on the availability of supplies, equipment and personnel. The offshore oil and gas industry is cyclical and experiences periodic shortages of drilling rigs, work boats, tubular goods, supplies and experienced personnel. Shortages can delay operations and materially increase operating and capital costs.
The loss of key personnel could adversely affect our ability to operate.
We depend, and will continue to depend in the foreseeable future, on the services of our senior officers and other key employees, as well as other third-party consultants with extensive experience and expertise in:
| | • | evaluating and analyzing drilling prospects and producing oil and gas from proved properties; and |
| | • | maximizing production from oil and natural gas properties. |
Our ability to retain our senior officers, other key employees and our third party consultants, none of whom are subject to employment agreements with us, is important to our future success and growth. The unexpected loss of the services of one or more of these individuals could have a detrimental effect on our business.
We may not be able to obtain the necessary financing to complete the development of the Main Pass Energy Hubtm Project (MPEHtm), and once operational, the MPEHtm project would be subject to certain risks.
Our long-term business objectives may include the pursuit of a multifaceted energy services development of the MPEHtm project. Should we decide to pursue this facility, we may not be able to obtain the necessary financing to complete its development and any such financing may be limited by restrictions contained in our existing financing agreements, or the financial, commodity and credit markets generally. Additionally, the MPEHtm project, once operational, would be subject to significant operating hazards and uninsured risks, one or more of which may create significant liabilities for us.
None.
We may from time to time be involved in various legal proceedings of a character normally incident to the ordinary course of our business. We believe that potential liability from any of these pending or threatened proceedings will not have a material adverse effect on our financial condition or results of operations. We maintain liability insurance to cover some, but not all, of the potential liabilities normally incident to the ordinary course of our businesses as well as other insurance coverages customary in our business, with coverage limits as we deem prudent.
Executive Officers of the Registrant
Listed below are the names and ages, as of February 11, 2011, of the present executive officers of McMoRan together with the principal positions and offices with McMoRan held by each.
| Name | | Age | | Position or Office |
| James R. Moffett | | 72 | | Co-Chairman of the Board, President |
| | | | | and Chief Executive Officer |
| | | | | |
| Richard C. Adkerson | | 64 | | Co-Chairman of the Board |
| | | | | |
| C. Howard Murrish | | 70 | | Executive Vice President |
| | | | | |
| Nancy D. Parmelee | | 59 | | Senior Vice President, Chief Financial Officer |
| | | | | and Secretary |
| | | | | |
| Kathleen L. Quirk | | 47 | | Senior Vice President and Treasurer |
| | | | | |
James R. Moffett has served as our Co-Chairman of the Board since November 1998 and our President and Chief Executive Officer since May 2010. Mr. Moffett has also served as the Chairman of the Board of Freeport-McMoRan Copper & Gold Inc. (FCX) since May 1992, and previously served as Chief Executive Officer of FCX from July 1995 to December 2003. Mr. Moffett’s technical background is in geology and he has been actively engaged in petroleum geological activities in the areas of our company’s operations throughout his business career. He is also founder of our predecessor company.
Richard C. Adkerson has served as our Co-Chairman of the Board since November 1998. He previously served as our President and Chief Executive Officer from November 1998 to February 2004. Mr. Adkerson has also served as a director of FCX since October 2006, Chief Executive Officer of FCX since December 2003, and as President of FCX since January 2008 and previously from April 1997 to March 2007 and previously served as Chief Financial Officer of FCX from October 2000 to December 2003.
C. Howard Murrish has served as our Executive Vice President since November 1998. He previously served as Vice Chairman of the Board from May 2001 to February 2004. Mr. Murrish previously served as President and Chief Operating Officer of MOXY from November 1998 to May 2001.
Nancy D. Parmelee has served as our Senior Vice President and Chief Financial Officer since August 1999. She was appointed as Secretary of the company in January 2000. Ms. Parmelee has also served as Vice President of FCX since April 2003.
Kathleen L. Quirk has served as our Senior Vice President since April 2002 and Treasurer since January 2000. Ms. Quirk currently serves as Executive Vice President, Chief Financial Officer and Treasurer of FCX, and has held those offices since March 2007, December 2003 and February 2000, respectively. She also previously served as Senior Vice President of FCX from December 2003 to March 2007.
Our common stock is listed on the New York Stock Exchange (NYSE) under the symbol “MMR.” The following table sets forth, for the period indicated, the range of high and low sales prices, as reported by the NYSE.
| | | 2010 | | 2009 | |
| | | High | | Low | | High | | Low | |
| First Quarter | | $18.80 | | $8.18 | | $12.35 | | $3.14 | |
| Second Quarter | | 17.10 | | 8.63 | | 7.71 | | 4.26 | |
| Third Quarter | | 18.04 | | 9.91 | | 9.35 | | 4.72 | |
| Fourth Quarter | | 19.80 | | 14.18 | | 9.78 | | 6.77 | |
As of February 11, 2011 there were 6,991 holders of record of our common stock. We have not in the past paid, and do not anticipate in the future paying, cash dividends on our common stock. Currently, our debt agreements prohibit our payment of dividends on our common stock. At such time, if ever, that such restrictions are lifted, the Board of Directors has the sole discretion as to the timing and amount of any cash dividends.
Issuer Purchases of Equity Securities
In 1999, our Board of Directors approved an open market share purchase program for up to 2.0 million shares of our common stock. In 2000, the Board of Directors authorized the purchase of up to an additional 0.5 million shares under the program. The program does not have an expiration date. No shares were purchased during the three years ending December 31, 2010. Approximately 0.3 million shares remain available for purchase under the program.
Performance Graph
The information included under the caption “Performance Graph” in this Item 5 of this Form 10-K is not deemed to be “soliciting material” or to be “filed” with the SEC or subject to Regulation 14A or 14C
under the Securities Exchange Act of 1934 or to the liabilities of Section 18 of the Securities Exchange Act of 1934, and will not be deemed to be incorporated by reference into any filings we make under the Securities Act of 1933 or the Securities Exchange Act of 1934, except to the extent we specifically incorporate it by reference into such a filing.
The following graph compares the change in the cumulative total stockholder return on our common stock with the cumulative total return of an Independent Oil & Gas Industry Group and the S&P Stock Index from 2006 through 2010. This comparison assumes $100 invested on December 31, 2005 in (1) our common stock, (2) an Independent Oil & Gas Industry Group, and (3) the S&P 500 Stock Index.
Comparison of Cumulative Total Return*
McMoRan Exploration Co., Independent
Oil & Gas Industry Group and S&P 500 Stock Index
| | December 31, |
| | 2005 | 2006 | 2007 | 2008 | 2009 | 2010 |
| McMoRan Exploration Co. | $100.00 | $71.93 | $66.21 | $49.57 | $40.57 | $86.70 |
| S&P 500 Stock Index | 100.00 | 115.80 | 122.16 | 76.96 | 97.33 | 111.99 |
| Independent Oil & Gas Industry | | | | | | |
| Group | 100.00 | 112.45 | 162.43 | 95.30 | 146.66 | 188.65 |
_______________
* Total Return Assumes Reinvestment of Dividends
Unregistered Sales of Equity Securities
On February 9, 2011, we privately negotiated the induced conversion of approximately 8,100 shares of our 8% preferred stock with a liquidation preference of $8.1 million into approximately 1.2 million shares of our common stock (at a conversion rate equal to 146.1454 shares of common stock per share of 8% preferred stock). To induce the early conversion of these shares of 8% preferred stock, we paid an aggregate of $1.5 million in cash to the holder of these shares, which amount will be included as a charge in our first quarter consolidated statements of operations within preferred dividends, amortization of convertible preferred stock issuance costs and inducement payments for early conversion of preferred stock. Annual preferred dividend savings following this transaction will approximate $0.6 million. Following this transaction, approximately 14,000 shares of our 8% preferred stock remain outstanding. This induced conversion was exempt from registration by virtue of the exemption provided under Section 3(a)(9) of the Securities Act.
The following table sets forth our selected audited historical financial and unaudited operating data for each of the five years in the period ended December 31, 2010. The historical information shown in the table below may not be indicative of our future results. You should read the information below together with Items 7. and 7A. “Management’s Discussion and Analysis of Financial Condition and Results of Operations and Qualitative and Quantitative Disclosures About Market Risk” and Item 8. “Financial Statements and Supplementary Data.” References to “Notes” refer to Notes to Consolidated Financial Statements located in Item 8. of this Form 10-K.
| | | 2010 | | 2009 | | 2008 | | 2007a | | 2006 | |
| Financial Data | | (Financial data in thousands, except per share amounts) | |
| Years Ended December 31: | | | | | | | | | | | | | | | | |
Revenues b | | $ | 434,376 | | $ | 435,435 | | $ | 1,072,482 | | $ | 481,167 | | $ | 209,738 | |
| Depreciation and amortization | | | 282,062 | c | | 313,980 | c | | 854,798 | c | | 256,007 | c | | 104,724 | |
| Exploration expenses | | | 42,608 | | | 94,281 | | | 79,116 | | | 58,954 | | | 67,737 | |
Main Pass Energy Hub™ costs d | | | 1,011 | | | 1,615 | | | 6,047 | | | 9,754 | | | 10,714 | |
| Exploration expense reimbursement | | | - | | | - | | | - | | | - | | | (10,979 | )e |
Insurance recoveries f | | | (38,944 | ) | | (24,592 | ) | | (3,391 | ) | | (2,338 | ) | | (3,306 | ) |
| Operating income (loss) | | | (78,985 | ) | | (168,434 | ) | | (155,234 | ) | | 3,509 | | | (32,567 | ) |
| Interest expense, net | | | (38,216 | ) | | (42,943 | ) | | (50,890 | ) | | (66,366 | ) | | (10,203 | ) |
| Loss from continuing operations | | | (116,976 | ) | | (204,889 | ) | | (211,198 | ) | | (63,561 | ) | | (44,716 | ) |
| Income (loss) from discontinued | | | | | | | | | | | | | | | | |
| operations | | | (3,366 | ) | | (6,097 | ) | | (5,496 | ) | | 3,827 | | | (2,938 | ) |
| Net loss applicable to common stock | | | (197,443 | ) | | (225,318 | ) | | (238,980 | ) | | (63,906 | ) | | (49,269 | ) |
| | | | | | | | | | | | | | |
| Basic and diluted net income (loss) per share | | | | | | | | | | | | | |
| of common stock: | | | | | | | | | | | | | | | | |
| Continuing operations | | $ | (2.04 | ) | $ | (2.79 | ) | $ | (3.79 | ) | $ | (1.97 | ) | $ | (1.66 | ) |
| Discontinued operations | | | (0.04 | ) | | (0.08 | ) | | (0.09 | ) | | 0.11 | | | (0.10 | ) |
| Basic and diluted net loss per share | | $ | (2.08 | ) | $ | (2.87 | ) | $ | (3.88 | ) | $ | (1.86 | ) | $ | (1.76 | ) |
| | | | | | | | | | | | | | | | | |
| Average basic and diluted common | | | | | | | | | | | | | | | | |
| shares outstanding | | | 95,125 | g | | 78,625 | g | | 61,581 | g | | 34,283 | | | 27,930 | |
| | | | | | | | | | | | | | | | | |
| At December 31: | | | | | | | | | | | | | | | | |
| Working capital (deficit) | | $ | 628,597 | | $ | 148,357 | | $ | 3,601 | | $ | (221,302 | ) | $ | (25,906 | ) |
| Property, plant and equipment, net | | | 1,785,607 | h | | 796,223 | | | 992,563 | | | 1,503,359 | | | 282,538 | |
| Total assets | | | 2,899,364 | | | 1,248,882 | | | 1,330,282 | | | 1,715,288 | | | 408,677 | |
| Oil and gas reclamation obligations | | | 358,624 | | | 428,711 | | | 421,201 | | | 294,737 | | | 25,876 | |
| Long-term debt, including current portion | | | 559,976 | g | | 374,720 | | | 374,720 | | | 689,000 | | | 244,620 | |
| Stockholders’ equity (deficit) | | $ | 1,724,337 | g,h | $ | 265,808 | | $ | 309,023 | | $ | 372,229 | | $ | (68,443 | ) |
| a. | Includes results from acquired oil and gas properties effective August 6, 2007. |
| b. | Includes service revenues totaling $15.6 million in 2010, $12.5 million in 2009, $13.7 million in 2008, $5.9 million in 2007 and $13.0 million in 2006 (Note 1). |
| c. | Includes impairment charges of $107.2 million in 2010, $75.3 million in 2009, $332.6 million in 2008, $13.6 million in 2007 and $33.2 million in 2006 (Note 4). |
| d. | Reflects costs associated with pursuit of the licensing, design and financing plans related to the potential establishment of an energy hub, including an liquefied natural gas (LNG) terminal, at Main Pass Block 299 in the Gulf of Mexico (Note 16). |
| e. | Primarily reflects $19.0 million recognized upon inception of an exploration agreement in fourth quarter of 2006 offset by an $8.0 million payment to a private partner for relinquishing its exploration rights to certain prospects in connection with our entering into the new exploration agreement. |
| f. | Reflects proceeds received in connection with our oil and gas property hurricane-related insurance claims (Note 4). |
| g. | Reflects the applicable impact of common and preferred stock and convertible debt transactions during the periods from 2007 through 2010 (Notes 2, 6, 8 and 9). |
| h. | Includes the impact of the approximate $1 billion acquisition of Gulf of Mexico shallow water properties from Plains Exploration & Production Company (PXP Acquisition), including the issuance of 51 million shares of McMoRan common stock (Note 2). |
____________________
| | 2010 | | 2009 | | 2008 | | 2007 a | | 2006 | |
| Operating Data | | | | | | | | | | | | | | | |
| Years Ended December 31: | | | | | | | | | | | | | | | |
| Sales Volumes: | | | | | | | | | | | | | | | |
| Gas (thousand cubic feet, or Mcf) | | 38,019,100 | | | 50,081,900 | | | 59,886,900 | | | 38,994,000 | | | 14,545,600 | |
| Oil (barrels) | | 2,480,900 | | | 2,994,100 | | | 3,635,200 | | | 2,380,500 | | | 1,379,300 | |
Plant products (Mcf equivalent)b | | 5,956,700 | | | 5,759,600 | | | 8,004,400 | | | 2,153,300 | | | 1,072,200 | |
| Average realization: | | | | | | | | | | | | | | | |
| Gas (per Mcf) | $ | 4.77 | | $ | 4.22 | | $ | 9.96 | | $ | 7.01 | | $ | 7.05 | |
| Oil (per barrel) | | 77.93 | | | 60.22 | | | 104.00 | | | 76.55 | | | 60.55 | |
| a. | Includes results from acquired oil and gas properties effective August 6, 2007 (Note 2). |
| b. | Revenues from plant products (ethane, propane, butane, etc.) totaled $43.6 million in 2010, $31.3 million in 2009, $83.3 million in 2008, $19.3 million in 2007 and $9.6 million in 2006. One Mcf equivalent is determined using the ratio of six Mcf of natural gas to one barrel of crude oil, condensate or natural gas liquids. |
OVERVIEW
You should read the following discussion in conjunction with our consolidated financial statements and the related discussion of “Business and Properties” included in Items 1. and 2. of this Form 10-K. The results of operations reported and summarized below are not necessarily indicative of our future operating results. All subsequent references to “Notes” refer to Notes to Consolidated Financial Statements located in Item 8. “Financial Statements and Supplementary Data” elsewhere in this Form 10-K.
We engage in the exploration, development and production of oil and natural gas in the shallow waters (less than 500 feet of water) of the Gulf of Mexico and onshore in the Gulf Coast area of the United States. Our exploration strategy is focused on targeting large structures on the “deep gas play,” and on the “ultra-deep play.” Deep gas prospects target large deposits at depths typically between 15,000 and 25,000 feet. Ultra-deep prospects target objectives at depths typically below 25,000 feet. We have one of the largest acreage positions in the shallow waters of these areas, with rights to approximately 880,000 gross acres, including over 200,000 gross acres associated with the ultra-deep gas play below the salt weld. Our focused strategy enables us to make efficient use of our geological,
engineering and operational expertise in these areas where we have more than 40 years of operating experience. We also believe that the scale of our operations in the Gulf of Mexico allows us to realize certain operating synergies and provides a strong platform from which to pursue our business strategy. Our oil and gas operations are conducted through McMoRan Oil & Gas LLC (MOXY), our principal operating subsidiary.
Our technical and operational expertise is primarily in the Gulf of Mexico and onshore in the Gulf Coast area. We leverage our expertise by attempting to identify exploration opportunities with high potential. Deep gas prospects target large structures above the salt weld (i.e. listric fault) in the Deep Miocene. Ultra-deep prospects target objectives below the salt weld in the Miocene and older age sections that have been correlated to those productive sections seen in deepwater discoveries by other industry participants. A significant advantage to our exploration strategy is that there is substantial infrastructure in our focus area to support the production and delivery of product. We believe this presents us with a material competitive advantage in bringing our discoveries on line and lowering related development costs. For additional information regarding our business strategy, see Items 1. and 2. “Business and Properties” of this Form 10-K.
On December 30, 2010, we completed the acquisition of Plains Exploration & Production Company’s (PXP) shallow water Gulf of Mexico shelf assets (PXP Acquisition). Under the terms of the transaction, we issued 51 million shares of common stock and paid $75.0 million cash to PXP, with total consideration for the transaction of approximately $1 billion based on the value of our common stock on the closing date. In addition, the purchase price includes $51.1 million associated with estimated revenues, expenses and capital expenditures attributable to the properties from the August 1, 2010 effective date through the December 30, 2010 closing date, and the assumption of approximately $9.9 million of related asset retirement obligations. The substantial majority of properties acquired from PXP represen ted their interests in certain deep gas and ultra-deep exploration projects that, prior to the transaction, were jointly owned by us and PXP. The acquisition purchase price has been allocated to the properties acquired with approximately 19% allocated to proved properties and the remaining portion allocated to unevaluated oil and gas properties. We incurred approximately $9 million in transaction related costs for this transaction. Concurrent with the PXP Acquisition, we issued $700 million of 5.75% Convertible Perpetual Preferred Stock (5.75% preferred stock) and $200 million of 4% Convertible Senior Notes (4% senior notes) to certain investors (Notes 6 and 8).
The transaction increased our scale of operations on the Gulf of Mexico shelf, consolidated our ownership in core focus areas, expanded our participation in future production from our deep gas and ultra-deep exploration and development programs and increased current reserves and production. In addition, we expect to continue to benefit from our positive relationship with PXP through PXP’s significant shareholding position in our company.
During the year ended December 31, 2010, we incurred $115.1 million of net abandonment expenditures. We plan to spend approximately $135 million in 2011 for the abandonment and removal of oil and gas structures in the Gulf of Mexico, a substantial portion of which is expected to be recovered through insurance reimbursements.
During the year ended December 31, 2010, we invested $217.3 million on capital-related projects primarily associated with our exploration activities. Depending on drilling results and follow on development opportunities, we expect 2011 capital expenditures to be at least $300 million and potentially up to $500 million. The low end of the range includes approximately $200 million in exploration and $100 million in development spending. Capital spending will continue to be driven by opportunities.
Capital spending will continue to be driven by exploration and development opportunities and
managed based on market conditions. We plan to fund our capital spending through available cash, cash flow from operations and participation by partners in exploration and development projects. We continue to monitor the global financial and credit markets, as well as the fluctuations in oil and natural gas market prices, all of which may ultimately have a material effect on one or more facets of our business and overall business strategy.
North American Natural Gas and Oil Market Environment
Our 2010 production volume is comprised of approximately 75 percent natural gas and 25 percent oil. As a result, our revenues are generally more sensitive to changes in the market price of natural gas than to changes in the market price of oil. North American natural gas averaged $4.40 per MMbtu during 2010. The spot price for natural gas was $3.79 per MMbtu on February 24, 2011. The average oil price for 2010 was $79.50 per barrel and the spot price for oil was $97.28 per barrel on February 24, 2011. Future oil and natural gas prices are subject to change and these changes are not within our control. For additional information regarding risks associated with price fluctuations and supply of these commodities, see Item 1A. “Risk Factors” included in this Form 1 0-K.
OPERATIONAL ACTIVITIES
Oil and Gas Activities
On April 20, 2010, the Deepwater Horizon, a semi-submersible offshore drilling rig located in the deepwater of the Gulf of Mexico, sank following a catastrophic explosion and fire. This event significantly and adversely disrupted oil and gas exploration activities in the Gulf of Mexico and ultimately resulted in the temporary suspension by the United States government of all deepwater drilling and exploration activity in the Gulf of Mexico. Although the suspension was lifted on October 13, 2010, delays in obtaining drilling permits and compliance with new safety regulations continue to slow new drilling and exploration activity by Gulf of Mexico operators, including operators in shallow waters. We have continued to advance our exploration and development activities despite a challenging regulatory environment.
While the suspension did not apply to any of our current operations or prospects, new regulations and enhanced safety certifications have been issued for all operations in the Gulf of Mexico. We completed the necessary initial certifications in June 2010 and are providing required information to secure permits for future drilling. The processing of permits has been slower than previously experienced, and continued delays in obtaining permits from the BOEMRE could impact the timing of drilling new wells scheduled for 2011 and beyond. Our drilling operations that were in progress at the time of the Deepwater Horizon incident, including the wells currently drilling at Davy Jones and Blackbeard East have not be en affected. Additionally, in September 2010 we were successful in obtaining a permit to drill our Lafitte ultra-deep exploratory well, and drilling operations at that location are ongoing. We have also received other permits to deepen and/or initiate drilling on other properties including our Blackbeard East, Brazos A23, Hurricane Deep and Boudin prospects.
We have significant drilling and other commitments associated with our business strategy. The events described above have heightened the challenges to us of managing and deploying available resources to ensure that our commitments are effectively managed and met. Although the current operating environment has had no significant impact on our ability to effectively manage our commitments
to date, uncertainties associated with our ability to obtain necessary permits could impact future financial results.
For additional information regarding our current oil and gas activities, see “Oil and Gas Activities” in Items 1. and 2. “Business and Properties” and “Risk Factors” in Item 1A of this Form 10-K.
Production Update
Our net production rates averaged 161 MMcfe/d during 2010 compared with 202 MMcfe/d during 2009 and 245 MMcfe/d during 2008. Fourth-quarter 2010 production averaged 144 MMcfe/d net to us, compared to 209 MMcfe/d in the fourth quarter of 2009.
We expect production to average approximately 175 MMcfe/d in the first quarter of 2011 and 160 MMcfe/d for the year. Our estimated production rates are dependent on the timing and success of development drilling, planned recompletions, production performance and other factors.
Acreage Position
For information regarding our acreage position, see “Properties — Acreage” in Items 1. and 2. “Business and Properties” of this Form 10-K.
RESULTS OF OPERATIONS
We use the successful efforts accounting method for our oil and gas operations, which requires exploration costs, other than drilling costs of successful and in-progress exploratory wells, to be charged to expense as incurred (Note 1).
Our operating loss during 2010 totaled $79.0 million which reflects (a) $107.2 million in impairment charges to reduce net carrying values to fair value for certain fields primarily related to the declines in market prices for oil and natural gas during 2010 and certain other operational factors that had a negative impact on reserve recoverability; (b) $9.0 million of transaction costs charged to general and administrative expense related to the PXP Acquisition; and (c) $14.5 million of non-productive exploratory drilling and related costs. These costs were offset by $38.9 million of insurance recoveries (gains) recognized as partial reimbursements for insured losses related to the September 2008 hurricanes in the Gulf of Mexico, a $4.2 million gain on oil and gas derivative contracts, and a $3.5 million gain on sale of an oil and gas property.
Our operating loss during 2009 totaled $168.4 million which reflects (a) $75.3 million in impairment charges to reduce net carrying values to fair value for certain fields primarily related to the declines in market prices for oil and natural gas during 2009 and certain other operational factors that had a negative impact on reserve recoverability; (b) $61.5 million of non-productive exploratory drilling and related costs; (c) $24.6 million of insurance recoveries (gains) received as partial payments for insured losses related to the September 2008 hurricanes in the Gulf of Mexico; and (d) a $17.4 million gain on oil and gas derivative contracts.
Our operating loss during 2008 totaled $155.2 million which reflects (a) $310.7 million in impairment charges to reduce net carrying values to fair value for certain fields related to the significant decline in the market prices for oil and natural gas during the fourth quarter of 2008; (b) $169.4 million of charges associated with damage to certain properties from the September 2008 hurricanes; (c) $38.9 million of non-productive exploratory drilling and related costs; and (d) a $16.3 million gain on oil and gas derivative contracts.
Oil and Gas Operations – Year-to-Year Comparisons
Revenues. A summary of increases (decreases) in our oil and natural gas revenues as compared to the previous period follows (in thousands):
| | | 2010 | | 2009 | |
| Oil and natural gas revenues – prior year period | | $ | 422,976 | | $ | 1,058,804 | |
| Increase (decrease) | | | | | | | |
| Price realizations: | | | | | | | |
| Natural gas | | | 20,911 | | | (287,470 | ) |
| Oil and condensate | | | 43,937 | | | (131,082 | ) |
| Sales volumes: | | | | | | | |
| Natural gas | | | (50,905 | ) | | (97,658 | ) |
| Oil and condensate | | | (30,905 | ) | | (66,674 | ) |
| Plant products revenue | | | 12,325 | | | (51,980 | ) |
| Other | | | 477 | | | (964 | ) |
| Oil and natural gas revenues - current year period | | $ | 418,816 | | $ | 422,976 | |
See Item 6. “Selected Financial Data” in this Form 10-K for operating data, including our sales volumes and average realizations for each of the five years in the period ended December 31, 2010.
Our oil and natural gas sales volumes totaled 58.9 Bcfe in 2010, 73.8 Bcfe in 2009 and 89.7 Bcfe in 2008. The decrease in volumes over the three year period primarily relates to anticipated declines in production associated with maturing properties acquired in the 2007 property acquisition as well as timing delays for certain well recompletion and development activities in 2010. Average realizations received for oil sold during 2010 increased by 29 percent over amounts received in 2009, which decreased by 42 percent compared to amounts received in 2008. Average realizations for natural gas sold during 2010 increased 13 percent from amounts received in 2009, which decreased 58 percent from amounts received during 2008. The variations in realizations for natural gas and oil sold during these years are related to the volatility in commodity prices during 2010 and 2009.
Our 2010 revenues included $43.6 million of plant product sales associated with approximately 6.0 Bcf equivalents for products (ethane, propane, butane, etc.) recovered from the processing of our natural gas. The amounts of plant product sales totaled $31.3 million from 5.8 Bcf equivalents during 2009 and $83.3 million from 8.0 Bcf equivalents during 2008. These variations are largely due to commodity price fluctuations over the three year period ended December 31, 2010.
Our service revenues totaled $15.6 million in 2010, $12.5 million in 2009 and $13.7 million in 2008.
Production and delivery costs. The following table reflects our production and delivery costs for the years ended December 31, 2010, 2009 and 2008 (in millions, except per Mcfe amounts):
| | | | Per | | | | Per | | | | Per |
| | 2010 | | Mcfe | | 2009 | | Mcfe | | 2008 | | Mcfe |
| Lease operating expense | $105.4 | | $1.79 | | $115.9 | | $1.57 | | $133.6 | | $1.49 |
| Workover costs | 22.9 | | 0.39 | | 18.0 | | 0.25 | | 39.7 | | 0.44 |
| Hurricane related repairs | 6.9 | | 0.12 | | 14.1 | | 0.19 | | 23.1 | | 0.26 |
| Insurance | 26.5 | | 0.45 | | 23.9 | | 0.32 | | 22.6 | | 0.25 |
| Transportation, production taxes and other | 21.1 | | 0.36 | | 21.1 | | 0.29 | | 39.5 | | 0.44 |
| Total production and delivery costs | $182.8 | | $3.11 | | $193.0 | | $2.62 | | $258.5 | | $2.88 |
Lease operating expense in 2010 decreased approximately $10.5 million compared to 2009, primarily reflecting the impact of decreased production volumes partially offset by higher per unit costs resulting from the effect of certain fixed costs allocable to a lower production volume base. Hurricane-related repairs decreased by approximately $7.2 million in 2010 compared to 2009 as the repair work related to the 2008 hurricane events neared completion.
Our lower lease operating expense in 2009 compared to 2008 reflects decreased production, as well as the results of efforts to lower our operating costs given the significant decline in oil and natural gas prices during the year. Workover costs decreased from 2008 due to the type and number of projects completed in 2009. Hurricane related repairs include work performed on wells related to the 2008 Hurricanes Gustav and Ike.
Insurance premium rates associated with our operations in the Gulf of Mexico have increased in recent years. We renewed our property insurance program through May 2011 with similar coverage to the previous year; however, premium rates for operational risk coverage increased primarily resulting from market reaction to the Deepwater Horizon incident in April 2010. Our renewal program includes coverage of our ownership interest for damages caused by Named Windstorms subject to recovery of 50 percent of any loss up to an annual aggregate limit of $100 million, in excess of a $50 million deductible. We also purchased operational risk coverage for losses resulting from perils other than Named Windstorms such as well blowouts, fires and explosions with lim its and deductibles scaled to our working interest in the covered property. The control of well coverage, subject to a $5 million deductible, has a limit of $150 million for all wells except ultra-deep wells which have a $250 million limit. We also renewed our Oil Spill Financial Responsibility policy coverage which has a $150 million limit.
2010 transportation and production taxes remained in line with 2009, while they decreased approximately $18.4 million in 2009 from 2008 primarily due to decreased production during 2009 resulting from wells that were shut-in following the 2008 hurricanes.
Depletion, depreciation and amortization expense. The following table reflects the components of our depletion, depreciation and amortization expense for the years ended December 31, 2010, 2009 and 2008 (in millions, except per Mcfe amounts):
| | | | Per | | | | Per | | | | Per |
| | 2010 | | Mcfe | | 2009 | | Mcfe | | 2008 | | Mcfe |
| Depletion and depreciation expense | $148.4 | | $2.52 | | $205.5 | | $2.78 | | $357.5 | | $3.98 |
| Accretion expense | 26.5 | | 0.45 | | 33.2 | | 0.45 | | 164.8 | | 1.84 |
| Impairment charges/losses | 107.2 | | 1.82 | | 75.3 | | 1.02 | | 332.5 | | 3.71 |
| Total depletion, depreciation and | | | | | | | | | | | |
| amortization expense | $282.1 | | $4.79 | | $314.0 | | $4.25 | | $854.8 | | $9.53 |
As described in Note 1, we record depletion, depreciation and amortization expense on a field-by- field basis using the units-of-production method. Our depletion, depreciation and amortization rates are directly affected by estimates of proved reserve quantities, which are subject to revisions over time as changes in reserve estimates and fluctuations in the recorded amounts of property, plant and equipment and asset retirement obligations occur. Reductions in the amounts of our depletion and depreciation expense in 2010 and 2009 primarily reflects lower production rates in the respective years as well as the significant reduction in the carrying value of our proved oil and gas property costs resulting from approximately $515.0 million in cumulative impairment charges recorded since late 2008.
We record accretion expense on our discounted reclamation obligations. In 2008 we recorded amounts to accretion expense totaling $124.4 million to reflect higher estimates and accelerated timing of future abandonment costs associated with hurricane damaged structures and wells. From 2008 through 2010 we have funded over $190 million of reclamation costs to settle a significant portion of the asset retirement obligations assumed in an oil and gas property acquisition in 2007, including certain properties damaged in the 2008 hurricanes. In addition, we intend to spend approximately $135 million on additional reclamation activities in 2011 to settle the asset retirement obligations of certain of our maturing properties. Excluding the potential impact for changes in our reclamation estimates, we would expect that as these obligations are continuing to be settled, scheduled accretion for our portfolio of maturing properties would moderately decline over time. However, changes in the industry’s regulatory environment and/or other market factors that could develop as a result of the Deepwater Horizon or other similar incidents could impact the timing and/or scope of future reclamation activities resulting in changes to our current estimates for asset retirement obligations.
As further discussed in Note 1, accounting rules require the carrying value of proved oil and gas property costs to be assessed for possible impairment under certain circumstances and reduced to fair value by a charge to earnings if impairment is deemed to have occurred. Conditions affecting current and
estimated future cash flows that could require impairment charges include, but are not limited to, lower than anticipated oil and natural gas prices, decreased production, increased development, production and reclamation costs and downward revisions of reserve estimates. Due to the decline in market prices for oil and natural gas and certain other operational factors that negatively impacted reserve recoverability, we recorded impairment charges of $107.2 million in 2010 and $75.3 million in 2009.
The significant decline in market prices in the fourth quarter of 2008 for oil and natural gas resulted in impairment charges of $246.9 million being recorded for certain producing properties as of December 31, 2008. We also recorded impairment charges totaling $44.9 million on two previously unevaluated wells (Mound Point South and JB Mountain Deep) after considering our then current drilling plans in the economic environment at that time. Earlier in 2008, we also recorded impairment charges totaling $40.8 million relating to certain fields, including the Ewing Banks 947 and South Marsh Island Block 49 wells which were significantly damaged by Hurricane Ike in the third quarter of that year.
As more fully identified in Item 1A. “Risk Factors” and elsewhere in this Form 10-K, a combination of any or all of the conditions described above, including the factors that contributed to the recognition of significant impairment charges in 2010, 2009 and 2008, could require additional impairment charges to be recorded in future periods.
Exploration Expenses. Summarized exploration expenses are as follows (in millions):
| | Years Ended December 31, | |
| | | 2010 | | | 2009 | | | 2008 | |
| Geological and geophysical, | | | | | | | | | |
including 3-D seismic purchasesa | $ | 19.3 | | $ | 26.8 | | $ | 31.9 | |
| Dry hole costs | | 14.5 | b | | 61.5 | c | | 38.9 | d |
| Insurance and other | | 8.8 | | | 6.0 | | | 8.3 | |
| | $ | 42.6 | | $ | 94.3 | | $ | 79.1 | |
| a. | Includes compensation costs associated with stock-based awards totaling $8.6 million in 2010, $6.6 million in 2009 and $14.4 million in 2008. |
| b. | Includes $7.2 million nonproductive exploratory drilling and related costs primarily associated with the Blueberry Hill offset appraisal well incurred below 19,000 feet which was determined to be non-commercial, net of other miscellaneous dry hole adjustments. Also includes $7.3 million of nonproductive exploratory drilling costs incurred through December 31, 2010 related to the Platte well (see below). |
| c. | Includes nonproductive exploratory drilling and related costs primarily associated with the Ammazzo well ($25.4 million), the Tom Sauk well ($11.1 million), the Cordage well ($11.0 million), the Sherwood well ($6.3 million) and the Gladstone East well ($6.2 million). |
| d. | Includes nonproductive exploratory drilling and related costs primarily associated with the Mound Point East well at Louisiana State Lease 340 ($16.0 million), the Northeast Belle Isle well ($9.5 million) and the Gladstone East well ($5.4 million) as well as approximately $8.0 million of nonproductive leasehold costs. |
Following the release of our unaudited 2010 financial information on January 18, 2011, the drilling results for our Platte deep gas well in Vermillion Parish, Louisiana were evaluated and deemed to be nonproductive. As a result, the well has been plugged and abandoned. We charged $7.3 million to exploration expense for drilling costs incurred through December 31, 2010 for the Platte well in our fourth quarter 2010 results. Our first quarter 2011 results will include approximately $2.3 million of costs incurred in 2011 related to this property.
Exploration Agreements. In 2009, we entered into an agreement with W.A. “Tex” Moncrief Jr. (Moncrief) to participate in our ultra-deep drilling program. Moncrief agreed to fund drilling and production operations on a promoted basis to explore and develop targets below 25,000 feet (ultra-deep prospects). We and two of our partners assigned 10 percent of the group’s collective working interest in Davy Jones to Moncrief. Moncrief may also participate for 10 percent of the collective interests of these parties in future ultra-deep wells.
Also in 2009, we entered into an arrangement with a private partner allowing that partner to participate in certain of our ongoing exploration and development activities. The private partner’s initial funding commitment was $30 million. Additional commitments, if any, for the partner’s participation and funding of future joint projects beyond the initial $30 million committed investment are at the discretion of the private partner.
Other Financial Results
Operating
Our general and administrative expenses totaled $51.5 million in 2010, $43.0 million in 2009 and $49.0 million in 2008. We charged approximately $9.8 million of stock-based compensation costs to general and administrative expense during 2010 compared to $7.2 million in 2009 and $14.8 million in 2008. The fluctuation in stock-based compensation costs is related to the timing of the valuation of the option grants, of which the 2008 grant occurred at a time when the price of our common stock exceeded $30 per share. In addition, general and administrative expense for 2010 includes $9.0 million of transaction costs associated with the PXP Acquisition.
In 2010, 2009 and 2008, we recorded aggregate gains of $4.2 million, $17.4 million and $16.3 million, respectively, associated with our oil and gas derivative contracts (Note 7). The variances among these years resulted from changes in commodity prices and the resulting mark-to-market impact that such changes had with respect to our derivative contract positions during those years.
Hurricanes Gustav and Ike impacted Gulf of Mexico operations prior to making landfall on the Louisiana and Texas coasts in September 2008. Although there was no significant damage to our properties resulting from Hurricane Gustav, Hurricane Ike caused significant structural damage to several platforms in which we had an investment interest. Since the third quarter of 2008, we have recorded charges totaling in excess of $190 million related to incurred repair costs, property impairments and additional estimated reclamation costs associated with the damaged properties. While a portion of these costs has been funded to date, a significant amount of the remaining expenditures, particularly for asset retirement obligations, will be funded by us over the next several years. Consistent with our claims experience to date, we expect to realize a substantial recovery in future periods under our insurance program for a large portion of these hurricane related costs, reimbursement for which is received after damage-related expenditures are funded and related claims are approved.
We recognized net insurance recoveries of $38.9 million in 2010 and $24.6 million in 2009, after satisfying a $50 million deductible, as partial reimbursements associated with certain of our insured hurricane-related losses. We did not record any insurance recoveries in 2008 related to Hurricane Ike; however, in that year we received final settlement on our prior Hurricane Katrina property loss claim of $3.4 million.
We recorded a $3.5 million gain on the sale of one of our Gulf of Mexico oil and gas properties in 2010. There were no such transactions in 2009 or 2008.
Non-Operating
Interest expense, net of capitalized interest, totaled $38.2 million in 2010, $42.9 million in 2009 and $50.9 million in 2008. We capitalized interest totaling $10.1 million in 2010, $3.9 million in 2009 and $5.0 million in 2008. Capitalized interest has fluctuated during the past three years to reflect the timing and amount of our oil and gas drilling and development activities.
Other income (expense) totaled $0.2 million in 2010, $4.0 million in 2009 and $(2.6) million in 2008. Interest income totaled $0.2 million in 2010, $0.7 million in 2009 and $1.1 million in 2008. Other income in 2009 primarily related to a $2.7 million gain related to the settlement of a contingency associated with the 2007 oil and gas property acquisition. Other expense in 2008 included $2.7 million of inducement payments related to our convertible senior notes (see “— Capital Resources and Liquidity—Convertible Senior Notes” below).
We recorded no income tax benefit (expense) in 2010. Income tax benefit (expense) totaled $2.4 million in 2009 and $(2.5) million in 2008. Our $2.4 million income tax benefit in 2009 primarily related to the carry back of our 2009 tax net operating loss (NOL) and refund of our 2008 federal alternative minimum tax.
As of December 31, 2010, we had approximately $864.3 million of NOLs ($599.8 million federal and $264.5 million state) available to offset future taxable income, subject to certain limitations. Federal tax regulations impose certain annual limitations on the utilization of NOLs from prior periods when a defined level of change in ownership of certain shareholders is exceeded. If a corporation has a statutorily defined change of ownership, its ability to use its existing NOLs could be limited by Section 382 of the Internal Revenue Code depending upon the level of future taxable income generated in a given year and other factors. State tax law imposes similar limitations. We have determined that such a change of ownership has occurred during 2010, which, depending upon the amounts and timing of future taxa ble income generated, may limit our ability to use our existing NOLs to fully offset taxable income in future periods.
In February 2011, the Obama Administration released its Fiscal Year 2012 budget which includes proposals that, if legislated and enacted into law, would make significant changes to United States (U.S.) tax laws, including the elimination of certain important U.S. federal income tax incentives currently available to companies involved in oil and gas exploration, development and production. It is uncertain whether any of the proposed tax changes will actually be enacted or how soon any changes could become effective. The passage of any legislation requiring these or similar changes in U.S. federal income tax law could negatively impact our financial condition and results of operations.
Discontinued Operations
Our discontinued operations resulted in losses of $3.4 million in 2010, $6.1 million in 2009 and $5.5 million in 2008. Our discontinued operations’ results are summarized in Note 10.
In connection with the June 2002 sale of assets, we agreed to be responsible for certain related historical environmental obligations and also agreed to indemnify the purchaser from certain potential liabilities with respect to the historical sulphur operations engaged in by Freeport Sulphur and its predecessor and successor companies, including reclamation and other potential environmental obligations. In addition, we assumed, and agreed to indemnify the purchaser from certain potential obligations, including environmental obligations, other than liabilities existing and identified as of the closing of the sale associated with historical oil and gas operations undertaken by the Freeport-McMoRan companies prior to the 1997 merger of Freeport-McMoRan Inc. and IMC Global Inc. Cumulative legal fees and related settleme nt amounts incurred with respect to this indemnification total approximately $1.3 million (since 2002). The future estimated closure costs for our former terminal facilities at Port Sulphur, Louisiana approximate $11.8 million at December 31, 2010, the funds for which will be expended over the next year.
CAPITAL RESOURCES AND LIQUIDITY
Our primary sources of liquidity are net cash provided from operations, cash from financings, and available drawings under our credit facility. Our cash flow from operations is subject to changes in oil and natural gas prices, which can be volatile and over which we have no control. Significant declines in commodity prices may negatively impact our revenue, earnings and cash flow, with a corresponding effect on capital spending and potentially our liquidity. Sales volumes, collections and costs may also impact our cash flow. As discussed in more detail below, although cash from operations decreased by approximately $33 million during 2010, we generated approximately $866 million in net cash flow from financings. We also have a $150 million credit facility, of which $100 million is us ed to support a reclamation surety letter of credit.
The maintenance of our long-term operating cash flow is dependent on our ability to replace reserves produced and control our ongoing operational costs. Our ability to maintain and grow our production and cash flow is significantly dependent on our success in funding, finding and developing oil and gas reserves through successful drilling programs and property acquisitions. These activities require substantial capital investment.
Our primary uses of cash are exploration, development and acquisitions of properties to replace depleted reserves, payment of ongoing operational costs and repayment of principal and interest on outstanding debt. Depending on drilling results and follow on development opportunities, we expect our 2011 capital expenditures to be at least $300 million and potentially up to $500 million. The low end of the range includes approximately $200 million in exploration and $100 million in development spending.
We also plan to spend approximately $135 million in 2011 for the abandonment and removal of oil and gas structures in the Gulf of Mexico. We plan to fund our capital spending through available cash, cash flow from operations and participation by partners in exploration and development projects.
Although we do not budget for acquisitions, we continually evaluate acquisition opportunities. The timing and size of acquisitions are unpredictable and future acquisition opportunities could fully utilize or even exceed our existing capital resources. Although we have no current plans to access the public or private markets to obtain additional capital, if acquisition opportunities are presented to us, we would consider such funding sources to provide capital in excess of what is currently available to us, as we have in the past.
Our capital spending will continue to be driven by opportunities and will be managed based on our available cash and cash flows, including potential participation by new partners in projects. Our expected level of capital expenditures is subject to change depending on the number of wells drilled, the results of our exploratory drilling, participant elections, availability of drilling rigs, the time it takes to drill each well, related personnel and material costs, and other factors, many of which are beyond our control. For more information regarding risk factors affecting our drilling operations, see Item 1A. “Risk Factors” included in this Form 10-K.
The table below summarizes our historical cash flow information by categorizing the information as cash provided by or used in operating, investing and financing activities and distinguishing between our continuing and discontinued operations (in millions).
| | For Year Ended December 31, | |
| | 2010 | | 2009 | | 2008 | |
| Continuing operations | | | | | | | | | |
Operating a | $ | 100.4 | | $ | 136.9 | | $ | 629.7 | |
| Investing | | (300.5 | ) | | (138.0 | ) | | (239.2 | ) |
| Financing | | 866.5 | | | 154.8 | | | (295.5 | ) |
| | | | | | | | | | |
| Discontinued operations | | | | | | | | | |
| Operating | $ | (2.2 | ) | $ | (5.7 | ) | $ | (6.3 | ) |
| Investing | | - | | | - | | | - | |
| Financing | | - | | | - | | | - | |
| | | | | | | | | | |
| Total cash flow | | | | | | | | | |
| Operating | $ | 98.2 | | $ | 131.2 | | $ | 623.4 | |
| Investing | | (300.5 | ) | | (138.0 | ) | | (239.2 | ) |
| Financing | | 866.5 | | | 154.8 | | | (295.5 | ) |
| a. | Net of reclamation spending of $115.1 million, $45.9 million and $29.4 million in 2010, 2009 and 2008, respectively. |
Comparison of Year-To-Year Cash Flow
Operating Cash Flow
Although our revenues from oil and natural gas remained relatively constant in 2010 compared to 2009, our operating cash flow decreased $32.9 million in 2010 compared to 2009 primarily due to $69.2 million of higher reclamation expenditures and $35.0 million of lower realized derivative gains, the effects of which were partially offset by $10.2 million of lower production and delivery charges, $4.7 million of lower geological, geophysical and other costs, $14.4 million of higher insurance recoveries, $3.1 million of increased service revenue and $40.9 million of positive working capital fluctuations between comparable years. $27.4 million of the working capital fluctuation was due to the use of inventory in our 2010 drilling operations that was purchased in prior per iods, with the remaining portion of the positive variance primarily due to the effect of increased drilling activities on net payables and receivables in 2010.
Our 2009 operating cash flow decreased significantly from 2008, reflecting lower oil and gas revenues resulting from the significantly lower oil and natural gas prices in 2009 as well as decreased production due to shut-ins from the 2008 hurricanes. Our 2008 operating cash flow included increased oil
and gas revenues reflecting production from our 2007 oil and gas property acquisition at substantially higher market prices for oil and natural gas sales during that year.
Cash used in our discontinued operations in 2010, 2009 and 2008 primarily reflect caretaking, remediation and other closure costs associated with our Port Sulphur, Louisiana former sulphur terminal. We estimate that we will incur approximately $11.8 million of closure costs over the next year with respect to currently planned closure activities (Note 10).
Investing Cash Flow
Our 2010 investing cash flow reflects capital expenditures of $217.3 million and $86.1 million of property acquisition costs. Total cash used in investing activities increased approximately $162.5 million in 2010 compared to 2009 primarily as a result of our increased investments in ultra-deep exploratory drilling and due to the cash portion of the consideration paid in the PXP acquisition.
Our 2009 and 2008 investing cash flow reflect capital expenditures of $138.0 million and $236.4 million, respectively, representing our exploratory drilling and development costs. Our 2009 expenditures were reduced in comparison to 2008 reflecting management of capital spending in response to commodity price levels and financial market conditions at that time.
Financing Cash Flow
Our 2010 financing cash flow reflects $700 million of proceeds from the 5.75% Convertible Perpetual Preferred stock private placements, and $200 million of proceeds from the 4% senior note issuance, offset by $6.7 million of related issuance costs and $15.1 million of preferred stock dividends and $12.2 million of preferred conversion inducement payments (Notes 6 and 8).
Our 2009 financing cash flow reflects net proceeds of $168.3 million from the sale of 15.5 million shares of our common stock and 86,250 shares of $1,000 par value 8% Convertible Perpetual Preferred Stock (8% preferred stock) (Note 8). We also paid $13.5 million in dividends on our 8% preferred stock and our 6¾% convertible preferred stock (6¾% preferred stock).
In 2008, we repaid $274.0 million in net borrowings under our credit facility and paid $2.7 million to induce conversion of $79.3 million of our convertible senior notes. We also paid $23.6 million in dividends on our preferred stock and for inducement payments on the early conversion of approximately 990,000 shares of our 6¾% preferred stock.
For additional information regarding our common and preferred stock offerings and our long-term debt, see Notes 6 and 8.
Variable Rate Senior Secured Revolving Credit Facility
Our credit facility matures in August 2012. The borrowing capacity was $150 million at December 31, 2010. We had no borrowings under the credit facility during 2010 or 2009 A letter of credit in the amount of $100 million remains outstanding under the credit facility to support a portion of the reclamation obligations assumed in a 2007 oil and gas property acquisition, reducing the remaining availability under the facility to $50 million. For additional information regarding our credit facility, see Note 6.
Senior Notes and Convertible Senior Notes
The following debt instruments were outstanding as of December 31, 2010 (in millions):
| | | | | |
| | Amount | | |
| 11.875% senior notes (due 2014) | $ | 300.0 | | |
| 5¼% convertible senior notes (due 2011) | | 74.7 | | |
| 4% convertible senior notes, net of $14.7 discount (due 2017) | | 185.3 | | |
| Credit facility | | - | | |
| Total debt | $ | 560.0 | | |
For additional information regarding our outstanding debt terms and related transactions, see Note 6.
Stockholders’ Equity
We have 157.2 million shares of common stock outstanding (net of treasury shares). In addition we have 22,063 shares of 8% convertible perpetual preferred stock and 700,000 shares of 5.75% convertible perpetual preferred stock, outstanding. As of December 31, 2009 we had 1,589,340 shares of 6 ¾% mandatory convertible preferred stock outstanding, all of which converted to common stock in 2010. As of December 31, 2010, our total stockholders’ equity was $1.7 billion. See Notes 2, 6 and 8 for additional information regarding the descriptions of our outstanding common and preferred stock and the transactions related thereto, including the impact on our results of operations for conversion inducement payments and other preferred dividend charges associated with our convertible preferred stock transactions.
Contractual Obligations and Commitments
In addition to our accounts payable and accrued liabilities ($202.0 million at December 31, 2010), we have other contractual obligations and commitments that will require payments in 2011 and beyond.
The table below summarizes the principal maturities and interest payments associated with our 5¼% notes, 11.875% notes and 4% senior notes, our expected payments for retiree medical costs (Notes 11 and 15), estimates of our current exploration and development commitments and our remaining minimum annual lease payments as of December 31, 2010 (in millions):
| | | | | | 2012 to | | 2014 to | | |
| | Total | | 2011 | | 2013 | | 2015 | | Thereafter |
Debt maturities a | $ | 574.7 | | $ | 74.7 | | $ | - | | $ | 300.0 | | $ | 200.0 |
Scheduled interest payment obligations b | | 237.3 | | | 53.4 | | | 89.5 | | | 78.4 | | | 16.0 |
Retirement benefits c | | 7.2 | | | 1.1 | | | 1.9 | | | 1.6 | | | 2.6 |
Oil and gas obligations d | | 385.1 | | | 355.4 | | | 29.7 | | | - | | | - |
Operating lease obligations e | | 8.3 | | | 2.4 | | | 4.7 | | | 1.2 | | | - |
| | | | | | | | | | | | | | | |
| Total contractual cash obligations | $ | 1,212.6 | | $ | 487.0 | | $ | 125.8 | | $ | 381.2 | | $ | 218.6 |
| a. | Includes $274.7 million of convertible debt, which can be converted to common stock prior to contractual maturity at the discretion of the holders of the securities. |
| b. | Reflects interest and unused commitment fees on the debt balances as of December 31, 2010. Because we did not have any amounts outstanding under our credit facility as of December 31, 2010, we assumed a zero percent effective annual interest rate on our credit facility and a 2.98 percent and |
0.50 percent interest rate on outstanding letters of credit ($100 million) and unused commitment fee, respectively. Interest on the senior notes and convertible senior notes is fixed.
| c. | Includes anticipated payments under our employee retirement health care plan through 2020 (Note 11) and our future reimbursements associated with the contractual liability covering certain of our former sulphur retirees’ medical costs (Note 15). |
| d. | These oil and gas obligations include our net working interest share of authorized exploration and development project costs at December 31, 2010 (i.e. project costs for which spending has been formally approved by us and our partners through executed AFE’s). Also, included in these amounts is $176.7 million of anticipated expenditures for drilling rig contract charges, portions of which we expect to share with our partners in our exploration program. In addition, includes escrow payments of $5 million per year through 2013 to support the funding requirements related to the 2007 oil and gas acquisition property reclamation obligations (Note 15). |
| e. | Amount primarily reflects leases for office space in two buildings in Houston, Texas, which terminate in April 2014 and July 2014, respectively, and office space in Lafayette, Louisiana which terminates in November 2012. |
The table above excludes amounts associated with our oil and gas and sulphur property asset retirement obligations. As of December 31, 2010, approximately $383.9 million of such obligations were recorded as liabilities, $132.7 million of which was reflected as current liabilities (Note 15). Additionally, McMoRan is not a party to any off-balance sheet arrangements that require disclosure in the table above.
We are currently meeting our BOEMRE financial obligations relating to the future abandonment of our Main Pass sulphur facilities using financial assurances from MOXY. We and our subsidiaries’ ongoing compliance with applicable BOEMRE requirements are subject to meeting certain financial and other criteria.
MAIN PASS ENERGY HUBTM PROJECT
Our long-term business objectives may include the pursuit of multifaceted energy services development of the MPEHtm project, including the potential development of a LNG regasification and storage facility through Freeport Energy. As of December 31, 2010, we have incurred approximately $52.5 million of cash costs associated with our pursuit of establishment of MPEHtm, including $0.7 million in 2010. As of December 31, 2010, we have recognized a liability of $12.0 million relating to the future reclamation of the MPEHtm related facilities. The actual amount and timing of reclamation for these structures is dependent on the success of our efforts to use these facilities at the MPEHtm project as described above. We will require commercial arrangements for the MPEH tm project to obtain financing, which may be in the form of additional debt and/or equity transactions. The ultimate outcome of our efforts to enter into commercial arrangements on reasonable terms to develop the MPEHtm project and obtain additional financing is subject to various uncertainties, many of which are beyond our control. Commercialization of the project has been adversely affected by increased domestic sup plies of natural gas, excess LNG re-gasification capacity and general market conditions.
For additional information regarding the MPEHtm project and risks associated therewith, including preliminary capital expenditure estimates, see Item 1A. “Risk Factors” included in this Form 10-K. Also see Note 16 regarding information about transactions that may reduce our future ownership interest in the MPEHtm project.
CRITICAL ACCOUNTING POLICIES AND ESTIMATES
Management’s Discussion and Analysis of our financial condition and results of operations is based upon our consolidated financial statements, which have been prepared in conformity with U.S. generally accepted accounting principles. The preparation of these statements requires that we make estimates and assumptions that affect the reported amounts of assets, liabilities, revenues and expenses. We base these estimates on historical experience and on assumptions that we consider reasonable under the circumstances; however, reported results could differ from the current estimates under different assumptions and/or conditions. The areas requiring the use of management’s estimates are discussed in Note 1 under the heading “Use of Estimates.” The assumptions and estimates described below are our critical acco unting estimates.
Management has reviewed the following discussion of its development and selection of critical accounting estimates with the Audit Committee of our Board of Directors.
Reclamation Costs. Both our oil and gas and former sulphur operations have significant obligations relating to the dismantling and removal of structures used in the production or storage of proved reserves and the plugging and abandoning of wells used to extract the proved reserves. The substantial majority of our reclamation obligations are associated with facilities located in the Gulf of Mexico, which are subject to the regulatory authority of the BOEMRE. The BOEMRE ensures that offshore leaseholders fulfill the abandonment and site clearance responsibilities related to their properties in accordance with applicable laws and regulations in existence at the time such activities are concluded. Current laws and regulations stipulate that upon completio n of operations, the field is to be restored to substantially the same condition as it was before extraction operations commenced. We are obligated for reclamation obligations related to wells and facilities located onshore Louisiana, which are subject to the laws and regulations of the State of Louisiana. Our sulphur reclamation obligations are associated with our former sulphur mining operations.
Among our oil and gas reclamation obligations are the plugging and abandonment of wells, the reclamation and removal of platforms, facilities and pipelines, and the repair and replacement of wells, equipment and facilities, including obligations associated with damages sustained from Hurricanes Ivan, Katrina, Rita and Ike. We record the fair value of our estimated asset retirement obligations in the period such obligations are incurred, rather than accruing the obligations as the related reserves are produced.
The accounting estimates related to reclamation costs are critical accounting estimates because (1) the cost of these obligations is significant to us; (2) we will not incur most of these costs for a number of years, requiring us to make estimates over a long period; (3) new laws and regulations regarding the standards required to perform our reclamation activities could be enacted and such changes could materially change our current estimates of the costs to perform the necessary work; (4) calculating the fair value of our asset retirement obligations requires management to assign probabilities and projected cash flows, to make long-term assumptions about inflation rates, to determine our credit-adjusted, risk-free interest rates and to determine market risk premiums that are appropriate for our operations; and (5)&# 160;given the magnitude of our estimated reclamation and closure costs, changes in any or all of these estimates could have a material impact on our results of operations and our ability to fund these costs.
We use estimates in determining our estimated asset retirement obligations under multiple probability scenarios reflecting a range of possible outcomes considering the future costs to be incurred, the scope of work to be performed and the timing of such expenditures. To calculate the fair value of the estimated obligations, we apply an estimated long-term inflation rate of 2.5 percent and a market risk premium ranging from 0-20 percent, which reflects an estimated premium that a third party would expect for assuming an obligation for a fixed price on a current basis when that obligation is to be settled in the future. We discount the resulting projected cash flows at our estimated credit-adjusted, risk-free interest rates for the corresponding time periods over which these costs would be incurred.
We revise our reclamation and well abandonment estimates whenever warranted by events but at a minimum at least once every year. Revisions made for certain properties depending upon the respective circumstances include consideration of the following: (1) the inclusion of estimates for new properties; (2) changes in the projected timing of certain reclamation costs because of changes in the estimated timing of the depletion of the related proved reserves for our oil and gas properties and current estimates for the timing of the reclamation for the structures comprising the MPEHtm project and Port Sulphur facilities; (3) changes in the reclamation costs based on revised estimates of future reclamation work to be performed; and (4) when applicable, changes in our credit-adjusted, risk-free interest rate. Over the period these reclamation costs would be incurred, the credit-adjusted, risk-free interest rates ranged from 4.6 percent to 9.9 percent at December 31, 2010 and 6.9 percent to 13.1 percent at December 31, 2009.
The following table summarizes the estimates of our reclamation obligations at December 31, 2010 and 2009 (in thousands):
| | Oil and Gas | | Sulphur |
| | 2010 | | 2009 | | 2010 | | 2009 |
| Undiscounted cost estimates | $ | 467,912 | | $ | 538,778 | | $ | 39,817 | | $ | 43,418 |
| Discounted cost estimates | $ | 358,624 | | $ | 428,711 | | $ | 25,266 | | $ | 27,452 |
The following table summarizes the approximate effect of a 1 percent change in the estimated inflation rates and a 5 percent change in the market risk premium rates (in millions):
| | Inflation Rate | | Market Risk Premium | |
| | +1% | | -1% | | +5% | | -5% | |
| Oil & Gas reclamation obligations: | | | | | | | | | | | | |
| Undiscounted | $ | 23.0 | | $ | (21.1) | | $ | 21.7 | | $ | (9.1) | |
| Discounted | | 10.8 | | | (10.1) | | | 16.3 | | | (4.6) | |
| Sulphur reclamation obligations: | | | | | | | | | | | | |
| Undiscounted | | 5.7 | | | (5.0) | | | 1.4 | | | (1.4) | |
| Discounted | | 1.1 | | | (1.0) | | | - | | | - | |
Depletion, Depreciation and Amortization, Including Impairment Charges. As discussed in Note 1, depletion, depreciation and amortization for our oil and gas producing assets is calculated on a field-by-field basis using the units-of-production method based on current estimates of our proved and proved developed reserves. Unproved properties having individually significant leasehold acquisition costs on which management has specifically identified an exploration prospect and plans to explore through drilling activities are individually assessed for impairment. We have fully depreciated all of our other remaining depreciable assets.
The accounting estimates related to depletion, depreciation, and amortization are critical accounting estimates because:
| 1) | The determination of our proved oil and natural gas reserves involves inherent uncertainties. The accuracy of any reserve estimate depends on the quality of available data and the application of engineering and geological interpretations and judgments. Different reserve engineers may make different estimates of proved reserve quantities and estimates of cash flows based on varying interpretations of the same available data. Estimates of proved reserves for wells with limited or no production history are less reliable than those based on actual production history. |
| 2) | The assumptions used in determining whether reserves can be produced economically can vary. The key assumptions used in estimating our proved reserves include: |
| a) | Estimated future oil and natural gas prices and future operating costs. |
| b) | Projected production levels and the timing and amounts of future development, remedial, and abandonment costs. |
| c) | Assumed effects of government regulations on our operations. |
| d) | Historical production from the area compared with production in similar producing areas. |
Changes to our estimates of proved reserves could result in changes to our depletion, depreciation and amortization expense, with a corresponding effect on our results of operations. If estimated proved reserves for each property were 10 percent higher at December 31, 2010, we estimate that our depletion, depreciation and amortization expense for 2010 would have decreased by approximately $15.0 million, while a 10 percent decrease in estimated proved reserves for each property would have resulted in an approximate $14.6 million increase in our depletion, depreciation and amortization expense for 2010. Changes in our estimates of proved reserves may also affect our assessment of asset impairment (see
below). We believe that if our aggregate estimated proved reserves were revised, such a revision could have a material impact on our results of operations, liquidity and capital resources.
As discussed in Notes 1 and 4, we review and evaluate our oil and gas properties for impairment when events or changes in circumstances indicate that the related carrying amounts may not be recoverable. In these impairment analyses we consider both our proved reserves and risk assessed probable reserves, which generally are subject to a greater level of uncertainty than our proved reserves. Decreases in reserve estimates may cause us to record asset impairment charges against our results of operations.
DISCLOSURES ABOUT MARKET RISKS
Our revenues are primarily derived from the sale of crude oil and natural gas. Our results of operations and cash flow can vary significantly with fluctuations in the market prices of these commodities. Based on the currently projected sales volumes of natural gas and oil for 2011, excluding the sales quantity amounts associated with our current oil and gas derivative contract amounts (see below), a change of $1.00 per Mcf in the average realized price for natural gas would have an approximate $45 million net impact on our revenues and pre-tax operating results and a $5 per barrel change in average oil realized prices would have an approximate $11 million net impact on our revenues and pre-tax operating results. Based on our currently projected sales volumes for 2011, excluding those volumes committed for sale under our existin g oil and gas derivative contracts, a 10 percent fluctuation in natural gas sales volumes would impact our revenues by approximately $22 million and our pre-tax operating results by approximately $8 million, while a 10 percent fluctuation in our oil sales volumes would have an approximate $20 million impact on revenues and an approximate $16 million impact on our pre-tax operating results.
Our production is subject to certain uncertainties, many of which are beyond our control, including the timing and flow rates associated with the initial production from our discoveries, weather-related factors, shut-in or recompletion activities on any of our oil and gas properties or on third-party owned pipelines or facilities and the state of the financial and commodity markets. Any of these factors, among others, could materially affect our estimated annualized sales volumes. For more information regarding risks associated with oil and gas production and commodity price fluctuations, see Item 1A. “Risk Factors” of this Form 10-K.
We do not have any amounts outstanding under our credit facility; however, if we did, the credit facility has a variable rate which exposes us to interest rate risk. At the present time we do not hedge our exposure to fluctuations in interest rates.
Because we conduct all of our operations within the U.S. in U.S. dollars and have no investments in equity securities, we currently are not subject to foreign currency exchange risk or equity price risk.
NEW ACCOUNTING STANDARDS
For information regarding our adoption of accounting standards, see Note 1. We do not expect the adoption of any accounting standards in 2011 to have a material impact to our financial statements.
CAUTIONARY STATEMENT
Management’s Discussion and Analysis of Financial Condition and Results of Operations contain forward-looking statements in which we discuss certain of our expectations regarding future operational and financial performance. Forward-looking statements are all statements other than statements of historical facts, such as those statements regarding potential oil and gas discoveries, projected oil and gas exploration, development and production activities and costs, amounts and timing of capital expenditures, reclamation, indemnification and environmental obligations and costs, potential quarterly and annual production rates, reserve estimates, projected operating cash flows and liquidity, and statements about the potential opportunities and benefits presented by the recent property acquisition, including expectations regar ding reserve estimates and production rates. The words “anticipates,” “may,” “can,” “plans,” “believes,” “estimates,” “expects,” “projects,” “intends,” “likely,” “will,” “should,” “to be,” and
any similar expressions and/or statements that are not historical facts are intended to identify those assertions as forward-looking statements.
We believe that our forward-looking statements are based on reasonable assumptions. However, we caution readers that these statements are not guarantees of future performance or exploration and development success, and our actual exploration experience and future financial results may differ materially from those anticipated, projected or assumed in the forward-looking statements. Important factors that may cause our actual results to differ materially from those anticipated by the forward-looking statements include, but are not limited to, those associated with general economic and business conditions, failure to realize expected value creation from property acquisitions, including the recent acquisition of assets from PXP, exercise of preferential rights to pu rchase, variations in the market demand for, and prices of, oil and natural gas, drilling results, unanticipated fluctuations in flow rates of producing wells due to mechanical or operational issues (including those experienced by wells operated by third parties where we are a participant), oil and natural gas reserve expectations, the potential adoption of new governmental regulations (including any enhanced regulatory oversight attributable to the governmental response to the Deepwater Horizon incident), failure of third party partners to fulfill their commitments, the ability to satisfy future cash obligations and environmental costs, adverse conditions, such as high temperatures and pressure that could lead to mechanical failures or increased costs, the ability to hold current or future lease acreage rights, the ability to satisfy future cash obligations and environmental costs, access to capital to fund drilling activities, as well as other genera l exploration and development risks and hazards, and other factors described in more detail under “Risk Factors” in Item 1A. of this Form 10-K.
Investors are cautioned that many of the assumptions upon which our forward-looking statements are based are likely to change after our forward-looking statements are made, including for example the market prices of oil and natural gas, which we cannot control, and production volumes and costs, some aspects of which we may or may not be able to control. Further, we may make changes to our business plans that could or will affect our results. We caution investors that we do not intend to update our forward-looking statements more frequently than quarterly, notwithstanding any changes in our assumptions, changes in our business plans, our actual experience, or other changes, and we undertake no obligation to update any forward-looking statements.
MANAGEMENT’S REPORT ON INTERNAL CONTROL OVER FINANCIAL REPORTING
Our management is responsible for establishing and maintaining adequate internal control over financial reporting. Internal control over financial reporting is defined in Rule 13a-15(f) or 15d-15(f) under the Securities Exchange Act of 1934 as a process designed by, or under the supervision of, the Company’s principal executive and principal financial officers and effected by the Company’s Board of Directors, management and other personnel, to provide reasonable assurance regarding the reliability of financial reporting and the preparation of financial statements for external purposes in accordance with generally accepted accounting principles and includes those policies and procedures that:
| · | Pertain to the maintenance of records that in reasonable detail accurately and fairly reflect the transactions and dispositions of the Company’s assets; |
| · | Provide reasonable assurance that transactions are recorded as necessary to permit preparation of financial statements in accordance with generally accepted accounting principles, and that receipts and expenditures of the Company are being made only in accordance with authorizations of management and directors of the Company; and |
| · | Provide reasonable assurance regarding prevention or timely detection of unauthorized acquisition, use or disposition of the Company’s assets that could have a material effect on the financial statements. |
Because of its inherent limitations, internal control over financial reporting may not prevent or detect misstatements. Projections of any evaluation of effectiveness to future periods are subject to the risk that controls may become inadequate because of changes in conditions, or that the degree of compliance with the policies or procedures may deteriorate.
Our management, including our principal executive officer and principal financial officer, assessed the effectiveness of our internal control over financial reporting as of the end of the fiscal year covered by this annual report on Form 10-K. In making this assessment, our management used the criteria set forth in Internal Control-Integrated Framework issued by the Committee of Sponsoring Organizations of the Treadway Commission (COSO). Based on our management’s assessment, management concluded that, as of the end of the fiscal year covered by this annual report on Form 10-K, our Company’s internal control over financial reporting is effective based on the COSO criteria.
Ernst & Young LLP, an independent registered public accounting firm, who audited the Company’s consolidated financial statements included in this Form 10-K, has issued an attestation report on the Company’s internal control over financial reporting, which is included herein.
| James R. Moffett | Nancy D. Parmelee |
| Co-Chairman of the Board, | Senior Vice President, |
| President and Chief Executive Officer | Chief Financial Officer and |
| | Secretary |
REPORT OF INDEPENDENT REGISTERED PUBLIC ACCOUNTING FIRM
TO THE STOCKHOLDERS AND BOARD OF DIRECTORS
OF McMoRan EXPLORATION Co.:
We have audited McMoRan Exploration Co.’s (McMoRan) internal control over financial reporting as of December 31, 2010, based on criteria established in Internal Control-Integrated Framework issued by the Committee of Sponsoring Organizations of the Treadway Commission (the COSO criteria). McMoRan’s management is responsible for maintaining effective internal control over financial reporting, and for its assessment of the effectiveness of internal control over financial reporting included in the accompanying Management’s Report on Internal Control Over Financial Reporting. Our responsibility is to express an opinion on the Company’s internal control over financial reporting based on our audit.
We conducted our audit in accordance with the standards of the Public Company Accounting Oversight Board (United States). Those standards require that we plan and perform the audit to obtain reasonable assurance about whether effective internal control over financial reporting was maintained in all material respects. Our audit included obtaining an understanding of internal control over financial reporting, assessing the risk that a material weakness exists, testing and evaluating the design and operating effectiveness of internal control based on the assessed risk, and performing such other procedures as we considered necessary in the circumstances. We believe that our audit provides a reasonable basis for our opinion.
A company’s internal control over financial reporting is a process designed to provide reasonable assurance regarding the reliability of financial reporting and the preparation of financial statements for external purposes in accordance with generally accepted accounting principles. A company’s internal control over financial reporting includes those policies and procedures that (1) pertain to the maintenance of records that, in reasonable detail, accurately and fairly reflect the transactions and dispositions of the assets of the company; (2) provide reasonable assurance that transactions are recorded as necessary to permit preparation of financial statements in accordance with generally accepted accounting principles, and that receipts and expenditures of the company are being made only in accordance with authorizations of m anagement and directors of the company; and (3) provide reasonable assurance regarding prevention or timely detection of unauthorized acquisition, use, or disposition of the company’s assets that could have a material effect on the financial statements.
Because of its inherent limitations, internal control over financial reporting may not prevent or detect misstatements. Also, projections of any evaluation of effectiveness to future periods are subject to the risk that controls may become inadequate because of changes in conditions, or that the degree of compliance with the policies or procedures may deteriorate.
In our opinion, McMoRan Exploration Co. maintained, in all material respects, effective internal control over financial reporting as of December 31, 2010, based on the COSO criteria.
We have also audited, in accordance with the standards of the Public Company Accounting Oversight Board (United States), the consolidated balance sheets of McMoRan Exploration Co. as of December 31, 2010 and 2009, and the related consolidated statements of operations, cash flow, and changes in stockholders’ equity for each of the three years in the period ended December 31, 2010, and our report dated February 28, 2011 expressed an unqualified opinion thereon.
New Orleans, Louisiana
February 28, 2011
REPORT OF INDEPENDENT REGISTERED PUBLIC ACCOUNTING FIRM
TO THE STOCKHOLDERS AND BOARD OF DIRECTORS
OF McMoRan EXPLORATION CO.:
We have audited the accompanying consolidated balance sheets of McMoRan Exploration Co. as of December 31, 2010 and 2009, and the related consolidated statements of operations, cash flows, and changes in stockholders’ equity for each of the three years in the period ended December 31, 2010. These financial statements are the responsibility of the Company’s management. Our responsibility is to express an opinion on these financial statements based on our audits.
We conducted our audits in accordance with the standards of the Public Company Accounting Oversight Board (United States). Those standards require that we plan and perform the audit to obtain reasonable assurance about whether the financial statements are free of material misstatement. An audit includes examining, on a test basis, evidence supporting the amounts and disclosures in the financial statements. An audit also includes assessing the accounting principles used and significant estimates made by management, as well as evaluating the overall financial statement presentation. We believe that our audits provide a reasonable basis for our opinion.
In our opinion, the consolidated financial statements referred to above present fairly, in all material respects, the consolidated financial position of McMoRan Exploration Co. at December 31, 2010 and 2009, and the consolidated results of its operations and its cash flow for each of the three years in the period ended December 31, 2010, in conformity with U.S. generally accepted accounting principles.
As discussed in Note 1 to the consolidated financial statements, in 2009 McMoRan changed its reserve estimates and related disclosures as a result of adopting new oil and gas reserve estimation and disclosure requirements.
We also have audited, in accordance with the standards of the Public Company Accounting Oversight Board (United States), McMoRan Exploration Co.’s internal control over financial reporting as of December 31, 2010, based on criteria established in Internal Control-Integrated Framework issued by the Committee of Sponsoring Organizations of the Treadway Commission and our report dated February 28, 2011, expressed an unqualified opinion thereon.
New Orleans, Louisiana
February 28, 2011
McMoRan EXPLORATION CO.
CONSOLIDATED BALANCE SHEETS
| | | December 31, | |
| | | 2010 | | 2009 | |
| | | (In thousands, except share related amounts) | |
| ASSETS | | | | | | | |
| Current assets: | | | | | | | |
| Cash and cash equivalents | | $ | 905,684 | | $ | 241,418 | |
| Accounts receivable | | | 86,516 | | | 79,681 | |
| Inventories | | | 38,461 | | | 47,818 | |
| Prepaid expenses | | | 15,478 | | | 14,457 | |
| Fair value of oil and gas derivative contracts | | | - | | | 8,693 | |
| Current assets from discontinued operations, including restricted cash of $473 | | | 702 | | | 825 | |
| Total current assets | | | 1,046,841 | | | 392,892 | |
| Property, plant and equipment, net | | | 1,785,607 | | | 796,223 | |
| Restricted cash | | | 53,975 | | | 41,677 | |
| Deferred financing costs and other assets | | | 9,952 | | | 11,931 | |
| Long-term assets from discontinued operations | | | 2,989 | | | 6,159 | |
| Total assets | | $ | 2,899,364 | | $ | 1,248,882 | |
| | | | | | | | |
| LIABILITIES AND STOCKHOLDERS’ EQUITY | | | | | | | |
| Current liabilities: | | | | | | | |
| Accounts payable | | $ | 102,658 | | $ | 66,544 | |
| Accrued liabilities | | | 99,363 | | | 51,945 | |
| Accrued interest and dividends payable | | | 6,768 | | | 8,535 | |
| Current portion of accrued oil and gas reclamation costs | | | 120,970 | | | 106,791 | |
| 5¼% convertible senior notes | | | 74,720 | | | - | |
| Fair value of oil and gas derivative contracts | | | - | | | 1,237 | |
| Current portion of accrued sulphur reclamation costs (discontinued operations) | | | 11,772 | | | 8,300 | |
| Current liabilities from discontinued operations | | | 1,993 | | | 1,183 | |
| Total current liabilities | | | 418,244 | | | 244,535 | |
| 11.875% senior notes | | | 300,000 | | | 300,000 | |
| 4% convertible senior notes | | | 185,256 | | | - | |
| 5¼% convertible senior notes | | | - | | | 74,720 | |
| Accrued oil and gas reclamation costs | | | 237,654 | | | 321,920 | |
| Other long-term liabilities | | | 16,596 | | | 16,602 | |
| Accrued sulphur reclamation costs (discontinued operations) | | | 13,494 | | | 19,152 | |
| Other long-term liabilities from discontinued operations | | | 3,783 | | | 6,145 | |
| Total liabilities | | $ | 1,175,027 | | $ | 983,074 | |
| Commitments and contingencies (Note 15) | | | | | | | |
McMoRan EXPLORATION CO.
CONSOLIDATED BALANCE SHEETS
(Continued)
| | | December 31, | |
| | | 2010 | | 2009 | |
| | | (In thousands, except share related amounts) | |
| Stockholders' equity: | | | | | | | |
| Preferred stock, par value $0.01, 50,000,000 shares authorized, 722,063 and | | | | | | | |
| 1,675,590 shares issued and outstanding (liquidation preference), | | | | | | | |
| respectively (Note 8) | | $ | 722,063 | | $ | 245,184 | |
| Common stock, par value $0.01, 300,000,000 shares authorized, 159,797,352 | | | | | | | |
| shares and 88,555,685 shares issued and outstanding, respectively | | | 1,598 | | | 885 | |
| Capital in excess of par value of common stock | | | 2,156,430 | | | 1,053,684 | |
| Accumulated deficit | | | (1,107,481 | ) | | (987,139 | ) |
| Accumulated other comprehensive loss | | | (97 | ) | | (346 | ) |
| Common stock held in treasury, 2,609,427 shares and 2,511,132 shares, | | | | | | | |
| at cost, respectively | | | (48,176 | ) | | (46,460 | ) |
| Total stockholders’ equity | | | 1,724,337 | | | 265,808 | |
| Total liabilities and stockholders’ equity | | $ | 2,899,364 | | $ | 1,248,882 | |
The accompanying notes are an integral part of these consolidated financial statements.
McMoRan EXPLORATION CO.
CONSOLIDATED STATEMENTS OF OPERATIONS
| | Years Ended December 31, | |
| | 2010 | | 2009 | | 2008 | |
| | (In thousands, except per share amounts) | |
| Revenues: | | | | | | | | | |
| Oil and natural gas | $ | 418,816 | | $ | 422,976 | | $ | 1,058,804 | |
| Service | | 15,560 | | | 12,459 | | | 13,678 | |
| Total revenues | | 434,376 | | | 435,435 | | | 1,072,482 | |
| | | | | | | | | | |
| Costs and expenses: | | | | | | | | | |
| Production and delivery costs | | 182,790 | | | 193,025 | | | 258,450 | |
| Depletion, depreciation and amortization expense | | 282,062 | | | 313,980 | | | 854,798 | |
| Exploration expenses | | 42,608 | | | 94,281 | | | 79,116 | |
| Gain on oil and gas derivative contracts | | (4,240 | ) | | (17,394 | ) | | (16,303 | ) |
| General and administrative expenses | | 51,529 | | | 42,954 | | | 48,999 | |
Main Pass Energy Hub™ costs | | 1,011 | | | 1,615 | | | 6,047 | |
| Insurance recoveries (Note 4) | | (38,944 | ) | | (24,592 | ) | | (3,391 | ) |
| Gain on sale of oil and gas property | | (3,455 | ) | | - | | | - | |
| Total costs and expenses | | 513,361 | | | 603,869 | | | 1,227,716 | |
| Operating loss | | (78,985 | ) | | (168,434 | ) | | (155,234 | ) |
| Interest expense, net | | (38,216 | ) | | (42,943 | ) | | (50,890 | ) |
| Other income (expense), net | | 225 | | | 4,043 | | | (2,566 | ) |
| Loss from continuing operations before income taxes | | (116,976 | ) | | (207,334 | ) | | (208,690 | ) |
| Income tax benefit (expense) | | - | | | 2,445 | | | (2,508 | ) |
| Loss from continuing operations | | (116,976 | ) | | (204,889 | ) | | (211,198 | ) |
| Loss from discontinued operations | | (3,366 | ) | | (6,097 | ) | | (5,496 | ) |
| Net loss | | (120,342 | ) | | (210,986 | ) | | (216,694 | ) |
| Preferred dividends and inducement payments for | | | | | | | | | |
| early conversion of preferred stock (Note 8) | | (77,101 | ) | | (14,332 | ) | | (22,286 | ) |
| Net loss applicable to common stock | $ | (197,443 | ) | $ | (225,318 | ) | $ | (238,980 | ) |
| | | | | | | | | | |
| Basic and diluted net loss per share of common stock: | | | | | | | | | |
| Net loss from continuing operations | | $(2.04 | ) | | $(2.79 | ) | | $(3.79 | ) |
| Net loss from discontinued operations | | (0.04 | ) | | (0.08 | ) | | (0.09 | ) |
| Net loss per share of common stock | | $(2.08 | ) | | $(2.87 | ) | | $(3.88 | ) |
| | | | | | | | | | |
| Average common shares outstanding: | | | | | | | | | |
| Basic and diluted | | 95,125 | | | 78,625 | | | 61,581 | |
The accompanying notes are an integral part of these consolidated financial statements.
McMoRan EXPLORATION CO.
CONSOLIDATED STATEMENTS OF CASH FLOW
| | | Years Ended December 31, | |
| | | 2010 | | 2009 | | 2008 | |
| | | (In thousands) | |
| Cash flow from operating activities: | | | | | | | | | | |
| Net loss | | $ | (120,342 | ) | $ | (210,986 | ) | $ | (216,694 | ) |
| Adjustments to reconcile net loss to net cash | | | | | | | | | | |
| provided by operating activities: | | | | | | | | | | |
| Loss from discontinued operations | | | 3,366 | | | 6,097 | | | 5,496 | |
| Depletion, depreciation and amortization expense | | | 282,062 | | | 313,980 | | | 854,798 | |
| Exploration drilling and related expenditures | | | 14,526 | | | 61,504 | | | 37,841 | |
| Compensation expense associated with stock-based awards | | | 18,707 | | | 14,193 | | | 30,223 | |
| Amortization of deferred financing costs | | | 3,729 | | | 3,725 | | | 4,630 | |
| Change in fair value of oil and gas derivative contracts | | | 6,800 | | | 28,631 | | | (40,612 | ) |
| Loss on induced conversion of convertible senior notes | | | - | | | - | | | 2,663 | |
| Reclamation expenditures, net of prepayments by third parties | | | (115,133 | ) | | (45,885 | ) | | (29,432 | ) |
| Increase in restricted cash | | | (12,298 | ) | | (15,049 | ) | | (15,152 | ) |
| Gain on sale of oil and gas property | | | (3,455 | ) | | - | | | - | |
| Payment to fund terminated pension plan | | | - | | | - | | | (2,291 | ) |
| Other | | | 227 | | | (720 | ) | | (155 | ) |
| (Increase) decrease in working capital: | | | | | | | | | | |
| Accounts receivable-customers | | | 13,006 | | | (4,868 | ) | | 40,900 | |
| Accounts receivable-joint interest partners | | | (20,111 | ) | | 34,545 | | | (25,270 | ) |
| Accounts receivable-other | | | (10,378 | ) | | 799 | | | 1,461 | |
| Accounts payable and accrued liabilities | | | 30,223 | | | (33,281 | ) | | 8,618 | |
| Inventories | | | 10,895 | | | (16,535 | ) | | (19,777 | ) |
| Prepaid expenses | | | (1,377 | ) | | 743 | | | (7,588 | ) |
| Net cash provided by continuing operations | | | 100,447 | | | 136,893 | | | 629,659 | |
| Net cash used in discontinued operations | | | (2,217 | ) | | (5,728 | ) | | (6,262 | ) |
| Net cash provided by operating activities | | | 98,230 | | | 131,165 | | | 623,397 | |
| | | | | | | | | | | |
| | | | | | | | | | | |
| Cash flow from investing activities: | | | | | | | | | | |
| Exploration, development and other capital expenditures | | | (217,252 | ) | | (138,015 | ) | | (236,383 | ) |
| Proceeds from sale of oil and gas property | | | 2,920 | | | - | | | - | |
| Acquisition of oil and gas properties, net | | | (86,134 | ) | | - | | | (2,826 | ) |
| Net cash used in continuing activities | | | (300,466 | ) | | (138,015 | ) | | (239,209 | ) |
| Net cash from discontinued operations | | | - | | | - | | | - | |
| Net cash used in investing activities | | $ | (300,466 | ) | $ | (138,015 | ) | $ | (239,209 | ) |
| | | | | | | | | | | |
McMoRan EXPLORATION CO.
CONSOLIDATED STATEMENTS OF CASH FLOW
(Continued)
| | | Years Ended December 31, | |
| | | 2010 | | 2009 | | 2008 | |
| | | (In thousands) | |
| Cash flow from financing activities: | | | | | | | | | | |
| Proceeds from the sale of 5.75% convertible perpetual | | | | | | | | | | |
| preferred stock | | $ | 700,000 | | $ | - | | $ | - | |
| Proceeds from the sale of 4% convertible senior notes | | | 200,000 | | | - | | | - | |
| Dividends paid and inducement payments on early conversion | | | | | | | | | | |
| of convertible preferred stock | | | (27,306 | ) | | (13,469 | ) | | (23,565 | ) |
| Proceeds from exercise of stock options, warrants and other | | | 497 | | | - | | | 4,696 | |
| Costs associated with the sale of 5.75% convertible perpetual | | | | | | | | | | |
| preferred stock and sale of 4% convertible senior notes | | | (6,689 | ) | | - | | | - | |
| Net proceeds from sale of common stock | | | - | | | 84,976 | | | - | |
| Net proceeds from sale of preferred stock | | | - | | | 83,275 | | | - | |
| Payments under senior secured revolving credit facility, net | | | | | | - | | | (274,000 | ) |
| Payments for induced conversion of convertible senior notes | | | - | | | - | | | (2,663 | ) |
| Net cash provided by (used in) continuing operations | | | 866,502 | | | 154,782 | | | (295,532 | ) |
| Net cash activity from discontinued operations | | | - | | | - | | | - | |
| Net cash provided by (used in) financing activities | | | 866,502 | | | 154,782 | | | (295,532 | ) |
| Net increase in cash and cash equivalents | | | 664,266 | | | 147,932 | | | 88,656 | |
| Cash and cash equivalents at beginning of year | | | 241,418 | | | 93,486 | | | 4,830 | |
| Cash and cash equivalents at end of year | | $ | 905,684 | | $ | 241,418 | | $ | 93,486 | |
| | | | | | | | | | | |
| | | | | | | | | | | |
| Interest paid | | $ | 44,543 | | $ | 43,059 | | $ | 55,181 | |
| Income taxes paid | | $ | 63 | | $ | 2,332 | | $ | 3,370 | |
| | | | | | | | | | | |
| Supplemental Non-Cash Investing & Financing Activities: | | | | | | | | | | |
| Issuance of 51 million shares of common stock and other | | | | | | | | | | |
| non-cash purchase price consideration related to PXP | | | | | | | | | | |
| Acquisition | | $ | 926,010 | | $ | - | | $ | - | |
| | | | | | | | | | | |
| Accrued debt and preferred stock offering costs | | $ | 1,006 | | $ | - | | $ | - | |
| | | | | | | | | | | |
The accompanying notes, which include information regarding noncash transactions, are an integral part of these consolidated financial statements.
McMoRan EXPLORATION CO.
CONSOLIDATED STATEMENTS OF CHANGES IN STOCKHOLDERS’ EQUITY
| | | Years Ended December 31, | |
| | | 2010 | | 2009 | | 2008 | |
| | | (In thousands, except share & per share amounts) | |
| 8% Convertible Perpetual Preferred Stock: | | | | | | | | | | |
Balance at beginning of year, representing 86,250 shares in 2010 and no shares in 2009 or 2008 | | $ | 86,250 | | $ | - | | $ | - | |
| Shares converted in privately negotiated transactions, | | | | | | | | | | |
| representing 64,187 shares | | | (64,187 | ) | | - | | | - | |
| Shares sold in equity offering, representing 86,250 shares | | | - | | | 86,250 | | | - | |
| Balance at end of year, representing 22,063 shares in 2010, | | | | | | | | | | |
| 86,250 shares in 2009 and no shares in 2008 | | | 22,063 | | | 86,250 | | | - | |
| | | | | | | | | | | |
| 5.75% Convertible Perpetual Preferred Stock: | | | | | | | | | | |
| Balance at beginning of year | | $ | - | | $ | - | | $ | - | |
| Shares sold in equity offering, representing 700,000 shares | | | 700,000 | | | - | | | - | |
| Balance at end of year, representing 700,000 shares in 2010 | | | | | | | | | | |
| and no shares in 2009 and 2008 | | | 700,000 | | | - | | | - | |
| | | | | | | | | | | |
| 6¾% Mandatorily Convertible Preferred Stock: | | | | | | | | | | |
| Balance at beginning of year, representing 1,589,340 shares in | | | | | | | | | | |
| 2010 and 2009 and 2,587,500 shares in 2008 | | | 158,934 | | | 158,934 | | | 258,750 | |
| Shares converted representing 1,589,340 shares in 2010 and 998,160 in 2008 | | | (158,934 | ) | | - | | | (99,816 | ) |
| Balance at end of year, representing no shares in 2010 and | | | | | | | | | | |
| 1,589,340 shares in 2009 and 2008 | | | - | | | 158,934 | | | 158,934 | |
| | | | | | | | | | | |
| Common Stock: | | | | | | | | | | |
| Balance at beginning of year, representing 88,555,685 shares | | | | | | | | | | |
| in 2010, 72,981,734 shares in 2009 and 55,795,251 shares | | | | | | | | | | |
| in 2008 | | | 885 | | | 730 | | | 558 | |
| Shares issued to Plains Exploration & Production Company | | | | | | | | | | |
| in 2010 (Notes 2 and 8), representing 51,000,000 shares | | | 510 | | | - | | | - | |
| Preferred stock conversions, representing 20,061,622 shares | | | | | | | | | | |
| and 6,708,033 shares in 2008 | | | 201 | | | - | | | 67 | |
| Shares issued in equity offering, representing 15,547,400 | | | | | | | | | | |
| shares (at $5.75 per share) in 2009 (Note 8) | | | - | | | 155 | | | - | |
| Shares issued in debt conversion transactions, representing | | | | | | | | | | |
| 9,508,743 shares in 2008 | | | - | | | - | | | 95 | |
| Exercise of stock warrants representing 636,811 shares | | | | | | | | | | |
| in 2008 | | | - | | | - | | | 7 | |
| Exercise of stock options and other, representing 180,045 in | | | | | | | | | | |
| 2010, 26,551 shares in 2009 and 332,896 shares in 2008 | | | 2 | | | - | | | 3 | |
| Balance at end of year, representing, 159,797,352 shares in | | | | | | | | | | |
| 2010, 88,555,685 shares in 2009 and 72,981,734 shares in | | | | | | | | | | |
| 2008 | | | 1,598 | | | 885 | | | 730 | |
| | | | | | | | | | | |
McMoRan EXPLORATION CO.
CONSOLIDATED STATEMENTS OF CHANGES IN STOCKHOLDERS’ EQUITY
(Continued)
| | | | Years Ended December 31, | |
| | | | 2010 | | | 2009 | | | 2008 | |
| | | | (In thousands, except share and per share amounts) | |
| Capital in Excess of Par Value: | | | | | | | | | | |
| Balance at beginning of year | | | 1,053,684 | | | 971,977 | | | 718,472 | |
| Costs associated with preferred stock equity offerings | | | (5,945 | ) | | (2,975 | ) | | - | |
| Common stock issued, net of offering costs | | | 875,670 | | | 84,821 | | | - | |
| Intrinsic value – convertible debt and equity beneficial conversion options (Notes 6 and 8) | | | 66,375 | | | - | | | - | |
| Shares issued in debt conversion transactions | | | - | | | - | | | 140,127 | |
| Preferred stock conversions | | | 222,921 | | | - | | | 99,749 | |
| Stock-based compensation expense | | | 18,707 | | | 14,193 | | | 30,223 | |
| Exercise of stock options and warrants | | | 2,119 | | | - | | | 5,692 | |
| Preferred stock dividends, inducement payments and beneficial conversion option | | | (77,101 | ) | | (14,332 | ) | | (22,286 | ) |
| Balance at end of year | | | 2,156,430 | | | 1,053,684 | | | 971,977 | |
| Accumulated Deficit: | | | | | | | | | | |
| Balance at beginning of year | | $ | (987,139 | ) | $ | (776,153 | ) | $ | (559,459 | ) |
| Net loss | | | (120,342 | ) | | (210,986 | ) | | (216,694 | ) |
| Balance at end of year | | | (1,107,481 | ) | | (987,139 | ) | | (776,153 | ) |
| | | | | | | | | | | |
| Accumulated Other Comprehensive Loss: | | | | | | | | | | |
| Balance at beginning of year | | | (346 | ) | | (22 | ) | | (653 | ) |
| Amortization of previously unrecognized pension | | | | | | | | | | |
| components, net | | | (40 | ) | | (40 | ) | | (40 | ) |
| Change in unrecognized net gains/losses of pension plans | | | 289 | | | (284 | ) | | 671 | |
| Balance at end of year | | | (97 | ) | | (346 | ) | | (22 | ) |
| | | | | | | | | | | |
| Common Stock Held in Treasury: | | | | | | | | | | |
| Balance at beginning of year, representing 2,511,132 shares | | | | | | | | | | |
| in 2010, 2,508,660 shares in 2009 and 2,471,674 in 2008 | | | (46,460 | ) | | (46,443 | ) | | (45,439 | ) |
| Tender of 98,295 shares in 2010, 2,472 shares in 2009 and | | | | | | | | | | |
| 36,986 shares in 2008 associated with the exercise of stock | | | | | | | | | | |
| options and the vesting of restricted stock | | | (1,716 | ) | | (17 | ) | | (1,004 | ) |
| Balance at end of year, representing 2,609,427 shares in | | | | | | | | | | |
| 2010, 2,511,132 shares in 2009 and 2,508,660 shares | | | | | | | | | | |
| in 2008 | | | (48,176 | ) | | (46,460 | ) | | (46,443 | ) |
| | | | | | | | | | | |
| Total stockholders’ equity | | $ | 1,724,337 | | $ | 265,808 | | $ | 309,023 | |
The accompanying notes are an integral part of these consolidated financial statements.
McMoRan EXPLORATION CO.
NOTES TO CONSOLIDATED FINANCIAL STATEMENTS
1. SUMMARY OF SIGNIFICANT ACCOUNTING POLICIES
Basis of Presentation. The consolidated financial statements of McMoRan Exploration Co. (McMoRan), a Delaware Corporation, are prepared in accordance with U.S. generally accepted accounting principles. McMoRan’s consolidated financial statements include the accounts of those subsidiaries where McMoRan directly or indirectly has more than 50 percent of the voting rights and where the right to participate in significant management decisions is not shared with other shareholders, including its two wholly owned subsidiaries, McMoRan Oil & Gas LLC (MOXY) and Freeport-McMoRan Energy LLC (Freeport Energy). MOXY conducts all of McMoRan’s oil and gas operations and the long-term business objective of Freeport Energy is to maximize the value of the offshore structures used in the former sulphur operations, which may include the pursuit of a multifaceted energy services facility, including the potential development of liquefied natural gas (LNG) regasification and storage facility at the Main Pass Energy HubTM (MPEHTM) project located at Main Pass Block 299 (Main Pass) in the Gulf of Mexico.
McMoRan’s investments in unincorporated legal entities represented by undivided interests in other oil and gas joint ventures and partnerships engaged in oil and gas exploration, development and production activities are pro rata consolidated, whereby a proportional share of each joint venture’s and partnership’s assets, liabilities, revenues and expenses are included in the accompanying consolidated financial statements in accordance with McMoRan’s working and net revenue interests in each joint venture and partnership.
All significant intercompany transactions have been eliminated. Changes in the accounting principles applied during 2010, none of which impacted the consistency of presentation, are discussed below under the caption “New Accounting Standard.”
McMoRan’s previously discontinued sulphur operations are presented as such, and the major classes of assets and liabilities related to its former sulphur business are separately shown for the periods presented.
On December 30, 2010, MOXY completed an acquisition of oil and gas properties (Note 2). McMoRan’s consolidated financial statements include the acquisition cost and results of operations of the acquired properties prospectively from the closing date.
Nature of Operations. McMoRan is an oil and gas exploration and production company engaged directly through its subsidiaries, joint ventures or partnerships with other entities in the exploration, development, production and marketing of crude oil and natural gas. McMoRan’s operations are located entirely in the United States, primarily offshore in the Gulf of Mexico and onshore in the Gulf Coast region (primarily Louisiana and Texas).
McMoRan’s production of oil and natural gas involves lifting oil and natural gas to the surface and gathering, treating and processing hydrocarbons to extract liquids from natural gas. McMoRan’s production costs include all costs incurred to operate or maintain its wells and related equipment and facilities. Examples of these costs include:
| · | labor costs to operate the wells and related equipment and facilities; |
| · | repair and maintenance costs, including costs associated with re-establishing production from a geological structure that has previously produced; |
| · | material, supplies, and fuel consumed and services utilized in operating the wells and related equipment and facilities, including marketing and transportation costs; and |
| · | property taxes and insurance applicable to proved properties and wells and related equipment and facilities. |
McMoRan’s oil and natural gas revenues include a component for reimbursements of marketing and transportation costs, which are recorded as a corresponding reduction of production and delivery costs.
Use of Estimates. The preparation of McMoRan’s financial statements in conformity with U.S. generally accepted accounting principles require management to make estimates and assumptions that affect the amounts reported in these consolidated financial statements and the accompanying notes to the consolidated financial statements. The more significant estimates include reclamation and environmental obligations, useful lives for depletion, depreciation and amortization, estimates of proved oil and natural gas reserves and related future cash flows and the carrying value of long-lived assets and assets held for sale or disposal. Actual results could differ from those estimates.
Cash and Cash Equivalents. Highly liquid investments purchased with an original maturity of three months or less are considered cash equivalents (excluding certain restricted cash, Note 15).
Accounts Receivable. The majority of McMoRan’s accounts receivable result from oil and natural gas sales or joint interest billings to third parties in the energy industry. McMoRan has not historically had any significant collection problems, and no allowance for doubtful accounts is included in the accompanying financial statements.
Inventories. Product inventories totaled $1.1 million at December 31, 2010 and $0.6 million at December 31, 2009, consisting entirely of crude oil at Main Pass. Materials and supplies inventory totaled $37.4 million at December 31, 2010 and $47.2 million at December 31, 2009 and represents the cost of supplies to be used in McMoRan’s drilling activities, primarily drilling pipe and tubulars. A portion of the cost of such inventory will be reimbursed to McMoRan by joint operating partners as future well drilling activity utilizes these materials. McMoRan’s inventories are stated at the lower of weighted average cost or market. As a result of declines in market values of certain inventory items, McMoRan recorded a write-down of $3 .3 million during 2009 for materials not dedicated to planned drilling projects. There were no required reductions in the carrying value of McMoRan’s inventories during 2010.
Property, Plant and Equipment.
Oil and Gas. McMoRan follows the successful efforts method of accounting for its oil and natural gas exploration and development activities. Costs associated with drilling and development activities are included as a use of investing cash flow in the accompanying consolidated statements of cash flow.
| · | Geological and geophysical costs and costs of retaining unproved properties and undeveloped properties are charged to expense as incurred and are included as a use of operating cash flow in the accompanying consolidated statements of cash flow. |
| · | Costs of exploratory wells are capitalized pending determination of whether they have discovered proved reserves. |
| * | The costs of exploratory wells that have found oil and natural gas reserves that cannot be classified as proved when drilling is completed, continue to be capitalized as long as the well has found a sufficient quantity of reserves to justify its completion as a producing well and sufficient progress is being made in assessing the proved reserves and the economic and operating viability of the project. Management evaluates progress on such wells on a quarterly basis. |
| * | Drilling costs that no longer meet the criteria for continued capitalization under U.S. generally accepted accounting principles, but for which management intends to pursue development activities, are charged to depletion, depreciation and amortization expense. |
| * | If proved reserves are not discovered, the related drilling costs are charged to exploration expense. |
| · | Acquisition costs of leases and development activities are capitalized. |
| · | Other exploration costs are charged to expense as incurred. |
| · | Depletion, depreciation and amortization expense is determined on a field-by-field basis using the units-of-production method, with depletion, depreciation and amortization rates for leasehold |
acquisition costs based on estimated proved reserves and depletion, depreciation and amortization rates for well and related facility costs based on proved developed reserves associated with each field. The depletion, depreciation and amortization rates are changed whenever there is an indication of the need for a revision but, at a minimum, are revised semi-annually. Any such revisions are accounted for prospectively as a change in accounting estimate.
| · | The costs of maintenance and repairs, which are not significant improvements, are expensed when incurred. |
| · | Gains or losses from dispositions of McMoRan’s interests in oil and gas properties are included in earnings under the following conditions: |
| * | All or part of an interest owned is sold to an unrelated third party; if only part of an interest is sold, there is no substantial uncertainty about the recoverability of cost applicable to the interest retained; and |
| * | McMoRan has no substantial obligation for future performance (e.g. drilling a well(s) or operating the property without proportional reimbursement of costs relating to the interest sold). |
| · | Interest expense allocable to significant unproved leasehold costs and in progress exploration and development projects is capitalized until the assets are ready for their intended use. Interest expense capitalized by McMoRan totaled $10.1 million in 2010, $3.9 million in 2009 and $5.0 million in 2008. |
Sulphur. Note 10 includes results associated with McMoRan’s discontinued operations, which are reflected within the caption “Loss from discontinued operations” in the accompanying consolidated statements of operations. McMoRan’s remaining sulphur property, plant and equipment is carried at the lower of cost or estimated net realizable value.
Asset Impairment. Costs of unproved oil and gas properties are assessed periodically and a loss is recognized if the properties are deemed impaired. When events or circumstances indicate that proved oil and gas property carrying amounts might not be recoverable from estimated future undiscounted cash flows, a reduction of the carrying amount to estimated fair value is required. McMoRan estimates the fair value of its properties (derived from Level 3 inputs) using estimated future cash flows based on proved and risk-adjusted probable oil and natural gas reserves as estimated by independent reserve engineers. Future cash flows are determined using published period-end forward market prices adjusted for property-specific price basis d ifferentials, net of estimated future production and development costs and excluding estimated asset retirement and abandonment expenditures. If the undiscounted cash flows indicate that the property is impaired, McMoRan discounts the future cash flows using a discount factor that considers market participants’ expected rates of return for similar type assets if acquired under current market conditions.
The determination of oil and gas reserve estimates is a subjective process, and the accuracy of any reserve estimate depends on the quality of available data and the application of engineering and geological interpretation and judgment. Estimates of economically recoverable reserves and future net cash flows depend on a number of variable factors and assumptions that are difficult to predict and may vary considerably from actual results. In particular, reserve estimates for wells with limited or no production history are less reliable than those based on actual production. Subsequent evaluation of the same reserves may result in variations in estimated reserves and related estimates of future cash flows, and these variations may be substantial. If the capitalized costs of an individual oil and gas propert y exceed the related estimated future net cash flows, an impairment charge to reduce the capitalized costs to the property’s estimated fair value is required (Note 4).
Revenue Recognition and Gas Balancing. McMoRan generally sells crude oil and natural gas under short-term agreements at prevailing market prices. Revenue for the sale of crude oil and natural gas is recognized when title passes to the customer, when prices are fixed or determinable and collection is reasonably assured. Natural gas revenues involving partners in natural gas wells are recognized when the natural gas is sold using the entitlements method of accounting and are based on McMoRan’s net
working interests. When McMoRan receives a volume in excess of its net working interests, it records a liability and under deliveries are recorded as receivables. At December 31, 2010, McMoRan had natural gas imbalance receivables valued at $5.7 million and liabilities valued at $6.7 million for over deliveries. At December 31, 2009, McMoRan had natural gas imbalance receivables valued at $5.4 million and liabilities valued at $8.0 million for over deliveries.
McMoRan has a number of producing fields that have been awarded royalty relief under the “Deep Gas Royalty Relief” program instituted by the Bureau of Ocean Energy Management, Regulation and Enforcement (BOEMRE) (formerly, the Minerals Management Service). Under this program, the leases in which McMoRan has obtained relief are eligible for suspensions of the obligation to pay federal royalties on certain amounts of production, with each field’s eligible amount of relief determined by specific BOEMRE criteria and subject to their final approval. Fluctuations in the amount of royalty relief revenue recognized will primarily occur based on the number of properties that qualify for relief in a given year. McMoRan recognized $2.8 million in 2010 , $4.0 million in 2009 and $17.7 million in 2008 of oil and natural gas revenues associated with awarded royalty relief. The royalty relief granted under this program is subject to certain annually adjusted price thresholds established by the BOEMRE. If the annual NYMEX market price for natural gas exceeds the BOEMRE’s annual price threshold, then relief is suspended under the program for that year and royalties would be due to the BOEMRE with interest. McMoRan recognizes oil and gas revenues from production on properties eligible for royalty relief as the amounts are earned. If the price threshold is exceeded or estimated to be exceeded based on forward pricing at the end of a reporting period, McMoRan defers all such revenues until the threshold price is no longer exceeded. The price threshold was not exceeded for the years ending December 31, 2010, 2009 or 2008.
Service Revenue. McMoRan records the gross amount of reimbursements for costs from third parties as service revenues whenever McMoRan is the primary obligor with respect to the source of such costs, has discretion in the selection of how the related service costs are incurred and when it has assumed the credit risk associated with the reimbursement for such service costs. The service costs associated with these third-party reimbursements are also recorded within the applicable cost and expense line item in the accompanying consolidated financial statements.
McMoRan’s service revenues have been generated primarily through fees for processing third-party oil production through the oil facilities at Main Pass, other third party management fees and standardized industry (COPAS) overhead charges McMoRan receives as operator of oil and gas properties.
Reclamation and Closure Costs. McMoRan incurs costs for environmental programs and projects. Expenditures pertaining to future revenues from operations are capitalized. Expenditures resulting from the remediation of conditions caused by past operations that do not contribute to future revenue generation are charged to expense. Liabilities are recognized for remedial activities when the efforts are probable and the costs can be reasonably estimated. Reclamation cost estimates are by their nature imprecise and can be expected to be revised over time because of a number of factors, including changes in reclamation plans, cost estimates, governmental regulations, technology and inflation.
McMoRan uses estimates derived from information provided by third-party specialists and in-house engineers in determining its estimated asset retirement obligations under multiple probability-assessed scenarios reflecting a range of possible outcomes considering the future costs to be incurred, the scope of work to be performed and the timing of such expenditures (Note 15).
Comprehensive Loss. McMoRan follows U.S. generally accepted accounting principles for the reporting and display of comprehensive loss (net loss adjusted for other comprehensive income (loss), or all other changes in net assets from nonowner sources) and its components (Note 13).
Financial Instruments and Contracts. Based on its assessment of market conditions, McMoRan may enter into financial contracts to manage certain risks resulting from fluctuations in oil and natural gas prices. Costs or premiums and gains or losses on contracts meeting deferral criteria are recognized with the hedged transactions. Also, gains or losses are recognized if the hedged transaction is no longer expected to occur or if deferral criteria are not met. McMoRan monitors any related counterparty credit risk on an ongoing basis and considers this risk to be minimal.
In connection with the 2007 oil and gas property acquisition, MOXY entered into oil and gas derivative contracts for a portion of its anticipated production for the years 2008 through 2010. The oil and gas derivative contracts were not designated as hedges for accounting purposes. Accordingly, these contracts are subject to mark-to-market fair value adjustments, the impact of which is recognized immediately in McMoRan’s operating results. McMoRan records all gains and losses associated with these derivative contracts within a separate line in the accompanying consolidated statements of operations, and any related cash flow effect is recorded within cash flows from operations in the related consolidated statements of cash flow. McMoRan believes the oper ating presentation of its oil and gas derivatives contracts is appropriate in both its statements of operations and cash flow because the sale of oil and natural gas production represents the primary source of its operating income and cash flow. As of December 31, 2010, McMoRan had no derivative contracts outstanding (Note 7).
Earnings Per Share. Basic net loss per share of common stock is calculated by dividing the loss applicable to continuing operations, the income (loss) from discontinued operations, and the net loss applicable to common stock by the weighted-average number of common shares outstanding during the periods presented. For purposes of the basic earnings per share computations, the net loss applicable to continuing operations includes preferred stock dividends and related charges (Notes 8 and 9).
Stock-Based Compensation. Compensation cost recognized includes compensation cost for all stock option awards granted based on the grant-date fair value and restricted stock units granted which are estimated in accordance with U.S. generally accepted accounting principles. McMoRan recognizes compensation costs for awards that vest over several years on a straight-line basis over the vesting period. McMoRan’s stock-based awards provide for an additional year of vesting after an employee retires. For awards to retirement-eligible employees, McMoRan records one year of amortization of the awards’ estimated fair value on the date of grant because the grantee has earned that one year vesting benefit under the terms of McMoRan’s stock options plans b ased on length of service. McMoRan includes estimated forfeitures in its compensation cost and updates the estimated forfeiture rate through the final vesting date of the awards (Note 11).
McMoRan currently recognizes no income tax benefits for deductions resulting from the exercise of stock options because all of its net deferred tax assets, including significant net operating loss carryforwards, have been reserved with a full valuation allowance (Note 12).
New Accounting Standards. In January 2010, the Financial Accounting Standards Board (FASB) issued guidance which added new requirements for fair value disclosures about transfers into and out of Levels 1 and 2 and separate disclosures about purchases, sales, issuances and settlements relating to Level 3 measurements. The guidance also clarified existing requirements regarding the level of disaggregation as well as inputs and valuation techniques used to measure fair value. The guidance is effective for the first reporting period beginning after December 31, 2009, except for the requirement to provide the Level 3 activity of purchases, sales, issuances, and settlements on a gross basis, which are effective for fiscal years beginning after December 31, 2010. The adoption of this guidance had no material impact on McMoRan’s fair value disclosures.
In December 2008 the Securities and Exchange Commission (SEC) approved amendments to revise its oil and gas reserve estimation and disclosure requirements. The amendments among other things:
| · | allow the use of new technologies to determine proved reserves; |
| · | permit the optional disclosure of probable and possible reserves; |
| · | modify the prices used to estimate reserves for SEC disclosure purposes to a 12-month average price instead of a period-end price; and |
| · | require that if a third party is primarily responsible for preparing or auditing the reserve estimates, the company make disclosures relating to the independence and qualifications of the third party, including filing as an exhibit any report received from the third party. |
The new SEC reserve estimation and disclosure requirements were initially effective for McMoRan’s disclosures included in its 2009 Form 10-K.
In January 2010, the FASB issued accounting guidance to align the reserve calculation and disclosure requirements of U.S. generally accepted accounting principles with the new SEC oil and gas
reserve estimation and disclosure rules. McMoRan adopted this accounting guidance effective for its December 31, 2009 financial statements (Note 17).
2. ACQUISITION OF GULF OF MEXICO SHELF PROPERTIES
On December 30, 2010, McMoRan completed the $1 billion acquisition of Plains Exploration & Production Company’s (PXP) shallow water Gulf of Mexico shelf assets (PXP Acquisition). Under the terms of the transaction, McMoRan issued 51 million shares of its common stock and paid $75.0 million in cash to PXP. In addition, the purchase price included $51.1 million associated with estimated revenues, expenses and capital expenditures attributable to the properties from the August 1, 2010 effective date through the December 30, 2010 closing date, and the assumption of approximately $9.9 million of related asset retirement obligations. The substantial majority of properties acquired from PXP represented their interests in certain deep gas and ultra-deep exploration projects that were jointly owned by McM oRan and PXP prior to the transaction. McMoRan incurred approximately $9.0 million in transaction related costs for the PXP Acquisition included in general and administrative expenses in 2010. Concurrent with the PXP Acquisition, McMoRan issued $700 million of 5.75% Convertible Perpetual Preferred Stock (5.75% preferred stock) and $200 million of 4% Convertible Senior Notes (4% senior notes) to certain investors (Notes 6 and 8).
The purchase price for the PXP Acquisition is subject to adjustments based on final settlement of certain post-closing items, if any, within 180 days of the closing date. The allocation of the approximate $1.0 billion purchase price to the acquired assets and assumed liabilities is based on McMoRan’s preliminary valuation estimates, which are subject to change pending the final settlement of post-closing adjustments related to the acquired properties. The following table summarizes the estimated fair value of the assets acquired and liabilities assumed (derived from Level 3 fair value inputs) at the date of acquisition (December 30, 2010):
| | | | | |
| Property, Plant and Equipment | | | | |
| Cash consideration- | | | | |
| Purchase price terms | $ | 75,000 | | |
| Post-effective date cash items | | 9,596 | | |
| Stock consideration- | | | | |
| 51 million shares based on McMoRan’s closing stock | | | | |
| price of $17.18 per share on December 30, 2010 | | 876,180 | | |
| Post-effective date non-cash items and other | | 39,948 | | |
| Assumed asset retirement obligations | | 9,882 | | |
| Acquired property, plant and equipment | $ | 1,010,606 | | |
| | | | | |
Inventory (cash consideration) | $ | 1,538 | | |
The following unaudited pro forma financial information assumes McMoRan acquired the properties from PXP and consummated the related financing transactions effective January 1, 2009 (amounts in thousands, except per share data):
| | (Pro Forma, Unaudited) |
| | Years Ended |
| | December 31, |
| | | 2010 | | | 2009 | |
| Revenues | $ | 550,808 | | $ | 562,726 | |
| Operating loss | | (58,331 | ) | | (175,565 | ) |
| Net loss to common shareholders | | (175,771 | ) | | (334,682 | ) |
| Basic and diluted net loss per share of common stock | | (1.20 | ) | | (2.58 | ) |
The pro forma operating loss and net loss amounts reflected above include pro forma adjustments for certain exploration and asset impairment charges that McMoRan would have recorded under the successful efforts method of accounting assuming the PXP Acquisition had been consummated
on January 1, 2009. Those amounts include $9.7 million and $39.7 million of non-productive exploratory drilling costs in 2010 and 2009, respectively, and $26.8 million of asset impairment charges in 2010. In addition, $9.0 million of transaction-related costs for the PXP Acquisition and $51.6 million of preferred dividend charges related to the issuance of the 5.75% preferred stock (Note 8) has been reflected in 2009 rather than 2010 under the pro forma assumption that the PXP Acquisition and related financing transactions occurred as of January 1, 2009.
The fair value of the acquired oil and gas properties was determined using estimated future cash flows based upon proved and risk-adjusted unproved oil and gas reserves, as estimated by a combination of independent and internal McMoRan reserve engineers. Future cash flows were determined using published forward market prices net of estimated future production and development costs. The future net cash flows were discounted using a discount factor that considered investors’ expected rates of return for similar assets.
3. ACCOUNTS RECEIVABLE AND MAJOR CUSTOMERS
The components of accounts receivable follow (in thousands):
| | | December 31, | |
| | | 2010 | | 2009 | |
| Accounts receivable: | | | | | | | |
| Customers | | $ | 42,138 | | $ | 55,144 | |
| Joint interest partners | | | 32,429 | | | 22,966 | |
| Other | | | 11,949 | | | 1,571 | |
| Total accounts receivable | | $ | 86,516 | | $ | 79,681 | |
Sales of McMoRan’s oil and natural gas production to individual customers representing 10 percent or more of its total consolidated oil and gas revenues in each of the three years in the period ended December 31, 2010 is as follows:
| | Years Ended December 31, | |
| Individual Customer | 2010 | | 2009 | | 2008 | |
| A | | 35 | % | | 32 | % | | 35 | % |
| B | | 14 | | | 15 | | | <10 | |
| C | | <10 | | | 10 | | | 18 | |
| D | | <10 | | | <10 | | | 12 | |
All of McMoRan’s customers are located in the United States. McMoRan does not believe the loss of any of these purchasers would have a material adverse affect on its operations because oil and gas is a commodity in demand and alternative purchasers, if needed, are available.
4. PROPERTY, PLANT AND EQUIPMENT
The components of net property, plant and equipment follow (in thousands):
| | | December 31, | |
| | | 2010 | | 2009 | |
| Oil and gas property, plant and equipment | | $ | 3,491,386 | | $ | 2,246,397 | |
| Other | | | 31 | | | 31 | |
| | | | 3,491,417 | | | 2,246,428 | |
| Accumulated depletion, depreciation and amortization | | | (1,705,810 | ) | | (1,450,205 | ) |
| Property, plant and equipment, net | | $ | 1,785,607 | | $ | 796,223 | |
See Note 2 regarding the PXP Acquisition which significantly increased McMoRan’s investment in oil and gas property, plant and equipment in 2010.
The components of McMoRan’s depletion, depreciation and amortization expense are summarized below (in thousands):
| | | Years Ended December 31, | |
| | | 2010 | | 2009 | | 2008 | |
| Depletion and depreciation expense | | $ | 148,358 | | $ | 205,479 | | $ | 357,458 | |
| Accretion expense | | | 26,525 | | | 33,186 | | | 164,753 | |
| Impairment charges/losses | | | 107,179 | | | 75,315 | | | 332,587 | |
| Total depletion, depreciation and amortization expense | | $ | 282,062 | | $ | 313,980 | | $ | 854,798 | |
As discussed in Note 1, when events and circumstances indicate that proved oil and gas property carrying amounts might not be recoverable from estimated future undiscounted cash flows, a reduction of the carrying amount to estimated fair value is required. McMoRan estimates the fair value of its properties using estimated future cash flows based on proved and risk-adjusted probable oil and natural gas reserves as estimated by independent reserve engineers. Future cash flows are determined using published forward market prices adjusted for property-specific price basis differentials, net of estimated future production and development costs and excluding estimated asset retirement and abandonment expenditures. If the undiscounted cash flows indicate that the property is impaired, McMoRan discounts the future cash flows using a discount factor that considers third-party investors’ expected rates of return for similar type assets if acquired under current market conditions. McMoRan classifies the fair value measurement used in its impairment evaluation as being derived from Level 3 fair value inputs, as defined under generally accepted accounting principles.
McMoRan recorded impairment charges during 2010 and 2009 of $107.2 million and $75.3 million, respectively, due largely to declines in market prices for natural gas during those years and, with respect to certain properties, as a result of negative reserve revisions from well performance issues.
As a result of the significant decline in market prices for oil and natural gas that occurred in the fourth quarter of 2008, McMoRan recorded impairment charges of $246.9 million. McMoRan also recorded impairment charges totaling $44.9 million on two oil and gas properties (Mound Point South and JB Mountain Deep) after re-considering its then near term drilling plans under market conditions at that time. Additionally, McMoRan recorded other charges in 2008 totaling $40.8 million to write off its remaining investments in various wells following unsuccessful attempts to re-establish production and after significant damage was incurred at certain wells during Hurricane Ike. In addition, asset retirement related accretion expense totaling $124.4 million was re corded during 2008 to reflect accelerated timing and additional reclamation costs for certain properties resulting from Hurricane Ike.
As discussed above, the continued decline in market prices for oil and natural gas coupled with other operational factors triggered impairment assessments that ultimately resulted in significant impairment charges for several of McMoRan’s oil and gas property investments. Additional impairment charges may be recorded in future periods if market conditions experienced in recent years continue to weaken, or if other unforeseen operational issues occur that negatively impact McMoRan’s ability to fully recover its current investments in oil and gas properties.
Insurance
Hurricanes Gustav and Ike impacted Gulf of Mexico operations prior to making landfall on the Louisiana and Texas coasts in September 2008. Although there was no significant damage to McMoRan’s properties resulting from Hurricane Gustav, Hurricane Ike caused significant structural damage to several platforms in which McMoRan had an investment interest. Since the third quarter of 2008, McMoRan has recorded charges totaling in excess of $190 million related to incurred repair costs, property impairments and additional estimated reclamation costs associated with the damaged properties. While a portion of these costs has been funded to date, a significant amount of the remaining expenditures, particularly for asset retirement obligations, will be funded by McMoRan in future years. Consistent wi th McMoRan’s claims experience to date, McMoRan expects to realize a substantial recovery in future periods under its insurance program for a large portion of these hurricane related costs, reimbursement for which is received after damage-related expenditures are funded and related claims are approved.
McMoRan recognized net insurance recoveries of $38.9 million in 2010 and $24.6 million in 2009, after satisfying its $50 million deductible, as partial reimbursements associated with certain of McMoRan’s
insured hurricane-related losses. McMoRan did not record any insurance recoveries in 2008 related to Hurricane Ike; however, in 2008 a $3.4 million settlement was received from McMoRan’s previous Hurricane Katrina property loss claim.
5. OTHER ASSETS AND OTHER LIABILITIES
McMoRan defers its financing costs associated with its debt instruments and amortizes the costs over the terms of the related instruments. The components of deferred financing costs follow (in thousands):
| | December 31, 2010 | | December 31, 2009 | |
| | Gross | | | | | | Gross | | | | | |
| | Carrying | | Accumulated | | | | Carrying | | Accumulated | | | |
| | Amount | | Amortization | | Net | | Amount | | Amortization | | Net | |
| 11.875% Senior Notes | | | | | | | | | | | | | | | | | | |
| (due November 2014) | $ | 8,055 | | $ | (3,602 | ) | $ | 4,453 | | $ | 8,055 | | $ | (2,451 | ) | $ | 5,604 | |
| Revolving Credit Facility | | | | | | | | | | | | | | | | | | |
| (matures August 2012) | | 11,377 | | | (7,961 | ) | | 3,416 | | | 11,377 | | | (5,820 | ) | | 5,557 | |
| 5¼% Convertible Senior | | | | | | | | | | | | | | | | | | |
| Notes (due October 2011) | | 6,243 | | | (5,909 | ) | | 334 | | | 6,243 | | | (5,473 | ) | | 770 | |
| 4% Convertible Senior | | | | | | | | | | | | | | | | | | |
| Notes (due December 2017) | | 1,750 | | | (1 | ) | | 1,749 | | | - | | | - | | | - | |
| | $ | 27,425 | | $ | (17,473 | ) | $ | 9,952 | | $ | 25,675 | | $ | (13,744 | ) | $ | 11,931 | |
The components of other long-term liabilities follow (in thousands):
| | | December 31, | |
| | | 2010 | | 2009 | |
| Advances from third parties for future abandonment | | | | | | | |
| costs (Note 15) | | $ | 7,561 | | $ | 7,767 | |
| Employee postretirement medical liability (Note 11) | | | 3,916 | | | 4,346 | |
| Liability for management services (Note 14) | | | 2,839 | | | 2,734 | |
| Nonqualified pension plan liability | | | 1,845 | | | 1,395 | |
| Accrued workers compensation and group insurance | | | 435 | | | 360 | |
| | | $ | 16,596 | | $ | 16,602 | |
6. LONG-TERM DEBT
The components of McMoRan’s long-term debt follow (in thousands):
| | December 31, | |
| | 2010 | | 2009 | |
| 11.875% senior notes (due 2014) | $ | 300,000 | | $ | 300,000 | |
| 5¼% convertible senior notes (due 2011) | | 74,720 | | | 74,720 | |
| 4% convertible senior notes, net of $14,744 discount (due 2017) | | 185,256 | | | - | |
| Credit facility | | - | | | - | |
| Total debt | | 559,976 | | | 374,720 | |
| Less current maturities | | (74,720 | ) | | - | |
| Long-term debt | $ | 485,256 | | $ | 374,720 | |
McMoRan’s scheduled debt maturities are $74.7 million in 2011; none in the years 2012 or 2013; $300 million in 2014; none in 2015; and $200 million thereafter.
Variable Rate Senior Secured Revolving Credit Facility
McMoRan’s variable rate senior secured revolving credit facility (credit facility) matures in August 2012. The borrowing capacity was $150 million at December 31, 2010. A letter of credit in the amount of $100 million remains outstanding under the credit facility as surety support to a third party for a portion of
McMoRan’s reclamation obligations, reducing the remaining availability under the credit facility to $50 million.
Availability under the credit facility is subject to a borrowing base calculated from estimates of MOXY’s oil and natural gas reserves, which is subject to redetermination by its lenders semi-annually each April and October. The credit facility is secured by (1) substantially all the oil and gas properties of MOXY and its subsidiaries and (2) a pledge of McMoRan’s ownership interest in MOXY and MOXY’s ownership interest in each of its wholly owned subsidiaries.
Interest on the credit facility currently accrues at LIBOR plus 2.75 percent, subject to increases or decreases based on usage as a percentage of the borrowing base. Fees associated with the letters of credit and the unused commitment fee are also subject to increases or decreases in the same manner. There were no borrowings under the credit facility in 2010 or 2009. For 2008 the average interest rate on borrowings under the facility was 5.5 percent. Interest expense on the credit facility (including amortization of deferred financing costs and other facility fees) totaled $6.2 million in 2010, $5.7 million in 2009 and $11.9 million in 2008.
The credit facility contains covenants and other restrictions customary for oil and gas borrowing base credit facilities, including limitations on debt, liens, dividends, voluntary redemptions of debt, investments, asset sales and transactions with affiliates. In addition, the credit facility requires that McMoRan maintain certain financial tests, including a leverage test (Total Debt to EBITDAX, as those terms are defined in the credit facility, for the preceding four quarters) and a secured leverage test (First Lien Debt to EBITDAX, as those terms are defined in the credit facility, for the preceding four quarters), and a current ratio test (current assets to current liabilities, subject to certain adjustments as of the end of the quarter). McMoRan was in compliance with these covenants at December 31, 2010.
11.875% Senior Notes
On November 14, 2007, McMoRan completed the sale of $300 million of 11.875% senior notes (senior notes). Net proceeds from the sale of the senior notes of approximately $292 million were used, along with additional borrowings under the credit facility, to repay remaining amounts outstanding on the bridge loan after application of the net proceeds from the concurrent public offerings of shares of McMoRan’s common stock and 6¾% mandatory convertible preferred stock (Note 8). The senior notes are due on November 15, 2014 and are unconditionally guaranteed on a senior basis by MOXY and its subsidiaries (Note 18). McMoRan may redeem some or all of these notes at its option at make-whole prices prior to November 15, 2011, and thereafter at stated redemption prices. The indenture governing t he senior notes contains restrictions, including restrictions on incurring debt, creating liens, selling assets and entering into certain transactions with affiliates. The covenants also restrict McMoRan’s ability to pay certain cash dividends on common stock, repurchase or redeem common or preferred equity, prepay subordinated debt and make certain investments. Interest expense on the senior notes during 2010, 2009 and 2008 totaled $36.8 million, including amortization of related deferred financing costs of $1.2 million in each of those years. The fair value of the 11.875% senior notes, which is determined at the end of each reporting period using inputs based upon quoted prices for such instruments in active markets, was approximately $331.5 million at December 31, 2010 and $307.1 million at December 31, 2009.
4% Convertible Senior Notes
On December 30, 2010, McMoRan completed a private placement of $200 million of 4% convertible senior notes due December 30, 2017 concurrent with the 5.75% convertible preferred stock offerings (Note 8) and the PXP Acquisition (Note 2). The 4% senior notes are unsecured with semi-annual interest payments payable on February 15 and August 15 of each year. The 4% senior notes are convertible, at the option of the holder, at any time on or prior to maturity, into shares of McMoRan common stock at a conversion rate of 62.5 shares of McMoRan common stock, which is equal to an initial conversion price of $16.00 per share of McMoRan common stock per $1,000 principal amount of the notes. The conversion rate is subject to adjustment upon the occurrence of certain events. The 4% senior notes are redeemable for cash by McMoRan beginning December 30, 2015 under certain conditions.
The terms of the 4% senior notes were negotiated in September 2010, and the closing for these notes was contingent upon the approval by McMoRan’s shareholders of Freeport-McMoRan Copper & Gold Inc.’s investment in the 5.75% preferred stock offering (Note 8) and the PXP Acquisition. The Notes closed on December 30, 2010, the date of shareholder approval of the other concurrent
transactions. Because the value of McMoRan’s common stock on the closing date ($17.18 per share) exceeded the conversion price ($16 per share) for the convertible notes issued, the 4% senior notes included a beneficial conversion option. With respect to the 4% senior notes, the intrinsic value of the beneficial conversion option was recognized as a $14.8 million debt discount and a $14.8 million increase to McMoRan’s additional paid-in-capital, and the debt discount will be accreted through McMoRan’s earnings as adjustments to interest expense through the debt maturity date. McMoRan incurred approximately $1.8 million of debt issuance costs associated with the 4% senior notes. The fair value of the 4% senior notes was approximately $255 million at December 31, 2010.
5 ¼ Convertible Senior Notes
On October 6, 2004, McMoRan completed a private placement of $140 million of 5¼% convertible senior notes due October 6, 2011 (5¼% notes). Net proceeds from the 5¼% notes, after fees and expenses, totaled $134.4 million, of which $21.2 million was used to purchase U.S. government securities to be held in escrow to pay the first six semi-annual interest payments on the notes. The 5¼% notes are otherwise unsecured. Interest payments are payable on April 6 and October 6 of each year. Interest expense totaled $4.4 million for the years ended December 31, 2010 and 2009, respectively, and $5.0 million for the year ended December 31, 2008, including amortization of deferred financing costs of $0.4 million in 2010 and 2009 and $0.5 million in 2008. The 5¼% notes are c onvertible at the option of the holder at any time prior to maturity into shares of McMoRan’s common stock at a conversion price of $16.575 per share. Since October 6, 2009, McMoRan had the option of redeeming the 5¼% notes for a price equal to 100 percent of the principal amount of the notes plus any accrued and unpaid interest on the notes prior to the redemption date, provided the closing price of McMoRan’s common stock exceeded 130 percent of the conversion price for at least 20 trading days in any consecutive 30-day trading period.
During 2008, McMoRan privately negotiated transactions to induce the conversion of $40.2 million of the 5¼% notes into approximately 2.4 million shares of McMoRan’s common stock. McMoRan paid an aggregate $1.7 million in cash to induce these conversions, which is reflected as non-operating expense in the consolidated statements of operations.
The fair value of the 5¼% notes, which is determined using inputs based upon quoted prices for such instruments in active markets, was $89.3 million at December 31, 2010 and $70.3 million at December 31, 2009.
6% Convertible Senior Notes
On July 3, 2003, McMoRan issued $130 million of 6% convertible senior notes due July 2, 2008 (6% notes). Net proceeds from the 6% notes totaled approximately $123.0 million, interest expense totaled $1.7 million and amortization of the related deferred financing costs totaled $0.4 million in 2008. During 2008, McMoRan privately negotiated transactions to induce the conversion of $39.1 million of the 6% notes into approximately 2.75 million shares of McMoRan’s common stock. McMoRan paid an aggregate of $1.0 million in cash to induce these conversions, which is reflected as non-operating expense in the consolidated statements of operations. The remaining $61.7 million of the 6% notes were converted into approximately 4.3 million shares of McMoRan common stock in accordance with the terms of the 6% notes at or prior to the notes’ stated maturity of July 2, 2008.
7. DERIVATIVE CONTRACTS
In connection with the closing of the 2007 oil and gas property acquisition and related financing, MOXY entered into derivative contracts for a portion of the anticipated production from its proved developed producing oil and gas properties at the time of the acquisition for the years 2008 through 2010.
Because these oil and gas derivative contracts were not designated as hedges for accounting purposes, unrealized (gains) losses representing changes in the related fair values along with realized (gains) losses representing cash settlements were recognized immediately in McMoRan’s operating results at each reporting period. McMoRan’s realized and unrealized (gains) losses on these contracts were as follows (in thousands):
| | | Years Ended December 31, | |
| | | 2010 | | 2009 | | 2008 | |
| Realized (gain) loss | | | | | | | | | | |
| Gas puts | | $ | (1,453 | ) | $ | (6,700 | ) | $ | 2,209 | |
| Oil puts | | | 121 | | | 238 | | | 356 | |
| Gas swaps | | | (10,754 | ) | | (33,818 | ) | | 4,005 | |
| Oil swaps | | | 1,046 | | | (5,745 | ) | | 17,739 | |
| Total realized (gain) loss | | | (11,040 | ) | | (46,025 | ) | | 24,309 | |
| | | | | | | | | | | |
| Unrealized (gain) loss | | | | | | | | | | |
| Gas puts | | | 578 | | | 1,167 | | | (3,178 | ) |
| Oil puts | | | (76 | ) | | 929 | | | (1,483 | ) |
| Gas swaps | | | 7,536 | | | 18,002 | | | (7,872 | ) |
| Oil swaps | | | (1,238 | ) | | 8,533 | | | (28,079 | ) |
| Total unrealized (gain) loss | | | 6,800 | | | 28,631 | | | (40,612 | ) |
| Net gain on oil and gas derivative contracts | | $ | (4,240 | ) | $ | (17,394 | ) | $ | (16,303 | ) |
The original cost of the put options was $4.6 million. There was no cost for entering into the swap contracts. The derivative contracts are reported at fair value on McMoRan’s balance sheets. The fair value of McMoRan’s swaps and puts is based on transaction counterparty acknowledgments and corroborated based on quoted market prices and internal valuation model analyses. McMoRan has classified the fair value measurement of its derivative instruments as being derived from Level 2 inputs, as defined under U.S. generally accepted accounting principles. The following table provides fair value measurement information as of December 31, 2009 (in thousands):
| | December 31, 2009 | |
| | Puts | | Swaps | | | | |
| | Gas | | Oil | | Gas | | Oil | | Total | |
| Current assets | $ | 1,113 | | $ | 45 | | $ | 7,535 | | $ | - | | $ | 8,693 | |
| Current liabilities | | - | | | - | | | - | | | (1,237 | ) | | (1,237 | ) |
| Fair value of contracts | $ | 1,113 | | $ | 45 | | $ | 7,535 | | $ | (1,237 | ) | $ | 7,456 | |
McMoRan had no remaining oil and gas derivative contracts outstanding as of December 31, 2010.
8. COMMON STOCK AND PREFERRED STOCK OFFERINGS
On December 30, 2010, McMoRan completed the private placement of $700 million of 5.75% convertible perpetual preferred stock (5.75% Preferred Stock) concurrent with the 4% senior note offering (Note 6) and the PXP Acquisition (Note 2). Freeport-McMoRan Copper & Gold Inc., an affiliate of McMoRan (Note 14), purchased $500 million of the 5.75% Preferred Stock, and $200 million of the 5.75% Preferred Stock was purchased by institutional investors.
The 5.75% preferred stock is recorded at the liquidation preference value ($1,000 per share). Cumulative annual dividends accrue at 5.75% of the liquidation preference, payable quarterly on February 15, May 15, August 15 and November 15 of each year, commencing on February 15, 2011. The 5.75% preferred stock is convertible, at the option of the holder, at any time into shares of McMoRan common stock at a conversion rate of 62.5 shares of McMoRan common stock per $1,000 liquidation preference of the 5.75% preferred stock, which is equal to an initial conversion price of $16.00 per share. On or after three years following the date of issuance, McMoRan may redeem some or all of the 5.75% preferred stock under certain conditions.
The terms of the 5.75% preferred stock were negotiated in September 2010 and closing for the transaction was subject to McMoRan shareholder approval. The transaction closed on December 30, 2010, the date of shareholder approval. Because the value of McMoRan’s common stock on the closing date ($17.18 per share) exceeded the conversion price ($16 per share) for the convertible instruments issued, the 5.75% preferred stock included a beneficial conversion option. The intrinsic value of the beneficial conversion option associated with the 5.75% preferred stock was recognized by McMoRan at the date of closing as a preferred stock discount and related preferred stock dividend resulting in a $51.6 million increase to additional paid-in-capital and a $51.6 mil lion reduction to income applicable to common
shareholders. McMoRan incurred approximately $5.8 million of offering costs associated with the 5.75% preferred stock.
In June 2009, McMoRan completed concurrent public offerings of 15.5 million shares of common stock at $5.75 per share and 86,250 shares of 8% convertible perpetual preferred stock (8% preferred stock) with an offering price of $1,000 per share. The net proceeds from these offerings, after deducting underwriters’ discounts and other expenses, were approximately $168.3 million.
The 8% preferred stock is recorded at the liquidation preference value ($1,000 per share), and dividends are paid quarterly. The 8% preferred stock is convertible in the aggregate into 12.6 million shares of McMoRan common stock (equivalent to a conversion price of $6.8425 per share), subject to certain anti-dilution adjustments. Beginning June 15, 2014, McMoRan has the right to redeem shares of the 8% preferred stock by paying cash, McMoRan common stock or any combination thereof for $1,000 per share plus accumulated and unpaid dividends, but only if the trading price of McMoRan’s common stock has exceeded 130% of the initial conversion price for at least 20 trading days within a period of 30 consecutive trading days ending on the trading day before the date McM oRan gives the redemption notice.
In 2010, McMoRan privately negotiated the induced conversion of approximately 64,200 shares of its 8% preferred stock with a liquidation preference of $64.2 million into approximately 9.4 million shares of McMoRan common stock (at a conversion rate equal to 146.1454 shares of common stock per share of 8% preferred stock). To induce the early conversions of the 8% preferred stock, McMoRan paid an aggregate of $12.2 million in cash and recorded such payments as preferred dividends.
In February 2011, McMoRan privately negotiated the induced conversion of approximately 8,100 shares of its 8% preferred stock with a liquidation preference of $8.1 million into approximately 1.2 million shares of McMoRan common stock (at a conversion rate equal to 146.1454 shares of common stock per share of 8% preferred stock). To induce the early conversion of these shares of 8% preferred stock, McMoRan paid an aggregate of $1.5 million in cash to the holder of these shares, which amount will be included as a charge in its first quarter consolidated statements of operations within preferred dividends, amortization of convertible preferred stock issuance costs and inducement payments for early conversion of preferred stock. Following this transaction, approximately 14,000 shares of McMoRan 8% preferred stock remain outstanding.
On November 7, 2007, McMoRan completed a public offering of 16.89 million shares of common stock at $12.40 per share and a concurrent public offering of 2.59 million shares of 6¾% mandatory convertible preferred stock (6¾% preferred stock) with an offering price of $100 per share. The 6¾% preferred stock automatically converted on November 15, 2010 into 10.7 million shares of McMoRan common stock.
In 2008, McMoRan agreed in a privately negotiated transaction to induce conversion of approximately 990,000 shares of its 6¾% preferred stock, with a liquidation preference of approximately $99 million, into approximately 6.7 million shares of McMoRan common stock (based on the minimum conversion rate of 6.7204 shares of common stock for each share of 6¾% preferred stock). McMoRan paid an aggregate $7.4 million in cash to induce the conversion of the 6¾% preferred stock, and recorded such payments as preferred dividends.
9. EARNINGS PER SHARE
McMoRan had a net loss from continuing operations for each of the three years in the period ending December 31, 2010. Accordingly, McMoRan’s diluted per share calculation for these periods was equivalent to its basic net loss per share calculation because it excluded the assumed exercise of stock options and stock warrants whose exercise prices were less than the average market price of McMoRan’s common stock during these periods, as well as the assumed conversion of McMoRan’s 5.75% preferred stock, 8% preferred stock, 6¾% preferred stock, 6% notes, 4% senior notes and 5¼% notes. These instruments were excluded for these periods because they were considered to be anti-dilutive, meaning their inclusion would have reduced the reported net loss per share for these periods. The excluded common share amounts are summarized below (in thousands):
| | | Years Ended December 31, | |
| | | 2010 | | 2009 | | 2008 | |
| | | | | | | | | | | |
In-the-money stock options a, b | | | 2,938 | | | - | | | 1,631 | |
Shares issuable upon exercise of stock warrants a, c | | | - | | | - | | | 257 | |
| Shares issuable upon assumed conversion of: | | | | | | | | | | |
8% preferred stock d | | | 2,875 | | | 6,631 | | | - | |
6¾% preferred stock e | | | 1,317 | | | 12,817 | | | 17,705 | |
5.75% preferred stock f | | | 120 | | | - | | | - | |
5¼% notes g | | | 4,508 | | | 4,508 | | | 5,508 | |
4% senior notes h | | | 34 | | | - | | | - | |
6% notes i | | | - | | | - | | | 2,635 | |
| a. | McMoRan uses the treasury stock method to determine the amount of in-the-money stock options and stock warrants to include in its diluted earnings per share calculation. |
| b. | Represents stock options with an exercise price less than the average market price for McMoRan’s common stock for the periods presented. |
| c. | Includes stock warrants issued pursuant to a prior business transaction in December 2002 (1.74 million shares) and September 2003 (0.76 million shares). On December 12, 2007, the stock warrant for 1.74 million common shares was exercised. The remaining warrant was exercised in June 2008 for 0.76 million common shares in a cashless transaction and received 0.64 million common shares. |
| d. | Amount represents total equivalent common stock shares assuming conversion of 8% preferred stock (Note 8). The 2009 amount is reduced from the total 12.6 million equivalent shares that would have been issued upon conversion to reflect the number of days the preferred stock was outstanding in 2009. Preferred dividends and inducement payments totaled $14.9 million in 2010 and $3.6 million in 2009. |
| e. | Amount represents total equivalent common stock shares assuming conversion of 6¾% preferred stock (Note 8). Preferred dividends, amortization of convertible preferred stock issuance costs and inducement payments for the early conversion of preferred stock totaled $9.4 million in 2010, $10.7 million in 2009 and $22.3 million in 2008. |
| f. | Amount represents total equivalent common stock shares assuming conversion of 5.75% preferred stock (Note 8). The 2010 amount is reduced from the total 43.8 million equivalent shares that would have been issued upon conversion to reflect the weighted average impact of the number of days the preferred stock was outstanding in 2010. Preferred dividends and other charges totaled $51.8 million in 2010. |
| g. | Amount represents total equivalent common stock shares assuming conversion of 5¼% notes (Note 6). Net interest expense on the 5¼% notes totaled $4.4 million in 2010, $4.0 million in 2009 and $4.4 million in 2008. |
| h. | Amount represents total equivalent common stock shares assuming conversion of 4% senior notes (Note 6). The 2010 amount is reduced from the total 12.5 million equivalent shares that would have been issued upon conversion to reflect the weighted average impact of the number of days the debt was outstanding in 2010. |
| i. | Amount represents total equivalent common stock shares assuming conversion of 6% notes (Note 6). Related net interest expense totaled $1.5 million in 2008. |
Outstanding stock options excluded from the computation of diluted net income (loss) per share of common stock because their exercise prices were greater than the average market price of McMoRan’s common stock during the periods presented are as follows:
| | | Years Ended December 31, | |
| | | 2010 | | | 2009 | | | 2008 | |
| Outstanding options (in thousands) | | | 7,696 | | | | 8,271 | | | | 232 | |
| Average exercise price | | $ | 16.53 | | | $ | 15.21 | | | $ | 23.83 | |
10. DISCONTINUED OPERATIONS
In November 1998, McMoRan acquired Freeport Energy, a business engaged in the purchasing, transporting, terminaling, processing, and marketing of recovered sulphur and the production of oil reserves at Main Pass. Prior to August 31, 2000, Freeport Energy was also engaged in the mining of sulphur. In June 2002, Freeport Energy sold substantially all of its remaining sulphur assets. As discussed in Note 1, all of McMoRan’s sulphur operations and major classes of assets and liabilities are classified as discontinued operations in the accompanying consolidated financial statements. All of McMoRan’s sulphur results are included in the accompanying consolidated statements of operations within the caption “Income (loss) from discontinued operations.”
The table below provides a summary of the discontinued results of operations (in thousands):
| | | Years Ended December 31, | |
| | | 2010 | | 2009 | | 2008 | |
| Accretion and other – sulphur reclamation | | | | | | | | | | |
| and contingency obligations | | $ | 1,415 | | $ | 1,863 | | $ | 3,295 | |
| Caretaking costs- Port Sulphur | | | 2,923 | | | 2,119 | | | 979 | |
Environmental remediation activities a | | | 36 | | | 2,027 | | | - | |
Sulphur retiree costs (credits)b | | | (1,330 | ) | | (444 | ) | | 494 | |
| General and administrative and legal | | | 382 | | | 324 | | | 236 | |
| Insurance | | | 213 | | | 177 | | | 432 | |
| Other | | | (273 | ) | | 31 | | | 60 | |
| Loss from discontinued operations | | $ | 3,366 | | $ | 6,097 | | $ | 5,496 | |
| a. | Primarily relates to certain environmental remediation activities at the Port Sulphur, Louisiana and Galveston, Texas facilities. |
| b. | Reflects changes in the postretirement benefit cost obligation associated with certain retired former sulphur employees (Note 15). |
Exit From Sulphur Business
In connection with the June 2002 sale of assets, McMoRan also agreed to be responsible for certain related historical environmental obligations and also agreed to indemnify the purchaser from certain potential liabilities with respect to the historical sulphur operations engaged in by Freeport Sulphur and its predecessor and successor companies, including reclamation obligations. In addition, McMoRan assumed, and agreed to indemnify the purchaser from certain potential obligations, including environmental obligations, other than liabilities existing and identified as of the closing of the sale associated with historical oil and gas operations undertaken by the Freeport-McMoRan companies prior to the 1997 merger of Freeport-McMoRan Inc. and IMC Global Inc. Cumulative legal fees and related settlement amounts incurred with respect to this indemnification total approximately $1.3 million (since 2002) (Note 15).
Sulphur Reclamation Obligations
McMoRan is currently meeting its financial obligations relating to the future abandonment of its former Main Pass sulphur facilities with the BOEMRE using financial assurances from MOXY. McMoRan and its subsidiaries’ ongoing compliance with applicable BOEMRE requirements will be subject to meeting certain financial and other criteria.
11. EMPLOYEE BENEFITS
Stock-Based Awards. At December 31, 2010, McMoRan had five shareholder-approved stock incentive plans. Under each plan McMoRan is authorized to issue a fixed amount of stock-based awards, which include stock options, stock appreciation rights, restricted stock, restricted stock units (RSUs) and other stock-based awards that are issuable in or valued by McMoRan common shares. Below is a summary of McMoRan’s stock incentive plans.
| Plan | | Authorized amount of stock-based awards | | Shares available for grant at December 31, 2010 |
| 2008 Stock Incentive Plan (2008 Plan) | | 11,500,000 | | 6,497,250 |
| 2005 Stock Incentive Plan (2005 Plan) | | 3,500,000 | | 250 |
| 2004 Director Compensation Plan (2004 Directors Plan) | | 175,000 | | 193 |
| 2003 Stock Incentive Plan (2003 Plan) | | 2,000,000 | | 250 |
| 2001 Stock Incentive Plan (2001 Plan) | | 1,250,000 | | 250 |
Restricted Stock Units. Under McMoRan’s incentive plans, its Board of Directors granted 48,500 RSUs in 2010, 20,000 RSUs in 2009 and 20,000 RSUs in 2008. The RSUs are converted ratably into an equivalent number of shares of McMoRan common stock on the first three anniversaries of the grant date, except for RSUs granted to the non-management directors, which vest incrementally over the first four anniversaries of the grant date. RSUs converted into common stock totaled 18,596 shares in 2010, 13,861 shares in 2009 and 8,232 shares in 2008. Upon issuance of the RSUs, unearned compensation equivalent to the market value at the date of grant is recorded as deferred compensation in stockholders’ equity and is charged to expense over the three or four-ye ar vesting period of each respective grant. McMoRan charged approximately $0.4 million of this deferred compensation to expense in 2010, $0.3 million in 2009 and $0.2 million in 2008.
Stock Options. McMoRan’s Board of Directors grants stock options under its stock incentive plans. Except for certain awards described below, the stock options become exercisable in 25 percent annual increments beginning one year from the date of grant and expire ten years after the date of grant. A summary of stock options outstanding follows:
| | | 2010 | | 2009 | | 2008 |
| | | Number of | | Average | | Number of | | Average | | Number of | | Average |
| | | Options | | Option Price | | Options | | Option Price | | Options | | Option Price |
| Beginning of year | | 10,446,250 | | $13.37 | | | 9,116,750 | | $14.91 | | | 7,754,100 | | $14.96 | |
| Granted | | 1,821,500 | | 15.57 | | | 1,855,500 | | 6.46 | | | 1,759,500 | | 15.25 | |
| Exercised | | (154,500 | ) | 13.75 | | | - | | - | | | (318,475 | ) | 17.90 | |
| Expired/forfeited | | (245,500 | ) | 14.00 | | | (526,000 | ) | 15.83 | | | (78,375 | ) | 15.29 | |
| End of year | | 11,867,750 | | 13.69 | | | 10,446,250 | | 13.37 | | | 9,116,750 | | 14.91 | |
| Exercisable at end | | | | | | | | | | | | | | | |
| of year | | 8,920,187 | | | | | 7,549,500 | | | | | 6,565,437 | | | |
The total intrinsic value of options exercised during the years ended December 31, 2010 and 2008 was $2.1 million and $4.0 million, respectively. The weighted average fair value per share of shares vested during the years ended December 31, 2010, 2009 and 2008 was $11.42, $11.19 and $15.50, respectively. The total intrinsic value of all McMoRan options outstanding at December 31, 2010 was $35.2 million with a weighted average life of 5.5 years. The total intrinsic value of exercisable options totaled $26.2 million at December 31, 2010. The exercisable options had a weighted average life of 4.7 years and a weighted average exercise price of $14.09.
The Co-Chairmen of McMoRan’s Board of Directors agreed to forgo all cash compensation during each of the three years ended December 31, 2010. In lieu of cash compensation, McMoRan has granted the Co-Chairmen stock options that are immediately exercisable upon grant and have a term of ten years. These grants to the Co-Chairmen totaled 400,000 options at an exercise price of $15.73 per share in February 2010, 400,000 options at an exercise price of $6.44 per share in February 2009 and 400,000 options at an exercise price of $15.04 per share in January 2008. The Co-Chairmen also received additional grants totaling 350,000 stock options in February 2010, February 2009 and January 2008, all of which vest ratably over a four-year period.
Compensation cost charged against earnings for stock-based awards is shown below (in thousands).
| | Years Ended December 31, | |
| | 2010 | | 2009 | | 2008 | |
| Cost of options awarded to employees (including directors) | $ | 17,435 | a | $ | 13,152 | a | $ | 28,725 | a |
| Cost of options awarded to non-employees | | 870 | | | 696 | | | 1,251 | |
| Cost of restricted stock units | | 402 | | | 345 | | | 247 | |
| Total stock-based compensation cost | $ | 18,707 | | $ | 14,193 | | $ | 30,223 | |
| a. | Includes $4.7 million, $1.8 million and $11.3 million of compensation charges associated with immediately vested stock options granted to certain executive officers including McMoRan’s Co-Chairmen during 2010, 2009 and 2008, respectively. Also includes $2.0 million, $1.1 million and $4.9 million of compensation charges related to stock options granted to retirement-eligible employees, which resulted in one-year’s compensation expense being immediately recognized at the date of the stock option grant during 2010, 2009 and 2008, respectively. |
A summary of the classification of stock-based compensation by financial statement line item for the three years in the period ended December 31, 2010 is as follows (in thousands):
| | 2010 | | 2009 | | 2008 | |
| General and administrative expenses | $ | 9,750 | | $ | 7,162 | | $ | 14,818 | |
| Exploration expenses | | 8,639 | | | 6,633 | | | 14,376 | |
| Main Pass Energy Hub costs | | 318 | | | 398 | | | 1,029 | |
| Total stock-based compensation cost | $ | 18,707 | | $ | 14,193 | | $ | 30,223 | |
As of December 31, 2010, total compensation cost related to nonvested, approved stock option awards not yet recognized in earnings was approximately $14.9 million, which is expected to be recognized over a weighted average period of one year. The fair value of option awards is estimated on the date of grant using a Black-Scholes option valuation model. Expected volatility is based on implied volatilities from the historical volatility of McMoRan’s stock, and to a lesser extent, on traded options on McMoRan’s common stock. McMoRan uses historical data to estimate option exercise, forfeitures and expected life of the options. The risk-free interest rate is based on Federal Reserve rates in effect for bonds with maturity dates equal to the expected term of the option at the date of gra nt. McMoRan has not paid, and is currently not permitted to pay, cash dividends on its common stock. The weighted average fair value of stock options granted and assumptions used to value stock option awards during the years ended December 31, 2010, 2009 and 2008 are noted in the following table:
| | 2010 | | 2009 | | 2008 | |
Weighted average fair value of stock options granted a | $ | 10.04 | | $ | 3.97 | | $ | 24.27 | |
| Expected and weighted average volatility | | 66.79 | % | | 64.88 | % | | 52.3 | % |
Expected life of options (in years) a | | 6.62 | | | 6.43 | | | 6.41 | |
| Risk-free interest rate | | 3.02 | % | | 1.87 | % | | 3.04 | % |
| a. | Excludes stock options that were granted with immediate vesting (445,000 shares, including 400,000 shares granted to the Co-Chairmen in lieu of cash compensation for 2010, 2009 and 2008). The expected life and fair value of stock options on the respective grant dates during the years ended December 31, 2010, 2009 and 2008 for such option awards are as follows: |
| | 2010 | | 2009 | | 2008 | |
| Expected life (in years) | | 7.22 | | | 6.77 | | | 6.86 | |
| Fair value of stock option on date of grant | $ | 10.60 | | $ | 4.04 | | $ | 25.41 | |
On February 7, 2011, McMoRan’s Board of Directors granted a total of 1,737,500 stock options to its employees at an exercise price of $17.25 per share, including immediately exercisable options for an aggregate of 445,000 shares, including 400,000 shares, to its Co-Chairmen in lieu of cash compensation in 2011. The remaining options granted vest ratably over a four-year period.
Pension Plans and Other Benefits. McMoRan’s previous defined benefit pension plan termination was approved by the Internal Revenue Service effective April 14, 2008, and plan assets were liquidated and distributed to participants in 2008.
McMoRan also provides certain health care and life insurance benefits (Other Benefits) to retired employees. McMoRan has the right to modify or terminate these benefits. For the year ended December 31, 2010, the health care trend rate used for Other Benefits was 7.9 percent in 2010, decreasing ratably annually until reaching 4.5 percent in 2027. For the year ended December 31, 2009, the health care trend rate used for Other Benefits was 8.1 percent in 2009, decreasing ratably annually until reaching 4.5 percent in 2027. A one-percentage-point increase or decrease in assumed health care cost trend rates would not have a significant impact on service or interest costs. Information on the McMoRan Other Benefits plan follows (in thousands):
| | Years Ended December 31, | |
| | 2010 | | 2009 | |
| Change in benefit obligation: | | | | | | |
| Benefit obligation at the beginning of year | $ | (4,851 | ) | $ | (4,873 | ) |
| Service cost | | (49 | ) | | (52 | ) |
| Interest cost | | (214 | ) | | (272 | ) |
| Actuarial gains (losses) | | 289 | | | (284 | ) |
| Participant contributions | | (197 | ) | | (186 | ) |
| Benefits paid | | 573 | | | 816 | |
| Benefit obligation at end of year | | (4,449 | ) | | (4,851 | ) |
| | | | | | | |
| Change in plan assets: | | | | | | |
| Fair value of plan assets at beginning of year | | - | | | - | |
| Return on plan assets | | - | | | - | |
| Employer/participant contributions | | 573 | | | 816 | |
| Benefits paid | | (573 | ) | | (816 | ) |
| Fair value of plan assets at end of year | | - | | | - | |
| | | | | | | |
| Funded status | $ | (4,449 | ) | $ | (4,851 | ) |
| | | | | | | |
| Weighted-average assumptions : | | | | | | |
| Discount rate | | 5.2 | % | | 5.2 | % |
| Expected return on plan assets | | - | | | - | |
| Rate of compensation increase | | - | | | - | |
Expected benefit payments for McMoRan’s other benefits plan approximate $0.5 million in each of the three years ending December 31, 2013, $0.4 million in the years ending December 31, 2014 and 2015 and a total of $1.4 million during the five years thereafter. The components of net periodic benefit cost for McMoRan’s plans follow (in thousands):
| | | Pension Benefits | | Other Benefits | |
| | | 2010 | | 2009 | | 2008 | | 2010 | | 2009 | | 2008 | |
| Service cost | | $ | - | | $ | - | | $ | - | | $ | 49 | | $ | 52 | | $ | 48 | |
| Interest cost | | | - | | | - | | | 62 | | | 214 | | | 271 | | | 285 | |
| Return on plan assets | | | - | | | - | | | (21 | ) | | - | | | - | | | - | |
| Amortization of prior service costs | | | - | | | - | | | - | | | (40 | ) | | (40 | ) | | (40 | ) |
| Net periodic benefit cost | | $ | - | | $ | - | | $ | 41 | | $ | 223 | | $ | 283 | | $ | 293 | |
Included in accumulated other comprehensive loss at December 31, 2010 (Note 13), are prior service credits of $0.2 million and actuarial losses of $0.3 million that have not been recognized in net periodic benefit costs associated with McMoRan’s Other Benefits. The total amount expected to be recognized into net periodic costs in 2011 associated with these prior service credits and actuarial gains and losses is immaterial.
McMoRan has an employee savings plan under Section 401(k) of the Internal Revenue Code. The plan allows eligible employees to contribute up to 75 percent of their pre-tax compensation, subject to certain limits prescribed by the Internal Revenue Code. McMoRan matches 100 percent of each employees’ contribution up to a maximum of 5 percent of each employees’ annual basic compensation amount. In this plan, participants exercise control and direct the investment of their contributions and account balances among various investment options. In connection with the termination of its defined benefits plan, McMoRan enhanced the savings plan for substantially all its employees. Pursuant to the enhancements, McMoRan contributes amounts to individual employee accounts totaling eithe r 4 percent or 10 percent of each employee’s pay, depending on a combination of each employee’s age and years of service with McMoRan. Participants who were actively employed on January 1, 2009 became fully vested in the matching contributions. Plan participants vest in McMoRan’s enhanced contributions upon completing three years of service with McMoRan. For employees whose eligible compensation exceeds certain levels, McMoRan provides an unfunded defined contribution plan. The balance of this liability totaled $1.5 million on December 31, 2010 and $1.4 million on December 31, 2009.
McMoRan’s results of operations reflect charges to expense totaling $1.1 million in 2010, 2009 and 2008 for its aggregate matching contributions for the Section 401(k) savings plan and the defined contribution plan. Additionally, McMoRan has other employee benefit plans, certain of which are related to McMoRan’s performance, which costs are recognized currently in general and administrative expense.
McMoRan also has a contractual obligation to reimburse a third party for a portion of their postretirement benefit costs relating to certain former retired sulphur employees (Note 15).
12. INCOME TAXES
McMoRan has a net deferred tax asset of $452.9 million as of December 31, 2010, resulting from net operating loss carryforwards and other temporary differences related to McMoRan’s activities. McMoRan has provided a valuation allowance, including approximately $36.6 million associated with McMoRan’s discontinued sulphur operations, for the full amount of these net deferred tax assets. McMoRan’s effective tax rate would be impacted in future periods to the extent these deferred tax assets are recognized. McMoRan will continue to assess whether or not its deferred tax assets can be recognized based on operating results in future periods. McMoRan has no material uncertain tax positions as of December 31, 2010.
As of December 31, 2010 and 2009, McMoRan had federal tax net operating loss carryforwards (NOL’s) of approximately $599.8 million and $485.1 million, respectively, and state tax NOL’s of approximately $264.5 million and $243.4 million, respectively. These NOL’s are scheduled to expire in varying amounts between tax years 2013 through 2030. The 2009 federal tax benefit of $2.4 million is primarily related to an alternative minimum tax (AMT) refund associated with the carryback of the 2009 AMT NOL against previously paid AMT as a result of recently enacted tax legislation.
Federal tax regulations impose certain annual limitations on the utilization of NOL’s from prior periods when a defined level of change in the stock ownership of certain shareholders is exceeded. If a corporation has a statutorily defined change of ownership, its ability to use its existing NOL’s could be limited by Section 382 of the Internal Revenue Code depending upon the level of future taxable income generated in a given year and other factors. McMoRan has determined that such a change of ownership has occurred during 2010, which, depending upon the amounts and timing of future taxable income generated, may limit McMoRan’s ability to use its existing NOL’s to fully offset taxable income in future periods. Interest or penalties associated with income taxes are recorded as components of the provision for income taxes, although no such amounts have been recognized in the accompanying financial statements. Currently, McMoRan’s major taxing jurisdictions are the United States (federal) and Louisiana. Tax periods open to audit for McMoRan primarily include federal and Louisiana income tax returns subsequent to 2006. NOL amounts prior to this time are also subject to audit.
The components of McMoRan’s deferred tax assets (liabilities) at December 31, 2010 and 2009 follow (in thousands):
| | | December 31, | |
| | | 2010 | | 2009 | |
| Federal and state net operating loss carryforwards | | $ | 222,308 | | $ | 181,120 | |
| Property, plant and equipment | | | 55,839 | | | 42,000 | |
| Reclamation and shutdown reserves | | | 134,362 | | | 156,752 | |
| Deferred compensation, postretirement and pension benefits and | | | | | | | |
| accrued liabilities | | | 35,437 | | | 30,158 | |
| Tax credits and other, net | | | 4,976 | | | 4,954 | |
| Less: valuation allowance | | | (452,922 | ) | | (414,984 | ) |
| Net deferred tax asset | | $ | - | | $ | - | |
Reconciliations of the differences between income taxes computed at the federal statutory tax rate and the income taxes recorded follow (in thousands):
| | Years Ended December 31, | |
| | 2010 | | 2009 | | 2008 | |
| Income tax benefit computed at the federal | | | | | | | | | |
| statutory income tax rate | $ | 42,119 | | $ | 74,701 | | $ | 74,965 | |
| Change in valuation allowance | | (43,098 | ) | | (71,922 | ) | | (78,508 | ) |
| Other | | 979 | | | (334 | ) | | 1,100 | |
| Federal income tax benefit (provision) | | - | | | 2,445 | | | (2,443 | ) |
| State income tax benefit (provision) | | - | | | - | | | (65 | ) |
| Total income tax benefit (provision) | $ | - | | $ | 2,445 | | $ | (2,508 | ) |
13. COMPREHENSIVE LOSS
The components of McMoRan’s comprehensive loss for 2010, 2009 and 2008 follows (in thousands):
| | Years Ended December 31, | |
| | 2010 | | 2009 | | 2008 | |
| Net loss | $ | (120,342 | ) | $ | (210,986 | ) | $ | (216,694 | ) |
| Other comprehensive loss | | | | | | | | | |
| Amortization of previously unrecognized pension | | | | | | | | | |
| components, net | | (40 | ) | | (40 | ) | | (40 | ) |
| Change in unrecognized net gains/losses of pension plans | | 289 | | | (284 | ) | | 671 | |
| Comprehensive loss | $ | (120,093 | ) | $ | (211,310 | ) | $ | (216,063 | ) |
14. TRANSACTIONS WITH AFFILIATES
FM Services Company, a wholly owned subsidiary of Freeport-McMoRan Copper & Gold Inc. (FCX) and a company with which McMoRan shares certain common executive management, provides McMoRan with certain administrative, financial and other services on a contractual basis. These service costs, which include related overhead amounts, including rent for the New Orleans corporate headquarters, totaled $7.7 million in 2010, $8.4 million in 2009 and $7.5 million in 2008. Management believes these costs do not differ materially from the costs that would have been incurred had the relevant personnel providing the services been employed directly by McMoRan. At December 31, 2010 and 2009, respectively, McMoRan had an obligation to fund $2.8 million and $2.7 million of FM Services costs, primarily reflecting long-term employee pension and postretirement medical obligations (Notes 5 and 11).
On December 30, 2010, FCX purchased 500,000 shares of McMoRan’s 5.75% preferred stock (Note 8).
15. COMMITMENTS AND CONTINGENCIES
Commitments. McMoRan has $385.1 million of estimated commitments related to its planned oil and gas exploration and development activities, including costs related to projects currently in progress,
inventory purchase commitments and other exploration expenditures. Included in this amount is $176.7 million of expenditures for drilling rig contract charges anticipated to be expended over approximately the next two years which McMoRan expects to share with its partners in its exploration program.
Long-Term Contracts and Operating Leases. McMoRan’s primary operating leases involve renting office space in two buildings in Houston, Texas, which expire in April 2014 and July 2014, and office space in Lafayette, Louisiana, which expires in November 2012. At December 31, 2010, McMoRan’s total minimum annual contractual charges aggregated $8.3 million, with payments totaling $2.4 million in 2011 and 2012, $2.3 million in 2013 and $1.2 million in 2014. Rent expense, including rent allocated to McMoRan by FM Services (Note 14), totaled $3.0 million in 2010, $3.2 million in 2009 and $2.8 million in 2008.
Other Liabilities. Freeport Energy has a contractual obligation to reimburse a third party a portion of its postretirement benefit costs relating to certain retired former sulphur employees of Freeport Energy. This contractual obligation totaled $3.0 million at December 31, 2010 and $5.1 million at December 31, 2009, including $0.2 million and $0.5 million in current liabilities from discontinued operations, respectively. A third-party actuarial consultant assesses the estimated related future costs associated with this contractual liability on an annual basis using current health care trend costs and incorporating changes made to the underlying benefit plans of the third party. The assessment at year end 2010 used an initial health care co st trend rate of 7.9 percent in 2011 decreasing ratably to 4.5 percent in 2027. During 2009, the assessment used an initial health care cost trend rate of 7.9 percent in 2010 decreasing ratably to 4.5 percent in 2027. McMoRan applied a discount rate of 8.5 percent at December 31, 2010 and 2009 to the consultant’s future cost estimates. McMoRan reduced the liability by $2.2 million and $1.1 million at December 31, 2010 and 2009, respectively, primarily reflecting decreases in future health claim costs resulting from lower than expected actual health claim reimbursements offset by higher health trend costs. Future changes to this estimate resulting from changes in assumptions or actual results varying from projected results will be recorded in earnings.
Environmental and Reclamation. McMoRan has made, and will continue to make, expenditures for the protection of the environment. McMoRan is subject to contingencies as a result of environmental laws and regulations. Present and future environmental laws and regulations applicable to McMoRan’s operations could require substantial capital expenditures or could adversely affect its operations in other ways that cannot be predicted at this time. Cumulative legal fees and related settlement amounts incurred with respect to historical oil and gas liabilities McMoRan assumed from IMC Global total approximately $1.3 million (since 2002). No additional amounts have been recorded because no specific liability has been identified that is reasonably probabl e of requiring McMoRan to fund any future material amounts.
McMoRan updates its reclamation and well abandonment estimates whenever warranted by events, but at a minimum at least annually. Revisions made for certain properties depending upon the respective circumstances include consideration of the following: (1) the inclusion of estimates for new properties; (2) changes in the projected timing of certain reclamation costs because of changes in the estimated timing of the depletion of the related proved reserves for our oil and gas properties and new estimates for the timing of the reclamation for the structures comprising the MPEHtm project and Port Sulphur facilities; (3) changes in the reclamation costs based on revised estimat es of future reclamation work to be performed; and (4) when applicable, changes in McMoRan’s credit-adjusted, risk-free interest rate. McMoRan’s credit adjusted, risk-free interest rates ranged from 4.6 percent to 9.9 percent at December 31, 2010, 6.9 percent to 13.1 percent at December 31, 2009 and 8.5 percent to 13.1 percent at December 31, 2008. At December 31, 2010, McMoRan’s estimated undiscounted reclamation obligations, including inflation and market risk premiums, totaled $507.7 million, including $39.8 million associated with its remaining sulphur obligations. A rollforward of McMoRan’s consolidated discounted asset retirement obligations (including both current and long term obligations) follows (in thousands):
| | Years Ended December 31, | |
| | 2010 | | 2009 | | 2008 | |
| Oil and Natural Gas | | | | | | | | | |
| Asset retirement obligation at beginning of year | $ | 428,711 | | $ | 421,201 | | $ | 294,737 | |
| Liabilities settled | | (124,142 | ) | | (42,212 | ) | | (43,782) | |
Scheduled accretion expense a | | 17,095 | | | 30,910 | | | 32,933 | |
| Reclamation costs assumed and other, net | | 2,268 | | | 2,711 | | | 5,335 | |
| Properties sold | | (411) | | | - | | | - | |
| Liabilities recorded in 2010 property acquisition | | 9,882 | | | - | | | - | |
| Revision for changes in estimates | | 25,221 | | | 16,101 | | | 131,978 | b |
| Asset retirement obligations at end of year | $ | 358,624 | | $ | 428,711 | | $ | 421,201 | |
| | | | | | | | | | |
| Sulphur | | | | | | | | | |
| Asset retirement obligations at beginning of year: | $ | 27,452 | | $ | 23,003 | | $ | 21,300 | |
| Liabilities settled | | (3,601 | ) | | (481 | ) | | (1,591 | ) |
| Scheduled accretion expense | | 1,415 | | | 2,001 | | | 866 | |
| Revision for changes in estimates | | - | | | 2,929 | | | 2,428 | |
| Asset retirement obligation at end of year | $ | 25,266 | | $ | 27,452 | | $ | 23,003 | |
| a. | Accretion expense charges are included within depletion, depreciation and amortization expense in the accompanying consolidated statements of operations. |
| b. | Primarily represents estimated future abandonment costs associated with damaged structures and well abandonment charges related to Hurricane Ike. |
At December 31, 2010, McMoRan had $7.6 million in restricted investments associated with third party prepayments of future abandonment costs and $46.4 million in escrow associated with the surety funding requirements in favor of a third party related to a portion of the reclamation obligations assumed in a 2007 oil and gas property acquisition. McMoRan is required to make payments under these requirements totaling $15 million annually, payable in quarterly installments (twelve payments total), through July 2010 and $5.0 million a year (payable in quarterly installments) thereafter until certain requirements under the arrangement are met. These restricted funds are classified as long-term restricted cash in the accompanying consolidated balance sheets.
Litigation. McMoRan may from time to time be involved in various legal proceedings of a character normally incident to the ordinary course of its business. Management believes that potential liability from any of these pending or threatened proceedings will not have a material adverse effect on McMoRan’s financial condition or results of operations.
16. MAIN PASS ENERGY HUBTM PROJECT
Freeport Energy’s long-term business objectives may include the pursuit of alternative uses of its discontinued sulphur facilities at Main Pass in the Gulf of Mexico. Freeport Energy refers to this project as the Main Pass Energy Hub™ project (MPEH™).
The Maritime Administration (MARAD) approved Freeport Energy’s license application for the MPEH™ project in January 2007 subject to various terms, criteria and conditions contained in the Record of Decision, including demonstration of financial responsibility, compliance with applicable laws and regulations, environmental monitoring and other customary conditions.
The costs associated with the establishment of the MPEH™ have been charged to expense in the accompanying consolidated statements of operations. These costs will continue to be charged to expense until commercial feasibility is established. Freeport Energy incurred costs for the MPEH™ project totaling $1.0 million in 2010, $1.6 million in 2009 and $6.0 million in 2008.
Currently, Freeport Energy owns 100 percent of the MPEH™ project. However, two entities have separate options to participate as passive equity investors for up to an aggregate 25 percent of Freeport Energy’s equity interest in the project. Future financing and commercial arrangements could also reduce Freeport Energy’s equity interest in the project. Commercialization of the project has
been adversely affected by increased domestic supplies of natural gas, excess LNG re-gasification capacity and general market conditions.
17. SUPPLEMENTARY OIL AND GAS INFORMATION
McMoRan’s oil and gas exploration, development and production activities are primarily conducted offshore in the Gulf of Mexico and onshore in the Gulf Coast region of the United States. Supplementary information presented below is prepared in accordance with requirements prescribed by U.S. generally accepted accounting principles.
Oil and Gas Capitalized Costs.
| | | Years Ended | |
| | | December 31, | |
| | | 2010 | | 2009 | |
| | | (In Thousands) | |
| Unproved properties | | $ | 1,054,399 | | $ | 93,584 | |
| Proved properties | | | 2,436,987 | | | 2,152,813 | |
| Subtotal | | | 3,491,386 | | | 2,246,397 | |
| Less accumulated depreciation and amortization | | | (1,705,810 | ) | | (1,450,205 | ) |
| Net oil and gas properties | | $ | 1,785,576 | | $ | 796,192 | |
Costs Incurred in Oil and Natural Gas Property Acquisition, Exploration and Development Activities.
| | | Years Ended December 31, | |
| | | 2010 | | 2009 | | 2008 | |
| | | (In Thousands) | |
| Acquisition of properties: | | | | | | | | | | |
| Proved | | $ | 191,605 | | $ | 78 | | $ | 2,230 | |
| Unproved | | | 819,001 | | | - | | | 2,808 | |
| Exploration costs | | | 207,806 | | | 148,465 | | | 125,039 | |
| Development costs | | | 53,465 | | | 16,715 | | | 126,199 | |
| | | $ | 1,271,877 | | $ | 165,258 | | $ | 256,276 | |
The following table reflects the net changes in McMoRan’s capitalized exploratory well costs during each of the three years in the period ended December 31, 2010 (in thousands):
| | Years Ended December 31, | |
| | 2010 | | 2009 | | 2008 | |
| Beginning of year | $ | 62,649 | | $ | 43,791 | | $ | 55,980 | |
| Additions to capitalized exploratory well | | | | | | | | | |
| costs pending determination of proved reserves | | 163,563 | a | | 85,356 | | | 141,263 | |
| Reclassifications to wells, facilities, and equipment | | | | | | | | | |
| based on determination of proved reserves | | - | | | (6,180 | ) | | (120,182 | ) |
| Amounts charged to expense | | (7,688 | ) a | | (60,318 | ) | | (33,270 | ) |
| End of year | $ | 218,524 | | $ | 62,649 | | $ | 43,791 | |
| a. | Excludes approximately $7.3 million of non-productive exploratory drilling costs initially capitalized and subsequently determined to be non-commercial in the same annual period (2010). |
At December 31, 2010, McMoRan had one well (South Timbalier Block 168 No. 1) (Blackbeard West) with costs that had been capitalized for a period in excess of one year following the completion of drilling operations. The well was drilled to a total depth of 32,997 feet in October 2008 and logs indicated four potential hydrocarbon bearing zones below 30,067 feet requiring further evaluation. The well has been temporarily abandoned while McMoRan evaluates whether to drill deeper at Blackbeard West, drill an offset location or complete the well to test the existing zones. McMoRan currently holds the rights to
the Blackbeard West lease under a Suspension of Operations (SOO) agreement with BOEMRE, the term of which has been recently extended through May 31, 2011. Under the terms of the SOO, McMoRan must inform the BOEMRE prior to the current SOO expiration date as to the specific plans of deepening and/or completing the current well or drilling a new offset well on that lease, and subsequent to that determination and notice, drilling and/or well completion activities must then re-commence no later than September 2011. McMoRan’s investment in Blackbeard West, including the related allocated amount of the PXP Acquisition purchase price, totaled $59.1 million at December 31, 2010.
Proved Oil and Natural Gas Reserves (Unaudited). Proved oil and natural gas reserves for the periods ending December 31, 2010 and 2009 have been estimated by Ryder Scott Company, L.P. (Ryder Scott), in accordance with the guidelines established by the SEC as set forth in Rule 4-10 (a) (6), (22), (26) and (31) effective December 31, 2009. Proved oil and natural gas reserves for the period ending December 31, 2008 were also estimated by Ryder Scott, in accordance with guidelines established by the SEC that were in effect at that time. All estimates of oil and natural gas reserves are inherently imprecise and subject to change as new technical information about the properties is obtained. Estimates of proved reserves for wells with little or n o production history are less reliable than those based on a long production history. Subsequent evaluation of the same reserves may result in variations which may be substantial. Revisions of proved reserves represent changes in previous estimates of proved reserves resulting from new information obtained from production history, additional development drilling and/or changes in other factors, including economic considerations. Discoveries and extensions represent additions to proved reserves resulting from (1) extensions of proved acreage of previously discovered reservoirs through additional drilling in periods subsequent to initial discovery, and (2) discovery of new fields with proved reserves or of new reservoirs of proved reserves in old fields. Substantially all of McMoRan's proved reserves are located offshore in the Gulf of Mexico. Oil, including condensate and plant products, is stated in thousands of barrels (MBbls) and natural gas in million s of cubic feet (MMcf).
| | Oil | | Natural Gas | |
| | 2010 | | 2009 | | 2008 | | 2010 | | 2009 | | 2008 | |
| Proved reserves: | | | | | | | | | | | | |
| Beginning of year | 15,519 | | 16,989 | | 19,717 | | 178,822 | | 242,897 | | 245,606 | |
| Revisions of previous estimates | 629 | | 1,369 | | (335 | ) | 11,211 | | (12,610 | ) | 5,469 | |
| Discoveries and extensions | - | | 131 | | 1,016 | | - | | 4,377 | | 45,993 | |
| Production | (2,481 | ) | (2,970 | ) | (3,633 | ) | (43,976 | ) | (55,842 | ) | (67,891 | ) |
| Sales of reserves | (222 | ) | - | | - | | (140 | ) | - | | - | |
| Purchase of reserves | 1,112 | a | - | | 224 | | 46,578 | a | - | | 13,720 | |
| End of year | 14,557 | | 15,519 | | 16,989 | | 192,495 | b | 178,822 | | 242,897 | |
| | | | | | | | | | | | | |
| Proved developed reserves: | | | | | | | | | | | | |
| Beginning of year | 13,483 | | 15,039 | | 17,452 | | 135,150 | | 198,610 | | 203,595 | |
| End of year | 13,317 | | 13,483 | | 15,039 | | 144,982 | b | 135,150 | | 198,610 | |
| a. | Reflects the estimated proved reserves associated with the 2010 oil and gas property acquisition (Note 1). |
| b. | At December 31, 2010, McMoRan had natural gas imbalances of 1.0 Bcfe for under deliveries and 0.9 Bcfe for over deliveries which are not reflected in the above reserve quantities. |
Standardized Measure of Discounted Future Net Cash Flows From Proved Oil and Natural Gas Reserves (Unaudited).
McMoRan’s standardized measure of discounted future net cash flows and changes therein relating to proved oil and natural gas reserves were computed using reserve valuations based on regulations and parameters prescribed by the SEC. SEC regulations require the use of average prices during the 12-month period prior to the reporting date. The weighted average of these prices for all properties with proved reserves was $76.97 per barrel of oil and $4.70 per Mcf of natural gas at December 31, 2010 and was $58.73 per barrel of oil and $4.16 per Mcf of natural gas at December 31, 2009.
| | | December 31, | |
| | | 2010 | | 2009 | |
| | | (In Thousands) | |
| Future cash inflows | | $ | 2,024,752 | | $ | 1,655,260 | |
| Future costs applicable to future cash flows: | | | | | | | |
| Production costs | | | (511,235 | ) | | (519,995 | ) |
| Development and abandonment costs | | | (595,335 | ) | | (649,940 | ) |
| Future income taxes | | | - | | | (2,348 | ) |
| Future net cash flows | | | 918,182 | | | 482,977 | |
Discount for estimated timing of net cash flows (10% discount rate) a | | | (267,262 | ) | | (134,596 | ) |
| | | $ | 650,920 | | $ | 348,381 | |
| a. | Amount reflects application of required 10 percent discount rate to both the estimated future income taxes and estimated future net cash flows associated with production of the estimated proved reserves. |
Changes in Standardized Measure of Discounted Future Net Cash Flows From Proved Oil and Natural Gas Reserves (Unaudited).
| | | Years Ended December 31, | |
| | | 2010 | | 2009 | | 2008 | |
| | | (In Thousands) | |
| Beginning of year | | $ | 348,381 | | $ | 705,291 | | $ | 1,638,266 | |
| Revisions: | | | | | | | | | | |
| Changes in prices | | | 196,927 | | | (183,301 | ) | | (534,921 | ) |
| Accretion of discount | | | 34,838 | | | 70,529 | | | 163,827 | |
| Change in reserve quantities | | | 53,306 | | | 15,459 | | | 4,204 | |
| Other changes, including revised estimates of development | | | | | | | | | | |
| costs and rates of production | | | (71,337 | ) | | (97,269 | ) | | (234,425 | )a |
| Discoveries and extensions, less related costs | | | - | | | 2,691 | | | 211,492 | |
| Development costs incurred during the year | | | 175,340 | b | | 65,256 | | | 50,811 | |
| Change in future income taxes | | | 1,476 | | | (324 | ) | | 179,156 | |
| Revenues, less production costs | | | (235,541 | ) | | (229,951 | ) | | (800,354 | ) |
| Purchases reserves in place | | | 154,967 | | | - | | | 27,235 | |
| Sales of reserves in place | | | (7,437) | | | - | | | - | |
| End of year | | $ | 650,920 | | $ | 348,381 | | $ | 705,291 | |
| a. | Includes $107.6 million of revised reclamation cost estimates related to additional costs associated with properties damaged by Hurricane Ike and accelerated timing of when these costs are expected to be incurred. |
| b. | Includes net abandonment costs incurred of approximately $121.9 million. |
18. GUARANTOR FINANCIAL STATEMENTS
In November 2007, McMoRan completed the sale of $300 million of 11.875% senior notes (Note 6). The senior notes are unconditionally guaranteed on a senior basis jointly and severally by MOXY and the subsidiary guarantors. The guarantee is an unsecured obligation of the guarantor and ranks equal in right of payment with all existing and future indebtedness of McMoRan, including indebtedness under the credit facility. The guarantee also ranks senior in right of payment with all future subordinated obligations and is effectively subordinated in right of payment to any debt of McMoRan’s subsidiaries that are not subsidiary guarantors.
The following condensed consolidating financial information includes information regarding McMoRan, as parent, MOXY and its subsidiaries, as guarantors, and Freeport Energy, as the non-
guarantor subsidiary. Included are the condensed consolidating balance sheets at December 31, 2010 and 2009 and the related condensed consolidating statements of operations and cash flow for the years ended December 31, 2010, 2009 and 2008, which should be read in conjunction with the notes to these consolidated financial statements:
CONDENSED CONSOLIDATING BALANCE SHEET
December 31, 2010
| | | | | | | Freeport | | | | Consolidated | |
| | | Parent | | MOXY | | Energy | | Eliminations | | McMoRan | |
| | | (In Thousands) | |
| ASSETS | | | | | | | | | | | | | | | | |
| Current assets: | | | | | | | | | | | | | | | | |
| Cash and cash equivalents | | $ | 420 | | $ | 904,889 | | $ | 375 | | $ | - | | $ | 905,684 | |
| Accounts receivable | | | 66 | | | 86,450 | | | - | | | - | | | 86,516 | |
| Inventories | | | - | | | 38,461 | | | - | | | - | | | 38,461 | |
| Prepaid expenses | | | 657 | | | 14,821 | | | - | | | - | | | 15,478 | |
| Current assets from discontinued | | | | | | | | | | | | | | | | |
| operations | | | - | | | - | | | 702 | | | - | | | 702 | |
| Total current assets | | | 1,143 | | | 1,044,621 | | | 1,077 | | | - | | | 1,046,841 | |
| Property, plant and equipment, net | | | - | | | 1,785,576 | | | 31 | | | - | | | 1,785,607 | |
| Investment in subsidiaries | | | 1,525,531 | | | - | | | - | | | (1,525,531 | ) | | - | |
| Amounts due from affiliates | | | 772,502 | | | | | | - | | | (772,502 | ) | | - | |
| Deferred financing costs and other | | | | | | | | | | | | | | | | |
| assets | | | 6,536 | | | 57,391 | | | - | | | - | | | 63,927 | |
| Discontinued sulphur assets | | | - | | | - | | | 2,989 | | | - | | | 2,989 | |
| Total assets | | $ | 2,305,712 | | $ | 2,887,588 | | $ | 4,097 | | $ | (2,298,033 | ) | $ | 2,899,364 | |
| | | | | | | | | | | | | | | | | |
| LIABILITIES AND STOCKHOLDERS’ EQUITY (DEFICIT) | | | | | | | | | | |
Current liabilities: | | | | | | | | | | | | | | | | |
| Accounts payable | | $ | 444 | | $ | 100,163 | | $ | 2,051 | | $ | - | | $ | 102,658 | |
| Accrued liabilities | | | 8,899 | | | 90,784 | | | (320 | ) | | - | | | 99,363 | |
| Current portion of debt | | | 74,720 | | | - | | | - | | | - | | | 74,720 | |
| Current portion of oil and gas | | | | | | | | | | | | | | | | |
| accrued reclamation costs | | | - | | | 120,970 | | | - | | | - | | | 120,970 | |
| Other current liabilities | | | 5,950 | | | 818 | | | - | | | - | | | 6,768 | |
| Current liabilities from discontinued | | | | | | | | | | | | | | | | |
| operations | | | - | | | - | | | 13,765 | | | - | | | 13,765 | |
| Total current liabilities | | | 90,013 | | | 312,735 | | | 15,496 | | | - | | | 418,244 | |
| Long-term debt | | | 485,256 | | | - | | | - | | | - | | | 485,256 | |
| Amounts due to affiliates | | | - | | | 770,373 | | | 2,129 | | | (772,502 | ) | | - | |
| Accrued oil and gas reclamation costs | | | - | | | 237,654 | | | - | | | - | | | 237,654 | |
| Other long-term liabilities | | | 6,106 | | | 8,876 | | | 1,614 | | | - | | | 16,596 | |
| Long-term liabilities from discontinued | | | | | | | | | | | | | | | | |
| operations | | | - | | | - | | | 17,277 | | | - | | | 17,277 | |
| Total liabilities | | | 581,375 | | | 1,329,638 | | | 36,516 | | | (772,502 | ) | | 1,175,027 | |
| Commitments and contingencies | | | | | | | | | | | | | | | | |
| Stockholders’ equity (deficit) | | | 1,724,337 | | | 1,557,950 | | | (32,419 | ) | | (1,525,531 | ) | | 1,724,337 | |
| Total liabilities and stockholders’ | | | | | | | | | | | | | | | | |
| equity (deficit) | | $ | 2,305,712 | | $ | 2,887,588 | | $ | 4,097 | | $ | (2,298,033 | ) | $ | 2,899,364 | |
CONDENSED CONSOLIDATING BALANCE SHEET
December 31, 2009
| | | | | | | Freeport | | | | Consolidated | |
| | | Parent | | MOXY | | Energy | | Eliminations | | McMoRan | |
| | | (In Thousands) | |
| ASSETS | | | | | | | | | | | | | | | | |
| Current assets: | | | | | | | | | | | | | | | | |
| Cash and cash equivalents | | $ | 16 | | $ | 241,400 | | $ | 2 | | $ | - | | $ | 241,418 | |
| Accounts receivable | | | - | | | 79,681 | | | - | | | - | | | 79,681 | |
| Inventories | | | - | | | 47,818 | | | - | | | - | | | 47,818 | |
| Prepaid expenses | | | 2,919 | | | 11,538 | | | - | | | - | | | 14,457 | |
| Fair value of derivative contracts | | | - | | | 8,693 | | | - | | | - | | | 8,693 | |
| Current assets from discontinued | | | | | | | | | | | | | | | | |
| operations | | | - | | | - | | | 825 | | | - | | | 825 | |
| Total current assets | | | 2,935 | | | 389,130 | | | 827 | | | - | | | 392,892 | |
| Property, plant and equipment, net | | | - | | | 796,192 | | | 31 | | | - | | | 796,223 | |
| Investment in subsidiaries | | | 694,820 | | | - | | | - | | | (694,820 | ) | | - | |
| Amounts due from affiliates | | | - | | | 53,173 | | | - | | | (53,173 | ) | | - | |
| Deferred financing costs and other | | | | | | | | | | | | | | | | |
| assets | | | 6,374 | | | 47,234 | | | - | | | - | | | 53,608 | |
| Discontinued sulphur assets | | | - | | | - | | | 6,159 | | | - | | | 6,159 | |
| Total assets | | $ | 704,129 | | $ | 1,285,729 | | $ | 7,017 | | $ | (747,993 | ) | $ | 1,248,882 | |
| | | | | | | | | | | | | | | | | |
| LIABILITIES AND STOCKHOLDERS’ EQUITY (DEFICIT) | | | | | | | | | | |
Current liabilities: | | | | | | | | | | | | | | | | |
| Accounts payable | | $ | 188 | | $ | 66,209 | | $ | 147 | | $ | - | | $ | 66,544 | |
| Accrued liabilities | | | 728 | | | 51,217 | | | - | | | - | | | 51,945 | |
| Current portion of oil and gas | | | | | | | | | | | | | | | | |
| accrued reclamation costs | | | - | | | 106,791 | | | - | | | - | | | 106,791 | |
| Other current liabilities | | | 7,698 | | | 2,074 | | | - | | | - | | | 9,772 | |
| Current liabilities from discontinued | | | | | | | | | | | | | | | | |
| operations | | | - | | | - | | | 9,483 | | | - | | | 9,483 | |
| Total current liabilities | | | 8,614 | | | 226,291 | | | 9,630 | | | - | | | 244,535 | |
| Long-term debt | | | 374,720 | | | - | | | - | | | - | | | 374,720 | |
| Amounts due to affiliates | | | 48,977 | | | - | | | 4,196 | | | (53,173 | ) | | - | |
| Accrued oil and gas reclamation costs | | | - | | | 321,920 | | | - | | | - | | | 321,920 | |
| Other long-term liabilities | | | 6,010 | | | 8,975 | | | 1,617 | | | - | | | 16,602 | |
| Long-term liabilities from discontinued | | | | | | | | | | | | | | | | |
| operations | | | - | | | - | | | 25,297 | | | - | | | 25,297 | |
| Total liabilities | | | 438,321 | | | 557,186 | | | 40,740 | | | (53,173 | ) | | 983,074 | |
| Commitments and contingencies | | | | | | | | | | | | | | | | |
| Stockholders’ equity (deficit) | | | 265,808 | | | 728,543 | | | (33,723 | ) | | (694,820 | ) | | 265,808 | |
| Total liabilities and stockholders’ | | | | | | | | | | | | | | | | |
| equity (deficit) | | $ | 704,129 | | $ | 1,285,729 | | $ | 7,017 | | $ | (747,993 | ) | $ | 1,248,882 | |
CONDENSED CONSOLIDATING STATEMENT OF OPERATIONS
Year Ended December 31, 2010
| | | | | | | Freeport | | | | Consolidated | |
| | | Parent | | MOXY | | Energy | | Eliminations | | McMoRan | |
| | | (In Thousands) | |
| Revenues: | | | | | | | | | | | | | | | | |
| Oil and natural gas | | $ | - | | $ | 418,816 | | $ | - | | $ | - | | $ | 418,816 | |
| Service | | | - | | | 15,560 | | | - | | | - | | | 15,560 | |
| Total revenues | | | - | | | 434,376 | | | - | | | - | | | 434,376 | |
| Costs and expenses: | | | | | | | | | | | | | | | | |
| Production and delivery costs | | | - | | | 182,843 | | | (53 | ) | | - | | | 182,790 | |
| Depletion, depreciation and amortization | | | | | | | | | | | | | | | | |
| expense | | | - | | | 282,062 | | | - | | | - | | | 282,062 | |
| Exploration expenses | | | - | | | 42,608 | | | - | | | - | | | 42,608 | |
| Gain on oil and gas derivative contracts | | | - | | | (4,240 | ) | | - | | | - | | | (4,240 | ) |
| General and administrative expenses | | | 13,931 | | | 37,598 | | | - | | | - | | | 51,529 | |
Main Pass Energy HubTM costs | | | - | | | - | | | 1,011 | | | - | | | 1,011 | |
| Gain on sale of oil and gas property | | | - | | | (3,455 | ) | | - | | | - | | | (3,455 | ) |
| Insurance recoveries | | | - | | | (38,944 | ) | | - | | | - | | | (38,944 | ) |
| Total costs and expenses | | | 13,931 | | | 498,472 | | | 958 | | | - | | | 513,361 | |
| Operating loss | | | (13,931 | ) | | (64,096 | ) | | (958 | ) | | - | | | (78,985 | ) |
| Interest expense, net | | | (38,196 | ) | | (20 | ) | | - | | | - | | | (38,216 | ) |
| Equity in losses of consolidated | | | | | | | | | | | | | | | | |
| subsidiaries | | | (68,201 | ) | | - | | | - | | | 68,201 | | | - | |
| Other income (expense), net | | | (14 | ) | | 239 | | | - | | | - | | | 225 | |
| Loss from continuing operations before | | | | | | | | | | | | | | | | |
| income taxes | | | (120,342 | ) | | (63,877 | ) | | (958 | ) | | 68,201 | | | (116,976 | ) |
| Income tax benefit | | | - | | | - | | | - | | | - | | | | |
| Loss from continuing operations | | | (120,342 | ) | | (63,877 | ) | | (958 | ) | | 68,201 | | | (116,976 | ) |
| Loss from discontinued operations | | | - | | | - | | | (3,366 | ) | | - | | | (3,366 | ) |
| Net loss | | | (120,342 | ) | | (63,877 | ) | | (4,324 | ) | | 68,201 | | | (120,342) | |
| Preferred dividends and other related | | | | | | | | | | | | | | | | |
| preferred stock costs | | | (77,101 | ) | | - | | | - | | | - | | | (77,101 | ) |
| Net loss applicable to common stock | | $ | (197,443 | ) | $ | (63,877 | ) | $ | (4,324 | ) | $ | 68,201 | | $ | (197,443 | ) |
| | | | | | | | | | | | | | | | | |
CONDENSED CONSOLIDATING STATEMENT OF OPERATIONS
Year Ended December 31, 2009
| | | | | | | Freeport | | | | Consolidated | |
| | | Parent | | MOXY | | Energy | | Eliminations | | McMoRan | |
| | | (In Thousands) | |
| Revenues: | | | | | | | | | | | | | | | | |
| Oil and natural gas | | $ | - | | $ | 422,976 | | $ | - | | $ | - | | $ | 422,976 | |
| Service | | | - | | | 12,459 | | | - | | | - | | | 12,459 | |
| Total revenues | | | - | | | 435,435 | | | - | | | - | | | 435,435 | |
| Costs and expenses: | | | | | | | | | | | | | | | | |
| Production and delivery costs | | | - | | | 193,081 | | | (56 | ) | | - | | | 193,025 | |
| Depletion, depreciation and amortization | | | | | | | | | | | | | | | | |
| expense | | | - | | | 313,980 | | | - | | | - | | | 313,980 | |
| Exploration expenses | | | - | | | 94,281 | | | - | | | - | | | 94,281 | |
| Gain on oil and gas derivative contracts | | | - | | | (17,394 | ) | | - | | | - | | | (17,394 | ) |
| General and administrative expenses | | | 5,749 | | | 37,181 | | | 24 | | | - | | | 42,954 | |
Main Pass Energy HubTM costs | | | - | | | - | | | 1,615 | | | - | | | 1,615 | |
| Insurance recoveries | | | - | | | (24,592 | ) | | - | | | - | | | (24,592 | ) |
| Total costs and expenses | | | 5,749 | | | 596,537 | | | 1,583 | | | - | | | 603,869 | |
| Operating loss | | | (5,749 | ) | | (161,102 | ) | | (1,583 | ) | | - | | | (168,434 | ) |
| Interest expense, net | | | (41,152 | ) | | (1,791 | ) | | - | | | - | | | (42,943 | ) |
| Equity in losses of consolidated | | | | | | | | | | | | | | | | |
| subsidiaries | | | (166,501 | ) | | - | | | - | | | 166,501 | | | - | |
| Other income (expense), net | | | (29 | ) | | 4,072 | | | - | | | - | | | 4,043 | |
| Loss from continuing operations before | | | | | | | | | | | | | | | | |
| income taxes | | | (213,431 | ) | | (158,821 | ) | | (1,583 | ) | | 166,501 | | | (207,334 | ) |
| Income tax benefit | | | 2,445 | | | - | | | - | | | - | | | 2,445 | |
| Loss from continuing operations | | | (210,986 | ) | | (158,821 | ) | | (1,583 | ) | | 166,501 | | | (204,889 | ) |
| Loss from discontinued operations | | | - | | | - | | | (6,097 | ) | | - | | | (6,097 | ) |
| Net loss | | | (210,986 | ) | | (158,821 | ) | | (7,680 | ) | | 166,501 | | | (210,986 | ) |
| Preferred dividends and other related | | | | | | | | | | | | | | | | |
| preferred stock costs | | | (14,332 | ) | | - | | | - | | | - | | | (14,332 | ) |
| Net loss applicable to common stock | | $ | (225,318 | ) | $ | (158,821 | ) | $ | (7,680 | ) | $ | 166,501 | | $ | (225,318 | ) |
| | | | | | | | | | | | | | | | | |
CONDENSED CONSOLIDATING STATEMENT OF OPERATIONS
Year Ended December 31, 2008
| | | | | | | Freeport | | | | Consolidated | |
| | | Parent | | MOXY | | Energy | | Eliminations | | McMoRan | |
| | | (In Thousands) | |
| Revenues: | | | | | | | | | | | | | | | | |
| Oil and natural gas | | $ | - | | $ | 1,058,804 | | $ | - | | $ | - | | $ | 1,058,804 | |
| Service | | | - | | | 13,678 | | | - | | | - | | | 13,678 | |
| Total revenues | | | - | | | 1,072,482 | | | - | | | - | | | 1,072,482 | |
| Costs and expenses: | | | | | | | | | | | | | | | | |
| Production and delivery costs | | | - | | | 258,504 | | | (54 | ) | | - | | | 258,450 | |
| Depletion, depreciation and amortization | | | | | | | | | | | | | | | | |
| expense | | | - | | | 854,798 | | | - | | | - | | | 854,798 | |
| Exploration expenses | | | - | | | 79,116 | | | - | | | - | | | 79,116 | |
| Gain on oil and gas derivative contracts | | | - | | | (16,303 | ) | | - | | | - | | | (16,303 | ) |
| General and administrative expenses | | | 7,624 | | | 41,024 | | | 351 | | | - | | | 48,999 | |
Main Pass Energy HubTM costs | | | - | | | - | | | 6,047 | | | - | | | 6,047 | |
| Insurance recoveries | | | - | | | (3,391 | ) | | - | | | - | | | (3,391 | ) |
| Total costs and expenses | | | 7,624 | | | 1,213,748 | | | 6,344 | | | - | | | 1,227,716 | |
| Operating loss | | | (7,624 | ) | | (141,266 | ) | | (6,344 | ) | | - | | | (155,234 | ) |
| Interest expense, net | | | (43,722 | ) | | (7,168 | ) | | - | | | - | | | (50,890 | ) |
| Equity in losses of consolidated | | | | | | | | | | | | | | | | |
| subsidiaries | | | (160,205 | ) | | - | | | - | | | 160,205 | | | - | |
| Other income (expense), net | | | (2,635 | ) | | 69 | | | - | | | - | | | (2,566 | ) |
| Loss from continuing operations before | | | | | | | | | | | | | | | | |
| income taxes | | | (214,186 | ) | | (148,365 | ) | | (6,344 | ) | | 160,205 | | | (208,690 | ) |
| Income tax expense | | | (2,508 | ) | | - | | | - | | | - | | | (2,508 | ) |
| Loss from continuing operations | | | (216,694 | ) | | (148,365 | ) | | (6,344 | ) | | 160,205 | | | (211,198 | ) |
| Loss from discontinued operations | | | - | | | - | | | (5,496 | ) | | - | | | (5,496 | ) |
| Net loss | | | (216,694 | ) | | (148,365 | ) | | (11,840 | ) | | 160,205 | | | (216,694 | ) |
| Preferred dividends and other related | | | | | | | | | | | | | | | | |
| preferred stock costs | | | (22,286 | ) | | - | | | - | | | - | | | (22,286 | ) |
| Net loss applicable to common stock | | $ | (238,980 | ) | $ | (148,365 | ) | $ | (11,840 | ) | $ | 160,205 | | $ | (238,980 | ) |
| | | | | | | | | | | | | | | | | |
CONDENSED CONSOLIDATING STATEMENT OF CASH FLOW
Year Ended December 31, 2010
| | | | | | | Freeport | | Consolidated | |
| | | Parent | | MOXY | | Energy | | McMoRan | |
| | | (In Thousands) | |
| | | | | | | | | | | | | | |
| Cash flow from operating activities: | | | | | | | | | | | | | |
| Net cash provided by (used in) continuing | | | | | | | | | | | | | |
| operations | | $ | (860,748 | ) | $ | 963,955 | | $ | (2,760 | ) | $ | 100,447 | |
| Net cash used in discontinued | | | | | | | | | | | | | |
| operations | | | - | | | - | | | (2,217 | ) | | (2,217 | ) |
| Net cash provided by (used in) | | | | | | | | | | | | | |
| operating activities | | | (860,748 | ) | | 963,955 | | | (4,977 | ) | | 98,230 | |
| | | | | | | | | | | | | | |
| Cash flow from investing activities: | | | | | | | | | | | | | |
| Exploration, development and other | | | | | | | | | | | | | |
| capital expenditures | | | - | | | (217,252 | ) | | - | | | (217,252 | ) |
| Acquisition of properties, net | | | - | | | (86,134 | ) | | - | | | (86,134 | ) |
| Gain on sale of oil and gas property | | | - | | | 2,920 | | | - | | | 2,920 | |
| Net cash used in investing activities | | | - | | | (300,466 | ) | | - | | | (300,466 | ) |
| | | | | | | | | | | | | | |
| Cash flow from financing activities: | | | | | | | | | | | | | |
| Net proceeds from sale of preferred stock | | | 700,000 | | | - | | | - | | | 700,000 | |
| Net proceeds from sale of senior notes | | | 200,000 | | | - | | | - | | | 200,000 | |
| Dividend and inducement payments | | | | | | | | | | | | | |
| on convertible preferred stock | | | (27,306 | ) | | - | | | - | | | (27,306 | ) |
| Costs associated with sale of preferred | | | | | | | | | | | | | |
| stock and senior notes | | | (6,689 | ) | | - | | | - | | | (6,689 | ) |
| Proceeds from exercise of stock options | | | 497 | | | - | | | - | | | 497 | |
| Investment from parent | | | (5,350 | ) | | - | | | 5,350 | | | - | |
| Net cash provided by financing activities | | | 861,152 | | | - | | | 5,350 | | | 866,502 | |
| | | | | | | | | | | | | | |
| Net increase (decrease) in cash and | | | | | | | | | | | | | |
| cash equivalents | | | 404 | | | 663,489 | | | 373 | | | 664,266 | |
| Cash and cash equivalents at beginning | | | | | | | | | | | | | |
| of year | | | 16 | | | 241,400 | | | 2 | | | 241,418 | |
| Cash and cash equivalents at end of | | | | | | | | | | | | | |
| year | | $ | 420 | | $ | 904,889 | | $ | 375 | | $ | 905,684 | |
| | | | | | | | | | | | | | |
CONDENSED CONSOLIDATING STATEMENT OF CASH FLOW
Year Ended December 31, 2009
| | | | | | | Freeport | | Consolidated | |
| | | Parent | | MOXY | | Energy | | McMoRan | |
| | | (In Thousands) | |
| | | | | | | | | | | | | | |
| Cash flow from operating activities: | | | | | | | | | | | | | |
| Net cash provided by (used in) continuing | | | | | | | | | | | | | |
| operations | | $ | (148,451 | ) | $ | 285,973 | | $ | (629 | ) | $ | 136,893 | |
| Net cash used in discontinued | | | | | | | | | | | | | |
| operations | | | - | | | - | | | (5,728 | ) | | (5,728 | ) |
| Net cash provided by (used in) | | | | | | | | | | | | | |
| operating activities | | | (148,451 | ) | | 285,973 | | | (6,357 | ) | | 131,165 | |
| | | | | | | | | | | | | | |
| Cash flow from investing activities: | | | | | | | | | | | | | |
| Exploration, development and other | | | | | | | | | | | | | |
| capital expenditures | | | - | | | (138,015 | ) | | - | | | (138,015 | ) |
| Net cash used in investing activities | | | - | | | (138,015 | ) | | - | | | (138,015 | ) |
| | | | | | | | | | | | | | |
| Cash flow from financing activities: | | | | | | | | | | | | | |
| Net proceeds from sale of common stock | | | 84,976 | | | - | | | - | | | 84,976 | |
| Net proceeds from sale of preferred stock | | | 83,275 | | | - | | | - | | | 83,275 | |
| Dividend and inducement payments | | | | | | | | | | | | | |
| on convertible preferred stock | | | (13,469 | ) | | - | | | - | | | (13,469 | ) |
| Investment from parent | | | (6,350 | ) | | - | | | 6,350 | | | - | |
| Net cash provided by financing activities | | | 148,432 | | | - | | | 6,350 | | | 154,782 | |
| | | | | | | | | | | | | | |
| Net increase (decrease) in cash and | | | | | | | | | | | | | |
| cash equivalents | | | (19 | ) | | 147,958 | | | (7 | ) | | 147,932 | |
| Cash and cash equivalents at beginning | | | | | | | | | | | | | |
| of year | | | 35 | | | 93,442 | | | 9 | | | 93,486 | |
| Cash and cash equivalents at end of | | | | | | | | | | | | | |
| year | | $ | 16 | | $ | 241,400 | | $ | 2 | | $ | 241,418 | |
| | | | | | | | | | | | | | |
CONDENSED CONSOLIDATING STATEMENT OF CASH FLOW
Year Ended December 31, 2008
| | | | | | | Freeport | | Consolidated | |
| | | Parent | | MOXY | | Energy | | McMoRan | |
| | | (In Thousands) | |
| | | | | | | | | | | | | | |
| Cash flow from operating activities: | | | | | | | | | | | | | |
| Net cash provided by continuing | | | | | | | | | | | | | |
| operations | | $ | 23,676 | | $ | 603,205 | | $ | 2,778 | | $ | 629,659 | |
| Net cash used in discontinued | | | | | | | | | | | | | |
| operations | | | - | | | - | | | (6,262 | ) | | (6,262 | ) |
| Net cash provided by (used in) | | | | | | | | | | | | | |
| operating activities | | | 23,676 | | | 603,205 | | | (3,484 | ) | | 623,397 | |
| | | | | | | | | | | | | | |
| Cash flow from investing activities: | | | | | | | | | | | | | |
| Exploration, development and other | | | | | | | | | | | | | |
| capital expenditures | | | - | | | (236,383 | ) | | - | | | (236,383 | ) |
| Acquisition of properties, net | | | - | | | (2,826 | ) | | - | | | (2,826 | ) |
| Net cash used in investing activities | | | - | | | (239,209 | ) | | - | | | (239,209 | ) |
| | | | | | | | | | | | | | |
| Cash flow from financing activities: | | | | | | | | | | | | | |
| Net borrowings under revolving credit | | | | | | | | | | | | | |
| facility | | | - | | | (274,000 | ) | | - | | | (274,000 | ) |
| Dividend and inducement payments | | | | | | | | | | | | | |
| on convertible preferred stock | | | (23,565 | ) | | - | | | - | | | (23,565 | ) |
| Proceeds from exercise of stock | | | | | | | | | | | | | |
| options, warrants and other | | | 4,696 | | | - | | | - | | | 4,696 | |
| Payments for induced conversion of | | | | | | | | | | | | | |
| convertible senior notes | | | (2,663 | ) | | - | | | - | | | (2,663 | ) |
| Investment from parent | | | (2,252 | ) | | - | | | 2,252 | | | - | |
| Net cash provided by (used in) | | | | | | | | | | | | | |
| financing activities | | | (23,784 | ) | | (274,000 | ) | | 2,252 | | | (295,532 | ) |
| | | | | | | | | | | | | | |
| Net increase (decrease) in cash and | | | | | | | | | | | | | |
| cash equivalents | | | (108 | ) | | 89,996 | | | (1,232 | ) | | 88,656 | |
| Cash and cash equivalents at beginning | | | | | | | | | | | | | |
| of year | | | 143 | | | 3,446 | | | 1,241 | | | 4,830 | |
| Cash and cash equivalents at end of | | | | | | | | | | | | | |
| year | | $ | 35 | | $ | 93,442 | | $ | 9 | | $ | 93,486 | |
| | | | | | | | | | | | | | |
19. QUARTERLY FINANCIAL INFORMATION (UNAUDITED)
| | | | | Operating | | | | Net Loss | |
| | | | | Income | | Net | | per Share | |
| | | Revenues | | (Loss) | | Loss a | | Basic | | Diluted | |
| | | (In Thousands, Except Per Share Amounts) | |
| 2010 | | | | | | | | | | | | | | | | |
1st Quarter | | $ | 132,488 | | $ | (41,282 | ) | $ | (66,160 | ) | $ | (0.74 | ) | $ | (0.74 | ) |
2nd Quarter | | | 108,041 | | | (5,188 | ) | | (21,746 | ) | | (0.23 | ) | | (0.23 | ) |
3rd Quarter | | | 94,840 | | | (10,927 | ) | | (25,253 | ) | | (0.26 | ) | | (0.26 | ) |
4th Quarter | | | 99,007 | | | (21,588 | ) | | (84,284 | ) | | (0.83 | ) | | (0.83 | ) |
| | | $ | 434,376 | | $ | (78,985 | ) | $ | (197,443 | ) | | | | | | |
| | | | | Operating | | | | Net Loss | |
| | | | | Income | | Net | | per Share | |
| | | Revenues | | (Loss) | | Loss a | | Basic | | Diluted | |
| | | (In Thousands, Except Per Share Amounts) | |
| 2009 | | | | | | | | | | | | | | | | |
1st Quarter | | $ | 97,376 | | $ | (49,139 | ) | $ | (63,241 | ) | $ | (0.90 | ) | $ | (0.90 | ) |
2nd Quarter | | | 96,552 | | | (87,258 | ) | | (100,612 | ) | | (1.40 | ) | | (1.40 | ) |
3rd Quarter | | | 109,535 | | | (35,514 | ) | | (51,932 | ) | | (0.60 | ) | | (0.60 | ) |
4th Quarter | | | 131,972 | | | 3,477 | | | (9,533 | ) | | (0.11 | ) | | (0.11 | ) |
| | | $ | 435,435 | | $ | (168,434 | ) | $ | (225,318 | ) | | | | | | |
| | | | | | | | | | | | | | | | | |
| a. | Represents net loss attributable to common shareholders, which includes preferred dividends and inducement payments for early conversion of preferred stock as a reduction to net income (loss). |
Not Applicable
(a) Evaluation of disclosure controls and procedures. Our chief executive officer and chief financial officer, with the participation of management, have evaluated the effectiveness of our disclosure controls and procedures (as defined in Rules 13a-15(e) and 15d-15(e) under the Securities Exchange Act of 1934) as of the end of the period covered by this annual report on Form 10-K. Based on their evaluation, they have concluded that our disclosure controls and procedures are effective as of the end of the period covered by this report.
(b) Management’s Report on Internal Control over Financial Reporting and Report of Independent Registered Public Accounting Firm. The information required to be furnished pursuant to this item is set forth under the captions “Management’s Report on Internal Control over Financial Reporting” and “Report of Independent Registered Public Accounting Firm” in Item 8 of this report.
(c) Changes in internal controls. There has been no change in our internal control over financial reporting that occurred during the fourth fiscal quarter that has materially affected, or is reasonably likely to materially affect our internal controls over financial reporting.
Not Applicable.
The information required by Item 10 regarding our executive officers appears in a separately captioned heading after Item 4 in Part II of this report on Form 10-K. Other information required by this item will be contained in our definitive proxy statement to be filed pursuant to Regulation 14A and is incorporated herein by reference.
Information required by this item will be contained in our definitive proxy statement to be filed pursuant to Regulation 14A and is incorporated herein by reference.
Except as set forth below, Information required by this item will be contained in our definitive proxy statement to be filed pursuant to Regulation 14A and is incorporated herein by reference.
Securities Authorized for Issuance Under Equity Compensation Plans.
The following table provides information as of December 31, 2010, with respect to compensation plans under which our equity securities are authorized for issuance.
| | Number of Securities to be Issued upon Exercise of Outstanding Options, Warrants and Rights | | Weighted Average Exercise Price of Outstanding Options | | Number of Securities Remaining Available for Future Grant Under Equity Compensation Plans | |
| | | | | | | | | | |
| Equity compensation plans approved by stockholders | $ | 11,966,250 a | | $ | 13.69 a | | $ | 6,498,193 b | |
| Equity compensation plans not approved by stockholders | | - | | | - | | | - | |
| | | | | | | | | | |
| a. | | Includes shares issuable upon the vesting of 73,500 restricted stock units, and the termination of deferrals with respect to 25,000 restricted stock units that were vested as of December 31, 2010. These awards are not reflected in the “weighted average exercise price of outstanding options” as they do not have an exercise price. | |
| b. | As of December 31, 2010, there were 6,497,250 shares remaining available for future issuance under the 2008 Stock Incentive Plan, all of which could be issued under the terms of the plan pursuant to awards of options and stock appreciation rights, and 3,411,500 of which could be issued under the terms of the plan pursuant to awards of restricted stock, restricted stock units and “other stock-based” awards. In addition, there were 250 shares remaining available for future issuance under the 2005 Stock Incentive Plan, all of which could be issued under the terms of the plan pursuant to awards of options, stock appreciation rights, restricted stock, restricted stock units and “other stock-based” awards. There were also 250 shares remaining available for future issuance under each of the 2003 Stock Incentive Plan and the 2001 Stock Incentive Plan, all of which could be issued under the respective terms of the plans pursuant to awards of options, stock appreciation rights, limited rights, restricted stock and “other stock-based” awards. Finally, there were also 193 shares remaining available for future issuance to our non-management directors and advisory directors under the 2004 Director Compensation Plan. |
See Note 11 to our consolidated financial statements for further information regarding the significant features of the above plans.
Information required by this item will be contained in our definitive proxy statement to be filed pursuant to Regulation 14A and is incorporated herein by reference.
Information required by this item will be contained in our definitive proxy statement to be filed pursuant to Regulation 14A and is incorporated herein by reference.
(a)(1). Financial Statements. Reference is made to Item 8 hereof.
| (a)(2). | Financial Statement Schedules. All financial statement schedules are either not required under the related instructions or are not applicable because the information has been included elsewhere herein. |
| (a)(3). | Exhibits. Reference is made to the Exhibit Index beginning on page E-1 hereof. |
____________________
3-D seismic technology. Seismic data which has been digitally recorded, processed and analyzed in a manner that permits color enhanced three dimensional displays of geologic structures. Seismic data processed in that manner facilitates more comprehensive and accurate analysis of subsurface geology, including the potential presence of hydrocarbons.
Bbl or Barrel. One stock tank barrel, or 42 U.S. gallons liquid volume (used in reference to crude oil or other liquid hydrocarbons).
Bcf. Billion cubic feet.
Bcfe. Billion cubic feet equivalent, determined using the ratio of six Mcf of natural gas to one barrel of crude oil, condensate or natural gas liquids.
Block. A block depicted on the Outer Continental Shelf Leasing and Official Protraction Diagrams issued by the U.S. Mineral Management Service or a similar depiction on official protraction or similar diagrams issued by a state bordering on the Gulf of Mexico.
Blowouts. Accidents resulting from a penetration of a gas or oil reservoir during drilling operations under higher-than-calculated pressure.
BOEMRE. The Bureau of Ocean Energy Management, Regulation and Enforcement (an agency of the Department of the Interior; formerly, the Minerals Management Service).
Completion. The installation of permanent equipment for the production of natural gas or oil, or in the case of a dry hole, the reporting of abandonment to the appropriate agency.
Condensate. A mixture of hydrocarbons that exists in the gaseous phase at original reservoir temperature and pressure, but that, when produced, is in the liquid phase at surface pressure and temperature.
Cratering. The collapse of the circulation system dug around the drilling rig for the prevention of blowouts.
Delineation well. A well drilled at a distance from a development well to determine physical extent, reserves and likely production rate of a new oil or gas reservoir.
Developed acreage. Acreage in which there are one or more producing wells or shut-in wells capable of commercial production and/or acreage with established reserves in quantities we deemed sufficient to develop.
Development well. A well drilled into a proved natural gas or oil reservoir to the depth of a stratigraphic horizon known to be productive.
Exploratory well. A well drilled to find a new field or to find a new reservoir in a field previously found to be productive of oil or gas in another reservoir.
Farm-in or farm-out. An agreement under which the owner of a working interest in a natural gas and oil lease assigns the working interest or a portion of the working interest to another party who desires to drill on the leased acreage. Generally, the assignee is required to drill one or more wells at its expense in order to earn its interest in the acreage. The assignor usually retains a royalty or reversionary interest in the lease. The agreement is a “farm-in” to the assignee and a “farm-out” to the assignor.
Field. An area consisting of a single reservoir or multiple reservoirs all grouped on or related to the same individual geological structural feature and/or stratigraphic condition.
Gross acres or gross wells. The total acres or wells, as the case may be, in which a working interest and/or operating right is owned.
Gross interval. The measurement of the vertical thickness of the producing and non-producing zones of an oil and gas reservoir.
Gulf of Mexico shelf. The offshore area within the Gulf of Mexico seaward on the coastline extending out to 200 meters water depth.
Henry Hub. The pricing point for natural gas futures on the New York Mercantile Exchange.
LNG. Liquefied natural gas.
MBbls. One thousand barrels, typically used to measure the volume of crude oil or other liquid hydrocarbons.
Mcf. One thousand cubic feet, typically used to measure the volume of natural gas.
Mcfe. One thousand cubic feet equivalent, determined using the ratio of six Mcf of natural gas to one Bbl of crude oil, condensate or natural gas liquids.
MMBbls. One million barrels, typically used to measure the volume of crude oil or other liquid hydrocarbons.
MMbtu. One million british thermal units.
MMcf. One million cubic feet, typically used to measure the volume of natural gas at specified temperature and pressure.
MMcfe. One million cubic feet equivalent, determined using the ratio of six Mcf of natural gas to one Bbl of crude oil, condensate or natural gas liquids.
MMcfe/d. One million cubic feet equivalent per day.
Net acres or net wells. Gross acres or gross wells multiplied by the percentage working interest and/or operating right owned.
Net feet of hydrocarbon bearing sands. The vertical thickness of the producing zone of an oil and gas reservoir.
Net feet of pay. The thickness of reservoir rock estimated to both contain hydrocarbons and be capable of contributing to producing rates.
Net profit interest. An interest in profits realized through the sale of production, after costs. It is carved out of the working interest.
Net revenue interest. An interest in a revenue stream net of all other interests burdening that stream, such as a lessor’s royalty and any overriding royalties. For example, if a lessor executes a lease with a one-eighth royalty, the lessor’s net revenue interest is 12.5 percent and the lessee’s net revenue interest is 87.5 percent.
Non-productive well. A well found to be incapable of producing hydrocarbons in quantities sufficient such that proceeds from the sale of production would exceed production expenses and taxes.
Overriding royalty interest. A revenue interest, created out of a working interest, that entitles its owner to a share of revenues, free of any operating or production costs. An overriding royalty is often retained by a lessee assigning an oil and gas lease.
Pay. Reservoir rock containing oil or gas.
Plant Products. Hydrocarbons (primarily ethane, propane, butane and natural gasolines) which have been extracted from wet natural gas and become liquid under various combinations of increasing pressure and lower temperature.
Productive well. A well that is found to be capable of producing hydrocarbons in quantities sufficient such that proceeds from the sale of production exceed production expenses and taxes.
Prospect. A specific geographic area which, based on supporting geological, geophysical or other data and also preliminary economic analysis using reasonably anticipated prices and costs, is deemed to have potential for the discovery of commercial hydrocarbons.
Proved developed non-producing reserves. Reserves expected to be recovered from zones in existing wells, which will require additional completion work or future recompletion prior to the start of production.
Proved developed producing reserves. Reserves expected to be recovered from completion intervals which are open and producing at the time the estimate is made.
Proved developed reserves. Proved developed oil and gas reserves are reserves that can be expected to be recovered through existing wells with existing equipment and operating methods.
Proved developed shut-in reserves. Reserves expected to be recovered from (1) completion intervals which are open at the time of the estimate, but which have not stared producing, (2) wells which were shut-in awaiting pipeline connections or as a result of a market interruption or (3) wells not capable of production for mechanical reasons.
Proved reserves. Proved oil and gas reserves are the estimated quantities of crude oil, natural gas, and natural gas liquids that geological and engineering data demonstrate with reasonable certainty to be recoverable in future years from known reservoirs under existing economic and operating conditions, i.e., prices and costs as of the date the estimate is made.
Proved oil and gas reserves. Proved oil and gas reserves are those quantities of oil and gas, which, by analysis of geoscience and engineering data, can be estimated with reasonable certainty to be economically producible-from a given date forward, from known reservoirs, an under existing economic conditions, operating methods, and government regulations-prior to the time at which contracts providing the right to operate expire, unless evidence indicates that renewal is reasonable certain, regardless of whether deterministic or probabilistic methods are used for the estimation.
Recompletion. An operation whereby a completion in one zone in a well is abandoned in order to attempt a completion in a different zone within the existing wellbore.
Reservoir. A porous and permeable underground formation containing a natural accumulation of producible natural gas and/or oil that is confined by impermeable rock or water barriers and is individual and separate from other reservoirs.
Sands. Sandstone or other sedimentary rocks.
SEC. Securities and Exchange Commission.
Sour. High sulphur content.
Undeveloped acreage. Lease acreage on which wells have not been drilled or completed to a point that would permit the production of commercial quantities of natural gas and oil regardless of whether the acreage contains proved reserves.
Working interest. The lessee’s interest created by the execution of an oil and gas lease that gives the lessee the right to exploit the minerals on the property.
For additional information regarding the definitions contained in this Glossary, or for other Oil & Gas definitions, please see Rule 4-10 of Regulation S-X.
Pursuant to the requirements of Section 13 of the Securities Exchange Act of 1934, the registrant has duly caused this report to be signed on its behalf by the undersigned, thereunto duly authorized on February 28, 2011.
McMoRan Exploration Co.
By: /s/ James R. Moffett
James R. Moffett
Co-Chairman of the Board
President and Chief Executive Officer
Pursuant to the requirements of the Securities Exchange Act of 1934, this report has been signed below by the following persons on behalf of the registrant and the capacities indicated, on February 28, 2011.
| /s/ James R. Moffett | Co-Chairman of the Board |
| James R. Moffett | |
| | |
| /s/ Richard C. Adkerson | Co-Chairman of the Board |
| Richard C. Adkerson | |
| | |
| * | Vice Chairman of the Board |
| B.M. Rankin, Jr. | |
| | |
| * | Executive Vice President |
| C. Howard Murrish | |
| | |
| /s/ Nancy D. Parmelee | Senior Vice President, Chief Financial |
| Nancy D. Parmelee | Officer and Secretary |
| | (Principal Financial Officer) |
| | |
| * | Vice President and Controller - Financial Reporting |
| C. Donald Whitmire, Jr. | (Principal Accounting Officer) |
| | |
| * | Director |
| A. Peyton Bush, III | |
| | |
| * | Director |
| William P. Carmichael | |
| | |
| * | Director |
| Robert A. Day | |
| | |
| * | Director |
| James C. Flores | |
| | |
| * | Director |
| Gerald J. Ford | |
| | |
| * | Director |
| H. Devon Graham, Jr. | |
| | |
| * | Director |
| Suzanne T. Mestayer | |
| | |
| * | Director |
| John F. Wombwell | |
| | |
| | |
| | |
*By: /s/ Richard C. Adkerson | |
| Richard C. Adkerson | |
| Attorney-in-Fact | |
McMoRan Exploration Co.
| | | Filed | | | |
| Exhibit | | with this | Incorporated by Reference |
| | | | | |
| 2.1 | Agreement and Plan of Merger dated as of August 1, 1998 | | S-4 | 333-61171 | 10/06/1998 |
| 2.2 | Agreement and Plan of Merger dated September 19, 2010, by and among McMoRan, McMoRan Oil & Gas LLC, McMoRan GOM, LLC and McMoRan Offshore LLC, and Plains Exploration & Production Company, PXP Gulf Properties LLC and PXP Offshore LLC | | 10-Q | 001-07791 | 11/09/2010 |
| 3.1 | Composite Certificate of Incorporation of McMoRan | | 8-A/A | 001-07791 | 01/28/201 |
| 3.2 | Amended and Restated By-Laws of McMoRan as amended effective through February 1, 2010 | | 8-K | 001-07791 | 02/03/2010 |
| 4.1 | Form of Certificate of McMoRan Common Stock | | S-4 | 333-61171 | 10/06/1998 |
| 4.2 | Standstill Agreement dated August 5, 1999 between McMoRan and Alpine Capital, L.P., Robert W. Bruce III, Algenpar, Inc, J. Taylor Crandall, Susan C. Bruce, Keystone, Inc., Robert M. Bass, the Anne T. and Robert M. Bass Foundation, Anne T. Bass and The Robert Bruce Management Company, Inc. Defined Benefit Pension Trust | | 10-Q | 001-07791 | 11/12/1999 |
| 4.3 | Purchase Agreement dated September 30, 2004, by and among McMoRan, Merrill Lynch & Co., Merrill Lynch, Pierce, Fenner & Smith Incorporated, and J.P. Morgan Securities Inc | | 8-K | 001-07791 | 10/07/2004 |
| 4.4 | Indenture dated October 6, 2004 by and among McMoRan and the Bank of New York, as trustee | | 8-K | 001-07791 | 10/07/2004 |
| 4.5 | First Supplemental Indenture dated as of November 14, 2007, by and between McMoRan and the Bank of New York, as trustee (related to the 11.875% Senior Notes due 2014) | | 8-K | 001-07791 | 11/15/2007 |
| 4.6 | Collateral Pledge and Security Agreement dated October 6, 2004 by and among McMoRan, as pledgor, The Bank of New York, as trustee and the Bank of New York, as collateral agent | | 8-K | 001-07791 | 10/07/2004 |
| 4.7 | Registration Rights Agreement dated October 6, 2004 by and among McMoRan, as issuer and Merrill Lynch, Pierce, Fenner & Smith Incorporated, J.P. Morgan Securities Inc. and Jefferies & Company, Inc. as Initial Purchasers | | 8-K | 001-07791 | 10/07/2004 |
| 4.8 | Registration Rights Agreement dated December 30, 2010, by and among McMoRan and Plains Exploration & Production Company | | 8-K | 001-07791 | 01/04/2011 |
| 4.9 | Registration Rights Agreement (related to the 4% Convertible Senior Notes) dated December 30, 2010 by and among McMoRan and investors | | 8-K | 001-07791 | 01/04/2011 |
| 4.10 | Registration Rights Agreement (related to the 5.75% Convertible Perpetual Preferred Stock, Series 1) dated December 30, 2010 by and among McMoRan and investors | | 8-K | 001-07791 | 01/04/2011 |
| 4.11 | Registration Rights Agreement dated December 30, 2010 by and among McMoRan and Freeport-McMoRan Preferred LLC | | 8-K | 001-07791 | 01/04/2011 |
| 4.12 | Indenture dated December 30, 2010 by and among McMoRan and U.S. Bank National Association, as trustee | | 8-K | 001-07791 | 01/04/2011 |
| 10.1 | Main Pass 299 Sulphur and Salt Lease, effective May 1, 1988 | | 10-K | 001-07791 | 04/16/2002 |
| 10.2 | IMC Global/FSC Agreement dated as of March 29, 2002 among IMC Global Inc., IMC Global Phosphate Company, Phosphate Resource Partners Limited Partnership, IMC Global Phosphates MP Inc., MOXY and McMoRan | | 10-Q | 001-07791 | 08/14/2002 |
| 10.3 | Amended and Restated Services Agreement dated as of January 1, 2002 between McMoRan and FM Services Company | | 10-Q | 001-07791 | 08/14/2003 |
| 10.4 | Letter Agreement dated August 22, 2000 between Devon Energy Corporation and Freeport Sulphur | | 10-Q | 001-07791 | 10/25/2000 |
| 10.5 | Asset Purchase Agreement dated effective December 1, 1999 between SOI Finance Inc., Shell Offshore Inc. and MOXY | | 10-K | 001-07791 | 02/08/2000 |
| 10.6 | Employee Benefits Agreement by and between Freeport-McMoRan Inc. and Freeport Sulphur | | 10-K | 001-07791 | 04/16/2002 |
| 10.7 | Purchase and Sales agreement dated January 25, 2002 but effective January 1, 2002 by and between MOXY and Halliburton Energy Services, Inc | | 8-K | 001-07791 | 03/11/2002 |
| 10.8 | Purchase and Sale Agreement dated as of March 29, 2002 by and among Freeport Sulphur, McMoRan, MOXY and Gulf Sulphur Services Ltd., LLP | | 10-Q | 001-07791 | 05/10/2002 |
| 10.9 | Purchase and Sale Agreement dated May 9, 2002 by and between MOXY and El Paso Production Company | | 10-Q | 001-07791 | 08/14/2002 |
| 10.10 | Amendment to Purchase and Sale Agreement dated May 22, 2002 by and between MOXY and El Paso Production Company | | 10-Q | 001-07791 | 08/14/2002 |
| 10.11 | Master Agreement dated October 22, 2002 by and among Freeport-McMoRan Sulphur LLC, K-Mc Venture LLC, K1 USA Energy Production Corporation and McMoRan | | 10-K | 001-07791 | 03/27/2003 |
| 10.12 | Purchase and Sale Agreement dated June 20, 2007 by and between Newfield Exploration Company as Seller and McMoRan Oil & Gas LLC as Buyer effective July 1, 2007 | | 8-K | 001-07791 | 06/22/2007 |
| 10.13 | Amended and Restated Credit Agreement dated as of August 6, 2007, among McMoRan, as parent, McMoRan Oil & Gas LLC, as borrower, JPMorgan Chase Bank, N.A. Merrill Lynch Capital, a division of Merrill Lynch Business Financial Services, Inc., as syndication agent, BNP Paribas, as documentation agent, and the lenders party thereto | | 10-Q | 001-07791 | 11/01/2007 |
| 10.14 | First Amendment to Credit Agreement dated as of June 20, 2008, among McMoRan, as borrower, JPMorgan Chase Bank, N.A., as administrative agent, and the lenders party thereto | | 10-Q | 001-07791 | 08/07/2008 |
| 10.15 | Second Amendment to Credit Agreement dated as of September 10, 2008, among McMoRan, as borrower, JPMorgan Chase Bank, N.A., as administrative agent, and the lenders party thereto | | 10-Q | 001-07791 | 11/06/2008 |
| 10.16 | Third Amendment to Credit Agreement dated as of April 17, 2009, among McMoRan, as borrower, JPMorgan Chase Bank, N.A., as administrative agent, and the lenders party thereto | | 10-Q | 001-07791 | 05/11/2009 |
| 10.17 | Fourth Amendment to Credit Agreement dated as of February 2, 2010, among McMoRan, as borrower, JPMorgan Chase Bank, N.A., as administrative agent, and the lenders party thereto | | 10-K | 001-07791 | 03/12/2010 |
| 10.18 | Fifth Amendment to Credit Agreement dated as of April 6, 2010, among McMoRan, as borrower, JPMorgan Chase Bank, N.A., as administrative agent, and the lenders party thereto | | 10-Q | 001-07791 | 05/10/2010 |
| 10.19 | Underwriting Agreement dated June 16, 2009 between McMoRan and J.P. Morgan Securities Inc., as representative of the several underwriters names in Schedule 1 thereto | | 8-K | 001-07791 | 06/19/2009 |
| 10.20 | Underwriting Agreement dated June 16, 2009 between McMoRan and J.P. Morgan Securities Inc., as representative of the several underwriters names in Schedule 1 thereto | | 8-K | 001-07791 | 06/19/2009 |
| 10.21 | Stock Purchase Agreement dated September 19, 2010 by and among McMoRan, Freeport-McMoRan Preferred LLC and Freeport-McMoRan Copper & Gold Inc. | | 10-Q | 001-07791 | 11/09/2010 |
| 10.22 | Stockholder Agreement dated December 30, 2010, by and among McMoRan and Plains Exploration & Production Company | | 8-K | 001-07791 | 01/04/2011 |
| 10.23 | Stockholder Agreement dated December 30, 2010, by and among McMoRan, Freeport-McMoRan Copper & Gold Inc. and Freeport-McMoRan Preferred LLC | | 8-K | 001-07791 | 01/04/2011 |
| 10.24 | Form of 4% Convertible Senior Notes Securities Purchase Agreement dated September 16, 2010, by investors and accepted by McMoRan | | 10-Q | 001-07791 | 11/09/2010 |
| 10.25 | Form of 5.75% Convertible Perpetual Preferred Stock Securities Purchase Agreement dated September 16, 2010, by investors and accepted by McMoRan | | 10-Q | 001-07791 | 11/09/2010 |
| 10.26* | McMoRan 1998 Stock Option Plan, as amended and restated | | 10-Q | 001-07791 | 05/10/2007 |
| 10.27* | McMoRan 1998 Stock Option Plan for Non-Employee Directors | | 10-Q | 001-07791 | 05/10/2007 |
| 10.28* | McMoRan Form of Notice of Grant of Nonqualified Stock Options under the 1998 Stock Option Plan | | 10-Q | 001-07791 | 08/04/2005 |
| 10.29* | McMoRan 2000 Stock Incentive Plan, as amended and restated | | 10-Q | 001-07791 | 05/10/2007 |
| 10.30* | McMoRan Form of Notice of Grant of Nonqualified Stock Options under the 2000 Stock Incentive Plan | | 10-Q | 001-07791 | 08/04/2005 |
| 10.31* | McMoRan 2001 Stock Incentive Plan, as amended and restated | | 10-Q | 001-07791 | 05/10/2007 |
| 10.32* | McMoRan 2003 Stock Incentive Plan, as amended and restated | | 10-Q | 001-07791 | 05/10/2007 |
| 10.33* | McMoRan’s Performance Incentive Awards Program as amended December 1, 2008 | | 10-K | 001-07791 | 02/27/2009 |
| 10.34* | McMoRan Form of Notice of Grant of Nonqualified Stock Options under the 2001 Stock Incentive Plan | | 10-Q | 001-07791 | 08/04/2005 |
| 10.35* | McMoRan Form of Restricted Stock Unit Agreement Under the 2001 Stock Incentive Plan | | 10-Q | 001-07791 | 08/09/2007 |
| 10.36* | McMoRan Executive Services Program, as amended May 4, 2009 | | 10-K | 001-07791 | 03/12/2010 |
| 10.37* | McMoRan Form of Notice of Grants of Nonqualified Stock Options under the 2003 Stock Incentive Plan | | 10-Q | 001-07791 | 08/04/2005 |
| 10.38* | McMoRan Form of Restricted Stock Unit Agreement Under the 2003 Stock Incentive Plan | | 10-Q | 001-07791 | 08/09/2007 |
| 10.39* | McMoRan 2004 Director Compensation Plan, as amended and restated | | 10-Q | 001-07791 | 08/09/2010 |
| 10.40* | Form of Amendment No. 1 to Notice of Grant of Nonqualified Stock Options under the 2004 Director Compensation Plan | | 8-K | 001-07791 | 05/05/2006 |
| 10.41* | Amended and Restated Agreement for Consulting Services between FM Services Company and B.M. Rankin, Jr. effective as of January 1, 2010 | | 10-K | 001-07791 | 03/12/2010 |
| 10.42* | McMoRan Director Compensation | | 10-Q | 001-07791 | 05/11/2009 |
| 10.43* | McMoRan 2005 Stock Incentive Plan | | 10-Q | 001-07791 | 05/10/2007 |
| 10.44* | Form of Notice of Grant of Nonqualified Stock Options under the 2005 Stock Incentive Plan | | 8-K | 001-07791 | 05/06/2005 |
| 10.45* | Form of Restricted Stock Unit Agreement under the 2005 Stock Incentive Plan | | 10-Q | 001-07791 | 08/09/2007 |
| 10.46* | McMoRan Supplemental Executive Capital Accumulation Plan | | 10-Q | 001-07791 | 05/08/2008 |
| 10.47* | McMoRan Supplemental Executive Capital Accumulation Plan Amendment One | | 10-Q | 001-07791 | 05/08/2008 |
| 10.48* | McMoRan Supplemental Executive Capital Accumulation Plan Amendment Two | | 10-K | 001-07791 | 02/27/2009 |
| 10.49* | McMoRan 2005 Supplemental Executive Capital Accumulation Plan | | 10-K | 001-07791 | 02/27/2009 |
| 10.50* | McMoRan 2005 Supplemental Executive Capital Accumulation Plan Amendment One | | 10-Q | 001-07791 | 05/10/2010 |
| 10.51* | McMoRan Amended and Restated 2008 Stock Incentive Plan | | 8-K | 001-07791 | 05/04/2010 |
| Form of Notice of Grant of Nonqualified Stock Options under the 2008, 2005, 2003 and 2001 Stock Incentive Plans (adopted February 2011). | X | | | |
| Form of Restricted Stock Unit Agreement under the 2008, 2005, 2003 and 2001 Stock Incentive Plans (adopted February 2011) | X | | | |
| 10.54* | Form of Notice of Grant of Nonqualified Stock Options and Restricted Stock Units under the 2008 Stock Incentive Plan (for grants made to non-management directors and advisory directors). | | 8-K | 001-07791 | 06/11/2008 |
| 10.55* | McMoRan Severance Plan. | | 10-K | 001-07791 | 02/27/2009 |
| 10.56* | Letter Agreement between Nancy Parmelee and FM Services Company (partially allocated to McMoRan) | | 10-K | 001-07791 | 03/12/2010 |
| Computation of Ratio of Earnings to Fixed Charges | X | | | |
| 14.1 | Ethics and Business Conduct Policy | | 10-K | 001-07791 | 03/15/2004 |
| List of subsidiaries | X | | | |
| Consent of Ernst & Young LLP | X | | | |
| Consent of Ryder Scott Company, L.P. | X | | | |
| Certified Resolution of the Board of Directors of McMoRan authorizing this report to be signed on behalf of any officer or director pursuant to a Power of Attorney. | X | | | |
| Powers of Attorney pursuant to which this report has been signed on behalf of certain officers and directors of McMoRan. | X | | | |
| Certification of Principal Executive Officer pursuant to Rule 13a–14(a)/15d-14(a) | X | | | |
| Certification of Principal Financial Officer pursuant to Rule 13a–14(a)/15d-14(a) | X | | | |
| Certification of Principal Executive Officer pursuant to 18 U.S.C. Section 1350 | X | | | |
| Certification of Principal Financial Officer pursuant to 18 U.S.C. Section 1350 | X | | | |
| Report of Ryder Scott Company, L.P. | X | | | |
–––––––––––––––––––––––––
* Indicates management contract or compensatory plan or agreement.