| UNITED STATES |
| SECURITIES AND EXCHANGE COMMISSION |
| Washington, D.C. 20549 |
| |
| FORM 10-K |
| (Mark One) |
| [X] ANNUAL REPORT PURSUANT TO SECTION 13 OR 15(d) OF THE SECURITIES EXCHANGE ACT OF 1934 |
| For the fiscal year ended December 31, 2008 |
| OR |
| [ ] TRANSITION REPORT PURSUANT TO SECTION 13 OR 15(d) OF THE SECURITIES EXCHANGE ACT OF 1934 |
| For the transition period from | | to |
| Commission File Number: 001-07791 |
|
| McMoRan Exploration Co. |
| (Exact name of registrant as specified in its charter) |
| Delaware | 72-1424200 | |
(State or other jurisdiction of incorporation or organization) | (IRS Employer Identification No.) | |
| | | |
| 1615 Poydras Street | | |
| New Orleans, Louisiana | 70112 | |
| (Address of principal executive offices) | (Zip Code) | |
| | |
| (504) 582-4000 | |
| (Registrant's telephone number, including area code) | |
| | |
| Securities registered pursuant to Section 12(b) of the Act: | |
| Title of each class | | Name of each exchange on which registered |
| Common Stock, par value $0.01 per share | | New York Stock Exchange |
| 6.75% Mandatory Convertible Preferred Stock | | New York Stock Exchange |
Securities registered pursuant to Section 12(g) of the Act: None
Indicate by check mark if the registrant is a well-known seasoned issuer, as defined in Rule 405 of the Securities Act
0 Yes SNo
Indicate by check mark if the registrant is not required to file reports pursuant to Section 13 or Section 15(d) of the Act.
0 Yes SNo
Indicate by check mark whether the registrant (1) has filed all reports required to be filed by Section 13 or 15(d) of the Securities Exchange Act of 1934 during the preceding 12 months (or for such shorter period that the registrant was required to file such reports), and (2) has been subject to such filing requirements for the past 90 days. S Yes 0 No
Indicate by check mark if disclosure of delinquent filers pursuant to Item 405 of Regulation S-K (§229.405 of this chapter) is not contained herein, and will not be contained, to the best of the registrant’s knowledge, in definitive proxy or information statements incorporated by reference in Part III of this Form 10-K or any amendment to this Form 10-K. 0
Indicate by check mark whether the registrant is a large accelerated filer, an accelerated filer, a non-accelerated filer, or a smaller reporting company. See definitions of “accelerated filer,” “large accelerated filer” and “smaller reporting company” in Rule 12b-2 of the Exchange Act (Check one):
S Large accelerated filer 0 Accelerated filer 0 Non-accelerated filer (Do not check if a smaller reporting company) 0 Smaller reporting company
Indicate by check mark whether the registrant is a shell company (as defined in Rule 12b-2 of the Exchange Act). 0 Yes S No
The aggregate market value of classes of common stock held by non-affiliates of the registrant was approximately $416.4 million on January 31, 2009, and approximately $1.316 billion on June 30, 2008.
On January 31, 2009, there were issued and outstanding 70,475,267 shares of the registrant’s Common Stock and on June 30, 2008, there were issued and outstanding 60,751,259 shares.
DOCUMENTS INCORPORATED BY REFERENCE
Portions of our Proxy Statement for our 2009 Annual Meeting to be held on June 11, 2009 are incorporated by reference into Part III (Items 10, 11, 12, 13 and 14) of this report. |
McMoRan Exploration Co.
Annual Report on Form 10-K for
the Fiscal Year ended December 31, 2008
|
| | |
| | Page |
| |
| 1 |
| 11 |
| 20 |
| 20 |
| 21 |
| 21 |
| | |
| |
| 22 |
| 24 |
| |
| 26 |
| 44 |
| 91 |
| 91 |
| 92 |
| | |
| |
| 92 |
| 92 |
| |
| 92 |
| 92 |
| 92 |
| | |
| |
| | |
| 92 |
| | |
| 92 |
| | |
| S-1 |
| | |
| E-1 |
Except as otherwise described herein or the context otherwise requires, all references to “McMoRan,” “MMR,” “we,” “us,” and “our” in this Form 10-K refer to McMoRan Exploration Co. and all entities owned or controlled by McMoRan Exploration Co.
All of our periodic report filings with the Securities and Exchange Commission (SEC) pursuant to Section 13(a) or 15(d) of the Securities Exchange Act of 1934, as amended, are available, free of charge, through our website located at www.mcmoran.com, including our annual reports on Form 10-K, quarterly reports on Form 10-Q, and current reports on Form 8-K, and any amendments to those reports. These reports and amendments are available through our website as soon as reasonably practicable after we electronically file or furnish such materials with the SEC. All references to Notes in this report refer to the Notes to the Consolidated Financial Statements located in Item 8. of this Form 10-K. We have also provided a glossary of definitions for some of the oil and gas industry terms we use in this Form 10-K beginning on page 92.
BUSINESS
We engage in the exploration, development and production of oil and natural gas offshore in the Gulf of Mexico and onshore in the Gulf Coast area. We have one of the largest acreage positions in the shallow waters of these areas, which are our regions of focus. Our focused strategy enables us to capitalize on both our geological, engineering, and production strengths and our more than 35 years of operating experience in this region. We also believe that the scale of our operations in the Gulf of Mexico allows us to realize certain operating synergies and provides a strong platform from which to pursue our business strategy. Our oil and gas operations are conducted through McMoRan Oil & Gas LLC (MOXY), our principal operating subsidiary. Separate from our oil and gas operations, we are continuing efforts to implement a successful plan to develop the Main Pass Energy Hubtm (MPEHtm), multifaceted energy services project, that would include the potential development of a liquefied natural gas (LNG) regasification and storage facility through our wholly owned subsidiary, Freeport-McMoRan Energy LLC (Freeport Energy) (see “Main Pass Energy Hubtm Project” below).
We conduct substantially all of our operations in the shallow waters of the Gulf of Mexico, commonly referred to as the “shelf,” and onshore in the Gulf Coast region. We believe that we have significant exploration opportunities in large, deep geologic structures commonly referred to as “deep gas” or the “deep shelf” (prospects with drilling depths between 15,000 feet to 25,000 feet) that are located beneath the shallow waters of the Gulf of Mexico shelf. These structures often lie beneath shallow reservoirs where significant reserves have already been produced. Our previously disclosed 2007 oil and gas property acquisition increased our deep gas exploration potential, provided access to new “ultra deep” exploration opportunities (prospects with total drilling depths in excess of 25,000 feet) and established us as a significant producer on the “traditional shelf” (prospects located at drilling depths not exceeding 15,000 feet) of the Gulf of Mexico. Additionally, the proximity of our shelf prospects to existing oil and gas infrastructure generally lowers development costs and the time needed to bring production on-line.
We also have significant expertise in various exploration and production technologies, including the incorporation of 3-D seismic interpretation capabilities with traditional structural geological techniques, offshore drilling to significant total depths and horizontal drilling. We employ 77 oil and gas technical professionals, including geophysicists, geologists, petroleum engineers, production and reservoir engineers and technical professionals, most of whom have considerable experience in their respective fields. We also own or have rights to an extensive seismic database, including 3-D seismic data on substantially all of our acreage. We leverage our in-house expertise and advanced technological capabilities to benefit our operations and identify high potential drilling prospects in the Gulf of Mexico. We continue to focus on enhancing reserve and production growth in the Gulf of Mexico by applying these technologies.
Our experience and recognition as an industry leader in drilling deep gas wells in the Gulf of Mexico also provides us with opportunities to partner with other established oil and gas companies. These partnerships, which typically involve the exploration of our identified prospects or prospects that are brought to us by third parties, allow us to diversify our risks and better manage costs.
We intend to continue to focus on pursuing opportunities presented by our expanded asset base created through our 2007 oil and gas property acquisition. We will be responsive to current weak economic conditions and unfavorable commodity price levels by prudently managing our capital spending as we continue to seek to build asset values through our focused drilling program. For 2009, we have allocated approximately 40 percent of our planned capital expenditures for development activities, and we intend to continue to allocate a significant portion of our total capital expenditures to future development activities.
Our exploration strategy, which we refer to as the “deeper pool concept,” involves exploring prospects that lie beneath shallower intervals on the Deep Miocene geologic trend that have had significant past production. We believe our techniques for identifying reservoirs using structural geology augmented by 3-D seismic data will enable us to identify and exploit additional “deeper pool” prospects at drilling depths exceeding 15,000 feet.
We use our expertise and a rigorous analytical process in conducting our exploration and development activities. While implementing our drilling plans, we focus on:
| | • | allocating investment capital based on the potential risk and reward for each exploratory and developmental opportunity; |
| | • | utilizing advanced seismic applications in combination with traditional analysis; |
| | • | employing professionals with geophysical and geological expertise; |
| | • | using new technology applications in drilling and completion practices; and |
| | • | increasing the efficiency of our production practices; |
PROPERTIES
Oil and Gas Reserves. Our estimated proved oil and natural gas reserves at December 31, 2008 totaled 344.8 Bcfe, of which 70 percent represented natural gas reserves. All of our proved reserve estimates were prepared by Ryder Scott Company, L.P., an independent petroleum engineering firm, in accordance with the rules and regulations required by the SEC.
Our estimated proved reserves as of December 31, 2008 are summarized in the table below:
| | Gas | | Oil and condensate | | Total |
| | (MMcf) | | (MBbls) | | (Bcfe) |
| Proved developed: | | | | | | | | |
| Producing | | 69,415 | | | 5,168 | | | 100.4 |
| Non-producing | | 109,954 | | | 9,057 | | | 164.3 |
| Shut-in | | 19,241 | | | 815 | | | 24.1 |
| Total proved developed | | 198,610 | | | 15,040 | | | 288.8 |
| Proved undeveloped | | 44,287 | | | 1,950 | | | 56.0 |
| Total proved reserves | | 242,897 | | | 16,990 | | | 344.8 |
The following table presents the present value of estimated future net cash flows before income taxes from the production and sale of our estimated proved reserves as of December 31, 2008 (in thousands).
| | Proved Reserves |
| | Developed | | Undeveloped | | Total |
| Estimated undiscounted future net cash flows before | | | | | | | | |
| income taxes | $ | 804,776 | | $ | 148,177 | | $ | 952,953 |
| Present value of estimated future net cash flows before | | | | | | | | |
income taxes a | $ | 613,823 | | $ | 94,248 | | $ | 708,071 |
| a. | Calculated based on the prices and costs prevailing at December 31, 2008 and using a 10 percent per annum discount rate as required by the SEC. The weighted average price for all our properties with proved reserves was $40.27 per barrel of oil and $6.09 per Mcf of natural gas at December 31, 2008. |
Production, Unit Prices and Costs. Average daily production from our properties, net to our interests, approximated 245 MMcfe/d in 2008, 152 MMcfe/d in 2007 and 65 MMcfe/d in 2006. Hurricanes Gustav and Ike, which made landfall on the Louisiana and Texas coasts on September 1, 2008 and September 13, 2008, respectively had an impact on our Gulf of Mexico operations. While there was no significant damage to our properties resulting from Hurricane Gustav, several platforms, comprising approximately three percent of production and two percent of reserves, had significant structural damage from Hurricane Ike. Current production approximates 210 MMcfe/d with an estimated additional 55 MMcfe/d constrained by outages at third party facilities which is expected to be restored by mid-year 2009.
The following table shows production volumes, average sales prices and average production (lifting) costs for our oil and natural gas sales for each period indicated. The relationship between our sales prices and production (lifting) costs depicted in the table is not necessarily indicative of our present or future results of operations.
| | | Years Ended December 31, | |
| | | 2008 | | 2007 | | 2006 | |
| Net natural gas production (Mcf) | | 59,886,900 | | 38,994,000 | | 14,545,600 | |
| Net crude oil and condensate production, excluding Main | | | | | | | |
| Pass 299(Bbls) | | 3,072,000 | | 1,821,900 | | 600,300 | |
| Net crude oil production from Main Pass 299 (Bbls) | | 561,400 | | 564,000 | | 775,500 | |
| Net plant product production (per Mcf equivalent) | | 8,004,400 | | 2,153,000 | | 1,072,200 | |
| Sales prices: | | | | | | | |
| Natural gas (per Mcf) | | $ 9.96 | | $ 7.01 | | $ 7.05 | |
| Crude oil and condensate, including Main Pass 299 (per | | | | | | | |
| Bbl) | | 104.00 | | 76.55 | | 60.55 | |
Production (lifting) costs: a | | | | | | | |
Per barrel for Main Pass b | | $69.29 | | $44.17 | | $35.76 | |
Per Mcfe for other properties c | | 2.56 | | 1.88 | | 1.34 | |
| a. | Production costs exclude all depletion, depreciation and amortization expense. The components of production costs may vary substantially among wells depending on the production characteristics of the particular producing formation, method of recovery employed, and other factors. Production costs include charges under transportation agreements as well as all lease operating expenses including well insurance costs. |
| b. | Production costs for Main Pass 299 included workover expenses of approximately $17.0 million, $30.22 per barrel in 2008, $1.8 million, $3.17 per barrel in 2007 and $3.6 million, $4.72 per barrel in 2006. |
| c. | Production costs were converted to an Mcf equivalent on the basis of one barrel of oil being equivalent to six Mcf of natural gas. Production costs included workover expenses totaling $45.8 million or $0.53 per Mcfe in 2008, $19.7 million or $0.38 per Mcfe in 2007 and $4.5 million or $0.23 per Mcfe in 2006. |
Acreage. As of December 31, 2008, we owned or controlled interests in 380 oil and gas leases in the Gulf of Mexico and onshore Louisiana and Texas covering 1.22 million gross acres (0.59 million acres net to our interests). Our acreage position on the outer continental shelf includes 1.02 million gross acres
(0.53 million acres net to our interests). Less than 0.1 million of our net leasehold interests are scheduled to expire in 2009. We also hold potential reversionary interests in oil and gas leases that we have farmed-out or sold to other oil and gas exploration companies. Interest in these leases will partially revert to us upon the achievement of specified production thresholds or the realization of specified net production proceeds.
The following table shows the oil and gas acreage in which we held interests as of December 31, 2008. The table does not account for our gross acres associated with our farm-in, or certain other farm-out arrangements (approximately 0.10 million gross acres). For more information regarding our acreage position, see Note 3.
| | | Developed | | Undeveloped |
| | | Gross | | Net | | Gross | | Net |
| | | Acres | | Acres | | Acres | | Acres |
| Offshore (federal waters) | | 659,267 | | 379,932 | | 359,245 | | 145,944 |
| Onshore Louisiana and Texas | | 36,070 | | 18,448 | | 68,491 | | 27,565 |
| Total at December 31, 2008 | | 695,337 | | 398,380 | | 427,736 | | 173,509 |
Oil and Gas Properties. Our properties are primarily located on the outer continental shelf in the shallow waters of the Gulf of Mexico. We classify our activities based upon the drilling depth of our prospects. Our three principal classifications for Gulf of Mexico shelf prospects are traditional shelf, deep shelf and ultra deep shelf. Prospects located at drilling depths not exceeding 15,000 feet are considered to be traditional shelf prospects. Prospects with drilling depths exceeding 15,000 feet but not exceeding 25,000 feet are considered deep shelf prospects. Any prospect located at drilling depths exceeding 25,000 feet is considered to be an ultra deep shelf prospect. Since 2004, we have focused our exploration activities almost exclusively on deep shelf prospects, and generally on those prospects located beneath shallow reservoirs where significant reserves have already been produced.
In addition to our Gulf of Mexico shelf properties, we also have property interests onshore and in the state waters of Louisiana and Texas and three deepwater properties in the Gulf of Mexico. The deepwater properties involve prospects located in water depths exceeding 1,000 feet.
The following table identifies our top ten producing properties as of December 31, 2008.
| | | Net | | | | |
| | Working | Revenue | Water | Production a |
| | Interest | Interest | Depth | Gross | | Net |
| | (%) | (%) | (feet) | (MMcfe/d) |
| Deep Shelf: | | | | | | |
| South Marsh Island Block 212 | | | | | | |
”Flatrock” b | 25.0 | 18.8 | 10 | 164 | | 31 |
| St. Mary Parish, LA | | | | | | |
“Laphroaig” c | 37.3 | 28.5 | <10 | 37 | | 11 |
| Louisiana State Lease 18090 | | | | | | |
“Long Point” b | 37.5 | 26.7 | 8 | 28 | | 8 |
| Onshore Vermilion Parish, LA | | | | | | |
“Liberty Canal” c | 37.5 | 27.6 | n/a d | 27 | | 7 |
| Traditional Shelf: | | | | | | |
Eugene Island Block 182 c,e, f | 66.9 | 52.8-63.6 | 91 | 21 | | 11 |
Main Pass Block 299 c | 100.0 | 83.3 | 210 | 11 | | 9 |
South Timbalier Block 193 c,e | 62.8-72.8 | 46.8-53.0 | 114 | 17 | | 8 |
| South Timbalier Block 299 | 75.0 | 62.5 | 314 | 12 | | 8 |
South Pelto Block 9 f | 33.3 | 34.3 | 35 | 24 | | 7 |
Grand Isle Block 3 c | 50.0 | 36.5 | 12 | 16 | | 6 |
| a. | Reflects average daily production rates for the fourth quarter of 2008. |
| b. | We were operator for drilling exploratory wells at these prospects. We relinquished being operator following successful completion of the related wells. |
| d. | Prospect is located onshore in Vermilion Parish, Louisiana. |
| e. | This property has multiple wells with varying ownership interests. Interests reflected in this table are approximate average working interest and net revenue interest for the field. |
| f. | Well is eligible for deep gas royalty relief under current MMS guidelines which exempt from U.S. government royalties production of as much as the first 25 Bcf from a depth of 18,000 feet or greater, and as much as 15 Bcf from depths between 15,000 and 18,000 feet, with gas production from all qualified wells on a lease counting towards the volume eligible for royalty relief. The exact amount of royalty relief depends on eligibility criteria, which include the well depth, nature of the well, and the timing of drilling and production. In addition, these guidelines include price threshold provisions that discontinue royalty relief if natural gas prices exceed a specified level. The price threshold was not exceeded for the years ended December 31, 2008, 2007 or 2006. |
Ultra Deep Shelf. We currently have no production from our ultra-deep shelf properties which includes interests in leases associated with the Treasure Island and Treasure Bay ultra-deep gas prospect inventory. This ultra-deep prospect inventory currently consists of 45 lease blocks. We have been designated operator of the South Timbalier Block 168 No. 1 prospect, which is located at South Timbalier Block 168 in 70 feet of water (see “Oil and Gas Activities—Discoveries and Development Activities—South Timbalier Block 168 No. 1” below). We currently hold an approximate 32.3 percent working interest in this well but are in discussions with third parties to participate in this prospect, the results of which we expect would decrease our current working interest. We continue to work towards identifying “deeper pool” exploration prospects on this ultra deep shelf acreage position.
Oil and Gas Activities.
Discoveries and Development Activities.
Flatrock. Following the initial discovery at Flatrock on South Marsh Island Block 212 in the OCS 310/Louisiana State Lease 340 area in approximately 10 feet of water, we have drilled five successful wells in this field.
The following is a report on current activities in the Flatrock area:
| Flatrock Wells | Total Pay Intervals | Net Feet of Pay a | Status b |
No. 1 (#228) Discovery Well | 8 | 260 | Producing from the Operc section |
| | | | |
No. 2 (#229) Delineation Well | 8 | 289 | Producing from the primary Rob-L sand |
| | | | |
No. 3 (#230) Delineation Well | 8 | 256 | Producing from the Operc section |
| | | | |
No. 4 (#231) Development Well | 2 | 116 | Producing from the primary Rob-L sand |
| | | | |
No. 5 (#232) Development Well | 8 | 155 | Completing in Operc section; first production expected in first half 2009 |
| | | | |
No. 6 (#233) Delineation Well | 2 | 40 | Drilling; targeting deeper Operc and possibly penetrate the upper Gyro sands |
| a. | Confirmed with wireline logs. |
| b. | Status is reported as of February 25, 2009. |
Four wells are currently producing at a gross rate of 220 MMcfe/d (41 MMcfe/d net to us). Per well rates will vary depending on the porosity, permeability, pressures and hydrocarbon column of the reservoir being produced. To date, the primary Rob-L reservoir has achieved the highest gross production rate in the field of over 100 MMcfe/d. The No. 4 well is currently producing at a gross rate of 95 MMcfe/d (17 MMcfe/d net to us).
The No. 5 development well logged 155 net feet of pay in the Rob-L and Operc sections. The well is being completed in the Operc section with first production expected in the first half of 2009. The Flatrock No. 6 delineation well on South Marsh Island Block 217 commenced drilling on October 28, 2008 and is currently drilling below 19,300 feet towards a total depth of 19,700 feet to evaluate the Operc and possibly penetrate the upper Gyro sand sections. In January 2009, wireline logs logged 40 net feet of pay in the Rob-L sand section of the No. 6 well.
Tom Sauk. The Tom Sauk deep gas exploratory prospect on Louisiana State Lease 340 commenced drilling on August 14, 2008 and is drilling below 20,100 feet. The well has been permitted to 21,000 feet. Tom Sauk, which is located in less than 10 feet of water, is a deep gas prospect that lies below the significant historical shallow production at Mound Point. We hold an 18.3 percent working interest and a 14.5 percent net revenue interest in the well. Our investment in Tom Sauk totaled $6.3 million at December 31, 2008.
Ammazzo. The Ammazzo deep gas exploratory prospect on South Marsh Island Block 251 in 25 feet of water commenced drilling on November 22, 2008 and is drilling below 12,200 feet towards a proposed total depth of 24,500 feet. The Ammazzo prospect is targeting one of the largest undrilled deep structures below 15,000 feet on the Shelf of the Gulf of Mexico. It is positioned on the southern portion of the structural ridge extending from the Flatrock and JB Mountain discoveries (located approximately 16 and 11 miles north-northwest, respectively), where we have successfully dilled to productive Rob-L, Operc and Gryo sands in the Middle Miocene. We operate the well and hold a 25.9 percent working interest and a 21.1 percent net revenue interest.
South Timbalier Block 168 No. 1. We and our partners are working on the design for the anticipated completion and production test of the South Timbalier Block 168 No. 1 ultra-deep exploratory well (formerly known as Blackbeard West No. 1). This well was drilled to a total depth of 32,997 feet in October 2008 and logs indicated four potential hydrocarbon bearing zones below 30,067 feet that require further evaluation. The well has been temporarily abandoned while the necessary long-lead time completion equipment is being designed and procured for this anticipated high pressure test.
The well is located on the top of the targeted structure. Seismic data on the prospect has indicated the potential for significantly thicker sands on the flanks of the structure as confirmed in recent major deepwater discoveries. We will continue to review additional drilling opportunities on the flanks of the structure and on other acreage we hold in the ultra-deep trend.
South Timbalier Block 168 is located in 70 feet of water approximately 115 miles southwest of New Orleans. We operate the well, which is the deepest well ever drilled below the mud line in the Gulf of Mexico. We have a 32.3 percent working interest (after casing point) and a 26.3 percent net revenue interest in the South Timbalier Block 168 No. 1 wellbore. Our investment in South Timbalier Block 168 totaled $32.1 million at December 31, 2008.
Cordage. The Cordage deep gas prospect on West Cameron Block 207 is expected to commence drilling in March 2009. The well has a proposed total depth of 19,500 feet and is located in 50 feet of water. We currently hold a 50 percent working interest and a 40.7 percent net revenue interest in the well.
Gladstone East. Following the release of our unaudited fourth quarter 2008 results on January 21, 2009, the drilling results for the Gladstone East deep gas exploratory prospect on Louisiana State Lease 340 were evaluated and deemed to be nonproductive. As a result, the well is being plugged and abandoned. We charged $5.4 million of costs incurred for drilling the well through December 31, 2008 to exploration expense in our fourth quarter 2008 results. Our first quarter 2009 exploration expense will include approximately $5.3 million in costs incurred since December 31, 2008.
Exploratory and Development Drilling. The following table shows the gross and net number of productive, dry, in-progress and total exploratory and development wells that we drilled in each of the periods presented.
| | | 2008 | | 2007 | | 2006 | |
| | | Gross | | Net | | Gross | | Net | | Gross | | Net | |
| Exploratory | | | | | | | | | | | | | |
| Productive | | 2 | | 0.500 | | 4 | | 1.150 | | 6 | | 2.375 | |
| Dry | | 3 | | 1.095 | | 1 | | 0.150 | | 4 | | 1.185 | a |
| In-progress | | 7 | | 2.188 | | 5 | | 1.673 | | 4 | | 1.808 | |
| Total | | 12 | | 3.783 | | 10 | | 2.973 | | 14 | | 5.368 | |
| | | | | | | | | | | | | | |
| Development | | | | | | | | | | | | | |
| Productive | | 3 | | 1.000 | | - | | - | | 7 | | 2.613 | |
| Dry | | 1 | | 0.500 | | 1 | | 0.250 | | - | | - | |
In-progress b | | 2 | | 1.091 | | 2 | | 1.091 | | 2 | | 0.854 | |
| Total | | 6 | | 2.591 | | 3 | | 1.341 | | 9 | | 3.467 | |
| a. | Includes the exploratory well at Grand Isle Block 18 (0.26 net) that was determined to be nonproductive in early January 2007. |
| b. | Includes the program’s 0.304 net interest in the Mound Point Offset No. 2 well (increased to 0.541 net interest for 2007) and 0.550 net interest in the JB Mountain No. 3, which have been temporarily abandoned. |
Productive Well Interests. The following table shows our interest in productive oil and natural gas wells as of December 31, 2008. For purposes of this table “productive wells” are defined as wells producing hydrocarbons and wells “capable of production” (for example, wells waiting for pipeline connections or wells waiting to be connected to currently installed production facilities). This table does not include (1) exploratory and development wells which have located commercial quantities of oil and natural gas but which are not capable of commercial production without installation of production facilities, or (2) wells that are shut-in and require a recompletion or workover to resume production. “Net wells” for the purposes of this table are defined to mean wells at our net revenue interest. Eight of these wells (two gas and six oil wells) have multiple completions.
| | Gas | | Oil | |
| | Gross | | Net | | Gross | | Net | |
| Offshore | 173 | | 79.729 | | 109 | | 59.749 | |
| Onshore | 19 | | 7.122 | | 2 | | 1.289 | |
| Total | 192 | | 86.851 | | 111 | | 61.038 | |
Exploration Agreements.
Plains Exploration & Production Company (Plains). In the fourth quarter of 2006, we entered into an exploration agreement with Plains pursuant to which Plains obtained the right to participate in various exploration prospects in limited areas being explored by us. As of December 31, 2008, Plains has participated in eleven prospects under the terms of this exploration arrangement.
El Paso Farm-Out Arrangement. We have a farm-out agreement with El Paso Production Company (El Paso) which resulted in the JB Mountain and Mound Point Offset discoveries in the OCS 310 and Louisiana State Lease 340 areas, respectively. Through this arrangement, El Paso currently has rights to approximately 13,000 gross acres surrounding the JB Mountain prospect (55 percent working interest and a 38.8 percent net revenue interest) and the Mound Point Offset prospect (30.4 percent working interest and a 21.6 percent net revenue interest). El Paso retains 100 percent of the program’s interests until the aggregate production attributable to the program’s net revenue interests reaches 100 Bcfe, after which, ownership of 50 percent of the program’s working and net revenue interests would revert to us. There are three producing wells subject to the 100 Bcfe arrangement, which averaged an aggregate gross rate of approximately 17 MMcfe/d during 2008. We do not expect payout under the 100 Bcfe arrangement will occur in 2009.
MAIN PASS ENERGY HUBtm PROJECT
We continue to pursue a multifaceted energy services development of the MPEH™, including the potential development of a liquefied natural gas (LNG) re-gasification and storage facility through Freeport Energy. The MPEHtm project is located at our Main Pass facilities located offshore in the Gulf of Mexico, 38 miles east of Venice, Louisiana.
The Maritime Administration (MARAD) has approved our license application for the MPEHtm project, subject to various terms, criteria and conditions contained in its Record of Decision, including demonstration of financial responsibility, compliance with applicable laws and regulations, environmental monitoring and other customary conditions. The MPEHtm facility is approved with a capacity of regasifying LNG at a peak rate of 1.6 Bcf per day, producing and shipping natural gas liquids, storing 28 Bcf of natural gas in salt caverns and delivering 3.1 Bcf per day of natural gas to the U.S. market, including gas from storage.
Prior to commencing construction of the facilities MPEHtm, we would be required to enter into commercial arrangements that would enable us to finance these costs. The total project investment is likely to be significant and will ultimately depend on comprehensive engineering studies, future estimated construction cost levels, project specification requirements for supply and the availability of financing. External financing in the capital markets is currently not available. We currently own 100 percent of the MPEHtm project. However, two entities have separate options to participate as passive equity investors for up to an aggregate of 25 percent of our equity interest in the project.
The ultimate outcome of our efforts to enter into commercial arrangements on reasonable terms to develop the MPEH™ project and obtain additional financing is subject to various uncertainties, many of which are beyond our control. For additional information on these and other risks, including without limitation, risks related to our reclamation obligations associated with the former assets and operations of the Main Pass facilities, see “Risk Factors” included in Item 1A. of this Form 10-K.
MARKETING
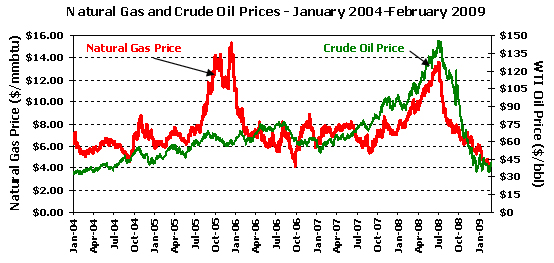
We currently sell our natural gas in the spot market at prevailing prices. Prices on the spot market fluctuate with demand and as a result of related industry variables. We generally sell our crude oil and condensate one month at a time at prevailing market prices. Oil and natural gas prices have significantly declined over the fourth quarter of 2008 from record levels earlier in 2008 and we are unable to predict the duration of this trend. We have entered, and may in the future enter, into transactions that fix the future prices for a portion of oil and natural gas sales volumes, through the issuance of oil and gas derivative contracts. See Note 9 for information regarding our existing oil and natural gas derivative contracts.
REGULATION
General. Our exploration, development and production activities are subject to federal, state and local laws and regulations governing exploration, development, production, environmental matters, occupational health and safety, taxes, labor standards and other matters. All material licenses, permits and other authorizations currently required for our operations have been obtained or timely applied for. Compliance is often burdensome, and failure to comply carries substantial penalties. The regulatory burden on the oil and gas industry increases the cost of doing business and affects profitability. For additional information related to the risks associated with the regulation of our oil and gas activities, see “Risk Factors” included in Item 1A. of this Form 10-K.
Exploration, Production and Development. Among other things, the federal and state level regulation of our operations mandate that operators obtain permits to drill wells and to meet bonding and insurance requirements in order to drill, own or operate wells. These regulations also control the location of wells, the method of drilling and casing wells, the restoration of properties upon which wells are drilled and the plugging and abandoning of wells. Our oil and gas operations are also subject to various conservation laws and regulations, which regulate the size of drilling units, the number of wells that may be drilled in a given area, the levels of production, and the unitization or pooling of oil and gas properties.
Federal leases. As of December 31, 2008, we have interests in 240 offshore leases located in federal waters on the Gulf of Mexico’s outer continental shelf. Federal offshore leases are administered by the MMS. These leases were issued through competitive bidding, contain relatively standard terms and require compliance with detailed MMS regulations and the Outer Continental Shelf Lands Act, which are subject to interpretation and change by the MMS. Lessees must obtain MMS approval for exploration, development and production plans prior to the commencement of offshore operations. In addition, approvals and permits are required from other agencies such as the U.S. Coast Guard, the Army Corps of Engineers and the Environmental Protection Agency. The MMS has regulations requiring offshore production facilities and pipelines located on the outer continental shelf to meet stringent engineering and construction specifications, and has proposed and/or promulgated additional safety-related regulations concerning the design and operating procedures of these facilities and pipelines. MMS regulations also restrict the flaring or venting of natural gas and prohibit the flaring of liquid hydrocarbons and oil without prior authorization.
The MMS has regulations governing the plugging and abandonment of wells located offshore and the installation and removal of all fixed drilling and production facilities. The MMS generally requires that lessees have substantial net worth or post supplemental bonds or other acceptable assurances that the obligations will be met. The cost of these bonds or other surety can be substantial, and there is no assurance that supplemental bonds or other surety can be obtained in all cases. We are currently satisfying the supplemental bonding requirements of the MMS by providing financial assurances from MOXY. We and our subsidiaries’ ongoing compliance with applicable MMS requirements will be subject to meeting certain financial and other criteria. Under some circumstances, the MMS could require any of our operations on federal leases to be suspended or terminated. Any suspension or termination of our operations for a prolonged duration would likely have a material adverse affect on our financial condition and results of operations.
State and Local Regulation of Drilling and Production. We own interests in properties located in state waters of the Gulf of Mexico, offshore Louisiana and Texas. These states regulate drilling and operating activities by requiring, among other things, drilling permits and bonds and reports concerning operations. The laws of these states also govern a number of environmental and conservation matters, including the handling and disposing of waste materials, unitization and pooling of natural gas and oil properties, and the levels of production from natural gas and oil wells.
Environmental Matters. Our operations are subject to numerous laws relating to environmental protection. These laws impose substantial penalties for any pollution resulting from our operations. We believe that our operations substantially comply with applicable environmental laws. For additional information related to risks associated with these environmental laws and their impact on our operations, see “Risk Factors” included in Item 1A. of this Form 10-K.
Solid Waste. Our operations require the disposal of both hazardous and nonhazardous solid wastes that are subject to the requirements of the Federal Resource Conservation and Recovery Act and comparable state statutes. In addition, the EPA and certain states in which we currently operate are presently in the process of developing stricter disposal standards for nonhazardous waste. Changes in these standards may result in our incurring additional expenditures or operating expenses.
Hazardous Substances. The Comprehensive Environmental Response, Compensation, and Liability Act (CERCLA), also known as the “Superfund” law, imposes liability, without regard to fault or the legality of the original conduct, on some classes of persons that are considered to have contributed to the release of a “hazardous substance” into the environment. These persons include but are not limited to the owner or operator of the site or sites where the release occurred or was threatened and companies that disposed or arranged for the disposal of the hazardous substances found at the site. Persons responsible for releases of hazardous substances under CERCLA may be subject to joint and several liability for the costs of cleaning up the hazardous substances and for damages to natural resources. Despite the “petroleum exclusion” of CERCLA that encompasses wastes directly associated with crude oil and gas production, we may generate or arrange for the disposal of “hazardous substances” within the meaning of CERCLA or comparable state statutes in the course of our ordinary operations. Thus, we may be responsible under CERCLA (or the state equivalents) for costs required to clean up sites where the release of a “hazardous substance” has occurred. Also, it is not uncommon for neighboring landowners and other third parties to file claims for cleanup costs as well as personal injury and property damage
allegedly caused by the hazardous substances released into the environment. Thus, we may be subject to cost recovery and to some other claims as a result of our operations.
Air. Our operations are also subject to regulation of air emissions under the Clean Air Act, comparable state and local requirements and the Outer Continental Shelf Lands Act. The scheduled implementation of these laws could lead to the imposition of new air pollution control requirements on our operations. Therefore, we may incur future capital expenditures to upgrade our air pollution control equipment. We do not believe that our operations would be materially affected by these requirements, nor do we expect the requirements to be any more burdensome to us than to other companies our size involved in exploration and production activities.
Water. The Clean Water Act prohibits any discharge into waters of the United States except in strict conformance with permits issued by federal and state agencies. Failure to comply with the ongoing requirements of these laws or inadequate cooperation during a spill event may subject a responsible party to civil or criminal enforcement actions. Similarly, the Oil Pollution Act of 1990 imposes liability on “responsible parties” for the discharge or substantial threat of discharge of oil into navigable waters or adjoining shorelines. A “responsible party” includes the owner or operator of a facility or vessel, or the lessee or permittee of the area in which a facility is located. The Oil Pollution Act assigns liability to each responsible party for oil removal costs and a variety of public and private damages. While liability limits apply in some circumstances, a party cannot take advantage of liability limits if the spill was caused by gross negligence or willful misconduct, or resulted from violation of a federal safety, construction or operating regulation. If the party fails to report a spill or to cooperate fully in the cleanup, liability limits likewise do not apply. Even if applicable, the liability limits for offshore facilities require the responsible party to pay all removal costs, plus up to $75 million in other damages. Few defenses exist to the liability imposed by the Oil Pollution Act.
The Oil Pollution Act also requires a responsible party to submit proof of its financial responsibility to cover environmental cleanup and restoration costs that could be incurred in connection with an oil spill. As amended by the Coast Guard Authorization Act of 1996, the Oil Pollution Act requires parties responsible for offshore facilities to provide financial assurance in amounts that vary from $35 million to $150 million depending on a company’s calculation of its “worst case” oil spill. Both Freeport Energy and MOXY currently have insurance to cover its facilities’ “worst case” oil spill under the Oil Pollution Act regulations. As a result, we believe that we are in compliance with this act.
Endangered Species. Several federal laws impose regulations designed to ensure that endangered or threatened plant and animal species are not jeopardized and their critical habitats are neither destroyed nor modified by federal action. These laws may restrict our exploration, development, and production operations and impose civil or criminal penalties for noncompliance.
Safety and Health Regulations. We are also subject to laws and regulations concerning occupational safety and health. We do not currently anticipate making substantial expenditures because of occupational safety and health laws and regulations. We cannot predict how or when these laws may be changed, or the ultimate cost of compliance with any future changes. However, we do not believe that any action taken will affect us in a way that materially differs from the way it would affect other companies in our industry.
EMPLOYEES
At December 31, 2008, we had a total of 140 employees located at our New Orleans, Louisiana headquarters and our Houston, Texas and Lafayette, Louisiana offices. These employees are primarily devoted to production, regulatory, engineering, land, geological and various administrative functions. Our employees are not represented by any union or covered by a collective bargaining agreement, and we believe our relations with our employees are satisfactory.
Additionally, since January 1, 1996, numerous services necessary for our business and operations, including certain executive, technical, administrative, accounting, financial, tax and other services, have been performed by FM Services Company (FM Services) pursuant to a services agreement. FM Services is a wholly owned subsidiary of Freeport-McMoRan Copper & Gold Inc. Either party may terminate the services agreement at any time upon 90 days notice (Note 16).
We also use contract personnel to perform various professional and technical services, including but not limited to drilling, construction, well site surveillance, environmental assessment, and field and on-site production operating services. These services are intended to minimize our development and operating costs as well as allow our management staff to focus on directing our oil and gas operations.
We maintain an ethics and business conduct policy applicable to all personnel employed by or affiliated with us. Our corporate governance guidelines and our ethics and business conduct policy are available at www.mcmoran.com and are available in print upon request. We intend to post promptly on our website amendments to or waivers, if any, of our ethics and business conduct policy made with respect to any of our directors and executive officers.
This report includes "forward looking statements" within the meaning of Section 27A of the Securities Act of 1933 and Section 21E of the Securities Exchange Act of 1934, including statements about our plans, strategies, expectations, assumptions and prospects. "Forward-looking statements" are all statements other than statements of historical fact, or current facts, that address activities, events, outcomes and other matters that we plan, expect, intend, assume, believe, budget, predict, forecast, project, estimate or anticipate (or other similar expressions) will, should or may occur in the future, including, without limitation: statements regarding our financial plans; our indebtedness; acquisitions; our exploration and development plans; the potential for sulphur production operations at Main Pass Block 299; our ability to satisfy our reclamation, indemnification and environmental obligations; anticipated flow rates of producing and new wells; drilling potential and results; reserve estimates and depletion rates; general economic and business conditions; risks and hazards inherent in the production of oil and natural gas; demand and potential demand for oil and natural gas; trends in oil and natural gas prices; amounts and timing of capital expenditures and reclamation costs; and our ability to obtain necessary permits for new operations.
Forward-looking statements are based on assumptions and analyses made in light of our experience and perception of historical trends, current conditions, expected future developments and other factors we believe are appropriate under the circumstances. These statements are subject to a number of assumptions, risks and uncertainties, including the risk factors discussed below and in our other filings with the SEC, general economic and business conditions, the business opportunities that may be presented to and pursued by us, changes in laws and other factors, many of which are beyond our control. Except for our ongoing obligations under federal securities laws, we do not intend, and we undertake no obligation, to update or revise any forward-looking statements. Readers are cautioned that forward-looking statements are not guarantees of future performance and actual results and developments may differ materially from those projected in the forward-looking statements. Important factors that could cause actual results to differ materially from our expectations include, without limitation, the following:
Risks Relating to Financial Matters
Our indebtedness, the current global recession, and disruption in the domestic and global financial markets could have an adverse effect on our operating results and financial condition.
As of December 31, 2008, the outstanding principal amount of our indebtedness was approximately $374.7 million, including $300 million of senior notes issued in 2007 which are due in 2014 and $74.7 million of convertible debt due in 2011. This level of indebtedness, coupled with the widely reported domestic and global recession, the associated low levels of energy prices, and the unprecedented levels of disruption and continuing relative illiquidity in the credit markets may, if continued for an extended period, have several important and adverse consequences on our business and operations.
For example, any one or more of these factors could (i) make it difficult for us to service or refinance our existing indebtedness; (ii) increase our vulnerability to additional adverse changes in economic and industry conditions; (iii) require us to dedicate a substantial portion of our cash flow from operations and proceeds of any debt or equity issuances or asset sales to pay or provide for our indebtedness; (iv) limit our flexibility to plan for, or react to, changes in our businesses and the markets in which we operate; (v) place us at a disadvantage to our competitors that are not as highly leveraged; or
(vi) limit our ability to borrow money or raise equity to fund our working capital, capital expenditures, acquisitions, debt service requirements, investments, general corporate activity or other financing needs.
Agreements governing our indebtedness may limit our ability to respond to opportunities as they arise or execute our capital spending and related initiatives.
The terms of our amended and restated credit facility and other financing agreements governing our indebtedness restrict our ability to incur additional debt. Additionally, because the availability under our credit facility is subject to a borrowing base determined by the estimated future cash flows from our oil and natural gas reserves, we expect that the recent sharp decline in the pricing for these commodities will result in a reduction in our borrowing base, which reduction could be significant, and as a result, will reduce the capital available to us.
If future debt financing is not available to us when required (as a result of limited access to the credit markets or otherwise), or is not available on acceptable terms, we may be unable to invest needed capital for our drilling and exploration activities, take advantage of business opportunities, respond to competitive pressures or refinance maturing debt, or be forced to sell some of our assets on an untimely basis or under unfavorable terms, any of which could have a material adverse effect on our operating results and financial condition.
The credit facility contains covenants and other restrictions customary for oil and gas borrowing base credit facilities, including limitations on debt, liens, dividends, voluntary redemptions of debt, investments, asset sales and transactions with affiliates. In addition, the credit facility requires that we maintain certain financial tests, including a leverage test (Total Debt to EBITDAX, as those terms are defined in the facility, for the preceding four quarters) and a secured leverage test (First Lien Debt to EBITDAX, as those terms are defined in the facility, for the preceding four quarters), and a current ratio test (current assets to current liabilities, subject to certain adjustments as of the end of the quarter).
As crude oil and natural gas prices decrease or our exploration efforts are unsuccessful, we may be required to write down the capitalized costs of individual oil and natural gas properties.
During the fourth quarter of 2008, the market price for oil and natural gas has decreased significantly, triggering an impairment assessment that ultimately resulted in impairment charges to reduce the carrying values of several properties. Additional write-downs of the capitalized costs of individual oil and natural gas properties may occur if oil and natural gas prices further decline or if we have substantial downward adjustments to our estimated proved oil and gas reserves, increases in our estimates of development costs or nonproductive exploratory drilling results. A write-down could adversely affect our results of operations and financial condition and could adversely affect the trading prices of our securities.
We use the successful efforts accounting method. All property acquisition costs and costs of exploratory and development wells are capitalized when incurred, pending the determination of whether proved reserves are discovered. If proved reserves are not discovered within an exploratory well, the costs of drilling this well are expensed. All geological and geophysical costs on exploratory prospects are expensed as incurred.
The capitalized costs of our oil and natural gas properties, on a field-by-field basis, may exceed the estimated future net cash flows of that field. If so, we record impairment charges to reduce the capitalized costs of each such field to our estimate of the field’s fair market value. Unproved properties are evaluated at the lower of cost or fair market value. These types of charges will reduce our earnings and stockholders’ equity.
We assess our properties for impairment periodically, based on future estimates of proved and risk-adjusted probable reserves, oil and natural gas prices, production rates and operating, development and reclamation costs based on operating budget forecasts. Once incurred, an impairment charge cannot be reversed at a later date even if we experience increases in the price of oil or natural gas, or both, or increases in the amount of our estimated proved reserves.
Our ability to collect our accounts receivable depends on the continuing creditworthiness of our customers.
The majority of our accounts receivable result from oil and natural gas sales or joint interest billings to third parties in the energy industry. Our credit risk associated with these third parties may increase as we produce and sell oil and natural gas on a larger scale. Additionally, the continuation of recent economic conditions and the price of oil and natural gas may, among other things, impair our ability to timely collect our receivables from these parties, result in downgrades to the credit ratings of our customers or other third parties that do business with us, or have other adverse consequences. While we sell oil and natural gas to third parties that we believe are reasonable credit risks, there is no guaranty, especially in light of these factors, that the risk associated with the creditworthiness of these parties will not increase.
Our future revenues will be reduced as a result of agreements that we have entered into and may enter into in the future with third parties, and any financial difficulties encountered by these parties could also have an adverse affect on the exploration and development of our prospects.
We currently have agreements with third parties to support the funding of the exploration and development of certain of our properties and we may seek to enter into additional farm-out or similar arrangements with other companies in the future.
Our ownership interest in prospects subject to farm-out or other exploration arrangements revert to us only upon the achievement of a specified production threshold or the receipt by our partners and co-ventures of specified net production proceeds. Consequently, even if exploration and development of our prospects is successful, we cannot assure you that such exploration and development will result in an increase in our revenues or our proved oil and gas reserves or when such increases might occur.
Additionally, in light of the current distressed state of the credit markets and the pricing for oil and natural gas, our ability to enter into future beneficial relationships with third parties for our exploration and production activities may be limited, and as a result, may have an adverse effect on our current operational strategy and related business initiatives. Our farm-out partners and working interest co-owners may also be unwilling or unable to pay their share of the costs of projects as they become due. In the case of a farm-out partner, we would either have to find a new farm-out partner or obtain alternative funding in order to complete the exploration and development of the prospects subject to the farm-out agreement. In the case of a working interest owner, we could be required to pay the working interest owner’s share of the project costs. The degree to which these and other factors may adversely impact our partners and third-party operators (and the extent of any associated affect on us) is uncertain.
We have incurred losses from our operations in the past and may continue to do so in the future. Our failure to achieve profitability in the future could adversely affect the trading price of our securities and our ability to raise additional capital, especially in the current marketplace.
Our continuing operations incurred losses of $211.2 million in 2008, $63.6 million in 2007 and $44.7 million in 2006. No assurance can be given that we will achieve profitability or positive cash flows from our operations in the future, especially given the current state of the credit markets and pricing for oil and natural gas. Our failure to achieve profitability in the future could adversely affect the trading price of our securities and our ability to raise additional capital.
We are responsible for reclamation, environmental indemnification and other obligations associated with our oil and gas properties and our former sulphur operations.
As of December 31, 2008, we had accrued $421.2 million relating to the reclamation liabilities with respect to our oil and gas properties. Among these reclamation obligations are the plugging and abandonment of wells, the reclamation and removal of platforms, facilities and pipelines and the repair and replacement of wells, equipment and facilities, including obligations associated with damages sustained from Hurricanes Katrina, Rita and Ike. The scope and cost of these obligations may ultimately be materially greater than estimated at the time of the acquisition.
As of December 31, 2008, we had $10.4 million relating to accrued reclamation liabilities with respect to our discontinued sulphur operations at Main Pass, of which $2.6 million has been prepaid as of December 31, 2008, and $12.6 million relating to accrued reclamation liabilities with respect to our other discontinued sulphur operations, including $11.3 million for the Port Sulphur facilities. We are in the
process of completing closure activities at the Port Sulphur facilities following damages sustained by the facilities from Hurricanes Katrina and Rita in 2005.
We cannot assure you that actual reclamation costs ultimately incurred will not exceed our current and future accruals for reclamation costs, that we will have the necessary resources to satisfy these obligations in the future, or that we will be able to satisfy applicable bonding requirements.
In addition, we are responsible for indemnification obligations related to the former sulphur operations previously engaged in by us and our predecessor companies. We have assumed, and agreed to indemnify IMC Global Inc. (now a subsidiary of Mosaic Company) from certain potential obligations, including environmental obligations relating to historical oil and gas operations conducted by the Freeport-McMoRan companies prior to the 1997 merger of Freeport-McMoRan Inc. and IMC Global. We have also assumed and agreed to indemnify Newfield Exploration Company (Newfield) from certain potential obligations, including environmental obligations relating to our 2007 oil and gas property acquisition. The scope and cost of these obligations may ultimately be materially greater than estimated at the time of the acquisition. Our liabilities with respect to those obligations could adversely affect our operations and liquidity.
Risks Relating to our Operations
The high-rate production characteristics of our Gulf of Mexico properties subject us to high reserve replacement needs.
Our future financial performance depends in large part on our ability to find, develop and produce oil and natural gas reserves, and we cannot make any assurances that we will be able to do so profitably. Unless we conduct successful exploration and development activities, acquire properties with proved reserves, or meet certain production and related thresholds in our prospects subject to farm-out arrangements, our proved reserves will decline as they are produced.
Producing natural gas and oil reservoirs are generally characterized by declining production rates that vary depending on reservoir characteristics and other factors. Production from the Gulf of Mexico shelf generally declines at a faster rate than in other producing regions of the world. Reservoirs in the Gulf of Mexico shelf are generally sandstone reservoirs characterized by high porosity and high permeability that results in an accelerated recovery of production in a relatively short period of time, with a generally more rapid decline near the end of the life of the reservoir. This results in recovery of a relatively higher percentage of reserves during the initial years of production, and a corresponding need to replace these reserves with discoveries at new prospects within a relatively short time frame. There can be no assurance that we will be able to replenish our reserves at attractive prices or within a suitable timeframe.
We will require additional capital to fund our future drilling activities and the development of other projects. If we fail to obtain additional capital, we may not be able to continue our operations or the development of these projects.
Historically, we have funded our operations and capital expenditures through:
| | • | our cash flow from operations; |
| | • | entering into exploration arrangements with other third parties; |
| | • | selling oil and gas properties; |
| | • | borrowing money from banks; |
• issuance of senior notes; and
| | • | selling preferred stock, common stock and securities convertible into common stock. |
We incurred $236.4 million in capital expenditures in 2008. We expect that our capital expenditures during 2009 will total approximately $230 million, including $100 million for costs associated with exploration opportunities, $75 million for anticipated development costs and $55 million for costs incurred in 2008 that will be funded in 2009. These expenditures could fluctuate depending on the
success of our drilling efforts and market conditions. Although we intend to fund our near-term expenditures with available cash, operating cash flows and borrowings under our senior secured revolving credit facility, we may need to consider the availability of raising additional capital through future equity or debt transactions to continue our drilling activities and other project developments.
We continue to closely monitor the recent disruption in the global financial and credit markets, as well as the recent significant decline in the market price for oil and natural gas. As these events unfold, we continue to evaluate and respond to any impact on our operations. In the near-term, we plan to continue to pursue the drilling of our exploration prospects, although we have and will continue to adjust our drilling plan and capital expenditures as necessary. However, external financing in the capital markets is currently not available, and without adequate capital resources, our drilling and other activities may be limited and our business, financial condition and results of operations may suffer.
Our exploration and development activities may not be commercially successful.
Oil and natural gas exploration and development activities involve a high degree of risk that hydrocarbons will not be found, that they will not be found in commercial quantities, or that the value produced will be less than the related drilling, completion and operating costs. The 3-D seismic data and other technologies that we use provide no assurance prior to drilling a well that oil or natural gas is present or economically producible. The cost of drilling, completing and operating a well is often uncertain, especially when drilling offshore and when drilling deep wells. Our drilling operations may be changed, delayed or canceled as a result of numerous factors, including:
| | • | continued economic uncertainty in light of the current state of the global financial and credit markets; |
| | • | the market price of oil and natural gas; |
| | • | unexpected drilling conditions; |
| | • | unexpected pressure or irregularities in geologic formations; |
| | • | equipment failures or accidents; |
| | • | tropical storms, hurricanes and other adverse weather conditions, which are common in the Gulf of Mexico during certain times of the year; |
| | • | regulatory requirements; and |
| | • | equipment and labor shortages resulting in cost overruns. |
Additionally, completion of a well does not guarantee that it will be profitable or even that it will result in recovery of the related drilling, completion and operating costs.
We anticipate that any of our near-term exploration and development activities will take place on deep shelf prospects in the shallow waters of the Gulf of Mexico, an area that has had limited historical drilling activity due, in part, to its geologic complexity. Deeper targets are more difficult to detect with traditional seismic processing and the expense of drilling deep shelf wells and the risk of mechanical failure is significantly higher because of the higher temperatures and pressure found at greater depths. Our exploratory wells require significant capital expenditures (typically ranging between $15-$20 million, net to our interests) before we can ascertain whether they contain commercially recoverable oil and natural gas reserves. Prior experience also suggests that the gross drilling costs for deep shelf exploratory wells can potentially exceed as much as $50 million per well. We cannot assure you that we will have, or be able to obtain, sufficient capital to pursue these expenditures or that our oil and natural gas exploration activities, either on the deep shelf or elsewhere, will be commercially successful.
A failure of our partners to fulfill their obligations or commitments to us could have an adverse effect on our operating results and financial condition.
We enter into contractual commitments related to our planned oil and gas exploration and development activities, including costs related to projects currently in progress, inventory purchase commitments and other exploration expenditures, some of which may be substantial. Additionally, a portion of our exploration program involves the sharing of certain costs associated with these expenditures with our partners.
At December 31, 2008, we had $239.0 million of contractual commitments, including $130.2 million of expenditures for drilling rig contract charges which we expect to share with our partners in our exploration program. A failure of our partners to fulfill their obligations or commitments to us, as a result of adverse consequences related to the current state of the financial markets or otherwise, would have an adverse effect on our operating results and financial condition.
The accounting methods we use to record our exploration results may result in losses.
We use the successful efforts accounting method for our oil and natural gas exploration and development activities. This method requires us to expense geologic and geophysical costs and the costs of unsuccessful exploration wells as they are incurred, rather than capitalizing these costs up to a specified limit as permitted pursuant to the full cost accounting method. Because the timing difference between incurring exploration costs and realizing revenues from successful properties can be significant, losses may be reported even though exploration activities may be successful during a reporting period. Accordingly, depending on our exploration results, we may incur significant additional losses as we continue to pursue our exploration activities. We cannot assure you that our oil and gas operations will enable us to achieve or sustain positive earnings or cash flows from operations in the future.
To sell our natural gas and oil we depend upon the availability, proximity and capacity of natural gas gathering systems, pipelines and processing facilities, which are owned by others.
To sell our natural gas and oil we depend upon the availability, operation and capacity of natural gas gathering systems, pipelines and processing facilities, which are owned by others. If, among other things, these systems and facilities are unavailable, lack available capacity due to hurricane damage, or are (or become) affected by the current financial crisis and depressed pricing for oil and gas, we could be forced to shut in producing wells or delay or discontinue development plans. Additionally, federal and state regulation of oil and natural gas production and transportation, general economic conditions and changes in supply and demand could also adversely affect our ability to produce and market our oil and natural gas.
The amount of oil and natural gas that we produce and the net cash flow that we receive from that production may differ materially from the amounts reflected in our reserve estimates.
Our estimates of proved oil and natural gas reserves are based on reserve engineering estimates using guidelines established by the SEC. Reserve engineering is a subjective process of estimating recoveries from underground accumulations of oil and natural gas that cannot be measured with complete accuracy. The accuracy of any reserve estimate depends on the quality of available data and the application of engineering and geological interpretation and judgment. Estimates of economically recoverable reserves and future net cash flows depend on a number of variable factors and assumptions, such as:
| | • | historical production from the area compared with production from other producing areas; |
| | • | assumptions concerning future oil and natural gas prices, future operating and development costs, workover, remediation and abandonment costs and severance and excise taxes; |
| | • | the effects that hedging contracts may have on our sales of oil and natural gas; and |
| | • | the assumed effects of government regulation and taxation. |
These factors and assumptions are difficult to predict and may vary considerably from actual results. In addition, reserve engineers may make varying estimates of reserve quantities and cash flows based on different interpretations of the same available data. Also, estimates of proved reserves for wells
with limited or no production history are less reliable than those based on actual production. Subsequent evaluation of the same reserves may result in variations in our estimated reserves, which may be substantial. As a result, all reserve estimates are imprecise.
You should not construe the estimated present values of future net cash flows from proved oil and natural gas reserves as the current market value of our estimated proved oil and natural gas reserves. As required by the SEC, we have estimated the discounted future net cash flows from proved reserves based on the prices and costs prevailing at December 31, 2008, without any adjustment to normalize those prices and costs based on variations over time either before or after this date. Future prices and costs may be materially higher or lower. Future net cash flows also will be affected by such factors as:
| | • | the actual amount and timing of production; |
| | • | changes in consumption by oil and gas purchasers; and |
| | • | changes in governmental regulations and taxation. |
In addition, the 10 percent discount factor, which is required by the SEC to be used in calculating discounted future net cash flows for reporting purposes, is not necessarily the most appropriate discount factor to be used in determining market values of proved oil and gas reserves. Changes in market interest rates at various times and the risks associated with our business or the oil and gas industry can vary significantly.
We cannot control the activities related to properties we do not operate.
Other companies operate several of the properties in which we have an interest. We have a limited ability to exercise influence over the operation of these properties or their associated costs. The success and timing of our drilling and development activities on properties operated by others therefore depend upon a number of factors outside of our control, including:
| | • | timing and amount of capital expenditures; |
| | • | the operator’s expertise, financial resources, and ability to sustain operations through periods of distressed or adverse economic conditions; |
| | • | approval of operators or other participants in drilling wells; and |
| | • | selection of technology. |
Hedging our production may expose us to various risks.
In connection with the financing of our 2007 oil and gas property acquisition, we were required to hedge a portion of our reasonably estimated oil and natural gas production from our proved developed producing oil and gas properties for the years 2008 through 2010. This hedging position was intended to reduce our exposure to fluctuations in the market prices of oil and natural gas; however, these positions may also limit our potential profits if oil and natural gas prices were to rise significantly over the stated price in these contracts. If we were to eliminate our hedging positions in the future, we may be more adversely affected by falling oil and natural gas prices than our competitors who are hedged.
Hedging will expose us to risk of financial loss in some circumstances, including if:
| | • | production is less than expected; |
| | • | the other party to the hedging contract defaults on its obligations; or |
| | • | there is a change in the expected differential between the underlying price in the hedging agreement and actual prices received. |
Additionally, the counterparties to our hedging contracts are financial institutions which have or may become affected (either directly or indirectly) by the current financial crisis, and as a result, the ability
of those counterparties to meet their obligations under such contracts may be adversely affected. This may expose us to additional risks in realizing any benefits associated with our hedge positions.
Compliance with environmental and other government regulations could be costly and could negatively affect production.
Our operations are subject to numerous laws and regulations governing the discharge of materials into the environment or otherwise relating to environmental protection. These laws and regulations may:
| | • | require the acquisition of a permit before drilling commences; |
| | • | restrict the types, quantities and concentration of various substances that can be released into the environment from drilling and production activities; |
| | • | limit or prohibit drilling activities on certain lands lying within wilderness, wetlands and other protected areas; |
| | • | require remedial measures to address or mitigate pollution from former operations, such as plugging abandoned wells; |
| | • | require bonds or the assumption of other financial responsibility requirements to cover drilling contingencies and well plugging and abandonment costs; |
| | • | impose substantial liabilities for pollution resulting from our operations; and |
| | • | require capital expenditures for pollution control equipment. |
New environmental laws or changes in existing laws or their enforcement may be enacted and such new laws or changes may require significant expenditures by us. The recent trend toward stricter standards in environmental legislation and regulations is likely to continue and could have a significant impact on our operating costs, as well as on the oil and gas industry in general.
Our operations could result in liability for personal injury, property damage, oil spills, natural resource damages, discharge of hazardous materials, remediation and clean-up costs and other environmental damages. Liability under environmental laws can be imposed retroactively and without regard to whether we knew of, or were responsible for, the presence of contamination on properties that we own or operate. Such liability may also be joint and several, meaning that the entire liability may be imposed on a party without regard to contribution. We could also be liable for environmental damages caused by previous property owners. As a result, substantial liabilities to third parties or governmental entities may be incurred, which could have a material adverse effect on our results of operations and financial condition. We could also be held liable for any and all consequences arising out of human exposure to hazardous substances, including without limitation, asbestos-containing materials or other environmental damage which liability could be substantial.
The Oil Pollution Act of 1990 imposes a variety of legal requirements on “responsible parties” related to the prevention of oil spills. The implementation of new, or the modification of existing, environmental laws or regulations, including regulations promulgated pursuant to the Oil Pollution Act of 1990, could have a material adverse effect on us.
The crude oil and natural gas exploration business is very competitive, and many of our competitors are larger and financially stronger than we are.
The business of oil and natural gas exploration, development and production is intensely competitive. We compete with many companies that have significantly greater financial and other resources than we have. Our competitors include the major integrated oil companies and a substantial number of independent exploration companies. We compete with these companies for supplies, equipment, labor and prospects. For example, these competitors may be better positioned to:
| | • | access capital bearing a lower cost; |
| | • | adapt to fluctuations in the credit markets and periods of distressed or adverse economic conditions; |
| | • | acquire producing properties and proved undeveloped acreage; |
| | • | obtain equipment, supplies and labor on better terms; |
| | • | develop, or buy, and implement new technologies; and |
| | • | access more information relating to prospects. |
Offshore operations are hazardous, and the hazards are not fully insurable at commercially reasonable costs.
Our operations are subject to the hazards and risks inherent in drilling for, producing and transporting oil and natural gas. These hazards and risks include:
| | • | abnormal pressures in geologic formations; |
If any of these or similar events occur, we could incur substantial losses as a result of death, personal injury, property damage, pollution, lost production, remediation and clean-up costs and other environmental or catastrophic damages.
We have historically maintained insurance for our operations, including liability, property damage, business interruption, limited coverage for sudden and accidental environmental damages and other insurance. We no longer carry business interruption insurance as the increased level of hurricane activity in the Gulf of Mexico during 2005 increased premiums to levels that are currently no longer cost effective. Any insurance that we purchase will not provide protection against all potential liabilities incident to the ordinary conduct of our business. Moreover, any insurance we maintain will be subject to coverage exclusions, limits, deductibles and other conditions. In addition, our insurance will not cover damages caused by war or environmental damages that occur over time. The occurrence of a material casualty loss that is not covered by insurance would adversely affect our results of operations and financial condition.
We are vulnerable to risks associated with the Gulf of Mexico because we currently explore and produce exclusively in that area.
Our strategy of concentrating our exploration and production activities on the Gulf of Mexico makes us more vulnerable to the risks associated with operating in that area than our competitors with more geographically diverse operations. These risks include:
| | • | tropical storms and hurricanes, which are common in the Gulf of Mexico during of the summer and early fall of each year; |
| | • | extensive governmental regulation (including regulations that may, in certain circumstances, impose strict liability for pollution damage); and |
| | • | interruption or termination of operations by governmental authorities based on environmental, safety or other considerations. |
These exposures in the Gulf of Mexico could have a material adverse effect on our results of operations and financial condition.
Shortages of supplies, equipment and personnel may adversely affect our operations.
Our ability to conduct operations in a timely and cost effective manner depends on the availability of supplies, equipment and personnel. The offshore oil and gas industry is cyclical and experiences periodic shortages of drilling rigs, work boats, tubular goods, supplies and experienced personnel. Shortages can delay operations and materially increase operating and capital costs.
The loss of key personnel could adversely affect our ability to operate.
We depend, and will continue to depend in the foreseeable future, on the services of our senior officers and other key employees, as well as other third-party consultants with extensive experience and expertise in:
| | • | evaluating and analyzing drilling prospects and producing oil and gas from proved properties; and |
| | • | maximizing production from oil and natural gas properties. |
Our ability to retain our senior officers, other key employees and our third party consultants, none of whom are subject to an employment agreement with us, is important to our future success and growth. The unexpected loss of the services of one or more of these individuals could have a detrimental effect on our business.
We may not be able to obtain the necessary financing to complete the development of the Main Pass Energy Hubtm Project (MPEHtm), and once operational, the MPEHtm project would be subject to certain risks.
While we are continuing our efforts to implement a successful plan for the development of the Main Pass Energy Hubtm project and a liquefied natural gas (LNG) regasification and storage facility, we may not be able to obtain the necessary financing to complete the development of this facility. Additionally, any such financing may be limited by restrictions contained in our existing financing agreements, or the financial, commodity and credit markets generally.
Additionally, our proposed LNG terminal, once operational, would be subject to significant operating hazards and uninsured risks, one or more of which may create significant liabilities for us. The operations of such facility would be subject to the inherent risks associated with those operations, including explosions, pollution, fires, adverse weather conditions and other hazards, any of which could result in damage to or destruction of our facilities or damage to persons and other property. These operations are also susceptible to acts of terrorism. If any of these events were to occur, we could suffer substantial losses. Depending on commercial availability, we would expect to maintain insurance against these types of risks to the extent and in the amounts that we believe are reasonable. However, our financial condition would be adversely affected if a significant event occurs that is not fully covered by insurance, and our continuing operations could be adversely affected by such an event whether or not it is fully covered by insurance.
None.
We may from time to time be involved in various legal proceedings of a character normally incident to the ordinary course of our business. We believe that potential liability from any of these pending or threatened proceedings will not have a material adverse effect on our financial condition or results of operations. We maintain liability insurance to cover some, but not all, of the potential liabilities normally incident to the ordinary course of our businesses as well as other insurance coverages customary in our business, with coverage limits as we deem prudent.
None.
Listed below are the names and ages, as of February 25, 2009, of the present executive officers of McMoRan together with the principal positions and offices with McMoRan held by each.
| Name | | Age | | Position or Office |
| James R. Moffett | | 70 | | Co-Chairman of the Board |
| | | | | |
| Richard C. Adkerson | | 62 | | Co-Chairman of the Board |
| | | | | |
| Glenn A. Kleinert | | 66 | | President and Chief Executive Officer |
| | | | | |
| C. Howard Murrish | | 68 | | Executive Vice President |
| | | | | |
| Nancy D. Parmelee | | 57 | | Senior Vice President, Chief Financial Officer |
| | | | | and Secretary |
| | | | | |
| Kathleen L. Quirk | | 45 | | Senior Vice President and Treasurer |
| | | | | |
| John G. Amato | | 64 | | General Counsel |
James R. Moffett has served as our Co-Chairman of the Board since November 1998. Mr. Moffett has also served as the Chairman of the Board of Freeport-McMoRan Copper & Gold Inc. (FCX) since May 1992, and previously served as Chief Executive Officer of FCX from July 1995 to December 2003. Mr. Moffett’s technical background is in geology and he has been actively engaged in petroleum geological activities in the areas of our company’s operations throughout his business career. He is also founder of our predecessor company.
Richard C. Adkerson has served as our Co-Chairman of the Board since November 1998. He previously served as our President and Chief Executive Officer from November 1998 to February 2004. Mr. Adkerson has also served as a director of FCX since October 2006, Chief Executive Officer of FCX since December 2003, and as President of FCX since January 2008 and previously from April 1997 to March 2007 and previously served as Chief Financial Officer of FCX from October 2000 to December 2003.
Glenn A. Kleinert has served as our President and Chief Executive Officer since February 2004. Previously he served as our Executive Vice President from May 2001 to February 2004. Mr. Kleinert has also served as President and Chief Operating Officer of MOXY since May 2001.
C. Howard Murrish has served as our Executive Vice President since November 1998. He previously served as Vice Chairman of the Board from May 2001 to February 2004. Mr. Murrish previously served as President and Chief Operating Officer of MOXY from November 1998 to May 2001 and McMoRan Oil & Gas Co. from September 1994 to November 1998.
Nancy D. Parmelee has served as our Senior Vice President and Chief Financial Officer since August 1999. She was appointed as Secretary of the company in January 2000. Ms. Parmelee has also served as Vice President of FCX since April 2003.
Kathleen L. Quirk has served as our Senior Vice President since April 2002 and Treasurer since January 2000. Ms. Quirk currently serves as Executive Vice President, Chief Financial Officer and Treasurer of FCX, and has held those offices since March 2007, December 2003 and February 2000, respectively. She also previously served as Senior Vice President of FCX from December 2003 to March 2007. Ms. Quirk currently serves as Vice President and Treasurer of Freeport-McMoRan Energy LLC, and has held the offices of Vice President and Treasurer since February 1999 and April 2003, respectively.
John G. Amato has served as our General Counsel since November 1998. Mr. Amato also currently provides legal and business advisory services to FCX under a consulting arrangement.
Our common stock is listed on the New York Stock Exchange (NYSE) under the symbol “MMR.” Our Chief Executive Officer submitted the Annual CEO Certification to the NYSE as required under the NYSE Listed Company rules. The certifications of each of our CEO and CFO required under Section 302 of the Sarbanes-Oxley Act of 2002 have been filed as exhibits to this Form 10-K. The following table sets forth, for the period indicated, the range of high and low sales prices, as reported by the NYSE.
| | | 2008 | | 2007 | |
| | | High | | Low | | High | | Low | |
| First Quarter | | $18.62 | | $12.50 | | $15.53 | | $11.01 | |
| Second Quarter | | 35.52 | | 17.01 | | 15.73 | | 12.51 | |
| Third Quarter | | 29.88 | | 19.55 | | 17.93 | | 12.94 | |
| Fourth Quarter | | 23.26 | | 7.39 | | 15.81 | | 10.70 | |
As of February 23, 2009 there were 7,427 holders of record of our common stock. We have not in the past paid, and do not anticipate in the future paying, cash dividends on our common stock. Currently, our debt agreements prohibit our payment of dividends on our common stock. At such time, if ever, that such restrictions are lifted, the Board of Directors have the sole discretion as to the timing and amount of any cash dividends.
Issuer Purchases of Equity Securities
In 1999, our Board of Directors approved an open market share purchase program for up to 2.0 million shares of our common stock. In 2000, the Board of Directors authorized the purchase of up to an additional 0.5 million shares under the program. The program does not have an expiration date. No shares were purchased during the three years ending December 31, 2008. Approximately 0.3 million shares remain available for purchase under the program.
Performance Graph
The information included under the caption “Performance Graph” in this Item 5 of this Form 10-K is not deemed to be “soliciting material” or to be “filed” with the SEC or subject to Regulation 14A or 14C under the Securities Exchange Act of 1934 or to the liabilities of Section 18 of the Securities Exchange Act of 1934, and will not be deemed to be incorporated by reference into any filings we make under the Securities Act of 1933 or the Securities Exchange Act of 1934, except to the extent we specifically incorporate it by reference into such a filing.
The following graph compares the change in the cumulative total stockholder return on our common stock with the cumulative total return of an Independent Oil & Gas Industry Group and the S&P Stock Index from 2004 through 2008. This comparison assumes $100 invested on December 31, 2003 in (a) our common stock, (b) an Independent Oil & Gas Industry Group, and (c) the S&P 500 Stock Index.
Comparison of Cumulative Total Return*
McMoRan Exploration Co., Independent
Oil & Gas Industry Group and S&P 500 Stock Index
| | December 31, |
| | 2003 | 2004 | 2005 | 2006 | 2007 | 2008 |
| McMoRan Exploration Co. | $100.00 | $99.73 | $105.44 | $75.84 | $69.81 | $52.27 |
| Independent Oil & Gas Industry | | | | | | |
| Group | 100.00 | 139.46 | 219.27 | 244.02 | 352.46 | 211.76 |
| S&P 500 Stock Index | 100.00 | 110.88 | 116.33 | 134.70 | 142.10 | 89.53 |
_______________
* Total Return Assumes Reinvestment of Dividends
The following table sets forth our selected audited historical financial and unaudited operating data for each of the five years in the period ended December 31, 2008. The historical information shown in the table below may not be indicative of our future results. You should read the information below together with Items 7. and 7A. “Management’s Discussion and Analysis of Financial Condition and Results of Operation and Qualitative and Quantitative Disclosures About Market Risk” and Item 8. “Financial Statements and Supplementary Data.” References to “Notes” refer to Notes to Consolidated Financial Statements located in Item 8. of this Form 10-K.
| | | 2008a | | 2007a | | 2006 | | 2005 | | 2004 | |
| Financial Data | | (Financial Data in Thousands, Except Per Share Amounts) | |
| Years Ended December 31: | | | | | | | | | | | | | | | | |
Revenues b | | $ | 1,072,482 | | $ | 481,167 | | $ | 209,738 | | $ | 130,127 | | $ | 29,849 | |
Depreciation and amortization c | | | 854,798 | | | 256,007 | | | 104,724 | | | 25,896 | | | 5,904 | |
| Exploration expenses | | | 79,116 | | | 58,954 | | | 67,737 | | | 63,805 | | | 36,903 | |
| Start-up costs for Main Pass Energy | | | | | | | | | | | | | | | | |
Hub™ d | | | 6,047 | | | 9,754 | | | 10,714 | | | 9,749 | | | 11,461 | |
Exploration expense reimbursement e | | | - | | | - | | | (10,979 | ) | | - | | | - | |
Litigation settlement f | | | - | | | - | | | (446 | ) | | 12,830 | | | - | |
Insurance recovery g | | | (3,391 | ) | | (2,338 | ) | | (3,306 | ) | | (8,900 | ) | | (1,074 | ) |
| Operating income (loss) | | | (155,234 | ) | | 3,509 | | | (32,567 | ) | | (22,373 | ) | | (43,940 | ) |
| Interest expense, net | | | (50,890 | ) | | 66,366 | | | 10,203 | | | 15,282 | | | 10,252 | |
| Loss from continuing operations | | | (211,198 | ) | | (63,561 | ) | | (44,716 | ) | | (31,470 | ) | | (52,032 | ) |
| Income (loss) from discontinued | | | | | | | | | | | | | | | | |
operations h | | | (5,496 | ) | | 3,827 | | | (2,938 | ) | | (8,242 | ) | | 361 | |
| Net loss applicable to common stock | | | (238,980 | ) | | (63,906 | ) | | (49,269 | ) | | (41,332 | ) | | (53,313 | ) |
| | | | | | | | | | | | | | |
| Basic and diluted net loss per share | | | | | | | | | | | | | |
| of common stock: | | | | | | | | | | | | | | | | |
| Continuing operations | | $ | (3.79 | ) | $ | (1.97 | ) | $ | (1.66 | ) | $ | (1.35 | ) | $ | (2.85 | ) |
| Discontinued operations | | | (0.09 | ) | | 0.11 | | | (0.10 | ) | | (0.33 | ) | | 0.02 | |
| Basic and diluted net loss per share | | $ | (3.88 | ) | $ | (1.86 | ) | $ | (1.76 | ) | $ | (1.68 | ) | $ | (2.83 | ) |
| | | | | | | | | | | | | | |
| Average basic and diluted common | | | | | | | | | | | | | | | | |
| shares outstanding | | | 61,581 | | | 34,283 | | | 27,930 | | | 24,583 | | | 18,828 | |
| | | | | | | | | | | | | | | | | |
| At December 31: | | | | | | | | | | | | | | | | |
| Working capital (deficit) | | $ | 3,601 | | $ | (221,302 | ) | $ | (25,906 | ) | $ | 67,135 | | $ | 175,889 | |
| Property, plant and equipment, net | | | 992,563 | | | 1,503,359 | | | 282,538 | | | 192,397 | | | 97,262 | |
| Total assets | | | 1,330,282 | | | 1,715,288 | | | 408,677 | | | 407,636 | | | 383,920 | |
| Oil and gas reclamation obligations | | | 421,201 | | | 294,737 | | | 25,876 | | | 26,484 | | | 14,429 | |
| Long-term debt | | | 374,720 | | | 689,000 | | | 244,620 | | | 270,000 | | | 270,000 | |
| Mandatorily redeemable convertible | | | | | | | | | | | | | | | | |
| preferred stock | | | - | | | - | | | 29,043 | | | 28,961 | | | 29,565 | |
| Stockholders’ equity (deficit) | | $ | 309,023 | | $ | 372,229 | | $ | (68,443 | ) | $ | (86,590 | ) | $ | (49,546 | ) |
| a. | Amounts in 2008 and 2007 include results from the 2007 oil and gas property acquisition. |
| b. | Includes service revenues totaling $13.7 million in 2008, $5.9 million in 2007, $13.0 million in 2006, $12.0 million in 2005 and $14.2 million in 2004. See Notes 1 and 3. |
| c. | Includes impairment charges of $332.6 million in 2008, $13.6 million in 2007, $33.2 million in 2006 and $0.8 million in 2004. McMoRan did not record any impairment charges in 2005 (Note 6). |
| d. | Reflects costs associated with pursuit of the licensing, design and financing plans necessary to establishing an energy hub, including an LNG terminal, at Main Pass Block 299 (Main Pass) in the Gulf of Mexico (Notes 4 and 6). |
| e. | Reflects $20.0 million received upon inception of an exploration agreement in fourth quarter of 2006 (Note 3). |
| f. | Reflects settlement of class action litigation case, net of insurance proceeds (Note 17). |
| g. | Reflects proceeds received in connection with our oil and gas hurricane-related insurance claims (Note 6). |
| h. | Amounts include charges for modification of previously estimated reclamation plans for remaining closed sulphur facilities at Port Sulphur, Louisiana and year-end reductions in the contractual liability associated with postretirement benefit costs relating to certain retired former sulphur employees (Notes 12 and 17). |
____________________
| | 2008a | | 2007a | | 2006 | | 2005 | | 2004 | |
| Operating Data | | | | | | | | | | | | | | | |
| Sales Volumes: | | | | | | | | | | | | | | | |
| Gas (thousand cubic feet, or Mcf) | | 59,886,900 | | | 38,994,000 | | | 14,545,600 | | | 7,938,000 | | | 1,978,500 | |
| Oil (barrels) | | 3,635,200 | | | 2,380,500 | | | 1,379,300 | | | 716,400 | | | 61,900 | |
Plant products (Mcf equivalent)b | | 8,004,400 | | | 2,153,300 | | | 1,072,200 | | | 640,200 | | | 137,400 | |
| Average realization: | | | | | | | | | | | | | | | |
| Gas (per Mcf) | $ | 9.96 | | $ | 7.01 | | $ | 7.05 | | $ | 9.24 | | $ | 6.08 | |
| Oil (per barrel) | | 104.00 | | | 76.55 | | | 60.55 | | | 53.82 | | | 39.83 | |
| a. | Sales volumes in 2008 associated with the 2007 oil and gas property acquisition totaled 40.9 Bcf of natural gas, approximately 2,411,500 barrels of oil and condensate and 5.8 Bcf equivalents of plant products. For the period from August 6, 2007 to December 31, 2007, the sales volumes associated with the 2007 oil and gas property acquisition totaled 25.5 Bcf of natural gas, approximately 1,267,500 barrels of oil and condensate and 1.3 Bcf equivalents of plant products. |
| b. | Revenues from plant products (ethane, propane, butane, etc.) totaled $83.3 million in 2008, $19.3 million in 2007, $9.6 million in 2006, $5.0 million in 2005 and $0.6 million in 2004. One Mcf equivalent is determined using the ratio of six Mcf of natural gas to one barrel of crude oil, condensate or natural gas liquids. |
OVERVIEW
You should read the following discussion in conjunction with our consolidated financial statements and the related discussion of “Business and Properties” included in Items 1. and 2. of this Form 10-K. The results of operations reported and summarized below are not necessarily indicative of our future operating results. All subsequent references to Notes refer to Notes to Consolidated Financial Statements located in Item 8. “Financial Statements and Supplementary Data” elsewhere in this Form 10-K.
We engage in the exploration, development and production of oil and natural gas offshore in the Gulf of Mexico and onshore in the Gulf Coast area. We have one of the largest acreage positions in the shallow waters of the Gulf of Mexico and Gulf Coast areas, which are our regions of focus. Our focused strategy enables us to capitalize on our geological, engineering and production strengths in these areas where we have more than 35 years of operating experience. We also believe that the scale of our operations in the Gulf of Mexico allows us to realize certain operating synergies and provides a strong platform from which to pursue our business strategy. Our oil and gas operations are conducted through McMoRan Oil & Gas LLC (MOXY), our principal operating subsidiary. Separate from our oil and gas operations, we are pursuing a multifaceted energy services development of the Main Pass Energy Hub™ (MPEH™) project, including the potential development of a liquefied natural gas (LNG) regasification and storage facility through our other wholly-owned subsidiary, Freeport-McMoRan Energy LLC (Freeport Energy). For additional information regarding our business and operations, see Items 1. and 2. entitled “Business and Properties” of this Form 10-K.
We intend to continue to focus on pursuing opportunities presented by our expanded asset base created through our 2007 oil and gas property acquisition. We will be responsive to current weak economic conditions and unfavorable commodity price levels by prudently managing our capital spending as we continue to seek to build asset values through our focused drilling program.
Our technical and operational expertise is primarily in the Gulf of Mexico. We leverage our expertise by attempting to identify exploration opportunities with high potential. Our exploration strategy, which we refer to as the “deeper pool concept,” involves exploring prospects that lie below shallower intervals on the Deep Miocene geologic trend that have had significant past production. A significant advantage to our exploration strategy is that the infrastructure to support the production and delivery of product is in most cases already in place and available, which we believe presents us with a material competitive advantage in bringing our discoveries on line and lowering related development costs. We believe our techniques for identifying reservoirs using structural geology augmented by 3-D seismic data will enable us to identify and exploit additional “deeper pool” prospects at drilling depths exceeding 15,000 feet, including “ultra deep” exploration opportunities (prospects with total drilling depths in excess of 25,000 feet). For additional information regarding our business strategy, see Items 1. and 2. “Business and Properties” of this Form 10-K.
Implementing our business strategy will require significant expenditures during 2009 and beyond. During 2008, we spent $236.4 million on capital-related projects primarily associated with our exploration activities and subsequent development of the related discoveries. Our exploration, development and other capital expenditures for 2009 are expected to approximate $230 million, including $100 million in exploration costs, $75 million in development costs and $55 million in costs incurred in 2008 that will be funded in 2009. Capital spending will continue to be driven by opportunities and will be managed based on available cash and cash flows. We also plan to spend approximately $115 million in 2009 to abandon and remove oil and gas structures from the Gulf of Mexico, most of which is associated with the removal of structures damaged during the 2005 and 2008 hurricane seasons. We believe that we are entitled to a substantial recovery of these hurricane related costs associated with this damage from our insurance program, and in the near-term, expect to receive a $20 million advance payment on this claim (see “2008 Hurricane Activity” below). We plan to fund our exploration, development and reclamation activities with our cash on hand, operating cash flow and borrowings, if necessary, under our variable rate senior secured revolving credit facility (see “Capital Resources and Liquidity — Senior Secured Revolving Credit Facility” below).
We are closely monitoring the recent disruption in the global financial and credit markets, as well as the recent significant declines in oil and natural gas market prices, each of which have been widely publicized and may ultimately have a material affect on one or more facets of our business and overall business strategy. We will continue to evaluate and respond to any impact these conditions may have on our operations. For additional information regarding the risks and uncertainties associated with the current state of the domestic and global markets, and its potential affect on our results of operation and financial condition, see Item 1A. “Risk Factors” included in this Form 10-K.
North American Natural Gas and Oil Market Environment
Market prices of natural gas and crude oil have significantly decreased from the highs of earlier in 2008. North American natural gas averaged $8.89 per MMbtu during 2008. The spot price for natural gas was $4.06 per MMbtu on February 25, 2009. Natural gas prices have declined as a result of reductions in industrial and power sector gas demand as part of the recent global economic recession. Supply inventories are higher than historical averages despite supply declines resulting from lower drilling activity. The average price for crude oil was $99.75 per barrel in 2008 and $42.50 per barrel on February 25, 2009. Future oil and natural gas prices are subject to change and these changes are not within our control (see Item 1A. “Risk Factors” included in this Form 10-K).
OPERATIONAL ACTIVITIES
Our 2007 oil and gas property acquisition significantly expanded our scale of operations. For additional information regarding the acquisition, see Note 2.
Oil and Gas Activities
For additional information regarding our current oil and gas activities, see “Oil and Gas Activity” in Items 1. and 2. “Business and Properties” of this Form 10-K.
2008 Hurricane Activity
Hurricanes Gustav and Ike impacted Gulf of Mexico operations prior to making landfall on the Louisiana and Texas coasts on September 1, 2008 and September 13, 2008, respectively. There was no significant damage to our properties resulting from Hurricane Gustav. Assessments following Hurricane Ike identified several platforms, comprising approximately three percent of production and two percent of reserves, with significant structural damage. An estimated 55 MMcfe/d is being constrained by outages at third party facilities and is expected to be restored by mid-year 2009. Drilling rigs used in our exploration and development activities sustained no significant damage in the storms and operations resumed immediately afterwards.
During the third quarter of 2008, we recorded impairment charges of $21.9 million to eliminate the carrying value of Ewing Banks Block 947 and South Marsh Island Block 49F after we concluded that the reserves associated with these properties would not be recoverable due to significant structural damage caused by Hurricane Ike. Additionally, we recorded reclamation charges of $124.4 million to record the additional reclamation costs for damaged properties and the acceleration of the timing of when these costs are expected to be incurred. We also recorded $23.1 million in production and delivery costs related to damage assessment and repairs during 2008. We believe that we are entitled to a substantial recovery under our insurance program for hurricane related costs, which are expected to be incurred over several years, and in the near-term, we expect to receive a $20.0 million advance payment on this claim. Insurance recovery will be recorded as income in our future financial results as claims are settled with insurers.
Production Update
We continue to restore production that was shut-in as a result of the September 2008 hurricane events in the Gulf of Mexico. Our net production rates averaged 245 MMcfe/d during 2008 compared with 152 MMcfe/d in 2007 and 65 MMcfe/d in 2006. Fourth-quarter 2008 production averaged 162 MMcfe/d net to us, compared to 295 MMcfe/d in the fourth quarter of 2007. Fourth-quarter 2008 production rates were lower because of delays associated with the availability of third party pipelines and processing facilities following Hurricane Ike.
Current production approximates 210 MMcfe/d with an estimated additional 55 MMcfe/d being constrained by outages at third party facilities and is expected to be restored by mid-year 2009. Based on recent information from third party operators of downstream facilities, average daily production is expected to average 190-200 MMcfe/d in the first quarter of 2009 and 220-230 MMcfe/d for the full year 2009. These production estimates are dependent on the timing of restoring shut in production from the lack of availability of third party downstream pipelines and facilities damaged by the September 2008 hurricane events and expected production from new wells.
Acreage Position
For information regarding our acreage position, see Note 3 and “Properties — Acreage” In Items 1. and 2. “Business and Properties” of this Form 10-K.
MAIN PASS ENERGY HUBTM PROJECT
We are continuing to pursue a multifaceted energy services development of the MPEHtm project, including the potential development of a liquefied natural gas (LNG) regasification and storage facility through Freeport Energy. As of December 31, 2008, we have incurred approximately $50.5 million of cash costs associated with our pursuit of establishment of MPEHtm, including $5.0 million in 2008. As of December 31, 2008, we have recognized a liability of $10.4 million relating to the future reclamation of the MPEHtm related facilities. The actual amount and timing of reclamation for these structures is dependent on the success of our efforts to use these facilities at the MPEHtm project as described above.
We will require commercial arrangements for the MPEH tm project to obtain financing, which may be in the form of additional debt and/or equity transactions. However, external financing in the capital markets is currently not available on a reasonable pricing or terms, and the ultimate outcome of our efforts to enter into commercial arrangements on reasonable terms to develop the MPEH tm project and obtain additional financing is subject to various uncertainties, many of which are beyond our control.
For additional information regarding the MPEHtm project and risks associated therewith, including preliminary capital expenditure estimates, see “Business and Properties— Business — Main Pass Energy Hubtm Project” in Items 1. and 2. and Item 1A. “Risk Factors” included in this Form 10-K. Also see Notes 4 and 6 regarding information about transactions that may reduce our future ownership interest in the MPEHtm project and our oil facilities at Main Pass.
RESULTS OF OPERATIONS
Our only segment is “Oil and Gas.” We are continuing to pursue a new segment, “Energy Services,” whose start-up activities are reflected as a single expense line item within consolidated statements of operations under the caption “Start-up Costs for Main Pass Energy Hubtm.”
We use the successful efforts accounting method for our oil and gas operations, which requires exploration costs, other than costs of successful drilling and in-progress exploratory wells, to be charged to expense as incurred (Note 1).
Our operating results have changed substantially following the 2007 oil and gas property acquisition. Our operating loss for 2008 totaling $155.2 million includes the results from the acquired properties for the entire year. Our operating income for 2007 totaling $3.5 million includes the results from the acquired properties beginning on August 6, 2007. The summarized operating results for acquired properties for the year ended December 31, 2008 and the period of August 6, 2007 through December 31, 2007 are as follows (in thousands):
| | | 2008 | | | 2007 | |
| Revenues: | | | | | | |
| Oil and natural gas | $ | 732,274 | | $ | 290,856 | |
| Service | | 14,171 | | | 4,557 | |
| Total revenues | | 746,445 | | | 295,413 | |
| Cost and Expenses: | | | | | | |
| Production and delivery costs | | 164,650 | | | 57,099 | |
| Depreciation and amortization | | 636,112 | a | | 170,012 | |
| Exploration expenses | | 4,559 | | | 112 | b |
General and administrative expenses c | | 4,551 | | | 2,463 | |
| Total costs and expenses | | 809,872 | | | 229,686 | |
| Operating income (loss) | $ | (63,427 | ) | $ | 65,727 | |
| a. | Includes impairment charges totaling $207.5 million and reclamation charges totaling $124.4 million to reflect higher estimates and accelerated timing of future abandonment costs. |
| b. | Excludes $13.0 million in seismic data costs incurred that were not allocated to the acquired properties. |
| c. | Only includes cost directly allocated to the acquired properties and excludes all compensation costs associated with newly hired employees, which are not allocated to the acquired properties. |
Our operating loss during 2008 totaled $155.2 million which reflects (a) $310.7 million in impairment charges to reduce net carrying values to fair value for certain fields related to the significant decline in the market prices for oil and natural gas during the fourth quarter of 2008; (b) $169.4 million of charges associated with damage to certain properties from Hurricane Ike; and (c) aggregated realized and unrealized gains of $16.3 million associated with the cash settlement and mark-to-market adjustment of the fair values of our oil and gas derivative contracts.
In addition to the revenues and expenses from the acquired properties, our 2007 operating income of $3.5 million reflects (a) exploration expenses of $59.0 million, which includes $13.0 million in seismic data costs primarily associated with the 2007 oil and gas property acquisition and $22.8 million of nonproductive exploratory drilling and related costs; (b) an impairment charge of $13.6 million to write off the remaining net book value of the Cane Ridge field at Louisiana State Lease 18055; (c) $9.8 million of start-up costs associated with MPEHTM; and (d) an unrealized loss of $5.2 million associated with the mark-to-market adjustment for our oil and gas derivative contracts.
Our operating loss during 2006 totaled $32.6 million, which included (a) impairment charges of $33.9 million to reduce the carrying costs of the West Cameron Block 43 and Eugene Island Block 213 fields to their estimated fair values at December 31, 2006; (b) $45.6 million in nonproductive drilling and related costs; and (c) $10.7 million of start-up costs for the MPEHtm project.
Oil and Gas Operations – Year-to-Year Comparisons
As shown in the table above, the 2007 oil and gas property acquisition had a significant impact on our operating results for the years ended December 31, 2008 and 2007.
Revenues. A summary of increases (decreases) in our oil and natural gas revenues as compared to the previous period follows (in thousands):
| | | 2008 | | 2007 | |
| Oil and natural gas revenues – prior year period | | $ | 475,250 | | $ | 196,717 | |
| Increase (decrease) | | | | | | | |
| Price realizations: | | | | | | | |
| Natural gas | | | 42,029 | | | 6,421 | |
| Oil and condensate | | | 37,709 | | | 6,725 | |
| Sales volumes: | | | | | | | |
| Natural gas | | | 41,029 | | | (7,215 | ) |
| Oil and condensate | | | 7,418 | | | (15,702 | ) |
| Properties acquired in 2007 | | | 441,418 | | | 290,856 | |
| Plant products revenue | | | 13,850 | | | (2,058 | ) |
| Other | | | 101 | | | (494 | ) |
| Oil and natural gas revenues - current year period | | $ | 1,058,804 | | $ | 475,250 | |
See Item 6. “Selected Financial Data” in this Form 10-K for operating data, including our sales volumes and average realizations for each of the three years in the period ended December 31, 2008.
Our oil and natural gas sales volumes totaled 89.7 Bcfe in 2008, 55.5 Bcfe in 2007 and 23.9 Bcfe in 2006. The increase in 2008 from 2007 reflects the continued additional production from our 2007 oil and gas property acquisition as well as additional production from the Flatrock field. The increase in 2007 from 2006 reflects the 2007 oil and gas property acquisition offset by a 12 percent decrease in production from our legacy properties related to natural production declines. Average realizations received for oil sold during 2008 increased by 46 percent over amounts received in 2007, which increased 10 percent over amounts received in 2006. Average realizations for natural gas sold during 2008 increased 29 percent from amounts received during 2007. Average realization for natural gas increased 7 percent from amounts received during 2006.
Our 2008 revenues included $83.3 million of plant product sales associated with approximately 8.0 Bcf equivalents for products (ethane, propane, butane, etc.) recovered from the processing of our natural gas. The amounts of plant product sales totaled $19.3 million from 2.2 Bcf equivalents during 2007 and $9.6 million from 1.1 Bcf equivalents in 2006. The increase in plant product revenues in 2008 and 2007 was directly related to the 2007 oil and gas property acquisition.
Our service revenues totaled $13.7 million in 2008, $5.9 million in 2007 and $13.0 million in 2006. The increase in 2008 reflects additional production and handling fees from the processing of third party production and reimbursements of standard industry overhead fees associated with the 2007 oil and gas property acquisition. The decrease in 2007 primarily reflects the conclusion of our multi-year exploration venture with a private partner (Note 3) and the termination of third party oil and gas processing fees at Main Pass offset by the increased revenue from our 2007 oil and gas property acquisition.
Production and delivery costs. The following table reflects our production and delivery costs for the years ended December 31, 2008, 2007 and 2006 (in millions, except per Mcfe amounts):
| | | | Per | | | | Per | | | | Per |
| | 2008 | | Mcfe | | 2007 | | Mcfe | | 2006 | | Mcfe |
| Lease operating expense | $133.6 | | $1.49 | | $ 69.8 | | $1.26 | | $30.4 | | $1.27 |
| Workover costs | 39.7 | | 0.44 | | 19.7 | | 0.35 | | 0.2 | | 0.01 |
| Hurricane related repairs | 23.1 | | 0.26 | | - | | - | | 4.3 | | 0.18 |
| Insurance | 22.6 | | 0.25 | | 23.2 | | 0.42 | | 8.5 | | 0.36 |
| Transportation and production taxes | 38.4 | | 0.43 | | 9.1 | | 0.16 | | 5.1 | | 0.21 |
| Other | 1.1 | | 0.01 | | 0.3 | | 0.01 | | 4.6 | | 0.19 |
| Total production and delivery costs | $258.5 | | $2.88 | | $122.1 | | $2.20 | | $53.1 | | $2.22 |
Our higher lease operating expense reflects increased production over the three year period ended December 31, 2008, including the 2007 oil and gas property acquisition. Our workover in 2008 primarily relate to remedial operations at Main Pass Block 299, Vermillion Block 398, the King of the Hill
well at High Island Block 131 and South Timbalier Block 139. Our workover costs during 2007 primarily reflect operations at the Cane Ridge, King Kong, Blueberry Hill, Eugene Island Block 97 No. 3 and the Eugene Island Block 193 wells. During 2006, our workover costs are related primarily to our attempts to restore production from the Minuteman well at Eugene Island Block 213 and the Hurricane No. 1 well at South Marsh Island Block 217. Hurricane related repairs related to work performed on wells in 2008 and 2006 related to the 2007 Hurricanes Gustav and Ike and the 2005 Hurricane Katrina.
Our insurance costs increased significantly following the mid-year 2006 renewal of our property insurance policies, which reflected the effects of the 2005 hurricanes on the insurance industry as well as the increased number of our producing fields and drilling activities during 2006. The amounts during 2008 and 2007 also reflect incremental insurance costs associated with coverage on the properties acquired in 2007. Our production taxes have increased over the prior year reflecting the commencement of production from new wells.
Depletion, depreciation and amortization expense. The following table reflects the components of our depletion, depreciation and amortization expense for the years ended December 31, 2008, 2007 and 2006 (in millions, except per Mcfe amounts):
| | | | Per | | | | Per | | | | Per |
| | 2008 | | Mcfe | | 2007 | | Mcfe | | 2006 | | Mcfe |
| Depletion and depreciation expense | $357.5 | | $3.98 | | $228.5 | | $4.12 | | $ 69.4 | | $2.91 |
| Accretion expense | 164.8 | | 1.84 | | 13.9 | | 0.25 | | 2.1 | | 0.08 |
| Impairment charges/losses | 332.5 | | 3.71 | | 13.6 | | 0.25 | | 33.2 | | 1.39 |
| Total depletion, depreciation and | | | | | | | | | | | |
| amortization expense | $854.8 | | $9.53 | | $256.0 | | $4.62 | | $104.7 | | $4.38 |
As indicated in Note 1, we record depletion, depreciation and amortization expense on a field-by- field basis using the units-of-production method. Our depletion, depreciation and amortization rates are directly affected by estimates of proved reserve quantities, which are subject to a significant level of uncertainty, especially for fields with little or no production history. Subsequent revisions to individual fields’ reserve estimates can yield significantly different depletion, depreciation and amortization rates. The increase in our depletion, depreciation and amortization expense in 2008 over prior years primarily reflects our increased production from new discoveries and related production from the 2007 oil and gas property acquisition. We anticipate our 2009 depletion, depreciation and amortization expense to be lower than 2008 amounts as a result of impairment charges recorded in 2008 which significantly reduced the carrying value of our proved oil and gas property costs. Based on recent information from third party operators of downstream facilities, we anticipate that our average daily production will average 220-230 MMcfe/d for the full year 2009 which would result in depletion, depreciation and amortization expense of approximately $280-$295 million.
We record accretion expense on our estimated discounted reclamation obligations. In 2008 we recorded amounts to accretion expense totaling $124.4 million to reflect higher estimates and accelerated timing of future abandonment costs associated with hurricane damaged structures and wells. The remaining increase in 2008 and 2007 primarily reflects the effect from assumed reclamation obligations from the 2007 oil and gas property acquisition.
As further discussed in Note 1, accounting rules require the carrying value of proved oil and gas property costs to be assessed for possible impairment under certain circumstances and reduced to fair value by a charge to earnings if impairment is deemed to have occurred. Conditions affecting current and estimated future cash flows that could require impairment charges include, but are not limited to, lower than anticipated oil and natural gas prices, decreased production, increased development, production and reclamation costs and downward revisions of reserve estimates. The significant decline in market prices in the fourth quarter of 2008 for oil and natural gas resulted in an impairment of the capitalized costs of individual proved oil and gas properties totaling $246.9 million based on forward prices and independent reserve engineers’ estimates for reserves as of December 31, 2008. We also recorded impairment charges totaling $44.9 million on two unevaluated wells (Mound Point South and JB Mountain Deep) after considering our near term drilling plans in the current economic environment. As more fully explained in Item 1A. “Risk Factors” elsewhere in this Form 10-K, a combination of any or all of these conditions could require additional impairment charges to be recorded in future periods.
In 2008, we also recorded additional impairment charges totaling $40.8 relating to Ship Shoal Block 139, West Cameron Block 176 and High Island Block 131 as well as Ewing Banks 947 and South Marsh Island Block 49 which were significantly damaged in Hurricane Ike.
In 2007, we recorded a charge of $13.6 million to depreciation, depletion and amortization expense to write off our remaining investment in the Cane Ridge well at Louisiana State Lease 18055, located onshore in Vermilion Parish.
In 2006, we recorded $33.2 million in charges to depletion, depreciation and amortization expense to reduce our investment in the Minuteman well at Eugene Island Block 213 and the West Cameron Block 43 field to their then estimated fair value at December 31, 2006.
Exploration Expenses. Summarized exploration expenses are as follows (in millions):
| | Years Ended December 31, | |
| | | 2008 | | | 2007 | | | 2006 | |
| Geological and geophysical, | | | | | | | | | |
including 3-D seismic purchases a | $ | 31.9 | | $ | 29.9 | b | $ | 15.2 | |
| Dry hole costs | | 38.9 | c | | 22.8 | d | | 45.6 | e |
| Insurance and other | | 8.3 | | | 6.3 | | | 6.9 | |
| | $ | 79.1 | | $ | 59.0 | | $ | 67.7 | |
| a. | Includes compensation costs associated with stock-based awards totaling $14.4 million in 2008, $6.3 million in 2007 and $8.1 million in 2006. |
| b. | Includes $13.0 million of seismic data purchases primarily associated with the exploration acreage acquired in the 2007 oil and gas property acquisition. |
| c. | Includes nonproductive exploratory drilling and related costs primarily associated with the Mound Point East well at Louisiana State Lease 340 ($16.0 million), the Northeast Belle Isle well ($9.5 million) and the Gladstone East well ($5.4 million) as well as approximately $8.0 million of nonproductive leasehold costs. |
| d. | Primarily includes nonproductive exploratory drilling and related costs primarily associated with the “Cas” well at South Timbalier Block 70 ($21.6 million). |
| e. | Primarily includes nonproductive exploratory drilling and related costs for wells at Louisiana State Lease 18091 ($14.9 million), South Pass Block 26 ($8.3 million), Vermilion Block 54 ($7.8 million), Grand Isle Block 18 ($7.0 million), and the evaluation of the deeper objectives at “Zigler Canal” in Vermilion Parish, Louisiana ($1.7 million). Also includes the costs incurred during 2006 totaling $5.2 million for two wells that were evaluated as nonproductive in January 2006. |
Following the release of our unaudited fourth quarter 2008 results on January 21, 2009, the drilling results for the Gladstone East deep gas exploratory prospect on Louisiana State Lease 340 were evaluated and deemed to be nonproductive. As a result, the well is being plugged and abandoned. We charged $5.4 million of costs incurred for drilling the well through December 31, 2008 to exploration expense in our fourth quarter 2008 results.
In the fourth quarter of 2006, we entered into an exploration agreement with Plains Exploration and Production Company (Plains) whereby Plains obtained the right to participate in various exploration prospects in limited areas being explored by us. As of December 31, 2008, Plains has participated in eleven prospects under the terms of this exploration agreement. Under the agreement, Plains paid us $20.0 million for these leasehold interests and related prospect costs. We reflected $19.0 million of this payment as operating income in the accompanying consolidated statements of operations within the line item titled “Reimbursement of exploration expense” and within our operating cash flows in the accompanying consolidated statements of cash flow. The remaining $1.0 million was classified as a reduction of our basis in the specified prospects covered by this agreement and is included within investing activities in the accompanying consolidated statements of cash flow.
Other Financial Results
Operating
Our general and administrative expenses totaled $49.0 million in 2008, $28.0 million in 2007 and $20.7 million in 2006. Our general and administrative costs in 2008 and 2007 reflect additional personnel
associated with administering the oil and gas properties acquired in 2007. We charged approximately $14.8 million of stock-based compensation costs to general and administrative expense during 2008 compared to $6.3 million in 2007 and $7.1 million in 2006. The increase in stock-based compensation costs in 2008 is related to the timing of the 2008 option grants, which occurred at a time when the price of our common stock exceeded $30 per share. General and administrative expenses during 2006 benefited from a reduction in legal costs following settlement of class action litigation in the fourth quarter of 2005 (see below).
In 2008, we recorded a $16.3 million gain related to mark-to-market accounting adjustments associated with derivative contracts based on changes in their respective fair market values through December 31, 2008. In 2007, we recorded $5.2 million in mark-to-market adjustments related to the fair values of our oil and gas derivative contracts (Note 9).
Our 2008 operating results included $3.4 million of insurance recoveries relating to our final Hurricane Katrina settlement. We are pursing insurance recoveries related to Hurricane Ike which affected operations during 2008. Our operating results in 2007 included insurance recoveries totaling $2.3 million related to our Hurricane Katrina property loss claims. Our operating results in 2006 included insurance recoveries totaling $3.3 million.
In 2005, we reached an agreement in principle with plaintiffs to settle previously disclosed class action litigation in the Delaware Court of Chancery relating to the 1998 merger of Freeport-McMoRan Sulphur Inc. and McMoRan Oil & Gas Co. In accordance with the terms of the settlement, we paid $17.5 million in cash into a settlement fund in the first quarter of 2006, the plaintiffs provided a complete release of all claims, and the Delaware litigation was dismissed with prejudice. In 2005, we recorded a $12.8 million charge to expense, net of the amount of anticipated insurance proceeds ($5.1 million). During 2006, we recorded an additional $0.4 million of insurance proceeds which was in excess of our original estimate as a reduction of our operating costs.
Non-Operating
Interest expense, net of capitalized interest, totaled $50.9 million in 2008, $66.4 million in 2007 and $10.2 million in 2006. We capitalized interest totaling $5.0 million in 2008, $6.3 million in 2007 and $5.3 million during 2006. The decrease in interest expense in 2008 is associated with our debt reduction during 2008. The increase in interest expense in 2007 is associated with the financing obtained for the 2007 oil and gas property acquisition including $17.9 million of unamortized deferred financing costs associated with the bridge loan partially offset by a $9.0 million reimbursement from our lenders of previously paid closing fees that were contractually reimbursable to us for retiring the bridge loan within 120 days of its origination (Note 8). Capitalized interest has fluctuated during the past three years to reflect the timing and amount of our oil and gas drilling and development activities.
Other expense totaled $2.6 million in 2008, $0.7 million in 2007 and $1.9 million in 2006. Interest income for the three years ended December 31, 2008 totaled $1.1 million in 2008 and $2.2 million in both 2007 and 2006. Other expense in 2008 included $2.7 million of inducement payments related to our convertible senior notes (see “— Capital Resources and Liquidity—Convertible Senior Notes” below). Other expense in 2007 included the prepayment premium of $3.0 million to terminate our Senior Secured Term Loan (see “— Capital Resources and Liquidity—Senior Term Loan Agreement” below) partially offset by interest income. Other expense in 2006 reflected $4.3 million of charges to expense resulting from the conversion transactions of our convertible senior notes during the first quarter of 2006 (see “— Capital Resources and Liquidity — Convertible Senior Notes” below).
Discontinued Operations
Our discontinued operations resulted in income (loss) of $(5.5) million in 2008, $3.8 million in 2007 and $(2.9) million in 2006. The aggregate estimated closure costs for our closed facilities at Port Sulphur, Louisiana approximates $11.3 million at December 31, 2008. Insurance recoveries totaling $7.7 million have partially mitigated our previously incurred Port Sulphur closure costs, with $3.5 million recorded as a gain from discontinued operations in the fourth quarter of 2006 and the remaining $4.2 million in the first quarter of 2007.
In connection with the June 2002 sale of assets, we agreed to be responsible for certain related historical environmental obligations and also agreed to indemnify the purchaser from certain potential liabilities with respect to the historical sulphur operations engaged in by Freeport Sulphur and its
predecessor companies, including reclamation obligations. In addition, we assumed, and agreed to indemnify the purchaser from certain potential obligations, including environmental obligations, other than liabilities existing and identified as of the closing of the sale, associated with the historical oil and gas operations undertaken by the Freeport-McMoRan companies prior to the 1997 merger of Freeport-McMoRan Inc. and IMC Global. As of December 31, 2008, we have paid approximately $0.2 million to settle certain claims related to these assumed liabilities. See Item 1A. “Risk Factors” included in this Form 10-K for more information with respect to these risks. Our discontinued operations’ results are summarized in Note 12.
CAPITAL RESOURCES AND LIQUIDITY
The table below summarizes our cash flow information by categorizing the information as cash provided by or used in operating, investing and financing activities and distinguishing between our continuing and discontinued operations (in millions).
| | For Year Ended December 31, | |
| | 2008 | | 2007 | | 2006 | |
| Continuing operations | | | | | | | | | |
| Operating | $ | 629.7 | | $ | 209.6 | | $ | 100.1 | |
| Investing | | (239.2 | ) | | (1,195.2 | ) | | (231.1 | ) |
| Financing | | (295.5 | ) | | 974.6 | | | 22.8 | |
| | | | | | | | | | |
| Discontinued operations | | | | | | | | | |
| Operating | $ | (6.3 | ) | $ | (2.0 | ) | $ | (4.9 | ) |
| Investing | | - | | | - | | | - | |
| Financing | | - | | | - | | | - | |
| | | | | | | | | | |
| Total cash flow | | | | | | | | | |
| Operating | $ | 623.4 | | $ | 207.6 | | $ | 95.2 | |
| Investing | | (239.2 | ) | | (1,195.2 | ) | | (231.1 | ) |
| Financing | | (295.5 | ) | | 974.6 | | | 22.8 | |
Comparison of Year-To-Year Cash Flows
Operating Cash Flows
Our 2008 operating cash flow continued to reflect increased oil and gas revenues reflecting production from our 2007 oil and gas property acquisition reduced by increased working capital requirements. Compared with 2006, operating cash flow from our continuing operations in 2007 primarily reflects increased oil and gas revenues reflecting production from the 2007 oil and gas property acquisition partially reduced by working capital requirements associated with our operations. Our 2006 operating cash flow increased over the comparable 2005 amount because of increased oil and gas revenues partially offset by increased working capital requirements and a $12.4 million net payment to settle class action litigation. Our operating cash flow during 2006 also reflected a $11.0 million net reimbursement of previously incurred exploration costs resulting from exploration agreements negotiated during 2006.
Cash used in our discontinued operations in 2008 reflected the remaining limited activity at our Port Sulphur, Louisiana facilities. Cash used in our discontinued operations during 2007 reflected increased reclamation activities associated with the closure of the inactive Port Sulphur, Louisiana facilities. We paid $3.5 million in reclamation costs associated with these facilities in 2007. Cash used in our discontinued operations primarily reflected $3.1 million of reclamation costs paid for work performed at Port Sulphur as well as other caretaking costs related to the facility. We estimate that we will incur the remaining $11.3 million of estimated closure costs in 2009 and 2010 under currently anticipated closure activities, which are subject to change pending regulatory approval (Note 12).
Investing Cash Flows
Our 2008 investing cash flow reflects capital expenditures of $236.4 million, representing our exploratory drilling and development costs.
Our investing cash flow in 2007 reflects the 2007 oil and gas property acquisition cost of $1.05 billion, net of purchase price adjustments (Note 2), and capital expenditures of $153.2 million, representing our exploratory drilling and development costs. Our investing cash flows also reflect the release to us of $6.1 million of previously escrowed U.S. government notes, which we used to pay the semi-annual interest payments on our 5¼% convertible senior notes on April 6, 2007 and October 6, 2007.
Our investing cash flow in 2006 reflects capital expenditures of $252.4 million. Our investing cash flows also reflect the release to us of $16.5 million of previously escrowed U.S. government notes. During 2006, we used $3.9 million and $3.1 million of these escrowed funds to pay the semi-annual interest payments on our 6% convertible senior notes on January 2, 2006 and July 2, 2006, respectively, and an aggregate $6.0 million to pay the $3.0 million semi-annual interest payments on our 5¼% convertible senior notes on April 6, 2006 and October 6, 2006. The remaining $3.5 million relates to the funding of the debt conversion transaction (see “— Convertible Senior Notes” below).
Financing Cash Flows
In 2008, we repaid $274.0 million in net borrowings under our senior secured revolving credit facility and $2.7 million to induce conversion of $79.3 million of our convertible senior notes. We also paid $23.6 million in dividends on our preferred stock and inducement payments on the early conversion of approximately 990,000 shares of our 6¾% convertible preferred stock.
Cash flow from our financing activities during 2007 primarily reflects the funding of the acquisition price for 2007 oil and gas property acquisition. At closing, we borrowed $800 million under a bridge loan agreement and $394 million under our senior secured revolving credit facility. In November 2007, we repaid the bridge loan following sales of shares of our 6¾% mandatorily redeemable preferred stock and common stock, which resulted in net proceeds of $450.6 million, and $300 million of 11.875% senior notes due 2014. Costs associated with these financing transactions totaled $30.6 million. Total net borrowings under our revolving credit facility totaled $245.3 million in 2007. In 2007, our cash flow from financing activities also reflect $10.4 million of proceeds from the exercise of stock based awards, including the exercise of warrants for 1.74 million shares (Note 6) and $1.1 million of preferred stock dividend payments. For more information regarding our 2007 financing transactions see “Senior Secured Revolving Credit Facility,” “11.875% Senior Notes, ” “Convertible Senior Notes,” “Unsecured Bridge Loan Facility,” “Senior Term Loan,” and “Equity Offerings” below.
Cash provided by our financing activities during 2006 primarily reflects $28.8 million of net borrowings under our revolving credit facility. We incurred costs of $0.5 million to establish the revolving credit facility. Our financing activities also included payments totaling $4.3 million in our debt conversion transactions (see “— Senior Convertible Notes” below). Financing activities also included the payment of $1.5 million of dividends on our 5% convertible preferred stock and proceeds of $0.4 million from the exercise of stock options.
Senior Secured Revolving Credit Facility
Our variable rate senior secured revolving credit facility (credit facility) was amended and expanded in connection with the closing of the 2007 oil and gas property acquisition and matures in August 2012. The borrowing capacity was $400 million at December 31, 2008. There were no borrowings outstanding at December 31, 2008. We have $100 million of letters of credit issued under the credit facility to support the reclamation obligations assumed in the 2007 oil and gas property acquisition (Note 2). At December 31, 2008, our unused borrowing capacity under the credit facility totaled $300 million.
Availability under our credit agreement is subject to a borrowing base based on estimates of MOXY’s oil and natural gas reserves, which is subject to redetermination by the lenders semi-annually each April 1 and October 1. We expect that the recent sharp decline in oil and natural gas prices will result in a reduction in our borrowing base, which reduction could be significant. The variable-rate facility is secured by (1) substantially all the oil and gas properties of MOXY and its subsidiaries and (2) a pledge of our ownership interest in MOXY and MOXY’s ownership interest in each of its wholly owned subsidiaries. The facility is guaranteed by McMoRan and each of MOXY’s wholly owned subsidiaries.
The credit facility contains covenants and other restrictions customary for oil and gas borrowing base credit facilities, including limitations on debt, liens, dividends, voluntary redemptions of debt,
investments, asset sales and transactions with affiliates. In addition, the credit facility requires that we maintain certain financial tests, including a leverage test (Total Debt to EBITDAX, as those terms are defined in the facility, for the preceding four quarters) and a secured leverage test (First Lien Debt to EBITDAX, as those terms are defined in the facility, for the preceding four quarters), and a current ratio test (current assets to current liabilities, subject to certain adjustments as of the end of the quarter).
We were in compliance with these covenants at December 31, 2008. During the third quarter of 2008, we entered into a second amendment to the credit facility which, among other things, (i) provided us with the ability to terminate, cancel or unwind any swap agreement associated with hedges of oil and gas prices that were previously entered into pursuant to the terms of the credit facility; and (ii) permits us to induce conversion of our 6¾% preferred stock into shares of our common stock subject to limitations on the amount of cash used to effect such inducements. We induced the conversion of a portion of our 6¾% preferred stock in the third quarter of 2008 (Note 10).
11.875% Senior Notes
On November 14, 2007, we completed the offering and sale of $300 million of our 11.875% senior notes (senior notes). Net proceeds from the sale of the senior notes of approximately $292 million were used, along with additional borrowings on our credit facility, to repay the remaining approximate $350 million of the bridge loan that remained outstanding after application of the net proceeds from the concurrent offerings of shares of our common stock and 6¾% mandatory convertible preferred stock. Interest on the senior notes is payable semi-annually (May 15 and November 15). The senior notes are due on November 15, 2014. We may redeem some or all of these notes at our option at make-whole redemption prices prior to November 15, 2011, and afterwards at stated redemption prices (Note 8).
Convertible Senior Notes
Our 5¼% convertible senior notes due October 6, 2011 (5¼% notes) totaled $74.7 million at December 31, 2008. The 5¼% notes are convertible into shares of our common stock at the election of the holder at any time prior to maturity at a $16.575 per share conversion price (Note 8). Beginning on October 9, 2009, we have the option of redeeming the 5¼% notes for a price equal to 100 percent of the principal amount of the notes plus any accrued and unpaid interest on these notes prior to the redemption date provided the closing price of our common stock has exceeded 130 percent of the conversion price for at least 20 trading days in any consecutive 30-day trading period.
During 2008, we privately negotiated transactions to induce the conversion of $40.2 million of our 5¼% notes into approximately 2.4 million shares of our common stock. We paid an aggregate $1.7 million in cash to induce these conversions, which is reflected as non-operating expense in the consolidated statements of operations.
Our 6% convertible senior notes (6% notes) were due on July 2, 2008. During 2008, we privately negotiated transactions to induce the conversion of $39.1 million of our 6% notes into approximately 2.75 million shares of our common stock. We paid an aggregate of $1.0 million in cash to induce these conversions, which is reflected as non-operating expense in the consolidated statements of operations. Additionally, $61.7 million of the 6% notes were converted into approximately 4.3 million shares of our common stock in accordance with the terms of the 6% notes (including the 6% notes converted into shares of common stock upon maturity on July 2, 2008).
The 5¼% convertible notes are unsecured and the 6% notes were unsecured when they remained outstanding. However, we used a portion of the net proceeds at closing of each series of convertible notes to purchase U.S. government securities to secure the first six semi-annual interest payments that were placed into escrow. We purchased $21.2 million of these government securities for the 5¼% notes and $22.9 million for the 6% notes. Interest payments on the 5¼% are due on April 6 and October 6. Our last interest payment on the 6% notes was due on July 2, 2008. In 2007, we used the last remaining escrowed funds to pay the interest on the 5¼% notes. Additionally, in 2006, a portion of then outstanding balances on these senior notes were converted to equity through privately negotiated transactions.
Unsecured Bridge Loan Facility
On August 6, 2007, we entered into a credit agreement in conjunction with the 2007 oil and gas property acquisition. The credit agreement provided for an $800 million interim bridge loan facility (bridge loan). We borrowed the entire $800 million available under the bridge loan to partially fund the acquisition
price. In November 2007, we used the net proceeds from the public offering of shares of our common stock, our 6¾% convertible preferred stock (see ““— Equity Offerings” below), our 11.875% senior notes due 2014 (see “—11.875% Senior Notes” below) as well as additional borrowings under our credit facility to fully repay and terminate the bridge loan.
Senior Term Loan
Effective January 19, 2007, we entered into a senior term loan agreement (term loan). The term loan agreement provided for a five-year, $100 million term loan facility. Proceeds at closing, net of related fees and discounts, totaled approximately $98.0 million. We used the net proceeds to repay borrowings then outstanding at that time under our previous revolving credit facility. At the closing of the 2007 oil and gas property acquisition, we repaid this loan (Note 8).
Equity Offerings
In November 2007, we completed a public offering of 16.9 million shares of our common stock at $12.40 per share and a concurrent public offering of 2.59 million shares of our 6¾% mandatory convertible preferred stock (6¾% preferred stock) with an offering price of $100 per share (Note 10). The net proceeds from these offerings, after deducting the underwriters’ discounts, were approximately $450 million. These proceeds were used to partially repay the bridge loan used in connection with the 2007 oil and gas property acquisition.
Each share of the 6¾% preferred stock has a par value of $100 and holders are entitled to receive quarterly cash dividends at rate of $1.6785 per share, with the exception of the first dividend payment which was paid February 15, 2008 at $1.8375 per share. The 6¾% preferred stock is convertible into between 17.4 million and 20.9 million shares of our common stock depending on the price of our common stock, subject to anti-dilution adjustments. The 6¾% preferred stock will automatically convert on November 15, 2010. Holders may elect at any time before November 15, 2010 to convert at a conversion rate equal to 6.7204 shares of common stock for each share of 6¾% preferred stock.
In 2008, we agreed in a privately negotiated transaction to induce conversion of approximately 990,000 shares of our 6¾% preferred stock (approximately 40% of the original issuance), with a liquidation preference of approximately $99 million, into approximately 6.7 million shares of our common stock (based on the minimum conversion rate of 6.7204 shares of common stock for each share of 6¾% preferred stock). We paid an aggregate $7.4 million in cash to the holders of these shares to induce the conversion of this 6¾% preferred stock, which is recorded as a $7.4 million charge to preferred dividends in the third quarter of 2008. Preferred dividend payment savings related to this transaction approximate $15 million through the November 2010 mandatory conversion date of the securities. Following this transaction, the remaining outstanding 6¾% preferred stock is convertible into between 10.7 million and 12.8 million shares of our common stock depending on the price of our common stock, subject to anti-dilution adjustments.
In June 2002, we completed a $35 million public offering of 1.4 million shares of our 5% mandatorily redeemable convertible preferred stock (5% preferred stock) (Note 10). Dividends accrued on the 5% preferred stock totaled $0.7 million in 2007 and $1.5 million in 2006. In the second quarter of 2007, we issued a call for the redemption of the 5% preferred stock, effective June 30, 2007. Prior to the effective redemption date, the holders of the 5% preferred stock elected to convert all of the approximate remaining 1.2 million shares of convertible preferred stock outstanding into approximately 6.2 million shares of our common stock. Each share of 5% preferred stock was converted into 5.1975 shares of our common stock, or an equivalent of $4.81 per share.
Contractual Obligations and Commitments
In addition to our accounts payable and accrued liabilities ($166.6 million at December 31, 2008), we have other contractual obligations and commitments that will require payments in 2009 and beyond.
The table below summarizes the maturities of our 5¼% notes and senior notes, our expected payments for retiree medical costs (Notes 13 and 17), our current exploration and development commitments and our remaining minimum annual lease payments as of December 31, 2008 (in millions):
| | Debt and | | | | | | | | | | |
| | Convertible | | Interest | | Retirement | | Oil & Gas | | Lease | | |
| | Securities a | | Paymentsb | | Benefitsc | | Obligationsd | | Paymentse | | Total |
| 2009 | $ | - | | $ | 44.7 | | $ | 1.4 | | $ | 174.6 | | $ | 2.3 | | $ | 223.0 |
| 2010 | | - | | | 44.7 | | | 1.4 | | | 93.3 | | | 2.3 | | | 141.7 |
| 2011 | | 74.7 | | | 44.7 | | | 1.4 | | | 0.4 | | | 2.3 | | | 123.5 |
| 2012 | | - | | | 37.4 | | | 1.4 | | | 5.3 | | | 2.3 | | | 46.4 |
| 2013 | | - | | | 35.6 | | | 1.3 | | | 5.3 | | | 2.3 | | | 44.5 |
| Thereafter | | 300.0 | | | 31.2 | | | 6.2 | | | 0.1 | | | 1.2 | | | 338.7 |
| Total | $ | 374.7 | | $ | 238.3 | | $ | 13.1 | | $ | 279.0 | | $ | 12.7 | | $ | 917.8 |
| a. | Amounts due upon maturity subject to change based on future conversions by the holders of the securities. |
| b. | Reflects interest and unused commitment fees on the debt balances and availability as of December 31, 2008. We did not have any amounts outstanding under our credit facility as of December 31, 2008; therefore, we assumed a zero percent effective annual interest rate on our credit facility and a 1.94 percent and 0.38 percent interest rate on outstanding letters of credit ($100 million) and unused commitment fee, respectively. Interest on the convertible senior notes is fixed. |
| c. | Includes anticipated payments under our employee retirement health care plan through 2018 (Note 13) and our future reimbursements associated with the contractual liability covering certain of our former sulphur retiree’s medical costs (Note 17). |
| d. | These oil & gas obligations primarily reflect our net working interest share of authorized exploration and development project costs at December 31, 2008 (see below for total estimated exploration and development expenditures for 2009). Included in these amounts is $130.2 million of expenditures for drilling rig contract charges which we expect to share with our partners in our exploration program. Also includes escrow payments to support the funding requirements related to the 2007 oil and gas acquisition property reclamation obligations (Note 17). |
| e. | Amount primarily reflects leases for office space in two buildings in Houston, Texas, which terminate in April 2014 and July 2014, respectively and office space in Lafayette, Louisiana which terminates in November 2011. |
We are currently meeting our MMS financial obligations relating to the future abandonment of our Main Pass sulphur facilities using financial assurances from MOXY. We and our subsidiaries’ ongoing compliance with applicable MMS requirements are subject to meeting certain financial and other criteria.
We continue to closely monitor the recent disruption in the global financial and capital markets, as well as the recent significant decline in the market price for oil and natural gas. We have reduced our planned 2009 exploration, development and other capital expenditures and currently expect these expenditures to approximate $230 million, including approximately $100 million in exploration costs, $75 million in development costs and $55 million in costs incurred in 2008 that will be funded in 2009. Our capital spending will continue to be driven by opportunities and will be managed based on our available cash and cash flows. We also expect to spend approximately $115 million in 2009 to abandon and remove oil and gas structures from the Gulf of Mexico, most of which is associated with the removal of structures damaged during the 2005 and 2008 hurricane seasons. We believe we are entitled to a substantial recovery under our insurance program for these costs, and in the near-term, we expect to receive a $20.0 million advance payment on this claim. We plan to fund our exploration, development and reclamation activities with our cash on hand, operating cash flow and availability under our variable rate senior secured revolving credit facility (see “— Senior Secured Revolving Credit Facility” above). Our expected level of capital expenditures is subject to change depending on the number of wells drilled, the result of our exploratory drilling, participant elections, availability of drilling rigs, the time it takes to drill each well, related personnel and material costs, and other factors, many of which are beyond our control. If these conditions persist or energy prices do not recover, we will respond to any impact on our operations, including but not limited to, further reducing capital expenditures. For more information regarding risk factors affecting our drilling operations, see Item 1A. “Risk Factors” included in this Form 10-K.
CRITICAL ACCOUNTING POLICIES AND ESTIMATES
Management’s Discussion and Analysis of our financial condition and results of operations is based upon our consolidated financial statements, which have been prepared in conformity with
U.S. generally accepted accounting principles. The preparation of these statements requires that we make estimates and assumptions that affect the reported amounts of assets, liabilities, revenues and expenses. We base these estimates on historical experience and on assumptions that we consider reasonable under the circumstances; however, reported results could differ from the current estimates under different assumptions and/or conditions. The areas requiring the use of management’s estimates are discussed in Note 1 under the heading “Use of Estimates.” The assumptions and estimates described below are our critical accounting estimates.
Management has reviewed the following discussion of its development and selection of critical accounting estimates with the Audit Committee of our Board of Directors.
Reclamation Costs. Both our oil and gas and former sulphur operations have significant obligations relating to the dismantling and removal of structures used in the production or storage of proved reserves and the plugging and abandoning of wells used to extract the proved reserves. The substantial majority of our reclamation obligations are associated with facilities located in the Gulf of Mexico, which are subject to the regulatory authority of the MMS. The MMS ensures that offshore leaseholders fulfill the abandonment and site clearance responsibilities related to their properties in accordance with applicable laws and regulations in existence at the time such activities are concluded. Current laws and regulations stipulate that upon completion of operations, the field is to be restored to substantially the same condition as it was before extraction operations commenced. Beginning in 2006, we became obligated for reclamation obligations related to wells and facilities located onshore Louisiana, which are subject to the laws and regulations of the State of Louisiana.
We also assumed responsibility for future liabilities associated with the 2007 oil and gas property acquisition. Among these reclamation obligations are the plugging and abandonment of wells, the reclamation and removal of platforms, facilities and pipelines, and the repair and replacement of wells, equipment and facilities, including obligations associated with damages sustained from Hurricanes Ivan, Katrina, Rita and Ike. We record the fair value of our estimated asset retirement obligations in the period such obligations are incurred, rather than accruing the obligations as the related reserves are produced.
Our sulphur reclamation obligations are associated with our former sulphur mining operations. In June 2000 we elected to cease all sulphur mining operations, and at that time fully accrued the estimated reclamation costs associated with our Main Pass sulphur mine and related facilities and the related storage facilities at Port Sulphur, Louisiana. We had previously fully accrued all estimated costs associated with the closed Caminada and Grand Ecaille sulphur mines and related facilities. During 2002, we entered into fixed cost contracts to perform a substantial portion of our sulphur reclamation work. All the work associated with the Caminada mine and related facilities was subsequently completed and the reclamation work on structures not essential to any future business opportunities at Main Pass has also been substantially completed (Note 12).
The accounting estimates related to reclamation costs are critical accounting estimates because 1) the cost of these obligations is significant to us; 2) we will not incur most of these costs for a number of years, requiring us to make estimates over a long period; 3) new laws and regulations regarding the standards required to perform our reclamation activities could be enacted and such changes could materially change our current estimates of the costs to perform the necessary work; 4) calculating the fair value of our asset retirement obligations requires management to assign probabilities and projected cash flows, to make long-term assumptions about inflation rates, to determine our credit-adjusted, risk-free interest rates and to determine market risk premiums that are appropriate for our operations; and 5) given the magnitude of our estimated reclamation and closure costs, changes in any or all of these estimates could have a material impact on our results of operations and our ability to fund these costs.
We use estimates in determining our estimated asset retirement obligations under multiple probability scenarios reflecting a range of possible outcomes considering the future costs to be incurred, the scope of work to be performed and the timing of such expenditures. To calculate the fair value of the estimated obligations, we apply an estimated long-term inflation rate of 2.5 percent and a market risk premium of 10 percent, which is based on market-based estimates of rates that a third party would have to pay to insure its exposure to possible future increases in the costs of these obligations. We discount the resulting projected cash flows at our estimated credit-adjusted, risk-free interest rates for the corresponding time periods over which these costs would be incurred.
We revise our reclamation and well abandonment estimates whenever warranted by events but at a minimum at least once every year. Revisions have been made for (1) the inclusion of estimates for new properties; (2) changes in the projected timing of certain reclamation costs because of changes in the estimated timing of the depletion of the related proved reserves for our oil and gas properties and new estimates for the timing of the reclamation for the structures comprising the MPEHtm project and Port Sulphur facilities; and (3) changes in our credit-adjusted, risk-free interest rate. Over the period these reclamation costs would be incurred, the credit-adjusted, risk-free interest rates ranged from 8.5 percent to 13.1 percent at December 31, 2008 and 8.5 percent to 10.0 percent at December 31, 2007.
The following table summarizes the estimates of our reclamation obligations at December 31, 2008 and 2007 (in thousands):
| | Oil and Gas | | Sulphur |
| | 2008 | | 2007 | | 2008 | | 2007 |
| Undiscounted cost estimates | $ | 642,155 | | $ | 448,095 | | $ | 42,557 | | $ | 38,712 |
| Discounted cost estimates | $ | 421,201 | | $ | 294,737 | | $ | 23,003 | | $ | 21,300 |
The following table summarizes the approximate effect of a 1 percent change in both the estimated inflation and market risk premium rates (in millions):
| | Inflation Rate | | Market Risk Premium | |
| | +1% | | -1% | | +1% | | -1% | |
| Oil & Gas reclamation obligations: | | | | | | | | | | | | |
| Undiscounted | $ | 28.4 | | $ | (29.7 | ) | $ | 2.6 | | $ | (6.6 | ) |
| Discounted | | 14.5 | | | (14.8 | ) | | 3.4 | | | (3.6 | ) |
| Sulphur reclamation obligations: | | | | | | | | | | | | |
| Undiscounted | | 5.0 | | | (5.0 | ) | | 0.4 | | | (0.4 | ) |
| Discounted | | 1.1 | | | (0.9 | ) | | 0.2 | | | (0.2 | ) |
Depletion, Depreciation and Amortization, Including Impairment Charges. As discussed in Note 1, depletion, depreciation and amortization for our oil and gas producing assets is calculated on a field-by-field basis using the units-of-production method based on current estimates of our proved and proved developed reserves. Unproved properties having individually significant leasehold acquisition costs on which management has specifically identified an exploration prospect and plans to explore through drilling activities are individually assessed for impairment. We have fully depreciated all of our other remaining depreciable assets.
The accounting estimates related to depletion, depreciation, and amortization are critical accounting estimates because:
| 1) | The determination of our proved oil and natural gas reserves involves inherent uncertainties. The accuracy of any reserve estimate depends on the quality of available data and the application of engineering and geological interpretations and judgments. Different reserve engineers may make different estimates of proved reserve quantities and estimates of cash flows based on varying interpretations of the same available data. Estimates of proved reserves for wells with limited or no production history are less reliable than those based on actual production history. |
| 2) | The assumptions used in determining whether reserves can be produced economically can vary. The key assumptions used in estimating our proved reserves include: |
| a) | Estimated future oil and natural gas prices and future operating costs. |
| b) | Projected production levels and the timing and amounts of future development, remedial, and abandonment costs. |
| c) | Assumed effects of government regulations on our operations. |
| d) | Historical production from the area compared with production in similar producing areas. |
Changes to our estimates of proved reserves could result in changes to our depletion, depreciation and amortization expense, with a corresponding effect on our results of operations. If estimated proved reserves for each property were 10 percent higher at December 31, 2008, we estimate that our depletion, depreciation and amortization expense for 2008 would have decreased by approximately $33.8 million, while a 10 percent decrease in estimated proved reserves for each property would have resulted in an approximate $37.7 million increase in our depletion, depreciation and amortization expense for 2008. Changes in our estimates of proved reserves may also affect our assessment of asset impairment (see below). We believe that if our aggregate estimated proved reserves were revised, such a revision could have a material impact on our results of operations, liquidity and capital resources.
As discussed in Notes 1 and 6, we review and evaluate our oil and gas properties for impairment when events or changes in circumstances indicate that the related carrying amounts may not be recoverable. In these impairment analyses we consider both our proved reserves and risk assessed probable reserves, which generally are subject to a greater level of uncertainty than our proved reserves. Decreases in reserve estimates may cause us to record asset impairment charges against our results of operations.
Postretirement and Other Employee Benefits Costs. As discussed in Note 17, we have a contractual obligation to reimburse a third party for a portion of their postretirement medical benefit costs relating to certain retired former sulphur employees. This obligation is based on numerous estimates of future health care cost trends, retired sulphur employees’ life expectancy, liability discount rates and other factors. We also have similar obligations for our employees, although the number of employees covered by our plan is significantly less than those covered under our contractual obligation to the third party. The amount of these postretirement and other employee benefit costs are critical accounting estimates because fluctuations in health care cost trend rates and liability discount rates may affect the amount of future payments we would expect to make.
To evaluate the present value of the contractual liability at December 31, 2008, an initial health care cost trend of 8.5 percent was used in 2009, with annual ratable decreases until reaching 5.0 percent in 2016. A one percentage point increase in the initial health care cost trend rate would have increased our recorded liability by $0.5 million at December 31, 2008; while a one percentage point decrease would have reduced our recorded liability by $0.7 million. We used a 9.5 percent discount at December 31, 2008 and a 8.5 percent discount rate at December 31, 2007. A one-percentage point increase in the discount rate would have decreased our net loss by approximately $0.3 million in 2008, while a one-percentage point decrease in the discount rate would have increased our net loss by approximately $0.3 million.
DISCLOSURES ABOUT MARKET RISKS
Our revenues are primarily derived from the sale of crude oil and natural gas. Our results of operations and cash flow can vary significantly with fluctuations in the market prices of these commodities. Based on the currently projected sales volumes of natural gas and oil for 2009, excluding the sales quantity amounts associated with our current oil and gas derivative contract amounts (see below), a change of $1.00 per MMbtu in the average realized price would have an approximate $62 million net impact on our revenues and pre-tax operating results and a $5 per barrel change in average oil realization would have an approximate $17 million net impact on our revenues and pre-tax operating results. Based on our currently projected sales volumes for 2009, excluding those volumes committed for sale under our existing oil and gas derivative contracts, a 10 percent fluctuation in natural gas sales volumes would impact our revenues by approximately $34 million and our pre-tax operating results by approximately $13 million while a 10 percent fluctuation in our oil sales volumes would have an approximate $16 million impact on revenues and an approximate $9 million impact on our pre-tax operating results.
Our production is subject to certain uncertainties, many of which are beyond our control, including the timing and flow rates associated with the initial production from our discoveries, weather-related factors, shut-in or recompletion activities on any of our oil and gas properties or on third-party owned pipelines or facilities and the state of the financial and commodity markets. Any of these factors, among others, could materially affect our estimated annualized sales volumes. For more information regarding risks associated with oil and gas production see Item 1A. “Risk Factors” of this Form 10-K.
We do not have any amounts outstanding under our credit facility; however, if we did, the credit facility has a variable rate which exposes us to interest rate risk. At the present time we do not hedge our exposure to fluctuations in interest rates.
In connection with our 2007 oil and gas property acquisition, we entered into various hedging contracts for a portion of our projected 2008-2010 sales of oil and natural gas (Note 9). The sensitivity of a $1.00 per MMbtu change from the average swap price for the natural gas volumes covered by the hedging contracts is $7.3 million in 2009 and $2.6 million in 2010. The sensitivity of a $5.00 per barrel change in the average swap price for the oil volumes covered by the hedging contracts is $1.6 million in 2009 and $0.6 million in 2010. The sensitivity of a $1.00 per MMbtu change in natural gas prices from the $6.00 per MMbtu contract put price is approximately $3.2 million in 2009 and $1.2 million in 2010. The sensitivity of a $5.00 per barrel change in crude oil prices from the $50.00 per barrel contract put price is approximately $0.6 million in 2009 and $0.3 million in 2010.
Since we conduct all of our operations within the U.S. in U.S. dollars and have no investments in equity securities, we currently are not subject to foreign currency exchange risk or equity price risk.
NEW ACCOUNTING STANDARDS
For information regarding our adoption of new accounting standards, see Note 1 in Item 8. of this Form 10-K.
ENVIRONMENTAL
We and our predecessors have a history of commitment to environmental responsibility. Since the 1940’s, long before public attention focused on the importance of maintaining environmental quality, we have conducted pre-operational, bioassay, marine ecological and other environmental surveys to ensure the environmental compatibility of our operations. Our environmental policy commits our operations to compliance with local, state, and federal laws and regulations, and prescribes the use of periodic environmental audits of all facilities to evaluate compliance status and communicate that information to management. We believe that our operations are being conducted pursuant to necessary permits and are in compliance in all material respects with the applicable laws, rules and regulations. We have access to environmental specialists who have developed and implemented corporate-wide environmental programs. We continue to study methods to reduce discharges and emissions.
Federal legislation (sometimes referred to as “Superfund” legislation) imposes liability for cleanup of certain waste sites, even though waste management activities were performed in compliance with regulations applicable at the time of disposal. Under the Superfund legislation, one responsible party may be required to bear more than its proportional share of cleanup costs if adequate payments cannot be obtained from other responsible parties. In addition, federal and state regulatory programs and legislation mandate clean up of specific wastes at operating sites. Governmental authorities have the power to enforce compliance with these regulations and permits, and violators are subject to civil and criminal penalties, including fines, injunctions or both. Third parties also have the right to pursue legal actions to enforce compliance. Liability under these laws can be significant and unpredictable. We have, at this time, no known significant liability under these laws.
We estimate the costs of future expenditures to restore our oil and gas and sulphur properties to a condition that we believe complies with environmental and other regulations. These estimates are based on current costs, laws and regulations. These estimates are by their nature imprecise and are subject to revision in the future because of changes in governmental regulation, operation, technology and inflation. For more information regarding our current reclamation and environmental obligations see “— Critical Accounting Policies and Estimates” above.
We have made, and will continue to make, expenditures at our operations for the protection of the environment. Continued government and public emphasis on environmental issues can be expected to result in increased future investments for environmental controls, which will be charged against income from future operations. Present and future environmental laws and regulations applicable to current operations may require substantial capital expenditures and may affect operations in other ways that cannot now be accurately predicted.
We maintain insurance coverage in amounts deemed prudent for certain types of damages associated with environmental liabilities that arise from sudden, unexpected and unforeseen events. The cost and amount of such insurance for the oil and gas industry is subject to overall insurance market conditions, which were significantly adversely affected by 2005 and 2008 hurricane activity.
CAUTIONARY STATEMENT
Management’s Discussion and Analysis of Financial Condition and Results of Operation contain forward-looking statements. All statements other than statements of historical fact in this report, including, without limitation, statements, plans and objectives of our management for future operations and our exploration and development activities are forward-looking statements. Factors that may cause our future performance to differ from that projected in the forward-looking statements are described in more detail under “Risk Factors” in Item 1A. of this Form 10-K.
_________________________
MANAGEMENT’S REPORT ON INTERNAL CONTROL OVER FINANCIAL REPORTING
Our management is responsible for establishing and maintaining adequate internal control over financial reporting. Internal control over financial reporting is defined in Rule 13a-15(f) or 15d-15(f) under the Securities Exchange Act of 1934 as a process designed by, or under the supervision of, the Company’s principal executive and principal financial officers and effected by the Company’s Board of Directors, management and other personnel, to provide reasonable assurance regarding the reliability of financial reporting and the preparation of financial statements for external purposes in accordance with generally accepted accounting principles and includes those policies and procedures that:
| · | Pertain to the maintenance of records that in reasonable detail accurately and fairly reflect the transactions and dispositions of the Company’s assets; |
| · | Provide reasonable assurance that transactions are recorded as necessary to permit preparation of financial statements in accordance with generally accepted accounting principles, and that receipts and expenditures of the Company are being made only in accordance with authorizations of management and directors of the Company; and |
| · | Provide reasonable assurance regarding prevention or timely detection of unauthorized acquisition, use or disposition of the Company’s assets that could have a material effect on the financial statements. |
Because of its inherent limitations, internal control over financial reporting may not prevent or detect misstatements. Projections of any evaluation of effectiveness to future periods are subject to the risk that controls may become inadequate because of changes in conditions, or that the degree of compliance with the policies or procedures may deteriorate.
Our management, including our principal executive officer and principal financial officer, assessed the effectiveness of our internal control over financial reporting as of the end of the fiscal year covered by this annual report on Form 10-K. In making this assessment, our management used the criteria set forth in Internal Control-Integrated Framework issued by the Committee of Sponsoring Organizations of the Treadway Commission (COSO). Based on our management’s assessment, management concluded that, as of the end of the fiscal year covered by this annual report on Form 10-K, our Company’s internal control over financial reporting is effective based on the COSO criteria.
Ernst & Young LLP, an independent registered public accounting firm, who audited the Company’s consolidated financial statements included in this Form 10-K, has issued an attestation report on the Company’s internal control over financial reporting, which is included herein.
| Glenn A. Kleinert | Nancy D. Parmelee |
| President and Chief | Senior Vice President, |
| Executive Officer | Chief Financial Officer and |
| | Secretary |
REPORT OF INDEPENDENT REGISTERED PUBLIC ACCOUNTING FIRM
TO THE STOCKHOLDERS AND BOARD OF DIRECTORS
OF McMoRan EXPLORATION Co.:
We have audited McMoRan Exploration Co.’s internal control over financial reporting as of December 31, 2008, based on criteria established in Internal Control-Integrated Framework issued by the Committee of Sponsoring Organizations of the Treadway Commission (the COSO criteria). McMoRan’s management is responsible for maintaining effective internal control over financial reporting, and for its assessment of the effectiveness of internal control over financial reporting included in the accompanying Management’s Report on Internal Control Over Financial Reporting. Our responsibility is to express an opinion on the Company’s internal control over financial reporting based on our audit.
We conducted our audit in accordance with the standards of the Public Company Accounting Oversight Board (United States). Those standards require that we plan and perform the audit to obtain reasonable assurance about whether effective internal control over financial reporting was maintained in all material respects. Our audit included obtaining an understanding of internal control over financial reporting, assessing the risk that a material weakness exists, testing and evaluating the design and operating effectiveness of internal control based on the assessed risk, and performing such other procedures as we considered necessary in the circumstances. We believe that our audit provides a reasonable basis for our opinion.
A company’s internal control over financial reporting is a process designed to provide reasonable assurance regarding the reliability of financial reporting and the preparation of financial statements for external purposes in accordance with generally accepted accounting principles. A company’s internal control over financial reporting includes those policies and procedures that (1) pertain to the maintenance of records that, in reasonable detail, accurately and fairly reflect the transactions and dispositions of the assets of the company; (2) provide reasonable assurance that transactions are recorded as necessary to permit preparation of financial statements in accordance with generally accepted accounting principles, and that receipts and expenditures of the company are being made only in accordance with authorizations of management and directors of the company; and (3) provide reasonable assurance regarding prevention or timely detection of unauthorized acquisition, use, or disposition of the company’s assets that could have a material effect on the financial statements.
Because of its inherent limitations, internal control over financial reporting may not prevent or detect misstatements. Also, projections of any evaluation of effectiveness to future periods are subject to the risk that controls may become inadequate because of changes in conditions, or that the degree of compliance with the policies or procedures may deteriorate.
In our opinion, McMoRan Exploration Co. maintained, in all material respects, effective internal control over financial reporting as of December 31, 2008, based on the COSO criteria.
We have also audited, in accordance with the standards of the Public Company Accounting Oversight Board (United States), the consolidated balance sheets of McMoRan Exploration Co. as of December 31, 2008 and 2007, and the related consolidated statements of operations, cash flow, and changes in stockholders’ equity for each of the three years in the period ended December 31, 2008, and our report dated February 26, 2009 expressed an unqualified opinion thereon.
New Orleans, Louisiana
February 26, 2009
TABLE OF CONTENTS
REPORT OF INDEPENDENT REGISTERED PUBLIC ACCOUNTING FIRM
TO THE STOCKHOLDERS AND BOARD OF DIRECTORS
OF McMoRan EXPLORATION CO.:
We have audited the accompanying consolidated balance sheets of McMoRan Exploration Co. as of December 31, 2008 and 2007, and the related consolidated statements of operations, cash flows, and changes in stockholders’ equity for each of the three years in the period ended December 31, 2008. These financial statements are the responsibility of the Company’s management. Our responsibility is to express an opinion on these financial statements based on our audits.
We conducted our audits in accordance with the standards of the Public Company Accounting Oversight Board (United States). Those standards require that we plan and perform the audit to obtain reasonable assurance about whether the financial statements are free of material misstatement. An audit includes examining, on a test basis, evidence supporting the amounts and disclosures in the financial statements. An audit also includes assessing the accounting principles used and significant estimates made by management, as well as evaluating the overall financial statement presentation. We believe that our audits provide a reasonable basis for our opinion.
In our opinion, the consolidated financial statements referred to above present fairly, in all material respects, the consolidated financial position of McMoRan Exploration Co. at December 31, 2008 and 2007, and the consolidated results of its operations and its cash flow for each of the three years in the period ended December 31, 2008, in conformity with U.S. generally accepted accounting principles.
We also have audited, in accordance with the standards of the Public Company Accounting Oversight Board (United States), McMoRan Exploration Co.’s internal control over financial reporting as of December 31, 2008, based on criteria established in Internal Control-Integrated Framework issued by the Committee of Sponsoring Organizations of the Treadway Commission and our report dated February 26, 2009, expressed an unqualified opinion thereon.
New Orleans, Louisiana
February 26, 2009
McMoRan EXPLORATION CO.
CONSOLIDATED BALANCE SHEETS
| | | December 31, | |
| | | 2008 | | 2007 | |
| | | (In Thousands) | |
| ASSETS | | | | | | | |
| Current assets: | | | | | | | |
| Cash and cash equivalents | | $ | 93,486 | | $ | 4,830 | |
| Accounts receivable | | | 112,684 | | | 128,690 | |
| Inventories | | | 31,284 | | | 11,507 | |
| Prepaid expenses | | | 13,819 | | | 14,331 | |
| Fair value of oil and gas derivative contracts | | | 31,624 | | | 16,623 | |
| Current assets from discontinued operations, including restricted cash of $0.5 million | | | 516 | | | 3,029 | |
| Total current assets | | | 283,413 | | | 179,010 | |
| Property, plant and equipment, net | | | 992,563 | | | 1,503,359 | |
| Sulphur business assets | | | 3,012 | | | 476 | |
| Restricted investments and cash | | | 29,789 | | | 6,909 | |
| Fair value of oil and gas derivative contracts | | | 5,847 | | | 4,317 | |
| Deferred financing costs | | | 15,658 | | | 21,217 | |
| Total assets | | $ | 1,330,282 | | $ | 1,715,288 | |
| | | | | | | | |
| LIABILITIES AND STOCKHOLDERS’ EQUITY | | | | | | | |
| Current liabilities: | | | | | | | |
| Accounts payable | | $ | 77,009 | | $ | 97,821 | |
| Accrued liabilities | | | 89,565 | | | 68,292 | |
| 6% convertible senior notes | | | - | | | 100,870 | |
| Other short term borrowings | | | - | | | 10,665 | |
| Accrued interest and dividends payable | | | 7,586 | | | 13,055 | |
| Current portion of accrued oil and gas reclamation costs | | | 103,550 | | | 80,839 | |
| Current portion of accrued sulphur reclamation costs | | | 785 | | | 12,145 | |
| Fair value of oil and gas derivative contracts | | | - | | | 14,001 | |
| Current liabilities from discontinued operations | | | 1,317 | | | 2,624 | |
| Total current liabilities | | | 279,812 | | | 400,312 | |
| Senior secured revolving credit facility | | | - | | | 274,000 | |
| 5¼% convertible senior notes | | | 74,720 | | | 115,000 | |
| 11.875% senior notes | | | 300,000 | | | 300,000 | |
| Accrued oil and gas reclamation costs | | | 317,651 | | | 213,898 | |
| Accrued sulphur reclamation costs | | | 22,218 | | | 9,155 | |
| Fair value of oil and gas derivative contracts | | | - | | | 7,516 | |
| Other long-term liabilities from discontinued operations | | | 6,835 | | | 7,808 | |
| Other long-term liabilities | | | 20,023 | | | 15,370 | |
| Total liabilities | | $ | 1,021,259 | | $ | 1,343,059 | |
| Commitments and contingencies (Note 17) | | | | | | | |
McMoRan EXPLORATION CO.
CONSOLIDATED BALANCE SHEETS
(Continued)
| | | December 31, | |
| | | 2008 | | 2007 | |
| | | (In Thousands) | |
| Stockholders' equity: | | | | | | | |
| Preferred stock, par value $0.01, 50,000,000 shares authorized, 1,589,340 and | | | | | | | |
| 2,587,500 shares issued and outstanding ($100 per share liquidation preference), | | | | | | | |
| respectively (Note 10) | | $ | 158,934 | | $ | 258,750 | |
| Common stock, par value $0.01, 150,000,000 shares authorized, 72,981,734 | | | | | | | |
| shares and 55,795,251 shares issued and outstanding, respectively | | | 730 | | | 558 | |
| Capital in excess of par value of common stock | | | 971,977 | | | 718,472 | |
| Accumulated deficit | | | (776,153 | ) | | (559,459 | ) |
| Accumulated other comprehensive loss | | | (22 | ) | | (653 | ) |
| Common stock held in treasury, 2,508,660 shares and 2,471,674 shares, | | | | | | | |
| at cost, respectively | | | (46,443 | ) | | (45,439 | ) |
| Total stockholders’ equity | | | 309,023 | | | 372,229 | |
| Total liabilities, mandatorily redeemable convertible preferred stock and | | | | | | | |
| stockholders’ equity | | $ | 1,330,282 | | $ | 1,715,288 | |
The accompanying notes are an integral part of these consolidated financial statements.
McMoRan EXPLORATION CO.
CONSOLIDATED STATEMENTS OF OPERATIONS
| | Years Ended December 31, | |
| | 2008 | | 2007 | | 2006 | |
| | (In Thousands, Except Per Share Amounts) | |
| Revenues: | | | | | | | | | |
| Oil and natural gas | $ | 1,058,804 | | $ | 475,250 | | $ | 196,717 | |
| Service | | 13,678 | | | 5,917 | | | 13,021 | |
| Total revenues | | 1,072,482 | | | 481,167 | | | 209,738 | |
| | | | | | | | | | |
| Costs and expenses: | | | | | | | | | |
| Production and delivery costs | | 258,450 | | | 122,127 | | | 53,134 | |
| Depletion, depreciation and amortization expense | | 854,798 | | | 256,007 | | | 104,724 | |
| Exploration expenses | | 79,116 | | | 58,954 | | | 67,737 | |
| (Gain) loss on oil and gas derivative contracts | | (16,303 | ) | | 5,181 | | | - | |
| General and administrative expenses | | 48,999 | | | 27,973 | | | 20,727 | |
Start-up costs for Main Pass Energy Hub™ Project | | 6,047 | | | 9,754 | | | 10,714 | |
| Exploration expense reimbursement (Note 3) | | - | | | - | | | (10,979 | ) |
| Litigation settlement, net of insurance proceeds (Note 17) | | - | | | - | | | (446 | ) |
| Insurance recoveries (Note 6) | | (3,391 | ) | | (2,338 | ) | | (3,306 | ) |
| Total costs and expenses | | 1,227,716 | | | 477,658 | | | 242,305 | |
| Operating income (loss) | | (155,234 | ) | | 3,509 | | | (32,567 | ) |
| Interest expense, net | | (50,890 | ) | | (66,366 | ) | | (10,203 | ) |
| Other expense, net | | (2,566 | ) | | (704 | ) | | (1,946 | ) |
| Loss from continuing operations before income taxes | | (208,690 | ) | | (63,561 | ) | | (44,716 | ) |
| Provision for income taxes | | (2,508 | ) | | - | | | - | |
| Loss from continuing operations | | (211,198 | ) | | (63,561 | ) | | (44,716 | ) |
| Income (loss) from discontinued operations | | (5,496 | ) | | 3,827 | | | (2,938 | ) |
| Net loss | | (216,694 | ) | | (59,734 | ) | | (47,654 | ) |
| Preferred dividends, amortization of convertible preferred | | | | | | | | | |
| stock issuance costs and inducement payments for the | | | | | | | | | |
| early conversion of preferred stock | | (22,286 | ) | | (4,172 | ) | | (1,615 | ) |
| Net loss applicable to common stock | $ | (238,980 | ) | $ | (63,906 | ) | $ | (49,269 | ) |
| | | | | | | | | | |
| Basic and diluted net loss per share of common stock: | | | | | | | | | |
| Net loss from continuing operations | | $(3.79 | ) | | $(1.97 | ) | | $(1.66 | ) |
| Net income (loss) from discontinued operations | | (0.09 | ) | | 0.11 | | | (0.10 | ) |
| Net loss per share of common stock | | $(3.88 | ) | | $(1.86 | ) | | $(1.76 | ) |
| | | | | | | | | | |
| Average common shares outstanding: | | | | | | | | | |
| Basic and diluted | | 61,581 | | | 34,283 | | | 27,930 | |
The accompanying notes are an integral part of these consolidated financial statements.
McMoRan EXPLORATION CO.
CONSOLIDATED STATEMENTS OF CASH FLOW
| | | Years Ended December 31, | |
| | | 2008 | | 2007 | | 2006 | |
| | | (In Thousands) | |
| Cash flow from operating activities: | | | | | | | | | | |
| Net loss | | $ | (216,694 | ) | $ | (59,734 | ) | $ | (47,654 | ) |
| Adjustments to reconcile net loss to net cash | | | | | | | | | | |
| provided by operating activities: | | | | | | | | | | |
| (Income) loss from discontinued operations | | | 5,496 | | | (3,827 | ) | | 2,938 | |
| Depletion, depreciation and amortization expense | | | 854,798 | | | 256,007 | | | 104,724 | |
| Exploration drilling and related expenditures | | | 37,841 | | | 22,832 | | | 45,591 | |
| Compensation associated with stock-based awards | | | 30,223 | | | 13,107 | | | 15,822 | |
| Amortization of deferred financing costs | | | 4,630 | | | 14,713 | | | 1,891 | |
| Unrealized (gain) loss on oil and gas derivative contracts | | | (40,612 | ) | | 5,181 | | | - | |
| Loss on induced conversion of convertible senior notes | | | 2,663 | | | - | | | 4,301 | |
| Reclamation expenditures, net of prepayments by third parties | | | (29,432 | ) | | (10,622 | ) | | (670 | ) |
| (Increase) decrease in restricted cash | | | (15,152 | ) | | (3,748 | ) | | 278 | |
| Payment to fund terminated pension plan | | | (2,291 | ) | | - | | | - | |
| Purchase of oil and gas derivative contracts and other | | | (155 | ) | | (4,335 | ) | | 997 | |
| (Increase) decrease in working capital: | | | | | | | | | | |
| Accounts receivable-customers | | | 40,900 | | | (51,433 | ) | | (2,423 | ) |
| Accounts receivable-joint interest partners | | | (25,270 | ) | | (10,099 | ) | | (3,364 | ) |
| Accounts receivable-other | | | 1,461 | | | (2,228 | ) | | 1,264 | |
| Accounts payable and accrued liabilities | | | 8,618 | | | 17,781 | | | 8,337 | |
| Inventories | | | (19,777 | ) | | 13,527 | | | (17,050 | ) |
| Prepaid expenses | | | (7,588 | ) | | 12,526 | | | (14,845 | ) |
| Net cash provided by continuing operations | | | 629,659 | | | 209,648 | | | 100,137 | |
| Net cash used in discontinued operations | | | (6,262 | ) | | (2,010 | ) | | (4,946 | ) |
| Net cash provided by operating activities | | | 623,397 | | | 207,638 | | | 95,191 | |
| | | | | | | | | | | |
| | | | | | | | | | | |
| Cash flow from investing activities: | | | | | | | | | | |
| Exploration, development and other capital expenditures | | | (236,383 | ) | | (153,210 | ) | | (252,369 | ) |
| Acquisition of properties, net | | | (2,826 | ) | | (1,047,936 | ) | | - | |
| Property insurance reimbursement | | | - | | | - | | | 3,947 | |
| Proceeds from restricted investments | | | - | | | 6,056 | | | 16,505 | |
| Increase in restricted investments | | | - | | | (126 | ) | | (229 | ) |
| Proceeds from sale of oil and gas properties | | | - | | | - | | | 1,071 | |
| Net cash used in continuing activities | | | (239,209 | ) | | (1,195,216 | ) | | (231,075 | ) |
| Net cash used in discontinued operations | | | - | | | - | | | - | |
| Net cash used in investing activities | | $ | (239,209 | ) | $ | (1,195,216 | ) | $ | (231,075 | ) |
| | | | | | | | | | | |
McMoRan EXPLORATION CO.
CONSOLIDATED STATEMENTS OF CASH FLOW
(Continued)
| | | Years Ended December 31, | |
| | | 2008 | | 2007 | | 2006 | |
| | | (In Thousands) | |
| Cash flow from financing activities: | | | | | | | | | | |
| (Payments) borrowings under senior secured revolving credit | | | | | | | | | | |
| facility, net | | $ | (274,000 | ) | $ | 245,250 | | $ | 28,750 | |
| Proceeds from sale of 11.875% senior notes | | | - | | | 300,000 | | | - | |
| Net proceeds from sale of 6¾% mandatory convertible | | | | | | | | | | |
| preferred stock | | | - | | | 250,385 | | | - | |
| Net proceeds from sale of common stock | | | - | | | 200,189 | | | - | |
| Proceeds from bridge loan facility | | | - | | | 800,000 | | | - | |
| Repayment of bridge loan facility | | | - | | | (800,000 | ) | | - | |
| Proceeds from senior term loan | | | - | | | 100,000 | | | - | |
| Repayment of senior term loan | | | - | | | (100,000 | ) | | - | |
| Financing costs | | | - | | | (30,553 | ) | | (531 | ) |
| Dividends paid and inducement payments on early conversion | | | | | | | | | | |
| of convertible preferred stock | | | (23,565 | ) | | (1,121 | ) | | (1,494 | ) |
| Payments for induced conversion of convertible senior notes | | | (2,663 | ) | | - | | | (4,301 | ) |
| Proceeds from exercise of stock options, warrants and other | | | 4,696 | | | 10,428 | | | 389 | |
| Net cash (used in) provided by continuing operations | | | (295,532 | ) | | 974,578 | | | 22,813 | |
| Net cash activity from discontinued operations | | | - | | | - | | | - | |
| Net cash (used in ) provided by financing activities | | | (295,532 | ) | | 974,578 | | | 22,813 | |
| Net decrease in cash and cash equivalents | | | 88,656 | | | (13,000 | ) | | (113,071 | ) |
| Cash and cash equivalents at beginning of year | | | 4,830 | | | 17,830 | | | 130,901 | |
| Cash and cash equivalents at end of year | | $ | 93,486 | | $ | 4,830 | | $ | 17,830 | |
| | | | | | | | | | | |
| | | | | | | | | | | |
| Interest paid | | $ | 55,181 | | $ | 67,622 | | $ | 9,382 | |
| Income taxes paid | | $ | 3,370 | | $ | - | | $ | - | |
| | | | | | | | | | | |
The accompanying notes, which include information regarding noncash transactions, are an integral part of these consolidated financial statements.
McMoRan EXPLORATION CO.
CONSOLIDATED STATEMENTS OF CHANGES IN STOCKHOLDERS’ EQUITY (DEFICIT)
| | | Years Ended December 31, | |
| | | 2008 | | 2007 | | 2006 | |
| | | (In Thousands) | |
| Preferred stock: | | | | | | | | | | |
| Balance at beginning of year, representing 2,587,500 shares | | | | | | | | | | |
| in 2008 and no shares in 2007 or 2006 | | $ | 258,750 | | $ | - | | $ | - | |
| Shares converted in privately negotiated transaction, | | | | | | | | | | |
| representing 998,160 shares | | | (99,816 | ) | | - | | | - | |
| Shares sold in equity offering, representing 2,587,500 shares | | | - | | | 258,750 | | | - | |
| Balance end of year, representing 1,589,340 shares in | | | | | | | | | | |
| 2008, 2,587,500 shares in 2007 and no shares in 2006 | | | 158,934 | | | 258,750 | | | - | |
| | | | | | | | | | | |
| Common stock: | | | | | | | | | | |
| Balance at beginning of year representing 55,795,251 shares | | | | | | | | | | |
| in 2008, 30,740,275 shares in 2007 and 27,122,538 shares | | | | | | | | | | |
| in 2006 | | | 558 | | | 307 | | | 271 | |
| Shares issued in equity offering representing 16,887,500 | | | | | | | | | | |
| shares (at $12.40 per share) (Note 10) | | | - | | | 169 | | | - | |
| Shares issued in debt conversion transactions representing | | | | | | | | | | |
| 9,508,743 shares in 2008 and 3,552,494 shares in 2006 | | | 95 | | | - | | | 36 | |
| Exercise of stock warrants representing 636,811 shares in | | | | | | | | | | |
| 2008 and 1,742,424 shares in 2007 | | | 7 | | | 17 | | | - | |
| Exercise of stock options and other representing 332,896 | | | | | | | | | | |
| shares in 2008, 219,633 shares in 2007 and 56,927 | | | | | | | | | | |
| shares in 2006 | | | 3 | | | 3 | | | - | |
| Preferred stock conversions representing 6,708,033 shares | | | | | | | | | | |
| in 2008, 6,205,419 shares in 2007 and 8,316 shares in 2006 | | | 67 | | | 62 | | | - | |
| Balance at end of year representing, 72,981,734 shares in | | | | | | | | | | |
| 2008, 55,795,251 shares in 2007 and 30,740,275 shares in | | | | | | | | | | |
| 2006 | | | 730 | | | 558 | | | 307 | |
| | | | | | | | | | | |
| Capital in Excess of Par Value: | | | | | | | | | | |
| Balance at beginning of year | | | 718,472 | | | 477,178 | | | 410,139 | |
| Costs associated with preferred stock equity offering | | | - | | | (8,365 | ) | | - | |
| Common stock equity offering, net of offering costs | | | | | | | | | | |
| of $9.6 million | | | - | | | 200,020 | | | - | |
| Shares issued in debt conversion transactions | | | 140,127 | | | - | | | 52,513 | |
| Preferred stock conversions | | | 99,749 | | | 29,786 | | | 40 | |
| Stock-based compensation expense | | | 30,223 | | | 13,107 | | | 15,822 | |
| Exercise of stock options and warrants | | | 5,692 | | | 10,917 | | | 389 | |
| Dividends and inducement payments on preferred stock and | | | | | | | | | | |
| amortization of related issuance cost | | | (22,286 | ) | | (4,171 | ) | | (1,615 | ) |
| Unamortized value of restricted stock units on adoption | | | | | | | | | | |
| of new accounting standard | | | - | | | - | | | (110 | ) |
| Balance at end of year | | | 971,977 | | | 718,472 | | | 477,178 | |
| | | | | | | | | | | |
| Unamortized value of restricted stock units: | | | | | | | | | | |
| Balance beginning of year | | | - | | | - | | | (110 | ) |
| Unamortized value of restricted stock units on adoption | | | | | | | | | | |
| of new accounting standard | | | - | | | - | | | 110 | |
| Amortization of related deferred compensation | | | - | | | - | | | - | |
| Balance end of year | | $ | - | | $ | - | | $ | - | |
| | | | | | | | | | | |
TABLE OF CONTENTS
McMoRan EXPLORATION CO.
CONSOLIDATED STATEMENTS OF CHANGES IN STOCKHOLDERS’ EQUITY (DEFICIT)
(Continued)
| | | Years Ended December 31, | |
| | | 2008 | | 2007 | | 2006 | |
| | | (In Thousands, Except Share Amounts) | |
| Accumulated Deficit: | | | | | | | | | | |
| Balance at beginning of year | | $ | (559,459 | ) | $ | (499,725 | ) | $ | (452,071 | ) |
| Net loss | | | (216,694 | ) | | (59,734 | ) | | (47,654 | ) |
| Balance at end of year | | $ | (776,153 | ) | $ | (559,459 | ) | $ | (499,725 | ) |
| | | | | | | | | | | |
| Accumulated Other Comprehensive Loss: | | | | | | | | | | |
| Balance at beginning of year | | | (653 | ) | | (1,273 | ) | | - | |
| Adoption of SFAS No. 158 (Note 15) | | | - | | | - | | | (1,273 | ) |
| Amortization of previously unrecognized pension | | | | | | | | | | |
| components, net | | | (40 | ) | | 31 | | | - | |
| Change in unrecognized net gains/losses of pension plans | | | 671 | | | 589 | | | - | |
| Balance at end of year | | | (22 | ) | | (653 | ) | | (1,273 | ) |
| | | | | | | | | | | |
| Common Stock Held in Treasury: | | | | | | | | | | |
| Balance at beginning of year representing, 2,471,674 shares in | | | | | | | | | | |
| 2008, 2,433,545 in 2007 and 2,428,121 shares in 2006 | | | (45,439 | ) | | (44,930 | ) | | (44,819 | ) |
| Tender of 36,986 shares in 2008, 38,129 shares in 2007 and | | | | | | | | | | |
| 5,424 shares in 2006 associated with the exercise of stock | | | | | | | | | | |
| options and the vesting of restricted stock | | | (1,004 | ) | | (509 | ) | | (111 | ) |
| Balance at end of year representing 2,508,660 shares in | | | | | | | | | | |
| 2007, 2,471,674 shares in 2007 and 2,433,545 shares | | | | | | | | | | |
| in 2006 | | | (46,443 | ) | | (45,439 | ) | | (44,930 | ) |
| | | | | | | | | | | |
| Total stockholders’ equity (deficit) | | $ | 309,023 | | $ | 372,229 | | $ | (68,443 | ) |
The accompanying notes are an integral part of these consolidated financial statements.
McMoRan EXPLORATION CO.
NOTES TO CONSOLIDATED FINANCIAL STATEMENTS
1. SUMMARY OF SIGNIFICANT ACCOUNTING POLICIES
Basis of Presentation. The consolidated financial statements of McMoRan Exploration Co. (McMoRan), a Delaware Corporation, are prepared in accordance with U.S. generally accepted accounting principles. McMoRan’s consolidated financial statements include the accounts of those subsidiaries where McMoRan directly or indirectly has more than 50 percent of the voting rights and where the right to participate in significant management decisions is not shared with other shareholders, including its two wholly owned subsidiaries, McMoRan Oil & Gas LLC (MOXY) and Freeport-McMoRan Energy LLC (Freeport Energy). MOXY conducts all of McMoRan’s oil and gas operations and Freeport Energy continues to pursue plans for a multifaceted energy services facility, including the potential development of liquefied natural gas (LNG) facilities and extensive storage capabilities at the Main Pass Energy Hub TM (MPEH TM) project.
McMoRan’s investments in unincorporated legal entities represented by undivided interests in other oil and gas joint ventures and partnerships engaged in oil and gas exploration, development and production activities are pro rata consolidated, whereby a proportional share of each joint venture’s and partnership’s assets, liabilities, revenues and expenses are included in the accompanying consolidated financial statements in accordance with McMoRan’s working and net revenue interests in each joint venture and partnership.
All significant intercompany transactions have been eliminated. Certain prior year amounts have been reclassified to conform to the current year presentation, including the presentations of discontinued operations amounts within the balance sheet and statements of cash flow. Changes in the accounting principles applied during 2008, none of which impacted the consistency of presentation, are discussed below under the caption “New Accounting Standards.”
McMoRan’s former sulphur operations are presented as discontinued operations, and the major classes of assets and liabilities related to its sulphur business are separately shown for the periods presented.
On August 6, 2007, MOXY completed an acquisition of oil and gas properties with an effective date of July 1, 2007 (Note 2). McMoRan’s consolidated financial statements include the results of operations of the acquired properties for the year ended December 31, 2008 and the period from August 6, 2007 (closing date) to December 31, 2007. The results of operations of the acquired properties from the July 1, 2007 effective date through the closing date are reflected as a purchase price adjustment within property, plant and equipment in the accompanying consolidated balance sheet as of December 31, 2007 and as a reduction of the acquisition cost in the investing activities section of the accompanying consolidated statement of cash flow for the year ending December 31, 2007.
Nature of Operations. McMoRan is an oil and gas exploration and production company engaged directly through its subsidiaries, joint ventures or partnerships with other entities in the exploration, development, production and marketing of crude oil and natural gas. McMoRan’s operations are located entirely in the United States, specifically offshore in the Gulf of Mexico and onshore in the Gulf Coast region (Louisiana and Texas). McMoRan is also seeking to establish a multifaceted energy services facility, including potential liquefied natural gas (LNG) facilities and extensive storage capabilities at Main Pass Block 299 (Main Pass) in the Gulf of Mexico .
McMoRan’s production of oil and natural gas involves lifting oil and natural gas to the surface and gathering, treating and processing hydrocarbons to extract liquids from natural gas. McMoRan’s production costs include all costs incurred to operate or maintain its wells and related equipment and facilities. Examples of these costs include:
| · | labor costs to operate the wells and related equipment and facilities; |
| · | repair and maintenance costs, including costs associated with re-establishing production from a geological structure that has previously produced; |
| · | material, supplies, and fuel consumed and services utilized in operating the wells and related equipment and facilities, including marketing and transportation costs; and |
| · | property taxes and insurance applicable to proved properties and wells and related equipment and facilities. |
McMoRan’s oil and natural gas revenues include a component for reimbursements of marketing and transportation costs, which are recorded as a corresponding reduction of production and delivery costs.
Use of Estimates. The preparation of McMoRan’s financial statements in conformity with U.S. generally accepted accounting principles requires management to make estimates and assumptions that affect the amounts reported in these consolidated financial statements and the accompanying notes to the consolidated financial statements. The more significant estimates include reclamation and environmental obligations, useful lives for depletion, depreciation and amortization, estimates of proved oil and natural gas reserves and related future cash flows, the carrying value of long-lived assets and assets held for sale or disposal and postretirement and other employee benefits. Actual results could differ from those estimates.
Cash and Cash Equivalents. Highly liquid investments purchased with an original maturity of three months or less are considered cash equivalents (excluding certain restricted cash, Note 17).
Accounts Receivable. The majority of McMoRan’s accounts receivable result from oil and natural gas sales or joint interest billings to third parties in the energy industry. McMoRan has not historically had any significant collection problems, and no allowance for doubtful accounts is included in the accompanying financial statements.
Inventories. Product inventories totaled $1.0 million at December 31, 2008 and $1.5 million at December 31, 2007, consisting entirely of oil at Main Pass. Materials and supplies inventory totaled $30.3 million at December 31, 2008 and $10.0 million at December 31, 2007 and represents the cost of supplies to be used in McMoRan’s drilling activities, primarily drilling pipe and tubulars. These costs will be partially reimbursed by third party participants in wells supplied with these materials. McMoRan’s inventories are stated at the lower of weighted average cost or market. There have been no required reductions in the carrying value of McMoRan’s inventories for any of the periods presented.
Property, Plant and Equipment.
Oil and Gas. McMoRan follows the successful efforts method of accounting for its oil and natural gas exploration and development activities. Costs associated with drilling and development activities are included as a reduction of investing cash flow in the accompanying consolidated statements of cash flow.
| · | Geological and geophysical costs and costs of retaining unproved properties and undeveloped properties are charged to expense as incurred and are included as a reduction of operating cash flow in the accompanying consolidated statements of cash flow. |
| · | Costs of exploratory wells are capitalized pending determination of whether they have discovered proved reserves. |
| * | The costs of exploratory wells that have found oil and natural gas reserves that cannot be classified as proved when drilling is completed continue to be capitalized as long as the well has found a sufficient quantity of reserves to justify its completion as a producing well and sufficient progress is being made in assessing the proved reserves and the economic and operating viability of the project. Management evaluates progress on such wells on a quarterly basis. |
| * | Costs that no longer meet the criteria for continued drilling and capitalization under Statement of Financial Accounting Standards (SFAS) 19-1, but for which management intends to pursue development activities are included in depletion, depreciation and amortization expense. |
| * | If proved reserves are not discovered the related drilling costs are charged to exploration expense. |
| · | Acquisition costs of leases and development activities are capitalized. |
| · | Other exploration costs are charged to expense as incurred. |
| · | Depletion, depreciation and amortization expense is determined on a field-by-field basis using the units-of-production method, with depletion, depreciation and amortization rates for leasehold acquisition costs based on estimated proved reserves and depletion, depreciation and amortization rates for well and related facility costs based on proved developed reserves associated with each field. The depletion, depreciation and amortization rates are changed whenever there is an indication of the need for a revision but, at a minimum, are revised semi-annually. Any such revisions are accounted for prospectively as a change in accounting estimate. |
| · | The costs of maintenance and repairs, which are not significant improvements, are expensed when incurred. |
| · | Gains or losses from dispositions of McMoRan’s interests in oil and gas properties are included in earnings under the following conditions: |
| * | All or part of an interest owned is sold to an unrelated third party; if only part of an interest is sold, there is no substantial uncertainty about the recoverability of cost applicable to the interest retained; and |
| * | McMoRan has no substantial obligation for future performance (e.g, drilling a well(s) or operating the property without proportional reimbursement of costs relating to the interest sold). |
| · | Interest expense allocable to significant unproved leasehold costs and in progress exploration and development projects is capitalized until the assets are ready for their intended use. Interest expense capitalized by McMoRan totaled $5.0 million in 2008, $6.3 million in 2007 and $5.3 million in 2006. |
Sulphur. See Note 12 for results associated with its discontinued operations, which are reflected within the caption “Income (loss) from discontinued operations” in the accompanying consolidated statements of operations. McMoRan’s remaining sulphur property, plant and equipment is carried at the lower of cost or estimated net realizable value.
Asset Impairment. Costs of unproved oil and gas properties are assessed periodically and a loss is recognized if the properties are deemed impaired. When events or circumstances indicate that proved oil and gas property carrying amounts might not be recoverable from estimated future undiscounted cash flows from the property, a reduction of the carrying amount to fair value is required. Measurement of the impairment loss is based on the estimated fair value of the asset, which McMoRan generally determines using estimated undiscounted future cash flows from the property, adjusted to present value using an interest rate considered appropriate for the asset. Future cash flow estimates for McMoRan’s oil and gas properties are measured on a field-by-field basis and include future estimates of proved and risk-adjusted probable reserves, oil and gas prices, production rates and operating and development costs based on operating budget forecasts.
The determination of oil and natural gas reserve estimates is a subjective process, and the accuracy of any reserve estimate depends on the quality of available data and the application of engineering and geological interpretation and judgment. Estimates of economically recoverable reserves and future net cash flows depend on a number of variable factors and assumptions that are difficult to predict and may vary considerably from actual results. In particular, reserve estimates for wells with limited or no production history are less reliable than those based on actual production. Subsequent evaluation of the same reserves may result in variations, which may be substantial, in estimated reserves and related future cash flow estimates. If the capitalized cost of an individual oil and gas property exceeds the related estimated future net cash flows, an impairment charge to reduce the capitalized costs to the property’s estimated fair value is required (Note 6).
Revenue Recognition and Gas Balancing. McMoRan generally sells crude oil and natural gas under short-term agreements at prevailing market prices. Revenue for the sale of crude oil and natural gas is
recognized when title passes to the customer, when prices are fixed or determinable and collection is reasonably assured. Natural gas revenues involving partners in natural gas wells are recognized when the natural gas is sold using the entitlements method of accounting and are based on McMoRan’s net working interests. When McMoRan receives a volume in excess of its net working interests, it records a liability and under deliveries are recorded as receivables. At December 31, 2008, McMoRan had natural gas imbalance receivables of $9.2 million and a liability of $12.6 million for over deliveries. At December 31, 2007, McMoRan had natural gas imbalance receivables of $3.3 million, including $3.2 million associated with the 2007 oil and gas property acquisition (Note 2). At December 31, 2007, the liability associated with over deliveries totaled $3.2 million, including $2.5 million for the acquired properties. McMoRan recorded a liability of $2.6 million for the values associated with the estimated net overdelivered position for the acquired properties at August 6, 2007, which is reflected as a component of the net purchase price (Note 2).
McMoRan has a number of producing fields that have been awarded royalty relief under the “Deep Gas Royalty Relief” program instituted by the Minerals Management Service (MMS). Under this program, the leases in which McMoRan has obtained relief are eligible for suspensions of the obligation to pay federal royalties on up to 25 Bcf of production, with each field’s eligible amount of relief determined by specific MMS criteria and subject to their final approval. During the three year period ended December 31, 2008, McMoRan recognized $17.7 million in 2008, $3.7 million in 2007 and $1.9 million in 2006 of additional oil and natural gas revenues associated with its awarded royalty relief. The royalty relief granted under this program is subject to certain annually adjusted price thresholds established by the MMS. If the annual NYMEX market price for natural gas exceeds the MMS’s annual price threshold, then relief is suspended under the program for that year and royalties would be due to the MMS with interest. McMoRan recognizes oil and gas revenues from production on properties eligible for royalty relief as the amounts are earned. If the price threshold is exceeded or estimated to be exceeded based on forward pricing at the end of a reporting period, McMoRan defers all such revenues until the threshold price is no longer exceeded. The price threshold was not exceeded for the years ending December 31, 2008, 2007 or 2006.
Service Revenue. McMoRan records the gross amount of reimbursements for costs from third parties as service revenues whenever McMoRan is the primary obligor with respect to the source of such costs, has discretion in the selection of how the related service costs are incurred and when it has assumed the credit risk associated with the reimbursement for such service costs. The service costs associated with these third-party reimbursements are also recorded within the applicable cost and expenses line item in the accompanying consolidated financial statements.
McMoRan’s service revenues have been generated primarily through its management fee related to the multi-year exploration venture (Note 3), fees for processing third-party oil production through the oil facilities at Main Pass, other third party management fees and standardized industry (COPAS) overhead charges McMoRan receives as operator of oil and gas properties.
Reclamation and Closure Costs. McMoRan incurs costs for environmental programs and projects. Expenditures pertaining to future revenues from operations are capitalized. Expenditures resulting from the remediation of conditions caused by past operations that do not contribute to future revenue generation are charged to expense. Liabilities are recognized for remedial activities when the efforts are probable and the costs can be reasonably estimated. Reclamation cost estimates are by their nature imprecise and can be expected to be revised over time because of a number of factors, including changes in reclamation plans, cost estimates, governmental regulations, technology and inflation.
McMoRan uses estimates derived from information provided by third party specialists in determining its estimated asset retirement obligations under multiple probability-assessed scenarios reflecting a range of possible outcomes considering the future costs to be incurred, the scope of work to be performed and the timing of such expenditures (Note 17).
Other Comprehensive Income (Loss). McMoRan follows SFAS 130 “Reporting Comprehensive Income” for the reporting and display of comprehensive income (loss) (net loss minus other comprehensive income, or all other changes in net assets from nonowner sources) and its components. McMoRan did not have
any other comprehensive income (loss) items until it adopted SFAS No. 158 “Accounting for Defined Benefit and Other Postretirement Plans” on December 31, 2006 (Note 15).
Financial Instruments and Contracts. Based on its assessment of market conditions, McMoRan may enter into financial contracts to manage certain risks resulting from fluctuations in oil and natural gas prices. McMoRan will account for any such financial contracts and other derivatives pursuant to SFAS No. 133 “Accounting for Derivative Instruments and Hedging Activities.” Under this standard, costs or premiums and gains or losses on contracts meeting deferral criteria are recognized with the hedged transactions. Also, gains or losses are recognized if the hedged transaction is no longer expected to occur or if deferral criteria are not met. McMoRan monitors any such credit risk on an ongoing basis and considers this risk to be minimal.
In connection with the 2007 oil and gas property acquisition, MOXY entered into oil and gas derivative contracts for a portion of its anticipated production for the years 2008 through 2010. The oil and gas derivative contracts were not designated as hedges for accounting purposes. Accordingly, these contracts are subject to mark-to-market fair value adjustments, the impact of which is recognized immediately in McMoRan’s operating results. McMoRan records all gains and losses associated with its derivative contracts within a separate line in the accompanying consolidated statements of operations, and any related cash flow effect is recorded within cash flows from operations within the related consolidated statements of cash flow. McMoRan believes the operating presentation of its oil and gas derivatives contracts is appropriate in both its statements of operations and cash flow because the sale of oil and natural gas production represents the primary source of its operating income and cash flow. See Note 9 for information regarding McMoRan’s oil and gas derivative contracts.
Earnings Per Share. Basic net loss per share of common stock was calculated by dividing the loss applicable to continuing operations, the income (loss) from discontinued operations, and the net loss applicable to common stock by the weighted-average number of common shares outstanding during the periods presented. For purposes of the basic earnings per share computations, the net loss applicable to continuing operations includes preferred stock dividends and related charges (Note 11).
Stock-Based Compensation. Effective January 1, 2006, McMoRan adopted the fair value recognition provisions of SFAS No. 123 (revised 2004), “Share-Based Payment” (SFAS No. 123R), using the modified prospective transition method. Under this method, compensation cost recognized includes (a) compensation costs for all stock option awards granted to employees prior to, but not yet vested as of, January 1, 2006 based on the grant-date fair value estimated in accordance with the original provisions of SFAS No. 123, and (b) compensation cost for all stock option awards granted subsequent to January 1, 2006, based on the grant-date fair value estimated in accordance with the provisions of SFAS No. 123R. In addition, other stock-based awards charged to expense under SFAS No.123 continue to be charged to expense under SFAS No. 123R, including stock options granted to non-employees and advisory directors as well as restricted stock units. McMoRan recognizes compensation costs for awards that vest over several years on a straight-line basis over the vesting period. McMoRan’s stock-based awards provide for an additional year of vesting after an employee retires. For awards to retirement-eligible employees, McMoRan records one year of amortization of the awards’ estimated fair value on the date of grant because the grantee has earned that one year vesting benefit under the terms of McMoRan’s stock options plans due to length of tenured service. McMoRan includes estimated forfeitures in its compensation cost and updates the estimated forfeiture rate through the final vesting date of the awards (Note 13).
McMoRan currently recognizes no income tax benefits for deductions resulting from the exercise of stock options because all of its net deferred tax assets, including significant net operating loss carryforwards, have been reserved with a full valuation allowance (Note 14).
New Accounting Standards. In September 2006, the FASB issued SFAS No. 157, “Fair Value Measurements.” SFAS No. 157 establishes a framework for measuring fair value in generally accepted accounting principles (GAAP), clarifies the definition of fair value within that framework, and expands disclosures about the use of fair value measurements. In many of its pronouncements, the FASB has previously concluded that fair value information is relevant to the users of financial statements and has required (or permitted) fair value as a measurement objective. However, prior to the issuance of this statement, there was limited guidance for applying the fair value measurement objective in GAAP. This
statement does not require any new fair value measurements in GAAP. McMoRan adopted SFAS No. 157 on January 1, 2008 with no material changes to its financial position or results of operations.
As defined in SFAS No. 157, fair value is the price that would be received to sell an asset or paid to transfer a liability in an orderly transaction between market participants at the measurement date. SFAS 157 establishes a fair value hierarchy that prioritizes the inputs to valuation techniques used to measure fair value. The fair value hierarchy consists of three broad levels:
| · | Level 1: valuations consist of unadjusted quoted prices in active markets for identical assets and liabilities and has the highest priority; |
| · | Level 2: valuations rely on quoted prices in markets that are not active or observable inputs over the full term of the asset or liability; |
| · | Level 3: valuations are based on prices or third party or internal valuation models that require inputs that are significant to the fair value measurement and are less observable and thus have the lowest priority. |
Financial instruments reported at fair value on a recurring basis are McMoRan's derivative instruments, which are discussed in Note 9.
In February 2007, the FASB issued SFAS No. 159 “The Fair Value Option for Financial Assets and Liabilities.” SFAS No. 159 permits entities to choose to measure certain financial instruments and certain other items at fair value. McMoRan adopted SFAS No. 159 on January 1, 2008 with no impact to its financial statements.
In December 2007, the FASB issued SFAS No. 141(R), “Applying the Acquisition Method.” SFAS 141(R) requires an acquirer to recognize 100 percent of the fair values of acquired assets, with limited exceptions, even if the acquirer has not acquired 100 percent of its target. Additionally, contingent consideration arrangements and preacquisition contingencies will be measured at fair value on the acquisition date and included in the basis of the purchase price. Transaction costs will now be expensed as incurred and not considered as part of the fair value of the acquisition; however, acquired research and development will no longer be expensed at acquisition, but instead will be capitalized as an indefinite-lived intangible asset. SFAS 141(R) is effective for fiscal years beginning after December 15, 2008 and early adoption is not allowed. McMoRan’s accounting for its 2007 oil and gas property acquisition is not affected by this new standard.
In December 2007, the FASB issued SFAS No. 160, “Accounting for Noncontrolling Interests.” SFAS 160 clarifies the classification of noncontrolling interests in the consolidated balance sheet and the accounting for and reporting of transactions between the reporting entity and holders of these noncontrolling interests. Under SFAS 160, noncontrolling interests (minority interests) are to be considered equity transactions and reflected accordingly in the balance sheet and related statement of cash flow. SFAS 160 will require separate disclosure on the face of the income statement distinguishing between the controlling and noncontrolling interests. SFAS 160 is effective for fiscal years beginning after December 15, 2008 and early adoption is not permitted. McMoRan does not believe that SFAS No. 160 will have a material impact on its financial statements.
In March 2008, the FASB issued FAS No. 161, “Disclosures about Derivative Instruments and Hedging Activities-an amendment of FASB Statement No. 133”. SFAS No. 161 requires enhanced disclosure related to derivatives and hedging activities and thereby seeks to improve the transparency of financial reporting. Under FAS No. 161, entities are required to provide enhanced disclosures relating to: (a) how and why an entity uses derivative instruments; (b) how derivative instruments and related hedge items are accounted for under FAS No. 133, “Accounting for Derivative Instruments and Hedging Activities” (“FAS No. 133”), and its related interpretations; and (c) how derivative instruments and related hedged items affect an entity’s financial position, financial performance, and cash flows. SFAS No. 161 must be applied prospectively to all derivative instruments and non-derivative instruments that are designated and qualify as hedging instruments and related hedged items accounted for under SFAS No. 133 for all financial statements issued for fiscal years and interim periods beginning after November 15, 2008, with early
application encouraged. McMoRan does not believe that SFAS No. 161 will have a material impact on its financial statements.
In May 2008, the FASB issued FASB Staff Position APB 14-1, “Accounting for Convertible Debt Instruments That May Be Settled in Cash upon Conversion (Including Partial Cash Settlement).” This FASB Staff Position requires the issuer of certain convertible debt instruments that may be settled in cash (or other assets) on conversion to separately account for the liability (debt) and equity (conversion option) components of the instrument in a manner that reflects the issuer’s nonconvertible debt borrowing rate. This will require the accretion of the resulting discount on the liability component of the convertible debt, which will result in additional interest expense based on McMoRan’s nonconvertible debt borrowing rate. This FASB Staff position is effective for fiscal years beginning after December 15, 2008 and must be applied retrospectively for all periods presented. McMoRan does not believe that this FASB Staff Position will have a material impact on its financial statements.
In December 2008 the Securities and Exchange Commission (SEC) unanimously approved amendments to revise its oil and gas reserves estimation and disclosure requirements. The amendments, among other things:
| · | allows the use of new technologies to determine proved reserves; |
| · | permits the optional disclosure of probable and possible reserves; |
| · | modifies the prices used to estimate reserves for SEC disclosure purposes to a 12-month average price instead of a period-end price; and |
| · | requires that if a third party is primarily responsible for preparing or auditing the reserve estimates, the company make disclosures relating to the independence and qualifications of the third party, including filing as an exhibit any report received from the third party. |
The revised rules are effective January 1, 2010. The new requirements do not have an impact on McMoRan’s 2008 financial statements.
2. ACQUISITION OF GULF OF MEXICO SHELF PROPERTIES
On August 6, 2007, MOXY completed the acquisition of substantially all of the proved oil and gas property interests and related assets of Newfield Exploration Company (Newfield) located on the outer continental shelf of the Gulf of Mexico for total cash consideration of $1.1 billion and assumption of the related reclamation obligations (the 2007 oil and gas property acquisition). MOXY also acquired 50 percent of Newfield’s interests in unproved exploration leases on the outer continental shelf of the Gulf of Mexico and a majority of Newfield’s interests in the inventory of leases associated with the Treasure Island and Treasure Bay ultra deep prospects (targets below 25,000 feet). McMoRan funded the acquisition through borrowings under its variable rate senior secured revolving credit facility (credit facility) and an interim bridge loan facility (Note 8).
The allocation of the purchase price to the acquired assets and assumed liabilities is based on McMoRan’s valuation estimates. The adjusted purchase price and purchase price allocation were finalized in the third quarter of 2008. The following table summarizes the estimated fair value of the assets acquired and liabilities assumed at the date of the closing of the 2007 oil and gas property acquisition (in thousands):
| Cash paid for acquired assets at closing (August 6, 2007) | $ | 1,076,286 | |
| Estimated oil & gas reclamation costs | | 268,766 | |
| Net assets acquired at closing | | 1,345,052 | |
| Post closing adjustments | | (38,645 | ) a |
| Other acquisition related costs | | 17,124 | b |
| Net assets acquired | $ | 1,323,531 | |
| a. | Represents net cash flow from the operation of the acquired properties during the period from July 1, 2007 (effective date) to August 6, 2007 (closing date). |
| b. | Includes $3.5 million contingency settled in the first quarter of 2008. |
The allocation of the purchase price of the acquired properties at the date of acquisition follows:
| Accounts receivable | $ | 35,649 | |
| Oil and gas property, plant and equipment | | 1,322,819 | |
| Asset retirement obligations | | (268,766 | ) |
| Other accrued liabilities | | (13,416 | ) |
| Cash paid for acquired assets at closing (August 6, 2007) | $ | 1,076,286 | |
The following unaudited pro forma financial information assumes MOXY acquired the properties effective January 1, 2007 and 2006, respectively, for the periods presented (amounts in thousands, except for per share data).
| | (Pro Forma, Unaudited) | |
| | Years Ended | |
| | December 31, | |
| | | 2007 | | | 2006 | |
| Revenues | $ | 888,550 | | $ | 822,791 | |
| Operating income | | 85,163 | | | 196,619 | |
| Net income (loss) | | (55,645 | ) | | 55,761 | |
| Basic net income (loss) per share of common stock | | $(1.62 | ) | | $2.00 | |
| Diluted net income (loss) per share of common stock | | (1.62 | ) | | 1.23 | |
3. OIL & GAS EXPLORATION ACTIVITIES
McMoRan’s oil and gas operations are conducted through MOXY, whose operations and properties are located almost exclusively offshore on the outer continental shelf of the Gulf of Mexico and onshore in the Gulf Coast region. Additional information regarding McMoRan’s oil and gas operations is included below.
Acreage (Unaudited)
As of December 31, 2008, McMoRan owned or controlled interests in 380 oil and gas leases in the Gulf of Mexico and onshore Louisiana and Texas covering 1.22 million gross acres (0.59 million acres net to McMoRan’s interests). McMoRan’s acreage position includes 1.02 million gross acres (0.53 million acres net to our interest) located on the outer continental shelf of the Gulf of Mexico. Less than 0.1 million of McMoRan’s net leasehold interests are scheduled to expire in 2009. McMoRan holds potential reversionary interests in oil and gas leases that it has farmed-out or sold to other oil and gas exploration companies but that will partially revert to McMoRan upon the achievement of specified production quantity thresholds or the achievement of specified net production proceeds.
The following table shows the oil and gas acreage in which McMoRan held interests as of December 31, 2008. The table does not account for McMoRan’s gross acres associated with its farm-in, or certain other farm-out arrangements (approximately 0.10 million gross acres).
| | | (Unaudited) |
| | | Developed | | Undeveloped |
| | | Gross | | Net | | Gross | | Net |
| | | Acres | | Acres | | Acres | | Acres |
| Offshore (federal waters) | | 659,267 | | 379,932 | | 359,245 | | 145,944 |
| Onshore Louisiana and Texas | | 36,070 | | 18,448 | | 68,491 | | 27,565 |
| Total at December 31, 2008 | | 695,337 | | 398,380 | | 427,736 | | 173,509 |
Exploration Funding Arrangements
McMoRan intends to continue to pursue grown in reserves and production through the exploration, exploitation and development of its existing prospects and new potential prospects. McMoRan will be responsive to weak economic conditions by managing its capital program while continuing to seek to build asset values through our focused drilling program. McMoRan plans to fund these activities with its operating cash flow and borrowings under its senior secured revolving credit facility (Note 8). In addition, when feasible and appropriate, McMoRan may diversify its exploration efforts through arrangements with third parties, similar to the arrangements further discussed below.
Exploration Agreement with Plains Exploration & Production Company
In the fourth quarter of 2006, McMoRan entered into an exploration agreement with Plains Exploration & Production Co. (Plains) pursuant to which Plains obtained the right to participate in various exploration prospects in limited areas being explored by McMoRan. As of December 31, 2008, Plains has participated in eleven prospects under the terms of this exploration agreement. Under the terms of the agreement, Plains paid McMoRan $20 million for leasehold interests and related prospect costs. McMoRan reflected $19.0 million of this payment as operating income in the accompanying consolidated statements of operations within the caption titled “Reimbursement of exploration expense.” The remaining $1.0 million was classified as a reduction of McMoRan’s leasehold costs for prospects covered by this arrangement and is included within investing activities in the accompanying consolidated statement of cash flow.
Other Exploration Agreements
In 2004, McMoRan formed a multi-year exploration venture with a private exploration and production company (exploration partner) and jointly committed with this exploration partner to spend at least $500 million to acquire and exploit high-potential prospects, primarily in Deep Miocene formations on the shelf of the Gulf of Mexico and in the Gulf Coast area. The spending commitments under the venture were achieved in 2006. Service revenues related to the exploration venture totaled $9.0 million in 2006. McMoRan received no management fees for exploration venture services during 2008 or 2007. McMoRan paid its exploration partner $8.0 million in the fourth quarter of 2006 for relinquishing its exploration rights to certain prospects in connection with McMoRan’s entry into a new exploration agreement with Plains (see above).
In 2002, MOXY entered into a farm-out agreement with El Paso Production Company (El Paso) that provided for the funding of exploratory drilling and related development costs with respect to four of its prospects in the shallow waters of the Gulf of Mexico. Under the program, El Paso is funding all of MOXY’s interests for the exploratory drilling and development costs of these prospects and will own 100 percent of the program’s interests until aggregate production to the program’s net revenue interests reaches 100 Bcfe. After aggregate production of 100 Bcfe, ownership of 50 percent of the program’s interests would revert back to MOXY. El Paso drilled an exploratory well at each prospect, which yielded the initial discoveries at the JB Mountain prospect at South Marsh Island Block 223 in December 2002 and the Mound Point prospect at Louisiana State Lease 340 in April 2003. El Paso elected to relinquish its rights to the other two prospects where drilling resulted in a nonproductive exploratory well at each prospect. El Paso subsequently relinquished its rights to all but 13,000 gross acres (unaudited) surrounding the JB Mountain and Mound Point Offset wells. There are three producing wells under this farm-out program which averaged an aggregate gross rate of approximately 17 MMcef/d (unaudited) during 2008. McMoRan does not expect payout under the 100 Bcfe arrangement will occur in 2009.
4. MAIN PASS ENERGY HUBTM PROJECT
Freeport Energy is pursuing alternative uses of its discontinued sulphur facilities at Main Pass in the Gulf of Mexico. Freeport Energy believes that a multifaceted energy facility, including the potential development of a facility to receive and process LNG and store and distribute natural gas, could be developed at Main Pass using the infrastructure previously constructed for its former sulphur mining operations. Freeport Energy refers to this project as the Main Pass Energy Hub™ project (MPEH™).
Following an extensive review, the Maritime Administration (MARAD) approved Freeport Energy’s license application for the MPEH™ project in January 2007. MARAD concluded in its Record of Decision that construction and operations of the MPEH™ deepwater port will be in the national interest and consistent with national security and other national policy goals and objectives, including energy sufficiency and environmental quality. MARAD also concluded that MPEH™ will fill a vital role in meeting national energy requirements for many years to come and that the port’s offshore deepwater location will help reduce congestion and enhance safety in receiving LNG cargoes to the U.S.
MARAD’s approval and issuance of the Deepwater Port license for MPEH™ is subject to various terms, criteria and conditions contained in the Record of Decision, including demonstration of financial responsibility, compliance with applicable laws and regulations, environmental monitoring and other customary conditions.
The start-up costs associated with the establishment of the MPEH™ have been charged to expense in the accompanying consolidated statements of operations. These costs will continue to be charged to expense until commercial feasibility is established, at which point Freeport Energy may begin to capitalize certain subsequent expenditures related to the development of the project. Freeport Energy incurred start-up costs for the MPEH™ project totaling $6.0 million in 2008, $9.8 million in 2007 and $10.7 million in 2006.
Currently, Freeport Energy owns 100 percent of the MPEH™ project. However, two entities have separate options to participate as passive equity investors for up to an aggregate 25 percent of Freeport Energy’s equity interest in the project (Notes 6 and 17). Future financing and commercial arrangements could also reduce Freeport Energy’s equity interest in the project.
5. ACCOUNTS RECEIVABLE AND MAJOR CUSTOMERS
The components of accounts receivable follow (in thousands):
| | | December 31, | |
| | | 2008 | | 2007 | |
| Accounts receivable: | | | | | | | |
| Customers | | $ | 50,275 | | $ | 91,176 | |
| Joint interest partners | | | 60,039 | | | 33,683 | |
| Other | | | 2,370 | | | 3,831 | |
| Total accounts receivable | | $ | 112,684 | | $ | 128,690 | |
Sales of McMoRan’s oil and natural gas production to individual customers representing 10 percent or more of its total consolidated oil and gas revenues in each of the three years in the period ended December 31, 2008 is as follows:
| | Year Ended December 31, | |
| | 2008 | | 2007 | | 2006 | |
| A | | 35 | % | | 27 | % | | 20 | % |
| B | | 18 | | | 24 | | | - | |
| C | | 12 | | | 13 | | | - | |
| D | | 10 | | | <10 | | | 25 | |
| E | | <10 | | | <10 | | | 26 | |
| F | | <10 | | | <10 | | | 16 | |
All of McMoRan’s customers are located in the United States. McMoRan does not believe the loss of any of these purchasers would have a material adverse affect on its operations because oil and gas is a commodity in demand and alternative purchasers, if needed, are available.
6. PROPERTY, PLANT AND EQUIPMENT
The components of net property, plant and equipment follow (in thousands):
| | | December 31, | |
| | | 2008 | | 2007 | |
| Oil and gas property, plant and equipment | | $ | 2,163,577 | | $ | 1,984,328 | |
| Other | | | 31 | | | 31 | |
| | | | 2,163,608 | | | 1,984,359 | |
| Accumulated depletion, depreciation and amortization | | | (1,171,045 | ) | | (481,000 | ) |
| Property, plant and equipment, net | | $ | 992,563 | | $ | 1,503,359 | |
Impairment
The following table reflects the components of our depletion, depreciation and amortization expense for the years ended December 31, 2008, 2007 and 2006 (in thousands):
| | | 2008 | | 2007 | | 2006 | |
| Depletion and depreciation expense | | $ | $357,458 | | $ | 228,540 | | $ | 69,465 | |
| Accretion expense | | | 164,753 | | | 13,872 | | | 2,088 | |
| Impairment charges/losses | | | 332,587 | | | 13,595 | | | 33,171 | |
| Total depletion, depreciation and amortization expense | | $ | 854,798 | | $ | 256,007 | | $ | 104,724 | |
As discussed in Note 1, when events and circumstances indicate that proved oil and gas property carrying amounts might not be recoverable from estimated future undiscounted cash flows, a reduction of the carrying amount to estimated fair value is required. McMoRan estimates the fair value of its properties using estimated future cash flows based on proved and risk-adjusted probable oil and natural gas reserves as estimated by independent reserve engineers. Future cash flows are determined using published forward market prices adjusted for property-specific price basis differential, net of estimated future production and development costs, excluding estimated asset retirement and abandonment expenditures. If the undiscounted cash flows indicate that the property is impaired, McMoRan discounts the future cash flows using a discount factor that considers investors’ expected rates of return for similar type assets if acquired under current market conditions.
Due to the significant decline in market prices for oil and natural gas and other related factors that occurred in the fourth quarter of 2008, McMoRan recorded impairment charges of $246.9 million. McMoRan also recorded impairment charges totaling $44.9 million on two oil and gas properties (Mound Point South and JB Mountain Deep) after re-considering its near term drilling plans under current market conditions. Additionally, McMoRan recorded other charges in 2008 totaling $40.8 million to write off its remaining investments in various wells following unsuccessful attempts to establish production at certain wells and after significant damage was incurred at two wells during Hurricane Ike. In addition, asset retirement related accretion expense totaling $124.4 million was recorded during 2008 associated with certain properties impacted by Hurricane Ike.
In 2007, McMoRan recorded a charge of $13.6 million to depreciation, depletion and amortization expense to write off its remaining investment in the Cane Ridge well at Louisiana State Lease 18055, located onshore in Vermilion Parish.
In 2006, McMoRan recorded $33.2 million in charges to depletion, depreciation and amortization expense to reduce its investment in the Minuteman well at Eugene Island Block 213 and the West Cameron Block 43 field to their then estimated fair value at December 31, 2006.
Following the release of McMoRan’s unaudited fourth quarter 2008 results on January 21, 2009, the drilling results for the Gladstone East deep gas exploratory prospect on Louisiana State Lease 340 were evaluated and deemed to be nonproductive. As a result, the well is being plugged and abandoned. McMoRan charged $5.4 million of costs incurred for drilling the well through December 31, 2008 to exploration expense in its fourth quarter 2008 results.
Transactions Involving the Main Pass Oil Facilities
On December 16, 2002, McMoRan and K1 USA Energy Production Corporation (K1 USA), a wholly owned subsidiary of k1 Venture Limited (collectively K1), completed the formation of a joint venture, K-Mc I, owned 66.7 percent by K1 USA and 33.3 percent by McMoRan, which then acquired McMoRan’s Main Pass oil facilities. The facilities not required to support the future planned business activities that now comprise the MPEH TM project were excluded from the joint venture and their dismantlement and removal is now substantially complete (Note 12). Proceeds for the joint venture’s acquisition of the Main Pass oil facilities were funded in conjunction with McMoRan’s funding requirements for the reclamation activities.
K1 USA also has the right to participate as a passive equity investor in up to 15 percent of McMoRan’s equity participation in the MPEH™ project. K1 USA would need to exercise that right upon closing of the project financing arrangements by agreeing prospectively to fund up to 15 percent of McMoRan’s future contributions to the project. K1 USA received stock warrants to acquire a total of 2.5 million shares of McMoRan common stock at $5.25 per share. K1 exercised one warrant for 1.74 million shares in December 2007 for a cash price of $9.1 million. In June 2008, K1 exercised the remaining warrant for 0.76 million common shares in a cashless transaction and received 0.64 million common shares.
Insurance
McMoRan did not record any insurance recoveries in 2008 related to Hurricane Ike; however, it did receive final settlement on its Hurricane Katrina property loss claim of $3.4 million. In 2007, McMoRan received insurance recoveries totaling $2.3 million related to its Hurricane Katrina claim. McMoRan received $3.3 million in insurance recoveries in 2006 related to the initial settlement of the Hurricane Katrina claim and the final settlement related to its Hurricane Ivan claim.
7. OTHER ASSETS AND OTHER LIABILITIES
McMoRan defers its financing costs associated with its debt instruments and amortizes the cost over the term of the related instrument. The components of deferred financing costs follow (in thousands):
| | December 31, 2008 | | December 31, 2007 | |
| | Gross | | | | | | Gross | | | | | |
| | Carrying | | Accumulated | | | | Carrying | | Accumulated | | | |
| | Amount | | Amortization | | Net | | Amount | | Amortization | | Net | |
| 11.875% Senior Notes | | | | | | | | | | | | | | | | | | |
| (due November 2014) | $ | 8,055 | | $ | (1,301 | ) | $ | 6,754 | | $ | 8,055 | | $ | (150 | ) | $ | 7,905 | |
| Revolving Credit Facility | | | | | | | | | | | | | | | | | | |
| (matures August 2012) | | 11,377 | | | (3,679 | ) | | 7,698 | | | 11,136 | | | (893 | ) | | 10,243 | |
| 6% Convertible Senior | | | | | | | | | | | | | | | | | | |
| Notes (due July 2008) | | - | | | - | | | - | | | 5,706 | | | (5,160 | ) | | 546 | |
| 5¼% Convertible Senior | | | | | | | | | | | | | | | | | | |
| Notes (due October 2011) | | 6,243 | | | (5,037 | ) | | 1,206 | | | 7,032 | | | (4,509 | ) | | 2,523 | |
| | $ | 25,675 | | $ | (10,017 | ) | $ | 15,658 | | $ | 31,929 | | $ | (10,712 | ) | $ | 21,217 | |
The components of other long-term liabilities follow (in thousands):
| | | December 31, | |
| | | 2008 | | 2007 | |
| Employee postretirement medical liability (Note 13) | | $ | 4,387 | | $ | 5,303 | |
| Accrued workers compensation and group insurance | | | 638 | | | 733 | |
| Sulphur-related environmental liability (Note 17) | | | 3,161 | | | 3,161 | |
| Defined benefit pension plan liability (Note 13) | | | - | | | 2,255 | |
| Nonqualified pension plan liability | | | 1,370 | | | 1,199 | |
| Restricted liability for abandonment costs (Note 17) | | | 7,728 | | | - | |
| Liability for management services (Note 16) | | | 2,739 | | | 2,719 | |
| | | $ | 20,023 | | $ | 15,370 | |
8. LONG-TERM DEBT
The table below contains the components of McMoRan’s long-term debt, which is followed by additional disclosure of each component (in thousands).
| | December 31, | |
| | 2008 | | 2007 | |
| Senior secured revolving credit facility | $ | - | | $ | 274,000 | |
| 11.875% senior notes (due 2014) | | 300,000 | | | 300,000 | |
| 5¼% convertible senior notes (due 2011) | | 74,720 | | | 115,000 | |
| 6% convertible senior notes | | - | | | 100,870 | |
| Other | | - | | | 10,665 | |
| Total debt | | 374,720 | | | 800,535 | |
| Less current maturities | | - | | | (111,535 | ) |
| Long-term debt | $ | 374,720 | | $ | 689,000 | |
Senior Secured Revolving Credit Facility
McMoRan’s variable rate senior secured revolving credit facility (credit facility) was amended and expanded in connection with the closing of the 2007 oil and gas property acquisition and matures in August 2012. The borrowing capacity was $400 million at December 31, 2008. There were no borrowings outstanding at December 31, 2008. McMoRan has $100 million of letters of credit issued under the credit facility to support the reclamation obligations assumed in the 2007 oil and gas property acquisition (Note 2). At December 31, 2008, our unused borrowing capacity under the credit facility totaled $300 million.
Availability under our credit agreement is subject to a borrowing base based on estimates of MOXY’s oil and natural gas reserves, which is subject to redetermination by the lenders semi-annually each April 1 and October 1. McMoRan expects that the recent sharp decline in oil and natural gas prices will result in a reduction in McMoRan’s borrowing base, which reduction could be significant. The variable-rate credit facility is secured by (1) substantially all the oil and gas properties of MOXY and its subsidiaries and (2) a pledge of McMoRan’s ownership interest in MOXY and MOXY’s ownership interest in each of its wholly owned subsidiaries.
Interest on the facility currently accrues at LIBOR plus 1.50 percent, subject to increases or decreases based on usage as a percentage of the borrowing base. Fees associated with the letters of credit and the unused commitment fee are also subject to increases or decreases in the same manner. The average interest rate on borrowings under the facility was 5.5 percent in 2008, 7.5 percent in 2007 and 8.2 percent in 2006. Interest expense on the credit facility totaled $11.9 million, including $6.3 million of commitment fees and amortization of related deferred financing costs for the year ended December 31, 2008; $13.3 million including $2.2 million of commitment fees and amortization of related deferred financing costs for the year ended December 31, 2007; and $1.7 million including $0.8 million of commitment and amortization of related deferred financing costs for the year ended December 31, 2006.
The credit facility contains covenants and other restrictions customary for oil and gas borrowing base credit facilities, including limitations on debt, liens, dividends, voluntary redemptions of debt, investments, asset sales and transactions with affiliates. In addition, the credit facility requires that McMoRan maintain certain financial tests, including a leverage test (Total Debt to EBITDAX, as those terms are defined in the facility, for the preceding four quarters) and a secured leverage test (First Lien Debt to EBITDAX, as those terms are defined in the facility, for the preceding four quarters), and a current ratio test (current assets to current liabilities, subject to certain adjustments as of the end of the quarter).
McMoRan was in compliance with these covenants at December 31, 2008. During the third quarter of 2008, McMoRan entered into a second amendment to the credit facility which, among other things, (i) provides the company with the ability to terminate, cancel or unwind any swap agreement associated with hedges of oil and gas prices that were previously entered into pursuant to the terms of the credit facility; and (ii) permits the company to induce conversion of our 6¾% preferred stock into shares of our common stock subject to limitations on the amount of cash used to effect such inducements. McMoRan induced the conversion of a portion of our 6¾% preferred stock in the third quarter of 2008 (Note 10).
At December 31, 2008, the carrying value of the credit facility approximated fair value because the interest rate is variable and is reflective of market rates.
11.875% Senior Notes
On November 14, 2007, McMoRan completed the sale of $300 million of 11.875% senior notes (senior notes). Net proceeds from the sale of the senior notes of approximately $292 million were used, along with additional borrowings under the credit facility, to repay remaining amounts outstanding on the bridge loan after application of the net proceeds from the concurrent public offerings of shares of McMoRan’s common stock and 6¾% mandatory convertible preferred stock (Note 10). The senior notes are due on November 15, 2014 and are unconditionally guaranteed on a senior basis by MOXY and its subsidiaries (Note 19). McMoRan may redeem some or all of these notes at its option at make-whole prices prior to November 15, 2011, and thereafter at stated redemption prices. The indenture governing the senior notes contains restrictions, including restrictions on incurring debt, creating liens, selling assets and entering into certain transactions with affiliates. The covenants also restrict McMoRan’s ability to pay certain cash dividends on common stock, repurchase or redeem common or preferred equity, prepay
subordinated debt and make certain investments. Interest expense on the senior notes during 2008 totaled $36.8 million, including amortization of related deferred financing costs of $1.2 million. Interest expense on the senior notes during 2007 totaled $4.8 million, including amortization of related deferred financing costs of $0.2 million. At December 31, 2008, the fair value of the 11.875% senior notes was approximately $207.0 million.
Convertible Senior Notes
On October 6, 2004, McMoRan completed a private placement of $140 million of 5¼% convertible senior notes due October 6, 2011 (5¼% notes). Net proceeds from the 5¼% notes, after fees and expenses, totaled $134.4 million, of which $21.2 million was used to purchase U.S. government securities to be held in escrow to pay the first six semi-annual interest payments on the notes. The 5¼% notes are otherwise unsecured. Interest payments are payable on April 6 and October 6 of each year, and began on April 6, 2005. Interest expense totaled $5.0 million, $6.7 million and $6.4 million for the years ended December 31, 2008, 2007 and 2006, respectively, including amortization of deferred financing costs of $0.5 million in 2008, $0.7 million in 2007 and $0.2 million in 2006. The 5¼% notes are convertible at the option of the holder at any time prior to maturity into shares of McMoRan’s common stock at a conversion price of $16.575 per share. Beginning on October 6, 2009, McMoRan has the option of redeeming the 5¼% notes for a price equal to 100 percent of the principal amount of the notes plus any accrued and unpaid interest on the notes prior to the redemption date, provided the closing price of McMoRan’s common stock has exceeded 130 percent of the conversion price for at least 20 trading days in any consecutive 30-day trading period.
During 2008, we privately negotiated transactions to induce the conversion of $40.2 million of the 5¼% notes into approximately 2.4 million shares of our common stock. McMoRan paid an aggregate $1.7 million in cash to induce these conversions, which is reflected as non-operating expense in the consolidated statements of operations.
On July 3, 2003, McMoRan issued $130 million of 6% convertible senior notes due July 2, 2008. Net proceeds from the notes totaled approximately $123.0 million, of which $22.9 million was used to purchase U.S. government securities held in escrow to secure the notes, and were used to pay the first six semi-annual interest payments through July 2, 2006. The notes are otherwise unsecured. Interest payments are payable on January 2 and July 2 of each year, and began on January 2, 2004. Interest expense totaled $1.7 million in 2008 and $7.2 million for the years ended December 31, 2007 and 2006. Amortization of the related deferred financing costs totaled $0.4 million in 2008, $1.1 million in 2007 and $1.0 million in 2006.
During 2008, McMoRan privately negotiated transactions to induce the conversion of $39.1 million of the 6% notes into approximately 2.75 million shares of McMoRan’s common stock. McMoRan paid an aggregate of $1.0 million in cash to induce these conversions, which is reflected as non-operating expense in the consolidated statements of operations. Additionally, $61.7 million of the 6% notes were converted into approximately 4.3 million shares of our common stock in accordance with the terms of the 6% notes (including the 6% notes converted into shares of common stock upon maturity on July 2, 2008).
In the first quarter of 2006, McMoRan privately negotiated transactions to induce conversion of $29.1 million of its 6% convertible senior notes and $25.0 million of its 5¼% convertible senior notes into approximately 3.6 million shares of its common stock based on the respective conversion price for each of the notes. McMoRan paid an aggregate $4.3 million in the transactions and recorded an approximate $4.0 million net charge to expense in the first quarter of 2006. The net charge reflects the $4.3 million inducement payment, reflected in the accompanying consolidated statement of operations as other non-operating expense, less $0.3 million of previously accrued interest expense recorded during 2005. McMoRan funded approximately $3.5 million of the cash payments from restricted cash held in escrow for funding interest payments on the convertible notes and paid the remaining portion with available unrestricted cash.
The fair value of the 5¼% notes was $62.9 million at December 31, 2008 and $125.4 million at December 31, 2007. The fair value of the 6% notes was $109.2 million at December 31, 2007.
Unsecured Bridge Loan Facility
On August 6, 2007, McMoRan entered into an $800 million interim bridge loan facility (bridge loan) in conjunction with the 2007 oil and gas property acquisition and initially borrowed $800 million to partially fund the acquisition costs. In November 2007, McMoRan used the net proceeds from concurrent public offerings of shares of its common and 6¾% preferred stock (Note 10), the sale of the 11.875% Senior Notes due 2014 (see “11.875% Senior Notes” above) and additional borrowings under the credit facility to repay and terminate the bridge loan. Upon repayment and termination of the bridge loan, the remaining unamortized deferred financing costs associated with the bridge loan, totaling $17.9 million, were charged to interest expense. This charge was partially offset by a $9.0 million reimbursement from McMoRan’s lenders of previously paid closing fees that were contractually reimbursable to McMoRan for retiring the bridge loan within 120 days of its origination. The average interest rate on borrowings under the bridge loan was 10.2 percent in 2007. For the year ended December 31, 2007, interest expense on the bridge loan totaled $30.7 million, including $9.3 million of amortization and subsequent net write off of the related deferred financing costs.
Senior Term Loan
Effective January 19, 2007, MOXY entered into a senior term loan agreement (term loan). The term loan agreement provided for a five-year, $100 million term loan facility. Proceeds at closing, net of related fees and discounts, totaled approximately $98.0 million. McMoRan used the net proceeds to repay borrowings then outstanding at that time under our previous revolving credit facility.
At the closing of the 2007 oil and gas property acquisition, MOXY repaid and terminated the term loan by repaying the principal plus a 3.0 percent ($3.0 million) prepayment premium. The prepayment premium was charged to non-operating expense in the consolidated statement of operations. The remaining unamortized deferred financings costs associated with the term loan, totaling $2.0 million, were charged to interest expense upon the repayment and termination of the term loan. The average interest rate on borrowings under the term loan was 12.7 percent in 2007. Interest expense on the term loan during 2007 totaled $9.3 million, including amortization and subsequent write off of related deferred financing costs of $2.3 million.
9. DERIVATIVE CONTRACTS
In connection with the closing of the 2007 oil and gas property acquisition (Note 2) and related financing, MOXY entered into derivative contracts for a portion of the anticipated production from its proved developed producing oil and gas properties at the time of the acquisition for the years 2008 through 2010. Excluding the put options, McMoRan has a total of 9.9 Bcf of natural gas and 0.4 million barrels of oil hedged through 2010, representing less than 5 percent of estimated proved reserves as of December 31, 2008. At December 31, 2008, McMoRan’s remaining outstanding oil and gas derivative contracts were as follows:
| | Natural Gas Positions (million MMbtu) |
| | Open Swap Positions a | | Put Options b | | |
| | Annual | | Average | | Annual | | Average | | Total |
| | Volumes | | Swap Price c | | Volumes | | Floor c | | Volumes |
| 2009 | 7.3 | | $ | 8.97 | | 3.2 | | $ | 6.00 | | 10.5 |
| 2010 | 2.6 | | $ | 8.63 | | 1.2 | | $ | 6.00 | | 3.8 |
| | Oil Positions (thousand bbls) |
| | Open Swap Positions a | | Put Options b | | |
| | Annual | | Average | | Annual | | Average | | Total |
| | Volumes | | Swap Price d | | Volumes | | Floor d | | Volumes |
| 2009 | 322 | | $ | 71.82 | | 125 | | $ | 50.00 | | 447 |
| 2010 | 118 | | $ | 70.89 | | 50 | | $ | 50.00 | | 168 |
| a. | Covering periods January-June and November-December of the respective years. |
| b. | Covering periods July-October of the respective years. |
| c. | Price per Mmbtu of natural gas. |
| d. | Price per barrel of oil. |
Because these oil and gas derivative contracts were not designated as hedges for accounting purposes, changes in the related fair values are recognized immediately in McMoRan’s operating results at each reporting period. McMoRan’s (gain)/loss on these contracts were as follows (in thousands):
| | Years Ended December 31, | |
| | | 2008 | | | 2007 | |
| Realized loss | | | | | | |
| Gas puts | $ | 2,209 | | $ | - | |
| Oil puts | | 356 | | | - | |
| Gas swaps | | 4,005 | | | - | |
| Oil swaps | | 17,739 | | | - | |
| Total realized loss | | 24,309 | | | - | |
| | | | | | | |
| Unrealized (gain) loss | | | | | | |
| Gas puts | | (3,178 | ) | | 1,433 | |
| Oil puts | | (1,483 | ) | | 630 | |
| Gas swaps | | (7,872 | ) | | (17,665 | ) |
| Oil swaps | | (28,079 | ) | | 20,783 | |
| Total unrealized (gain) loss | | (40,612 | ) | | 5,181 | |
| (Gain) loss on oil and gas derivative contracts | $ | (16,303 | ) | $ | 5,181 | |
The original cost of the put options was $4.6 million. There was no cost for entering into the swap contracts. The derivative contracts are reported at fair value on McMoRan’s balance sheets. McMoRan adopted SFAS 157 on January 1, 2008. The fair value of McMoRan’s swaps and puts are valued based on transaction counterparty acknowledgments and corroborated based on quoted market prices. McMoRan has classified its derivative instruments as Level 2 inputs (Note 1). The following table provides fair value measurement information as of December 31, 2008 and 2007 (in thousands):
| | December 31, 2008 | |
| | Puts | | Swaps | | | | |
| | Gas | | Oil | | Gas | | Oil | | Total | |
| Current assets | $ | 2,659 | | $ | 915 | | $ | 21,701 | | $ | 6,349 | | $ | 31,624 | |
| Other assets | | 765 | | | 297 | | | 3,837 | | | 948 | | | 5,847 | |
| Current liabilities | | - | | | - | | | - | | | - | | | - | |
| Other long-term liabilities | | - | | | - | | | - | | | - | | | - | |
| Fair value of contracts | $ | 3,424 | | $ | 1,212 | | $ | 25,538 | | $ | 7,297 | | $ | 37,471 | |
| | December 31, 2007 | |
| | Puts | | Swaps | | | | |
| | Gas | | Oil | | Gas | | Oil | | Total | |
| Current assets | $ | 1,350 | | $ | 4 | | $ | 15,269 | | $ | - | | $ | 16,623 | |
| Other assets | | 1,105 | | | 81 | | | 3,131 | | | - | | | 4,317 | |
| Current liabilities | | - | | | - | | | - | | | (14,001 | ) | | (14,001 | ) |
| Other long-term liabilities | | - | | | - | | | (735 | ) | | (6,781 | ) | | (7,516 | ) |
| Fair value of contracts | $ | 2,455 | | $ | 85 | | $ | 17,665 | | $ | (20,782 | ) | $ | (577 | ) |
10. COMMON AND MANDATORILY REDEEMABLE PREFERRED STOCK OFFERINGS
On November 7, 2007, McMoRan completed a public offering of 16.89 million shares of common stock at $12.40 per share and a concurrent public offering of 2.59 million shares of 6¾% mandatory convertible preferred stock with an offering price of $100 per share. The net proceeds from these offerings, after deducting the underwriters’ discounts, were approximately $450 million. The net proceeds from these offerings were used to repay a portion of the $800 million bridge loan (Note 8) that McMoRan used to partially fund its 2007 oil and gas property acquisition (Note 2).
The preferred stock is recorded at liquidation preference value ($100 per share) on the accompanying consolidated balance sheet. The quarterly cash dividend rate is $1.6785 per share, with the exception of the first dividend payment which was paid at $1.8375 per share, on February 15, 2008.
The 6¾% preferred stock was convertible into between 17.4 million and 20.9 million shares of McMoRan common stock, subject to certain anti-dilution adjustments, depending on the price of McMoRan’s common stock. The 6¾% preferred stock will automatically convert on November 15, 2010. Holders may elect at any time before November 15, 2010 to convert at a conversion rate equal to 6.7204 shares of common stock for each share of 6¾% preferred stock.
In 2008, McMoRan agreed in a privately negotiated transaction to induce conversion of approximately 990,000 shares of its 6¾% preferred stock (approximately 40% of the original issuance), with a liquidation preference of approximately $99 million, into approximately 6.7 million shares of McMoRan common stock (based on the minimum conversion rate of 6.7204 shares of common stock for each share of 6¾% preferred stock). McMoRan paid an aggregate $7.4 million in cash to the holders of these shares to induce the conversion of this 6¾% preferred stock, which is recorded as a $7.4 million charge to preferred dividends in the third quarter of 2008. Preferred dividend payment savings related to this transaction approximate $15 million through the November 2010 mandatory conversion date of the securities. Following this transaction, the remaining outstanding 6¾% preferred stock is convertible into between 10.7 million and 12.8 million shares of McMoRan common stock depending on the price of McMoRan’s common stock, subject to anti-dilution adjustments.
In June 2002, McMoRan completed a $35 million public offering of 1.4 million shares of its 5% mandatorily redeemable convertible preferred stock. Each share provided for a quarterly cash dividend of $0.3125 per share ($1.25 per share annually) and was convertible at the option of the holder at any time into 5.1975 shares of McMoRan’s common stock, which is equivalent to $4.81 per common share. Through December 31, 2006, a total of 30,375 shares of the 5% convertible stock was tendered and converted into a total of approximately 0.1 million shares of McMoRan common stock. During 2007, McMoRan called for the redemption of the remaining shares of 5% preferred stock outstanding; however, the holders of the shares elected to convert them into approximately 6.2 million shares of common stock prior to the effective redemption date. McMoRan’s dividend and amortization of convertible preferred stock issuance costs related to the 5% convertible preferred stock was $1.6 million for each of the two years ended December 31, 2007. Dividends paid were $1.1 million and $1.5 million for the years ended December 31, 2007 and 2006, respectively.
11. EARNINGS PER SHARE
McMoRan had a net loss from continuing operations for each of the three years in the period ending December 31, 2008. Accordingly, McMoRan’s diluted per share calculation for these periods was equivalent to its basic net loss per share calculation because it excluded the assumed exercise of stock options and stock warrants whose exercise prices were less than the average market price of McMoRan’s common stock during these periods, as well as the assumed conversion of McMoRan’s 5% mandatorily redeemable convertible preferred stock, 6¾% mandatorily convertible preferred stock, 6% convertible senior notes and 5¼% convertible senior notes. These instruments were excluded for these periods because they were considered to be anti-dilutive, meaning their inclusion would have reduced the reported net loss per share for these periods. The excluded common share amounts are summarized below (in thousands):
| | | Years Ended December 31, | |
| | | 2008 | | 2007 | | 2006 | |
| | | | | | | | | | | |
In-the-money stock options a, b | | | 1,631 | | | 1,727 | | | 1,097 | |
Shares issuable upon exercise of stock warrants a, c | | | 257 | | | 1,467 | | | 1,753 | |
| Shares issuable upon assumed conversion of: | | | | | | | | | | |
5% mandatorily redeemable preferred stock d | | | - | | | 3,103 | | | 6,205 | |
6¾% mandatorily convertible preferred stock e | | | 17,705 | | | 2,525 | | | - | |
6% convertible senior notes f | | | 2,635 | | | 7,079 | | | 7,079 | |
5¼% convertible senior notes g | | | 5,508 | | | 6,938 | | | 6,938 | |
| a. | McMoRan uses the treasury stock method to determine the amount of in-the-money stock options and stock warrants to include in its diluted earnings per share calculation. |
| b. | Represents stock options with an exercise price less than the average market price for McMoRan’s common stock for the periods presented. |
| c. | Includes stock warrants issued to K1 USA Energy Production Corporation in December 2002 (1.74 million shares) and September 2003 (0.76 million shares). On December 12, 2007, the stock warrant for 1.74 million common shares was exercised. K1 exercised the remaining warrant for 0.76 million common shares in a cashless transaction and received 0.64 million common shares (Note 6). |
| d. | Amount represents total equivalent common stock shares assuming conversion of 5% mandatorily redeemable preferred stock (Note 10). The remaining shares of the 5% preferred stock were converted into common stock at June 30, 2007. The amount is reduced from 6.2 million equivalent shares that were issued upon conversion to reflect the six months the preferred stock was outstanding. Preferred dividends and related costs totaled $1.6 million in 2007 and 2006. |
| e. | Amount represents total equivalent common stock shares assuming conversion of 6¾% mandatorily convertible preferred stock (Note 10). The 2007 amount is reduced from the total 17.4 million equivalent shares that would have been issued upon conversion to reflect the 53 days the preferred stock was outstanding in 2007. Preferred dividends, amortization of convertible preferred stock issuance costs and inducement payments for the early conversion of preferred stock totaled $22.3 million in 2008 and $2.6 million in 2007. |
| f. | Amount represents total equivalent common stock shares assuming conversion of 6% convertible senior notes (Note 8). Related net interest expense totaled $1.5 million in 2008, $6.6 million in 2007 and $4.7 million in 2006. |
| g. | Amount represents total equivalent common stock shares assuming conversion of 5¼% convertible senior notes (Note 8). Net interest expense on the 5¼% convertible senior notes totaled $4.4 million in 2008, $6.1 million in 2007 and $4.2 million in 2006. |
12. DISCONTINUED OPERATIONS
In November 1998, McMoRan acquired Freeport Energy, a business engaged in the purchasing, transporting, terminaling, processing, and marketing of recovered sulphur and the production of oil reserves at Main Pass. Prior to August 31, 2000, Freeport Energy was also engaged in the mining of sulphur. In June 2002, Freeport Energy sold substantially all of its remaining sulphur assets. As discussed in Note 1 - “Basis of Presentation” above, all of McMoRan’s sulphur operations and major classes of assets and liabilities are classified as discontinued operations in the accompanying consolidated financial statements. All of McMoRan sulphur results are included in the accompanying consolidated statements of operations within the caption “Income (loss) from discontinued operations.”
The table below provides a summary of the discontinued results of operations (in thousands):
| | | Years Ended December 31, | |
| | | 2008 | | 2007 | | 2006 | |
Sulphur retiree costs a | | | 494 | | | (3,155 | ) | | (1,436 | ) |
| Caretaking costs | | | 979 | | | 901 | | | 1,889 | |
| Accretion expense – sulphur | | | | | | | | | | |
| reclamation obligations | | | 3,295 | b | | 1,738 | | | 4,417 | b |
| Insurance | | | 432 | | | 463 | | | 881 | |
| General and administrative and legal | | | 236 | | | 174 | | | 176 | |
| Other | | | 60 | | | (3,948 | )c | | (2,989 | )d |
| (Income) loss from discontinued operations | | $ | 5,496 | | | (3,827 | ) | | 2,938 | |
| a. | Reflects postretirement benefit costs associated with certain retired former sulphur employees (Note 17). The amounts during 2008 and 2007 reflect reductions of the contractual liability resulting from decreased health care claim costs of $0.7 million and $4.6 million, respectively. The amount during 2006 reflects a $3.2 million reduction in a contractual liability resulting primarily from a significant reduction in the number of participants in the related benefit plans. |
| b. | Includes $3.1 million and $3.4 million charges to expense at December 31, 2008 and 2006 to increase the accrued reclamation costs for the Port Sulphur facilities to their estimated fair value. |
| c. | Includes $4.2 million of finalized insurance recoveries associated with the Port Sulphur property damage claims resulting from the 2005 hurricanes. |
| d. | Includes income of $3.5 million related to approved insurance claims resulting from property damages at the Port Sulphur facilities. Also includes $0.5 million of additional hurricane repair costs. |
Exit From Sulphur Business
In connection with the June 2002 sale of assets, McMoRan also agreed to be responsible for certain related historical environmental obligations and also agreed to indemnify the purchaser from certain potential liabilities with respect to the historical sulphur operations engaged in by Freeport Sulphur and its predecessor companies, including reclamation obligations. In addition, McMoRan assumed, and agreed to indemnify the purchaser from certain potential obligations, including environmental obligations, other than liabilities existing and identified as of the closing of the sale associated with historical oil and gas operations undertaken by the Freeport-McMoRan companies prior to the 1997 merger of Freeport-McMoRan Inc. and IMC Global Inc. As of December 31, 2008, McMoRan has paid approximately $0.2 million to settle certain claims associated with these assumed historical environmental obligations (Note 17).
Sulphur Reclamation Obligations
McMoRan is currently meeting its financial obligations relating to the future abandonment of its Main Pass facilities with the MMS using financial assurances from MOXY. McMoRan and its subsidiaries’ ongoing compliance with applicable MMS requirements will be subject to meeting certain financial and other criteria.
In 2002, McMoRan entered into a turnkey contract with Offshore Specialty Fabricators Inc. (OSFI) to dismantle and remove the remaining Main Pass sulphur facilities. OSFI commenced its reclamation work at the facilities not essential to any future business activities at Main Pass in 2002, which is now substantially complete. McMoRan paid OSFI $13 million for the removal of these structures at Main Pass. See Note 17 regarding the settlement of litigation between McMoRan and OSFI.
13. EMPLOYEE BENEFITS
Stock-Based Awards. At December 31, 2008, McMoRan had eight shareholder-approved stock incentive plans, five of which had shares available for grant. Under each plan McMoRan is authorized to issue a fixed amount of stock-based awards, which include stock options, stock appreciation rights, restricted stock, restricted stock units (RSUs) and other stock-based awards that are issuable in or valued by McMoRan common shares. Below is a summary of McMoRan’s plans.
| Plan | | Authorized amount of stock-based awards | | Shares available for grant at December 31, 2008 |
| 2008 Stock Incentive Plan (2008 Plan) | | 5,500,000 | | 3,778,500 |
| 2005 Stock Incentive Plan (2005 Plan) | | 3,500,000 | | 60,000 |
| 2004 Director Compensation Plan (2004 Directors Plan) | | 175,000 | | 79,123 |
| 2003 Stock Incentive Plan (2003 Plan) | | 2,000,000 | | 1,500 |
| 2001 Stock Incentive Plan (2001 Plan) | | 1,250,000 | | - |
| 2000 Stock Option Plan (2000 Plan) | | 600,000 | | 1,500 |
| 1998 Stock Option Plan | | 775,000 | | - |
| 1998 Stock Option Plan for Non-Employee Directors (Directors Plan) | | 75,000 | | - |
Restricted Stock Units. Under McMoRan’s incentive plans, its Board of Directors granted 20,000 RSUs in 2008 and 43,000 RSUs in 2007. There were no RSUs granted in 2006. The RSUs are converted ratably into an equivalent number of shares of McMoRan common stock on the grant anniversary dates over the following three years, unless deferred. RSUs converted into common stock totaled 8,232 shares in 2008, 4,167 shares in 2007 and 29,165 shares in 2006. Upon issuance of the RSUs, unearned compensation equivalent to the market value at the date of grants is recorded as deferred compensation in stockholders’ equity and is charged to expense over the three-year vesting period of each respective grant. McMoRan charged approximately $0.2 million of this deferred compensation to expense in 2008 and $0.1 million in 2007 and 2006.
Stock Options and Stock Appreciation Rights. McMoRan’s Board of Directors grants stock options under its stock incentive plans. Except for certain awards described below, the stock options become exercisable in 25 percent annual increments beginning one year from the date of grant and expire ten years
after the date of grant. McMoRan did not have any stock appreciation rights outstanding at December 31, 2008. A summary of stock options outstanding follows:
| | | 2008 | | 2007 | | 2006 |
| | | Number of | | Average | | Number of | | Average | | Number of | | Average |
| | | Options | | Option Price | | Options | | Option Price | | Options | | Option Price |
| Beginning of year | | 7,754,100 | | $14.96 | | | 7,095,991 | | $15.50 | | | 5,845,416 | | $14.57 | |
| Granted | | 1,759,500 | | 15.25 | | | 1,353,250 | | 12.29 | | | 1,365,500 | | 19.79 | |
| Exercised | | (318,475 | ) | 17.90 | | | (213,695 | ) | 8.37 | | | (26,823 | ) | 14.52 | |
| Expired/forfeited | | (78,375 | ) | 15.29 | | | (481,446 | ) | 18.33 | | | (88,102 | ) | 20.71 | |
| End of year | | 9,116,750 | | 14.91 | | | 7,754,100 | | 14.96 | | | 7,095,991 | | 15.50 | |
| Exercisable at end | | | | | | | | | | | | | | | |
| of year | | 6,565,437 | | | | | 5,636,100 | | | | | 5,169,822 | | | |
The total intrinsic value of options exercised during the years ended December 31, 2008, 2007 and 2006 was $4.0 million, $1.0 million and less than $0.1 million, respectively. The weighted average fair value of shares vested during the years ended December 31, 2008, 2007 and 2006 was $15.50, $10.02 and $9.95, respectively. The total intrinsic value of all McMoRan's options outstanding at December 31, 2008 was $130.5 million which have a weighted average life of 6.1 years. The total intrinsic value of exercisable options totaled $92.7 million at December 31, 2008. The exercisable options had a weighted average life of 5.3 years and a weighted average exercise price of $14.73.
The Co-Chairmen of McMoRan’s Board of Directors agreed to forgo all cash compensation during each of the three years ended December 31, 2008. In lieu of cash compensation, McMoRan has granted the Co-Chairmen stock options that are immediately exercisable upon grant and have a term of ten years. These grants to the Co-Chairmen totaled 400,000 options at an exercise price of $15.04 per share in January 2008, 400,000 options at an exercise price of $12.23 per share in January 2007 and 500,000 options at an exercise price of $19.85 per share in January 2006. The Co-Chairmen also received additional grants totaling 350,000 stock options in January 2008, 400,000 stock options in January 2007 and 350,000 stock options in January 2006, all of which vest ratably over a four-year period.
On February 2, 2009, McMoRan’s Board of Directors granted a total of 1,815,500 stock options to its employees at an exercise price of $6.44 per share, including immediately exercisable options for an aggregate of 445,000 shares, including 400,000 shares, to its Co-Chairmen in lieu of compensation in 2009.
Compensation cost charged against earnings for stock-based awards is shown below (in thousands).
| | Year Ended December 31, | |
| | 2008 | | 2007 | | 2006 | |
| Cost of options awarded to employees (including Directors) | $ | 28,725 | a | $ | 12,415 | a | $ | 15,129 | a |
| Cost of options awarded to non-employees and Advisory Directors | | 1,251 | | | 630 | | | 588 | |
| Cost of restricted stock units | | 247 | | | 62 | | | 105 | |
| Total stock-based compensation cost | $ | 30,223 | | $ | 13,107 | | $ | 15,822 | |
| a. | Includes $16.2 million, $2.8 million and $5.8 million of compensation charges associated with immediately vested stock options granted to McMoRan’s Co-Chairmen in lieu of receiving any cash compensation during 2008, 2007 and 2006, respectively. Also includes $4.9 million, $1.2 million and $1.9 million of compensation charges related to stock options granted to retirement-eligible employees, which resulted in one-year’s compensation expense being immediately recognized at the date of the stock option grant during 2008, 2007 and 2006, respectively. |
A summary of stock-based compensation by financial statement line item for the three years in the period ended December 31, 2008 is as follows (in thousands):
| | 2008 | | 2007 | | 2006 | |
| General and administrative expenses | $ | 14,818 | | $ | 6,334 | | $ | 7,120 | |
| Exploration expenses | | 14,376 | | | 6,296 | | | 8,104 | |
| Main Pass Energy Hub start-up costs | | 1,029 | | | 477 | | | 598 | |
| Total stock-based compensation cost | $ | 30,223 | | $ | 13,107 | | $ | 15,822 | |
As of December 31, 2008, total compensation cost related to nonvested, approved stock option awards not yet recognized in earnings was approximately $28.9 million, which is expected to be recognized over a weighted average period of one year. The fair value of option awards is estimated on the date of grant using a Black-Scholes-Merton option valuation model. Expected volatility is based on implied volatilities from the historical volatility of McMoRan’s stock and to a lesser extent on traded options on McMoRan’s common stock. McMoRan uses historical data to estimate option exercise, forfeitures and expected life of the options. The risk-free interest rate is based on Federal Reserve rates in effect for bonds with maturity dates equal to the expected term of the option at the date of grant. McMoRan has not paid, and is currently not permitted to pay, cash dividends on its common stock. The assumptions used to value stock option awards during the years ended December 31, 2008, 2007 and 2006 are noted in the following table:
| | | 2008 | | | 2007 | | | 2006 | |
| Weighted average fair value of stock options granted | $ | 24.27 | a | $ | 6.94 | b | $ | 11.85 | c |
| Expected and weighted average volatility | | 52.3 | | | 52.2 | | | 55.5 | % |
| Expected life of options (in years) | | 6.41 | a | | 6.29 | b | | 7 | c |
| Risk-free interest rate | | 3.04 | | | 4.76 | | | 4.5 | % |
| a. | Excludes stock options that were granted with immediate vesting (445,000 shares, including 400,000 shares granted to the Co-Chairmen in lieu of cash compensation for 2008) with an expected life of 6.86 years and fair value of stock options on grant date of $25.41 per share. |
| b. | Excludes stock options that were granted with immediate vesting (445,000 shares, including 400,000 shares granted to the Co-Chairmen in lieu of cash compensation for 2007) with an expected life of 6.56 years and fair value of stock options on grant date of $7.02 per share. |
| c. | Excludes stock options that were granted with immediate vesting (500,000 shares granted to the Co-Chairmen in lieu of any cash compensation for 2006) with an expected life of six years and a grant date fair value of $11.52 per share. |
Pension Plans and Other Benefits. During 2000, McMoRan elected to terminate its defined benefit pension plan covering substantially all its employees and replace this plan with enhancements to its savings plan, as further discussed below. All participants’ account balances in the defined benefit plan were fully vested on June 30, 2000. The plans’ investment portfolio was liquidated and invested primarily in short duration fixed-income securities in the fourth quarter of 2000 to reduce exposure to equity market volatility. Interest credits continued to accrue under the plan until the assets were liquidated and distributed after McMoRan received notification dated April 14, 2008 that the Internal Revenue Service approved the plan’s termination. McMoRan funded the approximate $2.3 million shortfall between the plan’s obligations and the underlying plan assets in August 2008.
McMoRan also provides certain health care and life insurance benefits (Other Benefits) to retired employees. McMoRan has the right to modify or terminate these benefits. For the year ended December 31, 2008, the health care cost trend rate used for the Other Benefits was 9.0 percent in 2009, decreasing ratably annually until reaching 5.0 percent in 2013. For the year ended December 31, 2007, the health care trend rate used for Other Benefits was 9.0 percent in 2008, decreasing ratably annually until reaching 5.0 percent in 2012. A one-percentage-point increase or decrease in assumed health care cost trend rates would not have a significant impact on service or interest costs. Information on the McMoRan plans follows (in thousands):
| | Pension Benefits | | Other Benefits | |
| | 2008 | | 2007 | | 2008 | | 2007 | |
| Change in benefit obligation: | | | | | | | | | | | | |
| Benefit obligation at the beginning of year | $ | (3,779 | ) | $ | (4,372 | ) | $ | (5,844 | ) | $ | (6,293 | ) |
| Service cost | | - | | | - | | | (48 | ) | | (26 | ) |
| Interest cost | | (62 | ) | | (214 | ) | | (285 | ) | | (330 | ) |
| Actuarial gains | | - | | | - | | | 670 | | | 588 | |
| Participant contributions | | - | | | - | | | (223 | ) | | (206 | ) |
| Benefits paid | | 3,841 | | | 807 | | | 857 | | | 423 | |
| Benefit obligation at end of year | | - | | | (3,779 | ) | | (4,873 | ) | | (5,844 | ) |
| | | | | | | | | | | | | |
| Change in plan assets: | | | | | | | | | | | | |
| Fair value of plan assets at beginning of year | | 1,524 | | | 2,231 | | | - | | | - | |
| Return on plan assets | | 21 | | | 100 | | | - | | | - | |
| Employer/participant contributions | | 2,296 | | | - | | | 856 | | | 423 | |
| Benefits paid | | (3,841 | ) | | (807 | ) | | (856 | ) | | (423 | ) |
| Fair value of plan assets at end of year | | - | | | 1,524 | | | - | | | - | |
| | | | | | | | | | | | | |
| Funded status | $ | - | | $ | (2,255 | ) | $ | (4,873 | ) | $ | (5,844 | ) |
| | | | | | | | | | | | | |
| Weighted-average assumptions (percent): | | | | | | | | | | | | |
| Discount rate | | N/A | | | N/A | a | | 6.20 | % | | 6.00 | % |
| Expected return on plan assets | | N/A | | | N/A | | | - | | | - | |
| Rate of compensation increase | | N/A | | | N/A | | | - | | | - | |
| a. | As discussed above, McMoRan elected to terminate its defined benefit pension plan on June 30, 2000. McMoRan invested almost the entire amount of this plan’s asset portfolio in short-term fixed income securities, with the remainder invested in overnight money market accounts. |
Expected benefit payments for McMoRan’s other benefits plan total $0.5 million in each of the five years ending December 31, 2013 and a total of $2.2 million during the ensuing five years. The components of net periodic benefit cost for McMoRan’s plans follow (in thousands):
| | | Pension Benefits | | Other Benefits | |
| | | 2008 | | 2007 | | 2006 | | 2008 | | 2007 | | 2006 | |
| Service cost | | $ | | | $ | - | | $ | - | | $ | 48 | | $ | 26 | | $ | 20 | |
| Interest cost | | | 62 | | | 214 | | | 217 | | | 285 | | | 330 | | | 347 | |
| Return on plan assets | | | (21 | ) | | (100 | ) | | (29 | ) | | - | | | - | | | - | |
| Amortization of prior service costs | | | - | | | - | | | - | | | (40 | ) | | (40 | ) | | (40 | ) |
| Recognition of net actuarial loss | | | - | | | - | | | - | | | - | | | 71 | | | 148 | |
| Net periodic benefit cost | | $ | 41 | | $ | 114 | | $ | 188 | | $ | 293 | | $ | 387 | | $ | 475 | |
Included in accumulated other comprehensive loss at December 31, 2008 (Note 15), are prior service credits of $0.2 million and actuarial losses of $0.3 million that have not been recognized in net periodic benefit costs associated with McMoRan’s health care and life insurance benefits for its retired employees (Other Benefits). The total amount expected to be recognized into net periodic costs in 2009 associated with these prior service credits and actuarial gains and losses is immaterial.
McMoRan has an employee savings plan under Section 401(k) of the Internal Revenue Code. The plan allows eligible employees to contribute up to 75 percent of their pre-tax compensation, subject to a limit prescribed by the Internal Revenue Code, which was $15,500 for 2008, $15,500 for 2007 and $15,000 for 2006. McMoRan matches 100 percent of each employees’ contribution up to a maximum of 5 percent of each employees’ annual basic compensation amount. In this plan, participants exercise
control and direct the investment of their contributions and account balances among a broad range of investment options. In connection with the termination of its defined benefits plan, McMoRan enhanced the savings plan for substantially all its employees. Pursuant to the enhancements, McMoRan contributes amounts to individual employee accounts totaling either 4 percent or 10 percent of each employee’s pay, depending on a combination of each employee’s age and years of service with McMoRan. Plan participants vest in McMoRan’s matching contributions and enhanced contributions upon completing three years of service with McMoRan. However, participants who were actively employed on January 1, 2009 became fully vested in the matching contributions. The plan’s 2009 matching contributions are fully vested. For employees whose eligible compensation exceeds certain levels, McMoRan provides an unfunded defined contribution plan. The balance of this liability totaled $1.4 million and $1.2 million on December 31, 2008 and 2007, respectively.
McMoRan’s results of operations reflect charges to expense totaling $1.1 million in 2008, $0.7 million in 2007 and $0.5 million in 2006 for its aggregate matching contributions for the Section 401(k) savings plan and the defined contribution plan. Additionally, McMoRan has other employee benefit plans, certain of which are related to McMoRan’s performance, which costs are recognized currently in general and administrative expense.
McMoRan also has a contractual obligation to reimburse a third party for a portion of their postretirement benefit costs relating to certain former retired sulphur employees (Note 17).
14. INCOME TAXES
McMoRan accounts for income taxes pursuant to SFAS 109, “Accounting for Income Taxes.” McMoRan also adopted the provisions of FIN 48 “Accounting for Uncertainties in Income Taxes” effective January 1, 2007. McMoRan has a net deferred tax asset of $343.1 million as of December 31, 2008, resulting from net operating loss and minimum tax credit carryforwards and other temporary differences related to McMoRan’s activities. McMoRan has provided a valuation allowance, including approximately $33.3 million associated with McMoRan’s discontinued sulphur operations, for the full amount of these net deferred tax assets. McMoRan’s effective tax rate would be impacted in future periods to the extent these deferred tax assets are recognized. McMoRan will continue to assess whether or not deferred tax assets can be recognized based on operating results in future periods.
As of December 31, 2008 and 2007, McMoRan had federal tax net operating loss carryforwards (NOL’s) of approximately $329.7 million and $459.3 million, respectively, and state tax NOL’s of approximately $244.8 million and $229.0 million, respectively. These NOL’s are scheduled to expire in varying amounts between tax years 2009 through 2027. In addition, McMoRan has approximately $2.4 million of minimum tax credit carryforwards which do not expire.
Internal Revenue Code provisions limit the application of alternative minimum tax net operating losses to ninety percent of defined alternative minimum taxable income. The recorded current federal tax provision reflects this limitation. Federal tax regulations impose additional limitations on the utilization of NOL’s from prior periods when a defined level of change in the stock ownership of certain shareholders is exceeded. Based on currently available information no such change in ownership was determined to have occurred during 2008. McMoRan continues to monitor stock ownership changes under the guidance of these provisions. Should an ownership change be determined or considered probable of occurring, McMoRan will include the impact of such change in the period that determination is made. Interest or penalties associated with income taxes are recorded as components of the provision for income taxes, although no such amounts have been recognized in the accompanying financial statements. Currently, McMoRan’s major taxing jurisdictions are the United States (federal) and Louisiana. Tax periods open to audit for McMoRan primarily include federal and Louisiana income tax returns subsequent to 2004. NOL amounts prior to this time are also subject to audit.
The components of McMoRan’s deferred tax assets (liabilities) at December 31, 2008 and 2007 follow (in thousands):
| | | December 31, | |
| | | 2008 | | 2007 | |
| Federal and state net operating loss carryforwards | | $ | 128,109 | | $ | 172,644 | |
| Property, plant and equipment | | | 38,037 | | | (43,000 | ) |
| Reclamation and shutdown reserves | | | 155,197 | | | 110,613 | |
| Deferred compensation, postretirement and pension benefits and | | | | | | | |
| accrued liabilities | | | 25,075 | | | 16,644 | |
| Tax credits and other, net | | | (3,356 | ) | | 7,653 | |
| Less: valuation allowance | | | (343,062 | ) | | (264,554 | ) |
| Net deferred tax asset | | $ | - | | $ | - | |
Reconciliations of the differences between income taxes computed at the federal statutory tax rate and the income taxes recorded follow (in thousands):
| | 2008 | | 2007 | | 2006 | |
| Income tax benefit computed at the federal | | | | | | | | | |
| statutory income tax rate | $ | 74,965 | | $ | 20,907 | | $ | 16,679 | |
| Change in valuation allowance | | (78,508 | ) | | (20,517 | ) | | (17,030 | ) |
| Other | | 1,100 | | | (390 | ) | | 351 | |
| Federal income tax provision | | (2,443 | ) | | - | | | - | |
| State income tax provision | | (65 | ) | | - | | | - | |
| Total income tax provision | $ | (2,508 | ) | $ | - | | $ | - | |
15. OTHER COMPREHENSIVE LOSS
McMoRan’s other comprehensive loss for 2008, 2007 and 2006 follows (in thousands):
| | 2008 | | 2007 | | 2006 | |
| Net loss | $ | (216,694 | ) | $ | (59,734 | ) | $ | (47,654 | ) |
| Other comprehensive income (loss) | | | | | | | | | |
| Amortization of previously unrecognized pension | | | | | | | | | |
| components, net | | (40 | ) | | 31 | | | - | |
| Change in unrecognized net gains/losses of pension plans | | 671 | | | 589 | | | - | |
| Other comprehensive loss | $ | (216,063 | ) | $ | (59,114 | ) | $ | (47,654 | ) |
16. TRANSACTIONS WITH AFFILIATES
FM Services, a company in which McMoRan shares certain common executive management, provides McMoRan with certain administrative, financial and other services on a contractual basis. These service costs, which include related overhead amounts, including rent for the New Orleans corporate headquarters, totaled $7.5 million in 2008, $5.5 million in 2007 and $5.2 million in 2006. Management believes these costs do not differ materially from the costs that would have been incurred had the relevant personnel providing the services been employed directly by McMoRan. At December 31, 2008 and 2007, McMoRan had an obligation to fund $2.7 million of FM Services costs, primarily reflecting long-term employee pension and postretirement medical obligations (Notes 7 and 13).
17. COMMITMENTS AND CONTINGENCIES
Commitments. At December 31, 2008, McMoRan had $239.0 million of contractual commitments related to its planned oil and gas exploration and development activities, including costs related to projects currently in progress, inventory purchase commitments and other exploration expenditures. Included in this amount is $130.2 million of expenditures for drilling rig contract charges which we expect to share with our partners in our exploration program.
Long-Term Contracts and Operating Leases. McMoRan’s primary operating leases involve renting office space in two buildings in Houston, Texas, which expire in April 2014 and July 2014, respectively,
and office space in Lafayette, Louisiana, which expires November 2011. At December 31, 2008, McMoRan’s total minimum annual contractual charges aggregated $12.7 million, with payments totaling $2.3 million in 2009, 2010, 2011, 2012 and 2013, and $1.2 million thereafter.
Other Liabilities. Freeport Energy has a contractual obligation to reimburse a third party a portion of its postretirement benefit costs relating to certain retired former sulphur employees of Freeport Energy. This contractual obligation totaled $6.1 million at December 31, 2008 and $7.3 million at December 31, 2007, including $0.7 million and $1.1 million in current liabilities from discontinued operations, respectively. A third-party actuarial consultant reviews the estimated related future costs associated with this contractual liability on an annual basis using current health care trend costs and incorporating changes made to the underlying benefit plans of the third party. The assessment at year end 2008 used an initial health care cost trend rate of 8.5 percent in 2009 decreasing ratably to 5.0 percent in 2016. During 2007, the assessment used an initial health care cost trend rate of 8.0 percent in 2008 decreasing ratably to 5.0 percent in 2011. McMoRan applied a discount rate of 9.5 percent at December 31, 2008 and 8.5 percent at December 31, 2007 to the consultant’s future cost estimates. McMoRan reduced the liability by $0.7 million and $4.6 million at December 31, 2008 and 2007, respectively, primarily reflecting decreases in future health claim costs resulting from lower than expected actual health claim reimbursements offset by higher health trend costs. Future changes to this estimate resulting from changes in assumptions or actual results varying from projected results will be recorded in earnings.
At December 31, 2008 and 2007, McMoRan had $3.2 million in escrow related to assumed sulphur-related environmental liabilities. The restricted escrowed funds, which approximate McMoRan’s estimated costs for the assumed environmental liabilities, is classified as a long-term asset and recorded in “Restricted investments and cash,” with a corresponding amount recorded in “Other Liabilities” in the accompanying consolidated balance sheets. In August 2010, the escrow agreement will terminate and any remaining restricted amounts will be refunded to McMoRan.
Environmental and Reclamation. McMoRan has made, and will continue to make, expenditures for the protection of the environment. McMoRan is subject to contingencies as a result of environmental laws and regulations. Present and future environmental laws and regulations applicable to McMoRan’s operations could require substantial capital expenditures or could adversely affect its operations in other ways that cannot be predicted at this time. As of December 31, 2008, McMoRan has paid approximately $0.2 million to settle certain claims related to historical oil and gas liabilities it assumed from IMC Global. No additional amounts have been recorded because no specific liability has been identified that is reasonably probable of requiring McMoRan to fund any future material amounts.
McMoRan revises its reclamation and well abandonment estimates recorded under SFAS No. 143 at least annually. During 2008 and 2007 these estimates were revised for (1) the initial estimates for the 2007 oil and gas property acquisition (Note 2); (2) changes in the projected timing of certain reclamation costs because of changes in the estimated timing of the depletion of the related proved reserves for McMoRan’s oil and gas properties and new estimates for the timing for the reclamation of the structures comprising the MPEH™ project and Port Sulphur facilities; (3) changes in its credit-adjusted risk free interest rate; and (4) assuming additional obligations at some properties and recording obligations relating to any new properties. McMoRan’s credit adjusted, risk-free interest rates ranged from 8.5 percent to 13.1 percent at December 31, 2008, 8.5 percent to 10.0 percent at December 31, 2007 and 9.3 percent to 10.0 percent at December 31, 2006. At December 31, 2008, McMoRan’s estimated undiscounted reclamation obligations, including inflation and market risk premiums, totaled $684.7 million, including $42.6 million associated with its remaining sulphur obligations. A rollforward of McMoRan’s consolidated discounted asset retirement obligations (including both current and long term obligations) follows (in thousands):
| | Years Ended December 31, | |
| | 2008 | | 2007 | | 2006 | |
| Oil and Natural Gas | | | | | | | | | |
| Asset retirement obligation at beginning of year | $ | 294,737 | | $ | 25,876 | | $ | 21,760 | |
| Liabilities settled | | (43,782 | ) | | (6,720 | ) | | (670 | ) |
Accretion expense a | | 32,933 | | | 12,222 | | | 2,088 | |
| Reclamation costs assumed from third parties | | 2,859 | | | - | | | - | |
| Liabilities assumed in 2007 property acquisition | | - | | | 267,537 | | | - | |
| Incurred liabilities | | 2,476 | | | 272 | | | 2,534 | |
| Revision for changes in estimates | | 131,978 | b | | (4,450 | ) | | 164 | |
| Asset retirement obligations at end of year | $ | 421,201 | | $ | 294,737 | | $ | 25,876 | |
| Sulphur | | | | | | | | | |
| Asset retirement obligations at beginning of year: | $ | 21,300 | | $ | 23,094 | | $ | 21,786 | |
| Liabilities settled | | (1,591 | ) | | (3,532 | )c | | (3,109 | )c |
| Accretion expense | | 866 | | | 1,738 | | | 1,392 | |
| Revision for changes in estimates | | 2,428 | | | - | | | 3,025 | d |
| Asset retirement obligation at end of year | $ | 23,003 | | $ | 21,300 | | $ | 23,094 | |
| | | | | | | | | | |
| a. | Accretion expense charges are included within depletion, depreciation and amortization expense in the accompanying consolidated statements of operations. |
| b. | Primarily represents estimated future abandonment costs associated with damaged structures and well abandonment related to Hurricane Ike. |
| c. | Amount of costs incurred to remove structures at Port Sulphur that were damaged by hurricanes Katrina and Rita in 2005. |
| d. | Revisions primarily reflect changes in estimated timing of reclamation work at Port Sulphur (Note 12). Accretion expense within discontinued operations includes amounts associated with revision for changes in estimates because there are no related property, plant and equipment amounts associated with the sulphur reclamation obligations. |
At December 31, 2008, McMoRan had $7.7 million in restricted investments associated with third party prepayments of future abandonment costs and $18.9 million in escrow associated with the funding requirements related to the reclamation obligations of the 2007 oil and gas property acquisition. McMoRan is required to make payments under these requirements totaling $15 million annually, payable in quarterly installments (twelve payments total), and $5.0 million a year (payable in quarterly installments) thereafter until certain requirements under the arrangement are met.
Litigation. In December 2005, McMoRan reached an agreement in principle with plaintiffs to settle previously disclosed litigation in the Delaware Court of Chancery relating to the 1998 merger of Freeport-McMoRan Sulphur Inc. and McMoRan Oil & Gas Co. McMoRan paid $17.5 million in cash into a settlement fund in the first quarter of 2006, the plaintiffs provided a complete release of all claims, and the Delaware litigation was dismissed with prejudice. During the fourth quarter of 2005, McMoRan recorded a $12.8 million charge, net of the minimum amount of insurance proceeds agreed to by insurers, for the settlement of this litigation. McMoRan received an additional $0.4 million of insurance proceeds in 2006. These items are disclosed as a separate line item in the accompanying consolidated statements of operations.
In 2002, McMoRan entered into a turnkey contract with OSFI for the reclamation of the sulphur mine and related facilities at Main Pass located offshore in the Gulf of Mexico. OSFI substantially completed its reclamation work at Main Pass for the structures not essential for use in the MPEH™ project. However, a contractual dispute between the parties resulted in litigation which was settled in July 2004. In accordance with the settlement, OSFI will complete the remaining reclamation work and McMoRan paid OSFI the $2.6 million representing the final balance for these reclamation costs in November 2004. In addition, OSFI currently has no obligation regarding the MPEH™ structures. Pursuant to the settlement, OSFI was granted an option to participate in the MPEH™ project for up to 10 percent of McMoRan’s equity interest on a basis parallel to McMoRan’s agreement with K1 USA (Note 6).
McMoRan may from time to time be involved in various legal proceedings of a character normally incident to the ordinary course of its business. Management believes that potential liability from any of
these pending or threatened proceedings will not have a material adverse effect on McMoRan’s financial condition or results of operations.
18. SUPPLEMENTARY OIL AND GAS INFORMATION
McMoRan’s oil and gas exploration, development and production activities are conducted offshore in the Gulf of Mexico and onshore in the Gulf Coast region of the United States. Supplementary information presented below is prepared in accordance with requirements prescribed by SFAS 69 “Disclosures about Oil and Gas Producing Activities.”
Oil and Gas Capitalized Costs.
| | | Years Ended | |
| | | December 31, | |
| | | 2008 | | 2007 | |
| | | (In Thousands) | |
Unproved properties a | | $ | 51,684 | | $ | 70,421 | |
Proved properties b | | | 2,111,893 | | | 1,913,907 | |
| Subtotal | | | 2,163,577 | | | 1,984,328 | |
| Less accumulated depreciation and amortization | | | (1,171,045 | ) | | (481,000 | ) |
| Net oil and gas properties | | $ | 992,532 | | $ | 1,503,328 | |
a. | Includes costs associated with in-progress wells and wells not fully evaluated, including related leasehold acquisition costs, totaling $43.8 million at December 31, 2008 and $55.6 million at December 31, 2007. |
| b. | Includes the costs associated with the Blueberry Hill well at Louisiana State Lease 340, where plans to sidetrack the well are being developed. Amounts totaled $22.9 million at December 31, 2008 and 2007, respectively. |
Costs Incurred in Oil and Natural Gas Property Acquisition, Exploration and Development Activities.
| | | Years Ended December 31, | |
| | | 2008 | | 2007 | | 2006 | |
| | | (In Thousands) | |
| Acquisition of properties: | | | | | | | | | | |
| Proved | | $ | 2,230 | | $ | 1,314,136 | a | $ | - | |
| Unproved | | | 2,808 | | | 8,313 | a | | 2,310 | |
| Exploration costs | | | 125,039 | | | 140,874 | | | 124,590 | |
| Development costs | | | 126,199 | | | 59,287 | | | 134,338 | |
| | | $ | 256,276 | | $ | 1,522,610 | | $ | 261,238 | |
| a. | Includes the costs associated with the 2007 oil and gas property acquisition (Note 2), including $7.5 million attributable to unproved properties. |
The following table reflects the net changes in McMoRan’s capitalized exploratory well costs (excluding any related leasehold costs) during each of the three years in the period ended December 31, 2008 (in thousands):
| | Years Ended December 31, | |
| | 2008 | | 2007 | | 2006 | |
| Beginning of year | $ | 55,980 | | $ | 38,456 | | $ | 19,619 | |
| Additions to capitalized exploratory well | | | | | | | | | |
| costs pending determination of proved reserves | | 141,263 | | | 157,216 | | | 242,558 | |
| Reclassifications to wells, facilities, and equipment | | | | | | | | | |
| based on determination of proved reserves | | (120,182 | ) | | (117,259 | ) | | (178,777 | ) |
| Amounts charged to expense | | (33,270 | ) | | (22,433 | ) | | (44,944 | ) |
| End of year | $ | 43,791 | | $ | 55,980 | | $ | 38,456 | |
Proved Oil and Natural Gas Reserves (Unaudited). Proved oil and natural gas reserves for each of the three years in the period ending December 31, 2008 have been estimated by Ryder Scott, in accordance with guidelines established by the Securities and Exchange Commission (SEC) as set forth in Rule 4-10(a)(2), (3) and (4) of Regulation S-X, which require such estimates to be based upon existing economic and operating conditions as of year-end without consideration of expected changes in prices and costs or other future events. All estimates of oil and natural gas reserves are inherently imprecise and subject to change as new technical information about the properties is obtained. Estimates of proved reserves for wells with little or no production history are less reliable than those based on a long production history. Subsequent evaluation of the same reserves may result in variations which may be substantial. Revisions of proved reserves represent changes in previous estimates of proved reserves resulting from new information obtained from production history, additional development drilling and/or changes in other factors, including economic considerations. Discoveries and extensions represent additions to proved reserves resulting from (1) extensions of proved acreage of previously discovered reservoirs through additional drilling in periods subsequent to initial discovery, and (2) discover of new fields with proved reserves or of new reservoirs of proved reserves in old fields. Substantially all of McMoRan's proved reserves are located offshore in the Gulf of Mexico. Oil, including condensate and plant products, is stated in thousands of barrels (MBbls) and natural gas in millions of cubic feet (MMcf).
| | Oil | | Natural Gas | |
| | 2008 | | 2007 | | 2006 | | 2008 | | 2007 | | 2006 | |
| Proved reserves: | | | | | | | | | | | | |
| Beginning of year | 19,717 | | 5,772 | | 7,131 | | 245,606 | | 41,202 | | 38,944 | |
| Revisions of previous estimates | (335 | ) | 565 | | (519 | ) | 5,469 | | (1,039 | ) | 723 | |
| Discoveries and extensions | 1,016 | | 484 | | 536 | | 45,993 | | 25,552 | | 17,153 | |
| Production | (3,633 | ) | (2,385 | ) | (1,376 | ) | (67,891 | ) | (41,147 | ) | (15,618 | ) |
| Purchase of reserves | 224 | | 15,281 | a | - | | 13,720 | | 221,038 | a | - | |
| End of year | 16,989 | b | 19,717 | | 5,772 | | 242,897 | b | 245,606 | | 41,202 | |
| | Oil | | Natural Gas | |
| | 2008 | | 2007 | | 2006 | | 2008 | | 2007 | | 2006 | |
| Proved developed reserves: | | | | | | | | | | | | |
| Beginning of year | 17,452 | | 5,526 | | 6,248 | | 203,595 | | 34,949 | | 29,101 | |
| End of year | 15,039 | | 17,452 | | 5,526 | | 198,610 | | 203,595 | | 34,949 | |
| a. | Reflects the estimated proved reserves of the 2007 oil and gas property acquisition (Note 2). |
| b. | At December 31, 2008, McMoRan had natural gas imbalances of 1.5 MMcf for under deliveries and 1.6 MMcf for over deliveries |
Standardized Measure of Discounted Future Net Cash Flows From Proved Oil and Natural Gas Reserves (Unaudited).
McMoRan’s standardized measure of discounted future net cash flows and changes therein relating to proved oil and natural gas reserves were computed using reserve valuations based on regulations and parameters prescribed by the SEC. These regulations require the use of year-end oil and natural gas prices in the projection of future net cash flows. The weighted average of these prices for all properties with proved reserves was $40.27 per barrel of oil and $6.09 per Mcf of natural gas at December 31, 2008 and $92.69 per barrel of oil and $7.22 per Mcf of natural gas at December 31, 2007. The oil price reflects the lower market value associated with the sour crude oil reserves produced at Main Pass, whose year-end prices were $38.80 per barrel at December 31, 2008 and $85.57 per barrel at December 31, 2007.
| | | December 31, | |
| | | 2008 | | 2007 | |
| | | (In Thousands) | |
| Future cash inflows | | $ | 2,163,814 | | $ | 3,601,360 | |
| Future costs applicable to future cash flows: | | | | | | | |
| Production costs | | | (537,147 | ) | | (687,588 | ) |
| Development and abandonment costs | | | (673,715 | ) | | (585,681 | ) |
| Future income taxes | | | (1,965 | ) | | (266,928 | ) |
| Future net cash flows | | | 950,987 | | | 2,061,163 | |
Discount for estimated timing of net cash flows (10% discount rate) a | | | (245,696 | ) | | (422,897 | ) |
| | | $ | 705,291 | | $ | 1,638,266 | |
| a. | Amount reflects application of required 10 percent discount rate to both the estimated future income taxes and estimated future net cash flows associated with production of the estimated proved reserves. |
Changes in Standardized Measure of Discounted Future Net Cash Flows From Proved Oil and Natural Gas Reserves (Unaudited).
| | | Years Ended December 31, | |
| | | 2008 | | 2007 | | 2006 | |
| | | (In Thousands) | |
| Beginning of year | | $ | 1,638,266 | | $ | 269,962 | | $ | 383,139 | |
| Revisions: | | | | | | | | | | |
| Changes in prices | | | (534,921 | ) | | 494,774 | | | (106,961 | ) |
| Accretion of discount | | | 163,827 | | | 26,996 | | | 38,313 | |
| Change in reserve quantities | | | 4,204 | | | 196,253 | | | (21,317 | ) |
| Other changes, including revised estimates of development | | | | | | | | | | |
| costs and rates of production | | | (234,425 | )a | | (186,238 | ) | | (11,739 | ) |
| Discoveries and extensions, less related costs | | | 211,492 | | | 132,808 | | | 93,125 | |
| Development costs incurred during the year | | | 50,811 | | | 8,559 | | | 35,123 | |
| Change in future income taxes | | | 179,156 | | | (179,725 | ) | | 3,862 | |
| Revenues, less production costs | | | (800,354 | ) | | (353,123 | ) | | (143,583 | ) |
| Purchase of reserves in place | | | 27,235 | | | 1,228,000 | b | | - | |
| End of year | | $ | 705,291 | | $ | 1,638,266 | | $ | 269,962 | |
| a. | Includes $107.6 million of revised reclamation cost estimates related to additional costs associated with properties damaged by Hurricane Ike and acceleration timing of when these costs are expected to be incurred. |
| b. | Reflects the standardized measure of the proved reserves for the 2007 oil and gas property acquisition (Note 2). |
19. GUARANTOR FINANCIAL STATEMENTS
In November 2007, McMoRan completed the sale of $300 million of 11.875% senior notes (Note 6). The senior notes are unconditionally guaranteed on a senior basis jointly and severally by MOXY and the subsidiary guarantors. The guarantee is an unsecured obligation of the guarantor and ranks equal in right of payment with all existing and future indebtedness of McMoRan, including indebtedness under the credit facility. The guarantee also ranks senior in right of payment with all future subordinated obligations and is effectively subordinated in right of payment to any debt of McMoRan’s subsidiaries that are not subsidiary guarantors.
The following condensed consolidating financial information includes information regarding McMoRan, as parent, MOXY and its subsidiaries, as guarantors, and Freeport Energy, as the non-guarantor subsidiary. Included are the condensed consolidating balance sheets at December 31, 2008
and 2007 and the related condensed consolidating statements of operations and cash flow for the years ended December 31, 2008, 2007 and 2006, which should be read in conjunction with the notes to these consolidated financial statements:
CONDENSED CONSOLIDATING BALANCE SHEET
December 31, 2008
| | | | | | | Freeport | | | | Consolidated | |
| | | Parent | | MOXY | | Energy | | Eliminations | | McMoRan | |
| | | (In Thousands) | |
| ASSETS | | | | | | | | | | | | | | | | |
| Current assets: | | | | | | | | | | | | | | | | |
| Cash and cash equivalents | | $ | 35 | | $ | 93,442 | | $ | 9 | | $ | - | | $ | 93,486 | |
| Accounts receivable | | | - | | | 112,684 | | | - | | | - | | | 112,684 | |
| Inventories | | | - | | | 31,284 | | | - | | | - | | | 31,284 | |
| Prepaid expenses | | | 12,794 | | | 1,025 | | | - | | | - | | | 13,819 | |
| Fair value of derivative contracts | | | - | | | 31,624 | | | - | | | - | | | 31,624 | |
| Current assets from discontinued | | | | | | | | | | | | | | | | |
| operations | | | - | | | - | | | 516 | | | - | | | 516 | |
| Total current assets | | | 12,829 | | | 270,059 | | | 525 | | | - | | | 283,413 | |
| Property, plant and equipment, net | | | - | | | 992,532 | | | 31 | | | - | | | 992,563 | |
| Discontinued sulphur assets | | | - | | | - | | | 3,012 | | | - | | | 3,012 | |
| Investment in subsidiaries | | | 841,882 | | | - | | | - | | | (841,882 | ) | | - | |
| Amounts due from affiliates | | | | | | 168,004 | | | (2,993 | ) | | (165,011 | ) | | - | |
| Deferred financing costs and other | | | | | | | | | | | | | | | | |
| assets | | | 11,122 | | | 40,172 | | | - | | | - | | | 51,294 | |
| Total assets | | $ | 865,833 | | $ | 1,470,767 | | $ | 575 | | $ | (1,006,893 | ) | $ | 1,330,282 | |
| | | | | | | | | | | | | | | | | |
| LIABILITIES AND STOCKHOLDERS’ EQUITY (DEFICIT) | | | | | | | | | | |
Current liabilities: | | | | | | | | | | | | | | | | |
| Accounts payable | | $ | 512 | | $ | 76,491 | | $ | 6 | | $ | - | | $ | 77,009 | |
| Accrued liabilities | | | 705 | | | 88,329 | | | 531 | | | - | | | 89,565 | |
| Current portion of oil and gas | | | | | | | | | | | | | | | | |
| accrued reclamation costs | | | - | | | 103,550 | | | - | | | - | | | 103,550 | |
| Other current liabilities | | | 6,835 | | | 751 | | | - | | | - | | | 7,586 | |
| Current liabilities from discontinued | | | | | | | | | | | | | | | | |
| operations | | | - | | | - | | | 2,102 | | | - | | | 2,102 | |
| Total current liabilities | | | 8,052 | | | 269,121 | | | 2,639 | | | - | | | 279,812 | |
| Long-term debt | | | 374,720 | | | - | | | - | | | - | | | 374,720 | |
| Amounts due to affiliates | | | 165,011 | | | - | | | - | | | (165,011 | ) | | - | |
| Accrued oil and gas reclamation costs | | | - | | | 317,651 | | | - | | | - | | | 317,651 | |
| Accrued sulphur reclamation costs | | | - | | | - | | | 22,218 | | | - | | | 22,218 | |
| Other long-term liabilities | | | 9,027 | | | 9,380 | | | 8,451 | | | - | | | 26,858 | |
| Total liabilities | | | 556,810 | | | 596,152 | | | 33,308 | | | (165,011 | ) | | 1,021,259 | |
| Commitments and contingencies | | | | | | | | | | | | | | | | |
| Stockholders’ equity (deficit) | | | 309,023 | | | 874,615 | | | (32,733 | ) | | (841,882 | ) | | 309,023 | |
| Total liabilities and stockholders’ | | | | | | | | | | | | | | | | |
| equity (deficit) | | $ | 865,833 | | $ | 1,470,767 | | $ | 575 | | $ | (1,006,893 | ) | $ | 1,330,282 | |
CONDENSED CONSOLIDATING BALANCE SHEET
December 31, 2007
| | | | | | | Freeport | | | | Consolidated | |
| | | Parent | | MOXY | | Energy | | Eliminations | | McMoRan | |
| | | (In Thousands) | |
| ASSETS | | | | | | | | | | | | | | | | |
| Current assets: | | | | | | | | | | | | | | | | |
| Cash and cash equivalents | | $ | 143 | | $ | 3,446 | | $ | 1,241 | | $ | - | | $ | 4,830 | |
| Accounts receivable | | | 885 | | | 127,805 | | | - | | | - | | | 128,690 | |
| Inventories | | | - | | | 11,507 | | | - | | | - | | | 11,507 | |
| Prepaid expenses | | | 12,833 | | | 1,498 | | | - | | | - | | | 14,331 | |
| Fair value of derivative contracts | | | - | | | 16,623 | | | - | | | - | | | 16,623 | |
| Current assets from discontinued | | | | | | | | | | | | | | | | |
| operations | | | - | | | - | | | 3,029 | | | - | | | 3,029 | |
| Total current assets | | | 13,861 | | | 160,879 | | | 4,270 | | | - | | | 179,010 | |
| Property, plant and equipment, net | | | - | | | 1,503,328 | | | 31 | | | - | | | 1,503,359 | |
| Discontinued sulphur assets | | | - | | | - | | | 476 | | | - | | | 476 | |
| Investment in subsidiaries | | | 971,176 | | | - | | | - | | | (971,176 | ) | | - | |
| Amounts due from affiliates | | | - | | | 68,341 | | | 5,987 | | | (74,328 | ) | | - | |
| Deferred financing costs and other | | | | | | | | | | | | | | | | |
| assets | | | 14,135 | | | 18,308 | | | - | | | - | | | 32,443 | |
| Total assets | | $ | 999,172 | | $ | 1,750,856 | | $ | 10,764 | | $ | (1,045,504 | ) | $ | 1,715,288 | |
| | | | | | | | | | | | | | | | | |
| LIABILITIES AND STOCKHOLDERS’ EQUITY (DEFICIT) | | | | | | | | | | |
Current liabilities: | | | | | | | | | | | | | | | | |
| Accounts payable | | $ | 222 | | $ | 97,300 | | $ | 299 | | $ | - | | $ | 97,821 | |
| Accrued liabilities | | | 2,110 | | | 65,006 | | | 1,176 | | | - | | | 68,292 | |
| Current portion of debt | | | 111,535 | | | - | | | - | | | - | | | 111,535 | |
| Current portion of oil and gas | | | | | | | | | | | | | | | | |
| accrued reclamation costs | | | - | | | 80,839 | | | - | | | - | | | 80,839 | |
| Other current liabilities | | | 11,723 | | | 15,333 | | | - | | | - | | | 27,056 | |
| Current liabilities from discontinued | | | | | | | | | | | | | | | | |
| operations | | | - | | | - | | | 14,769 | | | - | | | 14,769 | |
| Total current liabilities | | | 125,590 | | | 258,478 | | | 16,244 | | | - | | | 400,312 | |
| Long-term debt | | | 415,000 | | | 274,000 | | | - | | | - | | | 689,000 | |
| Amounts due to affiliates | | | 74,328 | | | - | | | - | | | (74,328 | ) | | - | |
| Accrued oil and gas reclamation costs | | | - | | | 213,898 | | | - | | | - | | | 213,898 | |
| Accrued sulphur reclamation costs | | | - | | | - | | | 9,155 | | | - | | | 9,155 | |
| Other long-term liabilities | | | 12,025 | | | 9,245 | | | 9,424 | | | - | | | 30,694 | |
| Total liabilities | | | 626,943 | | | 755,621 | | | 34,823 | | | (74,328 | ) | | 1,343,059 | |
| Commitments and contingencies | | | | | | | | | | | | | | | | |
| Stockholders’ equity (deficit) | | | 372,229 | | | 995,235 | | | (24,059 | ) | | (971,176 | ) | | 372,229 | |
| Total liabilities and stockholders’ | | | | | | | | | | | | | | | | |
| equity (deficit) | | $ | 999,172 | | $ | 1,750,856 | | $ | 10,764 | | $ | (1,045,504 | ) | $ | 1,715,288 | |
CONDENSED CONSOLIDATING STATEMENT OF OPERATIONS
Year Ended December 31, 2008
| | | | | | | Freeport | | | | Consolidated | |
| | | Parent | | MOXY | | Energy | | Eliminations | | McMoRan | |
| | | (In Thousands) | |
| Revenues: | | | | | | | | | | | | | | | | |
| Oil and gas | | $ | - | | $ | 1,058,804 | | $ | - | | $ | - | | $ | 1,058,804 | |
| Service | | | - | | | 13,678 | | | - | | | - | | | 13,678 | |
| Total revenues | | | - | | | 1,072,482 | | | - | | | - | | | 1,072,482 | |
| Costs and expenses: | | | | | | | | | | | | | | | | |
| Production and delivery costs | | | - | | | 258,504 | | | (54 | ) | | - | | | 258,450 | |
| Depletion, depreciation and amortization | | | - | | | 854,798 | | | - | | | - | | | 854,798 | |
| Exploration expenses | | | - | | | 79,116 | | | - | | | - | | | 79,116 | |
| General and administrative expenses | | | 7,624 | | | 41,024 | | | 351 | | | - | | | 48,999 | |
| Gain on oil and gas derivative contracts | | | - | | | (16,303 | ) | | - | | | - | | | (16,303 | ) |
| Start-up costs for Main Pass | | | | | | | | | | | | | | | | |
Energy HubTM | | | - | | | - | | | 6,047 | | | - | | | 6,047 | |
| Insurance recoveries and other | | | - | | | (3,391 | ) | | - | | | - | | | (3,391 | ) |
| Total costs and expenses | | | 7,624 | | | 1,213,748 | | | 6,344 | | | - | | | 1,227,716 | |
| Operating income (loss) | | | (7,624 | ) | | (141,266 | ) | | (6,344 | ) | | - | | | (155,234 | ) |
| Interest expense, net | | | (43,722 | ) | | (7,168 | ) | | - | | | - | | | (50,890 | ) |
| Equity in earnings (losses) of | | | | | | | | | | | | | | | | |
| consolidated subsidiaries | | | (160,205 | ) | | - | | | - | | | 160,205 | | | - | |
| Other income (expense), net | | | (2,635 | ) | | 69 | | | - | | | - | | | (2,566 | ) |
| Income (loss) from continuing operations | | | | | | | | | | | | | | | | |
| before income taxes | | | (214,186 | ) | | (148,365 | ) | | (6,344 | ) | | 160,205 | | | (208,690 | ) |
| Provision for income taxes | | | (2,508 | ) | | - | | | - | | | - | | | (2,508 | ) |
| Income (loss) from continuing operations | | | (216,694 | ) | | (148,365 | ) | | (6,344 | ) | | 160,205 | | | (211,198 | ) |
| Income from discontinued operations | | | - | | | - | | | (5,496 | ) | | - | | | (5,496 | ) |
| Net income (loss) | | | (216,694 | ) | | (148,365 | ) | | (11,840 | ) | | 160,205 | | | (216,694 | ) |
| Preferred dividends and amortization | | | | | | | | | | | | | | | | |
| of convertible preferred stock | | | | | | | | | | | | | | | | |
| issuance costs | | | (22,286 | ) | | - | | | - | | | - | | | (22,286 | ) |
| Net income (loss) applicable to | | | | | | | | | | | | | | | | |
| common stock | | $ | (238,980 | ) | $ | (148,365 | ) | $ | (11,840 | ) | $ | 160,205 | | $ | (238,980 | ) |
| | | | | | | | | | | | | | | | | |
CONDENSED CONSOLIDATING STATEMENT OF OPERATIONS
Year Ended December 31, 2007
| | | | | | | Freeport | | | | Consolidated | |
| | | Parent | | MOXY | | Energy | | Eliminations | | McMoRan | |
| | | (In Thousands) | |
| Revenues: | | | | | | | | | | | | | | | | |
| Oil and gas | | $ | - | | $ | 475,250 | | $ | - | | $ | - | | $ | 475,250 | |
| Service | | | - | | | 5,917 | | | - | | | - | | | 5,917 | |
| Total revenues | | | - | | | 481,167 | | | - | | | - | | | 481,167 | |
| Costs and expenses: | | | | | | | | | | | | | | | | |
| Production and delivery costs | | | - | | | 122,175 | | | (48 | ) | | - | | | 122,127 | |
| Depreciation and amortization | | | - | | | 256,007 | | | - | | | - | | | 256,007 | |
| Exploration expenses | | | - | | | 58,954 | | | - | | | - | | | 58,954 | |
| General and administrative expenses | | | 5,264 | | | 22,499 | | | 210 | | | - | | | 27,973 | |
| Loss on oil and gas derivative contracts | | | - | | | 5,181 | | | - | | | - | | | 5,181 | |
| Start-up costs for Main Pass | | | | | | | | | | | | | | | | |
Energy HubTM | | | - | | | - | | | 9,754 | | | - | | | 9,754 | |
| Insurance recovery and other | | | - | | | (2,338 | ) | | - | | | - | | | (2,338 | ) |
| Total costs and expenses | | | 5,264 | | | 462,478 | | | 9,916 | | | - | | | 477,658 | |
| Operating income (loss) | | | (5,264 | ) | | 18,689 | | | (9,916 | ) | | - | | | 3,509 | |
| Interest expense | | | (49,513 | ) | | (16,853 | ) | | - | | | - | | | (66,366 | ) |
| Equity in earnings (losses) of | | | | | | | | | | | | | | | | |
| consolidated subsidiaries | | | (6,464 | ) | | - | | | - | | | 6,464 | | | - | |
| Other income (expense), net | | | 1,507 | | | (2,211 | ) | | | | | | | | (704 | ) |
| Income (loss) from continuing operations | | | | | | | | | | | | | | | | |
| before income taxes | | | (59,734 | ) | | (375 | ) | | (9,916 | ) | | 6,464 | | | (63,561 | ) |
| Provision for income taxes | | | - | | | - | | | - | | | - | | | - | |
| Income (loss) from continuing operations | | | (59,734 | ) | | (375 | ) | | (9,916 | ) | | 6,464 | | | (63,561 | ) |
| Income from discontinued operations | | | - | | | 302 | | | 3,525 | | | - | | | 3,827 | |
| Net income (loss) | | | (59,734 | ) | | (73 | ) | | (6,391 | ) | | 6,464 | | | (59,734 | ) |
| Preferred dividends and amortization | | | | | | | | | | | | | | | | |
| of convertible preferred stock | | | | | | | | | | | | | | | | |
| issuance costs | | | (4,172 | ) | | - | | | - | | | - | | | (4,172 | ) |
| Net income (loss) applicable to | | | | | | | | | | | | | | | | |
| common stock | | $ | (63,906 | ) | $ | (73 | ) | $ | (6,391 | ) | $ | 6,464 | | $ | (63,906 | ) |
| | | | | | | | | | | | | | | | | |
CONDENSED CONSOLIDATING STATEMENT OF OPERATIONS
Year Ended December 31, 2006
| | | | | | | Freeport | | | | Consolidated | |
| | | Parent | | MOXY | | Energy | | Eliminations | | McMoRan | |
| | | (In Thousands) | |
| Revenues: | | | | | | | | | | | | | | | | |
| Oil and gas | | $ | - | | $ | 185,852 | | $ | 10,865 | | $ | - | | $ | 196,717 | |
| Service | | | 778 | | | 11,742 | | | 501 | | | - | | | 13,021 | |
| Total revenues | | | 778 | | | 197,594 | | | 11,366 | | | - | | | 209,738 | |
| Costs and expenses: | | | | | | | | | | | | | | | | |
| Production and delivery costs | | | - | | | 48,192 | | | 4,942 | | | - | | | 53,134 | |
| Depreciation and amortization | | | - | | | 104,063 | | | 661 | | | | | | 104,724 | |
| Exploration expenses | | | - | | | 67,737 | | | - | | | - | | | 67,737 | |
| General and administrative expenses | | | 5,637 | | | 14,982 | | | 108 | | | - | | | 20,727 | |
| Start-up costs for Main Pass | | | | | | | | | | | | | | | | |
Energy HubTM | | | - | | | - | | | 10,714 | | | - | | | 10,714 | |
| Exploration expense reimbursement | | | - | | | (10,979 | ) | | - | | | - | | | (10,979 | ) |
| Insurance recovery and other | | | (446 | ) | | (2,583 | ) | | (723 | ) | | - | | | (3,752 | ) |
| Total costs and expenses | | | 5,191 | | | 221,412 | | | 15,702 | | | - | | | 242,305 | |
| Operating income (loss) | | | (4,413 | ) | | (23,818 | ) | | (4,336 | ) | | - | | | (32,567 | ) |
| Interest expense | | | (10,135 | ) | | (68 | ) | | - | | | - | | | (10,203 | ) |
| Equity in earnings (losses) of | | | | | | | | | | | | | | | | |
| consolidated subsidiaries | | | (30,228 | ) | | - | | | - | | | 30,228 | | | - | |
| Other income (expense), net | | | (2,878 | ) | | 724 | | | 208 | | | - | | | (1,946 | ) |
| Income (loss) from continuing operations | | | | | | | | | | | | | | | | |
| before income taxes | | | (47,654 | ) | | (23,162 | ) | | (4,128 | ) | | 30,228 | | | (44,716 | ) |
| Provision for income taxes | | | - | | | - | | | - | | | - | | | - | |
| Income (loss) from continuing operations | | | (47,654 | ) | | (23,162 | ) | | (4,128 | ) | | 30,228 | | | (44,716 | ) |
| Income (loss) from discontinued | | | | | | | | | | | | | | | | |
| operations | | | - | | | 77 | | | (3,015 | ) | | - | | | (2,938 | ) |
| Net income (loss) | | | (47,654 | ) | | (23,085 | ) | | (7,143 | ) | | 30,228 | | | (47,654 | ) |
| Preferred dividends and amortization | | | | | | | | | | | | | | | | |
| of convertible preferred stock | | | | | | | | | | | | | | | | |
| issuance costs | | | (1,615 | ) | | - | | | - | | | - | | | (1,615 | ) |
| Net income (loss) applicable to | | | | | | | | | | | | | | | | |
| common stock | | $ | (49,269 | ) | $ | (23,085 | ) | $ | (7,143 | ) | $ | 30,228 | | $ | (49,269 | ) |
| | | | | | | | | | | | | | | | | |
CONDENSED CONSOLIDATING STATEMENT OF CASH FLOW
Year Ended December 31, 2008
| | | | | | | Freeport | | Consolidated | |
| | | Parent | | MOXY | | Energy | | McMoRan | |
| | | (In Thousands) | |
| | | | | | | | | | | | | | |
| Cash flow from operating activities: | | | | | | | | | | | | | |
| Net cash provided by continuing | | | | | | | | | | | | | |
| operations | | $ | 23,676 | | $ | 603,205 | | $ | 2,778 | | $ | 629,659 | |
| Net cash used in discontinued | | | | | | | | | | | | | |
| operations | | | - | | | - | | | (6,262 | ) | | (6,262 | ) |
| Net cash provided by (used in) | | | | | | | | | | | | | |
| operating activities | | | 23,676 | | | 603,205 | | | (3,484 | ) | | 623,397 | |
| | | | | | | | | | | | | | |
| Cash flow from investing activities: | | | | | | | | | | | | | |
| Exploration, development and other | | | | | | | | | | | | | |
| capital expenditures | | | - | | | (236,383 | ) | | - | | | (236,383 | ) |
| Acquisition of oil & gas properties, net | | | - | | | (2,826 | ) | | - | | | (2,826 | ) |
| Net cash used in investing activities | | | - | | | (239,209 | ) | | - | | | (239,209 | ) |
| | | | | | | | | | | | | | |
| Cash flow from financing activities: | | | | | | | | | | | | | |
| Net borrowings under revolving credit | | | | | | | | | | | | | |
| facility | | | - | | | (274,000 | ) | | - | | | (274,000 | ) |
| Dividends and inducements payments | | | | | | | | | | | | | |
| on convertible preferred stock | | | (23,565 | ) | | - | | | - | | | (23,565 | ) |
| Proceeds from exercise of stock | | | | | | | | | | | | | |
| options, warrants and other | | | 4,696 | | | - | | | - | | | 4,696 | |
| Payments for induced conversion of | | | | | | | | | | | | | |
| convertible senior notes | | | (2,663 | ) | | - | | | - | | | (2,663 | ) |
| Investment from parent | | | (2,252 | ) | | - | | | 2,252 | | | - | |
| Net cash provided by (used in) | | | | | | | | | | | | | |
| financing activities | | | (23,784 | ) | | (274,000 | ) | | 2,252 | | | (295,532 | ) |
| | | | | | | | | | | | | | |
| Net increase (decrease) in cash and | | | | | | | | | | | | | |
| cash equivalents | | | (108 | ) | | 89,996 | | | (1,232 | ) | | 88,656 | |
| Cash and cash equivalents at beginning | | | | | | | | | | | | | |
| of year | | | 143 | | | 3,446 | | | 1,241 | | | 4,830 | |
| Cash and cash equivalents at end of | | | | | | | | | | | | | |
| year | | $ | 35 | | $ | 93,442 | | $ | 9 | | $ | 93,486 | |
| | | | | | | | | | | | | | |
TABLE OF CONTENTS
CONDENSED CONSOLIDATING STATEMENT OF CASH FLOW
Year Ended December 31, 2007
| | | | | | | Freeport | | Consolidated | |
| | | Parent | | MOXY | | Energy | | McMoRan | |
| | | (In Thousands) | |
| | | | | | | | | | | | | | |
| Cash flow from operating activities: | | | | | | | | | | | | | |
| Net cash provided by (used in) | | | | | | | | | | | | | |
| continuing operations | | $ | 35,897 | | $ | 189,205 | | $ | (15,454 | ) | $ | 209,648 | |
| Net cash provided by (used in) | | | | | | | | | | | | | |
| discontinued operations | | | - | | | 302 | | | (2,312 | ) | | (2,010 | ) |
| Net cash provided by (used in) | | | | | | | | | | | | | |
| operating activities | | | 35,897 | | | 189,507 | | | (17,766 | ) | | 207,638 | |
| | | | | | | | | | | | | | |
| Cash flow from investing activities: | | | | | | | | | | | | | |
| Exploration, development and other | | | | | | | | | | | | | |
| capital expenditures | | | - | | | (153,210 | ) | | - | | | (153,210 | ) |
| Acquisition of Newfield properties, net | | | - | | | (1,047,936 | ) | | - | | | (1,047,936 | ) |
| Proceeds from restricted investments | | | 6,056 | | | - | | | - | | | 6,056 | |
| Increase in restricted investments | | | (126 | ) | | - | | | - | | | (126 | ) |
| Net cash provided by (used in) | | | | | | | | | | | | | |
| investing activities | | | 5,930 | | | (1,201,146 | ) | | - | | | (1,195,216 | ) |
| | | | | | | | | | | | | | |
| Cash flow from financing activities: | | | | | | | | | | | | | |
| Net borrowings under revolving credit | | | | | | | | | | | | | |
| facility | | | - | | | 245,250 | | | - | | | 245,250 | |
| Proceeds from sale of 11.875% senior | | | | | | | | | | | | | |
| notes | | | 300,000 | | | - | | | - | | | 300,000 | |
| Net proceeds from sale of 6.75% | | | | | | | | | | | | | |
| mandatory convertible preferred | | | | | | | | | | | | | |
| stock | | | 250,385 | | | - | | | - | | | 250,385 | |
| Net proceeds from sale of common stock | | | 200,189 | | | - | | | - | | | 200,189 | |
| Proceeds from bridge loan facility | | | 800,000 | | | - | | | - | | | 800,000 | |
| Repayment of bridge loan facility | | | (800,000 | ) | | - | | | - | | | (800,000 | ) |
| Proceeds from senior term loan | | | - | | | 100,000 | | | - | | | 100,000 | |
| Repayment of senior term loan | | | - | | | (100,000 | ) | | - | | | (100,000 | ) |
| Financing costs | | | (17,573 | ) | | (12,980 | ) | | - | | | (30,553 | ) |
| Dividends paid on convertible preferred | | | | | | | | | | | | | |
| stock | | | (1,121 | ) | | - | | | - | | | (1,121 | ) |
| Proceeds from exercise of stock | | | | | | | | | | | | | |
| options, warrants and other | | | 10,428 | | | - | | | - | | | 10,428 | |
| Investment from parent | | | (800,586 | ) | | 781,786 | | | 18,800 | | | - | |
| Net cash provided by (used in) | | | | | | | | | | | | | |
| financing activities | | | (58,278 | ) | | 1,014,056 | | | 18,800 | | | 974,578 | |
| | | | | | | | | | | | | | |
| Net increase (decrease) in cash and | | | | | | | | | | | | | |
| cash equivalents | | | (16,451 | ) | | 2,417 | | | 1,034 | | | (13,000 | ) |
| Cash and cash equivalents at beginning | | | | | | | | | | | | | |
| of year | | | 16,594 | | | 1,029 | | | 207 | | | 17,830 | |
| Cash and cash equivalents at end of | | | | | | | | | | | | | |
| year | | $ | 143 | | $ | 3,446 | | $ | 1,241 | | $ | 4,830 | |
| | | | | | | | | | | | | | |
CONDENSED CONSOLIDATING STATEMENT OF CASH FLOW
Year Ended December 31, 2006
| | | | | | | Freeport | | Consolidated | |
| | | Parent | | MOXY | | Energy | | McMoRan | |
| | | (In Thousands) | |
| Cash flow from operating activities: | | | | | | | | | | | | | |
| Net cash provided by (used in) | | | | | | | | | | | | | |
| continuing operations | | $ | (25,469 | ) | | 131,323 | | | (5,717 | ) | | 100,137 | |
| Net cash provided by (used in) | | | | | | | | | | | | | |
| discontinued operations | | | - | | | 77 | | | (5,023 | ) | | (4,946 | ) |
| Net cash provided by (used in) | | | | | | | | | | | | | |
| operating activities | | | (25,469 | ) | | 131,400 | | | (10,740 | ) | | 95,191 | |
| | | | | | | | | | | | | | |
| Cash flow from investing activities: | | | | | | | | | | | | | |
| Exploration, development and other | | | | | | | | | | | | | |
| capital expenditures | | | - | | | (251,851 | ) | | (518 | ) | | (252,369 | ) |
| Property insurance reimbursement | | | - | | | 3,947 | | | - | | | 3,947 | |
| Proceeds from restricted investments | | | 16,505 | | | - | | | - | | | 16,505 | |
| Increase in restricted investments | | | (229 | ) | | - | | | - | | | (229 | ) |
| Proceeds from sale of oil and gas | | | | | | | | | | | | | |
| properties | | | - | | | 1,021 | | | 50 | | | 1,071 | |
| Cash acquired | | | - | | | 23,052 | | | (23,052 | ) | | - | |
| Net cash provided by (used in) | | | | | | | | | | | | | |
| investing activities | | | 16,276 | | | (223,831 | ) | | (23,520 | ) | | (231,075 | ) |
| | | | | | | | | | | | | | |
| Cash flow from financing activities: | | | | | | | | | | | | | |
| Net borrowings under revolving credit | | | | | | | | | | | | | |
| facility | | | - | | | 28,750 | | | - | | | 28,750 | |
| Financing costs | | | - | | | (531 | ) | | - | | | (531 | ) |
| Dividends paid on convertible preferred | | | | | | | | | | | | | |
| stock | | | (1,494 | ) | | - | | | - | | | (1,494 | ) |
| Proceeds from exercise of stock | | | | | | | | | | | | | |
| options, warrants and other | | | 389 | | | - | | | - | | | 389 | |
| Payments for induced conversion of | | | | | | | | | | | | | |
| convertible senior notes | | | (4,301 | ) | | - | | | - | | | (4,301 | ) |
| Net repayment of borrowings to parent | | | 5,674 | | | (5,674 | ) | | - | | | - | |
| Investment from parent | | | (17,826 | ) | | - | | | 17,826 | | | - | |
| Net cash provided by (used in) | | | | | | | | | | | | | |
| financing activities | | | (17,558 | ) | | 22,545 | | | 17,826 | | | 22,813 | |
| | | | | | | | | | | | | | |
| Net decrease in cash and cash | | | | | | | | | | | | | |
| equivalents | | | (26,751 | ) | | (69,886 | ) | | (16,434 | ) | | (113,071 | ) |
| Cash and cash equivalents at beginning | | | | | | | | | | | | | |
| of year | | | 43,345 | | | 70,915 | | | 16,641 | | | 130,901 | |
| Cash and cash equivalents at end of | | | | | | | | | | | | | |
| year | | $ | 16,594 | | $ | 1,029 | | $ | 207 | | $ | 17,830 | |
| | | | | | | | | | | | | | |
20. QUARTERLY FINANCIAL INFORMATION (UNAUDITED)
| | | | | Operating | | Net | | Net Income | |
| | | | | Income | | Income | | (Loss) per Share | |
| | | Revenues | | (Loss) | | (Loss) a | | Basic | | Diluted | |
| | | (In Thousands, Except Per Share Amounts) | |
2008 b | | | | | | | | | | | | | | | | |
1st Quarter | | $ | 295,476 | | $ | 55,825 | | $ | 32,009 | | $ | 0.59 | | $ | 0.46 | |
2nd Quarter | | | 375,508 | | | 70,256 | | | 49,725 | | | 0.87 | | | 0.63 | |
3rd Quarter | | | 285,245 | | | 18,057 | c | | (6,132 | ) | | (0.10 | ) | | (0.10 | ) |
4th Quarter | | | 116,253 | | | (299,372 | )d | | (314,582 | ) | | (4.46 | ) | | (4.46 | ) |
| | | $ | 1,072,482 | | $ | (155,234 | ) | $ | (238,980 | ) | | | | | | |
| | | | | Operating | | Net | | Net Income | |
| | | | | Income | | Income | | (Loss) per Share | |
| | | Revenues | | (Loss) | | (Loss) a | | Basic | | Diluted | |
| | | (In Thousands, Except Per Share Amounts) | |
2007 b | | | | | | | | | | | | | | | | |
1st Quarter | | $ | 51,697 | | $ | (11,923 | ) | $ | (14,903 | )e | $ | (0.53 | ) | $ | (0.53 | ) |
2nd Quarter | | | 45,348 | | | 685 | | | (6,486 | ) | | (0.23 | ) | | (0.23 | ) |
3rd Quarter | | | 133,252 | | | (25,663 | )f | | (52,184 | ) | | (1.50 | ) | | (1.50 | ) |
4th Quarter | | | 250,870 | h | | 40,410 | | | 9,667 | g | | 0.21 | | | 0.20 | |
| | | $ | 481,167 | | $ | 3,509 | | $ | (63,906 | ) | | | | | | |
| | | | | | | | | | | | | | | | | |
| a. | Reflects net income (loss) attributable to common stock, which includes preferred dividends and amortization of convertible preferred stock issuance costs as a reduction to net income (loss). |
| b. | Amounts associated with the 2007 oil and gas property acquisition were recorded beginning August 6, 2007. |
| c. | Includes $152.6 million of Hurricane Ike related charges and an impairment charge of $10.8 million. |
| d. | Includes $291.8 million in impairment losses, $16.8 million of additional charges associated with Hurricane Ike damage and $22.1 million of non-productive well costs. |
| e. | Includes $4.2 million final settlement of property damage claims for the Port Sulphur, Louisiana facilities. |
| f. | Includes a $13.6 million impairment charge, nonproductive exploratory well drilling and related costs of $20.3 million and $12.5 million of seismic data purchases for exploration acreage acquired in 2007. |
| g. | Includes $8.7 million net charge to write off the remaining unamortized financing costs associated with the bridge loan facility upon its repayment and termination in November 2007 (Note 8) and a $4.6 million reduction in contractual liability covering certain retired former sulphur employees (Note 17). |
Not Applicable
(a) Evaluation of disclosure controls and procedures. Our chief executive officer and chief financial officer, with the participation of management, have evaluated the effectiveness of our disclosure controls and procedures (as defined in Rules 13a-14(c) and 15d-14(c) under the Securities Exchange Act of 1934) as of the end of the period covered by this annual report on Form 10-K. Based on their evaluation, they have concluded that our disclosure controls and procedures are effective in timely alerting them to material information relating to McMoRan (including our consolidated subsidiaries) required to be disclosed in our periodic SEC filings.
(b) Management’s Report on Internal Control over Financial Reporting and Report of Independent
Registered Public Accounting Firm. The information required to be furnished pursuant to this item is set forth under the captions “Management’s Report on Internal Control over Financial Reporting” and “Report of Independent Registered Public Accounting Firm” in Item 8 of this report.
(c) Changes in internal controls. There has been no change in our internal control over financial reporting that occurred during the fourth fiscal quarter that has materially affected, or is reasonably likely to materially affect our internal controls over financial reporting.
Not Applicable.
The information required by Item 10 regarding our executive officers appears in a separately captioned heading after Item 4 in Part II of this report on Form 10-K. Other information required by this item will be contained in our definitive proxy statement to be filed pursuant to Regulation 14A and is incorporated herein by reference.
Information required by this item will be contained in our definitive proxy statement to be filed pursuant to Regulation 14A and is incorporated herein by reference.
Information required by this item will be contained in our definitive proxy statement to be filed pursuant to Regulation 14A and is incorporated herein by reference.
Information required by this item will be contained in our definitive proxy statement to be filed pursuant to Regulation 14A and is incorporated herein by reference.
Information required by this item will be contained in our definitive proxy statement to be filed pursuant to Regulation 14A and is incorporated herein by reference.
(a)(1). Financial Statements. Reference is made to Item 8 hereof.
| (a)(2). | Financial Statement Schedules. All financial statement schedules are either not required under the related instructions or are not applicable because the information has been included elsewhere herein. |
| (a)(3). | Exhibits. Reference is made to the Exhibit Index beginning on page E-1 hereof. |
____________________
3-D seismic technology. Seismic data which has been digitally recorded, processed and analyzed in a manner that permits color enhanced three dimensional displays of geologic structures. Seismic data processed in that manner facilitates more comprehensive and accurate analysis of subsurface geology, including the potential presence of hydrocarbons.
Bbl or Barrel. One stock tank barrel, or 42 U.S. gallons liquid volume (used in reference to crude oil or other liquid hydrocarbons).
Bcf. Billion cubic feet.
Bcfe. Billion cubic feet equivalent, determined using the ratio of six Mcf of natural gas to one barrel of crude oil, condensate or natural gas liquids.
Block. A block depicted on the Outer Continental Shelf Leasing and Official Protraction Diagrams issued by the U.S. Mineral Management Service or a similar depiction on official protraction or similar diagrams issued by a state bordering on the Gulf of Mexico.
Blowouts. Accidents resulting from a penetration of a gas or oil reservoir during drilling operations under higher-than-calculated pressure.
Completion. The installation of permanent equipment for the production of natural gas or oil, or in the case of a dry hole, the reporting of abandonment to the appropriate agency.
Condensate. Liquid hydrocarbons associated with the production of a primarily natural gas reserve.
Cratering. The collapse of the circulation system dug around the drilling rig for the prevention of blowouts.
Developed acreage. Acreage in which there are one or more producing wells or shut-in wells capable of commercial production and/or acreage with established reserves in quantities we deemed sufficient to develop.
Development well. A well drilled into a proved natural gas or oil reservoir to the depth of a stratigraphic horizon known to be productive.
Exploratory well. A well drilled (1) to find and produce natural gas or oil reserves not classified as proved, (2) to find a new reservoir in a field previously found to be productive of natural gas or oil in another reservoir or (3) to extend a known reservoir.
Farm-in or farm-out. An agreement under which the owner of a working interest in a natural gas and oil lease assigns the working interest or a portion of the working interest to another party who desires to drill on the leased acreage. Generally, the assignee is required to drill one or more wells at its expense in order to earn its interest in the acreage. The assignor usually retains a royalty or reversionary interest in the lease. The agreement is a “farm-in” to the assignee and a “farm-out” to the assignor.
Field. An area consisting of a single reservoir or multiple reservoirs all grouped on or related to the same individual geological structural feature and/or stratigraphic condition.
Gross acres or gross wells. The total acres or wells, as the case may be, in which a working interest and/or operating right is owned.
Gross interval. The measurement of the vertical thickness of the producing and non-producing zones of an oil and gas reservoir.
Gulf of Mexico shelf. The offshore area within the Gulf of Mexico seaward on the coastline extending out to 200 meters water depth.
Henry Hub. The pricing point for natural gas futures on the New York Mercantile Exchange.
LNG. Liquefied natural gas
MBbls. One thousand barrels, typically used to measure the volume of crude oil or other liquid hydrocarbons.
Mcf. One thousand cubic feet, typically used to measure the volume of natural gas.
Mcfe. One thousand cubic feet equivalent, determined using the ratio of six Mcf of natural gas to one Bbl of crude oil, condensate or natural gas liquids.
MMBbls. One million barrels, typically used to measure the volume of crude oil or other liquid hydrocarbons.
MMbtu. One million british thermal units.
MMcf. One million cubic feet, typically used to measure the volume of natural gas at specified temperature and pressure.
MMcfe. One million cubic feet equivalent, determined using the ratio of six Mcf of natural gas to one Bbl of crude oil, condensate or natural gas liquids.
MMcfe/d. One million cubic feet equivalent per day.
MMS. The U.S. Minerals Management Service.
Net acres or net wells. Gross acres multiplied by the percentage working interest and/or operating right owned.
Net feet of hydrocarbon bearing sands. The vertical thickness of the producing zone of an oil and gas reservoir.
Net feet of pay. The thickness of reservoir rock estimated to both contain hydrocarbons and be capable of contributing to producing rates.
Net profit interest. An interest in profits realized through the sale of production, after costs. It is carved out of the working interest.
Net revenue interest. An interest in a revenue stream net of all other interests burdening that stream, such as a lessor’s royalty and any overriding royalties. For example, if a lessor executes a lease with a one-eighth royalty, the lessor’s net revenue interest is 12.5 percent and the lessee’s net revenue interest is 87.5 percent.
Non-productive well. A well found to be incapable of producing hydrocarbons in quantities sufficient such that proceeds from the sale of production would exceed production expenses and taxes.
Overriding royalty interest. A revenue interest, created out of a working interest, that entitles its owner to a share of revenues, free of any operating or production costs. An overriding royalty is often retained by a lessee assigning an oil and gas lease.
Pay. Reservoir rock containing oil or gas.
Plant Products. Hydrocarbons (primarily ethane, propane, butane and natural gasolines) which have been extracted from wet natural gas and become liquid under various combinations of increasing pressure and lower temperature.
Productive well. A well that is found to be capable of producing hydrocarbons in quantities sufficient such that proceeds from the sale of production exceed production expenses and taxes.
Prospect. A specific geographic area which, based on supporting geological, geophysical or other data and also preliminary economic analysis using reasonably anticipated prices and costs, is deemed to have potential for the discovery of commercial hydrocarbons.
Proved developed non-producing reserves. Reserves expected to be recovered from zones in existing wells, which will require additional completion work or future recompletion prior to the start of production.
Proved developed producing reserves. Reserves expected to be recovered from completion intervals which are open and producing at the time the estimate is made.
Proved developed reserves. Proved developed oil and gas reserves are reserves that can be expected to be recovered through existing wells with existing equipment and operating methods. For additional information, see the SEC’s definition in Regulation S-X Rule 4-10(a)(3).
Proved developed shut-in reserves. Reserves expected to be recovered from (1) completion intervals which are open at the time of the estimate, but which have not stared producing, (2) wells which were shut-in awaiting pipeline connections or as a result of a market interruption or (3) wells not capable of production for mechanical reasons.
Proved reserves. Proved oil and gas reserves are the estimated quantities of crude oil, natural gas, and natural gas liquids that geological and engineering data demonstrate with reasonable certainty to be recoverable in future years from known reservoirs under existing economic and operating conditions, i.e., prices and costs as of the date the estimate is made. For additional information, see the SEC’s definition in Regulation S-X Rule 4-10(a)(2).
Proved undeveloped reserves. Proved undeveloped oil and gas reserves are reserves that are expected to be recovered from new wells on undrilled acreage, or from existing wells where a relatively major expenditure is required for production to occur. For additional information, see the SEC’s definition in Regulation S-X Rule 4-10(a)(4).
Recompletion. An operation whereby a completion in one zone in a well is abandoned in order to attempt a completion in a different zone within the existing wellbore.
Reservoir. A porous and permeable underground formation containing a natural accumulation of producible natural gas and/or oil that is confined by impermeable rock or water barriers and is individual and separate from other reservoirs.
Sands. Sandstone or other sedimentary rocks.
SEC. Securities and Exchange Commission.
Sour. High sulphur content.
Undeveloped acreage. Lease acreage on which wells have not been drilled or completed to a point that would permit the production of commercial quantities of natural gas and oil regardless of whether the acreage contains proved reserves.
Working interest. The lessee’s interest created by the execution of an oil and gas lease that gives the lessee the right to exploit the minerals on the property.
TABLE OF CONTENTS
Pursuant to the requirements of Section 13 of the Securities Exchange Act of 1934, the registrant has duly caused this report to be signed on its behalf by the undersigned, thereunto duly authorized on February 27, 2009.
McMoRan Exploration Co.
By: /s/ Glenn A. Kleinert
Glenn A. Kleinert
President and Chief Executive Officer
Pursuant to the requirements of the Securities Exchange Act of 1934, this report has been signed below by the following persons on behalf of the registrant and the capacities indicated, on February 27, 2009.
| * | Co-Chairman of the Board |
| James R. Moffett | |
| | |
| * | Co-Chairman of the Board |
| Richard C. Adkerson | |
| | |
| * | Vice Chairman of the Board |
| B.M. Rankin, Jr. | |
| | |
| * | Executive Vice President |
| C. Howard Murrish | |
| | |
| /s/ Glenn A. Kleinert | President and Chief Executive Officer |
| Glenn A. Kleinert | |
| | |
| /s/ Nancy D. Parmelee | Senior Vice President, Chief Financial |
| Nancy D. Parmelee | Officer and Secretary |
| | (Principal Financial Officer) |
| | |
| * | Vice President and Controller - Financial Reporting |
| C. Donald Whitmire, Jr. | (Principal Accounting Officer) |
| | |
| * | Director |
| Robert A. Day | |
| | |
| * | Director |
| Gerald J. Ford | |
| | |
| * | Director |
| H. Devon Graham, Jr. | |
| | |
| * | Director |
| Suzanne T. Mestayer | |
| | |
*By: /s/ Richard C. Adkerson | |
| Richard C. Adkerson | |
| Attorney-in-Fact | |
TABLE OF CONTENTSMcMoRan Exploration Co.
| | | Filed | | | |
| Exhibit | | with this | Incorporated by Reference |
| Number | Exhibit Title | Form 10-K | Form | File No. | Date Filed |
| 2.1 | Agreement and Plan of Merger dated as of August 1, 1998 | | S-4 | 333-61171 | 10/06/1998 |
| 3.1 | Amended and Restated Certificate of Incorporation of McMoRan | | 10-K | 001-07791 | 03/25/1999 |
| 3.2 | Certificate of Amendment to the Amended and Restated Certificate of Incorporation of McMoRan | | 10-Q | 001-07791 | 05/13/2003 |
| 3.3 | Amended and Restated By-Laws of McMoRan as amended effective January 30, 2006 | | 8-K | 001-07791 | 02/03/2006 |
| 3.4 | Certificate of Elimination of Series A Participating Cumulative preferred Stock of McMoRan | | 8-K | 001-07791 | 11/14/2008 |
| 4.1 | Form of Certificate of McMoRan Common Stock | | S-4 | 333-61171 | 10/06/1998 |
| 4.2 | Standstill Agreement dated August 5, 1999 between McMoRan and Alpine Capital, L.P., Robert W. Bruce III, Algenpar, Inc, J. Taylor Crandall, Susan C. Bruce, Keystone, Inc., Robert M. Bass, the Anne T. and Robert M. Bass Foundation, Anne T. Bass and The Robert Bruce Management Company, Inc. Defined Benefit Pension Trust | | 10-Q | 001-07791 | 11/12/1999 |
| 4.3 | Purchase Agreement dated September 30, 2004, by and among McMoRan Exploration Co., Merrill Lynch & Co., Merrill Lynch, Pierce, Fenner & Smith Incorporated, and J.P. Morgan Securities Inc | | 8-K | 001-07791 | 10/07/2004 |
| 4.4 | Indenture dated October 6, 2004 by and among McMoRan and the Bank of New York, as trustee | | 8-K | 001-07791 | 10/07/2004 |
| 4.5 | Collateral Pledge and Security Agreement dated October 6, 2004 by and among McMoRan, as pledgor, The Bank of New York, as trustee and the Bank of New York, as collateral agent | | 8-K | 001-07791 | 10/07/2004 |
| 4.6 | Registration Rights Agreement dated October 6, 2004 by and among McMoRan, as issuer and Merrill Lynch, Pierce, Fenner & Smith Incorporated, J.P. Morgan Securities Inc. and Jefferies & Company, Inc. as Initial Purchasers | | 8-K | 001-07791 | 10/07/2004 |
| 10.1 | Main Pass 299 Sulphur and Salt Lease, effective May 1, 1988 | | 10-K | 001-07791 | 04/16/2002 |
| 10.2 | IMC Global/FSC Agreement dated as of March 29, 2002 among IMC Global Inc., IMC Global Phosphate Company, Phosphate Resource Partners Limited Partnership, IMC Global Phosphates MP Inc., MOXY and McMoRan | | 10-Q | 001-07791 | 08/14/2002 |
| 10.3 | Amended and Restated Services Agreement dated as of January 1, 2002 between McMoRan and FM Services Company | | 10-Q | 001-07791 | 08/14/2003 |
| 10.4 | Letter Agreement dated August 22, 2000 between Devon Energy Corporation and Freeport Sulphur | | 10-Q | 001-07791 | 10/25/2000 |
| | | Filed | | | |
| Exhibit | | with this | Incorporated by Reference |
| Number | Exhibit Title | Form 10-K | Form | File No. | Date Filed |
| 10.5 | Asset Purchase Agreement dated effective December 1, 1999 between SOI Finance Inc., Shell Offshore Inc. and MOXY | | 10-K | 001-07791 | 02/08/2000 |
| 10.6 | Employee Benefits Agreement by and between Freeport-McMoRan Inc. and Freeport Sulphur | | 10-K | 001-07791 | 04/16/2002 |
| 10.7 | Purchase and Sales agreement dated January 25, 2002 but effective January 1, 2002 by and between MOXY and Halliburton Energy Services, Inc | | 8-K | 001-07791 | 03/11/2002 |
| 10.8 | Purchase and Sale Agreement dated as of March 29, 2002 by and among Freeport Sulphur, McMoRan, MOXY and Gulf Sulphur Services Ltd., LLP | | 10-Q | 001-07791 | 05/10/2002 |
| 10.9 | Purchase and Sale Agreement dated May 9, 2002 by and between MOXY and El Paso Production Company | | 10-Q | 001-07791 | 08/14/2002 |
| 10.10 | Amendment to Purchase and Sale Agreement dated May 22, 2002 by and between MOXY and El Paso Production Company | | 10-Q | 001-07791 | 08/14/2002 |
| 10.11 | Master Agreement dated October 22, 2002 by and among Freeport-McMoRan Sulphur LLC, K-Mc Venture LLC, K1 USA Energy Production Corporation and McMoRan | | 10-K | 001-07791 | 03/27/2003 |
| 10.12 | Purchase and Sale Agreement dated June 20, 2007 by and between Newfield Exploration Company as Seller and McMoRan Oil & Gas LLC as Buyer effective July 1, 2007 | | 8-K | 001-07791 | 06/22/2007 |
| 10.13 | Amended and Restated Credit Agreement dated as of August 6, 2007, among McMoRan Exploration Co., as parent, McMoRan Oil & Gas LLC, as borrower, JPMorgan Chase Bank, N.A. Merrill Lynch Capital, a division of Merrill Lynch Business Financial Services, Inc., as syndication agent, BNP Paribas, as documentation agent, and the lenders party thereto | | 10-Q | 001-07791 | 11/01/2007 |
| 10.14 | First Amendment to Credit Agreement dated as of June 20, 2008, among McMoRan Exploration Co., as borrower, JPMorgan Chase Bank, N.A., as administrative agent, and the lenders party thereto | | 10-Q | 001-07791 | 08/07/2008 |
| 10.15 | Second Amendment to Credit Agreement dated as of September 10, 2008, among McMoRan Exploration Co., as borrower, JPMorgan Chase Bank, N.A., as administrative agent, and the lenders party thereto | | 10-Q | 001-07791 | 11/06/2008 |
| 10.16* | McMoRan 1998 Stock Option Plan, as amended and restated | | 10-Q | 001-07791 | 05/10/2007 |
| 10.17* | McMoRan 1998 Stock Option Plan for Non-Employee Directors | | 10-Q | 001-07791 | 05/10/2007 |
| 10. 18* | McMoRan Form of Notice of Grant of Nonqualified Stock Options under the 1998 Stock Option Plan | | 10-Q | 001-07791 | 08/04/2005 |
| 10.19* | McMoRan 2000 Stock Incentive Plan, as amended and restated | | 10-Q | 001-07791 | 05/10/2007 |
| | | Filed | | | |
| Exhibit | | with this | Incorporated by Reference |
| Number | Exhibit Title | Form 10-K | Form | File No. | Date Filed |
| 10.20* | McMoRan Form of Notice of Grant of Nonqualified Stock Options under the 2000 Stock Incentive Plan | | 10-Q | 001-07791 | 08/04/2005 |
| 10.21* | McMoRan 2001 Stock Incentive Plan, as amended and restated | | 10-Q | 001-07791 | 05/10/2007 |
| 10.22* | McMoRan 2003 Stock Incentive Plan, as amended and restated | | 10-Q | 001-07791 | 05/10/2007 |
| McMoRan’s Performance Incentive Awards Program as amended December 1, 2008 | X | | | |
| 10.24* | McMoRan Form of Notice of Grant of Nonqualified Stock Options under the 2001 Stock Incentive Plan | | 10-Q | 001-07791 | 08/04/2005 |
| 10.25* | McMoRan Form of Restricted Stock Unit Agreement Under the 2001 Stock Incentive Plan | | 10-Q | 001-07791 | 08/09/2007 |
| McMoRan Exploration Co. Executive Services Program, as amended December 1, 2008 | X | | | |
| 10.27* | McMoRan Form of Notice of Grants of Nonqualified Stock Options under the 2003 Stock Incentive Plan | | 10-Q | 001-07791 | 08/04/2005 |
| 10.28* | McMoRan Form of Restricted Stock Unit Agreement Under the 2003 Stock Incentive Plan | | 10-Q | 001-07791 | 08/09/2007 |
| 10.29* | McMoRan 2004 Director Compensation Plan, as amended and restated | | 10-Q | 001-07791 | 05/10/2007 |
| 10.30* | Form of Amendment No. 1 to Notice of Grant of Nonqualified Stock Options under the 2004 Director Compensation Plan | | 8-K | 001-07791 | 05/05/2006 |
| 10.31* | Agreement for Consulting Services between Freeport-McMoRan Inc. and B. M. Rankin, Jr. effective as of January 1, 1991)(assigned to FM Services Company as of January 1, 1996); as amended on December 15, 1997 and on December 7, 1998 | | 10-K | 001-07791 | 03/25/1999 |
| Supplemental Letter Agreement between FM Services Company and B.M. Rankin, Jr. effective as of January 1, 2009 | X | | | |
| 10.33* | McMoRan Director Compensation | | 10-Q | 001-07791 | 08/07/2008 |
| 10.34* | McMoRan Exploration Co. 2005 Stock Incentive Plan | | 10-Q | 001-07791 | 05/10/2007 |
| 10.35* | Form of Notice of Grant of Nonqualified Stock Options under the 2005 Stock Incentive Plan | | 8-K | 001-07791 | 05/06/2005 |
| 10.36* | Form of Restricted Stock Unit Agreement under the 2005 Stock Incentive Plan | | 10-Q | 001-07791 | 08/09/2007 |
| 10.37* | McMoRan Exploration Co. Supplemental Executive Capital Accumulation Plan | | 10-Q | 001-07791 | 05/08/2008 |
| 10.38* | McMoRan Exploration Co. Supplemental Executive Capital Accumulation Plan Amendment One | | 10-Q | 001-07791 | 05/08/2008 |
| McMoRan Exploration Co. Supplemental Executive Capital Accumulation Plan Amendment Two | X | | | |
| McMoRan Exploration Co. 2005 Supplemental Executive Capital Accumulation Plan | X | | | |
| | | Filed | | | |
| Exhibit | | with this | Incorporated by Reference |
| Number | Exhibit Title | Form 10-K | Form | File No. | Date Filed |
| 10.41* | McMoRan Exploration Co. 2008 Stock Incentive Plan. | | 8-K | 001-07791 | 06/11/2008 |
| 10.42* | Form of Notice of Grant of Nonqualified Stock Options under the 2008 Stock Incentive Plan. | | 8-K | 001-07791 | 06/11/2008 |
| 10.43* | Form of Restricted Stock Unit Agreement under the 2008 Stock Incentive Plan. | | 8-K | 001-07791 | 06/11/2008 |
| 10.44* | Form of Notice of Grant of Nonqualified Stock Options and Restricted Stock Units under the 2008 Stock Incentive Plan (for grants made to non-management directors and advisory directors). | | 8-K | 001-07791 | 06/11/2008 |
| McMoRan Severance Plan. | X | | | |
| Computation of Ratio of Earnings to Fixed Charges | X | | | |
| 14.1 | Ethics and Business Conduct Policy | | 10-K | 001-07791 | 03/15/2004 |
| List of subsidiaries | X | | | |
| Consent of Ernst & Young LLP | X | | | |
| Consent of Ryder Scott Company, L.P. | X | | | |
| Certified Resolution of the Board of Directors of McMoRan authorizing this report to be signed on behalf of any officer or director pursuant to a Power of Attorney. | X | | | |
| Powers of Attorney pursuant to which this report has been signed on behalf of certain officers and directors of McMoRan. | X | | | |
| Certification of Principal Executive Officer pursuant to Rule 13a–14(a)/15d-14(a) | X | | | |
| Certification of Principal Financial Officer pursuant to Rule 13a–14(a)/15d-14(a) | X | | | |
| Certification of Principal Executive Officer pursuant to 18 U.S.C. Section 1350 | X | | | |
| Certification of Principal Financial Officer pursuant to 18 U.S.C. Section 1350 | X | | | |
–––––––––––––––––––––––––
* Indicates management contract or compensatory plan or agreement.