| |
UNITED STATES |
SECURITIES AND EXCHANGE COMMISSION |
Washington, D.C. 20549 |
| |
FORM 10-Q |
| |
(Mark One) |
[X] | QUARTERLY REPORT PURSUANT TO SECTION 13 OR 15(d) OF THE |
SECURITIES EXCHANGE ACT OF 1934 |
For the quarterly period ended March 31, 2006 |
OR |
[ ] | TRANSITION REPORT PURSUANT TO SECTION 13 OR 15(d) OF THE |
SECURITIES EXCHANGE ACT OF 1934 |
For the transition period from | | to |
Commission File Number: 001-07791 |
| |
|
| |
McMoRan Exploration Co. |
| (Exact name of registrant as specified in its charter) |
Delaware | 72-1424200 |
(State or other jurisdiction of incorporation or organization) | (IRS Employer Identification No.) |
| | |
1615 Poydras Street | |
New Orleans, Louisiana* | 70112 |
| (Address of principal executive offices) | (Zip Code) |
| |
| |
(504) 582-4000 |
| (Registrant's telephone number, including area code) |
| |
Indicate by check mark whether the registrant (1) has filed all reports required to be filed by Section 13 or 15(d) of the Securities Exchange Act of 1934 during the preceding 12 months (or for such shorter period that the registrant was required to file such reports), and (2) has been subject to such filing requirements for the past 90 days. S Yes ÿ No o
Indicate by check mark whether the registrant is a large accelerated filer, an accelerated filer, or a non-accelerated filer. See definition of “accelerated filer and large accelerated filer” in Rule 12b-2 of the Exchange Act (Check one): Large accelerated filer oÿ Accelerated filer S Non-accelerated filer o
Indicate by check mark whether the registrant is a shell company (as defined in Rule 12b-2 of the Securities and Exchange Act of 1934). ÿ Yes S No o
On March 31, 2006, there were issued and outstanding 28,272,241shares of the registrant’s Common Stock, par value $0.01 per share.
| |
McMoRan Exploration Co. |
|
| |
| | Page |
| | |
| |
| | |
| |
| | |
| 3 |
| | |
| 4 |
| | |
| 5 |
| | |
| 6 |
| | |
| 12 |
| | |
| 12 |
| | |
| |
| 13 |
| | |
| 25 |
| | |
| 25 |
| | |
| 25 |
| | |
| 26 |
| | |
| E-1 |
McMoRan Exploration Co.
McMoRan EXPLORATION CO.
| | | March 31, | | December 31, | |
| | | 2006 | | 2005 | |
| | | (In Thousands) | |
| ASSETS | | | | | | | |
| Cash and cash equivalents: | | | | | | | |
| Continuing operations, includes restricted cash of $0.3 million at | | | | | | | |
| December 31, 2005 | | $ | 55,844 | | $ | 131,179 | |
| Discontinued operations, all restricted | | | 548 | | | 1,005 | |
Restricted investments | | | 9,049 | | | 15,155 | |
| Accounts receivable | | | 46,633 | | | 36,954 | |
| Inventories | | | 18,687 | | | 7,980 | |
| Prepaid expenses | | | 1,555 | | | 1,348 | |
| Current assets from discontinued operations, excluding cash | | | 3,454 | | | 2,550 | |
| Total current assets | | | 135,770 | | | 196,171 | |
| Property, plant and equipment, net | | | 260,078 | | | 192,397 | |
| Discontinued sulphur business assets | | | 372 | | | 375 | |
| Restricted investments and cash | | | 8,850 | | | 10,475 | |
| Other assets | | | 6,269 | | | 8,218 | |
| Total assets | | $ | 411,339 | | $ | 407,636 | |
| | | | | | | | |
| LIABILITIES AND STOCKHOLDERS’ DEFICIT | | | | | | | |
| Accounts payable | | $ | 68,221 | | $ | 63,398 | |
| Accrued liabilities | | | 55,495 | | | 49,817 | |
| Accrued interest | | | 4,448 | | | 5,635 | |
| Current portion of accrued sulphur reclamation cost | | | 4,205 | | | 4,724 | |
| Current liabilities from discontinued operations | | | 4,669 | | | 5,462 | |
| Total current liabilities | | | 137,038 | | | 129,036 | |
| 6% convertible senior notes | | | 100,895 | | | 130,000 | |
| 5¼% convertible senior notes | | | 115,000 | | | 140,000 | |
| Accrued oil and gas reclamation costs | | | 22,161 | | | 21,760 | |
| Accrued sulphur reclamation costs | | | 17,410 | | | 17,062 | |
| Contractual postretirement obligation | | | 11,779 | | | 11,517 | |
| Other long-term liabilities | | | 16,014 | | | 15,890 | |
| 5% mandatorily redeemable convertible preferred stock | | | 28,991 | | | 28,961 | |
| Stockholders' deficit | | | (37,949 | ) | | (86,590 | ) |
| Total liabilities and stockholders' deficit | | $ | 411,339 | | $ | 407,636 | |
| | | | | | | | |
The accompanying notes are an integral part of these consolidated financial statements.
McMoRan EXPLORATION CO.
| | | Three Months Ended March 31, | |
| | | 2006 | | 2005 | |
| | | (In Thousands, Except Per Share Amounts) | |
| Revenues: | | | | | | | |
| Oil & Gas | | $ | 35,441 | | $ | 11,380 | |
| Service | | | 4,305 | | | 3,287 | |
| Total revenues | | | 39,746 | | | 14,667 | |
| Costs and expenses: | | | | | | | |
| Production and delivery costs | | | 10,759 | | | 3,700 | |
| Depletion, depreciation and amortization | | | 5,844 | | | 3,916 | |
| Exploration expenses | | | 20,620 | | | 7,536 | |
| General and administrative expenses | | | 8,224 | | | 4,390 | |
| Start-up costs for Main Pass Energy Hub™ | | | 1,846 | | | 2,284 | |
| Insurance recovery | | | (1,169 | ) | | (5,043 | ) |
| Total costs and expenses | | | 46,124 | | | 16,783 | |
| Operating loss | | | (6,378 | ) | | (2,116 | ) |
| Interest expense | | | (1,833 | ) | | (3,787 | ) |
| Other (expense) income, net | | | (3,194 | ) | | 1,599 | |
| Loss from continuing operations | | | (11,405 | ) | | (4,304 | ) |
| Loss from discontinued operations | | | (1,677 | ) | | (1,029 | ) |
| Net loss | | | (13,082 | ) | | (5,333 | ) |
| Preferred dividends and amortization of convertible preferred stock | | | | | | | |
| issuance costs | | | (403 | ) | | (411 | ) |
| Net loss applicable to common stock | | $ | (13,485 | ) | $ | (5,744 | ) |
| | | | | | | | |
| Basic and diluted net loss per share of common stock: | | | | | | | |
| Continuing operations | | | $ (0.44 | ) | | $ (0.20 | ) |
| Discontinued operations | | | (0.06 | ) | | (0.04 | ) |
| Net loss per share of common stock | | | $ (0.50 | ) | | $�� (0.24 | ) |
| | | | | | | | |
| Basic and diluted average shares outstanding | | | 26,832 | | | 24,385 | |
The accompanying notes are an integral part of these consolidated financial statements.
McMoRan EXPLORATION CO.
| | | Three Months Ended | |
| | | March 31, | |
| | | 2006 | | 2005 | |
| | | (In Thousands) | |
Cash flow from operating activities: | | | | | | | |
| Net loss | | $ | (13,082 | ) | $ | (5,333 | ) |
| Adjustments to reconcile net loss to net cash (used in) provided by | | | | | | | |
| operating activities: | | | | | | | |
| Loss from discontinued operations | | | 1,677 | | | 1,029 | |
| Depreciation and amortization | | | 5,844 | | | 3,916 | |
| Exploration drilling and related expenditures | | | 12,342 | | | 2,938 | |
| Compensation expense associated with stock-based awards | | | 9,675 | | | 263 | |
| Amortization of deferred financing costs | | | 481 | | | 557 | |
| Loss on induced conversion of convertible senior notes | | | 4,301 | | | - | |
| Reclamation and mine shutdown expenditures | | | - | | | (4 | ) |
| Other | | | 470 | | | (202 | ) |
| (Increase) decrease in working capital: | | | | | | | |
| Accounts receivable | | | 506 | | | 6,751 | |
| Accounts payable and accrued liabilities | | | (17,237 | ) | | 18,525 | |
| Prepaid expenses and inventories | | | (10,892 | ) | | (46 | ) |
| Net cash (used in) provided by continuing operations | | | (5,915 | ) | | 28,394 | |
| Net cash used in discontinued operations | | | (3,490 | ) | | (1,021 | ) |
| Net cash (used in) provided by operating activities | | | (9,405 | ) | | 27,373 | |
| | | | | | | | |
Cash flow from investing activities: | | | | | | | |
| Exploration, development and other capital expenditures | | | (68,847 | ) | | (40,223 | ) |
| Proceeds from restricted investments | | | 7,400 | | | 3,900 | |
| Decrease (increase) in restricted investments | | | 69 | | | (154 | ) |
| Net cash used in continuing operations | | | (61,378 | ) | | (36,477 | ) |
| Net cash used in discontinued operations | | | - | | | - | |
| Net cash used in investing activities | | | (61,378 | ) | | (36,477 | ) |
| | | | | | | | |
Cash flow from financing activities: | | | | | | | |
| Payments for induced conversion of convertible senior notes | | | (4,301 | ) | | - | |
| Dividends paid on convertible preferred stock | | | (747 | ) | | (383 | ) |
| Proceeds from exercise of stock options and other | | | 39 | | | 1,357 | |
| Net cash (used in) provided by continuing operations | | | (5,009 | ) | | 974 | |
| Net cash from discontinued operations | | | - | | | - | |
| Net cash (used in) provided by financing activities | | | (5,009 | ) | | 974 | |
| Net decrease in cash and cash equivalents | | | (75,792 | ) | | (8,130 | ) |
| Cash and cash equivalents at beginning of year | | | 132,184 | | | 204,015 | |
| Cash and cash equivalents at end of period | | | 56,392 | | | 195,885 | |
| Less restricted cash from continuing operations | | | (1 | ) | | (3,180 | ) |
| Less restricted cash from discontinued operations | | | (548 | ) | | (984 | ) |
| Unrestricted cash and cash equivalents at end of period | | $ | 55,843 | | $ | 191,721 | |
The accompanying notes are an integral part of these consolidated financial statements.
McMoRan EXPLORATION CO.
1. BASIS OF PRESENTATION
The financial statements of McMoRan Exploration Co. (McMoRan), a Delaware Corporation, are prepared in accordance with U.S. generally accepted accounting principles. The consolidated financial statements of McMoRan include the accounts of those subsidiaries where McMoRan directly or indirectly has more than 50 percent of the voting rights and for which the right to participate in significant management decisions is not shared with other shareholders. McMoRan consolidates its wholly owned McMoRan Oil & Gas LLC (MOXY) and Freeport-McMoRan Energy LLC (Freeport Energy) subsidiaries. In December 2004, Freeport Energy acquired the remaining ownership interest in K-Mc Venture I LLC (K-Mc I) and began consolidating its wholly owned K-Mc I subsidiary. In April 2006, in connection with the establishment of a revolving bank credit facility, Freeport Energy transferred its ownership interest in K-Mc I to MOXY (Note 3). As a result of McMoRan’s exit from the sulphur business, its sulphur results have been presented as discontinued operations and the major classes of assets and liabilities related to the sulphur business have been separately shown for the periods presented.
2. STOCK-BASED COMPENSATION
Accounting for Stock-Based Compensation. As of March 31, 2006, McMoRan has eight stock-based employee compensation plans and director compensation plans (see below). Prior to January 1, 2006, McMoRan accounted for options granted under all of its plans under the recognition and measurement principles of Accounting Principles Board (APB) Opinion No. 25, “Accounting for Stock Issued to Employees,” and related interpretations, as permitted by Statement of Financial Accounting Standards (SFAS) No. 123, “Accounting for Stock-Based Compensation.” APB Opinion No. 25 required compensation cost for stock options to be recognized based on the difference on the date of grant, if any, between the quoted market price of the stock and the amount an employee must pay to acquire the stock (i.e., the intrinsic value). Because these plans require that the option exercise price be at least the market price on the date of grant, McMoRan generally recognized no compensation cost on the grant or exercise of its employees’ options. However, in certain instances, there was a difference between the date McMoRan awarded stock options and the ultimate date of the stock option grant, which resulted in compensation charges (see Note 8 of McMoRan’s 2005 Form 10-K). McMoRan has also awarded restricted stock units under the plans, which resulted in compensation costs being recognized in earnings based on the intrinsic value on the date of grant.
Effective January 1, 2006, McMoRan adopted the fair value recognition provisions of SFAS No. 123 (revised 2004), “Share-Based Payment” (SFAS No. 123R), using the modified prospective transition method. Under that transition method, compensation cost recognized in 2006 includes (a) compensation costs for all stock option awards granted to employees prior to, but not yet vested as of, January 1, 2006, based on the grant-date fair value estimated in accordance with the original provisions of SFAS No. 123, and (b) compensation cost for all stock option awards granted subsequent to January 1, 2006, based on the grant-date fair value estimated in accordance with the provisions of SFAS No. 123R. In addition, other stock-based awards charged to expense under SFAS No.123 continue to be charged to expense under SFAS No. 123R. These include stock options granted to non-employee and advisory directors as well as restricted stock units. Results for prior periods have not been restated. McMoRan has elected to recognize compensation costs for awards that vest over several years on a straight-line basis over the vesting period. McMoRan’s stock-based awards provide for an additional year of vesting after an employee retires. For awards to retirement- eligible employees, McMoRan records one year of amortization of the awards’ estimated fair value on the date of grant. In addition, prior to adoption of SFAS No. 123R McMoRan recognized forfeitures as they occurred in its SFAS No. 123 pro forma disclosures. Beginning January 1, 2006, McMoRan includes estimated forfeitures in its compensation cost and updates the estimated forfeiture rate through the final vesting date of the awards.
As a result of adopting SFAS No. 123R, McMoRan’s net loss for the three months ended March 31, 2006, was $9.2 million ($0.34 per basic and diluted share) higher than if it had continued to account for share-based compensation under APB Opinion No. 25. Basic and diluted net loss per share would have been $0.16 per share for the three months ended March 31, 2006 if McMoRan had not adopted SFAS No. 123R, compared to a reported net loss of $0.50 per basic and diluted share. McMoRan expects to record approximately $2 million of compensation expense each quarter for the remainder of 2006 related to its currently outstanding and unvested stock-based awards.
McMoRan currently has no income tax benefits for deductions resulting from the exercise of stock options because of its significant net operating loss carryforwards.
Stock-Based Compensation Cost. Compensation cost charged against earnings for stock-based awards is shown below (in thousands).
| | | | | | Three Months Ended March 31, | |
| | | | | | 2006 | | 2005 | |
| Stock options awarded to employees (including directors) | | | | | $ | 9,364 | | $ | 70 | a |
| Stock options awarded to non-employees and advisory directors | | | | | | 259 | | | 55 | |
| Restricted stock units | | | | | | 52 | | | 138 | |
| Total compensation cost | | | | | $ | 9,675 | | $ | 263 | |
a. Reflects compensation charge resulting from difference between the date stock options were awarded and the ultimate date of grant (see Note 8 of McMoRan’s 2005 Form 10-K). Amount during first quarter of 2005 was associated with February 2003 grants. The amortization of the remaining $1.0 million of unvested compensation costs resulting from these types of stock option grants ceased upon adoption of SFAS No. 123R.
The following table illustrates the effect on McMoRan’s net loss and net loss per share for the three months ended March 31, 2005, had it applied the fair value recognition provisions of SFAS No. 123 to stock-based awards granted under its stock-based compensation plans (in thousands, except per share amounts):
| Net loss applicable to common stock, as reported | | | $ | (5,744 | ) |
| Add: Stock-based employee compensation expense | | | | | |
| included in reported net loss for stock option | | | | | |
| conversions and restricted stock units | | | | 208 | |
| Deduct: Total stock-based employee compensation | | | | | |
| expense determined under fair value-based method | | | | | |
| for all awards | | | | (3,881 | ) |
| Pro forma net loss applicable to common stock | | | $ | (9,417 | ) |
| | | | | | |
| Net loss per share: | | | | | |
| Basic and diluted - as reported | | | $ | (0.24 | ) |
| Basic and diluted - pro forma | | | $ | (0.39 | ) |
| | | | | | |
For the pro forma computations, the values of option grants were calculated on the dates of grant using the Black-Scholes-Merton option pricing model and amortized to expense over the options’ vesting periods. No other discounts or restrictions related to vesting or the likelihood of vesting of stock options were applied. The following table summarizes the calculated fair values and assumptions used to determine the fair value of McMoRan’s stock option grants under SFAS No. 123 during the three months ended March 31, 2005. McMoRan’s expected volatility was based on implied volatilities from the historical volatility of its common stock.
| Fair value (per share) per stock option | | $ | 10.65 | | |
| Risk-free interest rate | | | 4.0 | % | |
| Expected volatility rate | | | 61 | % | |
| Expected life of options (in years) | | | 7 | | |
Stock-Based Compensation Plans. As discussed above, McMoRan currently has eight stock-based compensation plans and all are shareholder approved (see Note 8 of McMoRan’s 2005 Form 10-K). As of March 31, 2006, McMoRan was authorized to issue stock-based awards totaling 1,513,783 shares under these plans, including 1,335,500 shares from the 2005 Stock Incentive Plan. All the shares available for grant under McMoRan’s other existing stock-based plans at March 31, 2006 were the same as at December 31, 2005 (see Note 8 of McMoRan’s Form 10-K).
Awards granted under all of the plans generally expire 10 years after the date of grant and vest in 25 percent annual increments beginning one year from the date of grant. The plans provide for employees to be eligible for the following year’s vesting upon retirement and provide for accelerated vesting if there is a change in control (as defined in the plans). Restricted stock unit grants vest over three years and are valued on the date of grant.
Stock Options. A summary of stock options outstanding as of March 31, 2006 and changes during the three months ended March 31, 2006 follows:
| | | | | | Weighted | | | |
| | | | Weighted | | Average | | Aggregate | |
| | Number | | Average | | Remaining | | Intrinsic | |
| | Of | | Option | | Contractual | | Value | |
| | Options | | Price | | Term (years) | | ($000) | |
| Balance at January 1 | 5,845,416 | | $ | 14.57 | | | | | | |
| Granted | 1,331,000 | | | 19.85 | | | | | | |
| Exercised | (3,125 | ) | | 12.51 | | | | | | |
| Expired/Forfeited | - | | | - | | | | | | |
| Balance at March 31 | 7,173,291 | | | 15.55 | | 7.4 | | $ | 20,959 | |
| Vested and exercisable at | | | | | | | | | | |
| March 31 | 5,238,206 | | | 14.85 | | 6.7 | | $ | 18,507 | |
| | | | | | | | | | | |
The fair value of each option award is estimated on the date of grant using a Black-Scholes-Merton option valuation model. Expected volatility is based on implied volatilities from the historical volatility of McMoRan’s stock and to a lesser extent on traded options on McMoRan stock. McMoRan uses historical data to estimate option exercise, forfeitures and expected life of the options. When appropriate, employees who have similar historical exercise behavior are grouped for valuation purposes. The risk-free interest rate is based on Federal Reserve rates in effect for bonds with maturity dates equal to the expected term of the option at the date of grant. McMoRan has not paid, and has no current plan to pay, cash dividends on its common stock. The assumptions used to value stock option awards during the three months ended March 31, 2006 are noted in the following table.
| Fair value (per share) of stock option on grant date | | $ | 11.91 | a | |
| Expected and weighted average volatility | | | 55.5 | % | |
| Expected life of options (in years) | | | 7 | a | |
| Risk-free interest rate | | | 4.5 | % | |
| a. | For the stock options that were granted with immediate vesting (500,000 shares granted to the Co-Chairmen in lieu of cash compensation for 2006) the expected life of the options is six years and the fair value of stock options on grant date was $11.52 per share. |
As of March 31, 2006, McMoRan had approximately $19 million of total unrecognized compensation costs related to unvested stock options, which is expected to be recognized over a weighted average period of approximately 2.3 years.
Cash received from stock option exercises totaled $39,000 for the three months ended March 31, 2006 and $1.4 million for the three months ended March 31, 2005 (approximately 130,000 shares exercised). Upon exercise of stock options and vesting of restricted stock units, employees may tender McMoRan shares to McMoRan to pay the exercise price and/or the minimum required taxes. Shares tendered to McMoRan for these purposes totaled 5,424 shares in the first quarter of 2006 and 7,209 shares in the first quarter of 2005. McMoRan paid $0.1 million during the three months ended March 31, 2006 and $0.2 million during the three months ended March 31, 2005 for employee taxes related to stock-based award exercises.
Restricted Stock Units. As discussed above, McMoRan’s plans allow for issuance of restricted stock units. McMoRan did not grant any restricted stock units in the three months ended March 31, 2006 or during the three months ended March 31, 2005. Total remaining unamortized compensation cost associated with restricted stock units totaled $58,000 at March 31, 2006.
3. DEBT CONVERSION TRANSACTIONS AND CREDIT FACILTYSince the beginning of 2006 and through March 31, 2006, McMoRan privately negotiated transactions to induce conversion of $29.1 million of its 6% convertible senior notes and $25.0 million of its 5¼% convertible senior notes, into approximately 3.6 million shares of its common stock based on the respective conversion price for each set of convertible notes (Note 4). McMoRan paid an aggregate $4.3 million in the transactions and recorded an approximate $4.0 million net charge to expense in the first quarter of 2006. The net charge reflects the $4.3 million inducement payment, reflected in the accompanying consolidated statement of operations as other non-operating expense, less $0.3 million of previously accrued interest expense recorded during 2005. McMoRan funded approximately $3.5
million of the cash payments from restricted cash held in escrow for funding interest payments on the convertible notes and paid the remaining portion with available unrestricted cash.
In April 2006, McMoRan established a new four-year, $100 million Senior Secured Revolving Credit Facility with a group of banks for MOXY’s oil and natural gas operations. The facility has an initial borrowing base of $55 million. The borrowing base will be re-determined on a semi-annual basis on April 1 and October 1 of each year beginning October 1, 2006. The facility may be increased to $150 million with additional lender commitments. The credit agreement matures on April 19, 2010.
The variable-rate facility is secured by 1) substantially all the oil and gas related properties (with related oil and natural gas proved reserves) of MOXY and K-Mc I and 2) the pledge by McMoRan of its ownership interest in MOXY and by MOXY of its ownership interest in each of its wholly owned subsidiaries. The facility is further guaranteed by McMoRan and each of MOXY’s wholly owned subsidiaries. The facility contains customary financials covenants and other restrictions.
4. EARNINGS PER SHARE
Basic and diluted net loss per share of common stock were calculated by dividing the net loss applicable to continuing operations, net loss from discontinued operations and net loss applicable to common stock by the weighted-average number of common shares outstanding during the periods presented. For purposes of the earnings per share computations, the net loss applicable to continuing operations includes preferred stock dividends and related amortization of the issuance costs.
McMoRan had a net loss from continuing operations in both the first quarter of 2006 and 2005. Accordingly, the assumed exercise of stock options and stock warrants whose exercise prices are less than the average market price of McMoRan’s common stock during these periods, as well as the assumed conversion of McMoRan’s 5% convertible preferred stock, 6% convertible senior notes and 5¼% convertible senior notes, were excluded from the diluted net loss per share calculations. These instruments were excluded because they are considered to be anti-dilutive, meaning their inclusion would have decreased the reported net loss per share from continuing operations for both periods presented. The excluded share amounts are summarized below:
| | | First Quarter | |
| | | 2006 | | | 2005 | |
| | | (in thousands) | |
In-the-money stock options a ,b | | | 1,402 | | | | 3,190 | |
Stock warrants a,c | | | 1,810 | | | | 1,818 | |
5% convertible preferred stock d | | | 6,214 | | | | 6,362 | |
6% convertible senior notes e | | | 7,080 | | | | 9,123 | |
5¼% convertible senior notes f | | | 6,938 | | | | 8,446 | |
| | | | | | | | | |
| a. | McMoRan uses the treasury stock method to determine total shares relating to in-the-money stock options and stock warrants to include in its diluted earning per share calculation. |
| b. | Represents stock options with an exercise price less than the average market price for McMoRan’s common stock for the periods presented. |
| c. | Includes stock warrants issued to K1 USA Energy Production Corporation in December 2002 (1.74 million shares) and September 2003 (0.76 million shares). The warrants are exercisable for McMoRan common stock at any time over their respective five-year terms at an exercise price of $5.25 per share. See Note 4 of McMoRan’s 2005 Form 10-K for additional information regarding the warrants. |
| d. | At the election of the holder, and before the shares mature on June 30, 2012, each outstanding share of 5% mandatorily redeemable convertible preferred stock is convertible into 5.1975 shares of McMoRan common stock. For additional information regarding McMoRan’s convertible preferred stock see Note 6 of McMoRan’s 2005 Form 10-K. |
| e. | The notes, issued in July 2003, are convertible at the option of the holder at any time prior to their maturity on July 2, 2008 into shares of McMoRan common stock at a conversion price of $14.25 per share. Net interest expense on the 6% convertible senior notes totaled $1.0 million during the first quarter of 2006 and $2.0 million during the first quarter of 2005. Additional information regarding McMoRan’s 6% convertible senior notes is disclosed in Note 5 of its 2005 Form 10-K. |
| f. | The notes, issued in October 2004, are convertible at the option of the holder at any time prior to their maturity on October 6, 2011 into shares of McMoRan common stock at a conversion price of $16.575 per share. Net interest expense on the 5¼% convertible senior notes totaled $0.8 million |
during the first quarter of 2006 and $1.8 million during the first quarter of 2005. Additional information regarding McMoRan’s 5¼% convertible senior notes is disclosed in Note 5 of its 2005 Form 10-K.
Outstanding stock options excluded from the computation of diluted net loss per share of common stock because their exercise prices were greater than the average market price of the common stock during the periods presented are as follows:
| | | First Quarter | |
| | | 2006 | | | 2005 | |
| Outstanding options (in thousands) | | | 1,751 | | | | 438 | |
| Average exercise price | | $ | 20.30 | | | $ | 21.76 | |
5. OTHER MATTERS
Multi-Year Oil and Gas Exploration Venture
Since 2004, McMoRan and a private partner have participated in a multi-year oil and gas exploration venture with a combined commitment to spend at least $500 million to acquire and exploit high-potential, high-risk prospects, primarily in Deep Miocene formations on the shelf of the Gulf of Mexico and in the Gulf Coast area. McMoRan and its exploration partner will generally share equally in all future revenues and costs, including related overhead costs, associated with the exploration venture’s activities, except for the Dawson Deep prospect at Garden Banks Block 625, where the exploration partner is participating in 40 percent of McMoRan’s interests. McMoRan estimates its management fee associated with the reimbursement of the exploration venture’s overhead costs will approximate $8 million in 2006. McMoRan’s service revenues during the first quarter of 2006 included $3.0 million of management fees related to the exploration venture, which includes $2.0 million for 2006 activities and $1.0 million of additional management fees for services rendered on behalf of the exploration venture during 2005. Service revenue during the first quarter of 2005 included a $1.8 million exploration venture management fee.
Since inception of the exploration venture, McMoRan and its private partner have participated in 11 discoveries on the 22 prospects that have been drilled and evaluated. Production has commenced on five discoveries and development plans are being pursued for the other discoveries. McMoRan will be evaluating potentially positive drilling results at Blueberry Hill at Louisiana State Lease 340 and JB Mountain Deep at South Marsh Island Blocks 224/228/229. McMoRan’s investments in the Blueberry Hill and JB Mountain Deep prospects totaled $12.6 million and $24.3 million, respectively, at March 31, 2006. The exploration venture currently has four unevaluated exploratory wells in progress. McMoRan’s investment for its unevaluated in-progress wells at March 31, 2006 totaled $34.9 million, including $24.3 million related to its JB Mountain Deep prospect. During the first quarter of 2006, McMoRan charged $12.3 million to exploration expense for nonproductive well drilling and related costs. Nonproductive well drilling and related costs totaled $2.9 million in the first quarter of 2005.
The determination of oil and gas reserve estimates is a subjective process, and the accuracy of any reserve estimate depends on the quality of available data and the application of engineering and geological interpretation and judgment. Estimates of economically recoverable reserves and future net cash flows depend on a number of variable factors and assumptions that are difficult to predict and may vary considerably from actual results. In particular, reserve estimates for wells with limited or no production history are less reliable than those based on actual production. Subsequent evaluation of the same reserves may result in variations, which may be substantial, in estimated reserves and related estimates of future cash flows. If the capitalized costs of an individual oil and gas property exceed the related estimated future net cash flows, an impairment charge to reduce the capitalized costs to the property’s estimated fair value is required. For more information regarding the risks associated with McMoRan’s reserve estimation process see Item 1A. “Risk Factors” located in McMoRan’s 2005 Form 10-K.
The Minuteman well at Eugene Island Block 213 commenced production in February 2005. The well’s production decreased significantly from initial rates until stabilizing at a gross rate approximating 3 million cubic feet equivalent per day (MMcfe/d) in the second quarter of 2005. The well was shut in for both Hurricanes Katrina and Rita but returned to production following both storms at rates approximating 3 MMcfe/d. In late October 2005, the well was shut in because of mechanical problems. In the first quarter of 2006, the operator performed workover activities on the well. The well resumed production in February 2006 but was subsequently shut-in once again because of mechanical issues. McMoRan is planning remedial alternatives to restore production from the well. McMoRan has been unable to develop meaningful estimates of ultimate recoverable reserves for the Minuteman well because of its geological complexity and
the lack of sufficient production data. McMoRan will continue to monitor activity with respect to this well and accumulate data, including the effects of remedial work, to develop reserve estimates for this well. McMoRan’s net investment in the Minuteman well totaled $12.5 million at March 31, 2006. If the estimated undiscounted future net cash flows relating to this well’s estimated reserves were determined to be less than the related capitalized costs, McMoRan would reduce its investment accordingly through a future charge to its operating results.
Main Pass Block 299
K-Mc I owns the oil facilities and related proved oil reserves at Main Pass Block 299 (Main Pass). The storm center of Hurricane Ivan passed within 20 miles east of Main Pass in September 2004. The Main Pass structures did not incur significant damage from Ivan but oil production was shut-in because of extensive damage to a third-party offshore terminal and connecting pipelines that provided throughput service for the sale of Main Pass sour crude oil. Insurance proceeds under McMoRan’s business interruption and property insurance policies have partially mitigated the financial impact of the storm. Production resumed at Main Pass in May 2005 following successful modification of existing storage facilities to accommodate transportation of oil production from the field by barge. During the first quarter of 2006, McMoRan negotiated a $5.0 million final settlement of its insurance claim related to Hurricane Ivan. McMoRan received $4.8 million of these proceeds in April 2006, with the remainder expected to be received in the second quarter of 2006. McMoRan recorded $0.7 million of this amount as insurance recovery in the accompanying consolidated statements of operations, reflecting $0.5 million of additional business interruption proceeds and $0.2 million reimbursement of costs previously charged to expense in prior periods. The remaining reimbursement amount reduced the carrying costs of K-Mc I’s property, plant and equipment.
At March 31, 2006, McMoRan’s property, plant and equipment included $0.7 million of net costs associated with its efforts to modify the storage facilities, which included insurance reimbursements totaling $7.4 million.
Interest Cost
Interest expense excludes capitalized interest of $1.4 million in the first quarter of 2006 and $0.6 million in the first quarter of 2005.
Inventories.
Product inventories totaled $1.4 million at March 31, 2006 and $1.0 million at December 31, 2005, consisting entirely of oil associated with K-Mc I’s operations. Materials and supplies inventory totaled $17.2 million at March 31, 2006 and $7.0 million at December 31, 2005, reflecting McMoRan’s purchase of certain drilling supplies to be used in its drilling activities, primarily drilling pipe and tubulars. The materials and supplies inventory will be partially reimbursed by third party participants in wells supplied with these materials. McMoRan’s inventories are stated at the lower of average cost or market. There have been no required reductions in the carrying value of McMoRan’s inventories for any of the periods presented.
Pension Plan During 2000, McMoRan elected to terminate its defined benefit plan. The plan’s termination is still pending approval from the Internal Revenue Service and the Pension Benefit Guaranty Corporation. See Note 8 of McMoRan’s 2005 Annual Report on Form 10-K for additional information regarding its defined benefit plan and its status. The components of net periodic pension benefit cost for the three months ended March 31, 2006 and 2005 for this plan follows (in thousands):
| | 2006 | | 2005 | |
| Service cost | $ | - | | $ | - | |
| Interest cost | | 84 | | | 33 | |
| Return on plan assets | | (8 | ) | | (18 | ) |
| Change in plan payout assumptions | | - | | | - | |
| Net periodic benefit expense | $ | 76 | | $ | 15 | |
6. RATIO OF EARNINGS TO FIXED CHARGES
McMoRan sustained losses from continuing operations totaling $11.4 million for the first quarter of 2006 and $4.3 million for the first quarter of 2005, which were inadequate to cover its fixed charges of $3.2 million and $3.8 million for each of the respective first-quarter periods. For this calculation, earnings consist of loss from continuing operations and fixed charges. Fixed charges include interest and that portion of rent deemed representative of interest.
-----------------
The information furnished herein should be read in conjunction with McMoRan’s financial statements contained in its 2005 Annual Report on Form 10-K. The information furnished herein reflects all adjustments which are, in the opinion of management, necessary for a fair presentation of the results for the periods. All such adjustments are, in the opinion of management, of a normal recurring nature.
To the Board of Directors and Stockholders of McMoRan Exploration Co.:
We have reviewed the condensed consolidated balance sheet of McMoRan Exploration Co. (a Delaware corporation) as of March 31, 2006, and the related consolidated statements of operations and cash flow for the three-month periods ended March 31, 2006 and 2005. These financial statements are the responsibility of the Company’s management.
We conducted our review in accordance with the standards of the Public Company Accounting Oversight Board (United States). A review of interim financial information consists principally of applying analytical procedures and making inquiries of persons responsible for financial and accounting matters. It is substantially less in scope than an audit conducted in accordance with the standards of the Public Company Accounting Oversight Board, the objective of which is the expression of an opinion regarding the financial statements taken as a whole. Accordingly, we do not express such an opinion.
Based on our review, we are not aware of any material modifications that should be made to the condensed consolidated interim financial statements referred to above for them to be in conformity with U.S. generally accepted accounting principles.
We have previously audited in accordance with the standards of the Public Company Accounting Oversight Board (United States), the consolidated balance sheet of McMoRan Exploration Co. as of December 31, 2005, and the related consolidated statements of operations, cash flow and changes in stockholders’ deficit for the year then ended (not presented herein), and in our report dated March 10, 2006, we expressed an unqualified opinion on those consolidated financial statements. In our opinion, the information set forth in the accompanying condensed consolidated balance sheet as of December 31, 2005, is fairly stated, in all material respects, in relation to the consolidated balance sheet from which it has been derived.
/s/ ERNST & YOUNG LLP
New Orleans, Louisiana
May 1, 2006
OVERVIEW
In management’s discussion and analysis “we,” “us,” and “our” refer to McMoRan Exploration Co. and its wholly owned consolidated subsidiaries, McMoRan Oil & Gas LLC (MOXY) and Freeport-McMoRan Energy LLC (Freeport Energy). You should read the following discussions in conjunction with our consolidated financial statements, the related discussion and analysis of financial condition and results of operations and our discussion of “Business and Properties” in our Form 10-K for the year ended December 31, 2005 (2005 Form 10-K), filed with the Securities and Exchange Commission. The results of operations reported and summarized below are not necessarily indicative of future operating results. Unless otherwise specified, all references to Notes refers to Notes to Consolidated Financial Statements included elsewhere in this Form 10-Q.
We engage in the exploration, development and production of oil and natural gas offshore in the Gulf of Mexico and onshore in the Gulf Coast region, with a focus on potentially significant hydrocarbons which we believe are contained in large, deep geologic structures often located beneath shallow reservoirs where significant reserves have been produced. We are also pursuing plans for the development of the Main Pass Energy Hub™ (MPEH™) project at our former sulphur mining facilities at Main Pass Block 299 (Main Pass) in the Gulf of Mexico. This project includes the conversion of our former Main Pass sulphur facilities into a hub for the receipt and processing of liquefied natural gas (LNG) and the storage and distribution of natural gas. We were previously engaged in the sulphur business until June 2002.
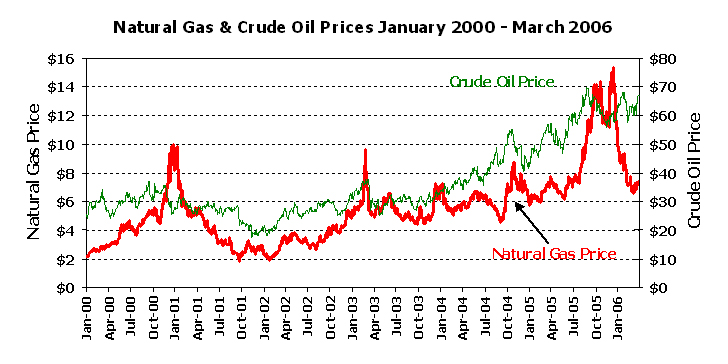
North American natural gas prices have declined from the record high prices of late 2005, reflecting lower than expected demand over the winter months resulting in near-record storage levels. However, production losses caused by hurricanes in 2005 and the onset of the current hurricane season are contributing to continued strong market conditions for natural gas. The world oil markets continue to reflect conditions of high demand and tight supplies. Our average realizations during the first quarter of 2006 were $8.12 per thousand cubic feet (Mcf) of natural gas and $57.15 per barrel for oil, including the sale of sour crude oil produced at Main Pass (see “Results of Operations” below).
OIL & GAS ACTIVITIES
Multi-Year Oil and Gas Exploration Venture
Since 2004, we have participated in a multi-year oil and gas exploration venture with a private partner that has a joint commitment to spend at least $500 million to acquire and exploit high-potential prospects, primarily Deep Miocene structures in the shallow waters of the shelf of the Gulf of Mexico and onshore in the Gulf Coast areas. As of March 31, 2006, the exploration venture had incurred approximately $380 million of exploration costs. The joint commitment under the exploration venture may be expanded as new opportunities are developed. We and our exploration partner have participated in 11 discoveries on the 22 prospects that have been drilled and evaluated. We will be evaluating potentially positive drilling results at the Blueberry Hill well on Louisiana State Lease 340 and JB Mountain Deep at South Marsh Island Blocks 224/228/229. Production has commenced on five of the discoveries and development plans are being pursued at the other four discoveries and the potential discoveries at Blueberry Hill and JB Mountain Deep.
We are currently participating in three exploratory wells as noted in the table below.
| | Working Interest | Net Revenue Interest | Prospect Acreage a | Water Depth | Proposed Total Depth b | Current Depth c | Spud Date |
| | % | % | | Feet | feet | Feet | |
Onshore Vermilion Parish, LA “Liberty Canal” d | 37.5 | 27.7 | 1,420 | n/ae | 16,500 | 15,685 | March 5, 2006 |
St. Mary Parish, LA “Laphroaig” | 37.5 | 27.8 | 2,439 | <10 | 19,000 | 11,300 | April 8, 2006 |
Louisiana State Lease 18091 “Long Point Deep” d | 37.5 | 26.8 | 5,000 | 8 | 23,000 | 4,000 | April 27, 2006 |
Near-Term Exploration Well | | | | | | | |
Vermilion Block 54 f | 30.0 | 24.2 | 3,125 | 20 | 15,400 | n/a | Second-Quarter 2006 |
Near-Term Development Well | | | | | | | |
South Marsh Island Block 217 “Hurricane No. 3” | 27.5 | 19.4 | 7,700 | 10 | 21,500 | n/a | Second-Quarter 2006 |
| a. | Gross acres encompassing prospect to which we retain exploration rights. |
| b. | Planned target measured depth, which is subject to change. |
| c. | Approximate depth of well on May 5, 2006. |
| d. | Wells in which we are the operator. |
| e. | Prospect located onshore Louisiana. |
| f. | Prospect will be eligible for deep gas royalty relief under current Minerals Management Service (MMS) guidelines, which could result in an increased net revenue interest for early production. If MMS approves the application for royalty relief, each lease may be exempt from paying MMS royalties on up to the initial 25 Bcf of production. |
At March 31, 2006, our total drilling and related leasehold costs associated with in-progress wells totaled $34.9 million, reflecting $24.3 million for JB Mountain Deep, $8.3 million for Pecos and $2.3 million for Liberty Canal. The Laphroaig and Long Point Deep prospects commenced drilling in April 2006.
The Liberty Canal exploratory well has been evaluated with log-while-drilling tools and confirmed with wireline logs, which indicated two intervals totaling 199 gross feet with 125 net feet of hydrocarbon bearing sands. The wireline log indicated excellent porosity with the potential for high flow rates. We plan to set a liner and drill deeper to evaluate additional targets. Following drilling activities, we will complete the well. Infrastructure near this onshore location would allow production to be established quickly. The Liberty Canal discovery is located on a significant north-south ridge where we control 13,000 gross acres and has a number of additional exploration prospects. The information gained from this well will be used to determine future drilling plans for the area.
The Pecos exploratory well commenced drilling on January 5, 2006 and was drilled to a true vertical depth of 18,795 feet (19,625 feet measured depth). Uphole pay sands were evaluated with log-while-drilling tools and wireline logs, indicating two intervals of hydrocarbons. The deeper zone encountered 31 net feet of hydrocarbon-bearing sands over a 172 foot gross interval; the upper zone encountered 12 net feet of hydrocarbon-bearing sands over a 14 foot gross interval. In May 2006, a drill-stem test over the deeper zone resulted in a gross flow rate of approximately 15.5 Million cubic feet of natural gas per day (MMcf/d) and 600 barrels per day (bbls/d) of condensate (7 MMcfe/d net to us) and no water with a flowing tubing pressure of 2,700 pounds per square inch (psi) on a 31/64ths choke. Production is expected to commence quickly utilizing nearby infrastructure. We and our private partner each own a 50 percent working interest and a 36.0 net revenue interest in the discovery. We have rights to approximately 3,500 acres comprising the Pecos and Platte deep gas exploration prospects at West Pecan Island located in Vermilion Parish, Louisiana. The Pecos prospect was drilled as a directional well from an offshore location in less than 10 feet of water to a bottom hole location onshore.
The JB Mountain Deep exploration well commenced drilling on July 14, 2005 and was drilled to a measured depth of 24,600 feet (true vertical depth of 24,557 feet). Interpretation of wireline logs indicated 120 gross feet of potential hydrocarbon bearing sands at a depth of approximately 21,900 feet that will require further evaluation. Wireline logs also indicated an additional 115 gross feet of potential hydrocarbons at a depth of approximately 24,250 feet. A liner is being set to protect the lower zone and the
well will be temporarily abandoned. Information obtained from the testing of the Blueberry Hill well at Louisiana State Lease 340 will be incorporated in our future plans for JB Mountain Deep (see “Production Update and Development Activities” below). Both areas (JB Mountain Deep and Blueberry Hill) demonstrate similar geologic settings and are targeting Deep Miocene sands that are equivalent in age.
We operate the JB Mountain Deep prospect and, if successful, we and our private partner would each earn a 35.0 percent working interest and a 24.8 percent net revenue interest in the well. We and our exploration partner control 5,200 gross acres in the JB Mountain Deep area including portions of South Marsh Island Blocks 224, 228 and 229. This acreage is not included in the JB Mountain/Mound Point program where we have a potential reversionary interest. We expect the well would be eligible for Deep Gas Royalty Relief.
The King of the Hill No. 2 exploratory well at High Island Block 131 commenced drilling on January 28, 2006 and was drilled to a total depth of 16,290 feet. The well was evaluated with wireline logs, indicating a discovery. We are evaluating additional drilling opportunities on this acreage position. We and our private partner each own a 25.0 percent working interest and a 19.6 percent net revenue interest in the King of the Hill prospect. The High Island Block 131 lease is eligible for Deep Gas Royalty Relief.
The Point Chevreuil exploratory well at Louisiana State Lease 18350 commenced drilling on November 18, 2005 and was drilled to a total depth of 17,011 feet. The well has been temporarily abandoned to allow further evaluation of the drilling results. We and our exploration partner both have a 25 percent working interest and a 17.5 percent net revenue interest in the Point Chevreuil prospect. Our investment in Point Chevreuil totaled $5.4 million at March 31, 2006.
We expect to participate in the drilling of at least seven additional exploration prospects during the remainder of 2006. We currently have exploration rights to approximately 400,000 gross acres, including rights acquired through a farm-out transaction in January 2006 covering over 100,000 gross acres in southern Louisiana and on the Gulf of Mexico shelf. These newly acquired rights were part of a five-year deal which allows us to earn acreage by drilling a specified minimum number of wells. Under this arrangement, the original lease owner may elect to participate in certain wells after casing point and may elect to participate in other wells as a joint interest owner. We are also pursuing opportunities through our exploration venture to acquire additional acreage and prospects through farm-in or other arrangements.
Production Update and Development Activities
Our first-quarter 2006 production averaged 46 million cubic feet of natural gas equivalent per day (MMcfe/d) compared with 17 MMcfe/d in the first quarter of 2005. Our first-quarter 2006 rates include approximately 2,400 barrels of oil per day (bbls/d) (14 MMcfe/d) from Main Pass, which was shut-in during the first quarter of 2005. The first-quarter 2006 rates include the effects of downtime associated with remedial activities at the Hurricane No. 1 well at South Marsh Island Block 217, which were successfully completed late in the first quarter of 2006. The Hurricane No. 1 well is currently producing at a gross rate of approximately 46 MMcfe/d, 9 MMcfe/d net to us.
Our share of second-quarter 2006 production is expected to average between 55-65 MMcfe/d, including approximately 2,400 bbls/d (14 MMcfe/d) from Main Pass. Our current net production rate exceeds 60 MMcfe/d and is expected to increase during the quarter with new production from Hurricane No. 2 at South Marsh Island Block 217 and West Cameron Block 43 No. 3. Our share of production is expected to reach 90 MMcfe/d in the second half of 2006 as new production from four additional wells commence, including Long Point Nos. 1 and 2 at Louisiana State Lease 18090, Dawson Deep at Garden Banks Block 625 and King of the Hill at High Island Block 131.
During the first quarter of 2006, we participated in five successful development wells, including Long Point No. 2, Hurricane No. 2, King Kong No. 3 at Vermilion Blocks 16/17, and the Raptor A-3 and A-4 wells at Ship Shoal Block 296. We are currently engaged in completion operations at Hurricane No. 2, Long Point Nos. 1 and 2, West Cameron Block 43 and Dawson Deep.
Expected commencement of production from these completions is as follows:
| | Working Interest | Net Revenue Interest | Start-Up or Expected Start-Up Date |
Onshore Vermilion Parish, LA “Cane Ridge” | 37.5% | 27.5% | April 21, 2006 |
Vermilion Blocks 16/17 “King Kong No. 3” | 40.0% | 29.2% | April 27, 2006 |
| Working Interest | Net Revenue Interest | Start-Up or Expected Start-Up Date |
West Cameron Block 43 “No. 3”* | 23.4% | 18.0% | May 2006 |
South Marsh Island Block 217 “Hurricane No. 2” | 27.5% | 19.4% | May 2006 |
Louisiana State Lease 18090 “Long Point No. 1” | 37.5% | 26.8% | Mid-2006 |
Louisiana State Lease 18090 “Long Point No. 2” | 37.5% | 26.8% | Mid-2006 |
Garden Banks Block 625 “Dawson Deep” | 30.0% | 24.0% | Mid-2006 |
Louisiana State Lease 340 “Blueberry Hill” | 35.3% | 24.2% | Completion Pending Third- Quarter 2006 Test |
* Lease is eligible for Deep Gas Royalty Relief under MMS guidelines.
The Cane Ridge discovery on Louisiana State Lease 18055 located onshore in Vermilion Parish, Louisiana commenced production on April 21, 2006. The well is currently producing at a gross rate of approximately 6.0 MMcfe/d, 2.4 MMcfe/d net to us.
The King Kong No. 3 development well at Vermilion Blocks 16/17 commenced production on April 27, 2006. In April 2006, a successful production test was conducted on the well indicating a gross flow rate of approximately 12 MMcf/d and 100 bbls/d of oil and condensate (3.7 MMcfe/d net to us) on a 22/64th choke with flowing tubing pressure of 4,556 pound per square inch. Pipeline limitations at this location were resolved during the first quarter and the field produced at a gross rate of 16 MMcfe/d (4.8 MMcfe/d net to us), principally from the King Kong No. 1 well. In mid-February 2006, the King Kong No. 2 well was shut-in for recompletion operations, which have been completed and production has resumed from the well. We are evaluating additional drilling opportunities on this acreage position. The King Kong field is currently producing at a gross rate of approximately 23 MMcf/d and 2,100 bbls/d of oil and condensate (35.8 MMcfe/d gross, 10.4 MMcfe/d net to us), including 9.6 MMcf/d and 300 bbls/d of oil and condensate from the No. 3 well (11.5 MMcfe/d gross, 3.3 MMcfe/d net to us).
Initial production from West Cameron Block 43 No. 3 is expected to commence in May 2006. The West Cameron Block 43 No. 4 well encountered mechanical issues during completion and sidetrack operations are being considered for the well. We hold a 41.7 percent working interest and a 32.3 percent net revenue interest in the West Cameron Block 43 No. 4 well. The West Cameron Block 43 lease is eligible for Deep Gas Royalty Relief
The Hurricane No. 2 development well at South Marsh Island Block 217 commenced drilling on August 21, 2005, and was drilled to 14,000 feet. The well was evaluated with log-while-drilling tools and wireline logs, indicating an interval approximating 35 net feet of hydrocarbon bearing sands in a partial penetration of the producing reservoir in the Hurricane No. 1 discovery well and its porosity development appears to be equal to or better than that encountered in the first well. A flow test on the Hurricane No. 2 well indicated a gross flow rate of 38 MMcf/d and 2,222 barrels of condensate per day (approximately 51 MMcfe/d gross, 10 MMcfe/d net to us) with a flowing tubing pressure of approximately 8,800 pounds per square inch on a 30/64th choke. The Hurricane No. 2 well is expected to commence production in May 2006. The Hurricane No. 2 well is located northwest of the Hurricane discovery well where workover activities were successfully performed during the first quarter of 2006. The Hurricane No. 1 well is currently producing at a gross rate of approximately 38 MMcf/d and 1,300 bbls/d of oil and condensate (46 MMcfe/d gross, 9 MMcfe/d net to us). Additional penetrations in this important reservoir are being studied and an offset development well (Hurricane No. 3) is scheduled to commence in second quarter of 2006. We have additional exploration opportunities in this area, including the Hurricane Deep exploratory well at South Marsh Island Block 217. Production from the Hurricane well goes to the Tiger Shoal facilities, which are also being used to produce the JB Mountain and Mound Point discoveries in the OCS 310/State Lease 340 area (see “JB Mountain and Mound Point Development Activities” below).
The Long Point No. 2 development well commenced drilling on November 30, 2005 and was drilled to a total depth of 19,617 feet. The well encountered a total of 135 feet of net hydrocarbon bearing sands including the original pay zone identified by the No. 1 discovery well and three additional pay zones, which may be significant. During the second quarter of 2006, a successful production test was conducted on the Long Point No. 2 well, which indicated a gross flow rate of approximately 37 MMcf/d and 450 bbls/d (total of approximately 40 MMcfe/d, 10.6 MMcfe/d net to us) on a 20/64ths choke with flowing tubing pressure of
11,400 pounds per square inch. Long Point No. 2 is located approximately 2,000 feet northwest from the Long Point discovery well. Drilling of the Long Point Deep exploratory well at Louisiana State Lease 18091 has commenced and its objective is to test a separate fault block.
The Long Point No. 1 exploratory well was drilled to 19,000 feet in October 2005. The discovery well was evaluated with log-while-drilling tools and wireline logs, indicating an interval approximating 116 net feet of hydrocarbon bearing sands with excellent porosity. In November 2005, we conducted a successful production test on the Long Point discovery, which indicated a gross flow rate of approximately 41 MMcf/d and 860 barrels of condensate per day (total of approximately 46 MMcfe/d, 12 MMcfe/d net to us) on a 29/64ths choke with flowing tubing pressure of 10,200 pounds per square inch.
Both Long Point wells are expected to commence production in mid-2006. Initial gross production of natural gas from the Long Point field is expected to be limited to 60-70 MMcf/d until additional pipeline capacity becomes available.
The Raptor A-3 and A-4 development wells were successfully completed and commenced production during the first quarter of 2006. The Raptor field’s current gross production is approximately 36 MMcfe/d, 12.4 MMcfe/d net to us compared to an average of 18 MMcfe/d, 6 MMcfe/d net to us in the fourth quarter of 2005. We have a 49.4 percent working interest and a 34.8 percent net revenue interest in the field.
The Dawson Deep discovery at Garden Banks Block 625 is being developed as a subsea tieback to the operator’s adjacent Gunnison spar facility. A successful production test was conducted on the well in April 2006. Initial test rates were limited to approximately 1,500 bbls/d of oil and 3 MMcf/d (12 MMcfe/d gross, 2.9 MMcfe/d net to us). We believe substantial rate improvements are possible when the well is placed on production. Production is expected by mid-2006. The Dawson Deep prospect is located on a 5,760 acre block located approximately 150 miles offshore Texas and is located adjacent to the operator’s spar facility.
The Blueberry Hill well at Louisiana State Lease 340 reached a total depth of 23,903 feet in the first quarter of 2005. Wireline logs indicated that the well encountered four potentially productive hydrocarbon bearing sands. A 4½ inch production liner was run and cemented to protect the identified potential pay zones. The drilling rig was moved off location while completion equipment is procured that will be capable of handling the well’s anticipated high pressure. Subsequent completion and testing of the well will determine future plans for this prospect. We operate Blueberry Hill, located seven miles east of the JB Mountain discovery and seven miles south southeast of the Mound Point Offset discovery. We hold a 35.3 percent working interest and a 24.2 percent net revenue interest in the Blueberry Hill well. Our net investment in the Blueberry Hill well totaled $12.6 million at March 31, 2006.
JB Mountain and Mound Point Area Development Activities
We are a participant in a program that began in 2002 and includes the JB Mountain and Mound Point Offset discoveries in the OCS 310 and Louisiana State Lease 340 areas, respectively. The program currently holds a 55 percent working interest and a 38.8 percent net revenue interest in the JB Mountain prospect and a 30.4 percent working interest and a 21.6 percent net revenue interest in the Mound Point Offset prospect. Under terms of the program, the third party partner is funding all of the costs attributable to our interests in the properties, and will own all of the program’s interests until the program’s aggregate production totals 100 Bcfe attributable to the program’s net revenue interest, at which point 50 percent of the program’s interests would revert to us. All exploration and development costs associated with the program’s interest in any future wells is to be funded by the third party partner during the period prior to when our potential reversion occurs.
There are three producing wells and approximately 13,000 gross acres on Louisiana State Lease 340 and OCS 310 that are subject to the 100 Bcfe arrangement. The three producing wells in the program averaged an aggregate gross rate of approximately 34 MMcfe/d during the first quarter of 2006. We believe there are further exploration and development opportunities associated with this acreage.
MAIN PASS ENERGY HUB™ PROJECT
We are pursuing plans for the development of the MPEH™ Project. As of March 31, 2006, we have incurred approximately $28.1 million of cash costs associated with our pursuit of the establishment of the MPEH™, including $1.8 million during the first quarter of 2006. We expect to spend approximately $6 million
to advance the licensing process and to pursue commercial arrangements for the project over the remainder of 2006.
We have completed conceptual and preliminary engineering for the potential development of the MPEH™ project. In February 2004, pursuant to the requirements of the U.S. Deepwater Port Act, we filed an application with the U.S. Coast Guard (Coast Guard) and the Maritime Administration (MARAD) requesting a license to develop an LNG receiving terminal at our Main Pass facilities located in the Gulf of Mexico, 38 miles east of Venice, Louisiana. The Coast Guard and MARAD published the Final Environmental Impact Study (EIS) for the MPEH™ license application on March 10, 2006. The Coast Guard conducted public hearings during the week of March 20, 2006. The Governors in the adjacent states (Louisiana, Mississippi, and Alabama for MPEH™) and applicable federal agencies had an effective veto right until May 8, 2006 on the license application with a record of decision scheduled by MARAD by mid-2006.
The Final EIS evaluated potential impacts associated with MPEH™. The EIS concluded that the environmental impacts associated with the construction and operation of MPEH™ would be expected to result in minor long-term adverse impacts. The EIS assessed the impact to fisheries of using an open rack vaporizer (ORV) alternative for the project and indicated this system would have “direct, adverse, minor impacts on biological resources.” However, the EIS noted that the National Marine Fisheries Service concluded that the use of open rack vaporizer technology would put stress on certain affected fish populations that the National Marine Fisheries Service is seeking to rebuild.
The methodology used in the EIS to assess the impact of ORV on biological resources did not consider potential benefits from varying the depth of seawater intake or other mitigation strategies which we plan to incorporate in the project to reduce the potential impacts. Based on additional technical studies, which consider the unique location of MPEH™ in 210 feet of water and mitigation measures expected to be included in the project’s deepwater port license, we expect the potential impact from MPEH™ using ORV, evaluated to be minor in EIS, would be further reduced. In a recent Environmental Protection Agency (EPA) memorandum establishing guidelines for the review of technology options for Deepwater LNG ports, the EPA indicated that the use of ORV, enhanced by certain design features and mitigation measures, could represent “Best Available Technology,” and on May 4, 2006, recommended approval of MPEH™ using ORV with mitigation measures.
Prior to the publication of the Final EIS, Governors of the States of Louisiana, Alabama and Mississippi had taken a position opposing the use of ORV technology until studies demonstrate that the use of this technology would not have an unacceptable impact on the surrounding ecosystem. Despite the conclusions supporting the MPEHTM application with ORV technology in the Final EIS, the favorable recommendation by the EPA, substantial additional information provided by us to the State of Louisiana and our commitment to environmental monitoring conditions, on May 5, 2006, Louisiana Governor Kathleen Blanco stated that until additional data are collected and evaluated, Louisiana will require the use of a “closed loop” regasification system, which uses natural gas rather than seawater to warm the LNG.
As a result of Governor’s Blanco’s action, we will undertake to obtain approval of our MPEHTM project using Closed Loop technology while we continue to address concerns about the more efficient ORV technology. The significant studies completed to date should enable the revisions to the MPEHTM permit application to incorporate Closed Loop technology to be processed expeditiously.
Using Closed Loop technology would require our facility to consume an estimated incremental 3.5 billion cubic feet (Bcf) of natural gas per annum compared with ORV technology thereby increasing the cost structure of our project. Closed Loop technology would also expected to result in a modest increase to capital cost of the facility.
As currently conceived, the proposed terminal would be capable of regasifying LNG at a rate of 1 Bcf per day and is being designed to accommodate potential future expansions. The capital cost for the terminal facilities, using ORV technologies, is currently estimated at $440 million. We are seeking a permit for a facility with capacity up to 1.6 Bcf per day, which if authorized by permit and built, would add approximately $100 million to the estimated capital cost. Following permitting, front-end engineering and design will be completed, which may result in revisions to the capital cost estimates. In addition, permitting of a facility using Closed Loop technology is expected to result in a revision to our capital cost estimates.
We are also considering additional investments to develop substantial undersea cavern storage for natural gas in the 2-mile diameter salt dome located at the site and to construct pipeline interconnects to the U.S. pipeline distribution system, including a new 93-mile, 36-inch pipeline to Coden, Alabama. Current plans for the MPEH™ include 28 Bcf of initial cavern storage capacity and aggregate peak deliverability from
the proposed terminal, including deliveries from storage of up to 2.5 Bcf per day. The estimated cost for these potential investments in pipelines and storage, which could be owned or financed by third parties, is approximately $450 million.
The MPEH™ is located in 210 feet of water, which allows deepwater access for large LNG tankers and is in close proximity to shipping channels. We plan to utilize the substantial existing platforms and infrastructure at the site, which we believe will provide us with significant timing advantages and cost savings. Safety and security aspects of the facility are also enhanced by the offshore location. If we receive our license expeditiously, as expected, and obtain financing for the project, construction could be completed within three years, which would potentially make MPEH™ one of the first U.S. offshore LNG terminals.
We are in discussions with potential LNG suppliers in the Atlantic Basin and with natural gas consumers in the United States regarding commercial arrangements for the facilities. We are also considering opportunities to participate in certain oil and gas exploration and production activities as an extension of our proposed LNG terminaling activities. We are advancing commercial discussions in parallel with the permitting process.
Currently we own 100 percent of the MPEH™ project. However two entities have separate options to participate as passive equity investors for up to an aggregate 25 percent of our equity interest in the project (see Notes 4 and 11 of our 2005 Form 10-K). Future financing arrangements may also reduce our equity interest in the project.
For additional information regarding our MPEH™ Project see Items 1. and 2. “Business and Properties - Main Pass Energy Hub™ Project” in our 2005 Form 10-K.
RESULTS OF OPERATIONS
Our only segment is “Oil and Gas,” which includes all oil and natural gas exploration and production operations of MOXY as well as the K-Mc I oil operations at Main Pass. We are pursuing a new business segment, “Energy Services,” whose start-up activities are reflected as a single expense line item within the accompanying consolidated statements of operations. See “Discontinued Operations” below for information regarding our former sulphur segment.
We use the successful efforts accounting method for our oil and gas operations, under which our exploration costs, other than costs of successful drilling and in-progress exploratory wells, are charged to expense as incurred. We anticipate that we may continue to experience operating losses during the near-term, primarily because of our significant planned exploration activities and the start-up costs associated with establishing the MPEH™, which included permitting fees and costs associated with the pursuit of commercial arrangements for the project.
During the first quarter of 2006, we had an operating loss of $6.4 million. The operating loss included $20.6 million of exploration expenses, including nonproductive well drilling and related costs of $12.3 million, and $1.8 million of MPEH™ start-up costs. Our operating results during the first quarter of 2006 also reflect the adoption of a new accounting standard (see “New Accounting Standard” below and Note 2) that requires that we charge to expense the estimated compensation costs related to stock-based awards issued by us. We charged $9.7 million of related compensation expense for stock based awards during the first quarter of 2006 compared with $0.3 million during the same period last year. During the first quarter of 2005, we had an operating loss of $2.1 million. The loss was attributed to $7.5 million of exploration expenses, including nonproductive exploratory well drilling and related costs of $2.9 million and $2.3 million of start-up costs associated with the MPEH™. Our operating losses during the first quarter periods were partially offset by insurance recoveries totaling $1.2 million for 2006 and $5.0 million for 2005 primarily reflecting recoveries associated with our Main Pass oil operations. Summarized operating data is as follows:
| | Three Months Ended March 31, |
| | 2006 | | 2005 |
| OPERATING DATA: | | | |
| Sales Volumes | | | |
| Gas (thousand cubic feet, or Mcf) | 2,159,400 | | 1,410,500 |
Oil (barrels) | 296,900 | a | 17,000 |
Plant products (equivalent barrels) b | 14,300 | | 7,100 |
| Average Realization | | | |
| Gas (per Mcf) | $ 8.12 | | $ 6.84 |
| Oil (per barrel) | 57.15 | | 50.28 |
| a. | After being shut-in in September 2004 as a result of damage to a third-party facility and connecting pipelines caused by Hurricane Ivan, Main Pass resumed production in May 2005 following completion of modifications to existing facilities to allow transportation of oil from the field by barge (Note 5). In the first quarter of 2006, sales volumes from Main Pass totaled approximately 199,300 barrels. Main Pass produces sour crude oil, which sells at a discount to other crude oils. |
| b. | We received approximately $0.8 million and $0.3 million of revenues associated with plant products (ethane, propane, butane, etc.) during the first quarters of 2006 and 2005, respectively (see “Oil and Gas Operations” below). |
Oil and Gas Operations
A summary of increases (decreases) in our oil and gas revenues between the periods follows (in thousands):
| | First Quarter | |
| Oil and natural gas revenues - prior year period | $ | 11,380 | |
| Increase (decrease) | | | |
| Price realizations: | | | |
| Oil and condensate | | 1,196 | |
| Natural gas | | 2,779 | |
| Sales volumes: | | | |
| Oil and condensate | | 14,918 | |
| Natural gas | | 5,120 | |
| Plant products revenues | | 509 | |
| Other | | (461 | ) |
| Oil and gas revenues - current year period | $ | 35,441 | |
Our first-quarter 2006 oil and natural gas revenues reflect a significant increase in volumes sold of natural gas (53 percent) and the average realization received for natural gas (19 percent) compared to the first quarter of 2005. Sales volumes of oil and condensate also reflected similar significant increases during the first quarter of 2006 with volumes approximating 16 times first quarter 2005 production, which primarily reflects the sale of 199,300 barrels of oil from Main Pass during the current quarter. Main Pass was shut-in during the first quarter of 2005 while modifications were made to its facilities to allow transportation of oil from the field by barge (Note 5). Oil realizations increased by 14 percent over last year’s amounts. The remaining increases in sales volume primarily reflect the establishment of production from new fields during 2005. For information regarding new producing fields commencing operations during 2005 see Items 1. and 2. “Business and Properties” in our 2005 Form 10-K.
Our service revenues totaled $4.3 million for the first quarter of 2006 compared to $3.3 million last year. The increase is primarily attributed to a $1.0 million adjustment to the management fee associated with the multi-year exploration venture activities during 2005 (Note 5) and oil and gas processing fees for third party production primarily associated with the Main Pass oil operations.
Production and delivery costs totaled $10.8 million in the first quarter of 2006 compared to $3.7 million in the first quarter of 2005. This increase primarily reflects additional costs relating to increased production for the first quarter of 2006 as compared with the first quarter of 2005. The increase also reflects increased well workover costs that totaled $2.6 million in the first quarter of 2006 compared with $0.1 million in the same period last year. Our current period workover costs were primarily related to operations to restore production from the Minuteman well at Eugene Island Block 213 (see below and Note 5).
Depletion, depreciation and amortization expense totaled $5.8 million in the first quarter of 2006 compared to $3.9 million for the same period last year. The increase reflects higher production volumes in the first quarter of 2006, including depletion, depreciation and amortization associated with oil production from Main Pass totaling $0.5 million.
As further explained in Note 5, accounting rules require that the carrying value of proved oil and gas property costs be assessed for possible impairment under certain circumstances, and reduced to fair value by a charge to earnings if impairment is deemed to have occurred. Conditions affecting current and estimated future cash flows that could require impairment charges include, but are not limited to, lower anticipated oil and natural gas prices, increased production, development and reclamation costs and downward revisions of reserve estimates. As more fully explained in Item 1A. “Risk Factors” in our 2005
Form 10-K, a combination of any or all of these conditions could require impairment charges to be recorded in future periods.
The determination of oil and natural gas reserve estimates is a subjective process, and the accuracy of any reserve estimate depends on the quality of available data and the application of engineering and geological interpretation and judgment. Estimates of economically recoverable reserves and future net cash flows depend on a number of variable factors and assumptions that are difficult to predict and may vary considerably from actual results. In particular, reserve estimates for wells with limited or no production history are less reliable than those based on actual production. Subsequent evaluation of the same reserves may result in variations, which may be substantial, in estimated reserves and related estimates of future cash flows. If the capitalized costs of an individual oil and gas property exceed the related estimated future net cash flows, an impairment charge to reduce the capitalized costs to the property’s estimated fair value is required. For more information regarding the risks associated with our reserve estimation process see Item 1A. “Risk Factors” in our 2005 Form 10-K.
The Minuteman well at Eugene Island Block 213 commenced production in February 2005. The well’s production decreased significantly from initial rates until stabilizing at a gross rate approximating 3 MMcfe/d in the second quarter of 2005. The well was shut in for both Hurricanes Katrina and Rita but returned to production following both storms at rates approximating 3 MMcfe/d. In late October 2005, the well was shut in because of mechanical problems. In the first quarter of 2006, the operator performed workover activities on the well. The well resumed production in February 2006 but was subsequently shut-in once again because of mechanical issues. We are planning remedial alternatives to restore production from the well. We have been unable to develop meaningful estimates of ultimate recoverable reserves for the Minuteman well because of its geological complexity and the lack of sufficient production data. We will continue to monitor activity with respect to this well and accumulate data, including the effects of remedial work, to develop reserve estimates for this well. Our net investment in the Minuteman well totaled $12.5 million at March 31, 2006. If the estimated undiscounted future net cash flows relating to this well’s estimated reserves were determined to be less than the related capitalized costs, we would reduce our investment accordingly through a charge to our future operating results.
Our exploration expenses will fluctuate in future periods based on the structure of our arrangements to drill exploratory wells (i.e. whether exploratory costs are financed by other participants or us), the number, results and costs of our exploratory drilling projects and the incurrence of geological and geophysical costs, including the cost of seismic data. Summarized exploration expenses are as follows (in millions):
| | Three Months Ended | |
| | March 31, | |
| | 2006 | | 2005 | |
| Geological and geophysical, | | | | | | |
| including 3-D seismic purchases | $ | 7.0 | a | $ | 1.8 | |
| Non productive exploratory costs, including | | | | | | |
| related lease costs | | 12.3 | b | | 2.9 | c |
| Other | | 1.3 | | | 2.8 | |
| | $ | 20.6 | | $ | 7.5 | |
| a. | Includes $5.0 million of compensation costs associated with outstanding stock-based awards following adoption of a new accounting standard (see “New Accounting Standard” below and Note 2). |
| b. | Includes nonproductive exploratory well drilling and related costs primarily associated with the “Denali” well at South Pass Block 26 ($8.1 million), and the costs incurred during the first quarter of 2006 for the “Cabin Creek” well at West Cameron Block 95 ($2.5 million) and “Elizabeth” well at South Marsh Island Block 230 ($1.7 million). |
| c. | Includes nonproductive exploratory well drilling and related costs associated with the “Caracara” well at Vermilion Blocks 227/228 ($1.3 million), the “King of the Hill” well at High Island Block 131($0.3 million), the “Gandalf ” well at Mustang Island Block 829 ($0.1 million) and the deeper zones at both the “Hurricane Upthrown” well at South Marsh Island Block 217 ($0.4 million) and the West Cameron Block 43 No. 3 exploratory well ($0.4 million). Amount also includes the write-off of approximately $0.4 million of leasehold costs associated with one onshore Louisiana prospect. |
Other Financial Results
General and administrative expense totaled $8.2 million in the first quarter of 2006 and $4.4 million in the first quarter of 2005. The increase primarily reflects the adoption of Statement of Accounting Standards No. 123 (revised 2004) “Share-Based Payment” (SFAS 123R) effective January 1, 2006 (see “New Accounting Standard” below and Note 2). We charged approximately $4.7 million of related stock-
based compensation costs to general and administrative expense during the first quarter of 2006. This increase was partially offset by decreased legal costs following settlement of litigation in the fourth quarter of 2005.
Interest expense, net of capitalized interest, totaled $1.8 million in the first quarter of 2006 and $3.8 million in the first quarter of 2005. Capitalized interest totaled $1.4 million in the first quarter of 2006 and $0.6 million in the first quarter of 2005. First-quarter 2006 conversions of our senior notes resulted in a reduction in interest expense of $0.6 million for previously accrued amounts (including $0.3 million accrued and outstanding at December 31, 2005) that were reclassified to losses on conversions of debt in other non-operating expense in the accompanying consolidated statements of operations. For more information regarding these conversion transactions see “Capital Resources and Liquidity” below and Note 3.
CAPITAL RESOURCES AND LIQUIDITY
The table below summarizes our cash flow information by categorizing the information as cash provided by or (used in) operating activities, investing activities and financing activities and distinguishing between our continuing operations and the discontinued operations (in millions):
| | Three Months Ended | |
| | March 31, | |
| | 2006 | | | 2005 | |
Continuing operations | | | | | | | |
| Operating | $ | (5.9 | ) | | $ | 28.4 | |
| Investing | | (61.4 | ) | | | (36.5 | ) |
| Financing | | (5.0 | ) | | | 1.0 | |
| | | | | | | | |
Discontinued operations | | | | | | | |
| Operating | | (3.5 | ) | | | (1.0 | ) |
| Investing | | - | | | | - | |
| Financing | | - | | | | - | |
| | | | | | | | |
Total cash flow | | | | | | | |
| Operating | | (9.4 | ) | | | 27.4 | |
| Investing | | (61.4 | ) | | | (36.5 | ) |
| Financing | | (5.0 | ) | | | 1.0 | |
First-Quarter 2006 Cash Flows Compared with First-Quarter 2005
Operating cash flow from our continuing operations during the first quarter of 2006 includes the $15.3 million net payment to settle class action litigation (see Part II, Item 1 “Legal Proceeding elsewhere in this Form 10-Q). We expect to receive an additional $2.9 million reimbursement of these costs from our insurers in the second quarter of 2006. Cash used in our continuing operations also reflects significant payments of accounts payable and increased materials and supply inventory purchases. These decreases were partially offset by increased oil and natural gas revenues and decreases in the amount of start-up costs associated with the MPEH™. Our operating cash flows during the first quarter of 2005 benefited from the receipt of proceeds related to our Main Pass insurance claims resulting from Hurricane Ivan in September 2004. We received $4.8 million of the final $5.0 million payment related to these Main Pass insurance claims in April 2006 and expect to collect the remainder in the second quarter of 2006.
Cash used in our discontinued operations increased from first-quarter 2005 amounts primarily reflecting $0.5 million of reclamation costs related to ongoing work at our Port Sulphur, Louisiana facilities as well as other increased caretaking costs related to the facilities.
Our investing cash flows reflect exploration, development and other capital expenditures for our in-progress exploratory wells and development wells as discussed in “Oil and Gas Activities” above. These expenditures also include nonproductive exploratory well costs as discussed in “Results of Operations” above. Our exploration, development and other capital expenditures for 2006 are expected to approximate $240 million, including approximately $140 million for exploration expenditures and approximately $100 million for currently identified development costs. These planned capital expenditures may increase as additional exploration opportunities are presented to us or to fund the development costs associated with additional successful wells. We plan to fund our exploration and development activities with our available unrestricted cash (approximately $56 million at March 31, 2006), our new revolving credit facility (see "Debt Conversion Transactions and Credit Facility" below and Note 3) and operating cash flows, which are
expected to increase as our oil and natural gas production rises (see "Oil & Gas Activities - Production Update and Development Activities" above). We may pursue additional funding through potential debt or equity financing for our oil and gas and MPEH™ activities.
Our investing cash flows reflect the liquidation of $7.4 million of previously escrowed U.S. government notes in the first quarter of 2006 and $3.9 million in the first quarter of 2005. We used $3.9 million of these escrow proceeds to pay the semi-annual interest payments on our 6% convertible senior notes on January 2, 2006 and 2005. The remaining $3.5 million of escrowed proceeds used in the first quarter of 2006 funded a portion of our debt conversion transactions (see “Debt Conversion Transactions and Credit Facility” below).
Our continuing operations’ financing activities included payments of dividends on our mandatorily redeemable preferred stock totaling $0.7 million in the first quarter of 2006, including approximately $0.4 million associated with the dividend payment from the fourth quarter of 2005 that was paid on January 3, 2006 and $0.4 million in the first quarter of 2005. Proceeds received from the exercise of stock options totaled $1.4 million in the first quarter of 2005.
Debt Conversion Transactions and Credit Facility
Since the beginning of 2006 and through March 31, 2006, we privately negotiated transactions to induce conversion of $29.1 million of our 6% convertible senior notes and $25.0 million of our 5¼% convertible senior notes, into an approximately 3.6 million shares of our common stock based on the respective conversion price for each set of convertible notes (Note 4). We paid an aggregate $4.3 million in the transactions and recorded an approximate $4.0 million net charge to expense in the first quarter of 2006. The net charge reflects the $4.3 million inducement payment, reflected in the accompanying consolidated statement of operations as other non-operating expense, less $0.3 million of previously accrued interest expense recorded during 2005. We funded approximately $3.5 million of the cash payments from restricted cash held in escrow for funding interest payments on the convertible notes and paid the remaining portion with available unrestricted cash. As a result of these transactions, the annual interest cost savings are estimated to approximate $3.1 million.
In April 2006, we established a new four-year, $100 million Senior Secured Revolving Credit Facility with a group of banks for MOXY’s oil and natural gas operations. The facility has an initial borrowing base of $55 million. The borrowing base will be re-determined on a semi-annual basis on April 1 and October 1 of each year beginning October 1, 2006. The facility may be increased to $150 million with additional lender commitments. The credit agreement matures on April 19, 2010.
The variable-rate facility is secured by 1) substantially all the oil and gas related properties (with related oil and natural gas proved reserves) of MOXY and K-Mc I and 2) the pledge by McMoRan of its ownership interest in MOXY and by MOXY of its ownership interest in each of its wholly owned subsidiaries. The facility is further guaranteed by McMoRan and each of MOXY’s wholly owned subsidiaries. The facility contains customary financials covenants and other restrictions.
NEW ACCOUNTING STANDARD
Effective January 1, 2006, we adopted the fair value recognition provisions of Statement of Financial Accounting Standards No. 123 (revised 2004), “Share-Based Payment” or (SFAS No. 123R), using the modified prospective transition method. Under that transition method, compensation cost recognized in 2006 includes: (a) compensation costs for all stock option awards granted to employees prior to, but not yet vested as of January 1, 2006, based on the grant-date fair value estimated in accordance with the original provisions of SFAS No. 123, and (b) compensation cost for all stock option awards granted subsequent to January 1, 2006, based on the grant-date fair value estimated in accordance with the provisions of SFAS No.123R. Fair value of stock option awards granted to employees was calculated using the Black-Scholes-Merton option-pricing model before and after adoption of SFAS No. 123R. Other stock-based awards charged to expense under SFAS No. 123 continue to be charged to expense under SFAS No. 123R (see Note 2). These include stock options granted to non-employees and advisory directors as well as restricted stock units. Results for prior periods have not been restated.
As a result of adopting SFAS No.123R, our net loss for the three months ended March 31, 2006, was $9.2 million ($0.34 per basic and diluted share) higher than if it had continued to account for share-based compensation under APB Opinion No. 25. Basic and diluted net loss per share would have been $0.16 per share for the three months ended March 31, 2006 if we had not adopted SFAS No.123R, compared to reported net loss of $0.50 per basic and diluted share. Compensation expense related to
currently outstanding and unvested stock-based awards is expected to approximate $2.0 million per quarter for the remainder of 2006.
Compensation cost charged against earnings for stock-based awards is shown below (in thousands).
| | | Three Months Ended March 31, | |
| | | 2006 | | 2005 | |
| General and administrative expenses | | $ | 4,651 | | $ | 86 | |
| Exploration expenses | | | 4,999 | | | 177 | |
| Main Pass Energy Hub start-up costs | | | 25 | | | - | |
| Total stock-based compensation cost | | $ | 9,675 | | $ | 263 | |
| | | | | | | | |
As of March 31, 2006, total compensation cost related to nonvested stock option awards not yet recognized in earnings was approximately $19 million, which is expected to be recognized over a weighted average period of approximately 2.3 years.
DISCONTINUED OPERATIONS
Our discontinued operations resulted in a net loss of $1.7 million in the first quarter of 2006 and $1.0 million in the first quarter of 2005. The summarized results of the discontinued operations are as follows (in thousands):
| | | First Quarter | |
| | | 2006 | | 2005 | |
| Sulphur retiree costs | | $ | 460 | | $ | 218 | |
| Legal expenses | | | 50 | | | 236 | |
| Caretaking costs | | | 430 | | | 190 | |
| Accretion expense - sulphur | | | | | | | |
| reclamation obligations | | | 348 | | | 240 | |
| Insurance | | | 418 | | | 90 | |
| General and administrative | | | 31 | | | 19 | |
| Other | | | (60 | ) | | 36 | |
| Loss from discontinued operations | | $ | 1,677 | | $ | 1,029 | |
CAUTIONARY STATEMENT
Management’s Discussion and Analysis of Financial Condition and Results of Operations contain forward-looking statements. All statements other than statements of historical fact included in this report, including, without limitation, statements regarding plans and objectives of our management for future operations and our exploration and development activities are forward-looking statements.
This report includes "forward looking statements" within the meaning of Section 27A of the Securities Act of 1933 and Section 21E of the Securities Exchange Act of 1934, including statements about our plans, strategies, expectations, assumptions and prospects. "Forward-looking statements" are all statements other than statements of historical fact, such as: statements regarding our business plans for 2006; statements regarding our need for, and the availability of, financing; and to satisfy the MMS reclamation obligations with respect to Main Pass; drilling potential and results; anticipated flow rates of producing wells; anticipated initial flow rates of new wells; reserve estimates and depletion rates; general economic and business conditions; risks and hazards inherent in the production of oil and natural gas; demand and potential demand for oil and gas; trends in oil and natural gas prices; amounts and timing of capital expenditures and reclamation costs; and other environmental issues. Further information regarding these and other factors that may cause our future performance to differ from that projected in the forward looking statements are described in more detail under Item 1A. “Risk Factors” included in our 2005 Form 10-K.
-------------------------
There have been no significant changes in our market risks since the year ended December 31, 2005. For more information, please read the consolidated financial statements and notes thereto included in our Annual Report on Form 10-K for the year ended December 31, 2005.
(a) Evaluation of disclosure controls and procedures. Our chief executive officer and chief financial officer, with the participation of management, have evaluated the effectiveness of our “disclosure controls and procedures” (as defined in Rules 13a-14(c) and 15d-14(c) under the Securities Exchange Act of 1934) as of the end of the period covered by this quarterly report on Form 10-Q. Based on their evaluation, they have concluded that our disclosure controls and procedures are effective in timely alerting them to material information relating to McMoRan (including our consolidated subsidiaries) required to be disclosed in our periodic Commission filings.
(b) Changes in internal controls. There has been no change in our internal control over financial reporting that occurred during the first fiscal quarter that has materially affected, or is reasonably likely to materially affect our internal control over financial reporting.
Item 1. Legal Proceedings.
Daniel W. Krasner v. James R. Moffett; René L. Latiolais; J. Terrell Brown; Thomas D. Clark, Jr.; B.M. Rankin, Jr.; Richard C. Adkerson; Robert M. Wohleber; Freeport-McMoRan Sulphur Inc. and McMoRan Oil & Gas Co., Civ. Act. No. 16729-NC (Del. Ch. filed Oct. 22, 1998). Gregory J. Sheffield and Moise Katz v. Richard C. Adkerson, J. Terrell Brown, Thomas D. Clark, Jr., René L. Latiolais, James R. Moffett, B.M. Rankin, Jr., Robert M. Wohleber and McMoRan Exploration Co., (Court of Chancery of the State of Delaware, filed December 15, 1998.). In December 2005, we announced that we reached an agreement in principle with the plaintiffs to settle this class action litigation. While we believe that the 1998 merger transaction was properly considered by the boards of directors of Freeport-McMoRan Sulphur Inc. and McMoRan Oil & Gas Co. and was substantially and procedurally fair to the shareholders of both companies, we believe this settlement is in the best interests of the company and its shareholders and eliminates the risk, burden and expense of further litigation. In accordance with the terms of the settlement, we paid $17.5 million in cash into a settlement fund in March 2006, the plaintiffs have provided a complete release of all claims, and the Delaware litigation has been dismissed with prejudice. Our insurance carriers have or are expected to fund $5.1 million of our settlement costs. All fees and expenses incident to the settlement, including the costs of administration, notice, and any payment for plaintiff’s attorney’s fees will be borne by the plaintiffs from the settlement fund.
Other than the proceeding discussed above, we may from time to time be involved in various legal proceedings of a character normally incident to the ordinary course of our business. We believe that potential liability from any of these pending or threatened proceedings will not have a material adverse effect on our financial condition or results of operations. We maintain liability insurance to cover some, but not all, of the potential liabilities normally incident to the ordinary course of our businesses as well as other insurance coverages customary in our business, with coverage limits as we deem prudent.
Item 1A. Risk Factors.
There have been no material changes to our risk factors since the year ended December 31, 2005. For more information, please read Item 1A included in our Form 10-K for the year ended December 31, 2005.
Item 4. Submission of Matters to a Vote of Security Holders
Our annual meeting of stockholders was held May 4, 2006 (the “Annual Meeting”). Proxies were solicited pursuant to Regulation 14A under the Securities Exchange Act of 1934, as amended. The following matters were submitted to a vote of security holders during our Annual Meeting:
| | Votes Cast For | Authority Withheld |
| 1. Election of Directors: | | |
Richard C. Adkerson | 24,439,347 | 459,103 |
| Robert A. Day | 24,429,423 | 469,027 |
Gerald J. Ford | 24,633,647 | 264,803 |
H. Devon Graham, Jr. | 24,556,974 | 341,476 |
James R. Moffett | 24,435,841 | 462,609 |
B. M. Rankin, Jr. | 24,320,911 | 577,539 |
| J. Taylor Wharton | 24,557,021 | 341,429 |
There were no abstentions with respect to the election of directors.
| | For | Against | Abstentions |
| 2. Ratification of Ernst & Young LLP as independent auditors | 24,853,225 | 22,472 | 22,753 |
Item 6. Exhibits.
The exhibits to this report are listed in the Exhibit Index appearing on page E-1 hereof.
McMoRan Exploration Co.
Pursuant to the requirements of the Securities Exchange Act of 1934, the registrant has duly caused this report to be signed on its behalf by the undersigned thereunto duly authorized.
McMoRan Exploration Co.
By: /s/ C. Donald Whitmire, Jr.
C. Donald Whitmire, Jr.
Vice President and Controller-
Financial Reporting
(authorized signatory and
Principal Accounting Officer)
Date: May 9, 2006
McMoRan Exploration Co.
Exhibit Number
| 2.1 | Agreement and Plan of Merger dated as of August 1, 1998. (Incorporated by reference to Annex A to McMoRan’s Registration Statement on Form S-4 (Registration No. 333-61171) filed with the SEC on October 6, 1998 (the McMoRan S-4)). |
| | |
| 3.1 | Amended and Restated Certificate of Incorporation of McMoRan. (Incorporated by reference to Exhibit 3.1 to McMoRan’s 1998 Annual Report on Form 10-K (the McMoRan 1998 Form 10-K)). |
| | |
| 3.2 | Certificate of Amendment to the Amended and Restated Certificate of Incorporation of McMoRan. (Incorporated by reference to Exhibit 3.2 of McMoRan’s First-Quarter 2003 Form 10-Q). |
| | |
| 3.3 | Amended and Restated By-Laws of McMoRan as amended effective January 30, 2006. (Incorporated by reference to Exhibit 3.3 to McMoRan’s Current Report on Form 8-K dated January 30, 2006 (filed February 3, 2006). |
| | |
| 4.1 | Form of Certificate of McMoRan Common Stock (Incorporated by reference to Exhibit 4.1 of the McMoRan S-4). |
| | |
| 4.2 | Rights Agreement dated as of November 13, 1998. (Incorporated by reference to Exhibit 4.2 to McMoRan 1998 Form 10-K). |
| | |
| 4.3 | Amendment to Rights Agreement dated December 28, 1998. (Incorporated by reference to Exhibit 4.3 to McMoRan 1998 Form 10-K). |
| | |
| 4.4 | Standstill Agreement dated August 5, 1999 between McMoRan and Alpine Capital, L.P., Robert W. Bruce III, Algenpar, Inc, J. Taylor Crandall, Susan C. Bruce, Keystone, Inc., Robert M. Bass, the Anne T. and Robert M. Bass Foundation, Anne T. Bass and The Robert Bruce Management Company, Inc. Defined Benefit Pension Trust. (Incorporated by reference to Exhibit 4.4 to McMoRan’s Third Quarter 1999 Form 10-Q). |
| | |
| 4.5 | Form of Certificate of McMoRan 5% Convertible Preferred Stock (McMoRan Preferred Stock). (Incorporated by reference to Exhibit 4.5 to McMoRan’s Second Quarter 2002 Form 10-Q). |
| | |
| 4.6 | Certificate of Designations of McMoRan Preferred Stock. (Incorporated by reference to Exhibit 4.6 to McMoRan’s Third-Quarter 2002 Form 10-Q). |
| | |
| 4.7 | Warrant to Purchase Shares of Common Stock of McMoRan dated December 16, 2002. (Incorporated by reference to Exhibit 4.7 to McMoRan’s 2002 Form 10-K). |
| | |
| 4.8 | Warrant to Purchase Shares of Common Stock of McMoRan dated September 30, 2003. (Incorporated by reference to Exhibit 4.8 to McMoRan’s 2003 Form 10-K), |
| | |
| 4.9 | Registration Rights Agreement dated December 16, 2002 between McMoRan and K1 USA Energy Production Corporation. (Incorporated by reference to Exhibit 4.8 to McMoRan’s 2002 Form 10-K). |
| | |
| 4.10 | Indenture dated as of July 2, 2003 by and between McMoRan and The Bank of New York, as trustee. (Incorporated by reference to Exhibit 4.9 to McMoRan’s Second-Quarter 2003 Form 10-Q). |
| 4.11 | Collateral Pledge and Security Agreement dated as of July 2, 2003 by and among McMoRan, as pledgor, The Bank of New York, as trustee, and the Bank of New York, as collateral agent. (Incorporated by reference to Exhibit 4.11 to McMoRan’s Second-Quarter 2003 Form 10-Q). |
| | |
| 4.12 | Indenture dated October 6, 2004 by and among McMoRan and the Bank of New York, as trustee. (Incorporated by reference to Exhibit 99.3 to McMoRan’s Current Report on Form 8-K dated October 6, 2004 (filed October 7, 2004). |
| | |
| 4.13 | Collateral Pledge and Security Agreement dated October 6, 2004 by and among McMoRan, as pledgor, The Bank of New York, as trustee and the Bank of New York, as collateral agent. (Incorporated by reference to Exhibit 99.4 to McMoRan’s Current Report on Form 8-K dated October 6, 2004 (filed October 7, 2004). |
| | |
| 4.14 | Registration Rights Agreement dated October 6, 2004 by and among McMoRan, as issuer and Merrill Lynch, Pierce, Fenner & Smith Incorporated, J.P. Morgan Securities Inc. and Jefferies & Company, Inc. as Initial Purchasers. (Incorporated by reference to Exhibit 99.5 to McMoRan’s Current Report on Form 8-K dated October 6, 2004 (filed October 7, 2004)). |
| | |
| 10.1 | Main Pass 299 Sulphur and Salt Lease, effective May 1, 1988. (Incorporated by reference to Exhibit 10.1 to McMoRan’s 2001 Annual Report on Form 10-K (the McMoRan 2001 Form 10-K)). |
| | |
| 10.2 | IMC Global/FSC Agreement dated as of March 29, 2002 among IMC Global Inc., IMC Global Phosphate Company, Phosphate Resource Partners Limited Partnership, IMC Global Phosphates MP Inc., MOXY and McMoRan. (Incorporated by reference to Exhibit 10.10 to McMoRan’s Second Quarter 2002 Form 10-Q). |
| | |
| 10.3 | Amended and Restated Services Agreement dated as of January 1, 2002 between McMoRan and FM Services Company. (Incorporated by reference to Exhibit 10.3 to McMoRan’s Second-Quarter 2003 Form 10-Q). |
| | |
| 10.4 | Letter Agreement dated August 22, 2000 between Devon Energy Corporation and Freeport Sulphur. (Incorporated by reference to Exhibit 10.36 to McMoRan’s Third-Quarter 2000 Form 10-Q). |
| | |
| 10.5 | Asset Purchase Agreement dated effective December 1, 1999 between SOI Finance Inc., Shell Offshore Inc. and MOXY. (Incorporated by reference to Exhibit 10.33 in the McMoRan 1999 Form 10-K). |
| | |
| 10.6 | Employee Benefits Agreement by and between Freeport-McMoRan Inc. and Freeport Sulphur (Incorporated by reference to Exhibit 10.29 to McMoRan’s 2001 Form 10-K). |
| | |
| 10.7 | Purchase and Sales agreement dated January 25, 2002 but effective January 1, 2002 by and between MOXY and Halliburton Energy Services, Inc. (Incorporated by reference to Exhibit 10.1 to McMoRan’s Current Report on Form 8-K dated February 22, 2002). |
| | |
| 10.8 | Purchase and Sale Agreement dated as of March 29, 2002 by and among Freeport Sulphur, McMoRan, MOXY and Gulf Sulphur Services Ltd., LLP. (Incorporated by reference to Exhibit 10.37 to McMoRan’s First-Quarter 2002 Form 10-Q.) |
| | |
| 10.9 | Purchase and Sale Agreement dated May 9, 2002 by and between MOXY and El Paso Production Company. (Incorporated by reference to Exhibit 10.28 to McMoRan’s Second Quarter 2002 Form 10-Q). |
| | |
| 10.10 | Amendment to Purchase and Sale Agreement dated May 22, 2002 by and between MOXY and El Paso Production Company. (Incorporated by reference to Exhibit 10.29 to McMoRan’s Second Quarter 2002 Form 10-Q). |
| | |
| 10.11 | Master Agreement dated October 22, 2002 by and among Freeport-McMoRan Sulphur LLC, K-Mc Venture LLC, K1 USA Energy Production Corporation and McMoRan (Incorporated by reference to Exhibit 10.18 to McMoRan’s 2002 Form 10-K). |
| | |
| 10.12 | Credit Agreement dated as of April 19, 2006 among McMoRan Oil & Gas LLC as borrower, JP Morgan Chase Bank, N.A., as administrative agent, Toronto-Dominion (Texas) LLC, as syndication agent and the Lenders Party Hereto. (Incorporated by reference to Exhibit 10.1 of McMoRan Current Report on Form 8-K dated April 19, 2006). |
| | Executive and Director Compensation Plans and Arrangements (Exhibits 10.13 through 10.34). |
| | |
| 10.13 | McMoRan Adjusted Stock Award Plan, as amended and restated. (Incorporated by reference to Exhibit 10.6 to McMoRan’s Current Report on Form 8-K dated May 1, 2006 (May 1, 2006 Form 8-K). |
| | |
| 10.14 | McMoRan 1998 Stock Option Plan, as amended and restated. (Incorporated by reference to Exhibit 10.5 to McMoRan’s May 1, 2006 Form 8-K). |
| | |
| 10.15 | McMoRan 1998 Stock Option Plan for Non-Employee Directors. (Incorporated by reference to Exhibit 10.14 to McMoRan’s Second-Quarter 2005 Form 10-Q). |
| | |
| 10.16 | McMoRan Form of Notice of Grant of Nonqualified Stock Options and Limited Rights under the 1998 Stock Option Plan. (Incorporated by reference to Exhibit 10.15 to McMoRan’s Second-Quarter 2005 Form 10-Q). |
| | |
| 10.17 | McMoRan 2000 Stock Incentive Plan, as amended and restated. (Incorporated by reference to Exhibit 10.4 to McMoRan’s May 1, 2006 Form 8-K). |
| | |
| 10.18 | McMoRan Form of Notice of Grant of Nonqualified Stock Options and Limited Rights under the 2000 Stock Incentive Plan. (Incorporated by reference to Exhibit 10.17 to McMoRan’s Second-Quarter 2005 Form 10-Q). |
| | |
| 10.19 | McMoRan 2001 Stock Incentive Plan, as amended and restated. (Incorporated by reference to Exhibit 10.3 to McMoRan’s May 1, 2006 Form 8-K). |
| | |
| 10.20 | McMoRan 2003 Stock Incentive Plan, as amended and restated. (Incorporated by reference to Exhibit 10.2 to McMoRan’s May 1, 2006 Form 8-K). |
| | |
| 10.21 | McMoRan’s Performance Incentive Awards Program as amended effective February 1, 1999. (Incorporated by reference to Exhibit 10.18 to McMoRan’s 1998 Form 10-K). |
| | |
| 10.22 | McMoRan Form of Notice of Grant of Nonqualified Stock Options and Limited Rights under the 2001 Stock Incentive Plan. (Incorporated by reference to Exhibit 10.21 to McMoRan’s Second-Quarter 2005 Form 10-Q). |
| | |
| 10.23 | McMoRan Form of Restricted Stock Unit Agreement Under the 2001 Stock Incentive Plan. (Incorporated by reference to Exhibit 10.22 to McMoRan’s Second-Quarter 2005 Form 10-Q). |
| | |
| 10.24 | McMoRan Exploration Co. Executive Services Program (Incorporated by reference to Exhibit 10.8 to McMoRan’s May 1, 2006 Form 8-K). |
| 10.25 | McMoRan Form of Notice of Grants of Nonqualified Stock Options and Limited Rights under the 2003 Stock Incentive Plan. (Incorporated by reference to Exhibit 10.24 to McMoRan’s Second-Quarter 2005 Form 10-Q). |
| | |
| 10.26 | McMoRan Form of Restricted Stock Unit Agreement Under the 2003 Stock Incentive Plan. (Incorporated by reference to Exhibit 10.25 to McMoRan’s Second-Quarter 2005 Form 10-Q). |
| | |
| 10.27 | McMoRan 2004 Director Compensation Plan. (Incorporated by reference to Exhibit 10.29 to McMoRan’s Second-Quarter 2004 Form 10-Q). |
| | |
| 10.28 | Form of Amendment No. 1 to Notice of Grant of Nonqualified Stock Options under the 2004 Director Compensation Plan. (Incorporated by reference to Exhibit 10.7 to McMoRan's May 1, 2006 Form 8-K). |
| | |
| 10.29 | Agreement for Consulting Services between Freeport-McMoRan Inc. and B. M. Rankin, Jr. effective as of January 1, 1991)(assigned to FM Services Company as of January 1, 1996); as amended on December 15, 1997 and on December 7, 1998. (Incorporated by reference to Exhibit 10.32 to McMoRan’s 1998 Form 10-K). |
| | |
| 10.30 | Supplemental Letter Agreement between FM Services Company and B.M. Rankin, Jr. effective as of January 1, 2006. (Incorporated by reference to Exhibit 10.28 to McMoRan’ 2005 Form 10-K). |
| | |
| 10.31 | McMoRan Director Compensation. (Incorporated by reference to Exhibit 10.27 to McMoRan’s 2004 Form 10-K). |
| | |
| 10.32 | McMoRan Exploration Co. 2005 Stock Incentive Plan. (Incorporated by reference to Exhibit 10.1 to McMoRan’s May 1, 2006 Form 8-K). |
| | |
| 10.33 | Form of Notice of Grant of Nonqualified Stock Options under the 2005 Stock Incentive Plan. (Incorporated by reference to Exhibit 10.2 to McMoRan’s Current Report on Form 8-K filed May 6, 2005). |
| | |
| 10.34 | Form of Restricted Stock Unit Agreement under the 2005 Stock Incentive Plan. (Incorporated by reference to Exhibit 10.3 to McMoRan’s Current Report on Form 8-K filed May 6, 2005). |
| Letter dated May 1, 2006 from Ernst & Young LLP regarding unaudited interim financial statements. |
| | |
| Certification of Principal Executive Officer pursuant to Rule 13a-14(a)/15d-14(a). |
| | |
| Certification of Principal Financial Officer pursuant to Rule 13a-14(a)/15d-14(a). |
| | |
| Certification of Principal Executive Officer pursuant to 18 U.S.C. Section 1350. |
| | |
| Certification of Principal Financial Officer pursuant to 18 U.S.C. Section 1350. |
| | |