| |
UNITED STATES |
SECURITIES AND EXCHANGE COMMISSION |
Washington, D.C. 20549 |
| |
FORM 10-Q |
| |
(Mark One) |
[X] | QUARTERLY REPORT PURSUANT TO SECTION 13 OR 15(d) OF THE |
SECURITIES EXCHANGE ACT OF 1934 |
For the quarterly period ended September 30, 2007 |
OR |
[ ] | TRANSITION REPORT PURSUANT TO SECTION 13 OR 15(d) OF THE |
SECURITIES EXCHANGE ACT OF 1934 |
For the transition period from | | to |
Commission File Number: 001-07791 |
| |
|
| |
McMoRan Exploration Co. |
| (Exact name of registrant as specified in its charter) |
| |
Delaware | 72-1424200 |
(State or other jurisdiction of incorporation or organization) | (IRS Employer Identification No.) |
| | |
1615 Poydras Street | |
New Orleans, Louisiana* | 70112 |
| (Address of principal executive offices) | (Zip Code) |
| |
| |
(504) 582-4000 |
| (Registrant's telephone number, including area code) |
| |
Indicate by check mark whether the registrant (1) has filed all reports required to be filed by Section 13 or 15(d) of the Securities Exchange Act of 1934 during the preceding 12 months (or for such shorter period that the registrant was required to file such reports), and (2) has been subject to such filing requirements for the past 90 days. S Yes ÿ No
Indicate by check mark whether the registrant is a large accelerated filer, an accelerated filer, or a non-accelerated filer. See definition of “accelerated filer and large accelerated filer” in Rule 12b-2 of the Exchange Act (Check one): Large accelerated filer ÿ Accelerated filer S Non-accelerated filer ÿ
Indicate by check mark whether the registrant is a shell company (as defined in Rule 12b-2 of the Securities and Exchange Act of 1934). ÿ Yes S No
On September 30, 2007, there were issued and outstanding 34,693,060 shares of the registrant’s Common Stock, par value $0.01 per share.
| |
McMoRan Exploration Co. |
|
| |
| | Page |
| | |
| |
| | |
| |
| | |
| 3 |
| | |
| 4 |
| | |
| 5 |
| | |
| 6 |
| | |
| 15 |
| | |
| |
| 16 |
| | |
| 30 |
| | |
| 30 |
| | |
| 31 |
| | |
| 39 |
| | |
| E-1 |
Table of Contents
McMoRan Exploration Co.
| | September 30, | | December 31, | |
| | 2007 | | 2006 | |
| | (In Thousands) | |
| ASSETS | | | | | | |
| Cash and cash equivalents | $ | 16,319 | | $ | 17,830 | |
| Restricted investments | | 3,019 | | | 5,930 | |
| Accounts receivable | | 121,734 | | | 45,636 | |
| Inventories | | 14,461 | | | 25,034 | |
| Prepaid expenses | | 22,053 | | | 16,190 | |
| Fair value of oil & gas derivative contracts | | 9,872 | | | - | |
| Current assets from discontinued operations, including restricted cash of | | | | | | |
| $0.5 million and $0.4 million, respectively | | 3,007 | | | 6,492 | |
| Total current assets | | 190,465 | | | 117,112 | |
| Property, plant and equipment, net | | 1,571,014 | | | 282,538 | |
| Sulphur business assets | | 352 | | | 362 | |
| Restricted investments and cash | | 3,288 | | | 3,288 | |
| Fair value of oil and gas derivative contracts | | 8,964 | | | - | |
Other assets, including unamortized deferred financing costs of $32.5 million at September 30, 2007 and $5.3 million at December 31, 2006 | | 32,507 | | | 5,377 | |
| Total assets | $ | 1,806,590 | | $ | 408,677 | |
| | | | | | | |
| LIABILITIES AND STOCKHOLDERS’ DEFICIT | | | | | | |
| Accounts payable | $ | 103,907 | | $ | 85,504 | |
| Accrued liabilities | | 103,475 | | | 32,844 | |
| 6% convertible senior notes | | 100,870 | | | - | |
| Other short term borrowings | | 18,664 | | | - | |
| Accrued interest and dividends payable | | 18,275 | | | 5,479 | |
| Current portion of accrued oil and gas reclamation costs | | 52,456 | | | 2,604 | |
| Current portion of accrued sulphur reclamation costs | | 11,490 | | | 12,909 | |
| Fair value of oil and gas derivative contracts | | 2,154 | | | - | |
| Current liabilities from discontinued operations | | 2,252 | | | 3,678 | |
| Total current liabilities | | 413,543 | | | 143,018 | |
| Unsecured bridge loan facility | | 800,000 | | | - | |
| Senior secured revolving credit facility | | 313,000 | | | 28,750 | |
| 5¼% convertible senior notes | | 115,000 | | | 115,000 | |
| 6% convertible senior notes | | - | | | 100,870 | |
| Accrued oil and gas reclamation costs | | 224,176 | | | 23,272 | |
| Accrued sulphur reclamation costs | | 11,489 | | | 10,185 | |
| Contractual postretirement obligation | | 10,633 | | | 9,831 | |
| Other long-term liabilities | | 18,686 | | | 17,151 | |
| Mandatorily redeemable convertible preferred stock | | - | | | 29,043 | |
| Stockholders' deficit | | (99,937 | ) | | (68,443 | ) |
| Total liabilities and stockholders' deficit | $ | 1,806,590 | | $ | 408,677 | |
| | | | | | | |
The accompanying notes are an integral part of these condensed consolidated financial statements.
McMoRan EXPLORATION CO.
| | Three Months Ended | | Nine Months Ended | |
| | September 30, | | September 30, | |
| | 2007 | | 2006 | | 2007 | | 2006 | |
| Revenues: | (In Thousands, Except Per Share Amounts) | |
| Oil and gas | $ | 131,018 | | $ | 57,810 | | $ | 227,381 | | $ | 143,527 | |
| Service | | 2,234 | | | 2,605 | | | 2,916 | | | 9,964 | |
| Total revenues | | 133,252 | | | 60,415 | | | 230,297 | | | 153,491 | |
| Costs and expenses: | | | | | | | | | | | | |
| Production and delivery costs | | 38,197 | | | 17,467 | | | 72,543 | | | 39,001 | |
| Depreciation and amortization | | 85,014 | | | 26,030 | | | 127,579 | | | 44,304 | |
| Exploration expenses | | 37,060 | | | 23,399 | | | 52,163 | | | 50,776 | |
| General and administrative expenses | | 6,992 | | | 4,078 | | | 17,804 | | | 16,624 | |
| Gain on oil & gas derivative contracts | | (10,695 | ) | | - | | | (10,695 | ) | | - | |
| Start-up costs for Main Pass Energy Hub™ | | 2,345 | | | 3,160 | | | 7,802 | | | 7,911 | |
| Insurance recovery | | - | | | - | | | - | | | (2,856 | ) |
| Total costs and expenses | | 158,913 | | | 74,134 | | | 267,196 | | | 155,760 | |
| Operating loss | | (25,661 | ) | | (13,719 | ) | | (36,899 | ) | | (2,269 | ) |
| Interest expense | | (22,887 | ) | | (2,694 | ) | | (34,296 | ) | | (6,840 | ) |
| Other income (expense), net | | (2,457 | ) | | 284 | | | (876 | ) | | (2,315 | ) |
| Loss from continuing operations before income taxes | | (51,005 | ) | | (16,129 | ) | | (72,071 | ) | | (11,424 | ) |
| Provision for income taxes | | - | | | - | | | - | | | - | |
| Loss from continuing operations | | (51,005 | ) | | (16,129 | ) | | (72,071 | ) | | (11,424 | ) |
| Income (loss) from discontinued operations | | (1,179 | ) | | (2,459 | ) | | 50 | | | (5,752 | ) |
| Net loss | | (52,184 | ) | | (18,588 | | | (72,021 | ) | | (17,176 | ) |
| Preferred dividends and amortization of convertible | | | | | | | | | | | | |
| preferred stock issuance costs | | - | | | (404 | ) | | (1,552 | ) | | (1,211 | ) |
| Net loss applicable to common stock | $ | (52,184 | ) | $ | (18,992 | ) | $ | (73,573 | ) | $ | (18,387 | ) |
| | | | | | | | | | | | | |
| Basic and diluted net loss per share of common stock: | | | | | | | | | | | | |
| Continuing operations | | $(1.47 | ) | | $(0.58 | ) | | $(2.40 | ) | | $(0.45 | ) |
| Discontinued operations | | (0.03 | ) | | (0.09 | ) | | 0.00 | | | (0.21 | ) |
| Net loss per share of common stock | | $(1.50 | ) | | $(0.67 | ) | | $(2.40 | ) | | $(0.66 | ) |
| | | | | | | | | | | | | |
| Basic and diluted average common shares outstanding | | 34,693 | | | 28,302 | | | 30,644 | | | 27,805 | |
The accompanying notes are an integral part of these consolidated financial statements.
McMoRan EXPLORATION CO.
| | | Nine Months Ended | |
| | | September 30, | |
| | | 2007 | | 2006 | |
| | | (In Thousands) | |
Cash flow from operating activities: | | | | | | | |
| Net loss | | $ | (72,021 | ) | $ | (17,176 | ) |
| Adjustments to reconcile net loss to net cash provided by | | | | | | | |
| operating activities: | | | | | | | |
| (Income) loss from discontinued operations | | | (50 | ) | | 5,752 | |
| Depreciation and amortization | | | 127,579 | | | 44,304 | |
| Exploration drilling and related expenditures | | | 21,663 | | | 32,941 | |
| Compensation expense associated with stock-based awards | | | 10,905 | | | 13,757 | |
| Amortization of deferred financing costs | | | 4,441 | | | 1,417 | |
| Gain on commodity hedging contracts | | | (10,695 | ) | | - | |
| Loss on conversions of convertible senior notes | | | - | | | 4,301 | |
| Reclamation expenditures | | | (4,186 | ) | | (543 | ) |
| Purchase of oil and gas derivative contracts and other | | | (4,716 | ) | | 892 | |
| Decrease in restricted cash | | | - | | | 278 | |
| Decrease (increase) in working capital: | | | | | | | |
| Accounts receivable | | | (72,533 | ) | | 6,656 | |
| Accounts payable, accrued liabilities and other | | | 78,632 | | | 16,472 | |
| Inventories and prepaid expenses | | | 23,375 | | | (38,550 | ) |
| Net cash provided by continuing operations | | | 102,394 | | | 70,501 | |
| Net cash provided by (used in) discontinued operations | | | 673 | | | (5,805 | ) |
| Net cash provided by operating activities | | | 103,067 | | | 64,696 | |
| | | | | | | | |
Cash flow from investing activities: | | | | | | | |
| Exploration, development and other capital expenditures | | | (109,165 | ) | | (202,889 | ) |
| Acquisition of Newfield properties, net | | | (1,051,302 | ) | | - | |
| Property insurance reimbursement | | | - | | | 3,947 | |
| Proceeds from restricted investments | | | 3,037 | | | 13,463 | |
| Proceeds from sale of property, plant and equipment | | | - | | | 50 | |
| Increase in restricted investments | | | (126 | ) | | (141 | ) |
| Net cash used in continuing operations | | | (1,157,556 | ) | | (185,570 | ) |
| Net cash from discontinued operations | | | - | | | - | |
| Net cash used in investing activities | | | (1,157,556 | ) | | (185,570 | ) |
| | | | | | | | |
Cash flow from financing activities: | | | | | | | |
| Net borrowings under senior secured revolving credit facility | | | 284,250 | | | 5,000 | |
| Proceeds from unsecured bridge loan facility | | | 800,000 | | | - | |
| Financing costs | | | (31,216 | ) | | (531 | ) |
| Payments for induced conversion of convertible senior notes | | | - | | | (4,301 | ) |
| Dividends paid on convertible preferred stock | | | (1,121 | ) | | (1,121 | ) |
| Proceeds from exercise of stock options and other | | | 1,065 | | | 389 | |
| Net cash provided by (used in) continuing operations | | | 1,052,978 | | | (564 | ) |
| Net cash from discontinued operations | | | - | | | - | |
| Net cash provided by (used in) financing activities | | | 1,052,978 | | | (564 | ) |
| Net decrease in cash and cash equivalents | | | (1,511 | ) | | (121,438 | ) |
| Cash and cash equivalents at beginning of year | | | 17,830 | | | 130,901 | |
| Cash and cash equivalents at end of period | | $ | 16,319 | | $ | 9,463 | |
The accompanying notes are an integral part of these consolidated financial statements.
McMoRan EXPLORATION CO.
1. BASIS OF PRESENTATION
The consolidated financial statements of McMoRan Exploration Co. (McMoRan), a Delaware Corporation, are prepared in accordance with U.S. generally accepted accounting principles. The consolidated financial statements of McMoRan include the accounts of those subsidiaries where McMoRan directly or indirectly has more than 50 percent of the voting rights and for which the right to participate in significant management decisions is not shared with other shareholders. McMoRan consolidates its wholly owned McMoRan Oil & Gas LLC (MOXY) and Freeport-McMoRan Energy LLC (Freeport Energy) subsidiaries. MOXY conducts all of McMoRan’s oil and gas operations while Freeport Energy is pursuing plans for the development of liquefied natural gas (LNG) facilities and natural gas storage capabilities at the Main Pass Energy Hub (MPEH™) project. As a result of McMoRan’s exit from the sulphur business in 2002, its sulphur results are presented as discontinued operations and the major classes of assets and liabilities related to the sulphur business are separately shown for the periods presented.
The accompanying unaudited consolidated financial statements should be read in conjunction with the McMoRan consolidated financial statements and notes contained in its 2006 Annual Report on Form 10-K. The information furnished herein reflects all adjustments which are, in the opinion of management, necessary for a fair presentation of the results for the periods presented. All such adjustments are, in the opinion of management, of a normal recurring nature. Certain reclassifications of prior year amounts have been made to conform to the current year presentation.
On August 6, 2007, MOXY completed an acquisition of oil and gas properties with an effective date of July 1, 2007 (Note 2). McMoRan’s consolidated financial statements include the results of the operations from the acquired properties prospectively from the August 6, 2007 closing date. The results of operations from the acquired properties from the July 1, 2007 effective date through the August 6, 2007 closing date are reflected as a purchase price adjustment within property, plant and equipment in the accompanying condensed consolidated balance sheet at September 30, 2007.
2. ACQUISITION OF GULF OF MEXICO SHELF PROPERTIES
On August 6, 2007, MOXY completed the acquisition of substantially all of the proved oil and gas property interests and related assets of Newfield Exploration Company (Newfield) on the outer continental shelf of the Gulf of Mexico for total cash consideration of $1.08 billion and assumption of the related reclamation obligations. McMoRan also acquired 50 percent of Newfield’s interests in nonproducing exploration leases on the Gulf of Mexico shelf and a majority of Newfield’s interests in the inventory of leases associated with the Treasure Island ultra deep prospect. McMoRan funded the acquisition by borrowing $800 million under an unsecured bridge loan facility (bridge loan) and $394 million under a senior secured revolving credit facility (credit facility) (Note 3).
At September 30, 2007, the purchase price reflects a reduction of $31.8 million to reflect the net cash flows of the acquired properties for the period from the July 1, 2007 effective date to the August 6, 2007 (Note 1). The purchase price allocation at September 30, 2007 is preliminary and remains subject to potential additional post-closing adjustments pending completion of certain valuation estimates currently in progress (see below). The purchase price is scheduled to be finalized by February 2, 2008.
The allocation of the initial purchase price to the acquired assets and liabilities is based on McMoRan’s preliminary valuation estimates. These allocations will be finalized based on valuation and other studies to be completed by McMoRan with the assistance of certain third party valuation specialists. As a result, the final adjusted purchase price and purchase price allocations may differ, possibly materially, from that presented below. The following table summarizes the estimated fair values of the assets acquired and liabilities assumed at the date of acquisition (August 6, 2007).
| Cash paid for acquired assets at closing (August 6, 2007) | $ | 1,076,286 | |
| Estimated oil & gas reclamation costs | | 255,000 | |
| Net assets acquired at closing | | 1,331,286 | |
| Post closing adjustments | | (31,768 | ) |
| Other acquisition related costs | | 6,784 | |
| Net assets acquired | $ | 1,306,302 | |
The following unaudited pro forma financial information assumes MOXY acquired the properties from Newfield effective January 1, 2007 and 2006, respectively for the periods presented (amounts in thousands, except for per share data).
| | Three Months Ended | | | Nine Months Ended | |
| | September 30, | | | September 30, | |
| | 2007 | | 2006 | | | 2007 | | 2006 | |
| Revenues | $ | 202,753 | | $ | 223,257 | | | $ | 637,680 | | $ | 621,826 | |
| Operating income | | 11,818 | | | 72,743 | | | | 68,811 | | | 248,390 | |
| Net income (loss) | | (25,695 | ) | | 38,021 | | | | (37,479 | ) | | 140,699 | |
| Basic net income (loss) per share of common stock | | $(0.74 | ) | | $1.34 | | | | $(1.22 | ) | | $5.06 | |
| Diluted net income (loss) per share of common stock | | $(0.74 | ) | | $0.79 | | | | $(1.22 | ) | | $2.90 | |
3. LONG TERM DEBT
McMoRan’s long-term debt is summarized below.
| | September 30, | | December 31, | |
| | 2007 | | 2006 | |
| | (in thousands) | |
| Unsecured bridge loan facility | $ | 800,000 | | $ | - | |
| Senior secured revolving credit facility | | 313,000 | | | 28,750 | |
| 5¼% convertible senior notes | | 115,000 | | | 115,000 | |
| 6% convertible senior notes | | 100,870 | | | 100,870 | |
| Other | | 18,664 | | | - | |
| Total debt | | 1,347,534 | | | 244,620 | |
| Less current maturities | | (119,534 | ) | | - | |
| Long-term debt | $ | 1,228,000 | | $ | 244,620 | |
As discussed below, on August 6, 2007, McMoRan entered into two separate financing agreements to fund the acquisition of the Newfield properties (Notes 1 and 2).
Unsecured Bridge Loan Facility. At the closing of the acquisition of the Newfield properties, McMoRan entered into a $800 million bridge loan facility, which matures on August 6, 2008, at which time the related amounts due would be convertible into exchange notes due in 2014. If the bridge loan facility remains outstanding for 120 days, the lenders are entitled to receive a second lien in the collateral securing the senior secured revolving credit facility (see below). The interest rate on the bridge loan was set at 9.9 percent, and increases 0.5 percent every 90 days, with McMoRan’s minimum rate payable being 10 percent and the maximum being 12 percent. Interest under the bridge loan facility is currently accruing at 10 percent. Interest expense on the bridge loan facility totaled $12.8 million for the periods presented in 2007, including $0.4 million of amortization expense associated with the related deferred financing costs.
On October 25, 2007, McMoRan commenced a public offering of approximately 11 million shares of common stock. McMoRan also concurrently commenced a public offering of 1.5 million shares of mandatory convertible preferred stock with an offering price of $100 per share. McMoRan intends to use the net proceeds from these offerings to repay a portion of its indebtedness under the $800 million bridge loan facility used to partially fund the acquisition of the oil and gas properties from Newfield (Note 2). McMoRan also intends to conduct a notes offering, the proceeds of which will be used to repay the remaining portion of amounts outstanding under the bridge loan facility. Upon completion of any of these planned refinancing transactions, McMoRan would be required to charge a pro rata amount of the remaining $17.9 million of unamortized deferred financing costs associated with the unsecured bridge loan facility to interest expense.
Senior Secured Revolving Credit Facility. McMoRan also amended and restated its senior secured revolving credit facility (credit facility) in conjunction with the acquisition of oil and gas properties from Newfield. The credit facility provides for up to $700 million of borrowings, is secured by substantially all of our oil and gas properties, and matures on August 6, 2012. Availability under the credit facility is subject to a borrowing base, initially set at $700 million and subject to redetermination by the lenders semi-annually on April 1 and October 1 of each year. The credit facility is also subject to reductions in the commitment of $60 million per quarter beginning in the fourth quarter of 2007 and continuing through the fourth quarter of 2008 ($300 million in the aggregate). At September 30, 2007, McMoRan had borrowings of $313 million and $100 million in letters of credit issued under the credit facility. The letters of credit support the reclamation obligations assumed in the acquisition of the Newfield properties. At September 30, 2007, McMoRan’s availability for additional borrowings under the credit facility totaled $287 million. Total borrowings under the facility totaled $293 million at October 30, 2007. Interest on the credit facility currently accrues at LIBOR plus
2 percent, subject to increases or decreases based on usage as a percentage of the borrowing base. The credit facility contains representations and affirmative and negative covenants, and other restrictions customary for oil and gas borrowing base credit facilities. The average interest rate on borrowings under the credit facility was 7.9 percent during the third quarter of 2007. For the three months ended September 30, 2007, interest expense on the credit facility totaled $5.0 million including $0.6 million of commitment fees and amortization of related deferred financing costs. For the nine months ended September 30, 2007, interest expense totaled $6.0 million, including $1.4 million of commitment fees and amortization of related deferred financing costs.
5¼% Convertible Senior Notes. During 2004, McMoRan completed a private placement of $140 million of 5¼% convertible senior notes due October 6, 2011. The notes are convertible at the option of the holder at any time prior to maturity into shares of McMoRan’s common stock at a conversion price of $16.575 per share. For more information regarding McMoRan’s 5¼% convertible senior notes see Note 4 below and Note 5 of its 2006 Form 10-K.
6% Convertible Senior Notes. During 2003, McMoRan completed a private placement of $130 million of 6% convertible senior notes due July 2, 2008. The notes are convertible at the option of the holder at any time prior to maturity into shares of McMoRan’s common stock at a conversion price of $14.25 per share. In July 2007, McMoRan classified the $100.9 million amount outstanding on the notes as current debt. In 2006, a portion of then outstanding balances on these senior notes were converted to equity through privately negotiated transactions (see Note 5 of McMoRan’s 2006 Form 10-K). McMoRan intends to consider opportunities to negotiate additional conversion transactions in the future. Absent any further conversion transactions, McMoRan’s believes that it will be able to meet the repayment requirements under the 6% convertible senior notes in July 2008 through use of operating cash flows and the availability under the credit facility or other refinancing transactions. For more information regarding McMoRan’s 6% convertible senior notes see Note 4 below and Note 5 of its 2006 Form 10-K.
Senior Secured Term Loan. Effective January 19, 2007, MOXY entered into a Senior Term Loan Agreement (term loan). McMoRan repaid the term loan simultaneously with the completion of its Gulf of Mexico property acquisition transaction (Note 2). McMoRan paid a $3.0 million prepayment premium to prepay and terminate the term loan. This premium is reflected as a charge to non operating expense in McMoRan’s statement of operations in the third quarter of 2007. Interest expense on the term loan totaled $3.4 million and $9.3 million for the three and nine-months ended September 30, 2007, respectively, including amortization of related deferred financing costs of $2.1 million and $2.3 million, respectively.
4. EARNINGS PER SHARE
Basic net loss per share of common stock was calculated by dividing the net loss applicable to continuing operations, net income (loss) from discontinued operations and net loss applicable to common stock by the weighted-average number of common shares outstanding during the periods presented. For purposes of the earnings per share computations, the net loss applicable to continuing operations includes preferred stock dividends and amortization of the related issuance costs.
McMoRan had a net loss from continuing operations for the third quarter and nine months ended September 30, 2007 and 2006. Accordingly, McMoRan’s diluted per share calculation for these periods is the same as its basic net loss per share calculation because it excludes the assumed exercise of stock options and stock warrants whose exercise prices were less than the average market price of McMoRan’s common stock during these periods, as well as the assumed conversion of McMoRan’s 6% convertible senior notes and 5¼% convertible senior notes. The excluded common share amounts are summarized below (in thousands):
| | Third Quarter | | Nine Months | |
| | 2007 | | | 2006 | | 2007 | | | 2006 | |
In-the-money stock options a,b | | 709 | | | | 748 | | | 663 | | | | 937 | |
Stock warrants a,c | | 1,550 | | | | 1,781 | | | 1,538 | | | | 1,785 | |
6% convertible senior notes d | | 7,079 | | | | 7,079 | | | 7,079 | | | | 7,079 | |
5¼% convertible senior notes e | | 6,938 | | | | 6,938 | | | 6,938 | | | | 6,938 | |
| 5% mandatorily redeemable convertible | | | | | | | | | | | | | | |
preferred stock f | | - | | | | 6,205 | | | - | | | | 6,205 | |
| a. | McMoRan uses the treasury stock method to determine the amount of in-the-money stock options and stock warrants to include in its diluted earnings per share calculation. |
| b. | Represents stock options with an exercise price less than the average market price for McMoRan’s common stock for the periods presented. |
| c. | Includes stock warrants issued in December 2002 (1.74 million shares) and September 2003 (0.76 million shares). The warrants are exercisable for McMoRan common stock at any time over their respective five-year terms at an exercise price of $5.25 per share. See Note 4 of McMoRan’s 2006 Form 10-K for additional information. |
| d. | Net interest expense on the 6% convertible senior notes totaled $1.6 million during the third quarter of 2007, $1.2 million during the third quarter of 2006 and $4.7 million and $3.3 million for the nine-month periods ended September 30, 2007 and 2006, respectively. For additional information see Note 3 above and Note 5 of McMoRan’s 2006 Form 10-K. |
| e. | Net interest expense on the 5¼% convertible senior notes totaled $1.5 million for the third quarter of 2007, $1.1 million during the third quarter of 2006 and $4.4 million and $2.9 million for the nine months ended September 30, 2007 and 2006, respectively. For additional information see Note 3 above and Note 5 of McMoRan’s 2006 Form 10-K. |
| f. | All of the remaining shares of McMoRan convertible preferred stock were converted into approximately 6.2 million common shares in the second quarter of 2007 (see Note 3 of McMoRan’s Form 10-Q for the period ending June 30, 2007). For additional information see Note 6 of McMoRan’s 2006 Form 10-K. |
Outstanding stock options excluded from the computation of diluted net loss per share of common stock because their exercise prices were greater than the average market price of the common stock during the periods presented are as follows:
| | | Third Quarter | | | Nine Months | |
| | | 2007 | | | 2006 | | | 2007 | | | 2006 | |
| Outstanding options (in thousands) | | | 5,378 | | | | 2,133 | | | | 5,378 | | | | 2,133 | |
| Average exercise price | | $ | 17.38 | | | $ | 19.85 | | | $ | 17.38 | | | $ | 19.85 | |
5. STOCK-BASED COMPENSATION
Accounting for Stock-Based Compensation. As of September 30, 2007, McMoRan had eight stock-based employee compensation plans and director compensation plans, all of which have been approved by McMoRan’s shareholders (see Note 8 of McMoRan’s 2006 Form 10-K). On January 1, 2006, McMoRan adopted the fair value recognition provisions of SFAS No. 123 (revised 2004), “Share-Based Payment” (SFAS No. 123R), using the modified prospective transition method. For more information regarding McMoRan’s accounting for stock-based awards see Note 1 of McMoRan’s 2006 Form 10-K.
Stock-Based Compensation Cost. Compensation costs charged to expense for stock-based awards are shown below (in thousands).
| | Three Months Ended | | | Nine Months Ended | |
| | September 30, | | | September 30, | |
| | 2007 | | 2006 | | | 2007 | | 2006 | |
| Cost of options awarded to employees (including | | | | | | | | | | | | | |
| Directors) | $ | 2,007 | | $ | 1,912 | | | $ | 10,382 | a | $ | 13,174 | a |
| Cost of options awarded to non-employees and | | | | | | | | | | | | | |
| advisory directors | | 133 | | | 112 | | | | 492 | | | 495 | |
| Cost of restricted stock units | | 25 | | | 18 | | | | 31 | | | 88 | |
| Total compensation cost | $ | 2,165 | | $ | 2,042 | | | $ | 10,905 | | $ | 13,757 | |
| a. | Includes compensation charges associated with immediately vested stock options totaling $4.4 million for the nine months ended September 30, 2007 and $7.7 million for the nine months ended September 30, 2006. These compensation costs include the stock options granted to McMoRan’s Co-Chairmen in lieu of receiving any cash compensation during the respective periods (see “Stock Options” below) and the compensation costs related to stock options granted to retiree-eligible employees, which resulted in one-year’s compensation expense being immediately recognized at the date of the stock option grant. |
Stock-Based Compensation Plans. In January 2007, McMoRan granted 1,323,500 stock options under its existing employee compensation plans. Consequently, it currently has less than 0.1 million options available for grant under these plans.
Awards granted under all of the plans generally expire 10 years after the date of grant and vest in 25 percent annual increments beginning one year from the date of grant. The plans provide for employees to be eligible for the following year’s vesting upon retirement and provide for accelerated vesting if there is a
change in control (as defined in the plans). Restricted stock unit grants vest over three years and are valued on the date of grant.
Stock Options. A summary of stock options outstanding as of September 30, 2007 and changes during the nine months ended September 30, 2007 follows:
| | | | | | Weighted | | | |
| | | | Weighted | | Average | | Aggregate | |
| | Number | | Average | | Remaining | | Intrinsic | |
| | Of | | Option | | Contractual | | Value | |
| | Options | | Price | | Term (years) | | ($000) | |
| Balance at January 1 | 7,095,991 | | $ | 15.50 | | | | | | |
| Granted | 1,353,250 | | | 12.29 | | | | | | |
| Exercised | (213,695 | ) | | 8.37 | | | | | | |
| Expired/Forfeited | (383,633 | ) | | 18.27 | | | | | | |
| Balance at September 30 | 7,851,913 | | | 15.01 | | 6.5 | | $ | 117,836 | |
| Vested and exercisable at | | | | | | | | | | |
| September 30 | 5,732,663 | | | | | 5.7 | | $ | 84,444 | |
| | | | | | | | | | | |
The fair value of each option award is estimated on the date of grant using a Black-Scholes-Merton option valuation model. Expected volatility is based on implied volatilities from the historical volatility of McMoRan’s stock and to a lesser extent on traded options on McMoRan stock. McMoRan uses historical data to estimate option exercise, forfeitures and expected life of the options. When appropriate, employees who have similar historical exercise behavior are grouped together for valuation purposes. The risk-free interest rate is based on Federal Reserve rates in effect for bonds with maturity dates equal to the expected term of the option at the date of grant. McMoRan has not paid, and has no current plan to pay, cash dividends on its common stock. The assumptions used to value stock option awards during the three months and nine months ended September 30, 2007 and September 30, 2006 are noted in the following table:
| | Three Months | | Nine Months | |
| | 2007a | | 2006 | | 2007 | | 2006 | |
| Fair Value (per share) of stock option on grant date | $ | n/a | | $ | 10.77 | | $ | 6.94 | b | | 11.85 | c |
| Expected and weighted average volatility | | n/a | | | 55.5 | % | | 52.23 | % | | 55.5 | % |
| Expected life of options (in years) | | n/a | | | 7 | | | 6.29 | b | | 7 | c |
| Risk-free interest rate | | n/a | | | 4.5 | % | | 4.76 | % | | 4.5 | % |
| a. | McMoRan did not grant stock options in the third quarter of 2007. McMoRan granted 33,000 restricted stock units in the third quarter of 2007 with an intrinsic value aggregating $0.5 million, which will be amortized over their three-year vesting period. |
| b. | Excludes stock options that were granted with immediate vesting (445,000 shares, including 400,000 shares granted to the Co-Chairmen in lieu of cash compensation for 2007) with an expected life of 6.56 years and fair value of stock options on grant date of $7.02 per share. |
| c. | Excludes stock options that were granted with immediately vested (500,000 shares granted to the Co-Chairmen in lieu of any cash compensation for 2006) with an expected life of six years and a grant date fair value of $11.52 per share. |
The total intrinsic value of options exercised during the nine months ended September 30, 2007 totaled $1.0 million. There were no stock options exercised during the third quarter of 2007. As of September 30, 2007, McMoRan had an approximate $12.6 million of total unrecognized compensation costs related to unvested stock options, which is expected to be recognized over a weighted average period of approximately 0.9 years.
6. DERIVATIVE CONTRACTS
In connection with the closing of the Newfield transaction and related financing, MOXY entered into derivative contracts for a portion of the anticipated production of the acquired properties for the years 2008 through 2010 as follows:
Table of Contents
| | Natural Gas Positions (million MMbtu) |
| | Open Swap Positions(a) | | Put Options(b) | | |
| | Annual | | Average | | Annual | | Average | | Total |
| | Volumes | | Swap Price(c) | | Volumes | | Floor(c) | | Volumes |
| 2008 | 16.4 | | $ | 8.60 | | 6.6 | | $ | 6.00 | | 23.0 |
| 2009 | 7.3 | | $ | 8.97 | | 3.2 | | $ | 6.00 | | 10.5 |
| 2010 | 2.6 | | $ | 8.63 | | 1.2 | | $ | 6.00 | | 3.8 |
| | Oil Positions (thousand bbls) |
| | Open Swap Positions(a) | | Put Options(b) | | |
| | Annual | | Average | | Annual | | Average | | Total |
| | Volumes | | Swap Price(d) | | Volumes | | Floor(d) | | Volumes |
| 2008 | 693 | | $ | 73.50 | | 288 | | $ | 50.00 | | 981 |
| 2009 | 322 | | $ | 71.82 | | 125 | | $ | 50.00 | | 447 |
| 2010 | 118 | | $ | 70.89 | | 50 | | $ | 50.00 | | 168 |
(a) Covering periods January-June and November-December of the respective years |
(b) Covering periods July-October of the respective years | | | |
(c) Price per MMbtu of natural gas | | | |
(d) Price per barrel of oil | | | |
These oil and gas derivative contracts were not designated as hedges for accounting purposes. Accordingly, these contracts are subject to mark-to-market fair value adjustments, the impact of which is recognized immediately in McMoRan’s operating results. McMoRan’s third-quarter 2007 results included a net unrealized gain of $10.7 million for mark-to-market accounting adjustments associated with these derivative contracts based on changes in their respective fair values through September 30, 2007. McMoRan records all gains and losses associated with its oil and gas derivative contracts on a separate line in the accompanying consolidated statement of operations, and any related cash effect is recorded within cash flows from operations within the related consolidated statements of cash flow. McMoRan believes the operating presentation of its derivative contracts is appropriate in both its statement of operations and statement of cash flow because the sale of oil and gas production represents the primary source of its operating income and cash flow. For the period ended September 30, 2007, McMoRan had no recognized gains or losses on its derivative contracts because none of its derivative contracts will begin settling until January 2008.
The original cost of the put options was approximately $4.6 million. At September 30, 2007, the fair value of the derivative contracts is as follows (in thousands):
| | Puts | | Swaps | | | | |
| | Gas | | Oil | | Gas | | Oil | | Total | |
| Current assets | $ | 1,535 | | $ | 88 | | $ | 8,249 | | $ | - | | $ | 9,872 | |
| Other assets | | 2,183 | | | 260 | | | 6,521 | | | - | | | 8,964 | |
| Current liabilities | | - | | | - | | | - | | | (2,154 | ) | | (2,154 | ) |
| Other long-term liabilities | | - | | | - | | | (281 | ) | | (1,104 | ) | | (1,385 | ) |
| Fair value of contracts | $ | 3,718 | | $ | 348 | | $ | 14,489 | | $ | (3,258 | ) | $ | 15,297 | |
7. ACCUMULATED COMPREHENSIVE LOSS
McMoRan did not have any items of other comprehensive income (loss) until it adopted SFAS 158 “Accounting for Defined Benefit and Other Postretirement Plans” on December 31, 2006 (see Note 8 of McMoRan’s 2006 Form 10-K). In applying the transition provisions of SFAS 158, McMoRan determined the adjustment to initially apply SFAS 158 was incorrectly included in total comprehensive loss for the year ended December 31, 2006. This presentation will be corrected in McMoRan’s future annual financial statement filings. McMoRan’s comprehensive loss for the three months and nine months ended September 30, 2007 is shown below (in thousands).
| | Three | | | Nine | |
| | Months | | | Months | |
| Net loss | $ | (52,184 | ) | | $ | (73,573 | ) |
| Other comprehensive income (loss): | | | | | | | |
| Amortization of minimum pension liability adjustment | | 14 | | | | 42 | |
| Total comprehensive loss | $ | (52,170 | ) | | $ | (73,531 | ) |
8. NEW ACCOUNTING STANDARDS
Accounting for Uncertainty in Income Taxes. Effective January 1, 2007, McMoRan adopted Financial Accounting Standards Board (FASB) Interpretation No. 48 “Accounting for Uncertainty in Income Taxes” (FIN 48). FIN 48 clarifies the accounting for income taxes by prescribing the minimum recognition threshold a tax position is required to meet before being recognized in the financial statements. FIN 48 also provides guidance on derecognition, measurement, classification, interest and penalties, accounting in interim periods, disclosure and transition. The adoption of FIN 48 had no effect on McMoRan’s financial statements.
As of January 1, 2007 and September 30, 2007, McMoRan had approximately $232.1 million and $257.1 million, respectively, of unrecognized tax benefits relating to its reported net losses and other temporary differences from operations. McMoRan has recorded a full valuation allowance on these deferred tax assets (see Note 9 of McMoRan’s 2006 Form 10-K). McMoRan’s effective tax rate would be reduced in future periods to the extent these deferred tax assets are recognized. Interest or penalties associated with income taxes are recorded as components of the provision for income taxes, although no such amounts have been recognized in the accompanying financial statements. Currently, McMoRan’s major taxing jurisdictions are the United States (federal) and Louisiana and McMoRan recently added a number of producing properties in Texas. Tax periods open to audit for McMoRan include federal income tax returns subsequent to 2003 and Louisiana income tax returns for calendar years subsequent to 2002.
Fair Value Measurements.
In September 2006, the FASB issued SFAS No. 157, “Fair Value Measurements.” SFAS No. 157 establishes a framework for measuring fair value in generally accepted accounting principles (GAAP), clarifies the definition of fair value within that framework, and expands disclosures about the use of fair value measurements. In many of its pronouncements, the FASB has previously concluded that fair value information is relevant to the users of financial statements and has required (or permitted) fair value as a measurement objective. However, prior to the issuance of this statement, there was limited guidance for applying the fair value measurement objective in GAAP. This statement does not require any new fair value measurements in GAAP. SFAS No. 157 is effective for fiscal years beginning after November 15, 2007, with early adoption allowed. McMoRan has not yet determined the impact, if any, that adopting this standard might have on its financial statements.
In February 2007, the FASB issued SFAS No. 159 “The Fair Value Option for Financial Assets and Liabilities – Including an amendment of FASB No. 115.” SFAS No. 159 permits entities to choose to measure many financial instruments and certain other items at fair value. This statement is effective for fiscal years beginning after November 15, 2007, with early adoption allowed. McMoRan has not yet determined the impact, if any, that adopting this standard might have on its financial statements.
9. OTHER MATTERS
Oil and Gas Activities
Since 2004, McMoRan has participated in 17 discoveries on 32 prospects that have been drilled and fully evaluated, including the results announced during the second quarter of 2007 at the Flatrock well located at South Marsh Island Block 212 and the Cottonwood Point well located at Vermilion Block 31. McMoRan has investments in three unevaluated wells totaling $65.2 million at September 30, 2007, including $22.5 million for the Blueberry Hill well at Louisiana State Lease 340, $13.1 million for the Mound Point South well and $29.6 million for the JB Mountain Deep well at South Marsh Island Block 224. In October 2007, the Mound Point South well was temporarily abandoned. McMoRan and its partners are considering future operations for this well, which will require the procurement of special tubulars for completion. McMoRan’s attempts in the second quarter of 2007 to clear the blockage above the perforated interval at the Blueberry Hill well were unsuccessful. McMoRan has elected to drill a sidetrack extension of this well to target Gyro sands. As previously reported, the Blueberry Hill well encountered four potentially productive hydrocarbon sands below 22,000 feet in February 2005. Testing of this well commenced in the fourth quarter of 2006 following receipt of special tubulars and casing for the high pressure well. Information obtained from the Blueberry Hill well coupled with the results from the Hurricane Deep well, expected to commence production in the fourth quarter of 2007, will be
incorporated into future plans for the JB Mountain Deep well as all three of these wells demonstrate similar geologic settings and are targeting deep Miocene sands equivalent in age.
The Pecos well located at West Pecan Island in Vermilion Parish, Louisiana commenced production in August 2006. Production rates subsequently decreased and in the first quarter of 2007 and McMoRan initiated remedial operations in an attempt to stimulate the well’s production. These efforts were unsuccessful and McMoRan subsequently recompleted the well to the upper productive interval. After producing and depleting the reserves from the upper productive zone, McMoRan will consider drilling a sidetrack well to recover additional identified potential reserves. McMoRan’s investment in the Pecos well totaled $6.9 million at September 30, 2007.
Spending commitments under a multi-year exploration program with a private partner were fulfilled in 2006, concluding the program. During the three months and nine months ended September 30, 2006, McMoRan’s management fees associated with its services to the multi-year exploration program totaled $2.0 million and $7.0 million, respectively, which are reflected as service revenues in the accompanying consolidated statement of operations. McMoRan is currently participating in the drilling of specific exploration wells under another exploration agreement. For more information regarding McMoRan’s exploration agreements see Note 2 of its 2006 Form 10-K.
The determination of oil and gas reserve estimates is a subjective process, and the accuracy of any reserve estimate depends on the quality of available data and the application of engineering and geological interpretation and judgment. Estimates of economically recoverable reserves and future net cash flows depend on a number of variable factors and assumptions that are difficult to predict and may vary considerably from actual results. In particular, reserve estimates for wells with limited or no production history are less reliable than those based on actual production. Subsequent evaluation of the same reserves may result in variations, which may be substantial, in estimated reserves and related estimates of future cash flows. If the capitalized costs of an individual oil and gas property exceed the related estimated future net cash flows, an impairment charge to reduce the capitalized costs to the property’s estimated fair value is required. For more information regarding the risks associated with the reserve estimation process see Item 1A. “Risk Factors” located in McMoRan’s 2006 Form 10-K.
Asset Impairment
McMoRan’s attempts to restore production from the Cane Ridge well at Louisiana State Lease 18055, located onshore in Vermilion Parish were unsuccessful during the third quarter of 2007. McMoRan has no future activities planned for the well. Accordingly, McMoRan recorded a charge of $13.6 million to depreciation, depletion and amortization expense to write off its remaining investment in the field.
Interest Cost
Interest expense excludes capitalized interest of $2.0 million in the third quarter of 2007 and $4.5 million for the nine months ended September 30, 2007. Capitalized interest totaled $1.3 million in the third quarter of 2006 and $4.3 million for the nine months ended September 30, 2006.
Inventories.
Product inventories totaled $0.9 million at September 30, 2007 and $1.1 million at December 31, 2006, consisting entirely of oil associated with operations at Main Pass Block 299. Materials and supplies inventory totaled $13.5 million at September 30, 2007 and $23.9 million at December 31, 2006, representing tubulars and other drilling supplies used in McMoRan’s drilling activities. The materials and supplies inventory will be partially reimbursed by third party participants in wells supplied with these materials. McMoRan’s inventories are stated at the lower of average cost or market. There have been no required reductions in the carrying value of McMoRan’s inventories for any of the periods presented.
Pension Plan
During 2000, McMoRan elected to terminate its defined benefit plan. The plan’s termination is pending approval from the Internal Revenue Service and the Pension Benefit Guaranty Corporation. McMoRan also provides certain health care and life insurance benefits (Other Benefits) to retired employees. For more information regarding these Pension and Other Benefit plans see Note 8 of McMoRan’s 2006 Form 10-K. The components of McMoRan’s net periodic pension (benefit) expense for the third quarter and nine months ended September 30, 2007 and 2006 follows (in thousands):
Table of Contents
| | | | Third Quarter | | | Nine Months | |
| | | | 2007 | | | 2006 | | | 2007 | | | 2006 | |
| Interest cost | | $ | 97 | | $ | 17 | | $ | 126 | | $ | 152 | |
| Service cost | | | - | | | - | | | - | | | - | |
| (Return) loss on plan assets | | | (25 | ) | | (28 | ) | | (72 | ) | | 9 | |
| Change in plan payout assumptions | | | - | | | - | | | - | | | - | |
| Net periodic expense (benefit) | | $ | 72 | | $ | (11 | ) | $ | 54 | | $ | 161 | |
The components of net periodic expense associated with McMoRan’s Other Benefits plan for the third quarter and nine months ended September 30, 2007 and 2006 follows (in thousands):
| | | | Third Quarter | | | Nine Months | |
| | | | 2007 | | | 2006 | | | 2007 | | | 2006 | |
| Interest cost | | $ | 86 | | $ | 85 | | $ | 258 | | $ | 255 | |
| Service cost | | | 5 | | | 5 | | | 14 | | | 15 | |
Return on plan assetsa | | | - | | | - | | | - | | | - | |
| Amortization of prior service costs | | | (10 | ) | | (12 | ) | | (30 | ) | | (36 | ) |
| Recognition of actuarial losses | | | 24 | | | 34 | | | 72 | | | 102 | |
| Net periodic expense | | $ | 105 | | $ | 112 | | $ | 314 | | $ | 336 | |
| a The Other Benefits plan has no assets held in trust. McMoRan pays benefits under the plan as payment is required. |
Accrued Reclamation Obligations
McMoRan follows SFAS No. 143 “Accounting for Asset Retirement Obligations” in determining amounts to record for the fair value of obligations associated with the removal of long-lived assets in the period they are incurred. For more information regarding McMoRan’s accounting for asset retirement obligations see Notes 1 and 11 of McMoRan’s 2006 Form 10-K. A summary of changes in McMoRan’s consolidated discounted asset retirement obligations (including both current and long-term obligations) since December 31, 2006 follows (in thousands):
Oil and Natural Gas | | | |
| Asset retirement obligation at beginning of year | $ | 25,876 | |
| Liabilities settled | | (10,613 | )a |
| Accretion expense | | 2,984 | |
| Liabilities assumed in Newfield property acquisition | | 255,000 | |
| Revision for changes in estimates | | 3,386 | b |
| Asset retirement obligations at September 30, 2007 | $ | 276,633 | |
| | | | |
Sulphur | | | |
| Asset retirement obligations at beginning of year: | $ | 23,094 | |
| Liabilities settled | | (1,419 | ) |
| Accretion expense | | 1,303 | |
| Revision for changes in estimates | | - | |
| Asset retirement obligation at September 30, 2007 | $ | 22,978 | |
| a. | Includes $6.4 million of costs included in accounts payable at September 30, 2007 for completed work. |
| b. | Reflects increases in the estimated reclamation costs at two fields. The work associated with the increase at one field has been completed ($0.7 million) and McMoRan expects all of the work at the other field to be completed over the next 12 months. |
10. RATIO OF EARNINGS TO FIXED CHARGES
McMoRan sustained losses from continuing operations totaling $72.1 million and $11.4 million for the nine months ended September 30, 2007 and 2006 which were inadequate to cover its fixed charges of $40.2 million and $11.1 million for the respective nine-month periods. For this calculation, earnings consist of income from continuing operations before income taxes and fixed charges. Fixed charges include interest and that portion of rent deemed representative of interest.
To the Board of Directors and Stockholders of McMoRan Exploration Co.:
We have reviewed the condensed consolidated balance sheet of McMoRan Exploration Co. (a Delaware corporation) as of September 30, 2007, and the related consolidated statements of operations for the three-month and nine-month periods ended September 30, 2007 and 2006, and the consolidated statements of cash flow for the nine-month periods ended September 30, 2007 and 2006. These financial statements are the responsibility of the Company’s management.
We conducted our review in accordance with the standards of the Public Company Accounting Oversight Board (United States). A review of interim financial information consists principally of applying analytical procedures and making inquiries of persons responsible for financial and accounting matters. It is substantially less in scope than an audit conducted in accordance with the standards of the Public Company Accounting Oversight Board, the objective of which is the expression of an opinion regarding the financial statements taken as a whole. Accordingly, we do not express such an opinion.
Based on our review, we are not aware of any material modifications that should be made to the condensed consolidated financial statements referred to above for them to be in conformity with U.S. generally accepted accounting principles.
We have previously audited in accordance with the standards of the Public Company Accounting Oversight Board (United States), the consolidated balance sheet of McMoRan Exploration Co. as of December 31, 2006, and the related consolidated statements of operations, cash flow and changes in stockholders’ deficit for the year then ended (not presented herein), and in our report dated March 12, 2007, we expressed an unqualified opinion on those consolidated financial statements. In our opinion, the information set forth in the accompanying condensed consolidated balance sheet as of December 31, 2006, is fairly stated, in all material respects, in relation to the consolidated balance sheet from which it has been derived.
/s/ ERNST & YOUNG LLP
New Orleans, Louisiana
October 30, 2007
OVERVIEW
In management’s discussion and analysis “we,” “us,” and “our” refer to McMoRan Exploration Co. and its wholly owned consolidated subsidiaries, McMoRan Oil & Gas LLC (MOXY) and Freeport-McMoRan Energy LLC (Freeport Energy). You should read the following discussions in conjunction with our consolidated financial statements, the related discussion and analysis of financial condition and results of operations and our discussion of “Business and Properties” in our Form 10-K for the year ended December 31, 2006 (2006 Form 10-K), filed with the Securities and Exchange Commission. The results of operations reported and summarized below are not necessarily indicative of future operating results. Unless otherwise specified, all references to Notes refers to Notes to Consolidated Financial Statements included elsewhere in this Form 10-Q.
We engage in the exploration, development and production of oil and natural gas offshore in the Gulf of Mexico and onshore in the Gulf Coast area. We have one of the largest acreage positions in the shallow waters of the Gulf of Mexico and Gulf Coast areas, which are our regions of focus. Our focused strategy enables us to efficiently use our strong base of geological, engineering and production experience in the area in which we have operated over the last 35 years. We also believe that our increased scale of operations in the Gulf of Mexico will provide synergies and an improved platform from which we will be able to pursue our business strategy. Our oil and gas operations are conducted through MOXY, our principal operating subsidiary. In addition to our oil and gas operations, we are pursuing the development of the Main Pass Energy Hubtm (MPEHtm) project for the development of an LNG regasification and storage facility through our other wholly owned subsidiary, Freeport Energy. We were previously engaged in mining of sulphur at Main Pass until August 2000 and discontinued other sulphur business activities in June 2002.
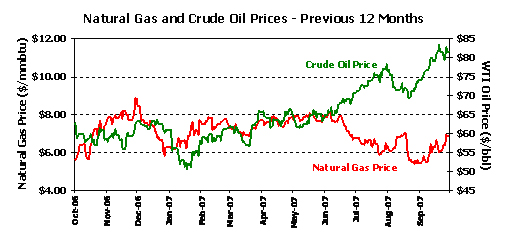
Natural gas prices averaged $6.25 per mmbtu in the third quarter of 2007 and currently approximate $8.02 per mmbtu. Natural gas prices were volatile during the quarter reflecting hurricane concerns in the Gulf of Mexico and storage level fluctuations. The market fundamentals for oil continue to be positive with prices in early October reaching new historical highs of over $90 per barrel. Oil prices reflect the potential for supply disruptions and tightening oil inventory balances. The average price for crude oil was in excess of $75 per barrel in the third quarter of 2007 and currently approximates $90.38 per barrel. Future oil and natural gas prices are subject to change and these changes are not within our control (see Item 1A. “Risk Factors” of our 2006 Form 10-K). Our average realizations during the third quarter of 2007 were $6.17 per thousand cubic feet (Mcf) of natural gas and $75.08 per barrel for oil, including the sale of sour crude oil produced at Main Pass and Garden Banks Block 625.
GULF OF MEXICO PROPERTY ACQUISITION
On August 6, 2007, we completed the acquisition of substantially all of the proved property interests and related assets of Newfield Exploration Company (Newfield) on the outer continental shelf of the Gulf of Mexico for total cash consideration of approximately $1.1 billion and the assumption of the related reclamation obligations. This acquisition had an effective date of July 1, 2007. We have reduced the purchase price by $31.8 million to reflect the net cash flows of the acquired properties from the July 1, 2007 effective date to the August 6, 2007 closing date. The acquisition price remains subject to change for additional post-closing adjustments with final settlement of the acquisition to occur by February 2, 2008. The allocation of the purchase price to the acquired assets and liabilities at September 30, 2007 is based on
our preliminary fair value estimates on August 6, 2007. These purchase price allocations will be finalized based on valuation and other studies to be performed by us with the assistance of third party valuation specialists. As a result, the final adjusted purchase price and purchase price allocations will differ, possibly materially, from our initial allocations (Note 2). We expect to complete our fair value assessments by year end 2007.
Our acquisition of the Newfield properties provides us with substantial reserves, production and exploration rights within our areas of focus. The properties include 124 fields on 148 offshore blocks covering approximately 1.25 million gross acres (approximately 0.5 million acres net to our interests), which average production of approximately 241 million cubic feet of natural gas equivalents per day (MMcfe/d) in the third quarter of 2007. Estimated proved reserves for the acquired properties as of July 1, 2007 totaled 321.3 billion cubic feet of natural gas equivalent (Bcfe), of which approximately 71 percent represented natural gas proved reserves.
We also acquired 50 percent of Newfield’s interests in certain of Newfield’s unproved non-producing exploration leases on the outer continental shelf of the Gulf of Mexico and certain of Newfield’s interests in leases associated with its Treasure Island and Treasure Bay ultra deep gas prospect inventory, including the Blackbeard prospect (see “Oil & Gas Activities – Drilling and Development”). In addition, we entered into a 50-50 joint venture with Newfield to explore these unproved leases, which include 14 lease blocks encompassing approximately 70,000 gross acres.
We have retained technical and operating personnel and contractors that have supported Newfield’s management of the acquired properties. In addition, we will jointly work with Newfield to identify additional exploration prospects within our jointly owned unexplored lease acreage position.
In connection with the acquisition, we borrowed $394 million and issued approximately $100 million in letters of credit under a $700 million senior secured revolving credit facility and we borrowed $800 million under an unsecured bridge loan facility (see “Capital Resources and Liquidity” below). In late July 2007, in connection with the closing of this transaction, we entered into certain derivative contracts as required under our debt financing arrangements with respect to a portion of the anticipated production of the acquired properties for the years 2008 through 2010. The cost of the put options was approximately $4.6 million. We elected not to designate any of these derivative contracts as hedges for accounting purposes. Accordingly, the derivative contracts are subject to mark-to-market fair value adjustments, the impact of which is recognized immediately within our operating results. Our third-quarter 2007 results included a net unrealized gain of $10.7 million for mark-to-market accounting adjustments associated with these derivative contracts based on changes in their respective fair values through September 30, 2007. Our derivative contracts are as follows:
| | Natural Gas Positions (million MMbtu) |
| | Open Swap Positions(a) | | Put Options(b) | | |
| | Annual | | Average | | Annual | | Average | | Total |
| | Volumes | | Swap Price(c) | | Volumes | | Floor(c) | | Volumes |
| 2008 | 16.4 | | $ | 8.60 | | 6.6 | | $ | 6.00 | | 23.0 |
| 2009 | 7.3 | | $ | 8.97 | | 3.2 | | $ | 6.00 | | 10.5 |
| 2010 | 2.6 | | $ | 8.63 | | 1.2 | | $ | 6.00 | | 3.8 |
| | Oil Positions (thousand bbls) |
| | Open Swap Positions(a) | | Put Options(b) | | |
| | Annual | | Average | | Annual | | Average | | Total |
| | Volumes | | Swap Price(d) | | Volumes | | Floor(d) | | Volumes |
| 2008 | 693 | | $ | 73.50 | | 288 | | $ | 50.00 | | 981 |
| 2009 | 322 | | $ | 71.82 | | 125 | | $ | 50.00 | | 447 |
| 2010 | 118 | | $ | 70.89 | | 50 | | $ | 50.00 | | 168 |
(a) Covering periods January-June and November-December of the respective years |
(b) Covering periods July-October of the respective years | | | |
(c) Price per MMbtu of natural gas | | | |
(d) Price per barrel of oil | | | |
OIL & GAS ACTIVITIES
Drilling and Development
Since 2004, we have participated in 17 discoveries on 32 prospects that have been drilled and fully evaluated, including four discoveries announced in 2007. At mid-year 2007, we announced a potentially significant discovery called Flatrock on OSC 310 at South Marsh Island Block 212. We have commenced production from 14 of these discoveries to date. Three additional prospects are either in progress or not fully evaluated, and we expect to bring on production from other discoveries in the near-term. Our aggregate investments in the three unevaluated wells totaled $65.2 million at September 30, 2007, including $22.5 million for the Blueberry Hill well at Louisiana State Lease 340, $13.1 million for the Mound Point South well at Louisiana State Lease 340 and $29.6 million for the JB Mountain Deep well at South Marsh Island Block 224. We currently have rights to approximately 1.6 million gross acres (approximately 0.7 million acres net to our interests) and plan to participate in the drilling of multiple wells over the next twelve months.
We recently completed a successful production test at the Flatrock exploratory prospect, which was drilled to a measured depth of 18,400 feet and is located on OCS 310 at South Marsh Island 212 in approximately 10 feet of water. The production test, which was performed in the Operc section, indicated a gross flow rate of approximately 71 MMcf/d and 739 barrels of condensate, approximately 14 MMcfe/d net to us, on a 37/64th choke with flowing tubing pressure of 8,520 pounds per square inch. We and our joint interest partners in this prospect will use the results of the production test to determine the optimal flow rate for the well, which we expect to begin commercial production by year-end 2007 using the Tiger Shoal facilities in the immediate area. We have a 25 percent working interest and an 18.8 percent net revenue interest in the Flatrock field. Wireline and log-while-drilling porosity logs confirmed that the well encountered eight potentially productive zones, totaling 260 net feet of hydrocarbon bearing sands over a combined 637 foot gross interval, including five zones in the Rob-L section and three zones in the Operc section.
Even though our initial assessment indicates that the Flatrock discovery is potentially significant, we cannot assure you that we will achieve the results contemplated. Adverse conditions such as high temperature and pressure may lead to mechanical failures or increased operating costs which may diminish the productive potential of the zones identified.
We intend to develop the opportunities in the Flatrock area and are currently permitting three offset locations to provide further options for the development of the multiple reservoirs found in the Rob-L and Operc sections. The first permitted location, Flatrock No. 2, commenced drilling on October 7, 2007. The well is currently drilling below 5,000 feet and has a proposed total depth of 18,100 feet and will target the Rob-L and Operc sands approximately one mile northwest of the discovery. The second permitted location, Flatrock No. 3, is expected to commence drilling in the fourth quarter of 2007, and is located approximately 3,000 feet south of the discovery well.
We control a significant amount of acreage in the Tiger Shoal/Mound Point area (OCS 310/Louisiana State Lease 340). The addition of the Flatrock discovery follows our prior discoveries in this area, including Hurricane, Hurricane Deep, JB Mountain and Mound Point. We have now drilled eight successful wells in the OCS 310/Louisiana State Lease 340 area. We have multiple additional exploration opportunities with significant potential on this large acreage position.
In the fourth quarter 2007, the Cottonwood Point exploratory well reached a total depth of approximately 20,000 feet and will be completed in the Rob L section. As previously announced, wireline logs indicated the well encountered 43 net feet of hydrocarbon bearing sands over an approximate 92 foot gross interval in the upper Rob L section.
We acquired the Blackbeard prospect as part of our acquisition of the Newfield properties. We are currently pursuing drilling arrangements for the Blackbeard prospect, which was previously drilled to 30,067 feet in August 2006, but was temporarily abandoned prior to reaching its primary targets.
The Laphroaig discovery located in St. Mary, Parish, Louisiana reached a true vertical depth of 19,060 feet in February 2007 and wireline logs indicated the well encountered 56 net feet of high quality gas bearing sand over a 75 foot gross interval. This well commenced production in August 2007 and is currently producing at a gross rate of approximately 44 MMcfe/d, 17 MMcfe/d net to us. We have rights to 2,600 gross acres in this area. Our working interest in the well is 50 percent and our net revenue interest is 38.5 percent.
The Hurricane Deep well, located on South Marsh Island Block 217commenced drilling in October 2006 and was drilled to 20,712 feet total vertical depth in March 2007. Logs have indicated that an exceptionally thick upper Gyro sand was encountered totaling 900 gross feet. Based on wireline logs the top of this Gyro sand is credited with a potential 40 feet of hydrocarbons in a 53 foot gross interval. This exceptional sand thickness suggests that prospects in the Mound Point/Hurricane/JB Mountain/Blueberry Hill area may have thick sands as potential Gyro reservoirs. In September 2007, we conducted a successful production test which indicated a gross flow rate of approximately 15.4 MMcf/d, 3 MMcf/d net to us on a 14/16th choke with flowing tubing pressure of 14,200 pounds per square inch. First production is expected in the fourth quarter of 2007 using existing infrastructure in the area. The Hurricane Deep well also has two zones behind pipe in the shallower Rob-L and Operc sections of the well. We have a 25.0 percent working interest and 20.8 percent net revenue interest in the Hurricane Deep well, which is located in 12 feet of water on OCS 310, one mile northeast of the currently producing Hurricane discovery well.
The Mound Point South exploratory prospect at Louisiana Sate Lease 340 commenced on April 12, 2007, and was drilled to a total measured depth of 21,065 feet. Based on wireline logs, the well encountered a potential 15 feet of net hydrocarbon bearing sands over 47-foot gross interval in the Gyro section. The Mound Point South well was temporarily abandoned in October 2007. We and our partners are considering future operations for this well, which will require special tubulars for completion. We have an 18.3 percent working interest and a 14.5 percent net revenue interest in the Mound Point South prospect, which is located in approximately 8 feet of water. Our investment in Mound Point South totaled $13.1 million at September 30, 2007.
We are planning a sidetrack of the Blueberry Hill well at Louisiana State Lease 340 following unsuccessful attempts in June 2007 to clear a blockage above the perforated interval. The sidetrack is expected to target Gyro sands in a down dip position to the original well. This well encountered four potentially productive hydrocarbon bearing sands below 22,200 feet in February 2005. We currently have a 49.0 percent working interest and a 33.9 percent net revenue interest in the Blueberry Hill well. Information from the Blueberry Hill and Hurricane Deep wells will be incorporated in future plans for the JB Mountain Deep well, as all three areas demonstrate similar geologic settings and are targeting deep Miocene sands equivalent in age.
Production Update
Our third-quarter 2007 production, including results from the properties acquired from Newfield since August 6, 2007, averaged 185 MMcfe/d compared with 75 MMcfe/d in the third quarter of 2006. Pro forma third quarter 2007 production averaged 289 MMcfe/d, including 241 MMcfe/d from the properties acquired from Newfield since July 1, 2007 and 48 MMcfe from the our legacy properties. These estimates were below our estimates announced in July 2007 of 300 MMcfe/d primarily as a result of a third party working interest owner exercising its preferential right on one property resulting in that property not being sold to us. After considering production consumed in operations, pro forma sales for the third quarter of 2007 totaled 278 MMcfe/d. We expect our fourth quarter 2007 production, net of amounts consumed in operations, to average approximately 290 MMcfe/d, including 230 MMcfe/d from the properties acquired from Newfield. Our fourth quarter estimates do not include any amounts associated with the Flatrock well, which is expected to begin production prior to year-end 2007.
JB Mountain and Mound Point Area Development Activities
We are a participant in a program that began in 2002 and includes the JB Mountain and Mound Point Offset discoveries. Under terms of the program, the third party partner is funding all of the costs attributable to our interests in the properties, and will own all of the program’s interests until the program’s aggregate production totals 100 Bcfe attributable to the program’s net revenue interest, at which point 50 percent of the program’s interests would revert to us. There are three producing wells and approximately 13,000 gross acres on Louisiana State Lease 340 and OCS 310 that are subject to the 100 Bcfe arrangement. The three producing wells averaged an aggregate gross rate of approximately 26 MMcfe/d during the third quarter of 2007. We believe there are further exploration and development opportunities associated with this acreage.
MAIN PASS ENERGY HUBTM PROJECT
We are pursuing plans for the development of the MPEH™ project for the development of an LNG regasificantion and storage facility through our wholly owned Freeport Energy subsidiary. The MPEH™ project is located at our Main Pass facilities located offshore in the Gulf of Mexico, 38 miles east of Venice, Louisiana. Following and extensive review, the Maritime Administration approved our license application for the MPEH™ project in January 2007. The MPEH™ facility is approved with a capacity of regasifying LNG at
a peak rate of 1.6 Bcf per day, storing 28 Bcf of natural gas in salt caverns and delivering up to 3.1 Bcf of natural gas per day, including gas from storage, to the U.S. market.
As of September 30, 2007, we have incurred $43.7 million of cash costs associated with our pursuit of the establishment of the MPEH™, including $2.3 million during the third quarter of 2007 and $7.4 million for the nine months ended September 30, 2007. All of the these costs will continue to be charged to expense until permits are received and commercial feasibility is established, at which point we will begin to capitalize certain subsequent expenditures related to the development of the project. We expect to spend approximately $3.0 million to advance the project and to pursue commercial arrangements for the project over the remainder of 2007.
For additional information regarding our MPEH™ Project see Items 1. and 2. “Business and Properties – Main Pass Energy Hub™ Project” in our 2006 Form 10-K.
RESULTS OF OPERATIONS
Our only segment is “Oil and Gas.” We are pursuing a new business segment, “Energy Services,” whose start-up activities are reflected as a single expense line item within the accompanying consolidated statements of operations under the caption “Start-up costs for Main Pass Energy Hub™”. See “Discontinued Operations” below for information regarding our former sulphur segment.
We use the successful efforts accounting method for our oil and gas operations, which requires exploration costs, other than costs of successful drilling and in-progress exploratory wells, to be charged to expense as incurred. Our operating results may continue to be adversely impacted because of our significant planned exploration activities and the start-up costs associated with establishing the MPEH™, which include permitting fees and costs associated with the pursuit of commercial arrangements for the project. Additionally, energy insurance market conditions are continuing to negatively affect our operating results as our property insurance coverage premiums have significantly increased over amounts paid two years ago while the related coverage generally has higher deductibles and more restrictive terms.
Our operating results have changed substantially following the acquisition of the Newfield properties (see “Gulf of Mexico Property Acquisition” above). Our consolidated operating results for the three and nine months ended September 30, 2007 includes the results from the acquired properties beginning on August 6, 2007. The summarized operating results for acquired properties for the period of August 6, 2007 through September 30, 2007 are as follows (amounts in thousands):
Revenues: | | | |
| Oil and natural gas | $ | 95,406 | |
| Service | | 1,875 | |
| Total revenues | | 97,281 | |
Cost and Expenses: | | | |
| Production and delivery costs | | 20,577 | |
| Depreciation and amortization | | 58,128 | |
| Exploration expenses | | 28 | |
| General and administrative expenses | | 1,000 | a |
| Total costs and expenses | | 79,733 | |
| Operating income | $ | 17,548 | |
| a. | Only includes cost directly allocated to the Newfield properties and excludes all compensation costs associated with newly hired employees, which are not allocated to the acquired properties. |
Compared to the year-ago period, after considering the additional revenues and expenses from the acquired properties, our third-quarter 2007 operating loss of $25.7 million reflects (a) exploration expenses of $37.1 million, which includes $12.5 million in seismic data costs associated with the purchased acreage from Newfield and $20.3 million of nonproductive exploratory well costs primarily associated with the Cas well at South Timbalier Block 98; (b) an impairment charge of $13.6 million to write off the remaining net book value of the Cane Ridge field; and (c) a gain of $10.7 million associated with our derivative contracts. Our third-quarter 2006 operating loss of $13.7 million reflects $23.4 million of exploration costs, including $18.5 million of nonproductive drilling and related costs. Start-up costs associated with MPEH™ totaled $2.3 million in the third quarter of 2007 compared with $3.2 million in the third quarter of 2006.
Our operating loss for the nine months ended September 30, 2007 totaled $36.9 million, which includes (a) $52.2 million of exploration expenses, including $21.7 million of nonproductive drilling and
related costs, (b) $7.8 million of start-up costs associated with MPEH™, (c) the Cane Ridge impairment charge, (d) $3.4 million of charges to depreciation, depletion and amortization expense to increase the estimates for the accrued reclamation costs for the Vermilion Block 160 and Ship Shoal Block 296 fields and (e) the gains on the derivative contracts as discussed above. For the nine months ended September 30, 2007, our non-cash compensation costs associated with stock-based awards totaled $10.9 million, which included $5.3 million of costs charged to exploration expense (see “Stock-Based Compensation” below).
For the nine months ended September 30, 2006 our operating loss totaled $2.3 million, which includes (a) exploration expenses of $50.8 million, including $32.9 million of nonproductive well drilling and related costs and (b) $7.9 million of start-up costs associated with MPEH™. Our non-cash compensation cost associated with stock-based awards for the nine months periods of 2006 totaled $13.8 million, including $7.1 million of costs charged to exploration expense. Summarized operating data is as follows:
| | Three Months Ended | | Nine Months Ended | |
| | September 30, | | September 30, | |
| | 2007a | | 2006 | | 2007a | | 2006 | |
| Sales volumes: | | | | | | | | |
| Gas (thousand cubic feet, or Mcf) | 12,645,100 | | 4,397,100 | | 19,401,900 | | 10,423,600 | |
Oil (barrels)b | 671,300 | | 379,100 | | 1,323,900 | | 1,015,700 | |
Plant products (equivalent barrels) c | 53,300 | | 70,400 | | 166,800 | | 105,700 | |
| Average realizations: | | | | | | | | |
| Gas (per Mcf) | $ 6.17 | | $ 6.51 | | $ 6.74 | | $ 6.99 | |
Oil (per barrel)b | 75.08 | | 65.11 | | 66.80 | | 62.73 | |
| a. | Sales volumes associated with the properties acquired from Newfield totaled 9,694 million cubic feet of natural gas and approximately 498,000 barrels of oil and condensate. |
| b. | Sales volumes from Main Pass totaled 111,000 barrels in the third quarter of 2007 and 432,000 barrels for the nine months ended September 30, 2007 compared with 195,800 barrels in the third quarter and 598,600 barrels for nine months ended September 30, 2006. Main Pass produces sour crude oil, which sells at a discount to other crude oils. |
| c. | We received approximately $2.4 million and $7.7 million of revenues associated with plant products (ethane, propane, butane, etc.) during the third quarter of 2007 and nine months ending September 30, 2007, respectively, compared with $4.2 million and $6.1 million of plant product revenues in the comparable periods last year. |
Oil and Gas Operations
A summary of changes in our oil and natural gas revenues between the periods follows (in thousands):
| | Third | | | Nine | |
| | Quarter | | | Months | |
| Oil and natural gas revenues – prior year period | $ | 57,810 | | $ | 143,527 | |
| Increase (decrease) in: | | | | | | |
| Sales volumes: | | | | | | |
| Natural gas | | (9,413 | ) | | (5,002 | ) |
| Oil and condensate | | (11,149 | ) | | (9,080 | ) |
| Price realizations: | | | | | | |
| Natural gas | | 380 | | | 4,439 | |
| Oil and condensate | | 1,243 | | | (1,800 | ) |
| Properties acquired from Newfield | | 95,406 | | | 95,406 | |
| Plant products revenues | | (3,232 | ) | | 277 | |
| Other | | (27 | ) | | (386 | ) |
| Oil and natural gas revenues – current year period | $ | 131,018 | | $ | 227,381 | |
Unless otherwise disclosed, the 2007-over-2006 comparisons within this of results of operations section relate to the activities of the MOXY legacy properties. The acquisition of the oil and gas properties from Newfield materially increased every line item comprising our operating income (loss) measurement during the three months and nine months ended September 30, 2007.
Oil and gas revenues decreased in the third quarter as compared to the same period last year reflecting reductions in volumes sold of both natural gas and oil. The decrease in sales volumes reflects lower production from Main Pass 299, Vermilion Block 16, South Marsh Block 217 and High Island Block 131. Average realizations for gas sold during the third quarter of 2007 increased 2 percent over the comparable 2006 period. Average realizations for oil volumes sold during the third quarter of 2007 increased approximately 9 percent from prices received in the third quarter of 2006.
The decrease in our oil and gas revenues during the nine months ended September 30, 2007 compared with the same period last year primarily reflects the decreased production at the fields discussed above. Average realizations received during the nine months ended September 30, 2007 increased approximately 7 percent for natural gas and decreased 3 percent for oil over amounts received for volumes sold during the nine months ended September 30, 2006. For information regarding new producing fields commencing operations during 2006 see Items 1. and 2. “Business and Properties” in our 2006 Form 10-K.
Our service revenues totaled $2.2 million for the third quarter of 2007 and $2.9 million for the nine months ended September 30, 2007 compared to $2.6 million and $10.0 million for the comparable periods last year. The decrease primarily reflects the conclusion of our multi-year exploration venture with a private partner (Note 9) and the termination of the third party oil and gas processing fees at Main Pass. These decreases were partially offset by production and handling fees and reimbursements of standard industry overhead fees associated with the properties acquired from Newfield.
Production and delivery costs totaled $38.2 million in the third quarter of 2007 and $72.5 million for the nine months ended September 30, 2007 compared to $17.5 million and $39.0 million for the comparable periods in 2006. The increases are primarily related to the acquisition of properties from Newfield and higher workover costs. Our workover costs totaled $8.3 million in the third quarter of 2007 and $14.5 million for the nine months ended September 30, 2007 compared with $0.4 million and $4.3 million for the comparable periods in 2006. Our workover costs during 2007 are primarily related to operations at the Cane Ridge, King Kong and Blueberry Hill wells during third quarter as well as costs at the Eugene Island Block 97 No. 3 well and the Eugene Island Block 193 C-1 and C-2 wells in the first half of 2007. Our insurance costs increased significantly following the mid-year 2006 renewal of our property insurance policies, which reflected the effects of the 2005 hurricanes on the insurance industry as well as the increased number of our producing fields and drilling activities during 2006. The amount of insurance charged to production costs totaled $6.5 million in the third quarter of 2007 and $11.6 million for the nine months ended September 30, 2007 compared with $2.2 million and $3.0 million for the comparable periods in 2006. The amounts during 2007 also reflect incremental insurance costs associated with coverage on the properties acquired from Newfield.
Depletion, depreciation and amortization expense totaled $85.0 million in the third quarter of 2007 and $127.6 million for the nine months ended September 30, 2007 compared with $26.0 million and $44.3 million for the same periods last year. The increases primarily reflect additional depreciation and amortization incurred as a result of the additional properties and related production from the Newfield properties. As indicated in Note 1 of our 2006 Form 10-K, we record depletion, depreciation and amortization expense on a field-by-field basis using the units-of-production method. Our depletion, depreciation and amortization rates are directly affected by estimates of proved reserve quantities, which are subject to a significant level of uncertainty, especially for fields with little or no production history. Subsequent revisions to reserve estimates for the same fields can yield significantly different results.
The Cane Ridge well at Louisiana State Lease 18055, located onshore in Vermilion Parish, commenced production in April 2006 at initial rates approximating 9 MMcfe/d. These initial rates decreased significantly and in July 2006 the well was shut-in. The operator was unsuccessful in initial attempts to reestablish production from the well. In December 2006, the operator assigned certain ownership interests in the well to us. Our final attempts to restore production from the well were unsuccessful during the third quarter of 2007. We have no future activities planned for the well. Accordingly, we recorded a charge of $13.6 million to depreciation, depletion and amortization expense to write off our remaining investment in the Cane Ridge well.
The Pecos well located at West Pecan Island in Vermilion Parish, Louisiana commenced production in August 2006. Production rates subsequently decreased and we initiated remedial operations in the first quarter of 2007 in an attempt to stimulate the well’s production. These efforts were unsuccessful and we subsequently recompleted the well to the upper productive interval. After producing and depleting the reserves from the upper productive zone, we will consider drilling a sidetrack well to recover additional identified potential reserves. Our investment in the Pecos well totaled $6.9 million at September 30, 2007.
As further explained in Note 9, accounting rules require that the carrying value of proved oil and gas property costs be assessed for possible impairment under certain circumstances, and reduced to fair value by a charge to earnings if impairment is deemed to have occurred. Conditions affecting current and estimated future cash flows that could require impairment charges include, but are not limited to, lower anticipated oil and natural gas prices, increased production, development and reclamation costs and downward revisions of reserve estimates. As more fully explained in Item 1A. “Risk Factors” in our 2006 Form 10-K, a combination of any or all of these conditions could require impairment charges to be recorded in future periods.
The determination of oil and natural gas reserve estimates is a subjective process, and the accuracy of any reserve estimate depends on the quality of available data and the application of engineering and geological interpretation and judgment. Estimates of economically recoverable reserves and future net cash flows depend on a number of variable factors and assumptions that are difficult to predict and may vary considerably from actual results. In particular, reserve estimates for wells with limited or no production history are less reliable than those based on actual production. Subsequent evaluation of the same reserves may result in variations, which may be substantial, in estimated reserves and related estimates of future cash flows. If the capitalized costs of an individual oil and gas property exceed the related estimated future net cash flows, an impairment charge to reduce the capitalized costs to the property’s estimated fair value is required. For more information regarding the risks associated with the reserve estimation process, see Item 1A. “Risk Factors” in our 2006 Form 10-K.
Our exploration expenses fluctuate based on the outcome of drilling exploratory wells, the structure of our drilling arrangements and the incurrence of geological and geophysical costs, including the cost of seismic data. Summarized exploration expenses are as follows (in millions):
| | Third Quarter | | Nine Months | |
| | 2007 | | 2006 | | 2007 | | 2006 | |
Geological and geophysical a | $ | 15.9 | b | $ | 2.8 | | $ | 25.7 | b | $ | 12.2 | |
| Nonproductive exploratory costs, including | | | | | | | | | | | | |
| related lease costs | | 20.3 | c | | 18.5 | d | | 21.7 | c,e | | 32.9 | d,f |
| Other | | 0.9 | | | 2.1 | d | | 4.8 | | | 5.7 | |
| | $ | 37.1 | | $ | 23.4 | | $ | 52.2 | | $ | 50.8 | |
| a. | Includes compensation costs associated with outstanding stock-based awards totaling $1.0 million in the third quarter of 2007 and $5.3 million for the nine months ended September 30, 2007 compared with $1.0 million and $7.1 million of compensation costs during comparable periods in 2006 (see “Stock Based Compensation” below and Note 5). |
| b. | Includes $12.5 million of seismic data purchases for the exploration acreage acquired from Newfield. |
| c. | Primarily reflects the nonproductive exploratory well costs primarily associated with the “Cas” well at South Timbalier Block 98. |
| d. | Includes nonproductive exploratory drilling and related costs for the wells at Vermilion Block 54 ($6.1 million), Long Point Deep at Louisiana State Lease 18091 ($11.5 million) and the costs incurred through September 30, 2006 for the drilling and evaluation of the deeper objective at Zigler Canal in Vermilion Parish, Louisiana. |
| e. | Amount also includes the nonproductive exploratory well drilling and related costs associated with the well at Grand Isle Block 18 that was evaluated to be nonproductive in January 2007. |
| f. | Includes nonproductive exploratory well drilling and related costs associated with the well at South Pass Block 26 ($8.2 million), and the costs incurred during the first half of 2006 for the wells at West Cameron Block 95 ($2.7 million) and at South Marsh Island Block 230 ($2.5 million). |
Our results for the nine months ended September 30, 2006 included insurance recoveries totaling $2.9 million including the receipt of the initial insurance settlement related to our Hurricane Katrina property loss claim in the second quarter of 2006 and the final settlement related to our Hurricane Ivan claim affecting Main Pass.
Other Financial Results
General and administrative expense totaled $7.0 million in the third quarter of 2007 and $17.8 million for the nine months ended September 30, 2007 compared with $4.1 million in the third quarter of 2006 and $16.6 million for the nine months ended September 30, 2006. Our increased general and administrative costs reflect the increased personnel associated with administering the properties acquired from Newfield. In addition, we charged approximately $1.1 million of related stock-based compensation costs to general and administrative expense during the third quarter of 2007 and $5.2 million for the nine
months ended September 30, 2007 compared to $0.9 million and $6.2 million for the comparable periods in 2006 (see “Stock-Based Compensation” below).
Interest expense totaled $22.9 million in the third quarter of 2007 and $34.3 million for the nine months ended September 30, 2007 compared with $2.7 million in the third quarter of 2006 and $6.8 million for the nine months ended September 30, 2006. Capitalized interest totaled $2.0 million in the third quarter of 2007, $1.3 million in the third quarter of 2006, $4.5 million for the nine months ended September 30, 2007 and $4.3 million for the nine months ended September 30, 2006. The higher interest expense during the 2007 periods reflect the approximate$1.1 billion of borrowings made under new debt agreements to fund the property acquisition from Newfield (see “Capital Resources and Liquidity – Senior Secured Revolving Credit Facility and Unsecured Bridge Loan Facility” below). The first-quarter 2006 conversions of our senior notes resulted in a reduction in interest expense of $0.6 million for previously accrued amounts (including $0.3 million accrued and outstanding at December 31, 2005) that were reclassified to losses on conversions of debt in other non-operating expense in the accompanying consolidated statements of operations. For more information regarding these conversion transactions see “Capital Resources and Liquidity – Debt Conversion Transactions” below and Note 5 of our 2006 Form 10-K.
Other expense totaled $2.5 million in the third quarter of 2007 and $0.9 million for the nine months ended September 30, 2007 compared with other income of $0.3 million in the third quarter of 2006 and other expense of $2.3 million for nine months ended September 30, 2006. Other expense in the third quarter of 2007 includes the $3.0 million prepayment premium paid to terminate the senior secured term loan on August 6, 2007 (see “Capital Resources and Liquidity – Senior Secured Revolving Credit Facility” below).
CAPITAL RESOURCES AND LIQUIDITY
The table below summarizes our cash flow information by categorizing the information as cash provided by or (used in) operating activities, investing activities and financing activities and distinguishing between our continuing operations and the discontinued operations (in millions):
| | Nine Months Ended | |
| | September 30, | |
| | 2007 | | | 2006 | |
Continuing operations | | | | | | | |
| Operating | $ | 102.4 | | | $ | 70.5 | |
| Investing | | (1,157.6 | ) | | | (185.6 | ) |
| Financing | | 1,053.0 | | | | (0.6 | ) |
Discontinued operations | | | | | | | |
| Operating | | 0.7 | | | | (5.8 | ) |
| Investing | | - | | | | - | |
| Financing | | - | | | | - | |
Total cash flow | | | | | | | |
| Operating | | 103.1 | | | | 64.7 | |
| Investing | | (1,157.6 | ) | | | (185.6 | ) |
| Financing | | 1,053.0 | | | | (0.6 | ) |
Nine-Month 2007 Cash Flows Compared with Nine-Month 2006
Operating cash flow from our continuing operations increased in 2007 from prior year levels, reflecting higher oil and natural gas revenues primarily associated with the properties acquired from Newfield and timing differences relating to working capital requirements associated with our operations. The increase in oil and natural gas revenues was partially offset by a significant decrease in service revenues reflecting the completion of a multi-year drilling program (Note 9). The reduced working capital amounts includes a reduction in purchases of materials and supplies inventory purchases during 2007 as compared to the nine months ended September 30, 2006 as we utilized a portion of our inventory in our drilling activities. Operating cash flow from our continuing operations during the nine months ended September 30, 2006 included the $12.4 million net payment to settle class action litigation (see Item 3 “Legal Proceedings” in our 2006 Form 10-K). We received the final $5.0 million payment related to the settlement of Hurricane Ivan business interruption insurance claims in the first half of 2006.
Cash provided by discontinued operations in the nine months ended September 30, 2007 reflected our receipt of $7.7 million of insurance proceeds related to our Port Sulphur hurricane-related property loss claims. We will be performing significant reclamation activities as part of a modified reclamation plan for the Port Sulphur facilities in the second half of 2007 and in 2008 (see “Discontinued Operations” below). The insurance proceeds were partially offset by cash used for caretaking and other costs required to maintain these and other non-operating facilities and certain retiree-related benefit costs. Reclamation costs associated with our discontinued operations totaled $1.4 million in the nine months ended September 30, 2007 and $2.7 million in the same period of 2006.
Our investing cash flow reflects exploration, development and other capital expenditures associated with our oil and gas activities (see “Oil & Gas Activities” above), including the acquisition of the Newfield properties for $1.05 billion, net of purchase price adjustments. Our exploration, development and other capital expenditures for 2007 are expected to approximate $190 million, including $150 million for costs associated with our deep gas exploration and development activities and approximately $40 million for anticipated development costs related to the acquisition of the Newfield properties (see “Gulf of Mexico Property Acquisition” above). These expenditures may increase as additional exploration opportunities are presented to us or to fund development costs associated with additional successful wells. We plan to fund our exploration and development activities with our available unrestricted cash (approximately $16.3 million at September 30, 2007), our senior secured revolving credit facility (see "Senior Secured Revolving Credit Facility" below) and operating cash flows. We will require commercial arrangements for the MPEH™ project to obtain financing, which may be in the form of additional debt or equity transactions.
Our investing cash flow also reflects the release to us of $3.0 million of previously escrowed U.S. government notes in the nine months ended September 30, 2007 and $13.5 million during the nine months ended September 30, 2006. In 2007, we used the $3.0 million to pay a semi-annual interest payment on April 6, 2007 as required for our 5¼% convertible senior notes. Our last interest payment made from escrowed funds available for the 5¼% convertible senior notes occurred on October 6, 2007. During 2006, we used $3.9 million of these escrowed funds to pay the semi-annual interest payments on our 6% convertible senior notes on January 2, 2006 and $3.0 million on our 5¼% convertible senior notes on April 6, 2006. The remaining $3.5 million of released funds used in the first half of 2006 represented interest payments we are no longer required to make on the convertible debt, and were used to fund a portion of our debt conversion transactions (see “Debt Conversion Transactions” below).
Our financing activities during the nine months ended September 30, 2007 reflect net borrowings of approximately $1.1 billion (see “Capital Resources and Liquidity – Senior Secured Revolving Credit Facility” and “Unsecured Bridge Loan Facility” below). We incurred $31.2 million in financing costs associated with the completion of the various debt financing transactions in 2007 (Note 3) and $0.5 million of costs associated with the establishment of a senior secured revolving credit facility in 2006. Our financing activities also included payments of dividends on our mandatorily redeemable preferred stock totaling $1.1 million during the nine months ended September 30, 2007 and $1.1 million during the nine months ended September 30, 2006, including approximately $0.4 million associated with the dividend payment from the fourth quarter of 2005 that was paid on January 3, 2006. In the second quarter of 2007, all of the remaining outstanding shares of the mandatorily redeemable preferred stock were converted into approximately 6.2 million shares of common stock (see Note 3 to our Form 10-Q for the period ended June 30, 2007). Net proceeds received from the exercise of stock options totaled $1.1 million for the nine months ended September 30, 2007 and $0.4 million for the same period in 2006.
Senior Secured Revolving Credit Facility
We amended and expanded our senior secured revolving credit facility (credit facility) on August 6, 2007 in connection with closing of the acquisition of the Newfield properties (see Notes 2 and 3 and “Gulf of Mexico Property Acquisition” above). The credit facility’s borrowing base was increased to $700 million and matures on August 6, 2012. At September 30, 2007, we had borrowings of $313 million and $100 million in letters of credit issued under the credit facility. The letters of credit support the reclamation obligations assumed in the acquisition of the Newfield properties. At September 30, 2007, our availability for additional borrowings under the credit facility totaled $287 million.
Availability under our credit facility is subject to a borrowing base determines on estimates of MOXY’s oil and natural gas reserves, which is subject to redetermination by the lenders semi-annually each April 1 and October 1. The variable-rate facility is secured by (1) substantially all the oil and gas properties (including related proved oil and natural gas reserves) of MOXY and its subsidiaries and (2) the pledge by us of our ownership interest in MOXY and by MOXY of its ownership interest in each of its wholly owned subsidiaries. The credit facility is guaranteed by McMoRan and each of MOXY’s wholly owned subsidiaries and contains customary financial covenants and other restrictions.
As a condition precedent to borrowing under the credit facility, MOXY was required to hedge 80 percent of its reasonably estimated projected crude oil and natural gas production from its proved developed producing oil and gas properties, as determined by reference to an initial reserve report for the years 2008 through 2010. For information regarding these hedging arrangements, see Note 6 and “Gulf of Mexico Property Acquisition” above. The credit facility is also subject to a quarterly reduction of $60 million in the commitment beginning in the fourth quarter of 2007 through the fourth quarter of 2008 ($300 million in the aggregate).The commitment under the credit facility will reduce $60 million per quarter beginning in the fourth quarter of 2007 and continuing through the fourth quarter of 2008 ($300 million in the aggregate).
Unsecured Bridge Loan Facility
On August 6, 2007, we entered into a credit agreement in conjunction with the acquisition of the Newfield properties. The credit agreement provided for an $800 million interim bridge loan facility (the bridge loan), which is currently fully funded. The bridge loan matures on August 6, 2008, at which time it would be convertible into exchange notes due in 2014. If the credit agreement remains outstanding for 120 days, the lenders are entitled to receive a second lien in the collateral securing our credit facility (see “Senior Secured Revolving Credit Facility” above). The interest rate on the bridge loan was set at 9.9 percent, and increases 0.5 percent every 90 days, with our minimum rate payable being 10 percent and the maximum being 12 percent. The current rate under the bridge loan is 10 percent. Interest expense on the bridge loan, including amortization of related deferred financing costs, totaled $12.8 million for the three months and nine months ended September 30, 2007. Our remaining unamortized deferred financing costs associated with the bridge loan facility totaled $17.9 million at September 30, 2007. A pro rata amount of these unamortized deferred financing cost would be required to be charge to interest expense upon completion of our planned refinancing transactions.
On October 25, 2007, we commenced a public offering of 11 million shares of common stock and a concurrent public offering of 1.5 million shares of mandatory convertible preferred stock with an offering price of $100 per share. We intend to use the net proceeds from these offerings to repay a portion of our indebtedness under the $800 million bridge loan. We also intend to conduct a notes offering, the proceeds of which will be used to repay the remaining portion of amounts outstanding under the bridge loan.
Senior Term Loan Agreement
In January 2007, we entered into senior term loan agreement (the term loan) (Note 3). The term loan agreement provided for a five-year term, $100 million second lien senior secured term loan facility. At the closing of the acquisition of the Newfield properties, we repaid and terminated the term loan (see Note 3 and “Gulf of Mexico Property Acquisition” above). In connection with this prepayment, we paid a 3.0 percent ($3.0 million) prepayment premium. The prepayment premium was reflected as a charge to non-operating expense in our third-quarter 2007 consolidated statement of operations.
Convertible Senior Notes
At September 30, 2007, our debt related to convertible senior notes totaled $215.9 million, reflecting $115.0 million related to our 5¼% convertible senior notes due on October 6, 2011 and $100.9 million related to our 6% convertible senior notes due July 2, 2008, which is reflected in current liabilities in the accompanying consolidated condensed balance sheet. Each series of convertible senior notes is convertible into shares of our common stock at the election of the holder at any time prior to maturity. The conversion prices are $16.575 per share for the 5¼% notes and $14.25 per share for the 6% notes (Note 3). In 2006, a portion of then outstanding balances on these senior notes were converted to equity through privately negotiated transactions (see below). We intend to consider opportunities to negotiate additional conversion transactions in the future. Absent any further conversion transactions, we believe that we will be able to meet our repayment requirements under the 6% convertible senior notes in July 2008 through use of our operating cash flows and the availability under our credit facility or other refinancing transactions.
Debt Conversion Transactions
In the first quarter of 2006, we privately negotiated transactions to induce conversion of $29.1 million of our 6% convertible senior notes and $25.0 million of our 5¼% convertible senior notes, into approximately 3.6 million shares of our common stock based on the respective conversion price for each set of convertible notes (Note 3). We paid an aggregate $4.3 million in the transactions and recorded an approximate $4.0 million net charge to expense in the first quarter of 2006. The net charge reflects the $4.3 million inducement payment, reflected in the accompanying consolidated statement of operations as other non-operating expense, less $0.3 million of previously accrued interest expense recorded during 2005. We funded approximately $3.5 million of the cash payments from restricted cash held in escrow for funding interest payments on the convertible notes and paid the remaining portion with available unrestricted cash. The annual interest cost savings as a result of these transactions approximates $3.1 million. We intend to
consider opportunities to negotiate additional conversion transactions in the future (see “Convertible Senior Notes” above).
Contractual Obligations and Commitments
In addition to our accounts payable and accrued liabilities ($207.4 million at September 30, 2007), we have other contractual obligations and commitments that will require payments during the remainder of 2007 and beyond.
The table below summarizes the maturities of our 6% and 5¼% convertible notes (Note 3), our expected payments for retiree medical costs (Notes 8 and 11 of our 2006 Form 10-K), our current exploration and development commitments and our remaining minimum annual lease payments as of September 30, 2007 (amounts in millions):
| | Long Term | | | | | | | | | | |
| | Debt and | | | | | | | | | | |
| | Convertible | | Retirement | | Oil & Gas | | Lease | | Interest | | |
| | Securities a | | Benefits b | | Obligationsc | | Paymentsd | | Payments e | | Total |
| 2007 | $ | - | | $ | 1.4 | | $ | 27.0 | | $ | 0.3 | | $ | 30.2 | | $ | 58.9 |
| 2008 | | 119.5 | | | 2.1 | | | 0.4 | | | 1.3 | | | 121.1 | | | 244.4 |
| 2009 | | - | | | 2.1 | | | - | | | 1.2 | | | 115.0 | | | 118.3 |
| 2010 | | - | | | 2.1 | | | - | | | 1.1 | | | 115.0 | | | 118.2 |
| 2011 | | 115.0 | | | 2.0 | | | - | | | 1.1 | | | 115.0 | | | 233.1 |
| Thereafter | | 1,113.0 | | | 12.4 | | | - | | | 2.8 | | | 223.6 | | | 1,351.8 |
| Total | $ | 1,347.5 | | $ | 22.1 | | $ | 27.4 | | $ | 7.8 | | $ | 719.9 | | $ | 2,124.7 |
| a. | Amounts due upon maturity of convertible senior notes subject to change based on future conversions by the holders of the securities. For purposes of this table it is assumed the bridge loan facility is for its current seven year term; although it is our intention to refinance the bridge loan facility in the fourth quarter of 2007 through debt, equity and/or equity linked securities. |
| b. | Includes anticipated payments under our employee retirement health care plan through 2016 (Note 8 of our 2006 Form 10-K) and our future reimbursements associated with the contractual liability covering certain of our former sulphur retiree’s medical costs (Note 11 of our 2006 Form 10-K). Amounts shown in 2007 are included within our accrued liabilities at September 30, 2007. |
| c. | These oil & gas obligations primarily reflect our net working interest share of authorized exploration and development project costs at September 30, 2007 (see below for total estimated exploration and development expenditures for the remainder of 2007). |
| d. | Amounts primarily reflect leases for two office locations in Houston, Texas, which terminate in April 2009 and July 2014, respectively. |
| e. | Reflects interest on the debt balances as September 30, 2007. Assumes a 10 percent effective annual interest rate on our unsecured bridge loan facility and its maturity to August 2014. Also assumes and an 8 percent effective annual interest rate on credit facility and a 2.5 percent and 0.5 percent interest on the letters of credit ($100 million) and unused commitment fee. Interest on the convertible senior notes is fixed. If interest rates on the credit facility and bridge loan facility change by 50 basis points our cumulative interest would change by approximately $44.3.million. |
STOCK-BASED COMPENSATION
Effective January 1, 2006, we adopted the fair value recognition provisions of Statement of Financial Accounting Standards No. 123 (revised 2004), “Share-Based Payment” or (SFAS No. 123R), using the modified prospective transition method. For more information regarding our accounting for stock-based awards see Note 1 of our 2006 Form 10-K.
Compensation cost charged against earnings for stock-based awards is shown as follows (in thousands).
| | Three Months Ended | | Nine Months Ended | |
| | September 30, | | September 30, | |
| | 2007 | | 2006 | | 2007 | | 2006 | |
| General and administrative expenses | $ | 1,084 | | $ | 932 | | $ | 5,228 | | $ | 6,184 | |
| Exploration expenses | | 1,003 | | | 1,031 | | | 5,279 | | | 7,052 | |
| Main Pass Energy Hub™ start-up costs | | 78 | | | 79 | | | 398 | | | 521 | |
| Total stock-based compensation cost | $ | 2,165 | | $ | 2,042 | | $ | 10,905 | | $ | 13,757 | |
Our stock based compensation for the nine months ended September 30, 2007 was reduced from amounts charged to expense in the comparable period last year, reflecting a decrease in the fair value of our options on the respective dates of grant (Note 5). As of September 30, 2007, total compensation cost related to nonvested stock option awards not yet recognized in earnings was approximately $12.6 million, which is expected to be recognized over a weighted average period of approximately 0.9 years. Compensation expense related to currently outstanding and unvested stock-based awards is expected to approximate $2.0 million in the fourth quarter of 2007.
CRITICAL ACCOUNTING POLICIES AND ESTIMATES
Management’s Discussion and Analysis of our financial condition and results of operations is based upon our consolidated financial statements, which have been prepared in conformity with U.S. generally accepted accounting principles. The preparation of these statements requires that we make estimates and assumptions that affect the reported amounts of assets, liabilities, revenues and expenses. We base these estimates on historical experience and on assumptions that we consider reasonable under the circumstances; however, reported results could differ from the current estimates under different assumptions and/or conditions. We have disclosed the areas requiring the use of management’s estimates in Note 1 of our 2006 Form 10-K under the heading “Use of Estimates.” During the third quarter of 2007, following the acquisition of properties from Newfield we identified the following assumptions and estimates as additional critical accounting policies and estimates to supplement those estimates included within Item 7. and 7.A of our 2006 Form 10-K under the heading “Critical Accounting Policies and Estimates.”
As noted above in “Senior Secured Revolving Credit Facility”, we were required to hedge 80 percent of our reasonably estimated projected crude oil and natural gas production from our existing proved developed producing oil and gas properties excluding Main Pass Block 299 (which represents approximately 15 percent of total future proved developed reserve production), for 2008, 2009 and 2010. We elected not to designate any of our oil and gas derivative contracts as accounting hedges. Accordingly, our hedging contracts are subject to mark-to-market fair value adjustments; and as such, we are likely to experience significant non-cash volatility in our reported earnings during periods of oil and gas price volatility. Our derivative contracts are carried at fair value (determined by quoted oil and natural gas future prices) on our consolidated balance sheets. We record all unrealized and recognized gains and losses associated with our oil and gas derivative contracts within a separate line item within our consolidated statement of operations with any related cash effect recorded within cash flows from operations within the consolidated statements of cash flow. We believe the operating treatment of our derivative contracts is appropriate as the sale of oil and gas production represents our primarily source of both operating income and cash flow.
Estimate of Purchase Price Allocation
The purchase price of the properties acquired from Newfield is allocated to the related assets and liabilities based on their estimated fair values at the acquisition date. The purchase price will be finalized by February 2, 2008. At September 30, 2007 the allocation of the purchase price to the acquired properties' assets and liabilities assumed in the Newfield transaction is based on our preliminary valuation estimates. These purchase price allocations will be finalized based on valuations and other studies to be performed by us with the assistance of third party valuation specialists. We expect substantially complete our fair value assessments by year-end 2007. As a result, the final adjusted purchase price and purchase price allocations may differ, possibly materially, from the amounts recorded at September 30, 2007.
DISCONTINUED OPERATIONS
Our discontinued operations resulted in a net loss of $1.2 million in the third quarter of 2007 and income of $0.1 million for the nine months ended September 30, 2007 compared with losses of $2.5 million in the third quarter of 2006 and $5.8 million for the nine months ended September 30, 2006. The current aggregate estimated closure cost for Port Sulphur facilities is an approximate $11.5 million. We are accelerating the closure of the Port Sulphur facilities and are considering several different alternatives under our reclamation plans. We incurred approximately $1.4 million of these costs in the nine months ended September 30, 2007. We estimate that we may incur up to an additional $8.9 million of these costs over the next twelve months under our currently anticipated closure plan, which is subject to change pending regulatory approval of the final plans. The total amount of our insurance recovery associated with our Port Sulphur property loss claims resulting from the damages incurred during the 2005 hurricanes was $7.7 million. The summarized results of the discontinued operations are as follows (in thousands):
Table of Contents
| | Third Quarter | | Nine Months | |
| | 2007 | | 2006 | | 2007 | | 2006 | |
| Sulphur retiree costs | $ | 397 | | $ | 392 | | $ | 1,121 | | $ | 1,327 | |
| Caretaking costs | | 221 | | | 271 | | | 655 | | | 944 | |
| Accretion expense – sulphur | | | | | | | | | | | | |
| reclamation obligations | | 434 | | | 348 | | | 1,303 | | | 1,044 | |
| Insurance | | 27 | | | 15 | | | 438 | | | 849 | |
| General and administrative , legal and other | | 54 | | | 67 | | | 139 | | | 186 | |
| Other | | 46 | | | 1,366 | | | (3,706 | )a | | 1,402 | |
| Loss (income) from discontinued operations | $ | 1,179 | | $ | 2,459 | | $ | (50 | ) | $ | 5,752 | |
| a. | Includes the $4.2 million of finalized insurance recoveries associated with the Port Sulphur property damage claims resulting from the 2005 hurricanes and $0.3 million of proceeds from discontinued oil and gas operations. |
NEW ACCOUNTING STANDARDS
Accounting for Uncertainty in Income Taxes.
Effective January 1, 2007, we adopted Financial Accounting Standards Board (FASB) Interpretation No. 48 “Accounting for Uncertainty in Income Taxes” (FIN 48). FIN 48 clarifies the accounting for income taxes by prescribing the minimum recognition threshold a tax position is required to meet before being recognized in the financial statements. FIN 48 also provides guidance on derecognition, measurement, classification, interest and penalties, accounting in interim periods, disclosure and transition. The adoption of FIN 48 had no effect on our financial statements.
As of January 1, 2007 and September 30, 2007, we had approximately $232.1 million and $257.1 million, respectively, of unrecognized tax benefits relating to our reported net losses and other temporary differences from operations. We have recorded a full valuation allowance on these deferred tax assets (see Note 9 of our 2006 Form 10-K). Our effective tax rate would be reduced in future periods to the extent these deferred tax assets are recognized. Interest or penalties associated with income taxes are recorded as components of the provision for income taxes, although no such amounts have been recognized in the accompanying financial statements. Our major taxing jurisdictions are the United States (federal) and Louisiana. Tax periods open to audit include our federal income tax returns subsequent to 2003 and Louisiana income tax returns for calendar years subsequent to 2002.
Fair Value Measurements.
In September 2006, the FASB issued SFAS No. 157, “Fair Value Measurements.” SFAS No. 157 establishes a framework for measuring fair value in generally accepted accounting principles (GAAP), clarifies the definition of fair value within that framework, and expands disclosures about the use of fair value measurements. In many of its pronouncements, the FASB has previously concluded that fair value information is relevant to the users of financial statements and has required (or permitted) fair value as a measurement objective. However, prior to the issuance of this statement, there was limited guidance for applying the fair value measurement objective in GAAP. This statement does not require any new fair value measurements in GAAP. SFAS No. 157 is effective for fiscal years beginning after November 15, 2007, with early adoption allowed. We are still reviewing the provisions of SFAS No. 157 and have not determined the impact, if any, that adopting this standard might have on our financial statements.
In February 2007, the FASB issued SFAS No. 159 “The Fair Value Option for Financial Assets and Liabilities – Including an amendment of FASB No. 115.” SFAS No. 159 permits entities to choose to measure many financial instruments and certain other items at fair value. This statement is effective for fiscal years beginning after November 15, 2007, with early adoption allowed. We have not yet determined the impact, if any, that adopting this standard might have on our financial statements.
CAUTIONARY STATEMENT
Management’s Discussion and Analysis of Financial Condition and Results of Operations contain forward-looking statements. All statements other than statements of historical fact included in this report, including, without limitation, statements regarding plans and objectives of our management for future operations and our exploration and development activities are forward-looking statements.
This report includes "forward looking statements" within the meaning of Section 27A of the Securities Act of 1933 and Section 21E of the Securities Exchange Act of 1934, including statements about our plans, strategies, expectations, assumptions and prospects. "Forward-looking statements" are all statements other than statements of historical fact, such as: statements regarding our business plans for 2007; statements regarding our need for, and the availability of, financing; and to satisfy the MMS reclamation obligations with respect to Main Pass; drilling potential and results; anticipated flow rates of producing wells; anticipated initial flow rates of new wells; reserve estimates and depletion rates; general economic and business conditions; risks and hazards inherent in the production of oil and natural gas; demand and potential demand for oil and gas; trends in oil and natural gas prices; amounts and timing of capital expenditures and reclamation costs; and other environmental issues. Further information regarding these and other factors that may cause our future performance to differ from that projected in the forward looking statements are described in more detail under Item 1A. “Risk Factors” included in our 2006 Form 10-K and those below in Part II Other Information – Item 1A. “Risk Factors”.
–––––––––––––––––––––––––
Subsequent to December 31, 2006, our interest rate market risk has significantly increased. Our revolving line of credit and unsecured bridge loan facility (see “Gulf of Mexico Property Acquisition” and “Capital Resources and Liquidity” and Notes 2 and 3) have variable rates, which exposes us to interest rate risk. At the present time we do not hedge our exposure to fluctuations in interest rates. Based on our outstanding borrowings at September 30, 2007 under the amended revolving credit facility and the unsecured bridge loan facility entered into on August 6, 2007, a change of 100 basis points in applicable annual interest rates would have an approximate $0.4 million annual pre-tax impact on our results of operations and cash flows. If the interest rates on the bridge loan were to exceed the set floor of 10 percent then a change of 100 basis points in applicable annual interest rates would have an approximate $1.2 million annual pre-tax impact on our results of operations and cash flows.
In connection with our acquisition of oil and gas properties from Newfield, we entered into various hedging contracts for a portion of our projected 2008-2010 sales of oil and natural gas (see “Gulf of Mexico Property Acquisition” and Note 6). The sensitivity of a $1.00 per mmbtu change from the average swap price for the natural gas volumes covered by the hedging contracts is $16.4 million in 2008, $7.3 million in 2009 and $2.6 million in 2010. The sensitivity of a $5.00 per barrel change in the average swap price for the oil volumes covered by the hedging contracts is $3.5 million in 2008, $1.6 million in 2009 and $0.6 million in 2010. The sensitivity of a $1.00 per mmbtu change in natural gas prices from the $6.00 per mmbtu contract put price is approximately $6.6 million in 2008, $3.2 million in 2009 and $1.2 million in 2010. The sensitivity of a $5.00 per barrel change in crude oil prices from the $50.00 per barrel contract put price is approximately $1.4 million in 2008, $0.6 million in 2009 and $0.3 million in 2010.
For information about market risks we are subject to, please read the consolidated financial statements and notes thereto included in our Annual Report on Form 10-K for the year ended December 31, 2006.
On August 6, 2007, McMoRan Oil & Gas LLC (MOXY), a wholly-owned subsidiary of McMoRan Exploration Co. (McMoRan), completed its acquisition of substantially all proved property interests and related assets of Newfield Exploration Company (Newfield) on the outer continental shelf of the Gulf of Mexico for total cash consideration of approximately $1.08 billion and the assumption of the related reclamation obligations. The acquisition had an effective date of July 1, 2007.
McMoRan considers the acquisition of oil and gas properties from Newfield material to the results of its operations, financial position and cash flows from the date of acquisition through September 30, 2007, and believes that the internal controls and procedures over the operations of the acquired oil and gas properties will have a material effect on McMoRan’s internal control over financial reporting. Certain administrative services are currently being provided to McMoRan by Newfield under terms of a transition services agreement, which will terminate on October 31, 2007. McMoRan is integrating the acquired properties’ operations and has extended its Sarbanes-Oxley Act Section 404 compliance program to include the acquired properties from Newfield. McMoRan will report on its assessment within the time provided by the Sarbanes-Oxley Act and applicable rules relating to business acquisitions.
McMoRan has maintained its disclosure controls and procedures that were in effect prior to the acquisition of the oil and gas properties from Newfield; although, it is currently integrating new personnel that will
contribute to McMoRan’s controls over financial reporting. McMoRan does not believe this transition will negatively affect its internal controls over financial reporting.
In addition, as a matter of course, McMoRan continues to update its internal controls over financial reporting as necessary to accommodate any modifications to its business processes or accounting procedures.
Our chief executive officer and chief financial officer, with the participation of management, have evaluated the effectiveness of our “disclosure controls and procedures” (as defined in Rules 13a-14(c) and 15d-14(c) under the Securities Exchange Act of 1934) as of the end of the period covered by this quarterly report on Form 10-Q. Based on their evaluation, they have concluded that our disclosure controls and procedures are effective in timely alerting them to material information relating to McMoRan (including our consolidated subsidiaries) required to be disclosed in our periodic Securities and Exchange Commission filings.
Item 1. Legal Proceedings.
We may from time to time be involved in various legal proceedings of a character normally incident to the ordinary course of our business. We believe that potential liability from any of these pending or threatened proceedings will not have a material adverse effect on our financial condition or results of operations. We maintain liability insurance to cover some, but not all, of the potential liabilities normally incident to the ordinary course of our businesses as well as other insurance coverages customary in our business, with coverage limits as we deem prudent.
Item 1A. Risk Factors.
For more information, please read Item 1A included in our Form 10-K for the year ended December 31, 2006.
Factors Relating to Financial Matters
Our substantial indebtedness, including the indebtedness incurred in connection with our recent acquisition of certain property interests and related assets from Newfield, could adversely affect our operating results and financial condition.
We incurred significant debt to fund the acquisition of certain property interests and related assets from Newfield. As of September 30, 2007, the outstanding principal amount of our indebtedness was approximately $1.3 billion (excluding unused availability under our revolving credit facility of approximately $0.3 billion after giving effect to outstanding letters of credit). Our level of indebtedness could have important consequences. For example, it could:
| · | make it difficult for us to satisfy our debt obligations; |
| · | increase our vulnerability to general adverse economic and industry conditions; |
| · | require us to dedicate a substantial portion of our cash flow from operations and proceeds of equity issuances or asset sales to payments on our indebtedness, thereby reducing the availability of cash flows to fund working capital, capital expenditures, acquisitions, investments and other general corporate purposes; |
| · | limit our flexibility in planning for, or reacting to, changes in our businesses and the markets in which we operate; |
| · | place us at a competitive disadvantage to our competitors that have less debt; and |
| · | limit our ability to borrow money or sell stock to fund our working capital, capital expenditures, acquisitions, and debt service requirements and other financing needs. |
In addition, we may need to incur additional indebtedness in the future in the ordinary course of business. The terms of our amended and restated credit facility and other agreements governing our indebtedness allow us to incur limited amounts of additional debt. If new debt is added to current debt levels, the risks described above could intensify. Further, if future debt financing is not available to us when required or is not available on acceptable terms, we may be unable to grow our business, take advantage of business opportunities, respond to competitive pressures or refinance maturing debt, any of which could have a material adverse effect on our operating results and financial condition.
Acquisitions involve risks, including unanticipated liabilities and expenses associated with acquired properties, difficulties in integrating acquired properties into our business, diversion of management attention, and increasing the scope and complexity of our operations.
On August 6, 2007, we completed the acquisition of substantially all of the proved property interests and related assets of Newfield on the outer continental shelf of the Gulf of Mexico. This acquisition had an effective date of July 1, 2007. Our review of the acquired property interests and related assets at the time of closing on August 6, 2007 was not comprehensive enough to uncover all existing or potential problems that could affect us as a result of the acquisition. Accordingly, it is possible that we will discover problems with an acquired property or asset that we did not anticipate at the time we completed the transaction. These problems may be material and could include, among other things, unexpected environmental problems, title defects or other liabilities. Often, we acquire properties on an “as is” basis, and have limited or no remedies against the seller with respect to these types of problems.
The failure to successfully integrate acquired operations into our existing operations may result in unforeseen operating difficulties and may require significant management attention and financial resources that would otherwise be available for the ongoing development or expansion of existing operations. Challenges involved in the integration process may include retaining key employees, maintaining key employee morale, addressing differences in business cultures, processes and systems and developing internal expertise regarding the acquired properties and assets.
We are responsible for reclamation, environmental and other obligations relating to (1) our former sulphur operations, including Main Pass and Port Sulphur and (2) our acquisition of certain property interests and related assets from Newfield.
In December 1997, we assumed responsibility for potential liabilities, including environmental liabilities, associated with the prior conduct of the businesses of our predecessors. Among these are potential liabilities arising from sulphur mines that were depleted and closed in the past in accordance with environmental laws in effect at the time, particularly in coastal or marshland areas that have experienced subsidence or erosion that has exposed previously buried pipelines and equipment. New laws or actions by governmental agencies calling for additional reclamation action on those closed operations could result in significant additional reclamation costs for us. We could also be subject to potential liability for personal injury or property damage relating to wellheads and other materials at closed mines in coastal areas that have become exposed through coastal erosion. As of September 30, 2007, we had accrued $10.3 million relating to reclamation liabilities with respect to our discontinued Main Pass sulphur operations (we have prepaid $2.6 million of this amount as of September 30, 2007), and $12.6 million relating to reclamation liabilities with respect to our other discontinued sulphur operations, including $11.4 million for the Port Sulphur facilities, for which we are pursuing various accelerated closure alternatives following damages sustained by the facilities from Hurricanes Katrina and Rita in 2005.
We also assumed responsibility for future liabilities associated with our acquisition of substantially all of the proved property interests and related assets of Newfield on the outer continental shelf of the Gulf of Mexico. Among these reclamation liabilities are the plugging and abandonment of wells, and reclamation and removal of platforms, facilities and pipelines and the repair and replacement of wells, equipment and facilities, including obligations associated with damages sustained by Hurricanes Ivan, Rita and Katrina. The scope and cost of these obligations may ultimately be materially greater than estimated at the time of the acquisition.
We cannot assure you that actual reclamation costs ultimately incurred will not exceed our current and future accruals for reclamation costs, that we will have the cash to fund these costs when incurred or that we will be able to satisfy applicable bonding requirements.
We are subject to indemnification obligations with respect to (1) the sulphur transportation and terminaling assets that we sold in June 2002, including sulphur and oil and gas obligations arising under environmental laws and (2) our acquisition of the Newfield properties.
We are subject to indemnification obligations with respect to the sulphur operations previously engaged in by us and our predecessor companies. In addition, we assumed, and agreed to indemnify IMC Global Inc. (now a subsidiary of the Mosaic Company) from certain potential obligations, including environmental obligations relating to historical oil and gas operations conducted by the Freeport-McMoRan companies prior to the 1997 merger of Freeport-McMoRan Inc. and IMC Global. We have also assumed and agree to indemnify Newfield from certain potential obligations, including environmental obligations relating to our acquisition of the Newfield properties. The scope and cost of these obligations may ultimately be materially greater than estimated at the time of the acquisition. Our liabilities with respect to those obligations could adversely affect our operations and liquidity.
The high-rate production characteristics of our Gulf of Mexico properties and our ownership interests in prospects subject to farm-out arrangements subject us to high reserve replacement needs.
Our future financial performance depends in large part on our ability to find, develop and produce oil and natural gas reserves, and we cannot make any assurances that we will be able to do so profitably. Unless we conduct successful exploration and development activities, acquire properties with proved reserves, or meet certain production and related thresholds in our prospects subject to farm-out arrangements, our proved reserves will decline as they are produced.
Producing natural gas and oil reservoirs are generally characterized by declining production rates that vary depending on reservoir characteristics and other factors. Production from the Gulf of Mexico shelf generally declines quicker than in other producing regions of the world. Reservoirs in the Gulf of Mexico shelf are generally sandstone reservoirs characterized by high porosity and high permeability that results in an accelerated recovery of production in a relatively short period of time, with a generally more rapid decline near the end of the life of the reservoir. This results in recovery of a relatively higher percentage of reserves during the initial years of production, and a corresponding need to replace these reserves with discoveries at new prospects at a relatively rapid rate.
Additionally, our ownership interests in prospects subject to farm-out or other exploration arrangements will revert to us only upon the achievement of a specified production threshold or the receipt of specified net production proceeds. As a result, significant discoveries on these prospects will be needed before we can increase our revenues or our proved oil and gas reserves. We cannot predict with certainty that our exploration or farm-out arrangements will result in an increase in our revenues or proved oil and gas reserves, or if they do result in an increase, when that increase might occur.
Factors Relating to Our Operations
Hedging our production may result in losses.
We entered into a credit agreement to fund our acquisition of the Newfield properties, which requires us to hedge 80 percent of our reasonably estimated oil and natural gas production from the acquired proved developed producing oil and gas properties for the years 2008 through 2010 as determined by reference to an initial reserve report. This hedging position reduces our exposure to fluctuations in the market prices of oil and natural gas. We may enter into additional oil and natural gas hedging contracts in order to increase credit availability. Hedging will expose us to risk of financial loss in some circumstances, including if:
| · | production is less than expected; |
| · | the other party to the contract defaults on its obligations; or |
| · | there is a change in the expected differential between the underlying price in the hedging agreement and actual prices received. |
In addition, hedging may limit the benefit we would otherwise receive from increases in the prices of oil and natural gas. Further, if we do not engage in hedging, we may be more adversely affected by changes in oil and natural gas prices than our competitors who engage in hedging.
Item 2. Unregistered Sales of Equity Securities and Use of Proceeds.
(c) Our Board of Directors has approved an open market share purchase program for up to 2.5 million shares. The program does not have an expiration date. No shares were purchased during the three-month period ended September 30, 2007 and 0.3 million shares remain available for purchase.
The following table sets forth information with respect to shares of common stock of McMoRan purchased by McMoRan during the three months ended September 30, 2007:
| | | | | | | | | | (d) Maximum Number |
| | | | | | | | (c) Total Number of | | (or Approximate |
| | | (a) Total | | | | | Shares (or Units) | | Dollar Value) of Shares |
| | | Number of | | (b) Average | | Purchased as Part of | | (or Units) That May |
| | | Shares (or Units) | | Price Paid Per | | Publicly Announced | | Yet Be Purchased Under |
| Period | | Purchased | | Share (or Unit) | | Plans or Programs | | the Plans or Programs |
| July 1-31, 2007 | | - | | $ | - | | - | | - |
| August 1-31, 2007 | | - | | | - | | - | | - |
| September 1-30, 2007 | | - | | | - | | - | | - |
| Total | | - | | $ | - | | - | | - |
| | | | | | | | | | |
Item 5. Other Information.
McMoRan EXPLORATION CO.
UNAUDITED PRO FORMA CONSOLIDATED STATEMENTS OF OPERATIONS
The following unaudited pro forma consolidated statements of operations and accompanying notes of McMoRan Exploration Co. (McMoRan or “the Company”) for nine months ended September 30, 2007 and for the year ended December 31, 2006 (the “Pro Forma Statements”), which have been prepared by the Company’s management, are derived from (a) the audited consolidated financial statements of the Company for the year ended December 31, 2006 included in its Annual Report on Form 10-K; (b) the unaudited consolidated financial statements of the Company for the nine months ended September 30, 2007 included in this Quarterly Report on Form 10-Q; (c) the audited statements of revenues and direct operating expenses of the properties acquired from Newfield Exploration Company (“Newfield”) (“the Acquired Properties”) for the year ended December 31, 2006; and (d) the unaudited statements of revenues and direct operating expenses of the Acquired Properties for the period from January 1, 2007 through August 5, 2007.
The Pro Forma Statements illustrate the effect on McMoRan’s historical results of operations of the purchase of oil and gas properties and exploration rights from Newfield for cash consideration of approximately $1.08 billion (“the Transaction”), including the Company incurring additional debt to fund the closing of the transaction, repay its existing $100 million senior term loan and provide additional working capital. The Pro Forma Statements are provided for illustrative purposes only and do not purport to represent what the Company’s results of operations would have been had the Acquired Properties been purchased on the dates indicated or results of operations for any future date or period. The unaudited pro forma condensed consolidated statements of operations for the year ending December 31, 2006 and for the nine months ended September 30, 2007 were prepared assuming the Transaction had occurred on January 1, 2006.
The Pro Forma Statements, including the related unaudited adjustments that are described in the accompanying notes, are based on currently available information and certain assumptions we believe are reasonable in connection with the Transaction. Certain of these assumptions, including purchase price allocation considerations, have been revised in preparing these updated pro forma financial statements from estimates used in preparing similar pro forma information included in the Company’s Current Report on Form 8K/A dated August 6, 2007 (filed September 27, 2007). These assumptions are subject to change (see Notes to Unaudited Pro Forma Consolidated Statements of Operations). Certain reclassifications of historical direct operating expenses of the oil and gas properties acquired from Newfield were made to conform with McMoRan’s historical financial statement classifications.
The Pro Forma Statements should be read in conjunction with (a) the historical consolidated financial statements and accompanying notes and “Management’s Discussion and Analysis of Financial Condition and Result of Operations,” which are set forth in McMoRan’s Annual Report on Form 10-K for the year ended December 31, 2006 and included herein in this Quarterly Report on Form 10-Q for the quarter ended September 30, 2007 and (b) the audited statements of revenues and direct operating expenses of certain oil and gas properties acquired from Newfield Exploration Company for the years ended December 31, 2006, 2005 and 2004 and the unaudited statements of revenues and direct operating expenses for the six months ended June 30, 2007 and 2006 as filed on the Current Report on Form 8-K/A dated August 6, 2007 (filed September 27, 2007).
McMoRan Exploration Co. | |
Unaudited Pro Forma Consolidated Statement of Operations | |
For Year Ending December 31, 2006 | |
(amounts in thousands) | |
| | |
| | McMoRan | | Newfield | | | | | | | |
| | Historical | | Properties | | Adjustments | | Pro Forma | |
Revenues: | | | | | | | | | | | | |
| Oil & Gas | $ | 196,717 | | $ | 619,307 | | $ | (15,560 | ) a | $ | 800,464 | |
| Service | | 13,021 | | | - | | | 9,306 | b | | 22,327 | |
| Total revenues | | 209,738 | | | 619,307 | | | (6,254 | ) | | 822,791 | |
| | | | | | | | | | | | | |
Costs and expenses: | | | | | | | | | | | | |
| Production and delivery costs | | 53,134 | | | 152,383 | | | 5,766 | a,b | | 211,283 | |
| Revenues in excess of direct operating expenses | | 156,604 | | | 466,924 | | | (12,020 | ) | | 611,508 | |
| Depletion, depreciation and amortization | | 104,724 | | | | | | 149,549 | c | | 264,173 | |
| | | | | | | | | 9,900 | d | | | |
| Exploration expenses | | 67,737 | | | | | | - | | | 67,737 | |
| General and administrative expenses | | 20,727 | | | | | | 16,800 | e | | 37,527 | |
Start-up costs for Main Pass Energy Hub™ | | 10,714 | | | | | | - | | | 10,714 | |
| Exploration expense reimbursement | | (10,979 | ) | | | | | - | | | (10,979 | ) |
| Litigation settlement, net of insurance proceeds | | (446 | ) | | | | | - | | | (446 | ) |
| Insurance recovery | | (3,306 | ) | | | | | - | | | (3,306 | ) |
| Operating income (loss) | | (32,567 | ) | | | | | (188,269 | ) | | 246,088 | |
| Interest expense, net | | (10,203 | ) | | | | | (121,080 | )f | | (136,126 | ) |
| | | | | | | | | (4,843 | )g | | | |
| Other expense, net | | (1,946 | ) | | | | | - | | | (1,946 | ) |
| Income (loss) from continuing operations before | | | | | | | | | | | | |
| income taxes | | (44,716 | ) | | | | | (314,192 | ) | | 108,016 | |
| Income tax provision | | - | | | | | | (2,160 | )h | | (2,160 | ) |
Income (loss) from continuing operations before preferred dividends and amortization of related issuance costs | | (44,716 | ) | | | | | (316,352 | ) | | 105,856 | |
| Preferred dividends and amortization of | | | | | | | | | | | | |
| convertible preferred stock issuance costs | | (1,615 | ) | | | | | - | | | (1,615 | ) |
| Income (loss) from continuing operations | $ | (46,331 | ) | | | | $ | (316,352 | ) | $ | 104,241 | |
| | | | | | | | | | | | | |
| Income (loss) per share of common stock from continuing operations: | | | | | | | | | | | | |
| Basic | | $(1.66 | ) | | | | | | | | $3.73 | |
| Diluted | | $(1.66 | ) | | | | | | | | $2.04 | |
| | | | | | | | | | | | | |
| Average common shares outstanding: | | | | | | | | | | | | |
| Basic | | 27,930 | | | | | | | | | 27,930 | |
| Diluted | | 27,930 | | | | | | | | | 50,992 | |
See accompanying notes.
McMoRan Exploration Co.
Unaudited Pro Forma Consolidated Statement of Operations
For the Nine Months Ending September 30, 2007
(amounts in thousands)
| | | | Newfield Properties | | | | | |
| | | | | | Period | | | | | |
| | | | Six Months | | From July 1, | | | | | |
| | | | Ended | | 2007 through | | | | | |
| | McMoRan | | June 30, | | August 5, | | | | | |
| | Historical | | 2007 | | 2007 | | Adjustments | | Pro Forma | |
Revenues: | | | | | | | | | | | | | | | |
| Oil & Gas | $ | 227,381 | | $ | 342,158 | | $ | 68,857 | | $ | (11,423 | ) a | $ | 626,973 | |
| Service | | 2,916 | | | - | | | 644 | | | 7,147 | b | | 10,707 | |
| Total revenues | | 230,297 | | | 342,158 | | | 69,501 | | | (4,276 | ) | | 637,680 | |
| | | | | | | | | | | | | | | | |
Costs and expenses: | | | | | | | | | | | | | | | |
| Production and delivery costs | | 72,543 | | | 121,536 | | | 17,375 | | | 4,912 | a,b | | 216,366 | |
| Revenues in excess of direct operating | | | | | | | | | | | | | | | |
| expenses | | 157,754 | | | 220,622 | | $ | 52,126 | | | (9,188 | ) | | 421,314 | |
| Depletion, depreciation and amortization | | 127,579 | | | | | | | | | 123,646 | c | | 257,000 | |
| | | | | | | | | | | | 5,775 | d | | | |
| Exploration expenses | | 52,163 | | | | | | | | | - | | | 52,163 | |
| General and administrative expenses | | 17,804 | | | | | | | | | 9,907 | e | | 27,711 | |
| Gain on oil & gas derivative contracts | | (10,695 | ) | | | | | | | | - | | | (10,695 | ) |
Start-up costs for Main Pass Energy Hub™ | | 7,802 | | | | | | | | | - | | | 7,802 | |
| Operating income (loss) | | (36,899 | ) | | | | | | | | (148,516 | ) | | 87,333 | |
| Interest expense, net | | (34,296 | ) | | | | | | | | (72,648 | )f | | (103,862 | ) |
| | | | | | | | | | | | (2,826 | )g | | | |
| | | | | | | | | | | | 5,908 | i | | | |
| Other expense, net | | (876 | ) | | | | | | | | - | | | (876 | ) |
| Loss from continuing operations | | | | | | | | | | | | | | | |
| before income taxes | | (72,071 | ) | | | | | | | | (218,082 | ) | | (17,405 | ) |
| Income tax provision | | - | | | | | | | | | - | | | - | |
| Loss from continuing operations | | | | | | | | | | | | | | | |
| before preferred dividends and | | | | | | | | | | | | | | | |
| amortization of related issuance costs | | (72,071 | ) | | | | | | | | (218,082 | ) | | (17,405 | ) |
| Preferred dividends and amortization of | | | | | | | | | | | | | | | |
| convertible preferred stock issuance costs | | (1,552 | ) | | | | | | | | - | | | (1,552 | ) |
| Loss from continuing operations | $ | (73,623 | ) | | | | | | | $ | (218,082 | ) | $ | (18,957 | ) |
| | | | | | | | | | | | | | | | |
| Basic and diluted net loss per share of | | | | | | | | | | | | | | | |
| common stock from continuing operations: | | $(2.40 | ) | | | | | | | | | | | $(0.62 | ) |
| | | | | | | | | | | | | | | | |
| Basic and diluted average common shares outstanding: | | 30,644 | | | | | | | | | | | | 30,644 | |
Unaudited Notes to Pro Forma Consolidated Statement of Operations
Pro Forma Financial Information Assumptions
The unaudited pro forma condensed consolidated statement of operations for the year ended December 31, 2006 and the nine months ended September 30, 2007 reflect the following adjustments.
| a. | Reflects elimination of the revenues and direct operating expenses for one field where a third party working interest owner exercised its preferential rights prior to closing of the transaction resulting in the property not being sold to McMoRan as originally planned. |
| b. | Reflects reimbursement of standard industry operating overhead costs attributable to the acquired properties, which are not included in the statements of revenues and direct operating expenses, totaling $3.1 million for the year ended December 31, 2006 and $2.0 million for the nine months ended September 30, 2007. Also reflects reclassification of amounts recorded in the Newfield Properties financial statements for production and handling fees to conform to historical McMoRan presentation. Reclassified amounts from direct operating expenses to service revenues totaled $6.2 million for the year ended December 31, 2006 and $7.8 million for the nine months ended September 30, 2007. |
c. | McMoRan follows the successful efforts method of accounting. Accordingly its depletion, depreciation and amortization expense is calculated on a field by field basis using the units of production method. Production for the Newfield Properties totaled approximately 81.0 Bcfe for 2006 and 64.8 Bcfe for the nine months ended September 30, 2007. Based on preliminary valuation estimates of the fair value of the assets acquired and liabilities assumed in the transaction, McMoRan allocated approximately $38 million of its approximate $1.3 billion purchase price to unproven properties, which are currently not subject to depreciation, depletion and amortization charges. McMoRan expects to substantially complete its valuation of the assets acquired and liabilities assumed by year end 2007, which may result in changes in the amount of the purchase price allocated not only to unproved properties but also to well equipment and facilities, which will be depreciated on a units of production basis over the related proved developed oil and gas reserves. |
| d. | Represents accretion of discount on asset retirement obligation associated with Newfield properties. With respect to the year ended December 31, 2006, the accretion adjustment amount presented herein differs from that which was previously filed with McMoRan’s Form 8-K/A dated August 6, 2007 based upon updated information as to current estimated timing of estimated reclamation work to be performed related to the acquired properties. McMoRan has not yet fully completed its evaluation of its assumed reclamation obligations associated with the transaction and expects additional changes may be required upon finalizing its reclamation obligation assessments. McMoRan anticipates finalizing these assessments by year end 2007. |
| e. | Represents continuing annualized incremental general and administrative costs directly relating to the acquisition for compensation expense associated with former Newfield and newly-hired personnel retained by McMoRan that are required to administer the operation of the Newfield properties and facility costs associated with establishing a new office location in Houston, Texas. |
| f. | Represents interest expense on $800 million bridge loan facility at an assumed annual average interest rate of 11 percent. McMoRan intends to refinance the bridge loan with long term notes, equity and equity-linked securities. Interest on the $394 million of borrowings under the senior secured revolving credit facility is based on an assumed average annual interest rate of 7.5 percent. The $100 million drawn under the letter of credit provision of the revolving credit facility accrues interest at an annual rate of 2.5 percent, and there is an annual 0.5 percent unused commitment fee. |
McMoRan’s bridge loan facility accrues interest at an effective annual rate of at least 10 percent but not exceeding 12 percent. The current rate under the bridge loan facility is 10 percent. The revolver is also subject to variable interest rates with rates stated in the paragraph above approximating
the market interest rates at the time of the acquisition. If the effective annual interest rates were to increase or decrease by 0.125 percent from the amounts disclosed above, the pro forma interest expense would change by approximately $1.9 million.
| g. | Represents the current amortization of debt issuance costs associated with the five-year senior secured revolving credit facility and the seven-year bridge loan facility. |
| h. | There were no pro forma adjustments for the income tax effects of the purchase price allocation reflected in the accompanying pro forma financial statements because of McMoRan’s substantial net deferred tax asset position prior to and after the effects of the acquisition of the Newfield Properties which, for historical and pro forma reporting purposes, has been reduced to zero by a full valuation allowance reserve. A full valuation allowance has been established against such net deferred tax assets because of McMoRan’s history of operating losses and the related limitations imposed against recognizing deferred tax assets under generally accepted accounting principles when a company has a history of cumulative operating losses generated in recent years. |
For purposes of the pro forma statement of operations, it is assumed that McMoRan has the ability to fully offset its regular taxable income through the use of existing net operating loss carryforwards (“NOLs”). However, under the alternative minimum tax rules, use of the NOLs is limited to 90 percent of the alternative minimum taxable income (“AMTI”). Therefore, for pro forma presentation purposes, the alternative minimum tax rate of 20 percent was applied to the remaining 10 percent of the AMTI, resulting in an effective 2 percent tax rate, which represents McMoRan’s current applicable effective tax rate.
Internal Revenue Code Section 382 (“Section 382”), includes provisions that if a change of control (as defined) occurs with respect to McMoRan’s equity ownership, McMoRan could be limited with respect to the amount of NOLs that may be used annually to offset future taxable income, if any. Currently, McMoRan believes that no recent change of control has occurred that would limit its ability to utilize its NOLs. However, as discussed in footnote (a) above, McMoRan intends to refinance its interim Bridge Loan Facility through the issuance of long-term notes, equity and/or equity linked securities, the impact of which could result in future changes in control of McMoRan’s stock. For purposes of the pro forma statements of operations, it is assumed Section 382 will not limit the use of McMoRan’s NOLs.
| i. | Represents removal of the related interest costs associated with the senior secured term loan that was finalized on January 19, 2007, repayment of which was required under the financing arrangements used to fund the acquisition of the Newfield Properties. |
Item 6. Exhibits.
The exhibits to this report are listed in the Exhibit Index appearing on page E-1 hereof.
McMoRan Exploration Co.
Pursuant to the requirements of the Securities Exchange Act of 1934, the registrant has duly caused this report to be signed on its behalf by the undersigned thereunto duly authorized.
McMoRan Exploration Co.
By: /s/ C. Donald Whitmire, Jr.
C. Donald Whitmire, Jr.
Vice President and Controller-
Financial Reporting
(authorized signatory and
Principal Accounting Officer)
Date: October 31, 2007
Table of Contents
McMoRan Exploration Co.
Exhibit Number
| 2.1 | Agreement and Plan of Merger dated as of August 1, 1998. (Incorporated by reference to Annex A to McMoRan’s Registration Statement on Form S-4 (Registration No. 333-61171) filed with the SEC on October 6, 1998 (the McMoRan S-4)). |
| | |
| 3.1 | Amended and Restated Certificate of Incorporation of McMoRan. (Incorporated by reference to Exhibit 3.1 to McMoRan’s 1998 Annual Report on Form 10-K (the McMoRan 1998 Form 10-K)). |
| | |
| 3.2 | Certificate of Amendment to the Amended and Restated Certificate of Incorporation of McMoRan. (Incorporated by reference to Exhibit 3.2 of McMoRan’s First-Quarter 2003 Form 10-Q). |
| | |
| 3.3 | Amended and Restated By-Laws of McMoRan as amended effective January 30, 2006. (Incorporated by reference to Exhibit 3.3 to McMoRan’s Current Report on Form 8-K dated January 30, 2006 (filed February 3, 2006)). |
| | |
| 4.1 | Form of Certificate of McMoRan Common Stock (Incorporated by reference to Exhibit 4.1 of the McMoRan S-4). |
| | |
| 4.2 | Rights Agreement dated as of November 13, 1998. (Incorporated by reference to Exhibit 4.2 to McMoRan 1998 Form 10-K). |
| | |
| 4.3 | Amendment to Rights Agreement dated December 28, 1998. (Incorporated by reference to Exhibit 4.3 to McMoRan 1998 Form 10-K). |
| | |
| 4.4 | Standstill Agreement dated August 5, 1999 between McMoRan and Alpine Capital, L.P., Robert W. Bruce III, Algenpar, Inc, J. Taylor Crandall, Susan C. Bruce, Keystone, Inc., Robert M. Bass, the Anne T. and Robert M. Bass Foundation, Anne T. Bass and The Robert Bruce Management Company, Inc. Defined Benefit Pension Trust. (Incorporated by reference to Exhibit 4.4 to McMoRan’s Third Quarter 1999 Form 10-Q). |
| | |
| 4.5 | Certificate of Designations of McMoRan Preferred Stock. (Incorporated by reference to Exhibit 4.6 to McMoRan’s Third Quarter 2002 Form 10-Q). |
| | |
| 4.6 | Warrant to Purchase Shares of Common Stock of McMoRan dated December 16, 2002. (Incorporated by reference to Exhibit 4.7 to McMoRan’s 2002 Form 10-K). |
| | |
| 4.7 | Warrant to Purchase Shares of Common Stock of McMoRan dated September 30, 2003. (Incorporated by reference to Exhibit 4.8 to McMoRan’s 2003 Form 10-K). |
| | |
| 4.8 | Registration Rights Agreement dated December 16, 2002 between McMoRan and K1 USA Energy Production Corporation. (Incorporated by reference to Exhibit 4.8 to McMoRan’s 2002 Form 10-K). |
| 4.9 | Indenture dated as of July 2, 2003 by and between McMoRan and The Bank of New York, as trustee. (Incorporated by reference to Exhibit 4.9 to McMoRan’s Second Quarter 2003 Form 10-Q). |
| 4.10 | Collateral Pledge and Security Agreement dated as of July 2, 2003 by and among McMoRan, as pledgor, The Bank of New York, as trustee, and the Bank of New York, as collateral agent. (Incorporated by reference to Exhibit 4.11 to McMoRan’s Second Quarter 2003 Form 10-Q). |
| | |
| 4.11 | Purchase Agreement dated September 30, 2004, by and among McMoRan Exploration Co., Merrill Lynch & Co., Merrill Lynch, Pierce, Fenner & Smith Incorporated, and J.P. Morgan Securities Inc. (Incorporated by reference to Exhibit 99.2 to McMoRan’s Current Report on Form 8-K dated October 6, 2004 (filed October 7, 2004). |
| | |
| 4.12 | Indenture dated October 6, 2004 by and among McMoRan and the Bank of New York, as trustee. (Incorporated by reference to Exhibit 99.3 to McMoRan’s Current Report on Form 8-K dated October 6, 2004 (filed October 7, 2004)). |
| | |
| 4.13 | Collateral Pledge and Security Agreement dated October 6, 2004 by and among McMoRan, as pledgor, The Bank of New York, as trustee and the Bank of New York, as collateral agent. (Incorporated by reference to Exhibit 99.4 to McMoRan’s Current Report on Form 8-K dated October 6, 2004 (filed October 7, 2004)). |
| | |
| 4.14 | Registration Rights Agreement dated October 6, 2004 by and among McMoRan, as issuer and Merrill Lynch, Pierce, Fenner & Smith Incorporated, J.P. Morgan Securities Inc. and Jefferies & Company, Inc. as Initial Purchasers. (Incorporated by reference to Exhibit 99.5 to McMoRan’s Current Report on Form 8-K dated October 6, 2004 (filed October 7, 2004)). |
| | |
| 10.1 | Main Pass 299 Sulphur and Salt Lease, effective May 1, 1988. (Incorporated by reference to Exhibit 10.1 to McMoRan’s 2001 Annual Report on Form 10-K (the McMoRan 2001 Form 10-K)). |
| | |
| 10.2 | IMC Global/FSC Agreement dated as of March 29, 2002 among IMC Global Inc., IMC Global Phosphate Company, Phosphate Resource Partners Limited Partnership, IMC Global Phosphates MP Inc., MOXY and McMoRan. (Incorporated by reference to Exhibit 10.10 to McMoRan’s Second Quarter 2002 Form 10-Q). |
| | |
| 10.3 | Amended and Restated Services Agreement dated as of January 1, 2002 between McMoRan and FM Services Company. (Incorporated by reference to Exhibit 10.3 to McMoRan’s Second Quarter 2003 Form 10-Q). |
| | |
| 10.4 | Letter Agreement dated August 22, 2000 between Devon Energy Corporation and Freeport Sulphur. (Incorporated by reference to Exhibit 10.36 to McMoRan’s Third Quarter 2000 Form 10-Q). |
| | |
| 10.5 | Asset Purchase Agreement dated effective December 1, 1999 between SOI Finance Inc., Shell Offshore Inc. and MOXY. (Incorporated by reference to Exhibit 10.33 to McMoRan’s 1999 Form 10-K). |
| | |
| 10.6 | Employee Benefits Agreement by and between Freeport-McMoRan Inc. and Freeport Sulphur (Incorporated by reference to Exhibit 10.29 to McMoRan’s 2001 Form 10-K). |
| | |
| 10.7 | Purchase and Sales agreement dated January 25, 2002 but effective January 1, 2002 by and between MOXY and Halliburton Energy Services, Inc. (Incorporated by reference to Exhibit 10.1 to McMoRan’s Current Report on Form 8-K dated February 22, 2002). |
| | |
| 10.8 | Purchase and Sale Agreement dated as of March 29, 2002 by and among Freeport Sulphur, McMoRan, MOXY and Gulf Sulphur Services Ltd., LLP. (Incorporated by reference to Exhibit 10.37 to McMoRan’s First Quarter 2002 Form 10-Q.) |
| | |
| 10.9 | Purchase and Sale Agreement dated May 9, 2002 by and between MOXY and El Paso Production Company. (Incorporated by reference to Exhibit 10.28 to McMoRan’s Second Quarter 2002 Form 10-Q). |
| | |
| 10.10 | Amendment to Purchase and Sale Agreement dated May 22, 2002 by and between MOXY and El Paso Production Company. (Incorporated by reference to Exhibit 10.29 to McMoRan’s Second Quarter 2002 Form 10-Q). |
| | |
| 10.11 | Master Agreement dated October 22, 2002 by and among Freeport-McMoRan Sulphur LLC, K-Mc Venture LLC, K1 USA Energy Production Corporation and McMoRan (Incorporated by reference to Exhibit 10.18 to McMoRan’s 2002 Form 10-K). |
| | |
| 10.12 | Credit Agreement dated as of April 19, 2006 among McMoRan Oil & Gas LLC as borrower, JP Morgan Chase Bank, N.A., as administrative agent, Toronto-Dominion (Texas) LLC, as syndication agent and the Lenders Party Hereto. (Incorporated by reference to Exhibit 10.1 to McMoRan’s Current Report on Form 8-K dated April 19, 2006). |
| | |
| 10.13 | First Amendment to Credit Agreement effective January 19, 2007 among McMoRan Oil & Gas LLC as borrower, JP Morgan Chase Bank, N.A, as administrative agent, Toronto-Dominion (Texas) LLC, as syndication agent and the Lenders Party Hereto (Incorporated by reference to Exhibit 10.14 to McMoRan’s 2006 Form 10-K) . |
| | |
| Amended and Restated Credit Agreement dated as of August 6, 2007, among McMoRan Exploration Co., as parent, McMoRan Oil & Gas LLC, as borrower, JPMorgan Chase Bank, N.A., Merrill Lynch Capital, a division of Merrill Lynch Business Financial Services, Inc., as syndication agent, BNP Paribas, as documentation agent, and the lenders party thereto. |
| | |
| Credit Agreement dated as of August 1, 2007, among McMoRan Exploration Co., as borrower, JPMorgan Chase Bank, N.A., as administrative agent, and the lenders party thereto. |
| | |
| | Executive and Director Compensation Plans and Arrangements (Exhibits 10.16 through 10.37). |
| | |
| 10.16 | McMoRan Adjusted Stock Award Plan, as amended and restated. (Incorporated by reference to Exhibit 10.15 to McMoRan’s First-Quarter 2007 Form 10-Q). |
| | |
| 10.17 | McMoRan 1998 Stock Option Plan, as amended and restated. (Incorporated by reference to Exhibit 10.16 to McMoRan’s First-Quarter 2007 Form 10-Q). |
| | |
| 10.18 | McMoRan 1998 Stock Option Plan for Non-Employee Directors, as amended and restated. (Incorporated by reference to Exhibit 10.17 to McMoRan’s First-Quarter 2007 Form 10-Q). |
| | |
| 10.19 | McMoRan Form of Notice of Grant of Nonqualified Stock Options under the 1998 Stock Option Plan. (Incorporated by reference to Exhibit 10.15 to McMoRan’s Second Quarter 2005 Form 10-Q). |
| | |
| 10.20 | McMoRan 2000 Stock Incentive Plan, as amended and restated. (Incorporated by reference to Exhibit 10.19 to McMoRan’s First-Quarter 2007 Form 10-Q). |
| | |
| 10.21 | McMoRan Form of Notice of Grant of Nonqualified Stock Options under the 2000 Stock Incentive Plan. (Incorporated by reference to Exhibit 10.17 to McMoRan’s Second Quarter 2005 Form 10-Q). |
| | |
| 10.22 | McMoRan 2001 Stock Incentive Plan, as amended and restated. (Incorporated by reference to Exhibit 10.21 to McMoRan’s First-Quarter 2007 Form 10-Q). |
| | |
| 10.23 | McMoRan 2003 Stock Incentive Plan, as amended and restated. (Incorporated by reference to Exhibit 10.22 to McMoRan’s First-Quarter 2007 Form 10-Q). |
| | |
| 10.24 | McMoRan’s Performance Incentive Awards Program as amended effective February 1, 1999. (Incorporated by reference to Exhibit 10.18 to McMoRan’s 1998 Form 10-K). |
| | |
| 10.25 | McMoRan Form of Notice of Grant of Nonqualified Stock Options under the 2001 Stock Incentive Plan. (Incorporated by reference to Exhibit 10.21 to McMoRan’s Second Quarter 2005 Form 10-Q). |
| 10.26 | McMoRan Form of Restricted Stock Unit Agreement Under the 2001 Stock Incentive Plan. |
| | |
| 10.27 | McMoRan Exploration Co. Executive Services Program (Incorporated by reference to Exhibit 10.8 to McMoRan’s May 1, 2006 Form 8-K). |
| | |
| 10.28 | McMoRan Form of Notice of Grants of Nonqualified Stock Options under the 2003 Stock Incentive Plan. (Incorporated by reference to Exhibit 10.24 to McMoRan’s Second Quarter 2005 Form 10-Q). |
| | |
| 10.29 | McMoRan Form of Restricted Stock Unit Agreement Under the 2003 Stock Incentive Plan. |
| | |
| 10.30 | McMoRan 2004 Director Compensation Plan, as amended and restated. (Incorporated by reference to Exhibit 10.29 to McMoRan’s First-Quarter 2007 Form 10-Q). |
| | |
| 10.31 | Form of Amendment No. 1 to Notice of Grant of Nonqualified Stock Options under the 2004 Director Compensation Plan. (Incorporated by reference to Exhibit 10.7 to McMoRan’s May 1, 2006 Form 8-K). |
| | |
| 10.32 | Agreement for Consulting Services between Freeport-McMoRan Inc. and B. M. Rankin, Jr. effective as of January 1, 1991) (assigned to FM Services Company as of January 1, 1996); as amended on December 15, 1997 and on December 7, 1998. (Incorporated by reference to Exhibit 10.32 to McMoRan’s 1998 Form 10-K). |
| | |
| 10.33 | Supplemental Letter Agreement between FM Services Company and B.M. Rankin, Jr. effective as of January 1, 2007 (Incorporated by reference to Exhibit 10.32 to McMoRan’s 2006 Form 10-K). |
| | |
| 10.34 | McMoRan Director Compensation. (Incorporated by reference to Exhibit 10.27 to McMoRan’s 2004 Form 10-K). |
| | |
| 10.35 | McMoRan Exploration Co. 2005 Stock Incentive Plan, as amended and restated. (Incorporated by reference to Exhibit 10.34 to McMoRan’s First-Quarter 2007 Form 10-Q). |
| | |
| 10.36 | Form of Notice of Grant of Nonqualified Stock Options under the 2005 Stock Incentive Plan. (Incorporated by reference to Exhibit 10.2 to McMoRan’s Current Report on Form 8-K filed May 6, 2005). |
| | |
| 10.37 | Form of Restricted Stock Unit Agreement under the 2005 Stock Incentive Plan. |
| | |
| 10.38 | Purchase and Sale Agreement dated June 20, 2007 by and between Newfield Exploration Company as Seller and McMoRan Oil & Gas LLC as Buyer effective July 1, 2007. (Incorporated by reference to Exhibit 99.1 to McMoRan’s Current Report on Form 8-K dated June 21, 2007 (filed on June 22, 2007)). |
| Letter dated October 30, 2007 from Ernst & Young LLP regarding unaudited interim financial statements. |
| | |
| Certification of Principal Executive Officer pursuant to Rule 13a–14(a)/15d-14(a). |
| | |
| Certification of Principal Financial Officer pursuant to Rule 13a–14(a)/15d-14(a). |
| | |
| Certification of Principal Executive Officer pursuant to 18 U.S.C. Section 1350. |
| | |
| Certification of Principal Financial Officer pursuant to 18 U.S.C. Section 1350. |