Exhibit (c)-3
The Special Committee of the Board of Directors of McMoRan Exploration Co. Preliminary Discussion Materials November 21, 2012
EVERCORE PARTNERS

These materials have been prepared by Evercore Group L.L.C. (“Evercore”) for the Special Committee of the Board of Directors of McMoRan Exploration Co. (the “Special Committee” or the “Company”) to whom such materials are directly addressed and delivered and may not be used or relied upon for any purpose other than as specifically contemplated by a written agreement with Evercore. These materials are based on information provided by or on behalf of the Company, from public sources or otherwise reviewed by Evercore. Evercore assumes no responsibility for independent investigation or verification of such information and has relied on such information being complete and accurate in all material respects. To the extent such information includes estimates and forecasts of future financial performance prepared by or reviewed with the management of the Company or obtained from public sources, Evercore has assumed that such estimates and forecasts have been reasonably prepared on bases reflecting the best currently available estimates and judgments of such management (or, with respect to estimates and forecasts obtained from public sources, represent reasonable estimates). No representation or warranty, express or implied, is made as to the accuracy or completeness of such information and nothing contained herein is, or shall be relied upon as, a representation, whether as to the past, the present or the future. These materials were designed for use by specific persons familiar with the business and affairs of the Company. These materials are not intended to provide the sole basis for evaluating, and should not be considered a recommendation with respect to, any transaction or other matter. These materials have been developed by and are proprietary to Evercore and were prepared exclusively for the benefit and internal use of the Company.
These materials were compiled on a confidential basis for use of the Company in evaluating the potential transaction described herein and not with a view to public disclosure or filing thereof under state or federal securities laws, and may not be reproduced, disseminated, quoted or refer red to, in whole or in part, without the prior written consent of Evercore.
These materials do not constitute an offer or solicitation to sell or purchase any securities and are not a commitment by Evercore (or any affiliate) to provide or arrange any financing for any transaction or to purchase any security in connection therewith. Evercore assumes no obligation to update or otherwise revise these materials. These materials may not reflect information known to other professionals in other business areas of Evercore and its affiliates.
Evercore and its affiliates do not provide legal, accounting or tax advice. Accordingly, any statements contained herein as to tax matters were neither written nor intended by Evercore or its affiliates to be used and cannot be used by any taxpayer for the purpose of avoiding tax penalties that may be imposed on such taxpayer. Each person should seek legal, accounting and tax advice based on his, her or its particular circumstances from independent advisors regarding the impact of the transactions or matters described herein.
EVERCORE PARTNERS
Preliminary Discussion Materials
Confidential
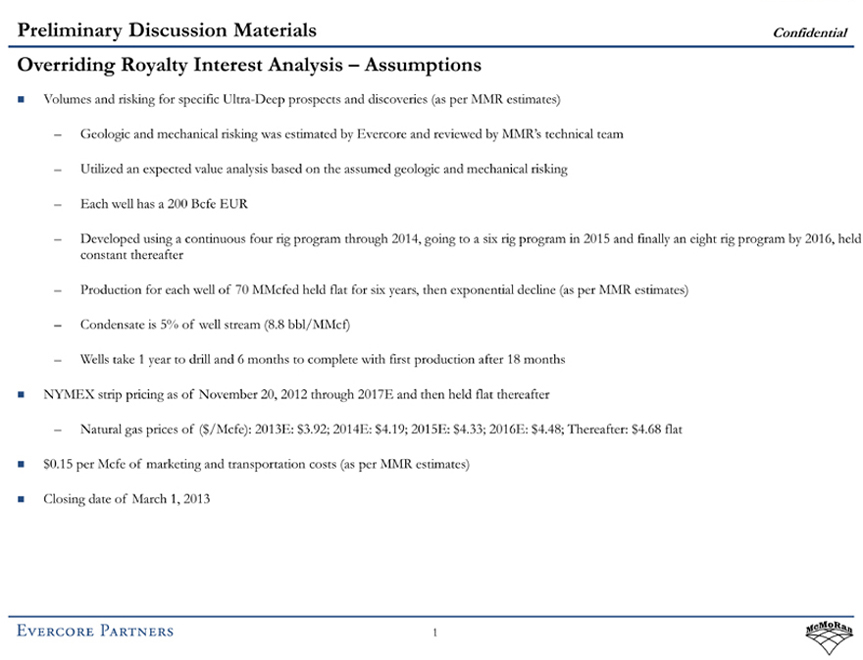
Overriding Royalty Interest Analysis – Assumptions
Volumes and risking for specific Ultra-Deep prospects and discoveries (as per MMR estimates)
Geologic and mechanical risking was estimated by Evercore and reviewed by MMR’s technical team
Utilized an expected value analysis based on the assumed geologic and mechanical risking
Each well has a 200 Bcfe EUR
Developed using a continuous four rig program through 2014, going to a six rig program in 2015 and finally an eight rig program by 2016, held constant thereafter
Production for each well of 70 MMcfed held flat for six years, then exponential decline (as per MMR estimates)
Condensate is 5% of well stream (8.8 bbl/MMcf)
Wells take 1 year to drill and 6 months to complete with first production after 18 months NYMEX strip pricing as of November 20, 2012 through 2017E and then held flat thereafter
Natural gas prices of ($/Mcfe): 2013E: $3.92; 2014E: $4.19; 2015E: $4.33; 2016E: $4.48; Thereafter: $4.68 flat $0.15 per Mcfe of marketing and transportation costs (as per MMR estimates) Closing date of March 1, 2013
EVERCORE PARTNERS

Preliminary Discussion Materials
Confidential
Overriding Royalty Interest – Risked
($ in millions, except per share values)
Overriding Royalty Interest Summary – Risked
2013E 2014E 2015E 2016E 2017E 2018E 2019E 2020E 2021E 2022E
Risked
Ultra Deep Revenue $ — $56.4 $267.3 $506.3 $842.0 $1,231.3 $1,671.3 $2,077.5 $2,190.6 $2,220.4
Marketing and Transportation Costs — (1.8) (8.3) (15.2) (24.5) (35.8) (48.6) (60.4) (63.7) (64.6)
Severance and Ad Valorem Taxes — — — — — — — (2.2) (13.2) (25.1)
Net Ultra Deep Revenue $— $54.6 $259.1 $491.1 $817.5 $1,195.5 $1,622.7 $2,014.9 $2,113.7 $2,130.7
Overriding Royalty Interest
4.0% of Revenue $ — $2.2 $10.4 $19.6 $32.7 $47.8 $64.9 $80.6 $84.5 $85.2
Risked Sensitivity (Strip Pricing) – Term (Total Value)
Discount Rate
Term
$374.9 5 Years 10 Years 15 Years 20 Years Life
8.0% $54.4 $258.8 $392.1 $446.1 $549.4
9.0% 52.5 243.2 362.4 408.5 484.8
10.0% 50.8 228.7 335.5 374.9 431.9
11.0% 49.1 215.3 311.0 344.8 387.9
12.0% 47.5 202.8 288.8 317.8 350.6
15.0% 43.1 170.5 233.1 251.6 266.9
20.0% 36.9 129.8 167.4 176.4 181.2
Risked Sensitivity (Strip Pricing) – Term ($/Share)
Discount Rate
Term
$1.62 5 Years 10 Years 15 Years 20 Years Life
8.0% $0.23 $1.12 $1.69 $1.93 $2.37
9.0% 0.23 1.05 1.56 1.76 2.09
10.0% 0.22 0.99 1.45 1.62 1.86
11.0% 0.21 0.93 1.34 1.49 1.67
12.0% 0.21 0.88 1.25 1.37 1.51
15.0% 0.19 0.74 1.01 1.09 1.15
20.0% 0.16 0.56 0.72 0.76 0.78
Risked Sensitivity (20 Year Term) – Price (Total Value)
Discount Rate
Price Deck
Strip $75/ $3 $90/ $4 $105/ $5
8.0% $446.1 $296.7 $392.7 $488.8
9.0% 408.5 271.8 359.7 447.7
10.0% 374.9 249.5 330.2 410.9
11.0% 344.8 229.5 303.7 378.0
12.0% 317.8 211.5 280.0 348.4
15.0% 251.6 167.6 221.8 276.0
20.0% 176.4 117.7 155.7 193.8
Risked Sensitivity (20 Year Term) – Price ($/Share)
Discount Rate
Price Deck
Strip $75/ $3 $90/ $4 $105/ $5
8.0% $1.93 $1.28 $1.70 $2.11
9.0% 1.76 1.17 1.55 1.93
10.0% 1.62 1.08 1.43 1.77
11.0% 1.49 0.99 1.31 1.63
12.0% 1.37 0.91 1.21 1.50
15.0% 1.09 0.72 0.96 1.19
20.0% 0.76 0.51 0.67 0.84
Note: Based on a $17.00 per share aggregate implied offer value, 231.6 million fully diluted shares and a March 1, 2013 closing date.
EVERCORE PARTNERS
Preliminary Discussion Materials
Confidential
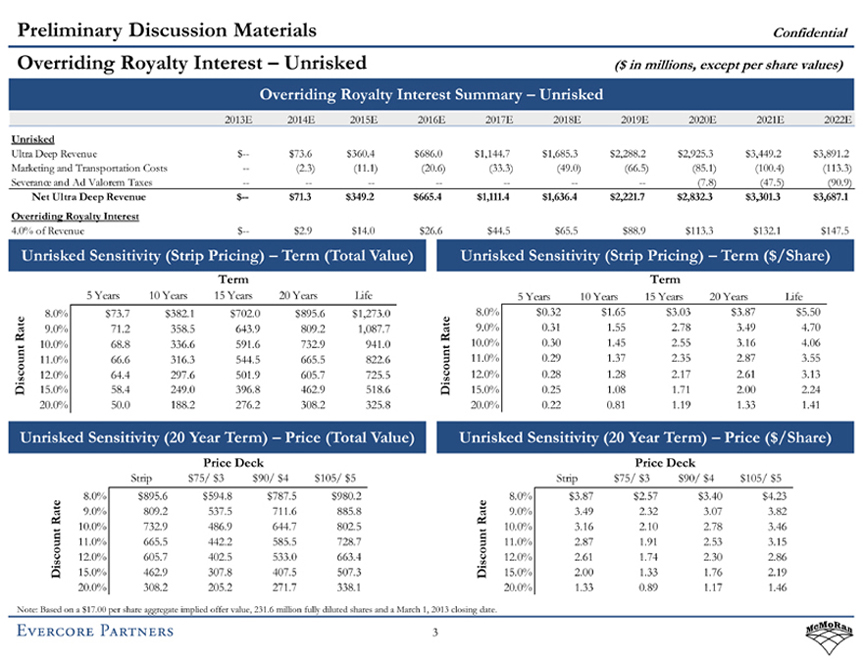
Overriding Royalty Interest – Unrisked
($ in millions, except per share values)
Overriding Royalty Interest Summary – Unrisked
2013E 2014E 2015E 2016E 2017E 2018E 2019E 2020E 2021E 2022E
Unrisked
Ultra Deep Revenue $ — $73.6 $360.4 $686.0 $1,144.7 $1,685.3 $2,288.2 $2,925.3 $3,449.2 $3,891.2
Marketing and Transportation Costs — (2.3) (11.1) (20.6) (33.3) (49.0) (66.5) (85.1) (100.4) (113.3)
Severance and Ad Valorem Taxes — — — — — — — (7.8) (47.5) (90.9)
Net Ultra Deep Revenue $— $71.3 $349.2 $665.4 $1,111.4 $1,636.4 $2,221.7 $2,832.3 $3,301.3 $3,687.1
Overriding Royalty Interest
4.0% of Revenue $ — $2.9 $14.0 $26.6 $44.5 $65.5 $88.9 $113.3 $132.1 $147.5
Unrisked Sensitivity (Strip Pricing) – Term (Total Value)
Discount Rate
Term
$732.9 5 Years 10 Years 15 Years 20 Years Life
8.0% $73.7 $382.1 $702.0 $895.6 $1,273.0
9.0% 71.2 358.5 643.9 809.2 1,087.7
10.0% 68.8 336.6 591.6 732.9 941.0
11.0% 66.6 316.3 544.5 665.5 822.6
12.0% 64.4 297.6 501.9 605.7 725.5
15.0% 58.4 249.0 396.8 462.9 518.6
20.0% 50.0 188.2 276.2 308.2 325.8
Unrisked Sensitivity (Strip Pricing) – Term ($/Share)
Discount Rate
Term
$3.16 5 Years 10 Years 15 Years 20 Years Life
8.0% $0.32 $1.65 $3.03 $3.87 $5.50
9.0% 0.31 1.55 2.78 3.49 4.70
10.0% 0.30 1.45 2.55 3.16 4.06
11.0% 0.29 1.37 2.35 2.87 3.55
12.0% 0.28 1.28 2.17 2.61 3.13
15.0% 0.25 1.08 1.71 2.00 2.24
20.0% 0.22 0.81 1.19 1.33 1.41
Unrisked Sensitivity (20 Year Term) – Price (Total Value)
Discount Rate
Price Deck
Strip $75/ $3 $90/ $4 $105/ $5
8.0% $895.6 $594.8 $787.5 $980.2
9.0% 809.2 537.5 711.6 885.8
10.0% 732.9 486.9 644.7 802.5
11.0% 665.5 442.2 585.5 728.7
12.0% 605.7 402.5 533.0 663.4
15.0% 462.9 307.8 407.5 507.3
20.0% 308.2 205.2 271.7 338.1
Unrisked Sensitivity (20 Year Term) – Price ($/Share)
Discount Rate
Price Deck
Strip $75/ $3 $90/ $4 $105/ $5
8.0% $3.87 $2.57 $3.40 $4.23
9.0% 3.49 2.32 3.07 3.82
10.0% 3.16 2.10 2.78 3.46
11.0% 2.87 1.91 2.53 3.15
12.0% 2.61 1.74 2.30 2.86
15.0% 2.00 1.33 1.76 2.19
20.0% 1.33 0.89 1.17 1.46
Note: Based on a $17.00 per share aggregate implied offer value, 231.6 million fully diluted shares and a March 1, 2013 closing date.
EVERCORE PARTNERS
Preliminary Discussion Materials
Confidential
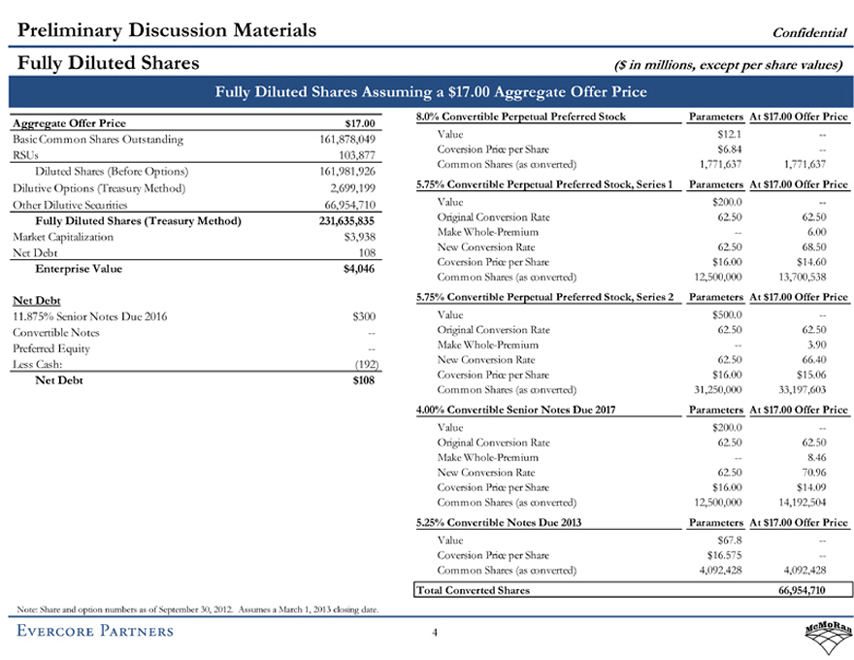
Fully Diluted Shares
($ in millions, except per share values)
Fully Diluted Shares Assuming a $17.00 Aggregate Offer Price
Aggregate Offer Price $17.00
Basic Common Shares Outstanding 161,878,049
RSUs 103,877
Diluted Shares (Before Options) 161,981,926
Dilutive Options (Treasury Method) 2,699,199
Other Dilutive Securities 66,954,710
Fully Diluted Shares (Treasury Method) 231,635,835
Market Capitalization $3,938
Net Debt 108
Enterprise Value $4,046
Net Debt
11.875% Senior Notes Due 2016 $300
Convertible Notes —
Preferred Equity —
Less Cash: (192)
Net Debt $108
8.0% Convertible Perpetual Preferred Stock Parameters At $17.00 Offer Price
Value $12.1 —
Coversion Price per Share $6.84 —
Common Shares (as converted) 1,771,637 1,771,637
5.75% Convertible Perpetual Preferred Stock, Series 1 Parameters At $17.00 Offer Price
Value $200.0 —
Original Conversion Rate 62.50 62.50
Make Whole-Premium — 6.00
New Conversion Rate 62.50 68.50
Coversion Price per Share $16.00 $14.60
Common Shares (as converted) 12,500,000 13,700,538
5.75% Convertible Perpetual Preferred Stock, Series 2 Parameters At $17.00 Offer Price
Value $500.0 —
Original Conversion Rate 62.50 62.50
Make Whole-Premium — 3.90
New Conversion Rate 62.50 66.40
Coversion Price per Share $16.00 $15.06
Common Shares (as converted) 31,250,000 33,197,603
4.00% Convertible Senior Notes Due 2017 Parameters At $17.00 Offer Price
Value $200.0 —
Original Conversion Rate 62.50 62.50
Make Whole-Premium — 8.46
New Conversion Rate 62.50 70.96
Coversion Price per Share $16.00 $14.09
Common Shares (as converted) 12,500,000 14,192,504
5.25% Convertible Notes Due 2013 Parameters At $17.00 Offer Price
Value $67.8 —
Coversion Price per Share $16.575 —
Common Shares (as converted) 4,092,428 4,092,428
Total Converted Shares 66,954,710
Note: Share and option numbers as of September 30, 2012. Assumes a March 1, 2013 closing date.
EVERCORE PARTNERS