Table of Contents
UNITED STATES
SECURITIES AND EXCHANGE COMMISSION
Washington, D.C. 20549
FORM N-CSR
CERTIFIED SHAREHOLDER REPORT OF REGISTERED
MANAGEMENT INVESTMENT COMPANIES
| Investment Company Act file number | 811-02224 |
MML Series Investment Fund | ||||
| (Exact name of registrant as specified in charter) | ||||
100 Bright Meadow Blvd., Enfield, CT 06082 | ||
| (Address of principal executive offices) | (Zip code) | |
| Brian Haendiges | ||
100 Bright Meadow Blvd., Enfield, CT 06082 | ||
| (Name and address of agent for service) | ||
Registrant’s telephone number, including area code: (860) 562-1000
Date of fiscal year end: 12/31/2016
Date of reporting period: 12/31/2016
Table of Contents
Item 1. Reports to Stockholders.
Table of Contents
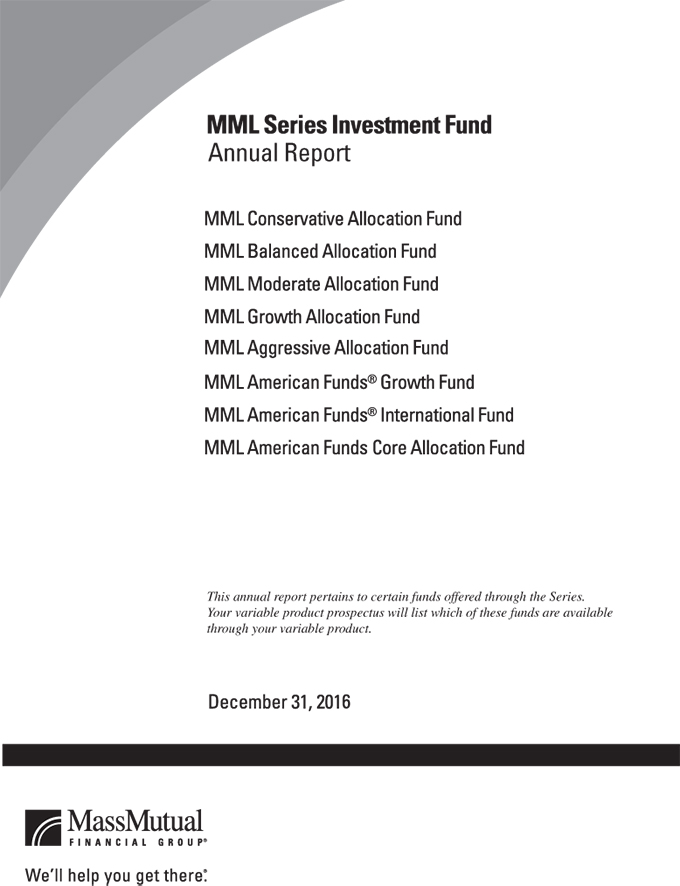
Table of Contents
| 1 | ||||
| 3 | ||||
| 6 | ||||
| 25 | ||||
| 26 | ||||
| 27 | ||||
| 28 | ||||
| 29 | ||||
| 30 | ||||
| 31 | ||||
| 32 | ||||
| 34 | ||||
| 38 | ||||
| 40 | ||||
| 44 | ||||
| 52 | ||||
| 65 | ||||
| 66 | ||||
| 70 | ||||
| 71 | ||||
| 71 | ||||
| 72 | ||||
This material must be preceded or accompanied by a current prospectus (or summary prospectus, if available) for the MML Series Investment Fund. Investors should consider a Fund’s investment objective, risks, and charges and expenses carefully before investing. This and other information about the investment company is available in the prospectus (or summary prospectus, if available). Read it carefully before investing.
Table of Contents
MML Series Investment Fund – President’s Letter to Shareholders (Unaudited)
To Our Shareholders

Brian Haendiges
“MassMutual believes that changing market conditions are a way of life for retirement investors – but these same conditions have the potential to reward patient investors who maintain a long-term perspective, instead of reacting to short-term market movements.”
December 31, 2016
Continued strength in U.S. markets in a challenging market environment
I am pleased to present you with the MML Series Investment Fund Annual Report, covering the year ended December 31, 2016 (the “fiscal year”). Domestic stocks outperformed most international equities during the fiscal year, as a strong market environment in the U.S. accelerated. Much of the strength occurred late in the reporting period, due to the surprising Republican victory in the race for the White House – as investors were buoyed by President-elect Trump’s promises for tax abatements and infrastructure spending. Economic difficulties elsewhere in the world – such as the challenging interest rate environment in Japan, uncertainty in Europe and the United Kingdom’s surprising Brexit vote that ratified an eventual exit from the European Union – had virtually no impact on U.S. stock indexes. Nevertheless, during the reporting period, recurring market volatility served as a general reminder for investors that market conditions are cyclical and can change anytime.
In MassMutual’s view, the ongoing uncertainties in markets today highlight the importance of taking a long-term perspective and not reacting to current events or short-term market changes. We also believe retirement investors who follow certain investment guidelines, such as the ones below, may increase their chances of reaching their retirement income goals.
Suggestions for retirement investors under any market conditions
Contribute as much as you can
While it is impossible to control your investments’ performance, you can control how often and how much you save. Contributing to your retirement account on a regular basis and increasing your contribution level as often as you are able, may be one way to help you realize your long-term investment objectives.*
Continue to invest
Some of the most sophisticated investors believe that individuals who can withstand a market downturn have the potential to be rewarded by accumulating larger positions at more favorable prices (relative to those who do not continue investing during a down market). That’s why most financial professionals believe it’s important to stay in the market, regardless of short-term results.
Time may be on your side
For most people, investing for retirement occurs over many decades. While retirement investors often know that the financial markets will be volatile from time to time, seasoned investors tend to understand the wisdom of taking a long-term approach. They know that this can help them navigate the market’s downturns, leverage its upturns, and successfully grow their account balances.
Monitor your asset allocation and diversify
Stocks, bonds, and short-term/money market investments are investment types that typically behave differently depending upon the economic and market environment. Each of these categories contains
| * | Systematic investing and asset allocation do not ensure a profit or protect against loss in a declining market. Systematic investing involves continuous investment in securities regardless of fluctuating price levels. Investors should consider their ability to continue investing through periods of low price levels. |
(Continued)
1
Table of Contents
MML Series Investment Fund – President’s Letter to Shareholders (Unaudited) (Continued)
an even greater array of sub-categories, such as small-cap stocks, international stocks, and high-yield bonds. Many financial professionals believe that investors can take advantage of different opportunities in the market and reduce the risk of over-exposure to one or two poorly performing investment types by maintaining a portfolio that includes a mix of investment types and sub-categories.
Make informed choices and seek professional guidance
Many financial advisors will suggest that retirement investors select an appropriate combination of investments that aligns with their retirement income goals. Doing so can help you weather the inevitable ups and downs of the markets.
For retirement investors who work with a financial professional
If you work with a financial professional, this may be an excellent time to contact him or her for assistance in assessing whether or not you:
| • | are saving enough for retirement based on your long-term needs; |
| • | are invested properly, based on your goals and objectives and where you are in your retirement planning journey; and |
| • | feel you are taking the right steps to help reduce the risk you could outlive your retirement savings. |
Protect who matters most
MassMutual believes that nothing matters more than the safety and well-being of your loved ones. That’s why we have always been committed to helping our customers put themselves on the path to a more secure financial future. And it’s why we have always encouraged retirement investors to maintain perspective over the long term. In our view, changing market conditions are a way of life for retirement investors, but these same conditions have the potential to reward patient investors who maintain a long-term perspective, instead of reacting to short-term market movements. Thank you for your continued trust in MassMutual.
Sincerely,

Brian Haendiges
President
The information provided is the opinion of MassMutual Funds Investment Management Group as of 1/1/17 and is subject to change without notice. It is not to be construed as tax, legal or investment advice. Of course, past performance does not guarantee future results.
2
Table of Contents
MML Series Investment Fund – Economic and Market Overview (Unaudited)
December 31, 2016
Economic Overview and Market Commentary
We note three significant and unexpected events that were followed by meaningful market movements in 2016. The first followed Federal Reserve (Fed) Board Chair Janet Yellen’s testimony before the U.S. Senate Committee on Banking, Housing, and Urban Affairs on February 11, 2016, where she confirmed a “slower for longer” plan for interest rate hikes going forward. The second followed the United Kingdom’s surprising June 23 referendum to leave the European Union – commonly referred to as “Brexit” (an abbreviation for “British exit”). The third followed Donald J. Trump’s election as the 45th President of the United States on November 8.
Throughout 2016, the initially sluggish domestic economy started to return more positive reports as modest gross domestic product (GDP) estimates were revised upward. (GDP reflects the total value of goods and services produced in the United States.) Investors responded favorably and domestic equity markets delivered broad positive returns for the fiscal year. Equity returns in the foreign and emerging markets ended the year more mixed.
For the year, the Dow Jones Industrial AverageSM (Dow) grew 16.50% and the broader S&P 500® Index (S&P 500) of large-capitalization U.S. stocks gained 11.96%. The technology-focused NASDAQ Composite® Index managed an 8.87% return, as tech stocks lagged the other indexes following the U.S. election. Small-cap equities outperformed for the year, with the Russell 2000® Index of small-capitalization stocks adding 21.31%. In foreign markets, the MSCI EAFE® Index, a barometer for foreign stocks in developed markets, gained only 1.00%, though the MSCI Emerging Markets Index, a measure of the performance of emerging stock markets throughout the world, rose 11.19%.* While developed foreign markets struggled under the weight of Brexit and longer-term fiscal burdens, emerging markets derived more of their value from domestic interactions and benefited more from that alignment.
Bonds performed well for much of the year, but dropped sharply following the U.S. election, as investors tried to anticipate what political policy might mean for bond markets in 2017 and beyond. The Bloomberg Barclays U.S. Aggregate Bond Index, a broad measure of the U.S. investment-grade bond markets, rose as much as 6% in July, but ended the year up only 2.65%. The performance of shorter-term debt investments continued to reflect the unrelenting low interest rate environment. Yields on the 2-year U.S. Treasury bond closed the year at 1.19%, while 10-year Treasury bonds yielded 2.44% at year end. These higher year-over-year yields reflect the turbulence in the fixed-income markets following the U.S. election. A “risk-on” environment developed as the year unfolded and high-yield bonds benefited. The Bloomberg Barclays U.S. Corporate High-Yield Index, which measures the performance of fixed-rate, below-investment-grade debt from corporate sectors, returned 17.13%.*
These returns were not without market volatility and surprises, however. Before rebounding, major indexes fell sharply through January and into February – until the Fed’s announcement triggered a more sustained period of growth. Markets stuttered briefly in May over concerns that Apple might not be able to sustain its growth in the smartphone market. Following a brief post-Brexit drop in late June, neither the surprising Brexit outcome nor global economic turbulence could disrupt the upward momentum in U.S. markets. Particularly noteworthy is the fact that domestic equity markets added nearly half of their annual returns in the final seven weeks of the year, as investors cheered President-elect Trump’s promises for tax abatements and infrastructure spending.
Q1 2016 – The inflection point
Headwinds affecting markets in late 2015 continued into January and early February of 2016. China’s slowing economy and falling crude oil prices, along with a weak January employment report, stoked fears that a U.S. recession could be on the near-term horizon. By February 11, the S&P 500 had dropped to 1,810. At this point, Fed Chair Janet Yellen signaled that the central bank would be patient in beginning to normalize policy interest rates and that it was unlikely that economic conditions would warrant an increase in the target range for the federal funds rate for at least the next few Open Market Committee meetings. (The federal funds rate is the interest rate that banks and financial institutions charge each other for borrowing funds overnight.)
Headwinds ultimately shifted to tailwinds. The S&P 500 gained nearly 250 points by the end of the first quarter, initiating a rally that would more or less be sustained throughout the second and third quarters of 2016. The employment picture improved, as
3
| * | Indexes are unmanaged, do not incur fees or expenses and cannot be purchased directly for investment. |
Table of Contents
MML Series Investment Fund – Economic and Market Overview (Unaudited) (Continued)
February’s non-farm payrolls came in stronger than the previous two months, and December 2015 and January 2016 payroll numbers were revised upward. Once again, the quarter recovered what it had lost and ended essentially where it started the year. Despite this, the climate had changed.
Q2 2016 – Domestic markets override negative interest rates and Brexit
While Britain’s historic Brexit vote dominated news at the end of the second quarter, the unusual arrival of negative interest rates for Japan’s sovereign debt proved puzzling for many investors early in the quarter. Both seemed to feed a “flight to quality” reaction that resulted in a stronger U.S. dollar. Neither event, however, derailed the strengthening U.S. economy. By the end of the second quarter, concerns about China’s economy and falling oil prices moderated. U.S. GDP firmed up and the Fed softened its interest rate strategy, taking a more cautious approach. May’s disappointing jobs report created investor concerns that the Fed could seriously consider suspending any interest rate hikes for at least a year. Nevertheless, the quarter ended with broad-based gains across a variety of asset classes, improved consumer spending, low unemployment rates, and better-than-expected corporate earnings reports.
On June 23, global economic focus shifted to the United Kingdom. The Brexit vote pushed European stocks more deeply into negative territory on concerns that the immediate impact might slow growth in the U.K. and the larger European region. Investors also worried that the British vote might encourage other countries to follow suit. Interestingly, emerging market and Pacific country stocks delivered positive returns for the quarter and year-to-date.
Q3 2016 – Campaign rhetoric overshadows economic momentum
By the end of July, it seemed markets had shrugged off Brexit fears. The U.S. economy was gathering steam, as evidenced on several fronts. The U.S. labor market continued to show strength as job openings rose in June and hiring increased. U.S. consumer confidence hit a 12-month high in August, according to the Conference Board’s Consumer Confidence Index®, which reflected improved consumer assessment of economic conditions and the six-month economic outlook. Corporate earnings came in better than expected for the second consecutive quarter, even though it was the fifth consecutive declining quarter. In mid-September, the U.S. Census Bureau announced that real median household income had jumped 5%, the biggest annual increase since they first started gathering this data in 1968. The two major U.S. presidential candidates accepted their party’s nominations in July. As September came to a close, it became more evident that the upcoming election would be both hotly contested and divisive.
Q4 2016 – The Fed takes a back seat
Prior to the November elections, the Fed held the throttle on the markets. In October, speculation about the next rate hike (whether it would happen before the end of the year and how frequently subsequent rate hikes might occur) dominated investor thinking. At the same time, increasingly heated campaign rhetoric served as a drag while investors tried to figure out what the next four years might look like in either case. On the morning following the U.S. election, market futures pointed sharply downward, as the widely expected presidential winner, Hillary Clinton, conceded electoral vote defeat to Donald J. Trump. When markets opened on November 9, buyers surged, however, as investors anticipated the economic impacts of the President-elect delivering on his pro-business and pro-domestic campaign rhetoric. This buoyant investor sentiment launched a year-end rally that pushed the S&P 500 up 5.3% by year-end, with nearly half of the Index’s 11.96% return occurring in the last seven weeks of the year. In December, the Fed did, indeed, raise policy interest rates, but the market throttle now appeared to be in other hands.
Going into 2017, markets have yet to digest the upcoming Trump presidency in an environment where the Fed is forecasting multiple rate hikes. Turning to the global stage, by the end of March 2017, Britain’s Prime Minister, Theresa May, plans to trigger Article 50 of the Lisbon Treaty, which would initiate the two-year process of withdrawing the U.K. from the European Union. Terrorism and military posturing add further tensions to the global environment.
Domestic equity markets delivered solid returns for investors in 2016, but investors endured a steady stream of uncertainty, surprises and volatility throughout. Long-term investors with a view to saving for retirement income pay attention to such things, but maintain a thoughtful and disciplined response to them. Many retirement investors wisely subscribe to the value of a well-
4
Table of Contents
MML Series Investment Fund – Economic and Market Overview (Unaudited) (Continued)
diversified portfolio, using an appropriate mix of available strategies to benefit from market expansions and mitigate the risks inherent in unexpected events.
The information provided is the opinion of MassMutual Funds Investment Management Group as of 12/31/16 and is subject to change without notice. It is not to be construed as tax, legal or investment advice. Of course, past performance does not guarantee future results.
5
Table of Contents
MML Allocation Fund Series – Portfolio Manager Report (Unaudited)
What are the investment approaches of the Funds that constitute the MML Allocation Series (the “Series”), and who is the Series’ investment adviser?
The MML Allocation Series comprises five Funds – each of which has a “fund of funds” structure. The five Funds in the Series are MML Conservative Allocation Fund, MML Balanced Allocation Fund, MML Moderate Allocation Fund, MML Growth Allocation Fund, and MML Aggressive Allocation Fund.
Each Fund seeks to achieve as high a total return over time as is considered consistent with prudent investment risk, preservation of capital, and recognition of the Fund’s stated asset allocation. Each Fund invests in a combination of domestic and international mutual funds (“MML Underlying Funds”) using an asset allocation strategy. MML Underlying Funds can include series of the MML Series Investment Fund and MML Series Investment Fund II (which are advised by MML Investment Advisers, LLC (MML Advisers), Oppenheimer Funds (which are advised by OFI Global Asset Management, Inc. (OFI Global Asset Management), a majority owned, indirect subsidiary of MassMutual), and non-affiliated funds. The Series’ investment adviser is MML Advisers.
Through their investment in MML Underlying Funds, the Funds may be exposed to a wide range of securities and other instruments with differing characteristics (such as credit quality, duration, geography, industry, and market capitalization), including, but not limited to, equity securities of small-, mid-, or large-capitalization U.S. or non-U.S. issuers, fixed income securities of U.S. or non-U.S. private or governmental issuers (including “junk” or “high-yield” bonds, including securities in default), inflation-protected securities, bank loans, commodities, real estate, and short-term investments of any kind.
Each Fund’s assets are allocated to its MML Underlying Funds according to an asset allocation strategy stated below. Each Fund may allocate a portion of its assets to “alternative” investments, such as commodities, precious metals, real estate, and foreign currencies.
| • | MML Conservative Allocation Fund: Approximately 35% to 45% in equity and similar funds and 55% to 65% in fixed income and similar funds, including money market funds. |
| • | MML Balanced Allocation Fund: Approximately 45% to 55% in equity and similar funds and 45% to 55% in fixed income and similar funds, including money market funds. |
| • | MML Moderate Allocation Fund: Approximately 55% to 65% in equity and similar funds and 35% to 45% in fixed income and similar funds, including money market funds. |
| • | MML Growth Allocation Fund: Approximately 70% to 80% in equity and similar funds and 20% to 30% in fixed income and similar funds, including money market funds. |
| • | MML Aggressive Allocation Fund: Approximately 85% to 95% in equity and similar funds and 5% to 15% in fixed income and similar funds, including money market funds. |
How did each Fund perform during the 12 months ended December 31, 2016?
Fund’s Initial | Custom | Russell 3000 | MSCI ACWI | Bloomberg Barclays | ||||||
| MML Conservative Allocation Fund | 5.78% | 5.84% | 12.74% | 4.50% | 2.65%* | |||||
| MML Balanced Allocation Fund | 6.15% | 6.66% | 12.74%* | 4.50% | 2.65% | |||||
| MML Moderate Allocation Fund | 6.89% | 7.46% | 12.74%* | 4.50% | 2.65% | |||||
| MML Growth Allocation Fund | 7.57% | 8.66% | 12.74%* | 4.50% | 2.65% | |||||
| MML Aggressive Allocation Fund | 8.54% | 10.13% | 12.74%* | 4.50% | 2.65% | |||||
* Benchmark return
6
Table of Contents
MML Allocation Fund Series – Portfolio Manager Report (Unaudited) (Continued)
Each of the MML Allocation Series Funds underperformed its respective Custom Index and the Russell 3000 Index. All five Funds outperformed the MSCI ACWI ex USA Index and the Bloomberg Barclays U.S. Aggregate Bond Index for the full year.
MML Allocation Fund Series Custom Indexes
| • | The Custom MML Conservative Allocation Index comprises the Bloomberg Barclays U.S. Aggregate Bond Index, the Russell 3000 Index, and the MSCI All Country World Index (ACWI) ex USA. The weightings of each index are 60%, 30%, and 10%, respectively. |
| • | The Custom MML Balanced Allocation Index comprises the Bloomberg Barclays U.S. Aggregate Bond Index, the Russell 3000 Index, and the MSCI All Country World Index (ACWI) ex USA. The weightings of each index are 50%, 37.5%, and 12.5%, respectively. |
| • | The Custom MML Moderate Allocation Index comprises the Bloomberg Barclays U.S. Aggregate Bond Index, the Russell 3000 Index, and the MSCI All Country World Index (ACWI) ex USA. The weightings of each index are 40%, 45%, and 15%, respectively. |
| • | The Custom MML Growth Allocation Index comprises the Bloomberg Barclays U.S. Aggregate Bond Index, the Russell 3000 Index, and the MSCI All Country World Index (ACWI) ex USA. The weightings of each index are 25%, 56.25%, and 18.75%, respectively. |
| • | The Custom MML Aggressive Allocation Index comprises the Bloomberg Barclays U.S. Aggregate Bond Index, the Russell 3000 Index, and the MSCI All Country World Index (ACWI) ex USA. The weightings of each index are 10%, 67.5%, and 22.5%, respectively. |
For a discussion on the economic and market environment during the 12-month period ended December 31, 2016, please see the Economic and Market Review, beginning on page 3.
Investment adviser discussion of factors that contributed to the Funds’ performance
For the year ended December 31, 2016, the Series Funds delivered positive returns consistent with their respective equity/fixed-income mix profiles across the Series, as U.S. equities (as represented by the S&P 500 Index) returned nearly 12% for the year – and U.S fixed-income investments, as represented by the Bloomberg Barclays U.S. Aggregate Bond Index, returned over 2.6%.
The year 2016 started off on a sour note for the equity markets – turning in the worst starting week to a year in the Dow Jones Industrial Average’s history. By mid-February, the broad market equity indexes were down about 10%, largely driven by a drop in oil prices to about $25 per barrel. A quick rebound rally by mid-April, coinciding with a recovery in oil prices, sent the markets on their way toward positive territory, despite global events such as “Brexit” and a November surprise in the U.S. elections. (Brexit – an abbreviation for “British exit” – was the United Kingdom’s surprising June 23, 2016 referendum to leave the European Union.)
In the fixed-income universe, the recovery in oil sent high-yield bonds to double-digit returns for the year, although the 10-year Treasury was more volatile – rising over 1% to 2.45% – after hitting a low over the summer of about 1.35%. The rise in yields through year end resulted in lower bond prices for the more interest rate-sensitive investment-grade fixed-income sector.
In the equity (stock) components of the Series, performance drivers included an underweight position, relative to the benchmark, in international stocks, which were hit by a rising U.S. dollar. Favorable strategy selection in international Underlying Funds, such as MML International Equity, MML Foreign, and MML Global, also benefited the Series. In the U.S., performance by mid- and small-cap value equity strategies held by the Series Funds provided modest offsets to the more significant detractors in the large-cap equity segment of the Series. In particular, Large Cap Growth was a detractor, as value stocks led their growth counterparts for the year and outperformed by 10%. In addition, selection in large-cap growth Underlying Funds was a meaningful detractor, as managers underweighted “safety and yield” in sectors like consumer staples and struggled on navigating the health care sector during the year. On the value side, large-cap value manager results were mixed, with positive Underlying Fund contributors being MML Focused Equity and MML Equity Income.
7
Table of Contents
MML Allocation Fund Series – Portfolio Manager Report (Unaudited) (Continued)
In the fixed-income (bond) components of the Series, allocations to sectors that are not included in the Bloomberg Barclays U.S. Aggregate Bond Index were contributors – such as high-yield bonds, U.S Treasury inflation-protected securities (TIPS), and international bonds. The Series allocation to high-yield bonds declined throughout the year as the oil market recovered and risks in high-yield pricing and debt covenant protections increased. Fixed-income was exceptionally challenging for investors, as yields on many global sovereign bonds in various maturities were negative, something unprecedented in the fixed-income market. Throughout the year, bond investors sought direction from the Federal Reserve (the Fed) to long-awaited increases in interest rates.
Investment adviser outlook
The outcome of the U.S. elections has triggered shifts across the market, as a surprising presidential victory, combined with one political party taking control of both houses of Congress, may signal quite a bit of activity in markets in 2017. Investors appear to have made the transition from focusing on central bank activity as being the market driver to a focus that places far greater importance on policy changes from the incoming president. Since the election, we have observed a rise in consumer and business confidence – and investors have demonstrated expectations of fiscal stimulus through investment in infrastructure, cuts in personal and corporate taxes, deregulation, and changes in health care – all of which have the potential to change consumer costs and reshape the jobs landscape. Many presidents experience a honeymoon period – as we witnessed with the surge in markets through the end of 2016 – but markets will, in our view, need to adjust in 2017 to what we believe will be a bumpy ride through the legislative process.
Investor optimism over a new U.S. president is being challenged by already expensive markets and an economy nearing its second-longest recovery in the post-war era. With expectations building of rising inflation, interest rates, lower profit margins, and a Fed signaling rising rates in 2017, our belief is that good news may already be reflected in risk assets.
8
Table of Contents
MML Allocation Fund Series – Portfolio Manager Report (Unaudited) (Continued)
| MML Conservative Allocation Fund Asset Allocation (% of Net Assets) on 12/31/16 | ||||
Fixed Income Funds | 60.5 | % | ||
Equity Funds | 39.6 | % | ||
|
| |||
Total Long-Term Investments | 100.1 | % | ||
Other Assets & Liabilities | (0.1 | )% | ||
|
| |||
Net Assets | 100.0 | % | ||
|
| |||
| MML Balanced Allocation Fund Asset Allocation (% of Net Assets) on 12/31/16 | ||||
Fixed Income Funds | 50.5 | % | ||
Equity Funds | 49.6 | % | ||
|
| |||
Total Long-Term Investments | 100.1 | % | ||
Other Assets & Liabilities | (0.1 | )% | ||
|
| |||
Net Assets | 100.0 | % | ||
|
| |||
MML Moderate Allocation Fund Asset Allocation | ||||
Equity Funds | 59.6 | % | ||
Fixed Income Funds | 40.5 | % | ||
|
| |||
Total Long-Term Investments | 100.1 | % | ||
Other Assets & Liabilities | (0.1 | )% | ||
|
| |||
Net Assets | 100.0 | % | ||
|
| |||
| MML Growth Allocation Fund Asset Allocation (% of Net Assets) on 12/31/16 | ||||
Equity Funds | 74.7 | % | ||
Fixed Income Funds | 25.4 | % | ||
|
| |||
Total Long-Term Investments | 100.1 | % | ||
Other Assets & Liabilities | (0.1 | )% | ||
|
| |||
Net Assets | 100.0 | % | ||
|
| |||
| MML Aggressive Allocation Fund Asset Allocation (% of Net Assets) on 12/31/16 | ||||
Equity Funds | 89.9 | % | ||
Fixed Income Funds | 10.2 | % | ||
|
| |||
Total Long-Term Investments | 100.1 | % | ||
Other Assets & Liabilities | (0.1 | )% | ||
|
| |||
Net Assets | 100.0 | % | ||
|
| |||
9
Table of Contents
MML Conservative Allocation Fund – Portfolio Manager Report (Unaudited) (Continued)
Growth of a $10,000 Investment
Hypothetical Investments in MML Conservative Allocation Fund Initial Class, the Bloomberg Barclays U.S. Aggregate Bond Index, the Russell 3000 Index, the MSCI ACWI ex USA, and the Custom MML Conservative Allocation Index.
TOTAL RETURN | One Year | Five Year | Since | |||||||||
Initial Class | 5.78% | 6.56% | 5.08% | |||||||||
Bloomberg Barclays U.S. Aggregate Bond Index* | 2.65% | 2.23% | 4.30% | |||||||||
Russell 3000 Index | 12.74% | 14.67% | 7.17% | |||||||||
MSCI ACWI ex USA | 4.50% | 5.00% | 0.17% | |||||||||
Custom MML Conservative Allocation Index | 5.84% | 6.28% | 5.23% | |||||||||
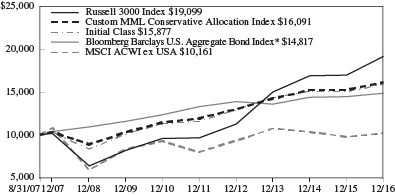
Hypothetical Investments in MML Conservative Allocation Fund Service Class, the Bloomberg Barclays U.S. Aggregate Bond Index, the Russell 3000 Index, the MSCI ACWI ex USA, and the Custom MML Conservative Allocation Index.
TOTAL RETURN | One Year | Five Year | Since | |||||||||
Service Class | 5.48% | 6.28% | 5.42% | |||||||||
Bloomberg Barclays U.S. Aggregate Bond Index* | 2.65% | 2.23% | 4.22% | |||||||||
Russell 3000 Index | 12.74% | 14.67% | 9.17% | |||||||||
MSCI ACWI ex USA | 4.50% | 5.00% | 1.59% | |||||||||
Custom MML Conservative Allocation Index | 5.84% | 6.28% | 5.94% | |||||||||
GROWTH OF $10,000 INVESTMENT SINCE INCEPTION
Generally accepted accounting principles require adjustments to be made to the net assets of the Fund at period end for financial reporting purposes only, and as such, the total return based on the unadjusted net asset value per share may differ from the total return reported in the financial highlights.
* Benchmark
Performance data quoted represents past performance; past performance is not predictive of future results. The investment return and principal value of shares of the Fund will fluctuate with market conditions so that shares of the Fund, when redeemed, may be worth more or less than their original cost. Current performance of the Fund may be lower or higher than the performance quoted. Performance data current to the most recent month end may be obtained by accessing the website www.massmutual.com.
Investors should note that the Fund is a professionally managed mutual fund, while the Bloomberg Barclays U.S. Aggregate Bond Index, the Russell 3000 Index, the MSCI ACWI ex USA, and the Custom MML Conservative Allocation Index are unmanaged, do not incur expenses, and cannot be purchased directly by investors. Investors should read the Fund’s prospectus with regard to the Fund’s investment objective, risks, and charges and expenses in conjunction with these financial statements. The Fund’s return reflects changes in the net asset value per share without the deduction of any product charges (e.g., cost of insurance, mortality and expense risk charges, administrative fees, and CDSL). The inclusion of these charges would have reduced the performance shown here.
10
Table of Contents
MML Balanced Allocation Fund – Portfolio Manager Report (Unaudited) (Continued)
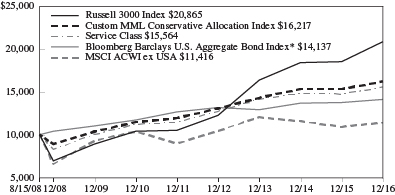
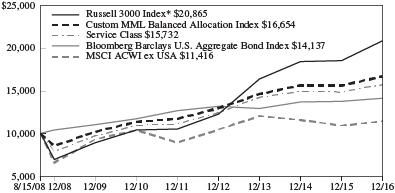
Growth of a $10,000 Investment
Hypothetical Investments in MML Balanced Allocation Fund Initial Class, the Russell 3000 Index, the Bloomberg Barclays U.S. Aggregate Bond Index, the MSCI ACWI ex USA, and the Custom MML Balanced Allocation Index.
TOTAL RETURN | One Year | Five Year | Since | |||||||||
Initial Class | 6.15% | 7.47% | 4.98% | |||||||||
Russell 3000 Index* | 12.74% | 14.67% | 7.17% | |||||||||
Bloomberg Barclays U.S. Aggregate Bond Index | 2.65% | 2.23% | 4.30% | |||||||||
MSCI ACWI ex USA | 4.50% | 5.00% | 0.17% | |||||||||
Custom MML Balanced Allocation Index | 6.66% | 7.29% | 5.37% | |||||||||
Hypothetical Investments in MML Balanced Allocation Fund Service Class, the Russell 3000 Index, the Bloomberg Barclays U.S. Aggregate Bond Index, the MSCI ACWI ex USA, and the Custom MML Balanced Allocation Index.
TOTAL RETURN | One Year | Five Year | Since | |||||||||
Service Class | 5.82% | 7.19% | 5.56% | |||||||||
Russell 3000 Index* | 12.74% | 14.67% | 9.17% | |||||||||
Bloomberg Barclays U.S. Aggregate Bond Index | 2.65% | 2.23% | 4.22% | |||||||||
MSCI ACWI ex USA | 4.50% | 5.00% | 1.59% | |||||||||
Custom MML Balanced Allocation Index | 6.66% | 7.29% | 6.28% | |||||||||
GROWTH OF $10,000 INVESTMENT SINCE INCEPTION
Generally accepted accounting principles require adjustments to be made to the net assets of the Fund at period end for financial reporting purposes only, and as such, the total return based on the unadjusted net asset value per share may differ from the total return reported in the financial highlights.
* Benchmark
Performance data quoted represents past performance; past performance is not predictive of future results. The investment return and principal value of shares of the Fund will fluctuate with market conditions so that shares of the Fund, when redeemed, may be worth more or less than their original cost. Current performance of the Fund may be lower or higher than the performance quoted. Performance data current to the most recent month end may be obtained by accessing the website www.massmutual.com.
Investors should note that the Fund is a professionally managed mutual fund, while the Russell 3000 Index, the Bloomberg Barclays U.S. Aggregate Bond Index, the MSCI ACWI ex USA, and the Custom MML Balanced Allocation Index are unmanaged, do not incur expenses, and cannot be purchased directly by investors. Investors should read the Fund’s prospectus with regard to the Fund’s investment objective, risks, and charges and expenses in conjunction with these financial statements. The Fund’s return reflects changes in the net asset value per share without the deduction of any product charges (e.g., cost of insurance, mortality and expense risk charges, administrative fees, and CDSL). The inclusion of these charges would have reduced the performance shown here.
11
Table of Contents
MML Moderate Allocation Fund – Portfolio Manager Report (Unaudited) (Continued)
Growth of a $10,000 Investment
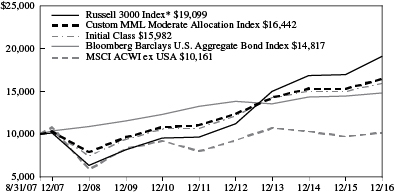
Hypothetical Investments in MML Moderate Allocation Fund Initial Class, the Russell 3000 Index, the Bloomberg Barclays U.S. Aggregate Bond Index, the MSCI ACWI ex USA, and the Custom MML Moderate Allocation Index.
TOTAL RETURN | One Year | Five Year | Since | |||||||||
Initial Class | 6.89% | 8.34% | 5.15% | |||||||||
Russell 3000 Index* | 12.74% | 14.67% | 7.17% | |||||||||
Bloomberg Barclays U.S. Aggregate Bond Index | 2.65% | 2.23% | 4.30% | |||||||||
MSCI ACWI ex USA | 4.50% | 5.00% | 0.17% | |||||||||
Custom MML Moderate Allocation Index | 7.46% | 8.29% | 5.47% | |||||||||
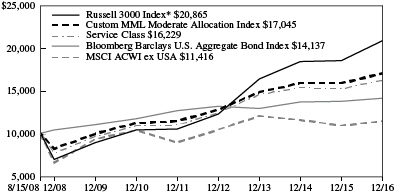
Hypothetical Investments in MML Moderate Allocation Fund Service Class, the Russell 3000 Index, the Bloomberg Barclays U.S. Aggregate Bond Index, the MSCI ACWI ex USA, and the Custom MML Moderate Allocation Index.
TOTAL RETURN | One Year | Five Year | Since | |||||||||
Service Class | 6.59% | 8.07% | 5.95% | |||||||||
Russell 3000 Index* | 12.74% | 14.67% | 9.17% | |||||||||
Bloomberg Barclays U.S. Aggregate Bond Index | 2.65% | 2.23% | 4.22% | |||||||||
MSCI ACWI ex USA | 4.50% | 5.00% | 1.59% | |||||||||
Custom MML Moderate Allocation Index | 7.46% | 8.29% | 6.57% | |||||||||
GROWTH OF $10,000 INVESTMENT SINCE INCEPTION
Generally accepted accounting principles require adjustments to be made to the net assets of the Fund at period end for financial reporting purposes only, and as such, the total return based on the unadjusted net asset value per share may differ from the total return reported in the financial highlights.
* Benchmark
Performance data quoted represents past performance; past performance is not predictive of future results. The investment return and principal value of shares of the Fund will fluctuate with market conditions so that shares of the Fund, when redeemed, may be worth more or less than their original cost. Current performance of the Fund may be lower or higher than the performance quoted. Performance data current to the most recent month end may be obtained by accessing the website www.massmutual.com.
Investors should note that the Fund is a professionally managed mutual fund, while the Russell 3000 Index, the Bloomberg Barclays U.S. Aggregate Bond Index, the MSCI ACWI ex USA, and the Custom MML Moderate Allocation Index are unmanaged, do not incur expenses, and cannot be purchased directly by investors. Investors should read the Fund’s prospectus with regard to the Fund’s investment objective, risks, and charges and expenses in conjunction with these financial statements. The Fund’s return reflects changes in the net asset value per share without the deduction of any product charges (e.g., cost of insurance, mortality and expense risk charges, administrative fees, and CDSL). The inclusion of these charges would have reduced the performance shown here.
12
Table of Contents
MML Growth Allocation Fund – Portfolio Manager Report (Unaudited) (Continued)
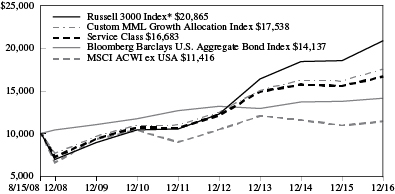
Growth of a $10,000 Investment
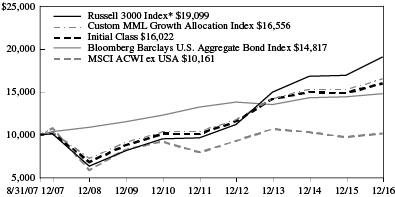
Hypothetical Investments in MML Growth Allocation Fund Initial Class, the Russell 3000 Index, the Bloomberg Barclays U.S. Aggregate Bond Index, the MSCI ACWI ex USA, and the Custom MML Growth Allocation Index.
TOTAL RETURN | One Year | Five Year | Since | |||||||||
Initial Class | 7.57% | 9.67% | 5.18% | |||||||||
Russell 3000 Index* | 12.74% | 14.67% | 7.17% | |||||||||
Bloomberg Barclays U.S. Aggregate Bond Index | 2.65% | 2.23% | 4.30% | |||||||||
MSCI ACWI ex USA | 4.50% | 5.00% | 0.17% | |||||||||
Custom MML Growth Allocation Index | 8.66% | 9.78% | 5.55% | |||||||||
Hypothetical Investments in MML Growth Allocation Fund Service Class, the Russell 3000 Index, the Bloomberg Barclays U.S. Aggregate Bond Index, the MSCI ACWI ex USA, and the Custom MML Growth Allocation Index.
TOTAL RETURN | One Year | Five Year Annual | Since | |||||||||
Service Class | 7.23% | 9.38% | 6.30% | |||||||||
Russell 3000 Index* | 12.74% | 14.67% | 9.17% | |||||||||
Bloomberg Barclays U.S. Aggregate Bond Index | 2.65% | 2.23% | 4.22% | |||||||||
MSCI ACWI ex USA | 4.50% | 5.00% | 1.59% | |||||||||
Custom MML Growth Allocation Index | 8.66% | 9.78% | 6.93% | |||||||||
GROWTH OF $10,000 INVESTMENT SINCE INCEPTION
Generally accepted accounting principles require adjustments to be made to the net assets of the Fund at period end for financial reporting purposes only, and as such, the total return based on the unadjusted net asset value per share may differ from the total return reported in the financial highlights.
* Benchmark
Performance data quoted represents past performance; past performance is not predictive of future results. The investment return and principal value of shares of the Fund will fluctuate with market conditions so that shares of the Fund, when redeemed, may be worth more or less than their original cost. Current performance of the Fund may be lower or higher than the performance quoted. Performance data current to the most recent month end may be obtained by accessing the website www.massmutual.com.
Investors should note that the Fund is a professionally managed mutual fund, while the Russell 3000 Index, the Bloomberg Barclays U.S. Aggregate Bond Index, the MSCI ACWI ex USA, and the Custom MML Growth Allocation Index are unmanaged, do not incur expenses, and cannot be purchased directly by investors. Investors should read the Fund’s prospectus with regard to the Fund’s investment objective, risks, and charges and expenses in conjunction with these financial statements. The Fund’s return reflects changes in the net asset value per share without the deduction of any product charges (e.g., cost of insurance, mortality and expense risk charges, administrative fees, and CDSL). The inclusion of these charges would have reduced the performance shown here.
13
Table of Contents
MML Aggressive Allocation Fund – Portfolio Manager Report (Unaudited) (Continued)
Growth of a $10,000 Investment
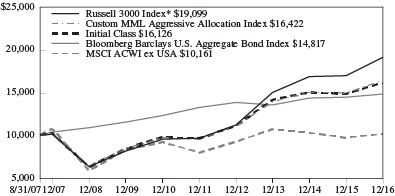
Hypothetical Investments in MML Aggressive Allocation Fund Initial Class, the Russell 3000 Index, the Bloomberg Barclays U.S. Aggregate Bond Index, the MSCI ACWI ex USA, and the Custom MML Aggressive Allocation Index.
TOTAL RETURN | One Year | Five Year Annual 1/1/12 - | Since | |||||||||
Initial Class | 8.54% | 10.93% | 5.25% | |||||||||
Russell 3000 Index* | 12.74% | 14.67% | 7.17% | |||||||||
Bloomberg Barclays U.S. Aggregate Bond Index | 2.65% | 2.23% | 4.30% | |||||||||
MSCI ACWI ex USA | 4.50% | 5.00% | 0.17% | |||||||||
Custom MML Aggressive Allocation Index | 10.13% | 11.49% | 5.46% | |||||||||
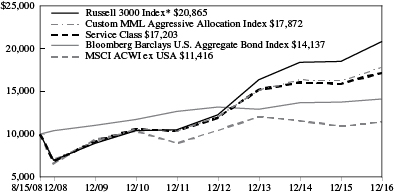
Hypothetical Investments in MML Aggressive Allocation Fund Service Class, the Russell 3000 Index, the Bloomberg Barclays U.S. Aggregate Bond Index, the MSCI ACWI ex USA, and the Custom MML Aggressive Allocation Index.
TOTAL RETURN | One Year | Five Year | Since | |||||||||
Service Class | 8.28% | 10.66% | 6.69% | |||||||||
Russell 3000 Index* | 12.74% | 14.67% | 9.17% | |||||||||
Bloomberg Barclays U.S. Aggregate Bond Index | 2.65% | 2.23% | 4.22% | |||||||||
MSCI ACWI ex USA | 4.50% | 5.00% | 1.59% | |||||||||
Custom MML Aggressive Allocation Index | 10.13% | 11.49% | 7.17% | |||||||||
GROWTH OF $10,000 INVESTMENT SINCE INCEPTION
Generally accepted accounting principles require adjustments to be made to the net assets of the Fund at period end for financial reporting purposes only, and as such, the total return based on the unadjusted net asset value per share may differ from the total return reported in the financial highlights.
* Benchmark
Performance data quoted represents past performance; past performance is not predictive of future results. The investment return and principal value of shares of the Fund will fluctuate with market conditions so that shares of the Fund, when redeemed, may be worth more or less than their original cost. Current performance of the Fund may be lower or higher than the performance quoted. Performance data current to the most recent month end may be obtained by accessing the website www.massmutual.com.
Investors should note that the Fund is a professionally managed mutual fund, while the Russell 3000 Index, the Bloomberg Barclays U.S. Aggregate Bond Index, the MSCI ACWI ex USA, and the Custom MML Aggressive Allocation Index are unmanaged, do not incur expenses, and cannot be purchased directly by investors. Investors should read the Fund’s prospectus with regard to the Fund’s investment objective, risks, and charges and expenses in conjunction with these financial statements. The Fund’s return reflects changes in the net asset value per share without the deduction of any product charges (e.g., cost of insurance, mortality and expense risk charges, administrative fees, and CDSL). The inclusion of these charges would have reduced the performance shown here.
14
Table of Contents
MML American Funds Growth Fund – Portfolio Manager Report (Unaudited)
What is the investment approach of MML American Funds® Growth Fund, and who is the Fund’s investment adviser?
The Fund seeks to provide investors with growth of capital through a “master feeder” relationship. (See page 52 of this report for information about the “master feeder” relationship.) The Fund invests all of its assets in Class 1 shares of the American Funds Insurance Series – Growth Fund (the “Master Growth Fund”), a series of the American Funds Insurance Series®, a registered open-end investment company, managed by Capital Research and Management Company (Capital Research), which has substantially the same investment objective as the Master Growth Fund. The Master Growth Fund invests primarily in common stocks and seeks to invest in companies that appear to offer superior opportunities for growth of capital. The Master Growth Fund may invest up to 25% of its assets in common stocks and other securities of issuers domiciled outside the United States. The Master Growth Fund may hold a portion of its assets in cash or cash equivalents. The Fund’s investment adviser is MML Investment Advisers, LLC (MML Advisers).
How did the Fund perform during the 12 months ended December 31, 2016?
The Fund returned 9.00%, underperforming the 11.96% return of the S&P 500® Index (the “benchmark”), a widely recognized, unmanaged index representative of common stocks of larger capitalized U.S. companies. The Fund outperformed the 7.08% return of the Russell 1000® Growth Index, an unmanaged index consisting of those Russell 1000 securities (representing the 1,000 largest U.S. companies based on market capitalization) with greater than average growth orientation that tend to exhibit higher price-to-book ratios and higher forecasted growth rates than securities in the value universe.
For a discussion on the economic and market environment during the 12-month period ended December 31, 2016, please see the Economic and Market Overview, beginning on page 3.
Capital Research’s discussion of factors that contributed to the Fund’s performance
For the year ended December 31, 2016, the Fund’s health care holdings detracted from full-year performance on both an absolute and relative basis. Specifically, Centene (a leading multiline health care enterprise that provides services to government health care programs); Express Scripts (a pharmacy benefit management company); Vertex Pharmaceuticals; and Regeneron Pharmaceuticals, Inc. (a biotechnology company) were among the top detractors from the Fund’s relative returns.
Elsewhere, a rebound in commodities lifted the energy sector, while financial stocks rose, spurred by rising interest rates and the potential for a less restrictive regulatory environment. Strong stock selection in consumer discretionary and information technology also boosted the Fund’s full-year results. Most notably, Fund holdings Nintendo Co., Ltd. (a Japanese multinational consumer electronics and software company); Charter Communications (an American cable telecommunications company); and ASML (a Dutch company that is a supplier of photolithography systems for the semiconductor industry) were among the Fund’s top contributors to relative returns – with Nintendo’s stock price increasing 50%. An overweight position, relative to the benchmark, and good stock selection in the energy sector were also additive to results, given the turnaround in energy prices.
Overall, the Fund’s modest holdings outside of the United States added relative value. Canada, the Netherlands, and Taiwan were primary contributors, while the United Kingdom and Ireland were the main detractors from the Fund’s full-year performance.
Capital Research’s outlook
As we enter 2017, Fund management is keeping a close watch on the U.S. economy, looking past the rhetoric of the presidential election and evaluating the implications of policy changes on issues ranging from health care and trade to reform regulations and taxes on domestic companies. Our portfolio managers are optimistic that Capital Research’s global research capabilities have the potential to help identify attractive long-term investment opportunities for the Fund moving forward.
15
Table of Contents
MML American Funds Growth Fund – Portfolio Manager Report (Unaudited) (Continued)
| MML American Funds Growth Fund Asset Allocation (% of Net Assets) on 12/31/16 | ||||
Equity Funds | 100.1 | % | ||
|
| |||
Total Long-Term Investments | 100.1 | % | ||
Other Assets & Liabilities | (0.1 | )% | ||
|
| |||
Net Assets | 100.0 | % | ||
|
| |||
16
Table of Contents
MML American Funds Growth Fund – Portfolio Manager Report (Unaudited) (Continued)
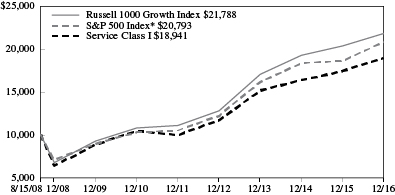
Growth of a $10,000 Investment
Hypothetical Investments in MML American Funds Growth Fund Service Class I, the S&P 500 Index, and the Russell 1000 Growth Index.
TOTAL RETURN | One Year | Five Year | Since | |||||||||
Service Class I | 9.00% | 13.76% | 7.92% | |||||||||
S&P 500 Index* | 11.96% | 14.66% | 9.13% | |||||||||
Russell 1000 Growth Index | 7.08% | 14.50% | 9.74% | |||||||||
GROWTH OF $10,000 INVESTMENT SINCE INCEPTION
Generally accepted accounting principles require adjustments to be made to the net assets of the Fund at period end for financial reporting purposes only, and as such, the total return based on the unadjusted net asset value per share may differ from the total return reported in the financial highlights.
* Benchmark
Performance data quoted represents past performance; past performance is not predictive of future results. The investment return and principal value of shares of the Fund will fluctuate with market conditions so that shares of the Fund, when redeemed, may be worth more or less than their original cost. Current performance of the Fund may be lower or higher than the performance quoted. Performance data current to the most recent month end may be obtained by accessing the website www.massmutual.com.
Investors should note that the Fund is a professionally managed mutual fund, while the S&P 500 Index and the Russell 1000 Growth Index are unmanaged, do not incur expenses, and cannot be purchased directly by investors. Investors should read the Fund’s prospectus with regard to the Fund’s investment objective, risks, and charges and expenses in conjunction with these financial statements. The Fund’s return reflects changes in the net asset value per share without the deduction of any product charges (e.g., cost of insurance, mortality and expense risk charges, administrative fees, and CDSL). The inclusion of these charges would have reduced the performance shown here.
17
Table of Contents
MML American Funds International Fund – Portfolio Manager Report (Unaudited)
What is the investment approach of MML American Funds® International Fund, and who is the Fund’s investment adviser?
The Fund seeks long-term capital growth of assets through a “master-feeder” relationship. (See page 52 of this report for information about the “master feeder” relationship.) The Fund invests all of its assets in Class 1 shares of the American Funds Insurance Series – International Fund (the “Master International Fund”), a series of the American Funds Insurance Series®, a registered open-end investment company managed by Capital Research and Management Company (Capital Research), which has substantially the same investment objective as the Master International Fund. The Master International Fund invests primarily in common stocks of companies domiciled outside the United States, including companies domiciled in developing countries, that Capital Research believes have the potential for growth. The Master International Fund may hold a portion of its assets in cash or cash equivalents. The Fund’s investment adviser is MML Investment Advisers, LLC (MML Advisers).
How did the Fund perform during the 12 months ended December 31, 2016?
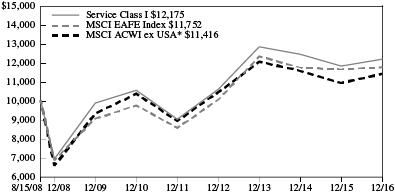
The Fund returned 2.97%, underperforming the 4.50% return of MSCI All Country World Index (ACWI) ex USA (the “benchmark”), an unmanaged index representative of stocks domiciled in global developed and emerging markets, excluding the United States. The Fund outperformed the 1.00% return of the MSCI EAFE Index, a widely recognized, unmanaged index representative of equity securities in developed markets around the world, excluding the U.S. and Canada.
For a discussion on the economic and market environment during the 12-month period ended December 31, 2016, please see the Economic and Market Review, beginning on page 3.
Capital Research’s discussion of factors that contributed to the Fund’s performance
The year 2016 was difficult one for non-U.S. stock markets – beginning with worries about China’s slowing growth and property bubble, and continuing with “Brexit” and the implications for companies in the eurozone. “Brexit” (an abbreviation for “British exit”), was the United Kingdom’s surprising June 23, 2016 referendum to leave the European Union. Europe continued its struggles to grow. In the Pacific Rim, Japan continued treading water, without making much progress.
In the United States, the economy strengthened, and so did the dollar, which tends to have a negative impact on emerging markets. One point of consolation for emerging markets was that oil prices rebounded, which helped to soothe fears of a further deflationary environment.
The Fund took advantage of the rally in commodities – as some materials stocks soared – during the year. The Fund’s positive performance was helped especially by miners First Quantum Minerals and Fortescue Metals. The shares of both of these Fund holdings doubled in price during the year. Energy stocks did well, but the Fund’s underweight exposure to the sector, relative to the benchmark, hurt results. Fund holdings in the information technology sector aided returns. There, standouts included Nintendo Co., Ltd. – a Japanese multinational consumer electronics and software company; and Tencent Holdings Limited, a Chinese company that provides media, entertainment, internet and mobile phone services in China. After strong returns in health care in recent years, many Fund holdings within that sector lagged – most notably, Novartis, a Swiss global health care company.
Capital Research’s outlook
In our view, some proposed U.S. policies may lead to inflation and trade barriers for non-U.S. companies, which could have a negative impact on growth and stock markets. Therefore, Fund management strives to have a balanced approach. We look for companies that will be least impacted by macroeconomic-driven events. Consequently, we take a diversified approach, making sure that the Fund invests in different geographies, industries, and companies that can control their own destiny through efficiencies or innovative products.
18
Table of Contents
MML American Funds International Fund – Portfolio Manager Report (Unaudited) (Continued)
| MML American Funds International Fund Asset Allocation (% of Net Assets) on 12/31/16 | ||||
Equity Funds | 100.1 | % | ||
|
| |||
Total Long-Term Investments | 100.1 | % | ||
Other Assets and Liabilities | (0.1 | )% | ||
|
| |||
Net Assets | 100.0 | % | ||
|
| |||
19
Table of Contents
MML American Funds International Fund – Portfolio Manager Report (Unaudited) (Continued)
Growth of a $10,000 Investment
Hypothetical Investments in MML American Funds International Fund Service Class I, the MSCI ACWI ex USA, and the MSCI EAFE Index.
TOTAL RETURN | One Year | Five Year | Since | |||||||||
Service Class I | 2.97% | 6.16% | 2.38% | |||||||||
MSCI ACWI | 4.50% | 5.00% | 1.59% | |||||||||
MSCI EAFE Index | 1.00% | 6.53% | 1.95% | |||||||||
GROWTH OF $10,000 INVESTMENT SINCE INCEPTION
Generally accepted accounting principles require adjustments to be made to the net assets of the Fund at period end for financial reporting purposes only, and as such, the total return based on the unadjusted net asset value per share may differ from the total return reported in the financial highlights.
* Benchmark
Performance data quoted represents past performance; past performance is not predictive of future results. The investment return and principal value of shares of the Fund will fluctuate with market conditions so that shares of the Fund, when redeemed, may be worth more or less than their original cost. Current performance of the Fund may be lower or higher than the performance quoted. Performance data current to the most recent month end may be obtained by accessing the website www.massmutual.com.
Investors should note that the Fund is a professionally managed mutual fund, while the MSCI ACWI ex USA and the MSCI EAFE Index are unmanaged, do not incur expenses, and cannot be purchased directly by investors. Investors should read the Fund’s prospectus with regard to the Fund’s investment objective, risks, and charges and expenses in conjunction with these financial statements. The Fund’s return reflects changes in the net asset value per share without the deduction of any product charges (e.g., cost of insurance, mortality and expense risk charges, administrative fees, and CDSL). The inclusion of these charges would have reduced the performance shown here.
20
Table of Contents
MML American Funds Core Allocation Fund – Portfolio Manager Report (Unaudited)
What is the investment approach of MML American Funds Core Allocation Fund, and who is the Fund’s investment adviser?
The Fund seeks to achieve as high a total return over time as is considered consistent with prudent investment risk, preservation of capital, and recognition of the Fund’s stated asset allocation. The Fund is a “fund of funds” and seeks to achieve its investment objective by principally investing in a combination of series of the American Funds Insurance Series® (the “American Underlying Funds”), managed by Capital Research and Management Company (“Capital Research”), using a flexible asset allocation approach. The Fund’s investment adviser invests the Fund’s assets in a combination of domestic and international American Underlying Funds. As of the date of this report, it is expected that the Underlying Funds will include Class I shares of the American Funds Insurance Series – Bond Fund, the American Funds Insurance Series – Blue Chip Income and Growth Fund, the American Funds Insurance Series – Growth-Income Fund, and the American Funds Insurance Series – International Fund. The Fund’s investment adviser allocates the Fund’s assets among a variety of different asset classes through investing in American Underlying Funds in response to changing market, economic, and investment conditions. The Fund’s investment adviser is MML Investment Advisers, LLC (MML Advisers).
How did the Fund perform during the 12 months ended December 31, 2016?
The Fund returned 8.97%, underperforming the 11.96% return of the S&P 500® Index (the “benchmark”), a widely recognized, unmanaged index representative of common stocks of larger capitalized U.S. companies. The Fund outperformed the 4.50% return of the MSCI All Country World Index (ACWI) ex USA, an unmanaged index representative of stocks domiciled in global developed and emerging markets, excluding the United States. The Fund outperformed the 2.65% return of the Bloomberg Barclays U.S. Aggregate Bond Index, an unmanaged index of fixed-rate investment-grade securities with at least one year to maturity, combining the Bloomberg Barclays U.S. Treasury Bond Index, the Bloomberg Barclays U.S. Government-Related Bond Index, the Bloomberg Barclays U.S. Corporate Bond Index, and the Bloomberg Barclays U.S. Securitized Bond Index. Finally, the Fund’s 8.97% return outperformed the 7.95% return of the Custom MML Core Allocation Index, which comprises the benchmark (55%), the Bloomberg Barclays U.S. Aggregate Bond Index (35%), and the MSCI ACWI ex USA (10%).
For a discussion on the economic and market environment during the 12-month period ended December 31, 2016, please see the Economic and Market Review, beginning on page 3.
Capital Research’s discussion of factors that contributed to the Fund’s performance
Although the Fund’s U.S. equity exposure, which is primarily in the large-cap market segment, was a detractor overall relative to an all-cap U.S. equity portfolio, stock selection and a more value orientation in U.S large-cap equities was a benefit to the Fund. An underweight to international equites, relative to a global portfolio, and exposure to high-yield bonds relative to investment-grade bonds were also additive to the Fund’s performance. The Fund continued to maintain a lower risk (standard deviation) of 6.51% relative to its custom benchmark of 7.11% for the year.
The following paragraphs discuss the results of each of the Fund’s underlying portfolio components. Because the Fund invests in both stock- and bond-based portfolios, its overall performance may vary considerably from the broad market indexes listed above, which each measure the performance of a specific group of securities. These component-specific discussions focus on results and positioning versus each component’s main comparative index, not how the Fund as a whole performed or was positioned versus those indexes.
The American Funds Insurance Series – Bond Fund (the “Bond Fund”) outperformed the Bloomberg Barclays U.S. Aggregate Bond Index (the “Index”) for the year. Yields moved higher in the latter half of 2016, with the most significant increase occurring in the wake of the U.S. presidential election. For the Bond Fund, corporate bond selection aided results, particularly in the energy sector. The Bond Fund’s underweight position in mortgages, relative to the benchmark, was helpful as rates began to increase. Stronger expectations for inflation boosted the Bond Fund’s Treasury inflation-protected securities (TIPS) holdings.
The American Funds Insurance Series – Blue Chip Income and Growth Fund (the “Income and Growth Fund”) substantially outperformed the benchmark in 2016. During the year, two Income and Growth Fund holdings – Canadian Natural Resources Limited (an oil and gas exploration, development, and production company) and Halliburton (one of the world’s largest oil field services companies) led the way for energy stocks, which were strong contributors as oil experienced a rebound. Two of the
21
Table of Contents
MML American Funds Core Allocation Fund – Portfolio Manager Report (Unaudited) (Continued)
Income and Growth Fund’s materials holdings – Freeport-McMoRan, Inc. (an Arizona-based mining company) and Brazilian metals and mining company Vale both doubled during the year. Health care stocks were notable detractors, as top holding Amgen Inc. (an American multinational biopharmaceutical company) lost ground.
The American Funds Insurance Series – Growth-Income Fund (the “Growth-Income Fund”) underperformed the benchmark for the year, as the Growth-Income Fund’s weakest sectors on a relative basis were health care, consumer staples, and financials. Health care was the biggest detractor from relative returns. Specifically, Amgen Inc. (an American multinational biopharmaceutical company); Gilead Sciences, Inc. (a biopharmaceutical company); and Illumina, Inc. (a company that develops, manufactures and markets integrated systems for the analysis of genetic variation and biological function) were the most significant laggards. On the positive side, stock selection in materials contributed the most to the Growth-Income Fund’s returns on a relative basis. As iron ore prices climbed, Brazilian metals and mining company Vale experienced a triple-digit return – making Vale among the top Growth-Income Fund holdings contributing to relative returns. American mining company Freeport McMoRan was another Growth-Income Fund holding that was additive to full-year performance, as its share price rose, after having plummeted 70% in 2015. An overweight position and good stock selection in the energy sector also added to results, given the turnaround in energy prices.
The American Funds Insurance Series – International Fund (the “International Fund”) underperformed the MSCI ACWI ex USA (the “Index”) for the year, as 2016 was a challenging year for non-U.S. stock markets – beginning with worries about China’s slowing growth and property bubble, and continuing with “Brexit” and the implications for companies in the eurozone. “Brexit” (an abbreviation for “British exit”), was the United Kingdom’s surprising June 23, 2016 referendum to leave the European Union. Europe continued its struggles to grow. In the Pacific Rim, Japan continued treading water, without making much progress. In the United States, the economy strengthened, and so did the dollar, which tends to have a negative impact on emerging markets. One point of consolation for emerging markets was that oil prices rebounded, which helped to soothe fears of a further deflationary environment. During the year, the International Fund took advantage of the rally in commodities, as some materials stocks soared. The International Fund’s positive performance was helped especially by miners First Quantum Minerals and Fortescue Metals. The shares of both of these International Fund holdings doubled in price. Energy stocks did well, but the International Fund’s underweight exposure to the sector hurt results. International Fund holdings in the information technology sector aided returns. There, standouts included Nintendo Co., Ltd. – a Japanese multinational consumer electronics and software company – and Tencent Holdings Limited, a Chinese company that provides media, entertainment, internet, and mobile phone services in China. After strong returns in health care in recent years, many International Fund holdings within that sector lagged in 2016 – most notably, Novartis, a Swiss global health care company.
Capital Research’s outlook
We believe that, on the whole, the U.S. economy is in good shape. While the recent stretch of fiscal exuberance has delighted investors and may have the potential to delay the next recession, we prefer markets that run on realism. The Trump administration has created considerable uncertainty with its rather broad statements on trade, tax reform, and spending. As such, we believe that periods of volatility could occur in the months ahead. If this becomes reality, with respect to the Bond Fund, we will search the bond market for promising investment opportunities in an effort to help the Bond Fund withstand the frequently changing market conditions.
With respect to domestic equities, Fund management exercises caution when considering the potential impact on the U.S. economy and markets that could result from the new administration’s approach to health care, infrastructure, fiscal policy, taxes, and trade. Should increased volatility occur, Fund management will search for investment options that they believe could have more favorable valuations in the long term.
Regarding the International Fund, we believe that some proposed U.S. policies may lead to inflation and trade barriers for non-U.S. companies, which could have a negative impact on growth and stock markets. Therefore, Fund management plans to have a balanced approach – which would involve seeking companies that have the potential to be minimally impacted by macroeconomic-driven events. This diversified approach means that the Fund may invest in different geographies, industries, and companies that Fund management believes can control their own destiny through efficiencies or innovative products.
22
Table of Contents
MML American Funds Core Allocation Fund – Portfolio Manager Report (Unaudited) (Continued)
| MML American Funds Core Allocation Fund Asset Allocation (% of Net Assets) on 12/31/16 | ||||
Equity Funds | 64.8 | % | ||
Fixed Income Funds | 35.3 | % | ||
|
| |||
Total Long-Term Investments | 100.1 | % | ||
Other Assets & Liabilities | (0.1 | )% | ||
|
| |||
Net Assets | 100.0 | % | ||
|
| |||
23
Table of Contents
MML American Funds Core Allocation Fund – Portfolio Manager Report (Unaudited) (Continued)
Growth of a $10,000 Investment
Hypothetical Investments in MML American Funds Core Allocation Fund Service Class I, the S&P 500 Index, the MSCI ACWI ex USA, the Bloomberg Barclays U.S. Aggregate Bond Index, and the Custom MML Core Allocation Index.
TOTAL RETURN | One Year | Five Year 1/1/12 - | Since Inception | |||||||||
Service Class I | 8.97% | 9.00% | 5.91% | |||||||||
S&P 500 Index* | 11.96% | 14.66% | 9.13% | |||||||||
| MSCI ACWI ex USA | 4.50% | 5.00% | 1.59% | |||||||||
| Bloomberg Barclays U.S. Aggregate Bond Index | 2.65% | 2.23% | 4.22% | |||||||||
| Custom MML Core Allocation Index | 7.95% | 9.37% | 7.11% | |||||||||
GROWTH OF $10,000 INVESTMENT SINCE INCEPTION

Generally accepted accounting principles require adjustments to be made to the net assets of the Fund at period end for financial reporting purposes only, and as such, the total return based on the unadjusted net asset value per share may differ from the total return reported in the financial highlights.
* Benchmark
Performance data quoted represents past performance; past performance is not predictive of future results. The investment return and principal value of shares of the Fund will fluctuate with market conditions so that shares of the Fund, when redeemed, may be worth more or less than their original cost. Current performance of the Fund may be lower or higher than the performance quoted. Performance data current to the most recent month end may be obtained by accessing the website www.massmutual.com.
Investors should note that the Fund is a professionally managed mutual fund, while the S&P 500 Index, the MSCI ACWI ex USA, the Bloomberg Barclays U.S. Aggregate Bond Index, and the Custom MML Core Allocation Index are unmanaged, do not incur expenses, and cannot be purchased directly by investors. Investors should read the Fund’s prospectus with regard to the Fund’s investment objective, risks, and charges and expenses in conjunction with these financial statements. The Fund’s return reflects changes in the net asset value per share without the deduction of any product charges (e.g., cost of insurance, mortality and expense risk charges, administrative fees, and CDSL). The inclusion of these charges would have reduced the performance shown here.
24
Table of Contents
MML Conservative Allocation Fund – Portfolio of Investments
December 31, 2016
| Number of Shares | Value | |||||||
| MUTUAL FUNDS — 100.1% | ||||||||
| Equity Funds — 39.6% | ||||||||
MML Blue Chip Growth Fund, Initial Class (a) | 948,536 | $ | 13,260,532 | |||||
MML Equity Income Fund, Initial Class (a) | 1,086,900 | 12,803,678 | ||||||
MML Equity Index Fund, Class III (a) | 272,727 | 7,229,980 | ||||||
MML Focused Equity Fund, Class II (a) | 580,032 | 7,656,425 | ||||||
MML Foreign Fund, Initial Class (a) | 1,008,329 | 9,518,629 | ||||||
MML Fundamental Growth Fund, Class II (a) | 871,922 | 9,957,354 | ||||||
MML Fundamental Value Fund, Class II (a) | 934,193 | 13,770,003 | ||||||
MML Global Fund, Class I (a) | 1,047,855 | 12,092,252 | ||||||
MML Income & Growth Fund, Initial Class (a) | 1,144,851 | 13,577,928 | ||||||
MML International Equity Fund, Class II (a) | 795,236 | 7,419,548 | ||||||
MML Large Cap Growth Fund, Initial Class (a) | 364,199 | 3,871,431 | ||||||
MML Mid Cap Growth Fund, Initial Class (a) | 556,347 | 7,983,581 | ||||||
MML Mid Cap Value Fund, Initial Class (a) | 853,669 | 10,064,752 | ||||||
MML Small Cap Growth Equity Fund, Initial Class (a) | 191,703 | 2,433,051 | ||||||
MML Small Company Value Fund, Class II (a) | 289,700 | 4,991,538 | ||||||
MML Small/Mid Cap Value Fund, Initial Class (a) | 184,477 | 2,440,628 | ||||||
Oppenheimer Discovery Mid Cap Growth Fund/VA, Non-Service Shares (a) | 37,243 | 2,705,704 | ||||||
Oppenheimer Global Fund/VA, Non-Service Shares (a) | 229,821 | 8,048,345 | ||||||
Oppenheimer Global Multi-Alternatives Fund/VA, Non-Service Shares (a) | 3,249,945 | 32,109,453 | ||||||
Oppenheimer International Growth Fund/VA, Non-Service Shares (a) | 3,309,102 | 6,882,933 | ||||||
|
| |||||||
| 188,817,745 | ||||||||
|
| |||||||
| Fixed Income Funds — 60.5% | ||||||||
MML Dynamic Bond Fund, Class II (a) | 6,557,621 | 64,854,876 | ||||||
MML High Yield Fund, Class II (a) | 1,547,264 | 15,364,330 | ||||||
MML Inflation-Protected and Income Fund, Initial Class (a) | 1,986,984 | 20,227,497 | ||||||
MML Managed Bond Fund, Initial Class (a) | 8,380,314 | 102,593,023 | ||||||
| Number of Shares | Value | |||||||
MML Short-Duration Bond Fund, Class II (a) | 2,614,870 | $ | 25,494,982 | |||||
MML Total Return Bond Fund, Class II (a) | 5,876,460 | 60,351,247 | ||||||
|
| |||||||
| 288,885,955 | ||||||||
|
| |||||||
| TOTAL MUTUAL FUNDS (Cost $493,155,235) | 477,703,700 | |||||||
|
| |||||||
| TOTAL LONG-TERM INVESTMENTS (Cost $493,155,235) | 477,703,700 | |||||||
|
| |||||||
| TOTAL INVESTMENTS — 100.1% (Cost $493,155,235) (b) | 477,703,700 | |||||||
| Other Assets/(Liabilities) — (0.1)% | (351,237 | ) | ||||||
|
| |||||||
| NET ASSETS — 100.0% | $ | 477,352,463 | ||||||
|
| |||||||
Notes to Portfolio of Investments
Percentages are stated as a percent of net assets.
| (a) | Affiliated issuer. See Note 7 for a summary of transactions in the investments of affiliated issuers. |
| (b) | See Note 6 for aggregate cost for federal tax purposes. |
The accompanying notes are an integral part of the financial statements.
25
Table of Contents
MML Balanced Allocation Fund – Portfolio of Investments
December 31, 2016
| Number of Shares | Value | |||||||
| MUTUAL FUNDS — 100.1% | ||||||||
| Equity Funds — 49.6% | ||||||||
MML Blue Chip Growth Fund, Initial Class (a) | 1,525,592 | $ | 21,327,777 | |||||
MML Equity Income Fund, Initial Class (a) | 1,522,823 | 17,938,855 | ||||||
MML Equity Index Fund, Class III (a) | 344,598 | 9,135,303 | ||||||
MML Focused Equity Fund, Class II (a) | 826,731 | 10,912,847 | ||||||
MML Foreign Fund, Initial Class (a) | 1,767,360 | 16,683,879 | ||||||
MML Fundamental Growth Fund, Class II (a) | 1,335,158 | 15,247,502 | ||||||
MML Fundamental Value Fund, Class II (a) | 1,216,219 | 17,927,067 | ||||||
MML Global Fund, Class I (a) | 1,608,498 | 18,562,070 | ||||||
MML Income & Growth Fund, Initial Class (a) | 1,708,600 | 20,264,000 | ||||||
MML International Equity Fund, Class II (a) | 1,462,951 | 13,649,330 | ||||||
MML Large Cap Growth Fund, Initial Class (a) | 587,861 | 6,248,966 | ||||||
MML Mid Cap Growth Fund, Initial Class (a) | 975,060 | 13,992,109 | ||||||
MML Mid Cap Value Fund, Initial Class (a) | 1,369,170 | 16,142,518 | ||||||
MML Small Cap Growth Equity Fund, Initial Class (a) | 319,938 | 4,060,581 | ||||||
MML Small Company Value Fund, Class II (a) | 409,118 | 7,049,106 | ||||||
MML Small/Mid Cap Value Fund, Initial Class (a) | 353,523 | 4,677,114 | ||||||
Oppenheimer Discovery Mid Cap Growth Fund/VA, Non-Service Shares (a) | 65,125 | 4,731,357 | ||||||
Oppenheimer Global Fund/VA, Non-Service Shares (a) | 354,384 | 12,410,533 | ||||||
Oppenheimer Global Multi-Alternatives Fund/VA, Non-Service Shares (a) | 4,189,370 | 41,390,980 | ||||||
Oppenheimer International Growth Fund/VA, Non-Service Shares (a) | 5,771,175 | 12,004,043 | ||||||
|
| |||||||
| 284,355,937 | ||||||||
|
| |||||||
| Fixed Income Funds — 50.5% | ||||||||
MML Dynamic Bond Fund, Class II (a) | 6,400,654 | 63,302,467 | ||||||
MML High Yield Fund, Class II (a) | 1,596,827 | 15,856,493 | ||||||
MML Inflation-Protected and Income Fund, Initial Class (a) | 2,092,360 | 21,300,226 | ||||||
MML Managed Bond Fund, Initial Class (a) | 8,228,878 | 100,739,121 | ||||||
| Number of Shares | Value | |||||||
MML Short-Duration Bond Fund, Class II (a) | 2,891,059 | $ | 28,187,825 | |||||
MML Total Return Bond Fund, Class II (a) | 5,879,263 | 60,380,036 | ||||||
|
| |||||||
| 289,766,168 | ||||||||
|
| |||||||
| TOTAL MUTUAL FUNDS (Cost $591,672,024) | 574,122,105 | |||||||
|
| |||||||
| TOTAL LONG-TERM INVESTMENTS (Cost $591,672,024) | 574,122,105 | |||||||
|
| |||||||
| TOTAL INVESTMENTS — 100.1% (Cost $591,672,024) (b) | 574,122,105 | |||||||
| Other Assets/(Liabilities) — (0.1)% | (410,015 | ) | ||||||
|
| |||||||
| NET ASSETS — 100.0% | $ | 573,712,090 | ||||||
|
| |||||||
Notes to Portfolio of Investments
Percentages are stated as a percent of net assets.
| (a) | Affiliated issuer. See Note 7 for a summary of transactions in the investments of affiliated issuers. |
| (b) | See Note 6 for aggregate cost for federal tax purposes. |
The accompanying notes are an integral part of the financial statements.
26
Table of Contents
MML Moderate Allocation Fund – Portfolio of Investments
December 31, 2016
| Number of Shares | Value | |||||||
| MUTUAL FUNDS — 100.1% | ||||||||
| Equity Funds — 59.6% | ||||||||
MML Blue Chip Growth Fund, Initial Class (a) | 7,994,376 | $ | 111,761,373 | |||||
MML Equity Income Fund, Initial Class (a) | 7,706,912 | 90,787,429 | ||||||
MML Equity Index Fund, Class III (a) | 1,443,633 | 38,270,712 | ||||||
MML Focused Equity Fund, Class II (a) | 3,911,670 | 51,634,038 | ||||||
MML Foreign Fund, Initial Class (a) | 8,510,670 | 80,340,727 | ||||||
MML Fundamental Growth Fund, Class II (a) | 6,504,519 | 74,281,602 | ||||||
MML Fundamental Value Fund, Class II (a) | 7,132,757 | 105,136,831 | ||||||
MML Global Fund, Class I (a) | 8,143,690 | 93,978,184 | ||||||
MML Income & Growth Fund, Initial Class (a) | 7,277,471 | 86,310,801 | ||||||
MML International Equity Fund, Class II (a) | 6,609,648 | 61,668,017 | ||||||
MML Large Cap Growth Fund, Initial Class (a) | 3,078,167 | 32,720,915 | ||||||
MML Mid Cap Growth Fund, Initial Class (a) | 5,348,661 | 76,753,279 | ||||||
MML Mid Cap Value Fund, Initial Class (a) | 7,089,359 | 83,583,544 | ||||||
MML Small Cap Growth Equity Fund, Initial Class (a) | 1,642,308 | 20,843,827 | ||||||
MML Small Company Value Fund, Class II (a) | 2,290,115 | 39,458,682 | ||||||
MML Small/Mid Cap Value Fund, Initial Class (a) | 1,748,910 | 23,138,079 | ||||||
MML Strategic Emerging Markets Fund, Class II (a) | 4,604,786 | 39,785,354 | ||||||
Oppenheimer Discovery Mid Cap Growth Fund/VA, Non-Service Shares (a) | 328,040 | 23,832,076 | ||||||
Oppenheimer Global Fund/VA, Non-Service Shares (a) | 1,800,933 | 63,068,689 | ||||||
Oppenheimer Global Multi-Alternatives Fund/VA, Non-Service Shares (a) | 18,221,504 | 180,028,457 | ||||||
Oppenheimer International Growth Fund/VA, Non-Service Shares (a) | 19,897,140 | 41,386,052 | ||||||
|
| |||||||
| 1,418,768,668 | ||||||||
|
| |||||||
| Fixed Income Funds — 40.5% | ||||||||
MML Dynamic Bond Fund, Class II (a) | 21,214,046 | 209,806,917 | ||||||
MML High Yield Fund, Class II (a) | 5,059,132 | 50,237,180 | ||||||
| Number of Shares | Value | |||||||
MML Inflation-Protected and Income Fund, Initial Class (a) | 7,471,136 | $ | 76,056,166 | |||||
MML Managed Bond Fund, Initial Class (a) | 27,172,837 | 332,653,833 | ||||||
MML Short-Duration Bond Fund, Class II (a) | 10,292,741 | 100,354,227 | ||||||
MML Total Return Bond Fund, Class II (a) | 18,940,084 | 194,514,661 | ||||||
|
| |||||||
| 963,622,984 | ||||||||
|
| |||||||
| TOTAL MUTUAL FUNDS (Cost $2,445,967,785) | 2,382,391,652 | |||||||
|
| |||||||
| TOTAL LONG-TERM INVESTMENTS (Cost $2,445,967,785) | 2,382,391,652 | |||||||
|
| |||||||
| TOTAL INVESTMENTS — 100.1% (Cost $2,445,967,785) (b) | 2,382,391,652 | |||||||
| Other Assets/(Liabilities) — (0.1)% | (1,681,333 | ) | ||||||
|
| |||||||
| NET ASSETS — 100.0% | $ | 2,380,710,319 | ||||||
|
| |||||||
Notes to Portfolio of Investments
Percentages are stated as a percent of net assets.
| (a) | Affiliated issuer. See Note 7 for a summary of transactions in the investments of affiliated issuers. |
| (b) | See Note 6 for aggregate cost for federal tax purposes. |
The accompanying notes are an integral part of the financial statements.
27
Table of Contents
MML Growth Allocation Fund – Portfolio of Investments
December 31, 2016
| Number of Shares | Value | |||||||
| MUTUAL FUNDS — 100.1% | ||||||||
| Equity Funds — 74.7% | ||||||||
MML Blue Chip Growth Fund, Initial Class (a) | 6,756,203 | $ | 94,451,718 | |||||
MML Equity Income Fund, Initial Class (a) | 5,761,598 | 67,871,628 | ||||||
MML Equity Index Fund, Class III (a) | 1,324,158 | 35,103,439 | ||||||
MML Focused Equity Fund, Class II (a) | 4,078,850 | 53,840,824 | ||||||
MML Foreign Fund, Initial Class (a) | 7,210,379 | 68,065,982 | ||||||
MML Fundamental Growth Fund, Class II (a) | 5,185,134 | 59,214,229 | ||||||
MML Fundamental Value Fund, Class II (a) | 5,306,715 | 78,220,986 | ||||||
MML Global Fund, Class I (a) | 6,952,467 | 80,231,464 | ||||||
MML Income & Growth Fund, Initial Class (a) | 5,998,774 | 71,145,461 | ||||||
MML International Equity Fund, Class II (a) | 6,624,099 | 61,802,842 | ||||||
MML Large Cap Growth Fund, Initial Class (a) | 2,631,374 | 27,971,510 | ||||||
MML Mid Cap Growth Fund, Initial Class (a) | 4,863,579 | 69,792,352 | ||||||
MML Mid Cap Value Fund, Initial Class (a) | 6,049,974 | 71,329,196 | ||||||
MML Small Cap Growth Equity Fund, Initial Class (a) | 1,363,846 | 17,309,649 | ||||||
MML Small Company Value Fund, Class II (a) | 1,952,409 | 33,640,005 | ||||||
MML Small/Mid Cap Value Fund, Initial Class (a) | 1,943,414 | 25,711,368 | ||||||
MML Strategic Emerging Markets Fund, Class II (a) | 4,844,657 | 41,857,835 | ||||||
Oppenheimer Discovery Mid Cap Growth Fund/VA, Non-Service Shares (a) | 308,373 | 22,403,281 | ||||||
Oppenheimer Global Fund/VA, Non-Service Shares (a) | 1,541,426 | 53,980,750 | ||||||
Oppenheimer Global Multi-Alternatives Fund/VA, Non-Service Shares (a) | 13,653,001 | 134,891,646 | ||||||
Oppenheimer International Growth Fund/VA, Non-Service Shares (a) | 15,697,197 | 32,650,169 | ||||||
|
| |||||||
| 1,201,486,334 | ||||||||
|
| |||||||
| Fixed Income Funds — 25.4% | ||||||||
MML Dynamic Bond Fund, Class II (a) | 8,242,299 | 81,516,332 | ||||||
MML High Yield Fund, Class II (a) | 1,378,040 | 13,683,936 | ||||||
| Number of Shares | Value | |||||||
MML Inflation-Protected and Income Fund, Initial Class (a) | 6,381,423 | $ | 64,962,883 | |||||
MML Managed Bond Fund, Initial Class (a) | 10,241,038 | 125,372,282 | ||||||
MML Short-Duration Bond Fund, Class II (a) | 4,765,970 | 46,468,211 | ||||||
MML Total Return Bond Fund, Class II (a) | 7,429,070 | 76,296,552 | ||||||
|
| |||||||
| 408,300,196 | ||||||||
|
| |||||||
| TOTAL MUTUAL FUNDS (Cost $1,613,819,422) | 1,609,786,530 | |||||||
|
| |||||||
| TOTAL LONG-TERM INVESTMENTS (Cost $1,613,819,422) | 1,609,786,530 | |||||||
|
| |||||||
| TOTAL INVESTMENTS — 100.1% (Cost $1,613,819,422) (b) | 1,609,786,530 | |||||||
| Other Assets/(Liabilities) — (0.1)% | (979,877 | ) | ||||||
|
| |||||||
| NET ASSETS — 100.0% | $ | 1,608,806,653 | ||||||
|
| |||||||
Notes to Portfolio of Investments
Percentages are stated as a percent of net assets.
| (a) | Affiliated issuer. See Note 7 for a summary of transactions in the investments of affiliated issuers. |
| (b) | See Note 6 for aggregate cost for federal tax purposes. |
The accompanying notes are an integral part of the financial statements.
28
Table of Contents
MML Aggressive Allocation Fund – Portfolio of Investments
December 31, 2016
| Number of Shares | Value | |||||||
| MUTUAL FUNDS — 100.1% | ||||||||
| Equity Funds — 89.9% | ||||||||
MML Blue Chip Growth Fund, Initial Class (a) | 607,538 | $ | 8,493,383 | |||||
MML Equity Income Fund, Initial Class (a) | 561,322 | 6,612,376 | ||||||
MML Equity Index Fund, Class III (a) | 68,329 | 1,811,405 | ||||||
MML Focused Equity Fund, Class II (a) | 372,991 | 4,923,483 | ||||||
MML Foreign Fund, Initial Class (a) | 714,459 | 6,744,490 | ||||||
MML Fundamental Growth Fund, Class II (a) | 564,841 | 6,450,487 | ||||||
MML Fundamental Value Fund, Class II (a) | 592,968 | 8,740,349 | ||||||
MML Global Fund, Class I (a) | 692,226 | 7,988,287 | ||||||
MML Income & Growth Fund, Initial Class (a) | 592,137 | 7,022,740 | ||||||
MML International Equity Fund, Class II (a) | 667,198 | 6,224,953 | ||||||
MML Large Cap Growth Fund, Initial Class (a) | 263,752 | 2,803,682 | ||||||
MML Mid Cap Growth Fund, Initial Class (a) | 516,877 | 7,417,192 | ||||||
MML Mid Cap Value Fund, Initial Class (a) | 641,176 | 7,559,467 | ||||||
MML Small Cap Growth Equity Fund, Initial Class (a) | 154,970 | 1,966,841 | ||||||
MML Small Company Value Fund, Class II (a) | 208,840 | 3,598,307 | ||||||
MML Small/Mid Cap Value Fund, Initial Class (a) | 204,807 | 2,709,603 | ||||||
MML Strategic Emerging Markets Fund, Class II (a) | 532,589 | 4,601,568 | ||||||
Oppenheimer Discovery Mid Cap Growth Fund/VA, Non-Service Shares (a) | 35,144 | 2,553,210 | ||||||
Oppenheimer Global Fund/VA, Non-Service Shares (a) | 154,404 | 5,407,235 | ||||||
Oppenheimer Global Multi-Alternatives Fund/VA, Non-Service Shares (a) | 1,191,553 | 11,772,547 | ||||||
Oppenheimer International Growth Fund/VA, Non-Service Shares (a) | 1,583,033 | 3,292,708 | ||||||
|
| |||||||
| 118,694,313 | ||||||||
|
| |||||||
| Fixed Income Funds — 10.2% | ||||||||
MML Dynamic Bond Fund, Class II (a) | 199,325 | 1,971,322 | ||||||
MML Inflation-Protected and Income Fund, Initial Class (a) | 350,048 | 3,563,490 | ||||||
MML Managed Bond Fund, Initial Class (a) | 261,001 | 3,195,208 | ||||||
| Number of Shares | Value | |||||||
MML Short-Duration Bond Fund, Class II (a) | 289,095 | $ | 2,818,672 | |||||
MML Total Return Bond Fund, Class II (a) | 185,417 | 1,904,237 | ||||||
|
| |||||||
| 13,452,929 | ||||||||
|
| |||||||
| TOTAL MUTUAL FUNDS (Cost $137,272,665) | 132,147,242 | |||||||
|
| |||||||
| TOTAL LONG-TERM INVESTMENTS (Cost $137,272,665) | 132,147,242 | |||||||
|
| |||||||
| TOTAL INVESTMENTS — 100.1% (Cost $137,272,665) (b) | 132,147,242 | |||||||
| Other Assets/(Liabilities) — (0.1)% | (92,313 | ) | ||||||
|
| |||||||
| NET ASSETS — 100.0% | $ | 132,054,929 | ||||||
|
| |||||||
Notes to Portfolio of Investments
Percentages are stated as a percent of net assets.
| (a) | Affiliated issuer. See Note 7 for a summary of transactions in the investments of affiliated issuers. |
| (b) | See Note 6 for aggregate cost for federal tax purposes. |
The accompanying notes are an integral part of the financial statements.
29
Table of Contents
MML American Funds Growth Fund – Portfolio of Investments
December 31, 2016
| Number of Shares | Value | |||||||
| MUTUAL FUNDS — 100.1% | ||||||||
| Equity Funds — 100.1% | ||||||||
American Funds Growth Fund, Class 1 | 2,080,567 | $ | 140,001,347 | |||||
|
| |||||||
| 140,001,347 | ||||||||
|
| |||||||
| TOTAL MUTUAL FUNDS (Cost $135,071,916) | 140,001,347 | |||||||
|
| |||||||
| TOTAL LONG-TERM INVESTMENTS (Cost $135,071,916) | 140,001,347 | |||||||
|
| |||||||
| TOTAL INVESTMENTS — 100.1% (Cost $135,071,916) (a) | 140,001,347 | |||||||
| Other Assets/(Liabilities) — (0.1)% | (160,618 | ) | ||||||
|
| |||||||
| NET ASSETS — 100.0% | $ | 139,840,729 | ||||||
|
| |||||||
Notes to Portfolio of Investments
Percentages are stated as a percent of net assets.
| (a) | See Note 6 for aggregate cost for federal tax purposes. |
The accompanying notes are an integral part of the financial statements.
30
Table of Contents
MML American Funds International Fund – Portfolio of Investments
December 31, 2016
| Number of Shares | Value | |||||||
| MUTUAL FUNDS — 100.1% | ||||||||
| Equity Funds — 100.1% | ||||||||
American Funds International Fund, Class 1 | 3,213,176 | $ | 54,045,616 | |||||
|
| |||||||
| 54,045,616 | ||||||||
|
| |||||||
| TOTAL MUTUAL FUNDS (Cost $57,826,748) | 54,045,616 | |||||||
|
| |||||||
| TOTAL LONG-TERM INVESTMENTS (Cost $57,826,748) | 54,045,616 | |||||||
|
| |||||||
| TOTAL INVESTMENTS — 100.1% (Cost $57,826,748) (a) | 54,045,616 | |||||||
| Other Assets/(Liabilities) — (0.1)% | (73,751 | ) | ||||||
|
| |||||||
| NET ASSETS — 100.0% | $ | 53,971,865 | ||||||
|
| |||||||
Notes to Portfolio of Investments
Percentages are stated as a percent of net assets.
| (a) | See Note 6 for aggregate cost for federal tax purposes. |
The accompanying notes are an integral part of the financial statements.
31
Table of Contents
MML American Funds Core Allocation Fund — Portfolio of Investments
December 31, 2016
| Number of Shares | Value | |||||||
| MUTUAL FUNDS — 100.1% | ||||||||
| Equity Funds — 64.8% | ||||||||
American Funds Blue Chip Income and Growth Fund, Class 1 | 17,319,736 | $ | 234,336,028 | |||||
American Funds Growth-Income Fund, Class 1 | 6,324,262 | 280,860,469 | ||||||
American Funds International Fund, Class 1 | 5,627,397 | 94,652,819 | ||||||
|
| |||||||
| 609,849,316 | ||||||||
|
| |||||||
| Fixed Income Funds — 35.3% | ||||||||
American Funds Bond Fund, Class 1 | 30,798,372 | 332,622,418 | ||||||
|
| |||||||
| TOTAL MUTUAL FUNDS (Cost $908,936,811) | 942,471,734 | |||||||
|
| |||||||
| TOTAL LONG-TERM INVESTMENTS (Cost $908,936,811) | 942,471,734 | |||||||
|
| |||||||
| TOTAL INVESTMENTS — 100.1% (Cost $908,936,811) (a) | 942,471,734 | |||||||
| Other Assets/(Liabilities) — (0.1)% | (1,021,831 | ) | ||||||
|
| |||||||
| NET ASSETS — 100.0% | $ | 941,449,903 | ||||||
|
| |||||||
Notes to Portfolio of Investments
Percentages are stated as a percent of net assets.
| (a) | See Note 6 for aggregate cost for federal tax purposes. |
The accompanying notes are an integral part of the financial statements.
32
Table of Contents
THIS PAGE INTENTIONALLY LEFT BLANK
33
Table of Contents
MML Series Investment Fund – Financial Statements
Statements of Assets and Liabilities
December 31, 2016
| MML Conservative Allocation Fund | MML Balanced Allocation Fund | |||||||
| Assets: | ||||||||
Investments, at value — unaffiliated issuers (Note 2) (a) | $ | - | $ | - | ||||
Investments, at value — affiliated issuers (Note 2 & 7) (b) | 477,703,700 | 574,122,105 | ||||||
|
|
|
| |||||
Total investments | 477,703,700 | 574,122,105 | ||||||
|
|
|
| |||||
Receivables from: | ||||||||
Investments sold | 8,472 | 564,558 | ||||||
Investment adviser (Note 3) | - | - | ||||||
Fund shares sold | 9,977 | 84,719 | ||||||
|
|
|
| |||||
Total assets | 477,722,149 | 574,771,382 | ||||||
|
|
|
| |||||
| Liabilities: | ||||||||
Payables for: | ||||||||
Investments purchased | - | - | ||||||
Fund shares repurchased | 15,541 | 645,873 | ||||||
Trustees’ fees and expenses (Note 3) | 52,268 | 62,410 | ||||||
Affiliates (Note 3): | ||||||||
Investment advisory fees | 40,836 | 48,687 | ||||||
Administration fees | - | - | ||||||
Service fees | 234,160 | 274,547 | ||||||
Accrued expense and other liabilities | 26,881 | 27,775 | ||||||
|
|
|
| |||||
Total liabilities | 369,686 | 1,059,292 | ||||||
|
|
|
| |||||
Net assets | $ | 477,352,463 | $ | 573,712,090 | ||||
|
|
|
| |||||
| Net assets consist of: | ||||||||
Paid-in capital | $ | 473,796,954 | $ | 557,837,544 | ||||
Undistributed (accumulated) net investment income (loss) | 9,472,309 | 10,393,930 | ||||||
Accumulated net realized gain (loss) on investments and foreign currency transactions | 9,534,735 | 23,030,535 | ||||||
Net unrealized appreciation (depreciation) on investments and foreign currency translations | (15,451,535 | ) | (17,549,919 | ) | ||||
|
|
|
| |||||
Net assets | $ | 477,352,463 | $ | 573,712,090 | ||||
|
|
|
| |||||
(a) Cost of investments — unaffiliated issuers: | $ | - | $ | - | ||||
(b) Cost of investments — affiliated issuers: | $ | 493,155,235 | $ | 591,672,024 | ||||
The accompanying notes are an integral part of the financial statements.
34
Table of Contents
| MML Moderate Allocation Fund | MML Growth Allocation Fund | MML Aggressive Allocation Fund | MML American Funds Growth Fund | MML American Funds International Fund | MML American Funds Core Allocation Fund | |||||||||||||||||
| $ | - | $ | - | $ | - | $ | 140,001,347 | $ | 54,045,616 | $ | 942,471,734 | |||||||||||
| 2,382,391,652 | 1,609,786,530 | 132,147,242 | - | - | - | |||||||||||||||||
|
|
|
|
|
|
|
|
|
|
|
| |||||||||||
| 2,382,391,652 | 1,609,786,530 | 132,147,242 | 140,001,347 | 54,045,616 | 942,471,734 | |||||||||||||||||
|
|
|
|
|
|
|
|
|
|
|
| |||||||||||
| 6,943 | 2,591 | - | - | - | 448,014 | |||||||||||||||||
| - | - | - | - | 1,367 | - | |||||||||||||||||
| 241,037 | 622,648 | 271,481 | 15,690 | 10,601 | 599,676 | |||||||||||||||||
|
|
|
|
|
|
|
|
|
|
|
| |||||||||||
| 2,382,639,632 | 1,610,411,769 | 132,418,723 | 140,017,037 | 54,057,584 | 943,519,424 | |||||||||||||||||
|
|
|
|
|
|
|
|
|
|
|
| |||||||||||
| 148,797 | 573,429 | 245,013 | 12,057 | 7,499 | - | |||||||||||||||||
| 85,091 | 42,345 | 25,705 | 2,829 | 2,773 | 1,042,301 | |||||||||||||||||
| 218,666 | 192,521 | 12,387 | 11,802 | 6,278 | 79,208 | |||||||||||||||||
| 201,706 | 136,417 | 11,157 | 17,776 | 6,868 | 154,200 | |||||||||||||||||
| - | - | - | 29,626 | 11,446 | 197,601 | |||||||||||||||||
| 1,231,820 | 623,050 | 45,053 | 85,451 | 34,634 | 572,584 | |||||||||||||||||
| 43,233 | 37,354 | 24,479 | 16,767 | 16,221 | 23,627 | |||||||||||||||||
|
|
|
|
|
|
|
|
|
|
|
| |||||||||||
| 1,929,313 | 1,605,116 | 363,794 | 176,308 | 85,719 | 2,069,521 | |||||||||||||||||
|
|
|
|
|
|
|
|
|
|
|
| |||||||||||
| $ | 2,380,710,319 | $ | 1,608,806,653 | $ | 132,054,929 | $ | 139,840,729 | $ | 53,971,865 | $ | 941,449,903 | |||||||||||
|
|
|
|
|
|
|
|
|
|
|
| |||||||||||
| $ | 2,293,664,782 | $ | 1,479,176,145 | $ | 127,805,876 | $ | 120,222,330 | $ | 52,134,594 | $ | 822,378,776 | |||||||||||
| 39,255,594 | 22,426,679 | 1,502,566 | 460,508 | 501,528 | 14,532,415 | |||||||||||||||||
| 111,366,076 | 111,236,721 | 7,871,910 | 14,228,460 | 5,116,875 | 71,003,789 | |||||||||||||||||
| (63,576,133 | ) | (4,032,892 | ) | (5,125,423 | ) | 4,929,431 | (3,781,132 | ) | 33,534,923 | |||||||||||||
|
|
|
|
|
|
|
|
|
|
|
| |||||||||||
| $ | 2,380,710,319 | $ | 1,608,806,653 | $ | 132,054,929 | $ | 139,840,729 | $ | 53,971,865 | $ | 941,449,903 | |||||||||||
|
|
|
|
|
|
|
|
|
|
|
| |||||||||||
| $ | - | $ | - | $ | - | $ | 135,071,916 | $ | 57,826,748 | $ | 908,936,811 | |||||||||||
| $ | 2,445,967,785 | $ | 1,613,819,422 | $ | 137,272,665 | $ | - | $ | - | $ | - | |||||||||||
35
Table of Contents
MML Series Investment Fund – Financial Statements (Continued)
Statements of Assets and Liabilities
December 31, 2016
| MML Conservative Allocation Fund | MML Balanced Allocation Fund | |||||||
| Initial Class shares: | ||||||||
Net assets | $ | 112,988,890 | $ | 134,715,828 | ||||
|
|
|
| |||||
Shares outstanding (a) | 11,736,269 | 13,883,328 | ||||||
|
|
|
| |||||
Net asset value, offering price and redemption price per share | $ | 9.63 | $ | 9.70 | ||||
|
|
|
| |||||
| Service Class shares: | ||||||||
Net assets | $ | 364,363,573 | $ | 438,996,262 | ||||
|
|
|
| |||||
Shares outstanding (a) | 38,216,834 | 45,611,423 | ||||||
|
|
|
| |||||
Net asset value, offering price and redemption price per share | $ | 9.53 | $ | 9.62 | ||||
|
|
|
| |||||
| Service Class I shares: | ||||||||
Net assets | $ | - | $ | - | ||||
|
|
|
| |||||
Shares outstanding (a) | - | - | ||||||
|
|
|
| |||||
Net asset value, offering price and redemption price per share | $ | - | $ | - | ||||
|
|
|
| |||||
| (a) | Authorized unlimited number of shares with no par value. |
The accompanying notes are an integral part of the financial statements.
36
Table of Contents
| MML Moderate Allocation Fund | MML Growth Allocation Fund | MML Aggressive Allocation Fund | MML American Funds Growth Fund | MML American Funds International Fund | MML American Funds Core Allocation Fund | |||||||||||||||||
| $ | 411,729,540 | $ | 607,088,471 | $ | 58,438,258 | $ | - | $ | - | $ | - | |||||||||||
|
|
|
|
|
|
|
|
|
|
|
| |||||||||||
| 39,665,433 | 66,272,262 | 6,040,942 | - | - | - | |||||||||||||||||
|
|
|
|
|
|
|
|
|
|
|
| |||||||||||
| $ | 10.38 | $ | 9.16 | $ | 9.67 | $ | - | $ | - | $ | - | |||||||||||
|
|
|
|
|
|
|
|
|
|
|
| |||||||||||
| $ | 1,968,980,779 | $ | 1,001,718,182 | $ | 73,616,671 | $ | - | $ | - | $ | - | |||||||||||
|
|
|
|
|
|
|
|
|
|
|
| |||||||||||
| 191,591,487 | 110,154,091 | 7,703,239 | - | - | - | |||||||||||||||||
|
|
|
|
|
|
|
|
|
|
|
| |||||||||||
| $ | 10.28 | $ | 9.09 | $ | 9.56 | $ | - | $ | - | $ | - | |||||||||||
|
|
|
|
|
|
|
|
|
|
|
| |||||||||||
| $ | - | $ | - | $ | - | $ | 139,840,729 | $ | 53,971,865 | $ | 941,449,903 | |||||||||||
|
|
|
|
|
|
|
|
|
|
|
| |||||||||||
| - | - | - | 11,303,467 | 5,914,848 | 78,848,445 | |||||||||||||||||
|
|
|
|
|
|
|
|
|
|
|
| |||||||||||
| $ | - | $ | - | $ | - | $ | 12.37 | $ | 9.12 | $ | 11.94 | |||||||||||
|
|
|
|
|
|
|
|
|
|
|
| |||||||||||
37
Table of Contents
MML Series Investment Fund – Financial Statements (Continued)
For the Year Ended December 31, 2016
| MML Conservative Allocation Fund | MML Balanced Allocation Fund | |||||||
| Investment income (Note 2): | ||||||||
Dividends — unaffiliated issuers | $ | - | $ | - | ||||
Dividends — affiliated issuers (Note 7) | 10,289,478 | 11,256,363 | ||||||
|
|
|
| |||||
Total investment income | 10,289,478 | 11,256,363 | ||||||
|
|
|
| |||||
| Expenses (Note 3): | ||||||||
Investment advisory fees | 476,167 | 567,576 | ||||||
Custody fees | 23,711 | 23,730 | ||||||
Audit fees | 30,260 | 30,336 | ||||||
Legal fees | 3,396 | 4,035 | ||||||
Proxy fees | 985 | 985 | ||||||
Shareholder reporting fees | 9,988 | 11,790 | ||||||
Trustees’ fees | 28,242 | 33,557 | ||||||
|
|
|
| |||||
| 572,749 | 672,009 | |||||||
Administration fees: | ||||||||
Service Class I | - | - | ||||||
Service fees: | ||||||||
Service Class | 901,625 | 1,073,271 | ||||||
Service Class I | - | - | ||||||
|
|
|
| |||||
Total expenses | 1,474,374 | 1,745,280 | ||||||
Expenses waived (Note 3): | ||||||||
Service Class I fees reimbursed by adviser | - | - | ||||||
|
|
|
| |||||
Net expenses | 1,474,374 | 1,745,280 | ||||||
|
|
|
| |||||
Net investment income (loss) | 8,815,104 | 9,511,083 | ||||||
|
|
|
| |||||
| Realized and unrealized gain (loss): | ||||||||
Net realized gain (loss) on: | ||||||||
Investment transactions — unaffiliated issuers | - | - | ||||||
Investment transactions — affiliated issuers (Note 7) | (3,339,902 | ) | 3,444,776 | |||||
Realized gain distributions — unaffiliated issuers | - | - | ||||||
Realized gain distributions — affiliated issuers (Note 7) | 15,195,866 | 21,113,995 | ||||||
|
|
|
| |||||
Net realized gain (loss) | 11,855,964 | 24,558,771 | ||||||
|
|
|
| |||||
Net change in unrealized appreciation (depreciation) on: | ||||||||
Investment transactions — unaffiliated issuers | - | - | ||||||
Investment transactions — affiliated issuers | 5,658,961 | (1,121,085 | ) | |||||
|
|
|
| �� | ||||
Net change in unrealized appreciation (depreciation) | 5,658,961 | (1,121,085 | ) | |||||
|
|
|
| |||||
Net realized gain (loss) and change in unrealized appreciation (depreciation) | 17,514,925 | 23,437,686 | ||||||
|
|
|
| |||||
Net increase (decrease) in net assets resulting from operations | $ | 26,330,029 | $ | 32,948,769 | ||||
|
|
|
| |||||
The accompanying notes are an integral part of the financial statements.
38
Table of Contents
| MML Moderate Allocation Fund | MML Growth Allocation Fund | MML Aggressive Allocation Fund | MML American Funds Growth Fund | MML American Funds International Fund | MML American Funds Core Allocation Fund | |||||||||||||||||
| $ | - | $ | - | $ | - | $ | 1,352,843 | $ | 888,819 | $ | 17,126,422 | |||||||||||
| 42,420,821 | 23,531,612 | 1,554,537 | - | - | - | |||||||||||||||||
|
|
|
|
|
|
|
|
|
|
|
| |||||||||||
| 42,420,821 | 23,531,612 | 1,554,537 | 1,352,843 | 888,819 | 17,126,422 | |||||||||||||||||
|
|
|
|
|
|
|
|
|
|
|
| |||||||||||
| 2,343,696 | 1,579,737 | 124,791 | 192,301 | 81,507 | 1,688,455 | |||||||||||||||||
| 24,761 | 24,760 | 24,720 | 2,236 | 2,236 | 6,851 | |||||||||||||||||
| 31,862 | 31,208 | 29,954 | 29,960 | 29,896 | 30,580 | |||||||||||||||||
| 18,161 | 11,953 | 899 | 944 | 399 | 6,351 | |||||||||||||||||
| 985 | 985 | 985 | 985 | 985 | 985 | |||||||||||||||||
| 43,971 | 30,506 | 3,611 | 5,374 | 2,981 | 26,199 | |||||||||||||||||
| 138,712 | 93,391 | 7,376 | 7,605 | 3,252 | 50,759 | |||||||||||||||||
|
|
|
|
|
|
|
|
|
|
|
| |||||||||||
| 2,602,148 | 1,772,540 | 192,336 | 239,405 | 121,256 | 1,810,180 | |||||||||||||||||
| - | - | - | 320,502 | 135,845 | 2,144,221 | |||||||||||||||||
| 4,834,796 | 2,459,261 | 172,577 | - | - | - | |||||||||||||||||
| - | - | - | 320,502 | 135,845 | 2,144,221 | |||||||||||||||||
|
|
|
|
|
|
|
|
|
|
|
| |||||||||||
| 7,436,944 | 4,231,801 | 364,913 | 880,409 | 392,946 | 6,098,622 | |||||||||||||||||
| - | - | - | - | (12,579 | ) | - | ||||||||||||||||
|
|
|
|
|
|
|
|
|
|
|
| |||||||||||
| 7,436,944 | 4,231,801 | 364,913 | 880,409 | 380,367 | 6,098,622 | |||||||||||||||||
|
|
|
|
|
|
|
|
|
|
|
| |||||||||||
| 34,983,877 | 19,299,811 | 1,189,624 | 472,434 | 508,452 | 11,027,800 | |||||||||||||||||
|
|
|
|
|
|
|
|
|
|
|
| |||||||||||
| - | - | - | 2,853,440 | 441,239 | 22,741,125 | |||||||||||||||||
| 15,913,622 | 32,900,980 | 490,933 | - | - | - | |||||||||||||||||
| - | - | - | 11,381,877 | 4,684,773 | 52,140,166 | |||||||||||||||||
| 101,641,194 | 83,561,313 | 8,025,463 | - | - | - | |||||||||||||||||
|
|
|
|
|
|
|
|
|
|
|
| |||||||||||
| 117,554,816 | 116,462,293 | 8,516,396 | 14,235,317 | 5,126,012 | 74,881,291 | |||||||||||||||||
|
|
|
|
|
|
|
|
|
|
|
| |||||||||||
| - | - | - | (3,419,681 | ) | (4,007,082 | ) | (12,582,717 | ) | ||||||||||||||
| (494,607 | ) | (23,017,750 | ) | 635,660 | - | - | - | |||||||||||||||
|
|
|
|
|
|
|
|
|
|
|
| |||||||||||
| (494,607 | ) | (23,017,750 | ) | 635,660 | (3,419,681 | ) | (4,007,082 | ) | (12,582,717 | ) | ||||||||||||
|
|
|
|
|
|
|
|
|
|
|
| |||||||||||
| 117,060,209 | 93,444,543 | 9,152,056 | 10,815,636 | 1,118,930 | 62,298,574 | |||||||||||||||||
|
|
|
|
|
|
|
|
|
|
|
| |||||||||||
| $ | 152,044,086 | $ | 112,744,354 | $ | 10,341,680 | $ | 11,288,070 | $ | 1,627,382 | $ | 73,326,374 | |||||||||||
|
|
|
|
|
|
|
|
|
|
|
| |||||||||||
39
Table of Contents
MML Series Investment Fund – Financial Statements (Continued)
Statements of Changes in Net Assets
| MML Conservative Allocation Fund | ||||||||
| Year Ended December 31, 2016 | Year Ended December 31, 2015 | |||||||
| Increase (Decrease) in Net Assets: | ||||||||
| Operations: | ||||||||
Net investment income (loss) | $ | 8,815,104 | $ | 8,532,224 | ||||
Net realized gain (loss) on investment transactions | 11,855,964 | 26,244,713 | ||||||
Net change in unrealized appreciation (depreciation) on investments | 5,658,961 | (37,319,169 | ) | |||||
|
|
|
| |||||
Net increase (decrease) in net assets resulting from operations | 26,330,029 | (2,542,232 | ) | |||||
|
|
|
| |||||
| Distributions to shareholders (Note 2): | ||||||||
From net investment income: | ||||||||
Initial Class | (2,692,993 | ) | (3,548,310 | ) | ||||
Service Class | (7,810,262 | ) | (9,257,469 | ) | ||||
|
|
|
| |||||
Total distributions from net investment income | (10,503,255 | ) | (12,805,779 | ) | ||||
|
|
|
| |||||
From net realized gains: | ||||||||
Initial Class | (5,991,228 | ) | (8,482,637 | ) | ||||
Service Class | (19,296,742 | ) | (24,137,599 | ) | ||||
|
|
|
| |||||
Total distributions from net realized gains | (25,287,970 | ) | (32,620,236 | ) | ||||
|
|
|
| |||||
| Net fund share transactions (Note 5): | ||||||||
Initial Class | (2,460,478 | ) | (1,290,436 | ) | ||||
Service Class | 32,960,765 | 32,124,904 | ||||||
|
|
|
| |||||
Increase (decrease) in net assets from fund share transactions | 30,500,287 | 30,834,468 | ||||||
|
|
|
| |||||
Total increase (decrease) in net assets | 21,039,091 | (17,133,779 | ) | |||||
| Net assets | ||||||||
Beginning of year | 456,313,372 | 473,447,151 | ||||||
|
|
|
| |||||
End of year | $ | 477,352,463 | $ | 456,313,372 | ||||
|
|
|
| |||||
Undistributed (accumulated) net investment income (loss) included in net assets at end of year | $ | 9,472,309 | $ | 10,438,968 | ||||
|
|
|
| |||||
The accompanying notes are an integral part of the financial statements.
40
Table of Contents
| MML Balanced Allocation Fund | MML Moderate Allocation Fund | MML Growth Allocation Fund | ||||||||||||||||||||
| Year Ended December 31, 2016 | Year Ended December 31, 2015 | Year Ended December 31, 2016 | Year Ended December 31, 2015 | Year Ended December 31, 2016 | Year Ended December 31, 2015 | |||||||||||||||||
| $ | 9,511,083 | $ | 9,565,349 | $ | 34,983,877 | $ | 33,254,400 | $ | 19,299,811 | $ | 18,089,594 | |||||||||||
| 24,558,771 | 41,697,369 | 117,554,816 | 176,835,004 | 116,462,293 | 175,302,009 | |||||||||||||||||
| (1,121,085 | ) | (54,370,281 | ) | (494,607 | ) | (232,107,546 | ) | (23,017,750 | ) | (206,408,711 | ) | |||||||||||
|
|
|
|
|
|
|
|
|
|
|
| |||||||||||
| 32,948,769 | (3,107,563 | ) | 152,044,086 | (22,018,142 | ) | 112,744,354 | (13,017,108 | ) | ||||||||||||||
|
|
|
|
|
|
|
|
|
|
|
| |||||||||||
| (3,170,342 | ) | (4,229,838 | ) | (8,560,018 | ) | (10,521,815 | ) | (11,364,240 | ) | (15,422,196 | ) | |||||||||||
| (9,076,660 | ) | (11,062,307 | ) | (36,427,389 | ) | (41,343,113 | ) | (16,338,690 | ) | (22,654,401 | ) | |||||||||||
|
|
|
|
|
|
|
|
|
|
|
| |||||||||||
| (12,247,002 | ) | (15,292,145 | ) | (44,987,407 | ) | (51,864,928 | ) | (27,702,930 | ) | (38,076,597 | ) | |||||||||||
|
|
|
|
|
|
|
|
|
|
|
| |||||||||||
| (9,368,018 | ) | (11,110,139 | ) | (28,611,812 | ) | (30,264,718 | ) | (62,519,828 | ) | (68,635,702 | ) | |||||||||||
| (30,031,130 | ) | (31,751,368 | ) | (137,512,376 | ) | (130,628,347 | ) | (104,164,195 | ) | (112,068,753 | ) | |||||||||||
|
|
|
|
|
|
|
|
|
|
|
| |||||||||||
| (39,399,148 | ) | (42,861,507 | ) | (166,124,188 | ) | (160,893,065 | ) | (166,684,023 | ) | (180,704,455 | ) | |||||||||||
|
|
|
|
|
|
|
|
|
|
|
| |||||||||||
| (5,081,384 | ) | (7,845,258 | ) | 5,105,108 | (6,251,096 | ) | 31,458,137 | 32,647,952 | ||||||||||||||
| 25,725,103 | 42,469,680 | 95,942,271 | 322,910,814 | 49,887,306 | 112,688,243 | |||||||||||||||||
|
|
|
|
|
|
|
|
|
|
|
| |||||||||||
| 20,643,719 | 34,624,422 | 101,047,379 | 316,659,718 | 81,345,443 | 145,336,195 | |||||||||||||||||
|
|
|
|
|
|
|
|
|
|
|
| |||||||||||
| 1,946,338 | (26,636,793 | ) | 41,979,870 | 81,883,583 | (297,156 | ) | (86,461,965 | ) | ||||||||||||||
| 571,765,752 | 598,402,545 | 2,338,730,449 | 2,256,846,866 | 1,609,103,809 | 1,695,565,774 | |||||||||||||||||
|
|
|
|
|
|
|
|
|
|
|
| |||||||||||
| $ | 573,712,090 | $ | 571,765,752 | $ | 2,380,710,319 | $ | 2,338,730,449 | $ | 1,608,806,653 | $ | 1,609,103,809 | |||||||||||
|
|
|
|
|
|
|
|
|
|
|
| |||||||||||
$ | 10,393,930 |
| $ | 12,170,055 | $ | 39,255,594 | $ | 44,735,030 | $ | 22,426,679 | $ | 27,457,310 | ||||||||||
|
|
|
|
|
|
|
|
|
|
|
| |||||||||||
41
Table of Contents
MML Series Investment Fund – Financial Statements (Continued)
Statements of Changes in Net Assets
| MML Aggressive Allocation Fund | ||||||||
| Year Ended December 31, 2016 | Year Ended December 31, 2015 | |||||||
| Increase (Decrease) in Net Assets: | ||||||||
| Operations: | ||||||||
Net investment income (loss) | $ | 1,189,624 | $ | 983,998 | ||||
Net realized gain (loss) on investment transactions | 8,516,396 | 14,093,956 | ||||||
Net change in unrealized appreciation (depreciation) on investments | 635,660 | (16,481,035 | ) | |||||
|
|
|
| |||||
Net increase (decrease) in net assets resulting from operations | 10,341,680 | �� | (1,403,081 | ) | ||||
|
|
|
| |||||
| Distributions to shareholders (Note 2): | ||||||||
From net investment income: | ||||||||
Initial Class | (870,484 | ) | (1,172,374 | ) | ||||
Service Class | (924,943 | ) | (1,250,188 | ) | ||||
Service Class I | - | - | ||||||
|
|
|
| |||||
Total distributions from net investment income | (1,795,427 | ) | (2,422,562 | ) | ||||
|
|
|
| |||||
From net realized gains: | ||||||||
Initial Class | (5,951,535 | ) | (6,716,268 | ) | ||||
Service Class | (7,461,136 | ) | (7,984,963 | ) | ||||
Service Class I | - | - | ||||||
|
|
|
| |||||
Total distributions from net realized gains | (13,412,671 | ) | (14,701,231 | ) | ||||
|
|
|
| |||||
| Net fund share transactions (Note 5): | ||||||||
Initial Class | 5,130,219 | 5,801,096 | ||||||
Service Class | 8,398,579 | 15,411,238 | ||||||
Service Class I | - | - | ||||||
|
|
|
| |||||
Increase (decrease) in net assets from fund share transactions | 13,528,798 | 21,212,334 | ||||||
|
|
|
| |||||
Total increase (decrease) in net assets | 8,662,380 | 2,685,460 | ||||||
| Net assets | ||||||||
Beginning of year | 123,392,549 | 120,707,089 | ||||||
|
|
|
| |||||
End of year | $ | 132,054,929 | $ | 123,392,549 | ||||
|
|
|
| |||||
Undistributed (accumulated) net investment income (loss) included in net assets at end of year | $ | 1,502,566 | $ | 1,780,744 | ||||
|
|
|
| |||||
The accompanying notes are an integral part of the financial statements.
42
Table of Contents
| MML American Funds Growth Fund | MML American Funds International Fund | MML American Funds Core Allocation Fund | ||||||||||||||||||||
| Year Ended December 31, 2016 | Year Ended December 31, 2015 | Year Ended December 31, 2016 | Year Ended December 31, 2015 | Year Ended December 31, 2016 | Year Ended December 31, 2015 | |||||||||||||||||
| $ | 472,434 | $ | 265,434 | $ | 508,452 | $ | 632,103 | $ | 11,027,800 | $ | 9,775,518 | |||||||||||
| 14,235,317 | 29,090,901 | 5,126,012 | 3,957,007 | 74,881,291 | 72,733,915 | |||||||||||||||||
| (3,419,681 | ) | (21,936,851 | ) | (4,007,082 | ) | (7,549,023 | ) | (12,582,717 | ) | (92,597,078 | ) | |||||||||||
|
|
|
|
|
|
|
|
|
|
|
| |||||||||||
| 11,288,070 | 7,419,484 | 1,627,382 | (2,959,913 | ) | 73,326,374 | (10,087,645 | ) | |||||||||||||||
|
|
|
|
|
|
|
|
|
|
|
| |||||||||||
| - | - | - | - | - | - | |||||||||||||||||
| - | - | - | - | - | - | |||||||||||||||||
| (267,323 | ) | (845,292 | ) | (632,920 | ) | (507,014 | ) | (16,088,756 | ) | (10,454,332 | ) | |||||||||||
|
|
|
|
|
|
|
|
|
|
|
| |||||||||||
| (267,323 | ) | (845,292 | ) | (632,920 | ) | (507,014 | ) | (16,088,756 | ) | (10,454,332 | ) | |||||||||||
|
|
|
|
|
|
|
|
|
|
|
| |||||||||||
| - | - | - | - | - | - | |||||||||||||||||
| - | - | - | - | - | - | |||||||||||||||||
| (29,068,974 | ) | (7,362,462 | ) | (3,955,087 | ) | (1,269,671 | ) | (66,430,452 | ) | (19,404,002 | ) | |||||||||||
|
|
|
|
|
|
|
|
|
|
|
| |||||||||||
| (29,068,974 | ) | (7,362,462 | ) | (3,955,087 | ) | (1,269,671 | ) | (66,430,452 | ) | (19,404,002 | ) | |||||||||||
|
|
|
|
|
|
|
|
|
|
|
| |||||||||||
| - | - | - | - | - | - | |||||||||||||||||
| - | - | - | - | - | - | |||||||||||||||||
| 30,222,393 | 16,528,308 | 1,343,819 | 8,983,872 | 137,539,582 | 156,441,371 | |||||||||||||||||
|
|
|
|
|
|
|
|
|
|
|
| |||||||||||
| 30,222,393 | 16,528,308 | 1,343,819 | 8,983,872 | 137,539,582 | 156,441,371 | |||||||||||||||||
|
|
|
|
|
|
|
|
|
|
|
| |||||||||||
| 12,174,166 | 15,740,038 | (1,616,806 | ) | 4,247,274 | 128,346,748 | 116,495,392 | ||||||||||||||||
| 127,666,563 | 111,926,525 | 55,588,671 | 51,341,397 | 813,103,155 | 696,607,763 | |||||||||||||||||
|
|
|
|
|
|
|
|
|
|
|
| |||||||||||
| $ | 139,840,729 | $ | 127,666,563 | $ | 53,971,865 | $ | 55,588,671 | $ | 941,449,903 | $ | 813,103,155 | |||||||||||
|
|
|
|
|
|
|
|
|
|
|
| |||||||||||
| $ | 460,508 | | $ | 255,401 | $ | 501,528 | $ | 625,998 | $ | 14,532,415 | $ | 16,008,733 | ||||||||||
|
|
|
|
|
|
|
|
|
|
|
| |||||||||||
43
Table of Contents
MML Series Investment Fund – Financial Statements (Continued)
Financial Highlights (For a share outstanding throughout each period)
MML Conservative Allocation Fund
| Income (loss) from investment operations | Less distributions to shareholders | Ratios / Supplemental Data | ||||||||||||||||||||||||||||||||||||||||||||||
| Net asset value, beginning of period | Net investment income (loss)c | Net realized and unrealized gain (loss) on investments | Total income (loss) from investment operations | From net investment income | From net realized gains | Total distributions | Net asset value, end of the period | Total returnm | Net assets, end of the period (000’s) | Ratio of expenses to average daily net assetsw | Net investment income (loss) to average daily net assets | |||||||||||||||||||||||||||||||||||||
Initial Class |
| |||||||||||||||||||||||||||||||||||||||||||||||
| 12/31/16 | $ | 9.83 | $ | 0.20 | $ | 0.37 | $ | 0.57 | $ | (0.24 | ) | $ | (0.53 | ) | $ | (0.77 | ) | $ | 9.63 | 5.78% | $ | 112,989 | 0.12% | 2.01% | ||||||||||||||||||||||||
| 12/31/15 | 10.94 | 0.21 | (0.25 | ) | (0.04 | ) | (0.32 | ) | (0.75 | ) | (1.07 | ) | 9.83 | (0.38% | ) | 117,636 | 0.12% | 1.96% | ||||||||||||||||||||||||||||||
| 12/31/14 | 11.40 | 0.25 | 0.33 | 0.58 | (0.29 | ) | (0.75 | ) | (1.04 | ) | 10.94 | 5.13% | 131,214 | 0.13% | 2.22% | |||||||||||||||||||||||||||||||||
| 12/31/13 | 10.81 | 0.25 | 0.93 | 1.18 | (0.26 | ) | (0.33 | ) | (0.59 | ) | 11.40 | 11.32% | 141,078 | 0.13% | 2.19% | |||||||||||||||||||||||||||||||||
| 12/31/12 | 10.24 | 0.25 | 0.90 | 1.15 | (0.21 | ) | (0.37 | ) | (0.58 | ) | 10.81 | 11.40% | 140,899 | 0.13% | 2.29% | |||||||||||||||||||||||||||||||||
| Service Class | ||||||||||||||||||||||||||||||||||||||||||||||||
| 12/31/16 | $ | 9.74 | $ | 0.18 | $ | 0.35 | $ | 0.53 | $ | (0.21 | ) | $ | (0.53 | ) | $ | (0.74 | ) | $ | 9.53 | 5.48% | $ | 364,364 | 0.37% | 1.80% | ||||||||||||||||||||||||
| 12/31/15 | 10.85 | 0.19 | (0.26 | ) | (0.07 | ) | (0.29 | ) | (0.75 | ) | (1.04 | ) | 9.74 | (0.63% | ) | 338,677 | 0.37% | 1.76% | ||||||||||||||||||||||||||||||
| 12/31/14 | 11.32 | 0.23 | 0.31 | 0.54 | (0.26 | ) | (0.75 | ) | (1.01 | ) | 10.85 | 4.83% | 342,234 | 0.38% | 2.01% | |||||||||||||||||||||||||||||||||
| 12/31/13 | 10.74 | 0.22 | 0.93 | 1.15 | (0.24 | ) | (0.33 | ) | (0.57 | ) | 11.32 | 11.07% | 326,916 | 0.38% | 1.96% | |||||||||||||||||||||||||||||||||
| 12/31/12 | 10.18 | 0.22 | 0.90 | 1.12 | (0.19 | ) | (0.37 | ) | (0.56 | ) | 10.74 | 11.15% | 295,560 | 0.38% | 2.05% | |||||||||||||||||||||||||||||||||
| Year ended December 31 | ||||||||||||||||||||
| 2016 | 2015 | 2014 | 2013 | 2012 | ||||||||||||||||
Portfolio turnover ratex | 24 | % | 29 | % | 33 | % | 33 | % | 18 | % | ||||||||||
| c | Per share amount calculated on the average shares method. |
| m | Total return does not reflect expenses that apply at the separate account level or to related insurance products. Inclusion of these charges would reduce the total return figures for all periods shown. |
| w | Expenses of the underlying funds are not included in the Fund’s expense ratio. The Fund indirectly bears its proportionate share of the expenses of any underlying fund. |
| x | Amount does not include the portfolio activity of any underlying fund. |
The accompanying notes are an integral part of the financial statements.
44
Table of Contents
MML Series Investment Fund – Financial Statements (Continued)
Financial Highlights (For a share outstanding throughout each period)
MML Balanced Allocation Fund
| Income (loss) from investment operations | Less distributions to shareholders | Ratios / Supplemental Data | ||||||||||||||||||||||||||||||||||||||||||||||
| Net asset value, beginning of period | Net investment income (loss)c | Net realized and unrealized gain (loss) on investments | Total income (loss) from investment operations | From net investment income | From net realized gains | Total distributions | Net asset value, end of the period | Total returnm | Net assets, end of the period (000’s) | Ratio of expenses to average daily net assetsw | Net investment income (loss) to average daily net assets | |||||||||||||||||||||||||||||||||||||
Initial Class |
| |||||||||||||||||||||||||||||||||||||||||||||||
| 12/31/16 | $ | 10.05 | $ | 0.18 | $ | 0.43 | $ | 0.61 | $ | (0.24 | ) | $ | (0.72 | ) | $ | (0.96 | ) | $ | 9.70 | 6.15% | $ | 134,716 | 0.12% | 1.84% | ||||||||||||||||||||||||
| 12/31/15 | 11.23 | 0.19 | (0.23 | ) | (0.04 | ) | (0.31 | ) | (0.83 | ) | (1.14 | ) | 10.05 | (0.36% | ) | 144,084 | 0.12% | 1.77% | ||||||||||||||||||||||||||||||
| 12/31/14 | 11.58 | 0.24 | 0.38 | 0.62 | (0.25 | ) | (0.72 | ) | (0.97 | ) | 11.23 | 5.35% | 167,530 | 0.12% | 2.05% | |||||||||||||||||||||||||||||||||
| 12/31/13 | 10.85 | 0.23 | 1.29 | 1.52 | (0.28 | ) | (0.51 | ) | (0.79 | ) | 11.58 | 14.49% | 164,583 | 0.13% | 1.99% | |||||||||||||||||||||||||||||||||
| 12/31/12 | 10.06 | 0.22 | 1.01 | 1.23 | (0.19 | ) | (0.25 | ) | (0.44 | ) | 10.85 | 12.40% | 148,872 | 0.13% | 2.08% | |||||||||||||||||||||||||||||||||
Service Class |
| |||||||||||||||||||||||||||||||||||||||||||||||
| 12/31/16 | $ | 9.98 | $ | 0.16 | $ | 0.42 | $ | 0.58 | $ | (0.22 | ) | $ | (0.72 | ) | $ | (0.94 | ) | $ | 9.62 | 5.82% | $ | 438,996 | 0.37% | 1.62% | ||||||||||||||||||||||||
| 12/31/15 | 11.16 | 0.17 | (0.23 | ) | (0.06 | ) | (0.29 | ) | (0.83 | ) | (1.12 | ) | 9.98 | (0.61% | ) | 427,682 | 0.37% | 1.56% | ||||||||||||||||||||||||||||||
| 12/31/14 | 11.52 | 0.21 | 0.37 | 0.58 | (0.22 | ) | (0.72 | ) | (0.94 | ) | 11.16 | 5.07% | 430,872 | 0.37% | 1.81% | |||||||||||||||||||||||||||||||||
| 12/31/13 | 10.80 | 0.20 | 1.28 | 1.48 | (0.25 | ) | (0.51 | ) | (0.76 | ) | 11.52 | 14.23% | 393,650 | 0.38% | 1.75% | |||||||||||||||||||||||||||||||||
| 12/31/12 | 10.02 | 0.19 | 1.01 | 1.20 | (0.17 | ) | (0.25 | ) | (0.42 | ) | 10.80 | 12.12% | 312,268 | 0.38% | 1.83% | |||||||||||||||||||||||||||||||||
| Year ended December 31 | ||||||||||||||||||||
| 2016 | 2015 | 2014 | 2013 | 2012 | ||||||||||||||||
Portfolio turnover ratex | 18 | % | 26 | % | 23 | % | 22 | % | 21 | % | ||||||||||
| c | Per share amount calculated on the average shares method. |
| m | Total return does not reflect expenses that apply at the separate account level or to related insurance products. Inclusion of these charges would reduce the total return figures for all periods shown. |
| w | Expenses of the underlying funds are not included in the Fund’s expense ratio. The Fund indirectly bears its proportionate share of the expenses of any underlying fund. |
| x | Amount does not include the portfolio activity of any underlying fund. |
The accompanying notes are an integral part of the financial statements.
45
Table of Contents
MML Series Investment Fund – Financial Statements (Continued)
Financial Highlights (For a share outstanding throughout each period)
MML Moderate Allocation Fund
| Income (loss) from investment operations | Less distributions to shareholders | Ratios / Supplemental Data | ||||||||||||||||||||||||||||||||||||||||||||||
| Net asset value, beginning of period | Net investment income (loss)c | Net realized and unrealized gain (loss) on investments | Total income (loss) from investment operations | From net investment income | From net realized gains | Total distributions | Net asset value, end of the period | Total returnm | Net assets, end of the period (000’s) | Ratio of expenses to average daily net assetsw | Net investment income (loss) to average daily net assets | |||||||||||||||||||||||||||||||||||||
| Initial Class | ||||||||||||||||||||||||||||||||||||||||||||||||
| 12/31/16 | $ | 10.66 | $ | 0.18 | $ | 0.54 | $ | 0.72 | $ | (0.23 | ) | $ | (0.77 | ) | $ | (1.00 | ) | $ | 10.38 | 6.89% | $ | 411,730 | 0.11% | 1.69% | ||||||||||||||||||||||||
| 12/31/15 | 11.83 | 0.18 | (0.26 | ) | (0.08 | ) | (0.28 | ) | (0.81 | ) | (1.09 | ) | 10.66 | (0.64% | ) | 416,556 | 0.11% | 1.59% | ||||||||||||||||||||||||||||||
| 12/31/14 | 12.10 | 0.21 | 0.47 | 0.68 | (0.21 | ) | (0.74 | ) | (0.95 | ) | 11.83 | 5.61% | 465,943 | 0.11% | 1.76% | |||||||||||||||||||||||||||||||||
| 12/31/13 | 10.96 | 0.20 | 1.66 | 1.86 | (0.21 | ) | (0.51 | ) | (0.72 | ) | 12.10 | 17.57% | 465,692 | 0.12% | 1.74% | |||||||||||||||||||||||||||||||||
| 12/31/12 | 10.04 | 0.20 | 1.11 | 1.31 | (0.16 | ) | (0.23 | ) | (0.39 | ) | 10.96 | 13.17% | 410,035 | 0.12% | 1.82% | |||||||||||||||||||||||||||||||||
| Service Class | ||||||||||||||||||||||||||||||||||||||||||||||||
| 12/31/16 | $ | 10.57 | $ | 0.15 | $ | 0.53 | $ | 0.68 | $ | (0.20 | ) | $ | (0.77 | ) | $ | (0.97 | ) | $ | 10.28 | 6.59% | $ | 1,968,981 | 0.36% | 1.45% | ||||||||||||||||||||||||
| 12/31/15 | 11.74 | 0.16 | (0.26 | ) | (0.10 | ) | (0.26 | )�� | (0.81 | ) | (1.07 | ) | 10.57 | (0.86% | ) | 1,922,174 | 0.36% | 1.38% | ||||||||||||||||||||||||||||||
| 12/31/14 | 12.02 | 0.19 | 0.46 | 0.65 | (0.19 | ) | (0.74 | ) | (0.93 | ) | 11.74 | 5.37% | 1,790,903 | 0.36% | 1.55% | |||||||||||||||||||||||||||||||||
| 12/31/13 | 10.89 | 0.18 | 1.65 | 1.83 | (0.19 | ) | (0.51 | ) | (0.70 | ) | 12.02 | 17.37% | 1,480,843 | 0.37% | 1.51% | |||||||||||||||||||||||||||||||||
| 12/31/12 | 9.99 | 0.17 | 1.10 | 1.27 | (0.14 | ) | (0.23 | ) | (0.37 | ) | 10.89 | 12.82% | 1,060,743 | 0.37% | 1.60% | |||||||||||||||||||||||||||||||||
| Year ended December 31 | ||||||||||||||||||||
| 2016 | 2015 | 2014 | 2013 | 2012 | ||||||||||||||||
Portfolio turnover ratex | 14 | % | 19 | % | 19 | % | 19 | % | 18 | % | ||||||||||
| c | Per share amount calculated on the average shares method. |
| m | Total return does not reflect expenses that apply at the separate account level or to related insurance products. Inclusion of these charges would reduce the total return figures for all periods shown. |
| w | Expenses of the underlying funds are not included in the Fund’s expense ratio. The Fund indirectly bears its proportionate share of the expenses of any underlying fund. |
| x | Amount does not include the portfolio activity of any underlying fund. |
The accompanying notes are an integral part of the financial statements.
46
Table of Contents
MML Series Investment Fund – Financial Statements (Continued)
Financial Highlights (For a share outstanding throughout each period)
MML Growth Allocation Fund
| Income (loss) from investment operations | Less distributions to shareholders | Ratios / Supplemental Data | ||||||||||||||||||||||||||||||||||||||||||||||
| Net asset value, beginning of period | Net investment income (loss)c | Net realized and unrealized gain (loss) on investments | Total income (loss) from investment operations | From net investment income | From net realized gains | Total distributions | Net asset value, end of the period | Total returnm | Net assets, end of the period (000’s) | Ratio of expenses to average daily net assetsw | Net investment income (loss) to average daily net assets | |||||||||||||||||||||||||||||||||||||
Initial Class |
| |||||||||||||||||||||||||||||||||||||||||||||||
| 12/31/16 | $ | 9.69 | $ | 0.13 | $ | 0.58 | $ | 0.71 | $ | (0.19 | ) | $ | (1.05 | ) | $ | (1.24 | ) | $ | 9.16 | 7.57% | $ | 607,088 | 0.11% | 1.38% | ||||||||||||||||||||||||
| 12/31/15 | 11.28 | 0.13 | (0.21 | ) | (0.08 | ) | (0.28 | ) | (1.23 | ) | (1.51 | ) | 9.69 | (0.71% | ) | 605,993 | 0.11% | 1.22% | ||||||||||||||||||||||||||||||
| 12/31/14 | 11.80 | 0.16 | 0.52 | 0.68 | (0.19 | ) | (1.01 | ) | (1.20 | ) | 11.28 | 5.77% | 660,986 | 0.11% | 1.39% | |||||||||||||||||||||||||||||||||
| 12/31/13 | 10.66 | 0.16 | 2.13 | 2.29 | (0.21 | ) | (0.94 | ) | (1.15 | ) | 11.80 | 22.64% | 659,823 | 0.12% | 1.36% | |||||||||||||||||||||||||||||||||
| 12/31/12 | 9.53 | 0.15 | 1.22 | 1.37 | (0.14 | ) | (0.10 | ) | (0.24 | ) | 10.66 | 14.49% | 559,044 | 0.12% | 1.43% | |||||||||||||||||||||||||||||||||
Service Class |
| |||||||||||||||||||||||||||||||||||||||||||||||
| 12/31/16 | $ | 9.63 | $ | 0.11 | $ | 0.56 | $ | 0.67 | $ | (0.16 | ) | $ | (1.05 | ) | $ | (1.21 | ) | $ | 9.09 | 7.23% | $ | 1,001,718 | 0.36% | 1.13% | ||||||||||||||||||||||||
| 12/31/15 | 11.22 | 0.11 | (0.22 | ) | (0.11 | ) | (0.25 | ) | (1.23 | ) | (1.48 | ) | 9.63 | (0.97% | ) | 1,003,111 | 0.36% | 0.98% | ||||||||||||||||||||||||||||||
| 12/31/14 | 11.74 | 0.13 | 0.52 | 0.65 | (0.16 | ) | (1.01 | ) | (1.17 | ) | 11.22 | 5.56% | 1,034,580 | 0.36% | 1.14% | |||||||||||||||||||||||||||||||||
| 12/31/13 | 10.62 | 0.13 | 2.11 | 2.24 | (0.18 | ) | (0.94 | ) | (1.12 | ) | 11.74 | 22.25% | 995,436 | 0.37% | 1.11% | |||||||||||||||||||||||||||||||||
| 12/31/12 | 9.49 | 0.12 | 1.23 | 1.35 | (0.12 | ) | (0.10 | ) | (0.22 | ) | 10.62 | 14.28% | 826,960 | 0.37% | 1.18% | |||||||||||||||||||||||||||||||||
| Year ended December 31 | ||||||||||||||||||||
| 2016 | 2015 | 2014 | 2013 | 2012 | ||||||||||||||||
Portfolio turnover ratex | 17 | % | 22 | % | 25 | % | 22 | % | 27 | % | ||||||||||
| c | Per share amount calculated on the average shares method. |
| m | Total return does not reflect expenses that apply at the separate account level or to related insurance products. Inclusion of these charges would reduce the total return figures for all periods shown. |
| w | Expenses of the underlying funds are not included in the Fund’s expense ratio. The Fund indirectly bears its proportionate share of the expenses of any underlying fund. |
| x | Amount does not include the portfolio activity of any underlying fund. |
The accompanying notes are an integral part of the financial statements.
47
Table of Contents
MML Series Investment Fund – Financial Statements (Continued)
Financial Highlights (For a share outstanding throughout each period)
MML Aggressive Allocation Fund
| Income (loss) from investment operations | Less distributions to shareholders | Ratios / Supplemental Data | ||||||||||||||||||||||||||||||||||||||||||||||||||
| Net asset value, beginning of period | Net investment income (loss)c,j | Net realized and unrealized gain (loss) on investments | Total income (loss) from investment operations | From net investment income | From net realized gains | Total distributions | Net asset value, end of the period | Total returnm | Net assets, end of the period (000’s) | Ratio of expenses to average daily net assets before expense waiversw | Ratio of expenses to average daily net assets after expense waiversw,j | Net investment income (loss) to average daily net assets | ||||||||||||||||||||||||||||||||||||||||
Initial Class | ||||||||||||||||||||||||||||||||||||||||||||||||||||
| 12/31/16 | $ | 10.10 | $ | 0.11 | $ | 0.72 | $ | 0.83 | $ | (0.16 | ) | $ | (1.10 | ) | $ | (1.26 | ) | $ | 9.67 | 8.54% | $ | 58,438 | 0.15% | N/A | 1.09% | |||||||||||||||||||||||||||
| 12/31/15 | 11.86 | 0.10 | (0.20 | ) | (0.10 | ) | (0.25 | ) | (1.41 | ) | (1.66 | ) | 10.10 | (0.84% | ) | 55,420 | 0.16% | N/A | 0.92% | |||||||||||||||||||||||||||||||||
| 12/31/14 | 12.38 | 0.12 | 0.60 | 0.72 | (0.14 | ) | (1.10 | ) | (1.24 | ) | 11.86 | 5.85% | 57,996 | 0.17% | N/A | 0.98% | ||||||||||||||||||||||||||||||||||||
| 12/31/13 | 10.47 | 0.11 | 2.65 | 2.76 | (0.14 | ) | (0.71 | ) | (0.85 | ) | 12.38 | 27.39% | 56,721 | 0.19% | 0.19% | l | 0.94% | |||||||||||||||||||||||||||||||||||
| 12/31/12 | 9.12 | 0.10 | 1.33 | 1.43 | (0.08 | ) | - | (0.08 | ) | 10.47 | 15.73% | 45,399 | 0.20% | 0.20% | k | 0.98% | ||||||||||||||||||||||||||||||||||||
Service Class | ||||||||||||||||||||||||||||||||||||||||||||||||||||
| 12/31/16 | $ | 10.00 | $ | 0.08 | $ | 0.72 | $ | 0.80 | $ | (0.14 | ) | $ | (1.10 | ) | $ | (1.24 | ) | $ | 9.56 | 8.28% | $ | 73,617 | 0.40% | N/A | 0.84% | |||||||||||||||||||||||||||
| 12/31/15 | 11.76 | 0.08 | (0.21 | ) | (0.13 | ) | (0.22 | ) | (1.41 | ) | (1.63 | ) | 10.00 | (1.07% | ) | 67,973 | 0.41% | N/A | 0.69% | |||||||||||||||||||||||||||||||||
| 12/31/14 | 12.29 | 0.09 | 0.59 | 0.68 | (0.11 | ) | (1.10 | ) | (1.21 | ) | 11.76 | 5.61% | 62,711 | 0.42% | N/A | 0.77% | ||||||||||||||||||||||||||||||||||||
| 12/31/13 | 10.40 | 0.08 | 2.64 | 2.72 | (0.12 | ) | (0.71 | ) | (0.83 | ) | 12.29 | 27.15% | 51,320 | 0.44% | 0.44% | l | 0.74% | |||||||||||||||||||||||||||||||||||
| 12/31/12 | 9.07 | 0.07 | 1.32 | 1.39 | (0.06 | ) | - | (0.06 | ) | 10.40 | 15.35% | 34,472 | 0.45% | 0.45% | k | 0.72% | ||||||||||||||||||||||||||||||||||||
| Year ended December 31 | ||||||||||||||||||||
| 2016 | 2015 | 2014 | 2013 | 2012 | ||||||||||||||||
Portfolio turnover ratex | 19 | % | 22 | % | 31 | % | 27 | % | 35 | % | ||||||||||
| c | Per share amount calculated on the average shares method. |
| j | Computed after giving effect to an agreement by MML Advisers and/or MassMutual to waive certain fees and expenses of the Fund. |
| k | Amount waived had no impact on the ratio of expenses to average daily net assets. |
| l | Expenses incurred during the period fell under the expense cap. |
| m | Total return does not reflect expenses that apply at the separate account level or to related insurance products. Inclusion of these charges would reduce the total return figures for all periods shown. |
| w | Expenses of the underlying funds are not included in the Fund’s expense ratio. The Fund indirectly bears its proportionate share of the expenses of any underlying fund. |
| x | Amount does not include the portfolio activity of any underlying fund. |
The accompanying notes are an integral part of the financial statements.
48
Table of Contents
MML Series Investment Fund – Financial Statements (Continued)
Financial Highlights (For a share outstanding throughout each period)
MML American Funds Growth Fund
| Income (loss) from investment operations | Less distributions to shareholders | Ratios / Supplemental Data | ||||||||||||||||||||||||||||||||||||||||||||||||||
| Net asset value, beginning of period | Net investment income (loss)c,j | Net realized and unrealized gain (loss) on investments | Total income (loss) from investment operations | From net investment income | From net realized gains | Total distributions | Net asset value, end of the period | Total returnm | Net assets, end of the period (000’s) | Ratio of expenses to average daily net assets before expense waiversu | Ratio of expenses to average daily net assets after expense waiversu,j | Net investment income (loss) to average daily net assets | ||||||||||||||||||||||||||||||||||||||||
| Service Class I | ||||||||||||||||||||||||||||||||||||||||||||||||||||
| 12/31/16 | $ | 14.53 | $ | 0.05 | $ | 1.16 | $ | 1.21 | $ | (0.03 | ) | $ | (3.34 | ) | $ | (3.37 | ) | $ | 12.37 | 9.00% | $ | 139,841 | 0.69% | 0.69% | l | 0.37% | ||||||||||||||||||||||||||
| 12/31/15 | 14.67 | 0.03 | 0.84 | 0.87 | (0.10 | ) | (0.91 | ) | (1.01 | ) | 14.53 | 6.41% | 127,667 | 0.69% | 0.69%l | 0.22% | ||||||||||||||||||||||||||||||||||||
| 12/31/14 | 14.14 | 0.12 | 1.00 | 1.12 | (0.06 | ) | (0.53 | ) | (0.59 | ) | 14.67 | 7.99% | 111,927 | 0.70% | 0.70%l | 0.83% | ||||||||||||||||||||||||||||||||||||
| 12/31/13 | 11.16 | 0.07 | 3.19 | 3.26 | (0.04 | ) | (0.24 | ) | (0.28 | ) | 14.14 | 29.56% | 94,167 | 0.70% | 0.70%k | 0.55% | ||||||||||||||||||||||||||||||||||||
| 12/31/12 | 9.61 | 0.05 | 1.62 | 1.67 | (0.02 | ) | (0.10 | ) | (0.12 | ) | 11.16 | 17.41% | 66,069 | 0.74% | 0.70% | 0.44% | ||||||||||||||||||||||||||||||||||||
| Year ended December 31 | ||||||||||||||||||||
| 2016 | 2015 | 2014 | 2013 | 2012 | ||||||||||||||||
Portfolio turnover ratex | 8 | % | 7 | % | 4 | % | 8 | % | 6 | % | ||||||||||
| c | Per share amount calculated on the average shares method. |
| j | Computed after giving effect to an agreement by MML Advisers and/or MassMutual to waive certain fees and expenses of the Fund. |
| k | Amount waived had no impact on the ratio of expenses to average daily net assets. |
| l | Expenses incurred during the period fell under the expense cap. |
| m | Total return does not reflect expenses that apply at the separate account level or to related insurance products. Inclusion of these charges would reduce the total return figures for all periods shown. |
| u | Expenses of the Master Fund are not included in the Fund’s expense ratio. The Fund indirectly bears its proportionate share of the expenses of the Master Fund. |
| x | Amount does not include the portfolio activity of the Master Fund. |
The accompanying notes are an integral part of the financial statements.
49
Table of Contents
MML Series Investment Fund – Financial Statements (Continued)
Financial Highlights (For a share outstanding throughout each period)
MML American Funds International Fund
| Income (loss) from investment operations | Less distributions to shareholders | Ratios / Supplemental Data | ||||||||||||||||||||||||||||||||||||||||||||||||||
| Net asset value, beginning of period | Net investment income (loss)c,j | Net realized and unrealized gain (loss) on investments | Total income (loss) from investment operations | From net investment income | From net realized gains | Total distributions | Net asset value, end of the period | Total returnm | Net assets, end of the period (000’s) | Ratio of expenses to average daily net assets before expense waiversu | Ratio of expenses to average daily net assets after expense waiversu,j | Net investment income (loss) to average daily net assets | ||||||||||||||||||||||||||||||||||||||||
Service Class I |
| |||||||||||||||||||||||||||||||||||||||||||||||||||
| 12/31/16 | $ | 9.63 | $ | 0.09 | $ | 0.21 | $ | 0.30 | $ | (0.11 | ) | $ | (0.70 | ) | $ | (0.81 | ) | $ | 9.12 | 2.97% | $ | 53,972 | 0.72% | 0.70% | 0.94% | |||||||||||||||||||||||||||
| 12/31/15 | 10.48 | 0.12 | (0.63 | ) | (0.51 | ) | (0.10 | ) | (0.24 | ) | (0.34 | ) | 9.63 | (4.93% | ) | 55,589 | 0.72% | 0.70% | 1.14% | |||||||||||||||||||||||||||||||||
| 12/31/14 | 11.27 | 0.11 | (0.43 | ) | (0.32 | ) | (0.10 | ) | (0.37 | ) | (0.47 | ) | 10.48 | (3.09% | ) | 51,341 | 0.73% | 0.70% | 1.02% | |||||||||||||||||||||||||||||||||
| 12/31/13 | 9.62 | 0.10 | 1.88 | 1.98 | (0.10 | ) | (0.23 | ) | (0.33 | ) | 11.27 | 21.09% | 48,455 | 0.74% | 0.70% | 0.98% | ||||||||||||||||||||||||||||||||||||
| 12/31/12 | 8.44 | 0.10 | 1.34 | 1.44 | (0.12 | ) | (0.14 | ) | (0.26 | ) | 9.62 | 17.38% | 38,624 | 0.79% | 0.70% | 1.11% | ||||||||||||||||||||||||||||||||||||
| Year ended December 31 | ||||||||||||||||||||
| 2016 | 2015 | 2014 | 2013 | 2012 | ||||||||||||||||
Portfolio turnover ratex | 12 | % | 4 | % | 6 | % | 8 | % | 10 | % | ||||||||||
| c | Per share amount calculated on the average shares method. |
| j | Computed after giving effect to an agreement by MML Advisers and/or MassMutual to waive certain fees and expenses of the Fund. |
| m | Total return does not reflect expenses that apply at the separate account level or to related insurance products. Inclusion of these charges would reduce the total return figures for all periods shown. |
| u | Expenses of the Master Fund are not included in the Fund’s expense ratio. The Fund indirectly bears its proportionate share of the expenses of the Master Fund. |
| x | Amount does not include the portfolio activity of the Master Fund. |
The accompanying notes are an integral part of the financial statements.
50
Table of Contents
MML Series Investment Fund – Financial Statements (Continued)
Financial Highlights (For a share outstanding throughout each period)
MML American Funds Core Allocation Fund
| Income (loss) from investment operations | Less distributions to shareholders | Ratios / Supplemental Data | ||||||||||||||||||||||||||||||||||||||||||||||||||
| Net asset value, beginning of period | Net investment income (loss)c,j | Net realized and unrealized gain (loss) on investments | Total income (loss) from investment operations | From net investment income | From net realized gains | Total distributions | Net asset value, end of the period | Total returnm | Net assets, end of the period (000’s) | Ratio of expenses to average daily net assets before expense waiversw | Ratio of expenses to average daily net assets after expense waiversw,j | Net investment income (loss) to average daily net assets | ||||||||||||||||||||||||||||||||||||||||
| Service Class I | ||||||||||||||||||||||||||||||||||||||||||||||||||||
| 12/31/16 | $ | 12.08 | $ | 0.16 | $ | 0.92 | $ | 1.08 | $ | (0.24 | ) | $ | (0.98 | ) | $ | (1.22 | ) | $ | 11.94 | 8.97% | $ | 941,450 | 0.71% | N/A | 1.29% | |||||||||||||||||||||||||||
| 12/31/15 | 12.72 | 0.16 | (0.31 | ) | (0.15 | ) | (0.17 | ) | (0.32 | ) | (0.49 | ) | 12.08 | (1.12% | ) | 813,103 | 0.71% | N/A | 1.28% | |||||||||||||||||||||||||||||||||
| 12/31/14 | 12.28 | 0.21 | 0.78 | 0.99 | (0.13 | ) | (0.42 | ) | (0.55 | ) | 12.72 | 8.05% | 696,608 | 0.72% | N/A | 1.71% | ||||||||||||||||||||||||||||||||||||
| 12/31/13 | 10.72 | 0.19 | 1.73 | 1.92 | (0.15 | ) | (0.21 | ) | (0.36 | ) | 12.28 | 18.30% | 550,517 | 0.72% | 0.72%l | 1.68% | ||||||||||||||||||||||||||||||||||||
| 12/31/12 | 10.00 | 0.17 | 0.99 | 1.16 | (0.16 | ) | (0.28 | ) | (0.44 | ) | 10.72 | 11.70% | 422,997 | 0.73% | 0.73% | l | 1.63% | |||||||||||||||||||||||||||||||||||
| Year ended December 31 | ||||||||||||||||||||
| 2016 | 2015 | 2014 | 2013 | 2012 | ||||||||||||||||
Portfolio turnover ratex | 7 | % | 3 | % | 3 | % | 8 | % | 8 | % | ||||||||||
| c | Per share amount calculated on the average shares method. |
| j | Computed after giving effect to an agreement by MML Advisers and/or MassMutual to waive certain fees and expenses of the Fund. |
| l | Expenses incurred during the period fell under the expense cap. |
| m | Total return does not reflect expenses that apply at the separate account level or to related insurance products. Inclusion of these charges would reduce the total return figures for all periods shown. |
| w | Expenses of the underlying funds are not included in the Fund’s expense ratio. The Fund indirectly bears its proportionate share of the expenses of any underlying fund. |
| x | Amount does not include the portfolio activity of any underlying fund. |
The accompanying notes are an integral part of the financial statements.
51
Table of Contents
| 1. | The Funds |
MML Series Investment Fund (the “Trust”) is registered under the Investment Company Act of 1940, as amended (the “1940 Act”), as a no-load, open-end, management investment company. The Trust is organized under the laws of the Commonwealth of Massachusetts as a Massachusetts business trust pursuant to an Agreement and Declaration of Trust dated December 19, 1984, as restated May 14, 1993, and further amended and restated as of December 15, 2011, as it may be further amended from time to time. The following are eight series of the Trust (each individually referred to as a “Fund” or collectively as the “Funds”):
MML Conservative Allocation Fund (“Conservative Allocation Fund”)
MML Balanced Allocation Fund (“Balanced Allocation Fund”)
MML Moderate Allocation Fund (“Moderate Allocation Fund”)
MML Growth Allocation Fund (“Growth Allocation Fund”)
MML Aggressive Allocation Fund (“Aggressive Allocation Fund”)
MML American Funds® Growth Fund (“American Funds Growth Fund”)
MML American Funds® International Fund (“American Funds International Fund”)
MML American Funds Core Allocation Fund (“American Funds Core Allocation Fund”)
The Trust makes shares of the Funds available for the investment of assets of various separate investment accounts established by Massachusetts Mutual Life Insurance Company (“MassMutual”) and by life insurance companies which are subsidiaries of MassMutual. Shares of the Trust are not offered to the general public. MassMutual, MML Bay State Life Insurance Company, and C.M. Life Insurance Company are the record owners of all of the outstanding shares of the Funds.
The Conservative Allocation Fund, Balanced Allocation Fund, Moderate Allocation Fund, Growth Allocation Fund, and Aggressive Allocation Fund (the “Allocation Funds”) invest their investable assets in shares of series of the Trust and MML Series Investment Fund II (which are advised by MML Investment Advisers, LLC (“MML Advisers”), Oppenheimer Funds (which are advised by OFI Global Asset Management, Inc., a majority-owned, indirect subsidiary of MassMutual), and non-affiliated funds (together, the “Underlying Funds”). The financial statements included herein are those of the Funds. The financial statements of the applicable Underlying Funds are presented separately and can be obtained from the Securities and Exchange Commission’s (“SEC”) EDGAR database on its website at http://www.sec.gov or by calling MML Advisers at 1-888-309-3539. The assets of each of the five Allocation Funds listed above are diversified and a shareholder’s interest is limited to the Underlying Funds in which the shares are invested.
American Funds Growth Fund and American Funds International Fund (each a “Feeder Fund,” collectively the “Feeder Funds”) invest all of their assets in Class 1 shares of the Growth and International Funds, respectively, each a series of the American Funds Insurance Series (each a “Master Fund,” collectively the “Master Funds”). Each Master Fund is an open-end investment company and organized as a Massachusetts business trust. Each Feeder Fund has an investment objective that is consistent with its corresponding Master Fund. Each Master Fund intends to comply with the requirements under Subchapter M of the Internal Revenue Code applicable to mutual funds and intends to distribute substantially all of its taxable income and capital gains to shareholders, which includes the applicable Feeder Fund, to qualify as a regulated investment company. The performance of the Feeder Funds is directly affected by the performance of the Master Funds. The financial statements of the Master Funds, including the Summary Investment Portfolios, are provided separately and should be read in conjunction with the Feeder Funds’ financial statements. As of December 31, 2016, the American Funds Growth Fund and American Funds International Fund owned 0.65% and 0.72% of the Growth and International Master Funds, respectively. The American Funds Core Allocation Fund invests all of its investable assets in shares of various series of American Funds Insurance Series, which are managed by Capital Research and Management Company.
The SEC file number for the American Funds Insurance Series is 811-03857. Additional information related to the Master Funds’ financial reports can be located on the SEC’s EDGAR database on its website at http://www.sec.gov.
Each share class of a Fund represents an interest in the same portfolio of assets. The principal difference among the classes is the level of service and administration fees, and shareholder and distribution service expenses borne by the classes. Because each class will have different fees and expenses, performance and share prices will vary between the classes. The classes of shares are offered to different types of investors, as outlined in the Funds’ Prospectus.
52
Table of Contents
Notes to Financial Statements (Continued)
| 2. | Significant Accounting Policies |
The following is a summary of significant accounting policies followed consistently by each Fund in the preparation of the financial statements in conformity with accounting principles generally accepted in the United States of America (“generally accepted accounting principles”). The preparation of the financial statements in accordance with generally accepted accounting principles requires management to make estimates and assumptions that affect the reported amounts and disclosures in the financial statements. Actual results could differ from those estimates.
Investment Valuation
The net asset value of each Fund’s shares is determined once daily as of the close of regular trading on the New York Stock Exchange (“NYSE”), on each day the NYSE is open for trading (a “business day”). The NYSE normally closes at 4:00 p.m. Eastern Time, but may close earlier on some days.
The net asset value of each Fund is based upon the net asset value(s) of its corresponding Master Fund or Underlying Funds. Shares of the Master Fund and Underlying Funds are valued at their closing net asset values as reported on each business day.
Certain Underlying Funds or Master Funds may invest in securities that are traded principally in foreign markets and that trade on weekends and other days when the Funds do not price their shares. As a result, the values of the Funds’ portfolio securities may change on days when the prices of the Funds’ shares are not calculated. The prices of the Funds’ shares will reflect any such changes when the prices of the Funds’ shares are next calculated, which is the next business day.
The Prospectuses and Statements of Additional Information (“SAIs”) for the Underlying Funds or Master Funds, as applicable, explain the valuation methods for the Underlying Funds or Master Funds including the circumstances under which the Underlying Funds or Master Funds, may use fair value pricing and the effects of doing so. Such Prospectuses and SAIs are available on the SEC’s EDGAR database on its website at http://www.sec.gov.
Various inputs may be used to determine the value of the Funds’ investments. The Funds categorize the inputs to valuation techniques used to value their investments into a disclosure hierarchy consisting of three levels as summarized below. The inputs or methodology used for valuing investments are not necessarily an indication of the risk associated with investing in those investments.
Level 1 – quoted prices (unadjusted) in active markets for identical investments that the Funds can access at the measurement date
Level 2 – other significant observable inputs (including quoted prices for similar investments, interest rates, prepayment speeds, credit risk, etc.)
Level 3 – significant unobservable inputs (including the Funds’ own assumptions in determining the fair value of investments)
Each Fund characterized all investments at Level 1, as of December 31, 2016. For each Fund, the level classification by major category of investments is the same as the category presentation in the Portfolio of Investments.
The Fund(s) had no transfers between Level 1, Level 2 and Level 3 of the fair value hierarchy during the year ended December 31, 2016. The Fund(s) recognize transfers between the Levels as of the beginning of the year.
Accounting for Investment Transactions
Investment transactions are accounted for on the trade date. Realized gains and losses on sales of investments and unrealized appreciation and depreciation of investments are computed by the specific identification cost method. Proceeds received from litigation, if any, are included in realized gains on investment transactions for any investments that are no longer held in the portfolio and as a reduction in cost for investments that continue to be held in the portfolio. Interest income, adjusted for amortization of discounts and premiums on debt securities, is earned from the settlement date and is recorded on the accrual basis. Dividend income and distributions including realized gain distributions are recorded on the ex-dividend date. Withholding taxes on foreign interest, dividends, and capital gains have been provided for in accordance with the applicable country’s tax rules and rates. Foreign dividend income is recorded on the ex-dividend date or as soon as practicable after the Fund determines the existence of a
53
Table of Contents
Notes to Financial Statements (Continued)
dividend declaration after exercising reasonable due diligence. Distributions received on securities that represent a return of capital or capital gain are recorded as a reduction of cost of investments and/or as a realized gain. The Funds determine the classification of distributions received as return of capital distributions or capital gain distributions.
Allocation of Operating Activity
In maintaining the records for the Funds, the income and expense accounts are allocated daily to each class of shares. Investment income and loss, and unrealized and realized gains or losses are prorated among the classes of shares based on the relative net assets of each. Expenses are allocated to each class of shares depending on the nature of the expenditures. Administration and service fees, if any, which are directly attributable to a class of shares, are charged to that class’s operations. Expenses of a Fund not directly attributable to the operations of any specific class of shares of the Fund are prorated among the classes to which the expense relates based on relative net assets.
In addition, each Fund will also incur certain fees and expenses indirectly as a shareholder in the Underlying Funds or Master Funds. Because the Underlying Funds have varied expense and fee levels, and the Allocation Funds may own different proportions of Underlying Funds at different times, the amount of fees and expenses indirectly incurred by each of the Allocation Funds will vary.
Foreign Securities
Certain Underlying Funds or Master Funds may invest in foreign securities. Foreign securities, including American Depositary Receipts, are subject to additional risks compared to securities of U.S. issuers, including international trade, currency, political, regulatory, and diplomatic risks. In addition, fluctuations in currency exchange rates may adversely affect the values of foreign securities and the price of a Fund’s shares. Emerging markets securities are subject to greater risks than securities issued in developed foreign markets, including less liquidity, greater price volatility, higher relative rates of inflation, greater political, economic, and social instability, greater custody and operational risks, and greater volatility in currency exchange rates.
Federal Income Tax
It is each Fund’s intent to continue to comply with the provisions of subchapter M of the Internal Revenue Code of 1986, as amended, applicable to a regulated investment company. Under such provisions, the Funds would not be subject to federal income taxes on their ordinary income and net realized capital gains to the extent they are distributed or deemed to have been distributed to their shareholders. Therefore, the Funds have not made any provision for federal income tax.
Dividends and Distributions to Shareholders
Dividends from net investment income and distributions of any net realized capital gains of each Fund are declared and paid annually and at other times as may be required to satisfy tax or regulatory requirements.
Distributions to shareholders are recorded on the ex-dividend date. Income and capital gain distributions are determined in accordance with income tax regulations, which may differ from generally accepted accounting principles. As a result, net investment income and net realized capital gains on investment transactions for a reporting period may differ significantly from distributions during such period.
54
Table of Contents
Notes to Financial Statements (Continued)
| 3. | Advisory Fees and Other Transactions |
Investment Advisory Fees
MML Advisers, a wholly-owned subsidiary of MassMutual, serves as investment adviser to each Fund. Under the investment advisory agreements between MML Advisers and the Trust on behalf of each Fund, MML Advisers is responsible for providing investment management services for each Fund. In return for these services, MML Advisers receives advisory fees, based upon each Fund’s average daily net assets, at the following annual rates:
Fund | Investment Advisory Fee | |
Conservative Allocation Fund | 0.10% | |
Balanced Allocation Fund | 0.10% | |
Moderate Allocation Fund | 0.10% | |
Growth Allocation Fund | 0.10% | |
Aggressive Allocation Fund | 0.10% | |
American Funds Growth Fund* | 0.15% on the first $500 million; and | |
| 0.125% on any excess over $500 million | ||
American Funds International Fund* | 0.15% on the first $500 million; and | |
| 0.125% on any excess over $500 million | ||
American Funds Core Allocation Fund* | 0.20% on the first $750 million; and | |
| 0.175% on any excess over $750 million |
| * | Prior to January 1, 2016, the investment advisory fees were as follows: |
Fund | Investment Advisory Fee | |
American Funds Growth Fund | 0.15% | |
American Funds International Fund | 0.15% | |
American Funds Core Allocation Fund | 0.20% |
Administration Fees
For the American Funds Growth Fund, American Funds International Fund, and American Funds Core Allocation Fund, under a separate Administrative and Shareholder Services Agreement between the Funds and MML Advisers, MML Advisers is obligated to provide all necessary administrative and shareholder services and bear some of the Fund specific administrative expenses. In return for these services, MML Advisers receives an administrative services fee based upon the average daily net assets of the applicable class of shares of the Funds, at the following annual rates:
| Service Class I | ||||
American Funds Growth Fund | 0.25% | |||
American Funds International Fund | 0.25% | |||
American Funds Core Allocation Fund | 0.25% | |||
Distribution and Service Fees
MML Distributors, LLC (the “Distributor”) acts as distributor to the Funds. Pursuant to a Distribution and Services Plan adopted by the Funds pursuant to Rule 12b-1 under the 1940 Act, Service Class shares and Service Class I shares of the Funds pay an annual fee of 0.25% of the average daily net asset value of Service Class shares and Service Class I shares. This fee, or a portion thereof, is paid to: (i) the Distributor for services provided and expenses incurred by it in connection with the distribution of Service Class shares or Service Class I shares, as applicable, of each Fund; and/or (ii) MassMutual for services provided and
55
Table of Contents
Notes to Financial Statements (Continued)
expenses incurred by it for purposes of maintaining or providing personal services to Service Class and Service Class I shareholders. The Distributor is a wholly-owned subsidiary of MassMutual.
Expense Caps and Waivers
MML Advisers agreed to cap the fees and expenses of the Funds noted below (other than extraordinary litigation and legal expenses, Master Fund Fees and Expenses#, interest expense, short sale dividend and loan expense, or other non-recurring or unusual expenses such as organizational expenses and shareholder meeting expenses) based upon the average daily net assets of the applicable class of shares of the Funds, as follows:
| Service Class I | ||||
American Funds Growth Fund* | 0.70% | |||
American Funds International Fund* | 0.70% | |||
| # | Master Fund Fees and Expenses are expenses borne indirectly by a Fund through investments in other pooled investment vehicles. |
| * | Expense caps in effect through April 30, 2017. |
Expense caps and waiver amounts are reflected as a reduction of expenses on the Statements of Operations.
Deferred Compensation
Trustees of the Funds who are not officers or employees of MassMutual may elect to defer receipt of their annual fees in accordance with terms of a Non-Qualified Deferred Compensation Plan. Amounts deferred shall accrue interest or earnings and shall be recorded on the Funds’ books as other liabilities. Deferred compensation is included within Trustees’ fees and expenses in the Statements of Assets and Liabilities.
Other
Certain officers and trustees of the Funds may also be employees of MassMutual. The compensation of a trustee who is not an employee of MassMutual is borne by the Funds.
4. Purchases and Sales of Investments
Cost of purchases and proceeds from sales of investments in Underlying Funds or Master Funds (excluding short-term investments) for the year ended December 31, 2016, were as follows:
| Purchases | Sales | |||||||||||||||
| Long-Term U.S. Government Securities | Other Long-Term Securities | Long-Term U.S. Government Securities | Other Long-Term Securities | |||||||||||||
Conservative Allocation Fund | $ | - | $ | 132,626,344 | $ | - | $ | 113,905,140 | ||||||||
Balanced Allocation Fund | - | 100,645,738 | - | 101,040,382 | ||||||||||||
Moderate Allocation Fund | - | 364,393,926 | - | 337,863,539 | ||||||||||||
Growth Allocation Fund | - | 276,107,112 | - | 286,371,561 | ||||||||||||
Aggressive Allocation Fund | - | 31,805,459 | - | 24,271,534 | ||||||||||||
American Funds Growth Fund | - | 22,589,490 | - | 9,846,545 | ||||||||||||
American Funds International Fund | - | 8,650,279 | - | 6,706,786 | ||||||||||||
American Funds Core Allocation Fund | - | 179,046,428 | - | 60,762,194 | ||||||||||||
56
Table of Contents
Notes to Financial Statements (Continued)
| 5. | Capital Share Transactions |
Changes in shares outstanding for each Fund were as follows:
| Year Ended December 31, 2016 | Year Ended December 31, 2015 | |||||||||||||||
| Shares | Amount | Shares | Amount | |||||||||||||
Conservative Allocation Fund Initial Class | ||||||||||||||||
Sold | 1,356,985 | $ | 13,299,244 | 1,756,649 | $ | 18,905,121 | ||||||||||
Issued as reinvestment of dividends | 901,788 | 8,684,221 | 1,221,416 | 12,030,947 | ||||||||||||
Redeemed | (2,493,168 | ) | (24,443,943 | ) | (3,000,297 | ) | (32,226,504 | ) | ||||||||
|
|
|
|
|
|
|
| |||||||||
Net increase (decrease) | (234,395 | ) | $ | (2,460,478 | ) | (22,232 | ) | $ | (1,290,436 | ) | ||||||
|
|
|
|
|
|
|
| |||||||||
Conservative Allocation Fund Service Class | ||||||||||||||||
Sold | 7,357,528 | $ | 71,400,199 | 4,182,198 | $ | 44,590,385 | ||||||||||
Issued as reinvestment of dividends | 2,841,405 | 27,107,004 | 3,418,124 | 33,395,068 | ||||||||||||
Redeemed | (6,752,196 | ) | (65,546,438 | ) | (4,360,810 | ) | (45,860,549 | ) | ||||||||
|
|
|
|
|
|
|
| |||||||||
Net increase (decrease) | 3,446,737 | $ | 32,960,765 | 3,239,512 | $ | 32,124,904 | ||||||||||
|
|
|
|
|
|
|
| |||||||||
Balanced Allocation Fund Initial Class | ||||||||||||||||
Sold | 758,080 | $ | 7,515,695 | 670,590 | $ | 7,374,874 | ||||||||||
Issued as reinvestment of dividends | 1,299,312 | 12,538,360 | 1,524,849 | 15,339,977 | ||||||||||||
Redeemed | (2,510,382 | ) | (25,135,439 | ) | (2,773,827 | ) | (30,560,109 | ) | ||||||||
|
|
|
|
|
|
|
| |||||||||
Net increase (decrease) | (452,990 | ) | $ | (5,081,384 | ) | (578,388 | ) | $ | (7,845,258 | ) | ||||||
|
|
|
|
|
|
|
| |||||||||
Balanced Allocation Fund Service Class | ||||||||||||||||
Sold | 3,242,682 | $ | 31,965,320 | 3,556,395 | $ | 38,690,272 | ||||||||||
Issued as reinvestment of dividends | 4,082,233 | 39,107,790 | 4,281,368 | 42,813,675 | ||||||||||||
Redeemed | (4,585,592 | ) | (45,348,007 | ) | (3,583,988 | ) | (39,034,267 | ) | ||||||||
|
|
|
|
|
|
|
| |||||||||
Net increase (decrease) | 2,739,323 | $ | 25,725,103 | 4,253,775 | $ | 42,469,680 | ||||||||||
|
|
|
|
|
|
|
| |||||||||
Moderate Allocation Fund Initial Class | ||||||||||||||||
Sold | 1,909,387 | $ | 20,138,659 | 1,881,741 | $ | 21,996,513 | ||||||||||
Issued as reinvestment of dividends | 3,619,457 | 37,171,830 | 3,826,129 | 40,786,533 | ||||||||||||
Redeemed | (4,934,301 | ) | (52,205,381 | ) | (6,009,084 | ) | (69,034,142 | ) | ||||||||
|
|
|
|
|
|
|
| |||||||||
Net increase (decrease) | 594,543 | $ | 5,105,108 | (301,214 | ) | $ | (6,251,096 | ) | ||||||||
|
|
|
|
|
|
|
| |||||||||
Moderate Allocation Fund Service Class | ||||||||||||||||
Sold | 8,936,099 | $ | 92,912,593 | 17,299,728 | $ | 198,445,800 | ||||||||||
Issued as reinvestment of dividends | 17,086,421 | 173,939,765 | 16,269,769 | 171,971,460 | ||||||||||||
Redeemed | (16,363,697 | ) | (170,910,087 | ) | (4,174,971 | ) | (47,506,446 | ) | ||||||||
|
|
|
|
|
|
|
| |||||||||
Net increase (decrease) | 9,658,823 | $ | 95,942,271 | 29,394,526 | $ | 322,910,814 | ||||||||||
|
|
|
|
|
|
|
| |||||||||
Growth Allocation Fund Initial Class |
| |||||||||||||||
Sold | 1,578,677 | $ | 14,808,352 | 1,743,894 | $ | 19,150,556 | ||||||||||
Issued as reinvestment of dividends | 8,209,341 | 73,884,068 | 8,692,647 | 84,057,898 | ||||||||||||
Redeemed | (6,047,828 | ) | (57,234,283 | ) | (6,497,306 | ) | (70,560,502 | ) | ||||||||
|
|
|
|
|
|
|
| |||||||||
Net increase (decrease) | 3,740,190 | $ | 31,458,137 | 3,939,235 | $ | 32,647,952 | ||||||||||
|
|
|
|
|
|
|
| |||||||||
Growth Allocation Fund Service Class |
| |||||||||||||||
Sold | 2,613,115 | $ | 24,405,528 | 3,281,727 | $ | 34,772,801 | ||||||||||
Issued as reinvestment of dividends | 13,479,070 | 120,502,885 | 14,019,059 | 134,723,154 | ||||||||||||
Redeemed | (10,131,162 | ) | (95,021,107 | ) | (5,344,473 | ) | (56,807,712 | ) | ||||||||
|
|
|
|
|
|
|
| |||||||||
Net increase (decrease) | 5,961,023 | $ | 49,887,306 | 11,956,313 | $ | 112,688,243 | ||||||||||
|
|
|
|
|
|
|
| |||||||||
57
Table of Contents
Notes to Financial Statements (Continued)
| Year Ended December 31, 2016 | Year Ended December 31, 2015 | |||||||||||||||
| Shares | Amount | Shares | Amount | |||||||||||||
Aggressive Allocation Fund Initial Class | ||||||||||||||||
Sold | 597,830 | $ | 5,824,037 | 515,681 | $ | 5,777,095 | ||||||||||
Issued as reinvestment of dividends | 723,438 | 6,822,019 | 784,159 | 7,888,642 | ||||||||||||
Redeemed | (766,148 | ) | (7,515,837 | ) | (702,596 | ) | (7,864,641 | ) | ||||||||
|
|
|
|
|
|
|
| |||||||||
Net increase (decrease) | 555,120 | $ | 5,130,219 | 597,244 | $ | 5,801,096 | ||||||||||
|
|
|
|
|
|
|
| |||||||||
Aggressive Allocation Fund Service Class | ||||||||||||||||
Sold | 791,226 | $ | 7,727,853 | 984,077 | $ | 11,205,683 | ||||||||||
Issued as reinvestment of dividends | 899,794 | 8,386,079 | 927,224 | 9,235,151 | ||||||||||||
Redeemed | (787,999 | ) | (7,715,353 | ) | (444,298 | ) | (5,029,596 | ) | ||||||||
|
|
|
|
|
|
|
| |||||||||
Net increase (decrease) | 903,021 | $ | 8,398,579 | 1,467,003 | $ | 15,411,238 | ||||||||||
|
|
|
|
|
|
|
| |||||||||
American Funds Growth Fund Service Class I | ||||||||||||||||
Sold | 1,129,900 | $ | 14,971,405 | 1,352,994 | $ | 20,149,461 | ||||||||||
Issued as reinvestment of dividends | 2,440,624 | 29,336,297 | 599,106 | 8,207,754 | ||||||||||||
Redeemed | (1,053,380 | ) | (14,085,309 | ) | (793,612 | ) | (11,828,907 | ) | ||||||||
|
|
|
|
|
|
|
| |||||||||
Net increase (decrease) | 2,517,144 | $ | 30,222,393 | 1,158,488 | $ | 16,528,308 | ||||||||||
|
|
|
|
|
|
|
| |||||||||
American Funds International Fund Service Class I | ||||||||||||||||
Sold | 471,718 | $ | 4,419,158 | 1,042,589 | $ | 10,938,123 | ||||||||||
Issued as reinvestment of dividends | 490,696 | 4,588,007 | 182,224 | 1,776,685 | ||||||||||||
Redeemed | (822,096 | ) | (7,663,346 | ) | (351,204 | ) | (3,730,936 | ) | ||||||||
|
|
|
|
|
|
|
| |||||||||
Net increase (decrease) | 140,318 | $ | 1,343,819 | 873,609 | $ | 8,983,872 | ||||||||||
|
|
|
|
|
|
|
| |||||||||
American Funds Core Allocation Fund Service Class I |
| |||||||||||||||
Sold | 9,222,514 | $ | 111,618,224 | 12,267,580 | $ | 154,946,189 | ||||||||||
Issued as reinvestment of dividends | 6,975,419 | 82,519,208 | 2,526,086 | 29,858,334 | ||||||||||||
Redeemed | (4,649,056 | ) | (56,597,850 | ) | (2,241,931 | ) | (28,363,152 | ) | ||||||||
|
|
|
|
|
|
|
| |||||||||
Net increase (decrease) | 11,548,877 | $ | 137,539,582 | 12,551,735 | $ | 156,441,371 | ||||||||||
|
|
|
|
|
|
|
| |||||||||
| 6. | Federal Income Tax Information |
At December 31, 2016, the cost of securities and the unrealized appreciation (depreciation) in the value of investments owned by the Fund(s), as computed on a federal income tax basis, were as follows:
| Federal Income Tax Cost | Tax Basis Unrealized Appreciation | Tax Basis Unrealized (Depreciation) | Net Unrealized Appreciation (Depreciation) | |||||||||||||
Conservative Allocation Fund | $ | 497,745,172 | $ | 1,030,090 | $ | (21,071,562 | ) | $ | (20,041,472 | ) | ||||||
Balanced Allocation Fund | 593,597,984 | 3,339,780 | (22,815,659 | ) | (19,475,879 | ) | ||||||||||
Moderate Allocation Fund | 2,450,927,743 | 22,822,675 | (91,358,766 | ) | (68,536,091 | ) | ||||||||||
Growth Allocation Fund | 1,617,681,467 | 41,537,073 | (49,432,010 | ) | (7,894,937 | ) | ||||||||||
Aggressive Allocation Fund | 138,250,918 | 1,015,097 | (7,118,773 | ) | (6,103,676 | ) | ||||||||||
American Funds Growth Fund | 135,078,770 | 4,922,577 | - | 4,922,577 | ||||||||||||
American Funds International Fund | 57,870,170 | - | (3,824,554 | ) | (3,824,554 | ) | ||||||||||
American Funds Core Allocation Fund | 908,986,963 | 44,812,696 | (11,327,925 | ) | 33,484,771 | |||||||||||
Net capital loss carryforwards may be applied against any net realized taxable gains in succeeding years, subject to the carryforward period limitations, where applicable. On December 22, 2010, the Regulated Investment Company Modernization Act of 2010 (the “Modernization Act”) was signed by the President. The Modernization Act changed the capital loss carryforward
58
Table of Contents
Notes to Financial Statements (Continued)
rules as they relate to regulated investment companies. Capital losses generated in tax years beginning after the date of enactment may now be carried forward indefinitely, and retain the character of the original loss. Under pre-enactment law, capital losses could be carried forward for up to eight tax years as short-term capital losses. The provisions affecting the utilization of capital loss carryforwards under the Modernization Act also require the utilization of post-enactment losses prior to the utilization of pre-enactment losses.
At December 31, 2016, for federal income tax purposes, there were no unused capital losses.
Generally accepted accounting principles in the United States of America require that only distributions in excess of tax basis earnings and profits be reported in the financial statements as a return of capital.
The tax character of distributions (including capital gain dividends, if any, designated pursuant to Section 852 of the Code) paid during the year ended December 31, 2016, was as follows:
| Ordinary Income | Long Term Capital Gain | Return of Capital | ||||||||||
Conservative Allocation Fund | $ | 10,503,255 | $ | 25,287,970 | $ | - | ||||||
Balanced Allocation Fund | 12,247,002 | 39,399,148 | - | |||||||||
Moderate Allocation Fund | 44,987,407 | 166,124,188 | - | |||||||||
Growth Allocation Fund | 27,702,930 | 166,684,023 | - | |||||||||
Aggressive Allocation Fund | 1,795,427 | 13,412,671 | - | |||||||||
American Funds Growth Fund | 267,323 | 29,068,974 | - | |||||||||
American Funds International Fund | 632,920 | 3,955,087 | - | |||||||||
American Funds Core Allocation Fund | 16,088,756 | 66,430,452 | - | |||||||||
The tax character of distributions (including capital gain dividends, if any, designated pursuant to Section 852 of the Code) paid during the year ended December 31, 2015, was as follows:
| Ordinary Income | Long Term Capital Gain | Return of Capital | ||||||||||
Conservative Allocation Fund | $ | 13,013,682 | $ | 32,412,333 | $ | - | ||||||
Balanced Allocation Fund | 15,528,133 | 42,625,519 | - | |||||||||
Moderate Allocation Fund | 52,556,082 | 160,201,911 | - | |||||||||
Growth Allocation Fund | 38,564,652 | 180,216,400 | - | |||||||||
Aggressive Allocation Fund | 2,510,513 | 14,613,280 | - | |||||||||
American Funds Growth Fund | 845,292 | 7,362,462 | - | |||||||||
American Funds International Fund | 507,014 | 1,269,671 | - | |||||||||
American Funds Core Allocation Fund | 10,454,332 | 19,404,002 | - | |||||||||
The following Fund(s) have elected to pass through the foreign tax credit for the year ended December 31, 2016:
| Amount | ||||
Conservative Allocation Fund | $ | 33,466 | ||
Balanced Allocation Fund | 52,952 | |||
Moderate Allocation Fund | 313,244 | |||
Growth Allocation Fund | 289,177 | |||
Aggressive Allocation Fund | 29,017 | |||
American Funds International Fund | 100,969 | |||
American Funds Core Allocation Fund | 273,497 | |||
Capital accounts within the financial statements are periodically adjusted for permanent differences between book and tax accounting. These adjustments have no impact on net assets or the results of operations. Temporary book and tax accounting differences will reverse in subsequent periods. At December 31, 2016, temporary book and tax accounting differences were primarily attributable to the deferral of wash sale losses, and deferred Trustee compensation.
59
Table of Contents
Notes to Financial Statements (Continued)
At December 31, 2016, the components of distributable earnings on a tax basis were as follows:
| Undistributed Ordinary Income | Undistributed Long Term Capital Gain (Capital Loss Carryover) | Other Temporary Differences | Unrealized Appreciation (Depreciation) | |||||||||||||
Conservative Allocation Fund | $ | 9,521,709 | $ | 14,124,671 | $ | (49,399 | ) | $ | (20,041,472 | ) | ||||||
Balanced Allocation Fund | 10,452,978 | 24,956,494 | (59,047 | ) | (19,475,879 | ) | ||||||||||
Moderate Allocation Fund | 39,460,334 | 116,326,034 | (204,740 | ) | (68,536,091 | ) | ||||||||||
Growth Allocation Fund | 22,609,852 | 115,098,767 | (183,174 | ) | (7,894,937 | ) | ||||||||||
Aggressive Allocation Fund | 1,514,205 | 8,850,164 | (11,640 | ) | (6,103,676 | ) | ||||||||||
American Funds Growth Fund | 471,529 | 14,235,313 | (11,020 | ) | 4,922,577 | |||||||||||
American Funds International Fund | 507,479 | 5,160,298 | (5,952 | ) | (3,824,554 | ) | ||||||||||
American Funds Core Allocation Fund | 14,606,398 | 71,053,940 | (73,982 | ) | 33,484,771 | |||||||||||
During the year ended December 31, 2016, the following amounts were reclassified due to permanent differences between book and tax accounting:
| Paid-in Capital | Accumulated Net Realized Gain (Loss) on Investments | Undistributed Net Investment Income (Loss) | ||||||||||
Conservative Allocation Fund | $ | 20 | $ | (721,512 | ) | $ | 721,492 | |||||
Balanced Allocation Fund | 24 | (959,818 | ) | 959,794 | ||||||||
Moderate Allocation Fund | 84 | (4,524,178 | ) | 4,524,094 | ||||||||
Growth Allocation Fund | 71 | (3,372,559 | ) | 3,372,488 | ||||||||
Aggressive Allocation Fund | 5 | (327,630 | ) | 327,625 | ||||||||
American Funds Growth Fund | 4 | - | (4 | ) | ||||||||
American Funds International Fund | 2 | - | (2 | ) | ||||||||
American Funds Core Allocation Fund | 25 | (3,584,663 | ) | 3,584,638 | ||||||||
The Funds did not have any unrecognized tax benefits at December 31, 2016, nor were there any increases or decreases in unrecognized tax benefits for the year then ended. The Funds recognize interest and penalties, if any, related to unrecognized tax benefits as an income tax expense in the Statements of Operations. During the year ended December 31, 2016, the Funds did not incur any such interest or penalties. The Funds are subject to examination by U.S. federal and state tax authorities for returns filed for the prior three fiscal years. Foreign taxes are provided for based on the Funds’ understanding of the tax rules and rates that exist in the foreign markets in which they invest.
60
Table of Contents
Notes to Financial Statements (Continued)
| 7. | Investment in Affiliated Issuers |
A summary of the Funds’ transactions in the securities of affiliated issuers during the year ended December 31, 2016, was as follows:
| Number of Shares Held as of 12/31/15 | Purchases | Sales | Number of Shares Held as of 12/31/16 | Value as of 12/31/16 | Dividend Income | Realized Gains Distributions | Net Realized Gain (Loss) | |||||||||||||||||||||||||
Conservative Allocation Fund | ||||||||||||||||||||||||||||||||
MML Blue Chip Growth Fund, Initial Class | 1,167,140 | 351,019 | 569,623 | 948,536 | $ | 13,260,532 | $ | - | $ | 2,273,126 | $ | (99,743 | ) | |||||||||||||||||||
MML Dynamic Bond Fund, Class II | 5,963,265 | 594,356 | - | 6,557,621 | 64,854,876 | 1,857,357 | - | - | ||||||||||||||||||||||||
MML Equity Income Fund, Initial Class | 1,311,877 | 406,242 | 631,219 | 1,086,900 | 12,803,678 | 299,564 | 1,516,707 | 267,015 | ||||||||||||||||||||||||
MML Equity Index Fund, Class III | - | 272,727 | - | 272,727 | 7,229,980 | - | - | - | ||||||||||||||||||||||||
MML Focused Equity Fund, Class II | 494,591 | 176,061 | 90,620 | 580,032 | 7,656,425 | 108,541 | 466,485 | 115,597 | ||||||||||||||||||||||||
MML Foreign Fund, Initial Class | 940,166 | 187,048 | 118,885 | 1,008,329 | 9,518,629 | 177,787 | - | (45,018 | ) | |||||||||||||||||||||||
MML Fundamental Growth Fund, Class II | 940,992 | 304,006 | 373,076 | 871,922 | 9,957,354 | 81,408 | 1,428,670 | 125,219 | ||||||||||||||||||||||||
MML Fundamental Value Fund, Class II | 1,124,438 | 276,437 | 466,682 | 934,193 | 13,770,003 | 232,589 | 1,202,882 | 732,256 | ||||||||||||||||||||||||
MML Global Fund, Class I | 918,807 | 376,801 | 247,753 | 1,047,855 | 12,092,252 | 131,066 | 901,410 | 587,145 | ||||||||||||||||||||||||
MML High Yield Fund, Class II | 1,936,560 | 217,161 | 606,457 | 1,547,264 | 15,364,330 | 1,213,904 | - | (571,046 | ) | |||||||||||||||||||||||
MML Income & Growth Fund, Initial Class | 961,082 | 453,493 | 269,724 | 1,144,851 | 13,577,928 | 250,130 | 1,229,107 | 451,895 | ||||||||||||||||||||||||
MML Inflation-Protected and Income Fund, Initial Class | 1,831,486 | 395,799 | 240,301 | 1,986,984 | 20,227,497 | 480,387 | - | (184,804 | ) | |||||||||||||||||||||||
MML International Equity Fund, Class II | 1,005,672 | 150,439 | 360,875 | 795,236 | 7,419,548 | 179,747 | 20,097 | (365,133 | ) | |||||||||||||||||||||||
MML Large Cap Growth Fund, Initial Class | 987,465 | 282,708 | 905,974 | 364,199 | 3,871,431 | 14,602 | 1,014,372 | (1,667,439 | ) | |||||||||||||||||||||||
MML Managed Bond Fund, Initial Class | 8,526,226 | 2,177,792 | 2,323,704 | 8,380,314 | 102,593,023 | 3,131,363 | 493,049 | (1,435,366 | ) | |||||||||||||||||||||||
MML Mid Cap Growth Fund, Initial Class | 565,678 | 151,116 | 160,447 | 556,347 | 7,983,581 | - | 1,222,322 | 238,924 | ||||||||||||||||||||||||
MML Mid Cap Value Fund, Initial Class | 1,012,760 | 240,429 | 399,520 | 853,669 | 10,064,752 | 197,509 | 1,190,141 | (179,819 | ) | |||||||||||||||||||||||
MML Short-Duration Bond Fund, Class II | 1,705,983 | 1,552,642 | 643,755 | 2,614,870 | 25,494,982 | 440,093 | - | (185,456 | ) | |||||||||||||||||||||||
MML Small Cap Growth Equity Fund, Initial Class | 161,880 | 73,738 | 43,915 | 191,703 | 2,433,051 | - | 405,876 | (335,652 | ) | |||||||||||||||||||||||
MML Small Company Value Fund, Class II | 340,419 | 94,462 | 145,181 | 289,700 | 4,991,538 | 34,782 | 727,702 | (507,323 | ) | |||||||||||||||||||||||
MML Small/Mid Cap Value Fund, Initial Class | 195,748 | 52,064 | 63,335 | 184,477 | 2,440,628 | 13,841 | 160,360 | (37,006 | ) | |||||||||||||||||||||||
MML Total Return Bond Fund, Class II | 4,513,410 | 2,092,090 | 729,040 | 5,876,460 | 60,351,247 | 838,947 | - | (238,005 | ) | |||||||||||||||||||||||
Oppenheimer Discovery Mid Cap Growth Fund/VA, Non-Service Shares* | 40,579 | 8,031 | 11,367 | 37,243 | 2,705,704 | - | 241,978 | 26,489 | ||||||||||||||||||||||||
Oppenheimer Global Fund/VA, Non-Service Shares* | 217,899 | 69,565 | 57,643 | 229,821 | 8,048,345 | 84,845 | 537,798 | 33,093 | ||||||||||||||||||||||||
Oppenheimer Global Multi-Alternatives Fund/VA, Non-Service Shares* | 3,090,684 | 159,261 | - | 3,249,945 | 32,109,453 | 444,023 | - | - | ||||||||||||||||||||||||
Oppenheimer International Growth Fund/VA, Non-Service Shares* | 3,148,664 | 929,454 | 769,016 | 3,309,102 | 6,882,933 | 76,993 | 163,784 | (65,725 | ) | |||||||||||||||||||||||
|
|
|
|
|
|
|
| |||||||||||||||||||||||||
| $ | 477,703,700 | $ | 10,289,478 | $ | 15,195,866 | $ | (3,339,902 | ) | ||||||||||||||||||||||||
|
|
|
|
|
|
|
| |||||||||||||||||||||||||
Balanced Allocation Fund | ||||||||||||||||||||||||||||||||
MML Blue Chip Growth Fund, Initial Class | 1,712,363 | 297,182 | 483,953 | 1,525,592 | $ | 21,327,777 | $ | - | $ | 3,119,105 | $ | 1,316,912 | ||||||||||||||||||||
MML Dynamic Bond Fund, Class II | 6,262,802 | 390,112 | 252,260 | 6,400,654 | 63,302,467 | 1,873,230 | - | 65,588 | ||||||||||||||||||||||||
MML Equity Income Fund, Initial Class | 1,744,461 | 283,731 | 505,369 | 1,522,823 | 17,938,855 | 370,448 | 1,875,595 | 1,159,244 | ||||||||||||||||||||||||
MML Equity Index Fund, Class III | - | 344,598 | - | 344,598 | 9,135,303 | - | - | - | ||||||||||||||||||||||||
MML Focused Equity Fund, Class II | 863,712 | 111,864 | 148,845 | 826,731 | 10,912,847 | 157,248 | 675,819 | 143,875 | ||||||||||||||||||||||||
MML Foreign Fund, Initial Class | 1,578,092 | 361,007 | 171,739 | 1,767,360 | 16,683,879 | 281,491 | - | 98,541 | ||||||||||||||||||||||||
MML Fundamental Growth Fund, Class II | 1,356,886 | 237,355 | 259,083 | 1,335,158 | 15,247,502 | 107,505 | 1,886,689 | 73,980 | ||||||||||||||||||||||||
MML Fundamental Value Fund, Class II | 1,548,381 | 188,746 | 520,908 | 1,216,219 | 17,927,067 | 292,055 | 1,510,425 | 2,110,011 | ||||||||||||||||||||||||
MML Global Fund, Class I | 1,357,142 | 390,941 | 139,585 | 1,608,498 | 18,562,070 | 181,519 | 1,248,397 | 499,517 | ||||||||||||||||||||||||
MML High Yield Fund, Class II | 2,113,483 | 142,979 | 659,635 | 1,596,827 | 15,856,493 | 1,371,393 | - | (451,593 | ) | |||||||||||||||||||||||
MML Income & Growth Fund, Initial Class | 1,581,322 | 389,860 | 262,582 | 1,708,600 | 20,264,000 | 348,786 | 1,713,887 | 614,271 | ||||||||||||||||||||||||
MML Inflation-Protected and Income Fund, Initial Class | 2,006,442 | 257,689 | 171,771 | 2,092,360 | 21,300,226 | 496,675 | - | (180,626 | ) | |||||||||||||||||||||||
MML International Equity Fund, Class II | 1,688,153 | 103,779 | 328,981 | 1,462,951 | 13,649,330 | 284,232 | 31,779 | (339,239 | ) | |||||||||||||||||||||||
MML Large Cap Growth Fund, Initial Class | 1,417,002 | 187,920 | 1,017,061 | 587,861 | 6,248,966 | 18,911 | 1,313,637 | (1,327,017 | ) | |||||||||||||||||||||||
MML Managed Bond Fund, Initial Class | 8,462,758 | 1,090,830 | 1,324,710 | 8,228,878 | 100,739,121 | 2,917,099 | 461,527 | (652,226 | ) | |||||||||||||||||||||||
MML Mid Cap Growth Fund, Initial Class | 1,018,445 | 175,184 | 218,569 | 975,060 | 13,992,109 | - | 2,056,691 | 567,751 | ||||||||||||||||||||||||
61
Table of Contents
Notes to Financial Statements (Continued)
| Number of Shares Held as of 12/31/15 | Purchases | Sales | Number of Shares Held as of 12/31/16 | Value as of 12/31/16 | Dividend Income | Realized Gains Distributions | Net Realized Gain (Loss) | |||||||||||||||||||||||||
Balanced Allocation Fund (Continued) | ||||||||||||||||||||||||||||||||
MML Mid Cap Value Fund, Initial Class | 1,589,173 | 240,587 | 460,590 | 1,369,170 | $ | 16,142,518 | $ | 292,909 | $ | 1,765,005 | $ | 197,350 | ||||||||||||||||||||
MML Short-Duration Bond Fund, Class II | 2,144,780 | 1,256,046 | 509,767 | 2,891,059 | 28,187,825 | 515,012 | - | (159,916 | ) | |||||||||||||||||||||||
MML Small Cap Growth Equity Fund, Initial Class | 295,911 | 71,800 | 47,773 | 319,938 | 4,060,581 | - | 655,552 | (305,430 | ) | |||||||||||||||||||||||
MML Small Company Value Fund, Class II | 486,852 | 82,713 | 160,447 | 409,118 | 7,049,106 | 46,409 | 970,970 | (250,413 | ) | |||||||||||||||||||||||
MML Small/Mid Cap Value Fund, Initial Class | 385,482 | 59,726 | 91,685 | 353,523 | 4,677,114 | 25,920 | 300,309 | (75,429 | ) | |||||||||||||||||||||||
MML Total Return Bond Fund, Class II | 4,817,762 | 1,554,352 | 492,851 | 5,879,263 | 60,380,036 | 829,956 | - | 146,055 | ||||||||||||||||||||||||
Oppenheimer Discovery Mid Cap Growth Fund/VA, Non-Service Shares* | 73,033 | 8,018 | 15,926 | 65,125 | 4,731,357 | - | 407,069 | 23,996 | ||||||||||||||||||||||||
Oppenheimer Global Fund/VA, Non-Service Shares* | 346,047 | 59,643 | 51,306 | 354,384 | 12,410,533 | 128,828 | 816,594 | 293,363 | ||||||||||||||||||||||||
Oppenheimer Global Multi-Alternatives Fund/VA, Non-Service Shares* | 4,230,578 | 57,918 | 99,126 | 4,189,370 | 41,390,980 | 573,388 | - | (77,129 | ) | |||||||||||||||||||||||
Oppenheimer International Growth Fund/VA, Non-Service Shares* | 6,092,835 | 473,251 | 794,911 | 5,771,175 | 12,004,043 | 143,349 | 304,945 | (46,660 | ) | |||||||||||||||||||||||
|
|
|
|
|
|
|
| |||||||||||||||||||||||||
| $ | 574,122,105 | $ | 11,256,363 | $ | 21,113,995 | $ | 3,444,776 | |||||||||||||||||||||||||
|
|
|
|
|
|
|
| |||||||||||||||||||||||||
Moderate Allocation Fund |
| |||||||||||||||||||||||||||||||
MML Blue Chip Growth Fund, Initial Class | 8,184,941 | 1,159,406 | 1,349,971 | 7,994,376 | $ | 111,761,373 | $ | - | $ | 14,451,682 | $ | 5,562,839 | ||||||||||||||||||||
MML Dynamic Bond Fund, Class II | 19,891,309 | 1,451,680 | 128,943 | 21,214,046 | 209,806,917 | 6,065,453 | - | 33,525 | ||||||||||||||||||||||||
MML Equity Income Fund, Initial Class | 7,849,388 | 1,087,494 | 1,229,970 | 7,706,912 | 90,787,429 | 1,774,232 | 8,983,038 | 3,150,380 | ||||||||||||||||||||||||
MML Equity Index Fund, Class III | - | 1,443,633 | - | 1,443,633 | 38,270,712 | - | - | - | ||||||||||||||||||||||||
MML Focused Equity Fund, Class II | 5,314,303 | 497,148 | 1,899,781 | 3,911,670 | 51,634,038 | 968,158 | 4,160,945 | 2,262,940 | ||||||||||||||||||||||||
MML Foreign Fund, Initial Class | 7,686,617 | 1,279,632 | 455,579 | 8,510,670 | 80,340,727 | 1,398,979 | - | 311,107 | ||||||||||||||||||||||||
MML Fundamental Growth Fund, Class II | 6,304,428 | 935,899 | 735,808 | 6,504,519 | 74,281,602 | 511,199 | 8,971,386 | 357,392 | ||||||||||||||||||||||||
MML Fundamental Value Fund, Class II | 6,892,236 | 1,230,890 | 990,369 | 7,132,757 | 105,136,831 | 1,422,763 | 7,358,126 | 3,491,839 | ||||||||||||||||||||||||
MML Global Fund, Class I | 8,079,675 | 1,709,041 | 1,645,026 | 8,143,690 | 93,978,184 | 1,055,422 | 7,258,675 | 6,014,421 | ||||||||||||||||||||||||
MML High Yield Fund, Class II | 6,660,545 | 670,753 | 2,272,166 | 5,059,132 | 50,237,180 | 4,466,397 | - | (1,350,981 | ) | |||||||||||||||||||||||
MML Income & Growth Fund, Initial Class | 6,906,198 | 1,019,888 | 648,615 | 7,277,471 | 86,310,801 | 1,451,754 | 7,133,725 | 1,652,811 | ||||||||||||||||||||||||
MML Inflation-Protected and Income Fund, Initial Class | 7,044,413 | 837,746 | 411,023 | 7,471,136 | 76,056,166 | 1,773,292 | - | (316,967 | ) | |||||||||||||||||||||||
MML International Equity Fund, Class II | 8,224,169 | 649,640 | 2,264,161 | 6,609,648 | 61,668,017 | 1,413,714 | 158,061 | (2,249,840 | ) | |||||||||||||||||||||||
MML Large Cap Growth Fund, Initial Class | 6,659,363 | 684,064 | 4,265,260 | 3,078,167 | 32,720,915 | 88,614 | 6,155,670 | (4,715,521 | ) | |||||||||||||||||||||||
MML Managed Bond Fund, Initial Class | 27,926,248 | 1,747,037 | 2,500,448 | 27,172,837 | 332,653,833 | 9,783,987 | 1,533,191 | (1,016,761 | ) | |||||||||||||||||||||||
MML Mid Cap Growth Fund, Initial Class | 5,220,967 | 819,204 | 691,510 | 5,348,661 | 76,753,279 | - | 10,081,881 | 2,879,969 | ||||||||||||||||||||||||
MML Mid Cap Value Fund, Initial Class | 8,084,466 | 1,038,041 | 2,033,148 | 7,089,359 | 83,583,544 | 1,492,477 | 8,993,310 | 2,724,692 | ||||||||||||||||||||||||
MML Short-Duration Bond Fund, Class II | 7,835,240 | 4,056,426 | 1,598,925 | 10,292,741 | 100,354,227 | 1,822,818 | - | (564,148 | ) | |||||||||||||||||||||||
MML Small Cap Growth Equity Fund, Initial Class | 1,495,898 | 314,591 | 168,181 | 1,642,308 | 20,843,827 | - | 3,423,457 | (1,128,300 | ) | |||||||||||||||||||||||
MML Small Company Value Fund, Class II | 2,639,451 | 398,600 | 747,936 | 2,290,115 | 39,458,682 | 256,290 | 5,362,129 | (1,054,496 | ) | |||||||||||||||||||||||
MML Small/Mid Cap Value Fund, Initial Class | 1,746,669 | 379,636 | 377,395 | 1,748,910 | 23,138,079 | 130,219 | 1,508,707 | (221,405 | ) | |||||||||||||||||||||||
MML Strategic Emerging Markets Fund, Class II | 4,949,839 | 367,214 | 712,267 | 4,604,786 | 39,785,354 | 193,727 | - | (1,050,319 | ) | |||||||||||||||||||||||
MML Total Return Bond Fund, Class II | 15,791,998 | 4,222,961 | 1,074,875 | 18,940,084 | 194,514,661 | 2,946,324 | - | 434,037 | ||||||||||||||||||||||||
Oppenheimer Discovery Mid Cap Growth Fund/VA, Non-Service Shares* | 371,954 | 32,711 | 76,625 | 328,040 | 23,832,076 | - | 1,979,908 | 89,919 | ||||||||||||||||||||||||
Oppenheimer Global Fund/VA, Non-Service Shares* | 1,369,488 | 536,066 | 104,621 | 1,800,933 | 63,068,689 | 519,332 | 3,291,839 | 677,325 | ||||||||||||||||||||||||
Oppenheimer Global Multi-Alternatives Fund/VA, Non-Service Shares* | 18,158,610 | 251,812 | 188,918 | 18,221,504 | 180,028,457 | 2,492,933 | - | 24,151 | ||||||||||||||||||||||||
Oppenheimer International Growth Fund/VA, Non-Service Shares* | 16,540,251 | 4,793,006 | 1,436,117 | 19,897,140 | 41,386,052 | 392,737 | 835,464 | (84,987 | ) | |||||||||||||||||||||||
|
|
|
|
|
|
|
| |||||||||||||||||||||||||
| $ | 2,382,391,652 | $ | 42,420,821 | $ | 101,641,194 | $ | 15,913,622 | |||||||||||||||||||||||||
|
|
|
|
|
|
|
| |||||||||||||||||||||||||
62
Table of Contents
Notes to Financial Statements (Continued)
| Number of Shares Held as of 12/31/15 | Purchases | Sales | Number of Shares Held as of 12/31/16 | Value as of 12/31/16 | Dividend Income | Realized Gains Distributions | Net Realized Gain (Loss) | |||||||||||||||||||||||||
Growth Allocation Fund |
| |||||||||||||||||||||||||||||||
MML Blue Chip Growth Fund, Initial Class | 7,224,353 | 992,179 | 1,460,329 | 6,756,203 | $ | 94,451,718 | $ | - | $ | 12,741,127 | $ | 7,260,092 | ||||||||||||||||||||
MML Dynamic Bond Fund, Class II | 8,864,352 | 756,135 | 1,378,188 | 8,242,299 | 81,516,332 | 2,524,201 | - | 343,741 | ||||||||||||||||||||||||
MML Equity Income Fund, Initial Class | 5,960,113 | 830,186 | 1,028,701 | 5,761,598 | 67,871,628 | 1,320,000 | 6,683,239 | 2,340,890 | ||||||||||||||||||||||||
MML Equity Index Fund, Class III | - | 1,324,158 | - | 1,324,158 | 35,103,439 | - | - | - | ||||||||||||||||||||||||
MML Focused Equity Fund, Class II | 5,009,056 | 449,492 | 1,379,698 | 4,078,850 | 53,840,824 | 906,457 | 3,895,767 | 1,823,011 | ||||||||||||||||||||||||
MML Foreign Fund, Initial Class | 6,575,048 | 1,398,275 | 762,944 | 7,210,379 | 68,065,982 | 1,300,812 | - | 434,911 | ||||||||||||||||||||||||
MML Fundamental Growth Fund, Class II | 5,526,176 | 819,277 | 1,160,319 | 5,185,134 | 59,214,229 | 423,738 | 7,436,480 | 584,345 | ||||||||||||||||||||||||
MML Fundamental Value Fund, Class II | 5,259,437 | 908,885 | 861,607 | 5,306,715 | 78,220,986 | 1,104,596 | 5,712,656 | 3,830,922 | ||||||||||||||||||||||||
MML Global Fund, Class I | 7,587,562 | 983,385 | 1,618,480 | 6,952,467 | 80,231,464 | 1,011,967 | 6,959,815 | 6,873,673 | ||||||||||||||||||||||||
MML High Yield Fund, Class II | 1,709,366 | 119,377 | 450,703 | 1,378,040 | 13,683,936 | 1,145,989 | - | (293,778 | ) | |||||||||||||||||||||||
MML Income & Growth Fund, Initial Class | 4,641,511 | 2,080,008 | 722,745 | 5,998,774 | 71,145,461 | 1,121,328 | 5,510,057 | 1,734,716 | ||||||||||||||||||||||||
MML Inflation-Protected and Income Fund, Initial Class | 6,207,439 | 580,113 | 406,129 | 6,381,423 | 64,962,883 | 1,520,054 | - | (247,700 | ) | |||||||||||||||||||||||
MML International Equity Fund, Class II | 7,033,804 | 892,357 | 1,302,062 | 6,624,099 | 61,802,842 | 1,274,176 | 142,460 | (1,538,629 | ) | |||||||||||||||||||||||
MML Large Cap Growth Fund, Initial Class | 5,852,306 | 482,591 | 3,703,523 | 2,631,374 | 27,971,510 | 63,998 | 4,445,684 | 1,255,784 | ||||||||||||||||||||||||
MML Managed Bond Fund, Initial Class | 9,735,409 | 1,513,793 | 1,008,164 | 10,241,038 | 125,372,282 | 3,461,243 | 524,825 | (596,145 | ) | |||||||||||||||||||||||
MML Mid Cap Growth Fund, Initial Class | 4,928,272 | 727,325 | 792,018 | 4,863,579 | 69,792,352 | - | 9,136,006 | 5,591,000 | ||||||||||||||||||||||||
MML Mid Cap Value Fund, Initial Class | 6,623,031 | 1,011,480 | 1,584,537 | 6,049,974 | 71,329,196 | 1,126,317 | 6,786,916 | 5,535,203 | ||||||||||||||||||||||||
MML Short-Duration Bond Fund, Class II | 4,041,195 | 1,508,407 | 783,632 | 4,765,970 | 46,468,211 | 901,383 | - | (274,480 | ) | |||||||||||||||||||||||
MML Small Cap Growth Equity Fund, Initial Class | 1,310,125 | 257,617 | 203,896 | 1,363,846 | 17,309,649 | - | 2,863,061 | (928,703 | ) | |||||||||||||||||||||||
MML Small Company Value Fund, Class II | 2,231,233 | 302,564 | 581,388 | 1,952,409 | 33,640,005 | 197,662 | 4,135,499 | (264,912 | ) | |||||||||||||||||||||||
MML Small/Mid Cap Value Fund, Initial Class | 1,958,155 | 421,481 | 436,222 | 1,943,414 | 25,711,368 | 144,380 | 1,672,763 | (247,921 | ) | |||||||||||||||||||||||
MML Strategic Emerging Markets Fund, Class II | 4,892,264 | 587,283 | 634,890 | 4,844,657 | 41,857,835 | 187,097 | - | (1,290,858 | ) | |||||||||||||||||||||||
MML Total Return Bond Fund, Class II | 6,991,579 | 1,099,225 | 661,734 | 7,429,070 | 76,296,552 | 1,228,455 | - | 392,783 | ||||||||||||||||||||||||
Oppenheimer Discovery Mid Cap Growth Fund/VA, Non-Service Shares* | 353,340 | 28,957 | 73,924 | 308,373 | 22,403,281 | - | 1,801,541 | 36,910 | ||||||||||||||||||||||||
Oppenheimer Global Fund/VA, Non-Service Shares* | 1,041,496 | 587,271 | 87,341 | 1,541,426 | 53,980,750 | 387,435 | 2,455,796 | 565,690 | ||||||||||||||||||||||||
Oppenheimer Global Multi-Alternatives Fund/VA, Non-Service Shares* | 14,402,875 | 189,010 | 938,884 | 13,653,001 | 134,891,646 | 1,871,188 | - | 64,442 | ||||||||||||||||||||||||
Oppenheimer International Growth Fund/VA, Non-Service Shares* | 13,406,401 | 3,909,337 | 1,618,541 | 15,697,197 | 32,650,169 | 309,136 | 657,621 | (84,007 | ) | |||||||||||||||||||||||
|
|
|
|
|
|
|
| |||||||||||||||||||||||||
| $ | 1,609,786,530 | $ | 23,531,612 | $ | 83,561,313 | $ | 32,900,980 | |||||||||||||||||||||||||
|
|
|
|
|
|
|
| |||||||||||||||||||||||||
Aggressive Allocation Fund |
| |||||||||||||||||||||||||||||||
MML Blue Chip Growth Fund, Initial Class | 634,872 | 137,538 | 164,872 | 607,538 | $ | 8,493,383 | $ | - | $ | 1,093,500 | $ | 301,389 | ||||||||||||||||||||
MML Dynamic Bond Fund, Class II | 237,604 | 13,937 | 52,216 | 199,325 | 1,971,322 | 64,715 | - | 14,488 | ||||||||||||||||||||||||
MML Equity Income Fund, Initial Class | 534,057 | 117,650 | 90,385 | 561,322 | 6,612,376 | 124,679 | 631,257 | 158,176 | ||||||||||||||||||||||||
MML Equity Index Fund, Class III | - | 68,329 | - | 68,329 | 1,811,405 | - | - | - | ||||||||||||||||||||||||
MML Focused Equity Fund, Class II | 456,845 | 84,385 | 168,239 | 372,991 | 4,923,483 | 88,574 | 380,671 | 152,449 | ||||||||||||||||||||||||
MML Foreign Fund, Initial Class | 629,255 | 191,117 | 105,913 | 714,459 | 6,744,490 | 129,509 | - | 64,535 | ||||||||||||||||||||||||
MML Fundamental Growth Fund, Class II | 489,197 | 141,263 | 65,619 | 564,841 | 6,450,487 | 40,620 | 712,866 | 34,053 | ||||||||||||||||||||||||
MML Fundamental Value Fund, Class II | 466,188 | 236,271 | 109,491 | 592,968 | 8,740,349 | 125,114 | 647,052 | 361,776 | ||||||||||||||||||||||||
MML Global Fund, Class I | 667,387 | 149,075 | 124,236 | 692,226 | 7,988,287 | 93,084 | 640,186 | 347,300 | ||||||||||||||||||||||||
MML Income & Growth Fund, Initial Class | 413,791 | 231,778 | 53,432 | 592,137 | 7,022,740 | 104,674 | 514,354 | 108,823 | ||||||||||||||||||||||||
MML Inflation-Protected and Income Fund, Initial Class | 314,711 | 62,485 | 27,148 | 350,048 | 3,563,490 | 80,666 | - | (4,139 | ) | |||||||||||||||||||||||
MML International Equity Fund, Class II | 673,188 | 124,044 | 130,034 | 667,198 | 6,224,953 | 124,215 | 13,888 | (135,712 | ) | |||||||||||||||||||||||
MML Large Cap Growth Fund, Initial Class | 522,418 | 84,724 | 343,390 | 263,752 | 2,803,682 | 4,942 | 343,304 | (661,212 | ) | |||||||||||||||||||||||
MML Managed Bond Fund, Initial Class | 216,089 | 76,297 | 31,385 | 261,001 | 3,195,208 | 82,949 | 12,082 | 1,100 | ||||||||||||||||||||||||
MML Mid Cap Growth Fund, Initial Class | 483,289 | 109,166 | 75,578 | 516,877 | 7,417,192 | - | 944,976 | 187,077 | ||||||||||||||||||||||||
MML Mid Cap Value Fund, Initial Class | 660,236 | 156,044 | 175,104 | 641,176 | 7,559,467 | 116,000 | 698,993 | 72,647 | ||||||||||||||||||||||||
63
Table of Contents
Notes to Financial Statements (Continued)
| Number of Shares Held as of 12/31/15 | Purchases | Sales | Number of Shares Held as of 12/31/16 | Value as of 12/31/16 | Dividend Income | Realized Gains Distributions | Net Realized Gain (Loss) | |||||||||||||||||||||||||
Aggressive Allocation Fund (Continued) |
| |||||||||||||||||||||||||||||||
MML Short-Duration Bond Fund, Class II | 278,729 | 33,422 | 23,056 | 289,095 | 2,818,672 | 62,033 | - | (4,728 | ) | |||||||||||||||||||||||
MML Small Cap Growth Equity Fund, Initial Class | 132,887 | 44,980 | 22,897 | 154,970 | 1,966,841 | - | 315,205 | (213,494 | ) | |||||||||||||||||||||||
MML Small Company Value Fund, Class II | 221,501 | 46,142 | 58,803 | 208,840 | 3,598,307 | 20,519 | 429,302 | (122,025 | ) | |||||||||||||||||||||||
MML Small/Mid Cap Value Fund, Initial Class | 193,691 | 55,028 | 43,912 | 204,807 | 2,709,603 | 14,831 | 171,821 | (31,698 | ) | |||||||||||||||||||||||
MML Strategic Emerging Markets Fund, Class II | 503,233 | 103,849 | 74,493 | 532,589 | 4,601,568 | 20,492 | - | (127,933 | ) | |||||||||||||||||||||||
MML Total Return Bond Fund, Class II | 166,200 | 35,258 | 16,041 | 185,417 | 1,904,237 | 29,923 | - | (6,085 | ) | |||||||||||||||||||||||
Oppenheimer Discovery Mid Cap Growth Fund/VA, Non-Service Shares* | 35,731 | 6,369 | 6,956 | 35,144 | 2,553,210 | - | 189,870 | 12,494 | ||||||||||||||||||||||||
Oppenheimer Global Fund/VA, Non-Service Shares* | 91,900 | 71,093 | 8,589 | 154,404 | 5,407,235 | 35,593 | 225,613 | (14,488 | ) | |||||||||||||||||||||||
Oppenheimer Global Multi-Alternatives Fund/VA, Non-Service Shares* | 1,171,285 | 35,594 | 15,326 | 1,191,553 | 11,772,547 | 162,954 | - | 2,452 | ||||||||||||||||||||||||
Oppenheimer International Growth Fund/VA, Non-Service Shares* | 1,172,242 | 557,027 | 146,236 | 1,583,033 | 3,292,708 | 28,451 | 60,523 | (6,312 | ) | |||||||||||||||||||||||
|
|
|
|
|
|
|
| |||||||||||||||||||||||||
| $ | 132,147,242 | $ | 1,554,537 | $ | 8,025,463 | $ | 490,933 | |||||||||||||||||||||||||
|
|
|
|
|
|
|
| |||||||||||||||||||||||||
| * | Fund advised by OFI Global Asset Management, Inc. |
| 8. | Indemnifications |
Under the Funds’ organizational documents, current and former Trustees and Officers are provided with specified rights to indemnification against liabilities arising in connection with the performance of their duties to the Funds, and shareholders are indemnified against personal liability for obligations of the Funds. In the normal course of business, the Funds may also enter into contracts that provide general indemnifications. The Funds’ maximum exposure under these arrangements is unknown as this would be dependent on future claims that may be made against the Funds. The risk of material loss from such claims is considered remote.
| 9. | Subsequent Events |
In preparation of these financial statements, management has evaluated the events and transactions subsequent to December 31, 2016, through the date when the financial statements were issued, and determined that there are no subsequent events or transactions that would require adjustments to or disclosures in the Funds’ financial statements other than those disclosed below.
Elaine A. Sarsynski resigned as a Trustee of the Trust effective as of February 1, 2017.
64
Table of Contents
Report of Independent Registered Public Accounting Firm
To the Board of Trustees of MML Series Investment Fund and Shareholders of MML Conservative Allocation Fund, MML Balanced Allocation Fund, MML Moderate Allocation Fund, MML Growth Allocation Fund, MML Aggressive Allocation Fund, MML American Funds Growth Fund, MML American Funds International Fund, and MML American Funds Core Allocation Fund (collectively, the “Funds”):
We have audited the accompanying statements of assets and liabilities of the Funds, including the portfolios of investments, as of December 31, 2016, and the related statements of operations for the year then ended, the statements of changes in net assets for each of the two years in the period then ended, and the financial highlights for each of the periods presented. These financial statements and financial highlights are the responsibility of the Funds’ management. Our responsibility is to express an opinion on these financial statements and financial highlights based on our audits.
We conducted our audits in accordance with the standards of the Public Company Accounting Oversight Board (United States). Those standards require that we plan and perform the audit to obtain reasonable assurance about whether the financial statements and financial highlights are free of material misstatement. The Funds are not required to have, nor were we engaged to perform, an audit of their internal control over financial reporting. Our audits included consideration of internal control over financial reporting as a basis for designing audit procedures that are appropriate in the circumstances, but not for the purpose of expressing an opinion on the effectiveness of the Funds’ internal control over financial reporting. Accordingly, we express no such opinion. An audit also includes examining, on a test basis, evidence supporting the amounts and disclosures in the financial statements, assessing the accounting principles used and significant estimates made by management, as well as evaluating the overall financial statement presentation. Our procedures included confirmation of securities owned as of December 31, 2016, by correspondence with the custodian and transfer agents; when replies were not received from transfer agents, we performed other auditing procedures. We believe that our audits provide a reasonable basis for our opinion.
In our opinion, such financial statements and financial highlights referred to above present fairly, in all material respects, the financial position of each of the Funds as of December 31, 2016, the results of their operations for the year then ended, the changes in their net assets for each of the two years in the period then ended, and the financial highlights for each of the periods presented, in conformity with accounting principles generally accepted in the United States of America.
Deloitte & Touche LLP
Boston, Massachusetts
February 21, 2017
65
Table of Contents
Trustees and Officers (Unaudited)
The following table lists the Trust’s Trustees and Officers; their address and age; their position with the Trust; the length of time holding that position with the Trust; their principal occupation(s) during the past five years; the number of portfolios in the fund complex they oversee; and other directorships they hold in companies subject to registration or reporting requirements of the Securities Exchange Act of 1934 (generally called “public companies”) or in registered investment companies. The Trust’s Statements of Additional Information include additional information about the Trust’s Trustees and are available, without charge, upon request by calling 1-888-309-3539 or by writing MML Series Investment Fund, c/o Massachusetts Mutual Life Insurance Company, 100 Bright Meadow Blvd., Enfield, Connecticut 06082-1981, Attention: MassMutual U.S. Product and Marketing.
Disinterested Trustees
Name, Address*, and Age | Position(s) | Term of | Principal Occupation(s) | Number of Portfolios in Fund Complex Overseen by Trustee | Other Directorships Held by Trustee | |||||
Allan W. Blair Age: 68 | Trustee | Since 2003 | Retired; President and Chief Executive Officer (1996-2014), Economic Development Council of Western Massachusetts (non-profit development company); President and Chief Executive Officer (1984-2014), Westover Metropolitan Development Corporation (quasi-public development company). | 94 | Trustee (since 2003), MassMutual Select Funds (open-end investment company); Trustee (since 2012), MML Series Investment Fund II (open-end investment company); Trustee (since 2012), MassMutual Premier Funds (open-end investment company). | |||||
| Nabil N. El-Hage Age: 58 | Trustee | Since 2012
| Founder and sole member of PR Academy of Executive Education, LLC (since 2016); Chairman (2011-2016), Academy of Executive Education, LLC (predecessor to PR Academy of Executive Education, LLC). | 94 | Director (2011-2015), Argo Group International Holdings, Ltd. (underwriter of specialty insurance and reinsurance products); Trustee (since 2012), MassMutual Select Funds (open-end investment company); Trustee (since 2005), Chairman (2006-2012), MML Series Investment Fund II (open-end investment company); Trustee (since 2003), Chairman (2006-2012), MassMutual Premier Funds (open-end investment company). | |||||
| Maria D. Furman Age: 62 | Trustee | Since 2012 | Retired. | 94 | Trustee (since 2011), GMO Series Trust (open-end investment company); Trustee (since 2012), MassMutual Select Funds (open-end investment company); Trustee (since 2005), MML Series Investment Fund II (open-end investment company); Trustee (since 2004), MassMutual Premier Funds (open-end investment company). | |||||
R. Alan Hunter, Jr. Age: 70 | Chairperson
Trustee | Since 2016
Since 2003 | Retired. | 94 | Director (since 2007), Actuant Corporation (diversified industrial company); Chairperson (since 2016), Trustee (since 2003), MassMutual Select Funds (open-end investment company); Chairperson (since 2016), Trustee (since 2012), MML Series Investment Fund II (open-end investment company); Chairperson (since 2016), Trustee (since 2012), MassMutual Premier Funds (open-end investment company). | |||||
66
Table of Contents
Trustees and Officers (Unaudited) (Continued)
Name, Address*, and Age | Position(s) | Term of | Principal Occupation(s) | Number of Portfolios in Fund Complex Overseen by Trustee | Other Directorships | |||||
| C. Ann Merrifield Age: 65 | Trustee | Since 2012 | Retired; President and Chief Executive Officer (2012-2014), PathoGenetix (genomics company). | 94 | Director (since 2015), Juniper Pharmaceuticals Inc. (specialty pharmaceutical company); Director (since 2014), Flexion Therapeutics (specialty pharmaceutical company); Director (since 2014), InVivo Therapeutics (research and clinical-stage biomaterials and biotechnology company); Trustee (since 2012), MassMutual Select Funds (open-end investment company); Trustee (since 2005), MML Series Investment Fund II (open-end investment company); Trustee (since 2004), MassMutual Premier Funds (open-end investment company). | |||||
Susan B. Sweeney Age: 64 | Trustee | Since 2009 | Retired; Senior Vice President and Chief Investment Officer (2010-2014), Selective Insurance Group (property and casualty company). | 96^ | Trustee (since 2012), Barings Corporate Investors (closed-end investment company); Trustee (since 2012), Barings Participation Investors (closed-end investment company); Trustee (since 2009), MassMutual Select Funds (open-end investment company); Trustee (since 2012), MML Series Investment Fund II (open-end investment company); Trustee (since 2012), MassMutual Premier Funds (open-end investment company). | |||||
67
Table of Contents
Trustees and Officers (Unaudited) (Continued)
Interested Trustee
Name, Address*, and Age | Position(s) | Term of | Principal Occupation(s) | Number of Portfolios in Fund Complex Overseen by Trustee | Other Directorships | |||||
Robert E. Joyal^^ Age: 71 | Trustee | Since 2003 | Retired. | 96^ | Director (since 2013), Leucadia National Corporation (holding company); Director (since 2012), Ormat Technologies, Inc. (provider of alternative and renewable energy technology); Director (2006-2014), Jefferies Group LLC (investment bank); Trustee (since 2003), Barings Corporate Investors (closed-end investment company); Trustee (since 2003), Barings Participation Investors (closed-end investment company); Trustee (since 2003), MassMutual Select Funds (open-end investment company); Trustee (since 2012), MML Series Investment Fund II (open-end investment company); Trustee (since 2012), MassMutual Premier Funds (open-end investment company). |
Principal Officers who are Not Trustees
Name, Address*, and Age | Position(s) Held | Term of Office# and Length of Time Served | Principal Occupation(s) During Past 5 Years | Number of Portfolios in Fund Complex Overseen by Officer | ||||
| Michael C. Eldredge Age: 52 | Vice President | Since 2009 | Head of Asset Allocation Funds (since 2016), portfolio manager (2014-2016), Head of Investments (2014-2016), MML Advisers; Vice President (since 2008), MassMutual; Vice President (since 2009), MassMutual Select Funds (open-end investment company); Vice President (since 2009), MML Series Investment Fund II (open-end investment company); Vice President (since 2009), MassMutual Premier Funds (open-end investment company). | 94 | ||||
Andrew M. Goldberg Age: 50 | Vice President, Secretary, and Chief Legal Officer
Assistant Secretary
| Since 2008
(2001- | Assistant Vice President and Counsel (since 2004), MassMutual; Secretary (since 2015), Assistant Secretary (2013-2015), MML Advisers; Vice President, Secretary, and Chief Legal Officer (since 2008), Assistant Secretary (2001-2008), MassMutual Select Funds (open-end investment company); Vice President, Secretary, (formerly known as “Clerk”), and Chief Legal Officer (since 2008), Assistant Clerk (2005-2008), MML Series Investment Fund II (open-end investment company); Vice President, Secretary, (formerly known as “Clerk”), and Chief Legal Officer (since 2008), Assistant Clerk (2004-2008), MassMutual Premier Funds (open-end investment company). | 94 | ||||
Brian K. Haendiges Age: 56 | President Vice President
| Since 2016 (2014- | Vice President (since 2014), MML Advisers; Senior Vice President (since 2014), Vice President (2010-2014), MassMutual; Vice President (since 2014), MassMutual Select Funds (open-end investment company); President (since 2016), Vice President (2014-2016), MML Series Investment Fund II (open-end investment company); Vice President (since 2014), MassMutual Premier Funds (open-end investment company). | 94 | ||||
Renee Hitchcock Age: 46 | Chief Financial Officer and Treasurer
Assistant Treasurer | Since 2016
2007- | Assistant Vice President (since 2015), Director (2007-2015), MassMutual; Chief Financial Officer and Treasurer (since 2016), Assistant Treasurer (2007-2016), MassMutual Select Funds (open-end investment company); Chief Financial Officer and Treasurer (since 2016), Assistant Treasurer (2007-2016), MML Series Investment Fund II (open-end investment company); Chief Financial Officer and Treasurer (since 2016), Assistant Treasurer (2007-2016), MassMutual Premier Funds (open-end investment company). | 94 | ||||
68
Table of Contents
Trustees and Officers (Unaudited) (Continued)
Name, Address*, and Age | Position(s) Held | Term of Office# and Length of Time Served | Principal Occupation(s) During Past 5 Years | Number of Portfolios in Fund Complex Overseen by Officer | ||||
Douglas Steele Age: 41 | Vice President | Since 2016 | Head of Investment Due Diligence (since 2016), MML Advisers; Assistant Vice President (since 2013), Investment Director (2005-2013), MassMutual; Vice President (since 2016), MassMutual Select Funds (open-end investment company); Vice President (since 2016), MML Series Investment Fund II (open-end investment company); Vice President (since 2016), MassMutual Premier Funds (open-end investment company). | 94 | ||||
Philip S. Wellman Age: 52 | Vice President and Chief Compliance Officer | Since 2007 | Vice President and Chief Compliance Officer (since 2013), MML Advisers; Vice President, Associate General Counsel, and Chief Compliance Officer (Mutual Funds) (since 2014), Vice President, Associate General Counsel, and Chief Compliance Officer (Mutual Funds and Investment Advisory) (2008-2014), MassMutual; Vice President and Chief Compliance Officer (since 2007), MassMutual Select Funds (open-end investment company); Vice President and Chief Compliance Officer (since 2007), MML Series Investment Fund II (open-end investment company); Vice President and Chief Compliance Officer (since 2007), MassMutual Premier Funds (open-end investment company). | 94 | ||||
Eric H. Wietsma Age: 50 | Vice President | Since 2006 | Director and President (since 2013), MML Advisers; Senior Vice President (since 2010), MassMutual; President (since 2008), Vice President (2006-2008), MassMutual Select Funds (open-end investment company); Vice President (since 2006), MML Series Investment Fund II (open-end investment company); President (since 2008) Vice President (2006-2008), MassMutual Premier Funds (open-end investment company). | 94 | ||||
Tina Wilson Age: 46 | Vice President | Since 2016 | Vice President and Head of Investments (since 2016), MML Advisers; Senior Vice President (since 2014), Vice President (2009-2014), MassMutual; Vice President (since 2016), MassMutual Select Funds (open-end investment company); Vice President (since 2016), MML Series Investment Fund II (open-end investment company); Vice President (since 2016), MassMutual Premier Funds (open-end investment company). | 94 | ||||
| * | The address of each Trustee and Principal Officer is the same as that for the Trust; 100 Bright Meadow Blvd., Enfield, CT 06082-1981. |
| ** | Each Trustee of the Trust serves until the next meeting of shareholders called for the purpose of electing Trustees and until the election and qualification of his or her successor or until he or she dies, resigns, or is removed. Notwithstanding the foregoing, unless the Trustees determine that it is desirable and in the best interest of the Trust that an exception to the retirement policy of the Trust be made, a Trustee shall retire and cease to serve as a Trustee upon the conclusion of the calendar year in which such Trustee attains the age of seventy-two years. |
| The Chairperson is elected to hold such office for a term of three years or until their successor is elected and qualified to carry out the duties and responsibilities of their office, or until he or she retires, dies, resigns, is removed, or becomes disqualified. The Chairperson shall hold office at the pleasure of the Trustees. |
| ^ | Barings Participation Investors and Barings Corporate Investors are deemed to be a part of the Fund Complex, because they are managed by Barings LLC (formerly known as Babson Capital Management LLC), an affiliate of MML Advisers. |
| ^^ | Mr. Joyal is an “Interested Person,” as that term is defined in the 1940 Act, through his position as a director of Leucadia National Corporation, which controls Jefferies Group LLC, a broker-dealer that may execute portfolio transactions and/or engage in principal transactions with the Funds, other investment companies advised by MML Advisers or holding themselves out to investors as related companies for purposes of investment or investor services, or any other advisory accounts over which MML Advisers has brokerage placement discretion. |
| # | The President, Treasurer, and Secretary and such other officers as the Trustees may in their discretion from time to time elect are elected to hold such office until their successor is elected and qualified to carry out the duties and responsibilities of their office, or until he or she dies, resigns, is removed, or becomes disqualified. Each officer shall hold office at the pleasure of the Trustees. |
69
Table of Contents
Federal Tax Information (Unaudited)
For corporate shareholders, a portion of the ordinary dividends paid during the Fund(s)’ year ended December 31, 2016, qualified for the dividends received deduction, as follows:
| Dividends Received Deductions | ||||
Conservative Allocation Fund | 15.46% | |||
Balanced Allocation Fund | 19.23% | |||
Moderate Allocation Fund | 24.24% | |||
Growth Allocation Fund | 33.02% | |||
Aggressive Allocation Fund | 97.03% | |||
American Funds Core Allocation Fund | 46.59% | |||
For the year ended December 31, 2016, the following Fund(s) earned the following foreign sources of income:
| Amount | ||||
Conservative Allocation Fund | $ | 268,416 | ||
Balanced Allocation Fund | 424,685 | |||
Moderate Allocation Fund | 2,277,636 | |||
Growth Allocation Fund | 2,090,491 | |||
Aggressive Allocation Fund | 207,548 | |||
American Funds International Fund | 5,173,408 | |||
American Funds Core Allocation Fund | 27,311,377 | |||
70
Table of Contents
A description of the policies and procedures that each Fund’s investment adviser uses to vote proxies relating to the Fund’s portfolio securities is available, without charge, upon request, by calling 1-888-309-3539, and on the SEC’s EDGAR database on its website at http://www.sec.gov.
Information regarding how the Funds voted proxies relating to portfolio securities during the most recent 12-month period ended June 30 is available, without charge, upon request, on the MassMutual website at http://www.massmutual.com/funds and on the SEC’s EDGAR database on its website at http://www.sec.gov.
The Funds file their complete schedule of portfolio holdings with the SEC for the first and third quarters of each fiscal year on Form N-Q. The Funds’ Forms N-Q are available on the SEC’s EDGAR database on its website at http://www.sec.gov and may be reviewed and copied at the SEC’s Public Reference Room in Washington D.C. Information on the operation of the SEC’s Public Reference Room may be obtained by calling 1-800-SEC-0330.
71
Table of Contents
Other Information (Unaudited) (Continued)
Fund Expenses December 31, 2016
Expense Examples:
The following information is in regards to expenses for the six months ended December 31, 2016:
As a shareholder of the Funds, you incur ongoing costs, including advisory fees, distribution and/or service (12b-1) fees, and other Fund expenses. These examples are intended to help you understand your ongoing costs (in dollars) of investing in the Funds and to compare these costs with the ongoing costs of investing in other mutual funds. These examples are based on an investment of $1,000 invested for the six months ended December 31, 2016.
Actual Expenses:
The first four columns of the table below provide information about actual account values and actual expenses. You may use this information, together with the amount you invested, to estimate the expenses that you paid over the period. Simply divide your account value by $1,000 (for example, an $8,600 account value divided by $1,000 = 8.6), then multiply the result by the number under the heading entitled “Operating Expenses Incurred” to estimate the expenses you paid on your account during this period.
Hypothetical Example for Comparison Purposes:
The last two columns of the table below provide information about hypothetical account values and hypothetical expenses based on the Fund’s actual expense ratio and an assumed rate of return of 5% per year before expenses, which is not the Fund’s actual return. The hypothetical account values and expenses may not be used to estimate the actual ending account balance or expenses you paid for the period. You may use this information to compare the ongoing costs of investing in the Fund and other funds. To do so, compare this 5% hypothetical example with the 5% hypothetical examples that appear in the shareholder reports of the other funds.
Please note that the expenses shown in the table are meant to highlight your ongoing costs only and do not reflect any transactional costs. Therefore, the last two columns of the table are useful in comparing ongoing costs only, and will not help you determine the relative total costs of owning different funds. In addition, if these transactional costs were included, your costs would have been higher.
| Beginning Value | Annualized Expense Ratio | Ending Value (Based on Actual Returns and Expenses) | Operating Expenses Incurred* | Ending Value (Based on Hypothetical Returns and Expenses) | Operating Expenses Incurred* | |||||||||||||||||||
| Conservative Allocation Fund | ||||||||||||||||||||||||
Initial Class | $ | 1,000 | 0.12 | % | $ | 1,025.50 | $ | 0.61 | $ | 1,024.50 | $ | 0.61 | ||||||||||||
Service Class | 1,000 | 0.37 | % | 1,023.30 | 1.88 | 1,023.30 | 1.88 | |||||||||||||||||
| Balanced Allocation Fund | ||||||||||||||||||||||||
Initial Class | 1,000 | 0.12 | % | 1,033.70 | 0.61 | 1,024.50 | 0.61 | |||||||||||||||||
Service Class | 1,000 | 0.37 | % | 1,032.30 | 1.89 | 1,023.30 | 1.88 | |||||||||||||||||
| Moderate Allocation Fund | ||||||||||||||||||||||||
Initial Class | 1,000 | 0.11 | % | 1,043.40 | 0.57 | 1,024.60 | 0.56 | |||||||||||||||||
Service Class | 1,000 | 0.36 | % | 1,043.20 | 1.85 | 1,023.30 | 1.83 | |||||||||||||||||
| Growth Allocation Fund | ||||||||||||||||||||||||
Initial Class | 1,000 | 0.11 | % | 1,057.20 | 0.57 | 1,024.60 | 0.56 | |||||||||||||||||
Service Class | 1,000 | 0.36 | % | 1,054.70 | 1.86 | 1,023.30 | 1.83 | |||||||||||||||||
| Aggressive Allocation Fund | ||||||||||||||||||||||||
Initial Class | 1,000 | 0.15 | % | 1,071.60 | 0.78 | 1,024.40 | 0.76 | |||||||||||||||||
Service Class | 1,000 | 0.40 | % | 1,071.00 | 2.08 | 1,023.10 | 2.03 | |||||||||||||||||
72
Table of Contents
Other Information (Unaudited) (Continued)
| Beginning Value | Annualized Expense Ratio | Ending Value (Based on Actual Returns and Expenses) | Operating Expenses Incurred* | Ending Value (Based on Hypothetical Returns and Expenses) | Operating Expenses Incurred* | |||||||||||||||||||
| American Funds Growth Fund | ||||||||||||||||||||||||
Service Class I** | $ | 1,000 | 1.04 | % | $ | 1,081.90 | $ | 5.44 | $ | 1,019.90 | $ | 5.28 | ||||||||||||
| American Funds International Fund | ||||||||||||||||||||||||
Service Class I** | 1,000 | 1.24 | % | 1,044.90 | 6.37 | 1,018.90 | 6.29 | |||||||||||||||||
| American Funds Core Allocation Fund | ||||||||||||||||||||||||
Service Class I | 1,000 | 0.71 | % | 1,038.10 | 3.64 | 1,021.60 | 3.61 | |||||||||||||||||
| * | Expenses are calculated using the annualized expense ratio for the six months ended December 31, 2016, multiplied by the average account value over the period, multiplied by 184 days in the period, divided by 366 days in the year, unless stated otherwise. The annualized expense ratio does not reflect expenses deducted under the variable life insurance or variable annuity contract through which the Funds are invested in. Inclusion of these expenses would increase the annualized expense ratios shown. |
| ** | The annualized expense ratio reflects the expenses of both the Feeder Fund and the Master Fund in which it invests. |
73
Table of Contents
Underwriter: MML Distributors, LLC 100 Bright Meadow Blvd. Enfield, CT 06082-1981 |  |

| ©2017 Massachusetts Mutual Life Insurance Company, Springfield, MA 01111-0001. All rights reserved. www.massmutual.com. MassMutual Financial Group is a marketing name for Massachusetts Mutual Life Insurance Company (MassMutual) and its affiliated companies and sales representatives. Investment Adviser: MML Investment Advisers, LLC | RS-41635-00 |
Table of Contents
Table of Contents
| 1 | ||||
| 3 | ||||
| 6 | ||||
Portfolio of Investments | ||||
| 63 | ||||
| 66 | ||||
| 69 | ||||
| 76 | ||||
| 77 | ||||
| 79 | ||||
| 82 | ||||
| 85 | ||||
| 87 | ||||
| 89 | ||||
| 92 | ||||
| 94 | ||||
| 96 | ||||
| 104 | ||||
| 107 | ||||
| 110 | ||||
| 114 | ||||
| 118 | ||||
| 121 | ||||
| 130 | ||||
| 142 | ||||
| 148 | ||||
| 161 | ||||
| 180 | ||||
| 214 | ||||
| 215 | ||||
| 219 | ||||
| 220 | ||||
| 220 | ||||
| 220 | ||||
| 222 | ||||
This material must be preceded or accompanied by a current prospectus (or summary prospectus, if available) for the MML Series Investment Fund. Investors should consider a Fund’s investment objective, risks, and charges and expenses carefully before investing. This and other information about the investment company is available in the prospectus (or summary prospectus, if available). Read it carefully before investing.
Table of Contents
MML Series Investment Fund – President’s Letter to Shareholders (Unaudited)
To Our Shareholders

Brian Haendiges
“MassMutual believes that changing market conditions are a way of life for retirement investors – but these same conditions have the potential to reward patient investors who maintain a long-term perspective, instead of reacting to short-term market movements.”
December 31, 2016
Continued strength in U.S. markets in a challenging market environment
I am pleased to present you with the MML Series Investment Fund Annual Report, covering the year ended December 31, 2016 (the “fiscal year”). Domestic stocks outperformed most international equities during the fiscal year, as a strong market environment in the U.S. accelerated. Much of the strength occurred late in the reporting period, due to the surprising Republican victory in the race for the White House – as investors were buoyed by President-elect Trump’s promises for tax abatements and infrastructure spending. Economic difficulties elsewhere in the world – such as the challenging interest rate environment in Japan, uncertainty in Europe and the United Kingdom’s surprising Brexit vote that ratified an eventual exit from the European Union – had virtually no impact on U.S. stock indexes. Nevertheless, during the reporting period, recurring market volatility served as a general reminder for investors that market conditions are cyclical and can change anytime.
In MassMutual’s view, the ongoing uncertainties in markets today highlight the importance of taking a long-term perspective and not reacting to current events or short-term market changes. We also believe retirement investors who follow certain investment guidelines, such as the ones below, may increase their chances of reaching their retirement income goals.
Suggestions for retirement investors under any market conditions
Contribute as much as you can
While it is impossible to control your investments’ performance, you can control how often and how much you save. Contributing to your retirement account on a regular basis and increasing your contribution level as often as you are able, may be one way to help you realize your long-term investment objectives.*
Continue to invest
Some of the most sophisticated investors believe that individuals who can withstand a market downturn have the potential to be rewarded by accumulating larger positions at more favorable prices (relative to those who do not continue investing during a down market). That’s why most financial professionals believe it’s important to stay in the market, regardless of short-term results.
Time may be on your side
For most people, investing for retirement occurs over many decades. While retirement investors often know that the financial markets will be volatile from time to time, seasoned investors tend to understand the wisdom of taking a long-term approach. They know that this can help them navigate the market’s downturns, leverage its upturns, and successfully grow their account balances.
Monitor your asset allocation and diversify
Stocks, bonds, and short-term/money market investments are investment types that typically behave differently depending upon the economic and market environment. Each of these categories contains
| * | Systematic investing and asset allocation do not ensure a profit or protect against loss in a declining market. Systematic investing involves continuous investment in securities regardless of fluctuating price levels. Investors should consider their ability to continue investing through periods of low price levels. |
(Continued)
1
Table of Contents
MML Series Investment Fund – President’s Letter to Shareholders (Unaudited) (Continued)
an even greater array of sub-categories, such as small-cap stocks, international stocks, and high-yield bonds. Many financial professionals believe that investors can take advantage of different opportunities in the market and reduce the risk of over-exposure to one or two poorly performing investment types by maintaining a portfolio that includes a mix of investment types and sub-categories.
Make informed choices and seek professional guidance
Many financial advisors will suggest that retirement investors select an appropriate combination of investments that aligns with their retirement income goals. Doing so can help you weather the inevitable ups and downs of the markets.
For retirement investors who work with a financial professional
If you work with a financial professional, this may be an excellent time to contact him or her for assistance in assessing whether or not you:
| • | are saving enough for retirement based on your long-term needs; |
| • | are invested properly, based on your goals and objectives and where you are in your retirement planning journey; and |
| • | feel you are taking the right steps to help reduce the risk you could outlive your retirement savings. |
Protect who matters most
MassMutual believes that nothing matters more than the safety and well-being of your loved ones. That’s why we have always been committed to helping our customers put themselves on the path to a more secure financial future. And it’s why we have always encouraged retirement investors to maintain perspective over the long term. In our view, changing market conditions are a way of life for retirement investors, but these same conditions have the potential to reward patient investors who maintain a long-term perspective, instead of reacting to short-term market movements. Thank you for your continued trust in MassMutual.
Sincerely,

Brian Haendiges
President
The information provided is the opinion of MassMutual Funds Investment Management Group as of 1/1/17 and is subject to change without notice. It is not to be construed as tax, legal or investment advice. Of course, past performance does not guarantee future results.
2
Table of Contents
MML Series Investment Fund – Economic and Market Overview (Unaudited)
December 31, 2016
Economic Overview and Market Commentary
We note three significant and unexpected events that were followed by meaningful market movements in 2016. The first followed Federal Reserve (Fed) Board Chair Janet Yellen’s testimony before the U.S. Senate Committee on Banking, Housing, and Urban Affairs on February 11, 2016, where she confirmed a “slower for longer” plan for interest rate hikes going forward. The second followed the United Kingdom’s surprising June 23 referendum to leave the European Union – commonly referred to as “Brexit” (an abbreviation for “British exit”). The third followed Donald J. Trump’s election as the 45th President of the United States on November 8.
Throughout 2016, the initially sluggish domestic economy started to return more positive reports as modest gross domestic product (GDP) estimates were revised upward. (GDP reflects the total value of goods and services produced in the United States.) Investors responded favorably and domestic equity markets delivered broad positive returns for the fiscal year. Equity returns in the foreign and emerging markets ended the year more mixed.
For the year, the Dow Jones Industrial AverageSM (Dow) grew 16.50% and the broader S&P 500® Index (S&P 500) of large-capitalization U.S. stocks gained 11.96%. The technology-focused NASDAQ Composite® Index managed an 8.87% return, as tech stocks lagged the other indexes following the U.S. election. Small-cap equities outperformed for the year, with the Russell 2000® Index of small-capitalization stocks adding 21.31%. In foreign markets, the MSCI EAFE® Index, a barometer for foreign stocks in developed markets, gained only 1.00%, though the MSCI Emerging Markets Index, a measure of the performance of emerging stock markets throughout the world, rose 11.19%.* While developed foreign markets struggled under the weight of Brexit and longer-term fiscal burdens, emerging markets derived more of their value from domestic interactions and benefited more from that alignment.
Bonds performed well for much of the year, but dropped sharply following the U.S. election, as investors tried to anticipate what political policy might mean for bond markets in 2017 and beyond. The Bloomberg Barclays U.S. Aggregate Bond Index, a broad measure of the U.S. investment-grade bond markets, rose as much as 6% in July, but ended the year up only 2.65%. The performance of shorter-term debt investments continued to reflect the unrelenting low interest rate environment. Yields on the 2-year U.S. Treasury bond closed the year at 1.19%, while 10-year Treasury bonds yielded 2.44% at year end. These higher year-over-year yields reflect the turbulence in the fixed-income markets following the U.S. election. A “risk-on” environment developed as the year unfolded and high-yield bonds benefited. The Bloomberg Barclays U.S. Corporate High-Yield Index, which measures the performance of fixed-rate, below-investment-grade debt from corporate sectors, returned 17.13%.*
These returns were not without market volatility and surprises, however. Before rebounding, major indexes fell sharply through January and into February – until the Fed’s announcement triggered a more sustained period of growth. Markets stuttered briefly in May over concerns that Apple might not be able to sustain its growth in the smartphone market. Following a brief post-Brexit drop in late June, neither the surprising Brexit outcome nor global economic turbulence could disrupt the upward momentum in U.S. markets. Particularly noteworthy is the fact that domestic equity markets added nearly half of their annual returns in the final seven weeks of the year, as investors cheered President-elect Trump’s promises for tax abatements and infrastructure spending.
Q1 2016 – The inflection point
Headwinds affecting markets in late 2015 continued into January and early February of 2016. China’s slowing economy and falling crude oil prices, along with a weak January employment report, stoked fears that a U.S. recession could be on the near-term horizon. By February 11, the S&P 500 had dropped to 1,810. At this point, Fed Chair Janet Yellen signaled that the central bank would be patient in beginning to normalize policy interest rates and that it was unlikely that economic conditions would warrant an increase in the target range for the federal funds rate for at least the next few Open Market Committee meetings. (The federal funds rate is the interest rate that banks and financial institutions charge each other for borrowing funds overnight.)
| * | Indexes are unmanaged, do not incur fees or expenses and cannot be purchased directly for investment. |
3
Table of Contents
MML Series Investment Fund – Economic and Market Overview (Unaudited) (Continued)
Headwinds ultimately shifted to tailwinds. The S&P 500 gained nearly 250 points by the end of the first quarter, initiating a rally that would more or less be sustained throughout the second and third quarters of 2016. The employment picture improved, as February’s non-farm payrolls came in stronger than the previous two months, and December 2015 and January 2016 payroll numbers were revised upward. Once again, the quarter recovered what it had lost and ended essentially where it started the year. Despite this, the climate had changed.
Q2 2016 – Domestic markets override negative interest rates and Brexit
While Britain’s historic Brexit vote dominated news at the end of the second quarter, the unusual arrival of negative interest rates for Japan’s sovereign debt proved puzzling for many investors early in the quarter. Both seemed to feed a “flight to quality” reaction that resulted in a stronger U.S. dollar. Neither event, however, derailed the strengthening U.S. economy. By the end of the second quarter, concerns about China’s economy and falling oil prices moderated. U.S. GDP firmed up and the Fed softened its interest rate strategy, taking a more cautious approach. May’s disappointing jobs report created investor concerns that the Fed could seriously consider suspending any interest rate hikes for at least a year. Nevertheless, the quarter ended with broad-based gains across a variety of asset classes, improved consumer spending, low unemployment rates, and better-than-expected corporate earnings reports.
On June 23, global economic focus shifted to the United Kingdom. The Brexit vote pushed European stocks more deeply into negative territory on concerns that the immediate impact might slow growth in the U.K. and the larger European region. Investors also worried that the British vote might encourage other countries to follow suit. Interestingly, emerging market and Pacific country stocks delivered positive returns for the quarter and year-to-date.
Q3 2016 – Campaign rhetoric overshadows economic momentum
By the end of July, it seemed markets had shrugged off Brexit fears. The U.S. economy was gathering steam, as evidenced on several fronts. The U.S. labor market continued to show strength as job openings rose in June and hiring increased. U.S. consumer confidence hit a 12-month high in August, according to the Conference Board’s Consumer Confidence Index®, which reflected improved consumer assessment of economic conditions and the six-month economic outlook. Corporate earnings came in better than expected for the second consecutive quarter, even though it was the fifth consecutive declining quarter. In mid-September, the U.S. Census Bureau announced that real median household income had jumped 5%, the biggest annual increase since they first started gathering this data in 1968. The two major U.S. presidential candidates accepted their party’s nominations in July. As September came to a close, it became more evident that the upcoming election would be both hotly contested and divisive.
Q4 2016 – The Fed takes a back seat
Prior to the November elections, the Fed held the throttle on the markets. In October, speculation about the next rate hike (whether it would happen before the end of the year and how frequently subsequent rate hikes might occur) dominated investor thinking. At the same time, increasingly heated campaign rhetoric served as a drag while investors tried to figure out what the next four years might look like in either case. On the morning following the U.S. election, market futures pointed sharply downward, as the widely expected presidential winner, Hillary Clinton, conceded electoral vote defeat to Donald J. Trump. When markets opened on November 9, buyers surged, however, as investors anticipated the economic impacts of the President-elect delivering on his pro-business and pro-domestic campaign rhetoric. This buoyant investor sentiment launched a year-end rally that pushed the S&P 500 up 5.3% by year-end, with nearly half of the Index’s 11.96% return occurring in the last seven weeks of the year. In December, the Fed did, indeed, raise policy interest rates, but the market throttle now appeared to be in other hands.
Going into 2017, markets have yet to digest the upcoming Trump presidency in an environment where the Fed is forecasting multiple rate hikes. Turning to the global stage, by the end of March 2017, Britain’s Prime Minister, Theresa May, plans to trigger Article 50 of the Lisbon Treaty, which would initiate the two-year process of withdrawing the U.K. from the European Union. Terrorism and military posturing add further tensions to the global environment.
Domestic equity markets delivered solid returns for investors in 2016, but investors endured a steady stream of uncertainty, surprises and volatility throughout. Long-term investors with a view to saving for retirement income pay attention to such things,
4
Table of Contents
MML Series Investment Fund – Economic and Market Overview (Unaudited) (Continued)
but maintain a thoughtful and disciplined response to them. Many retirement investors wisely subscribe to the value of a well-diversified portfolio, using an appropriate mix of available strategies to benefit from market expansions and mitigate the risks inherent in unexpected events.
The information provided is the opinion of MassMutual Funds Investment Management Group as of 12/31/16 and is subject to change without notice. It is not to be construed as tax, legal or investment advice. Of course, past performance does not guarantee future results.
5
Table of Contents
MML Blue Chip Growth Fund – Portfolio Manager Report (Unaudited)
What is the investment approach of MML Blue Chip Growth Fund, and who is the Fund’s subadviser?
The Fund seeks long-term capital growth. Income is a secondary objective. Under normal circumstances, the Fund invests at least 80% of net assets (plus the amount of any borrowings for investment purposes) in the common stocks of large- and medium-sized blue chip growth companies. The Fund’s subadviser currently defines blue chip growth companies to mean firms that, in its view, are well-established in their industries and have the potential for above-average earnings growth. The Fund’s subadviser is T. Rowe Price Associates, Inc. (T. Rowe Price).
How did the Fund perform during the 12 months ended December 31, 2016?
The Fund’s Initial Class shares returned 0.91%, underperforming, by a wide margin, the 7.08% return of the Russell 1000® Growth Index (the “benchmark”), an unmanaged index consisting of those Russell 1000 securities (representing the 1,000 largest U.S. companies based on market capitalization) with greater than average growth orientation that tend to exhibit higher price-to-book ratios and higher forecasted growth rates than securities in the value universe. In addition, the Fund substantially underperformed the 11.96% return of the S&P 500® Index, a widely recognized, unmanaged index representative of common stocks of larger capitalized U.S. companies.
For a discussion on the economic and market environment during the 12-month period ended December 31, 2016, please see the Economic and Market Overview, beginning on page 3.
Subadviser discussion of factors that contributed to the Fund’s performance
Overall, stock selection was the primary reason for the Fund’s underperformance, relative to the benchmark, for the year ended December 31, 2016. From a sector perspective, health care, information technology, and consumer discretionary were the largest relative detractors, whereas financials and real estate were the leading outperformers.
Health care was the largest relative detractor, mainly due to stock selection, but an underweight allocation to the sector, relative to the benchmark, also hurt performance. Early in the year, shares of Fund holding Alexion Pharmaceuticals sold off along with other larger biotechnology stocks. The company issued disappointing guidance that fell below consensus analyst estimates, and shares declined sharply in the second quarter after the announcement of disappointing results of a phase III clinical trial. Shares of another Fund holding, Allergan, declined earlier in the year when its proposed merger with Pfizer was called off after the U.S. Treasury Department issued a notice aimed at curbing the benefits of tax inversions. (Tax inversion is the practice of relocating a corporation’s legal domicile to a nation that imposes lower taxes, or to a tax haven, usually while keeping its primary operations in its country of origin.) The Fund subsequently trimmed its position in Allergan.
Information technology underperformed on stock selection. The Fund’s overweight exposure to Fund holding salesforce.com, a cloud software firm, detracted from relative returns in the latter half of 2016, largely in response to a lack of clarity surrounding the company’s acquisition strategy. Sentiment weighed on the stock based on its failed efforts to acquire LinkedIn and on rumors of the CEO’s interest in acquiring Twitter. While shares of internet software and services provider Alphabet (the parent company of Google) lagged for the year and weighed on the Fund’s relative performance, this stock remains a top Fund holding.
Consumer discretionary underperformed largely on stock selection. The Fund’s exposure to travel companies Norwegian Cruise Line Holdings and Royal Caribbean Cruises weighed on relative returns due to heightened uncertainty about global travel trends. Challenges facing the industry included terrorist activity around the globe, concerns about the Zika virus, the United Kingdom’s vote to leave the European Union (also known as “Brexit”), and foreign exchange volatility.
Financials outperformed mainly on stock selection, but the Fund’s overweight position in the sector was also beneficial. Fund holding Morgan Stanley, a global investment bank, rose sharply in the second half of the year, along with the broader financials sector. The outcome of the U.S. presidential election caused investors to view the outlook for financials in a positive light amid expectations for reduced regulations, lower corporate taxes, and rising interest rates and inflation, all of which could be materially beneficial to the sector.
6
Table of Contents
MML Blue Chip Growth Fund – Portfolio Manager Report (Unaudited) (Continued)
Subadviser outlook
Our view is that large-cap growth stock valuations appear relatively attractive versus their value counterparts and compared with small- and mid-cap stocks, which recently recorded strong fourth-quarter and 12-month gains. We are not concerned that interest rates are rising, because moderately rising rates are a sign that the economy is growing. If President-elect Trump’s agenda is pursued successfully, we believe that multinational companies could benefit from improving global growth. Our belief is that large-cap growth stocks have the potential to benefit from a rollback in corporate tax rates and an increase in infrastructure spending in 2017.
| MML Blue Chip Growth Fund Largest Holdings (% of Net Assets) on 12/31/16 | ||||
Amazon.com, Inc. | 8.3 | % | ||
Facebook, Inc. Class A | 4.6 | % | ||
Alphabet, Inc. Class C | 4.4 | % | ||
The Priceline Group, Inc. | 4.2 | % | ||
Microsoft Corp. | 3.5 | % | ||
Visa, Inc. Class A | 2.8 | % | ||
MasterCard, Inc. Class A | 2.7 | % | ||
Alphabet, Inc. Class A | 2.5 | % | ||
Danaher Corp. | 2.4 | % | ||
UnitedHealth Group, Inc. | 2.2 | % | ||
|
| |||
| 37.6 | % | |||
|
| |||
| MML Blue Chip Growth Fund Sector Table (% of Net Assets) on 12/31/16 | ||||
Communications | 30.5 | % | ||
Consumer, Non-cyclical | 21.3 | % | ||
Consumer, Cyclical | 14.0 | % | ||
Financial | 13.8 | % | ||
Technology | 11.4 | % | ||
Industrial | 8.0 | % | ||
Utilities | 0.3 | % | ||
Basic Materials | 0.1 | % | ||
Mutual Funds | 0.0 | % | ||
|
| |||
Total Long-Term Investments | 99.4 | % | ||
Short-Term Investments and Other Assets and Liabilities | 0.6 | % | ||
|
| |||
Net Assets | 100.0 | % | ||
|
| |||
7
Table of Contents
MML Blue Chip Growth Fund – Portfolio Manager Report (Unaudited) (Continued)
Growth of a $10,000 Investment
Hypothetical Investments in MML Blue Chip Growth Fund Initial Class, the Russell 1000 Growth Index, and the S&P 500 Index.
| TOTAL RETURN | One Year 1/1/16 - 12/31/16 | Five Year Average Annual 1/1/12 - 12/31/16 | Ten Year Average Annual 1/1/07 - 12/31/16 | |||||||||
| Initial Class | 0.91% | 15.39% | 8.32% | |||||||||
| Russell 1000 Growth Index* | 7.08% | 14.50% | 8.33% | |||||||||
| S&P 500 Index | 11.96% | 14.66% | 6.95% | |||||||||
Hypothetical Investments in MML Blue Chip Growth Fund Service Class, the Russell 1000 Growth Index, and the S&P 500 Index.
| TOTAL RETURN | One Year 1/1/16 - 12/31/16 | Five Year Average Annual 1/1/12 - 12/31/16 | Since Inception Average Annual 8/15/08 - 12/31/16 | |||||||||
| Service Class | 0.65% | 15.09% | 9.52% | |||||||||
| Russell 1000 Growth Index* | 7.08% | 14.50% | 9.74% | |||||||||
| S&P 500 Index | 11.96% | 14.66% | 9.13% | |||||||||
GROWTH OF $10,000 INVESTMENT FOR THE PAST 10 YEARS
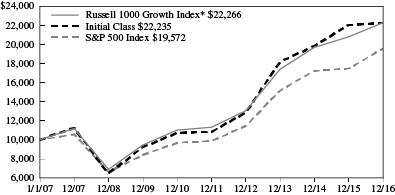
GROWTH OF $10,000 INVESTMENT SINCE INCEPTION
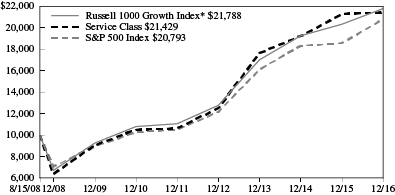
Generally accepted accounting principles require adjustments to be made to the net assets of the Fund at period end for financial reporting purposes only, and as such, the total return based on the unadjusted net asset value per share may differ from the total return reported in the financial highlights.
* Benchmark
Performance data quoted represents past performance; past performance is not predictive of future results. The investment return and principal value of shares of the Fund will fluctuate with market conditions so that shares of the Fund, when redeemed, may be worth more or less than their original cost. Current performance of the Fund may be lower or higher than the performance quoted. Performance data current to the most recent month end may be obtained by accessing the website www.massmutual.com.
Investors should note that the Fund is a professionally managed mutual fund, while the Russell 1000 Growth Index and the S&P 500 Index are unmanaged, do not incur expenses, and cannot be purchased directly by investors. Investors should read the Fund’s prospectus with regard to the Fund’s investment objective, risks, and charges and expenses in conjunction with these financial statements. The Fund’s return reflects changes in the net asset value per share without the deduction of any product charges (e.g., cost of insurance, mortality and expense risk charges, administrative fees, and CDSL). The inclusion of these charges would have reduced the performance shown here.
8
Table of Contents
MML Equity Income Fund – Portfolio Manager Report (Unaudited)
What is the investment approach of MML Equity Income Fund, and who is the Fund’s subadviser?
The Fund seeks dividend income and long-term capital growth by investing primarily in the common stocks of established companies. Under normal circumstances, the Fund invests at least 80% of its net assets (plus the amount of any borrowings for investment purposes) in common stocks, with 65% in the common stocks of well-established companies paying above-average dividends. The Fund’s subadviser currently considers well-established companies to mean companies that it considers to be seasoned companies with relatively long operating histories. The Fund’s subadviser is T. Rowe Price Associates, Inc. (T. Rowe Price).
How did the Fund perform during the 12 months ended December 31, 2016?
The Fund’s Initial Class shares returned 18.68%, outperforming, by a wide margin, the 11.96% return of the S&P 500® Index (the “benchmark”), a widely recognized, unmanaged index representative of common stocks of larger capitalized U.S. companies. In addition, the Fund outperformed the 17.34% return of the Russell 1000® Value Index, an unmanaged index consisting of those Russell 1000 securities (representing the 1,000 largest U.S. companies, based on market capitalization) with greater than average value orientation that tend to exhibit lower price-to-book ratios and lower forecasted growth rates than securities in the growth universe.
For a discussion on the economic and market environment during the 12-month period ended December 31, 2016, please see the Economic and Market Overview, beginning on page 3.
Subadviser discussion of factors that contributed to the Fund’s performance
For the year ended December 31, 2016, sector weightings contributed to the Fund’s performance, relative to the benchmark, as did stock selection. Leading contributors to relative results were the information technology and consumer staples sectors. The telecommunication services, consumer discretionary, and financials sectors detracted from performance.
The information technology sector contributed to relative performance largely due to stock selection. Sector Fund holding, Applied Materials, the leading supplier of equipment services and software used to manufacture semiconductors, benefited from a surge in spending on the latest memory chip technology for mobile devices and displays, as well as from stronger demand in China. An underweight allocation and stock selection in the consumer staples sector also boosted the Fund’s relative results. Agricultural processor Archer-Daniels-Midland, one Fund holding within the sector, performed well, driven by a robust U.S. harvest, higher U.S. exports, and higher ethanol margins.
Stock selection in the telecommunication services sector detracted from relative performance for the year. United Kingdom-based Vodafone was one Fund holding within the sector that declined, driven by negative currency effects and concerns that the Brexit vote, which authorized the U.K.’s departure from the European Union, could lead to higher regulatory hurdles for a potentially synergistic deal with Liberty Global. Significant exposure to the consumer discretionary sector also hindered relative results, as did stock selection in the financials sector. In financials, Fund holding U.K.-based Royal Bank of Scotland suffered from additional provisions for litigation claims, persistently low U.K. interest rates, and higher macroeconomic uncertainty following the Brexit vote.
During the year, the Fund used a kind of derivative called a “right.” (Derivatives are securities that derive their value from the performance of one or more other investments and take the form of a contract between two or more parties. Most derivatives are used for hedging, speculation, or both.) Rights give stockholders the ability to buy stock at a predetermined price (normally at a discount) in proportion to the number of shares already owned. Rights are issued only for a limited time, after which they expire. The Fund held rights at various points throughout the year. These derivatives had a negligible effect on the Fund’s performance.
Subadviser outlook
Despite facing several geopolitical events during the year, the market performed surprisingly well. Issues such as Russia’s activity in Syria, tensions in the Middle East, and provocative actions from North Korea introduced uncertainties that have the potential to escalate into crises. Additionally, electorates in many countries have exhibited levels of responsiveness to populist messages not seen in decades. In the U.S., the market repositioned itself for the expected policy initiatives of the incoming Trump
9
Table of Contents
MML Equity Income Fund – Portfolio Manager Report (Unaudited) (Continued)
administration, but significant uncertainty remains as to whether actual policy will match expectations. The U.S. dollar remained strong, and in addition to a December rate hike, the U.S. Federal Reserve Board communicated expectations for additional rate increases, as increasing wage pressure and fiscal stimulus could result in higher inflation.
In this environment, we expect increased volatility and modest equity returns in the coming months, as future U.S. policy starts to materialize, allowing market participants to assess the longer-term impact to the global economy. Following recent strength, valuations appear more stretched to us, although they have fallen in traditionally defensive sectors in anticipation of rising U.S. interest rates. Given the environment, we are finding more opportunities to sell than buy; however, the cross-currents in the market continue to provide the Fund with select opportunities to purchase quality companies trading at relatively attractive valuations.
| MML Equity Income Fund Largest Holdings (% of Net Assets) on 12/31/16 | ||||
JP Morgan Chase & Co. | 3.5 | % | ||
Exxon Mobil Corp. | 2.7 | % | ||
Microsoft Corp. | 2.1 | % | ||
Morgan Stanley | 2.1 | % | ||
Pfizer, Inc. | 2.0 | % | ||
The Boeing Co. | 2.0 | % | ||
General Electric Co. | 1.9 | % | ||
Total SA | 1.8 | % | ||
Wells Fargo & Co. | 1.7 | % | ||
Johnson & Johnson | 1.7 | % | ||
|
| |||
| 21.5 | % | |||
|
| |||
| MML Equity Income Fund Sector Table (% of Net Assets) on 12/31/16 | ||||
Financial | 26.7 | % | ||
Consumer, Non-cyclical | 13.5 | % | ||
Industrial | 12.7 | % | ||
Energy | 11.0 | % | ||
Utilities | 7.8 | % | ||
Communications | 7.7 | % | ||
Technology | 7.6 | % | ||
Consumer, Cyclical | 6.0 | % | ||
Basic Materials | 4.9 | % | ||
Mutual Funds | 0.0 | % | ||
|
| |||
Total Long-Term Investments | 97.9 | % | ||
Short-Term Investments and Other Assets and Liabilities | 2.1 | % | ||
|
| |||
Net Assets | 100.0 | % | ||
|
| |||
10
Table of Contents
MML Equity Income Fund – Portfolio Manager Report (Unaudited) (Continued)
Growth of a $10,000 Investment
Hypothetical Investments in MML Equity Income Fund Initial Class, the S&P 500 Index, and the Russell 1000 Value Index.
| TOTAL RETURN | One Year 1/1/16 - 12/31/16 | Five Year Average Annual 1/1/12 - 12/31/16 | Ten Year Average Annual 1/1/07 - 12/31/16 | |||||||||
| Initial Class | 18.68% | 12.62% | 5.53% | |||||||||
| S&P 500 Index* | 11.96% | 14.66% | 6.95% | |||||||||
| Russell 1000 Value Index | 17.34% | 14.80% | 5.72% | |||||||||
Hypothetical Investments in MML Equity Income Fund Service Class, the S&P 500 Index, and the Russell 1000 Value Index.
| TOTAL RETURN | One Year 1/1/16 - 12/31/16 | Five Year Average Annual 1/1/12 - 12/31/16 | Since Inception Average Annual 8/15/08 - 12/31/16 | |||||||||
| Service Class | 18.46% | 12.34% | 7.45% | |||||||||
| S&P 500 Index* | 11.96% | 14.66% | 9.13% | |||||||||
| Russell 1000 Value Index | 17.34% | 14.80% | 8.60% | |||||||||
GROWTH OF $10,000 FOR THE PAST 10 YEARS
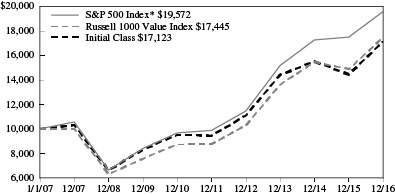
GROWTH OF $10,000 INVESTMENT SINCE INCEPTION
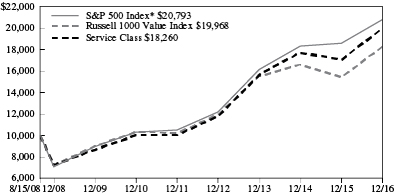
Generally accepted accounting principles require adjustments to be made to the net assets of the Fund at period end for financial reporting purposes only, and as such, the total return based on the unadjusted net asset value per share may differ from the total return reported in the financial highlights.
* Benchmark
Performance data quoted represents past performance; past performance is not predictive of future results. The investment return and principal value of shares of the Fund will fluctuate with market conditions so that shares of the Fund, when redeemed, may be worth more or less than their original cost. Current performance of the Fund may be lower or higher than the performance quoted. Performance data current to the most recent month end may be obtained by accessing the website www.massmutual.com.
Investors should note that the Fund is a professionally managed mutual fund, while the S&P 500 Index and the Russell 1000 Value Index are unmanaged, do not incur expenses, and cannot be purchased directly by investors. Investors should read the Fund’s prospectus with regard to the Fund’s investment objective, risks, and charges and expenses in conjunction with these financial statements. The Fund’s return reflects changes in the net asset value per share without the deduction of any product charges (e.g., cost of insurance, mortality and expense risk charges, administrative fees, and CDSL). The inclusion of these charges would have reduced the performance shown here.
11
Table of Contents
MML Equity Index Fund – Portfolio Manager Report (Unaudited)
What is the investment approach of MML Equity Index Fund, and who is the Fund’s subadviser?
The Fund’s investment objective is to provide investment results that correspond to the price and yield performance of publicly traded common stocks in the aggregate as represented by the S&P 500® Index* (the “Index”). Under normal circumstances, the Fund invests at least 80% (and, typically, substantially all) of its net assets (plus the amount of any borrowings for investment purposes) in the equity securities of companies included within the Index. The Fund’s subadviser is Northern Trust Investments, Inc. (NTI).
How did the Fund perform during the 12 months ended December 31, 2016?
The Fund’s Class I shares returned 11.48%, slightly underperforming the 11.96% return of the Index, a widely recognized, unmanaged index representative of common stocks of larger capitalized U.S. companies.
For a discussion on the economic and market environment during the 12-month period ended December 31, 2016, please see the Economic and Market Overview, beginning on page 3.
Subadviser discussion of factors that contributed to the Fund’s performance
The Fund’s underperformance versus the Index is mainly attributable to the impact of fees and expenses necessary for the management and operation of the Fund. The Index is not subject to fees or expenses, and it is not possible to invest directly in the Index.
For the year ended December 31, 2016, energy and telecommunication services were the strongest-performing sectors within the Index, whereas the health care and real estate sectors returned the worst performances.
The first two weeks of 2016 began with U.S. markets spiraling downward over 8%, as problems with the Chinese economy preoccupied investors and crashing oil prices weighed on investor sentiment. Markets rebounded as global central banks expanded monetary operations yet again in response to signs of slow growth.
The June 23 “Brexit” referendum in Britain brought a surprise victory for the “leave” campaign. Brexit – an abbreviation for “British exit” – was the referendum that authorized the U.K.’s withdrawal from the European Union. The vote resulted in significantly increased volatility across asset classes and caused an immediate drop in global equity markets. U.S. equities rallied in subsequent days, wiping away losses. While many investors had expected two interest rate hikes over the course of the year, weak economic data helped push the U.S. Federal Reserve (the Fed) into delaying a rate increase until December. Federal Open Market Committee projections issued at that time implied the potential for three hikes in 2017.
In November, OPEC approved its first production cut in eight years, pushing oil prices above the $50/barrel mark. U.S. equities finished the year strong after heightened volatility in the run-up to the November presidential election. The majority of the rally was driven by the promise of Republican pro-growth initiatives – including tax reform and regulatory rollbacks – in addition to potential increases in infrastructure spending proposed by the Trump administration.
Jobless claims reached multi-year lows as the year concluded, with a 4.7% national unemployment rate. The yield curve shifted higher and steeper during the fourth quarter as the 10-year Treasury rose above 2.4%. (The yield curve is a graph showing the term structure of interest rates by plotting the yields of all bonds of comparable quality with maturities ranging from the shortest – typically one month – to the longest – typically 30 years – available. The resulting curve shows whether short-term interest rates are higher or lower than long-term rates.) Although inflation remained stubbornly low throughout 2016, investors pushed interest rates upward in anticipation of higher growth and inflation in 2017. These expectations resulted in post-election U.S. dollar strength against foreign currencies.
| * | The S&P 500 Index is a product of S&P Dow Jones Indices LLC (“SPDJI”), and has been licensed for use by MML Advisers. Standard & Poor’s®, S&P® and S&P 500® are registered trademarks of Standard & Poor’s Financial Services LLC (“S&P”); Dow Jones® is a registered trademark of Dow Jones Trademark Holdings LLC (“Dow Jones”); and these trademarks have been licensed for use by SPDJI and sublicensed for certain purposes by MML Advisers. The Fund is not sponsored, endorsed, sold or promoted by SPDJI, Dow Jones, S&P, their respective affiliates, and none of such parties make any representation regarding the advisability of investing in such product(s) nor do they have any liability for any errors, omissions, or interruptions of the S&P 500 Index. |
12
Table of Contents
MML Equity Index Fund – Portfolio Manager Report (Unaudited) (Continued)
Subadviser outlook
Although it is impossible to predict the direction that the equity markets will take as we move into 2017 – after its positive performance, overall, in the past year – numerous forces will influence the direction that the market takes moving forward. These include the legislative and policy changes implemented by the Trump administration and the Republican House and Senate, Fed policy, unemployment, and developments on the world stage – such as the continuing impact of the strong dollar, the direction of oil prices, and any additional fallout from the Brexit vote. We believe, however, that the Fund continues to be well positioned to pursue returns that are consistent with those of the Index.
| MML Equity Index Fund Largest Holdings (% of Net Assets) on 12/31/16 | ||||
Apple, Inc. | 3.1 | % | ||
Microsoft Corp. | 2.4 | % | ||
Exxon Mobil Corp. | 1.9 | % | ||
Johnson & Johnson | 1.6 | % | ||
Berkshire Hathaway, Inc. Class B | 1.5 | % | ||
JP Morgan Chase & Co. | 1.5 | % | ||
Amazon.com, Inc. | 1.5 | % | ||
General Electric Co. | 1.4 | % | ||
Facebook, Inc. Class A | 1.3 | % | ||
AT&T, Inc. | 1.3 | % | ||
|
| |||
| 17.5 | % | |||
|
| |||
| MML Equity Index Fund Sector Table (% of Net Assets) on 12/31/16 | ||||
Consumer, Non-cyclical | 22.0 | % | ||
Financial | 17.2 | % | ||
Communications | 13.1 | % | ||
Technology | 12.6 | % | ||
Industrial | 9.8 | % | ||
Consumer, Cyclical | 8.8 | % | ||
Energy | 7.3 | % | ||
Utilities | 3.1 | % | ||
Basic Materials | 2.5 | % | ||
Diversified | 0.0 | % | ||
|
| |||
Total Long-Term Investments | 96.4 | % | ||
Short-Term Investments and Other Assets and Liabilities | 3.6 | % | ||
|
| |||
Net Assets | 100.0 | % | ||
|
| |||
13
Table of Contents
MML Equity Index Fund – Portfolio Manager Report (Unaudited) (Continued)
Growth of a $10,000 Investment
Hypothetical Investments in MML Equity Index Fund Class I, Class II, Class III, and the S&P 500 Index.
| TOTAL RETURN | One Year 1/1/16 - 12/31/16 | Five Year Average Annual 1/1/12 - 12/31/16 | Ten Year Average Annual 1/1/07 - 12/31/16 | |||||||||
| Class I | 11.48% | 14.17% | 6.52% | |||||||||
| Class II | 11.62% | 14.35% | 6.68% | |||||||||
| Class III | 11.69% | 14.50% | 6.83% | |||||||||
| S&P 500 Index | 11.96% | 14.66% | 6.95% | |||||||||
Hypothetical Investments in MML Equity Index Fund Service Class I and the S&P 500 Index.
| TOTAL RETURN | One Year 1/1/16 - 12/31/16 | Five Year Average Annual 1/1/12 - 12/31/16 | Since Inception Average Annual 8/15/08 - 12/31/16 | |||||||||
| Service Class I | 11.19% | 13.88% | 8.41% | |||||||||
| S&P 500 Index | 11.96% | 14.66% | 9.13% | |||||||||
GROWTH OF $10,000 INVESTMENT FOR THE PAST 10 YEARS
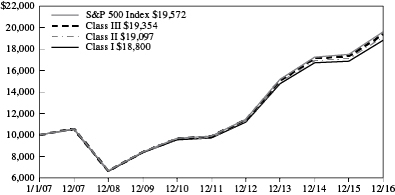
GROWTH OF $10,000 INVESTMENT SINCE INCEPTION
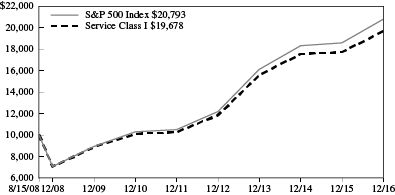
Generally accepted accounting principles require adjustments to be made to the net assets of the Fund at period end for financial reporting purposes only, and as such, the total return based on the unadjusted net asset value per share may differ from the total return reported in the financial highlights.
Performance data quoted represents past performance; past performance is not predictive of future results. The investment return and principal value of shares of the Fund will fluctuate with market conditions so that shares of the Fund, when redeemed, may be worth more or less than their original cost. Current performance of the Fund may be lower or higher than the performance quoted. Performance data current to the most recent month end may be obtained by accessing the website www.massmutual.com.
Investors should note that the Fund is a professionally managed mutual fund, while the S&P 500 Index is unmanaged, does not incur expenses, and cannot be purchased directly by investors. Investors should read the Fund’s prospectus with regard to the Fund’s investment objective, risks, and charges and expenses in conjunction with these financial statements. The Fund’s return reflects changes in the net asset value per share without the deduction of any product charges (e.g., cost of insurance, mortality and expense risk charges, administrative fees, and CDSL). The inclusion of these charges would have reduced the performance shown here.
14
Table of Contents
MML Focused Equity Fund – Portfolio Manager Report (Unaudited)
What is the investment approach of MML Focused Equity Fund, and who is the Fund’s subadviser?
The Fund seeks growth of capital over the long-term by investing primarily in equity securities of U.S. companies that the Fund’s subadviser believes are undervalued. Under normal circumstances, the Fund invests at least 80% of its net assets (plus the amount of any borrowings for investment purposes) in equity securities. The Fund’s subadviser is Harris Associates L.P. (Harris).
How did the Fund perform during the 12 months ended December 31, 2016?
The Fund’s Class II shares returned 17.96%, outperforming, by a wide margin, the 12.05% return of the Russell 1000® Index (the “benchmark”), a widely recognized, unmanaged index representing the performance of common stocks of larger capitalized U.S. companies.
For a discussion on the economic and market environment during the 12-month period ended December 31, 2016, please see the Economic and Market Overview, beginning on page 3.
Subadviser discussion of factors that contributed to the Fund’s performance
For the year ended December 31, 2016, Fund holdings in the industrials sector produced the largest return for the Fund. There, top Fund holdings included Cummins and Caterpillar, both industrial construction machinery manufacturers. The industrials sector also delivered the best results relative to the benchmark.
The best-performing individual Fund holding was industrials sector holding Cummins, whose quarterly results benefited from ongoing restructuring and cost-reduction initiatives, and earnings per share beat market forecasts for the first and second quarters of 2016. Management repurchased 7 million shares through its third quarter and authorized another $1 billion share repurchase plan to be enacted upon the completion of the first plan. The next-best results came from financial company Goldman Sachs and industrials firm Caterpillar, which both added substantially to the Fund’s performance for the year.
Turning to the downside, the real estate sector supplied the largest negative collective absolute return, owing to the Fund’s single holding within that market segment, real estate management and development company CBRE Group. Energy was the only other sector that declined for the period, as the Fund’s lone underlying energy holding, oil and gas exploration/production firm Anadarko (eliminated in the second quarter), lost value during the holding period.
On a stock-specific basis, real estate holding CBRE Group also diminished the Fund’s full-year performance the most, as its share price declined exclusively in the first half of the year due to various market factors and investors’ anxiety about the business impact from Brexit. (“Brexit” – an abbreviation for “British exit” – was the United Kingdom’s surprising June 2016 referendum to leave the European Union.) CBRE’s second-quarter earnings results reflected weak property sales. This was particularly the case in the U.K., where Brexit caused market-wide property sales to fall 40%, negatively affecting CBRE’s earnings guidance. Fund holdings technology company Intel and energy capital goods firm NOW were the next-greatest detractors from the Fund’s overall return in 2016.
Subadviser outlook
The results of November’s U.S. presidential election prompted upward market movements in the fourth quarter, capping a year in which markets finished stronger than they started. As value investors, we feel that our key task is to see through the haze generated by market pundits who are overly influenced by geopolitical events such as referendums and elections. Instead, we focus on the fundamental drivers of long-term cash flows. We seek to make investment decisions based on a company’s ability to generate and sustain a growing cash flow stream. While the market chased stable stocks in the face of uncertainty, our belief is that the attractive valuations in financials and cyclically exposed areas of the market provide more safety.
15
Table of Contents
MML Focused Equity Fund – Portfolio Manager Report (Unaudited) (Continued)
| MML Focused Equity Fund Largest Holdings (% of Net Assets) on 12/31/16 | ||||
Wells Fargo & Co. | 7.2 | % | ||
General Motors Co. | 6.7 | % | ||
Alphabet, Inc. Class C | 6.0 | % | ||
JP Morgan Chase & Co. | 5.9 | % | ||
Charter Communications, Inc. Class A | 5.7 | % | ||
American International Group, Inc. | 5.6 | % | ||
HCA Holdings, Inc. | 5.3 | % | ||
CarMax, Inc. | 5.0 | % | ||
Baxter International, Inc. | 4.8 | % | ||
BlackRock, Inc. | 4.6 | % | ||
|
| |||
| 56.8 | % | |||
|
| |||
| MML Focused Equity Fund Sector Table (% of Net Assets) on 12/31/16 | ||||
Financial | 34.5 | % | ||
Communications | 24.5 | % | ||
Consumer, Cyclical | 15.9 | % | ||
Consumer, Non-cyclical | 14.0 | % | ||
Industrial | 8.9 | % | ||
|
| |||
Total Long-Term Investments | 97.8 | % | ||
Short-Term Investments and Other Assets and Liabilities | 2.2 | % | ||
|
| |||
Net Assets | 100.0 | % | ||
|
| |||
16
Table of Contents
MML Focused Equity Fund – Portfolio Manager Report (Unaudited) (Continued)
Growth of a $10,000 Investment
Hypothetical Investments in MML Focused Equity Fund Class II and the Russell 1000 Index.
| TOTAL RETURN | One Year 1/1/16 - 12/31/16 | Five Year Average Annual 1/1/12 - 12/31/16 | Since Inception Average Annual 12/8/11 - 12/31/16 | |||||||||
| Class II | 17.96% | 14.96% | 14.85% | |||||||||
| Russell 1000 Index | 12.05% | 14.69% | 14.42% | |||||||||
Hypothetical Investments in MML Focused Equity Fund Service Class I and the Russell 1000 Index.
| TOTAL RETURN | One Year 1/1/16 - 12/31/16 | Since Inception Average Annual 5/1/12 - 12/31/16 | ||||||
| Service Class I | 17.74% | 12.39% | ||||||
| Russell 1000 Index | 12.05% | 12.97% | ||||||
GROWTH OF $10,000 INVESTMENT SINCE INCEPTION
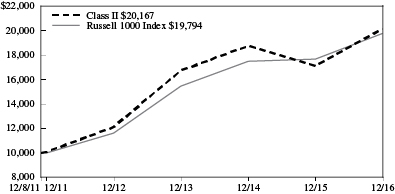
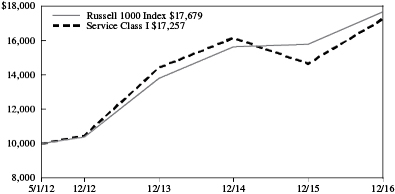
Generally accepted accounting principles require adjustments to be made to the net assets of the Fund at period end for financial reporting purposes only, and as such, the total return based on the unadjusted net asset value per share may differ from the total return reported in the financial highlights.
Performance data quoted represents past performance; past performance is not predictive of future results. The investment return and principal value of shares of the Fund will fluctuate with market conditions so that shares of the Fund, when redeemed, may be worth more or less than their original cost. Current performance of the Fund may be lower or higher than the performance quoted. Performance data current to the most recent month end may be obtained by accessing the website www.massmutual.com
Investors should note that the Fund is a professionally managed mutual fund, while the Russell 1000 Index is unmanaged, does not incur expenses, and cannot be purchased directly by investors. Investors should read the Fund's prospectus with regard to the Fund's investment objective, risks, and charges and expenses in conjunction with these financial statements. The Fund's return reflects changes in the net asset value per share without the deduction of any product charges (e.g., cost of insurance, mortality and expense risk charges, administrative fees, and CDSL). The inclusion of these charges would have reduced the performance shown here.
17
Table of Contents
MML Foreign Fund – Portfolio Manager Report (Unaudited)
What is the investment approach of MML Foreign Fund, and who is the Fund’s subadviser?
The Fund seeks long-term capital growth by investing, under normal circumstances, at least 80% of its net assets (plus the amount of any borrowings for investment purposes) in investments of issuers located outside of the U.S., including those in emerging markets. Under normal market conditions, the Fund invests predominantly in equity securities, consisting primarily to predominantly of common stocks, and, while there are no set percentage targets, the Fund invests predominantly in large- to medium-capitalization companies with market capitalization values greater than $2 billion and may invest a portion in smaller companies. The Fund’s subadviser is Templeton Investment Counsel, LLC (Templeton).
How did the Fund perform during the 12 months ended December 31, 2016?
The Fund’s Initial Class shares returned 1.44%, outperforming the 1.00% return of the MSCI EAFE Index (the “benchmark”), a widely recognized, unmanaged index representative of equity securities in developed markets around the world, excluding the U.S. and Canada.
For a discussion on the economic and market environment during the 12-month period ended December 31, 2016, please see the Economic and Market Overview, beginning on page 3.
Subadviser discussion of factors that contributed to the Fund’s performance
For the year ended December 31, 2016, the Fund’s stock selection in Europe, particularly in France and Germany, benefited its performance, relative to the benchmark. Security selection in Asia was also a performance driver. Within that region, off-benchmark exposure to South Korea contributed significantly to relative returns.
From a sector perspective, stock selection in the information technology sector benefited the Fund’s relative performance. Within the sector, South Korea-based consumer electronics manufacturer Samsung Electronics, a Fund holding that is not a benchmark constituent, was a significant contributor. Security selection in the consumer staples sector also boosted the Fund’s relative performance; specifically, Fund holding Tesco, a U.K.-based grocery retailer, fueled returns. An overweight allocation, relative to the benchmark, in the materials sector also boosted the Fund’s relative performance, and within the sector, a Fund holding that contributed significantly was specialty materials and chemicals manufacturer LANXESS (Germany). Other Fund holdings that helped to drive full-year returns included Subsea 7 (U.K.), an out-of-benchmark offshore energy services provider; and independent oil and gas company Royal Dutch Shell (the Netherlands) – both in the energy sector.
In contrast, the Fund’s sole holding in Israel detracted significantly from relative performance for the year. In Europe, positioning in Sweden, Switzerland, and Italy hampered returns, while off-benchmark exposure to China weighed on results in Asia.
Stock selection and an overweight position in the financials sector detracted from the Fund’s relative performance, as did an overweight stake and security selection in the health care sector. Stock selection in the industrials sector also weighed on relative results. Within financials, Switzerland-based financial services firm Credit Suisse Group and Italy-based commercial bank UniCredit were two Fund holdings that were leading detractors. In the health care sector, one Fund holding that significantly hindered results was generic drug manufacturer Teva Pharmaceutical Industries (Israel). Other Fund holdings that detracted notably included U.K. retailer Marks & Spencer Group in the consumer discretionary sector, U.K. telecommunications firm Vodafone Group in the telecommunication services sector, and Sweden-based health care products and services provider Getinge in the health care sector.
During the period, the U.S. dollar appreciated against most foreign currencies, which also hurt the Fund’s performance because investments in securities with non-U.S. currency exposure lost value as the dollar rose.
Subadviser outlook
A critical lesson we have learned through decades of investing in global equity markets is that returns seem to accrue to value intermittently. Our style of investing has historically produced positive performance over a long-term investment horizon. However, it has rarely been a steady appreciation. While we believe that near-term consolidation is possible should the value rally
18
Table of Contents
MML Foreign Fund – Portfolio Manager Report (Unaudited) (Continued)
get ahead of itself, we believe the fundamental underpinnings for value’s recovery remain intact, and expect the next leg to be driven by improving earnings. Rate cycles are long and difficult to call, though our view is that signs of a turning point may be emerging. We believe that being properly positioned for these turns is essential to capturing the long-term benefits of the value investment discipline. We expect further financial repression and low real rates (though nominal rates may rise) as indebted governments continue deficit spending. We believe that 2017 looks like a challenging environment for investors in bonds and equity-market bond proxies. Real assets like equities are better positioned, in our view, although investors must be discriminating. While this environment has been, and may remain, painful for some time, we believe the eventual normalization of these extremes represents the most compelling opportunity in equity markets today, and we have positioned the Fund accordingly.
| MML Foreign Fund Largest Holdings (% of Net Assets) on 12/31/16 | ||||
Samsung Electronics Co., Ltd. | 3.0 | % | ||
BP PLC | 2.9 | % | ||
Royal Dutch Shell PLC Class B | 2.8 | % | ||
BNP Paribas | 2.0 | % | ||
Roche Holding AG | 2.0 | % | ||
HSBC Holdings PLC | 1.7 | % | ||
Teva Pharmaceutical Industries Ltd. Sponsored ADR (Israel) | 1.7 | % | ||
Sanofi | 1.7 | % | ||
Eni SpA | 1.7 | % | ||
Bayer AG | 1.6 | % | ||
|
| |||
| 21.1 | % | |||
|
| |||
| MML Foreign Fund Sector Table (% of Net Assets) on 12/31/16 | ||||
Financial | 22.6 | % | ||
Consumer, Non-cyclical | 17.1 | % | ||
Energy | 13.7 | % | ||
Industrial | 12.8 | % | ||
Communications | 11.4 | % | ||
Consumer, Cyclical | 7.6 | % | ||
Technology | 6.3 | % | ||
Basic Materials | 5.8 | % | ||
Mutual Funds | 0.6 | % | ||
|
| |||
Total Long-Term Investments | 97.9 | % | ||
Short-Term Investments and Other Assets and Liabilities | 2.1 | % | ||
|
| |||
Net Assets | 100.0 | % | ||
|
| |||
19
Table of Contents
MML Foreign Fund – Portfolio Manager Report (Unaudited) (Continued)
Growth of a $10,000 Investment
Hypothetical Investments in MML Foreign Fund Initial Class and the MSCI EAFE Index.
| TOTAL RETURN | One Year 1/1/16 - 12/31/16 | Five Year Average Annual 1/1/12 - 12/31/16 | Ten Year Average Annual 1/1/07 - 12/31/16 | |||||||||
| Initial Class | 1.44% | 5.40% | 0.59% | |||||||||
| MSCI EAFE Index | 1.00% | 6.53% | 0.75% | |||||||||
Hypothetical Investments in MML Foreign Fund Service Class and the MSCI EAFE Index.
| TOTAL RETURN | One Year 1/1/16 - 12/31/16 | Five Year Average Annual 1/1/12 - 12/31/16 | Since Inception Average Annual 8/15/08 - 12/31/16 | |||||||||
| Service Class | 1.18% | 5.13% | 1.20% | |||||||||
| MSCI EAFE Index | 1.00% | 6.53% | 1.95% | |||||||||
GROWTH OF $10,000 FOR THE PAST 10 YEARS
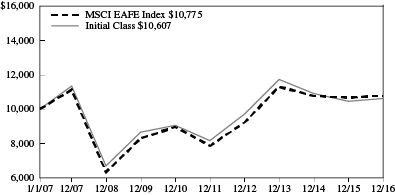
GROWTH OF $10,000 INVESTMENT SINCE INCEPTION
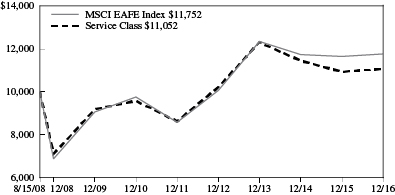
Generally accepted accounting principles require adjustments to be made to the net assets of the Fund at period end for financial reporting purposes only, and as such, the total return based on the unadjusted net asset value per share may differ from the total return reported in the financial highlights.
Performance data quoted represents past performance; past performance is not predictive of future results. The investment return and principal value of shares of the Fund will fluctuate with market conditions so that shares of the Fund, when redeemed, may be worth more or less than their original cost. Current performance of the Fund may be lower or higher than the performance quoted. Performance data current to the most recent month end may be obtained by accessing the website www.massmutual.com.
Investors should note that the Fund is a professionally managed mutual fund, while the MSCI EAFE Index is unmanaged, does not incur expenses, and cannot be purchased directly by investors. Investors should read the Fund’s prospectus with regard to the Fund’s investment objective, risks, and charges and expenses in conjunction with these financial statements. The Fund’s return reflects changes in the net asset value per share without the deduction of any product charges (e.g., cost of insurance, mortality and expense risk charges, administrative fees, and CDSL). The inclusion of these charges would have reduced the performance shown here.
20
Table of Contents
MML Fundamental Growth Fund – Portfolio Manager Report (Unaudited)
What is the investment approach of MML Fundamental Growth Fund, and who is the Fund’s subadviser?
The Fund seeks long-term growth of capital by investing primarily in domestic equity securities that the Fund’s subadviser believes offer the potential for long-term growth. The Fund’s subadviser is Wellington Management Company LLP (Wellington Management).
How did the Fund perform during the 12 months ended December 31, 2016?
The Fund’s Class II shares returned 3.73%, underperforming the 7.08% return of the Russell 1000® Growth Index (the “benchmark”), an unmanaged index consisting of those Russell 1000 securities (representing the 1,000 largest U.S. companies based on market capitalization) with greater than average growth orientation that tend to exhibit higher price-to-book ratios and higher forecasted growth rates than securities in the value universe.
For a discussion on the economic and market environment during the 12-month period ended December 31, 2016, please see the Economic and Market Overview, beginning on page 3.
Subadviser discussion of factors that contributed to the Fund’s performance
Security selection within the information technology sector was the greatest driver of the Fund’s underperformance versus its benchmark during the year ended December 31, 2016. Stock selection within the industrials and consumer staples sectors also detracted from relative performance, as did the Fund’s underweight exposure, relative to the benchmark, to the industrials sector. Positive stock selection within the energy and materials sectors helped to partially offset these negative results. The Fund also benefited from its overweight exposure to the information technology sector.
On a stock-specific basis, top detractors from relative performance included Fund holdings First Solar (information technology) and Microsoft (information technology). First Solar is a solar energy solutions company. Though the company was profitable and revenues nearly doubled during the first quarter of 2016, management announced revenues that were below consensus expectations. In addition, the announcement of a leadership transition and ongoing concerns about the impact of the expiration of solar Investment Tax Credit incentives weighed on the stock. The Fund sold its stake in First Solar on these concerns. An underweight position in Microsoft, a developer of software products and services, early in the period weighed on the Fund’s results relative to the benchmark. Not owning benchmark constituents UnitedHealth Group (a managed health care company) and NVIDIA (a company that designs graphics processing units for the gaming market), which both performed well during the period, also hampered the Fund’s relative performance.
Top contributors to benchmark-relative returns included Fund holdings Linear Technology (information technology) and Baker Hughes (energy). Linear Technology designs, manufactures, and markets integrated circuits. Shares rose when semiconductor company Analog Devices announced an offer to acquire the company during the third quarter of 2016. Baker Hughes, an oilfield services company, performed well during the second quarter, following news that the company would merge with General Electric to form a $30 billion oil and gas group.
Subadviser outlook
We anticipate volatility from the fallout of a change in interest rate policy over the coming year. This has been an unprecedented period of time, and we believe there will be challenges for the U.S. Federal Reserve in managing its $4 trillion balance sheet to a level that is more in line with historical levels. We see uncertainty in how this will transpire, but we expect it could be disruptive to global financial markets – potentially affecting asset prices, inflation, and profitability. We also believe these management challenges could impact areas that we and the market cannot foresee.
On a more positive note, we have had many encouraging meetings recently with CEOs who are optimistic about the prospects for their businesses. Based on the information gathered during these meetings, our view is that the potential for deregulation, lower taxes, and a more company-friendly environment has a greater likelihood going forward. The Fund is well positioned for this change.
21
Table of Contents
MML Fundamental Growth Fund – Portfolio Manager Report (Unaudited) (Continued)
At year end, the Fund held its largest overweight allocations to information technology, with energy being the Fund’s second-largest overweight position. The Fund’s greatest underweight stakes were in the consumer discretionary and consumer staples sectors.
| MML Fundamental Growth Fund Largest Holdings (% of Net Assets) on 12/31/16 | ||||
Apple, Inc. | 6.3 | % | ||
Microsoft Corp. | 5.4 | % | ||
Alphabet, Inc. Class C | 5.4 | % | ||
Facebook, Inc. Class A | 3.1 | % | ||
Amazon.com, Inc. | 2.4 | % | ||
PepsiCo, Inc. | 2.3 | % | ||
Oracle Corp. | 2.3 | % | ||
Comcast Corp. Class A | 2.2 | % | ||
Visa, Inc. Class A | 2.0 | % | ||
Amgen, Inc. | 2.0 | % | ||
|
| |||
| 33.4 | % | |||
|
| |||
| MML Fundamental Growth Fund Sector Table (% of Net Assets) on 12/31/16 | ||||
Technology | 24.8 | % | ||
Consumer, Non-cyclical | 24.6 | % | ||
Communications | 22.4 | % | ||
Financial | 7.8 | % | ||
Industrial | 7.6 | % | ||
Energy | 5.3 | % | ||
Consumer, Cyclical | 5.0 | % | ||
Basic Materials | 2.4 | % | ||
|
| |||
Total Long-Term Investments | 99.9 | % | ||
Short-Term Investments and Other Assets and Liabilities | 0.1 | % | ||
|
| |||
Net Assets | 100.0 | % | ||
|
| |||
22
Table of Contents
MML Fundamental Growth Fund – Portfolio Manager Report (Unaudited) (Continued)
Growth of a $10,000 Investment
Hypothetical Investments in MML Fundamental Growth Fund Class II and the Russell 1000 Growth Index.
| TOTAL RETURN | One Year 1/1/16 - 12/31/16 | Five Year Average Annual 1/1/12 - 12/31/16 | Since Inception Average Annual 12/8/11 - 12/31/16 | |||||||||
| Class II | 3.73% | 12.87% | 12.58% | |||||||||
| Russell 1000 Growth Index | 7.08% | 14.50% | 14.09% | |||||||||
Hypothetical Investments in MML Fundamental Growth Fund Service Class I and the Russell 1000 Growth Index.
| TOTAL RETURN | One Year 1/1/16 - 12/31/16 | Since Annual 5/1/12 - | ||||||
| Service Class I | 3.54% | 10.09% | ||||||
| Russell 1000 Growth Index | 7.08% | 12.29% | ||||||
GROWTH OF $10,000 INVESTMENT SINCE INCEPTION
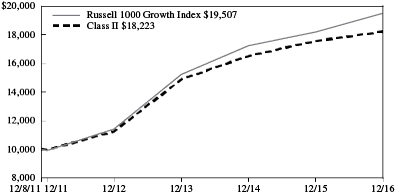
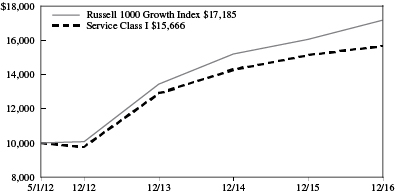
Generally accepted accounting principles require adjustments to be made to the net assets of the Fund at period end for financial reporting purposes only, and as such, the total return based on the unadjusted net asset value per share may differ from the total return reported in the financial highlights.
Performance data quoted represents past performance; past performance is not predictive of future results. The investment return and principal value of shares of the Fund will fluctuate with market conditions so that shares of the Fund, when redeemed, may be worth more or less than their original cost. Current performance of the Fund may be lower or higher than the performance quoted. Performance data current to the most recent month end may be obtained by accessing the website www.massmutual.com
Investors should note that the Fund is a professionally managed mutual fund, while the Russell 1000 Growth Index is unmanaged, does not incur expenses, and cannot be purchased directly by investors. Investors should read the Fund's prospectus with regard to the Fund's investment objective, risks, and charges and expenses in conjunction with these financial statements. The Fund's return reflects changes in the net asset value per share without the deduction of any product charges (e.g., cost of insurance, mortality and expense risk charges, administrative fees, and CDSL). The inclusion of these charges would have reduced the performance shown here.
23
Table of Contents
MML Fundamental Value Fund – Portfolio Manager Report (Unaudited)
What is the investment approach of MML Fundamental Value Fund, and who is the Fund’s subadviser?
The Fund seeks long-term total return by investing primarily in equity securities of issuers that the Fund’s subadviser believes are undervalued. Under normal circumstances, the Fund invests at least 80% of its net assets (plus the amount of any borrowings for investment purposes) in equity securities, with a focus on companies with large market capitalizations (which the subadviser believes are generally above $2 billion). The Fund’s subadviser is Wellington Management Company LLP (Wellington Management).
How did the Fund perform during the 12 months ended December 31, 2016?
The Fund’s Class II shares returned 13.25%, underperforming the 17.34% return of the Russell 1000® Value Index (the “benchmark”), an unmanaged index consisting of those Russell 1000 securities (representing the 1,000 largest U.S. companies, based on market capitalization) with greater than average value orientation that tend to exhibit lower price-to-book ratios and lower forecasted growth rates than securities in the growth universe.
For a discussion on the economic and market environment during the 12-month period ended December 31, 2016, please see the Economic and Market Overview, beginning on page 3.
Subadviser discussion of factors that contributed to the Fund’s performance
Security selection within the financials, industrials, health care, and information technology sectors detracted from the Fund’s relative performance for the year ended December 31, 2016. The Fund’s overweight allocation, relative to the benchmark, to the consumer discretionary sector, which lagged the broader index, also weighed on returns. Negative relative results were partially offset by stronger security selection within the energy sector as well as an underweight exposure to the real estate and financials sectors.
Turning to Fund holdings, top detractors from benchmark-relative performance included Norwegian Cruise Line (in the consumer discretionary sector), Bristol-Myers Squibb (health care), and Invesco (financials). Norwegian Cruise Line, a cruise ship operator, was primarily impacted by investor concerns over demand in Europe and China. However, Fund management believes that the prospects for revenue growth in the cruise industry are good, driven by a favorable supply/demand balance. Bristol-Myers Squibb is a global biopharmaceutical company whose trial for immuno-oncology drug Opdivo failed during the third quarter, driving the stock lower. Fund management maintains a favorable view on the long-term potential of immuno-oncology and the company’s strong position in the space. Invesco’s stock price was negatively impacted during the second quarter of the year, driven largely by their exposure to non-U.S. markets and foreign currencies. Brexit, in particular, weighed on the stock, as about 20% of the company’s earnings per share come from the U.K. business. (“Brexit” – an abbreviation for “British exit” – was the United Kingdom’s surprising June 23, 2016 referendum to leave the European Union.)
Top contributors to benchmark-relative results included Fund holdings Halliburton (energy) and JPMorgan Chase (financials). Shares of Halliburton, an oil field services company, rose with energy prices which, along with recent capital allocation actions, improved the balance sheets and long-term prospects for the company. JPMorgan Chase is a multinational banking and financial services company. Shares of financial stocks broadly, and JPMorgan specifically, benefited from the anticipation that the Trump administration will roll back some post-financial crisis regulations.
Subadviser outlook
We believe that there is the potential for solid growth in the U.S. economy in 2017, supported by continued growth in consumer spending and an increase in investment levels. Inventories, which have hampered growth over the last five quarters, appear to be in better balance heading into 2017, and in our view, should no longer pose a meaningful drag on the economy. We believe that decreased regulation, lower tax rates, and the potential for increased infrastructure spending could also support the economy in the coming year. On the negative side, in our opinion, the strong U.S. dollar and uncertainty surrounding foreign policy and global trade have the potential to weigh on growth in 2017.
At the end of the year, the Fund’s largest overweight allocations were in the consumer discretionary and information technology sectors, and its largest underweight stake was in real estate.
24
Table of Contents
MML Fundamental Value Fund – Portfolio Manager Report (Unaudited) (Continued)
| MML Fundamental Value Fund Largest Holdings (% of Net Assets) on 12/31/16 | ||||
JP Morgan Chase & Co. | 4.9 | % | ||
Wells Fargo & Co. | 3.9 | % | ||
Cisco Systems, Inc. | 2.9 | % | ||
Citigroup, Inc. | 2.7 | % | ||
The PNC Financial Services Group, Inc. | 2.7 | % | ||
Chevron Corp. | 2.6 | % | ||
Merck & Co., Inc. | 2.6 | % | ||
Intel Corp. | 2.2 | % | ||
General Electric Co. | 2.0 | % | ||
Chubb Ltd. | 1.7 | % | ||
|
| |||
| 28.2 | % | |||
|
| |||
| MML Fundamental Value Fund Sector Table (% of Net Assets) on 12/31/16 | ||||
Financial | 28.3 | % | ||
Consumer, Non-cyclical | 15.9 | % | ||
Energy | 12.3 | % | ||
Industrial | 11.3 | % | ||
Communications | 10.8 | % | ||
Technology | 8.7 | % | ||
Consumer, Cyclical | 6.3 | % | ||
Utilities | 3.4 | % | ||
Basic Materials | 2.7 | % | ||
|
| |||
Total Long-Term Investments | 99.7 | % | ||
Short-Term Investments and Other Assets and Liabilities | 0.3 | % | ||
|
| |||
Net Assets | 100.0 | % | ||
|
| |||
25
Table of Contents
MML Fundamental Value Fund – Portfolio Manager Report (Unaudited) (Continued)
Growth of a $10,000 Investment
Hypothetical Investments in MML Fundamental Value Fund Class II and the Russell 1000 Value Index.
| TOTAL RETURN | One Year 1/1/16 - 12/31/16 | Five Year Average Annual 1/1/12 - 12/31/16 | Since Inception Average Annual 8/10/10 - 12/31/16 | |||||||||
| Class II | 13.25% | 13.24% | 11.82% | |||||||||
| Russell 1000 Value Index | 17.34% | 14.80% | 13.37% | |||||||||
Hypothetical Investments in MML Fundamental Value Fund Service Class I and the Russell 1000 Value Index.
| TOTAL RETURN | One Year 1/1/16 - 12/31/16 | Since Inception Average Annual 5/1/12 - 12/31/16 | ||||||||||
| Service Class I | 13.05% | 11.28% | ||||||||||
| Russell 1000 Value Index | 17.34% | 13.58% | ||||||||||
GROWTH OF $10,000 INVESTMENT SINCE INCEPTION
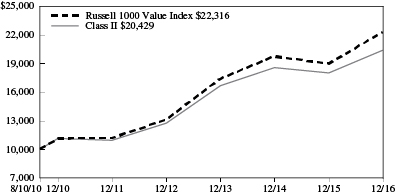
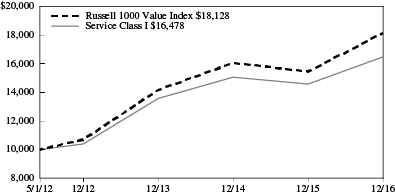
Generally accepted accounting principles require adjustments to be made to the net assets of the Fund at period end for financial reporting purposes only, and as such, the total return based on the unadjusted net asset value per share may differ from the total return reported in the financial highlights.
Performance data quoted represents past performance; past performance is not predictive of future results. The investment return and principal value of shares of the Fund will fluctuate with market conditions so that shares of the Fund, when redeemed, may be worth more or less than their original cost. Current performance of the Fund may be lower or higher than the performance quoted. Performance data current to the most recent month end may be obtained by accessing the website www.massmutual.com.
Investors should note that the Fund is a professionally managed mutual fund, while the Russell 1000 Value Index is unmanaged, does not incur expenses, and cannot be purchased directly by investors. Investors should read the Fund’s prospectus with regard to the Fund’s investment objective, risks, and charges and expenses in conjunction with these financial statements. The Fund’s return reflects changes in the net asset value per share without the deduction of any product charges (e.g., cost of insurance, mortality and expense risk charges, administrative fees, and CDSL). The inclusion of these charges would have reduced the performance shown here.
26
Table of Contents
MML Global Fund – Portfolio Manager Report (Unaudited)
What is the investment approach of MML Global Fund, and who is the Fund’s subadviser?
The Fund seeks long-term capital appreciation by investing primarily in the equity securities of U.S. and foreign companies, including companies in developed and emerging markets. The Fund may invest a large percentage of its assets in issuers in a single country, a small number of countries, or a particular geographic region. The Fund’s subadviser is Massachusetts Financial Services Company (MFS).
How did the Fund perform during the 12 months ended December 31, 2016?
The Fund’s Class I shares returned 7.55%, modestly outperforming the 7.51% return of the MSCI World Index (the “benchmark”), an unmanaged index of issuers listed on the stock exchanges of 22 foreign countries and the U.S.
For a discussion on the economic and market environment during the 12-month period ended December 31, 2016, please see the Economic and Market Overview, beginning on page 3.
Subadviser discussion of factors that contributed to the Fund’s performance
Strong security selection in the health care, retail, and transportation sectors benefited the Fund’s relative performance for the year ended December 31, 2016. Within the health care sector, the Fund’s overweight positions, relative to the benchmark in two Fund holdings – cardiovascular medical device maker St. Jude Medical and medical equipment manufacturer Stryker – lifted relative returns. Within the retail sector, the Fund’s overweight stake in luxury goods company LVMH (France) aided relative results. Lastly, within the transportation sector, the Fund’s overweight allocation to strong-performing railroad company Canadian National Railway (Canada) and delivery service company United Parcel Service buoyed relative performance, as both Fund holdings outpaced the benchmark over the reporting period. Fund holdings in other sectors that supported relative full-year returns included media firm Time Warner, financial services firm Goldman Sachs, custody bank State Street, semiconductor manufacturer Microchip Technology, and South Korean microchip and electronics manufacturer Samsung Electronics, which is not a benchmark constituent. The Fund was overweight in all of these holdings.
Detracting from the Fund’s 2016 relative performance were stock selection and an overweight position in the consumer staples sector. Within this sector, overweight positions in beauty product manufacturer Coty and household products manufacturer Reckitt Benckiser Group (United Kingdom) held back relative results, as both Fund holdings lagged the benchmark during the reporting period. In addition, an underweight position in the strong-performing energy sector and security selection in the basic materials sector also weighed on the Fund’s relative returns. Elsewhere, holding back relative performance were overweight positions in several underperforming Fund holdings, including health care products maker Bayer (Germany), satellite television broadcaster Sky (United Kingdom), investment management and banking firm UBS (Switzerland), medical device maker Medtronic, pharmaceutical and diagnostic company Roche Holding (Switzerland), life sciences supply company Thermo Fisher Scientific, and hotel and restaurant operator Whitbread (United Kingdom). Not holding shares of strong-performing global financial services firm JPMorgan Chase also hampered the Fund’s full-year relative performance. During the reporting period, the Fund’s relative currency exposure, resulting primarily from differences between the Fund’s and the benchmark’s exposures to holdings of securities denominated in foreign currencies, detracted from relative performance.
Subadviser outlook
Whether the outcome of the 2016 U.S. presidential election should be considered a positive or negative for investors remains to be seen. But what is clear, both in Europe and in the U.S., is that anti-globalization has become and could remain a potent force. Upcoming national elections in France and Germany, for example, could be impacted to varying degrees by the backlash against globalization. It’s important to keep all of this in perspective, however. One thing investors learned from “Brexit” (an abbreviation for “British exit”), the United Kingdom’s surprising June 2016 referendum to leave the European Union (EU), is that even unexpected outcomes don’t always lead to expected results. Although observers expected equity markets to react poorly to the vote to leave the EU, in the wake of the referendum and after a few days of volatility, U.K. stock markets performed quite well, so investors who reacted rashly to the negative headlines missed the rebound. Our view continues to be that by focusing on company fundamentals rather than headlines, investors can take advantage of investment opportunities that may become available as a result of volatility.
27
Table of Contents
MML Global Fund – Portfolio Manager Report (Unaudited) (Continued)
| MML Global Fund Largest Holdings (% of Net Assets) on 12/31/16 | ||||
Thermo Fisher Scientific, Inc. | 2.7 | % | ||
Bayer AG | 2.6 | % | ||
Nestle SA | 2.6 | % | ||
Honeywell International, Inc. | 2.5 | % | ||
Time Warner, Inc. | 2.4 | % | ||
Accenture PLC Class A | 2.3 | % | ||
The Walt Disney Co. | 2.3 | % | ||
Reckitt Benckiser Group PLC | 2.1 | % | ||
Visa, Inc. Class A | 2.1 | % | ||
Stryker Corp. | 2.0 | % | ||
|
| |||
| 23.6 | % | |||
|
| |||
| MML Global Fund Sector Table (% of Net Assets) on 12/31/16 | ||||
Consumer, Non-cyclical | 37.2 | % | ||
Industrial | 15.2 | % | ||
Financial | 11.5 | % | ||
Communications | 10.3 | % | ||
Consumer, Cyclical | 7.9 | % | ||
Basic Materials | 7.1 | % | ||
Technology | 7.0 | % | ||
Diversified | 1.8 | % | ||
Energy | 1.4 | % | ||
Mutual Funds | 1.3 | % | ||
|
| |||
Total Long-Term Investments | 100.7 | % | ||
Short-Term Investments and Other Assets and Liabilities | (0.7 | )% | ||
|
| |||
Net Assets | 100.0 | % | ||
|
| |||
28
Table of Contents
MML Global Fund – Portfolio Manager Report (Unaudited) (Continued)
Growth of a $10,000 Investment
Hypothetical Investments in MML Global Fund Class I, Class II, and the MSCI World Index.
| TOTAL RETURN | One Year 1/1/16 - 12/31/16 | Five Year Average Annual 1/1/12 - 12/31/16 | Ten Year Average Annual 1/1/07 - 12/31/16 | |||||||||
| Class I | 7.55% | 11.82% | 3.80% | |||||||||
| Class II | 7.54% | 11.88% | 3.94% | |||||||||
| MSCI World Index | 7.51% | 10.41% | 3.83% | |||||||||
Hypothetical Investments in MML Global Fund Service Class I and the MSCI World Index.
| TOTAL RETURN | One Year 1/1/16 - 12/31/16 | Five Year Average Annual 1/1/12 - 12/31/16 | Since Inception Average Annual 8/15/08 - 12/31/16 | |||||||||
| Service Class I | 7.34% | 11.53% | 6.00% | |||||||||
| MSCI World Index | 7.51% | 10.41% | 5.37% | |||||||||
GROWTH OF $10,000 INVESTMENT FOR THE PAST 10 YEARS
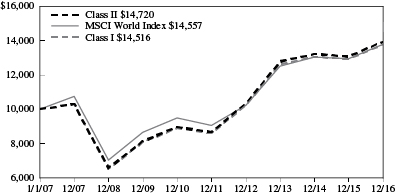
GROWTH OF $10,000 INVESTMENT SINCE INCEPTION
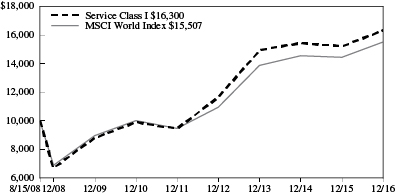
Generally accepted accounting principles require adjustments to be made to the net assets of the Fund at period end for financial reporting purposes only, and as such, the total return based on the unadjusted net asset value per share may differ from the total return reported in the financial highlights.
Performance data quoted represents past performance; past performance is not predictive of future results. The investment return and principal value of shares of the Fund will fluctuate with market conditions so that shares of the Fund, when redeemed, may be worth more or less than their original cost. Current performance of the Fund may be lower or higher than the performance quoted. Performance data current to the most recent month end may be obtained by accessing the website www.massmutual.com.
Investors should note that the Fund is a professionally managed mutual fund, while the MSCI World Index is unmanaged, does not incur expenses, and cannot be purchased directly by investors. Investors should read the Fund’s prospectus with regard to the Fund’s investment objective, risks, and charges and expenses in conjunction with these financial statements. The Fund’s return reflects changes in the net asset value per share without the deduction of any product charges (e.g., cost of insurance, mortality and expense risk charges, administrative fees, and CDSL). The inclusion of these charges would have reduced the performance shown here.
29
Table of Contents
MML Growth & Income Fund – Portfolio Manager Report (Unaudited)
What is the investment approach of MML Growth & Income Fund, and who is the Fund’s subadviser?
The Fund seeks capital appreciation and income by investing, under normal circumstances, at least 80% of its net assets (plus the amount of any borrowings for investment purposes) in equity securities and equity-related securities, including convertible securities, preferred stocks, options, and warrants, of U.S. companies with market capitalizations at the time of purchase greater than $1 billion. The Fund’s subadviser is Massachusetts Financial Services Company (MFS).
How did the Fund perform during the 12 months ended December 31, 2016?
The Fund’s Initial Class shares returned 8.77%, underperforming the 11.96% return of the S&P 500® Index (the “benchmark”), a widely recognized, unmanaged index representative of common stocks of larger capitalized U.S. companies.
For a discussion on the economic and market environment during the 12-month period ended December 31, 2016, please see the Economic and Market Overview, beginning on page 3.
Subadviser discussion of factors that contributed to the Fund’s performance
For the year ended December 31, 2016, stock selection in the health care sector detracted from the Fund’s performance relative to the benchmark. Most notably, specialty pharmaceutical company Valeant Pharmaceuticals International (Canada), which is not a benchmark constituent, was one Fund holding that detracted from relative performance. Similarly, the Fund’s overweight positions, relative to the benchmark, in drug maker Endo Pharmaceuticals (also not represented in the S&P 500 Index), eye care and skin care products company Allergan, health services and information technology company McKesson, life sciences supply company Thermo Fisher Scientific, and pharmaceutical company Eli Lilly dampened relative performance, as all five of these Fund holdings underperformed during the reporting period. We eliminated the Fund’s positions in Valeant Pharmaceuticals and Endo Pharmaceuticals before year end. Elsewhere, the Fund’s overweight positions in information technology company Cognizant Technology and global payments technology company Visa hurt relative results, as did not owning shares of integrated energy company Chevron.
The Fund’s cash and cash equivalents position during the period also detracted from relative performance, since the benchmark holds no cash position. While the Fund strives to be fully invested, it generally also holds a cash position to buy new holdings and to provide liquidity. In the period when markets rose sharply following the U.S. presidential election, holding this cash position further detracted from relative performance.
Contributing to the Fund’s relative performance for the year was its overweight position and stock selection in the financial services sector. With respect to specific Fund holdings, overweight positions in financial services firms Bank of America, JPMorgan Chase, Goldman Sachs, and Morgan Stanley all proved beneficial. In other sectors, the Fund’s overweight positions in media firm Time Warner, energy exploration and production company EOG Resources, global provider of banking and payment technologies Fidelity National Information Services, broadband communications and networking services provider Broadcom, and medical equipment manufacturer Stryker all aided relative performance. Not owning shares of biotechnology firm Gilead Sciences also bolstered the Fund’s relative full-year results.
Subadviser outlook
Whether the outcome of the 2016 U.S. presidential election should be considered a positive or negative for investors remains to be seen. But what is clear, both in Europe and in the U.S., is that anti-globalization has become and could remain a potent force. Upcoming national elections in France and Germany, for example, could be impacted to varying degrees by the backlash against globalization. It’s important to keep all of this in perspective, however. One thing investors learned from “Brexit” (an abbreviation for “British exit”), the United Kingdom’s surprising June 2016 referendum to leave the European Union (EU), is that even unexpected outcomes don’t always lead to expected results. Although observers expected equity markets to react poorly to the vote to leave the EU, in the wake of the referendum and after a few days of volatility, U.K. stock markets performed quite well, so investors who reacted rashly to the negative headlines missed the rebound. Our view continues to be that by focusing on company fundamentals rather than headlines, investors can take advantage of investment opportunities that may become available as a result of volatility.
30
Table of Contents
MML Growth & Income Fund – Portfolio Manager Report (Unaudited) (Continued)
| MML Growth & Income Fund Largest Holdings (% of Net Assets) on 12/31/16 | ||||
JP Morgan Chase & Co. | 4.3 | % | ||
Bank of America Corp. | 3.6 | % | ||
Visa, Inc. Class A | 2.9 | % | ||
Alphabet, Inc. Class A | 2.6 | % | ||
The Goldman Sachs Group, Inc. | 2.5 | % | ||
Thermo Fisher Scientific, Inc. | 2.4 | % | ||
American Tower Corp. | 2.4 | % | ||
Schlumberger Ltd. | 2.3 | % | ||
Broadcom Ltd. | 2.3 | % | ||
Danaher Corp. | 2.1 | % | ||
|
| |||
| 27.4 | % | |||
|
| |||
| MML Growth & Income Fund Sector Table (% of Net Assets) on 12/31/16 | ||||
Consumer, Non-cyclical | 26.3 | % | ||
Financial | 23.3 | % | ||
Technology | 11.7 | % | ||
Communications | 10.7 | % | ||
Industrial | 9.4 | % | ||
Consumer, Cyclical | 7.4 | % | ||
Energy | 4.9 | % | ||
Basic Materials | 3.6 | % | ||
Diversified | 1.5 | % | ||
Utilities | 0.5 | % | ||
|
| |||
Total Long-Term Investments | 99.3 | % | ||
Short-Term Investments and Other Assets and Liabilities | 0.7 | % | ||
|
| |||
Net Assets | 100.0 | % | ||
|
| |||
31
Table of Contents
MML Growth & Income Fund – Portfolio Manager Report (Unaudited) (Continued)
Growth of a $10,000 Investment
Hypothetical Investments in MML Growth & Income Fund Initial Class and the S&P 500 Index.
| TOTAL RETURN | One Year 1/1/16 - 12/31/16 | Five Year Average Annual 1/1/12 - 12/31/16 | Ten Year Average Annual 1/1/07 - 12/31/16 | |||||||||
| Initial Class | 8.77% | 13.99% | 4.85% | |||||||||
| S&P 500 Index | 11.96% | 14.66% | 6.95% | |||||||||
Hypothetical Investments in MML Growth & Income Fund Service Class and the S&P 500 Index.
| TOTAL RETURN | One Year 1/1/16 - 12/31/16 | Five Year Average Annual 1/1/12 - 12/31/16 | Since Inception Average Annual 8/15/08 - 12/31/16 | |||||||||
| Service Class | 8.50% | 13.72% | 7.26% | |||||||||
| S&P 500 Index | 11.96% | 14.66% | 9.13% | |||||||||
GROWTH OF $10,000 INVESTMENT FOR THE PAST 10 YEARS
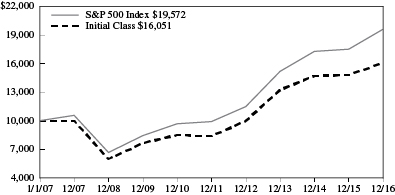
GROWTH OF $10,000 INVESTMENT SINCE INCEPTION
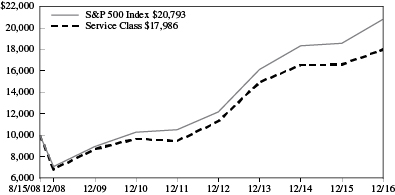
Generally accepted accounting principles require adjustments to be made to the net assets of the Fund at period end for financial reporting purposes only, and as such, the total return based on the unadjusted net asset value per share may differ from the total return reported in the financial highlights.
Performance data quoted represents past performance; past performance is not predictive of future results. The investment return and principal value of shares of the Fund will fluctuate with market conditions so that shares of the Fund, when redeemed, may be worth more or less than their original cost. Current performance of the Fund may be lower or higher than the performance quoted. Performance data current to the most recent month end may be obtained by accessing the website www.massmutual.com.
Investors should note that the Fund is a professionally managed mutual fund, while the S&P 500 Index is unmanaged, does not incur expenses, and cannot be purchased directly by investors. Investors should read the Fund’s prospectus with regard to the Fund’s investment objective, risks, and charges and expenses in conjunction with these financial statements. The Fund’s return reflects changes in the net asset value per share without the deduction of any product charges (e.g., cost of insurance, mortality and expense risk charges, administrative fees, and CDSL). The inclusion of these charges would have reduced the performance shown here.
32
Table of Contents
MML Income & Growth Fund – Portfolio Manager Report (Unaudited)
What is the investment approach of MML Income & Growth Fund, and who is the Fund’s subadviser?
The Fund seeks long-term total return and current income by investing primarily in equity securities of dividend paying companies that the Fund’s subadviser believes will both increase in value over the long term and provide current income. The Fund will focus on issuers that have good prospects for capital appreciation. The Fund’s subadviser is BlackRock Investment Management, LLC (BlackRock).
How did the Fund perform during the 12 months ended December 31, 2016?
The Fund’s Initial Class shares returned 16.40%, outperforming the 11.96% return of the S&P 500® Index (the “benchmark”), a widely recognized, unmanaged index representative of common stocks of larger capitalized U.S. companies. The Fund underperformed the 17.34% return of the Russell 1000® Value Index, an unmanaged index consisting of those Russell 1000 securities (representing the 1,000 largest U.S. companies based on market capitalization) with greater than average value orientation that tend to exhibit lower price-to-book ratios and lower forecasted growth rates than securities in the growth universe.
For a discussion on the economic and market environment during the 12-month period ended December 31, 2016, please see the Economic and Market Overview, beginning on page 3.
Subadviser discussion of factors that contributed to the Fund’s performance
Entering 2016, Fund management positioned the Fund to benefit from the maturing U.S. business cycle and the slow-growth environment we anticipated could unfold over time. The Fund’s largest sector allocations were in the financials, health care, and industrials sectors.
The largest contributor to relative performance for the year ended December 31, 2016 was stock selection in the health care sector. Notably contributing to the Fund’s performance in that sector were overweight positions, relative to the benchmark, in Fund holdings UnitedHealth Group Inc., a health plan provider; and Quest Diagnostics Inc., a low-cost provider of lab services. UnitedHealth outperformed due to above-consensus growth in its Optum business and robust membership gains within its Medicare, Medicaid, and commercial segments. Shares of Quest Diagnostics advanced due to solid pricing growth amid the continued shift to more complex specialized testing. Within financials, the Fund’s large overweight position in banks also proved beneficial. Bank earnings in the second half of 2016 were generally positive and relative outperformance accelerated following the U.S. presidential election. Valuation multiples expanded during the period, reflecting investor expectations for an acceleration in U.S. nominal gross domestic product (GDP) growth and potentially rising interest rates. (GDP reflects the total value of goods and services produced in the United States.) Momentum in the banking industry also accelerated based on investor expectations for the incoming administration to enact pro-business policies, which could include a reduction in regulatory burdens. Lastly, an underweight position in real estate added to the Fund’s relative performance for the year.
The largest detractor from relative performance in 2016 was a combination of stock selection and allocation decisions in the industrials sector. Notably, underweight stakes in the machinery and airlines industries dampened relative returns. Stock selection in the consumer staples sector also hurt the Fund’s relative full-year performance. There, non-benchmark Fund holding Kroger Co., a grocery store operator, lagged after lowering 2016 projections and reporting lower-than-expected earnings, due in part to food deflation and increasing competition. Lastly, an underweight allocation to the energy sector and the metals & mining industry also detracted from the Fund’s relative returns for the year.
Subadviser outlook
One could characterize our investment outlook for 2017 as cautiously optimistic. Donald Trump’s U.S. presidential election victory has fueled investor expectations for large tax cuts, increased infrastructure spending, and reduced government regulation – and amplified U.S. growth expectations. To the extent that these assumptions can translate to stronger economic growth, our view is that stocks have the potential to reap further gains in this business cycle.
33
Table of Contents
MML Income & Growth Fund – Portfolio Manager Report (Unaudited) (Continued)
| MML Income & Growth Fund Largest Holdings (% of Net Assets) on 12/31/16 | ||||
Bank of America Corp. | 4.2 | % | ||
JP Morgan Chase & Co. | 3.8 | % | ||
Pfizer, Inc. | 3.4 | % | ||
Wells Fargo & Co. | 2.9 | % | ||
Citigroup, Inc. | 2.8 | % | ||
General Electric Co. | 2.6 | % | ||
Microsoft Corp. | 2.2 | % | ||
Oracle Corp. | 2.0 | % | ||
Merck & Co., Inc. | 2.0 | % | ||
Occidental Petroleum Corp. | 1.8 | % | ||
|
| |||
| 27.7 | % | |||
|
| |||
| MML Income & Growth Fund Sector Table (% of Net Assets) on 12/31/16 | ||||
Financial | 27.7 | % | ||
Consumer, Non-cyclical | 21.5 | % | ||
Energy | 12.0 | % | ||
Industrial | 9.1 | % | ||
Technology | 8.5 | % | ||
Communications | 5.7 | % | ||
Utilities | 4.8 | % | ||
Basic Materials | 3.4 | % | ||
Consumer, Cyclical | 3.1 | % | ||
|
| |||
Total Long-Term Investments | 95.8 | % | ||
Short-Term Investments and Other Assets and Liabilities | 4.2 | % | ||
|
| |||
Net Assets | 100.0 | % | ||
|
| |||
34
Table of Contents
MML Income & Growth Fund – Portfolio Manager Report (Unaudited) (Continued)
Growth of a $10,000 Investment
Hypothetical Investments in MML Income & Growth Fund Initial Class, the S&P 500 Index, and the Russell 1000 Value Index.
| TOTAL RETURN | One Year 1/1/16 - 12/31/16 | Five Year Average Annual 1/1/12 - 12/31/16 | Ten Year Average Annual 1/1/07 - 12/31/16 | |||||||||
| Initial Class | 16.40% | 12.12% | 4.80% | |||||||||
| S&P 500 Index* | 11.96% | 14.66% | 6.95% | |||||||||
| Russell 1000 Value Index | 17.34% | 14.80% | 5.72% | |||||||||
Hypothetical Investments in MML Income & Growth Fund Service Class, the S&P 500 Index, and the Russell 1000 Value Index.
| TOTAL RETURN | One Year 1/1/16 - 12/31/16 | Five Year Average Annual 1/1/12 - 12/31/16 | Since Inception Average Annual 8/15/08 - 12/31/16 | |||||||||
| Service Class | 16.10% | 11.84% | 7.10% | |||||||||
| S&P 500 Index* | 11.96% | 14.66% | 9.13% | |||||||||
| Russell 1000 Value Index | 17.34% | 14.80% | 8.60% | |||||||||
GROWTH OF $10,000 INVESTMENT FOR THE PAST 10 YEARS
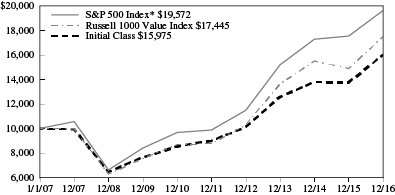
GROWTH OF $10,000 INVESTMENT SINCE INCEPTION
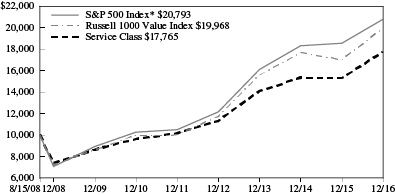
Generally accepted accounting principles require adjustments to be made to the net assets of the Fund at period end for financial reporting purposes only, and as such, the total return based on the unadjusted net asset value per share may differ from the total return reported in the financial highlights.
* Benchmark
Performance data quoted represents past performance; past performance is not predictive of future results. The investment return and principal value of shares of the Fund will fluctuate with market conditions so that shares of the Fund, when redeemed, may be worth more or less than their original cost. Current performance of the Fund may be lower or higher than the performance quoted. Performance data current to the most recent month end may be obtained by accessing the website www.massmutual.com.
Investors should note that the Fund is a professionally managed mutual fund, while the S&P 500 Index and the Russell 1000 Value Index are unmanaged, do not incur expenses, and cannot be purchased directly by investors. Investors should read the Fund’s prospectus with regard to the Fund’s investment objective, risks, and charges and expenses in conjunction with these financial statements. The Fund’s return reflects changes in the net asset value per share without the deduction of any product charges (e.g., cost of insurance, mortality and expense risk charges, administrative fees, and CDSL). The inclusion of these charges would have reduced the performance shown here.
35
Table of Contents
MML International Equity Fund – Portfolio Manager Report (Unaudited)
What is the investment approach of MML International Equity Fund, and who is the Fund’s subadviser?
The Fund seeks long-term capital growth by investing, under normal circumstances, at least 80% of its net assets (plus the amount of any borrowings for investment purposes) in equity securities of non-U.S. companies located in non-U.S. markets throughout the world, including emerging markets. The Fund may invest a substantial portion of its assets in just one region or country and may, but does not currently intend to, invest in U.S. companies. Ordinarily, the Fund’s portfolio typically holds thirty to sixty stocks and the Fund invests in the securities of at least five countries outside the U.S. The Fund’s subadviser is Harris Associates L.P. (Harris).
How did the Fund perform during the 12 months ended December 31, 2016?
The Fund’s Class II shares returned 8.27%, outperforming, by a wide margin, the 2.75% return of the MSCI World Index ex USA (the “benchmark”), an unmanaged index representative of stocks domiciled in 22 global developed markets, excluding the United States.
For a discussion on the economic and market environment during the 12-month period ended December 31, 2016, please see the Economic and Market Overview, beginning on page 3.
Subadviser discussion of factors that contributed to the Fund’s performance
For the year ended December 31, 2016, with respect to both country and sector performance relative to the benchmark, stock selection contributed to the Fund’s results; sector weightings were also beneficial. Country weightings detracted for the reporting period.
From a geographic perspective, Fund holdings in Switzerland, the United Kingdom, and France contributed most to relative performance for the year. Half of the 30 underlying holdings in these countries produced positive absolute returns. Supplying the largest positive returns were three Fund holdings: Switzerland’s materials (metals & mining) company Glencore, U.K.-based financial firm Royal Bank of Scotland, and France’s luxury goods company Kering.
From a sector perspective, the best relative performance came from Fund holdings in the materials sector. Materials also produced the largest positive collective absolute return, mainly driven by underlying metals & mining company Glencore. The industrials sector was the next-greatest positive relative performer – and also generated the next-highest absolute return.
A lack of exposure to Canada detracted most from the Fund’s relative performance. Germany was the next-weakest relative performer, as all four of the Fund’s holdings there lost value. Mexico supplied the third-worst relative results, owing to the Fund’s single underlying holding, media and broadcasting company Grupo Televisa, which declined sharply.
From a sector perspective, Fund holdings in the financials sector produced the worst relative results, as nine of 14 holdings within that market segment declined for the period. A lack of exposure to energy and consumer discretionary holdings made these sectors the next-weakest relative performers.
With respect to currency exposures, the Fund held hedges on the Australian dollar and Swiss franc. (Currency hedges are financial contracts that are put in place to help protect against changes in currency exchange rates.) During the year, approximately 10% of the underlying Australian dollar and 23% of the underlying franc were hedged. We believe these currencies appreciated above the range of their intrinsic values, as measured by purchasing power parity and other economic fundamentals. Overall, currency hedges contributed to the Fund’s cumulative performance for the year.
Subadviser outlook
Major global market movements in the fourth quarter were largely influenced by the result of November’s U.S. presidential election, capping a year in which markets finished stronger than they started. As value investors, we feel that our key task is to see through the haze generated by market pundits who are overly influenced by geopolitical events such as referendums and elections. Instead, we focus on the fundamental drivers of long-term cash flows. We seek to make investment decisions based on a company’s ability to generate and sustain a growing cash flow stream. While the market chased stable stocks in the face of uncertainty, we felt the attractive valuations in financials and cyclically exposed areas of the market provided more safety.
36
Table of Contents
MML International Equity Fund – Portfolio Manager Report (Unaudited) (Continued)
| MML International Equity Fund Largest Holdings (% of Net Assets) on 12/31/16 | ||||
Glencore PLC | 4.2 | % | ||
Lloyds Banking Group PLC | 3.9 | % | ||
BNP Paribas | 3.6 | % | ||
Intesa Sanpaolo SpA | 3.5 | % | ||
Daimler AG | 3.5 | % | ||
Allianz SE | 3.5 | % | ||
Credit Suisse Group | 3.5 | % | ||
CNH Industrial NV | 3.4 | % | ||
Honda Motor Co. Ltd. | 2.5 | % | ||
Toyota Motor Corp. | 2.2 | % | ||
|
| |||
| 33.8 | % | |||
|
| |||
| MML International Equity Fund Sector Table (% of Net Assets) on 12/31/16 | ||||
Financial | 30.7 | % | ||
Consumer, Cyclical | 23.7 | % | ||
Industrial | 16.2 | % | ||
Consumer, Non-cyclical | 12.0 | % | ||
Basic Materials | 6.7 | % | ||
Communications | 3.9 | % | ||
Technology | 2.7 | % | ||
Diversified | 1.7 | % | ||
Mutual Funds | 0.1 | % | ||
|
| |||
Total Long-Term Investments | 97.7 | % | ||
Short-Term Investments and Other Assets and Liabilities | 2.3 | % | ||
|
| |||
Net Assets | 100.0 | % | ||
|
| |||
37
Table of Contents
MML International Equity Fund – Portfolio Manager Report (Unaudited) (Continued)
Growth of a $10,000 Investment
Hypothetical Investments in MML International Equity Fund Class II and the MSCI World Index ex USA.
| TOTAL RETURN | One Year 1/1/16 - 12/31/16 | Since Inception Average Annual 1/7/14 - 12/31/16 | ||||||
| Class II | 8.27% | -0.58% | ||||||
| MSCI World Index ex USA | 2.75% | -1.20% | ||||||
Hypothetical Investments in MML International Equity Fund Service Class I and the MSCI World Index ex USA.
| TOTAL RETURN | One Year 1/1/16 - 12/31/16 | Since Inception Average Annual 5/1/14 - 12/31/16 | ||||||
| Service Class I | 7.97% | -1.96% | ||||||
| MSCI World Index ex USA | 2.75% | -2.62% | ||||||
GROWTH OF $10,000 INVESTMENT SINCE INCEPTION
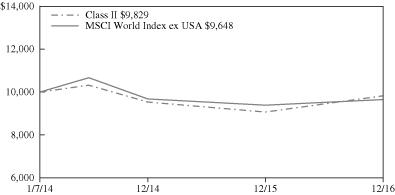
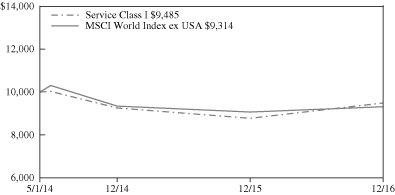
Generally accepted accounting principles require adjustments to be made to the net assets of the Fund at period end for financial reporting purposes only, and as such, the total return based on the unadjusted net asset value per share may differ from the total return reported in the financial highlights.
Performance data quoted represents past performance; past performance is not predictive of future results. The investment return and principal value of shares of the Fund will fluctuate with market conditions so that shares of the Fund, when redeemed, may be worth more or less than their original cost. Current performance of the Fund may be lower or higher than the performance quoted. Performance data current to the most recent month end may be obtained by accessing the website www.massmutual.com.
Investors should note that the Fund is a professionally managed mutual fund, while the MSCI World Index ex USA is unmanaged, does not incur expenses, and cannot be purchased directly by investors. Investors should read the Fund’s prospectus with regard to the Fund’s investment objective, risks, and charges and expenses in conjunction with these financial statements. The Fund’s return reflects changes in the net asset value per share without the deduction of any product charges (e.g., cost of insurance, mortality and expense risk charges, administrative fees, and CDSL). The inclusion of these charges would have reduced the performance shown here.
38
Table of Contents
MML Large Cap Growth Fund – Portfolio Manager Report (Unaudited)
What is the investment approach of MML Large Cap Growth Fund, and who is the Fund’s subadviser?
The Fund seeks long-term capital appreciation by investing primarily in large-capitalization companies that the Fund’s subadviser believes offer the potential for long-term growth. Under normal circumstances, the Fund invests at least 80% of its net assets (plus the amount of any borrowings for investment purposes) in the common stocks of companies whose market capitalizations at the time of purchase are within the market capitalization range of companies included in the Russell 1000® Growth Index. Effective December 7, 2016, Loomis, Sayles & Company, L.P. (Loomis Sayles) replaced Rainier Investment Management, LLC (Rainier) as subadviser to the Fund.
How did the Fund perform during the 12 months ended December 31, 2016?
The Fund’s Initial Class shares returned -0.38%, significantly underperforming the 7.08% return of the Russell 1000 Growth Index (the “benchmark”), an unmanaged index consisting of those Russell 1000 securities (representing the 1,000 largest U.S. companies based on market capitalization) with greater than average growth orientation that tend to exhibit higher price-to-book ratios and higher forecasted growth rates than securities in the value universe.
For a discussion on the economic and market environment during the 12-month period ended December 31, 2016, please see the Economic and Market Overview, beginning on page 3.
Subadviser discussion of factors that contributed to the Fund’s performance
For the time Rainier served as subadviser (January 1, 2016 through December 6, 2016), the Fund underperformed the benchmark primarily due to the growth-oriented technology sector and weakness in health care. The weakest results, relative to the benchmark, came from the technology sector, where underperformance in two Fund holdings – Palo Alto Networks, a provider of enterprise network security; and customer relationship management software company Salesforce.com – weighed on results. An ill-timed exit from another Fund holding, technology giant Apple, also negatively impacted performance. Health care shares also detracted from performance, as several of the Fund’s holdings experienced headwinds from pricing concerns in the biotechnology and pharmaceutical industries.
Contributing to the Fund’s results for the reporting period was Fund holding Applied Materials, which supplies equipment, services, and software to enable the manufacturing of semiconductor chips for electronics, computer display screens, smartphones, televisions, and solar products. It was up 72% for the period. Energy stocks were the top contributor to the Fund’s relative performance: WTI crude oil prices bottomed at $26 per barrel in February of 2016 and rallied to $53 per barrel by year end. Improving economic growth and favorable OPEC commentary regarding production restraints drove the increase. In this environment, several Fund holdings benefited – including Cimarex Energy, Continental Resources, and Concho Resources – all oil exploration and production companies. The Fund’s underweight position, relative to the benchmark, in the real estate sector was also advantageous to relative results. In the cyclical sectors of industrials and materials, the best performers were Delta Air Lines, which traded up on the prospect of positive passenger revenue growth in 2017; defense company Raytheon, which benefited from a strong defense spending landscape; and construction aggregate producer Vulcan Materials, a beneficiary of the Trump administration’s infrastructure spending plans.
For the time Loomis Sayles served as subadviser to the Fund (December 7, through December 31, 2016), stock selection in the information technology, health care, and consumer staples sectors detracted, whereas stock selection in the energy and financials sectors, as well as the Fund’s allocation to the consumer discretionary sector, contributed to relative returns.
Subadviser outlook
The Loomis Sayles investment process is characterized by bottom-up, fundamental research and a long-term investment time horizon. The nature of the process leads to lower portfolio turnover rates, and sector positioning is the result of stock selection. At year end, the Fund held an overweight allocation to the information technology, consumer staples, financials, and energy sectors – and underweight stakes in the consumer discretionary, industrials, and health care sectors. The Fund held no positions in the materials, real estate, telecommunications services, or utilities sectors as of December 31, 2016.
39
Table of Contents
MML Large Cap Growth Fund – Portfolio Manager Report (Unaudited) (Continued)
| MML Large Cap Growth Fund Largest Holdings (% of Net Assets) on 12/31/16 | ||||
Amazon.com, Inc. | 7.0 | % | ||
Facebook, Inc. Class A | 6.2 | % | ||
Cisco Systems, Inc. | 5.1 | % | ||
Visa, Inc. Class A | 4.9 | % | ||
Alibaba Group Holding Ltd. Sponsored ADR (Cayman Islands) | 4.5 | % | ||
QUALCOMM, Inc. | 4.3 | % | ||
Oracle Corp. | 4.1 | % | ||
Monster Beverage Corp. | 3.8 | % | ||
The Procter & Gamble Co. | 3.3 | % | ||
The Coca-Cola Co. | 3.2 | % | ||
|
| |||
| 46.4 | % | |||
|
| |||
| MML Large Cap Growth Fund Sector Table (% of Net Assets) on 12/31/16 | ||||
Consumer, Non-cyclical | 36.0 | % | ||
Communications | 30.5 | % | ||
Technology | 16.8 | % | ||
Industrial | 8.6 | % | ||
Consumer, Cyclical | 2.9 | % | ||
Energy | 2.6 | % | ||
Financial | 1.5 | % | ||
|
| |||
Total Long-Term Investments | 98.9 | % | ||
Short-Term Investments and Other Assets and Liabilities | 1.1 | % | ||
|
| |||
Net Assets | 100.0 | % | ||
|
| |||
40
Table of Contents
MML Large Cap Growth Fund – Portfolio Manager Report (Unaudited) (Continued)
Growth of a $10,000 Investment
Hypothetical Investments in MML Large Cap Growth Fund Initial Class and the Russell 1000 Growth Index.
| TOTAL RETURN | One Year 1/1/16 - 12/31/16 | Five Year Average | Ten Year Average Annual 1/1/07 - 12/31/16 | |||||||||
| Initial Class | -0.38% | 12.14% | 6.04% | |||||||||
| Russell 1000 Growth Index | 7.08% | 14.50% | 8.33% | |||||||||
Hypothetical Investments in MML Large Cap Growth Fund Service Class and the Russell 1000 Growth Index.
| TOTAL RETURN | One Year 1/1/16 - 12/31/16 | Five Year Average Annual 1/1/12 - 12/31/16 | Since Inception Average Annual 8/15/08 - 12/31/16 | |||||||||
| Service Class | -0.52% | 11.86% | 7.14% | |||||||||
| Russell 1000 Growth Index | 7.08% | 14.50% | 9.74% | |||||||||
GROWTH OF $10,000 INVESTMENT FOR THE PAST 10 YEARS
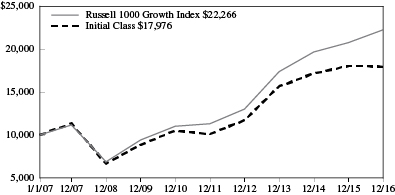
GROWTH OF $10,000 INVESTMENT SINCE INCEPTION
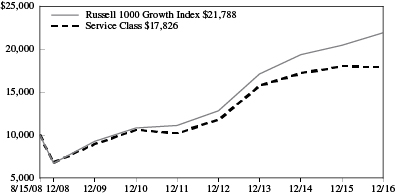
Generally accepted accounting principles require adjustments to be made to the net assets of the Fund at period end for financial reporting purposes only, and as such, the total return based on the unadjusted net asset value per share may differ from the total return reported in the financial highlights.
Performance data quoted represents past performance; past performance is not predictive of future results. The investment return and principal value of shares of the Fund will fluctuate with market conditions so that shares of the Fund, when redeemed, may be worth more or less than their original cost. Current performance of the Fund may be lower or higher than the performance quoted. Performance data current to the most recent month end may be obtained by accessing the website www.massmutual.com.
Investors should note that the Fund is a professionally managed mutual fund, while the Russell 1000 Growth Index is unmanaged, does not incur expenses, and cannot be purchased directly by investors. Investors should read the Fund’s prospectus with regard to the Fund’s investment objective, risks, and charges and expenses in conjunction with these financial statements. The Fund’s return reflects changes in the net asset value per share without the deduction of any product charges (e.g., cost of insurance, mortality and expense risk charges, administrative fees, and CDSL). The inclusion of these charges would have reduced the performance shown here.
41
Table of Contents
MML Managed Volatility Fund – Portfolio Manager Report (Unaudited)
What is the investment approach of MML Managed Volatility Fund and who is the Fund’s subadviser?
The Fund seeks to capture the majority of the returns associated with equity market investments, while exposing investors to less risk than other equity investments. Under normal circumstances, the Fund invests in a broadly diversified portfolio of common stocks, while also selling index call options and purchasing index put options. The Fund’s stock portfolio will have approximately 500 stocks, and seeks to duplicate the investment composition and return of the S&P 500® Index* by holding each stock included in the Index in approximately the same proportion as each stock’s relative weighting in the Index. The Fund’s subadviser is Gateway Investment Advisers, LLC (Gateway).
How did the Fund perform during the 12 months ended December 31, 2016?
The Fund’s Initial Class shares returned 3.69%, underperforming the 11.96% return of the S&P 500 Index, a widely recognized, unmanaged index representative of common stocks of larger capitalized U.S. companies. The Fund outperformed the 2.65% return of the Bloomberg Barclays U.S. Aggregate Bond Index, an unmanaged index of fixed-rate investment-grade securities with at least one year to maturity, combining the Bloomberg Barclays U.S. Treasury Bond Index, the Bloomberg Barclays U.S. Government-Related Bond Index, the Bloomberg Barclays U.S. Corporate Bond Index, and the Bloomberg Barclays U.S. Securitized Bond Index.
For a discussion on the economic and market environment during the 12-month period ended December 31, 2016, please see the Economic and Market Overview, beginning on page 3.
Subadviser discussion of factors that contributed to the Fund’s performance
The strong equity performance of the Fund’s stock portfolio, which mirrors the S&P 500 Index, drove the Fund’s performance in 2016. As is typically the case in a strongly advancing equity market, the Fund’s return on its equity portfolio was moderated by two factors: its hedging strategy of selling S&P 500 Index call options against 95% or more of the value of its S&P 500 Index equity portfolio; and purchasing out-of-the money S&P 500 Index put options on the equity portfolio to mitigate a sudden severe market decline. (A call option is an agreement that gives the owner the ability – if desired – to buy a specified amount of an underlying security at a specified price within a specified period of time. A put option is an agreement that gives the owner the ability – if desired – to sell a specified amount of an underlying security at a specified price within a specified period of time.) It is the net premium-to-earnings from selling index call options, less the price of protective put options, that is a significant factor affecting the Fund’s performance.
More specifically, the Fund’s relatively modest annual return was attributable to the moderate stock market volatility environment throughout 2016, which limited the net index option premiums received during much of the reporting period. Market volatility, as measured by The Chicago Board Options Exchange Volatility Index (the “VIX”), averaged 15.83 for 2016. It hit a high of 28.14 in early February and a low of 11.27 in mid-December. Except for January and February, the VIX spent much of 2016 in a range between 12 and 16. The VIX briefly spiked over 20 in June, and again in early November. The 20 level is approximately the historical long-term average for the VIX. Unlike 2015, volatility quickly contracted in 2016 after each spike, as the market experienced only brief and shallow selloffs, outside of the January and February declines. The selling of index call options hampered Fund performance, and protective puts also detracted from performance for the year.
Subadviser outlook
As a hedged equity manager, Gateway is more focused on market volatility and its effects on portfolio risk, rather than the equity markets in isolation. Our view is that there are many fundamental factors that could affect the underlying environment for the equity market and cause spikes in volatility – including uncertainty surrounding the pace and timing of further interest rate hikes
| * | The S&P 500 Index is a product of S&P Dow Jones Indices LLC (“SPDJI”), and has been licensed for use by MML Advisers. Standard & Poor’s®, S&P® and S&P 500® are registered trademarks of Standard & Poor’s Financial Services LLC (“S&P”); Dow Jones® is a registered trademark of Dow Jones Trademark Holdings LLC (“Dow Jones”); and these trademarks have been licensed for use by SPDJI and sublicensed for certain purposes by MML Advisers. The Fund is not sponsored, endorsed, sold or promoted by SPDJI, Dow Jones, S&P, their respective affiliates, and none of such parties make any representation regarding the advisability of investing in such product(s) nor do they have any liability for any errors, omissions, or interruptions of the S&P 500 Index. |
42
Table of Contents
MML Managed Volatility Fund – Portfolio Manager Report (Unaudited) (Continued)
by the Federal Reserve Board, uncertainty surrounding fiscal policy of the new Trump Administration, concerns over the European banking sector, and weakening economic and credit conditions in China. Geopolitical risks continue to fester, such as events surrounding Russia and the Middle East, as well as in Southeast Asia. Upcoming elections in France and Germany could also have an effect on volatility similar to what occurred in the wake of the Brexit vote. (“Brexit” – an abbreviation for “British exit” – was the United Kingdom’s surprising June 23, 2016 referendum to leave the European Union.)
While Gateway’s investment management team does not try to forecast these types of events, we remain vigilant to their possibility and will continue to manage the Fund’s index option positions in line with the objectives of the Fund – which is to maintain a risk profile that allows for potentially upside participation in the equity market, but with lower volatility.
| MML Managed Volatility Fund Largest Holdings (% of Net Assets) on 12/31/16 | ||||
Apple, Inc. | 3.2 | % | ||
Microsoft Corp. | 2.5 | % | ||
Exxon Mobil Corp. | 1.9 | % | ||
Johnson & Johnson | 1.6 | % | ||
JP Morgan Chase & Co. | 1.6 | % | ||
Berkshire Hathaway, Inc. Class B | 1.6 | % | ||
Amazon.com, Inc. | 1.5 | % | ||
General Electric Co. | 1.4 | % | ||
Facebook, Inc. Class A | 1.4 | % | ||
AT&T, Inc. | 1.3 | % | ||
|
| |||
| 18.0 | % | |||
|
| |||
| MML Managed Volatility Fund Sector Table (% of Net Assets) on 12/31/16 | ||||
Consumer, Non-cyclical | 22.5 | % | ||
Financial | 18.1 | % | ||
Communications | 13.4 | % | ||
Technology | 12.9 | % | ||
Industrial | 10.1 | % | ||
Consumer, Cyclical | 9.1 | % | ||
Energy | 7.4 | % | ||
Utilities | 3.1 | % | ||
Basic Materials | 2.5 | % | ||
Diversified | 0.0 | % | ||
|
| |||
Total Long-Term Investments | 99.1 | % | ||
Short-Term Investments and Other Assets and Liabilities | 0.9 | % | ||
|
| |||
Net Assets | 100.0 | % | ||
|
| |||
43
Table of Contents
MML Managed Volatility Fund – Portfolio Manager Report (Unaudited) (Continued)
Growth of a $10,000 Investment
Hypothetical Investments in MML Managed Volatility Fund Initial Class, the S&P 500 Index, and the Bloomberg Barclays U.S. Aggregate Bond Index.
| TOTAL RETURN | One Year 1/1/16 - 12/31/16 | Five Year Average Annual 1/1/12 - 12/31/16 | Ten Year Average Annual 1/1/07 - 12/31/16 | |||||||||
| Initial Class | 3.69% | 8.26% | 2.87% | |||||||||
| S&P 500 Index* | 11.96% | 14.66% | 6.95% | |||||||||
| Bloomberg Barclays U.S. Aggregate Bond Index | 2.65% | 2.23% | 4.34% | |||||||||
Hypothetical Investments in MML Managed Volatility Fund Service Class, the S&P 500 Index, and the Bloomberg Barclays U.S. Aggregate Bond Index.
| TOTAL RETURN | One Year 1/1/16 - 12/31/16 | Five Year Average Annual 1/1/12 - 12/31/16 | Since Inception Average Annual 8/15/08 - 12/31/16 | |||||||||
| Service Class | 3.42% | 7.99% | 4.31% | |||||||||
| S&P 500 Index* | 11.96% | 14.66% | 9.13% | |||||||||
| Bloomberg Barclays U.S. Aggregate Bond Index | 2.65% | 2.23% | 4.22% | |||||||||
GROWTH OF $10,000 INVESTMENT FOR THE PAST 10 YEARS
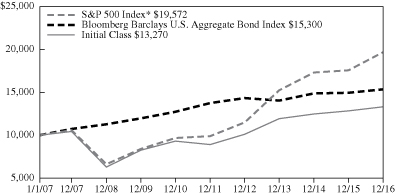
GROWTH OF $10,000 INVESTMENT SINCE INCEPTION
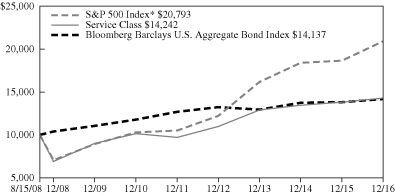
Generally accepted accounting principles require adjustments to be made to the net assets of the Fund at period end for financial reporting purposes only, and as such, the total return based on the unadjusted net asset value per share may differ from the total return reported in the financial highlights.
* Benchmark
Performance data quoted represents past performance; past performance is not predictive of future results. The investment return and principal value of shares of the Fund will fluctuate with market conditions so that shares of the Fund, when redeemed, may be worth more or less than their original cost. Current performance of the Fund may be lower or higher than the performance quoted. Performance data current to the most recent month end may be obtained by accessing the website www.massmutual.com.
Investors should note that the Fund is a professionally managed mutual fund, while the S&P 500 Index and the Bloomberg Barclays U.S. Aggregate Bond Index are unmanaged, do not incur expenses, and cannot be purchased directly by investors. Investors should read the Fund’s prospectus with regard to the Fund’s investment objective, risks, and charges and expenses in conjunction with these financial statements. The Fund’s return reflects changes in the net asset value per share without the deduction of any product charges (e.g., cost of insurance, mortality and expense risk charges, administrative fees, and CDSL). The inclusion of these charges would have reduced the performance shown here.
44
Table of Contents
MML Mid Cap Growth Fund – Portfolio Manager Report (Unaudited)
What is the investment approach of MML Mid Cap Growth Fund, and who is the Fund’s subadviser?
The Fund seeks long-term capital appreciation by investing primarily in equity securities of mid-capitalization companies that the Fund’s subadviser believes offer the potential for above-average earnings growth. Under normal circumstances, the Fund invests at least 80% of its net assets (plus the amount of any borrowings for investment purposes) in a broadly diversified portfolio of common stocks of mid-cap companies whose earnings the subadviser expects to grow at a faster rate than the average company. The Fund’s subadviser is T. Rowe Price Associates, Inc. (T. Rowe Price).
How did the Fund perform during the 12 months ended December 31, 2016?
The Fund’s Initial Class shares returned 6.29%, underperforming the 7.33% return of the Russell Midcap® Growth Index (the “benchmark”), a widely recognized, unmanaged index that measures the performance of those Russell Midcap companies (representing mid-capitalization U.S. common stocks) with higher price-to-book ratios and higher forecasted growth rates than securities in the value universe. The Fund’s 6.29% return underperformed, by a wide margin, the 20.74% return of the S&P MidCap 400® Index, a widely recognized, unmanaged index representative of common stocks of mid-capitalized U.S. companies.
For a discussion on the economic and market environment during the 12-month period ended December 31, 2016, please see the Economic and Market Overview, beginning on page 3.
Subadviser discussion of factors that contributed to the Fund’s performance
For the year ended December 31, 2016, Fund holdings in the financials sector detracted the most from the Fund’s performance – including LPL Financial Holdings, Jones Lang LaSalle, and U.K.-based Willis Towers Watson. Shares of LPL Financial Holdings, the largest independent broker-dealer in the U.S., fell due to an ill-timed, debt-funded share buyback driven by activist investor pressure, as well as a dip in commissions from real estate investment trusts (REITs). The Fund subsequently sold its stake in LPL Financial Holdings. Real estate investment manager Jones Lang LaSalle missed two earnings estimates over the course of the year and faced investor skepticism of its shift toward the lower-margin annuity market as well as its potential exposure to Brexit. (“Brexit” – an abbreviation for “British exit” – was the United Kingdom’s surprising June 2016 referendum to leave the European Union.) Insurance broker and advisory company Willis Towers Watson also struggled, partly due to its exposure to Brexit.
Stock selection and a detrimental underweight, relative to the benchmark, made information technology another area of relative weakness for the Fund during the year. Fund holdings that were underperformers in that market segment included Red Hat and VeriSign. Open-source software leader Red Hat experienced a share price drop due to a sell-off of software names early in the period, a CFO transition, and lower-than-expected billings. VeriSign, which serves as monopoly operator of the dot-com and dot-net domain name registries and also offers security services, struggled in the wake of a prominent U.S. senator’s public call to review pricing terms before renewing VeriSign’s dot-com registry agreement.
Turning to the positive, in telecommunication services, the Fund’s holdings outperformed their benchmark peers – most notably wireless network operator T-Mobile U.S, whose shares rose amid speculation about potential merger and acquisition activity as well as the successful launch of a new unlimited data product. The Fund’s overweight position in industrials and business services also proved beneficial. Stock positioning within the materials sector helped as well, particularly the Fund’s exposure to Martin Marietta Materials, a leading supplier of construction aggregates and heavy building materials. This Fund holding benefited from a cyclical recovery in the aggregates (i.e., road building materials) industry due to increases in highway spending and residential construction.
Subadviser outlook
In the wake of Trump’s inauguration, we would not be surprised to see further market turbulence as the more controversial elements of his agenda work their way through the political process. Many of his stated policy goals could introduce considerable uncertainty into the prospects for some of our holdings. In that case, we hope to take advantage of any short-term volatility to build up positions in firms that we believe may offer superior long-term prospects.
45
Table of Contents
MML Mid Cap Growth Fund – Portfolio Manager Report (Unaudited) (Continued)
| MML Mid Cap Growth Fund Largest Holdings (% of Net Assets) on 12/31/16 | ||||
Textron, Inc. | 2.2 | % | ||
Fiserv, Inc. | 2.2 | % | ||
Willis Towers Watson PLC | 1.9 | % | ||
Teleflex, Inc. | 1.8 | % | ||
Microchip Technology, Inc. | 1.7 | % | ||
Hologic, Inc. | 1.6 | % | ||
AutoZone, Inc. | 1.6 | % | ||
Norwegian Cruise Line Holdings Ltd. | 1.5 | % | ||
IDEX Corp. | 1.5 | % | ||
Dollar General Corp. | 1.5 | % | ||
|
| |||
| 17.5 | % | |||
|
| |||
| MML Mid Cap Growth Fund Sector Table (% of Net Assets) on 12/31/16 | ||||
Consumer, Non-cyclical | 29.1 | % | ||
Industrial | 19.9 | % | ||
Consumer, Cyclical | 16.0 | % | ||
Technology | 11.7 | % | ||
Financial | 9.9 | % | ||
Communications | 4.6 | % | ||
Basic Materials | 3.5 | % | ||
Mutual Funds | 2.9 | % | ||
Energy | 1.7 | % | ||
|
| |||
Total Long-Term Investments | 99.3 | % | ||
Short-Term Investments and Other Assets and Liabilities | 0.7 | % | ||
|
| |||
Net Assets | 100.0 | % | ||
|
| |||
46
Table of Contents
MML Mid Cap Growth Fund – Portfolio Manager Report (Unaudited) (Continued)
Growth of a $10,000 Investment
Hypothetical Investments in MML Mid Cap Growth Fund Initial Class, the Russell Midcap Growth Index, and the S&P MidCap 400 Index.
| TOTAL RETURN | One Year 1/1/16 - 12/31/16 | Five Year Average Annual 1/1/12 - 12/31/16 | Ten Year Average Annual 1/1/07 - 12/31/16 | |||||||||
| Initial Class | 6.29% | 14.86% | 9.90% | |||||||||
| Russell Midcap Growth Index* | 7.33% | 13.51% | 7.83% | |||||||||
| S&P MidCap 400 Index | 20.74% | 15.33% | 9.16% | |||||||||
Hypothetical Investments in MML Mid Cap Growth Fund Service Class, the Russell Midcap Growth Index, and the S&P MidCap 400 Index.
| TOTAL RETURN | One Year 1/1/16 - 12/31/16 | Five Year Average Annual 1/1/12 - 12/31/16 | Since Inception Average Annual 8/15/08 - 12/31/16 | |||||||||
| Service Class | 6.02% | 14.58% | 10.46% | |||||||||
| Russell Midcap Growth Index* | 7.33% | 13.51% | 9.17% | |||||||||
| S&P MidCap 400 Index | 20.74% | 15.33% | 10.46% | |||||||||
GROWTH OF $10,000 INVESTMENT FOR THE PAST 10 YEARS
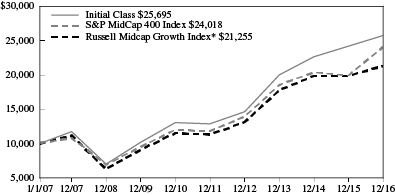
GROWTH OF $10,000 INVESTMENT SINCE INCEPTION
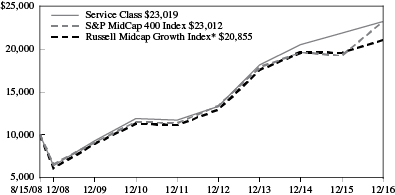
Generally accepted accounting principles require adjustments to be made to the net assets of the Fund at period end for financial reporting purposes only, and as such, the total return based on the unadjusted net asset value per share may differ from the total return reported in the financial highlights.
* Benchmark
Performance data quoted represents past performance; past performance is not predictive of future results. The investment return and principal value of shares of the Fund will fluctuate with market conditions so that shares of the Fund, when redeemed, may be worth more or less than their original cost. Current performance of the Fund may be lower or higher than the performance quoted. Performance data current to the most recent month end may be obtained by accessing the website www.massmutual.com.
Investors should note that the Fund is a professionally managed mutual fund, while the Russell Midcap Growth Index and the S&P MidCap 400 Index are unmanaged, do not incur expenses, and cannot be purchased directly by investors. Investors should read the Fund’s prospectus with regard to the Fund’s investment objective, risks, and charges and expenses in conjunction with these financial statements. The Fund’s return reflects changes in the net asset value per share without the deduction of any product charges (e.g., cost of insurance, mortality and expense risk charges, administrative fees, and CDSL). The inclusion of these charges would have reduced the performance shown here.
47
Table of Contents
MML Mid Cap Value Fund – Portfolio Manager Report (Unaudited)
What is the investment approach of MML Mid Cap Value Fund, and who is the Fund’s subadviser?
The Fund seeks long-term capital growth. Income is a secondary objective. The Fund invests primarily in equity securities of mid-capitalization companies that the Fund’s subadviser believes offer prospects for long-term capital growth. Under normal circumstances, the Fund invests at least 80% of its net assets (plus the amount of any borrowings for investment purposes) in equity securities of medium-size companies. The Fund’s subadviser is American Century Investment Management, Inc. (American Century).
How did the Fund perform during the 12 months ended December 31, 2016?
The Fund’s Initial Class shares returned 23.23%, outperforming the 20.00% return of Russell Midcap® Value Index (the “benchmark”), a widely recognized, unmanaged index that measures the performance of those Russell Midcap companies (representing mid-capitalization U.S. common stocks) with lower price-to-book ratios and lower forecasted growth rates than securities in the growth universe.
For a discussion on the economic and market environment during the 12-month period ended December 31, 2016, please see the Economic and Market Overview, beginning on page 3.
Subadviser discussion of factors that contributed to the Fund’s performance
During the year ended December 31, 2016, the Fund’s performance benefited, on an absolute basis, from an environment that included improving economic growth, pro-business implications from the outcome of the U.S. presidential election, a high level of merger and acquisition (M&A) activity, and a boost in oil prices driven by an OPEC production agreement. The Fund’s top performers, from a sector perspective, were its holdings in the materials, telecommunication services, and industrials sectors.
On a relative basis, stock selection and an overweight allocation, relative to the benchmark, in the financials sector also helped to drive the Fund’s performance, as stock selection in the insurance industry and an overweight allocation to banks proved particularly beneficial. The momentum in economic growth and the election of Donald Trump boosted the outlook for higher interest rates in the year ahead, which benefited banks. Security selection and an overweight to the industrials sector also helped returns, driven by several stocks in the building products and commercial services and supplies industries. One top contributor was Fund holding Tyco, an Ireland-based security systems company, which merged with Johnson Controls International, a U.S.-based automotive and HVAC parts maker, in September. Semiconductor equipment maker Applied Materials was another top-performing Fund holding; it rose on sales strength. Finally, Fund holding Sysco, a marketer and distributor of food products, boosted the Fund’s full-year results due to its strong earnings.
In terms of detractors, an underweight allocation to the materials sector hampered the Fund’s performance. Materials outperformed on rising commodity prices and increased expectations for infrastructure spending following the U.S. presidential election. Energy stocks were generally strong, due to rising oil prices, but the Fund’s security selection there detracted from relative performance – although the Fund’s overweight stake in energy largely offset its underperforming holdings within the sector. With respect to individual Fund holdings, LifePoint Health was a detractor, as shares of this hospital company lagged on investor concerns over the potential end of the Affordable Care Act, and because the company missed its third-quarter earnings targets.
Though the use of derivatives is not a principal investment strategy, the Fund can use index futures to equitize cash in the portfolio and foreign currency exchange contracts to hedge any foreign currency exposure. (Derivatives are securities that derive their value from the performance of one or more other investments and take the form of a contract between two or more parties. Most derivatives are used for hedging, speculation, or both.) Such derivatives did not have a material impact on Fund performance for the year.
Subadviser outlook
The Fund’s sector weightings experienced some changes during the year due to the large return differential in certain sectors and stocks. The drop in interest rates early in 2016 enabled Fund management to purchase holdings in attractively valued, more
48
Table of Contents
MML Mid Cap Value Fund – Portfolio Manager Report (Unaudited) (Continued)
cyclical shares. Conversely, a rally in yield-oriented, lower-volatility securities provided Fund management with the opportunity to reduce the Fund’s stake in certain holdings at a profit. The post-election stock rally and rise in interest rates were catalysts for outperformance in many cyclical names – and for the underperformance of more defensive, yield-oriented securities. As such, Fund management reduced the Fund’s allocations to the energy and financials sectors – and increased its stakes in health care, consumer staples, and utilities holdings in the fourth quarter.
| MML Mid Cap Value Fund Largest Holdings (% of Net Assets) on 12/31/16 | ||||
Northern Trust Corp. | 3.1 | % | ||
iShares Russell Mid-Cap Value ETF | 2.8 | % | ||
Johnson Controls International PLC | 2.7 | % | ||
Zimmer Biomet Holdings, Inc. | 1.8 | % | ||
Imperial Oil Ltd. | 1.8 | % | ||
EQT Corp. | 1.6 | % | ||
Applied Materials, Inc. | 1.6 | % | ||
Baker Hughes, Inc. | 1.6 | % | ||
Noble Energy, Inc. | 1.6 | % | ||
Weyerhaeuser Co. | 1.5 | % | ||
|
| |||
| 20.1 | % | |||
|
| |||
| MML Mid Cap Value Fund Sector Table (% of Net Assets) on 12/31/16 | ||||
Financial | 27.7 | % | ||
Industrial | 18.5 | % | ||
Consumer, Non-cyclical | 15.0 | % | ||
Energy | 13.1 | % | ||
Utilities | 7.9 | % | ||
Consumer, Cyclical | 7.2 | % | ||
Technology | 5.4 | % | ||
Mutual Funds | 2.7 | % | ||
Communications | 0.7 | % | ||
Basic Materials | 0.2 | % | ||
|
| |||
Total Long-Term Investments | 98.4 | % | ||
Short-Term Investments and Other Assets and Liabilities | 1.6 | % | ||
|
| |||
Net Assets | 100.0 | % | ||
|
| |||
49
Table of Contents
MML Mid Cap Value Fund – Portfolio Manager Report (Unaudited) (Continued)
Growth of a $10,000 Investment
Hypothetical Investments in MML Mid Cap Value Fund Initial Class and the Russell Midcap Value Index.
| TOTAL RETURN | One Year 1/1/16 - 12/31/16 | Five Year Average Annual 1/1/12 - 12/31/16 | Ten Year Average Annual 1/1/07 - 12/31/16 | |||||||||
| Initial Class | 23.23% | 16.61% | 9.48% | |||||||||
| Russell Midcap Value Index | 20.00% | 15.70% | 7.59% | |||||||||
Hypothetical Investments in MML Mid Cap Value Fund Service Class and the Russell Midcap Value Index.
| TOTAL RETURN | One Year 1/1/16 - 12/31/16 | Five Year 1/1/12 - | Since Inception Average Annual 8/15/08 - 12/31/16 | |||||||||
| Service Class | 22.86% | 16.32% | 11.62% | |||||||||
| Russell Midcap Value Index | 20.00% | 15.70% | 10.22% | |||||||||
GROWTH OF $10,000 INVESTMENT FOR THE PAST 10 YEARS
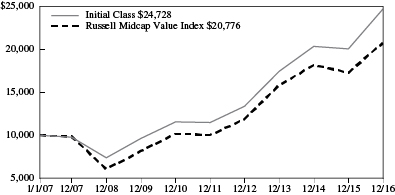
GROWTH OF $10,000 INVESTMENT SINCE INCEPTION
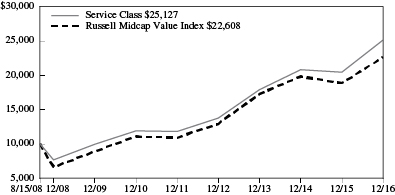
Generally accepted accounting principles require adjustments to be made to the net assets of the Fund at period end for financial reporting purposes only, and as such, the total return based on the unadjusted net asset value per share may differ from the total return reported in the financial highlights.
Performance data quoted represents past performance; past performance is not predictive of future results. The investment return and principal value of shares of the Fund will fluctuate with market conditions so that shares of the Fund, when redeemed, may be worth more or less than their original cost. Current performance of the Fund may be lower or higher than the performance quoted. Performance data current to the most recent month end may be obtained by accessing the website www.massmutual.com.
Investors should note that the Fund is a professionally managed mutual fund, while the Russell Midcap Value Index is unmanaged, does not incur expenses, and cannot be purchased directly by investors. Investors should read the Fund’s prospectus with regard to the Fund’s investment objective, risks, and charges and expenses in conjunction with these financial statements. The Fund’s return reflects changes in the net asset value per share without the deduction of any product charges (e.g., cost of insurance, mortality and expense risk charges, administrative fees, and CDSL). The inclusion of these charges would have reduced the performance shown here.
50
Table of Contents
MML Small Cap Growth Equity Fund – Portfolio Manager Report (Unaudited)
What is the investment approach of MML Small Cap Growth Equity Fund, and who is the Fund’s subadviser?
The Fund seeks long-term capital appreciation by investing primarily in equity securities of smaller companies that the Fund’s subadviser believes offer potential for long-term growth. Under normal circumstances, the Fund invests at least 80% of its net assets (plus the amount of any borrowings for investment purposes) in the equity securities of companies whose market capitalizations at the time of purchase are within the market capitalization range of companies included in the Russell 2000® Index or the S&P SmallCap 600 Index. The Fund’s subadviser is Wellington Management Company LLP (Wellington Management). Waddell & Reed Investment Management Company (Waddell & Reed) acted as a co-subadviser to the Fund until April 24, 2016.
How did the Fund perform during the 12 months ended December 31, 2016?
The Fund’s Initial Class shares returned 12.74%, outperforming the 11.32% return of the Russell 2000 Growth Index (the “benchmark”), a widely recognized, unmanaged index that measures the performance of those Russell 2000 Index companies (representing small-capitalization U.S. common stocks) with higher price-to-book ratios and higher forecasted growth rates than securities in the value universe. The Fund’s 12.74% return underperformed, by a wide margin, the 21.31% return of the Russell 2000 Index, a widely recognized, unmanaged index representative of common stocks of smaller capitalized U.S. companies.
For a discussion on the economic and market environment during the 12-month period ended December 31, 2016, please see the Economic and Market Overview, beginning on page 3.
Subadviser discussion of factors that contributed to the Fund’s performance
For the time Waddell & Reed served as co-subadviser (January 1, 2016 through April 24, 2016), the primary source of this Fund component’s performance strength, relative to the benchmark, was its holdings in the health care, consumer discretionary, and industrials sectors. During this time frame, small-cap stocks were down over double digits into February, but ultimately recovered for the most part as recession concerns faded. The underperformance of Fund component holdings in the information technology (IT) sector provided a modest headwind against the strength seen from other sectors. For example, Fund component holdings SPS Commerce (a provider of cloud-based supply chain management software to retailers, suppliers, third-party logistics providers and partners) and Virtusa Corp. (IT outsourcing company) were the top detractors from performance within the IT sector. On the positive side, in health care, Fund component holdings ExamWorks Group (a provider of independent medical examinations, peer and bill reviews, and Medicare compliance) and LDR Holding Corp. (a global medical device company) both contributed to performance. Within consumer discretionary, three Fund component holdings posted results that exceeded expectations: specifically, Kate Spade & Co. (a luxury brand company); Carter’s, Inc. (a leading children’s clothing company); and Five Below (a discount retailer). Finally, Fund component holding Toro Co. (a designer, manufacturer of professional turf maintenance equipment and services) proved to be a material contributor to performance within the industrials sector.
For the Wellington Management component of the Fund, during the year ended December 31, 2016, several of the relatively top-performing Fund component holdings were the subject of acquisitions. These included Cepheid (in the health care sector) and DreamWorks Animation (consumer discretionary). Shares of DreamWorks Animation jumped after management announced its acquisition by Comcast. The Fund sold its DreamWorks position on strength. Late in the third quarter of 2016, Danaher announced its acquisition of Cepheid, a leading global molecular diagnostics company. The Fund sold Cepheid as a result. In the health care sector, Fund component holding Tesaro, a biotechnology company focused on developing treatments for ovarian cancer, drove significant upside performance after announcing positive phase III testing results. Wellington Management trimmed the Fund’s allocation somewhat, but continued to retain its stake in Tesaro as of the end of the year. On the downside, Fund component holdings that were top relative detractors included SunPower (energy), Allscripts Healthcare (health care), and KapStone Paper (materials). SunPower, a leading U.S. solar manufacturer and project developer, was primarily impacted by concerns about residential demand for solar equipment. Allscripts Healthcare, which provides electronic health record technology to health care providers, declined in November following the release of third-quarter 2016 earnings that missed expectations. Finally, shares of KapStone Paper, a large North American containerboard producer, declined early in the period as results disappointed.
51
Table of Contents
MML Small Cap Growth Equity Fund – Portfolio Manager Report (Unaudited) (Continued)
Subadviser outlook
Despite U.S. small-cap stocks being at record highs as we entered 2017, in Wellington Management’s view, there remains much uncertainty surrounding the Trump administration. Though we are optimistic, we see more risk than opportunity in seeking to be early in anticipating potential areas impacted by pending regulatory and legislative changes, when so much remains unclear. We will continue to assess the businesses we hold, and our broader opportunity set as events progress over the coming months.
| MML Small Cap Growth Equity Fund Largest Holdings (% of Net Assets) on 12/31/16 | ||||
Insulet Corp. | 1.7 | % | ||
Sterling Bancorp | 1.5 | % | ||
Swift Transportation Co. | 1.4 | % | ||
MB Financial, Inc. | 1.3 | % | ||
Clean Harbors, Inc. | 1.2 | % | ||
Masonite International Corp. | 1.2 | % | ||
Western Alliance Bancorp | 1.2 | % | ||
Kennedy-Wilson Holdings, Inc. | 1.2 | % | ||
Kate Spade & Co. | 1.1 | % | ||
Hannon Armstrong Sustainable Infrastructure Capital, Inc. | 1.1 | % | ||
|
| |||
| 12.9 | % | |||
|
| |||
| MML Small Cap Growth Equity Fund Sector Table (% of Net Assets) on 12/31/16 | ||||
Financial | 21.2 | % | ||
Consumer, Non-cyclical | 17.3 | % | ||
Industrial | 16.8 | % | ||
Consumer, Cyclical | 14.0 | % | ||
Technology | 13.7 | % | ||
Mutual Funds | 8.5 | % | ||
Communications | 6.3 | % | ||
Energy | 4.5 | % | ||
Basic Materials | 3.0 | % | ||
Utilities | 0.9 | % | ||
Diversified | 0.6 | % | ||
|
| |||
Total Long-Term Investments | 106.8 | % | ||
Short-Term Investments and Other Assets and Liabilities | (6.8 | )% | ||
|
| |||
Net Assets | 100.0 | % | ||
|
| |||
52
Table of Contents
MML Small Cap Growth Equity Fund – Portfolio Manager Report (Unaudited) (Continued)
Growth of a $10,000 Investment
Hypothetical Investments in MML Small Cap Growth Equity Fund Initial Class, the Russell 2000 Growth Index, and the Russell 2000 Index.
| TOTAL RETURN | One Year 1/1/16 - 12/31/16 | Five Year Average Annual 1/1/12 - 12/31/16 | Ten Year Average Annual 1/1/07 - 12/31/16 | |||||||||
| Initial Class | 12.74% | 13.80% | 7.51% | |||||||||
| Russell 2000 Growth Index* | 11.32% | 13.74% | 7.76% | |||||||||
| Russell 2000 Index | 21.31% | 14.46% | 7.07% | |||||||||
Hypothetical Investments in MML Small Cap Growth Equity Fund Service Class, the Russell 2000 Growth Index, and the Russell 2000 Index.
| TOTAL RETURN | One Year 1/1/16 - 12/31/16 | Five Year Average Annual 1/1/12 - 12/31/16 | Since Inception Average Annual 8/15/08 - 12/31/16 | |||||||||
| Service Class | 12.46% | 13.51% | 8.53% | |||||||||
| Russell 2000 Growth Index* | 11.32% | 13.74% | 8.75% | |||||||||
| Russell 2000 Index | 21.31% | 14.46% | 8.79% | |||||||||
GROWTH OF $10,000 INVESTMENT FOR THE PAST 10 YEARS
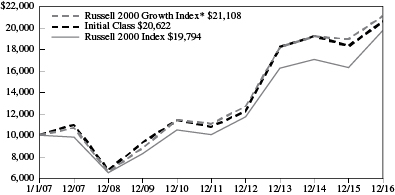
GROWTH OF $10,000 INVESTMENT SINCE INCEPTION
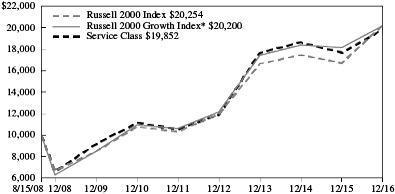
Generally accepted accounting principles require adjustments to be made to the net assets of the Fund at period end for financial reporting purposes only, and as such, the total return based on the unadjusted net asset value per share may differ from the total return reported in the financial highlights.
* Benchmark
Performance data quoted represents past performance; past performance is not predictive of future results. The investment return and principal value of shares of the Fund will fluctuate with market conditions so that shares of the Fund, when redeemed, may be worth more or less than their original cost. Current performance of the Fund may be lower or higher than the performance quoted. Performance data current to the most recent month end may be obtained by accessing the website www.massmutual.com.
Investors should note that the Fund is a professionally managed mutual fund, while the Russell 2000 Growth Index and the Russell 2000 Index are unmanaged, do not incur expenses, and cannot be purchased directly by investors. Investors should read the Fund’s prospectus with regard to the Fund’s investment objective, risks, and charges and expenses in conjunction with these financial statements. The Fund’s return reflects changes in the net asset value per share without the deduction of any product charges (e.g., cost of insurance, mortality and expense risk charges, administrative fees, and CDSL). The inclusion of these charges would have reduced the performance shown here.
53
Table of Contents
MML Small Company Value Fund – Portfolio Manager Report (Unaudited)
What is the investment approach of MML Small Company Value Fund, and who is the Fund’s subadviser?
The Fund seeks long-term capital appreciation by investing primarily in equity securities that the Fund’s subadviser believes are undervalued. Under normal circumstances, the Fund invests at least 80% of its net assets (plus the amount of any borrowings for investment purposes) in the securities of companies whose market capitalizations at the time of purchase are within the market capitalization range of companies included in the Russell 2000® Index. The Fund’s subadviser is T. Rowe Price Associates, Inc. (T. Rowe Price).
How did the Fund perform during the 12 months ended December 31, 2016?
The Fund’s Class II shares returned 32.46%, outperforming the 31.74% return of the Russell 2000 Value Index (the “benchmark”), a widely recognized, unmanaged index that measures the performance of those Russell 2000 Index companies (representing small-capitalization U.S. common stocks) with lower price-to-book ratios and lower forecasted growth rates than securities in the growth universe. The Fund significantly outperformed the 21.31% return of the Russell 2000 Index, a widely recognized, unmanaged index representative of common stocks of smaller capitalized U.S. companies.
For a discussion on the economic and market environment during the 12-month period ended December 31, 2016, please see the Economic and Market Overview, beginning on page 3.
Subadviser discussion of factors that contributed to the Fund’s performance
Broadly speaking, stock selection accounted for the Fund’s outperformance, relative to the benchmark, for the year ended December 31, 2016, while sector allocation negated some of those gains. Consumer discretionary, information technology, and health care all helped relative results, primarily due to stock selection. Materials, utilities, and consumer staples all hampered performance, also primarily due to stock choices.
The consumer discretionary group added the most value to relative performance, driven by stock choices that more than made up for a detrimental overweight (relative to the benchmark) to the group. LCI Industries, a supplier of components for recreational vehicles and manufactured housing, was one Fund holding that saw a turn in financial status, since dealers have become more comfortable maintaining inventory and the manufactured housing market has seen marked improvement. Information technology was also a source of relative strength for the Fund, due primarily to stock selection.
Stock selection made health care another source of relative strength, offsetting the negative effect of an overweight allocation to the sector. Fund holding WellCare Health Plans, a large Medicaid managed care company, benefited from health care policy continuing to move in a direction that seeks to expand patient access to care, while reducing costs and improving quality.
Materials was the largest source of relative weakness, due to stock selection, partially offset by an overweighting to the group. Myers Industries, a manufacturing polymer manufacturer, was a Fund holding that suffered amid slow industrial activity, low agricultural commodity pricing, and weak tire shipments. Stock selection in the utilities and consumer staples sectors also detracted from relative results. In consumer staples, Fund holding PriceSmart, which operates a chain of international membership warehouse clubs, had a challenging currency environment and aggressive pricing policies that hindered recent gross margins and earning results.
Subadviser outlook
We are still assessing the effects the new Trump administration will have on U.S. stocks. On the policy side, we are carefully watching actions by Congress and cabinet appointments to help us ascertain the policies and priorities of the new administration. The possibility of a sharp rise in interest rates is another concern for stock investors. Higher coupon returns from bonds could draw assets away from equities, and higher rates would mean increased borrowing costs and lower profits for corporations. However, we believe that a moderate increase does not necessarily pose a threat to equity valuations. Stock prices have historically been able to rise alongside interest rates, particularly when yields have remained under 5%. (The yield on the 10-year Treasury note ended the year at 2.45%.)
54
Table of Contents
MML Small Company Value Fund – Portfolio Manager Report (Unaudited) (Continued)
| MML Small Company Value Fund Largest Holdings (% of Net Assets) on 12/31/16 | ||||
Home Bancshares, Inc. | 2.3 | % | ||
East West Bancorp, Inc. | 1.6 | % | ||
Landstar System, Inc. | 1.6 | % | ||
Littelfuse, Inc. | 1.4 | % | ||
SVB Financial Group | 1.4 | % | ||
Belden, Inc. | 1.4 | % | ||
BankUnited, Inc. | 1.3 | % | ||
West Pharmaceutical Services, Inc. | 1.2 | % | ||
LCI Industries | 1.2 | % | ||
Columbia Banking System, Inc. | 1.2 | % | ||
|
| |||
| 14.6 | % | |||
|
| |||
| MML Small Company Value Fund Sector Table (% of Net Assets) on 12/31/16 | ||||
Financial | 34.9 | % | ||
Industrial | 16.8 | % | ||
Consumer, Non-cyclical | 14.3 | % | ||
Consumer, Cyclical | 9.2 | % | ||
Utilities | 6.0 | % | ||
Technology | 4.3 | % | ||
Basic Materials | 4.3 | % | ||
Energy | 4.2 | % | ||
Mutual Funds | 3.2 | % | ||
Communications | 2.9 | % | ||
Diversified | 1.0 | % | ||
|
| |||
Total Long-Term Investments | 101.1 | % | ||
Short-Term Investments and Other Assets and Liabilities | (1.1 | )% | ||
|
| |||
Net Assets | 100.0 | % | ||
|
| |||
55
Table of Contents
MML Small Company Value Fund – Portfolio Manager Report (Unaudited) (Continued)
Growth of a $10,000 Investment
Hypothetical Investments in MML Small Company Value Fund Class II, Service Class I, the Russell 2000 Value Index, and the Russell 2000 Index.
| TOTAL RETURN | One Year 1/1/16 - 12/31/16 | Five Year Average Annual 1/1/12 - 12/31/16 | Since Inception Average Annual 2/27/09 - 12/31/16 | |||||||||
| Class II | 32.46% | 13.83% | 18.06% | |||||||||
| Service Class I | 32.16% | 13.55% | 17.76% | |||||||||
| Russell 2000 Value Index* | 31.74% | 15.07% | 18.72% | |||||||||
| Russell 2000 Index | 21.31% | 14.46% | 18.76% | |||||||||
GROWTH OF $10,000 INVESTMENT SINCE INCEPTION
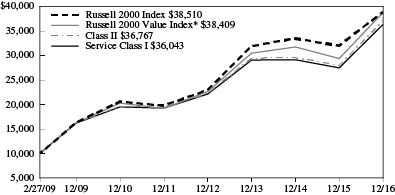
Generally accepted accounting principles require adjustments to be made to the net assets of the Fund at period end for financial reporting purposes only, and as such, the total return based on the unadjusted net asset value per share may differ from the total return reported in the financial highlights.
* Benchmark
Performance data quoted represents past performance; past performance is not predictive of future results. The investment return and principal value of shares of the Fund will fluctuate with market conditions so that shares of the Fund, when redeemed, may be worth more or less than their original cost. Current performance of the Fund may be lower or higher than the performance quoted. Performance data current to the most recent month end may be obtained by accessing the website www.massmutual.com.
Investors should note that the Fund is a professionally managed mutual fund, while the Russell 2000 Value Index and the Russell 2000 Index are unmanaged, do not incur expenses, and cannot be purchased directly by investors. Investors should read the Fund’s prospectus with regard to the Fund’s investment objective, risks, and charges and expenses in conjunction with these financial statements. The Fund’s return reflects changes in the net asset value per share without the deduction of any product charges (e.g., cost of insurance, mortality and expense risk charges, administrative fees, and CDSL). The inclusion of these charges would have reduced the performance shown here.
56
Table of Contents
MML Small/Mid Cap Value Fund – Portfolio Manager Report (Unaudited)
What is the investment approach of MML Small/Mid Cap Value Fund, and who is the Fund’s subadviser?
The Fund seeks long-term total return by investing primarily in securities that the Fund’s subadviser believes to be undervalued. Under normal circumstances, the Fund invests at least 80% of its net assets (plus the amount of any borrowings for investment purposes) in securities of small- and mid-cap companies. The Fund’s subadviser is AllianceBernstein L.P. (AllianceBernstein).
How did the Fund perform during the 12 months ended December 31, 2016?
The Fund’s Initial Class Shares returned 25.10%, significantly outperforming the 17.59% return of the Russell 2500TM Index (the “benchmark”), an unmanaged index that measures the performance of the 2,500 smallest companies in the Russell 3000® Index, which measures the performance of the 3,000 largest U.S. companies based on market capitalization. The Fund modestly underperformed the 25.20% return of the Russell 2500 Value Index, an unmanaged index representative of common stocks of small- and mid-capitalization U.S. companies with lower price-to-book ratios and lower forecasted growth rates than securities in the growth universe.
For a discussion on the economic and market environment during the 12-month period ended December 31, 2016, please see the Economic and Market Overview, beginning on page 3.
Subadviser discussion of factors that contributed to the Fund’s performance
For the year ended December 31, 2016, smaller-cap stocks outperformed their larger-cap counterparts, as investors perceived smaller shares, in the wake of the U.S. presidential election, to be bigger beneficiaries of future U.S. economic policies.
Overall, stock selection contributed for the period, primarily owing to Fund holdings in the industrials, technology, and consumer discretionary sectors. Underweight positions, relative to the benchmark, in real estate and consumer staples, and an overweight stake in energy also contributed. The Fund’s materials, financials, and energy holdings, an overweight position in the consumer discretionary sector, and an underweight position in financials detracted.
Fund holdings that were leading contributors for the period included Finisar, a manufacturer of optical communications components. The company delivered stronger-than-expected sales and earnings growth driven by robust end-market demand for its high-end telecom and data communication products. Advanced Micro Devices, a maker of microprocessor chips, also contributed to Fund performance during the year, as this Fund holding benefited from new management that refreshed its intellectual property and executed several transactions that improved its balance sheet.
Among the detractors for the year was LifePoint Health, a regional health care provider. Shares of this Fund holding fell on market concerns regarding changes in health care policy under the new administration. Specifically, concerns focused on the possible reduction in or removal of the Affordable Care Act – which could increase the number of uninsured patients the hospital system treats. Similarly, shares of Molina Healthcare, a Medicaid health care provider, fell, due to general weakness in the sector as well as investor concerns that prospective changes in the Medicaid program could adversely impact the company’s profitability.
Subadviser outlook
In our view, as we enter 2017, the equity landscape remains uncertain. While little is sure, prevailing investor sentiment is that there is a strong likelihood that corporate tax rates will decline under the new administration – and the regulatory burden faced by American companies will lessen. Repatriation of corporate cash trapped overseas also seems to be a possibility. While it’s tempting to consider these shifts as inevitable, the reality is they and their impacts are more uncertain, and we don’t share the market’s confident forecast.
Our view is that the best approach remains staying true to our deeper value with a catalyst discipline, and reacting to policy changes as they become more certain. We continue to seek companies that combine attractive value, strong free cash flow, and compelling company- or industry-level catalysts. However, if these trends occur, we believe that many of the Fund’s holdings could benefit from lower tax bills, less regulation, and offshore cash repatriation, if it transpires.
57
Table of Contents
MML Small/Mid Cap Value Fund – Portfolio Manager Report (Unaudited) (Continued)
| MML Small/Mid Cap Value Fund Largest Holdings (% of Net Assets) on 12/31/16 | ||||
Huntington Bancshares, Inc. | 1.8 | % | ||
Synergy Resources Corp. | 1.8 | % | ||
Zions Bancorp | 1.7 | % | ||
Comerica, Inc. | 1.6 | % | ||
Helmerich & Payne, Inc. | 1.6 | % | ||
Anixter International, Inc. | 1.6 | % | ||
Reinsurance Group of America, Inc. | 1.5 | % | ||
American Financial Group, Inc. | 1.5 | % | ||
CDW Corp. | 1.5 | % | ||
Oil States International, Inc. | 1.4 | % | ||
|
| |||
| 16.0 | % | |||
|
| |||
| MML Small/Mid Cap Value Fund Sector Table (% of Net Assets) on 12/31/16 | ||||
Financial | 22.7 | % | ||
Consumer, Cyclical | 16.9 | % | ||
Industrial | 16.7 | % | ||
Consumer, Non-cyclical | 11.7 | % | ||
Energy | 11.7 | % | ||
Technology | 8.3 | % | ||
Communications | 6.3 | % | ||
Utilities | 2.8 | % | ||
Basic Materials | 1.4 | % | ||
|
| |||
Total Long-Term Investments | 98.5 | % | ||
Short-Term Investments and Other Assets and Liabilities | 1.5 | % | ||
|
| |||
Net Assets | 100.0 | % | ||
|
| |||
58
Table of Contents
MML Small/Mid Cap Value Fund – Portfolio Manager Report (Unaudited) (Continued)
Growth of a $10,000 Investment
Hypothetical Investments in MML Small/Mid Cap Value Fund Initial Class, the Russell 2500 Index, and the Russell 2500 Value Index.
| TOTAL RETURN | One Year 1/1/16 - 12/31/16 | Five Year Average Annual 1/1/12 - 12/31/16 | Ten Year Average Annual 1/1/07 - 12/31/16 | |||||||||
| Initial Class | 25.10% | 16.30% | 6.02% | |||||||||
| Russell 2500 Index* | 17.59% | 14.54% | 7.69% | |||||||||
| Russell 2500 Value Index | 25.20% | 15.04% | 6.94% | |||||||||
Hypothetical Investments in MML Small/Mid Cap Value Fund Service Class, the Russell 2500 Index, and the Russell 2500 Value Index.
| TOTAL RETURN | One Year 1/1/16 - 12/31/16 | Five Year Average Annual 1/1/12 - 12/31/16 | Since Inception Average Annual 8/15/08 - 12/31/16 | |||||||||
| Service Class | 24.83% | 16.02% | 10.12% | |||||||||
| Russell 2500 Index* | 17.59% | 14.54% | 9.56% | |||||||||
| Russell 2500 Value Index | 25.20% | 15.04% | 9.64% | |||||||||
GROWTH OF $10,000 INVESTMENT FOR THE PAST 10 YEARS
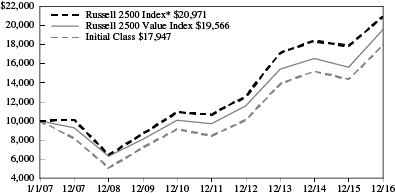
GROWTH OF $10,000 INVESTMENT SINCE INCEPTION
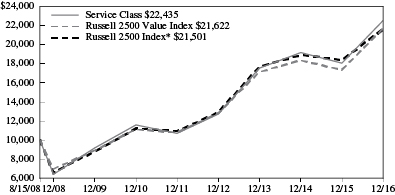
Generally accepted accounting principles require adjustments to be made to the net assets of the Fund at period end for financial reporting purposes only, and as such, the total return based on the unadjusted net asset value per share may differ from the total return reported in the financial highlights.
* Benchmark
Performance data quoted represents past performance; past performance is not predictive of future results. The investment return and principal value of shares of the Fund will fluctuate with market conditions so that shares of the Fund, when redeemed, may be worth more or less than their original cost. Current performance of the Fund may be lower or higher than the performance quoted. Performance data current to the most recent month end may be obtained by accessing the website www.massmutual.com.
Investors should note that the Fund is a professionally managed mutual fund, while the Russell 2500 Index and the Russell 2500 Value Index are unmanaged, do not incur expenses, and cannot be purchased directly by investors. Investors should read the Fund’s prospectus with regard to the Fund’s investment objective, risks, and charges and expenses in conjunction with these financial statements. The Fund’s return reflects changes in the net asset value per share without the deduction of any product charges (e.g., cost of insurance, mortality and expense risk charges, administrative fees, and CDSL). The inclusion of these charges would have reduced the performance shown here.
59
Table of Contents
MML Total Return Bond Fund – Portfolio Manager Report (Unaudited)
What is the investment approach of MML Total Return Bond Fund, and who is the Fund’s subadviser?
The Fund seeks maximum total return, consistent with preservation of capital and prudent investment management, by investing, under normal circumstances, at least 80% of its net assets (plus the amount of any borrowings for investment purposes) in a diversified portfolio of investment grade fixed income securities (rated Baa3 or higher by Moody’s, BBB- or higher by Standard & Poor’s, BBB- or higher by Fitch, or A-2 by S&P, P-2 by Moody’s, or F-2 by Fitch for short-term debt obligations, or, if unrated, determined by the Fund’s subadviser to be of comparable quality). The Fund’s subadviser is Metropolitan West Asset Management, LLC (MetWest).
How did the Fund perform during the 12 months ended December 31, 2016?
The Fund’s Class II shares returned 2.52%, underperforming the 2.65% return of the Bloomberg Barclays U.S. Aggregate Bond Index (the “benchmark”), an unmanaged index of fixed-rate investment-grade securities with at least one year to maturity, combining the Bloomberg Barclays U.S. Treasury Bond Index, the Bloomberg Barclays U.S. Government-Related Bond Index, the Bloomberg Barclays U.S. Corporate Bond Index, and the Bloomberg Barclays U.S. Securitized Bond Index.
For a discussion on the economic and market environment during the 12-month period ended December 31, 2016, please see the Economic and Market Overview, beginning on page 3.
Subadviser discussion of factors that contributed to the Fund’s performance
For the year ended December 31, 2016, the defensive duration position of the Fund weighed on returns over the first half of the year, but the drag was reversed, even as duration was extended, as rates rose rapidly into year end. (Duration is a measure of a bond fund’s sensitivity to interest rates. The longer the duration, the greater the price impact on the bond or portfolio when interest rates rise or fall.)
The Fund’s conservative positioning in the bond sector was rewarded early in 2016 when volatility spiked, but in aggregate, weighed on relative performance over the course of the full year. In particular, the Fund’s underweight allocation (relative to the benchmark) to the industrials sector – such as holdings in metals & mining – detracted amid stabilization in commodity-related sectors. The Fund did benefit from an out-of-benchmark allocation to non-agency mortgage-backed securities (MBS). (“Agency” refers to government-sponsored entities that issue bonds backed by mortgage loans, including Ginnie Mae, Fannie Mae, Freddie Mac, and the Federal Home Loan Banks.) Improving fundamentals, such as ongoing home price appreciation that has helped drive down mortgage loan-to-value ratios, contributed, as did technical support stemming from a dearth of new supply.
The Fund’s emphasis within asset-backed securities (ABS) on government-guaranteed student loans also benefited performance for the year, as uncertainty about downgrades subsided as the rating review process neared conclusion. (Bond issuers create securitized bonds by pooling various types of contractual debt – such as mortgages, auto loans, or credit card debt.) The Fund’s commercial MBS (CMBS) positioning continued to represent an overweight allocation, which further contributed to returns as the sector was notably tighter year-over-year. Non-agency CMBS benefited from lower issuance than what was initially expected, a response to significant volatility in February and subsequently tighter lending standards. In contrast, agency CMBS was held back by heavy issuance, but spreads still tightened on solid demand for high-quality assets from banks and dealers. (Spreads represent the difference in yields between comparable Treasury and corporate bonds. Tightening spreads often reflect rising corporate bond prices; widening spreads often reflect falling corporate bond prices.)
The Fund used derivatives to manage the Fund’s duration and the yield curve, which had no material impact on performance for the reporting period. (Derivatives are securities that derive their value from the performance of one or more other investments and take the form of a contract between two or more parties. Most derivatives are used for hedging, speculation, or both.)
Subadviser outlook
Looking ahead, we believe that the Fund’s dampened risk profile will allow Fund management to take advantage of episodic volatility at better price levels than those available at year end, particularly as a post-election run-up in relative valuations has further richened the market to an unwarranted degree. We predicate our perspective on the late-cycle conditions evidenced in
60
Table of Contents
MML Total Return Bond Fund – Portfolio Manager Report (Unaudited) (Continued)
rising leverage, as well as increased merger and acquisition and shareholder-friendly activity that tends to elevate creditor risks, ultimately resulting in higher levels of yield disparity in compensation. If those market adjustments materialize, we may increase the Fund’s allocations to credit and enhance the Fund’s yield profile vis-a-vis the benchmark. Our view is that these developments could be favorable for prospective returns, while undercurrents within the broad sector could allow for industry and security selection opportunities that also offer potentially good value.
| MML Total Return Bond Fund Portfolio Characteristics (% of Net Assets) on 12/31/16 | ||||
U.S. Treasury Obligations | 34.9 | % | ||
U.S. Government Agency Obligations and Instrumentalities | 27.2 | % | ||
Corporate Debt | 23.1 | % | ||
Non-U.S. Government Agency Obligations | 14.1 | % | ||
Municipal Obligations | 1.1 | % | ||
Bank Loans | 0.2 | % | ||
|
| |||
Total Long-Term Investments | 100.6 | % | ||
Short-Term Investments and Other Assets and Liabilities | (0.6 | )% | ||
|
| |||
Net Assets | 100.0 | % | ||
|
| |||
61
Table of Contents
MML Total Return Bond Fund – Portfolio Manager Report (Unaudited) (Continued)
Growth of a $10,000 Investment
Hypothetical Investments in MML Total Return Bond Fund Class II and the Bloomberg Barclays U.S. Aggregate Bond Index.
| TOTAL RETURN | One Year 1/1/16 - 12/31/16 | Five Year Average Annual 1/1/12 - 12/31/16 | Since Inception Average Annual 8/10/10 - 12/31/16 | |||||||||
| Class II | 2.52% | 2.90% | 2.67% | |||||||||
| Bloomberg Barclays U.S. Aggregate Bond Index | 2.65% | 2.23% | 2.92% | |||||||||
Hypothetical Investments in MML Total Return Bond Fund Service Class I and the Bloomberg Barclays U.S. Aggregate Bond Index.
| TOTAL RETURN | One Year 1/1/16 - 12/31/16 | Since Inception Average Annual 5/1/12 - 12/31/16 | ||||||
| Service Class I | 2.30% | 2.06% | ||||||
| Bloomberg Barclays U.S. Aggregate Bond Index | 2.65% | 2.08% | ||||||
GROWTH OF $10,000 INVESTMENT SINCE INCEPTION
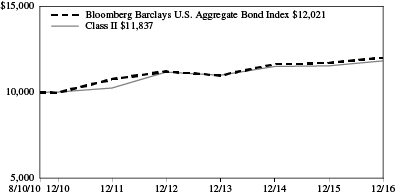
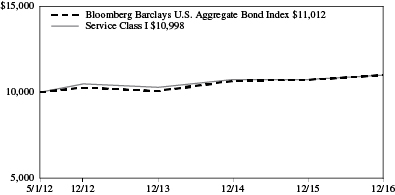
Generally accepted accounting principles require adjustments to be made to the net assets of the Fund at period end for financial reporting purposes only, and as such, the total return based on the unadjusted net asset value per share may differ from the total return reported in the financial highlights.
Performance data quoted represents past performance; past performance is not predictive of future results. The investment return and principal value of shares of the Fund will fluctuate with market conditions so that shares of the Fund, when redeemed, may be worth more or less than their original cost. Current performance of the Fund may be lower or higher than the performance quoted. Performance data current to the most recent month end may be obtained by accessing the website www.massmutual.com.
Investors should note that the Fund is a professionally managed mutual fund, while the Bloomberg Barclays U.S. Aggregate Bond Index is unmanaged, does not incur expenses, and cannot be purchased directly by investors. Investors should read the Fund’s prospectus with regard to the Fund’s investment objective, risks, and charges and expenses in conjunction with these financial statements. The Fund’s return reflects changes in the net asset value per share without the deduction of any product charges (e.g., cost of insurance, mortality and expense risk charges, administrative fees, and CDSL). The inclusion of these charges would have reduced the performance shown here.
62
Table of Contents
MML Blue Chip Growth Fund – Portfolio of Investments
December 31, 2016
| Number of Shares | Value | |||||||
| EQUITIES — 99.4% | ||||||||
| COMMON STOCK — 99.4% | ||||||||
| Basic Materials — 0.1% | ||||||||
| Chemicals — 0.1% | ||||||||
E.I. du Pont de Nemours & Co. | 600 | $ | 44,040 | |||||
Ecolab, Inc. | 2,700 | 316,494 | ||||||
The Sherwin-Williams Co. | 700 | 188,118 | ||||||
|
| |||||||
| 548,652 | ||||||||
|
| |||||||
| Communications — 30.5% | ||||||||
| Internet — 29.5% | ||||||||
Alibaba Group Holding Ltd. Sponsored ADR (Cayman Islands) (a) | 80,846 | 7,099,087 | ||||||
Alphabet, Inc. Class A (a) | 12,000 | 9,509,400 | ||||||
Alphabet, Inc. Class C (a) | 21,456 | 16,560,170 | ||||||
Amazon.com, Inc. (a) | 41,900 | 31,419,553 | ||||||
Baidu, Inc. Sponsored ADR (Cayman Islands) (a) | 6,200 | 1,019,342 | ||||||
Ctrip.com International Ltd. ADR (Cayman Islands) (a) | 40,240 | 1,609,600 | ||||||
Equinix, Inc. | 2,100 | 750,561 | ||||||
Facebook, Inc. Class A (a) | 152,176 | 17,507,849 | ||||||
Netflix, Inc. (a) | 36,500 | 4,518,700 | ||||||
The Priceline Group, Inc. (a) | 10,970 | 16,082,678 | ||||||
Tencent Holdings Ltd. | 242,100 | 5,875,810 | ||||||
|
| |||||||
| 111,952,750 | ||||||||
|
| |||||||
| Media — 1.0% | ||||||||
Charter Communications, Inc. Class A (a) | 7,132 | 2,053,445 | ||||||
Comcast Corp. Class A | 15,100 | 1,042,655 | ||||||
Time Warner, Inc. | 6,700 | 646,751 | ||||||
The Walt Disney Co. | 1,600 | 166,752 | ||||||
|
| |||||||
| 3,909,603 | ||||||||
|
| |||||||
| 115,862,353 | ||||||||
|
| |||||||
| Consumer, Cyclical — 14.0% | ||||||||
| Airlines — 2.9% | ||||||||
Alaska Air Group, Inc. | 37,400 | 3,318,502 | ||||||
American Airlines Group, Inc. | 145,800 | 6,807,402 | ||||||
Delta Air Lines, Inc. | 15,600 | 767,364 | ||||||
|
| |||||||
| 10,893,268 | ||||||||
|
| |||||||
| Apparel — 0.2% | ||||||||
Hanesbrands, Inc. | 25,400 | 547,878 | ||||||
|
| |||||||
| Auto Manufacturers — 0.9% | ||||||||
Ferrari NV | 13,500 | 784,890 | ||||||
Tesla Motors, Inc. (a) | 12,397 | 2,649,115 | ||||||
|
| |||||||
| 3,434,005 | ||||||||
|
| |||||||
| Automotive & Parts — 0.3% | ||||||||
Delphi Automotive PLC | 17,400 | 1,171,890 | ||||||
|
| |||||||
| Number of Shares | Value | |||||||
| Leisure Time — 0.4% | ||||||||
Norwegian Cruise Line Holdings Ltd. (a) | 3,100 | $ | 131,843 | |||||
Royal Caribbean Cruises Ltd. | 18,400 | 1,509,536 | ||||||
|
| |||||||
| 1,641,379 | ||||||||
|
| |||||||
| Lodging — 2.3% | ||||||||
Hilton Worldwide Holdings, Inc. | 98,928 | 2,690,842 | ||||||
Las Vegas Sands Corp. | 26,200 | 1,399,342 | ||||||
Marriott International, Inc. Class A | 27,887 | 2,305,697 | ||||||
MGM Resorts International (a) | 80,400 | 2,317,932 | ||||||
|
| |||||||
| 8,713,813 | ||||||||
|
| |||||||
| Retail — 7.0% | ||||||||
AutoZone, Inc. (a) | 2,200 | 1,737,538 | ||||||
Coach, Inc. | 12,800 | 448,256 | ||||||
Costco Wholesale Corp. | 5,100 | 816,561 | ||||||
Dollar General Corp. | 11,000 | 814,770 | ||||||
Domino’s Pizza, Inc. | 2,100 | 334,404 | ||||||
The Home Depot, Inc. | 31,500 | 4,223,520 | ||||||
L Brands, Inc. | 2,600 | 171,184 | ||||||
Lowe’s Cos., Inc. | 50,800 | 3,612,896 | ||||||
O’Reilly Automotive, Inc. (a) | 13,600 | 3,786,376 | ||||||
Ross Stores, Inc. | 42,100 | 2,761,760 | ||||||
Starbucks Corp. | 20,500 | 1,138,160 | ||||||
Tractor Supply Co. | 11,600 | 879,396 | ||||||
Walgreens Boots Alliance, Inc. | 53,300 | 4,411,108 | ||||||
Yum! Brands, Inc. | 25,700 | 1,627,581 | ||||||
|
| |||||||
| 26,763,510 | ||||||||
|
| |||||||
| 53,165,743 | ||||||||
|
| |||||||
| Consumer, Non-cyclical — 21.3% | ||||||||
| Agriculture — 0.4% | ||||||||
Philip Morris International, Inc. | 17,700 | 1,619,373 | ||||||
|
| |||||||
| Beverages — 0.7% | ||||||||
Constellation Brands, Inc. Class A | 7,600 | 1,165,156 | ||||||
Dr. Pepper Snapple Group, Inc. | 900 | 81,603 | ||||||
Molson Coors Brewing Co. Class B | 9,200 | 895,252 | ||||||
Monster Beverage Corp. (a) | 10,000 | 443,400 | ||||||
|
| |||||||
| 2,585,411 | ||||||||
|
| |||||||
| Biotechnology — 4.1% | ||||||||
Alexion Pharmaceuticals, Inc. (a) | 33,182 | 4,059,818 | ||||||
Biogen, Inc. (a) | 13,400 | 3,799,972 | ||||||
Celgene Corp. (a) | 47,300 | 5,474,975 | ||||||
Illumina, Inc. (a) | 175 | 22,407 | ||||||
Regeneron Pharmaceuticals, Inc. (a) | 400 | 146,836 | ||||||
Vertex Pharmaceuticals, Inc. (a) | 25,300 | 1,863,851 | ||||||
|
| |||||||
| 15,367,859 | ||||||||
|
| |||||||
| Commercial Services — 4.0% | ||||||||
Equifax, Inc. | 952 | 112,555 | ||||||
FleetCor Technologies, Inc. (a) | 3,700 | 523,624 | ||||||
Global Payments, Inc. | 2,200 | 152,702 | ||||||
The accompanying notes are an integral part of the financial statements.
63
Table of Contents
MML Blue Chip Growth Fund – Portfolio of Investments (Continued)
| Number of Shares | Value | |||||||
IHS Markit Ltd. (a) | 17,248 | $ | 610,752 | |||||
PayPal Holdings, Inc. (a) | 65,300 | 2,577,391 | ||||||
S&P Global, Inc. | 4,700 | 505,438 | ||||||
Visa, Inc. Class A | 138,520 | 10,807,330 | ||||||
|
| |||||||
| 15,289,792 | ||||||||
|
| |||||||
| Foods — 0.5% | ||||||||
The Kraft Heinz Co. | 1,200 | 104,784 | ||||||
Mondelez International, Inc. Class A | 38,700 | 1,715,571 | ||||||
|
| |||||||
| 1,820,355 | ||||||||
|
| |||||||
| Health Care – Products — 3.0% | ||||||||
Becton, Dickinson & Co. | 17,200 | 2,847,460 | ||||||
C.R. Bard, Inc. | 1,200 | 269,592 | ||||||
Henry Schein, Inc. (a) | 1,300 | 197,223 | ||||||
Intuitive Surgical, Inc. (a) | 5,700 | 3,614,769 | ||||||
Stryker Corp. | 36,630 | 4,388,640 | ||||||
|
| |||||||
| 11,317,684 | ||||||||
|
| |||||||
| Health Care – Services — 5.7% | ||||||||
Aetna, Inc. | 36,139 | 4,481,598 | ||||||
Anthem, Inc. | 500 | 71,885 | ||||||
Centene Corp. (a) | 6,087 | 343,976 | ||||||
Cigna Corp. | 10,000 | 1,333,900 | ||||||
DENTSPLY SIRONA, Inc. | 3,900 | 225,147 | ||||||
Humana, Inc. | 11,900 | 2,427,957 | ||||||
Thermo Fisher Scientific, Inc. | 31,271 | 4,412,338 | ||||||
UnitedHealth Group, Inc. | 52,800 | 8,450,112 | ||||||
|
| |||||||
| 21,746,913 | ||||||||
|
| |||||||
| Pharmaceuticals — 2.9% | ||||||||
Allergan PLC (a) | 22,154 | 4,652,562 | ||||||
Bristol-Myers Squibb Co. | 26,700 | 1,560,348 | ||||||
Cardinal Health, Inc. | 300 | 21,591 | ||||||
Eli Lilly & Co. | 9,700 | 713,435 | ||||||
McKesson Corp. | 300 | 42,135 | ||||||
Merck & Co., Inc. | 14,300 | 841,841 | ||||||
Shire PLC Sponsored ADR (Ireland) | 10,719 | 1,826,303 | ||||||
Zoetis, Inc. | 27,600 | 1,477,428 | ||||||
|
| |||||||
| 11,135,643 | ||||||||
|
| |||||||
| 80,883,030 | ||||||||
|
| |||||||
| Financial — 13.8% | ||||||||
| Banks — 2.1% | ||||||||
The Bank of New York Mellon Corp. | 48,500 | 2,297,930 | ||||||
Citigroup, Inc. | 19,600 | 1,164,828 | ||||||
Citizens Financial Group, Inc. | 9,600 | 342,048 | ||||||
First Republic Bank | 2,324 | 214,133 | ||||||
The Goldman Sachs Group, Inc. | 1,300 | 311,285 | ||||||
Northern Trust Corp. | 3,800 | 338,390 | ||||||
State Street Corp. | 41,200 | 3,202,064 | ||||||
U.S. Bancorp | 2,300 | 118,151 | ||||||
|
| |||||||
| 7,988,829 | ||||||||
|
| |||||||
| Number of Shares | Value | |||||||
| Diversified Financial — 9.2% | ||||||||
Ameriprise Financial, Inc. | 2,400 | $ | 266,256 | |||||
BlackRock, Inc. | 2,100 | 799,134 | ||||||
The Charles Schwab Corp. | 45,900 | 1,811,673 | ||||||
CME Group, Inc. | 6,600 | 761,310 | ||||||
Intercontinental Exchange, Inc. | 92,300 | 5,207,566 | ||||||
JP Morgan Chase & Co. | 29,800 | 2,571,442 | ||||||
MasterCard, Inc. Class A | 99,100 | 10,232,075 | ||||||
Morgan Stanley | 195,700 | 8,268,325 | ||||||
TD Ameritrade Holding Corp. | 117,100 | 5,105,560 | ||||||
|
| |||||||
| 35,023,341 | ||||||||
|
| |||||||
| Insurance — 0.8% | ||||||||
Aon PLC | 1,000 | 111,530 | ||||||
Chubb Ltd. | 2,100 | 277,452 | ||||||
Marsh & McLennan Cos., Inc. | 22,800 | 1,541,052 | ||||||
Willis Towers Watson PLC | 7,700 | 941,556 | ||||||
|
| |||||||
| 2,871,590 | ||||||||
|
| |||||||
| Real Estate Investment Trusts (REITS) — 1.7% | ||||||||
American Tower Corp. | 62,870 | 6,644,102 | ||||||
|
| |||||||
| 52,527,862 | ||||||||
|
| |||||||
| Industrial — 8.0% | ||||||||
| Aerospace & Defense — 1.7% | ||||||||
The Boeing Co. | 32,400 | 5,044,032 | ||||||
General Dynamics Corp. | 400 | 69,064 | ||||||
Northrop Grumman Corp. | 4,700 | 1,093,126 | ||||||
Raytheon Co. | 1,400 | 198,800 | ||||||
Rockwell Collins, Inc. | 2,500 | 231,900 | ||||||
|
| |||||||
| 6,636,922 | ||||||||
|
| |||||||
| Airlines — 0.6% | ||||||||
United Continental Holdings, Inc. (a) | 33,300 | 2,426,904 | ||||||
|
| |||||||
| Electronics — 1.1% | ||||||||
Agilent Technologies, Inc. | 1,700 | 77,452 | ||||||
Fortive Corp. | 61,980 | 3,323,987 | ||||||
Johnson Controls International PLC | 17,800 | 733,182 | ||||||
|
| |||||||
| 4,134,621 | ||||||||
|
| |||||||
| Machinery – Diversified — 0.3% | ||||||||
Roper Technologies, Inc. | 5,800 | 1,061,864 | ||||||
Wabtec Corp. | 700 | 58,114 | ||||||
|
| |||||||
| 1,119,978 | ||||||||
|
| |||||||
| Manufacturing — 2.7% | ||||||||
Danaher Corp. | 117,560 | 9,150,871 | ||||||
Pentair PLC | 800 | 44,856 | ||||||
Textron, Inc. | 18,400 | 893,504 | ||||||
|
| |||||||
| 10,089,231 | ||||||||
|
| |||||||
| Packaging & Containers — 0.3% | ||||||||
Ball Corp. | 13,500 | 1,013,445 | ||||||
|
| |||||||
| Transportation — 1.3% | ||||||||
Canadian Pacific Railway Ltd. | 10,000 | 1,427,700 | ||||||
FedEx Corp. | 13,800 | 2,569,560 | ||||||
The accompanying notes are an integral part of the financial statements.
64
Table of Contents
MML Blue Chip Growth Fund – Portfolio of Investments (Continued)
| Number of Shares | Value | |||||||
J.B. Hunt Transport Services, Inc. | 7,400 | $ | 718,318 | |||||
Kansas City Southern | 300 | 25,455 | ||||||
Norfolk Southern Corp. | 1,500 | 162,105 | ||||||
Union Pacific Corp. | 400 | 41,472 | ||||||
|
| |||||||
| 4,944,610 | ||||||||
|
| |||||||
| 30,365,711 | ||||||||
|
| |||||||
| Technology — 11.4% | ||||||||
| Computers — 0.8% | ||||||||
Apple, Inc. | 26,167 | 3,030,662 | ||||||
|
| |||||||
| Semiconductors — 1.9% | ||||||||
Broadcom Ltd. | 14,700 | 2,598,519 | ||||||
Microchip Technology, Inc. | 2,700 | 173,205 | ||||||
NXP Semiconductor NV (a) | 45,657 | 4,474,842 | ||||||
|
| |||||||
| 7,246,566 | ||||||||
|
| |||||||
| Software — 8.7% | ||||||||
Activision Blizzard, Inc. | 3,400 | 122,774 | ||||||
Electronic Arts, Inc. (a) | 22,500 | 1,772,100 | ||||||
Fidelity National Information Services, Inc. | 17,550 | 1,327,482 | ||||||
Fiserv, Inc. (a) | 38,940 | 4,138,543 | ||||||
Intuit, Inc. | 8,200 | 939,802 | ||||||
Microsoft Corp. | 215,700 | 13,403,598 | ||||||
Red Hat, Inc. (a) | 24,248 | 1,690,086 | ||||||
Salesforce.com, Inc. (a) | 83,200 | 5,695,872 | ||||||
ServiceNow, Inc. (a) | 44,850 | 3,334,149 | ||||||
Workday, Inc. Class A (a) | 12,200 | 806,298 | ||||||
|
| |||||||
| 33,230,704 | ||||||||
|
| |||||||
| 43,507,932 | ||||||||
|
| |||||||
| Utilities — 0.3% | ||||||||
| Electric — 0.3% | ||||||||
NextEra Energy, Inc. | 9,900 | 1,182,654 | ||||||
|
| |||||||
| TOTAL COMMON STOCK (Cost $261,762,981) | 378,043,937 | |||||||
|
| |||||||
| TOTAL EQUITIES (Cost $261,762,981) | 378,043,937 | |||||||
|
| |||||||
| MUTUAL FUNDS — 0.0% | ||||||||
| Diversified Financial — 0.0% | ||||||||
T. Rowe Price Reserve Investment Fund | 1,005 | 1,005 | ||||||
|
| |||||||
| TOTAL MUTUAL FUNDS (Cost $1,005) | 1,005 | |||||||
|
| |||||||
| TOTAL LONG-TERM INVESTMENTS (Cost $261,763,986) | 378,044,942 | |||||||
|
| |||||||
| Principal Amount | Value | |||||||
| SHORT-TERM INVESTMENTS — 1.0% | ||||||||
| Repurchase Agreement — 1.0% | ||||||||
State Street Bank & Trust Co. Repurchase Agreement, dated 12/30/16, 0.010%, due 1/03/17 (b) | $ | 3,657,524 | $ | 3,657,524 | ||||
|
| |||||||
| TOTAL SHORT-TERM INVESTMENTS (Cost $3,657,524) | 3,657,524 | |||||||
|
| |||||||
| TOTAL INVESTMENTS — 100.4% (Cost $265,421,510) (c) | 381,702,466 | |||||||
| Other Assets/(Liabilities) — (0.4)% | (1,603,635 | ) | ||||||
|
| |||||||
| NET ASSETS — 100.0% | $ | 380,098,831 | ||||||
|
| |||||||
Notes to Portfolio of Investments
Percentages are stated as a percent of net assets.
| ADR | American Depositary Receipt |
| (a) | Non-income producing security. |
| (b) | Maturity value of $3,657,528. Collateralized by U.S. Government Agency obligations with a rate of 3.125%, maturity date of 5/15/19, and an aggregate market value, including accrued interest, of $3,734,113. |
| (c) | See Note 6 for aggregate cost for federal tax purposes. |
The accompanying notes are an integral part of the financial statements.
65
Table of Contents
MML Equity Income Fund – Portfolio of Investments
December 31, 2016
| Number of Shares | Value | |||||||
| EQUITIES — 97.7% | ||||||||
| COMMON STOCK — 96.6% | ||||||||
| Basic Materials — 4.9% | ||||||||
| Chemicals — 2.3% | ||||||||
CF Industries Holdings, Inc. | 118,800 | $ | 3,739,824 | |||||
E.I. du Pont de Nemours & Co. | 100,200 | 7,354,680 | ||||||
|
| |||||||
| 11,094,504 | ||||||||
|
| |||||||
| Forest Products & Paper — 1.1% | ||||||||
International Paper Co. | 105,200 | 5,581,912 | ||||||
|
| |||||||
| Iron & Steel — 0.7% | ||||||||
Nucor Corp. | 54,900 | 3,267,648 | ||||||
|
| |||||||
| Mining — 0.8% | ||||||||
Vulcan Materials Co. | 32,300 | 4,042,345 | ||||||
|
| |||||||
| 23,986,409 | ||||||||
|
| |||||||
| Communications — 7.7% | ||||||||
| Media — 3.8% | ||||||||
Comcast Corp. Class A | 84,400 | 5,827,820 | ||||||
News Corp. Class A | 284,000 | 3,254,640 | ||||||
Time Warner, Inc. | 6,433 | 620,978 | ||||||
Twenty-First Century Fox, Inc. Class B | 225,700 | 6,150,325 | ||||||
The Walt Disney Co. | 26,400 | 2,751,408 | ||||||
|
| |||||||
| 18,605,171 | ||||||||
|
| |||||||
| Telecommunications — 3.9% | ||||||||
CenturyLink, Inc. | 83,005 | 1,973,859 | ||||||
Cisco Systems, Inc. | 198,200 | 5,989,604 | ||||||
Telefonica SA | 165,655 | 1,536,121 | ||||||
Verizon Communications, Inc. | 155,335 | 8,291,782 | ||||||
Vodafone Group PLC | 543,492 | 1,336,705 | ||||||
|
| |||||||
| 19,128,071 | ||||||||
|
| |||||||
| 37,733,242 | ||||||||
|
| |||||||
| Consumer, Cyclical — 6.0% | ||||||||
| Airlines — 0.4% | ||||||||
Southwest Airlines Co. | 36,500 | 1,819,160 | ||||||
|
| |||||||
| Auto Manufacturers — 0.4% | ||||||||
Ford Motor Co. | 103,700 | 1,257,881 | ||||||
General Motors Co. | 21,949 | 764,703 | ||||||
|
| |||||||
| 2,022,584 | ||||||||
|
| |||||||
| Auto Parts & Equipment — 0.6% | ||||||||
Adient PLC (a) | 49,681 | 2,911,307 | ||||||
|
| |||||||
| Leisure Time — 0.7% | ||||||||
Carnival Corp. | 64,900 | 3,378,694 | ||||||
|
| |||||||
| Lodging — 0.9% | ||||||||
Las Vegas Sands Corp. | 86,300 | 4,609,283 | ||||||
|
| |||||||
| Retail — 2.2% | ||||||||
Kohl’s Corp. | 75,100 | 3,708,438 | ||||||
Macy’s, Inc. | 70,500 | 2,524,605 | ||||||
Staples, Inc. | 23,800 | 215,390 | ||||||
| Number of Shares | Value | |||||||
Wal-Mart Stores, Inc. | 59,900 | $ | 4,140,288 | |||||
|
| |||||||
| 10,588,721 | ||||||||
|
| |||||||
| Toys, Games & Hobbies — 0.8% | ||||||||
Mattel, Inc. | 148,100 | 4,080,155 | ||||||
|
| |||||||
| 29,409,904 | ||||||||
|
| |||||||
| Consumer, Non-cyclical — 13.5% | ||||||||
| Agriculture — 1.6% | ||||||||
Archer-Daniels-Midland Co. | 127,800 | 5,834,070 | ||||||
Philip Morris International, Inc. | 21,400 | 1,957,886 | ||||||
|
| |||||||
| 7,791,956 | ||||||||
|
| |||||||
| Beverages — 1.7% | ||||||||
Diageo PLC | 105,392 | 2,726,606 | ||||||
PepsiCo, Inc. | 51,700 | 5,409,371 | ||||||
|
| |||||||
| 8,135,977 | ||||||||
|
| |||||||
| Biotechnology — 0.4% | ||||||||
Gilead Sciences, Inc. | 30,500 | 2,184,105 | ||||||
|
| |||||||
| Cosmetics & Personal Care — 0.6% | ||||||||
Avon Products, Inc. | 169,400 | 853,776 | ||||||
Coty, Inc. Class A | 120,173 | 2,200,368 | ||||||
|
| |||||||
| 3,054,144 | ||||||||
|
| |||||||
| Foods — 0.6% | ||||||||
The Hershey Co. | 6,700 | 692,981 | ||||||
Kellogg Co. | 32,900 | 2,425,059 | ||||||
|
| |||||||
| 3,118,040 | ||||||||
|
| |||||||
| Health Care – Products — 3.0% | ||||||||
Becton, Dickinson & Co. | 21,300 | 3,526,215 | ||||||
Johnson & Johnson | 73,000 | 8,410,330 | ||||||
Medtronic PLC | 39,200 | 2,792,216 | ||||||
|
| |||||||
| 14,728,761 | ||||||||
|
| |||||||
| Health Care – Services — 1.4% | ||||||||
Anthem, Inc. | 46,300 | 6,656,551 | ||||||
|
| |||||||
| Pharmaceuticals — 4.2% | ||||||||
Bristol-Myers Squibb Co. | 67,600 | 3,950,544 | ||||||
GlaxoSmithKline PLC | 132,703 | 2,534,250 | ||||||
Merck & Co., Inc. | 73,200 | 4,309,284 | ||||||
Pfizer, Inc. | 300,254 | 9,752,250 | ||||||
|
| |||||||
| 20,546,328 | ||||||||
|
| |||||||
| 66,215,862 | ||||||||
|
| |||||||
| Energy — 11.0% | ||||||||
| Oil & Gas — 10.9% | ||||||||
Apache Corp. | 76,586 | 4,860,913 | ||||||
Canadian Natural Resources Ltd. | 68,600 | 2,186,968 | ||||||
Chevron Corp. | 47,600 | 5,602,520 | ||||||
EQT Corp. | 21,480 | 1,404,792 | ||||||
Exxon Mobil Corp. | 146,800 | 13,250,168 | ||||||
Hess Corp. | 95,000 | 5,917,550 | ||||||
Occidental Petroleum Corp. | 64,600 | 4,601,458 | ||||||
The accompanying notes are an integral part of the financial statements.
66
Table of Contents
MML Equity Income Fund – Portfolio of Investments (Continued)
| Number of Shares | Value | |||||||
Royal Dutch Shell PLC A Shares Sponsored ADR (United Kingdom) | 131,400 | $ | 7,145,532 | |||||
Total SA | 169,301 | 8,642,432 | ||||||
|
| |||||||
| 53,612,333 | ||||||||
|
| |||||||
| Oil & Gas Services — 0.1% | ||||||||
Targa Resources Corp. | 8,400 | 470,988 | ||||||
|
| |||||||
| 54,083,321 | ||||||||
|
| |||||||
| Financial — 26.7% | ||||||||
| Banks — 11.2% | ||||||||
Bank of America Corp. | 210,177 | 4,644,911 | ||||||
The Bank of New York Mellon Corp. | 89,400 | 4,235,772 | ||||||
Citigroup, Inc. | 120,500 | 7,161,315 | ||||||
Fifth Third Bancorp | 161,900 | 4,366,443 | ||||||
KeyCorp | 207,700 | 3,794,679 | ||||||
Northern Trust Corp. | 68,600 | 6,108,830 | ||||||
The PNC Financial Services Group, Inc. | 37,900 | 4,432,784 | ||||||
Royal Bank of Scotland Group PLC (a) | 737,931 | 2,038,111 | ||||||
State Street Corp. | 92,400 | 7,181,328 | ||||||
U.S. Bancorp | 47,500 | 2,440,075 | ||||||
Wells Fargo & Co. | 155,700 | 8,580,627 | ||||||
|
| |||||||
| 54,984,875 | ||||||||
|
| |||||||
| Diversified Financial — 8.1% | ||||||||
American Express Co. | 81,800 | 6,059,744 | ||||||
Ameriprise Financial, Inc. | 56,400 | 6,257,016 | ||||||
JP Morgan Chase & Co. | 197,700 | 17,059,533 | ||||||
Morgan Stanley | 238,700 | 10,085,075 | ||||||
Och-Ziff Capital Management Group LLC Class A | 144,200 | 477,302 | ||||||
|
| |||||||
| 39,938,670 | ||||||||
|
| |||||||
| Insurance — 5.4% | ||||||||
Chubb Ltd. | 6,908 | 912,685 | ||||||
Loews Corp. | 171,700 | 8,040,711 | ||||||
Marsh & McLennan Cos., Inc. | 85,500 | 5,778,945 | ||||||
MetLife, Inc. | 153,100 | 8,250,559 | ||||||
Willis Towers Watson PLC | 18,811 | 2,300,209 | ||||||
XL Group Ltd. | 36,900 | 1,374,894 | ||||||
|
| |||||||
| 26,658,003 | ||||||||
|
| |||||||
| Real Estate Investment Trusts (REITS) — 2.0% | ||||||||
Equity Residential | 46,000 | 2,960,560 | ||||||
Rayonier, Inc. | 110,900 | 2,949,940 | ||||||
Weyerhaeuser Co. | 123,342 | 3,711,361 | ||||||
|
| |||||||
| 9,621,861 | ||||||||
|
| |||||||
| 131,203,409 | ||||||||
|
| |||||||
| Number of Shares | Value | |||||||
| Industrial — 12.7% | ||||||||
| Aerospace & Defense — 3.6% | ||||||||
The Boeing Co. | 62,200 | $ | 9,683,296 | |||||
Harris Corp. | 67,535 | 6,920,311 | ||||||
United Technologies Corp. | 10,900 | 1,194,858 | ||||||
|
| |||||||
| 17,798,465 | ||||||||
|
| |||||||
| Electrical Components & Equipment — 1.0% | ||||||||
Emerson Electric Co. | 86,000 | 4,794,500 | ||||||
|
| |||||||
| Electronics — 1.9% | ||||||||
Johnson Controls International PLC | 191,415 | 7,884,384 | ||||||
TE Connectivity Ltd. | 22,800 | 1,579,584 | ||||||
|
| |||||||
| 9,463,968 | ||||||||
|
| |||||||
| Machinery – Diversified — 1.1% | ||||||||
Cummins, Inc. | 20,900 | 2,856,403 | ||||||
Flowserve Corp. | 52,592 | 2,527,046 | ||||||
|
| |||||||
| 5,383,449 | ||||||||
|
| |||||||
| Manufacturing — 3.5% | ||||||||
General Electric Co. | 300,500 | 9,495,800 | ||||||
Illinois Tool Works, Inc. | 39,800 | 4,873,908 | ||||||
Pentair PLC | 50,500 | 2,831,535 | ||||||
|
| |||||||
| 17,201,243 | ||||||||
|
| |||||||
| Transportation — 1.6% | ||||||||
Union Pacific Corp. | 31,100 | 3,224,448 | ||||||
United Parcel Service, Inc. Class B | 39,200 | 4,493,888 | ||||||
|
| |||||||
| 7,718,336 | ||||||||
|
| |||||||
| 62,359,961 | ||||||||
|
| |||||||
| Technology — 7.4% | ||||||||
| Computers — 1.0% | ||||||||
Apple, Inc. | 15,500 | 1,795,210 | ||||||
Western Digital Corp. | 45,500 | 3,091,725 | ||||||
|
| |||||||
| 4,886,935 | ||||||||
|
| |||||||
| Semiconductors — 4.1% | ||||||||
Analog Devices, Inc. | 61,200 | 4,444,344 | ||||||
Applied Materials, Inc. | 156,400 | 5,047,028 | ||||||
QUALCOMM, Inc. | 95,400 | 6,220,080 | ||||||
Texas Instruments, Inc. | 63,500 | 4,633,595 | ||||||
|
| |||||||
| 20,345,047 | ||||||||
|
| |||||||
| Software — 2.3% | ||||||||
CA, Inc. | 25,300 | 803,781 | ||||||
Microsoft Corp. | 168,300 | 10,458,162 | ||||||
|
| |||||||
| 11,261,943 | ||||||||
|
| |||||||
| 36,493,925 | ||||||||
|
| |||||||
| Utilities — 6.7% | ||||||||
| Electric — 5.6% | ||||||||
The AES Corp. | 379,300 | 4,407,466 | ||||||
Edison International | 60,600 | 4,362,594 | ||||||
Eversource Energy | 4,263 | 235,445 | ||||||
Exelon Corp. | 128,200 | 4,549,818 | ||||||
The accompanying notes are an integral part of the financial statements.
67
Table of Contents
MML Equity Income Fund – Portfolio of Investments (Continued)
| Number of Shares | Value | |||||||
FirstEnergy Corp. | 95,579 | $ | 2,960,082 | |||||
Great Plains Energy, Inc. | 5,256 | 143,752 | ||||||
PG&E Corp. | 99,800 | 6,064,846 | ||||||
The Southern Co. | 26,500 | 1,303,535 | ||||||
Xcel Energy, Inc. | 90,300 | 3,675,210 | ||||||
|
| |||||||
| 27,702,748 | ||||||||
|
| |||||||
| Gas — 1.1% | ||||||||
NiSource, Inc. | 231,600 | 5,127,624 | ||||||
|
| |||||||
| 32,830,372 | ||||||||
|
| |||||||
| TOTAL COMMON STOCK (Cost $369,287,858) | 474,316,405 | |||||||
|
| |||||||
| PREFERRED STOCK — 1.1% | ||||||||
| Utilities — 1.1% | ||||||||
| Electric — 1.1% | ||||||||
DTE Energy Co. | 15,505 | 821,765 | ||||||
Great Plains Energy, Inc. | 25,333 | 1,281,850 | ||||||
NextEra Energy, Inc. | 64,753 | 3,171,602 | ||||||
|
| |||||||
| 5,275,217 | ||||||||
|
| |||||||
| TOTAL PREFERRED STOCK (Cost $5,207,012) | 5,275,217 | |||||||
|
| |||||||
| TOTAL EQUITIES (Cost $374,494,870) | 479,591,622 | |||||||
|
| |||||||
| Principal Amount | ||||||||
| BONDS & NOTES — 0.2% | ||||||||
| CORPORATE DEBT — 0.2% | ||||||||
| Computers — 0.2% | ||||||||
Western Digital Corp. (b) | $ | 695,000 | 821,838 | |||||
|
| |||||||
| Pharmaceuticals — 0.0% | ||||||||
Valeant Pharmaceuticals International (b) | 54,000 | 46,389 | ||||||
|
| |||||||
| TOTAL CORPORATE DEBT (Cost $731,147) | 868,227 | |||||||
|
| |||||||
| TOTAL BONDS & NOTES (Cost $731,147) | 868,227 | |||||||
|
| |||||||
| Number of Shares | Value | |||||||
| MUTUAL FUNDS — 0.0% | ||||||||
| Diversified Financial — 0.0% | ||||||||
T. Rowe Price Reserve Investment Fund | 1,006 | $ | 1,006 | |||||
|
| |||||||
| TOTAL MUTUAL FUNDS (Cost $1,006) | 1,006 | |||||||
|
| |||||||
| TOTAL LONG-TERM INVESTMENTS (Cost $375,227,023) | 480,460,855 | |||||||
|
| |||||||
| Principal Amount | ||||||||
| SHORT-TERM INVESTMENTS — 2.0% | ||||||||
| Repurchase Agreement — 2.0% | ||||||||
State Street Bank & Trust Co. Repurchase Agreement, dated 12/30/16, 0.010%, due 1/03/17 (c) | $ | 9,915,158 | 9,915,158 | |||||
|
| |||||||
| Time Deposit — 0.0% | ||||||||
Euro Time Deposit | 43,397 | 43,397 | ||||||
|
| |||||||
| TOTAL SHORT-TERM INVESTMENTS (Cost $9,958,555) | 9,958,555 | |||||||
|
| |||||||
| TOTAL INVESTMENTS — 99.9% (Cost $385,185,578) (d) | 490,419,410 | |||||||
| Other Assets/(Liabilities) — 0.1% | 531,171 | |||||||
|
| |||||||
| NET ASSETS — 100.0% | $ | 490,950,581 | ||||||
|
| |||||||
Notes to Portfolio of Investments
Percentages are stated as a percent of net assets.
| ADR | American Depositary Receipt |
| (a) | Non-income producing security. |
| (b) | Securities exempt from registration under rule 144A of the Securities Act of 1933. These securities may be resold in transactions exempt from registration, normally to qualified institutional buyers. At December 31, 2016, these securities amounted to a value of $868,227 or 0.18% of net assets. |
| (c) | Maturity value of $9,915,169. Collateralized by U.S. Government Agency obligations with rates ranging from 1.625% – 3.125%, maturity dates ranging from 4/30/19 – 5/15/19, and an aggregate market value, including accrued interest, of $10,118,393. |
| (d) | See Note 6 for aggregate cost for federal tax purposes. |
The accompanying notes are an integral part of the financial statements.
68
Table of Contents
MML Equity Index Fund – Portfolio of Investments
December 31, 2016
| Number of Shares | Value | |||||||
| EQUITIES — 96.4% | ||||||||
| COMMON STOCK — 96.4% | ||||||||
| Basic Materials — 2.5% | ||||||||
| Chemicals — 2.0% | ||||||||
Air Products & Chemicals, Inc. | 6,130 | $ | 881,617 | |||||
Albemarle Corp. | 3,199 | 275,370 | ||||||
CF Industries Holdings, Inc. | 6,472 | 203,739 | ||||||
The Dow Chemical Co. | 31,648 | 1,810,899 | ||||||
E.I. du Pont de Nemours & Co. | 24,536 | 1,800,942 | ||||||
Eastman Chemical Co. | 4,101 | 308,436 | ||||||
Ecolab, Inc. | 7,403 | 867,780 | ||||||
FMC Corp. | 3,837 | 217,021 | ||||||
International Flavors & Fragrances, Inc. | 2,268 | 267,238 | ||||||
LyondellBasell Industries NV Class A | 9,435 | 809,334 | ||||||
Monsanto Co. | 12,362 | 1,300,606 | ||||||
The Mosaic Co. | 9,964 | 292,244 | ||||||
PPG Industries, Inc. | 7,465 | 707,383 | ||||||
Praxair, Inc. | 8,053 | 943,731 | ||||||
The Sherwin-Williams Co. | 2,290 | 615,415 | ||||||
|
| |||||||
| 11,301,755 | ||||||||
|
| |||||||
| Forest Products & Paper — 0.1% | ||||||||
International Paper Co. | 11,604 | 615,708 | ||||||
|
| |||||||
| Iron & Steel — 0.1% | ||||||||
Nucor Corp. | 8,969 | 533,835 | ||||||
|
| |||||||
| Mining — 0.3% | ||||||||
Freeport-McMoRan, Inc. (a) | 35,574 | 469,221 | ||||||
Newmont Mining Corp. | 14,975 | 510,198 | ||||||
Vulcan Materials Co. | 3,747 | 468,937 | ||||||
|
| |||||||
| 1,448,356 | ||||||||
|
| |||||||
| 13,899,654 | ||||||||
|
| |||||||
| Communications — 13.1% | ||||||||
| Advertising — 0.2% | ||||||||
The Interpublic Group of Companies, Inc. | 11,132 | 260,600 | ||||||
Nielsen Holdings PLC | 9,491 | 398,147 | ||||||
Omnicom Group, Inc. | 6,671 | 567,769 | ||||||
|
| |||||||
| 1,226,516 | ||||||||
|
| |||||||
| Internet — 6.5% | ||||||||
Akamai Technologies, Inc. (a) | 4,850 | 323,398 | ||||||
Alphabet, Inc. Class A (a) | 8,360 | 6,624,882 | ||||||
Alphabet, Inc. Class C (a) | 8,379 | 6,467,080 | ||||||
Amazon.com, Inc. (a) | 11,136 | 8,350,552 | ||||||
eBay, Inc. (a) | 29,384 | 872,411 | ||||||
Equinix, Inc. | 2,021 | 722,326 | ||||||
Expedia, Inc. | 3,416 | 386,964 | ||||||
F5 Networks, Inc. (a) | 1,838 | 265,995 | ||||||
Facebook, Inc. Class A (a) | 66,092 | 7,603,885 | ||||||
| Number of Shares | Value | |||||||
Netflix, Inc. (a) | 12,117 | $ | 1,500,085 | |||||
The Priceline Group, Inc. (a) | 1,394 | 2,043,688 | ||||||
Symantec Corp. | 17,490 | 417,836 | ||||||
TripAdvisor, Inc. (a) | 3,171 | 147,039 | ||||||
VeriSign, Inc. (a) | 2,579 | 196,184 | ||||||
Yahoo!, Inc. (a) | 24,793 | 958,745 | ||||||
|
| |||||||
| 36,881,070 | ||||||||
|
| |||||||
| Media — 2.8% | ||||||||
CBS Corp. Class B | 11,074 | 704,528 | ||||||
Charter Communications, Inc. Class A (a) | 6,114 | 1,760,343 | ||||||
Comcast Corp. Class A | 67,302 | 4,647,203 | ||||||
Discovery Communications, Inc. Series A (a) | 4,194 | 114,958 | ||||||
Discovery Communications, Inc. Series C (a) | 6,230 | 166,839 | ||||||
News Corp. Class A | 10,576 | 121,201 | ||||||
News Corp. Class B | 3,523 | 41,571 | ||||||
Scripps Networks Interactive Class A | 2,644 | 188,702 | ||||||
TEGNA, Inc. | 5,954 | 127,356 | ||||||
Time Warner, Inc. | 21,774 | 2,101,844 | ||||||
Twenty-First Century Fox, Inc. Class A | 29,914 | 838,789 | ||||||
Twenty-First Century Fox, Inc. Class B | 13,782 | 375,560 | ||||||
Viacom, Inc. Class B | 9,840 | 345,384 | ||||||
The Walt Disney Co. | 41,349 | 4,309,393 | ||||||
|
| |||||||
| 15,843,671 | ||||||||
|
| |||||||
| Telecommunications — 3.6% | ||||||||
AT&T, Inc. | 173,383 | 7,373,979 | ||||||
CenturyLink, Inc. | 15,451 | 367,425 | ||||||
Cisco Systems, Inc. | 141,748 | 4,283,624 | ||||||
Corning, Inc. | 26,886 | 652,523 | ||||||
Frontier Communications Corp. | 32,563 | 110,063 | ||||||
Juniper Networks, Inc. | 10,631 | 300,432 | ||||||
Level 3 Communications, Inc. (a) | 8,235 | 464,125 | ||||||
Motorola Solutions, Inc. | 4,713 | 390,661 | ||||||
Verizon Communications, Inc. | 115,095 | 6,143,771 | ||||||
|
| |||||||
| 20,086,603 | ||||||||
|
| |||||||
| 74,037,860 | ||||||||
|
| |||||||
| Consumer, Cyclical — 8.8% | ||||||||
| Airlines — 0.5% | ||||||||
Alaska Air Group, Inc. | 3,493 | 309,934 | ||||||
American Airlines Group, Inc. | 14,625 | 682,841 | ||||||
Delta Air Lines, Inc. | 20,785 | 1,022,414 | ||||||
Southwest Airlines Co. | 17,376 | 866,020 | ||||||
|
| |||||||
| 2,881,209 | ||||||||
|
| |||||||
| Apparel — 0.6% | ||||||||
Hanesbrands, Inc. | 10,801 | 232,978 | ||||||
Michael Kors Holdings Ltd. (a) | 4,690 | 201,576 | ||||||
The accompanying notes are an integral part of the financial statements.
69
Table of Contents
MML Equity Index Fund – Portfolio of Investments (Continued)
| Number of Shares | Value | |||||||
Nike, Inc. Class B | 37,752 | $ | 1,918,934 | |||||
Ralph Lauren Corp. | 1,565 | 141,351 | ||||||
Under Armour, Inc. Class A (a) | 5,090 | 147,864 | ||||||
Under Armour, Inc. Class C (a) | 5,116 | 128,770 | ||||||
VF Corp. | 9,375 | 500,156 | ||||||
|
| |||||||
| 3,271,629 | ||||||||
|
| |||||||
| Auto Manufacturers — 0.6% | ||||||||
Ford Motor Co. | 110,308 | 1,338,036 | ||||||
General Motors Co. | 39,195 | 1,365,554 | ||||||
PACCAR, Inc. | 9,895 | 632,291 | ||||||
|
| |||||||
| 3,335,881 | ||||||||
|
| |||||||
| Automotive & Parts — 0.2% | ||||||||
BorgWarner, Inc. | 5,593 | 220,588 | ||||||
Delphi Automotive PLC | 7,673 | 516,776 | ||||||
The Goodyear Tire & Rubber Co. | 7,286 | 224,919 | ||||||
|
| |||||||
| 962,283 | ||||||||
|
| |||||||
| Distribution & Wholesale — 0.3% | ||||||||
Fastenal Co. | 8,170 | 383,826 | ||||||
Genuine Parts Co. | 4,208 | 402,032 | ||||||
LKQ Corp. (a) | 8,744 | 268,004 | ||||||
W.W. Grainger, Inc. | 1,543 | 358,362 | ||||||
|
| |||||||
| 1,412,224 | ||||||||
|
| |||||||
| Home Builders — 0.1% | ||||||||
D.R. Horton, Inc. | 9,648 | 263,680 | ||||||
Lennar Corp. Class A | 5,542 | 237,918 | ||||||
PulteGroup, Inc. | 8,579 | 157,682 | ||||||
|
| |||||||
| 659,280 | ||||||||
|
| |||||||
| Home Furnishing — 0.1% | ||||||||
Harman International Industries, Inc. | 1,937 | 215,317 | ||||||
Whirlpool Corp. | 2,133 | 387,715 | ||||||
|
| |||||||
| 603,032 | ||||||||
|
| |||||||
| Housewares — 0.1% | ||||||||
Newell Brands, Inc. | 13,629 | 608,535 | ||||||
|
| |||||||
| Leisure Time — 0.2% | ||||||||
Carnival Corp. | 11,844 | 616,598 | ||||||
Harley-Davidson, Inc. | 4,964 | 289,600 | ||||||
Royal Caribbean Cruises Ltd. | 4,743 | 389,116 | ||||||
|
| |||||||
| 1,295,314 | ||||||||
|
| |||||||
| Lodging — 0.2% | ||||||||
Marriott International, Inc. Class A | 9,041 | 747,510 | ||||||
Wyndham Worldwide Corp. | 3,051 | 233,005 | ||||||
Wynn Resorts Ltd. | 2,204 | 190,668 | ||||||
|
| |||||||
| 1,171,183 | ||||||||
|
| |||||||
| Retail — 5.7% | ||||||||
Advance Auto Parts, Inc. | 2,084 | 352,446 | ||||||
AutoNation, Inc. (a) | 1,842 | 89,613 | ||||||
AutoZone, Inc. (a) | 812 | 641,310 | ||||||
Bed Bath & Beyond, Inc. | 4,286 | 174,183 | ||||||
Best Buy Co., Inc. | 7,662 | 326,938 | ||||||
| Number of Shares | Value | |||||||
CarMax, Inc. (a) | 5,421 | $ | 349,058 | |||||
Chipotle Mexican Grill, Inc. (a) | 826 | 311,666 | ||||||
Coach, Inc. | 7,959 | 278,724 | ||||||
Costco Wholesale Corp. | 12,342 | 1,976,078 | ||||||
CVS Health Corp. | 30,111 | 2,376,059 | ||||||
Darden Restaurants, Inc. | 3,477 | 252,847 | ||||||
Dollar General Corp. | 7,189 | 532,489 | ||||||
Dollar Tree, Inc. (a) | 6,678 | 515,408 | ||||||
Foot Locker, Inc. | 3,849 | 272,856 | ||||||
The Gap, Inc. | 6,083 | 136,503 | ||||||
The Home Depot, Inc. | 34,403 | 4,612,754 | ||||||
Kohl’s Corp. | 4,985 | 246,159 | ||||||
L Brands, Inc. | 6,798 | 447,580 | ||||||
Lowe’s Cos., Inc. | 24,575 | 1,747,774 | ||||||
Macy’s, Inc. | 8,562 | 306,605 | ||||||
McDonald’s Corp. | 23,446 | 2,853,847 | ||||||
Nordstrom, Inc. | 3,225 | 154,574 | ||||||
O’Reilly Automotive, Inc. (a) | 2,670 | 743,355 | ||||||
PVH Corp. | 2,227 | 200,965 | ||||||
Ross Stores, Inc. | 11,214 | 735,638 | ||||||
Signet Jewelers Ltd. | 1,932 | 182,110 | ||||||
Staples, Inc. | 18,060 | 163,443 | ||||||
Starbucks Corp. | 41,091 | 2,281,372 | ||||||
Target Corp. | 15,886 | 1,147,446 | ||||||
Tiffany & Co. | 2,982 | 230,896 | ||||||
The TJX Cos., Inc. | 18,428 | 1,384,496 | ||||||
Tractor Supply Co. | 3,711 | 281,331 | ||||||
Ulta Salon Cosmetics & Fragrance, Inc. (a) | 1,657 | 422,436 | ||||||
Urban Outfitters, Inc. (a) | 2,471 | 70,374 | ||||||
Wal-Mart Stores, Inc. | 42,508 | 2,938,153 | ||||||
Walgreens Boots Alliance, Inc. | 24,162 | 1,999,647 | ||||||
Yum! Brands, Inc. | 9,841 | 623,231 | ||||||
|
| |||||||
| 32,360,364 | ||||||||
|
| |||||||
| Textiles — 0.1% | ||||||||
Cintas Corp. | 2,432 | 281,042 | ||||||
Mohawk Industries, Inc. (a) | 1,784 | 356,229 | ||||||
|
| |||||||
| 637,271 | ||||||||
|
| |||||||
| Toys, Games & Hobbies — 0.1% | ||||||||
Hasbro, Inc. | 3,133 | 243,716 | ||||||
Mattel, Inc. | 9,701 | 267,263 | ||||||
|
| |||||||
| 510,979 | ||||||||
|
| |||||||
| 49,709,184 | ||||||||
|
| |||||||
| Consumer, Non-cyclical — 22.0% | ||||||||
| Agriculture — 1.7% | ||||||||
Altria Group, Inc. | 55,022 | 3,720,587 | ||||||
Archer-Daniels-Midland Co. | 16,301 | 744,141 | ||||||
Philip Morris International, Inc. | 43,771 | 4,004,609 | ||||||
Reynolds American, Inc. | 23,345 | 1,308,254 | ||||||
|
| |||||||
| 9,777,591 | ||||||||
|
| |||||||
The accompanying notes are an integral part of the financial statements.
70
Table of Contents
MML Equity Index Fund – Portfolio of Investments (Continued)
| Number of Shares | Value | |||||||
| Beverages — 2.0% | ||||||||
Brown-Forman Corp. Class B | 5,217 | $ | 234,348 | |||||
The Coca-Cola Co. | 109,548 | 4,541,860 | ||||||
Constellation Brands, Inc. Class A | 5,027 | 770,689 | ||||||
Dr. Pepper Snapple Group, Inc. | 5,225 | 473,751 | ||||||
Molson Coors Brewing Co. Class B | 5,202 | 506,207 | ||||||
Monster Beverage Corp. (a) | 11,443 | 507,382 | ||||||
PepsiCo, Inc. | 40,464 | 4,233,748 | ||||||
|
| |||||||
| 11,267,985 | ||||||||
|
| |||||||
| Biotechnology — 2.2% | ||||||||
Alexion Pharmaceuticals, Inc. (a) | 6,332 | 774,720 | ||||||
Amgen, Inc. | 21,005 | 3,071,141 | ||||||
Biogen, Inc. (a) | 6,143 | 1,742,032 | ||||||
Celgene Corp. (a) | 21,887 | 2,533,420 | ||||||
Gilead Sciences, Inc. | 37,199 | 2,663,821 | ||||||
Illumina, Inc. (a) | 4,147 | 530,982 | ||||||
Regeneron Pharmaceuticals, Inc. (a) | 2,135 | 783,737 | ||||||
Vertex Pharmaceuticals, Inc. (a) | 7,009 | 516,353 | ||||||
|
| |||||||
| 12,616,206 | ||||||||
|
| |||||||
| Commercial Services — 1.9% | ||||||||
Automatic Data Processing, Inc. | 12,739 | 1,309,315 | ||||||
Equifax, Inc. | 3,384 | 400,090 | ||||||
Global Payments, Inc. | 4,363 | 302,836 | ||||||
H&R Block, Inc. | 6,083 | 139,848 | ||||||
Moody’s Corp. | 4,727 | 445,614 | ||||||
Paychex, Inc. | 9,092 | 553,521 | ||||||
PayPal Holdings, Inc. (a) | 31,688 | 1,250,725 | ||||||
Quanta Services, Inc. (a) | 4,192 | 146,091 | ||||||
Robert Half International, Inc. | 3,614 | 176,291 | ||||||
S&P Global, Inc. | 7,314 | 786,548 | ||||||
Total System Services, Inc. | 4,731 | 231,961 | ||||||
United Rentals, Inc. (a) | 2,392 | 252,547 | ||||||
Verisk Analytics, Inc. (a) | 4,365 | 354,307 | ||||||
Visa, Inc. Class A | 52,733 | 4,114,229 | ||||||
The Western Union Co. | 13,538 | 294,045 | ||||||
|
| |||||||
| 10,757,968 | ||||||||
|
| |||||||
| Cosmetics & Personal Care — 1.6% | ||||||||
Colgate-Palmolive Co. | 25,068 | 1,640,450 | ||||||
Coty, Inc. Class A | 13,094 | 239,751 | ||||||
The Estee Lauder Cos., Inc. Class A | 6,295 | 481,505 | ||||||
The Procter & Gamble Co. | 75,539 | 6,351,319 | ||||||
|
| |||||||
| 8,713,025 | ||||||||
|
| |||||||
| Foods — 1.7% | ||||||||
Campbell Soup Co. | 5,514 | 333,432 | ||||||
Conagra Brands, Inc. | 11,753 | 464,831 | ||||||
General Mills, Inc. | 16,665 | 1,029,397 | ||||||
The Hershey Co. | 3,964 | 409,997 | ||||||
Hormel Foods Corp. | 7,700 | 268,037 | ||||||
The J.M. Smucker Co. | 3,287 | 420,933 | ||||||
Kellogg Co. | 7,110 | 524,078 | ||||||
The Kraft Heinz Co. | 16,819 | 1,468,635 | ||||||
| Number of Shares | Value | |||||||
The Kroger Co. | 26,665 | $ | 920,209 | |||||
McCormick & Co., Inc. | 3,269 | 305,096 | ||||||
Mondelez International, Inc. Class A | 43,592 | 1,932,433 | ||||||
Sysco Corp. | 14,204 | 786,475 | ||||||
Tyson Foods, Inc. Class A | 8,210 | 506,393 | ||||||
Whole Foods Market, Inc. | 9,064 | 278,809 | ||||||
|
| |||||||
| 9,648,755 | ||||||||
|
| |||||||
| Health Care – Products — 3.7% | ||||||||
Abbott Laboratories | 41,569 | 1,596,665 | ||||||
Baxter International, Inc. | 13,809 | 612,291 | ||||||
Becton, Dickinson & Co. | 5,992 | 991,976 | ||||||
Boston Scientific Corp. (a) | 38,411 | 830,830 | ||||||
C.R. Bard, Inc. | 2,074 | �� | 465,945 | |||||
The Cooper Cos., Inc. | 1,393 | 243,677 | ||||||
Edwards Lifesciences Corp. (a) | 6,036 | 565,573 | ||||||
Henry Schein, Inc. (a) | 2,270 | 344,382 | ||||||
Hologic, Inc. (a) | 7,877 | 316,025 | ||||||
Intuitive Surgical, Inc. (a) | 1,096 | 695,050 | ||||||
Johnson & Johnson | 76,805 | 8,848,704 | ||||||
Medtronic PLC | 38,764 | 2,761,160 | ||||||
St. Jude Medical, Inc. | 8,062 | 646,492 | ||||||
Stryker Corp. | 8,770 | 1,050,734 | ||||||
Varian Medical Systems, Inc. (a) | 2,670 | 239,713 | ||||||
Zimmer Biomet Holdings, Inc. | 5,656 | 583,699 | ||||||
|
| |||||||
| 20,792,916 | ||||||||
|
| |||||||
| Health Care – Services — 2.3% | ||||||||
Aetna, Inc. | 9,904 | 1,228,195 | ||||||
Anthem, Inc. | 7,436 | 1,069,074 | ||||||
Centene Corp. (a) | 4,859 | 274,582 | ||||||
Cigna Corp. | 7,248 | 966,811 | ||||||
DaVita, Inc. (a) | 4,404 | 282,737 | ||||||
DENTSPLY SIRONA, Inc. | 6,469 | 373,455 | ||||||
Envision Healthcare Corp. (a) | 3,364 | 212,908 | ||||||
HCA Holdings, Inc. (a) | 8,293 | 613,848 | ||||||
Humana, Inc. | 4,209 | 858,762 | ||||||
Laboratory Corporation of America Holdings (a) | 2,905 | 372,944 | ||||||
Quest Diagnostics, Inc. | 3,935 | 361,626 | ||||||
Thermo Fisher Scientific, Inc. | 11,149 | 1,573,124 | ||||||
UnitedHealth Group, Inc. | 26,867 | 4,299,795 | ||||||
Universal Health Services, Inc. Class B | 2,501 | 266,056 | ||||||
|
| |||||||
| 12,753,917 | ||||||||
|
| |||||||
| Household Products — 0.4% | ||||||||
Avery Dennison Corp. | 2,466 | 173,163 | ||||||
Church & Dwight Co., Inc. | 7,308 | 322,940 | ||||||
The Clorox Co. | 3,651 | 438,193 | ||||||
Kimberly-Clark Corp. | 10,110 | 1,153,753 | ||||||
|
| |||||||
| 2,088,049 | ||||||||
|
| |||||||
The accompanying notes are an integral part of the financial statements.
71
Table of Contents
MML Equity Index Fund – Portfolio of Investments (Continued)
| Number of Shares | Value | |||||||
| Pharmaceuticals — 4.5% | ||||||||
AbbVie, Inc. | 45,882 | $ | 2,873,131 | |||||
Allergan PLC (a) | 10,592 | 2,224,426 | ||||||
AmerisourceBergen Corp. | 4,732 | 369,995 | ||||||
Bristol-Myers Squibb Co. | 47,187 | 2,757,608 | ||||||
Cardinal Health, Inc. | 9,075 | 653,128 | ||||||
Eli Lilly & Co. | 27,431 | 2,017,550 | ||||||
Endo International PLC (a) | 5,503 | 90,634 | ||||||
Express Scripts Holding Co. (a) | 17,408 | 1,197,496 | ||||||
Mallinckrodt PLC (a) | 2,990 | 148,962 | ||||||
McKesson Corp. | 6,383 | 896,492 | ||||||
Mead Johnson Nutrition Co. | 5,223 | 369,580 | ||||||
Merck & Co., Inc. | 77,844 | 4,582,676 | ||||||
Mylan NV (a) | 13,001 | 495,988 | ||||||
Patterson Cos., Inc. | 2,331 | 95,641 | ||||||
Perrigo Co. PLC | 4,060 | 337,914 | ||||||
Pfizer, Inc. | 171,335 | 5,564,961 | ||||||
Zoetis, Inc. | 13,943 | 746,369 | ||||||
|
| |||||||
| 25,422,551 | ||||||||
|
| |||||||
| 123,838,963 | ||||||||
|
| |||||||
| Diversified — 0.0% | ||||||||
| Holding Company – Diversified — 0.0% | ||||||||
Leucadia National Corp. | 9,032 | 209,994 | ||||||
|
| |||||||
| Energy — 7.3% | ||||||||
| Energy – Alternate Sources — 0.0% | ||||||||
First Solar, Inc. (a) | 2,224 | 71,368 | ||||||
|
| |||||||
| Oil & Gas — 5.7% | ||||||||
Anadarko Petroleum Corp. | 15,780 | 1,100,339 | ||||||
Apache Corp. | 10,713 | 679,954 | ||||||
Cabot Oil & Gas Corp. | 13,224 | 308,913 | ||||||
Chesapeake Energy Corp. (a) | 20,690 | 145,244 | ||||||
Chevron Corp. | 53,297 | 6,273,057 | ||||||
Cimarex Energy Co. | 2,689 | 365,435 | ||||||
Concho Resources, Inc. (a) | 4,148 | 550,025 | ||||||
ConocoPhillips | 34,986 | 1,754,198 | ||||||
Devon Energy Corp. | 14,784 | 675,185 | ||||||
EOG Resources, Inc. | 16,274 | 1,645,301 | ||||||
EQT Corp. | 4,899 | 320,395 | ||||||
Exxon Mobil Corp. | 117,076 | 10,567,280 | ||||||
Helmerich & Payne, Inc. | 3,088 | 239,011 | ||||||
Hess Corp. | 7,582 | 472,283 | ||||||
Marathon Oil Corp. | 23,929 | 414,211 | ||||||
Marathon Petroleum Corp. | 14,905 | 750,467 | ||||||
Murphy Oil Corp. | 4,493 | 139,867 | ||||||
Newfield Exploration Co. (a) | 5,513 | 223,277 | ||||||
Noble Energy, Inc. | 12,106 | 460,754 | ||||||
Occidental Petroleum Corp. | 21,578 | 1,537,001 | ||||||
Phillips 66 | 12,501 | 1,080,211 | ||||||
Pioneer Natural Resources Co. | 4,791 | 862,715 | ||||||
Range Resources Corp. | 5,218 | 179,291 | ||||||
Southwestern Energy Co. (a) | 13,698 | 148,212 | ||||||
Tesoro Corp. | 3,297 | 288,323 | ||||||
| Number of Shares | Value | |||||||
Valero Energy Corp. | 12,782 | $ | 873,266 | |||||
|
| |||||||
| 32,054,215 | ||||||||
|
| |||||||
| Oil & Gas Services — 1.1% | ||||||||
Baker Hughes, Inc. | 11,934 | 775,352 | ||||||
FMC Technologies, Inc. (a) | 6,462 | 229,595 | ||||||
Halliburton Co. | 24,379 | 1,318,660 | ||||||
National Oilwell Varco, Inc. | 10,664 | 399,260 | ||||||
Schlumberger Ltd. | 39,273 | 3,296,969 | ||||||
Transocean Ltd. (a) | 10,769 | 158,735 | ||||||
|
| |||||||
| 6,178,571 | ||||||||
|
| |||||||
| Pipelines — 0.5% | ||||||||
Kinder Morgan, Inc. | 54,208 | 1,122,648 | ||||||
ONEOK, Inc. | 5,962 | 342,278 | ||||||
Spectra Energy Corp. | 19,804 | 813,746 | ||||||
The Williams Cos., Inc. | 19,293 | 600,784 | ||||||
|
| |||||||
| 2,879,456 | ||||||||
|
| |||||||
| 41,183,610 | ||||||||
|
| |||||||
| Financial — 17.2% | ||||||||
| Banks — 6.1% | ||||||||
Bank of America Corp. | 285,332 | 6,305,837 | ||||||
The Bank of New York Mellon Corp. | 29,859 | 1,414,719 | ||||||
BB&T Corp. | 22,927 | 1,078,028 | ||||||
Capital One Financial Corp. | 13,622 | 1,188,383 | ||||||
Citigroup, Inc. | 80,494 | 4,783,758 | ||||||
Citizens Financial Group, Inc. | 14,425 | 513,963 | ||||||
Comerica, Inc. | 4,832 | 329,108 | ||||||
Fifth Third Bancorp | 21,354 | 575,917 | ||||||
The Goldman Sachs Group, Inc. | 10,443 | 2,500,576 | ||||||
Huntington Bancshares, Inc. | 30,689 | 405,709 | ||||||
KeyCorp | 30,532 | 557,820 | ||||||
M&T Bank Corp. | 4,399 | 688,136 | ||||||
Northern Trust Corp. | 5,912 | 526,464 | ||||||
The PNC Financial Services Group, Inc. | 13,742 | 1,607,264 | ||||||
Regions Financial Corp. | 34,784 | 499,498 | ||||||
State Street Corp. | 10,240 | 795,853 | ||||||
SunTrust Banks, Inc. | 13,871 | 760,824 | ||||||
U.S. Bancorp | 45,113 | 2,317,455 | ||||||
Wells Fargo & Co. | 127,627 | 7,033,524 | ||||||
Zions Bancorp | 5,699 | 245,285 | ||||||
|
| |||||||
| 34,128,121 | ||||||||
|
| |||||||
| Diversified Financial — 4.3% | ||||||||
Affiliated Managers Group, Inc. (a) | 1,562 | 226,959 | ||||||
Alliance Data Systems Corp. | 1,625 | 371,313 | ||||||
American Express Co. | 21,706 | 1,607,980 | ||||||
Ameriprise Financial, Inc. | 4,465 | 495,347 | ||||||
BlackRock, Inc. | 3,432 | 1,306,013 | ||||||
The Charles Schwab Corp. | 34,063 | 1,344,467 | ||||||
CME Group, Inc. | 9,580 | 1,105,053 | ||||||
Discover Financial Services | 11,132 | 802,506 | ||||||
The accompanying notes are an integral part of the financial statements.
72
Table of Contents
MML Equity Index Fund – Portfolio of Investments (Continued)
| Number of Shares | Value | |||||||
E*TRADE Financial Corp. (a) | 7,826 | $ | 271,171 | |||||
Franklin Resources, Inc. | 9,780 | 387,092 | ||||||
Intercontinental Exchange, Inc. | 16,819 | 948,928 | ||||||
Invesco Ltd. | 11,639 | 353,127 | ||||||
JP Morgan Chase & Co. | 101,031 | 8,717,965 | ||||||
MasterCard, Inc. Class A | 26,874 | 2,774,740 | ||||||
Morgan Stanley | 40,725 | 1,720,631 | ||||||
Nasdaq, Inc. | 3,189 | 214,046 | ||||||
Navient Corp. | 8,609 | 141,446 | ||||||
Synchrony Financial | 22,181 | 804,505 | ||||||
T. Rowe Price Group, Inc. | 6,877 | 517,563 | ||||||
|
| |||||||
| 24,110,852 | ||||||||
|
| |||||||
| Insurance — 4.2% | ||||||||
Aflac, Inc. | 11,525 | 802,140 | ||||||
The Allstate Corp. | 10,409 | 771,515 | ||||||
American International Group, Inc. | 27,558 | 1,799,813 | ||||||
Aon PLC | 7,435 | 829,226 | ||||||
Arthur J. Gallagher & Co. | 5,055 | 262,658 | ||||||
Assurant, Inc. | 1,584 | 147,090 | ||||||
Berkshire Hathaway, Inc. Class B (a) | 53,610 | 8,737,358 | ||||||
Chubb Ltd. | 13,137 | 1,735,660 | ||||||
Cincinnati Financial Corp. | 4,254 | 322,241 | ||||||
The Hartford Financial Services Group, Inc. | 10,673 | 508,568 | ||||||
Lincoln National Corp. | 6,456 | 427,839 | ||||||
Loews Corp. | 7,826 | 366,492 | ||||||
Marsh & McLennan Cos., Inc. | 14,549 | 983,367 | ||||||
MetLife, Inc. | 31,036 | 1,672,530 | ||||||
Principal Financial Group, Inc. | 7,555 | 437,132 | ||||||
The Progressive Corp. | 16,389 | 581,809 | ||||||
Prudential Financial, Inc. | 12,142 | 1,263,497 | ||||||
Torchmark Corp. | 3,098 | 228,508 | ||||||
The Travelers Cos., Inc. | 8,022 | 982,053 | ||||||
Unum Group | 6,516 | 286,248 | ||||||
Willis Towers Watson PLC | 3,603 | 440,575 | ||||||
XL Group Ltd. | 7,635 | 284,480 | ||||||
|
| |||||||
| 23,870,799 | ||||||||
|
| |||||||
| Real Estate — 0.0% | ||||||||
CBRE Group, Inc. Class A (a) | 8,517 | 268,200 | ||||||
|
| |||||||
| Real Estate Investment Trusts (REITS) — 2.6% | ||||||||
American Tower Corp. | 12,001 | 1,268,266 | ||||||
Apartment Investment & Management Co. Class A | 4,506 | 204,798 | ||||||
AvalonBay Communities, Inc. | 3,859 | 683,622 | ||||||
Boston Properties, Inc. | 4,324 | 543,873 | ||||||
Crown Castle International Corp. | 10,203 | 885,314 | ||||||
Digital Realty Trust, Inc. | 4,484 | 440,598 | ||||||
Equity Residential | 10,283 | 661,814 | ||||||
Essex Property Trust, Inc. | 1,849 | 429,892 | ||||||
Extra Space Storage, Inc. | 3,586 | 276,983 | ||||||
Federal Realty Investment Trust | 2,019 | 286,920 | ||||||
General Growth Properties, Inc. | 16,489 | 411,895 | ||||||
| Number of Shares | Value | |||||||
HCP, Inc. | 13,216 | $ | 392,780 | |||||
Host Hotels & Resorts, Inc. | 20,977 | 395,207 | ||||||
Iron Mountain, Inc. | 7,014 | 227,815 | ||||||
Kimco Realty Corp. | 12,039 | 302,901 | ||||||
The Macerich Co. | 3,451 | 244,469 | ||||||
Mid-America Apartment Communities, Inc. | 3,225 | 315,792 | ||||||
Prologis, Inc. | 14,951 | 789,263 | ||||||
Public Storage | 4,218 | 942,723 | ||||||
Realty Income Corp. | 7,301 | 419,661 | ||||||
Simon Property Group, Inc. | 8,853 | 1,572,913 | ||||||
SL Green Realty Corp. | 2,850 | 306,518 | ||||||
UDR, Inc. | 7,613 | 277,722 | ||||||
Ventas, Inc. | 10,024 | 626,700 | ||||||
Vornado Realty Trust | 4,839 | 505,046 | ||||||
Welltower, Inc. | 10,224 | 684,292 | ||||||
Weyerhaeuser Co. | 21,077 | 634,207 | ||||||
|
| |||||||
| 14,731,984 | ||||||||
|
| |||||||
| Savings & Loans — 0.0% | ||||||||
People’s United Financial, Inc. | 8,654 | 167,542 | ||||||
|
| |||||||
| 97,277,498 | ||||||||
|
| |||||||
| Industrial — 9.8% | ||||||||
| Aerospace & Defense — 2.1% | ||||||||
Arconic, Inc. | 12,520 | 232,121 | ||||||
The Boeing Co. | 16,201 | 2,522,172 | ||||||
General Dynamics Corp. | 8,075 | 1,394,230 | ||||||
Harris Corp. | 3,518 | 360,489 | ||||||
L3 Technologies, Inc. | 2,189 | 332,969 | ||||||
Lockheed Martin Corp. | 7,112 | 1,777,573 | ||||||
Northrop Grumman Corp. | 4,972 | 1,156,388 | ||||||
Raytheon Co. | 8,287 | 1,176,754 | ||||||
Rockwell Collins, Inc. | 3,682 | 341,542 | ||||||
TransDigm Group, Inc. | 1,418 | 353,025 | ||||||
United Technologies Corp. | 21,612 | 2,369,107 | ||||||
|
| |||||||
| 12,016,370 | ||||||||
|
| |||||||
| Airlines — 0.1% | ||||||||
United Continental Holdings, Inc. (a) | 8,150 | 593,972 | ||||||
|
| |||||||
| Building Materials — 0.2% | ||||||||
Fortune Brands Home & Security, Inc. | 4,399 | 235,171 | ||||||
Martin Marietta Materials, Inc. | 1,791 | 396,760 | ||||||
Masco Corp. | 9,167 | 289,860 | ||||||
|
| |||||||
| 921,791 | ||||||||
|
| |||||||
| Electrical Components & Equipment — 0.3% | ||||||||
Acuity Brands, Inc. | 1,248 | 288,113 | ||||||
AMETEK, Inc. | 6,596 | 320,566 | ||||||
Emerson Electric Co. | 18,135 | 1,011,026 | ||||||
|
| |||||||
| 1,619,705 | ||||||||
|
| |||||||
| Electronics — 0.8% | ||||||||
Agilent Technologies, Inc. | 9,192 | 418,787 | ||||||
The accompanying notes are an integral part of the financial statements.
73
Table of Contents
MML Equity Index Fund – Portfolio of Investments (Continued)
| Number of Shares | Value | |||||||
Allegion PLC | 2,662 | $ | 170,368 | |||||
Amphenol Corp. Class A | 8,718 | 585,850 | ||||||
FLIR Systems, Inc. | 3,812 | 137,956 | ||||||
Fortive Corp. | 8,493 | 455,480 | ||||||
Garmin Ltd. | 3,198 | 155,071 | ||||||
Johnson Controls International PLC | 26,457 | 1,089,764 | ||||||
Mettler-Toledo International, Inc. (a) | 736 | 308,060 | ||||||
PerkinElmer, Inc. | 3,040 | 158,536 | ||||||
TE Connectivity Ltd. | 10,050 | 696,264 | ||||||
Waters Corp. (a) | 2,289 | 307,619 | ||||||
|
| |||||||
| 4,483,755 | ||||||||
|
| |||||||
| Engineering & Construction — 0.1% | ||||||||
Fluor Corp. | 3,994 | 209,765 | ||||||
Jacobs Engineering Group, Inc. (a) | 3,370 | 192,090 | ||||||
|
| |||||||
| 401,855 | ||||||||
|
| |||||||
| Environmental Controls — 0.2% | ||||||||
Republic Services, Inc. | 6,469 | 369,057 | ||||||
Stericycle, Inc. (a) | 2,360 | 181,814 | ||||||
Waste Management, Inc. | 11,496 | 815,181 | ||||||
|
| |||||||
| 1,366,052 | ||||||||
|
| |||||||
| Hand & Machine Tools — 0.1% | ||||||||
Snap-on, Inc. | 1,653 | 283,109 | ||||||
Stanley Black & Decker, Inc. | 4,256 | 488,121 | ||||||
|
| |||||||
| 771,230 | ||||||||
|
| |||||||
| Machinery – Construction & Mining — 0.4% | ||||||||
Caterpillar, Inc. | 16,517 | 1,531,786 | ||||||
Ingersoll-Rand PLC | 7,291 | 547,117 | ||||||
|
| |||||||
| 2,078,903 | ||||||||
|
| |||||||
| Machinery – Diversified — 0.5% | ||||||||
Cummins, Inc. | 4,358 | 595,608 | ||||||
Deere & Co. | 8,168 | 841,631 | ||||||
Flowserve Corp. | 3,620 | 173,941 | ||||||
Rockwell Automation, Inc. | 3,645 | 489,888 | ||||||
Roper Technologies, Inc. | 2,867 | 524,890 | ||||||
Xylem, Inc. | 5,113 | 253,196 | ||||||
|
| |||||||
| 2,879,154 | ||||||||
|
| |||||||
| Manufacturing — 3.2% | ||||||||
3M Co. | 16,977 | 3,031,583 | ||||||
Danaher Corp. | 17,180 | 1,337,291 | ||||||
Dover Corp. | 4,401 | 329,767 | ||||||
Eaton Corp. PLC | 12,742 | 854,861 | ||||||
General Electric Co. | 249,771 | 7,892,764 | ||||||
Honeywell International, Inc. | 21,517 | 2,492,744 | ||||||
Illinois Tool Works, Inc. | 8,908 | 1,090,874 | ||||||
Leggett & Platt, Inc. | 3,710 | 181,345 | ||||||
Parker Hannifin Corp. | 3,767 | 527,380 | ||||||
Pentair PLC | 4,748 | 266,220 | ||||||
Textron, Inc. | 7,630 | 370,513 | ||||||
|
| |||||||
| 18,375,342 | ||||||||
|
| |||||||
| Number of Shares | Value | |||||||
| Packaging & Containers — 0.2% | ||||||||
Ball Corp. | 4,938 | $ | 370,696 | |||||
Sealed Air Corp. | 5,459 | 247,511 | ||||||
WestRock Co. | 7,116 | 361,279 | ||||||
|
| |||||||
| 979,486 | ||||||||
|
| |||||||
| Transportation — 1.6% | ||||||||
C.H. Robinson Worldwide, Inc. | 3,963 | 290,329 | ||||||
CSX Corp. | 26,458 | 950,636 | ||||||
Expeditors International of Washington, Inc. | 5,027 | 266,230 | ||||||
FedEx Corp. | 6,910 | 1,286,642 | ||||||
J.B. Hunt Transport Services, Inc. | 2,441 | 236,948 | ||||||
Kansas City Southern | 3,079 | 261,253 | ||||||
Norfolk Southern Corp. | 8,252 | 891,794 | ||||||
Ryder System, Inc. | 1,485 | 110,543 | ||||||
Union Pacific Corp. | 23,272 | 2,412,841 | ||||||
United Parcel Service, Inc. Class B | 19,480 | 2,233,187 | ||||||
|
| |||||||
| 8,940,403 | ||||||||
|
| |||||||
| 55,428,018 | ||||||||
|
| |||||||
| Technology — 12.6% | ||||||||
| Computers — 4.9% | ||||||||
Accenture PLC Class A | 17,514 | 2,051,415 | ||||||
Apple, Inc. | 150,557 | 17,437,512 | ||||||
Cognizant Technology Solutions Corp. Class A (a) | 17,132 | 959,906 | ||||||
CSRA, Inc. | 4,043 | 128,729 | ||||||
Hewlett Packard Enterprise Co. | 47,061 | 1,088,991 | ||||||
HP, Inc. | 48,331 | 717,232 | ||||||
International Business Machines Corp. | 24,428 | 4,054,804 | ||||||
NetApp, Inc. | 7,736 | 272,849 | ||||||
Seagate Technology PLC | 8,289 | 316,391 | ||||||
Teradata Corp. (a) | 3,620 | 98,355 | ||||||
Western Digital Corp. | 8,064 | 547,949 | ||||||
|
| |||||||
| 27,674,133 | ||||||||
|
| |||||||
| Office Equipment/Supplies — 0.1% | ||||||||
Pitney Bowes, Inc. | 5,212 | 79,170 | ||||||
Xerox Corp. | 24,397 | 212,986 | ||||||
|
| |||||||
| 292,156 | ||||||||
|
| |||||||
| Semiconductors — 3.2% | ||||||||
Analog Devices, Inc. | 8,669 | 629,543 | ||||||
Applied Materials, Inc. | 30,523 | 984,977 | ||||||
Broadcom Ltd. | 11,221 | 1,983,536 | ||||||
Intel Corp. | 133,820 | 4,853,651 | ||||||
KLA-Tencor Corp. | 4,419 | 347,687 | ||||||
Lam Research Corp. | 4,628 | 489,319 | ||||||
Linear Technology Corp. | 6,793 | 423,544 | ||||||
Microchip Technology, Inc. | 6,110 | 391,957 | ||||||
Micron Technology, Inc. (a) | 29,422 | 644,930 | ||||||
NVIDIA Corp. | 15,218 | 1,624,369 | ||||||
Qorvo, Inc. (a) | 3,550 | 187,192 | ||||||
The accompanying notes are an integral part of the financial statements.
74
Table of Contents
MML Equity Index Fund – Portfolio of Investments (Continued)
| Number of Shares | Value | |||||||
QUALCOMM, Inc. | 41,702 | $ | 2,718,970 | |||||
Skyworks Solutions, Inc. | 5,203 | 388,456 | ||||||
Texas Instruments, Inc. | 28,227 | 2,059,724 | ||||||
Xilinx, Inc. | 7,149 | 431,585 | ||||||
|
| |||||||
| 18,159,440 | ||||||||
|
| |||||||
| Software — 4.4% | ||||||||
Activision Blizzard, Inc. | 19,393 | 700,281 | ||||||
Adobe Systems, Inc. (a) | 14,039 | 1,445,315 | ||||||
Autodesk, Inc. (a) | 5,532 | 409,423 | ||||||
CA, Inc. | 8,941 | 284,056 | ||||||
Cerner Corp. (a) | 8,535 | 404,303 | ||||||
Citrix Systems, Inc. (a) | 4,405 | 393,411 | ||||||
The Dun & Bradstreet Corp. | 1,068 | 129,570 | ||||||
Electronic Arts, Inc. (a) | 8,561 | 674,264 | ||||||
Fidelity National Information Services, Inc. | 9,272 | 701,334 | ||||||
Fiserv, Inc. (a) | 6,133 | 651,815 | ||||||
Intuit, Inc. | 6,882 | 788,746 | ||||||
Microsoft Corp. | 219,522 | 13,641,097 | ||||||
Oracle Corp. | 84,616 | 3,253,485 | ||||||
Red Hat, Inc. (a) | 5,028 | 350,452 | ||||||
Salesforce.com, Inc. (a) | 18,026 | 1,234,060 | ||||||
|
| |||||||
| 25,061,612 | ||||||||
|
| |||||||
| 71,187,341 | ||||||||
|
| |||||||
| Utilities — 3.1% | ||||||||
| Electric — 2.8% | ||||||||
The AES Corp. | 18,859 | 219,142 | ||||||
Alliant Energy Corp. | 6,496 | 246,133 | ||||||
Ameren Corp. | 6,872 | 360,505 | ||||||
American Electric Power Co., Inc. | 13,865 | 872,940 | ||||||
CenterPoint Energy, Inc. | 12,243 | 301,668 | ||||||
CMS Energy Corp. | 7,916 | 329,464 | ||||||
Consolidated Edison, Inc. | 8,579 | 632,101 | ||||||
Dominion Resources, Inc. | 17,668 | 1,353,192 | ||||||
DTE Energy Co. | 5,055 | 497,968 | ||||||
Duke Energy Corp. | 19,433 | 1,508,390 | ||||||
Edison International | 9,175 | 660,508 | ||||||
Entergy Corp. | 5,066 | 372,199 | ||||||
Eversource Energy | 8,952 | 494,419 | ||||||
Exelon Corp. | 26,098 | 926,218 | ||||||
FirstEnergy Corp. | 12,035 | 372,724 | ||||||
NextEra Energy, Inc. | 13,185 | 1,575,080 | ||||||
NRG Energy, Inc. | 8,745 | 107,214 | ||||||
PG&E Corp. | 14,256 | 866,337 | ||||||
Pinnacle West Capital Corp. | 3,179 | 248,057 | ||||||
PPL Corp. | 19,115 | 650,866 | ||||||
Public Service Enterprise Group, Inc. | 14,266 | 625,992 | ||||||
SCANA Corp. | 4,065 | 297,883 | ||||||
The Southern Co. | 27,643 | 1,359,759 | ||||||
WEC Energy Group, Inc. | 8,886 | 521,164 | ||||||
Xcel Energy, Inc. | 14,296 | 581,847 | ||||||
|
| |||||||
| 15,981,770 | ||||||||
|
| |||||||
| Number of Shares | Value | |||||||
| Gas — 0.2% | ||||||||
NiSource, Inc. | 9,255 | $ | 204,906 | |||||
Sempra Energy | 7,030 | 707,499 | ||||||
|
| |||||||
| 912,405 | ||||||||
|
| |||||||
| Water — 0.1% | ||||||||
American Water Works Co., Inc. | 5,031 | 364,043 | ||||||
|
| |||||||
| 17,258,218 | ||||||||
|
| |||||||
| TOTAL COMMON STOCK (Cost $334,711,231) | 544,030,340 | |||||||
|
| |||||||
| TOTAL EQUITIES (Cost $334,711,231) | 544,030,340 | |||||||
|
| |||||||
| TOTAL LONG-TERM INVESTMENTS (Cost $334,711,231) | 544,030,340 | |||||||
|
| |||||||
| Principal Amount | ||||||||
| SHORT-TERM INVESTMENTS — 3.5% | ||||||||
| Repurchase Agreement — 3.3% | ||||||||
State Street Bank & Trust Co. Repurchase Agreement, dated 12/30/16, 0.010%, due 1/03/17 (b) | $ | 18,414,468 | 18,414,468 | |||||
|
| |||||||
| Time Deposit — 0.0% | ||||||||
Euro Time Deposit | 7,777 | 7,777 | ||||||
|
| |||||||
| U.S. Treasury Bill — 0.2% | ||||||||
U.S. Treasury Bill (c) | 1,205,000 | 1,204,060 | ||||||
|
| |||||||
| TOTAL SHORT-TERM INVESTMENTS (Cost $19,626,319) | 19,626,305 | |||||||
|
| |||||||
| TOTAL INVESTMENTS — 99.9% (Cost $354,337,550) (d) | 563,656,645 | |||||||
| Other Assets/(Liabilities) — 0.1% | 317,910 | |||||||
|
| |||||||
| NET ASSETS — 100.0% | $ | 563,974,555 | ||||||
|
| |||||||
Notes to Portfolio of Investments
Percentages are stated as a percent of net assets.
| (a) | Non-income producing security. |
| (b) | Maturity value of $18,414,488. Collateralized by U.S. Government Agency obligations with a rate of 3.125%, maturity date of 5/15/21, and an aggregate market value, including accrued interest, of $18,784,606. |
| (c) | A portion of this security is held as collateral for open futures contracts. (Note 2). |
| (d) | See Note 6 for aggregate cost for federal tax purposes. |
The accompanying notes are an integral part of the financial statements.
75
Table of Contents
MML Focused Equity Fund – Portfolio of Investments
December 31, 2016
| Number of Shares | Value | |||||||
| EQUITIES — 97.8% | ||||||||
| COMMON STOCK — 97.8% | ||||||||
| Communications — 24.5% | ||||||||
| Internet — 10.5% | ||||||||
Alphabet, Inc. Class C (a) | 10,500 | $ | 8,104,110 | |||||
CDW Corp. | 118,000 | 6,146,620 | ||||||
|
| |||||||
| 14,250,730 | ||||||||
|
| |||||||
| Media — 9.8% | ||||||||
Charter Communications, Inc. Class A (a) | 26,700 | 7,687,464 | ||||||
Tribune Media Co. Class A | 161,500 | 5,649,270 | ||||||
|
| |||||||
| 13,336,734 | ||||||||
|
| |||||||
| Telecommunications — 4.2% | ||||||||
CommScope Holding Co., Inc. (a) | 151,000 | 5,617,200 | ||||||
|
| |||||||
| 33,204,664 | ||||||||
|
| |||||||
| Consumer, Cyclical — 15.9% | ||||||||
| Auto Manufacturers — 6.7% | ||||||||
General Motors Co. | 264,000 | 9,197,760 | ||||||
|
| |||||||
| Retail — 9.2% | ||||||||
CarMax, Inc. (a) | 105,700 | 6,806,023 | ||||||
Tiffany & Co. | 73,000 | 5,652,390 | ||||||
|
| |||||||
| 12,458,413 | ||||||||
|
| |||||||
| 21,656,173 | ||||||||
|
| |||||||
| Consumer, Non-cyclical — 14.0% | ||||||||
| Health Care – Products — 4.8% | ||||||||
Baxter International, Inc. | 146,500 | 6,495,810 | ||||||
|
| |||||||
| Health Care – Services — 5.3% | ||||||||
HCA Holdings, Inc. (a) | 97,500 | 7,216,950 | ||||||
|
| |||||||
| Pharmaceuticals — 3.9% | ||||||||
Quintiles IMS Holdings, Inc. (a) | 70,000 | 5,323,500 | ||||||
|
| |||||||
| 19,036,260 | ||||||||
|
| |||||||
| Financial — 34.5% | ||||||||
| Banks — 10.3% | ||||||||
The Goldman Sachs Group, Inc. | 17,500 | 4,190,375 | ||||||
Wells Fargo & Co. | 177,500 | 9,782,025 | ||||||
|
| |||||||
| 13,972,400 | ||||||||
|
| |||||||
| Diversified Financial — 10.5% | ||||||||
BlackRock, Inc. | 16,300 | 6,202,802 | ||||||
JP Morgan Chase & Co. | 93,500 | 8,068,115 | ||||||
|
| |||||||
| 14,270,917 | ||||||||
|
| |||||||
| Insurance — 10.1% | ||||||||
American International Group, Inc. | 117,000 | 7,641,270 | ||||||
Aon PLC | 55,000 | 6,134,150 | ||||||
|
| |||||||
| 13,775,420 | ||||||||
|
| |||||||
| Number of Shares | Value | |||||||
| Real Estate — 3.6% | ||||||||
CBRE Group, Inc. Class A (a) | 154,000 | $ | 4,849,460 | |||||
|
| |||||||
| 46,868,197 | ||||||||
|
| |||||||
| Industrial — 8.9% | ||||||||
| Machinery – Construction & Mining — 4.5% | ||||||||
Caterpillar, Inc. | 66,000 | 6,120,840 | ||||||
|
| |||||||
| Machinery – Diversified — 4.4% | ||||||||
Cummins, Inc. | 43,200 | 5,904,144 | ||||||
|
| |||||||
| 12,024,984 | ||||||||
|
| |||||||
| TOTAL COMMON STOCK (Cost $106,580,396) | 132,790,278 | |||||||
|
| |||||||
| TOTAL EQUITIES (Cost $106,580,396) | 132,790,278 | |||||||
|
| |||||||
| TOTAL LONG-TERM INVESTMENTS (Cost $106,580,396) | 132,790,278 | |||||||
|
| |||||||
| Principal Amount | ||||||||
| SHORT-TERM INVESTMENTS — 2.3% | ||||||||
| Repurchase Agreement — 2.3% | ||||||||
State Street Bank & Trust Co. Repurchase Agreement, dated 12/30/16, 0.010%, due 1/03/17 (b) | $ | 3,141,952 | 3,141,952 | |||||
|
| |||||||
| TOTAL SHORT-TERM INVESTMENTS (Cost $3,141,952) | 3,141,952 | |||||||
|
| |||||||
| TOTAL INVESTMENTS — 100.1% (Cost $109,722,348) (c) | 135,932,230 | |||||||
| Other Assets/(Liabilities) — (0.1)% | (114,098 | ) | ||||||
|
| |||||||
| NET ASSETS — 100.0% | $ | 135,818,132 | ||||||
|
| |||||||
Notes to Portfolio of Investments
Percentages are stated as a percent of net assets.
| (a) | Non-income producing security. |
| (b) | Maturity value of $3,141,955. Collateralized by U.S. Government Agency obligations with a rate of 1.625%, maturity date of 4/30/19, and an aggregate market value, including accrued interest, of $3,205,401. |
| (c) | See Note 6 for aggregate cost for federal tax purposes. |
The accompanying notes are an integral part of the financial statements.
76
Table of Contents
MML Foreign Fund – Portfolio of Investments
December 31, 2016
| Number of Shares | Value | |||||||
| EQUITIES — 97.3% | ||||||||
| COMMON STOCK — 97.3% | ||||||||
| Bermuda — 0.4% | ||||||||
Kunlun Energy Co. Ltd | 1,700,000 | $ | 1,269,101 | |||||
|
| |||||||
| Brazil — 0.5% | ||||||||
Embraer SA Sponsored ADR (Brazil) | 84,639 | 1,629,301 | ||||||
|
| |||||||
| Canada — 0.5% | ||||||||
Silver Wheaton Corp. | 95,700 | 1,848,924 | ||||||
|
| |||||||
| Cayman Islands — 2.4% | ||||||||
Baidu, Inc. Sponsored ADR (Cayman Islands) (a) | 20,070 | 3,299,709 | ||||||
Cheung Kong Property Holdings Ltd. | 367,254 | 2,227,089 | ||||||
CK Hutchison Holdings Ltd. | 288,754 | 3,259,774 | ||||||
|
| |||||||
| 8,786,572 | ||||||||
|
| |||||||
| China — 3.5% | ||||||||
China Life Insurance Co. Ltd. | 1,251,000 | 3,236,332 | ||||||
China Telecom Corp. Ltd. Class H | 11,037,643 | 5,083,250 | ||||||
CRRC Corp. Ltd. | 1,616,100 | 1,445,489 | ||||||
Sinopharm Group Co. Ltd. Class H | 568,800 | 2,333,650 | ||||||
Weichai Power Co. Ltd. Class H | 273,100 | 418,823 | ||||||
|
| |||||||
| 12,517,544 | ||||||||
|
| |||||||
| France — 10.1% | ||||||||
AXA SA | 216,747 | 5,469,374 | ||||||
BNP Paribas | 114,450 | 7,290,625 | ||||||
Cie Generale des Etablissements Michelin Class B | 33,060 | 3,677,223 | ||||||
Compagnie de Saint-Gobain | 96,920 | 4,513,212 | ||||||
Credit Agricole SA | 208,930 | 2,590,231 | ||||||
Sanofi | 76,358 | 6,175,520 | ||||||
Total SA | 95,472 | 4,873,629 | ||||||
Zodiac Aerospace | 73,100 | 1,678,120 | ||||||
|
| |||||||
| 36,267,934 | ||||||||
|
| |||||||
| Germany — 13.1% | ||||||||
Bayer AG | 55,810 | 5,822,432 | ||||||
Deutsche Boerse AG (a) | 31,620 | 2,576,023 | ||||||
Deutsche Lufthansa AG | 128,000 | 1,653,933 | ||||||
Deutsche Post AG | 66,911 | 2,197,239 | ||||||
HeidelbergCement AG | 48,930 | 4,564,902 | ||||||
Infineon Technologies AG | 273,297 | 4,736,742 | ||||||
Innogy SE (a) (b) | 88,140 | 3,064,535 | ||||||
Lanxess AG | 75,100 | 4,920,719 | ||||||
Merck KGaA | 50,900 | 5,311,964 | ||||||
Metro AG | 83,660 | 2,776,382 | ||||||
MorphoSys AG (a) (c) | 20,350 | 1,042,262 | ||||||
SAP AG Sponsored ADR (Germany) | 40,788 | 3,525,307 | ||||||
Siemens AG | 37,896 | 4,658,249 | ||||||
|
| |||||||
| 46,850,689 | ||||||||
|
| |||||||
| Hong Kong — 1.9% | ||||||||
AIA Group Ltd. | 485,200 | 2,715,308 | ||||||
| Number of Shares | Value | |||||||
China Mobile Ltd. | 382,500 | $ | 4,010,807 | |||||
|
| |||||||
| 6,726,115 | ||||||||
|
| |||||||
| Ireland — 1.5% | ||||||||
CRH PLC | 160,802 | 5,557,675 | ||||||
|
| |||||||
| Israel — 1.7% | ||||||||
Teva Pharmaceutical Industries Ltd. Sponsored ADR (Israel) | 171,799 | 6,227,714 | ||||||
|
| |||||||
| Italy — 1.9% | ||||||||
Eni SpA | 371,293 | 6,019,797 | ||||||
UniCredit SpA (c) | 331,247 | 952,264 | ||||||
|
| |||||||
| 6,972,061 | ||||||||
|
| |||||||
| Japan — 11.7% | ||||||||
IHI Corp. (a) | 607,000 | 1,573,805 | ||||||
Inpex Corp. | 304,100 | 3,036,035 | ||||||
Konica Minolta Holding, Inc. | 446,100 | 4,419,131 | ||||||
Nissan Motor Co. Ltd. | 517,770 | 5,194,532 | ||||||
Omron Corp. | 120,100 | 4,596,429 | ||||||
Panasonic Corp. | 330,300 | 3,352,215 | ||||||
SoftBank Group Corp. | 83,700 | 5,525,652 | ||||||
Sumitomo Metal Mining Co. Ltd. | 226,000 | 2,906,826 | ||||||
Sumitomo Rubber Industries Ltd. | 121,700 | 1,925,148 | ||||||
Suntory Beverage & Food Ltd. | 129,100 | 5,340,690 | ||||||
Toshiba Corp. (a) | 1,046,000 | 2,527,186 | ||||||
Toyota Motor Corp. Sponsored ADR (Japan) | 14,919 | 1,748,507 | ||||||
|
| |||||||
| 42,146,156 | ||||||||
|
| |||||||
| Luxembourg — 0.6% | ||||||||
Subsea 7 SA (a) | 168,800 | 2,133,713 | ||||||
|
| |||||||
| Netherlands — 4.9% | ||||||||
Akzo Nobel NV | 75,670 | 4,725,701 | ||||||
ING Groep NV | 378,890 | 5,332,090 | ||||||
NN Group NV | 63,590 | 2,153,331 | ||||||
QIAGEN NV (a) | 84,700 | 2,376,289 | ||||||
SBM Offshore NV | 191,128 | 2,992,046 | ||||||
|
| |||||||
| 17,579,457 | ||||||||
|
| |||||||
| Norway — 1.8% | ||||||||
Telenor ASA | 316,016 | 4,711,672 | ||||||
Yara International ASA | 44,800 | 1,764,143 | ||||||
|
| |||||||
| 6,475,815 | ||||||||
|
| |||||||
| Portugal — 1.0% | ||||||||
Galp Energia SGPS SA | 242,320 | 3,602,107 | ||||||
|
| |||||||
| Republic of Korea — 5.9% | ||||||||
Hana Financial Group, Inc. | 79,353 | 2,048,480 | ||||||
Hyundai Mobis | 18,195 | 3,968,332 | ||||||
Hyundai Motor Co. | 14,936 | 1,794,455 | ||||||
KB Financial Group, Inc. Sponsored ADR (Republic of Korea) (a) | 80,916 | 2,855,526 | ||||||
The accompanying notes are an integral part of the financial statements.
77
Table of Contents
MML Foreign Fund – Portfolio of Investments (Continued)
| Number of Shares | Value | |||||||
Samsung Electronics Co., Ltd. | 7,180 | $ | 10,608,866 | |||||
|
| |||||||
| 21,275,659 | ||||||||
|
| |||||||
| Singapore — 3.3% | ||||||||
DBS Group Holdings, Ltd. | 385,379 | 4,597,858 | ||||||
Singapore Telecommunications Ltd. | 340,700 | 853,466 | ||||||
Singapore Telecommunications Ltd. | 1,468,000 | 3,684,117 | ||||||
United Overseas Bank Ltd. | 201,500 | 2,827,814 | ||||||
|
| |||||||
| 11,963,255 | ||||||||
|
| |||||||
| Spain — 1.1% | ||||||||
Telefonica SA Sponsored ADR (Spain) (c) | 432,139 | 3,975,679 | ||||||
|
| |||||||
| Sweden — 0.6% | ||||||||
Getinge AB Class B | 128,140 | 2,052,481 | ||||||
|
| |||||||
| Switzerland — 5.9% | ||||||||
ABB Ltd. | 99,000 | 2,084,086 | ||||||
Novartis AG | 54,480 | 3,962,802 | ||||||
Roche Holding AG | 31,790 | 7,243,453 | ||||||
Swiss Re AG | 40,730 | 3,858,799 | ||||||
UBS Group AG | 257,960 | 4,038,346 | ||||||
|
| |||||||
| 21,187,486 | ||||||||
|
| |||||||
| Taiwan — 1.0% | ||||||||
Taiwan Semiconductor Manufacturing Co. Ltd. | 641,275 | 3,591,164 | ||||||
|
| |||||||
| Thailand — 1.0% | ||||||||
Bangkok Bank PCL | 792,100 | 3,559,625 | ||||||
|
| |||||||
| United Kingdom — 21.0% | ||||||||
Aviva PLC | 657,655 | 3,924,297 | ||||||
BAE Systems PLC | 633,010 | 4,597,031 | ||||||
Barclays PLC | 1,857,820 | 5,103,376 | ||||||
BP PLC | 1,648,784 | 10,244,707 | ||||||
GlaxoSmithKline PLC | 251,884 | 4,810,269 | ||||||
Glencore PLC (a) | 721,150 | 2,423,853 | ||||||
HSBC Holdings PLC | 781,600 | 6,278,950 | ||||||
Johnson Matthey PLC | 61,620 | 2,407,748 | ||||||
Kingfisher PLC | 789,544 | 3,400,070 | ||||||
LivaNova PLC (a) | 50,930 | 2,290,322 | ||||||
Petrofac Ltd. | 190,850 | 2,039,585 | ||||||
Royal Dutch Shell PLC Class A | 2,397 | 66,049 | ||||||
Royal Dutch Shell PLC Class B | 351,154 | 10,020,465 | ||||||
Sky PLC | 398,860 | 4,852,589 | ||||||
Standard Chartered PLC (a) | 553,782 | 4,535,682 | ||||||
Tesco PLC (a) | 1,373,370 | 3,495,891 | ||||||
Vodafone Group PLC Sponsored ADR (United Kingdom) | 195,308 | 4,771,374 | ||||||
|
| |||||||
| 75,262,258 | ||||||||
|
| |||||||
| TOTAL COMMON STOCK (Cost $346,917,243) | 349,458,485 | |||||||
|
| |||||||
| TOTAL EQUITIES (Cost $346,917,243) | 349,458,485 | |||||||
|
| |||||||
| Number of Shares | Value | |||||||
MUTUAL FUNDS — 0.6% |
| |||||||
| United States — 0.6% | ||||||||
State Street Navigator Securities Lending Prime Portfolio (d) | 2,095,368 | $ | 2,095,368 | |||||
|
| |||||||
| TOTAL MUTUAL FUNDS (Cost $2,095,368) | 2,095,368 | |||||||
|
| |||||||
| TOTAL LONG-TERM INVESTMENTS (Cost $349,012,611) | 351,553,853 | |||||||
|
| |||||||
| Principal Amount | ||||||||
| SHORT-TERM INVESTMENTS — 2.6% | ||||||||
| Repurchase Agreement — 2.6% | ||||||||
State Street Bank & Trust Co. Repurchase Agreement, dated 12/30/16, 0.010%, due 1/03/17 (e) | $ | 9,225,651 | 9,225,651 | |||||
|
| |||||||
| TOTAL SHORT-TERM INVESTMENTS (Cost $9,225,651) | 9,225,651 | |||||||
|
| |||||||
| TOTAL INVESTMENTS — 100.5% (Cost $358,238,262) (f) | 360,779,504 | |||||||
| Other Assets/(Liabilities) — (0.5)% | (1,711,971 | ) | ||||||
|
| |||||||
| NET ASSETS — 100.0% | $ | 359,067,533 | ||||||
|
| |||||||
Notes to Portfolio of Investments
Percentages are stated as a percent of net assets.
| ADR | American Depositary Receipt |
| (a) | Non-income producing security. |
| (b) | Securities exempt from registration under rule 144A of the Securities Act of 1933. These securities may be resold in transactions exempt from registration, normally to qualified institutional buyers. At December 31, 2016, these securities amounted to a value of $3,064,535 or 0.85% of net assets. |
| (c) | Denotes all or a portion of security on loan. The total value of securities on loan as of December 31, 2016, was $1,993,224 or 0.56% of net assets. Total securities on loan may not correspond with the amounts identified in the Portfolio of Investments because pending sales may be in the process of recall from the brokers. (Note 2). |
| (d) | Represents investment of security lending collateral. (Note 2). |
| (e) | Maturity value of $9,225,661. Collateralized by U.S. Government Agency obligations with rates ranging from 1.500% – 3.125%, maturity dates ranging from 5/15/19 – 11/30/19, and an aggregate market value, including accrued interest, of $9,411,933. |
| (f) | See Note 6 for aggregate cost for federal tax purposes. |
The accompanying notes are an integral part of the financial statements.
78
Table of Contents
MML Fundamental Growth Fund – Portfolio of Investments
December 31, 2016
| Number of Shares | Value | |||||||
| EQUITIES — 99.9% | ||||||||
| COMMON STOCK — 99.9% | ||||||||
| Basic Materials — 2.4% | ||||||||
| Chemicals — 0.4% | ||||||||
The Sherwin-Williams Co. | 2,304 | $ | 619,177 | |||||
|
| |||||||
| Iron & Steel — 0.8% | ||||||||
Nucor Corp. | 23,992 | 1,428,004 | ||||||
|
| |||||||
| Mining — 1.2% | ||||||||
Rio Tinto PLC Sponsored ADR (United Kingdom) | 50,946 | 1,959,383 | ||||||
|
| |||||||
| 4,006,564 | ||||||||
|
| |||||||
| Communications — 22.4% | ||||||||
| Advertising — 0.8% | ||||||||
Omnicom Group, Inc. | 15,708 | 1,336,908 | ||||||
|
| |||||||
| Internet — 16.7% | ||||||||
Alibaba Group Holding Ltd. Sponsored ADR (Cayman Islands) (a) | 11,684 | 1,025,972 | ||||||
Alphabet, Inc. Class C (a) | 11,772 | 9,085,865 | ||||||
Amazon.com, Inc. (a) | 5,523 | 4,141,532 | ||||||
Baidu, Inc. Sponsored ADR (Cayman Islands) (a) | 3,619 | 595,000 | ||||||
eBay, Inc. (a) | 64,714 | 1,921,359 | ||||||
F5 Networks, Inc. (a) | 11,927 | 1,726,075 | ||||||
Facebook, Inc. Class A (a) | 45,261 | 5,207,278 | ||||||
GoDaddy, Inc. Class A (a) | 5,343 | 186,738 | ||||||
Netflix, Inc. (a) | 7,060 | 874,028 | ||||||
The Priceline Group, Inc. (a) | 1,668 | 2,445,388 | ||||||
Yandex NV Class A (a) | 57,128 | 1,149,987 | ||||||
|
| |||||||
| 28,359,222 | ||||||||
|
| |||||||
| Media — 4.1% | ||||||||
Comcast Corp. Class A | 53,189 | 3,672,700 | ||||||
Discovery Communications, Inc. Series A (a) | 31,238 | 856,234 | ||||||
FactSet Research Systems, Inc. | 3,510 | 573,639 | ||||||
Scripps Networks Interactive Class A | 19,848 | 1,416,552 | ||||||
Viacom, Inc. Class B | 14,748 | 517,655 | ||||||
|
| |||||||
| 7,036,780 | ||||||||
|
| |||||||
| Telecommunications — 0.8% | ||||||||
Cisco Systems, Inc. | 42,252 | 1,276,855 | ||||||
|
| |||||||
| 38,009,765 | ||||||||
|
| |||||||
| Consumer, Cyclical — 5.0% | ||||||||
| Lodging — 1.1% | ||||||||
Las Vegas Sands Corp. | 24,858 | 1,327,666 | ||||||
Wyndham Worldwide Corp. | 6,498 | 496,252 | ||||||
|
| |||||||
| 1,823,918 | ||||||||
|
| |||||||
| Retail — 3.9% | ||||||||
Dollar General Corp. | 9,828 | 727,960 | ||||||
The Home Depot, Inc. | 25,118 | 3,367,821 | ||||||
| Number of Shares | Value | |||||||
O’Reilly Automotive, Inc. (a) | 2,218 | $ | 617,513 | |||||
Ross Stores, Inc. | 9,433 | 618,805 | ||||||
The TJX Cos., Inc. | 12,819 | 963,092 | ||||||
Wal-Mart Stores, Inc. | 4,714 | 325,832 | ||||||
|
| |||||||
| 6,621,023 | ||||||||
|
| |||||||
| 8,444,941 | ||||||||
|
| |||||||
| Consumer, Non-cyclical — 24.6% | ||||||||
| Beverages — 2.3% | ||||||||
PepsiCo, Inc. | 36,998 | 3,871,101 | ||||||
|
| |||||||
| Biotechnology — 3.5% | ||||||||
Amgen, Inc. | 23,052 | 3,370,433 | ||||||
Celgene Corp. (a) | 2,863 | 331,392 | ||||||
Gilead Sciences, Inc. | 30,692 | 2,197,854 | ||||||
|
| |||||||
| 5,899,679 | ||||||||
|
| |||||||
| Commercial Services — 7.7% | ||||||||
Experian PLC | 42,642 | 825,387 | ||||||
Gartner, Inc. (a) | 8,994 | 909,023 | ||||||
Global Payments, Inc. | 12,916 | 896,499 | ||||||
IHS Markit Ltd. (a) | 47,388 | 1,678,009 | ||||||
Paychex, Inc. | 23,098 | 1,406,206 | ||||||
PayPal Holdings, Inc. (a) | 47,146 | 1,860,853 | ||||||
Vantiv, Inc. Class A (a) | 25,335 | 1,510,473 | ||||||
Verisk Analytics, Inc. (a) | 6,529 | 529,959 | ||||||
Visa, Inc. Class A | 44,480 | 3,470,330 | ||||||
|
| |||||||
| 13,086,739 | ||||||||
|
| |||||||
| Cosmetics & Personal Care — 0.5% | ||||||||
Colgate-Palmolive Co. | 13,754 | 900,062 | ||||||
|
| |||||||
| Foods — 1.1% | ||||||||
BRF SA Sponsored ADR (Brazil) | 24,991 | 368,867 | ||||||
The Hershey Co. | 9,479 | 980,413 | ||||||
Mondelez International, Inc. Class A | 12,543 | 556,031 | ||||||
|
| |||||||
| 1,905,311 | ||||||||
|
| |||||||
| Health Care – Products — 3.2% | ||||||||
Becton, Dickinson & Co. | 6,344 | 1,050,249 | ||||||
C.R. Bard, Inc. | 3,441 | 773,055 | ||||||
Johnson & Johnson | 16,774 | 1,932,533 | ||||||
Medtronic PLC | 13,138 | 935,820 | ||||||
Varian Medical Systems, Inc. (a) | 7,421 | 666,257 | ||||||
|
| |||||||
| 5,357,914 | ||||||||
|
| |||||||
| Health Care – Services — 2.5% | ||||||||
Aetna, Inc. | 16,220 | 2,011,442 | ||||||
Anthem, Inc. | 4,517 | 649,409 | ||||||
HCA Holdings, Inc. (a) | 12,102 | 895,790 | ||||||
ICON PLC (a) | 10,368 | 779,674 | ||||||
|
| |||||||
| 4,336,315 | ||||||||
|
| |||||||
| Pharmaceuticals — 3.8% | ||||||||
Allergan PLC (a) | 6,171 | 1,295,972 | ||||||
Bristol-Myers Squibb Co. | 46,609 | 2,723,830 | ||||||
The accompanying notes are an integral part of the financial statements.
79
Table of Contents
MML Fundamental Growth Fund – Portfolio of Investments (Continued)
| Number of Shares | Value | |||||||
Cardinal Health, Inc. | 15,150 | $ | 1,090,345 | |||||
Merck & Co., Inc. | 21,486 | 1,264,881 | ||||||
|
| |||||||
| 6,375,028 | ||||||||
|
| |||||||
| 41,732,149 | ||||||||
|
| |||||||
| Energy — 5.3% | ||||||||
| Oil & Gas — 3.1% | ||||||||
BP PLC Sponsored ADR (United Kingdom) | 47,186 | 1,763,813 | ||||||
Chevron Corp. | 15,299 | 1,800,692 | ||||||
Pioneer Natural Resources Co. | 9,325 | 1,679,153 | ||||||
|
| |||||||
| 5,243,658 | ||||||||
|
| |||||||
| Oil & Gas Services — 2.2% | ||||||||
Baker Hughes, Inc. | 28,486 | 1,850,735 | ||||||
Schlumberger Ltd. | 22,723 | 1,907,596 | ||||||
|
| |||||||
| 3,758,331 | ||||||||
|
| |||||||
| 9,001,989 | ||||||||
|
| |||||||
| Financial — 7.8% | ||||||||
| Banks — 1.7% | ||||||||
Bank of America Corp. | 86,105 | 1,902,920 | ||||||
Citigroup, Inc. | 18,107 | 1,076,099 | ||||||
|
| |||||||
| 2,979,019 | ||||||||
|
| |||||||
| Diversified Financial — 4.2% | ||||||||
Alliance Data Systems Corp. | 4,232 | 967,012 | ||||||
Intercontinental Exchange, Inc. | 31,090 | 1,754,098 | ||||||
JP Morgan Chase & Co. | 18,801 | 1,622,338 | ||||||
MasterCard, Inc. Class A | 27,186 | 2,806,955 | ||||||
|
| |||||||
| 7,150,403 | ||||||||
|
| |||||||
| Insurance — 1.1% | ||||||||
American International Group, Inc. | 28,181 | 1,840,501 | ||||||
|
| |||||||
| Real Estate Investment Trusts (REITS) — 0.8% | ||||||||
Public Storage | 5,988 | 1,338,318 | ||||||
|
| |||||||
| 13,308,241 | ||||||||
|
| |||||||
| Industrial — 7.6% | ||||||||
| Electrical Components & Equipment — 0.5% | ||||||||
Emerson Electric Co. | 15,113 | 842,550 | ||||||
|
| |||||||
| Electronics — 0.5% | ||||||||
Fortive Corp. | 14,434 | 774,095 | ||||||
|
| |||||||
| Machinery – Construction & Mining — 0.8% | ||||||||
Caterpillar, Inc. | 15,330 | 1,421,704 | ||||||
|
| |||||||
| Machinery – Diversified — 1.6% | ||||||||
Cummins, Inc. | 11,055 | 1,510,887 | ||||||
Rockwell Automation, Inc. | 9,044 | 1,215,514 | ||||||
|
| |||||||
| 2,726,401 | ||||||||
|
| |||||||
| Manufacturing — 3.4% | ||||||||
Danaher Corp. | 11,339 | 882,628 | ||||||
Dover Corp. | 12,600 | 944,118 | ||||||
Honeywell International, Inc. | 18,853 | 2,184,120 | ||||||
| Number of Shares | Value | |||||||
Parker Hannifin Corp. | 12,794 | $ | 1,791,160 | |||||
|
| |||||||
| 5,802,026 | ||||||||
|
| |||||||
| Transportation — 0.8% | ||||||||
C.H. Robinson Worldwide, Inc. | 17,793 | 1,303,515 | ||||||
|
| |||||||
| 12,870,291 | ||||||||
|
| |||||||
| Technology — 24.8% | ||||||||
| Computers — 7.7% | ||||||||
Amdocs Ltd. | 16,065 | 935,786 | ||||||
Apple, Inc. | 92,194 | 10,677,909 | ||||||
Jack Henry & Associates, Inc. | 15,677 | 1,391,804 | ||||||
|
| |||||||
| 13,005,499 | ||||||||
|
| |||||||
| Internet — 1.4% | ||||||||
Check Point Software Technologies Ltd. (a) | 27,705 | 2,339,964 | ||||||
|
| |||||||
| Semiconductors — 6.3% | ||||||||
Cirrus Logic, Inc. (a) | 11,578 | 654,620 | ||||||
Linear Technology Corp. | 37,987 | 2,368,489 | ||||||
Maxim Integrated Products, Inc. | 48,608 | 1,874,811 | ||||||
QUALCOMM, Inc. | 33,016 | 2,152,643 | ||||||
Texas Instruments, Inc. | 35,649 | 2,601,308 | ||||||
Xilinx, Inc. | 17,589 | 1,061,848 | ||||||
|
| |||||||
| 10,713,719 | ||||||||
|
| |||||||
| Software — 9.4% | ||||||||
Electronic Arts, Inc. (a) | 13,895 | 1,094,370 | ||||||
Fiserv, Inc. (a) | 8,828 | 938,240 | ||||||
Intuit, Inc. | 6,577 | 753,790 | ||||||
Microsoft Corp. | 146,805 | 9,122,463 | ||||||
Oracle Corp. | 99,353 | 3,820,123 | ||||||
SS&C Technologies Holdings, Inc | 6,854 | 196,024 | ||||||
|
| |||||||
| 15,925,010 | ||||||||
|
| |||||||
| 41,984,192 | ||||||||
|
| |||||||
| TOTAL COMMON STOCK (Cost $146,764,755) | 169,358,132 | |||||||
|
| |||||||
| TOTAL EQUITIES (Cost $146,764,755) | 169,358,132 | |||||||
|
| |||||||
| TOTAL LONG-TERM INVESTMENTS (Cost $146,764,755) | 169,358,132 | |||||||
|
| |||||||
The accompanying notes are an integral part of the financial statements.
80
Table of Contents
MML Fundamental Growth Fund – Portfolio of Investments (Continued)
| Principal Amount | Value | |||||||
| SHORT-TERM INVESTMENTS — 0.1% | ||||||||
| Repurchase Agreement — 0.1% | ||||||||
State Street Bank & Trust Co. Repurchase Agreement, dated 12/30/16, 0.010%, due 1/03/17 (b) | $ | 129,588 | $ | 129,588 | ||||
|
| |||||||
| TOTAL SHORT-TERM INVESTMENTS (Cost $129,588) | 129,588 | |||||||
|
| |||||||
| TOTAL INVESTMENTS — 100.0% (Cost $146,894,343) (c) | 169,487,720 | |||||||
| Other Assets/(Liabilities) — (0.0)% | (41,443 | ) | ||||||
|
| |||||||
| NET ASSETS — 100.0% | $ | 169,446,277 | ||||||
|
| |||||||
Notes to Portfolio of Investments
Percentages are stated as a percent of net assets.
| ADR | American Depositary Receipt |
| (a) | Non-income producing security. |
| (b) | Maturity value of $129,588. Collateralized by U.S. Government Agency obligations with a rate of 1.625%, maturity date of 4/30/19, and an aggregate market value, including accrued interest, of $136,293. |
| (c) | See Note 6 for aggregate cost for federal tax purposes. |
The accompanying notes are an integral part of the financial statements.
81
Table of Contents
MML Fundamental Value Fund – Portfolio of Investments
December 31, 2016
| Number of Shares | Value | |||||||
| EQUITIES — 99.7% | ||||||||
| COMMON STOCK — 99.7% | ||||||||
| Basic Materials — 2.7% | ||||||||
| Chemicals — 2.0% | ||||||||
Agrium, Inc. | 15,980 | $ | 1,606,789 | |||||
The Dow Chemical Co. | 55,480 | 3,174,566 | ||||||
|
| |||||||
| 4,781,355 | ||||||||
|
| |||||||
| Forest Products & Paper — 0.7% | ||||||||
International Paper Co. | 30,190 | 1,601,881 | ||||||
|
| |||||||
| 6,383,236 | ||||||||
|
| |||||||
| Communications — 10.8% | ||||||||
| Advertising — 0.8% | ||||||||
Nielsen Holdings PLC | 46,980 | 1,970,811 | ||||||
|
| |||||||
| Internet — 1.3% | ||||||||
eBay, Inc. (a) | 39,820 | 1,182,256 | ||||||
Liberty Interactive Corp. QVC Group Class A (a) | 87,480 | 1,747,850 | ||||||
|
| |||||||
| 2,930,106 | ||||||||
|
| |||||||
| Media — 3.5% | ||||||||
CBS Corp. Class B | 50,480 | 3,211,538 | ||||||
Comcast Corp. Class A | 39,030 | 2,695,021 | ||||||
Thomson Reuters Corp. | 54,010 | 2,364,558 | ||||||
|
| |||||||
| 8,271,117 | ||||||||
|
| |||||||
| Telecommunications — 5.2% | ||||||||
Cisco Systems, Inc. | 219,980 | 6,647,796 | ||||||
Nokia OYJ Sponsored ADR (Finland) | 352,690 | 1,696,439 | ||||||
Verizon Communications, Inc. | 70,590 | 3,768,094 | ||||||
|
| |||||||
| 12,112,329 | ||||||||
|
| |||||||
| 25,284,363 | ||||||||
|
| |||||||
| Consumer, Cyclical — 6.3% | ||||||||
| Home Builders — 1.0% | ||||||||
PulteGroup, Inc. | 124,680 | 2,291,618 | ||||||
|
| |||||||
| Leisure Time — 0.9% | ||||||||
Norwegian Cruise Line Holdings Ltd. (a) | 50,260 | 2,137,558 | ||||||
|
| |||||||
| Lodging — 1.7% | ||||||||
Hilton Worldwide Holdings, Inc. | 143,900 | 3,914,080 | ||||||
|
| |||||||
| Retail — 2.7% | ||||||||
CVS Health Corp. | 10,430 | 823,031 | ||||||
The Home Depot, Inc. | 15,130 | 2,028,631 | ||||||
Lowe’s Cos., Inc. | 25,720 | 1,829,207 | ||||||
Signet Jewelers Ltd. | 17,590 | 1,658,033 | ||||||
|
| |||||||
| 6,338,902 | ||||||||
|
| |||||||
| 14,682,158 | ||||||||
|
| |||||||
| Number of Shares | Value | |||||||
| Consumer, Non-cyclical — 15.9% | ||||||||
| Agriculture — 2.7% | ||||||||
British American Tobacco PLC | 50,559 | $ | 2,870,685 | |||||
Philip Morris International, Inc. | 37,280 | 3,410,747 | ||||||
|
| |||||||
| 6,281,432 | ||||||||
|
| |||||||
| Biotechnology — 0.9% | ||||||||
Amgen, Inc. | 14,740 | 2,155,135 | ||||||
|
| |||||||
| Foods — 1.9% | ||||||||
The Kraft Heinz Co. | 22,506 | 1,965,224 | ||||||
Mondelez International, Inc. Class A | 56,480 | 2,503,758 | ||||||
|
| |||||||
| 4,468,982 | ||||||||
|
| |||||||
| Health Care – Products — 1.4% | ||||||||
Medtronic PLC | 46,889 | 3,339,904 | ||||||
|
| |||||||
| Health Care – Services — 1.5% | ||||||||
UnitedHealth Group, Inc. | 21,130 | 3,381,645 | ||||||
|
| |||||||
| Pharmaceuticals — 7.5% | ||||||||
Allergan PLC (a) | 12,360 | 2,595,724 | ||||||
AstraZeneca PLC Sponsored ADR (United Kingdom) | 80,100 | 2,188,332 | ||||||
Bristol-Myers Squibb Co. | 49,440 | 2,889,274 | ||||||
Merck & Co., Inc. | 102,040 | 6,007,095 | ||||||
Pfizer, Inc. | 35,899 | 1,165,999 | ||||||
Roche Holding AG | 11,251 | 2,563,576 | ||||||
|
| |||||||
| 17,410,000 | ||||||||
|
| |||||||
| 37,037,098 | ||||||||
|
| |||||||
| Energy — 12.3% | ||||||||
| Oil & Gas — 10.7% | ||||||||
Anadarko Petroleum Corp. | 21,510 | 1,499,892 | ||||||
Canadian Natural Resources Ltd. | 55,350 | 1,764,558 | ||||||
Chevron Corp. | 51,050 | 6,008,585 | ||||||
EOG Resources, Inc. | 37,200 | 3,760,920 | ||||||
Exxon Mobil Corp. | 40,840 | 3,686,218 | ||||||
Marathon Oil Corp. | 167,704 | 2,902,956 | ||||||
Occidental Petroleum Corp. | 22,150 | 1,577,745 | ||||||
Pioneer Natural Resources Co. | 14,400 | 2,593,008 | ||||||
Southwestern Energy Co. (a) | 101,550 | 1,098,771 | ||||||
|
| |||||||
| 24,892,653 | ||||||||
|
| |||||||
| Oil & Gas Services — 1.6% | ||||||||
Halliburton Co. | 69,040 | 3,734,374 | ||||||
|
| |||||||
| 28,627,027 | ||||||||
|
| |||||||
| Financial — 28.3% | ||||||||
| Banks — 13.2% | ||||||||
Bank of America Corp. | 120,800 | 2,669,680 | ||||||
Citigroup, Inc. | 105,280 | 6,256,790 | ||||||
The Goldman Sachs Group, Inc. | 13,410 | 3,211,025 | ||||||
M&T Bank Corp. | 21,390 | 3,346,038 | ||||||
The PNC Financial Services Group, Inc. | 52,940 | 6,191,862 | ||||||
The accompanying notes are an integral part of the financial statements.
82
Table of Contents
MML Fundamental Value Fund – Portfolio of Investments (Continued)
| Number of Shares | Value | |||||||
Wells Fargo & Co. | 163,450 | $ | 9,007,729 | |||||
|
| |||||||
| 30,683,124 | ||||||||
|
| |||||||
| Diversified Financial — 8.5% | ||||||||
BlackRock, Inc. | 8,780 | 3,341,141 | ||||||
Intercontinental Exchange, Inc. | 41,060 | 2,316,605 | ||||||
Invesco Ltd. | 92,340 | 2,801,596 | ||||||
JP Morgan Chase & Co. | 132,550 | 11,437,740 | ||||||
|
| |||||||
| 19,897,082 | ||||||||
|
| |||||||
| Insurance — 6.6% | ||||||||
American International Group, Inc. | 39,320 | 2,567,989 | ||||||
Chubb Ltd. | 30,585 | 4,040,890 | ||||||
Marsh & McLennan Cos., Inc. | 41,830 | 2,827,290 | ||||||
MetLife, Inc. | 55,150 | 2,972,033 | ||||||
Principal Financial Group, Inc. | 33,960 | 1,964,926 | ||||||
Unum Group | 24,960 | 1,096,493 | ||||||
|
| |||||||
| 15,469,621 | ||||||||
|
| |||||||
| 66,049,827 | ||||||||
|
| |||||||
| Industrial — 11.3% | ||||||||
| Aerospace & Defense — 2.0% | ||||||||
Triumph Group, Inc. | 45,770 | 1,212,905 | ||||||
United Technologies Corp. | 31,460 | 3,448,645 | ||||||
|
| |||||||
| 4,661,550 | ||||||||
|
| |||||||
| Building Materials — 1.0% | ||||||||
Fortune Brands Home & Security, Inc. | 43,610 | 2,331,391 | ||||||
|
| |||||||
| Machinery – Construction & Mining — 2.3% | ||||||||
Caterpillar, Inc. | 22,720 | 2,107,053 | ||||||
Ingersoll-Rand PLC | 44,550 | 3,343,032 | ||||||
|
| |||||||
| 5,450,085 | ||||||||
|
| |||||||
| Manufacturing — 4.7% | ||||||||
3M Co. | 15,300 | 2,732,121 | ||||||
Eaton Corp. PLC | 55,080 | 3,695,317 | ||||||
General Electric Co. | 144,320 | 4,560,512 | ||||||
|
| |||||||
| 10,987,950 | ||||||||
|
| |||||||
| Transportation — 1.3% | ||||||||
Union Pacific Corp. | 29,000 | 3,006,720 | ||||||
|
| |||||||
| 26,437,696 | ||||||||
|
| |||||||
| Technology — 8.7% | ||||||||
| Computers — 1.9% | ||||||||
Apple, Inc. | 13,910 | 1,611,056 | ||||||
Cognizant Technology Solutions Corp. Class A (a) | 47,340 | 2,652,460 | ||||||
|
| |||||||
| 4,263,516 | ||||||||
|
| |||||||
| Semiconductors — 5.7% | ||||||||
Analog Devices, Inc. | 19,300 | 1,401,566 | ||||||
Intel Corp. | 138,220 | 5,013,239 | ||||||
Maxim Integrated Products, Inc. | 78,580 | 3,030,831 | ||||||
| Number of Shares | Value | |||||||
QUALCOMM, Inc. | 59,730 | $ | 3,894,396 | |||||
|
| |||||||
| 13,340,032 | ||||||||
|
| |||||||
| Software — 1.1% | ||||||||
Microsoft Corp. | 41,450 | 2,575,703 | ||||||
|
| |||||||
| 20,179,251 | ||||||||
|
| |||||||
| Utilities — 3.4% | ||||||||
| Electric — 3.4% | ||||||||
Dominion Resources, Inc. | 16,550 | 1,267,565 | ||||||
Edison International | 30,600 | 2,202,894 | ||||||
Eversource Energy | 52,080 | 2,876,378 | ||||||
NextEra Energy, Inc. | 12,350 | 1,475,331 | ||||||
|
| |||||||
| 7,822,168 | ||||||||
|
| |||||||
| TOTAL COMMON STOCK (Cost $180,864,972) | 232,502,824 | |||||||
|
| |||||||
| TOTAL EQUITIES (Cost $180,864,972) | 232,502,824 | |||||||
|
| |||||||
| TOTAL LONG-TERM INVESTMENTS (Cost $180,864,972) | 232,502,824 | |||||||
|
| |||||||
| Principal Amount | ||||||||
| SHORT-TERM INVESTMENTS — 0.5% | ||||||||
| Repurchase Agreement — 0.5% | ||||||||
State Street Bank & Trust Co. Repurchase Agreement, dated 12/30/16, 0.010%, due 1/03/17 (b) | $ | 1,151,582 | 1,151,582 | |||||
|
| |||||||
| Time Deposit — 0.0% | ||||||||
Euro Time Deposit | 18,060 | 18,060 | ||||||
|
| |||||||
| TOTAL SHORT-TERM INVESTMENTS (Cost $1,169,642) | 1,169,642 | |||||||
|
| |||||||
| TOTAL INVESTMENTS — 100.2% (Cost $182,034,614) (c) | 233,672,466 | |||||||
| Other Assets/(Liabilities) — (0.2)% | (551,844 | ) | ||||||
|
| |||||||
| NET ASSETS — 100.0% | $ | 233,120,622 | ||||||
|
| |||||||
The accompanying notes are an integral part of the financial statements.
83
Table of Contents
MML Fundamental Value Fund – Portfolio of Investments (Continued)
Notes to Portfolio of Investments
Percentages are stated as a percent of net assets.
| ADR | American Depositary Receipt |
| (a) | Non-income producing security. |
| (b) | Maturity value of $1,151,583. Collateralized by U.S. Government Agency obligations with a rate of 1.625%, maturity date of 4/30/19, and an aggregate market value, including accrued interest, of $1,176,155. |
| (c) | See Note 6 for aggregate cost for federal tax purposes. |
Country weightings, as a percentage of net assets, is as follows:
United States | 82.3 | % | ||
Ireland | 5.6 | % | ||
United Kingdom | 3.0 | % | ||
Switzerland | 2.8 | % | ||
Bermuda | 2.8 | % | ||
Canada | 2.5 | % | ||
Finland | 0.7 | % | ||
|
| |||
Total Long-Term Investments | 99.7 | % | ||
Short-Term Investments and Other Assets and Liabilities | 0.3 | % | ||
|
| |||
Net Assets | 100.0 | % | ||
|
|
The accompanying notes are an integral part of the financial statements.
84
Table of Contents
MML Global Fund – Portfolio of Investments
December 31, 2016
| Number of Shares | Value | |||||||
| EQUITIES — 99.4% | ||||||||
| COMMON STOCK — 99.4% | ||||||||
| Austria — 0.4% | ||||||||
Erste Group Bank AG | 35,419 | $ | 1,037,021 | |||||
|
| |||||||
| Brazil — 0.5% | ||||||||
AMBEV SA | 260,431 | 1,284,753 | ||||||
|
| |||||||
| Canada — 1.7% | ||||||||
Canadian National Railway Co. | 63,350 | 4,269,790 | ||||||
|
| |||||||
| Cayman Islands — 0.2% | ||||||||
Sands China Ltd. | 122,000 | 524,695 | ||||||
|
| |||||||
| Czech Republic — 0.1% | ||||||||
Komercni Banka AS | 9,190 | 316,486 | ||||||
|
| |||||||
| Denmark — 0.8% | ||||||||
Carlsberg A/S Class B | 23,137 | 1,996,744 | ||||||
|
| |||||||
| France — 7.8% | ||||||||
Air Liquide | 12,395 | 1,376,006 | ||||||
Danone SA | 59,043 | 3,737,147 | ||||||
Hermes International | 1,140 | 467,519 | ||||||
Legrand SA | 35,020 | 1,983,264 | ||||||
LVMH Moet Hennessy Louis Vuitton SE | 23,520 | 4,484,731 | ||||||
Pernod-Ricard SA | 39,374 | 4,265,468 | ||||||
Schneider Electric SE | 41,310 | 2,870,535 | ||||||
|
| |||||||
| 19,184,670 | ||||||||
|
| |||||||
| Germany — 6.5% | ||||||||
Bayer AG | 60,782 | 6,341,141 | ||||||
Brenntag AG | 15,968 | 884,850 | ||||||
Deutsche Boerse AG (a) | 16,768 | 1,366,058 | ||||||
Linde AG | 19,525 | 3,201,595 | ||||||
Merck KGaA | 20,694 | 2,159,642 | ||||||
MTU Aero Engines AG | 17,009 | 1,962,336 | ||||||
|
| |||||||
| 15,915,622 | ||||||||
|
| |||||||
| Ireland — 4.3% | ||||||||
Accenture PLC Class A | 48,604 | 5,692,987 | ||||||
Medtronic PLC | 68,737 | 4,896,136 | ||||||
|
| |||||||
| 10,589,123 | ||||||||
|
| |||||||
| Israel — 1.0% | ||||||||
Check Point Software Technologies Ltd. (a) | 27,287 | 2,304,660 | ||||||
|
| |||||||
| Japan — 1.2% | ||||||||
Hoya Corp. | 35,300 | 1,479,486 | ||||||
Kubota Corp. | 103,100 | 1,467,704 | ||||||
|
| |||||||
| 2,947,190 | ||||||||
|
| |||||||
| Mexico — 0.3% | ||||||||
Grupo Financiero Banorte SAB de CV Class O | 158,353 | 779,938 | ||||||
|
| |||||||
| Number of Shares | Value | |||||||
| Netherlands — 2.9% | ||||||||
Akzo Nobel NV | 42,876 | $ | 2,677,668 | |||||
Heineken NV | 29,090 | 2,178,936 | ||||||
Schlumberger Ltd. | 27,379 | 2,298,467 | ||||||
|
| |||||||
| 7,155,071 | ||||||||
|
| |||||||
| Republic of Korea — 0.8% | ||||||||
Samsung Electronics Co., Ltd. | 1,283 | 1,895,707 | ||||||
|
| |||||||
| Spain — 0.6% | ||||||||
Aena SA (b) | 10,337 | 1,410,302 | ||||||
|
| |||||||
| Sweden — 1.8% | ||||||||
Svenska Cellulosa AB Class B | 159,281 | 4,491,288 | ||||||
|
| |||||||
| Switzerland — 8.7% | ||||||||
Adecco Group AG | 30,399 | 1,984,734 | ||||||
Cie Financiere Richemont SA | 35,090 | 2,323,373 | ||||||
Julius Baer Group Ltd. | 21,017 | 933,104 | ||||||
Nestle SA | 88,330 | 6,335,566 | ||||||
Roche Holding AG | 18,624 | 4,243,538 | ||||||
Sonova Holding AG | 10,364 | 1,253,948 | ||||||
Swiss Re AG | 8,186 | 775,549 | ||||||
UBS Group AG | 232,720 | 3,643,216 | ||||||
|
| |||||||
| 21,493,028 | ||||||||
|
| |||||||
| Thailand — 0.2% | ||||||||
Kasikornbank PCL | 108,100 | 534,017 | ||||||
|
| |||||||
| United Kingdom — 9.7% | ||||||||
Burberry Group PLC | 75,168 | 1,385,548 | ||||||
Compass Group PLC | 156,243 | 2,879,921 | ||||||
Delphi Automotive PLC | 20,535 | 1,383,032 | ||||||
Diageo PLC | 187,683 | 4,855,565 | ||||||
Reckitt Benckiser Group PLC | 62,186 | 5,256,849 | ||||||
Sky PLC | 158,789 | 1,931,850 | ||||||
Standard Chartered PLC (a) | 86,861 | 711,424 | ||||||
Whitbread PLC | 32,645 | 1,517,482 | ||||||
WPP PLC | 181,842 | 4,065,204 | ||||||
|
| |||||||
| 23,986,875 | ||||||||
|
| |||||||
| United States — 49.9% | ||||||||
3M Co. | 23,896 | 4,267,109 | ||||||
American Express Co. | 46,933 | 3,476,797 | ||||||
Amphenol Corp. Class A | 24,157 | 1,623,350 | ||||||
AutoZone, Inc. (a) | 2,467 | 1,948,412 | ||||||
The Bank of New York Mellon Corp. | 93,251 | 4,418,232 | ||||||
Charter Communications, Inc. Class A (a) | 5,828 | 1,677,998 | ||||||
Cisco Systems, Inc. | 59,602 | 1,801,172 | ||||||
Cognizant Technology Solutions Corp. Class A (a) | 31,040 | 1,739,171 | ||||||
Colgate-Palmolive Co. | 46,316 | 3,030,919 | ||||||
The Cooper Cos., Inc. | 14,765 | 2,582,841 | ||||||
Coty, Inc. Class A | 172,560 | 3,159,574 | ||||||
DENTSPLY SIRONA, Inc. | 19,863 | 1,146,691 | ||||||
The accompanying notes are an integral part of the financial statements.
85
Table of Contents
MML Global Fund – Portfolio of Investments (Continued)
| Number of Shares | Value | |||||||
eBay, Inc. (a) | 64,903 | $ | 1,926,970 | |||||
Franklin Resources, Inc. | 59,812 | 2,367,359 | ||||||
The Goldman Sachs Group, Inc. | 12,726 | 3,047,241 | ||||||
Harley-Davidson, Inc. | 24,109 | 1,406,519 | ||||||
Honeywell International, Inc. | 52,256 | 6,053,858 | ||||||
International Flavors & Fragrances, Inc. | 6,141 | 723,594 | ||||||
Johnson & Johnson | 9,190 | 1,058,780 | ||||||
Kellogg Co. | 46,021 | 3,392,208 | ||||||
Marriott International, Inc. Class A | 10,902 | 901,377 | ||||||
Microchip Technology, Inc. (c) | 23,638 | 1,516,378 | ||||||
Monsanto Co. | 23,007 | 2,420,566 | ||||||
National Oilwell Varco, Inc. | 23,007 | 861,382 | ||||||
NOW, Inc. (a) | 13,449 | 275,301 | ||||||
Omnicom Group, Inc. | 26,526 | 2,257,628 | ||||||
Oracle Corp. | 106,615 | 4,099,347 | ||||||
PayPal Holdings, Inc. (a) | 31,843 | 1,256,843 | ||||||
Praxair, Inc. | 15,032 | 1,761,600 | ||||||
Sally Beauty Holdings, Inc. (a) | 59,005 | 1,558,912 | ||||||
St. Jude Medical, Inc. | 49,878 | 3,999,717 | ||||||
State Street Corp. | 63,523 | 4,937,008 | ||||||
Stryker Corp. | 41,867 | 5,016,085 | ||||||
Thermo Fisher Scientific, Inc. | 46,373 | 6,543,230 | ||||||
Time Warner, Inc. | 62,287 | 6,012,564 | ||||||
Union Pacific Corp. | 11,817 | 1,225,187 | ||||||
United Parcel Service, Inc. Class B | 34,514 | 3,956,685 | ||||||
United Technologies Corp. | 25,676 | 2,814,603 | ||||||
Urban Outfitters, Inc. (a) | 41,076 | 1,169,844 | ||||||
Visa, Inc. Class A | 65,477 | 5,108,516 | ||||||
W.W. Grainger, Inc. (c) | 7,223 | 1,677,542 | ||||||
The Walt Disney Co. | 54,496 | 5,679,573 | ||||||
Waters Corp. (a) | 15,127 | 2,032,917 | ||||||
Wynn Resorts Ltd. | 4,919 | 425,543 | ||||||
Zimmer Biomet Holdings, Inc. | 44,825 | 4,625,940 | ||||||
|
| |||||||
| 122,983,083 | ||||||||
|
| |||||||
| TOTAL COMMON STOCK (Cost $213,125,706) | 245,100,063 | |||||||
|
| |||||||
| TOTAL EQUITIES (Cost $213,125,706) | 245,100,063 | |||||||
|
| |||||||
| MUTUAL FUNDS — 1.3% | ||||||||
| United States — 1.3% | ||||||||
State Street Navigator Securities Lending Prime Portfolio (d) | 3,209,958 | 3,209,958 | ||||||
|
| |||||||
| TOTAL MUTUAL FUNDS (Cost $3,209,958) | 3,209,958 | |||||||
|
| |||||||
| TOTAL LONG-TERM INVESTMENTS (Cost $216,335,664) | 248,310,021 | |||||||
|
| |||||||
| Principal Amount | Value | |||||||
| SHORT-TERM INVESTMENTS — 0.5% | ||||||||
| Repurchase Agreement — 0.5% | ||||||||
State Street Bank & Trust Co. Repurchase Agreement, dated 12/30/16, 0.010%, due 1/03/17 (e) | $ | 1,217,925 | $ | 1,217,925 | ||||
|
| |||||||
| Time Deposit — 0.0% | ||||||||
Euro Time Deposit | 18,129 | 18,129 | ||||||
|
| |||||||
| TOTAL SHORT-TERM INVESTMENTS (Cost $1,236,054) | 1,236,054 | |||||||
|
| |||||||
| TOTAL INVESTMENTS — 101.2% (Cost $217,571,718) (f) | 249,546,075 | |||||||
| Other Assets/(Liabilities) — (1.2)% | (2,962,504 | ) | ||||||
|
| |||||||
| NET ASSETS — 100.0% | $ | 246,583,571 | ||||||
|
| |||||||
Notes to Portfolio of Investments
Percentages are stated as a percent of net assets.
| (a) | Non-income producing security. |
| (b) | Securities exempt from registration under rule 144A of the Securities Act of 1933. These securities may be resold in transactions exempt from registration, normally to qualified institutional buyers. At December 31, 2016, these securities amounted to a value of $1,410,302 or 0.57% of net assets. |
| (c) | Denotes all or a portion of security on loan. The total value of securities on loan as of December 31, 2016, was $3,144,762 or 1.28% of net assets. Total securities on loan may not correspond with the amounts identified in the Portfolio of Investments because pending sales may be in the process of recall from the brokers. (Note 2). |
| (d) | Represents investment of security lending collateral. (Note 2). |
| (e) | Maturity value of $1,217,926. Collateralized by U.S. Government Agency obligations with a rate of 1.625%, maturity date of 4/30/19, and an aggregate market value, including accrued interest, of $1,246,825. |
| (f) | See Note 6 for aggregate cost for federal tax purposes. |
The accompanying notes are an integral part of the financial statements.
86
Table of Contents
MML Growth & Income Fund – Portfolio of Investments
December 31, 2016
| Number of Shares | Value | |||||||
| EQUITIES — 99.3% | ||||||||
| COMMON STOCK — 99.3% | ||||||||
| Basic Materials — 3.6% | ||||||||
| Chemicals — 3.6% | ||||||||
Monsanto Co. | 20,328 | $ | 2,138,709 | |||||
PPG Industries, Inc. | 11,345 | 1,075,052 | ||||||
The Sherwin-Williams Co. | 4,773 | 1,282,696 | ||||||
|
| |||||||
| 4,496,457 | ||||||||
|
| |||||||
| Communications — 10.7% | ||||||||
| Advertising — 0.7% | ||||||||
The Interpublic Group of Companies, Inc. | 34,570 | 809,284 | ||||||
|
| |||||||
| Internet — 4.6% | ||||||||
Alphabet, Inc. Class A (a) | 4,140 | 3,280,743 | ||||||
Alphabet, Inc. Class C (a) | 3,323 | 2,564,758 | ||||||
|
| |||||||
| 5,845,501 | ||||||||
|
| |||||||
| Media — 5.4% | ||||||||
Comcast Corp. Class A | 39,163 | 2,704,205 | ||||||
Time Warner, Inc. | 18,315 | 1,767,947 | ||||||
Twenty-First Century Fox, Inc. Class A | 44,528 | 1,248,565 | ||||||
The Walt Disney Co. | 10,313 | 1,074,821 | ||||||
|
| |||||||
| 6,795,538 | ||||||||
|
| |||||||
| 13,450,323 | ||||||||
|
| |||||||
| Consumer, Cyclical — 7.4% | ||||||||
| Apparel — 1.3% | ||||||||
Nike, Inc. Class B | 13,939 | 708,519 | ||||||
VF Corp. | 17,836 | 951,551 | ||||||
|
| |||||||
| 1,660,070 | ||||||||
|
| |||||||
| Distribution & Wholesale — 0.8% | ||||||||
W.W. Grainger, Inc. | 4,414 | 1,025,151 | ||||||
|
| |||||||
| Housewares — 1.7% | ||||||||
Newell Brands, Inc. | 48,779 | 2,177,982 | ||||||
|
| |||||||
| Retail — 3.6% | ||||||||
AutoZone, Inc. (a) | 1,388 | 1,096,228 | ||||||
Costco Wholesale Corp. | 6,961 | 1,114,526 | ||||||
Ross Stores, Inc. | 21,568 | 1,414,861 | ||||||
Starbucks Corp. | 15,930 | 884,434 | ||||||
|
| |||||||
| 4,510,049 | ||||||||
|
| |||||||
| 9,373,252 | ||||||||
|
| |||||||
| Consumer, Non-cyclical — 26.3% | ||||||||
| Beverages — 2.0% | ||||||||
Diageo PLC | 38,975 | 1,008,326 | ||||||
Pernod-Ricard SA | 14,069 | 1,524,124 | ||||||
|
| |||||||
| 2,532,450 | ||||||||
|
| |||||||
| Commercial Services — 4.3% | ||||||||
Aramark | 23,045 | 823,167 | ||||||
| Number of Shares | Value | |||||||
Gartner, Inc. (a) | 9,719 | $ | 982,299 | |||||
Visa, Inc. Class A | 47,079 | 3,673,104 | ||||||
|
| |||||||
| 5,478,570 | ||||||||
|
| |||||||
| Cosmetics & Personal Care — 2.5% | ||||||||
Colgate-Palmolive Co. | 19,525 | 1,277,716 | ||||||
Coty, Inc. Class A | 24,232 | 443,688 | ||||||
The Estee Lauder Cos., Inc. Class A | 9,223 | 705,467 | ||||||
The Procter & Gamble Co. | 8,415 | 707,533 | ||||||
|
| |||||||
| 3,134,404 | ||||||||
|
| |||||||
| Foods — 3.1% | ||||||||
Danone SA | 23,829 | 1,508,265 | ||||||
Mondelez International, Inc. Class A | 53,660 | 2,378,748 | ||||||
|
| |||||||
| 3,887,013 | ||||||||
|
| |||||||
| Health Care – Products — 5.9% | ||||||||
Abbott Laboratories | 19,663 | 755,256 | ||||||
Johnson & Johnson | 19,338 | 2,227,931 | ||||||
Medtronic PLC | 23,522 | 1,675,472 | ||||||
St. Jude Medical, Inc. | 13,458 | 1,079,197 | ||||||
Stryker Corp. | 14,630 | 1,752,820 | ||||||
|
| |||||||
| 7,490,676 | ||||||||
|
| |||||||
| Health Care – Services — 2.5% | ||||||||
Thermo Fisher Scientific, Inc. | 21,863 | 3,084,869 | ||||||
|
| |||||||
| Household Products — 0.5% | ||||||||
Kimberly-Clark Corp. | 5,671 | 647,175 | ||||||
|
| |||||||
| Pharmaceuticals — 5.5% | ||||||||
Allergan PLC (a) | 8,395 | 1,763,034 | ||||||
Eli Lilly & Co. | 24,065 | 1,769,981 | ||||||
McKesson Corp. | 8,287 | 1,163,909 | ||||||
Mead Johnson Nutrition Co. | 12,928 | 914,785 | ||||||
Zoetis, Inc. | 23,933 | 1,281,134 | ||||||
|
| |||||||
| 6,892,843 | ||||||||
|
| |||||||
| 33,148,000 | ||||||||
|
| |||||||
| Diversified — 1.5% | ||||||||
| Holding Company – Diversified — 1.5% | ||||||||
LVMH Moet Hennessy Louis Vuitton SE | 9,513 | 1,813,914 | ||||||
|
| |||||||
| Energy — 4.9% | ||||||||
| Oil & Gas — 1.7% | ||||||||
EOG Resources, Inc. | 21,947 | 2,218,842 | ||||||
|
| |||||||
| Oil & Gas Services — 2.3% | ||||||||
Schlumberger Ltd. | 34,112 | 2,863,702 | ||||||
|
| |||||||
| Pipelines — 0.9% | ||||||||
Enterprise Products Partners LP | 41,136 | 1,112,318 | ||||||
|
| |||||||
| 6,194,862 | ||||||||
|
| |||||||
The accompanying notes are an integral part of the financial statements.
87
Table of Contents
MML Growth & Income Fund – Portfolio of Investments (Continued)
| Number of Shares | Value | |||||||
| Financial — 23.3% | ||||||||
| Banks — 8.8% | ||||||||
Bank of America Corp. | 203,319 | $ | 4,493,350 | |||||
The Goldman Sachs Group, Inc. | 13,292 | 3,182,770 | ||||||
State Street Corp. | 10,481 | 814,583 | ||||||
U.S. Bancorp | 30,601 | 1,571,973 | ||||||
Wells Fargo & Co. | 18,302 | 1,008,623 | ||||||
|
| |||||||
| 11,071,299 | ||||||||
|
| |||||||
| Diversified Financial — 10.9% | ||||||||
BlackRock, Inc. | 5,086 | 1,935,427 | ||||||
The Blackstone Group LP | 35,947 | 971,647 | ||||||
JP Morgan Chase & Co. | 62,242 | 5,370,862 | ||||||
MasterCard, Inc. Class A | 23,318 | 2,407,584 | ||||||
Morgan Stanley | 38,237 | 1,615,513 | ||||||
Nasdaq, Inc. | 20,864 | 1,400,392 | ||||||
|
| |||||||
| 13,701,425 | ||||||||
|
| |||||||
| Insurance — 1.2% | ||||||||
Chubb Ltd. | 11,676 | 1,542,633 | ||||||
|
| |||||||
| Real Estate Investment Trusts (REITS) — 2.4% | ||||||||
American Tower Corp. | 29,174 | 3,083,108 | ||||||
|
| |||||||
| 29,398,465 | ||||||||
|
| |||||||
| Industrial — 9.4% | ||||||||
| Aerospace & Defense — 0.8% | ||||||||
United Technologies Corp. | 9,363 | 1,026,372 | ||||||
|
| |||||||
| Electrical Components & Equipment — 0.7% | ||||||||
AMETEK, Inc. | 17,697 | 860,074 | ||||||
|
| |||||||
| Engineering & Construction — 0.7% | ||||||||
Fluor Corp. | 15,787 | 829,133 | ||||||
|
| |||||||
| Manufacturing — 3.9% | ||||||||
Danaher Corp. | 34,761 | 2,705,796 | ||||||
Honeywell International, Inc. | 18,912 | 2,190,955 | ||||||
|
| |||||||
| 4,896,751 | ||||||||
|
| |||||||
| Packaging & Containers — 1.4% | ||||||||
Crown Holdings, Inc. (a) | 34,164 | 1,796,002 | ||||||
|
| |||||||
| Transportation — 1.9% | ||||||||
Canadian National Railway Co. | 35,044 | 2,361,966 | ||||||
|
| |||||||
| 11,770,298 | ||||||||
|
| |||||||
| Technology — 11.7% | ||||||||
| Computers — 6.0% | ||||||||
Accenture PLC Class A | 22,107 | 2,589,393 | ||||||
Apple, Inc. | 9,947 | 1,152,062 | ||||||
Cognizant Technology Solutions Corp. Class A (a) | 44,174 | 2,475,069 | ||||||
Hewlett Packard Enterprise Co. | 55,817 | 1,291,605 | ||||||
|
| |||||||
| 7,508,129 | ||||||||
|
| |||||||
| Semiconductors — 3.2% | ||||||||
Broadcom Ltd. | 16,198 | 2,863,320 | ||||||
Texas Instruments, Inc. | 16,378 | 1,195,103 | ||||||
|
| |||||||
| 4,058,423 | ||||||||
|
| |||||||
| Number of Shares | Value | |||||||
| Software — 2.5% | ||||||||
Adobe Systems, Inc. (a) | 8,910 | $ | 917,285 | |||||
Fidelity National Information Services, Inc. | 30,313 | 2,292,875 | ||||||
|
| |||||||
| 3,210,160 | ||||||||
|
| |||||||
| 14,776,712 | ||||||||
|
| |||||||
| Utilities — 0.5% | ||||||||
| Electric — 0.5% | ||||||||
American Electric Power Co., Inc. | 10,739 | 676,127 | ||||||
|
| |||||||
| TOTAL COMMON STOCK (Cost $89,743,386) | 125,098,410 | |||||||
|
| |||||||
| TOTAL EQUITIES (Cost $89,743,386) | 125,098,410 | |||||||
|
| |||||||
| TOTAL LONG-TERM INVESTMENTS (Cost $89,743,386) | 125,098,410 | |||||||
|
| |||||||
| Principal Amount | ||||||||
| SHORT-TERM INVESTMENTS — 0.7% | ||||||||
| Repurchase Agreement — 0.7% | ||||||||
State Street Bank & Trust Co. Repurchase Agreement, dated 12/30/16, 0.010%, due 1/03/17 (b) | $ | 905,307 | 905,307 | |||||
|
| |||||||
| Time Deposit — 0.0% | ||||||||
Euro Time Deposit | 8,174 | 8,174 | ||||||
|
| |||||||
| TOTAL SHORT-TERM INVESTMENTS (Cost $913,481) | 913,481 | |||||||
|
| |||||||
| TOTAL INVESTMENTS —100.0% (Cost $90,656,867) (c) | 126,011,891 | |||||||
| Other Assets/(Liabilities) — 0.0% | 42,442 | |||||||
|
| |||||||
| NET ASSETS — 100.0% | $ | 126,054,333 | ||||||
|
| |||||||
Notes to Portfolio of Investments
Percentages are stated as a percent of net assets.
| (a) | Non-income producing security. |
| (b) | Maturity value of $905,308. Collateralized by U.S. Government Agency obligations with a rate of 1.625%, maturity date of 12/31/19, and an aggregate market value, including accrued interest, of $926,415. |
| (c) | See Note 6 for aggregate cost for federal tax purposes. |
The accompanying notes are an integral part of the financial statements.
88
Table of Contents
MML Income & Growth Fund – Portfolio of Investments
December 31, 2016
| Number of Shares | Value | |||||||
| EQUITIES — 95.8% | ||||||||
| COMMON STOCK — 95.8% | ||||||||
| Basic Materials — 3.4% | ||||||||
| Chemicals — 2.9% | ||||||||
The Dow Chemical Co. | 86,290 | $ | 4,937,514 | |||||
E.I. du Pont de Nemours & Co. | 30,730 | 2,255,582 | ||||||
Praxair, Inc. | 6,480 | 759,391 | ||||||
|
| |||||||
| 7,952,487 | ||||||||
|
| |||||||
| Forest Products & Paper — 0.5% | ||||||||
International Paper Co. | 27,470 | 1,457,558 | ||||||
|
| |||||||
| 9,410,045 | ||||||||
|
| |||||||
| Communications — 5.7% | ||||||||
| Advertising — 1.0% | ||||||||
Nielsen Holdings PLC | 33,590 | 1,409,100 | ||||||
Publicis Groupe SA | 19,080 | 1,316,245 | ||||||
|
| |||||||
| 2,725,345 | ||||||||
|
| |||||||
| Media — 1.7% | ||||||||
Comcast Corp. Class A | 70,760 | 4,885,978 | ||||||
|
| |||||||
| Telecommunications — 3.0% | ||||||||
BCE, Inc. | 16,030 | 693,137 | ||||||
Motorola Solutions, Inc. | 28,150 | 2,333,354 | ||||||
SK Telecom Co. Ltd. Sponsored ADR (South Korea) | 63,820 | 1,333,838 | ||||||
Verizon Communications, Inc. | 73,790 | 3,938,910 | ||||||
|
| |||||||
| 8,299,239 | ||||||||
|
| |||||||
| 15,910,562 | ||||||||
|
| |||||||
| Consumer, Cyclical — 3.1% | ||||||||
| Lodging — 0.5% | ||||||||
Hilton Worldwide Holdings, Inc. | 55,338 | 1,505,193 | ||||||
|
| |||||||
| Retail — 2.6% | ||||||||
Dollar General Corp. | 37,490 | 2,776,884 | ||||||
The Gap, Inc. | 72,520 | 1,627,349 | ||||||
The Home Depot, Inc. | 21,060 | 2,823,725 | ||||||
|
| |||||||
| 7,227,958 | ||||||||
|
| |||||||
| 8,733,151 | ||||||||
|
| |||||||
| Consumer, Non-cyclical — 21.5% | ||||||||
| Agriculture — 1.1% | ||||||||
Altria Group, Inc. | 16,210 | 1,096,120 | ||||||
Philip Morris International, Inc. | 10,710 | 979,858 | ||||||
Reynolds American, Inc. | 16,558 | 927,910 | ||||||
|
| |||||||
| 3,003,888 | ||||||||
|
| |||||||
| Beverages — 1.8% | ||||||||
The Coca-Cola Co. | 70,200 | 2,910,492 | ||||||
Diageo PLC | 87,010 | 2,251,044 | ||||||
|
| |||||||
| 5,161,536 | ||||||||
|
| |||||||
| Commercial Services — 0.5% | ||||||||
Experian PLC | 76,924 | 1,488,956 | ||||||
|
| |||||||
| Number of Shares | Value | |||||||
| Cosmetics & Personal Care — 1.0% | ||||||||
The Procter & Gamble Co. | 32,360 | $ | 2,720,829 | |||||
|
| |||||||
| Foods — 2.7% | ||||||||
The Kroger Co. | 108,760 | 3,753,308 | ||||||
Mondelez International, Inc. Class A | 31,150 | 1,380,879 | ||||||
Unilever NV NY Shares | 55,910 | 2,295,665 | ||||||
|
| |||||||
| 7,429,852 | ||||||||
|
| |||||||
| Health Care – Products — 1.4% | ||||||||
Becton, Dickinson & Co. | 10,320 | 1,708,476 | ||||||
Johnson & Johnson | 18,830 | 2,169,404 | ||||||
|
| |||||||
| 3,877,880 | ||||||||
|
| |||||||
| Health Care – Services — 5.8% | ||||||||
Aetna, Inc. | 39,992 | 4,959,408 | ||||||
Anthem, Inc. | 32,740 | 4,707,030 | ||||||
Quest Diagnostics, Inc. | 34,850 | 3,202,715 | ||||||
UnitedHealth Group, Inc. | 21,643 | 3,463,745 | ||||||
|
| |||||||
| 16,332,898 | ||||||||
|
| |||||||
| Pharmaceuticals — 7.2% | ||||||||
AstraZeneca PLC | 74,031 | 4,014,944 | ||||||
Mead Johnson Nutrition Co. | 13,580 | 960,921 | ||||||
Merck & Co., Inc. | 93,570 | 5,508,466 | ||||||
Pfizer, Inc. | 292,350 | 9,495,528 | ||||||
|
| |||||||
| 19,979,859 | ||||||||
|
| |||||||
| 59,995,698 | ||||||||
|
| |||||||
| Energy — 12.0% | ||||||||
| Oil & Gas — 11.1% | ||||||||
Anadarko Petroleum Corp. | 12,590 | 877,901 | ||||||
Chevron Corp. | 37,188 | 4,377,028 | ||||||
ConocoPhillips | 28,330 | 1,420,466 | ||||||
Exxon Mobil Corp. | 46,880 | 4,231,389 | ||||||
Hess Corp. | 49,112 | 3,059,186 | ||||||
Marathon Oil Corp. | 52,250 | 904,447 | ||||||
Marathon Petroleum Corp. | 43,210 | 2,175,623 | ||||||
Occidental Petroleum Corp. | 69,964 | 4,983,536 | ||||||
Pioneer Natural Resources Co. | 3,830 | 689,668 | ||||||
Suncor Energy, Inc. | 121,690 | 3,978,046 | ||||||
Total SA Sponsored ADR (France) | 81,473 | 4,152,679 | ||||||
|
| |||||||
| 30,849,969 | ||||||||
|
| |||||||
| Oil & Gas Services — 0.4% | ||||||||
Schlumberger Ltd. | 14,440 | 1,212,238 | ||||||
|
| |||||||
| Pipelines — 0.5% | ||||||||
Spectra Energy Corp. | 29,830 | 1,225,715 | ||||||
|
| |||||||
| 33,287,922 | ||||||||
|
| |||||||
| Financial — 27.7% | ||||||||
| Banks — 14.4% | ||||||||
Bank of America Corp. | 534,020 | 11,801,842 | ||||||
Citigroup, Inc. | 131,020 | 7,786,518 | ||||||
The Goldman Sachs Group, Inc. | 13,420 | 3,213,419 | ||||||
The accompanying notes are an integral part of the financial statements.
89
Table of Contents
MML Income & Growth Fund – Portfolio of Investments (Continued)
| Number of Shares | Value | |||||||
KeyCorp | 74,260 | $ | 1,356,730 | |||||
SunTrust Banks, Inc. | 69,722 | 3,824,252 | ||||||
U.S. Bancorp | 79,430 | 4,080,319 | ||||||
Wells Fargo & Co. | 144,270 | 7,950,720 | ||||||
|
| |||||||
| 40,013,800 | ||||||||
|
| |||||||
| Diversified Financial — 6.9% | ||||||||
CME Group, Inc. | 18,200 | 2,099,370 | ||||||
Invesco Ltd. | 54,464 | 1,652,438 | ||||||
JP Morgan Chase & Co. | 124,080 | 10,706,863 | ||||||
Morgan Stanley | 116,890 | 4,938,602 | ||||||
|
| |||||||
| 19,397,273 | ||||||||
|
| |||||||
| Insurance — 6.0% | ||||||||
The Allstate Corp. | 18,100 | 1,341,572 | ||||||
American International Group, Inc. | 70,710 | 4,618,070 | ||||||
Marsh & McLennan Cos., Inc. | 19,520 | 1,319,357 | ||||||
MetLife, Inc. | 60,860 | 3,279,746 | ||||||
Prudential Financial, Inc. | 37,300 | 3,881,438 | ||||||
The Travelers Cos., Inc. | 18,720 | 2,291,702 | ||||||
|
| |||||||
| 16,731,885 | ||||||||
|
| |||||||
| Real Estate Investment Trusts (REITS) — 0.4% | ||||||||
Weyerhaeuser Co. | 34,050 | 1,024,565 | ||||||
|
| |||||||
| 77,167,523 | ||||||||
|
| |||||||
| Industrial — 9.1% | ||||||||
| Aerospace & Defense — 3.2% | ||||||||
Lockheed Martin Corp. | 12,650 | 3,161,741 | ||||||
Northrop Grumman Corp. | 16,740 | 3,893,389 | ||||||
Raytheon Co. | 12,860 | 1,826,120 | ||||||
|
| |||||||
| 8,881,250 | ||||||||
|
| |||||||
| Machinery – Diversified — 0.3% | ||||||||
Rockwell Automation, Inc. | 4,740 | 637,056 | ||||||
|
| |||||||
| Manufacturing — 4.2% | ||||||||
3M Co. | 6,390 | 1,141,063 | ||||||
General Electric Co. | 229,680 | 7,257,888 | ||||||
Honeywell International, Inc. | 29,120 | 3,373,552 | ||||||
|
| |||||||
| 11,772,503 | ||||||||
|
| |||||||
| Transportation — 1.4% | ||||||||
Union Pacific Corp. | 14,809 | 1,535,397 | ||||||
United Parcel Service, Inc. Class B | 21,100 | 2,418,904 | ||||||
|
| |||||||
| 3,954,301 | ||||||||
|
| |||||||
| 25,245,110 | ||||||||
|
| |||||||
| Technology — 8.5% | ||||||||
| Computers — 0.4% | ||||||||
Lenovo Group Ltd. | 1,802,000 | 1,085,246 | ||||||
|
| |||||||
| Semiconductors — 3.9% | ||||||||
Intel Corp. | 92,230 | 3,345,182 | ||||||
QUALCOMM, Inc. | 42,050 | 2,741,660 | ||||||
Samsung Electronics Co., Ltd. GDR (a) | 5,390 | 4,013,945 | ||||||
| Number of Shares | Value | |||||||
Taiwan Semiconductor Manufacturing Co. Ltd. Sponsored ADR (Taiwan) | 32,360 | $ | 930,350 | |||||
|
| |||||||
| 11,031,137 | ||||||||
|
| |||||||
| Software — 4.2% | ||||||||
Microsoft Corp. | 96,680 | 6,007,695 | ||||||
Oracle Corp. | 146,000 | 5,613,700 | ||||||
|
| |||||||
| 11,621,395 | ||||||||
|
| |||||||
| 23,737,778 | ||||||||
|
| |||||||
| Utilities — 4.8% | ||||||||
| Electric — 4.6% | ||||||||
CMS Energy Corp. | 37,690 | 1,568,658 | ||||||
Dominion Resources, Inc. | 36,290 | 2,779,451 | ||||||
DTE Energy Co. | 4,870 | 479,744 | ||||||
Exelon Corp. | 51,630 | 1,832,349 | ||||||
FirstEnergy Corp. | 21,700 | 672,049 | ||||||
NextEra Energy, Inc. | 28,150 | 3,362,799 | ||||||
Public Service Enterprise Group, Inc. | 50,730 | 2,226,032 | ||||||
|
| |||||||
| 12,921,082 | ||||||||
|
| |||||||
| Water — 0.2% | ||||||||
American Water Works Co., Inc. | 6,770 | 489,877 | ||||||
|
| |||||||
| 13,410,959 | ||||||||
|
| |||||||
| TOTAL COMMON STOCK (Cost $214,320,685) | 266,898,748 | |||||||
|
| |||||||
| TOTAL EQUITIES (Cost $214,320,685) | 266,898,748 | |||||||
|
| |||||||
| TOTAL LONG-TERM INVESTMENTS (Cost $214,320,685) | 266,898,748 | |||||||
|
| |||||||
| Principal Amount | ||||||||
| SHORT-TERM INVESTMENTS — 4.1% | ||||||||
| Repurchase Agreement — 4.1% | ||||||||
State Street Bank & Trust Co. Repurchase Agreement, dated 12/30/16, 0.010%, due 1/03/17 (b) | $ | 11,374,171 | 11,374,171 | |||||
|
| |||||||
| TOTAL SHORT-TERM INVESTMENTS (Cost $11,374,171) | 11,374,171 | |||||||
|
| |||||||
| TOTAL INVESTMENTS — 99.9% (Cost $225,694,856) (c) | 278,272,919 | |||||||
| Other Assets/(Liabilities) — 0.1% | 226,802 | |||||||
|
| |||||||
| NET ASSETS — 100.0% | $ | 278,499,721 | ||||||
|
| |||||||
The accompanying notes are an integral part of the financial statements.
90
Table of Contents
MML Income & Growth Fund – Portfolio of Investments (Continued)
Notes to Portfolio of Investments
Percentages are stated as a percent of net assets.
| ADR | American Depositary Receipt |
| GDR | Global Depositary Receipt |
| (a) | Security exempt from registration under Regulation S of the Securities Act of 1933, which exempts from registration securities offered and sold outside the United States. Security may not be offered or sold in the United States except pursuant to an exemption from, or in a transaction not subject to, the registration requirements of the Securities Act of 1933. At December 31, 2016, these securities amounted to a value of $4,013,945 or 1.44% of net assets. |
| (b) | Maturity value of $11,374,183. Collateralized by U.S. Government Agency obligations with a rate of 3.125%, maturity date of 5/15/19, and an aggregate market value, including accrued interest, of $11,605,037. |
| (c) | See Note 6 for aggregate cost for federal tax purposes. |
The accompanying notes are an integral part of the financial statements.
91
Table of Contents
MML International Equity Fund – Portfolio of Investments
December 31, 2016
| Number of Shares | Value | |||||||
| EQUITIES — 97.6% | ||||||||
| COMMON STOCK — 97.6% | ||||||||
| Australia — 3.9% | ||||||||
AMP Ltd. | 830,900 | $ | 3,014,044 | |||||
Orica Ltd. | 227,124 | 2,885,050 | ||||||
|
| |||||||
| 5,899,094 | ||||||||
|
| |||||||
| Cayman Islands — 3.4% | ||||||||
Baidu, Inc. Sponsored ADR (Cayman Islands) (a) | 18,275 | 3,004,593 | ||||||
Melco Crown Entertainment Ltd. ADR (Cayman Islands) | 137,000 | 2,178,300 | ||||||
|
| |||||||
| 5,182,893 | ||||||||
|
| |||||||
| France — 14.8% | ||||||||
BNP Paribas | 86,050 | 5,481,505 | ||||||
Bureau Veritas SA | 137,000 | 2,654,392 | ||||||
Danone SA | 42,475 | 2,688,470 | ||||||
Kering | 10,855 | 2,433,526 | ||||||
LVMH Moet Hennessy Louis Vuitton SE | 13,190 | 2,515,034 | ||||||
Pernod-Ricard SA | 18,690 | 2,024,727 | ||||||
Safran SA | 31,170 | 2,244,160 | ||||||
Sanofi | 3,200 | 258,803 | ||||||
Valeo SA | 37,410 | 2,149,564 | ||||||
|
| |||||||
| 22,450,181 | ||||||||
|
| |||||||
| Germany — 10.0% | ||||||||
Allianz SE | 32,080 | 5,302,924 | ||||||
Bayerische Motoren Werke AG | 16,280 | 1,524,180 | ||||||
Continental AG | 15,795 | 3,074,724 | ||||||
Daimler AG | 71,500 | 5,306,402 | ||||||
|
| |||||||
| 15,208,230 | ||||||||
|
| |||||||
| India — 0.6% | ||||||||
Infosys Ltd. Sponsored ADR (India) | 64,000 | 949,120 | ||||||
|
| |||||||
| Indonesia — 1.8% | ||||||||
Bank Mandiri Persero Tbk PT | 3,268,900 | 2,795,216 | ||||||
|
| |||||||
| Ireland — 2.9% | ||||||||
Experian PLC | 83,000 | 1,606,564 | ||||||
Willis Towers Watson PLC | 23,479 | 2,871,012 | ||||||
|
| |||||||
| 4,477,576 | ||||||||
|
| |||||||
| Israel — 0.1% | ||||||||
Check Point Software Technologies Ltd. (a) | 1,400 | 118,244 | ||||||
|
| |||||||
| Italy — 4.9% | ||||||||
Intesa Sanpaolo SpA | 2,087,200 | 5,328,203 | ||||||
Prada SpA | 642,200 | 2,167,284 | ||||||
|
| |||||||
| 7,495,487 | ||||||||
|
| |||||||
| Japan — 9.1% | ||||||||
Daiwa Securities Group, Inc. | 476,000 | 2,924,098 | ||||||
| Number of Shares | Value | |||||||
Honda Motor Co. Ltd. | 130,100 | $ | 3,787,622 | |||||
Komatsu Ltd. | 57,800 | 1,304,614 | ||||||
Nomura Holdings, Inc. | 36,200 | 213,384 | ||||||
Olympus Corp. | 20,400 | 703,415 | ||||||
Omron Corp. | 40,400 | 1,546,176 | ||||||
Toyota Motor Corp. | 57,300 | 3,345,143 | ||||||
|
| |||||||
| 13,824,452 | ||||||||
|
| |||||||
| Mexico — 1.8% | ||||||||
Grupo Televisa SAB Sponsored ADR (Mexico) | 129,900 | 2,713,611 | ||||||
|
| |||||||
| Netherlands — 7.7% | ||||||||
Akzo Nobel NV | 14,661 | 915,601 | ||||||
ASML Holding NV | 6,970 | 780,944 | ||||||
CNH Industrial NV | 601,100 | 5,226,175 | ||||||
EXOR NV | 60,000 | 2,587,579 | ||||||
Koninklijke Philips Electronics NV | 71,015 | 2,164,609 | ||||||
|
| |||||||
| 11,674,908 | ||||||||
|
| |||||||
| Republic of Korea — 1.2% | ||||||||
Samsung Electronics Co., Ltd. | 1,210 | 1,787,845 | ||||||
|
| |||||||
| Sweden — 4.3% | ||||||||
Atlas Copco AB Class B | 27,200 | 740,315 | ||||||
Hennes & Mauritz AB Class B | 111,000 | 3,081,337 | ||||||
SKF AB Class B | 148,000 | 2,716,617 | ||||||
|
| |||||||
| 6,538,269 | ||||||||
|
| |||||||
| Switzerland — 12.1% | ||||||||
Cie Financiere Richemont SA | 49,450 | 3,274,174 | ||||||
Credit Suisse Group | 368,123 | 5,256,435 | ||||||
Kuehne & Nagel International AG | 15,960 | 2,107,007 | ||||||
LafargeHolcim Ltd. | 62,970 | 3,307,851 | ||||||
Nestle SA | 19,670 | 1,410,852 | ||||||
The Swatch Group AG (b) | 9,585 | 2,980,260 | ||||||
|
| |||||||
| 18,336,579 | ||||||||
|
| |||||||
| Taiwan — 0.3% | ||||||||
Taiwan Semiconductor Manufacturing Co. Ltd. | 73,000 | 408,803 | ||||||
|
| |||||||
| United Kingdom — 18.7% | ||||||||
Ashtead Group PLC | 152,700 | 2,958,349 | ||||||
Diageo PLC | 115,800 | 2,995,873 | ||||||
G4S PLC | 584,700 | 1,692,079 | ||||||
Glencore PLC (a) | 1,906,900 | 6,409,271 | ||||||
Lloyds Banking Group PLC | 7,705,700 | 5,925,922 | ||||||
Meggitt PLC | 242,738 | 1,370,775 | ||||||
Royal Bank of Scotland Group PLC (a) | 863,200 | 2,384,095 | ||||||
Schroders PLC | 71,600 | 2,640,893 | ||||||
Smiths Group PLC | 69,200 | 1,202,090 | ||||||
Wolseley PLC | 10,300 | 629,270 | ||||||
The accompanying notes are an integral part of the financial statements.
92
Table of Contents
MML International Equity Fund – Portfolio of Investments (Continued)
| Number of Shares | Value | |||||||
WPP PLC | 7,300 | $ | 163,196 | |||||
|
| |||||||
| 28,371,813 | ||||||||
|
| |||||||
| TOTAL COMMON STOCK (Cost $146,004,559) | 148,232,321 | |||||||
|
| |||||||
| TOTAL EQUITIES (Cost $146,004,559) | 148,232,321 | |||||||
|
| |||||||
| MUTUAL FUNDS — 0.1% | ||||||||
| United States — 0.1% | ||||||||
State Street Navigator Securities Lending Prime Portfolio (c) | 145,010 | 145,010 | ||||||
|
| |||||||
| TOTAL MUTUAL FUNDS (Cost $145,010) | 145,010 | |||||||
|
| |||||||
| TOTAL LONG-TERM INVESTMENTS (Cost $146,149,569) | 148,377,331 | |||||||
|
| |||||||
| Principal Amount | ||||||||
| SHORT-TERM INVESTMENTS — 2.1% | ||||||||
| Repurchase Agreement — 2.1% | ||||||||
State Street Bank & Trust Co. Repurchase Agreement, dated 12/30/16, 0.010%, due 1/03/17 (d) | $ | 3,166,695 | 3,166,695 | |||||
|
| |||||||
| TOTAL SHORT-TERM INVESTMENTS (Cost $3,166,695) | 3,166,695 | |||||||
|
| |||||||
| TOTAL INVESTMENTS — 99.8% (Cost $149,316,264) (e) | 151,544,026 | |||||||
| Other Assets/(Liabilities) — 0.2% | 272,049 | |||||||
|
| |||||||
| NET ASSETS — 100.0% | $ | 151,816,075 | ||||||
|
| |||||||
Notes to Portfolio of Investments
Percentages are stated as a percent of net assets.
| ADR | American Depositary Receipt |
| (a) | Non-income producing security. |
| (b) | Denotes all or a portion of security on loan. The total value of securities on loan as of December 31, 2016, was $138,095 or 0.09% of net assets. Total securities on loan may not correspond with the amounts identified in the Portfolio of Investments because pending sales may be in the process of recall from the brokers. (Note 2). |
| (c) | Represents investment of security lending collateral. (Note 2). |
| (d) | Maturity value of $3,166,699. Collateralized by U.S. Government Agency obligations with a rate of 8.125%, |
| maturity date of 8/15/21, and an aggregate market value, including accrued interest, of $3,231,276. |
| (e) | See Note 6 for aggregate cost for federal tax purposes. |
The accompanying notes are an integral part of the financial statements.
93
Table of Contents
MML Large Cap Growth Fund – Portfolio of Investments
December 31, 2016
| Number of Shares | Value | |||||||
| EQUITIES — 98.9% | ||||||||
| COMMON STOCK — 98.9% | ||||||||
| Communications — 30.5% | ||||||||
| Internet — 23.5% | ||||||||
Alibaba Group Holding Ltd. Sponsored ADR (Cayman Islands) (a) | 54,684 | $ | 4,801,802 | |||||
Alphabet, Inc. Class A (a) | 4,058 | 3,215,762 | ||||||
Alphabet, Inc. Class C (a) | 4,072 | 3,142,851 | ||||||
Amazon.com, Inc. (a) | 9,913 | 7,433,461 | ||||||
Facebook, Inc. Class A (a) | 57,283 | 6,590,409 | ||||||
|
| |||||||
| 25,184,285 | ||||||||
|
| |||||||
| Media — 1.9% | ||||||||
FactSet Research Systems, Inc. | 12,460 | 2,036,338 | ||||||
|
| |||||||
| Telecommunications — 5.1% | ||||||||
Cisco Systems, Inc. | 179,132 | 5,413,369 | ||||||
|
| |||||||
| 32,633,992 | ||||||||
|
| |||||||
| Consumer, Cyclical — 2.9% | ||||||||
| Retail — 2.9% | ||||||||
Yum China Holdings, Inc. (a) | 45,624 | 1,191,699 | ||||||
Yum! Brands, Inc. | 30,487 | 1,930,742 | ||||||
|
| |||||||
| 3,122,441 | ||||||||
|
| |||||||
| 3,122,441 | ||||||||
|
| |||||||
| Consumer, Non-cyclical — 36.0% | ||||||||
| Beverages — 7.0% | ||||||||
The Coca-Cola Co. | 82,891 | 3,436,661 | ||||||
Monster Beverage Corp. (a) | 92,314 | 4,093,203 | ||||||
|
| |||||||
| 7,529,864 | ||||||||
|
| |||||||
| Biotechnology — 4.7% | ||||||||
Amgen, Inc. | 14,517 | 2,122,531 | ||||||
Regeneron Pharmaceuticals, Inc. (a) | 7,949 | 2,917,998 | ||||||
|
| |||||||
| 5,040,529 | ||||||||
|
| |||||||
| Commercial Services — 8.9% | ||||||||
Automatic Data Processing, Inc. | 10,435 | 1,072,509 | ||||||
SEI Investments Co. | 64,468 | 3,182,141 | ||||||
Visa, Inc. Class A | 67,488 | 5,265,414 | ||||||
|
| |||||||
| 9,520,064 | ||||||||
|
| |||||||
| Cosmetics & Personal Care — 3.3% | ||||||||
The Procter & Gamble Co. | 41,548 | 3,493,356 | ||||||
|
| |||||||
| Foods — 3.2% | ||||||||
Danone SA Sponsored ADR (France) | 269,000 | 3,384,020 | ||||||
|
| |||||||
| Health Care – Products — 2.4% | ||||||||
Varian Medical Systems, Inc. (a) | 28,280 | 2,538,978 | ||||||
|
| |||||||
| Pharmaceuticals — 6.5% | ||||||||
Merck & Co., Inc. | 24,916 | 1,466,805 | ||||||
Novartis AG ADR (Switzerland) | 30,684 | 2,235,022 | ||||||
| Number of Shares | Value | |||||||
Novo Nordisk A/S Sponsored ADR (Denmark) | 90,787 | $ | 3,255,622 | |||||
|
| |||||||
| 6,957,449 | ||||||||
|
| |||||||
| 38,464,260 | ||||||||
|
| |||||||
| Energy — 2.6% | ||||||||
| Oil & Gas Services — 2.6% | ||||||||
Schlumberger Ltd. | 33,490 | 2,811,485 | ||||||
|
| |||||||
| Financial — 1.5% | ||||||||
| Diversified Financial — 1.5% | ||||||||
American Express Co. | 21,740 | 1,610,499 | ||||||
|
| |||||||
| Industrial — 8.6% | ||||||||
| Machinery – Diversified — 2.7% | ||||||||
Deere & Co. | 27,542 | 2,837,928 | ||||||
|
| |||||||
| Transportation — 5.9% | ||||||||
Expeditors International of Washington, Inc. | 62,438 | 3,306,716 | ||||||
United Parcel Service, Inc. Class B | 26,650 | 3,055,156 | ||||||
|
| |||||||
| 6,361,872 | ||||||||
|
| |||||||
| 9,199,800 | ||||||||
|
| |||||||
| Technology — 16.8% | ||||||||
| Semiconductors — 4.8% | ||||||||
Analog Devices, Inc. | 7,038 | 511,100 | ||||||
QUALCOMM, Inc. | 70,570 | 4,601,164 | ||||||
|
| |||||||
| 5,112,264 | ||||||||
|
| |||||||
| Software — 12.0% | ||||||||
Autodesk, Inc. (a) | 44,695 | 3,307,877 | ||||||
Cerner Corp. (a) | 44,776 | 2,121,039 | ||||||
Microsoft Corp. | 47,676 | 2,962,587 | ||||||
Oracle Corp. | 114,701 | 4,410,253 | ||||||
|
| |||||||
| 12,801,756 | ||||||||
|
| |||||||
| 17,914,020 | ||||||||
|
| |||||||
| TOTAL COMMON STOCK (Cost $97,690,745) | 105,756,497 | |||||||
|
| |||||||
| TOTAL EQUITIES (Cost $97,690,745) | 105,756,497 | |||||||
|
| |||||||
| TOTAL LONG-TERM INVESTMENTS (Cost $97,690,745) | 105,756,497 | |||||||
|
| |||||||
The accompanying notes are an integral part of the financial statements.
94
Table of Contents
MML Large Cap Growth Fund – Portfolio of Investments (Continued)
| Principal Amount | Value | |||||||
| SHORT-TERM INVESTMENTS — 1.1% | ||||||||
| Repurchase Agreement — 1.1% | ||||||||
State Street Bank & Trust Co. Repurchase Agreement, dated 12/30/16, 0.010%, due 1/03/17 (b) | $ | 1,202,159 | $ | 1,202,159 | ||||
|
| |||||||
| TOTAL SHORT-TERM INVESTMENTS (Cost $1,202,159) | 1,202,159 | |||||||
|
| |||||||
| TOTAL INVESTMENTS —100.0% (Cost $98,892,904) (c) | 106,958,656 | |||||||
| Other Assets/(Liabilities) — (0.0)% | (38,809 | ) | ||||||
|
| |||||||
| NET ASSETS — 100.0% | $ | 106,919,847 | ||||||
|
| |||||||
Notes to Portfolio of Investments
Percentages are stated as a percent of net assets.
| ADR | American Depositary Receipt |
| (a) | Non-income producing security. |
| (b) | Maturity value of $1,202,160. Collateralized by U.S. Government Agency obligations with a rate of 1.625%, maturity date of 12/31/19, and an aggregate market value, including accrued interest, of $1,230,157. |
| (c) | See Note 6 for aggregate cost for federal tax purposes. |
The accompanying notes are an integral part of the financial statements.
95
Table of Contents
MML Managed Volatility Fund – Portfolio of Investments
December 31, 2016
| Number of Shares | Value | |||||||
| EQUITIES — 98.7% | ||||||||
| COMMON STOCK — 98.7% | ||||||||
| Basic Materials — 2.5% | ||||||||
| Chemicals — 2.0% | ||||||||
Air Products & Chemicals, Inc. (a) | 2,032 | $ | 292,242 | |||||
Albemarle Corp. (a) | 1,036 | 89,179 | ||||||
CF Industries Holdings, Inc. (a) | 2,266 | 71,334 | ||||||
The Dow Chemical Co. (a) | 10,550 | 603,671 | ||||||
E.I. du Pont de Nemours & Co. (a) | 8,223 | 603,568 | ||||||
Eastman Chemical Co. (a) | 1,353 | 101,759 | ||||||
Ecolab, Inc. (a) | 2,509 | 294,105 | ||||||
FMC Corp. (a) | 1,167 | 66,005 | ||||||
International Flavors & Fragrances, Inc. (a) | 729 | 85,898 | ||||||
LyondellBasell Industries NV Class A (a) | 3,201 | 274,582 | ||||||
Monsanto Co. (a) | 4,114 | 432,834 | ||||||
The Mosaic Co. (a) | 3,453 | 101,276 | ||||||
PPG Industries, Inc. (a) | 2,505 | 237,374 | ||||||
Praxair, Inc. (a) | 2,682 | 314,304 | ||||||
The Sherwin-Williams Co. (a) | 755 | 202,899 | ||||||
|
| |||||||
| 3,771,030 | ||||||||
|
| |||||||
| Forest Products & Paper — 0.1% | ||||||||
International Paper Co. (a) | 3,800 | 201,628 | ||||||
|
| |||||||
| Iron & Steel — 0.1% | ||||||||
Nucor Corp. (a) | 2,904 | 172,846 | ||||||
|
| |||||||
| Mining — 0.3% | ||||||||
Freeport-McMoRan, Inc. (a) (b) | 11,290 | 148,915 | ||||||
Newmont Mining Corp. (a) | 5,024 | 171,168 | ||||||
Vulcan Materials Co. (a) | 1,260 | 157,689 | ||||||
|
| |||||||
| 477,772 | ||||||||
|
| |||||||
| 4,623,276 | ||||||||
|
| |||||||
| Communications — 13.4% | ||||||||
| Advertising — 0.2% | ||||||||
The Interpublic Group of Companies, Inc. (a) | 3,643 | 85,283 | ||||||
Nielsen Holdings PLC (a) | 2,973 | 124,717 | ||||||
Omnicom Group, Inc. (a) | 2,267 | 192,945 | ||||||
|
| |||||||
| 402,945 | ||||||||
|
| |||||||
| Internet — 6.7% | ||||||||
Akamai Technologies, Inc. (a) (b) | 1,588 | 105,888 | ||||||
Alphabet, Inc. Class A (a) (b) | 2,771 | 2,195,879 | ||||||
Alphabet, Inc. Class C (a) (b) | 2,776 | 2,142,572 | ||||||
Amazon.com, Inc. (a) (b) | 3,699 | 2,773,769 | ||||||
eBay, Inc. (a) (b) | 9,868 | 292,981 | ||||||
Equinix, Inc. (a) | 667 | 238,392 | ||||||
Expedia, Inc. (a) | 1,107 | 125,401 | ||||||
F5 Networks, Inc. (a) (b) | 617 | 89,292 | ||||||
Facebook, Inc. Class A (a) (b) | 21,830 | 2,511,542 | ||||||
| Number of Shares | Value | |||||||
Netflix, Inc. (a) (b) | 4,032 | $ | 499,162 | |||||
The Priceline Group, Inc. (a) (b) | 467 | 684,650 | ||||||
Symantec Corp. (a) | 5,664 | 135,313 | ||||||
TripAdvisor, Inc. (a) (b) | 1,100 | 51,007 | ||||||
VeriSign, Inc. (a) (b) | 849 | 64,583 | ||||||
Yahoo!, Inc. (a) (b) | 8,294 | 320,729 | ||||||
|
| |||||||
| 12,231,160 | ||||||||
|
| |||||||
| Media — 2.9% | ||||||||
CBS Corp. Class B (a) | 3,829 | 243,601 | ||||||
Charter Communications, Inc. Class A (a) (b) | 2,038 | 586,781 | ||||||
Comcast Corp. Class A (a) | 22,576 | 1,558,873 | ||||||
Discovery Communications, Inc. Series A (a) (b) | 1,578 | 43,253 | ||||||
Discovery Communications, Inc. Series C (a) (b) | 1,970 | 52,757 | ||||||
News Corp. Class A (a) | 4,034 | 46,230 | ||||||
News Corp. Class B (a) | 798 | 9,416 | ||||||
Scripps Networks Interactive Class A (a) | 965 | 68,872 | ||||||
TEGNA, Inc. (a) | 1,890 | 40,427 | ||||||
Time Warner, Inc. (a) | 7,310 | 705,634 | ||||||
Twenty-First Century Fox, Inc. Class A (a) | 10,401 | 291,644 | ||||||
Twenty-First Century Fox, Inc. Class B (a) | 4,276 | 116,521 | ||||||
Viacom, Inc. Class B (a) | 3,265 | 114,601 | ||||||
The Walt Disney Co. (a) | 13,890 | 1,447,616 | ||||||
|
| |||||||
| 5,326,226 | ||||||||
|
| |||||||
| Telecommunications — 3.6% | ||||||||
AT&T, Inc. (a) | 57,834 | 2,459,680 | ||||||
CenturyLink, Inc. (a) | 5,076 | 120,707 | ||||||
Cisco Systems, Inc. (a) | 47,401 | 1,432,458 | ||||||
Corning, Inc. (a) | 8,862 | 215,081 | ||||||
Frontier Communications Corp. (a) | 11,503 | 38,880 | ||||||
Juniper Networks, Inc. (a) | 3,405 | 96,225 | ||||||
Level 3 Communications, Inc. (a) (b) | 2,726 | 153,638 | ||||||
Motorola Solutions, Inc. (a) | 1,522 | 126,159 | ||||||
Verizon Communications, Inc. (a) | 38,316 | 2,045,308 | ||||||
|
| |||||||
| 6,688,136 | ||||||||
|
| |||||||
| 24,648,467 | ||||||||
|
| |||||||
| Consumer, Cyclical — 9.1% | ||||||||
| Airlines — 0.5% | ||||||||
Alaska Air Group, Inc. (a) | 1,199 | 106,387 | ||||||
American Airlines Group, Inc. (a) | 4,961 | 231,629 | ||||||
Delta Air Lines, Inc. (a) | 7,012 | 344,921 | ||||||
Southwest Airlines Co. (a) | 5,881 | 293,109 | ||||||
|
| |||||||
| 976,046 | ||||||||
|
| |||||||
| Apparel — 0.6% | ||||||||
Hanesbrands, Inc. (a) | 3,430 | 73,985 | ||||||
The accompanying notes are an integral part of the financial statements.
96
Table of Contents
MML Managed Volatility Fund – Portfolio of Investments (Continued)
| Number of Shares | Value | |||||||
Michael Kors Holdings Ltd. (a) (b) | 1,589 | $ | 68,295 | |||||
Nike, Inc. Class B (a) | 12,694 | 645,236 | ||||||
Ralph Lauren Corp. (a) | 558 | 50,398 | ||||||
Under Armour, Inc. Class A (a) (b) | 1,616 | 46,945 | ||||||
Under Armour, Inc. Class C (a) (b) | 1,787 | 44,979 | ||||||
VF Corp. (a) | 3,054 | 162,931 | ||||||
|
| |||||||
| 1,092,769 | ||||||||
|
| |||||||
| Auto Manufacturers — 0.6% | ||||||||
Ford Motor Co. (a) | 36,807 | 446,469 | ||||||
General Motors Co. (a) | 13,269 | 462,292 | ||||||
PACCAR, Inc. (a) | 3,329 | 212,723 | ||||||
|
| |||||||
| 1,121,484 | ||||||||
|
| |||||||
| Automotive & Parts — 0.2% | ||||||||
BorgWarner, Inc. (a) | 1,724 | 67,995 | ||||||
Delphi Automotive PLC (a) | 2,603 | 175,312 | ||||||
The Goodyear Tire & Rubber Co. (a) | 2,615 | 80,725 | ||||||
|
| |||||||
| 324,032 | ||||||||
|
| |||||||
| Distribution & Wholesale — 0.3% | ||||||||
Fastenal Co. (a) | 2,702 | 126,940 | ||||||
Genuine Parts Co. (a) | 1,418 | 135,476 | ||||||
LKQ Corp. (a) (b) | 2,888 | 88,517 | ||||||
W.W. Grainger, Inc. (a) | 527 | 122,396 | ||||||
|
| |||||||
| 473,329 | ||||||||
|
| |||||||
| Home Builders — 0.1% | ||||||||
D.R. Horton, Inc. (a) | 3,291 | 89,943 | ||||||
Lennar Corp. Class A (a) | 1,839 | 78,948 | ||||||
PulteGroup, Inc. (a) | 2,802 | 51,501 | ||||||
|
| |||||||
| 220,392 | ||||||||
|
| |||||||
| Home Furnishing — 0.1% | ||||||||
Harman International Industries, Inc. (a) | 647 | 71,920 | ||||||
Whirlpool Corp. (a) | 680 | 123,604 | ||||||
|
| |||||||
| 195,524 | ||||||||
|
| |||||||
| Housewares — 0.1% | ||||||||
Newell Brands, Inc. (a) | 4,416 | 197,174 | ||||||
|
| |||||||
| Leisure Time — 0.3% | ||||||||
Carnival Corp. (a) | 4,037 | 210,166 | ||||||
Harley-Davidson, Inc. (a) | 1,688 | 98,478 | ||||||
Royal Caribbean Cruises Ltd. (a) | 1,585 | 130,033 | ||||||
|
| |||||||
| 438,677 | ||||||||
|
| |||||||
| Lodging — 0.2% | ||||||||
Marriott International, Inc. Class A (a) | 3,057 | 252,753 | ||||||
Wyndham Worldwide Corp. (a) | 1,102 | 84,160 | ||||||
Wynn Resorts Ltd. (a) | 708 | 61,249 | ||||||
|
| |||||||
| 398,162 | ||||||||
|
| |||||||
| Retail — 5.9% | ||||||||
Advance Auto Parts, Inc. (a) | 683 | 115,509 | ||||||
AutoNation, Inc. (a) (b) | 470 | 22,865 | ||||||
| Number of Shares | Value | |||||||
AutoZone, Inc. (a) (b) | 278 | $ | 219,562 | |||||
Bed Bath & Beyond, Inc. (a) | 1,548 | 62,911 | ||||||
Best Buy Co., Inc. (a) | 2,549 | 108,766 | ||||||
CarMax, Inc. (a) (b) | 1,786 | 115,001 | ||||||
Chipotle Mexican Grill, Inc. (a) (b) | 264 | 99,612 | ||||||
Coach, Inc. (a) | 2,752 | 96,375 | ||||||
Costco Wholesale Corp. (a) | 4,126 | 660,614 | ||||||
CVS Health Corp. (a) | 10,034 | 791,783 | ||||||
Darden Restaurants, Inc. (a) | 1,189 | 86,464 | ||||||
Dollar General Corp. (a) | 2,396 | 177,472 | ||||||
Dollar Tree, Inc. (a) (b) | 2,275 | 175,584 | ||||||
Foot Locker, Inc. (a) | 1,218 | 86,344 | ||||||
The Gap, Inc. (a) | 2,014 | 45,194 | ||||||
The Home Depot, Inc. (a) | 11,622 | 1,558,278 | ||||||
Kohl’s Corp. (a) | 1,685 | 83,205 | ||||||
L Brands, Inc. (a) | 2,216 | 145,901 | ||||||
Lowe’s Cos., Inc. (a) | 8,215 | 584,251 | ||||||
Macy’s, Inc. (a) | 2,865 | 102,596 | ||||||
McDonald’s Corp. (a) | 8,034 | 977,898 | ||||||
Nordstrom, Inc. (a) | 995 | 47,690 | ||||||
O’Reilly Automotive, Inc. (a) (b) | 889 | 247,506 | ||||||
PVH Corp. (a) | 805 | 72,643 | ||||||
Ross Stores, Inc. (a) | 3,733 | 244,885 | ||||||
Signet Jewelers Ltd. (a) | 663 | 62,494 | ||||||
Staples, Inc. (a) | 6,307 | 57,078 | ||||||
Starbucks Corp. (a) | 13,819 | 767,231 | ||||||
Target Corp. (a) | 5,463 | 394,592 | ||||||
Tiffany & Co. (a) | 978 | 75,727 | ||||||
The TJX Cos., Inc. (a) | 6,223 | 467,534 | ||||||
Tractor Supply Co. (a) | 1,328 | 100,676 | ||||||
Ulta Salon Cosmetics & Fragrance, Inc. (a) (b) | 535 | 136,393 | ||||||
Urban Outfitters, Inc. (a) (b) | 887 | 25,262 | ||||||
Wal-Mart Stores, Inc. (a) | 14,243 | 984,476 | ||||||
Walgreens Boots Alliance, Inc. (a) | 8,052 | 666,384 | ||||||
Yum! Brands, Inc. (a) | 3,226 | 204,303 | ||||||
|
| |||||||
| 10,871,059 | ||||||||
|
| |||||||
| Textiles — 0.1% | ||||||||
Cintas Corp. (a) | 788 | 91,061 | ||||||
Mohawk Industries, Inc. (a) (b) | 583 | 116,414 | ||||||
|
| |||||||
| 207,475 | ||||||||
|
| |||||||
| Toys, Games & Hobbies — 0.1% | ||||||||
Hasbro, Inc. (a) | 1,112 | 86,503 | ||||||
Mattel, Inc. (a) | 3,075 | 84,716 | ||||||
|
| |||||||
| 171,219 | ||||||||
|
| |||||||
| 16,687,342 | ||||||||
|
| |||||||
| Consumer, Non-cyclical — 22.5% | ||||||||
| Agriculture — 1.8% | ||||||||
Altria Group, Inc. (a) | 18,408 | 1,244,749 | ||||||
Archer-Daniels-Midland Co. (a) | 5,481 | 250,208 | ||||||
Philip Morris International, Inc. (a) | 14,587 | 1,334,564 | ||||||
The accompanying notes are an integral part of the financial statements.
97
Table of Contents
MML Managed Volatility Fund – Portfolio of Investments (Continued)
| Number of Shares | Value | |||||||
Reynolds American, Inc. (a) | 7,804 | $ | 437,336 | |||||
|
| |||||||
| 3,266,857 | ||||||||
|
| |||||||
| Beverages — 2.0% | ||||||||
Brown-Forman Corp. Class B (a) | 1,590 | 71,423 | ||||||
The Coca-Cola Co. (a) | 36,528 | 1,514,451 | ||||||
Constellation Brands, Inc. Class A (a) | 1,676 | 256,948 | ||||||
Dr. Pepper Snapple Group, Inc. (a) | 1,681 | 152,416 | ||||||
Molson Coors Brewing Co. Class B (a) | 1,753 | 170,584 | ||||||
Monster Beverage Corp. (a) (b) | 3,826 | 169,645 | ||||||
PepsiCo, Inc. (a) | 13,535 | 1,416,167 | ||||||
|
| |||||||
| 3,751,634 | ||||||||
|
| |||||||
| Biotechnology — 2.3% | ||||||||
Alexion Pharmaceuticals, Inc. (a) (b) | 2,096 | 256,446 | ||||||
Amgen, Inc. (a) | 7,034 | 1,028,441 | ||||||
Biogen, Inc. (a) (b) | 2,060 | 584,175 | ||||||
Celgene Corp. (a) (b) | 7,286 | 843,354 | ||||||
Gilead Sciences, Inc. (a) | 12,405 | 888,322 | ||||||
Illumina, Inc. (a) (b) | 1,373 | 175,799 | ||||||
Regeneron Pharmaceuticals, Inc. (a) (b) | 708 | 259,900 | ||||||
Vertex Pharmaceuticals, Inc. (a) (b) | 2,266 | 166,936 | ||||||
|
| |||||||
| 4,203,373 | ||||||||
|
| |||||||
| Commercial Services — 2.0% | ||||||||
Automatic Data Processing, Inc. (a) | 4,317 | 443,701 | ||||||
Equifax, Inc. (a) | 1,109 | 131,117 | ||||||
Global Payments, Inc. (a) | 1,452 | 100,783 | ||||||
H&R Block, Inc. (a) | 1,881 | 43,244 | ||||||
Moody’s Corp. (a) | 1,541 | 145,270 | ||||||
Paychex, Inc. (a) | 3,098 | 188,606 | ||||||
PayPal Holdings, Inc. (a) (b) | 10,549 | 416,369 | ||||||
Quanta Services, Inc. (a) (b) | 1,344 | 46,839 | ||||||
Robert Half International, Inc. (a) | 1,168 | 56,975 | ||||||
S&P Global, Inc. (a) | 2,503 | 269,173 | ||||||
Total System Services, Inc. (a) | 1,495 | 73,300 | ||||||
United Rentals, Inc. (a) (b) | 807 | 85,203 | ||||||
Verisk Analytics, Inc. (a) (b) | 1,535 | 124,596 | ||||||
Visa, Inc. Class A (a) | 17,736 | 1,383,763 | ||||||
The Western Union Co. (a) | 4,272 | 92,788 | ||||||
|
| |||||||
| 3,601,727 | ||||||||
|
| |||||||
| Cosmetics & Personal Care — 1.6% | ||||||||
Colgate-Palmolive Co. (a) | 8,342 | 545,900 | ||||||
Coty, Inc. Class A (a) | 4,449 | 81,461 | ||||||
The Estee Lauder Cos., Inc. Class A (a) | 2,120 | 162,159 | ||||||
The Procter & Gamble Co. (a) | 25,082 | 2,108,895 | ||||||
|
| |||||||
| 2,898,415 | ||||||||
|
| |||||||
| Foods — 1.7% | ||||||||
Campbell Soup Co. (a) | 1,783 | 107,818 | ||||||
Conagra Brands, Inc. (a) | 3,747 | 148,194 | ||||||
General Mills, Inc. (a) | 5,730 | 353,942 | ||||||
| Number of Shares | Value | |||||||
The Hershey Co. (a) | 1,308 | $ | 135,286 | |||||
Hormel Foods Corp. (a) | 2,458 | 85,563 | ||||||
The J.M. Smucker Co. (a) | 1,143 | 146,373 | ||||||
Kellogg Co. (a) | 2,337 | 172,260 | ||||||
The Kraft Heinz Co. (a) | 5,579 | 487,158 | ||||||
The Kroger Co. (a) | 8,821 | 304,413 | ||||||
McCormick & Co., Inc. (a) | 1,071 | 99,956 | ||||||
Mondelez International, Inc. Class A (a) | 14,644 | 649,169 | ||||||
Sysco Corp. (a) | 4,830 | 267,437 | ||||||
Tyson Foods, Inc. Class A (a) | 2,809 | 173,259 | ||||||
Whole Foods Market, Inc. (a) | 2,885 | 88,743 | ||||||
|
| |||||||
| 3,219,571 | ||||||||
|
| |||||||
| Health Care – Products — 3.8% | ||||||||
Abbott Laboratories (a) | 13,801 | 530,096 | ||||||
Baxter International, Inc. (a) | 4,613 | 204,540 | ||||||
Becton, Dickinson & Co. (a) | 2,033 | 336,563 | ||||||
Boston Scientific Corp. (a) (b) | 12,905 | 279,135 | ||||||
C.R. Bard, Inc. (a) | 678 | 152,319 | ||||||
The Cooper Cos., Inc. (a) | 478 | 83,617 | ||||||
Edwards Lifesciences Corp. (a) (b) | 2,054 | 192,460 | ||||||
Henry Schein, Inc. (a) (b) | 737 | 111,810 | ||||||
Hologic, Inc. (a) (b) | 2,466 | 98,936 | ||||||
Intuitive Surgical, Inc. (a) (b) | 367 | 232,740 | ||||||
Johnson & Johnson (a) | 25,698 | 2,960,667 | ||||||
Medtronic PLC (a) | 12,968 | 923,711 | ||||||
St. Jude Medical, Inc. (a) | 2,646 | 212,183 | ||||||
Stryker Corp. (a) | 2,916 | 349,366 | ||||||
Varian Medical Systems, Inc. (a) (b) | 857 | 76,941 | ||||||
Zimmer Biomet Holdings, Inc. (a) | 1,859 | 191,849 | ||||||
|
| |||||||
| 6,936,933 | ||||||||
|
| |||||||
| Health Care – Services — 2.3% | ||||||||
Aetna, Inc. (a) | 3,297 | 408,861 | ||||||
Anthem, Inc. (a) | 2,476 | 355,974 | ||||||
Centene Corp. (a) (b) | 1,686 | 95,276 | ||||||
Cigna Corp. (a) | 2,418 | 322,537 | ||||||
DaVita, Inc. (a) (b) | 1,508 | 96,814 | ||||||
DENTSPLY SIRONA, Inc. (a) | 2,191 | 126,486 | ||||||
Envision Healthcare Corp. (a) (b) | 1,145 | 72,467 | ||||||
HCA Holdings, Inc. (a) (b) | 2,785 | 206,146 | ||||||
Humana, Inc. (a) | 1,401 | 285,846 | ||||||
Laboratory Corporation of America Holdings (a) (b) | 977 | 125,427 | ||||||
Quest Diagnostics, Inc. (a) | 1,239 | 113,864 | ||||||
Thermo Fisher Scientific, Inc. (a) | 3,716 | 524,328 | ||||||
UnitedHealth Group, Inc. (a) | 8,956 | 1,433,318 | ||||||
Universal Health Services, Inc. Class B (a) | 903 | 96,061 | ||||||
|
| |||||||
| 4,263,405 | ||||||||
|
| |||||||
The accompanying notes are an integral part of the financial statements.
98
Table of Contents
MML Managed Volatility Fund – Portfolio of Investments (Continued)
| Number of Shares | Value | |||||||
| Household Products — 0.4% | ||||||||
Avery Dennison Corp. (a) | 821 | $ | 57,651 | |||||
Church & Dwight Co., Inc. (a) | 2,370 | 104,730 | ||||||
The Clorox Co. (a) | 1,230 | 147,625 | ||||||
Kimberly-Clark Corp. (a) | 3,384 | 386,182 | ||||||
|
| |||||||
| 696,188 | ||||||||
|
| |||||||
| Pharmaceuticals — 4.6% | ||||||||
AbbVie, Inc. (a) | 15,308 | 958,587 | ||||||
Allergan PLC (a) (b) | 3,522 | 739,655 | ||||||
AmerisourceBergen Corp. (a) | 1,512 | 118,223 | ||||||
Bristol-Myers Squibb Co. (a) | 15,690 | 916,924 | ||||||
Cardinal Health, Inc. (a) | 2,950 | 212,311 | ||||||
Eli Lilly & Co. (a) | 9,125 | 671,144 | ||||||
Endo International PLC (a) (b) | 1,794 | 29,547 | ||||||
Express Scripts Holding Co. (a) (b) | 5,944 | 408,888 | ||||||
Mallinckrodt PLC (a) (b) | 1,090 | 54,304 | ||||||
McKesson Corp. (a) | 2,104 | 295,507 | ||||||
Mead Johnson Nutrition Co. (a) | 1,774 | 125,528 | ||||||
Merck & Co., Inc. (a) | 25,973 | 1,529,031 | ||||||
Mylan NV (a) (b) | 4,421 | 168,661 | ||||||
Patterson Cos., Inc. (a) | 852 | 34,958 | ||||||
Perrigo Co. PLC (a) | 1,332 | 110,862 | ||||||
Pfizer, Inc. (a) | 56,975 | 1,850,548 | ||||||
Zoetis, Inc. (a) | 4,719 | 252,608 | ||||||
|
| |||||||
| 8,477,286 | ||||||||
|
| |||||||
| 41,315,389 | ||||||||
|
| |||||||
| Diversified — 0.0% | ||||||||
| Holding Company – Diversified — 0.0% | ||||||||
Leucadia National Corp. (a) | 2,905 | 67,541 | ||||||
|
| |||||||
| Energy — 7.4% | ||||||||
| Energy – Alternate Sources — 0.0% | ||||||||
First Solar, Inc. (a) (b) | 794 | 25,479 | ||||||
|
| |||||||
| Oil & Gas — 5.8% | ||||||||
Anadarko Petroleum Corp. (a) | 5,123 | 357,227 | ||||||
Apache Corp. (a) | 3,554 | 225,572 | ||||||
Cabot Oil & Gas Corp. (a) | 4,538 | 106,008 | ||||||
Chesapeake Energy Corp. (a) (b) | 7,048 | 49,477 | ||||||
Chevron Corp. (a) | 17,732 | 2,087,056 | ||||||
Cimarex Energy Co. (a) | 850 | 115,515 | ||||||
Concho Resources, Inc. (a) (b) | 1,318 | 174,767 | ||||||
ConocoPhillips (a) | 11,628 | 583,028 | ||||||
Devon Energy Corp. (a) | 4,868 | 222,322 | ||||||
EOG Resources, Inc. (a) | 5,124 | 518,036 | ||||||
EQT Corp. (a) | 1,682 | 110,003 | ||||||
Exxon Mobil Corp. (a) | 38,983 | 3,518,606 | ||||||
Helmerich & Payne, Inc. (a) | 1,072 | 82,973 | ||||||
Hess Corp. (a) | 2,515 | 156,659 | ||||||
Marathon Oil Corp. (a) | 8,143 | 140,955 | ||||||
Marathon Petroleum Corp. (a) | 4,973 | 250,391 | ||||||
Murphy Oil Corp. (a) | 1,605 | 49,964 | ||||||
Newfield Exploration Co. (a) (b) | 1,932 | 78,246 | ||||||
| Number of Shares | Value | |||||||
Noble Energy, Inc. (a) | 4,032 | $ | 153,458 | |||||
Occidental Petroleum Corp. (a) | 7,118 | 507,015 | ||||||
Phillips 66 (a) | 4,194 | 362,403 | ||||||
Pioneer Natural Resources Co. (a) | 1,594 | 287,032 | ||||||
Range Resources Corp. (a) | 1,772 | 60,886 | ||||||
Southwestern Energy Co. (a) (b) | 4,854 | 52,520 | ||||||
Tesoro Corp. (a) | 1,085 | 94,883 | ||||||
Valero Energy Corp. (a) | 4,282 | 292,546 | ||||||
|
| |||||||
| 10,637,548 | ||||||||
|
| |||||||
| Oil & Gas Services — 1.1% | ||||||||
Baker Hughes, Inc. (a) | 4,033 | 262,024 | ||||||
FMC Technologies, Inc. (a) (b) | 1,949 | 69,248 | ||||||
Halliburton Co. (a) | 8,064 | 436,182 | ||||||
National Oilwell Varco, Inc. (a) | 3,542 | 132,613 | ||||||
Schlumberger Ltd. (a) | 13,059 | 1,096,303 | ||||||
Transocean Ltd. (a) (b) | 3,645 | 53,727 | ||||||
|
| |||||||
| 2,050,097 | ||||||||
|
| |||||||
| Pipelines — 0.5% | ||||||||
Kinder Morgan, Inc. (a) | 18,052 | 373,857 | ||||||
ONEOK, Inc. (a) | 2,047 | 117,518 | ||||||
Spectra Energy Corp. (a) | 6,611 | 271,646 | ||||||
The Williams Cos., Inc. (a) | 6,526 | 203,220 | ||||||
|
| |||||||
| 966,241 | ||||||||
|
| |||||||
| 13,679,365 | ||||||||
|
| |||||||
| Financial — 17.7% | ||||||||
| Banks — 6.2% | ||||||||
Bank of America Corp. (a) | 95,915 | 2,119,721 | ||||||
The Bank of New York Mellon Corp. (a) | 10,039 | 475,648 | ||||||
BB&T Corp. (a) | 7,797 | 366,615 | ||||||
Capital One Financial Corp. (a) | 4,765 | 415,699 | ||||||
Citigroup, Inc. (a) | 27,320 | 1,623,628 | ||||||
Citizens Financial Group, Inc. (a) | 4,950 | 176,369 | ||||||
Comerica, Inc. (a) | 1,629 | 110,951 | ||||||
Fifth Third Bancorp (a) | 7,135 | 192,431 | ||||||
The Goldman Sachs Group, Inc. (a) | 3,543 | 848,371 | ||||||
Huntington Bancshares, Inc. (a) | 9,779 | 129,278 | ||||||
KeyCorp (a) | 10,065 | 183,888 | ||||||
M&T Bank Corp. (a) | 1,459 | 228,231 | ||||||
Northern Trust Corp. (a) | 1,972 | 175,607 | ||||||
The PNC Financial Services Group, Inc. (a) | 4,643 | 543,045 | ||||||
Regions Financial Corp. (a) | 11,423 | 164,034 | ||||||
State Street Corp. (a) | 3,447 | 267,901 | ||||||
SunTrust Banks, Inc. (a) | 4,637 | 254,339 | ||||||
U.S. Bancorp (a) | 15,150 | 778,255 | ||||||
Wells Fargo & Co. (a) | 42,705 | 2,353,473 | ||||||
Zions Bancorp (a) | 2,004 | 86,252 | ||||||
|
| |||||||
| 11,493,736 | ||||||||
|
| |||||||
The accompanying notes are an integral part of the financial statements.
99
Table of Contents
MML Managed Volatility Fund – Portfolio of Investments (Continued)
| Number of Shares | Value | |||||||
| Diversified Financial — 4.4% | ||||||||
Affiliated Managers Group, Inc. (a) (b) | 537 | $ | 78,026 | |||||
Alliance Data Systems Corp. (a) | 548 | 125,218 | ||||||
American Express Co. (a) | 7,281 | 539,376 | ||||||
Ameriprise Financial, Inc. (a) | 1,478 | 163,969 | ||||||
BlackRock, Inc. (a) | 1,147 | 436,479 | ||||||
The Charles Schwab Corp. (a) | 11,406 | 450,195 | ||||||
CME Group, Inc. (a) | 3,188 | 367,736 | ||||||
Discover Financial Services (a) | 3,810 | 274,663 | ||||||
E*TRADE Financial Corp. (a) (b) | 2,729 | 94,560 | ||||||
Franklin Resources, Inc. (a) | 3,277 | 129,704 | ||||||
Intercontinental Exchange, Inc. (a) | 5,604 | 316,178 | ||||||
Invesco Ltd. (a) | 3,832 | 116,263 | ||||||
JP Morgan Chase & Co. (a) | 33,962 | 2,930,581 | ||||||
MasterCard, Inc. Class A (a) | 9,015 | 930,799 | ||||||
Morgan Stanley (a) | 13,784 | 582,374 | ||||||
Nasdaq, Inc. (a) | 1,118 | 75,040 | ||||||
Navient Corp. (a) | 3,249 | 53,381 | ||||||
Synchrony Financial (a) | 7,482 | 271,372 | ||||||
T. Rowe Price Group, Inc. (a) | 2,341 | 176,184 | ||||||
|
| |||||||
| 8,112,098 | ||||||||
|
| |||||||
| Insurance — 4.3% | ||||||||
Aflac, Inc. (a) | 3,868 | 269,213 | ||||||
The Allstate Corp. (a) | 3,507 | 259,939 | ||||||
American International Group, Inc. (a) | 9,508 | 620,967 | ||||||
Aon PLC (a) | 2,499 | 278,713 | ||||||
Arthur J. Gallagher & Co. (a) | 1,761 | 91,502 | ||||||
Assurant, Inc. (a) | 459 | 42,623 | ||||||
Berkshire Hathaway, Inc. Class B (a) (b) | 17,841 | 2,907,726 | ||||||
Chubb Ltd. (a) | 4,390 | 580,007 | ||||||
Cincinnati Financial Corp. (a) | 1,376 | 104,232 | ||||||
The Hartford Financial Services Group, Inc. (a) | 3,597 | 171,397 | ||||||
Lincoln National Corp. (a) | 2,068 | 137,046 | ||||||
Loews Corp. (a) | 2,645 | 123,865 | ||||||
Marsh & McLennan Cos., Inc. (a) | 4,942 | 334,030 | ||||||
MetLife, Inc. (a) | 10,341 | 557,276 | ||||||
Principal Financial Group, Inc. (a) | 2,529 | 146,328 | ||||||
The Progressive Corp. (a) | 5,307 | 188,399 | ||||||
Prudential Financial, Inc. (a) | 4,118 | 428,519 | ||||||
Torchmark Corp. (a) | 1,117 | 82,390 | ||||||
The Travelers Cos., Inc. (a) | 2,733 | 334,574 | ||||||
Unum Group (a) | 2,348 | 103,148 | ||||||
Willis Towers Watson PLC (a) | 1,190 | 145,513 | ||||||
XL Group Ltd. (a) | 2,390 | 89,051 | ||||||
|
| |||||||
| 7,996,458 | ||||||||
|
| |||||||
| Real Estate — 0.1% | ||||||||
CBRE Group, Inc. Class A (a) (b) | 2,901 | 91,353 | ||||||
|
| |||||||
| Real Estate Investment Trusts (REITS) — 2.7% | ||||||||
American Tower Corp. (a) | 4,014 | 424,200 | ||||||
| Number of Shares | Value | |||||||
Apartment Investment & Management Co. Class A (a) | 1,562 | $ | 70,993 | |||||
AvalonBay Communities, Inc. (a) | 1,281 | 226,929 | ||||||
Boston Properties, Inc. (a) | 1,424 | 179,111 | ||||||
Crown Castle International Corp. (a) | 3,389 | 294,064 | ||||||
Digital Realty Trust, Inc. (a) | 1,491 | 146,506 | ||||||
Equity Residential (a) | 3,432 | 220,884 | ||||||
Essex Property Trust, Inc. (a) | 613 | 142,522 | ||||||
Extra Space Storage, Inc. (a) | 1,251 | 96,627 | ||||||
Federal Realty Investment Trust (a) | 684 | 97,203 | ||||||
General Growth Properties, Inc. (a) | 5,546 | 138,539 | ||||||
HCP, Inc. (a) | 4,461 | 132,581 | ||||||
Host Hotels & Resorts, Inc. (a) | 7,012 | 132,106 | ||||||
Iron Mountain, Inc. (a) | 2,212 | 71,846 | ||||||
Kimco Realty Corp. (a) | 3,815 | 95,985 | ||||||
The Macerich Co. (a) | 1,060 | 75,090 | ||||||
Mid-America Apartment Communities, Inc. (a) | 1,108 | 108,495 | ||||||
Prologis, Inc. (a) | 4,918 | 259,621 | ||||||
Public Storage (a) | 1,397 | 312,229 | ||||||
Realty Income Corp. (a) | 2,520 | 144,850 | ||||||
Simon Property Group, Inc. (a) | 2,956 | 525,192 | ||||||
SL Green Realty Corp. (a) | 918 | 98,731 | ||||||
UDR, Inc. (a) | 2,618 | 95,505 | ||||||
Ventas, Inc. (a) | 3,275 | 204,753 | ||||||
Vornado Realty Trust (a) | 1,556 | 162,400 | ||||||
Welltower, Inc. (a) | 3,359 | 224,818 | ||||||
Weyerhaeuser Co. (a) | 6,948 | 209,065 | ||||||
|
| |||||||
| 4,890,845 | ||||||||
|
| |||||||
| Savings & Loans — 0.0% | ||||||||
People’s United Financial, Inc. (a) | 2,564 | 49,639 | ||||||
|
| |||||||
| 32,634,129 | ||||||||
|
| |||||||
| Industrial — 10.1% | ||||||||
| Aerospace & Defense — 2.2% | ||||||||
Arconic, Inc. (a) | 4,133 | 76,626 | ||||||
The Boeing Co. (a) | 5,469 | 851,414 | ||||||
General Dynamics Corp. (a) | 2,722 | 469,981 | ||||||
Harris Corp. (a) | 1,158 | 118,660 | ||||||
L3 Technologies, Inc. (a) | 722 | 109,823 | ||||||
Lockheed Martin Corp. (a) | 2,370 | 592,358 | ||||||
Northrop Grumman Corp. (a) | 1,697 | 394,688 | ||||||
Raytheon Co. (a) | 2,788 | 395,896 | ||||||
Rockwell Collins, Inc. (a) | 1,119 | 103,799 | ||||||
TransDigm Group, Inc. (a) | 465 | 115,766 | ||||||
United Technologies Corp. (a) | 7,326 | 803,076 | ||||||
|
| |||||||
| 4,032,087 | ||||||||
|
| |||||||
| Airlines — 0.1% | ||||||||
United Continental Holdings, Inc. (a) (b) | 2,729 | 198,889 | ||||||
|
| |||||||
| Building Materials — 0.2% | ||||||||
Fortune Brands Home & Security, Inc. (a) | 1,512 | 80,832 | ||||||
The accompanying notes are an integral part of the financial statements.
100
Table of Contents
MML Managed Volatility Fund – Portfolio of Investments (Continued)
| Number of Shares | Value | |||||||
Martin Marietta Materials, Inc. (a) | 602 | $ | 133,361 | |||||
Masco Corp. (a) | 2,886 | 91,255 | ||||||
|
| |||||||
| 305,448 | ||||||||
|
| |||||||
| Electrical Components & Equipment — 0.3% | ||||||||
Acuity Brands, Inc. (a) | 412 | 95,114 | ||||||
AMETEK, Inc. (a) | 1,975 | 95,985 | ||||||
Emerson Electric Co. (a) | 6,112 | 340,744 | ||||||
|
| |||||||
| 531,843 | ||||||||
|
| |||||||
| Electronics — 0.8% | ||||||||
Agilent Technologies, Inc. (a) | 3,072 | 139,960 | ||||||
Allegion PLC (a) | 987 | 63,168 | ||||||
Amphenol Corp. Class A (a) | 2,954 | 198,509 | ||||||
FLIR Systems, Inc. (a) | 1,332 | 48,205 | ||||||
Fortive Corp. (a) | 2,801 | 150,218 | ||||||
Garmin Ltd. (a) | 1,157 | 56,103 | ||||||
Johnson Controls International PLC (a) | 8,882 | 365,850 | ||||||
Mettler-Toledo International, Inc. (a) (b) | 259 | 108,407 | ||||||
PerkinElmer, Inc. (a) | 1,090 | 56,843 | ||||||
TE Connectivity Ltd. (a) | 3,318 | 229,871 | ||||||
Waters Corp. (a) (b) | 742 | 99,717 | ||||||
|
| |||||||
| 1,516,851 | ||||||||
|
| |||||||
| Engineering & Construction — 0.1% | ||||||||
Fluor Corp. (a) | 1,351 | 70,955 | ||||||
Jacobs Engineering Group, Inc. (a) (b) | 1,173 | 66,861 | ||||||
|
| |||||||
| 137,816 | ||||||||
|
| |||||||
| Environmental Controls — 0.2% | ||||||||
Republic Services, Inc. (a) | 2,097 | 119,634 | ||||||
Stericycle, Inc. (a) (b) | 712 | 54,852 | ||||||
Waste Management, Inc. (a) | 3,790 | 268,749 | ||||||
|
| |||||||
| 443,235 | ||||||||
|
| |||||||
| Hand & Machine Tools — 0.1% | ||||||||
Snap-on, Inc. (a) | 580 | 99,337 | ||||||
Stanley Black & Decker, Inc. (a) | 1,380 | 158,272 | ||||||
|
| |||||||
| 257,609 | ||||||||
|
| |||||||
| Machinery – Construction & Mining — 0.4% | ||||||||
Caterpillar, Inc. (a) | 5,507 | 510,719 | ||||||
Ingersoll-Rand PLC (a) | 2,453 | 184,073 | ||||||
|
| |||||||
| 694,792 | ||||||||
|
| |||||||
| Machinery – Diversified — 0.5% | ||||||||
Cummins, Inc. (a) | 1,453 | 198,582 | ||||||
Deere & Co. (a) | 2,726 | 280,887 | ||||||
Flowserve Corp. (a) | 1,348 | 64,771 | ||||||
Rockwell Automation, Inc. (a) | 1,234 | 165,850 | ||||||
Roper Technologies, Inc. (a) | 972 | 177,954 | ||||||
Xylem, Inc. (a) | 1,647 | 81,559 | ||||||
|
| |||||||
| 969,603 | ||||||||
|
| |||||||
| Manufacturing — 3.4% | ||||||||
3M Co. (a) | 5,670 | 1,012,492 | ||||||
| Number of Shares | Value | |||||||
Danaher Corp. (a) | 5,690 | $ | 442,910 | |||||
Dover Corp. (a) | 1,530 | 114,643 | ||||||
Eaton Corp. PLC (a) | 4,304 | 288,755 | ||||||
General Electric Co. (a) | 84,211 | 2,661,067 | ||||||
Honeywell International, Inc. (a) | 7,142 | 827,401 | ||||||
Illinois Tool Works, Inc. (a) | 3,015 | 369,217 | ||||||
Leggett & Platt, Inc. (a) | 1,226 | 59,927 | ||||||
Parker Hannifin Corp. (a) | 1,253 | 175,420 | ||||||
Pentair PLC (a) | 1,471 | 82,479 | ||||||
Textron, Inc. (a) | 2,509 | 121,837 | ||||||
|
| |||||||
| 6,156,148 | ||||||||
|
| |||||||
| Packaging & Containers — 0.2% | ||||||||
Ball Corp. (a) | 1,564 | 117,409 | ||||||
Sealed Air Corp. (a) | 1,936 | 87,778 | ||||||
WestRock Co. (a) | 2,488 | 126,316 | ||||||
|
| |||||||
| 331,503 | ||||||||
|
| |||||||
| Transportation — 1.6% | ||||||||
C.H. Robinson Worldwide, Inc. (a) | 1,320 | 96,703 | ||||||
CSX Corp. (a) | 8,820 | 316,903 | ||||||
Expeditors International of Washington, Inc. (a) | 1,814 | 96,069 | ||||||
FedEx Corp. (a) | 2,308 | 429,750 | ||||||
J.B. Hunt Transport Services, Inc. (a) | 886 | 86,004 | ||||||
Kansas City Southern (a) | 984 | 83,492 | ||||||
Norfolk Southern Corp. (a) | 2,759 | 298,165 | ||||||
Ryder System, Inc. (a) | 511 | 38,039 | ||||||
Union Pacific Corp. (a) | 7,823 | 811,089 | ||||||
United Parcel Service, Inc. Class B (a) | 6,487 | 743,670 | ||||||
|
| |||||||
| 2,999,884 | ||||||||
|
| |||||||
| 18,575,708 | ||||||||
|
| |||||||
| Technology — 12.9% | ||||||||
| Computers — 5.0% | ||||||||
Accenture PLC Class A (a) | 5,849 | 685,093 | ||||||
Apple, Inc. (a) | 50,642 | 5,865,357 | ||||||
Cognizant Technology Solutions Corp. Class A (a) (b) | 5,766 | 323,069 | ||||||
CSRA, Inc. (a) | 1,430 | 45,531 | ||||||
Hewlett Packard Enterprise Co. (a) | 15,636 | 361,817 | ||||||
HP, Inc. (a) | 15,949 | 236,683 | ||||||
International Business Machines Corp. (a) | 8,176 | 1,357,134 | ||||||
NetApp, Inc. (a) | 2,510 | 88,528 | ||||||
Seagate Technology PLC (a) | 2,933 | 111,953 | ||||||
Teradata Corp. (a) (b) | 1,361 | 36,978 | ||||||
Western Digital Corp. (a) | 2,631 | 178,777 | ||||||
|
| |||||||
| 9,290,920 | ||||||||
|
| |||||||
| Office Equipment/Supplies — 0.1% | ||||||||
Pitney Bowes, Inc. (a) | 1,997 | 30,335 | ||||||
Xerox Corp. (a) | 7,518 | 65,632 | ||||||
|
| |||||||
| 95,967 | ||||||||
|
| |||||||
The accompanying notes are an integral part of the financial statements.
101
Table of Contents
MML Managed Volatility Fund – Portfolio of Investments (Continued)
| Number of Shares | Value | |||||||
| Semiconductors — 3.3% | ||||||||
Analog Devices, Inc. (a) | 2,923 | $ | 212,268 | |||||
Applied Materials, Inc. (a) | 10,273 | 331,510 | ||||||
Broadcom Ltd. (a) | 3,718 | 657,231 | ||||||
Intel Corp. (a) | 44,410 | 1,610,751 | ||||||
KLA-Tencor Corp. (a) | 1,424 | 112,040 | ||||||
Lam Research Corp. (a) | 1,460 | 154,366 | ||||||
Linear Technology Corp. (a) | 2,258 | 140,786 | ||||||
Microchip Technology, Inc. (a) | 2,033 | 130,417 | ||||||
Micron Technology, Inc. (a) (b) | 9,755 | 213,830 | ||||||
NVIDIA Corp. (a) | 5,080 | 542,239 | ||||||
Qorvo, Inc. (a) (b) | 1,280 | 67,494 | ||||||
QUALCOMM, Inc. (a) | 13,848 | 902,890 | ||||||
Skyworks Solutions, Inc. (a) | 1,736 | 129,610 | ||||||
Texas Instruments, Inc. (a) | 9,397 | 685,699 | ||||||
Xilinx, Inc. (a) | 2,390 | 144,284 | ||||||
|
| |||||||
| 6,035,415 | ||||||||
|
| |||||||
| Software — 4.5% | ||||||||
Activision Blizzard, Inc. (a) | 6,541 | 236,196 | ||||||
Adobe Systems, Inc. (a) (b) | 4,698 | 483,659 | ||||||
Autodesk, Inc. (a) (b) | 1,798 | 133,070 | ||||||
CA, Inc. (a) | 2,950 | 93,722 | ||||||
Cerner Corp. (a) (b) | 2,921 | 138,368 | ||||||
Citrix Systems, Inc. (a) (b) | 1,432 | 127,892 | ||||||
The Dun & Bradstreet Corp. (a) | 369 | 44,767 | ||||||
Electronic Arts, Inc. (a) (b) | 2,807 | 221,079 | ||||||
Fidelity National Information Services, Inc. (a) | 3,110 | 235,240 | ||||||
Fiserv, Inc. (a) (b) | 2,068 | 219,787 | ||||||
Intuit, Inc. (a) | 2,304 | 264,061 | ||||||
Microsoft Corp. (a) | 73,254 | 4,552,004 | ||||||
Oracle Corp. (a) | 28,292 | 1,087,827 | ||||||
Red Hat, Inc. (a) (b) | 1,705 | 118,838 | ||||||
Salesforce.com, Inc. (a) (b) | 6,050 | 414,183 | ||||||
|
| |||||||
| 8,370,693 | ||||||||
|
| |||||||
| 23,792,995 | ||||||||
|
| |||||||
| Utilities — 3.1% | ||||||||
| Electric — 2.9% | ||||||||
The AES Corp. (a) | 6,577 | 76,425 | ||||||
Alliant Energy Corp. (a) | 2,106 | 79,796 | ||||||
Ameren Corp. (a) | 2,172 | 113,943 | ||||||
American Electric Power Co., Inc. (a) | 4,666 | 293,771 | ||||||
CenterPoint Energy, Inc. (a) | 3,953 | 97,402 | ||||||
CMS Energy Corp. (a) | 2,363 | 98,348 | ||||||
Consolidated Edison, Inc. (a) | 2,870 | 211,462 | ||||||
Dominion Resources, Inc. (a) | 5,960 | 456,476 | ||||||
DTE Energy Co. (a) | 1,586 | 156,237 | ||||||
Duke Energy Corp. (a) | 6,496 | 504,220 | ||||||
Edison International (a) | 3,085 | 222,089 | ||||||
Entergy Corp. (a) | 1,775 | 130,409 | ||||||
Eversource Energy (a) | 2,879 | 159,007 | ||||||
Exelon Corp. (a) | 8,678 | 307,982 | ||||||
| Number of Shares | Value | |||||||
FirstEnergy Corp. (a) | 3,938 | $ | 121,960 | |||||
NextEra Energy, Inc. (a) | 4,383 | 523,593 | ||||||
NRG Energy, Inc. (a) | 3,280 | 40,213 | ||||||
PG&E Corp. (a) | 4,659 | 283,128 | ||||||
Pinnacle West Capital Corp. (a) | 1,123 | 87,628 | ||||||
PPL Corp. (a) | 6,559 | 223,334 | ||||||
Public Service Enterprise Group, Inc. (a) | 4,720 | 207,114 | ||||||
SCANA Corp. (a) | 1,440 | 105,523 | ||||||
The Southern Co. (a) | 9,165 | 450,826 | ||||||
WEC Energy Group, Inc. (a) | 2,841 | 166,625 | ||||||
Xcel Energy, Inc. (a) | 4,739 | 192,877 | ||||||
|
| |||||||
| 5,310,388 | ||||||||
|
| |||||||
| Gas — 0.1% | ||||||||
NiSource, Inc. (a) | 3,193 | 70,693 | ||||||
Sempra Energy (a) | 2,344 | 235,900 | ||||||
|
| |||||||
| 306,593 | ||||||||
|
| |||||||
| Water — 0.1% | ||||||||
American Water Works Co., Inc. (a) | 1,653 | 119,611 | ||||||
|
| |||||||
| 5,736,592 | ||||||||
|
| |||||||
| TOTAL COMMON STOCK (Cost $152,504,124) | 181,760,804 | |||||||
|
| |||||||
| TOTAL EQUITIES (Cost $152,504,124) | 181,760,804 | |||||||
|
| |||||||
| Principal Amount | ||||||||
| BONDS & NOTES — 0.0% | ||||||||
| CORPORATE DEBT — 0.0% | ||||||||
| Forest Products & Paper — 0.0% | ||||||||
Sino Forest Corp. (a) (c) | $ | 359,000 | - | |||||
|
| |||||||
| TOTAL CORPORATE DEBT (Cost $0) | - | |||||||
|
| |||||||
| TOTAL BONDS & NOTES (Cost $0) | - | |||||||
|
| |||||||
| Units | ||||||||
| PURCHASED OPTIONS — 0.4% | ||||||||
| Financial — 0.4% | ||||||||
| Diversified Financial — 0.4% | ||||||||
S&P 500 Index, Put, Expires 01/20/17, Strike 2,000.00 | 98 | 10,290 | ||||||
S&P 500 Index, Put, Expires 01/20/17, Strike 2,050.00 | 119 | 18,802 | ||||||
S&P 500 Index, Put, Expires 02/17/17, Strike 2,025.00 | 182 | 118,300 | ||||||
The accompanying notes are an integral part of the financial statements.
102
Table of Contents
MML Managed Volatility Fund – Portfolio of Investments (Continued)
| Units | Value | |||||||
S&P 500 Index, Put, Expires 02/21/17, Strike 1,975.00 | 82 | $ | 31,406 | |||||
S&P 500 Index, Put, Expires 03/17/17, Strike 2,000.00 | 137 | 164,400 | ||||||
S&P 500 Index, Put, Expires 03/17/17, Strike 2,075.00 | 186 | 353,772 | ||||||
|
| |||||||
| 696,970 | ||||||||
|
| |||||||
| TOTAL PURCHASED OPTIONS (Cost $1,171,700) | 696,970 | |||||||
|
| |||||||
| TOTAL LONG-TERM INVESTMENTS (Cost $153,675,824) | 182,457,774 | |||||||
|
| |||||||
| Principal Amount | ||||||||
| SHORT-TERM INVESTMENTS — 2.8% | ||||||||
| Repurchase Agreement — 2.8% | ||||||||
State Street Bank & Trust Co. Repurchase Agreement, dated 12/30/16, 0.010%, due 1/03/17 (d) | $ | 5,163,935 | 5,163,935 | |||||
|
| |||||||
| Time Deposit — 0.0% | ||||||||
Euro Time Deposit | 1,188 | 1,188 | ||||||
|
| |||||||
| TOTAL SHORT-TERM INVESTMENTS (Cost $5,165,123) | 5,165,123 | |||||||
|
| |||||||
| TOTAL INVESTMENTS — 101.9% (Cost $158,840,947) (e) | 187,622,897 | |||||||
| Other Assets/(Liabilities) — (1.9)% | (3,516,941 | ) | ||||||
|
| |||||||
| NET ASSETS — 100.0% | $ | 184,105,956 | ||||||
|
| |||||||
Notes to Portfolio of Investments
Percentages are stated as a percent of net assets.
| (a) | All or a portion of these securities are pledged as collateral for written options. (Note 2). |
| (b) | Non-income producing security. |
| (c) | This security is fair valued in good faith in accordance with procedures approved by the Board of Trustees. At December 31, 2016, these securities amounted to a value of $0 or 0.00% of net assets. |
| (d) | Maturity value of $5,163,941. Collateralized by U.S. Government Agency obligations with a rate of 3.125%, maturity date of 5/15/21, and an aggregate market value, including accrued interest, of $5,270,463. |
| (e) | See Note 6 for aggregate cost for federal tax purposes. |
The accompanying notes are an integral part of the financial statements.
103
Table of Contents
MML Mid Cap Growth Fund – Portfolio of Investments
December 31, 2016
| Number of Shares | Value | |||||||
| EQUITIES — 96.4% | ||||||||
| COMMON STOCK — 95.9% | ||||||||
| Basic Materials — 3.5% | ||||||||
| Chemicals — 3.0% | ||||||||
Air Products & Chemicals, Inc. | 34,000 | $ | 4,889,880 | |||||
Ashland Global Holdings, Inc. | 27,000 | 2,950,830 | ||||||
RPM International, Inc. | 69,000 | 3,714,270 | ||||||
Valvoline, Inc. | 47,000 | 1,010,500 | ||||||
|
| |||||||
| 12,565,480 | ||||||||
|
| |||||||
| Mining — 0.5% | ||||||||
Franco-Nevada Corp. | 38,000 | 2,270,880 | ||||||
|
| |||||||
| 14,836,360 | ||||||||
|
| |||||||
| Communications — 4.4% | ||||||||
| Internet — 2.0% | ||||||||
Dropbox, Inc. (a) (b) | 9,011 | 86,776 | ||||||
Equinix, Inc. | 1,000 | 357,410 | ||||||
Match Group, Inc. (b) (c) | 48,686 | 832,530 | ||||||
TripAdvisor, Inc. (b) | 26,000 | 1,205,620 | ||||||
VeriSign, Inc. (b) (c) | 60,000 | 4,564,200 | ||||||
Zillow Group, Inc. Class A (b) | 18,000 | 656,100 | ||||||
Zillow Group, Inc. Class C (b) (c) | 25,000 | 911,750 | ||||||
|
| |||||||
| 8,614,386 | ||||||||
|
| |||||||
| Media — 0.4% | ||||||||
FactSet Research Systems, Inc. | 10,000 | 1,634,300 | ||||||
|
| |||||||
| Telecommunications — 2.0% | ||||||||
DigitalGlobe, Inc. (b) | 96,000 | 2,750,400 | ||||||
Palo Alto Networks, Inc. (b) | 3,000 | 375,150 | ||||||
SBA Communications Corp. Class A (b) | 7,000 | 722,820 | ||||||
T-Mobile US, Inc. (b) | 76,000 | 4,370,760 | ||||||
|
| |||||||
| 8,219,130 | ||||||||
|
| |||||||
| 18,467,816 | ||||||||
|
| |||||||
| Consumer, Cyclical — 16.0% | ||||||||
| Apparel — 0.9% | ||||||||
Carter’s, Inc. | 24,000 | 2,073,360 | ||||||
Hanesbrands, Inc. | 68,000 | 1,466,760 | ||||||
|
| |||||||
| 3,540,120 | ||||||||
|
| |||||||
| Auto Manufacturers — 0.7% | ||||||||
Ferrari NV | 26,000 | 1,511,640 | ||||||
Tesla Motors, Inc. (b) | 6,000 | 1,282,140 | ||||||
|
| |||||||
| 2,793,780 | ||||||||
|
| |||||||
| Automotive & Parts — 0.3% | ||||||||
WABCO Holdings, Inc. (b) | 13,000 | 1,379,950 | ||||||
|
| |||||||
| Entertainment — 0.3% | ||||||||
Vail Resorts, Inc. | 7,864 | 1,268,542 | ||||||
|
| |||||||
| Home Furnishing — 0.5% | ||||||||
Harman International Industries, Inc. | 19,000 | 2,112,040 | ||||||
|
| |||||||
| Number of Shares | Value | |||||||
| Leisure Time — 2.2% | ||||||||
Norwegian Cruise Line Holdings Ltd. (b) | 153,000 | $ | 6,507,090 | |||||
Royal Caribbean Cruises Ltd. | 36,000 | 2,953,440 | ||||||
|
| |||||||
| 9,460,530 | ||||||||
|
| |||||||
| Lodging — 2.3% | ||||||||
Choice Hotels International, Inc. | 17,000 | 952,850 | ||||||
Marriott International, Inc. Class A | 77,000 | 6,366,360 | ||||||
MGM Resorts International (b) | 89,000 | 2,565,870 | ||||||
|
| |||||||
| 9,885,080 | ||||||||
|
| |||||||
| Retail — 8.8% | ||||||||
AutoZone, Inc. (b) | 8,500 | 6,713,215 | ||||||
Burlington Stores, Inc. (b) | 26,000 | 2,203,500 | ||||||
CarMax, Inc. (b) (c) | 81,000 | 5,215,590 | ||||||
Coach, Inc. | 123,000 | 4,307,460 | ||||||
Dick’s Sporting Goods, Inc. | 31,000 | 1,646,100 | ||||||
Dollar General Corp. | 86,000 | 6,370,020 | ||||||
L Brands, Inc. | 38,000 | 2,501,920 | ||||||
The Michaels Cos., Inc. (b) | 128,000 | 2,617,600 | ||||||
O’Reilly Automotive, Inc. (b) | 16,000 | 4,454,560 | ||||||
PVH Corp. | 15,000 | 1,353,600 | ||||||
|
| |||||||
| 37,383,565 | ||||||||
|
| |||||||
| 67,823,607 | ||||||||
|
| |||||||
| Consumer, Non-cyclical — 28.8% | ||||||||
| Biotechnology — 2.6% | ||||||||
Alkermes PLC (b) | 94,000 | 5,224,520 | ||||||
Illumina, Inc. (b) | 17,000 | 2,176,680 | ||||||
Incyte Corp. (b) | 19,000 | 1,905,130 | ||||||
Vertex Pharmaceuticals, Inc. (b) | 21,000 | 1,547,070 | ||||||
|
| |||||||
| 10,853,400 | ||||||||
|
| |||||||
| Commercial Services — 9.7% | ||||||||
Aramark | 77,000 | 2,750,440 | ||||||
Equifax, Inc. | 49,605 | 5,864,799 | ||||||
FleetCor Technologies, Inc. (b) | 27,000 | 3,821,040 | ||||||
Gartner, Inc. (b) | 23,000 | 2,324,610 | ||||||
Global Payments, Inc. | 68,000 | 4,719,880 | ||||||
IHS Markit Ltd. (b) | 149,000 | 5,276,090 | ||||||
KAR Auction Services, Inc. | 68,000 | 2,898,160 | ||||||
ManpowerGroup, Inc. | 8,000 | 710,960 | ||||||
Sabre Corp. | 102,000 | 2,544,900 | ||||||
TransUnion (b) | 25,000 | 773,250 | ||||||
Vantiv, Inc. Class A (b) | 76,000 | 4,531,120 | ||||||
Verisk Analytics, Inc. (b) | 55,000 | 4,464,350 | ||||||
Wework Cos., Inc. Class A (a) | 12,099 | 392,008 | ||||||
|
| |||||||
| 41,071,607 | ||||||||
|
| |||||||
| Foods — 2.2% | ||||||||
Blue Buffalo Pet Products, Inc. (b) | 52,000 | 1,250,080 | ||||||
Conagra Brands, Inc. | 77,000 | 3,045,350 | ||||||
Sprouts Farmers Market, Inc. (b) | 117,312 | 2,219,543 | ||||||
The accompanying notes are an integral part of the financial statements.
104
Table of Contents
MML Mid Cap Growth Fund – Portfolio of Investments (Continued)
| Number of Shares | Value | |||||||
TreeHouse Foods, Inc. (b) | 38,000 | $ | 2,743,220 | |||||
|
| |||||||
| 9,258,193 | ||||||||
|
| |||||||
| Health Care – Products — 8.4% | ||||||||
Bruker Corp. | 158,000 | 3,346,440 | ||||||
The Cooper Cos., Inc. | 31,000 | 5,422,830 | ||||||
Henry Schein, Inc. (b) | 21,000 | 3,185,910 | ||||||
Hologic, Inc. (b) | 174,000 | 6,980,880 | ||||||
IDEXX Laboratories, Inc. (b) | 21,000 | 2,462,670 | ||||||
Intuitive Surgical, Inc. (b) | 7,000 | 4,439,190 | ||||||
Teleflex, Inc. | 47,000 | 7,574,050 | ||||||
West Pharmaceutical Services, Inc. | 28,000 | 2,375,240 | ||||||
|
| |||||||
| 35,787,210 | ||||||||
|
| |||||||
| Health Care – Services — 4.2% | ||||||||
Acadia Healthcare Co., Inc. (b) | 44,000 | 1,456,400 | ||||||
Catalent, Inc. (b) | 112,000 | 3,019,520 | ||||||
DENTSPLY SIRONA, Inc. | 85,000 | 4,907,050 | ||||||
Envision Healthcare Corp. (b) | 47,000 | 2,974,630 | ||||||
MEDNAX, Inc. (b) | 85,000 | 5,666,100 | ||||||
|
| |||||||
| 18,023,700 | ||||||||
|
| |||||||
| Pharmaceuticals — 1.7% | ||||||||
Alnylam Pharmaceuticals, Inc. (b) | 21,000 | 786,240 | ||||||
Neurocrine Biosciences, Inc. (b) | 8,000 | 309,600 | ||||||
Quintiles IMS Holdings, Inc. (b) | 30,000 | 2,281,500 | ||||||
TESARO, Inc. (b) (c) | 8,000 | 1,075,840 | ||||||
Zoetis, Inc. | 51,000 | 2,730,030 | ||||||
|
| |||||||
| 7,183,210 | ||||||||
|
| |||||||
| 122,177,320 | ||||||||
|
| |||||||
| Energy — 1.7% | ||||||||
| Oil & Gas — 1.7% | ||||||||
ARC Resources Ltd. (c) | 68,000 | 1,170,432 | ||||||
Centennial Resource Development, Inc. (a) (b) | 19,204 | 349,133 | ||||||
Cimarex Energy Co. | 7,000 | 951,300 | ||||||
Concho Resources, Inc. (b) | 9,000 | 1,193,400 | ||||||
EQT Corp. | 55,000 | 3,597,000 | ||||||
|
| |||||||
| 7,261,265 | ||||||||
|
| |||||||
| Financial — 9.9% | ||||||||
| Commercial Services — 0.7% | ||||||||
CoreLogic, Inc. (b) | 86,000 | 3,167,380 | ||||||
|
| |||||||
| Diversified Financial — 6.0% | ||||||||
Bats Global Markets, Inc. | 25,000 | 837,750 | ||||||
CBOE Holdings, Inc. | 68,000 | 5,024,520 | ||||||
E*TRADE Financial Corp. (b) | 59,000 | 2,044,350 | ||||||
FNF Group | 187,000 | 6,350,520 | ||||||
Intercontinental Exchange, Inc. | 94,000 | 5,303,480 | ||||||
TD Ameritrade Holding Corp. | 132,000 | 5,755,200 | ||||||
|
| |||||||
| 25,315,820 | ||||||||
|
| |||||||
| Insurance — 3.0% | ||||||||
The Progressive Corp. | 132,000 | 4,686,000 | ||||||
| Number of Shares | Value | |||||||
Willis Towers Watson PLC | 66,000 | $ | 8,070,480 | |||||
|
| |||||||
| 12,756,480 | ||||||||
|
| |||||||
| Real Estate — 0.2% | ||||||||
Jones Lang LaSalle, Inc. | 9,000 | 909,360 | ||||||
|
| |||||||
| 42,149,040 | ||||||||
|
| |||||||
| Industrial — 19.9% | ||||||||
| Aerospace & Defense — 2.1% | ||||||||
Harris Corp. | 51,000 | 5,225,970 | ||||||
Rockwell Collins, Inc. | 40,000 | 3,710,400 | ||||||
|
| |||||||
| 8,936,370 | ||||||||
|
| |||||||
| Building Materials — 0.8% | ||||||||
Martin Marietta Materials, Inc. | 15,000 | 3,322,950 | ||||||
|
| |||||||
| Electrical Components & Equipment — 0.5% | ||||||||
Acuity Brands, Inc. | 9,000 | 2,077,740 | ||||||
|
| |||||||
| Electronics — 5.7% | ||||||||
Agilent Technologies, Inc. | 119,000 | 5,421,640 | ||||||
Allegion PLC | 65,000 | 4,160,000 | ||||||
Fortive Corp. | 63,000 | 3,378,690 | ||||||
Keysight Technologies, Inc. (b) | 130,000 | 4,754,100 | ||||||
Mettler-Toledo International, Inc. (b) | 4,000 | 1,674,240 | ||||||
Sensata Technologies Holding NV (b) | 119,000 | 4,635,050 | ||||||
|
| |||||||
| 24,023,720 | ||||||||
|
| |||||||
| Environmental Controls — 1.3% | ||||||||
Stericycle, Inc. (b) | 11,106 | 855,606 | ||||||
Waste Connections, Inc. | 60,000 | 4,715,400 | ||||||
|
| |||||||
| 5,571,006 | ||||||||
|
| |||||||
| Machinery – Diversified — 4.5% | ||||||||
Cognex Corp. | 21,000 | 1,336,020 | ||||||
IDEX Corp. | 71,000 | 6,394,260 | ||||||
The Middleby Corp. (b) | 15,000 | 1,932,150 | ||||||
Roper Technologies, Inc. | 34,000 | 6,224,720 | ||||||
Xylem, Inc. | 64,000 | 3,169,280 | ||||||
|
| |||||||
| 19,056,430 | ||||||||
|
| |||||||
| Manufacturing — 2.6% | ||||||||
Colfax Corp. (b) | 38,000 | 1,365,340 | ||||||
Textron, Inc. | 196,000 | 9,517,760 | ||||||
|
| |||||||
| 10,883,100 | ||||||||
|
| |||||||
| Packaging & Containers — 1.0% | ||||||||
Ball Corp. | 60,000 | 4,504,200 | ||||||
|
| |||||||
| Transportation — 1.4% | ||||||||
J.B. Hunt Transport Services, Inc. | 17,000 | 1,650,190 | ||||||
Kansas City Southern | 43,000 | 3,648,550 | ||||||
Old Dominion Freight Line, Inc. (b) | 8,000 | 686,320 | ||||||
|
| |||||||
| 5,985,060 | ||||||||
|
| |||||||
| 84,360,576 | ||||||||
|
| |||||||
The accompanying notes are an integral part of the financial statements.
105
Table of Contents
MML Mid Cap Growth Fund – Portfolio of Investments (Continued)
| Number of Shares | Value | |||||||
| Technology — 11.7% | ||||||||
| Computers — 0.4% | ||||||||
CSRA, Inc. | 56,103 | $ | 1,786,319 | |||||
|
| |||||||
| Semiconductors — 3.2% | ||||||||
KLA-Tencor Corp. | 17,000 | 1,337,560 | ||||||
Microchip Technology, Inc. | 111,000 | 7,120,650 | ||||||
NXP Semiconductor NV (b) | 30,000 | 2,940,300 | ||||||
Xilinx, Inc. | 35,000 | 2,112,950 | ||||||
|
| |||||||
| 13,511,460 | ||||||||
|
| |||||||
| Software — 8.1% | ||||||||
Atlassian Corp. PLC Class A (b) | 72,000 | 1,733,760 | ||||||
Black Knight Financial Services, Inc. Class A (b) (c) | 2,955 | 111,699 | ||||||
Electronic Arts, Inc. (b) | 26,000 | 2,047,760 | ||||||
Fidelity National Information Services, Inc. | 31,000 | 2,344,840 | ||||||
Fiserv, Inc. (b) | 89,000 | 9,458,920 | ||||||
Guidewire Software, Inc. (b) | 19,000 | 937,270 | ||||||
MSCI, Inc. | 34,000 | 2,678,520 | ||||||
Red Hat, Inc. (b) | 72,000 | 5,018,400 | ||||||
ServiceNow, Inc. (b) | 17,000 | 1,263,780 | ||||||
Splunk, Inc. (b) | 34,000 | 1,739,100 | ||||||
SS&C Technologies Holdings, Inc | 69,000 | 1,973,400 | ||||||
Tableau Software, Inc. Class A (b) | 30,000 | 1,264,500 | ||||||
Veeva Systems, Inc. Class A (b) | 52,000 | 2,116,400 | ||||||
Workday, Inc. Class A (b) | 26,000 | 1,718,340 | ||||||
|
| |||||||
| 34,406,689 | ||||||||
|
| |||||||
| 49,704,468 | ||||||||
|
| |||||||
| TOTAL COMMON STOCK (Cost $303,438,872) | 406,780,452 | |||||||
|
| |||||||
| PREFERRED STOCK — 0.5% | ||||||||
| Communications — 0.2% | ||||||||
| Internet — 0.2% | ||||||||
Dropbox, Inc. Series A (a) (b) | 11,190 | 107,760 | ||||||
Dropbox, Inc. Series A 1 (a) (b) | 54,965 | 529,313 | ||||||
|
| |||||||
| 637,073 | ||||||||
|
| |||||||
| Consumer, Non-cyclical — 0.3% | ||||||||
| Commercial Services — 0.3% | ||||||||
Wework, Inc. Series D 1 (a) (b) | 22,197 | 719,183 | ||||||
Wework, Inc. Series D 2 (a) (b) | 17,440 | 565,056 | ||||||
|
| |||||||
| 1,284,239 | ||||||||
|
| |||||||
| TOTAL PREFERRED STOCK (Cost $1,258,645) | 1,921,312 | |||||||
|
| |||||||
| TOTAL EQUITIES (Cost $304,697,517) | 408,701,764 | |||||||
|
| |||||||
| Number of Shares | Value | |||||||
| MUTUAL FUNDS — 2.9% | ||||||||
| Diversified Financial — 2.9% | ||||||||
State Street Navigator Securities Lending Prime Portfolio (d) | 11,944,642 | $ | 11,944,642 | |||||
T. Rowe Price Government Reserve Investment Fund | 500,780 | 500,780 | ||||||
|
| |||||||
| TOTAL MUTUAL FUNDS (Cost $12,445,422) | 12,445,422 | |||||||
|
| |||||||
| TOTAL LONG-TERM INVESTMENTS (Cost $317,142,939) | 421,147,186 | |||||||
|
| |||||||
| Principal Amount | ||||||||
| SHORT-TERM INVESTMENTS — 3.7% | ||||||||
| Repurchase Agreement — 3.7% | ||||||||
State Street Bank & Trust Co. Repurchase Agreement, dated 12/30/16, 0.010%, due 1/03/17 (e) | $ | 15,573,326 | 15,573,326 | |||||
|
| |||||||
| TOTAL SHORT-TERM INVESTMENTS (Cost $15,573,326) | 15,573,326 | |||||||
|
| |||||||
| TOTAL INVESTMENTS — 103.0% (Cost $332,716,265) (f) | 436,720,512 | |||||||
| Other Assets/(Liabilities) — (3.0)% | (12,739,957 | ) | ||||||
|
| |||||||
| NET ASSETS — 100.0% | $ | 423,980,555 | ||||||
|
| |||||||
Notes to Portfolio of Investments
Percentages are stated as a percent of net assets.
| (a) | This security is fair valued in good faith in accordance with procedures approved by the Board of Trustees. At December 31, 2016, these securities amounted to a value of $2,749,229 or 0.65% of net assets. |
| (b) | Non-income producing security. |
| (c) | Denotes all or a portion of security on loan. The total value of securities on loan as of December 31, 2016, was $11,665,878 or 2.75% of net assets. Total securities on loan may not correspond with the amounts identified in the Portfolio of Investments because pending sales may be in the process of recall from the brokers. (Note 2). |
| (d) | Represents investment of security lending collateral. (Note 2). |
| (e) | Maturity value of $15,573,344. Collateralized by U.S. Government Agency obligations with a rate of 3.125%, maturity date of 5/15/19, and an aggregate market value, including accrued interest, of $15,888,284. |
| (f) | See Note 6 for aggregate cost for federal tax purposes. |
The accompanying notes are an integral part of the financial statements.
106
Table of Contents
MML Mid Cap Value Fund – Portfolio of Investments
December 31, 2016
| Number of Shares | Value | |||||||
| EQUITIES — 95.7% | ||||||||
| COMMON STOCK — 95.7% | ||||||||
| Basic Materials — 0.2% | ||||||||
| Iron & Steel — 0.2% | ||||||||
Nucor Corp. | 15,595 | $ | 928,213 | |||||
|
| |||||||
| Communications — 0.7% | ||||||||
| Telecommunications — 0.7% | ||||||||
Level 3 Communications, Inc. (a) | 62,850 | 3,542,226 | ||||||
|
| |||||||
| Consumer, Cyclical — 7.2% | ||||||||
| Apparel — 0.5% | ||||||||
Ralph Lauren Corp. | 27,070 | 2,444,962 | ||||||
|
| |||||||
| Auto Manufacturers — 1.1% | ||||||||
Honda Motor Co. Ltd. Sponsored ADR (Japan) | 140,915 | 4,113,309 | ||||||
Oshkosh Corp. | 14,508 | 937,362 | ||||||
|
| |||||||
| 5,050,671 | ||||||||
|
| |||||||
| Automotive & Parts — 1.0% | ||||||||
Delphi Automotive PLC | 70,994 | 4,781,446 | ||||||
|
| |||||||
| Home Builders — 0.7% | ||||||||
PulteGroup, Inc. | 191,721 | 3,523,832 | ||||||
|
| |||||||
| Leisure Time — 0.7% | ||||||||
Carnival Corp. | 65,012 | 3,384,525 | ||||||
|
| |||||||
| Retail — 2.8% | ||||||||
Advance Auto Parts, Inc. | 30,585 | 5,172,535 | ||||||
CST Brands, Inc. | 81,114 | 3,905,639 | ||||||
Target Corp. | 62,710 | 4,529,544 | ||||||
|
| |||||||
| 13,607,718 | ||||||||
|
| |||||||
| Toys, Games & Hobbies — 0.4% | ||||||||
Mattel, Inc. | 63,815 | 1,758,103 | ||||||
|
| |||||||
| 34,551,257 | ||||||||
|
| |||||||
| Consumer, Non-cyclical — 15.0% | ||||||||
| Foods — 6.2% | ||||||||
Conagra Brands, Inc. | 168,836 | 6,677,464 | ||||||
General Mills, Inc. | 59,541 | 3,677,847 | ||||||
The J.M. Smucker Co. | 24,299 | 3,111,730 | ||||||
Kellogg Co. | 53,870 | 3,970,758 | ||||||
Lamb Weston Holdings, Inc. (a) | 48,623 | 1,840,380 | ||||||
Mondelez International, Inc. Class A | 136,930 | 6,070,107 | ||||||
Sysco Corp. | 72,799 | 4,030,881 | ||||||
|
| |||||||
| 29,379,167 | ||||||||
|
| |||||||
| Health Care – Products — 3.8% | ||||||||
Abbott Laboratories | 73,961 | 2,840,842 | ||||||
Baxter International, Inc. | 71,827 | 3,184,809 | ||||||
STERIS PLC | 49,027 | 3,303,930 | ||||||
Zimmer Biomet Holdings, Inc. | 84,229 | 8,692,433 | ||||||
|
| |||||||
| 18,022,014 | ||||||||
|
| |||||||
| Number of Shares | Value | |||||||
| Health Care – Services — 2.7% | ||||||||
HCA Holdings, Inc. (a) | 19,549 | $ | 1,447,017 | |||||
LifePoint Health, Inc. (a) | 128,256 | 7,284,941 | ||||||
Quest Diagnostics, Inc. | 44,249 | 4,066,483 | ||||||
|
| |||||||
| 12,798,441 | ||||||||
|
| |||||||
| Pharmaceuticals — 2.3% | ||||||||
Cardinal Health, Inc. | 49,460 | 3,559,636 | ||||||
Express Scripts Holding Co. (a) | 34,992 | 2,407,100 | ||||||
McKesson Corp. | 19,234 | 2,701,415 | ||||||
Mead Johnson Nutrition Co. | 35,066 | 2,481,270 | ||||||
|
| |||||||
| 11,149,421 | ||||||||
|
| |||||||
| 71,349,043 | ||||||||
|
| |||||||
| Energy — 13.1% | ||||||||
| Oil & Gas — 8.9% | ||||||||
Anadarko Petroleum Corp. | 91,414 | 6,374,298 | ||||||
Cimarex Energy Co. | 14,367 | 1,952,475 | ||||||
Devon Energy Corp. | 102,591 | 4,685,331 | ||||||
EQT Corp. | 118,104 | 7,724,002 | ||||||
Imperial Oil Ltd. | 241,356 | 8,396,633 | ||||||
Noble Energy, Inc. | 194,438 | 7,400,310 | ||||||
Occidental Petroleum Corp. | 79,915 | 5,692,345 | ||||||
|
| |||||||
| 42,225,394 | ||||||||
|
| |||||||
| Oil & Gas Services — 3.9% | ||||||||
Baker Hughes, Inc. | 115,441 | 7,500,202 | ||||||
FMC Technologies, Inc. (a) | 33,990 | 1,207,665 | ||||||
Frank’s International NV | 170,360 | 2,097,132 | ||||||
Halliburton Co. | 69,635 | 3,766,557 | ||||||
National Oilwell Varco, Inc. | 113,619 | 4,253,895 | ||||||
|
| |||||||
| 18,825,451 | ||||||||
|
| |||||||
| Pipelines — 0.3% | ||||||||
Spectra Energy Partners LP | 26,917 | 1,233,875 | ||||||
|
| |||||||
| 62,284,720 | ||||||||
|
| |||||||
| Financial — 27.7% | ||||||||
| Banks — 12.8% | ||||||||
Bank of Hawaii Corp. | 37,480 | 3,324,101 | ||||||
BB&T Corp. | 133,837 | 6,293,016 | ||||||
Comerica, Inc. | 54,586 | 3,717,853 | ||||||
Commerce Bancshares, Inc. | 92,745 | 5,361,588 | ||||||
M&T Bank Corp. | 34,087 | 5,332,229 | ||||||
Northern Trust Corp. | 168,603 | 15,014,097 | ||||||
The PNC Financial Services Group, Inc. | 55,222 | 6,458,765 | ||||||
State Street Corp. | 50,194 | 3,901,078 | ||||||
SunTrust Banks, Inc. | 66,637 | 3,655,039 | ||||||
UMB Financial Corp. | 38,706 | 2,985,007 | ||||||
Westamerica Bancorp. | 75,031 | 4,721,701 | ||||||
|
| |||||||
| 60,764,474 | ||||||||
|
| |||||||
The accompanying notes are an integral part of the financial statements.
107
Table of Contents
MML Mid Cap Value Fund – Portfolio of Investments (Continued)
| Number of Shares | Value | |||||||
| Diversified Financial — 2.7% | ||||||||
Ameriprise Financial, Inc. | 39,334 | $ | 4,363,714 | |||||
Invesco Ltd. | 169,216 | 5,134,014 | ||||||
T. Rowe Price Group, Inc. | 45,817 | 3,448,187 | ||||||
|
| |||||||
| 12,945,915 | ||||||||
|
| |||||||
| Insurance — 7.0% | ||||||||
Aflac, Inc. | 33,395 | 2,324,292 | ||||||
The Allstate Corp. | 26,604 | 1,971,888 | ||||||
Brown & Brown, Inc. | 92,105 | 4,131,830 | ||||||
Chubb Ltd. | 52,039 | 6,875,393 | ||||||
MetLife, Inc. | 65,961 | 3,554,638 | ||||||
ProAssurance Corp. | 44,093 | 2,478,027 | ||||||
Reinsurance Group of America, Inc. | 43,526 | 5,476,877 | ||||||
Torchmark Corp. | 24,074 | 1,775,698 | ||||||
Unum Group | 111,797 | 4,911,242 | ||||||
|
| |||||||
| 33,499,885 | ||||||||
|
| |||||||
| Real Estate Investment Trusts (REITS) — 4.2% | ||||||||
Boston Properties, Inc. | 2,595 | 326,399 | ||||||
Empire State Realty Trust, Inc. Class A | 95,051 | 1,919,080 | ||||||
Host Hotels & Resorts, Inc. | 174,676 | 3,290,896 | ||||||
MGM Growth Properties LLC Class A | 102,131 | 2,584,935 | ||||||
Piedmont Office Realty Trust, Inc. Class A | 190,792 | 3,989,461 | ||||||
Welltower, Inc. | 6,203 | 415,167 | ||||||
Weyerhaeuser Co. | 243,632 | 7,330,887 | ||||||
|
| |||||||
| 19,856,825 | ||||||||
|
| |||||||
| Savings & Loans — 1.0% | ||||||||
Capitol Federal Financial, Inc. | 298,428 | 4,912,125 | ||||||
|
| |||||||
| 131,979,224 | ||||||||
|
| |||||||
| Industrial — 18.5% | ||||||||
| Electrical Components & Equipment — 2.0% | ||||||||
Emerson Electric Co. | 62,779 | 3,499,929 | ||||||
Hubbell, Inc. | 50,148 | 5,852,272 | ||||||
|
| |||||||
| 9,352,201 | ||||||||
|
| |||||||
| Electronics — 6.0% | ||||||||
Johnson Controls International PLC | 313,941 | 12,931,230 | ||||||
Keysight Technologies, Inc. (a) | 150,681 | 5,510,404 | ||||||
Koninklijke Philips Electronics NV | 181,625 | 5,536,114 | ||||||
TE Connectivity Ltd. | 68,096 | 4,717,691 | ||||||
|
| |||||||
| 28,695,439 | ||||||||
|
| |||||||
| Environmental Controls — 1.5% | ||||||||
Clean Harbors, Inc. (a) | 21,682 | 1,206,603 | ||||||
Republic Services, Inc. | 105,675 | 6,028,759 | ||||||
|
| |||||||
| 7,235,362 | ||||||||
|
| |||||||
| Machinery – Construction & Mining — 1.2% | ||||||||
Ingersoll-Rand PLC | 78,729 | 5,907,824 | ||||||
|
| |||||||
| Number of Shares | Value | |||||||
| Machinery – Diversified — 1.4% | ||||||||
Cummins, Inc. | 30,146 | $ | 4,120,054 | |||||
Rockwell Automation, Inc. | 19,105 | 2,567,712 | ||||||
|
| |||||||
| 6,687,766 | ||||||||
|
| |||||||
| Manufacturing — 2.0% | ||||||||
ITT, Inc. | 27,981 | 1,079,227 | ||||||
Parker Hannifin Corp. | 19,458 | 2,724,120 | ||||||
Textron, Inc. | 116,536 | 5,658,988 | ||||||
|
| |||||||
| 9,462,335 | ||||||||
|
| |||||||
| Packaging & Containers — 2.4% | ||||||||
Bemis Co., Inc. | 39,104 | 1,869,953 | ||||||
Sonoco Products Co. | 58,563 | 3,086,270 | ||||||
WestRock Co. | 125,092 | 6,350,921 | ||||||
|
| |||||||
| 11,307,144 | ||||||||
|
| |||||||
| Transportation — 2.0% | ||||||||
CSX Corp. | 121,683 | 4,372,070 | ||||||
Heartland Express, Inc. | 255,571 | 5,203,426 | ||||||
|
| |||||||
| 9,575,496 | ||||||||
|
| |||||||
| 88,223,567 | ||||||||
|
| |||||||
| Technology — 5.4% | ||||||||
| Computers — 0.5% | ||||||||
NetApp, Inc. | 73,031 | 2,575,804 | ||||||
|
| |||||||
| Semiconductors — 4.9% | ||||||||
Applied Materials, Inc. | 239,223 | 7,719,726 | ||||||
Lam Research Corp. | 45,726 | 4,834,610 | ||||||
Maxim Integrated Products, Inc. | 150,510 | 5,805,171 | ||||||
Teradyne, Inc. | 193,891 | 4,924,831 | ||||||
|
| |||||||
| 23,284,338 | ||||||||
|
| |||||||
| 25,860,142 | ||||||||
|
| |||||||
| Utilities — 7.9% | ||||||||
| Electric — 6.5% | ||||||||
Ameren Corp. | 65,646 | 3,443,789 | ||||||
Consolidated Edison, Inc. | 38,967 | 2,871,089 | ||||||
Edison International | 97,060 | 6,987,349 | ||||||
Eversource Energy | 36,580 | 2,020,313 | ||||||
NorthWestern Corp. | 50,583 | 2,876,655 | ||||||
PG&E Corp. | 109,032 | 6,625,875 | ||||||
Xcel Energy, Inc. | 153,726 | 6,256,648 | ||||||
|
| |||||||
| 31,081,718 | ||||||||
|
| |||||||
| Gas — 1.4% | ||||||||
Atmos Energy Corp. | 39,984 | 2,964,814 | ||||||
Spire, Inc. | 57,117 | 3,686,902 | ||||||
|
| |||||||
| 6,651,716 | ||||||||
|
| |||||||
| 37,733,434 | ||||||||
|
| |||||||
| TOTAL COMMON STOCK (Cost $389,690,435) | 456,451,826 | |||||||
|
| |||||||
| TOTAL EQUITIES (Cost $389,690,435) | 456,451,826 | |||||||
|
| |||||||
The accompanying notes are an integral part of the financial statements.
108
Table of Contents
MML Mid Cap Value Fund – Portfolio of Investments (Continued)
| Number of Shares | Value | |||||||
| MUTUAL FUNDS — 2.7% | ||||||||
| Diversified Financial — 2.7% | ||||||||
iShares Russell Mid-Cap Value ETF | 163,186 | $ | 13,125,050 | |||||
|
| |||||||
| TOTAL MUTUAL FUNDS (Cost $12,254,247) | 13,125,050 | |||||||
|
| |||||||
| TOTAL LONG-TERM INVESTMENTS (Cost $401,944,682) | 469,576,876 | |||||||
|
| |||||||
| Principal Amount | ||||||||
| SHORT-TERM INVESTMENTS — 1.7% | ||||||||
| Repurchase Agreement — 1.7% | ||||||||
State Street Bank & Trust Co. Repurchase Agreement, dated 12/30/16, 0.010%, due 1/03/17 (b) | $ | 8,006,866 | 8,006,866 | |||||
|
| |||||||
| Time Deposit — 0.0% | ||||||||
Euro Time Deposit | 32,346 | 32,346 | ||||||
|
| |||||||
| TOTAL SHORT-TERM INVESTMENTS (Cost $8,039,212) | 8,039,212 | |||||||
|
| |||||||
| TOTAL INVESTMENTS — 100.1% (Cost $409,983,894) (c) | 477,616,088 | |||||||
| Other Assets/(Liabilities) — (0.1)% | (422,107 | ) | ||||||
|
| |||||||
| NET ASSETS — 100.0% | $ | 477,193,981 | ||||||
|
| |||||||
Notes to Portfolio of Investments
Percentages are stated as a percent of net assets.
| ADR | American Depositary Receipt |
| ETF | Exchange-Traded Fund |
| (a) | Non-income producing security. |
| (b) | Maturity value of $8,006,875. Collateralized by U.S. Government Agency obligations with a rate of 3.125%, maturity date of 5/15/19, and an aggregate market value, including accrued interest, of $8,169,026. |
| (c) | See Note 6 for aggregate cost for federal tax purposes. |
The accompanying notes are an integral part of the financial statements.
109
Table of Contents
MML Small Cap Growth Equity Fund – Portfolio of Investments
December 31, 2016
| Number of Shares | Value | |||||||
| EQUITIES — 98.3% | ||||||||
| COMMON STOCK — 97.4% | ||||||||
| Basic Materials — 3.0% | ||||||||
| Chemicals — 2.8% | ||||||||
Ingevity Corp. (a) | 16,629 | $ | 912,267 | |||||
Methanex Corp. | 28,832 | 1,262,841 | ||||||
Minerals Technologies, Inc. | 11,737 | 906,683 | ||||||
Platform Specialty Products Corp. (a) | 155,058 | 1,521,119 | ||||||
PolyOne Corp. | 31,365 | 1,004,935 | ||||||
|
| |||||||
| 5,607,845 | ||||||||
|
| |||||||
| Forest Products & Paper — 0.2% | ||||||||
KapStone Paper and Packaging Corp. | 21,300 | 469,665 | ||||||
|
| |||||||
| 6,077,510 | ||||||||
|
| |||||||
| Communications — 5.9% | ||||||||
| Internet — 2.7% | ||||||||
Dropbox, Inc. (a) (b) | 10,469 | 100,816 | ||||||
GoDaddy, Inc. Class A (a) | 38,854 | 1,357,947 | ||||||
Just Eat PLC (a) | 101,567 | 729,588 | ||||||
Mimecast Ltd. (a) | 25,800 | 461,820 | ||||||
Stamps.com, Inc. (a) | 8,827 | 1,012,016 | ||||||
The Trade Desk, Inc. Class A (a) | 1,000 | 27,670 | ||||||
Wix.com Ltd. (a) | 23,355 | 1,040,465 | ||||||
Zillow Group, Inc. Class C (a) | 21,368 | 779,291 | ||||||
|
| |||||||
| 5,509,613 | ||||||||
|
| |||||||
| Media — 0.5% | ||||||||
The New York Times Co. Class A | 75,281 | 1,001,238 | ||||||
|
| |||||||
| Telecommunications — 2.7% | ||||||||
Arista Networks, Inc. (a) | 11,070 | 1,071,244 | ||||||
Ciena Corp. (a) | 50,976 | 1,244,324 | ||||||
Gigamon, Inc. (a) | 24,713 | 1,125,677 | ||||||
Oclaro, Inc. (a) | 78,800 | 705,260 | ||||||
ORBCOMM, Inc. (a) | 22,164 | 183,296 | ||||||
Vonage Holdings Corp. (a) | 169,756 | 1,162,829 | ||||||
|
| |||||||
| 5,492,630 | ||||||||
|
| |||||||
| 12,003,481 | ||||||||
|
| |||||||
| Consumer, Cyclical — 14.0% | ||||||||
| Airlines — 0.9% | ||||||||
Spirit Airlines, Inc. (a) | 31,891 | 1,845,213 | ||||||
|
| |||||||
| Apparel — 0.5% | ||||||||
Steven Madden Ltd. (a) | 30,700 | 1,097,525 | ||||||
|
| |||||||
| Automotive & Parts — 0.6% | ||||||||
Tenneco, Inc. (a) | 21,114 | 1,318,992 | ||||||
|
| |||||||
| Distribution & Wholesale — 0.8% | ||||||||
Beacon Roofing Supply, Inc. (a) | 15,904 | 732,697 | ||||||
WESCO International, Inc. (a) | 13,528 | 900,289 | ||||||
|
| |||||||
| 1,632,986 | ||||||||
|
| |||||||
| Entertainment — 1.6% | ||||||||
Cinemark Holdings, Inc. | 28,904 | 1,108,757 | ||||||
| Number of Shares | Value | |||||||
Marriott Vacations Worldwide Corp. | 11,514 | $ | 976,963 | |||||
National CineMedia, Inc. | 74,514 | 1,097,591 | ||||||
|
| |||||||
| 3,183,311 | ||||||||
|
| |||||||
| Home Furnishing — 0.5% | ||||||||
La-Z-Boy, Inc. | 35,023 | 1,087,464 | ||||||
|
| |||||||
| Leisure Time — 2.8% | ||||||||
Acushnet Holdings Corp. (a) | 37,961 | 748,211 | ||||||
ClubCorp Holdings, Inc. | 114,537 | 1,643,606 | ||||||
Fox Factory Holding Corp. (a) | 36,240 | 1,005,660 | ||||||
Lindblad Expeditions Holdings, Inc. (a) | 103,457 | 977,669 | ||||||
Planet Fitness, Inc. Class A | 67,202 | 1,350,760 | ||||||
|
| |||||||
| 5,725,906 | ||||||||
|
| |||||||
| Lodging — 0.5% | ||||||||
Hyatt Hotels Corp. Class A (a) | 17,991 | 994,183 | ||||||
|
| |||||||
| Retail — 5.8% | ||||||||
Bloomin’ Brands, Inc. | 59,672 | 1,075,886 | ||||||
The Cheesecake Factory, Inc. | 16,651 | 997,062 | ||||||
Chico’s FAS, Inc. | 65,772 | 946,459 | ||||||
Dick’s Sporting Goods, Inc. | 14,400 | 764,640 | ||||||
DSW, Inc. Class A | 32,279 | 731,120 | ||||||
FirstCash, Inc. | 13,658 | 641,926 | ||||||
Five Below, Inc. (a) | 8,346 | 333,506 | ||||||
Kate Spade & Co. (a) | 123,590 | 2,307,425 | ||||||
Nu Skin Enterprises, Inc. Class A | 21,950 | 1,048,771 | ||||||
Panera Bread Co. Class A (a) (c) | 9,936 | 2,037,774 | ||||||
Wingstop, Inc. | 30,975 | 916,550 | ||||||
|
| |||||||
| 11,801,119 | ||||||||
|
| |||||||
| 28,686,699 | ||||||||
|
| |||||||
| Consumer, Non-cyclical — 17.3% | ||||||||
| Agriculture — 0.4% | ||||||||
MGP Ingredients, Inc. (c) | 16,270 | 813,175 | ||||||
|
| |||||||
| Biotechnology — 2.5% | ||||||||
Aduro Biotech, Inc. (a) (c) | 33,400 | 380,760 | ||||||
Alder Biopharmaceuticals, Inc. (a) (c) | 21,784 | 453,107 | ||||||
Bluebird Bio, Inc. (a) (c) | 10,632 | 655,995 | ||||||
Coherus Biosciences, Inc. (a) | 10,360 | 291,634 | ||||||
Five Prime Therapeutics, Inc. (a) | 16,929 | 848,312 | ||||||
Ionis Pharmaceuticals, Inc. (a) (c) | 13,584 | 649,723 | ||||||
Ironwood Pharmaceuticals, Inc. (a) | 25,839 | 395,078 | ||||||
PTC Therapeutics, Inc. (a) | 26,388 | 287,893 | ||||||
Ultragenyx Pharmaceutical, Inc. (a) | 16,249 | 1,142,467 | ||||||
|
| |||||||
| 5,104,969 | ||||||||
|
| |||||||
| Commercial Services — 3.0% | ||||||||
Cardtronics PLC Class A (a) | 29,396 | 1,604,140 | ||||||
CoStar Group, Inc. (a) | 5,231 | 985,991 | ||||||
Monro Muffler Brake, Inc. | 16,148 | 923,666 | ||||||
TriNet Group, Inc. (a) | 34,100 | 873,642 | ||||||
WEX, Inc. (a) | 15,816 | 1,765,065 | ||||||
|
| |||||||
| 6,152,504 | ||||||||
|
| |||||||
The accompanying notes are an integral part of the financial statements.
110
Table of Contents
MML Small Cap Growth Equity Fund – Portfolio of Investments (Continued)
| Number of Shares | Value | |||||||
| Foods — 0.9% | ||||||||
Greencore Group PLC | 258,629 | $ | 786,312 | |||||
Sanderson Farms, Inc. (c) | 11,860 | 1,117,686 | ||||||
|
| |||||||
| 1,903,998 | ||||||||
|
| |||||||
| Health Care – Products — 5.1% | ||||||||
ABIOMED, Inc. (a) | 7,341 | 827,184 | ||||||
Align Technology, Inc. (a) | 16,827 | 1,617,580 | ||||||
Bio-Techne Corp. | 7,660 | 787,678 | ||||||
Dexcom, Inc. (a) | 8,117 | 484,585 | ||||||
Globus Medical, Inc. Class A (a) | 48,245 | 1,196,958 | ||||||
Haemonetics Corp. (a) | 21,700 | 872,340 | ||||||
Inogen, Inc. (a) | 8,901 | 597,880 | ||||||
Insulet Corp. (a) | 91,790 | 3,458,647 | ||||||
MiMedx Group, Inc. (a) (c) | 67,400 | 597,164 | ||||||
|
| |||||||
| 10,440,016 | ||||||||
|
| |||||||
| Health Care – Services — 2.6% | ||||||||
Acadia Healthcare Co., Inc. (a) | 21,926 | 725,751 | ||||||
Kindred Healthcare, Inc. | 98,063 | 769,794 | ||||||
LifePoint Health, Inc. (a) | 21,290 | 1,209,272 | ||||||
Molina Healthcare, Inc. (a) | 19,800 | 1,074,348 | ||||||
Surgical Care Affiliates, Inc. (a) | 19,601 | 906,938 | ||||||
WellCare Health Plans, Inc. (a) | 3,934 | 539,273 | ||||||
|
| |||||||
| 5,225,376 | ||||||||
|
| |||||||
| Pharmaceuticals — 2.8% | ||||||||
Aerie Pharmaceuticals, Inc. (a) | 26,536 | 1,004,388 | ||||||
Galapagos NV (a) | 12,638 | 811,233 | ||||||
Global Blood Therapeutics, Inc. (a) | 19,471 | 281,356 | ||||||
Nevro Corp. (a) | 13,219 | 960,493 | ||||||
Otonomy, Inc. (a) | 29,293 | 465,759 | ||||||
Portola Pharmaceuticals, Inc. (a) | 15,926 | 357,379 | ||||||
TESARO, Inc. (a) (c) | 13,236 | 1,779,977 | ||||||
|
| |||||||
| 5,660,585 | ||||||||
|
| |||||||
| 35,300,623 | ||||||||
|
| |||||||
| Diversified — 0.6% | ||||||||
| Holding Company – Diversified — 0.6% | ||||||||
FCB Financial Holdings, Inc. Class A (a) | 25,235 | 1,203,710 | ||||||
|
| |||||||
| Energy — 4.5% | ||||||||
| Energy – Alternate Sources — 0.8% | ||||||||
First Solar, Inc. (a) (c) | 22,454 | 720,549 | ||||||
Pattern Energy Group, Inc. (c) | 45,779 | 869,343 | ||||||
|
| |||||||
| 1,589,892 | ||||||||
|
| |||||||
| Oil & Gas — 3.1% | ||||||||
Callon Petroleum Co. (a) | 67,833 | 1,042,593 | ||||||
Centennial Resource Development, Inc. (a) (b) | 4,111 | 74,739 | ||||||
Centennial Resource Development, Inc. Class A (a) (c) | 36,649 | 722,718 | ||||||
Delek US Holdings, Inc. | 46,800 | 1,126,476 | ||||||
Ensco PLC Class A | 50,343 | 489,334 | ||||||
| Number of Shares | Value | |||||||
QEP Resources, Inc. | 49,955 | $ | 919,672 | |||||
Resolute Energy Corp. (a) | 1,800 | 74,142 | ||||||
Synergy Resources Corp. (a) (c) | 85,803 | 764,505 | ||||||
WPX Energy, Inc. (a) | 78,867 | 1,149,092 | ||||||
|
| |||||||
| 6,363,271 | ||||||||
|
| |||||||
| Oil & Gas Services — 0.6% | ||||||||
Forum Energy Technologies, Inc. (a) | 53,488 | 1,176,736 | ||||||
|
| |||||||
| 9,129,899 | ||||||||
|
| |||||||
| Financial — 21.2% | ||||||||
| Banks — 6.9% | ||||||||
Ameris Bancorp | 30,725 | 1,339,610 | ||||||
ConnectOne Bancorp, Inc. | 42,129 | 1,093,248 | ||||||
Great Western Bancorp, Inc. | 30,447 | 1,327,185 | ||||||
IBERIABANK Corp. | 6,885 | 576,619 | ||||||
MB Financial, Inc. | 56,083 | 2,648,800 | ||||||
South State Corp. | 11,961 | 1,045,391 | ||||||
State Bank Financial Corp. | 32,689 | 878,027 | ||||||
Texas Capital Bancshares, Inc. (a) | 14,911 | 1,169,022 | ||||||
United Community Banks, Inc. | 51,512 | 1,525,785 | ||||||
Western Alliance Bancorp (a) | 49,157 | 2,394,437 | ||||||
|
| |||||||
| 13,998,124 | ||||||||
|
| |||||||
| Diversified Financial — 2.6% | ||||||||
Air Lease Corp. | 31,800 | 1,091,694 | ||||||
Hannon Armstrong Sustainable Infrastructure Capital, Inc. | 113,568 | 2,156,656 | ||||||
WageWorks, Inc. (a) | 12,521 | 907,773 | ||||||
WisdomTree Investments, Inc. (c) | 109,764 | 1,222,771 | ||||||
|
| |||||||
| 5,378,894 | ||||||||
|
| |||||||
| Diversified Financial Services — 0.4% | ||||||||
Blackhawk Network Holdings, Inc. (a) | 23,249 | 875,906 | ||||||
|
| |||||||
| Insurance — 3.3% | ||||||||
Assurant, Inc. | 9,184 | 852,826 | ||||||
Assured Guaranty Ltd. | 28,842 | 1,089,363 | ||||||
eHealth, Inc. (a) | 25,540 | 272,001 | ||||||
Horace Mann Educators Corp. | 29,679 | 1,270,261 | ||||||
Kemper Corp. | 25,800 | 1,142,940 | ||||||
MBIA, Inc. (a) | 60,209 | 644,236 | ||||||
MGIC Investment Corp. (a) | 146,578 | 1,493,630 | ||||||
|
| |||||||
| 6,765,257 | ||||||||
|
| |||||||
| Real Estate — 1.6% | ||||||||
Hilltop Holdings, Inc. | 29,623 | 882,765 | ||||||
Kennedy-Wilson Holdings, Inc. | 116,781 | 2,394,011 | ||||||
|
| |||||||
| 3,276,776 | ||||||||
|
| |||||||
| Real Estate Investment Trusts (REITS) — 4.9% | ||||||||
Coresite Realty Corp. | 14,661 | 1,163,644 | ||||||
LaSalle Hotel Properties | 70,681 | 2,153,650 | ||||||
Life Storage, Inc. | 11,171 | 952,440 | ||||||
MFA Financial, Inc. | 138,764 | 1,058,769 | ||||||
The accompanying notes are an integral part of the financial statements.
111
Table of Contents
MML Small Cap Growth Equity Fund – Portfolio of Investments (Continued)
| Number of Shares | Value | |||||||
Outfront Media, Inc. | 46,500 | $ | 1,156,455 | |||||
PS Business Parks, Inc. | 10,791 | 1,257,367 | ||||||
Redwood Trust, Inc. | 71,672 | 1,090,131 | ||||||
Rexford Industrial Realty, Inc. | 48,110 | 1,115,671 | ||||||
|
| |||||||
| 9,948,127 | ||||||||
|
| |||||||
| Savings & Loans — 1.5% | ||||||||
Sterling Bancorp | 129,679 | 3,034,488 | ||||||
|
| |||||||
| 43,277,572 | ||||||||
|
| |||||||
| Industrial — 16.8% | ||||||||
| Aerospace & Defense — 2.8% | ||||||||
Astronics Corp. (a) | 18,406 | 622,859 | ||||||
Curtiss-Wright Corp. | 9,901 | 973,862 | ||||||
HEICO Corp. Class A | 8,470 | 575,113 | ||||||
MACOM Technology Solutions Holdings, Inc. (a) | 43,227 | 2,000,546 | ||||||
Teledyne Technologies, Inc. (a) | 12,247 | 1,506,381 | ||||||
|
| |||||||
| 5,678,761 | ||||||||
|
| |||||||
| Building Materials — 2.0% | ||||||||
Armstrong Flooring, Inc. (a) | 32,763 | 652,311 | ||||||
Armstrong World Industries, Inc. (a) (c) | 22,586 | 944,095 | ||||||
Masonite International Corp. (a) | 36,826 | 2,423,151 | ||||||
|
| |||||||
| 4,019,557 | ||||||||
|
| |||||||
| Electrical Components & Equipment — 0.1% | ||||||||
SunPower Corp. (a) (c) | 40,716 | 269,133 | ||||||
|
| |||||||
| Electronics — 1.0% | ||||||||
Coherent, Inc. (a) | 6,083 | 835,713 | ||||||
Watts Water Technologies, Inc. Class A | 17,060 | 1,112,312 | ||||||
|
| |||||||
| 1,948,025 | ||||||||
|
| |||||||
| Environmental Controls — 1.5% | ||||||||
AquaVenture Holdings Ltd. (a) | 23,000 | 564,190 | ||||||
Clean Harbors, Inc. (a) | 45,405 | 2,526,788 | ||||||
|
| |||||||
| 3,090,978 | ||||||||
|
| |||||||
| Hand & Machine Tools — 0.2% | ||||||||
Regal Beloit Corp. | 7,300 | 505,525 | ||||||
|
| |||||||
| Machinery – Diversified — 2.6% | ||||||||
Altra Industrial Motion Corp. | 39,172 | 1,445,447 | ||||||
Applied Industrial Technologies, Inc. | 21,004 | 1,247,637 | ||||||
The Middleby Corp. (a) | 14,949 | 1,925,581 | ||||||
Zebra Technologies Corp. Class A (a) | 7,729 | 662,839 | ||||||
|
| |||||||
| 5,281,504 | ||||||||
|
| |||||||
| Manufacturing — 0.5% | ||||||||
John Bean Technologies Corp. | 11,815 | 1,015,499 | ||||||
|
| |||||||
| Metal Fabricate & Hardware — 1.4% | ||||||||
Advanced Drainage Systems, Inc. (c) | 95,924 | 1,976,034 | ||||||
The Timken Co. | 22,800 | 905,160 | ||||||
|
| |||||||
| 2,881,194 | ||||||||
|
| |||||||
| Number of Shares | Value | |||||||
| Packaging & Containers — 0.4% | ||||||||
Graphic Packaging Holding Co. | 69,715 | $ | 870,043 | |||||
|
| |||||||
| Transportation — 3.8% | ||||||||
Genesee & Wyoming, Inc. Class A (a) | 15,080 | 1,046,703 | ||||||
Kirby Corp. (a) | 31,834 | 2,116,961 | ||||||
Knight Transportation, Inc. | 48,013 | 1,586,830 | ||||||
Swift Transportation Co. (a) (c) | 120,200 | 2,928,072 | ||||||
|
| |||||||
| 7,678,566 | ||||||||
|
| |||||||
| Trucking & Leasing — 0.5% | ||||||||
GATX Corp. (c) | 17,626 | 1,085,409 | ||||||
|
| |||||||
| 34,324,194 | ||||||||
|
| |||||||
| Technology — 13.2% | ||||||||
| Computers — 0.3% | ||||||||
VeriFone Systems, Inc. (a) | 40,316 | 714,803 | ||||||
|
| |||||||
| Semiconductors — 5.0% | ||||||||
Cavium, Inc. (a) | 32,622 | 2,036,918 | ||||||
Entegris, Inc. (a) | 101,810 | 1,822,399 | ||||||
Impinj, Inc. (a) (c) | 23,100 | 816,354 | ||||||
Integrated Device Technology, Inc. (a) | 42,192 | 994,043 | ||||||
MaxLinear, Inc. Class A (a) | 63,036 | 1,374,185 | ||||||
MKS Instruments, Inc. | 24,020 | 1,426,788 | ||||||
Monolithic Power Systems, Inc. | 6,895 | 564,907 | ||||||
Tower Semiconductor Ltd. (a) | 65,123 | 1,239,291 | ||||||
|
| |||||||
| 10,274,885 | ||||||||
|
| |||||||
| Software — 7.9% | ||||||||
2U, Inc. (a) | 14,551 | 438,713 | ||||||
Allscripts Healthcare Solutions, Inc. (a) | 96,108 | 981,263 | ||||||
Aspen Technology, Inc. (a) | 28,115 | 1,537,328 | ||||||
BroadSoft, Inc. (a) | 47,715 | 1,968,244 | ||||||
Callidus Software, Inc. (a) | 52,060 | 874,608 | ||||||
CommVault Systems, Inc. (a) | 12,433 | 639,056 | ||||||
Docusign, Inc. Series E (Escrow Shares) (a) (b) | 2,601 | - | ||||||
Envestnet, Inc. (a) | 21,185 | 746,771 | ||||||
EPAM Systems, Inc. (a) | 7,143 | 459,366 | ||||||
Fair Isaac Corp. | 12,854 | 1,532,454 | ||||||
Five9, Inc. (a) | 35,800 | 508,002 | ||||||
Guidewire Software, Inc. (a) | 10,651 | 525,414 | ||||||
HubSpot, Inc. (a) | 44,026 | 2,069,222 | ||||||
Nutanix, Inc. Class A (a) | 14,135 | 375,426 | ||||||
Proofpoint, Inc. (a) | 10,251 | 724,233 | ||||||
SS&C Technologies Holdings, Inc | 15,702 | 449,077 | ||||||
Telogis (a) (b) | 80,369 | 255,573 | ||||||
The Ultimate Software Group, Inc. (a) | 4,868 | 887,680 | ||||||
Veeva Systems, Inc. Class A (a) | 27,629 | 1,124,500 | ||||||
|
| |||||||
| 16,096,930 | ||||||||
|
| |||||||
| 27,086,618 | ||||||||
|
| |||||||
The accompanying notes are an integral part of the financial statements.
112
Table of Contents
MML Small Cap Growth Equity Fund – Portfolio of Investments (Continued)
| Number of Shares | Value | |||||||
| Utilities — 0.9% | ||||||||
| Electric — 0.3% | ||||||||
8Point3 Energy Partners LP | 51,601 | $ | 669,782 | |||||
|
| |||||||
| Gas — 0.6% | ||||||||
South Jersey Industries, Inc. | 33,390 | 1,124,909 | ||||||
|
| |||||||
| 1,794,691 | ||||||||
|
| |||||||
| TOTAL COMMON STOCK (Cost $179,664,427) | 198,884,997 | |||||||
|
| |||||||
| PREFERRED STOCK — 0.9% | ||||||||
| Communications — 0.4% | ||||||||
| Internet — 0.4% | ||||||||
Draftkings Series D (a) (b) | 14,868 | 59,472 | ||||||
Draftkings, Inc. Series D 1 (a) (b) | 28,744 | 146,307 | ||||||
The Honest Co. (a) (b) | 4,027 | 139,012 | ||||||
Veracode, Inc. (a) (b) | 10,688 | 219,211 | ||||||
Zuora, Inc. Series F (a) (b) | 69,937 | 259,466 | ||||||
|
| |||||||
| 823,468 | ||||||||
|
| |||||||
| Technology — 0.5% | ||||||||
| Software — 0.5% | ||||||||
Cloudera, Inc. Series F (a) (b) | 12,068 | 207,932 | ||||||
Docusign, Inc. Series B (a) (b) | 456 | 7,364 | ||||||
Docusign, Inc. Series B 1 (a) (b) | 136 | 2,196 | ||||||
Docusign, Inc. Series D (a) (b) | 327 | 5,281 | ||||||
Docusign, Inc. Series E (a) (b) | 7,083 | 114,390 | ||||||
Marklogic Corp. Series F (a) (b) | 22,966 | 236,779 | ||||||
Telogis (a) (b) | 109,450 | 481,843 | ||||||
|
| |||||||
| 1,055,785 | ||||||||
|
| |||||||
| TOTAL PREFERRED STOCK (Cost $1,736,191) | 1,879,253 | |||||||
|
| |||||||
| TOTAL EQUITIES (Cost $181,400,618) | 200,764,250 | |||||||
|
| |||||||
| MUTUAL FUNDS — 8.5% | ||||||||
| Diversified Financial — 8.5% | ||||||||
iShares Russell 2000 Index Fund (c) | 4,169 | 562,190 | ||||||
State Street Navigator Securities Lending Prime Portfolio (d) | 16,856,377 | 16,856,377 | ||||||
|
| |||||||
| TOTAL MUTUAL FUNDS (Cost $17,432,502) | 17,418,567 | |||||||
|
| |||||||
| TOTAL LONG-TERM INVESTMENTS (Cost $198,833,120) | 218,182,817 | |||||||
|
| |||||||
| Principal Amount | Value | |||||||
| SHORT-TERM INVESTMENTS — 1.5% | ||||||||
| Repurchase Agreement — 1.5% | ||||||||
State Street Bank & Trust Co. Repurchase Agreement, dated 12/30/16, 0.010%, due 1/03/17 (e) | $ | 3,038,156 | $ | 3,038,156 | ||||
|
| |||||||
| Time Deposit — 0.0% | ||||||||
Euro Time Deposit | 8,717 | 8,717 | ||||||
|
| |||||||
| TOTAL SHORT-TERM INVESTMENTS (Cost $3,046,873) | 3,046,873 | |||||||
|
| |||||||
| TOTAL INVESTMENTS — 108.3% (Cost $201,879,993) (f) | 221,229,690 | |||||||
| Other Assets/(Liabilities) — (8.3)% | (17,015,957 | ) | ||||||
|
| |||||||
| NET ASSETS — 100.0% | $ | 204,213,733 | ||||||
|
| |||||||
Notes to Portfolio of Investments
Percentages are stated as a percent of net assets.
| (a) | Non-income producing security. |
| (b) | This security is fair valued in good faith in accordance with procedures approved by the Board of Trustees. At December 31, 2016, these securities amounted to a value of $2,310,381 or 1.13% of net assets. |
| (c) | Denotes all or a portion of security on loan. The total value of securities on loan as of December 31, 2016, was $16,431,762 or 8.05% of net assets. Total securities on loan may not correspond with the amounts identified in the Portfolio of Investments because pending sales may be in the process of recall from the brokers. (Note 2). |
| (d) | Represents investment of security lending collateral. (Note 2). |
| (e) | Maturity value of $3,038,160. Collateralized by U.S. Government Agency obligations with a rate of 1.625%, maturity date of 4/30/19, and an aggregate market value, including accrued interest, of $3,104,443. |
| (f) | See Note 6 for aggregate cost for federal tax purposes. |
The accompanying notes are an integral part of the financial statements.
113
Table of Contents
MML Small Company Value Fund – Portfolio of Investments
December 31, 2016
| Number of Shares | Value | |||||||
| EQUITIES — 97.9% | ||||||||
| COMMON STOCK — 97.9% | ||||||||
| Basic Materials — 4.3% | ||||||||
| Chemicals — 2.5% | ||||||||
American Vanguard Corp. | 21,600 | $ | 413,640 | |||||
Innospec, Inc. | 5,983 | 409,835 | ||||||
KMG Chemicals, Inc. | 17,000 | 661,130 | ||||||
Minerals Technologies, Inc. | 13,700 | 1,058,325 | ||||||
|
| |||||||
| 2,542,930 | ||||||||
|
| |||||||
| Forest Products & Paper — 0.8% | ||||||||
Clearwater Paper Corp. (a) | 13,000 | 852,150 | ||||||
|
| |||||||
| Iron & Steel — 1.0% | ||||||||
Carpenter Technology Corp. | 16,600 | 600,422 | ||||||
Reliance Steel & Aluminum Co. | 5,800 | 461,332 | ||||||
|
| |||||||
| 1,061,754 | ||||||||
|
| |||||||
| 4,456,834 | ||||||||
|
| |||||||
| Communications — 2.9% | ||||||||
| Internet — 0.9% | ||||||||
New Media Investment Group, Inc. | 34,800 | 556,452 | ||||||
Rightside Group Ltd. (a) | 17,168 | 141,979 | ||||||
Safeguard Scientifics, Inc. (a) | 21,500 | 289,175 | ||||||
|
| |||||||
| 987,606 | ||||||||
|
| |||||||
| Media — 0.9% | ||||||||
Cable One, Inc. | 900 | 559,557 | ||||||
Scholastic Corp. | 8,200 | 389,418 | ||||||
|
| |||||||
| 948,975 | ||||||||
|
| |||||||
| Telecommunications — 1.1% | ||||||||
Harmonic, Inc. (a) | 85,600 | 428,000 | ||||||
Ixia (a) | 42,200 | 679,420 | ||||||
|
| |||||||
| 1,107,420 | ||||||||
|
| |||||||
| 3,044,001 | ||||||||
|
| |||||||
| Consumer, Cyclical — 9.2% | ||||||||
| Apparel — 0.6% | ||||||||
Crocs, Inc. (a) | 15,300 | 104,958 | ||||||
Steven Madden Ltd. (a) | 16,100 | 575,575 | ||||||
|
| |||||||
| 680,533 | ||||||||
|
| |||||||
| Automotive & Parts — 0.9% | ||||||||
Dorman Products, Inc. (a) | 12,200 | 891,332 | ||||||
|
| |||||||
| Distribution & Wholesale — 1.8% | ||||||||
Beacon Roofing Supply, Inc. (a) | 16,200 | 746,334 | ||||||
Pool Corp. | 10,400 | 1,085,136 | ||||||
|
| |||||||
| 1,831,470 | ||||||||
|
| |||||||
| Home Builders — 0.6% | ||||||||
Cavco Industries, Inc. (a) | 6,600 | 659,010 | ||||||
|
| |||||||
| Home Furnishing — 0.5% | ||||||||
Ethan Allen Interiors, Inc. | 13,400 | 493,790 | ||||||
|
| |||||||
| Number of Shares | Value | |||||||
| Leisure Time — 1.2% | ||||||||
LCI Industries | 11,600 | $ | 1,249,900 | |||||
|
| |||||||
| Lodging — 0.4% | ||||||||
ILG, Inc. | 22,700 | 412,459 | ||||||
|
| |||||||
| Retail — 2.6% | ||||||||
Fred’s, Inc. Class A (b) | 19,900 | 369,344 | ||||||
Genesco, Inc. (a) | 4,700 | 291,870 | ||||||
Lumber Liquidators Holdings, Inc. (a) (b) | 21,400 | 336,836 | ||||||
Party City Holdco, Inc. (a) (b) | 16,200 | 230,040 | ||||||
Pier 1 Imports, Inc. | 24,409 | 208,453 | ||||||
PriceSmart, Inc. | 7,200 | 601,200 | ||||||
Red Robin Gourmet Burgers, Inc. (a) | 7,600 | 428,640 | ||||||
Sportsman’s Warehouse Holdings, Inc. (a) | 31,033 | 291,400 | ||||||
|
| |||||||
| 2,757,783 | ||||||||
|
| |||||||
| Textiles — 0.6% | ||||||||
Culp, Inc. | 15,700 | 583,255 | ||||||
|
| |||||||
| 9,559,532 | ||||||||
|
| |||||||
| Consumer, Non-cyclical — 14.3% | ||||||||
| Agriculture — 0.4% | ||||||||
Vector Group Ltd. (b) | 17,879 | 406,569 | ||||||
|
| |||||||
| Commercial Services — 4.9% | ||||||||
Aaron’s, Inc. | 27,900 | 892,521 | ||||||
American Public Education, Inc. (a) | 16,000 | 392,800 | ||||||
Capella Education Co. | 10,700 | 939,460 | ||||||
FTI Consulting, Inc. (a) | 10,800 | 486,864 | ||||||
Green Dot Corp. Class A (a) | 26,080 | 614,184 | ||||||
Hillenbrand, Inc. | 9,130 | 350,135 | ||||||
McGrath RentCorp | 16,099 | 630,920 | ||||||
Navigant Consulting, Inc. (a) | 31,900 | 835,142 | ||||||
|
| |||||||
| 5,142,026 | ||||||||
|
| |||||||
| Foods — 2.2% | ||||||||
Nomad Foods Ltd. (a) | 57,800 | 553,146 | ||||||
Pinnacle Foods, Inc. | 9,100 | 486,395 | ||||||
Post Holdings, Inc. (a) | 6,900 | 554,691 | ||||||
SpartanNash Co. | 18,500 | 731,490 | ||||||
|
| |||||||
| 2,325,722 | ||||||||
|
| |||||||
| Health Care – Products — 4.4% | ||||||||
Atrion Corp. | 2,250 | 1,141,200 | ||||||
Haemonetics Corp. (a) | 19,000 | 763,800 | ||||||
Halyard Health, Inc. (a) | 21,700 | 802,466 | ||||||
Quidel Corp. (a) | 27,600 | 591,192 | ||||||
West Pharmaceutical Services, Inc. | 15,300 | 1,297,899 | ||||||
|
| |||||||
| 4,596,557 | ||||||||
|
| |||||||
| Health Care – Services — 2.0% | ||||||||
The Ensign Group, Inc. | 8,600 | 191,006 | ||||||
National Healthcare Corp. | 5,200 | 394,108 | ||||||
The accompanying notes are an integral part of the financial statements.
114
Table of Contents
MML Small Company Value Fund – Portfolio of Investments (Continued)
| Number of Shares | Value | |||||||
Select Medical Holdings Corp. (a) | 30,600 | $ | 405,450 | |||||
Triple-S Management Corp. Class B (a) | 15,600 | 322,920 | ||||||
WellCare Health Plans, Inc. (a) | 5,600 | 767,648 | ||||||
|
| |||||||
| 2,081,132 | ||||||||
|
| |||||||
| Household Products — 0.4% | ||||||||
CSS Industries, Inc. | 14,900 | 403,343 | ||||||
|
| |||||||
| 14,955,349 | ||||||||
|
| |||||||
| Diversified — 1.0% | ||||||||
| Holding Company – Diversified — 1.0% | ||||||||
Conyers Park Acquisition Corp. (a) | 18,300 | 198,555 | ||||||
National Bank Holdings Corp. Class A | 26,400 | 841,896 | ||||||
|
| |||||||
| 1,040,451 | ||||||||
|
| |||||||
| Energy — 4.2% | ||||||||
| Oil & Gas — 3.2% | ||||||||
Matador Resources Co. (a) (b) | 32,700 | 842,352 | ||||||
Parsley Energy, Inc. Class A (a) | 17,800 | 627,272 | ||||||
Rice Energy, Inc. (a) | 18,200 | 388,570 | ||||||
Western Refining, Inc. | 16,600 | 628,310 | ||||||
WPX Energy, Inc. (a) | 54,900 | 799,893 | ||||||
|
| |||||||
| 3,286,397 | ||||||||
|
| |||||||
| Oil & Gas Services — 1.0% | ||||||||
Oceaneering International, Inc. | 13,600 | 383,656 | ||||||
Tesco Corp. | 47,500 | 391,875 | ||||||
TETRA Technologies, Inc. (a) | 58,100 | 291,662 | ||||||
|
| |||||||
| 1,067,193 | ||||||||
|
| |||||||
| 4,353,590 | ||||||||
|
| |||||||
| Financial — 34.9% | ||||||||
| Banks — 16.2% | ||||||||
CoBiz Financial, Inc. | 36,000 | 608,040 | ||||||
Columbia Banking System, Inc. | 27,900 | 1,246,572 | ||||||
East West Bancorp, Inc. | 33,526 | 1,704,127 | ||||||
First Hawaiian, Inc. | 12,342 | 429,748 | ||||||
Glacier Bancorp, Inc. | 27,300 | 989,079 | ||||||
Home Bancshares, Inc. | 85,450 | 2,372,946 | ||||||
Hope Bancorp, Inc. | 36,200 | 792,418 | ||||||
Pinnacle Financial Partners, Inc. | 7,500 | 519,750 | ||||||
Popular, Inc. | 25,900 | 1,134,938 | ||||||
Prosperity Bancshares, Inc. | 17,300 | 1,241,794 | ||||||
Sandy Spring Bancorp, Inc. | 8,150 | 325,919 | ||||||
SVB Financial Group (a) | 8,350 | 1,433,361 | ||||||
Synovus Financial Corp. | 10,200 | 419,016 | ||||||
Texas Capital Bancshares, Inc. (a) | 9,300 | 729,120 | ||||||
Towne Bank | 35,600 | 1,183,700 | ||||||
Webster Financial Corp. | 16,575 | 899,691 | ||||||
Wintrust Financial Corp. (b) | 11,900 | 863,583 | ||||||
|
| |||||||
| 16,893,802 | ||||||||
|
| |||||||
| Number of Shares | Value | |||||||
| Diversified Financial — 1.6% | ||||||||
Bats Global Markets, Inc. | 17,091 | $ | 572,720 | |||||
Houlihan Lokey, Inc. | 11,326 | 352,465 | ||||||
Janus Capital Group, Inc. | 33,800 | 448,526 | ||||||
Stifel Financial Corp. (a) | 6,300 | 314,685 | ||||||
|
| |||||||
| 1,688,396 | ||||||||
|
| |||||||
| Insurance — 4.7% | ||||||||
Assured Guaranty Ltd. | 17,082 | 645,187 | ||||||
Employers Holdings, Inc. | 15,200 | 601,920 | ||||||
Kinsale Capital Group, Inc. | 11,613 | 394,958 | ||||||
ProAssurance Corp. | 20,400 | 1,146,480 | ||||||
Radian Group, Inc. | 50,900 | 915,182 | ||||||
RenaissanceRe Holdings Ltd. | 2,200 | 299,684 | ||||||
Safety Insurance Group, Inc. | 6,000 | 442,200 | ||||||
State Auto Financial Corp. Class A | 17,900 | 479,899 | ||||||
|
| |||||||
| 4,925,510 | ||||||||
|
| |||||||
| Real Estate Investment Trusts (REITS) — 8.6% | ||||||||
Acadia Realty Trust | 23,900 | 781,052 | ||||||
American Assets Trust, Inc. | 6,200 | 267,096 | ||||||
American Campus Communities, Inc. | 9,900 | 492,723 | ||||||
Cedar Realty Trust, Inc. | 113,500 | 741,155 | ||||||
Douglas Emmett, Inc. | 14,700 | 537,432 | ||||||
EastGroup Properties, Inc. | 12,100 | 893,464 | ||||||
First Potomac Realty Trust | 66,090 | 725,007 | ||||||
Healthcare Realty Trust, Inc. | 15,100 | 457,832 | ||||||
Kilroy Realty Corp. | 9,000 | 658,980 | ||||||
Potlatch Corp. | 16,000 | 666,400 | ||||||
PS Business Parks, Inc. | 6,200 | 722,424 | ||||||
Retail Opportunity Investments Corp. | 18,000 | 380,340 | ||||||
Saul Centers, Inc. | 12,200 | 812,642 | ||||||
Washington Real Estate Investment Trust | 22,900 | 748,601 | ||||||
|
| |||||||
| 8,885,148 | ||||||||
|
| |||||||
| Savings & Loans — 3.8% | ||||||||
BankUnited, Inc. | 34,900 | 1,315,381 | ||||||
Beneficial Bancorp, Inc. | 42,823 | 787,943 | ||||||
Meridian Bancorp, Inc. | 16,700 | 315,630 | ||||||
United Financial Bancorp, Inc. | 45,600 | 828,096 | ||||||
WSFS Financial Corp. | 14,700 | 681,345 | ||||||
|
| |||||||
| 3,928,395 | ||||||||
|
| |||||||
| 36,321,251 | ||||||||
|
| |||||||
| Industrial — 16.8% | ||||||||
| Aerospace & Defense — 0.7% | ||||||||
Kaman Corp. (b) | 8,300 | 406,119 | ||||||
Triumph Group, Inc. | 12,800 | 339,200 | ||||||
|
| |||||||
| 745,319 | ||||||||
|
| |||||||
| Building Materials — 0.6% | ||||||||
Universal Forest Products, Inc. | 6,400 | 653,952 | ||||||
|
| |||||||
The accompanying notes are an integral part of the financial statements.
115
Table of Contents
MML Small Company Value Fund – Portfolio of Investments (Continued)
| Number of Shares | Value | |||||||
| Electrical Components & Equipment — 4.0% | ||||||||
Advanced Energy Industries, Inc. (a) | 12,500 | $ | 684,375 | |||||
Belden, Inc. | 18,960 | 1,417,639 | ||||||
Energizer Holdings, Inc. | 13,100 | 584,391 | ||||||
Littelfuse, Inc. | 9,500 | 1,441,815 | ||||||
|
| |||||||
| 4,128,220 | ||||||||
|
| |||||||
| Electronics — 2.6% | ||||||||
Analogic Corp. | 5,300 | 439,635 | ||||||
Badger Meter, Inc. | 13,600 | 502,520 | ||||||
Brady Corp. Class A | 13,900 | 521,945 | ||||||
Knowles Corp. (a) (b) | 43,500 | 726,885 | ||||||
Methode Electronics, Inc. | 13,200 | 545,820 | ||||||
|
| |||||||
| 2,736,805 | ||||||||
|
| |||||||
| Engineering & Construction — 0.8% | ||||||||
Aegion Corp. (a) | 34,700 | 822,390 | ||||||
|
| |||||||
| Environmental Controls — 0.4% | ||||||||
MSA Safety, Inc. | 6,200 | 429,846 | ||||||
|
| |||||||
| Machinery – Diversified — 0.6% | ||||||||
Applied Industrial Technologies, Inc. | 10,100 | 599,940 | ||||||
|
| |||||||
| Manufacturing — 2.4% | ||||||||
Colfax Corp. (a) | 10,200 | 366,486 | ||||||
ESCO Technologies, Inc. | 17,900 | 1,014,035 | ||||||
Matthews International Corp. Class A | 5,700 | 438,045 | ||||||
Myers Industries, Inc. | 47,750 | 682,825 | ||||||
|
| |||||||
| 2,501,391 | ||||||||
|
| |||||||
| Metal Fabricate & Hardware — 1.7% | ||||||||
Circor International, Inc. | 10,500 | 681,240 | ||||||
RBC Bearings, Inc. (a) | 6,100 | 566,141 | ||||||
Sun Hydraulics Corp. | 12,600 | 503,622 | ||||||
|
| |||||||
| 1,751,003 | ||||||||
|
| |||||||
| Transportation — 3.0% | ||||||||
Genesee & Wyoming, Inc. Class A (a) | 10,050 | 697,571 | ||||||
Kirby Corp. (a) | 6,350 | 422,275 | ||||||
Landstar System, Inc. | 19,000 | 1,620,700 | ||||||
Universal Logistics Holdings, Inc. | 22,500 | 367,875 | ||||||
|
| |||||||
| 3,108,421 | ||||||||
|
| |||||||
| 17,477,287 | ||||||||
| �� | |||||||
| Technology — 4.3% | ||||||||
| Computers — 0.5% | ||||||||
CSRA, Inc. | 18,000 | 573,120 | ||||||
|
| |||||||
| Semiconductors — 1.9% | ||||||||
Brooks Automation, Inc. | 25,500 | 435,285 | ||||||
Cabot Microelectronics Corp. | 8,800 | 555,896 | ||||||
Intersil Corp. Class A | 28,200 | 628,860 | ||||||
Rudolph Technologies, Inc. (a) | 15,400 | 359,590 | ||||||
|
| |||||||
| 1,979,631 | ||||||||
|
| |||||||
| Number of Shares | Value | |||||||
| Software — 1.9% | ||||||||
Callidus Software, Inc. (a) | 27,900 | $ | 468,720 | |||||
Progress Software Corp. | 19,100 | 609,863 | ||||||
SYNNEX Corp. | 7,200 | 871,344 | ||||||
|
| |||||||
| 1,949,927 | ||||||||
|
| |||||||
| 4,502,678 | ||||||||
|
| |||||||
| Utilities — 6.0% | ||||||||
| Electric — 2.3% | ||||||||
El Paso Electric Co. | 11,100 | 516,150 | ||||||
NorthWestern Corp. | 15,100 | 858,737 | ||||||
NRG Energy, Inc. | 32,800 | 402,128 | ||||||
Portland General Electric Co. | 14,800 | 641,284 | ||||||
|
| |||||||
| 2,418,299 | ||||||||
|
| |||||||
| Gas — 3.5% | ||||||||
Atmos Energy Corp. | 7,200 | 533,880 | ||||||
Chesapeake Utilities Corp. | 12,700 | 850,265 | ||||||
ONE Gas, Inc. | 17,300 | 1,106,508 | ||||||
PNM Resources, Inc. | 33,100 | 1,135,330 | ||||||
|
| |||||||
| 3,625,983 | ||||||||
|
| |||||||
| Water — 0.2% | ||||||||
California Water Service Group | 6,900 | 233,910 | ||||||
|
| |||||||
| 6,278,192 | ||||||||
|
| |||||||
| TOTAL COMMON STOCK (Cost $72,678,754) | 101,989,165 | |||||||
|
| |||||||
| TOTAL EQUITIES (Cost $72,678,754) | 101,989,165 | |||||||
|
| |||||||
| MUTUAL FUNDS — 3.2% | ||||||||
| Diversified Financial — 3.2% | ||||||||
State Street Navigator Securities Lending Prime Portfolio (c) | 3,384,259 | 3,384,259 | ||||||
T. Rowe Price Reserve Investment Fund | 1,005 | 1,005 | ||||||
|
| |||||||
| TOTAL MUTUAL FUNDS (Cost $3,385,264) | 3,385,264 | |||||||
|
| |||||||
| TOTAL LONG-TERM INVESTMENTS (Cost $76,064,018) | 105,374,429 | |||||||
|
| |||||||
The accompanying notes are an integral part of the financial statements.
116
Table of Contents
MML Small Company Value Fund – Portfolio of Investments (Continued)
| Principal Amount | Value | |||||||
| SHORT-TERM INVESTMENTS — 2.0% | ||||||||
| Repurchase Agreement — 2.0% | ||||||||
State Street Bank & Trust Co. Repurchase Agreement, dated 12/30/16, 0.010%, due 1/03/17 (d) | $ | 2,098,298 | $ | 2,098,298 | ||||
|
| |||||||
| TOTAL SHORT-TERM INVESTMENTS (Cost $2,098,298) | 2,098,298 | |||||||
|
| |||||||
| TOTAL INVESTMENTS — 103.1% (Cost $78,162,316) (e) | 107,472,727 | |||||||
| Other Assets/(Liabilities) — (3.1)% | (3,278,467 | ) | ||||||
|
| |||||||
| NET ASSETS — 100.0% | $ | 104,194,260 | ||||||
|
| |||||||
Notes to Portfolio of Investments
Percentages are stated as a percent of net assets.
| (a) | Non-income producing security. |
| (b) | Denotes all or a portion of security on loan. The total value of securities on loan as of December 31, 2016, was $3,300,322 or 3.17% of net assets. Total securities on loan may not correspond with the amounts identified in the Portfolio of Investments because pending sales may be in the process of recall from the brokers. (Note 2). |
| (c) | Represents investment of security lending collateral. (Note 2). |
| (d) | Maturity value of $2,098,300. Collateralized by U.S. Government Agency obligations with a rate of 8.125%, maturity date of 8/15/21, and an aggregate market value, including accrued interest, of $2,143,326. |
| (e) | See Note 6 for aggregate cost for federal tax purposes. |
The accompanying notes are an integral part of the financial statements.
117
Table of Contents
MML Small/Mid Cap Value Fund – Portfolio of Investments
December 31, 2016
| Number of Shares | Value | |||||||
| EQUITIES — 98.5% | ||||||||
| COMMON STOCK — 98.5% | ||||||||
| Basic Materials — 1.4% | ||||||||
| Chemicals — 1.4% | ||||||||
Huntsman Corp. | 83,950 | $ | 1,601,766 | |||||
Ingevity Corp. (a) | 32,270 | 1,770,332 | ||||||
|
| |||||||
| 3,372,098 | ||||||||
|
| |||||||
| Communications — 6.3% | ||||||||
| Internet — 1.5% | ||||||||
CDW Corp. | 64,770 | 3,373,869 | ||||||
|
| |||||||
| Media — 1.0% | ||||||||
Scholastic Corp. | 48,890 | 2,321,786 | ||||||
|
| |||||||
| Telecommunications — 3.8% | ||||||||
Anixter International, Inc. (a) | 44,380 | 3,596,999 | ||||||
Finisar Corp. (a) | 86,420 | 2,615,934 | ||||||
Infinera Corp. (a) | 147,500 | 1,252,275 | ||||||
NETGEAR, Inc. (a) | 25,846 | 1,404,730 | ||||||
|
| |||||||
| 8,869,938 | ||||||||
|
| |||||||
| 14,565,593 | ||||||||
|
| |||||||
| Consumer, Cyclical — 16.9% | ||||||||
| Airlines — 1.3% | ||||||||
SkyWest, Inc. | 84,240 | 3,070,548 | ||||||
|
| |||||||
| Apparel — 0.7% | ||||||||
Crocs, Inc. (a) | 219,440 | 1,505,358 | ||||||
|
| |||||||
| Auto Manufacturers — 1.3% | ||||||||
Oshkosh Corp. | 48,160 | 3,111,618 | ||||||
|
| |||||||
| Automotive & Parts — 3.4% | ||||||||
Dana, Inc. | 164,893 | 3,129,669 | ||||||
Lear Corp. | 15,416 | 2,040,616 | ||||||
Tenneco, Inc. (a) | 42,881 | 2,678,776 | ||||||
|
| |||||||
| 7,849,061 | ||||||||
|
| |||||||
| Entertainment — 1.2% | ||||||||
Regal Entertainment Group Class A | 137,100 | 2,824,260 | ||||||
|
| |||||||
| Home Builders — 2.0% | ||||||||
CalAtlantic Group, Inc. | 87,020 | 2,959,550 | ||||||
PulteGroup, Inc. | 88,060 | 1,618,543 | ||||||
|
| |||||||
| 4,578,093 | ||||||||
|
| |||||||
| Retail — 7.0% | ||||||||
Big Lots, Inc. | 39,598 | 1,988,216 | ||||||
Bloomin’ Brands, Inc. | 168,380 | 3,035,891 | ||||||
Brinker International, Inc. | 50,349 | 2,493,786 | ||||||
Burlington Stores, Inc. (a) | 20,969 | 1,777,123 | ||||||
Caleres, Inc. | 72,380 | 2,375,512 | ||||||
The Children’s Place, Inc. | 20,122 | 2,031,316 | ||||||
The Michaels Cos., Inc. (a) | 118,890 | 2,431,300 | ||||||
|
| |||||||
| 16,133,144 | ||||||||
|
| |||||||
| 39,072,082 | ||||||||
|
| |||||||
| Number of Shares | Value | |||||||
| Consumer, Non-cyclical — 11.7% | ||||||||
| Commercial Services — 5.6% | ||||||||
ABM Industries, Inc. | 44,300 | $ | 1,809,212 | |||||
Booz Allen Hamilton Holding Corp. | 84,500 | 3,047,915 | ||||||
Genpact Ltd. (a) | 102,377 | 2,491,856 | ||||||
Quanta Services, Inc. (a) | 86,230 | 3,005,116 | ||||||
Sotheby’s | 67,220 | 2,679,389 | ||||||
|
| |||||||
| 13,033,488 | ||||||||
|
| |||||||
| Foods — 0.6% | ||||||||
Ingredion, Inc. | 11,372 | 1,421,045 | ||||||
|
| |||||||
| Health Care – Services — 4.8% | ||||||||
ICON PLC (a) | 40,930 | 3,077,936 | ||||||
LifePoint Health, Inc. (a) | 53,000 | 3,010,400 | ||||||
Molina Healthcare, Inc. (a) | 48,590 | 2,636,494 | ||||||
WellCare Health Plans, Inc. (a) | 17,630 | 2,416,720 | ||||||
|
| |||||||
| 11,141,550 | ||||||||
|
| |||||||
| Pharmaceuticals — 0.7% | ||||||||
Horizon Pharma PLC (a) | 94,260 | 1,525,127 | ||||||
|
| |||||||
| 27,121,210 | ||||||||
|
| |||||||
| Energy — 11.7% | ||||||||
| Oil & Gas — 9.1% | ||||||||
Gulfport Energy Corp. (a) | 83,860 | 1,814,730 | ||||||
Helmerich & Payne, Inc. | 46,950 | 3,633,930 | ||||||
Oasis Petroleum, Inc. (a) | 155,260 | 2,350,637 | ||||||
QEP Resources, Inc. | 176,080 | 3,241,633 | ||||||
SM Energy Co. | 85,800 | 2,958,384 | ||||||
Southwestern Energy Co. (a) | 117,200 | 1,268,104 | ||||||
Synergy Resources Corp. (a) | 463,820 | 4,132,636 | ||||||
Western Refining, Inc. | 45,140 | 1,708,549 | ||||||
|
| |||||||
| 21,108,603 | ||||||||
|
| |||||||
| Oil & Gas Services — 2.6% | ||||||||
Oil States International, Inc. (a) | 84,590 | 3,299,010 | ||||||
RPC, Inc. | 134,690 | 2,668,209 | ||||||
|
| |||||||
| 5,967,219 | ||||||||
|
| |||||||
| 27,075,822 | ||||||||
|
| |||||||
| Financial — 22.7% | ||||||||
| Banks — 11.1% | ||||||||
Associated Banc-Corp. | 104,837 | 2,589,474 | ||||||
Comerica, Inc. | 55,815 | 3,801,560 | ||||||
Fulton Financial Corp. | 141,260 | 2,655,688 | ||||||
Huntington Bancshares, Inc. | 313,035 | 4,138,323 | ||||||
Synovus Financial Corp. | 57,120 | 2,346,489 | ||||||
Texas Capital Bancshares, Inc. (a) | 36,650 | 2,873,360 | ||||||
Webster Financial Corp. | 60,663 | 3,292,788 | ||||||
Zions Bancorp | 93,615 | 4,029,189 | ||||||
|
| |||||||
| 25,726,871 | ||||||||
|
| |||||||
| Diversified Financial — 0.6% | ||||||||
OneMain Holdings, Inc. (a) | 58,280 | 1,290,319 | ||||||
|
| |||||||
The accompanying notes are an integral part of the financial statements.
118
Table of Contents
MML Small/Mid Cap Value Fund – Portfolio of Investments (Continued)
| Number of Shares | Value | |||||||
| Insurance — 7.7% | ||||||||
American Financial Group, Inc. | 38,320 | $ | 3,376,758 | |||||
Essent Group Ltd. (a) | 97,670 | 3,161,578 | ||||||
First American Financial Corp. | 62,570 | 2,291,939 | ||||||
The Hanover Insurance Group, Inc. | 15,540 | 1,414,295 | ||||||
Reinsurance Group of America, Inc. | 26,890 | 3,383,569 | ||||||
Selective Insurance Group, Inc. | 39,740 | 1,710,807 | ||||||
Validus Holdings Ltd. | 47,490 | 2,612,425 | ||||||
|
| |||||||
| 17,951,371 | ||||||||
|
| |||||||
| Real Estate Investment Trusts (REITS) — 3.3% | ||||||||
Education Realty Trust, Inc. | 72,500 | 3,066,750 | ||||||
Empire State Realty Trust, Inc. Class A | 66,550 | 1,343,645 | ||||||
Gramercy Property Trust | 343,346 | 3,151,916 | ||||||
|
| |||||||
| 7,562,311 | ||||||||
|
| |||||||
| 52,530,872 | ||||||||
|
| |||||||
| Industrial — 16.7% | ||||||||
| Aerospace & Defense — 1.7% | ||||||||
BE Aerospace, Inc. | 19,670 | 1,183,937 | ||||||
Esterline Technologies Corp. (a) | 29,570 | 2,637,644 | ||||||
|
| |||||||
| 3,821,581 | ||||||||
|
| |||||||
| Electrical Components & Equipment — 1.4% | ||||||||
EnerSys | 39,970 | 3,121,657 | ||||||
|
| |||||||
| Electronics — 3.1% | ||||||||
Avnet, Inc. | 51,290 | 2,441,917 | ||||||
Keysight Technologies, Inc. (a) | 72,000 | 2,633,040 | ||||||
Vishay Intertechnology, Inc. | 125,446 | 2,032,225 | ||||||
|
| |||||||
| 7,107,182 | ||||||||
|
| |||||||
| Engineering & Construction — 3.4% | ||||||||
AECOM (a) | 82,823 | 3,011,444 | ||||||
EMCOR Group, Inc. | 23,180 | 1,640,217 | ||||||
Tutor Perini Corp. (a) | 110,660 | 3,098,480 | ||||||
|
| |||||||
| 7,750,141 | ||||||||
|
| |||||||
| Hand & Machine Tools — 1.1% | ||||||||
Regal Beloit Corp. | 37,780 | 2,616,265 | ||||||
|
| |||||||
| Machinery – Construction & Mining — 0.5% | ||||||||
Terex Corp. | 36,306 | 1,144,728 | ||||||
|
| |||||||
| Machinery – Diversified — 1.0% | ||||||||
SPX FLOW, Inc. (a) | 73,830 | 2,366,990 | ||||||
|
| |||||||
| Manufacturing — 0.7% | ||||||||
ITT, Inc. | 43,970 | 1,695,923 | ||||||
|
| |||||||
| Packaging & Containers — 1.3% | ||||||||
Graphic Packaging Holding Co. | 245,830 | 3,067,958 | ||||||
|
| |||||||
| Transportation — 2.5% | ||||||||
Atlas Air Worldwide Holdings, Inc. (a) | 28,560 | 1,489,404 | ||||||
| Number of Shares | Value | |||||||
Ryder System, Inc. | 28,350 | $ | 2,110,374 | |||||
Werner Enterprises, Inc. | 85,130 | 2,294,254 | ||||||
|
| |||||||
| 5,894,032 | ||||||||
|
| |||||||
| 38,586,457 | ||||||||
|
| |||||||
| Technology — 8.3% | ||||||||
| Computers — 3.2% | ||||||||
Amdocs Ltd. | 50,318 | 2,931,024 | ||||||
NCR Corp. (a) | 78,140 | 3,169,358 | ||||||
VeriFone Systems, Inc. (a) | 77,580 | 1,375,493 | ||||||
|
| |||||||
| 7,475,875 | ||||||||
|
| |||||||
| Semiconductors — 3.9% | ||||||||
Advanced Micro Devices, Inc. (a) | 151,180 | 1,714,381 | ||||||
Cypress Semiconductor Corp. | 282,270 | 3,229,169 | ||||||
Integrated Device Technology, Inc. (a) | 58,170 | 1,370,485 | ||||||
Qorvo, Inc. (a) | 52,750 | 2,781,508 | ||||||
|
| |||||||
| 9,095,543 | ||||||||
|
| |||||||
| Software — 1.2% | ||||||||
Verint Systems, Inc. (a) | 76,740 | 2,705,085 | ||||||
|
| |||||||
| 19,276,503 | ||||||||
|
| |||||||
| Utilities — 2.8% | ||||||||
| Electric — 1.0% | ||||||||
Portland General Electric Co. | 50,300 | 2,179,499 | ||||||
|
| |||||||
| Gas — 1.8% | ||||||||
PNM Resources, Inc. | 82,823 | 2,840,829 | ||||||
Southwest Gas Corp. | 18,490 | 1,416,704 | ||||||
|
| |||||||
| 4,257,533 | ||||||||
|
| |||||||
| 6,437,032 | ||||||||
|
| |||||||
| TOTAL COMMON STOCK (Cost $186,817,893) | 228,037,669 | |||||||
|
| |||||||
| TOTAL EQUITIES (Cost $186,817,893) | 228,037,669 | |||||||
|
| |||||||
| TOTAL LONG-TERM INVESTMENTS (Cost $186,817,893) | 228,037,669 | |||||||
|
| |||||||
The accompanying notes are an integral part of the financial statements.
119
Table of Contents
MML Small/Mid Cap Value Fund – Portfolio of Investments (Continued)
| Principal Amount | Value | |||||||
| SHORT-TERM INVESTMENTS — 1.6% | ||||||||
| Repurchase Agreement — 1.6% | ||||||||
State Street Bank & Trust Co. Repurchase Agreement, dated 12/30/16, 0.010%, due 1/03/17 (b) | $ | 3,703,328 | $ | 3,703,328 | ||||
|
| |||||||
| TOTAL SHORT-TERM INVESTMENTS (Cost $3,703,328) | 3,703,328 | |||||||
|
| |||||||
| TOTAL INVESTMENTS — 100.1% (Cost $190,521,221) (c) | 231,740,997 | |||||||
| Other Assets/(Liabilities) — (0.1)% | (328,484 | ) | ||||||
|
| |||||||
| NET ASSETS — 100.0% | $ | 231,412,513 | ||||||
|
| |||||||
Notes to Portfolio of Investments
Percentages are stated as a percent of net assets.
| (a) | Non-income producing security. |
| (b) | Maturity value of $3,703,332. Collateralized by U.S. Government Agency obligations with a rate of 3.125%, maturity date of 5/15/19, and an aggregate market value, including accrued interest, of $3,781,182. |
| (c) | See Note 6 for aggregate cost for federal tax purposes. |
The accompanying notes are an integral part of the financial statements.
120
Table of Contents
MML Total Return Bond Fund – Portfolio of Investments
December 31, 2016
| Principal Amount | Value | |||||||
| BONDS & NOTES — 100.6% | ||||||||
| BANK LOANS — 0.2% | ||||||||
| Diversified Financial — 0.2% | ||||||||
Delos Finance SARL, Term Loan B | $ | 840,000 | $ | 845,401 | ||||
|
| |||||||
| TOTAL BANK LOANS (Cost $837,073) | 845,401 | |||||||
|
| |||||||
| CORPORATE DEBT — 23.1% | ||||||||
| Aerospace & Defense — 0.2% | ||||||||
United Technologies Corp. STEP | 1,000,000 | 1,000,218 | ||||||
|
| |||||||
| Airlines — 0.6% | ||||||||
Continental Airlines Pass-Through Trust | 1,752,931 | 1,958,900 | ||||||
Northwest Airlines Pass-Through Trust | 380,692 | 436,845 | ||||||
|
| |||||||
| 2,395,745 | ||||||||
|
| |||||||
| Auto Manufacturers — 0.4% | ||||||||
Ford Motor Credit Co. LLC | 750,000 | 748,786 | ||||||
Ford Motor Credit Co. LLC | 500,000 | 500,724 | ||||||
General Motors Financial Co., Inc. | 500,000 | 509,484 | ||||||
|
| |||||||
| 1,758,994 | ||||||||
|
| |||||||
| Banks — 3.0% | ||||||||
American Express Centurion Bank | 750,000 | 773,185 | ||||||
Bank of America Corp. | 500,000 | 523,881 | ||||||
Bank of America Corp. | 500,000 | 514,489 | ||||||
CIT Group, Inc. (a) | 350,000 | 368,813 | ||||||
Citigroup, Inc. | 1,350,000 | 1,350,942 | ||||||
Citigroup, Inc. | 1,000,000 | 1,001,890 | ||||||
HBOS PLC (a) | 1,100,000 | 1,159,947 | ||||||
JP Morgan Chase & Co. 3 mo. USD LIBOR + .550%, FRN 1.432% 4/25/18 | 700,000 | 701,973 | ||||||
JP Morgan Chase & Co. | 895,000 | 854,267 | ||||||
Morgan Stanley 3 mo. USD LIBOR + | 1,000,000 | 1,010,465 | ||||||
Morgan Stanley | 500,000 | 520,415 | ||||||
| Principal Amount | Value | |||||||
Wells Fargo & Co. | $ | 710,000 | $ | 690,869 | ||||
Wells Fargo & Co. | 1,410,000 | 1,399,552 | ||||||
Wells Fargo & Co. | 475,000 | 453,260 | ||||||
Wells Fargo Bank NA | 1,000,000 | 999,380 | ||||||
|
| |||||||
| 12,323,328 | ||||||||
|
| |||||||
| Beverages — 0.4% | ||||||||
Anheuser-Busch InBev Finance, Inc. | 299,000 | 303,542 | ||||||
Anheuser-Busch InBev Finance, Inc. | 551,000 | 595,559 | ||||||
Constellation Brands, Inc. | 325,000 | 366,548 | ||||||
DS Services of America, Inc. (a) | 330,000 | 361,763 | ||||||
|
| |||||||
| 1,627,412 | ||||||||
|
| |||||||
| Biotechnology — 0.7% | ||||||||
Amgen, Inc. | 500,000 | 479,273 | ||||||
Celgene Corp. | 750,000 | 779,797 | ||||||
Gilead Sciences, Inc. | 600,000 | 612,436 | ||||||
Gilead Sciences, Inc. | 1,195,000 | 1,135,015 | ||||||
|
| |||||||
| 3,006,521 | ||||||||
|
| |||||||
| Chemicals — 0.1% | ||||||||
Axalta Coating Systems LLC (a) | 180,000 | 180,000 | ||||||
Valvoline, Inc. (a) | 200,000 | 207,000 | ||||||
|
| |||||||
| 387,000 | ||||||||
|
| |||||||
| Commercial Services — 0.2% | ||||||||
Catholic Health Initiatives | 500,000 | 486,460 | ||||||
IHS Markit Ltd. (a) | 225,000 | 233,437 | ||||||
|
| |||||||
| 719,897 | ||||||||
|
| |||||||
| Computers — 0.2% | ||||||||
Apple, Inc. | 850,000 | 917,872 | ||||||
|
| |||||||
| Diversified Financial — 4.0% | ||||||||
Federal Home Loan Banks STEP | 2,010,000 | 2,012,373 | ||||||
Federal Home Loan Mortgage Corp. | 700,000 | 696,281 | ||||||
The accompanying notes are an integral part of the financial statements.
121
Table of Contents
MML Total Return Bond Fund – Portfolio of Investments (Continued)
| Principal Amount | Value | |||||||
GE Capital International Funding Co. Unlimited Co. | $ | 780,000 | $ | 817,368 | ||||
General Electric Co. | 244,000 | 307,081 | ||||||
The Goldman Sachs Group, Inc. | 2,100,000 | 2,187,657 | ||||||
The Goldman Sachs Group, Inc. | 600,000 | 631,149 | ||||||
International Lease Finance Corp. (a) | 1,000,000 | 1,077,500 | ||||||
JP Morgan Chase & Co. 3 mo. USD LIBOR + .520%, FRN | 2,700,000 | 2,701,701 | ||||||
Merrill Lynch & Co., Inc. | 4,400,000 | 4,676,804 | ||||||
Morgan Stanley | 1,000,000 | 1,000,492 | ||||||
Morgan Stanley | 250,000 | 273,802 | ||||||
|
| |||||||
| 16,382,208 | ||||||||
|
| |||||||
| Electric — 2.6% | ||||||||
Commonwealth Edison Co. | 535,000 | 502,773 | ||||||
Dominion Resources, Inc. (a) | 1,000,000 | 995,347 | ||||||
Duke Energy Carolinas LLC | 1,000,000 | 993,099 | ||||||
Duquesne Light Holdings, Inc. (a) | 1,500,000 | 1,673,680 | ||||||
Emera US Finance LP (a) | 1,068,000 | 1,066,235 | ||||||
Florida Power & Light Co. | 1,200,000 | 1,180,054 | ||||||
Jersey Central Power & Light Co. (a) | 800,000 | 851,215 | ||||||
Jersey Central Power & Light Co. | 425,000 | 468,982 | ||||||
MidAmerican Energy Co. | 1,400,000 | 1,548,638 | ||||||
Southern California Edison Co. | 400,000 | 378,360 | ||||||
Southwestern Electric Power Co. | 800,000 | 960,404 | ||||||
|
| |||||||
| 10,618,787 | ||||||||
|
| |||||||
| Engineering & Construction — 0.1% | ||||||||
SBA Communications Corp. (a) | 240,000 | 237,000 | ||||||
|
| |||||||
| Entertainment — 0.1% | ||||||||
Churchill Downs, Inc. | 175,000 | 181,562 | ||||||
| Principal Amount | Value | |||||||
GLP Capital LP/GLP Financing II, Inc. | $ | 200,000 | $ | 208,580 | ||||
|
| |||||||
| 390,142 | ||||||||
|
| |||||||
| Food Services — 0.0% | ||||||||
Aramark Services, Inc. (a) | 200,000 | 198,000 | ||||||
|
| |||||||
| Foods — 0.4% | ||||||||
Kraft Heinz Foods Co. | 558,000 | 558,447 | ||||||
Lamb Weston Holdings, Inc. (a) | 210,000 | 207,769 | ||||||
Mondelez International Holdings Netherlands BV (a) | 1,195,000 | 1,171,449 | ||||||
|
| |||||||
| 1,937,665 | ||||||||
|
| |||||||
| Gas — 0.6% | ||||||||
CenterPoint Energy Resources Corp. | 1,095,000 | 1,243,794 | ||||||
Florida Gas Transmission Co. LLC (a) | 1,000,000 | 1,119,045 | ||||||
Southern Co. Gas Capital Corp. | 100,000 | 95,910 | ||||||
|
| |||||||
| 2,458,749 | ||||||||
|
| |||||||
| Health Care – Services — 1.1% | ||||||||
Aetna, Inc. | 885,000 | 871,733 | ||||||
Centene Corp. | 400,000 | 390,500 | ||||||
DaVita, Inc. | 415,000 | 408,256 | ||||||
HCA, Inc. | 800,000 | 823,000 | ||||||
Northwell Healthcare, Inc. | 585,000 | 538,552 | ||||||
Providence St Joseph Health Obligated Group | 845,000 | 799,919 | ||||||
RWJ Barnabas Health, Inc. | 595,000 | 548,020 | ||||||
Tenet Healthcare Corp. 3 mo. USD LIBOR + 3.500%, FRN | 350,000 | 352,625 | ||||||
Tenet Healthcare Corp. | 40,000 | 41,900 | ||||||
|
| |||||||
| 4,774,505 | ||||||||
|
| |||||||
| Household Products — 0.0% | ||||||||
Spectrum Brands, Inc. | 85,000 | 88,188 | ||||||
|
| |||||||
| Insurance — 1.0% | ||||||||
Berkshire Hathaway Finance Corp. | 500,000 | 516,566 | ||||||
The accompanying notes are an integral part of the financial statements.
122
Table of Contents
MML Total Return Bond Fund – Portfolio of Investments (Continued)
| Principal Amount | Value | |||||||
Berkshire Hathaway Finance Corp. | $ | 750,000 | $ | 789,565 | ||||
Farmers Exchange Capital III 3 mo. USD LIBOR + 3.454%, VRN (a) | 970,000 | 944,644 | ||||||
Metropolitan Life Global Funding I (a) | 1,100,000 | 1,069,394 | ||||||
New York Life Global Funding (a) | 750,000 | 747,855 | ||||||
|
| |||||||
| 4,068,024 | ||||||||
|
| |||||||
| Lodging — 0.1% | ||||||||
Hilton Worldwide Finance LLC/Hilton Worldwide Finance Corp. | 345,000 | 356,385 | ||||||
|
| |||||||
| Manufacturing — 0.1% | ||||||||
Siemens Financieringsmaatschappij NV (a) | 550,000 | 518,947 | ||||||
|
| |||||||
| Media — 0.6% | ||||||||
CCO Holdings LLC/CCO Holdings Capital Corp (a) | 150,000 | 160,125 | ||||||
Charter Communications Operating LLC/Charter Communications Operating Capital | 875,000 | 914,402 | ||||||
Charter Communications Operating LLC/Charter Communications Operating Capital | 200,000 | 231,216 | ||||||
CSC Holdings LLC (a) | 400,000 | 405,000 | ||||||
CSC Holdings LLC | 100,000 | 110,500 | ||||||
DISH DBS Corp. | 100,000 | 105,250 | ||||||
DISH DBS Corp. | 70,000 | 75,950 | ||||||
Sirius XM Radio, Inc. (a) | 205,000 | 208,075 | ||||||
Virgin Media Secured Finance PLC (a) | 200,000 | 197,500 | ||||||
|
| |||||||
| 2,408,018 | ||||||||
|
| |||||||
| Oil & Gas — 0.2% | ||||||||
Gulfport Energy Corp. (a) | 200,000 | 202,540 | ||||||
Noble Energy, Inc. | 140,000 | 142,606 | ||||||
Shell International Finance BV | 415,000 | 420,385 | ||||||
|
| |||||||
| 765,531 | ||||||||
|
| |||||||
| Principal Amount | Value | |||||||
| Packaging & Containers — 0.4% | ||||||||
Amcor Finance USA, Inc. (a) | $ | 650,000 | $ | 636,659 | ||||
Ball Corp. | 350,000 | 365,750 | ||||||
Graphic Packaging International, Inc. | 200,000 | 191,000 | ||||||
Sealed Air Corp. (a) | 390,000 | 402,675 | ||||||
|
| |||||||
| 1,596,084 | ||||||||
|
| |||||||
| Pharmaceuticals — 1.2% | ||||||||
AbbVie, Inc. | 500,000 | 500,376 | ||||||
AbbVie, Inc. | 357,000 | 339,659 | ||||||
AbbVie, Inc. | 500,000 | 495,244 | ||||||
Actavis Funding SCS | 1,350,000 | 1,351,590 | ||||||
Actavis Funding SCS | 300,000 | 294,520 | ||||||
Baxalta, Inc. | 725,000 | 724,819 | ||||||
Grifols Worldwide Operations Ltd. | 200,000 | 207,000 | ||||||
Quintiles Transnational Corp. (a) | 175,000 | 177,625 | ||||||
Shire Acquisitions Investments Ireland DAC | 500,000 | 493,661 | ||||||
Valeant Pharmaceuticals International, Inc. (a) | 400,000 | 300,000 | ||||||
Valeant Pharmaceuticals International, Inc. (a) | 100,000 | 77,500 | ||||||
Valeant Pharmaceuticals International, Inc. (a) | 50,000 | 37,563 | ||||||
|
| |||||||
| 4,999,557 | ||||||||
|
| |||||||
| Pipelines — 0.7% | ||||||||
Boardwalk Pipelines LLC | 1,000,000 | 1,002,664 | ||||||
Energy Transfer Partners LP | 567,000 | 557,648 | ||||||
Energy Transfer Partners LP 3 mo. USD LIBOR + 3.018%, FRN | 170,000 | 135,703 | ||||||
Energy Transfer Partners LP | 400,000 | 383,632 | ||||||
Rockies Express Pipeline LLC (a) | 155,000 | 163,137 | ||||||
The accompanying notes are an integral part of the financial statements.
123
Table of Contents
MML Total Return Bond Fund – Portfolio of Investments (Continued)
| Principal Amount | Value | |||||||
Rockies Express Pipeline LLC (a) | $ | 75,000 | $ | 78,750 | ||||
Williams Partners LP | 683,000 | 686,614 | ||||||
|
| |||||||
| 3,008,148 | ||||||||
|
| |||||||
| Real Estate — 0.4% | ||||||||
WEA Finance LLC/Westfield UK & Europe Finance PLC (a) | 1,550,000 | 1,550,964 | ||||||
|
| |||||||
| Real Estate Investment Trusts (REITS) — 1.8% | ||||||||
HCP, Inc. | 1,000,000 | 956,823 | ||||||
HCP, Inc. | 500,000 | 499,751 | ||||||
Highwoods Realty LP | 1,000,000 | 1,008,455 | ||||||
National Retail Properties, Inc. | 750,000 | 779,227 | ||||||
Realty Income Corp. | 750,000 | 752,116 | ||||||
Ventas Realty LP | 1,500,000 | 1,476,789 | ||||||
VEREIT Operating Partnership LP | 200,000 | 202,570 | ||||||
Welltower, Inc. | 830,000 | 848,253 | ||||||
Welltower, Inc. | 750,000 | 778,664 | ||||||
|
| |||||||
| 7,302,648 | ||||||||
|
| |||||||
| Retail — 0.3% | ||||||||
CVS Health Corp. | 535,000 | 509,944 | ||||||
Wal-Mart Stores, Inc. | 400,000 | 401,829 | ||||||
Walgreens Boots Alliance, Inc. | 275,000 | 282,648 | ||||||
|
| |||||||
| 1,194,421 | ||||||||
|
| |||||||
| Semiconductors — 0.1% | ||||||||
NXP BV/NXP Funding LLC (a) | 200,000 | 206,500 | ||||||
|
| |||||||
| Software — 0.4% | ||||||||
First Data Corp. (a) | 426,000 | 428,266 | ||||||
IMS Health, Inc. (a) | 200,000 | 200,500 | ||||||
Microsoft Corp. | 635,000 | 595,472 | ||||||
Oracle Corp. | 715,000 | 692,693 | ||||||
|
| |||||||
| 1,916,931 | ||||||||
|
| |||||||
| Principal Amount | Value | |||||||
| Telecommunications — 1.0% | ||||||||
Altice US Finance I Corp. (a) | $ | 425,000 | $ | 440,938 | ||||
AT&T, Inc. | 500,000 | 506,283 | ||||||
AT&T, Inc. | 300,000 | 317,303 | ||||||
AT&T, Inc. | 750,000 | 710,564 | ||||||
Level 3 Financing, Inc. (a) | 90,000 | 89,100 | ||||||
Level 3 Financing, Inc. | 175,000 | 179,375 | ||||||
Sprint Communications, Inc. (a) | 400,000 | 441,000 | ||||||
T-Mobile USA, Inc. | 345,000 | 358,800 | ||||||
T-Mobile USA, Inc. | 80,000 | 83,500 | ||||||
T-Mobile USA, Inc. | 184,000 | 192,280 | ||||||
Verizon Communications, Inc. | 600,000 | 575,347 | ||||||
Verizon Communications, Inc. | 200,000 | 202,659 | ||||||
|
| |||||||
| 4,097,149 | ||||||||
|
| |||||||
| Transportation — 0.1% | ||||||||
Burlington Northern Santa Fe LLC | 265,000 | 268,738 | ||||||
|
| |||||||
| TOTAL CORPORATE DEBT (Cost $96,285,086) | 95,480,276 | |||||||
|
| |||||||
| MUNICIPAL OBLIGATIONS — 1.1% | ||||||||
Alabama Economic Settlement Authority | 1,000,000 | 1,008,650 | ||||||
City of New York NY | 750,000 | 859,013 | ||||||
Los Angeles Community College District BAB | 900,000 | 1,295,766 | ||||||
New York City Water & Sewer System | 315,000 | 407,481 | ||||||
New York State Dormitory Authority | 750,000 | 874,192 | ||||||
|
| |||||||
| 4,445,102 | ||||||||
|
| |||||||
| TOTAL MUNICIPAL OBLIGATIONS (Cost $4,138,067) | 4,445,102 | |||||||
|
| |||||||
The accompanying notes are an integral part of the financial statements.
124
Table of Contents
MML Total Return Bond Fund – Portfolio of Investments (Continued)
| Principal Amount | Value | |||||||
| NON-U.S. GOVERNMENT AGENCY OBLIGATIONS — 14.1% | ||||||||
| Automobile ABS — 0.3% | ||||||||
Honda Auto Receivables Owner Trust, Series 2015-4, Class A2 | $ | 478,060 | $ | 477,705 | ||||
Nissan Auto Receivables Owner Trust, Series 2015-C, Class A2A | 488,022 | 487,632 | ||||||
Toyota Auto Receivables Owner Trust, Series 2014-A, Class A3 | 99,850 | 99,819 | ||||||
|
| |||||||
| 1,065,156 | ||||||||
|
| |||||||
| Commercial MBS — 1.6% | ||||||||
7 WTC Depositor LLC Trust, | 111,159 | 111,927 | ||||||
BAMLL Commercial Mortgage Securities Trust, Series 2012-PARK, Class A (a) | 375,000 | 377,071 | ||||||
Banc of America Large Loan, Inc., | 348,990 | 349,843 | ||||||
Citigroup Commercial Mortgage Trust, Series 2013-375P, Class A (a) | 340,000 | 346,054 | ||||||
COMM Mortgage Trust, | 340,000 | 347,386 | ||||||
COMM Mortgage Trust, | 325,000 | 351,555 | ||||||
GS Mortgage Securities Corp., | 370,000 | 386,631 | ||||||
JP Morgan Chase Commercial Mortgage Securities Corp., Series 2010-C2, Class A2 (a) | 862,629 | 875,378 | ||||||
Liberty Street Trust, Series 2016-225L, Class A (a) | 340,000 | 348,505 | ||||||
RBS Commercial Funding, Inc. Trust, Series 2013-GSP, Class A, VRN (a) | 330,000 | 345,729 | ||||||
SFAVE Commercial Mortgage Securities Trust, Series 2015-5AVE, | 370,000 | 363,840 | ||||||
TCW/Trust Co. West | 805,000 | 813,994 | ||||||
| Principal Amount | Value | |||||||
Wells Fargo Commercial Mortgage Trust, Series 2010-C1, Class A2 (a) | $ | 500,000 | $ | 532,382 | ||||
WF-RBS Commercial Mortgage Trust, Series 2011-C4, Class A4, VRN (a) | 800,000 | 877,165 | ||||||
|
| |||||||
| 6,427,460 | ||||||||
|
| |||||||
| Credit Card ABS — 0.2% | ||||||||
Chase Issuance Trust, Series 2015-A6, Class A6, 1 mo. LIBOR + .250%, FRN | 865,000 | 865,240 | ||||||
|
| |||||||
| Home Equity ABS — 0.7% | ||||||||
Bear Stearns I Trust, Series 2006-HE1, Class 1M1, 1 mo. USD LIBOR + .410%, FRN | 1,560,615 | 1,560,498 | ||||||
Wells Fargo Home Equity Trust, Series 2004-2, Class M3, 1 mo. USD LIBOR + 1.050%, FRN | 1,555,799 | 1,463,911 | ||||||
|
| |||||||
| 3,024,409 | ||||||||
|
| |||||||
| Other ABS — 1.7% | ||||||||
Blue Hill CLO Ltd., Series 2013-1A, Class A, 3 mo. USD LIBOR + | 950,000 | 950,290 | ||||||
Countrywide Asset-Backed Certificates, Series 2006-15, Class A3, VRN | 1,763,117 | 1,615,065 | ||||||
First Frankin Mortgage Loan Trust, Series 2005-FF7, Class M2, 1 mo. USD LIBOR + .470%, FRN | 897,688 | 886,602 | ||||||
Magnetite CLO Ltd., Series 2015-12A, Class AR, 3 mo. USD LIBOR + | 1,060,000 | 1,059,998 | ||||||
RAMP Trust, Series 2005-RS2, Class M2, 1 mo. USD LIBOR + | 629,146 | 628,584 | ||||||
Saxon Asset Securities Trust, Series 2005-1, Class M1, 1 mo. USD LIBOR + .690%, FRN | 1,307,500 | 1,276,499 | ||||||
Voya CLO Ltd., Series 2014-3A, Class A1, 3 mo. USD LIBOR + | 800,000 | 800,158 | ||||||
|
| |||||||
| 7,217,196 | ||||||||
|
| |||||||
The accompanying notes are an integral part of the financial statements.
125
Table of Contents
MML Total Return Bond Fund – Portfolio of Investments (Continued)
| Principal Amount | Value | |||||||
| Student Loans ABS — 4.9% | ||||||||
Access Group, Inc., Series 2015-1, Class A, 1 mo. USD LIBOR + .700%, FRN (a) | $ | 1,044,260 | $ | 1,032,007 | ||||
Collegiate Funding Services Education Loan Trust, Series 2005-A, Class A4, 3 mo. USD LIBOR + .200%, FRN | 1,500,000 | 1,391,837 | ||||||
Nelnet Student Loan Trust, Series 2015-1A, Class A, 1 mo. USD LIBOR + .590%, FRN (a) | 1,652,538 | 1,552,569 | ||||||
Nelnet Student Loan Trust, Series 2015-3A, Class A2, 1 mo. USD LIBOR + .600%, FRN (a) | 2,075,000 | 2,023,011 | ||||||
Pennsylvania Higher Education Assistance Agency, Series 2013-3A, Class A, 1 mo. USD LIBOR + .750%, FRN (a) | 1,499,823 | 1,481,889 | ||||||
SLC Student Loan Trust, Series 2006-2, Class A6, 3 mo. USD LIBOR + .160%, FRN | 2,300,000 | 2,023,036 | ||||||
SLC Student Loan Trust, Series 2005-2, Class B, 3 mo. USD LIBOR + .280%, FRN | 391,711 | 328,368 | ||||||
SLM Student Loan Trust, Series 2007-1, Class A5, 3 mo. USD LIBOR + .090%, FRN | 1,991,134 | 1,971,847 | ||||||
SLM Student Loan Trust, Series 2005-4, Class B, 3 mo. USD LIBOR + | 204,966 | 176,122 | ||||||
SLM Student Loan Trust, Series 2005-9, Class B, 3 mo. USD LIBOR + | 199,804 | 170,475 | ||||||
SLM Student Loan Trust, Series 2012-1, Class A2, 1 mo. USD LIBOR + | 335,464 | 335,209 | ||||||
SLM Student Loan Trust, Series 2007-6, Class A4, 3 mo. USD LIBOR + | 1,953,558 | 1,921,997 | ||||||
SLM Student Loan Trust, Series 2011-1, Class A1, 1 mo. USD LIBOR + | 1,020,419 | 1,018,841 | ||||||
| Principal Amount | Value | |||||||
SLM Student Loan Trust, Series 2012-2, Class A, 1 mo. USD LIBOR + .700%, FRN | $ | 1,504,313 | $ | 1,470,488 | ||||
SLM Student Loan Trust, Series 2007-6, Class B, 3 mo. USD LIBOR + .850%, FRN | 565,340 | 496,498 | ||||||
SLM Student Loan Trust, Series 2007-8, Class B, 3 mo. USD LIBOR + 1.000%, FRN | 200,203 | 175,060 | ||||||
SLM Student Loan Trust, Series 2008-9, Class A, 3 mo. USD LIBOR + 1.500%, FRN | 1,444,557 | 1,446,380 | ||||||
SLM Student Loan Trust, Series 2008-5, Class B, 3 mo. USD LIBOR + 1.850%, FRN | 700,000 | 651,770 | ||||||
SLM Student Loan Trust, Series 2008-9, Class B, 3 mo. USD LIBOR + 2.250%, FRN | 680,000 | 657,650 | ||||||
|
| |||||||
| 20,325,054 | ||||||||
|
| |||||||
| WL Collateral CMO — 4.7% | ||||||||
Chase Mortgage Finance Trust, | 855,827 | 798,347 | ||||||
Citigroup Mortgage Loan Trust, | 1,137,051 | 1,144,092 | ||||||
First Horizon Mortgage Pass-Through Trust, Series 2005-AR5, Class 2A1, VRN | 1,408,531 | 1,335,988 | ||||||
Impac CMB Trust, Series 2005-1, Class 1A1, 1 mo. USD LIBOR + | 1,687,625 | 1,557,340 | ||||||
IndyMac Index Mortgage Loan Trust, Series 2006-AR27, Class 1A3, 1 mo. USD LIBOR + .270%, FRN | 2,608,279 | 1,788,216 | ||||||
IndyMac Index Mortgage Loan Trust, Series 2005-AR19, Class A1, VRN | 1,604,072 | 1,365,861 | ||||||
Morgan Stanley Resecuritization Trust, Series 2014-R9, Class 3A, 12 mo. MTA + .840%, FRN (a) | 1,589,911 | 1,528,215 | ||||||
The accompanying notes are an integral part of the financial statements.
126
Table of Contents
MML Total Return Bond Fund – Portfolio of Investments (Continued)
| Principal Amount | Value | |||||||
Nomura Asset Acceptance Corp. Alternative Loan Trust, Series 2005-AR1, Class M1, 1 mo. LIBOR + 1.070%, FRN | $ | 3,073,311 | $ | 2,893,029 | ||||
Nomura Resecuritization Trust, Series 2015-1R, Class 6A1, 1 mo. USD LIBOR + .210%, FRN (a) | 1,048,412 | 1,030,366 | ||||||
Washington Mutual Mortgage Pass-Through Certificates, | 1,419,909 | 1,361,594 | ||||||
Washington Mutual Mortgage Pass-Through Certificates, Series 2005-AR2, Class 2A21, 1 mo. USD LIBOR + .330%, FRN | 1,357,352 | 1,306,123 | ||||||
Washington Mutual Mortgage Pass-Through Certificates, Series 2006-1 Class 3A2 | 1,492,527 | 1,405,723 | ||||||
Wells Fargo Mortgage Backed Securities Trust, Series 2006-AR8, Class 3A1, VRN | 1,438,823 | 1,428,476 | ||||||
Wells Fargo Mortgage Backed Securities Trust, Series 2004-DD, Class 2A6, VRN | 417,322 | 431,597 | ||||||
|
| |||||||
| 19,374,967 | ||||||||
|
| |||||||
| TOTAL NON-U.S. GOVERNMENT AGENCY OBLIGATIONS (Cost $57,722,327) | 58,299,482 | |||||||
|
| |||||||
| U.S. GOVERNMENT AGENCY OBLIGATIONS AND INSTRUMENTALITIES — 27.2% | ||||||||
| Pass-Through Securities — 27.2% | ||||||||
Federal Home Loan Mortgage Corp. |
| |||||||
Pool #G18622 2.500% | 2,898,464 | 2,907,974 | ||||||
Pool #G18592 3.000% | 776,649 | 798,280 | ||||||
Pool #G18627 3.000% | 2,190,000 | 2,250,995 | ||||||
Pool #G08710 3.000% | 457,308 | 454,860 | ||||||
Pool #G08715 3.000% | 3,478,041 | 3,459,428 | ||||||
Pool #G08726 3.000% | 3,316,295 | 3,299,584 | ||||||
| Principal Amount | Value | |||||||
Pool #G08732 3.000% | $ | 1,158,046 | $ | 1,152,211 | ||||
Pool #G08737 3.000% | 413,968 | 411,882 | ||||||
Pool #G08741 3.000% | 2,830,000 | 2,815,739 | ||||||
Pool #G07848 3.500% | 3,189,965 | 3,302,486 | ||||||
Pool #G07924 3.500% | 3,276,131 | 3,376,335 | ||||||
Pool #G60023 3.500% | 3,348,948 | 3,457,657 | ||||||
Pool #G60238 3.500% | 911,008 | 938,018 | ||||||
Pool #G08698 3.500% | 4,600,607 | 4,715,442 | ||||||
Pool #G08702 3.500% | 1,298,306 | 1,330,814 | ||||||
Pool #G08706 3.500% | 569,439 | 583,698 | ||||||
Pool #G08711 3.500% | 1,966,344 | 2,015,733 | ||||||
Pool #G08716 3.500% | 2,716,667 | 2,784,902 | ||||||
Pool #G67700 3.500% | 3,689,158 | 3,799,689 | ||||||
Pool #G08722 3.500% | 543,919 | 557,581 | ||||||
Pool #G08677 4.000% | 1,299,339 | 1,366,691 | ||||||
Pool #G60344 4.000% | 2,231,767 | 2,362,796 | ||||||
Pool #G08703 4.000% | 1,006,303 | 1,057,837 | ||||||
Pool #G08707 4.000% | 2,258,722 | 2,373,688 | ||||||
Federal National Mortgage Association |
| |||||||
Pool #AM0359 2.310% | 500,000 | 495,516 | ||||||
Pool #AM0992 2.340% | 820,000 | 811,453 | ||||||
Pool #AM1402 2.420% | 945,000 | 938,788 | ||||||
Pool #MA2740 2.500% | 1,883,622 | 1,919,234 | ||||||
Pool #AM0827 2.600% | 999,524 | 1,005,098 | ||||||
Pool #AN2913 2.610% | 725,000 | 688,081 | ||||||
Pool #AM2808 2.700% | 375,000 | 377,180 | ||||||
Pool #AN1089 2.740% | 690,000 | 678,041 | ||||||
The accompanying notes are an integral part of the financial statements.
127
Table of Contents
MML Total Return Bond Fund – Portfolio of Investments (Continued)
| Principal Amount | Value | |||||||
Pool #AL6829 2.965% | $ | 1,369,662 | $ | 1,362,499 | ||||
Pool #MA1607 3.000% | 914,997 | 934,763 | ||||||
Pool #AM9343 3.380% | 650,000 | 656,605 | ||||||
Pool #AB4262 3.500% | 1,016,987 | 1,062,315 | ||||||
Pool #MA1512 3.500% | 448,800 | 468,382 | ||||||
Pool #MA1148 3.500% | 3,053,199 | 3,140,621 | ||||||
Pool #469621 3.650% | 1,596,588 | 1,681,638 | ||||||
Pool #AL7916 3.820% | 1,733,701 | 1,827,520 | ||||||
Pool #AM4108 3.850% | 380,557 | 402,968 | ||||||
Pool #AM4109 3.850% | 423,370 | 448,301 | ||||||
Pool #466960 3.890% | 1,140,949 | 1,205,870 | ||||||
Pool #466919 3.930% | 1,475,916 | 1,563,270 | ||||||
Pool #AM4236 3.940% | 630,187 | 670,909 | ||||||
Pool #468551 3.980% | 1,230,000 | 1,310,906 | ||||||
Pool #AL9027 4.000% | 2,552,146 | 2,687,429 | ||||||
Pool #AL9549 4.000% | 1,205,000 | 1,268,874 | ||||||
Pool #AM5165 4.080% | 653,073 | 699,981 | ||||||
Pool #931504 4.500% | 133,138 | 145,989 | ||||||
Pool #986268 5.000% | 2,112 | 2,317 | ||||||
Pool #AD6374 5.000% | 44,788 | 49,057 | ||||||
Pool #AE6338 5.000% | 58,063 | 63,560 | ||||||
Pool #AI2733 5.000% | 448,838 | 491,337 | ||||||
Pool #977014 5.500% | 48,678 | 54,958 | ||||||
Pool #985524 5.500% | 43,997 | 49,372 | ||||||
Pool #988578 5.500% | 342,913 | 384,800 | ||||||
Pool #995482 5.500% | 231,917 | 262,057 | ||||||
Federal National Mortgage Association TBA |
| |||||||
Pool #3348 2.500% | 2,580,000 | 2,585,845 | ||||||
| Principal Amount | Value | |||||||
Pool #1312 3.000% | $ | 1,665,000 | $ | 1,708,836 | ||||
Pool #4241 3.000% | 4,165,000 | 4,140,921 | ||||||
Pool #1963 3.500% | 4,020,000 | 4,120,500 | ||||||
Pool #9174 4.000% | 4,445,000 | 4,672,806 | ||||||
Government National Mortgage Association, Pool #MA3736 3.500% 6/20/46 | 1,232,746 | 1,283,115 | ||||||
Government National Mortgage Association II |
| |||||||
Pool #MA4126 3.000% | 2,945,000 | 2,987,679 | ||||||
Pool #MA3521 3.500% | 1,394,219 | 1,451,077 | ||||||
Pool #MA3597 3.500% | 896,682 | 933,250 | ||||||
Pool #MA3663 3.500% | 639,667 | 665,803 | ||||||
Pool #MA3937 3.500% | 495,195 | 516,124 | ||||||
Government National Mortgage Association II TBA |
| |||||||
Pool #188 3.000% | 2,020,000 | 2,045,881 | ||||||
Pool #207 3.500% | 3,590,000 | 3,733,039 | ||||||
|
| |||||||
| 112,228,885 | ||||||||
|
| |||||||
| TOTAL U.S. GOVERNMENT AGENCY OBLIGATIONS AND INSTRUMENTALITIES (Cost $113,792,214) | 112,228,885 | |||||||
|
| |||||||
| U.S. TREASURY OBLIGATIONS — 34.9% | ||||||||
| U.S. Treasury Bonds & Notes — 34.9% | ||||||||
U.S. Treasury Bond | 15,265,000 | 14,739,073 | ||||||
U.S. Treasury Inflation Index | 4,757,026 | 4,731,186 | ||||||
U.S. Treasury Inflation Index | 3,259,106 | 3,066,626 | ||||||
U.S. Treasury Inflation Index | 1,431,281 | 1,561,973 | ||||||
U.S. Treasury Note | 6,115,000 | 6,109,058 | ||||||
U.S. Treasury Note | 8,470,000 | 8,408,832 | ||||||
U.S. Treasury Note | 3,475,000 | 3,477,257 | ||||||
U.S. Treasury Note | 9,015,000 | 8,985,860 | ||||||
U.S. Treasury Note | 4,955,000 | 4,804,947 | ||||||
The accompanying notes are an integral part of the financial statements.
128
Table of Contents
MML Total Return Bond Fund – Portfolio of Investments (Continued)
| Principal Amount | Value | |||||||
U.S. Treasury Note | $ | 20,095,000 | $ | 20,209,604 | ||||
U.S. Treasury Note | 3,925,000 | 3,946,158 | ||||||
U.S. Treasury Note | 8,885,000 | 8,683,786 | ||||||
U.S. Treasury Note | 14,435,000 | 14,328,288 | ||||||
U.S. Treasury Note | 21,225,000 | 21,298,627 | ||||||
U.S. Treasury Note | 20,360,000 | 19,593,320 | ||||||
|
| |||||||
| 143,944,595 | ||||||||
|
| |||||||
| TOTAL U.S. TREASURY OBLIGATIONS (Cost $144,602,542) | 143,944,595 | |||||||
|
| |||||||
| TOTAL BONDS & NOTES (Cost $417,377,309) | 415,243,741 | |||||||
|
| |||||||
| TOTAL LONG-TERM INVESTMENTS (Cost $417,377,309) | 415,243,741 | |||||||
|
| |||||||
| SHORT-TERM INVESTMENTS — 10.6% | ||||||||
| Repurchase Agreement — 6.7% | ||||||||
State Street Bank & Trust Co. Repurchase Agreement, dated 12/30/16, | 27,469,182 | 27,469,182 | ||||||
|
| |||||||
| Sovereign Debt Obligations — 3.8% | ||||||||
Japan Treasury Discount Bill JPY (d) 0.000% 1/10/17 | 1,200,000,000 | 10,267,328 | ||||||
Japan Treasury Discount Bill JPY (d) 0.000% 3/13/17 | 630,000,000 | 5,393,382 | ||||||
|
| |||||||
| 15,660,710 | ||||||||
|
| |||||||
| U.S. Treasury Bill — 0.1% | ||||||||
U.S. Treasury Bill (e) | 223,000 | 222,697 | ||||||
|
| |||||||
| TOTAL SHORT-TERM INVESTMENTS (Cost $45,096,323) | 43,352,589 | |||||||
|
| |||||||
| TOTAL INVESTMENTS — 111.2% (Cost $462,473,632) (f) | 458,596,330 | |||||||
| Other Assets/(Liabilities) — (11.2)% | (46,241,857 | ) | ||||||
|
| |||||||
| NET ASSETS — 100.0% | $ | 412,354,473 | ||||||
|
| |||||||
Notes to Portfolio of Investments
Percentages are stated as a percent of net assets.
| ABS | Asset-Backed Security |
| BAB | Build America Bonds |
| CLO | Collateralized Loan Obligation |
| CMO | Collateralized Mortgage Obligation |
| CMT | Constant Maturity Treasury Index |
| FRN | Floating Rate Note |
| MBS | Mortgage-Backed Security |
| MTA | Monthly Treasury Average Index |
| STEP | Step Up Bond |
| TBA | To Be Announced |
| VRN | Variable Rate Note |
| WL | Whole Loan |
| (a) | Securities exempt from registration under rule 144A of the Securities Act of 1933. These securities may be resold in transactions exempt from registration, normally to qualified institutional buyers. At December 31, 2016, these securities amounted to a value of $37,865,426 or 9.18% of net assets. |
| (b) | A portion of this security is purchased on a when-issued, delayed-delivery or forward commitment basis. (Note 2). |
| (c) | Maturity value of $27,469,212. Collateralized by U.S. Government Agency obligations with a rate of 2.250%, maturity date of 7/31/21, and an aggregate market value, including accrued interest, of $28,018,584. |
| (d) | The principal amount of the security is in foreign currency. The market value is in U.S. dollars. |
| (e) | A portion of this security is held as collateral for open futures contracts. (Note 2). |
| (f) | See Note 6 for aggregate cost for federal tax purposes. |
The accompanying notes are an integral part of the financial statements.
129
Table of Contents
MML Series Investment Fund – Financial Statements
Statements of Assets and Liabilities
December 31, 2016
| MML Blue Chip Growth Fund | MML Equity Income Fund | |||||||
| Assets: | ||||||||
Investments, at value (Note 2) (a) | $ | 378,044,942 | $ | 480,460,855 | ||||
Repurchase agreements, at value (b) | 3,657,524 | 9,915,158 | ||||||
Other short-term investments, at value (Note 2) (c) | - | 43,397 | ||||||
|
|
|
| |||||
Total investments (d) | 381,702,466 | 490,419,410 | ||||||
|
|
|
| |||||
Foreign currency, at value (e) | - | 123 | ||||||
Receivables from: | ||||||||
Investments sold | 484,502 | 84,730 | ||||||
Fund shares sold | 120,935 | 106,717 | ||||||
Interest and dividends | 188,379 | 912,639 | ||||||
Foreign taxes withheld | - | - | ||||||
|
|
|
| |||||
Total assets | 382,496,282 | 491,523,619 | ||||||
|
|
|
| |||||
| Liabilities: | ||||||||
Payables for: | ||||||||
Investments purchased | 1,874,516 | - | ||||||
Fund shares repurchased | 137,233 | 85,755 | ||||||
Securities on loan (Note 2) | - | - | ||||||
Trustees’ fees and expenses (Note 3) | 53,292 | 81,423 | ||||||
Variation margin on open derivative instruments (Note 2) | - | - | ||||||
Affiliates (Note 3): | ||||||||
Investment advisory fees | 247,976 | 314,215 | ||||||
Administration fees | - | - | ||||||
Service fees | 28,740 | 45,325 | ||||||
Accrued expense and other liabilities | 55,694 | 46,320 | ||||||
|
|
|
| |||||
Total liabilities | 2,397,451 | 573,038 | ||||||
|
|
|
| |||||
Net assets | $ | 380,098,831 | $ | 490,950,581 | ||||
|
|
|
| |||||
| Net assets consist of: | ||||||||
Paid-in capital | $ | 233,349,460 | $ | 343,181,045 | ||||
Undistributed (accumulated) net investment income (loss) | (33,171 | ) | 10,818,884 | |||||
Accumulated net realized gain (loss) on investments and foreign currency transactions | 30,501,554 | 31,716,500 | ||||||
Net unrealized appreciation (depreciation) on investments and foreign currency translations | 116,280,988 | 105,234,152 | ||||||
|
|
|
| |||||
Net assets | $ | 380,098,831 | $ | 490,950,581 | ||||
|
|
|
| |||||
(a) Cost of investments: | $ | 261,763,986 | $ | 375,227,023 | ||||
(b) Cost of repurchase agreements: | $ | 3,657,524 | $ | 9,915,158 | ||||
(c) Cost of other short-term investments: | $ | - | $ | 43,397 | ||||
(d) Securities on loan with market value of: | $ | - | $ | - | ||||
(e) Cost of foreign currency: | $ | - | $ | 123 | ||||
The accompanying notes are an integral part of the financial statements.
130
Table of Contents
| MML Equity Index Fund | MML Focused Equity Fund | MML Foreign Fund | MML Fundamental Growth Fund | MML Fundamental Value Fund | ||||||||||||||
| $ | 544,030,340 | $ | 132,790,278 | $ | 351,553,853 | $ | 169,358,132 | $ | 232,502,824 | |||||||||
| 18,414,468 | 3,141,952 | 9,225,651 | 129,588 | 1,151,582 | ||||||||||||||
| 1,211,837 | - | - | - | 18,060 | ||||||||||||||
|
|
|
|
|
|
|
|
|
| |||||||||
| 563,656,645 | 135,932,230 | 360,779,504 | 169,487,720 | 233,672,466 | ||||||||||||||
|
|
|
|
|
|
|
|
|
| |||||||||
| - | - | 15,775 | - | - | ||||||||||||||
| - | - | 25,490 | 107,960 | - | ||||||||||||||
| 11,744 | 59,756 | 44,502 | 69,543 | 69,787 | ||||||||||||||
| 668,165 | 45,852 | 434,252 | 115,192 | 285,440 | ||||||||||||||
| - | - | 425,767 | 527 | 51,407 | ||||||||||||||
|
|
|
|
|
|
|
|
|
| |||||||||
| 564,336,554 | 136,037,838 | 361,725,290 | 169,780,942 | 234,079,100 | ||||||||||||||
|
|
|
|
|
|
|
|
|
| |||||||||
| - | - | 52,866 | 118,352 | 651,202 | ||||||||||||||
| 6,406 | 68,228 | 71,411 | 40,089 | 90,784 | ||||||||||||||
| - | - | 2,095,368 | - | - | ||||||||||||||
| 102,071 | 16,156 | 58,338 | 20,795 | 25,431 | ||||||||||||||
| 80,053 | - | - | - | - | ||||||||||||||
| 44,866 | 84,316 | 272,472 | 91,267 | 119,959 | ||||||||||||||
| 50,178 | 18,068 | - | 22,081 | 29,990 | ||||||||||||||
| 25,993 | 4,033 | 6,832 | 2,464 | 5,489 | ||||||||||||||
| 52,432 | 28,905 | 100,470 | 39,617 | 35,623 | ||||||||||||||
|
|
|
|
|
|
|
|
|
| |||||||||
| 361,999 | 219,706 | 2,657,757 | 334,665 | 958,478 | ||||||||||||||
|
|
|
|
|
|
|
|
|
| |||||||||
| $ | 563,974,555 | $ | 135,818,132 | $ | 359,067,533 | $ | 169,446,277 | $ | 233,120,622 | |||||||||
|
|
|
|
|
|
|
|
|
| |||||||||
| $ | 334,108,373 | $ | 95,424,192 | $ | 369,717,851 | $ | 131,587,209 | $ | 161,309,232 | |||||||||
| 8,699,279 | 1,607,936 | 7,399,681 | 1,372,286 | 4,200,172 | ||||||||||||||
| 11,971,926 | 12,576,122 | (20,556,313 | ) | 13,893,405 | 15,977,367 | |||||||||||||
| 209,194,977 | 26,209,882 | 2,506,314 | 22,593,377 | 51,633,851 | ||||||||||||||
|
|
|
|
|
|
|
|
|
| |||||||||
| $ | 563,974,555 | $ | 135,818,132 | $ | 359,067,533 | $ | 169,446,277 | $ | 233,120,622 | |||||||||
|
|
|
|
|
|
|
|
|
| |||||||||
| $ | 334,711,231 | $ | 106,580,396 | $ | 349,012,611 | $ | 146,764,755 | $ | 180,864,972 | |||||||||
| $ | 18,414,468 | $ | 3,141,952 | $ | 9,225,651 | $ | 129,588 | $ | 1,151,582 | |||||||||
| $ | 1,211,851 | $ | - | $ | - | $ | - | $ | 18,060 | |||||||||
| $ | - | $ | - | $ | 1,993,224 | $ | - | $ | - | |||||||||
| $ | - | $ | - | $ | 15,815 | $ | - | $ | - | |||||||||
131
Table of Contents
MML Series Investment Fund – Financial Statements (Continued)
Statements of Assets and Liabilities
December 31, 2016
| MML Blue Chip Growth Fund | MML Equity Income Fund | |||||||
| Initial Class shares: | ||||||||
Net assets | $ | 332,687,932 | $ | 413,303,858 | ||||
|
|
|
| |||||
Shares outstanding (a) | 23,803,773 | 35,073,014 | ||||||
|
|
|
| |||||
Net asset value, offering price and redemption price per share | $ | 13.98 | $ | 11.78 | ||||
|
|
|
| |||||
| Class I shares: | ||||||||
Net assets | $ | - | $ | - | ||||
|
|
|
| |||||
Shares outstanding (a) | - | - | ||||||
|
|
|
| |||||
Net asset value, offering price and redemption price per share | $ | - | $ | - | ||||
|
|
|
| |||||
| Class II shares: | ||||||||
Net assets | $ | - | $ | - | ||||
|
|
|
| |||||
Shares outstanding (a) | - | - | ||||||
|
|
|
| |||||
Net asset value, offering price and redemption price per share | $ | - | $ | - | ||||
|
|
|
| |||||
| Class III shares: | ||||||||
Net assets | $ | - | $ | - | ||||
|
|
|
| |||||
Shares outstanding (a) | - | - | ||||||
|
|
|
| |||||
Net asset value, offering price and redemption price per share | $ | - | $ | - | ||||
|
|
|
| |||||
| Service Class shares: | ||||||||
Net assets | $ | 47,410,899 | $ | 77,646,723 | ||||
|
|
|
| |||||
Shares outstanding (a) | 3,480,116 | 6,649,714 | ||||||
|
|
|
| |||||
Net asset value, offering price and redemption price per share | $ | 13.62 | $ | 11.68 | ||||
|
|
|
| |||||
| Service Class I shares:: | ||||||||
Net assets | $ | - | $ | - | ||||
|
|
|
| |||||
Shares outstanding (a) | - | - | ||||||
|
|
|
| |||||
Net asset value, offering price and redemption price per share | $ | - | $ | - | ||||
|
|
|
| |||||
| (a) | Authorized unlimited number of shares with no par value. |
The accompanying notes are an integral part of the financial statements.
132
Table of Contents
| MML Equity Index Fund | MML Focused Equity Fund | MML Foreign Fund | MML Fundamental Growth Fund | MML Fundamental Value Fund | ||||||||||||||
| $ | - | $ | - | $ | 348,836,482 | $ | - | $ | - | |||||||||
|
|
|
|
|
|
|
|
|
| |||||||||
| - | - | 36,958,606 | - | - | ||||||||||||||
|
|
|
|
|
|
|
|
|
| |||||||||
| $ | - | $ | - | $ | 9.44 | $ | - | $ | - | |||||||||
|
|
|
|
|
|
|
|
|
| |||||||||
| $ | 66,342,998 | $ | - | $ | - | $ | - | $ | - | |||||||||
|
|
|
|
|
|
|
|
|
| |||||||||
| 2,500,566 | - | - | - | - | ||||||||||||||
|
|
|
|
|
|
|
|
|
| |||||||||
| $ | 26.53 | $ | - | $ | - | $ | - | $ | - | |||||||||
|
|
|
|
|
|
|
|
|
| |||||||||
| $ | 175,525,450 | $ | 128,989,570 | $ | - | $ | 165,183,026 | $ | 223,801,367 | |||||||||
|
|
|
|
|
|
|
|
|
| |||||||||
| 6,610,845 | 9,770,274 | - | 14,461,574 | 15,182,852 | ||||||||||||||
|
|
|
|
|
|
|
|
|
| |||||||||
| $ | 26.55 | $ | 13.20 | $ | - | $ | 11.42 | $ | 14.74 | |||||||||
|
|
|
|
|
|
|
|
|
| |||||||||
| $ | 279,940,934 | $ | - | $ | - | $ | - | $ | - | |||||||||
|
|
|
|
|
|
|
|
|
| |||||||||
| 10,560,363 | - | - | - | - | ||||||||||||||
|
|
|
|
|
|
|
|
|
| |||||||||
| $ | 26.51 | $ | - | $ | - | $ | - | $ | - | |||||||||
|
|
|
|
|
|
|
|
|
| |||||||||
| $ | - | $ | - | $ | 10,231,051 | $ | - | $ | - | |||||||||
|
|
|
|
|
|
|
|
|
| |||||||||
| - | - | 1,090,682 | - | - | ||||||||||||||
|
|
|
|
|
|
|
|
|
| |||||||||
| $ | - | $ | - | $ | 9.38 | $ | - | $ | - | |||||||||
|
|
|
|
|
|
|
|
|
| |||||||||
| $ | 42,165,173 | $ | 6,828,562 | $ | - | $ | 4,263,251 | $ | 9,319,255 | |||||||||
|
|
|
|
|
|
|
|
|
| |||||||||
| 1,632,088 | 521,054 | - | 377,645 | 639,792 | ||||||||||||||
|
|
|
|
|
|
|
|
|
| |||||||||
| $ | 25.84 | $ | 13.11 | $ | - | $ | 11.29 | $ | 14.57 | |||||||||
|
|
|
|
|
|
|
|
|
| |||||||||
133
Table of Contents
MML Series Investment Fund – Financial Statements (Continued)
Statements of Assets and Liabilities
December 31, 2016
| MML Global Fund | MML Growth & Income Fund | |||||||
| Assets: | ||||||||
Investments, at value (Note 2) (a) | $ | 248,310,021 | $ | 125,098,410 | ||||
Repurchase agreements, at value (b) | 1,217,925 | 905,307 | ||||||
Other short-term investments, at value (Note 2) (c) | 18,129 | 8,174 | ||||||
|
|
|
| |||||
Total investments (d) | 249,546,075 | 126,011,891 | ||||||
|
|
|
| |||||
Foreign currency, at value (e) | 16,551 | 1 | ||||||
Receivables from: | ||||||||
Investments sold | - | - | ||||||
Open forward foreign currency contracts (Note 2) | - | - | ||||||
Investment adviser (Note 3) | - | - | ||||||
Fund shares sold | 62,170 | 106,379 | ||||||
Interest and dividends | 205,134 | 128,389 | ||||||
Foreign taxes withheld | 254,012 | - | ||||||
|
|
|
| |||||
Total assets | 250,083,942 | 126,246,660 | ||||||
|
|
|
| |||||
| Liabilities: | ||||||||
Payables for: | ||||||||
Investments purchased | - | - | ||||||
Written options outstanding, at value (Note 2) (f) | - | - | ||||||
Open forward foreign currency contracts (Note 2) | - | - | ||||||
Fund shares repurchased | 43,746 | 67,182 | ||||||
Securities on loan (Note 2) | 3,209,958 | - | ||||||
Trustees’ fees and expenses (Note 3) | 24,440 | 28,812 | ||||||
Affiliates (Note 3): | ||||||||
Investment advisory fees | 125,204 | 53,557 | ||||||
Administration fees | 31,301 | - | ||||||
Service fees | 7,695 | 13,886 | ||||||
Accrued expense and other liabilities | 58,027 | 28,890 | ||||||
|
|
|
| |||||
Total liabilities | 3,500,371 | 192,327 | ||||||
|
|
|
| |||||
Net assets | $ | 246,583,571 | $ | 126,054,333 | ||||
|
|
|
| |||||
| Net assets consist of: | ||||||||
Paid-in capital | $ | 193,598,102 | $ | 103,811,944 | ||||
Undistributed (accumulated) net investment income (loss) | 2,804,692 | 1,261,399 | ||||||
Accumulated net realized gain (loss) on investments and foreign currency transactions | 18,228,309 | (14,374,034 | ) | |||||
Net unrealized appreciation (depreciation) on investments and foreign currency translations | 31,952,468 | 35,355,024 | ||||||
|
|
|
| |||||
Net assets | $ | 246,583,571 | $ | 126,054,333 | ||||
|
|
|
| |||||
(a) Cost of investments: | $ | 216,335,664 | $ | 89,743,386 | ||||
(b) Cost of repurchase agreements: | $ | 1,217,925 | $ | 905,307 | ||||
(c) Cost of other short-term investments: | $ | 18,129 | $ | 8,174 | ||||
(d) Securities on loan with market value of: | $ | 3,144,762 | $ | - | ||||
(e) Cost of foreign currency: | $ | 16,586 | $ | 1 | ||||
(f) Premiums on written options: | $ | - | $ | - | ||||
The accompanying notes are an integral part of the financial statements.
134
Table of Contents
| MML Income & Growth Fund | MML International Equity Fund | MML Large Cap Growth Fund | MML Managed Volatility Fund | MML Mid Cap Growth Fund | ||||||||||||||
| $ | 266,898,748 | $ | 148,377,331 | $ | 105,756,497 | $ | 182,457,774 | $ | 421,147,186 | |||||||||
| 11,374,171 | 3,166,695 | 1,202,159 | 5,163,935 | 15,573,326 | ||||||||||||||
| - | - | - | 1,188 | - | ||||||||||||||
|
|
|
|
|
|
|
|
|
| |||||||||
| 278,272,919 | 151,544,026 | 106,958,656 | 187,622,897 | 436,720,512 | ||||||||||||||
|
|
|
|
|
|
|
|
|
| |||||||||
| 1,093 | 10,781 | - | 17,721 | 1,646 | ||||||||||||||
| - | 110,150 | - | - | 295,617 | ||||||||||||||
| - | 294,394 | - | - | - | ||||||||||||||
| - | 9,897 | - | - | - | ||||||||||||||
| 55,107 | 36,047 | 69,402 | 7,517 | 67,216 | ||||||||||||||
| 465,091 | 78,024 | 56,756 | 234,125 | 224,528 | ||||||||||||||
| - | 340,620 | 5,816 | - | - | ||||||||||||||
|
|
|
|
|
|
|
|
|
| |||||||||
| 278,794,210 | 152,423,939 | 107,090,630 | 187,882,260 | 437,309,519 | ||||||||||||||
|
|
|
|
|
|
|
|
|
| |||||||||
| - | 235,954 | - | - | 818,764 | ||||||||||||||
| - | - | - | 3,424,740 | - | ||||||||||||||
| - | 370 | - | - | - | ||||||||||||||
| 53,643 | 20,337 | 38,832 | 70,783 | 123,916 | ||||||||||||||
| - | 145,010 | - | - | 11,944,642 | ||||||||||||||
| 32,799 | 9,525 | 26,451 | 50,474 | 60,755 | ||||||||||||||
| 154,103 | 104,188 | 70,062 | 117,565 | 279,394 | ||||||||||||||
| - | 19,535 | - | - | - | ||||||||||||||
| 12,083 | 624 | 2,216 | 20,475 | 44,113 | ||||||||||||||
| 41,861 | 72,321 | 33,222 | 92,267 | 57,380 | ||||||||||||||
|
|
|
|
|
|
|
|
|
| |||||||||
| 294,489 | 607,864 | 170,783 | 3,776,304 | 13,328,964 | ||||||||||||||
|
|
|
|
|
|
|
|
|
| |||||||||
| $ | 278,499,721 | $ | 151,816,075 | $ | 106,919,847 | $ | 184,105,956 | $ | 423,980,555 | |||||||||
|
|
|
|
|
|
|
|
|
| |||||||||
| $ | 200,371,179 | $ | 163,633,895 | $ | 70,902,767 | $ | 157,757,398 | $ | 276,176,149 | |||||||||
| 4,967,449 | 2,549,717 | 379,013 | 2,303,224 | (153,367 | ) | |||||||||||||
| 20,583,204 | (16,842,499 | ) | 27,572,315 | (4,511,108 | ) | 43,953,512 | ||||||||||||
| 52,577,889 | 2,474,962 | 8,065,752 | 28,556,442 | 104,004,261 | ||||||||||||||
|
|
|
|
|
|
|
|
|
| |||||||||
| $ | 278,499,721 | $ | 151,816,075 | $ | 106,919,847 | $ | 184,105,956 | $ | 423,980,555 | |||||||||
|
|
|
|
|
|
|
|
|
| |||||||||
| $ | 214,320,685 | $ | 146,149,569 | $ | 97,690,745 | $ | 153,675,824 | $ | 317,142,939 | |||||||||
| $ | 11,374,171 | $ | 3,166,695 | $ | 1,202,159 | $ | 5,163,935 | $ | 15,573,326 | |||||||||
| $ | - | $ | - | $ | - | $ | 1,188 | $ | - | |||||||||
| $ | - | $ | 138,095 | $ | - | $ | - | $ | 11,665,878 | |||||||||
| $ | 1,103 | $ | 10,790 | $ | - | $ | 18,250 | $ | 1,652 | |||||||||
| $ | - | $ | - | $ | - | $ | 3,199,761 | $ | - | |||||||||
135
Table of Contents
MML Series Investment Fund – Financial Statements (Continued)
Statements of Assets and Liabilities
December 31, 2016
| MML Global Fund | MML Growth & Income Fund | |||||||
| Initial Class: | ||||||||
Net assets | $ | - | $ | 102,857,720 | ||||
|
|
|
| |||||
Shares outstanding (a) | - | 7,250,966 | ||||||
|
|
|
| |||||
Net asset value, offering price and redemption price per share | $ | - | $ | 14.19 | ||||
|
|
|
| |||||
| Class I shares: | ||||||||
Net assets | $ | 218,697,669 | $ | - | ||||
|
|
|
| |||||
Shares outstanding (a) | 18,953,968 | - | ||||||
|
|
|
| |||||
Net asset value, offering price and redemption price per share | $ | 11.54 | $ | - | ||||
|
|
|
| |||||
| Class II shares: | ||||||||
Net assets | $ | 15,757,353 | $ | - | ||||
|
|
|
| |||||
Shares outstanding (a) | 1,341,695 | - | ||||||
|
|
|
| |||||
Net asset value, offering price and redemption price per share | $ | 11.74 | $ | - | ||||
|
|
|
| |||||
| Service Class shares: | ||||||||
Net assets | $ | - | $ | 23,196,613 | ||||
|
|
|
| |||||
Shares outstanding (a) | - | 1,645,361 | ||||||
|
|
|
| |||||
Net asset value, offering price and redemption price per share | $ | - | $ | 14.10 | ||||
|
|
|
| |||||
| Service Class I shares: | ||||||||
Net assets | $ | 12,128,549 | $ | - | ||||
|
|
|
| |||||
Shares outstanding (a) | 1,060,953 | - | ||||||
|
|
|
| |||||
Net asset value, offering price and redemption price per share | $ | 11.43 | $ | - | ||||
|
|
|
| |||||
| (a) | Authorized unlimited number of shares with no par value. |
The accompanying notes are an integral part of the financial statements.
136
Table of Contents
| MML Income & Growth Fund | MML International Equity Fund | MML Large Cap Growth Fund | MML Managed Volatility Fund | MML Mid Cap Growth Fund | ||||||||||||||
| $ | 257,874,113 | $ | - | $ | 103,315,348 | $ | 151,537,093 | $ | 352,753,586 | |||||||||
|
|
|
|
|
|
|
|
|
| |||||||||
| 21,741,098 | - | 9,715,609 | 12,911,105 | 24,574,101 | ||||||||||||||
|
|
|
|
|
|
|
|
|
| |||||||||
| $ | 11.86 | $ | - | $ | 10.63 | $ | 11.74 | $ | 14.35 | |||||||||
|
|
|
|
|
|
|
|
|
| |||||||||
| $ | - | $ | - | $ | - | $ | - | $ | - | |||||||||
|
|
|
|
|
|
|
|
|
| |||||||||
| - | - | - | - | - | ||||||||||||||
|
|
|
|
|
|
|
|
|
| |||||||||
| $ | - | $ | - | $ | - | $ | - | $ | - | |||||||||
|
|
|
|
|
|
|
|
|
| |||||||||
| $ | - | $ | 150,752,914 | $ | - | $ | - | $ | - | |||||||||
|
|
|
|
|
|
|
|
|
| |||||||||
| - | 16,159,131 | - | - | - | ||||||||||||||
|
|
|
|
|
|
|
|
|
| |||||||||
| $ | - | $ | 9.33 | $ | - | $ | - | $ | - | |||||||||
|
|
|
|
|
|
|
|
|
| |||||||||
| $ | 20,625,608 | $ | - | $ | 3,604,499 | $ | 32,568,863 | $ | 71,226,969 | |||||||||
|
|
|
|
|
|
|
|
|
| |||||||||
| 1,756,148 | - | 346,311 | 2,797,703 | 5,105,032 | ||||||||||||||
|
|
|
|
|
|
|
|
|
| |||||||||
| $ | 11.74 | $ | - | $ | 10.41 | $ | 11.64 | $ | 13.95 | |||||||||
|
|
|
|
|
|
|
|
|
| |||||||||
| $ | - | $ | 1,063,161 | $ | - | $ | - | $ | - | |||||||||
|
|
|
|
|
|
|
|
|
| |||||||||
| - | 114,412 | - | - | - | ||||||||||||||
|
|
|
|
|
|
|
|
|
| |||||||||
| $ | - | $ | 9.29 | $ | - | $ | - | $ | - | |||||||||
|
|
|
|
|
|
|
|
|
| |||||||||
137
Table of Contents
MML Series Investment Fund – Financial Statements (Continued)
Statements of Assets and Liabilities
December 31, 2016
| MML Mid Cap Value Fund | MML Small Cap Growth Equity Fund | |||||||
| Assets: | ||||||||
Investments, at value (Note 2) (a) | $ | 469,576,876 | $ | 218,182,817 | ||||
Repurchase agreements, at value (b) | 8,006,866 | 3,038,156 | ||||||
Other short-term investments, at value (Note 2) (c) | 32,346 | 8,717 | ||||||
|
|
|
| |||||
Total investments (d) | 477,616,088 | 221,229,690 | ||||||
|
|
|
| |||||
Foreign currency, at value (e) | 13 | 11 | ||||||
Receivables from: | ||||||||
Investments sold | 832,118 | 251,910 | ||||||
Investments sold on a when-issued basis (Note 2) | - | - | ||||||
Open forward foreign currency contracts (Note 2) | 20,842 | - | ||||||
Investment adviser (Note 3) | - | - | ||||||
Fund shares sold | 120,591 | 78,668 | ||||||
Variation margin on open derivative instruments (Note 2) | - | - | ||||||
Interest and dividends | 1,051,987 | 233,780 | ||||||
Foreign taxes withheld | 1,461 | - | ||||||
|
|
|
| |||||
Total assets | 479,643,100 | 221,794,059 | ||||||
|
|
|
| |||||
| Liabilities: | ||||||||
Payables for: | ||||||||
Investments purchased | 1,772,083 | 349,484 | ||||||
Open forward foreign currency contracts (Note 2) | 95,156 | - | ||||||
Investments purchased on a when-issued basis (Note 2) | - | - | ||||||
Fund shares repurchased | 73,546 | 95,231 | ||||||
Securities on loan (Note 2) | - | 16,856,377 | ||||||
Trustees’ fees and expenses (Note 3) | 74,300 | 48,640 | ||||||
Affiliates (Note 3): | ||||||||
Investment advisory fees | 343,673 | 181,694 | ||||||
Administration fees | - | - | ||||||
Service fees | 26,357 | 7,953 | ||||||
Accrued expense and other liabilities | 64,004 | 40,947 | ||||||
|
|
|
| |||||
Total liabilities | 2,449,119 | 17,580,326 | ||||||
|
|
|
| |||||
Net assets | $ | 477,193,981 | $ | 204,213,733 | ||||
|
|
|
| |||||
| Net assets consist of: | ||||||||
Paid-in capital | $ | 378,629,857 | $ | 178,122,653 | ||||
Undistributed (accumulated) net investment income (loss) | 7,414,131 | 27,553 | ||||||
Accumulated net realized gain (loss) on investments and foreign currency transactions | 23,591,588 | 6,714,116 | ||||||
Net unrealized appreciation (depreciation) on investments and foreign currency translations | 67,558,405 | 19,349,411 | ||||||
|
|
|
| |||||
Net assets | $ | 477,193,981 | $ | 204,213,733 | ||||
|
|
|
| |||||
(a) Cost of investments: | $ | 401,944,682 | $ | 198,833,120 | ||||
(b) Cost of repurchase agreements: | $ | 8,006,866 | $ | 3,038,156 | ||||
(c) Cost of other short-term investments: | $ | 32,346 | $ | 8,717 | ||||
(d) Securities on loan with market value of: | $ | - | $ | 16,431,762 | ||||
(e) Cost of foreign currency: | $ | 13 | $ | 11 | ||||
The accompanying notes are an integral part of the financial statements.
138
Table of Contents
| MML Small Company Value Fund | MML Small/Mid Cap Value Fund | MML Total Return Bond Fund | ||||||||
| $ | 105,374,429 | $ | 228,037,669 | $ | 415,243,741 | |||||
| 2,098,298 | 3,703,328 | 27,469,182 | ||||||||
| - | - | 15,883,407 | ||||||||
|
|
|
|
|
| |||||
| 107,472,727 | 231,740,997 | 458,596,330 | ||||||||
|
|
|
|
|
| |||||
| - | - | 1 | ||||||||
| - | - | 2,414,845 | ||||||||
| - | - | 5,418,950 | ||||||||
| - | - | 364,683 | ||||||||
| 1 | - | 251 | ||||||||
| 65,164 | 23,346 | 65,492 | ||||||||
| - | - | 37,662 | ||||||||
| 196,067 | 218,744 | 1,840,275 | ||||||||
| - | - | - | ||||||||
|
|
|
|
|
| |||||
| 107,733,959 | 231,983,087 | 468,738,489 | ||||||||
|
|
|
|
|
| |||||
| 10,536 | 286,378 | 27,629,202 | ||||||||
| - | - | - | ||||||||
| - | - | 28,326,406 | ||||||||
| 13,036 | 50,715 | 114,629 | ||||||||
| 3,384,259 | - | - | ||||||||
| 13,663 | 35,744 | 42,221 | ||||||||
| 71,394 | 149,846 | 136,390 | ||||||||
| 13,386 | - | 51,146 | ||||||||
| 8,688 | 11,491 | 12,626 | ||||||||
| 24,737 | 36,400 | 71,396 | ||||||||
|
|
|
|
|
| |||||
| 3,539,699 | 570,574 | 56,384,016 | ||||||||
|
|
|
|
|
| |||||
| $ | 104,194,260 | $ | 231,412,513 | $ | 412,354,473 | |||||
|
|
|
|
|
| |||||
| $ | 62,606,821 | $ | 176,247,523 | $ | 410,171,273 | |||||
| 633,459 | 1,008,202 | 8,272,525 | ||||||||
| 11,643,569 | 12,937,012 | (2,515,639 | ) | |||||||
| 29,310,411 | 41,219,776 | (3,573,686 | ) | |||||||
|
|
|
|
|
| |||||
| $ | 104,194,260 | $ | 231,412,513 | $ | 412,354,473 | |||||
|
|
|
|
|
| |||||
| $ | 76,064,018 | $ | 186,817,893 | $ | 417,377,309 | |||||
| $ | 2,098,298 | $ | 3,703,328 | $ | 27,469,182 | |||||
| $ | - | $ | - | $ | 17,627,141 | |||||
| $ | 3,300,322 | $ | - | $ | - | |||||
| $ | - | $ | - | $ | 1 | |||||
139
Table of Contents
MML Series Investment Fund – Financial Statements (Continued)
Statements of Assets and Liabilities
December 31, 2016
| MML Mid Cap Value Fund | MML Small Cap Growth Equity Fund | |||||||
| Initial Class shares: | ||||||||
Net assets | $ | 433,045,619 | $ | 191,245,199 | ||||
|
|
|
| |||||
Shares outstanding (a) | 36,721,770 | 15,068,421 | ||||||
|
|
|
| |||||
Net asset value, offering price and redemption price per share | $ | 11.79 | $ | 12.69 | ||||
|
|
|
| |||||
| Class II shares: | ||||||||
Net assets | $ | - | $ | - | ||||
|
|
|
| |||||
Shares outstanding (a) | - | - | ||||||
|
|
|
| |||||
Net asset value, offering price and redemption price per share | $ | - | $ | - | ||||
|
|
|
| |||||
| Service Class shares: | ||||||||
Net assets | $ | 44,148,362 | $ | 12,968,534 | ||||
|
|
|
| |||||
Shares outstanding (a) | 3,796,255 | 1,067,963 | ||||||
|
|
|
| |||||
Net asset value, offering price and redemption price per share | $ | 11.63 | $ | 12.14 | ||||
|
|
|
| |||||
| Service Class I shares:: | ||||||||
Net assets | $ | - | $ | - | ||||
|
|
|
| |||||
Shares outstanding (a) | - | - | ||||||
|
|
|
| |||||
Net asset value, offering price and redemption price per share | $ | - | $ | - | ||||
|
|
|
| |||||
| (a) | Authorized unlimited number of shares with no par value. |
The accompanying notes are an integral part of the financial statements.
140
Table of Contents
| MML Small Company Value Fund | MML Small/Mid Cap Value Fund | MML Total Return Bond Fund | ||||||||
| $ | - | $ | 211,849,187 | $ | - | |||||
|
|
|
|
|
| |||||
| - | 16,008,711 | - | ||||||||
|
|
|
|
|
| |||||
| $ | - | $ | 13.23 | $ | - | |||||
|
|
|
|
|
| |||||
| $ | 88,729,158 | $ | - | $ | 393,275,917 | |||||
|
|
|
|
|
| |||||
| 5,150,182 | - | 38,310,295 | ||||||||
|
|
|
|
|
| |||||
| $ | 17.23 | $ | - | $ | 10.27 | |||||
|
|
|
|
|
| |||||
| $ | - | $ | 19,563,326 | $ | - | |||||
|
|
|
|
|
| |||||
| - | 1,491,190 | - | ||||||||
|
|
|
|
|
| |||||
| $ | - | $ | 13.12 | $ | - | |||||
|
|
|
|
|
| |||||
| $ | 15,465,102 | $ | - | $ | 19,078,556 | |||||
|
|
|
|
|
| |||||
| 918,854 | - | 1,874,751 | ||||||||
|
|
|
|
|
| |||||
| $ | 16.83 | $ | - | $ | 10.18 | |||||
|
|
|
|
|
| |||||
141
Table of Contents
MML Series Investment Fund – Financial Statements (Continued)
For the Year Ended December 31, 2016
| MML Blue Chip Growth Fund | MML Equity Income Fund | |||||||
| Investment income (Note 2): | ||||||||
Dividends (a) | $ | 3,229,040 | $ | 14,297,518 | ||||
Interest | 196 | 60,954 | ||||||
Securities lending net income | - | - | ||||||
|
|
|
| |||||
Total investment income | 3,229,236 | 14,358,472 | ||||||
|
|
|
| |||||
| Expenses (Note 3): | ||||||||
Investment advisory fees | 2,971,881 | 3,467,863 | ||||||
Custody fees | 51,486 | 59,977 | ||||||
Audit fees | 35,422 | 34,846 | ||||||
Legal fees | 2,930 | 3,219 | ||||||
Proxy fees | 985 | 985 | ||||||
Shareholder reporting fees | 39,547 | 45,951 | ||||||
Trustees’ fees | 23,445 | 27,196 | ||||||
|
|
|
| |||||
| 3,125,696 | 3,640,037 | |||||||
Administration fees: | ||||||||
Class I | - | - | ||||||
Class II | - | - | ||||||
Service Class I | - | - | ||||||
Service fees: | ||||||||
Service Class | 105,861 | 165,191 | ||||||
Service Class I | - | - | ||||||
|
|
|
| |||||
Total expenses | 3,231,557 | 3,805,228 | ||||||
Expenses waived : | ||||||||
Initial Class advisory fees waived | - | (70,506 | ) | |||||
Service Class advisory fees waived | - | (12,104 | ) | |||||
|
|
|
| |||||
Net expenses | 3,231,557 | 3,722,618 | ||||||
|
|
|
| |||||
Net investment income (loss) | (2,321 | ) | 10,635,854 | |||||
|
|
|
| |||||
| Realized and unrealized gain (loss): | ||||||||
Net realized gain (loss) on: | ||||||||
Investment transactions | 31,710,355 | 35,721,181 | ||||||
Futures contracts | - | - | ||||||
Foreign currency transactions | (122 | ) | (53,822 | ) | ||||
|
|
|
| |||||
Net realized gain (loss) | 31,710,233 | 35,667,359 | ||||||
|
|
|
| |||||
Net change in unrealized appreciation (depreciation) on: | ||||||||
Investment transactions | (29,103,607 | ) | 32,947,554 | |||||
Futures contracts | - | - | ||||||
Translation of assets and liabilities in foreign currencies | 11 | 3,231 | ||||||
|
|
|
| |||||
Net change in unrealized appreciation (depreciation) | (29,103,596 | ) | 32,950,785 | |||||
|
|
|
| |||||
Net realized gain (loss) and change in unrealized appreciation (depreciation) | 2,606,637 | 68,618,144 | ||||||
|
|
|
| |||||
Net increase (decrease) in net assets resulting from operations | $ | 2,604,316 | $ | 79,253,998 | ||||
|
|
|
| |||||
(a) Net of foreign withholding tax of: | $ | 3,758 | $ | 169,821 | ||||
The accompanying notes are an integral part of the financial statements.
142
Table of Contents
| MML Equity Index Fund | MML Focused Equity Fund | MML Foreign Fund | MML Fundamental Growth Fund | MML Fundamental Value Fund | ||||||||||||||
| $ | 10,012,610 | $ | 2,966,223 | $ | 10,848,290 | $ | 2,877,684 | $ | 6,102,269 | |||||||||
| 2,215 | 1,060 | 832 | 173 | 438 | ||||||||||||||
| - | - | 242,522 | - | - | ||||||||||||||
|
|
|
|
|
|
|
|
|
| |||||||||
| 10,014,825 | 2,967,283 | 11,091,644 | 2,877,857 | 6,102,707 | ||||||||||||||
|
|
|
|
|
|
|
|
|
| |||||||||
| 456,484 | 1,031,435 | 3,092,586 | 1,099,170 | 1,404,854 | ||||||||||||||
| 45,036 | 12,439 | 172,994 | 42,491 | 24,158 | ||||||||||||||
| 35,466 | 34,579 | 41,438 | 34,602 | 34,650 | ||||||||||||||
| 3,287 | 1,055 | 2,461 | 1,261 | 1,739 | ||||||||||||||
| 985 | 985 | 985 | 985 | 985 | ||||||||||||||
| 42,486 | 15,567 | 34,380 | 18,395 | 22,602 | ||||||||||||||
| 26,715 | 8,790 | 20,739 | 10,500 | 13,752 | ||||||||||||||
|
|
|
|
|
|
|
|
|
| |||||||||
| 610,459 | 1,104,850 | 3,365,583 | 1,207,404 | 1,502,740 | ||||||||||||||
| 210,986 | - | - | - | - | ||||||||||||||
| 248,383 | 211,433 | - | 260,863 | 339,118 | ||||||||||||||
| 117,628 | 9,589 | - | 5,065 | 12,096 | ||||||||||||||
| - | - | 27,391 | - | - | ||||||||||||||
| 98,023 | 15,982 | - | 8,442 | 20,160 | ||||||||||||||
|
|
|
|
|
|
|
|
|
| |||||||||
| 1,285,479 | 1,341,854 | 3,392,974 | 1,481,774 | 1,874,114 | ||||||||||||||
| - | - | - | - | - | ||||||||||||||
| - | - | - | - | - | ||||||||||||||
|
|
|
|
|
|
|
|
|
| |||||||||
| 1,285,479 | 1,341,854 | 3,392,974 | 1,481,774 | 1,874,114 | ||||||||||||||
|
|
|
|
|
|
|
|
|
| |||||||||
| 8,729,346 | 1,625,429 | 7,698,670 | 1,396,083 | 4,228,593 | ||||||||||||||
|
|
|
|
|
|
|
|
|
| |||||||||
| 18,897,306 | 12,576,129 | (10,525,852 | ) | 14,185,724 | 15,833,494 | |||||||||||||
| 1,109,313 | - | - | - | - | ||||||||||||||
| - | - | (218,339 | ) | 301 | (894 | ) | ||||||||||||
|
|
|
|
|
|
|
|
|
| |||||||||
| 20,006,619 | 12,576,129 | (10,744,191 | ) | 14,186,025 | 15,832,600 | |||||||||||||
|
|
|
|
|
|
|
|
|
| |||||||||
| 21,528,371 | 10,422,355 | 7,896,891 | (9,193,322 | ) | 10,959,495 | |||||||||||||
| (127,367 | ) | - | - | - | - | |||||||||||||
| - | - | 3,121 | - | (1,151 | ) | |||||||||||||
|
|
|
|
|
|
|
|
|
| |||||||||
| 21,401,004 | 10,422,355 | 7,900,012 | (9,193,322 | ) | 10,958,344 | |||||||||||||
|
|
|
|
|
|
|
|
|
| |||||||||
| 41,407,623 | 22,998,484 | (2,844,179 | ) | 4,992,703 | 26,790,944 | |||||||||||||
|
|
|
|
|
|
|
|
|
| |||||||||
| $ | 50,136,969 | $ | 24,623,913 | $ | 4,854,491 | $ | 6,388,786 | $ | 31,019,537 | |||||||||
|
|
|
|
|
|
|
|
|
| |||||||||
| $ | - | $ | - | $ | 1,065,315 | $ | 1,279 | $ | 39,440 | |||||||||
143
Table of Contents
MML Series Investment Fund – Financial Statements (Continued)
Statements of Operations
For the Year Ended December 31, 2016
| MML Global Fund | MML Growth & Income Fund | |||||||
| Investment income (Note 2): | ||||||||
Dividends (a) | $ | 4,911,176 | $ | 2,039,999 | ||||
Interest | 210 | 130 | ||||||
Securities lending net income | 38,653 | - | ||||||
|
|
|
| |||||
Total investment income | 4,950,039 | 2,040,129 | ||||||
|
|
|
| |||||
| Expenses (Note 3): | ||||||||
Investment advisory fees | 1,492,135 | 614,661 | ||||||
Custody fees | 80,588 | 14,420 | ||||||
Audit fees | 41,352 | 34,553 | ||||||
Legal fees | 1,832 | 867 | ||||||
Proxy fees | 985 | 985 | ||||||
Shareholder reporting fees | 24,930 | 12,924 | ||||||
Trustees’ fees | 14,604 | 7,261 | ||||||
|
|
|
| |||||
| 1,656,426 | 685,671 | |||||||
Administration fees: | ||||||||
Class I | 332,320 | - | ||||||
Class II | 23,538 | - | ||||||
Service Class I | 17,176 | - | ||||||
Service fees: | ||||||||
Service Class | - | 50,415 | ||||||
Service Class I | 28,627 | - | ||||||
|
|
|
| |||||
Total expenses | 2,058,087 | 736,086 | ||||||
Expenses waived : | ||||||||
Class II fees reimbursed by adviser | - | - | ||||||
Service Class I fees reimbursed by adviser | - | - | ||||||
|
|
|
| |||||
Net expenses | 2,058,087 | 736,086 | ||||||
|
|
|
| |||||
Net investment income (loss) | 2,891,952 | 1,304,043 | ||||||
|
|
|
| |||||
| Realized and unrealized gain (loss): | ||||||||
Net realized gain (loss) on: | ||||||||
Investment transactions | 18,271,943 | 4,900,855 | ||||||
Written options | - | - | ||||||
Foreign currency transactions | (57,147 | ) | (1,972 | ) | ||||
|
|
|
| |||||
Net realized gain (loss) | 18,214,796 | 4,898,883 | ||||||
|
|
|
| |||||
Net change in unrealized appreciation (depreciation) on: | ||||||||
Investment transactions | (2,052,774 | )* | 4,121,853 | |||||
Written options | - | - | ||||||
Translation of assets and liabilities in foreign currencies | (5,806 | ) | - | |||||
|
|
|
| |||||
Net change in unrealized appreciation (depreciation) | (2,058,580 | ) | 4,121,853 | |||||
|
|
|
| |||||
Net realized gain (loss) and change in unrealized appreciation (depreciation) | 16,156,216 | 9,020,736 | ||||||
|
|
|
| |||||
Net increase (decrease) in net assets resulting from operations | $ | 19,048,168 | $ | 10,324,779 | ||||
|
|
|
| |||||
(a) Net of foreign withholding tax of: | $ | 256,144 | $ | 21,898 | ||||
| * | Net decrease in accrued foreign capital gains tax of $(369). |
The accompanying notes are an integral part of the financial statements.
144
Table of Contents
| MML Income & Growth Fund | MML International Equity Fund | MML Large Cap Growth Fund | MML Managed Volatility Fund | MML Mid Cap Growth Fund | ||||||||||||||
| $ | 6,840,045 | $ | 4,263,264 | $ | 1,674,110 | $ | 4,094,278 | $ | 3,100,483 | |||||||||
| 884 | 491 | 502 | 490 | 14,075 | ||||||||||||||
| - | 38,679 | - | - | 234,774 | ||||||||||||||
|
|
|
|
|
|
|
|
|
| |||||||||
| 6,840,929 | 4,302,434 | 1,674,612 | 4,094,768 | 3,349,332 | ||||||||||||||
|
|
|
|
|
|
|
|
|
| |||||||||
| 1,671,849 | 1,273,188 | 1,168,016 | 1,396,819 | 3,268,116 | ||||||||||||||
| 35,952 | 126,446 | 15,751 | 223,627 | 53,806 | ||||||||||||||
| 35,294 | 36,784 | 34,613 | 34,609 | 35,444 | ||||||||||||||
| 1,850 | 1,195 | 1,266 | 1,115 | 3,096 | ||||||||||||||
| 985 | 985 | 985 | 985 | 985 | ||||||||||||||
| 24,477 | 19,078 | 20,346 | 20,997 | 41,538 | ||||||||||||||
| 15,156 | 9,537 | 10,914 | 10,848 | 25,080 | ||||||||||||||
|
|
|
|
|
|
|
|
|
| |||||||||
| 1,785,563 | 1,467,213 | 1,251,891 | 1,689,000 | 3,428,065 | ||||||||||||||
| - | - | - | - | - | ||||||||||||||
| - | 236,990 | - | - | - | ||||||||||||||
| - | 1,733 | - | - | - | ||||||||||||||
| 44,562 | - | 8,347 | 80,864 | 167,811 | ||||||||||||||
| - | 2,888 | - | - | - | ||||||||||||||
|
|
|
|
|
|
|
|
|
| |||||||||
| 1,830,125 | 1,708,824 | 1,260,238 | 1,769,864 | 3,595,876 | ||||||||||||||
| - | (113,586 | ) | - | - | - | |||||||||||||
| - | (858 | ) | - | - | - | |||||||||||||
|
|
|
|
|
|
|
|
|
| |||||||||
| 1,830,125 | 1,594,380 | 1,260,238 | 1,769,864 | 3,595,876 | ||||||||||||||
|
|
|
|
|
|
|
|
|
| |||||||||
| 5,010,804 | 2,708,054 | 414,374 | 2,324,904 | (246,544 | ) | |||||||||||||
|
|
|
|
|
|
|
|
|
| |||||||||
| 20,796,270 | (15,914,101 | ) | 27,762,845 | 1,870,996 | 44,833,435 | |||||||||||||
| - | - | - | (4,271,668 | ) | - | |||||||||||||
| (957 | ) | 112,732 | - | (77 | ) | (101 | ) | |||||||||||
|
|
|
|
|
|
|
|
|
| |||||||||
| 20,795,313 | (15,801,369 | ) | 27,762,845 | (2,400,749 | ) | 44,833,334 | ||||||||||||
|
|
|
|
|
|
|
|
|
| |||||||||
| 15,591,656 | 25,743,300 | (29,371,491 | ) | 9,152,344 | (19,044,489 | ) | ||||||||||||
| - | - | - | (2,611,425 | ) | - | |||||||||||||
| (102 | ) | 81,624 | - | (433 | ) | 13 | ||||||||||||
|
|
|
|
|
|
|
|
|
| |||||||||
| 15,591,554 | 25,824,924 | (29,371,491 | ) | 6,540,486 | (19,044,476 | ) | ||||||||||||
|
|
|
|
|
|
|
|
|
| |||||||||
| 36,386,867 | 10,023,555 | (1,608,646 | ) | 4,139,737 | 25,788,858 | |||||||||||||
|
|
|
|
|
|
|
|
|
| |||||||||
| $ | 41,397,671 | $ | 12,731,609 | $ | (1,194,272 | ) | $ | 6,464,641 | $ | 25,542,314 | ||||||||
|
|
|
|
|
|
|
|
|
| |||||||||
| $ | 65,087 | $ | 441,291 | $ | 1,124 | $ | - | $ | 12,177 | |||||||||
145
Table of Contents
MML Series Investment Fund — Financial Statements (Continued)
Statements of Operations
For the Year Ended December 31, 2016
| MML Mid Cap Value Fund | MML Small Cap Growth Equity Fund | |||||||
| Investment income (Note 2): | ||||||||
Dividends (a) | $ | 11,436,857 | $ | 2,058,980 | ||||
Interest | 736 | 357 | ||||||
Securities lending net income | - | 128,852 | ||||||
|
|
|
| |||||
Total investment income | 11,437,593 | 2,188,189 | ||||||
|
|
|
| |||||
| Expenses (Note 3): | ||||||||
Investment advisory fees | 3,950,567 | 2,047,842 | ||||||
Custody fees | 67,925 | 47,967 | ||||||
Audit fees | 35,479 | 37,110 | ||||||
Legal fees | 3,389 | 1,314 | ||||||
Proxy fees | 985 | 985 | ||||||
Shareholder reporting fees | 45,414 | 20,824 | ||||||
Trustees’ fees | 27,617 | 11,670 | ||||||
|
|
|
| |||||
| 4,131,376 | 2,167,712 | |||||||
Administration fees: | ||||||||
Class II | - | - | ||||||
Service Class I | - | - | ||||||
Service fees: | ||||||||
Service Class | 93,003 | 29,604 | ||||||
Service Class I | - | - | ||||||
|
|
|
| |||||
Total expenses | 4,224,379 | 2,197,316 | ||||||
Expenses waived : | ||||||||
Class II fees reimbursed by adviser | - | - | ||||||
Service Class I fees reimbursed by adviser | - | - | ||||||
Class II advisory fees waived | - | - | ||||||
Service Class I advisory fees waived | - | - | ||||||
|
|
|
| |||||
Net expenses | 4,224,379 | 2,197,316 | ||||||
|
|
|
| |||||
Net investment income (loss) | 7,213,214 | (9,127 | ) | |||||
|
|
|
| |||||
| Realized and unrealized gain (loss): | ||||||||
Net realized gain (loss) on: | ||||||||
Investment transactions | 27,430,925 | 8,366,937 | ||||||
Futures contracts | - | - | ||||||
Foreign currency transactions | 228,666 | (341 | ) | |||||
|
|
|
| |||||
Net realized gain (loss) | 27,659,591 | 8,366,596 | ||||||
|
|
|
| |||||
Net change in unrealized appreciation (depreciation) on: | ||||||||
Investment transactions | 64,373,812 | 15,347,270 | ||||||
Futures contracts | - | - | ||||||
Translation of assets and liabilities in foreign currencies | (42,981 | ) | 209 | |||||
|
|
|
| |||||
Net change in unrealized appreciation (depreciation) | 64,330,831 | 15,347,479 | ||||||
|
|
|
| |||||
Net realized gain (loss) and change in unrealized appreciation (depreciation) | 91,990,422 | 23,714,075 | ||||||
|
|
|
| |||||
Net increase (decrease) in net assets resulting from operations | $ | 99,203,636 | $ | 23,704,948 | ||||
|
|
|
| |||||
(a) Net of foreign withholding tax of: | $ | 36,837 | $ | 5,759 | ||||
The accompanying notes are an integral part of the financial statements.
146
Table of Contents
| MML Small Company Value Fund | MML Small/Mid Cap Value Fund | MML Total Return Bond Fund | ||||||||
| $ | 1,653,254 | $ | 2,832,589 | $ | - | |||||
| 185 | 430 | 8,362,192 | ||||||||
| 8,646 | - | - | ||||||||
|
|
|
|
|
| |||||
| 1,662,085 | 2,833,019 | 8,362,192 | ||||||||
|
|
|
|
|
| |||||
| 815,709 | 1,635,062 | 1,544,316 | ||||||||
| 15,893 | 24,929 | 83,181 | ||||||||
| 35,164 | 34,637 | 52,134 | ||||||||
| 739 | 1,517 | 2,463 | ||||||||
| 985 | 985 | 985 | ||||||||
| 10,553 | 21,790 | 41,280 | ||||||||
| 5,993 | 12,842 | 21,907 | ||||||||
|
|
|
|
|
| |||||
| 885,036 | 1,731,762 | 1,746,266 | ||||||||
| 134,927 | - | 522,102 | ||||||||
| 18,019 | - | 29,638 | ||||||||
| - | 41,526 | - | ||||||||
| 30,031 | - | 49,397 | ||||||||
|
|
|
|
|
| |||||
| 1,068,013 | 1,773,288 | 2,347,403 | ||||||||
| - | - | (17,064 | ) | |||||||
| - | - | (957 | ) | |||||||
| (44,969 | ) | - | (69,039 | ) | ||||||
| (6,013 | ) | - | (3,970 | ) | ||||||
|
|
|
|
|
| |||||
| 1,017,031 | 1,773,288 | 2,256,373 | ||||||||
|
|
|
|
|
| |||||
| 645,054 | 1,059,731 | 6,105,819 | ||||||||
|
|
|
|
|
| |||||
| 11,762,787 | 13,034,233 | (281,802 | ) | |||||||
| - | - | (212,505 | ) | |||||||
| - | - | 1,430,206 | ||||||||
|
|
|
|
|
| |||||
| 11,762,787 | 13,034,233 | 935,899 | ||||||||
|
|
|
|
|
| |||||
| 16,968,232 | 36,465,058 | 200,184 | ||||||||
| - | - | (34,055 | ) | |||||||
| - | - | 364,683 | ||||||||
|
|
|
|
|
| |||||
| 16,968,232 | 36,465,058 | 530,812 | ||||||||
|
|
|
|
|
| |||||
| 28,731,019 | 49,499,291 | 1,466,711 | ||||||||
|
|
|
|
|
| |||||
| $ | 29,376,073 | $ | 50,559,022 | $ | 7,572,530 | |||||
|
| �� |
|
|
|
| ||||
| $ | 1,812 | $ | - | $ | - | |||||
147
Table of Contents
MML Series Investment Fund – Financial Statements (Continued)
Statements of Changes in Net Assets
| MML Blue Chip Growth Fund | ||||||||
| Year Ended December 31, 2016 | Year Ended December 31, 2015 | |||||||
| Increase (Decrease) in Net Assets: | ||||||||
| Operations: | ||||||||
Net investment income (loss) | $ | (2,321 | ) | $ | (349,068 | ) | ||
Net realized gain (loss) on investment transactions | 31,710,233 | 50,455,541 | ||||||
Net change in unrealized appreciation (depreciation) on investments | (29,103,596 | ) | (4,300,969 | ) | ||||
|
|
|
| |||||
Net increase (decrease) in net assets resulting from operations | 2,604,316 | 45,805,504 | ||||||
|
|
|
| |||||
| Distributions to shareholders (Note 2): | ||||||||
From net investment income: | ||||||||
Initial Class | - | - | ||||||
Class I | - | - | ||||||
Class II | - | - | ||||||
Class III | - | - | ||||||
Service Class | - | - | ||||||
Service Class I | - | - | ||||||
|
|
|
| |||||
Total distributions from net investment income | - | - | ||||||
|
|
|
| |||||
From net realized gains: | ||||||||
Initial Class | (44,016,658 | ) | (62,289,222 | ) | ||||
Class I | - | - | ||||||
Class II | - | - | ||||||
Class III | - | - | ||||||
Service Class | (5,513,029 | ) | (6,171,321 | ) | ||||
Service Class I | - | - | ||||||
|
|
|
| |||||
Total distributions from net realized gains | (49,529,687 | ) | (68,460,543 | ) | ||||
|
|
|
| |||||
| Net fund share transactions (Note 5): | ||||||||
Initial Class | (14,216,357 | ) | 18,440,481 | |||||
Class I | - | - | ||||||
Class II | - | - | ||||||
Class III | - | - | ||||||
Service Class | 10,100,450 | 13,312,534 | ||||||
Service Class I | - | - | ||||||
|
|
|
| |||||
Increase (decrease) in net assets from fund share transactions | (4,115,907 | ) | 31,753,015 | |||||
|
|
|
| |||||
Total increase (decrease) in net assets | (51,041,278 | ) | 9,097,976 | |||||
| Net assets | ||||||||
Beginning of year | 431,140,109 | 422,042,133 | ||||||
|
|
|
| |||||
End of year | $ | 380,098,831 | $ | 431,140,109 | ||||
|
|
|
| |||||
Undistributed (accumulated) net investment income (loss) included in net assets at end of year | $ | (33,171 | ) | $ | (69,942 | ) | ||
|
|
|
| |||||
The accompanying notes are an integral part of the financial statements.
148
Table of Contents
| MML Equity Income Fund | MML Equity Index Fund | |||||||||||||
| Year Ended December 31, 2016 | Year Ended December 31, 2015 | Year Ended December 31, 2016 | Year Ended December 31, 2015 | |||||||||||
| $ | 10,635,854 | $ | 9,773,702 | $ | 8,729,346 | $ | 8,061,688 | |||||||
| 35,667,359 | 48,043,703 | 20,006,619 | 11,156,840 | |||||||||||
| 32,950,785 | (93,042,103 | ) | 21,401,004 | (14,650,759 | ) | |||||||||
|
|
|
|
|
|
|
| |||||||
| 79,253,998 | (35,224,698 | ) | 50,136,969 | 4,567,769 | ||||||||||
|
|
|
|
|
|
|
| |||||||
| (8,080,286 | ) | (8,271,226 | ) | - | - | |||||||||
| - | - | (1,138,655 | ) | (1,153,387 | ) | |||||||||
| - | - | (3,098,350 | ) | (2,440,730 | ) | |||||||||
| - | - | (3,556,322 | ) | (3,144,175 | ) | |||||||||
| (1,211,150 | ) | (1,072,744 | ) | - | - | |||||||||
| - | - | (617,842 | ) | (555,456 | ) | |||||||||
|
|
|
|
|
|
|
| |||||||
| (9,291,436 | ) | (9,343,970 | ) | (8,411,169 | ) | (7,293,748 | ) | |||||||
|
|
|
|
|
|
|
| |||||||
| (40,910,962 | ) | (43,647,364 | ) | - | - | |||||||||
| - | - | (1,622,191 | ) | (1,723,595 | ) | |||||||||
| - | - | (3,906,075 | ) | (3,212,126 | ) | |||||||||
| - | - | (4,183,965 | ) | (3,815,424 | ) | |||||||||
| (6,930,496 | ) | (6,436,103 | ) | - | - | |||||||||
| - | - | (962,234 | ) | (843,155 | ) | |||||||||
|
|
|
|
|
|
|
| |||||||
| (47,841,458 | ) | (50,083,467 | ) | (10,674,465 | ) | (9,594,300 | ) | |||||||
|
|
|
|
|
|
|
| |||||||
| (14,762,650 | ) | 18,918,608 | - | - | ||||||||||
| - | - | (13,086,785 | ) | (7,783,632 | ) | |||||||||
| - | - | (384,062 | ) | 14,726,714 | ||||||||||
| - | - | 94,690,407 | 4,278,949 | |||||||||||
| 11,031,372 | 11,554,876 | - | - | |||||||||||
| - | - | 874,480 | 7,738,315 | |||||||||||
|
|
|
|
|
|
|
| |||||||
| (3,731,278 | ) | 30,473,484 | 82,094,040 | 18,960,346 | ||||||||||
|
|
|
|
|
|
|
| |||||||
| 18,389,826 | (64,178,651 | ) | 113,145,375 | 6,640,067 | ||||||||||
| 472,560,755 | 536,739,406 | 450,829,180 | 444,189,113 | |||||||||||
|
|
|
|
|
|
|
| |||||||
| $ | 490,950,581 | $ | 472,560,755 | $ | 563,974,555 | $ | 450,829,180 | |||||||
|
|
|
|
|
|
|
| |||||||
$ | 10,818,884 |
| $ | 9,649,862 | $ | 8,699,279 | $ | 7,900,197 | ||||||
|
|
|
|
|
|
|
| |||||||
149
Table of Contents
MML Series Investment Fund – Financial Statements (Continued)
Statements of Changes in Net Assets
| MML Focused Equity Fund | ||||||||
| Year Ended December 31, 2016 | Year Ended December 31, 2015 | |||||||
| Increase (Decrease) in Net Assets: | ||||||||
| Operations: | ||||||||
Net investment income (loss) | $ | 1,625,429 | $ | 2,302,164 | ||||
Net realized gain (loss) on investment transactions | 12,576,129 | 10,037,468 | ||||||
Net change in unrealized appreciation (depreciation) on investments | 10,422,355 | (27,280,097 | ) | |||||
|
|
|
| |||||
Net increase (decrease) in net assets resulting from operations | 24,623,913 | (14,940,465 | ) | |||||
|
|
|
| |||||
| Distributions to shareholders (Note 2): | ||||||||
From net investment income: | ||||||||
Initial Class | - | - | ||||||
Class II | (2,228,977 | ) | (2,897,589 | ) | ||||
Service Class | - | - | ||||||
Service Class I | (75,702 | ) | (110,596 | ) | ||||
|
|
|
| |||||
Total distributions from net investment income | (2,304,679 | ) | (3,008,185 | ) | ||||
|
|
|
| |||||
From net realized gains: | ||||||||
Class II | (9,579,688 | ) | (20,741,790 | ) | ||||
Service Class I | (406,428 | ) | (899,601 | ) | ||||
|
|
|
| |||||
Total distributions from net realized gains | (9,986,116 | ) | (21,641,391 | ) | ||||
|
|
|
| |||||
| Net fund share transactions (Note 5): | ||||||||
Initial Class | - | - | ||||||
Class II | (30,259,067 | ) | 25,146,462 | |||||
Service Class | - | - | ||||||
Service Class I | (715,507 | ) | 1,408,371 | |||||
|
|
|
| |||||
Increase (decrease) in net assets from fund share transactions | (30,974,574 | ) | 26,554,833 | |||||
|
|
|
| |||||
Total increase (decrease) in net assets | (18,641,456 | ) | (13,035,208 | ) | ||||
| Net assets | ||||||||
Beginning of year | 154,459,588 | 167,494,796 | ||||||
|
|
|
| |||||
End of year | $ | 135,818,132 | $ | 154,459,588 | ||||
|
|
|
| |||||
Undistributed (accumulated) net investment income (loss) included in net assets at end of year | $ | 1,607,936 | $ | 2,287,193 | ||||
|
|
|
| |||||
The accompanying notes are an integral part of the financial statements.
150
Table of Contents
| MML Foreign Fund | MML Fundamental Growth Fund | |||||||||||||
| Year Ended December 31, 2016 | Year Ended December 31, 2015 | Year Ended December 31, 2016 | Year Ended December 31, 2015 | |||||||||||
| $ | 7,698,670 | $ | 7,136,966 | $ | 1,396,083 | $ | 1,233,079 | |||||||
| (10,744,191 | ) | 6,447,456 | 14,186,025 | 20,689,392 | ||||||||||
| 7,900,012 | (30,321,475 | ) | (9,193,322 | ) | (9,853,074 | ) | ||||||||
|
|
|
|
|
|
|
| |||||||
| 4,854,491 | (16,737,053 | ) | 6,388,786 | 12,069,397 | ||||||||||
|
|
|
|
|
|
|
| |||||||
| (6,733,929 | ) | (10,665,933 | ) | - | - | |||||||||
| - | - | (1,164,469 | ) | (1,522,932 | ) | |||||||||
| (193,084 | ) | (322,750 | ) | - | - | |||||||||
| - | - | (18,624 | ) | (20,162 | ) | |||||||||
|
|
|
|
|
|
|
| |||||||
| (6,927,013 | ) | (10,988,683 | ) | (1,183,093 | ) | (1,543,094 | ) | |||||||
|
|
|
|
|
|
|
| |||||||
| - | - | (20,436,093 | ) | (35,452,387 | ) | |||||||||
| - | - | (412,071 | ) | (541,999 | ) | |||||||||
|
|
|
|
|
|
|
| |||||||
| - | - | (20,848,164 | ) | (35,994,386 | ) | |||||||||
|
|
|
|
|
|
|
| |||||||
| 3,739,806 | 45,853,471 | - | - | |||||||||||
| - | - | (2,566,740 | ) | 1,052,674 | ||||||||||
| (1,068,302 | ) | 1,207,009 | - | - | ||||||||||
| - | - | 1,606,362 | 1,164,609 | |||||||||||
|
|
|
|
|
|
|
| |||||||
| 2,671,504 | 47,060,480 | (960,378 | ) | 2,217,283 | ||||||||||
|
|
|
|
|
|
|
| |||||||
| 598,982 | 19,334,744 | (16,602,849 | ) | (23,250,800 | ) | |||||||||
| 358,468,551 | 339,133,807 | 186,049,126 | 209,299,926 | |||||||||||
|
|
|
|
|
|
|
| |||||||
| $ | 359,067,533 | $ | 358,468,551 | $ | 169,446,277 | $ | 186,049,126 | |||||||
|
|
|
|
|
|
|
| |||||||
$ | 7,399,681 |
| $ | 6,846,380 | $ | 1,372,286 | $ | 1,213,633 | ||||||
|
|
|
|
|
|
|
| |||||||
151
Table of Contents
MML Series Investment Fund – Financial Statements (Continued)
Statements of Changes in Net Assets
| MML Fundamental Value Fund | ||||||||
| Year Ended December 31, 2016 | Year Ended December 31, 2015 | |||||||
| Increase (Decrease) in Net Assets: | ||||||||
| Operations: | ||||||||
Net investment income (loss) | $ | 4,228,593 | $ | 3,404,175 | ||||
Net realized gain (loss) on investment transactions | 15,832,600 | 17,023,290 | ||||||
Net change in unrealized appreciation (depreciation) on investments | 10,958,344 | (27,342,230 | ) | |||||
|
|
|
| |||||
Net increase (decrease) in net assets resulting from operations | 31,019,537 | (6,914,765 | ) | |||||
|
|
|
| |||||
| Distributions to shareholders (Note 2): | ||||||||
From net investment income: | ||||||||
Initial Class | - | - | ||||||
Class I | - | - | ||||||
Class II | (3,177,117 | ) | (3,059,837 | ) | ||||
Service Class | - | - | ||||||
Service Class I | (97,403 | ) | (74,012 | ) | ||||
|
|
|
| |||||
Total distributions from net investment income | (3,274,520 | ) | (3,133,849 | ) | ||||
|
|
|
| |||||
From net realized gains: | ||||||||
Class I | - | - | ||||||
Class II | (16,431,141 | ) | (17,374,817 | ) | ||||
Service Class I | (574,567 | ) | (465,845 | ) | ||||
|
|
|
| |||||
Total distributions from net realized gains | (17,005,708 | ) | (17,840,662 | ) | ||||
|
|
|
| |||||
| Net fund share transactions (Note 5): | ||||||||
Initial Class | - | - | ||||||
Class I | - | - | ||||||
Class II | (3,697,842 | ) | 24,581,537 | |||||
Service Class | - | - | ||||||
Service Class I | 1,213,663 | 2,883,449 | ||||||
|
|
|
| |||||
Increase (decrease) in net assets from fund share transactions | (2,484,179 | ) | 27,464,986 | |||||
|
|
|
| |||||
Total increase (decrease) in net assets | 8,255,130 | (424,290 | ) | |||||
| Net assets | ||||||||
Beginning of year | 224,865,492 | 225,289,782 | ||||||
|
|
|
| |||||
End of year | $ | 233,120,622 | $ | 224,865,492 | ||||
|
|
|
| |||||
Undistributed (accumulated) net investment income (loss) included in net assets at end of year | $ | 4,200,172 | $ | 3,401,647 | ||||
|
|
|
| |||||
The accompanying notes are an integral part of the financial statements.
152
Table of Contents
| MML Global Fund | MML Growth & Income Fund | |||||||||||||
| Year Ended December 31, 2016 | Year Ended December 31, 2015 | Year Ended December 31, 2016 | Year Ended December 31, 2015 | |||||||||||
| $ | 2,891,952 | $ | 2,943,882 | $ | 1,304,043 | $ | 1,309,220 | |||||||
| 18,214,796 | 19,591,857 | 4,898,883 | 11,753,803 | |||||||||||
| (2,058,580 | ) | (25,705,766 | ) | 4,121,853 | (12,364,158 | ) | ||||||||
|
|
|
|
|
|
|
| |||||||
| 19,048,168 | (3,170,027 | ) | 10,324,779 | 698,865 | ||||||||||
|
|
|
|
|
|
|
| |||||||
| - | - | (1,079,085 | ) | (1,325,627 | ) | |||||||||
| (2,547,594 | ) | (2,573,159 | ) | - | - | |||||||||
| (177,958 | ) | (194,417 | ) | - | - | |||||||||
| - | - | (171,221 | ) | (190,746 | ) | |||||||||
| (116,936 | ) | (95,568 | ) | - | - | |||||||||
|
|
|
|
|
|
|
| |||||||
| (2,842,488 | ) | (2,863,144 | ) | (1,250,306 | ) | (1,516,373 | ) | |||||||
|
|
|
|
|
|
|
| |||||||
| (17,521,108 | ) | (9,861,148 | ) | - | - | |||||||||
| (1,198,304 | ) | (706,225 | ) | - | - | |||||||||
| (941,843 | ) | (431,717 | ) | - | - | |||||||||
|
|
|
|
|
|
|
| |||||||
| (19,661,255 | ) | (10,999,090 | ) | - | - | |||||||||
|
|
|
|
|
|
|
| |||||||
| - | - | (11,230,669 | ) | (14,434,363 | ) | |||||||||
| (3,174,455 | ) | 29,653,736 | - | - | ||||||||||
| 113,343 | (516,071 | ) | - | - | ||||||||||
| - | - | 2,835,766 | 31,132 | |||||||||||
| 1,770,763 | 2,128,221 | - | - | |||||||||||
|
|
|
|
|
|
|
| |||||||
| (1,290,349 | ) | 31,265,886 | (8,394,903 | ) | (14,403,231 | ) | ||||||||
|
|
|
|
|
|
|
| |||||||
| (4,745,924 | ) | 14,233,625 | 679,570 | (15,220,739 | ) | |||||||||
| 251,329,495 | 237,095,870 | 125,374,763 | 140,595,502 | |||||||||||
|
|
|
|
|
|
|
| |||||||
| $ | 246,583,571 | $ | 251,329,495 | $ | 126,054,333 | $ | 125,374,763 | |||||||
|
|
|
|
|
|
|
| |||||||
$ | 2,804,692 |
| $ | 2,874,790 | $ | 1,261,399 | $ | 1,261,906 | ||||||
|
|
|
|
|
|
|
| |||||||
153
Table of Contents
MML Series Investment Fund – Financial Statements (Continued)
Statements of Changes in Net Assets
| MML Income & Growth Fund | ||||||||
| Year Ended December 31, 2016 | Year Ended December 31, 2015 | |||||||
| Increase (Decrease) in Net Assets: | ||||||||
| Operations: | ||||||||
Net investment income (loss) | $ | 5,010,804 | $ | 4,567,746 | ||||
Net realized gain (loss) on investment transactions | 20,795,313 | 22,630,785 | ||||||
Net change in unrealized appreciation (depreciation) on investments | 15,591,554 | (27,368,276 | ) | |||||
|
|
|
| |||||
Net increase (decrease) in net assets resulting from operations | 41,397,671 | (169,745 | ) | |||||
|
|
|
| |||||
| Distributions to shareholders (Note 2): | ||||||||
From net investment income: | ||||||||
Initial Class | (4,279,358 | ) | (4,320,659 | ) | ||||
Class II | - | - | ||||||
Service Class | (277,905 | ) | (279,311 | ) | ||||
Service Class I | - | - | ||||||
|
|
|
| |||||
Total distributions from net investment income | (4,557,263 | ) | (4,599,970 | ) | ||||
|
|
|
| |||||
From net realized gains: | ||||||||
Initial Class | (21,028,191 | ) | (14,106,335 | ) | ||||
Class II | - | - | ||||||
Service Class | (1,563,913 | ) | (1,036,220 | ) | ||||
Service Class I | - | - | ||||||
|
|
|
| |||||
Total distributions from net realized gains | (22,592,104 | ) | (15,142,555 | ) | ||||
|
|
|
| |||||
| Net fund share transactions (Note 5): | ||||||||
Initial Class | 22,805,308 | 8,119,045 | ||||||
Class II | - | - | ||||||
Service Class | 2,776,981 | 2,143,957 | ||||||
Service Class I | - | - | ||||||
|
|
|
| |||||
Increase (decrease) in net assets from fund share transactions | 25,582,289 | 10,263,002 | ||||||
|
|
|
| |||||
Total increase (decrease) in net assets | 39,830,593 | (9,649,268 | ) | |||||
| Net assets | ||||||||
Beginning of year | 238,669,128 | 248,318,396 | ||||||
|
|
|
| |||||
End of year | $ | 278,499,721 | $ | 238,669,128 | ||||
|
|
|
| |||||
Undistributed (accumulated) net investment income (loss) included in net assets at end of year | $ | 4,967,449 | $ | 4,517,405 | ||||
|
|
|
| |||||
The accompanying notes are an integral part of the financial statements.
154
Table of Contents
| MML International Equity Fund | MML Large Cap Growth Fund | |||||||||||||
| Year Ended December 31, 2016 | Year Ended December 31, 2015 | Year Ended December 31, 2016 | Year Ended December 31, 2015 | |||||||||||
| $ | 2,708,054 | $ | 2,655,779 | $ | 414,374 | $ | 230,467 | |||||||
| (15,801,369 | ) | 722,053 | 27,762,845 | 16,258,396 | ||||||||||
| 25,824,924 | (14,160,470 | ) | (29,371,491 | ) | (4,137,656 | ) | ||||||||
|
|
|
|
|
|
|
| |||||||
| 12,731,609 | (10,782,638 | ) | (1,194,272 | ) | 12,351,207 | |||||||||
|
|
|
|
|
|
|
| |||||||
| - | - | (231,013 | ) | - | ||||||||||
| (3,276,084 | ) | (332,992 | ) | - | - | |||||||||
| - | - | - | - | |||||||||||
| (19,857 | ) | (2,305 | ) | - | - | |||||||||
|
|
|
|
|
|
|
| |||||||
| (3,295,941 | ) | (335,297 | ) | (231,013 | ) | - | ||||||||
|
|
|
|
|
|
|
| |||||||
| - | - | (16,047,562 | ) | (43,425,029 | ) | |||||||||
| (366,284 | ) | - | - | - | ||||||||||
| - | - | (316,827 | ) | (653,118 | ) | |||||||||
| (2,464 | ) | - | - | - | ||||||||||
|
|
|
|
|
|
|
| |||||||
| (368,748 | ) | - | (16,364,389 | ) | (44,078,147 | ) | ||||||||
|
|
|
|
|
|
|
| |||||||
| - | - | (93,549,683 | ) | 3,267,615 | ||||||||||
| (22,358,626 | ) | 51,164,597 | - | - | ||||||||||
| - | - | 459,219 | 1,304,526 | |||||||||||
| (488,347 | ) | 1,335,762 | - | - | ||||||||||
|
|
|
|
|
|
|
| |||||||
| (22,846,973 | ) | 52,500,359 | (93,090,464 | ) | 4,572,141 | |||||||||
|
|
|
|
|
|
|
| |||||||
| (13,780,053 | ) | 41,382,424 | (110,880,138 | ) | (27,154,799 | ) | ||||||||
| 165,596,128 | 124,213,704 | 217,799,985 | 244,954,784 | |||||||||||
|
|
|
|
|
|
|
| |||||||
| $ | 151,816,075 | $ | 165,596,128 | $ | 106,919,847 | $ | 217,799,985 | |||||||
|
|
|
|
|
|
|
| |||||||
$ | 2,549,717 |
| $ | 3,017,091 | $ | 379,013 | $ | 195,662 | ||||||
|
|
|
|
|
|
|
| |||||||
155
Table of Contents
MML Series Investment Fund – Financial Statements (Continued)
Statements of Changes in Net Assets
| MML Managed Volatility Fund | ||||||||
| Year Ended December 31, 2016 | Year Ended December 31, 2015 | |||||||
| Increase (Decrease) in Net Assets: | ||||||||
| Operations: | ||||||||
Net investment income (loss) | $ | 2,324,904 | $ | 2,847,343 | ||||
Net realized gain (loss) on investment transactions | (2,400,749 | ) | 50,126,502 | |||||
Net change in unrealized appreciation (depreciation) on investments | 6,540,486 | (44,754,278 | ) | |||||
|
|
|
| |||||
Net increase (decrease) in net assets resulting from operations | 6,464,641 | 8,219,567 | ||||||
|
|
|
| |||||
| Distributions to shareholders (Note 2): | ||||||||
From net investment income: |
| |||||||
Initial Class | (2,685,854 | ) | (3,096,226 | ) | ||||
Service Class | (494,437 | ) | (511,045 | ) | ||||
|
|
|
| |||||
Total distributions from net investment income | (3,180,291 | ) | (3,607,271 | ) | ||||
|
|
|
| |||||
From net realized gains: |
| |||||||
Initial Class | (28,897,380 | ) | - | |||||
Service Class | (6,196,954 | ) | - | |||||
|
|
|
| |||||
Total distributions from net realized gains | (35,094,334 | ) | - | |||||
|
|
|
| |||||
| Net fund share transactions (Note 5): | ||||||||
Initial Class | 15,411,463 | (178,845,533 | ) | |||||
Service Class | 4,991,636 | 1,003,527 | ||||||
|
|
|
| |||||
Increase (decrease) in net assets from fund share transactions | 20,403,099 | (177,842,006 | ) | |||||
|
|
|
| |||||
Total increase (decrease) in net assets | (11,406,885 | ) | (173,229,710 | ) | ||||
| Net assets | ||||||||
Beginning of year | 195,512,841 | 368,742,551 | ||||||
|
|
|
| |||||
End of year | $ | 184,105,956 | $ | 195,512,841 | ||||
|
|
|
| |||||
Undistributed (accumulated) net investment income (loss) included in net assets at end of year | $ | 2,303,224 | $ | 2,763,852 | ||||
|
|
|
| |||||
The accompanying notes are an integral part of the financial statements.
156
Table of Contents
| MML Mid Cap Growth Fund | MML Mid Cap Value Fund | |||||||||||||
| Year Ended December 31, 2016 | Year Ended December 31, 2015 | Year Ended December 31, 2016 | Year Ended December 31, 2015 | |||||||||||
| $ | (246,544 | ) | $ | (452,102 | ) | $ | 7,213,214 | $ | 6,027,300 | |||||
| 44,833,334 | 57,283,864 | 27,659,591 | 48,020,608 | |||||||||||
| (19,044,476 | ) | (27,939,811 | ) | 64,330,831 | (60,895,172 | ) | ||||||||
|
|
|
|
|
|
|
| |||||||
| 25,542,314 | 28,891,951 | 99,203,636 | (6,847,264 | ) | ||||||||||
|
|
|
|
|
|
|
| |||||||
| - | - | (6,934,131 | ) | (8,610,298 | ) | |||||||||
| - | - | (550,572 | ) | (553,849 | ) | |||||||||
|
|
|
|
|
|
|
| |||||||
| - | - | (7,484,703 | ) | (9,164,147 | ) | |||||||||
|
|
|
|
|
|
|
| |||||||
| (47,049,556 | ) | (42,547,818 | ) | (41,783,431 | ) | (63,870,147 | ) | |||||||
| (9,296,846 | ) | (7,241,068 | ) | (3,795,883 | ) | (4,598,846 | ) | |||||||
|
|
|
|
|
|
|
| |||||||
| (56,346,402 | ) | (49,788,886 | ) | (45,579,314 | ) | (68,468,993 | ) | |||||||
|
|
|
|
|
|
|
| |||||||
| 2,845,685 | 15,687,945 | (37,553,607 | ) | 41,173,782 | ||||||||||
| 9,674,951 | 13,988,017 | 7,738,309 | 8,626,487 | |||||||||||
|
|
|
|
|
|
|
| |||||||
| 12,520,636 | 29,675,962 | (29,815,298 | ) | 49,800,269 | ||||||||||
|
|
|
|
|
|
|
| |||||||
| (18,283,452 | ) | 8,779,027 | 16,324,321 | (34,680,135 | ) | |||||||||
| 442,264,007 | 433,484,980 | 460,869,660 | 495,549,795 | |||||||||||
|
|
|
|
|
|
|
| |||||||
| $ | 423,980,555 | $ | 442,264,007 | $ | 477,193,981 | $ | 460,869,660 | |||||||
|
|
|
|
|
|
|
| |||||||
$ | (153,367 | ) | $ | (682,055 | ) | $ | 7,414,131 | $ | 8,320,913 | |||||
|
|
|
|
|
|
|
| |||||||
157
Table of Contents
MML Series Investment Fund – Financial Statements (Continued)
Statements of Changes in Net Assets
| MML Small Cap Growth Equity Fund | ||||||||
| Year Ended December 31, 2016 | Year Ended December 31, 2015 | |||||||
| Increase (Decrease) in Net Assets: | ||||||||
| Operations: | ||||||||
Net investment income (loss) | $ | (9,127 | ) | $ | (535,879 | ) | ||
Net realized gain (loss) on investment transactions | 8,366,596 | 33,642,911 | ||||||
Net change in unrealized appreciation (depreciation) on investments | 15,347,479 | (41,187,848 | ) | |||||
|
|
|
| |||||
Net increase (decrease) in net assets resulting from operations | 23,704,948 | (8,080,816 | ) | |||||
|
|
|
| |||||
| Distributions to shareholders (Note 2): | ||||||||
From net investment income: |
| |||||||
Initial Class | - | - | ||||||
Class II | - | - | ||||||
Service Class | - | - | ||||||
Service Class I | - | - | ||||||
|
|
|
| |||||
Total distributions from net investment income | - | - | ||||||
|
|
|
| |||||
From net realized gains: |
| |||||||
Initial Class | (32,147,623 | ) | (40,634,083 | ) | ||||
Class II | - | - | ||||||
Service Class | (2,198,947 | ) | (2,122,311 | ) | ||||
Service Class I | - | - | ||||||
|
|
|
| |||||
Total distributions from net realized gains | (34,346,570 | ) | (42,756,394 | ) | ||||
|
|
|
| |||||
| Net fund share transactions (Note 5): | ||||||||
Initial Class | 6,283,248 | (10,108,774 | ) | |||||
Class II | - | - | ||||||
Service Class | 2,308,313 | 4,136,629 | ||||||
Service Class I | - | - | ||||||
|
|
|
| |||||
Increase (decrease) in net assets from fund share transactions | 8,591,561 | (5,972,145 | ) | |||||
|
|
|
| |||||
Total increase (decrease) in net assets | (2,050,061 | ) | (56,809,355 | ) | ||||
| Net assets | ||||||||
Beginning of year | 206,263,794 | 263,073,149 | ||||||
|
|
|
| |||||
End of year | $ | 204,213,733 | $ | 206,263,794 | ||||
|
|
|
| |||||
Undistributed (accumulated) net investment income (loss) included in net assets at end of year | $ | 27,553 | $ | (71,739 | ) | |||
|
|
|
| |||||
The accompanying notes are an integral part of the financial statements.
158
Table of Contents
| MML Small Company Value Fund | MML Small/Mid Cap Value Fund | |||||||||||||
| Year Ended December 31, 2016 | Year Ended December 31, 2015 | Year Ended December 31, 2016 | Year Ended December 31, 2015 | |||||||||||
| $ | 645,054 | $ | 618,302 | $ | 1,059,731 | $ | 1,141,187 | |||||||
| 11,762,787 | 13,291,659 | 13,034,233 | 14,216,113 | |||||||||||
| 16,968,232 | (19,544,016 | ) | 36,465,058 | (27,388,266 | ) | |||||||||
|
|
|
|
|
|
|
| |||||||
| 29,376,073 | (5,634,055 | ) | 50,559,022 | (12,030,966 | ) | |||||||||
|
|
|
|
|
|
|
| |||||||
| - | - | (1,124,385 | ) | (1,528,716 | ) | |||||||||
| (555,663 | ) | (292,251 | ) | - | - | |||||||||
| - | - | (53,616 | ) | (82,016 | ) | |||||||||
| (49,139 | ) | (15,522 | ) | - | - | |||||||||
|
|
|
|
|
|
|
| |||||||
| (604,802 | ) | (307,773 | ) | (1,178,001 | ) | (1,610,732 | ) | |||||||
|
|
|
|
|
|
|
| |||||||
| - | - | (13,026,952 | ) | (34,922,416 | ) | |||||||||
| (11,625,602 | ) | (8,989,337 | ) | - | - | |||||||||
| - | - | (1,081,940 | ) | (2,694,866 | ) | |||||||||
| (1,548,667 | ) | (1,113,650 | ) | - | - | |||||||||
|
|
|
|
|
|
|
| |||||||
| (13,174,269 | ) | (10,102,987 | ) | (14,108,892 | ) | (37,617,282 | ) | |||||||
|
|
|
|
|
|
|
| |||||||
| - | - | (18,016,276 | ) | 8,419,482 | ||||||||||
| (12,961,576 | ) | 6,549,088 | - | - | ||||||||||
| - | - | 940,646 | 4,172,406 | |||||||||||
| 2,661,360 | 1,879,270 | - | - | |||||||||||
|
|
|
|
|
|
|
| |||||||
| (10,300,216 | ) | 8,428,358 | (17,075,630 | ) | 12,591,888 | |||||||||
|
|
|
|
|
|
|
| |||||||
| 5,296,786 | (7,616,457 | ) | 18,196,499 | (38,667,092 | ) | |||||||||
| 98,897,474 | 106,513,931 | 213,216,014 | 251,883,106 | |||||||||||
|
|
|
|
|
|
|
| |||||||
| $ | 104,194,260 | $ | 98,897,474 | $ | 231,412,513 | $ | 213,216,014 | |||||||
|
|
|
|
|
|
|
| |||||||
| $ | 633,459 | $ | 604,429 | $ | 1,008,202 | $ | 1,171,178 | |||||||
|
|
|
|
|
|
|
| |||||||
159
Table of Contents
MML Series Investment Fund – Financial Statements (Continued)
Statements of Changes in Net Assets
| MML Total Return Bond Fund | ||||||||
| Year Ended December 31, 2016 | Year Ended December 31, 2015 | |||||||
| Increase (Decrease) in Net Assets: | ||||||||
| Operations: | ||||||||
Net investment income (loss) | $ | 6,105,819 | $ | 4,953,970 | ||||
Net realized gain (loss) on investment transactions | 935,899 | 2,325,817 | ||||||
Net change in unrealized appreciation (depreciation) on investments | 530,812 | (6,568,770 | ) | |||||
|
|
|
| |||||
Net increase (decrease) in net assets resulting from operations | 7,572,530 | 711,017 | ||||||
|
|
|
| |||||
| Distributions to shareholders (Note 2): | ||||||||
From net investment income: |
| |||||||
Class II | (5,873,606 | ) | (11,042,639 | ) | ||||
Service Class I | (333,516 | ) | (502,420 | ) | ||||
|
|
|
| |||||
Total distributions from net investment income | (6,207,122 | ) | (11,545,059 | ) | ||||
|
|
|
| |||||
From net realized gains: |
| |||||||
Class II | - | (3,600,708 | ) | |||||
Service Class I | - | (173,513 | ) | |||||
|
|
|
| |||||
Total distributions from net realized gains | - | (3,774,221 | ) | |||||
|
|
|
| |||||
| Net fund share transactions (Note 5): | ||||||||
Class II | 63,034,175 | (60,886,838 | ) | |||||
Service Class I | 1,865,939 | 3,416,275 | ||||||
|
|
|
| |||||
Increase (decrease) in net assets from fund share transactions | 64,900,114 | (57,470,563 | ) | |||||
|
|
|
| |||||
Total increase (decrease) in net assets | 66,265,522 | (72,078,826 | ) | |||||
| Net assets | ||||||||
Beginning of year | 346,088,951 | 418,167,777 | ||||||
|
|
|
| |||||
End of year | $ | 412,354,473 | $ | 346,088,951 | ||||
|
|
|
| |||||
Undistributed (accumulated) net investment income (loss) included in net assets at end of year | $ | 8,272,525 | $ | 6,160,640 | ||||
|
|
|
| |||||
The accompanying notes are an integral part of the financial statements.
160
Table of Contents
MML Series Investment Fund – Financial Statements (Continued)
Financial Highlights (For a share outstanding throughout each period)
MML Blue Chip Growth Fund
| Income (loss) from investment operations | Less distributions to shareholders | Ratios / Supplemental Data | ||||||||||||||||||||||||||||||||||||||||||||||
| Net asset value, beginning of the period | Net investment income (loss)c | Net realized and unrealized gain (loss) on investments | Total income (loss) from investment operations | From net investment income | From net realized gains | Total distributions | Net asset value, end of the period | Total returnm | Net assets, end of the period (000’s) | Ratio of expenses to average daily net assets | Net investment income (loss) to average daily net assets | |||||||||||||||||||||||||||||||||||||
Initial Class |
| |||||||||||||||||||||||||||||||||||||||||||||||
| 12/31/16 | $ | 15.79 | $ | 0.00 | d | $ | 0.13 | $ | 0.13 | $ | - | $ | (1.94 | ) | $ | (1.94 | ) | $ | 13.98 | 0.91% | $ | 332,688 | 0.79% | 0.03% | ||||||||||||||||||||||||
| 12/31/15 | 17.09 | (0.01 | ) | 1.70 | 1.69 | - | (2.99 | ) | (2.99 | ) | 15.79 | 11.10% | 388,654 | 0.79% | (0.06% | ) | ||||||||||||||||||||||||||||||||
| 12/31/14 | 17.35 | (0.01 | ) | 1.55 | 1.54 | - | (1.80 | ) | (1.80 | ) | 17.09 | 9.13% | 390,322 | 0.79% | (0.09% | ) | ||||||||||||||||||||||||||||||||
| 12/31/13 | 13.50 | (0.00 | )d | 5.28 | 5.28 | (0.04 | ) | (1.39 | ) | (1.43 | ) | 17.35 | 41.33% | 429,689 | 0.79% | (0.01% | ) | |||||||||||||||||||||||||||||||
| 12/31/12 | 11.42 | 0.03 | 2.06 | 2.09 | (0.01 | ) | - | (0.01 | ) | 13.50 | 18.31% | 321,245 | 0.80% | 0.26% | ||||||||||||||||||||||||||||||||||
Service Class |
| |||||||||||||||||||||||||||||||||||||||||||||||
| 12/31/16 | $ | 15.47 | $ | (0.03 | ) | $ | 0.12 | $ | 0.09 | $ | - | $ | (1.94 | ) | $ | (1.94 | ) | $ | 13.62 | 0.65% | $ | 47,411 | 1.04% | (0.22% | ) | |||||||||||||||||||||||
| 12/31/15 | 16.85 | (0.05 | ) | 1.66 | 1.61 | - | (2.99 | ) | (2.99 | ) | 15.47 | 10.76% | 42,486 | 1.04% | (0.31% | ) | ||||||||||||||||||||||||||||||||
| 12/31/14 | 17.17 | (0.06 | ) | 1.54 | 1.48 | - | (1.80 | ) | (1.80 | ) | 16.85 | 8.87% | 31,721 | 1.04% | (0.34% | ) | ||||||||||||||||||||||||||||||||
| 12/31/13 | 13.38 | (0.04 | ) | 5.23 | 5.19 | (0.01 | ) | (1.39 | ) | (1.40 | ) | 17.17 | 41.00% | 23,273 | 1.04% | (0.26% | ) | |||||||||||||||||||||||||||||||
| 12/31/12 | 11.34 | 0.01 | 2.03 | 2.04 | - | - | - | 13.38 | 17.99% | 14,895 | 1.05% | 0.06% | ||||||||||||||||||||||||||||||||||||
| Year ended December 31 | ||||||||||||||||||||
| 2016 | 2015 | 2014 | 2013 | 2012 | ||||||||||||||||
Portfolio turnover rate | 29 | % | 31 | % | 30 | % | 35 | % | 25 | % | ||||||||||
| c | Per share amount calculated on the average shares method. |
| d | Amount is less than $0.005 per share. |
| m | Total return does not reflect expenses that apply at the separate account level or to related insurance products. Inclusion of these charges would reduce the total return figures for all periods shown. |
The accompanying notes are an integral part of the financial statements.
161
Table of Contents
MML Series Investment Fund – Financial Statements (Continued)
Financial Highlights (For a share outstanding throughout each period)
MML Equity Income Fund
| Income (loss) from investment operations | Less distributions to shareholders | Ratios / Supplemental Data | ||||||||||||||||||||||||||||||||||||||||||||||||||
| Net asset value, beginning of the period | Net investment income (loss)c,j | Net realized and unrealized gain (loss) on investments | Total income (loss) from investment operations | From net investment income | From net realized gains | Total distributions | Net asset value, end of the period | Total returnm | Net assets, end of the period (000’s) | Ratio of expenses to average daily net assets before expense waiver | Ratio of expenses to average daily net assets after expense waiversj | Net investment income (loss) to average daily net assets | ||||||||||||||||||||||||||||||||||||||||
Initial Class |
| |||||||||||||||||||||||||||||||||||||||||||||||||||
| 12/31/16 | $ | 11.29 | $ | 0.27 | $ | 1.73 | $ | 2.00 | $ | (0.25 | ) | $ | (1.26 | ) | $ | (1.51 | ) | $ | 11.78 | 18.68% | $ | 413,304 | 0.79% | 0.77 | % | 2.33% | ||||||||||||||||||||||||||
| 12/31/15 | 13.93 | 0.25 | (1.28 | ) | (1.03 | ) | (0.26 | ) | (1.35 | ) | (1.61 | ) | 11.29 | (6.88% | ) | 409,298 | 0.78% | N/A | 1.96% | |||||||||||||||||||||||||||||||||
| 12/31/14 | 13.47 | 0.25 | 0.76 | 1.01 | (0.24 | ) | (0.31 | ) | (0.55 | ) | 13.93 | 7.54% | 472,989 | 0.78% | N/A | 1.84% | ||||||||||||||||||||||||||||||||||||
| 12/31/13 | 10.57 | 0.20 | 2.93 | 3.13 | (0.23 | ) | - | (0.23 | ) | 13.47 | 29.93% | 556,649 | 0.78% | N/A | 1.64% | |||||||||||||||||||||||||||||||||||||
| 12/31/12 | 9.20 | 0.21 | 1.37 | 1.58 | (0.21 | ) | - | (0.21 | ) | 10.57 | 17.32% | 478,096 | 0.79% | N/A | 2.12% | |||||||||||||||||||||||||||||||||||||
Service Class |
| |||||||||||||||||||||||||||||||||||||||||||||||||||
| 12/31/16 | $ | 11.20 | $ | 0.24 | $ | 1.72 | $ | 1.96 | $ | (0.22 | ) | $ | (1.26 | ) | $ | (1.48 | ) | $ | 11.68 | 18.46% | $ | 77,647 | 1.04% | 1.02 | % | 2.10% | ||||||||||||||||||||||||||
| 12/31/15 | 13.83 | 0.22 | (1.27 | ) | (1.05 | ) | (0.23 | ) | (1.35 | ) | (1.58 | ) | 11.20 | (7.10% | ) | 63,263 | 1.03% | N/A | 1.72% | |||||||||||||||||||||||||||||||||
| 12/31/14 | 13.39 | 0.22 | 0.74 | 0.96 | (0.21 | ) | (0.31 | ) | (0.52 | ) | 13.83 | 7.23% | 63,751 | 1.03% | N/A | 1.58% | ||||||||||||||||||||||||||||||||||||
| 12/31/13 | 10.52 | 0.17 | 2.91 | 3.08 | (0.21 | ) | - | (0.21 | ) | 13.39 | 29.55% | 54,576 | 1.03% | N/A | 1.39% | |||||||||||||||||||||||||||||||||||||
| 12/31/12 | 9.16 | 0.19 | 1.36 | 1.55 | (0.19 | ) | - | (0.19 | ) | 10.52 | 17.06% | 39,397 | 1.04% | N/A | 1.88% | |||||||||||||||||||||||||||||||||||||
| Year ended December 31 | ||||||||||||||||||||
| 2016 | 2015 | 2014 | 2013 | 2012 | ||||||||||||||||
Portfolio turnover rate | 22 | % | 39 | % | 9 | % | 15 | % | 15 | % | ||||||||||
| c | Per share amount calculated on the average shares method. |
| j | Computed after giving effect to an agreement by MML Advisers to waive certain fees and expenses of the Fund. |
| m | Total return does not reflect expenses that apply at the separate account level or to related insurance products. Inclusion of these charges would reduce the total return figures for all periods shown. |
The accompanying notes are an integral part of the financial statements.
162
Table of Contents
MML Series Investment Fund – Financial Statements (Continued)
Financial Highlights (For a share outstanding throughout each period)
MML Equity Index Fund
| Income (loss) from investment operations | Less distributions to shareholders | Ratios / Supplemental Data | ||||||||||||||||||||||||||||||||||||||||||||||||||
| Net asset value, beginning of the period | Net investment income (loss)c,j | Net realized and unrealized gain (loss) on investments | Total income (loss) from investment operations | From net investment income | From net realized gains | Total distributions | Net asset value, end of the period | Total returnm | Net assets, end of the period (000's) | Ratio of expenses to average daily net assets before expense waivers | Ratio of expenses to average daily net assets after expense waiversj | Net investment income (loss) to average daily net assets | ||||||||||||||||||||||||||||||||||||||||
Class I |
| |||||||||||||||||||||||||||||||||||||||||||||||||||
| 12/31/16 | $ | 24.76 | $ | 0.44 | $ | 2.37 | $ | 2.81 | $ | (0.43 | ) | $ | (0.61 | ) | $ | (1.04 | ) | $ | 26.53 | 11.48% | $ | 66,343 | 0.43% | N/A | 1.76% | |||||||||||||||||||||||||||
| 12/31/15 | 25.52 | 0.42 | (0.23 | ) | 0.19 | (0.38 | ) | (0.57 | ) | (0.95 | ) | 24.76 | 0.95% | 74,631 | 0.43% | N/A | 1.67% | |||||||||||||||||||||||||||||||||||
| 12/31/14 | 23.14 | 0.38 | 2.65 | 3.03 | (0.33 | ) | (0.32 | ) | (0.65 | ) | 25.52 | 13.17% | 84,445 | 0.44% | N/A | 1.58% | ||||||||||||||||||||||||||||||||||||
| 12/31/13 | 17.89 | 0.34 | 5.30 | 5.64 | (0.33 | ) | (0.06 | ) | (0.39 | ) | 23.14 | 31.84% | 92,853 | 0.44% | 0.44 | %l | 1.65% | |||||||||||||||||||||||||||||||||||
| 12/31/12 | 15.73 | 0.32 | 2.11 | 2.43 | (0.27 | ) | - | (0.27 | ) | 17.89 | 15.47% | 79,070 | 0.45% | 0.45 | %l | 1.84% | ||||||||||||||||||||||||||||||||||||
Class II |
| |||||||||||||||||||||||||||||||||||||||||||||||||||
| 12/31/16 | $ | 24.80 | $ | 0.48 | $ | 2.36 | $ | 2.84 | $ | (0.48 | ) | $ | (0.61 | ) | $ | (1.09 | ) | $ | 26.55 | 11.62% | $ | 175,525 | 0.28% | N/A | 1.91% | |||||||||||||||||||||||||||
| 12/31/15 | 25.56 | 0.47 | (0.23 | ) | 0.24 | (0.43 | ) | (0.57 | ) | (1.00 | ) | 24.80 | 1.17% | 164,515 | 0.30% | 0.28 | % | 1.83% | ||||||||||||||||||||||||||||||||||
| 12/31/14 | 23.19 | 0.42 | 2.65 | 3.07 | (0.38 | ) | (0.32 | ) | (0.70 | ) | 25.56 | 13.35% | 154,210 | 0.33% | 0.28 | % | 1.74% | |||||||||||||||||||||||||||||||||||
| 12/31/13 | 17.93 | 0.37 | 5.31 | 5.68 | (0.36 | ) | (0.06 | ) | (0.42 | ) | 23.19 | 32.02% | 141,468 | 0.33% | 0.28 | % | 1.81% | |||||||||||||||||||||||||||||||||||
| 12/31/12 | 15.76 | 0.35 | 2.12 | 2.47 | (0.30 | ) | - | (0.30 | ) | 17.93 | 15.69% | 109,646 | 0.34% | 0.29 | % | 2.00% | ||||||||||||||||||||||||||||||||||||
Class III |
| |||||||||||||||||||||||||||||||||||||||||||||||||||
| 12/31/16 | $ | 24.78 | $ | 0.52 | $ | 2.34 | $ | 2.86 | $ | (0.52 | ) | $ | (0.61 | ) | $ | (1.13 | ) | $ | 26.51 | 11.69% | $ | 279,941 | 0.13% | N/A | 2.05% | |||||||||||||||||||||||||||
| 12/31/15 | 25.54 | 0.50 | (0.22 | ) | 0.28 | (0.47 | ) | (0.57 | ) | (1.04 | ) | 24.78 | 1.32% | 172,992 | 0.15% | 0.13 | % | 1.97% | ||||||||||||||||||||||||||||||||||
| 12/31/14 | 23.16 | 0.46 | 2.65 | 3.11 | (0.41 | ) | (0.32 | ) | (0.73 | ) | 25.54 | 13.54% | 173,459 | 0.19% | 0.14 | % | 1.88% | |||||||||||||||||||||||||||||||||||
| 12/31/13 | 17.91 | 0.40 | 5.29 | 5.69 | (0.38 | ) | (0.06 | ) | (0.44 | ) | 23.16 | 32.17% | 155,356 | 0.19% | 0.14 | % | 1.95% | |||||||||||||||||||||||||||||||||||
| 12/31/12 | 15.74 | 0.37 | 2.12 | 2.49 | (0.32 | ) | - | (0.32 | ) | 17.91 | 15.87% | 119,034 | 0.20% | 0.15 | % | 2.14% | ||||||||||||||||||||||||||||||||||||
Service Class I |
| |||||||||||||||||||||||||||||||||||||||||||||||||||
| 12/31/16 | $ | 24.16 | $ | 0.37 | $ | 2.31 | $ | 2.68 | $ | (0.39 | ) | $ | (0.61 | ) | $ | (1.00 | ) | $ | 25.84 | 11.24% | $ | 42,165 | 0.68% | N/A | 1.51% | |||||||||||||||||||||||||||
| 12/31/15 | 24.98 | 0.35 | (0.23 | ) | 0.12 | (0.37 | ) | (0.57 | ) | (0.94 | ) | 24.16 | 0.70% | 38,691 | 0.68% | N/A | 1.43% | |||||||||||||||||||||||||||||||||||
| 12/31/14 | 22.72 | 0.32 | 2.59 | 2.91 | (0.33 | ) | (0.32 | ) | (0.65 | ) | 24.98 | 12.92% | 32,075 | 0.69% | N/A | 1.34% | ||||||||||||||||||||||||||||||||||||
| 12/31/13 | 17.62 | 0.29 | 5.20 | 5.49 | (0.33 | ) | (0.06 | ) | (0.39 | ) | 22.72 | 31.49% | 21,443 | 0.69% | 0.69 | %l | 1.40% | |||||||||||||||||||||||||||||||||||
| 12/31/12 | 15.53 | 0.28 | 2.08 | 2.36 | (0.27 | ) | - | (0.27 | ) | 17.62 | 15.21% | 10,229 | 0.70% | 0.70 | %l�� | 1.63% | ||||||||||||||||||||||||||||||||||||
| Year ended December 31 | ||||||||||||||||||||
| 2016 | 2015 | 2014 | 2013 | 2012 | ||||||||||||||||
Portfolio turnover rate | 8 | % | 4 | % | 3 | % | 4 | % | 3 | % | ||||||||||
| c | Per share amount calculated on the average shares method. |
| j | Computed after giving effect to an agreement by MML Advisers and/or MassMutual to waive certain fees and expenses of the Fund. |
| l | Expenses incurred during the period fell under the expense cap. |
| m | Total return does not reflect expenses that apply at the separate account level or to related insurance products. Inclusion of these charges would reduce the total return figures for all periods shown. |
The accompanying notes are an integral part of the financial statements.
163
Table of Contents
MML Series Investment Fund – Financial Statements (Continued)
Financial Highlights (For a share outstanding throughout each period)
MML Focused Equity Fund
| Income (loss) from investment operations | Less distributions to shareholders | Ratios / Supplemental Data | ||||||||||||||||||||||||||||||||||||||||||||||||||
| Net asset value, beginning of the period | Net investment income (loss)c,j | Net realized and unrealized gain (loss) on investments | Total income (loss) from investment operations | From net investment income | From net realized gain | Total distributions | Net asset value, end of the period | Total returnm | Net assets, end of the period (000’s) | Ratio of expenses to average daily net assets before expense waivers | Ratio of expenses to average daily net assets after expense waiversj | Net investment income (loss) to average daily net assets | ||||||||||||||||||||||||||||||||||||||||
Class II |
| |||||||||||||||||||||||||||||||||||||||||||||||||||
| 12/31/16 | $ | 12.15 | $ | 0.13 | $ | 1.96 | $ | 2.09 | $ | (0.20 | ) | $ | (0.84 | ) | $ | (1.04 | ) | $ | 13.20 | 17.96% | $ | 128,990 | 0.90% | N/A | 1.11% | |||||||||||||||||||||||||||
| 12/31/15 | 15.97 | 0.21 | (1.71 | ) | (1.50 | ) | (0.28 | ) | (2.04 | ) | (2.32 | ) | 12.15 | (8.93% | ) | 147,436 | 0.90% | N/A | 1.43% | |||||||||||||||||||||||||||||||||
| 12/31/14 | 15.64 | 0.29 | 1.59 | 1.88 | (0.06 | ) | (1.49 | ) | (1.55 | ) | 15.97 | 12.24% | 160,206 | 0.90% | N/A | 1.86% | ||||||||||||||||||||||||||||||||||||
| 12/31/13 | 11.49 | 0.05 | 4.29 | 4.34 | - | (0.19 | ) | (0.19 | ) | 15.64 | 38.05% | 166,655 | 0.90% | 0.90 | %l | 0.40% | ||||||||||||||||||||||||||||||||||||
| 12/31/12 | 10.03 | 0.09 | 1.98 | 2.07 | (0.09 | ) | (0.52 | ) | (0.61 | ) | 11.49 | 20.61% | 136,305 | 0.90% | 0.90 | %k | 0.76% | |||||||||||||||||||||||||||||||||||
Service Class I |
| |||||||||||||||||||||||||||||||||||||||||||||||||||
| 12/31/16 | $ | 12.06 | $ | 0.10 | $ | 1.95 | $ | 2.05 | $ | (0.16 | ) | $ | (0.84 | ) | $ | (1.00 | ) | $ | 13.11 | 17.74% | $ | 6,829 | 1.15% | N/A | 0.87% | |||||||||||||||||||||||||||
| 12/31/15 | 15.87 | 0.17 | (1.69 | ) | (1.52 | ) | (0.25 | ) | (2.04 | ) | (2.29 | ) | 12.06 | (9.16% | ) | 7,023 | 1.15% | N/A | 1.20% | |||||||||||||||||||||||||||||||||
| 12/31/14 | 15.58 | 0.22 | 1.61 | 1.83 | (0.05 | ) | (1.49 | ) | (1.54 | ) | 15.87 | 11.97% | 7,289 | 1.15% | N/A | 1.39% | ||||||||||||||||||||||||||||||||||||
| 12/31/13 | 11.48 | 0.02 | 4.27 | 4.29 | - | (0.19 | ) | (0.19 | ) | 15.58 | 37.64% | 4,960 | 1.15% | 1.15 | %k | 0.18% | ||||||||||||||||||||||||||||||||||||
| 12/31/12h | 11.54 | 0.07 | 0.47 | 0.54 | (0.08 | ) | (0.52 | ) | (0.60 | ) | 11.48 | 4.68% | b | 818 | 1.15% | a | 1.15 | %a,l | 0.91% | a | ||||||||||||||||||||||||||||||||
| Year ended December 31 | ||||||||||||||||||||
| 2016 | 2015 | 2014 | 2013 | 2012 | ||||||||||||||||
Portfolio turnover rate | 37 | % | 52 | % | 35 | % | 28 | % | 34 | % | ||||||||||
| a | Annualized. |
| b | Percentage represents the results for the period and is not annualized. |
| c | Per share amount calculated on the average shares method. |
| h | For the period May 1, 2012 (commencement of operations) through December 31, 2012. |
| j | Computed after giving effect to an agreement by MML Advisers and/or MassMutual to waive certain fees and expenses of the Fund. |
| k | Amount waived had no impact on the ratio of expenses to average daily net assets. |
| l | Expenses incurred during the period fell under the expense cap. |
| m | Total return does not reflect expenses that apply at the separate account level or to related insurance products. Inclusion of these charges would reduce the total return figures for all periods shown. |
The accompanying notes are an integral part of the financial statements.
164
Table of Contents
MML Series Investment Fund – Financial Statements (Continued)
Financial Highlights (For a share outstanding throughout each period)
MML Foreign Fund
| Income (loss) from investment operations | Less distributions to shareholders | Ratios / Supplemental Data | ||||||||||||||||||||||||||||||||||||||||||
| Net asset value, beginning of the period | Net investment income (loss)c | Net realized and unrealized gain (loss) on investments | Total income (loss) from investment operations | From net investment income | Total distributions | Net asset value, end of the period | Total returnm | Net assets, end of the period (000’s) | Ratio of expenses to average daily net assets | Net investment income (loss) to average daily net assets | ||||||||||||||||||||||||||||||||||
Initial Class |
| |||||||||||||||||||||||||||||||||||||||||||
| 12/31/16 | $ | 9.49 | $ | 0.20 | $ | (0.07 | ) | $ | 0.13 | $ | (0.18 | ) | $ | (0.18 | ) | $ | 9.44 | 1.44% | $ | 348,836 | 0.97% | 2.22% | ||||||||||||||||||||||
| 12/31/15 | 10.22 | 0.20 | (0.63 | ) | (0.43 | ) | (0.30 | ) | (0.30 | ) | 9.49 | (4.26% | ) | 347,072 | 0.97% | 1.89% | ||||||||||||||||||||||||||||
| 12/31/14 | 11.22 | 0.34 | (1.09 | ) | (0.75 | ) | (0.25 | ) | (0.25 | ) | 10.22 | (6.97% | ) | 328,045 | 0.97% | 3.09% | ||||||||||||||||||||||||||||
| 12/31/13 | 9.47 | 0.20 | 1.75 | 1.95 | (0.20 | ) | (0.20 | ) | 11.22 | 20.80% | 412,363 | 0.97% | 2.00% | |||||||||||||||||||||||||||||||
| 12/31/12 | 8.13 | 0.21 | 1.32 | 1.53 | (0.19 | ) | (0.19 | ) | 9.47 | 19.06% | 355,174 | 0.97% | 2.38% | |||||||||||||||||||||||||||||||
Service Class |
| |||||||||||||||||||||||||||||||||||||||||||
| 12/31/16 | $ | 9.43 | $ | 0.18 | $ | (0.07 | ) | $ | 0.11 | $ | (0.16 | ) | $ | (0.16 | ) | $ | 9.38 | 1.18% | $ | 10,231 | 1.22% | 2.02% | ||||||||||||||||||||||
| 12/31/15 | 10.16 | 0.17 | (0.62 | ) | (0.45 | ) | (0.28 | ) | (0.28 | ) | 9.43 | (4.51% | ) | 11,396 | 1.22% | 1.59% | ||||||||||||||||||||||||||||
| 12/31/14 | 11.16 | 0.30 | (1.07 | ) | (0.77 | ) | (0.23 | ) | (0.23 | ) | 10.16 | (7.07% | ) | 11,089 | 1.22% | 2.72% | ||||||||||||||||||||||||||||
| 12/31/13 | 9.43 | 0.17 | 1.74 | 1.91 | (0.18 | ) | (0.18 | ) | 11.16 | 20.42% | 8,350 | 1.22% | 1.71% | |||||||||||||||||||||||||||||||
| 12/31/12 | 8.10 | 0.18 | 1.32 | 1.50 | (0.17 | ) | (0.17 | ) | 9.43 | 18.74% | 6,756 | 1.22% | 2.13% | |||||||||||||||||||||||||||||||
| Year ended December 31 | ||||||||||||||||||||
| 2016 | 2015 | 2014 | 2013 | 2012 | ||||||||||||||||
Portfolio turnover rate | 19 | % | 12 | % | 13 | %t | 20 | % | 15 | % | ||||||||||
| c | Per share amount calculated on the average shares method. |
| m | Total return does not reflect expenses that apply at the separate account level or to related insurance products. Inclusion of these charges would reduce the total return figures for all periods shown. |
| t | The portfolio turnover rate was not impacted as a result of the cash merger. |
The accompanying notes are an integral part of the financial statements.
165
Table of Contents
MML Series Investment Fund – Financial Statements (Continued)
Financial Highlights (For a share outstanding throughout each period)
MML Fundamental Growth Fund
| Income (loss) from investment operations | Less distributions to shareholders | Ratios / Supplemental Data | ||||||||||||||||||||||||||||||||||||||||||||||||||
| Net asset value, beginning of the period | Net investment income (loss)c,j | Net realized and unrealized gain (loss) on investments | Total income (loss) from investment operations | From net investment income | From net realized gains | Total distributions | Net asset value, end of the period | Total returnm | Net assets, end of the period (000’s) | Ratio of expenses to average daily net assets before expense waivers | Ratio of expenses to average daily net assets after expense waiversj | Net investment income (loss) to average daily net assets | ||||||||||||||||||||||||||||||||||||||||
Class II | ||||||||||||||||||||||||||||||||||||||||||||||||||||
| 12/31/16 | $ | 12.53 | $ | 0.09 | $ | 0.36 | $ | 0.45 | $ | (0.08 | ) | $ | (1.48 | ) | $ | (1.56 | ) | $ | 11.42 | 3.73% | $ | 165,183 | 0.83% | 0.83% | l | 0.79% | ||||||||||||||||||||||||||
| 12/31/15 | 14.89 | 0.09 | 0.64 | 0.73 | (0.13 | ) | (2.96 | ) | (3.09 | ) | 12.53 | 6.22% | 183,094 | 0.84% | 0.84% | l | 0.63% | |||||||||||||||||||||||||||||||||||
| 12/31/14 | 14.46 | 0.12 | 1.44 | 1.56 | (0.11 | ) | (1.02 | ) | (1.13 | ) | 14.89 | 11.06% | 207,086 | 0.86% | 0.85% | 0.81% | ||||||||||||||||||||||||||||||||||||
| 12/31/13 | 10.94 | 0.09 | 3.44 | 3.53 | - | (0.01 | ) | (0.01 | ) | 14.46 | 32.29% | 236,837 | 0.86% | 0.85% | 0.72% | |||||||||||||||||||||||||||||||||||||
| 12/31/12 | 9.95 | 0.09 | 1.23 | 1.32 | (0.09 | ) | (0.24 | ) | (0.33 | ) | 10.94 | 13.14% | 179,834 | 0.87% | 0.85% | 0.79% | ||||||||||||||||||||||||||||||||||||
Service Class I |
| |||||||||||||||||||||||||||||||||||||||||||||||||||
| 12/31/16 | $ | 12.41 | $ | 0.06 | $ | 0.37 | $ | 0.43 | $ | (0.07 | ) | $ | (1.48 | ) | $ | (1.55 | ) | $ | 11.29 | 3.54% | $ | 4,263 | 1.08% | 1.08% | l | 0.54% | ||||||||||||||||||||||||||
| 12/31/15 | 14.80 | 0.05 | 0.63 | 0.68 | (0.11 | ) | (2.96 | ) | (3.07 | ) | 12.41 | 5.91% | 2,955 | 1.09% | 1.09% | l | 0.36% | |||||||||||||||||||||||||||||||||||
| 12/31/14 | 14.40 | 0.09 | 1.43 | 1.52 | (0.10 | ) | (1.02 | ) | (1.12 | ) | 14.80 | 10.81% | 2,214 | 1.11% | 1.10% | 0.59% | ||||||||||||||||||||||||||||||||||||
| 12/31/13 | 10.92 | 0.06 | 3.43 | 3.49 | - | (0.01 | ) | (0.01 | ) | 14.40 | 31.98% | 1,353 | 1.11% | 1.10% | 0.45% | |||||||||||||||||||||||||||||||||||||
| 12/31/12h | 11.50 | 0.07 | (0.33 | ) | (0.26 | ) | (0.08 | ) | (0.24 | ) | (0.32 | ) | 10.92 | (2.32% | )b | 518 | 1.12% | a | 1.10% | a | 0.94% | a | ||||||||||||||||||||||||||||||
| Year ended December 31 | ||||||||||||||||||||
| 2016 | 2015 | 2014 | 2013 | 2012 | ||||||||||||||||
Portfolio turnover rate | 49 | % | 44 | % | 51 | % | 61 | % | 66 | % | ||||||||||
| a | Annualized. |
| b | Percentage represents the results for the period and is not annualized. |
| c | Per share amount calculated on the average shares method. |
| h | For the period May 1, 2012 (commencement of operations) through December 31, 2012. |
| j | Computed after giving effect to an agreement by MML Advisers and/or MassMutual to waive certain fees and expenses of the Fund. |
| l | Expenses incurred during the period fell under the expense cap. |
| m | Total return does not reflect expenses that apply at the separate account level or to related insurance products. Inclusion of these charges would reduce the total return figures for all periods shown. |
The accompanying notes are an integral part of the financial statements.
166
Table of Contents
MML Series Investment Fund – Financial Statements (Continued)
Financial Highlights (For a share outstanding throughout each period)
MML Fundamental Value Fund
| Income (loss) from investment operations | Less distributions to shareholders | Ratios / Supplemental Data | ||||||||||||||||||||||||||||||||||||||||||||||||||
| Net asset value, beginning of the period | Net investment income (loss)c,j | Net realized and unrealized gain (loss) on investments | Total income (loss) from investment operations | From net investment income | From net realized gains | Total distributions | Net asset value, end of the period | Total returnm | Net assets, end of the period (000’s) | Ratio of expenses to average daily net assets before expense waivers | Ratio of expenses to average daily net assets after expense waiversj | Net investment income (loss) to average daily net assets | ||||||||||||||||||||||||||||||||||||||||
Class II |
| |||||||||||||||||||||||||||||||||||||||||||||||||||
| 12/31/16 | $ | 14.20 | $ | 0.26 | $ | 1.56 | $ | 1.82 | $ | (0.21 | ) | $ | (1.07 | ) | $ | (1.28 | ) | $ | 14.74 | 13.25% | $ | 223,801 | 0.79% | N/A | 1.81% | |||||||||||||||||||||||||||
| 12/31/15 | 16.20 | 0.23 | (0.76 | ) | (0.53 | ) | (0.22 | ) | (1.25 | ) | (1.47 | ) | 14.20 | (2.88% | ) | 217,109 | 0.79% | N/A | 1.51% | |||||||||||||||||||||||||||||||||
| 12/31/14 | 15.46 | 0.23 | 1.47 | 1.70 | (0.25 | ) | (0.71 | ) | (0.96 | ) | 16.20 | 11.19% | 219,679 | 0.79% | N/A | 1.47% | ||||||||||||||||||||||||||||||||||||
| 12/31/13 | 12.45 | 0.23 | 3.54 | 3.77 | (0.25 | ) | (0.51 | ) | (0.76 | ) | 15.46 | 30.91% | 233,724 | 0.79% | 0.79% | l | 1.61% | |||||||||||||||||||||||||||||||||||
| 12/31/12 | 10.88 | 0.24 | 1.53 | 1.77 | (0.17 | ) | (0.03 | ) | (0.20 | ) | 12.45 | 16.31% | 185,473 | 0.80% | 0.80% | l | 1.98% | |||||||||||||||||||||||||||||||||||
Service Class I |
| |||||||||||||||||||||||||||||||||||||||||||||||||||
| 12/31/16 | $ | 14.05 | $ | 0.22 | $ | 1.55 | $ | 1.77 | $ | (0.18 | ) | $ | (1.07 | ) | $ | (1.25 | ) | $ | 14.57 | 13.05% | $ | 9,319 | 1.04% | N/A | 1.55% | |||||||||||||||||||||||||||
| 12/31/15 | 16.07 | 0.19 | (0.76 | ) | (0.57 | ) | (0.20 | ) | (1.25 | ) | (1.45 | ) | 14.05 | (3.18% | ) | 7,757 | 1.04% | N/A | 1.26% | |||||||||||||||||||||||||||||||||
| 12/31/14 | 15.37 | 0.19 | 1.47 | 1.66 | (0.25 | ) | (0.71 | ) | (0.96 | ) | 16.07 | 10.98% | 5,611 | 1.04% | N/A | 1.21% | ||||||||||||||||||||||||||||||||||||
| 12/31/13 | 12.42 | 0.19 | 3.52 | 3.71 | (0.25 | ) | (0.51 | ) | (0.76 | ) | 15.37 | 30.55% | 2,650 | 1.04% | 1.04% | l | 1.28% | |||||||||||||||||||||||||||||||||||
| 12/31/12h | 12.16 | 0.14 | 0.33 | 0.47 | (0.18 | ) | (0.03 | ) | (0.21 | ) | 12.42 | 3.90% | b | 381 | 1.05% | a | 1.05% | a,l | 1.78% | a | ||||||||||||||||||||||||||||||||
| Year ended December 31 | ||||||||||||||||||||
| 2016 | 2015 | 2014 | 2013 | 2012 | ||||||||||||||||
Portfolio turnover rate | 20 | % | 19 | % | 14 | % | 22 | % | 24 | % | ||||||||||
| a | Annualized. |
| b | Percentage represents the results for the period and is not annualized. |
| c | Per share amount calculated on the average shares method. |
| h | For the period May 1, 2012 (commencement of operations) through December 31, 2012. |
| j | Computed after giving effect to an agreement by MML Advisers and/or MassMutual to waive certain fees and expenses of the Fund. |
| l | Expenses incurred during the period fell under the expense cap. |
| m | Total return does not reflect expenses that apply at the separate account level or to related insurance products. Inclusion of these charges would reduce the total return figures for all periods shown. |
The accompanying notes are an integral part of the financial statements.
167
Table of Contents
MML Series Investment Fund – Financial Statements (Continued)
Financial Highlights (For a share outstanding throughout each period)
MML Global Fund
| Income (loss) from investment operations | Less distributions to shareholders | Ratios / Supplemental Data | ||||||||||||||||||||||||||||||||||||||||||||||||||
| Net asset value, beginning of the period | Net investment income (loss)c,j | Net realized and unrealized gain (loss) on investments | Total income (loss) from investment operations | From net investment income | From net realized gains | Total distributions | Net asset value, end of the period | Total returnm | Net assets, end of the period (000’s) | Ratio of expenses to average daily net assets before expense waivers | Ratio of expenses to average daily net assets after expense waiversj | Net investment income (loss) to average daily net assets | ||||||||||||||||||||||||||||||||||||||||
Class I |
| |||||||||||||||||||||||||||||||||||||||||||||||||||
| 12/31/16 | $ | 11.74 | $ | 0.14 | $ | 0.76 | $ | 0.90 | $ | (0.14 | ) | $ | (0.96 | ) | $ | (1.10 | ) | $ | 11.54 | 7.55% | $ | 218,698 | 0.82% | N/A | 1.18% | |||||||||||||||||||||||||||
| 12/31/15 | 12.61 | 0.14 | (0.33 | ) | (0.19 | ) | (0.14 | ) | (0.54 | ) | (0.68 | ) | 11.74 | (1.36% | ) | 224,808 | 0.86% | 0.85% | 1.13% | |||||||||||||||||||||||||||||||||
| 12/31/14 | 12.44 | 0.16 | 0.33 | 0.49 | (0.11 | ) | (0.21 | ) | (0.32 | ) | 12.61 | 3.95% | 210,395 | 0.95% | 0.90% | 1.29% | ||||||||||||||||||||||||||||||||||||
| 12/31/13 | 9.82 | 0.12 | 2.63 | 2.75 | (0.13 | ) | - | (0.13 | ) | 12.44 | 28.13% | 149,796 | 0.96% | 0.90% | 1.10% | |||||||||||||||||||||||||||||||||||||
| 12/31/12 | 8.02 | 0.12 | 1.77 | 1.89 | (0.09 | ) | - | (0.09 | ) | 9.82 | 23.69% | 131,665 | 0.98% | 0.90% | 1.33% | |||||||||||||||||||||||||||||||||||||
Class II |
| |||||||||||||||||||||||||||||||||||||||||||||||||||
| 12/31/16 | $ | 11.93 | $ | 0.14 | $ | 0.77 | $ | 0.91 | $ | (0.14 | ) | $ | (0.96 | ) | $ | (1.10 | ) | $ | 11.74 | 7.54% | $ | 15,757 | 0.82% | N/A | 1.17% | |||||||||||||||||||||||||||
| 12/31/15 | 12.81 | 0.15 | (0.34 | ) | (0.19 | ) | (0.15 | ) | (0.54 | ) | (0.69 | ) | 11.93 | (1.35% | ) | 15,876 | 0.83% | 0.81% | 1.13% | |||||||||||||||||||||||||||||||||
| 12/31/14 | 12.63 | 0.17 | 0.33 | 0.50 | (0.11 | ) | (0.21 | ) | (0.32 | ) | 12.81 | 4.00% | 17,481 | 0.85% | 0.80% | 1.35% | ||||||||||||||||||||||||||||||||||||
| 12/31/13 | 9.96 | 0.14 | 2.66 | 2.80 | (0.13 | ) | - | (0.13 | ) | 12.63 | 28.34% | 18,681 | 0.86% | 0.80% | 1.21% | |||||||||||||||||||||||||||||||||||||
| 12/31/12 | 8.13 | 0.13 | 1.80 | 1.93 | (0.10 | ) | - | (0.10 | ) | 9.96 | 23.79% | 16,324 | 0.88% | 0.80% | 1.45% | |||||||||||||||||||||||||||||||||||||
Service Class I |
| |||||||||||||||||||||||||||||||||||||||||||||||||||
| 12/31/16 | $ | 11.65 | $ | 0.10 | $ | 0.76 | $ | 0.86 | $ | (0.12 | ) | $ | (0.96 | ) | $ | (1.08 | ) | $ | 11.43 | 7.25% | $ | 12,129 | 1.07% | N/A | 0.89% | |||||||||||||||||||||||||||
| 12/31/15 | 12.52 | 0.10 | (0.31 | ) | (0.21 | ) | (0.12 | ) | (0.54 | ) | (0.66 | ) | 11.65 | (1.55% | ) | 10,646 | 1.11% | 1.10% | 0.84% | |||||||||||||||||||||||||||||||||
| 12/31/14 | 12.38 | 0.12 | 0.32 | 0.44 | (0.09 | ) | (0.21 | ) | (0.30 | ) | 12.52 | 3.57% | 9,220 | 1.20% | 1.15% | 1.00% | ||||||||||||||||||||||||||||||||||||
| 12/31/13 | 9.78 | 0.09 | 2.63 | 2.72 | (0.12 | ) | - | (0.12 | ) | 12.38 | 27.94% | 6,657 | 1.21% | 1.15% | 0.82% | |||||||||||||||||||||||||||||||||||||
| 12/31/12 | 8.00 | 0.09 | 1.77 | 1.86 | (0.08 | ) | - | (0.08 | ) | 9.78 | 23.35% | 3,707 | 1.23% | 1.15% | 1.03% | |||||||||||||||||||||||||||||||||||||
| Year ended December 31 | ||||||||||||||||||||
| 2016 | 2015 | 2014 | 2013 | 2012 | ||||||||||||||||
Portfolio turnover rate | 15 | % | 17 | % | 12 | % | 11 | % | 11 | % | ||||||||||
| c | Per share amount calculated on the average shares method. |
| j | Computed after giving effect to an agreement by MML Advisers and/or MassMutual to waive certain fees and expenses of the Fund. |
| m | Total return does not reflect expenses that apply at the separate account level or to related insurance products. Inclusion of these charges would reduce the total return figures for all periods shown. |
The accompanying notes are an integral part of the financial statements.
168
Table of Contents
MML Series Investment Fund – Financial Statements (Continued)
Financial Highlights (For a share outstanding throughout each period)
MML Growth & Income Fund
| Income (loss) from investment operations | Less distributions to shareholders | Ratios / Supplemental Data | ||||||||||||||||||||||||||||||||||||||||||
| Net asset value, beginning of the period | Net investment income (loss)c | Net realized and unrealized gain (loss) on investments | Total income (loss) from investment operations | From net investment income | Total distributions | Net asset value, end of the period | Total returnm | Net assets, end of the period (000’s) | Ratio of expenses to average daily net assets | Net investment income (loss) to average daily net assets | ||||||||||||||||||||||||||||||||||
Initial Class |
| |||||||||||||||||||||||||||||||||||||||||||
| 12/31/16 | $ | 13.18 | $ | 0.15 | $ | 1.00 | $ | 1.15 | $ | (0.14 | ) | $ | (0.14 | ) | $ | 14.19 | 8.77% | $ | 102,858 | 0.56% | 1.10% | |||||||||||||||||||||||
| 12/31/15 | 13.28 | 0.14 | (0.08 | ) | 0.06 | (0.16 | ) | (0.16 | ) | 13.18 | 0.49% | 106,578 | 0.56% | 1.01% | ||||||||||||||||||||||||||||||
| 12/31/14 | 12.08 | 0.14 | 1.20 | 1.34 | (0.14 | ) | (0.14 | ) | 13.28 | 11.19% | 121,667 | 0.56% | 1.16% | |||||||||||||||||||||||||||||||
| 12/31/13 | 9.24 | 0.13 | 2.85 | 2.98 | (0.14 | ) | (0.14 | ) | 12.08 | 32.53% | 129,107 | 0.57% | 1.22% | |||||||||||||||||||||||||||||||
| 12/31/12 | 7.83 | 0.13 | 1.39 | 1.52 | (0.11 | ) | (0.11 | ) | 9.24 | 19.49% | 116,115 | 0.58% | 1.46% | |||||||||||||||||||||||||||||||
Service Class |
| |||||||||||||||||||||||||||||||||||||||||||
| 12/31/16 | $ | 13.10 | $ | 0.11 | $ | 1.00 | $ | 1.11 | $ | (0.11 | ) | $ | (0.11 | ) | $ | 14.10 | 8.50% | $ | 23,197 | 0.81% | 0.85% | |||||||||||||||||||||||
| 12/31/15 | 13.21 | 0.10 | (0.08 | ) | 0.02 | (0.13 | ) | (0.13 | ) | 13.10 | 0.18% | 18,797 | 0.81% | 0.76% | ||||||||||||||||||||||||||||||
| 12/31/14 | 12.02 | 0.11 | 1.20 | 1.31 | (0.12 | ) | (0.12 | ) | 13.21 | 10.94% | 18,929 | 0.81% | 0.91% | |||||||||||||||||||||||||||||||
| 12/31/13 | 9.20 | 0.10 | 2.84 | 2.94 | (0.12 | ) | (0.12 | ) | 12.02 | 32.20% | 17,142 | 0.82% | 0.97% | |||||||||||||||||||||||||||||||
| 12/31/12 | 7.79 | 0.11 | 1.39 | 1.50 | (0.09 | ) | (0.09 | ) | 9.20 | 19.32% | 12,385 | 0.83% | 1.21% | |||||||||||||||||||||||||||||||
| Year ended December 31 | ||||||||||||||||||||
| 2016 | 2015 | 2014 | 2013 | 2012 | ||||||||||||||||
Portfolio turnover rate | 17 | % | 17 | % | 20 | % | 19 | % | 26 | % | ||||||||||
| c | Per share amount calculated on the average shares method. |
| m | Total return does not reflect expenses that apply at the separate account level or to related insurance products. Inclusion of these charges would reduce the total return figures for all periods shown. |
The accompanying notes are an integral part of the financial statements.
169
Table of Contents
MML Series Investment Fund – Financial Statements (Continued)
Financial Highlights (For a share outstanding throughout each period)
MML Income & Growth Fund
| Income (loss) from investment operations | Less distributions to shareholders | Ratios / Supplemental Data | ||||||||||||||||||||||||||||||||||||||||||||||
| Net asset value, beginning of the period | Net investment income (loss)c | Net realized and unrealized gain (loss) on investments | Total income (loss) from investment operations | From net investment income | From net realized gains | Total distributions | Net asset value, end of the period | Total returnm | Net assets, end of the period (000’s) | Ratio of expenses to average daily net assets | Net investment income (loss) to average daily net assets | |||||||||||||||||||||||||||||||||||||
Initial Class | ||||||||||||||||||||||||||||||||||||||||||||||||
| 12/31/16 | $ | 11.35 | $ | 0.22 | $ | 1.55 | $ | 1.77 | $ | (0.21 | ) | $ | (1.05 | ) | $ | (1.26 | ) | $ | 11.86 | 16.40% | $ | 257,874 | 0.69% | 1.97% | ||||||||||||||||||||||||
| 12/31/15 | 12.44 | 0.23 | (0.31 | ) | (0.08 | ) | (0.24 | ) | (0.77 | ) | (1.01 | ) | 11.35 | (0.09% | ) | 221,763 | 0.69% | 1.90% | ||||||||||||||||||||||||||||||
| 12/31/14 | 11.60 | 0.23 | 0.83 | 1.06 | (0.22 | ) | - | (0.22 | ) | 12.44 | 9.22% | 232,187 | 0.70% | 1.91% | ||||||||||||||||||||||||||||||||||
| 12/31/13 | 9.48 | 0.22 | 2.09 | 2.31 | (0.19 | ) | - | (0.19 | ) | 11.60 | 24.62% | 228,095 | 0.70% | 2.07% | ||||||||||||||||||||||||||||||||||
| 12/31/12 | 8.56 | 0.23 | 0.79 | 1.02 | (0.10 | ) | - | (0.10 | ) | 9.48 | 11.96% | 171,207 | 0.72% | 2.51% | ||||||||||||||||||||||||||||||||||
Service Class | ||||||||||||||||||||||||||||||||||||||||||||||||
| 12/31/16 | $ | 11.25 | $ | 0.19 | $ | 1.54 | $ | 1.73 | $ | (0.19 | ) | $ | (1.05 | ) | $ | (1.24 | ) | $ | 11.74 | 16.10% | $ | 20,626 | 0.94% | 1.71% | ||||||||||||||||||||||||
| 12/31/15 | 12.34 | 0.20 | (0.31 | ) | (0.11 | ) | (0.21 | ) | (0.77 | ) | (0.98 | ) | 11.25 | (0.35% | ) | 16,906 | 0.94% | 1.65% | ||||||||||||||||||||||||||||||
| 12/31/14 | 11.51 | 0.20 | 0.83 | 1.03 | (0.20 | ) | - | (0.20 | ) | 12.34 | 8.96% | 16,131 | 0.95% | 1.66% | ||||||||||||||||||||||||||||||||||
| 12/31/13 | 9.42 | 0.20 | 2.06 | 2.26 | (0.17 | ) | - | (0.17 | ) | 11.51 | 24.22% | 14,775 | 0.95% | 1.82% | ||||||||||||||||||||||||||||||||||
| 12/31/12 | 8.51 | 0.20 | 0.80 | 1.00 | (0.09 | ) | - | (0.09 | ) | 9.42 | 11.73% | 11,282 | 0.97% | 2.23% | ||||||||||||||||||||||||||||||||||
| Year ended December 31 | ||||||||||||||||||||
| 2016 | 2015 | 2014 | 2013 | 2012 | ||||||||||||||||
Portfolio turnover rate | 30 | % | 27 | % | 19 | % | 15 | % | 3 | % | ||||||||||
| c | Per share amount calculated on the average shares method. |
| m | Total return does not reflect expenses that apply at the separate account level or to related insurance products. Inclusion of these charges would reduce the total return figures for all periods shown. |
The accompanying notes are an integral part of the financial statements.
170
Table of Contents
MML Series Investment Fund – Financial Statements (Continued)
Financial Highlights (For a share outstanding throughout each period)
MML International Equity Fund
| Income (loss) from investment operations | Less distributions to shareholders | Ratios / Supplemental Data | ||||||||||||||||||||||||||||||||||||||||||||||||||
| Net asset value, beginning of the period | Net investment income (loss)c,j | Net realized and unrealized gain (loss) on investments | Total income (loss) from investment operations | From net investment income | From net realized gains | Total distributions | Net asset value, end of the period | Total returnm | Net assets, end of the period (000’s) | Ratio of expenses to average daily net assets before expense waivers | Ratio of expenses to average daily net assets after expense waiversj | Net investment income (loss) to average daily net assets | ||||||||||||||||||||||||||||||||||||||||
Class II | ||||||||||||||||||||||||||||||||||||||||||||||||||||
| 12/31/16 | $ | 8.81 | $ | 0.15 | $ | 0.56 | $ | 0.71 | $ | (0.17 | ) | $ | (0.02 | ) | $ | (0.19 | ) | $ | 9.33 | 8.27% | $ | 150,753 | 1.07% | 1.00% | 1.70% | |||||||||||||||||||||||||||
| 12/31/15 | 9.27 | 0.15 | (0.59 | ) | (0.44 | ) | (0.02 | ) | - | (0.02 | ) | 8.81 | (4.77% | ) | 164,083 | 1.09% | 1.00% | 1.59% | ||||||||||||||||||||||||||||||||||
| 12/31/14g | 10.00 | 0.18 | (0.65 | ) | (0.47 | ) | (0.20 | ) | (0.06 | ) | (0.26 | ) | 9.27 | (4.67% | )b | 123,915 | 1.15% | a | 1.00% | a | 1.79% | a | ||||||||||||||||||||||||||||||
Service Class I |
| |||||||||||||||||||||||||||||||||||||||||||||||||||
| 12/31/16 | $ | 8.78 | $ | 0.13 | $ | 0.56 | $ | 0.69 | $ | (0.16 | ) | $ | (0.02 | ) | $ | (0.18 | ) | $ | 9.29 | 7.97% | $ | 1,063 | 1.32% | 1.25% | 1.50% | |||||||||||||||||||||||||||
| 12/31/15 | 9.27 | 0.10 | (0.57 | ) | (0.47 | ) | (0.02 | ) | - | (0.02 | ) | 8.78 | (5.10% | ) | 1,513 | 1.35% | 1.25% | 1.11% | ||||||||||||||||||||||||||||||||||
| 12/31/14h | 10.29 | 0.07 | (0.83 | ) | (0.76 | ) | (0.20 | ) | (0.06 | ) | (0.26 | ) | 9.27 | (7.44% | )b | 298 | 1.36% | a | 1.25% | a | 1.08% | a | ||||||||||||||||||||||||||||||
| Year ended December 31 | ||||||||||||
| 2016 | 2015 | 2014 | ||||||||||
Portfolio turnover rate | 50 | % | 46 | % | 39 | %b,g | ||||||
| a | Annualized. |
| b | Percentage represents the results for the period and is not annualized. |
| c | Per share amount calculated on the average shares method. |
| g | For the period January 7, 2014 (commencement of operations) through December 31, 2014. |
| h | For the period May 1, 2014 (commencement of operations) through December 31, 2014. |
| j | Computed after giving effect to an agreement by MML Advisers and/or MassMutual to waive certain fees and expenses of the Fund. |
| m | Total return does not reflect expenses that apply at the separate account level or to related insurance products. Inclusion of these charges would reduce the total return figures for all periods shown. |
The accompanying notes are an integral part of the financial statements.
171
Table of Contents
MML Series Investment Fund – Financial Statements (Continued)
Financial Highlights (For a share outstanding throughout each period)
MML Large Cap Growth Fund
| Income (loss) from investment operations | Less distributions to shareholders | Ratios / Supplemental Data | ||||||||||||||||||||||||||||||||||||||||||||||
| Net asset value, beginning of the period | Net investment income (loss)c | Net realized and unrealized gain (loss) on investments | Total income (loss) from investment operations | From net investment income | From net realized gains | Total distributions | Net asset value, end of the period | Total returnm | Net assets, end of the period (000’s) | Ratio of expenses to average daily net assets | Net investment income (loss) to average daily net assets | |||||||||||||||||||||||||||||||||||||
Initial Class |
| |||||||||||||||||||||||||||||||||||||||||||||||
| 12/31/16 | $ | 11.70 | $ | 0.03 | $ | (0.06 | ) | $ | (0.03 | ) | $ | (0.01 | ) | $ | (1.03 | ) | $ | (1.04 | ) | $ | 10.63 | (0.38% | ) | $ | 103,315 | 0.70% | 0.24% | |||||||||||||||||||||
| 12/31/15 | 14.06 | 0.01 | 0.58 | 0.59 | - | (2.95 | ) | (2.95 | ) | 11.70 | 5.12% | 214,299 | 0.69% | 0.10% | ||||||||||||||||||||||||||||||||||
| 12/31/14 | 14.63 | (0.01 | ) | 1.36 | 1.35 | - | (1.92 | ) | (1.92 | ) | 14.06 | 9.51% | 242,229 | 0.69% | (0.07% | ) | ||||||||||||||||||||||||||||||||
| 12/31/13 | 11.62 | 0.00 | d | 3.76 | 3.76 | (0.05 | ) | (0.70 | ) | (0.75 | ) | 14.63 | 33.54% | 268,330 | 0.70% | 0.00% | e | |||||||||||||||||||||||||||||||
| 12/31/12 | 10.04 | 0.05 | 1.54 | 1.59 | (0.01 | ) | - | (0.01 | ) | 11.62 | 15.81% | 205,833 | 0.70% | 0.49% | ||||||||||||||||||||||||||||||||||
Service Class |
| |||||||||||||||||||||||||||||||||||||||||||||||
| 12/31/16 | $ | 11.48 | $ | (0.00 | )d | $ | (0.04 | ) | $ | (0.04 | ) | $ | - | $ | (1.03 | ) | $ | (1.03 | ) | $ | 10.41 | (0.52% | ) | $ | 3,604 | 0.95% | (0.02% | ) | ||||||||||||||||||||
| 12/31/15 | 13.89 | (0.02 | ) | 0.56 | 0.54 | - | (2.95 | ) | (2.95 | ) | 11.48 | 4.80% | 3,501 | 0.94% | (0.15% | ) | ||||||||||||||||||||||||||||||||
| 12/31/14 | 14.51 | (0.04 | ) | 1.34 | 1.30 | - | (1.92 | ) | (1.92 | ) | 13.89 | 9.23% | 2,726 | 0.94% | (0.29% | ) | ||||||||||||||||||||||||||||||||
| 12/31/13 | 11.53 | (0.03 | ) | 3.73 | 3.70 | (0.02 | ) | (0.70 | ) | (0.72 | ) | 14.51 | 33.24% | 1,849 | 0.95% | (0.25% | ) | |||||||||||||||||||||||||||||||
| 12/31/12 | 9.99 | 0.03 | 1.51 | 1.54 | - | - | - | 11.53 | 15.42% | 1,439 | 0.95% | 0.25% | ||||||||||||||||||||||||||||||||||||
| Year ended December 31 | ||||||||||||||||||||
| 2016 | 2015 | 2014 | 2013 | 2012 | ||||||||||||||||
Portfolio turnover rate | 134 | % | 73 | % | 77 | % | 89 | % | 91 | % | ||||||||||
| c | Per share amount calculated on the average shares method. |
| d | Amount is less than $0.005 per share. |
| e | Amount is less than 0.005%. |
| m | Total return does not reflect expenses that apply at the separate account level or to related insurance products. Inclusion of these charges would reduce the total return figures for all periods shown. |
The accompanying notes are an integral part of the financial statements.
172
Table of Contents
MML Series Investment Fund – Financial Statements (Continued)
Financial Highlights (For a share outstanding throughout each period)
MML Managed Volatility Fund
| Income (loss) from investment operations | Less distributions to shareholders | Ratios / Supplemental Data | ||||||||||||||||||||||||||||||||||||||||||||||
| Net asset value, beginning of the period | Net investment income (loss)c | Net realized and unrealized gain (loss) on investments | Total income (loss) from investment operations | From net investment income | From net realized gains | Total distributions | Net asset value, end of the period | Total returnm | Net assets, end of the period (000’s) | Ratio of expenses to average daily net assets | Net investment income (loss) to average daily net assets | |||||||||||||||||||||||||||||||||||||
Initial Class |
| |||||||||||||||||||||||||||||||||||||||||||||||
| 12/31/16 | $ | 14.27 | $ | 0.17 | $ | 0.31 | $ | 0.48 | $ | (0.26 | ) | $ | (2.75 | ) | $ | (3.01 | ) | $ | 11.74 | 3.69% | $ | 151,537 | 0.91% | 1.29% | ||||||||||||||||||||||||
| 12/31/15 | 14.11 | 0.17 | 0.25 | 0.42 | (0.26 | ) | - | (0.26 | ) | 14.27 | 3.01% | 162,332 | 0.89% | 1.18% | ||||||||||||||||||||||||||||||||||
| 12/31/14 | 14.33 | 0.16 | 0.46 | 0.62 | (0.10 | ) | (0.74 | ) | (0.84 | ) | 14.11 | 4.41% | 336,931 | 0.90% | 1.14% | |||||||||||||||||||||||||||||||||
| 12/31/13 | 12.34 | 0.16 | 2.02 | 2.18 | (0.19 | ) | - | (0.19 | ) | 14.33 | 17.78% | 203,330 | 0.88% | 1.19% | ||||||||||||||||||||||||||||||||||
| 12/31/12 | 10.98 | 0.17 | 1.27 | 1.44 | (0.08 | ) | - | (0.08 | ) | 12.34 | 13.19% | 193,271 | 0.83% | 1.43% | ||||||||||||||||||||||||||||||||||
Service Class |
| |||||||||||||||||||||||||||||||||||||||||||||||
| 12/31/16 | $ | 14.18 | $ | 0.14 | $ | 0.29 | $ | 0.43 | $ | (0.22 | ) | $ | (2.75 | ) | $ | (2.97 | ) | $ | 11.64 | 3.42% | $ | 32,569 | 1.16% | 1.04% | ||||||||||||||||||||||||
| 12/31/15 | 14.02 | 0.14 | 0.24 | 0.38 | (0.22 | ) | - | (0.22 | ) | 14.18 | 2.79% | 33,180 | 1.14% | 0.95% | ||||||||||||||||||||||||||||||||||
| 12/31/14 | 14.25 | 0.13 | 0.45 | 0.58 | (0.07 | ) | (0.74 | ) | (0.81 | ) | 14.02 | 4.14% | 31,812 | 1.15% | 0.88% | |||||||||||||||||||||||||||||||||
| 12/31/13 | 12.27 | 0.13 | 2.02 | 2.15 | (0.17 | ) | - | (0.17 | ) | 14.25 | 17.56% | 28,423 | 1.13% | 0.95% | ||||||||||||||||||||||||||||||||||
| 12/31/12 | 10.93 | 0.14 | 1.26 | 1.40 | (0.06 | ) | - | (0.06 | ) | 12.27 | 12.83% | 22,660 | 1.08% | 1.21% | ||||||||||||||||||||||||||||||||||
| Year ended December 31 | ||||||||||||||||||||
| 2016 | 2015 | 2014 | 2013 | 2012 | ||||||||||||||||
Portfolio turnover rate | 4 | % | 3 | % | 14 | % | 94 | % | 11 | % | ||||||||||
| c | Per share amount calculated on the average shares method. |
| m | Total return does not reflect expenses that apply at the separate account level or to related insurance products. Inclusion of these charges would reduce the total return figures for all periods shown. |
The accompanying notes are an integral part of the financial statements.
173
Table of Contents
MML Series Investment Fund – Financial Statements (Continued)
Financial Highlights (For a share outstanding throughout each period)
MML Mid Cap Growth Fund
| | Income (loss) from investment operations | | | Less distributions to shareholders | | Ratios / Supplemental Data | ||||||||||||||||||||||||||||||||||||||||||
| Net asset value, beginning of the period | Net investment income (loss)c | Net realized and unrealized gain (loss) on investments | Total income (loss) from investment operations | From net investment income | From net realized gains | Total distributions | Net asset value, end of the period | Total returnm | Net assets, end of the period (000’s) | Ratio of expenses to average daily net assets | Net investment income (loss) to average daily net assets | |||||||||||||||||||||||||||||||||||||
Initial Class |
| |||||||||||||||||||||||||||||||||||||||||||||||
| 12/31/16 | $ | 15.50 | $ | (0.00 | )d | $ | 0.97 | $ | 0.97 | $ | - | $ | (2.12 | ) | $ | (2.12 | ) | $ | 14.35 | 6.29% | $ | 352,754 | 0.81% | (0.02% | ) | |||||||||||||||||||||||
| 12/31/15 | 16.41 | (0.01 | ) | 1.05 | 1.04 | - | (1.95 | ) | (1.95 | ) | 15.50 | 6.78% | 375,328 | 0.81% | (0.07% | ) | ||||||||||||||||||||||||||||||||
| 12/31/14 | 16.59 | (0.03 | ) | 2.11 | 2.08 | - | (2.26 | ) | (2.26 | ) | 16.41 | 13.27% | 377,028 | 0.81% | (0.17% | ) | ||||||||||||||||||||||||||||||||
| 12/31/13 | 12.96 | (0.03 | ) | 4.65 | 4.62 | (0.04 | ) | (0.95 | ) | (0.99 | ) | 16.59 | 36.69% | 371,803 | 0.81% | (0.21% | ) | |||||||||||||||||||||||||||||||
| 12/31/12 | 12.08 | 0.01 | 1.63 | 1.64 | - | (0.76 | ) | (0.76 | ) | 12.96 | 13.78% | 330,731 | 0.82% | 0.04% | ||||||||||||||||||||||||||||||||||
Service Class |
| |||||||||||||||||||||||||||||||||||||||||||||||
| 12/31/16 | $ | 15.16 | $ | (0.04 | ) | $ | 0.95 | $ | 0.91 | $ | - | $ | (2.12 | ) | $ | (2.12 | ) | $ | 13.95 | 6.02% | $ | 71,227 | 1.06% | (0.27% | ) | |||||||||||||||||||||||
| 12/31/15 | 16.12 | (0.05 | ) | 1.04 | 0.99 | - | (1.95 | ) | (1.95 | ) | 15.16 | 6.59% | 66,936 | 1.06% | (0.31% | ) | ||||||||||||||||||||||||||||||||
| 12/31/14 | 16.38 | (0.07 | ) | 2.07 | 2.00 | - | (2.26 | ) | (2.26 | ) | 16.12 | 12.93% | 56,457 | 1.06% | (0.42% | ) | ||||||||||||||||||||||||||||||||
| 12/31/13 | 12.81 | (0.07 | ) | 4.61 | 4.54 | (0.02 | ) | (0.95 | ) | (0.97 | ) | 16.38 | 36.40% | 43,873 | 1.06% | (0.45% | ) | |||||||||||||||||||||||||||||||
| 12/31/12 | 11.98 | (0.02 | ) | 1.61 | 1.59 | - | (0.76 | ) | (0.76 | ) | 12.81 | 13.47% | 29,154 | 1.07% | (0.19% | ) | ||||||||||||||||||||||||||||||||
| Year ended December 31 | ||||||||||||||||||||
| 2016 | 2015 | 2014 | 2013 | 2012 | ||||||||||||||||
Portfolio turnover rate | 29 | % | 35 | % | 25 | % | 26 | % | 31 | % | ||||||||||
| c | Per share amount calculated on the average shares method. |
| d | Amount is less than $0.005 per share. |
| m | Total return does not reflect expenses that apply at the separate account level or to related insurance products. Inclusion of these charges would reduce the total return figures for all periods shown. |
The accompanying notes are an integral part of the financial statements.
174
Table of Contents
MML Series Investment Fund – Financial Statements (Continued)
Financial Highlights (For a share outstanding throughout each period)
MML Mid Cap Value Fund
| | Income (loss) from investment operations | | | Less distributions to shareholders | | Ratios / Supplemental Data | ||||||||||||||||||||||||||||||||||||||||||
| Net asset value, beginning of the period | Net investment income (loss)c | Net realized and unrealized gain (loss) on investments | Total income (loss) from investment operations | From net investment income | From net realized gains | Total distributions | Net asset value, end of the period | Total returnm | Net assets, end of the period (000’s) | Ratio of expenses to average daily net assets | Net investment income (loss) to average daily net assets | |||||||||||||||||||||||||||||||||||||
Initial Class |
| |||||||||||||||||||||||||||||||||||||||||||||||
| 12/31/16 | $ | 10.74 | $ | 0.17 | $ | 2.22 | $ | 2.39 | $ | (0.19 | ) | $ | (1.15 | ) | $ | (1.34 | ) | $ | 11.79 | 23.23% | $ | 433,046 | 0.88% | 1.55% | ||||||||||||||||||||||||
| 12/31/15 | 13.12 | 0.16 | (0.43 | ) | (0.27 | ) | (0.25 | ) | (1.86 | ) | (2.11 | ) | 10.74 | (1.45% | ) | 427,920 | 0.88% | 1.26% | ||||||||||||||||||||||||||||||
| 12/31/14 | 13.65 | 0.19 | 1.97 | 2.16 | (0.24 | ) | (2.45 | ) | (2.69 | ) | 13.12 | 16.66% | 465,533 | 0.88% | 1.39% | |||||||||||||||||||||||||||||||||
| 12/31/13 | 11.11 | 0.20 | 3.09 | 3.29 | (0.24 | ) | (0.51 | ) | (0.75 | ) | 13.65 | 30.43% | 467,386 | 0.88% | 1.57% | |||||||||||||||||||||||||||||||||
| 12/31/12 | 10.17 | 0.23 | 1.42 | 1.65 | (0.18 | ) | (0.53 | ) | (0.71 | ) | 11.11 | 16.70% | 437,725 | 0.89% | 2.12% | |||||||||||||||||||||||||||||||||
Service Class |
| |||||||||||||||||||||||||||||||||||||||||||||||
| 12/31/16 | $ | 10.62 | $ | 0.15 | $ | 2.18 | $ | 2.33 | $ | (0.17 | ) | $ | (1.15 | ) | $ | (1.32 | ) | $ | 11.63 | 22.86% | $ | 44,148 | 1.13% | 1.35% | ||||||||||||||||||||||||
| 12/31/15 | 12.99 | 0.12 | (0.41 | ) | (0.29 | ) | (0.22 | ) | (1.86 | ) | (2.08 | ) | 10.62 | (1.60% | ) | 32,950 | 1.13% | 1.03% | ||||||||||||||||||||||||||||||
| 12/31/14 | 13.55 | 0.16 | 1.94 | 2.10 | (0.21 | ) | (2.45 | ) | (2.66 | ) | 12.99 | 16.33% | 30,017 | 1.13% | 1.16% | |||||||||||||||||||||||||||||||||
| 12/31/13 | 11.04 | 0.17 | 3.07 | 3.24 | (0.22 | ) | (0.51 | ) | (0.73 | ) | 13.55 | 30.11% | 23,348 | 1.13% | 1.33% | |||||||||||||||||||||||||||||||||
| 12/31/12 | 10.12 | 0.20 | 1.41 | 1.61 | (0.16 | ) | (0.53 | ) | (0.69 | ) | 11.04 | 16.37% | 16,241 | 1.14% | 1.89% | |||||||||||||||||||||||||||||||||
| Year ended December 31 | ||||||||||||||||||||
| 2016 | 2015 | 2014 | 2013 | 2012 | ||||||||||||||||
Portfolio turnover rate | 52 | % | 68 | % | 66 | % | 71 | % | 81 | % | ||||||||||
| c | Per share amount calculated on the average shares method. |
| m | Total return does not reflect expenses that apply at the separate account level or to related insurance products. Inclusion of these charges would reduce the total return figures for all periods shown. |
The accompanying notes are an integral part of the financial statements.
175
Table of Contents
MML Series Investment Fund – Financial Statements (Continued)
Financial Highlights (For a share outstanding throughout each period)
MML Small Cap Growth Equity Fund
| | Income (loss) from investment operations | | | Less distributions to shareholders | | Ratios / Supplemental Data | ||||||||||||||||||||||||||||||||||||||||||
| Net asset value, beginning of the period | Net investment income (loss)c,j | Net realized and unrealized gain (loss) on investments | Total income (loss) from investment operations | From net realized gains | Total distributions | Net asset value, end of the period | Total returnm | Net assets, end of the period (000's) | Ratio of expenses to average daily net assets before expense waivers | Ratio of expenses to average daily net assets after expense waiversj | Net investment income (loss) to average daily net assets | |||||||||||||||||||||||||||||||||||||
Initial Class |
| |||||||||||||||||||||||||||||||||||||||||||||||
| 12/31/16 | $ | 13.51 | $ | 0.00 | d | $ | 1.59 | $ | 1.59 | $ | (2.41 | ) | $ | (2.41 | ) | $ | 12.69 | 12.74 | % | $ | 191,245 | 1.10 | % | N/A | 0.01 | % | ||||||||||||||||||||||
| 12/31/15 | 17.85 | (0.04 | ) | (0.74 | ) | (0.78 | ) | (3.56 | ) | (3.56 | ) | 13.51 | (5.11 | %) | 194,889 | 1.09 | % | N/A | (0.22 | %) | ||||||||||||||||||||||||||||
| 12/31/14 | 22.81 | (0.09 | ) | 1.21 | 1.12 | (6.08 | ) | (6.08 | ) | 17.85 | 5.92 | % | 253,096 | 1.08 | % | N/A | (0.43 | %) | ||||||||||||||||||||||||||||||
| 12/31/13 | 16.30 | (0.08 | ) | 7.79 | 7.71 | (1.20 | ) | (1.20 | ) | 22.81 | 48.54 | % | 273,041 | 1.10 | % | 1.08 | % | (0.43 | %) | |||||||||||||||||||||||||||||
| 12/31/12 | 16.05 | (0.06 | ) | 2.17 | 2.11 | (1.86 | ) | (1.86 | ) | 16.30 | 13.41 | % | 256,961 | 1.13 | % | 1.12 | % | (0.38 | %) | |||||||||||||||||||||||||||||
Service Class |
| |||||||||||||||||||||||||||||||||||||||||||||||
| 12/31/16 | $ | 13.05 | $ | (0.03 | ) | $ | 1.53 | $ | 1.50 | $ | (2.41 | ) | $ | (2.41 | ) | $ | 12.14 | 12.46 | % | $ | 12,969 | 1.35 | % | N/A | (0.23 | %) | ||||||||||||||||||||||
| 12/31/15 | 17.40 | (0.07 | ) | (0.72 | ) | (0.79 | ) | (3.56 | ) | (3.56 | ) | 13.05 | (5.33 | %) | 11,375 | 1.34 | % | N/A | (0.46 | %) | ||||||||||||||||||||||||||||
| 12/31/14 | 22.44 | (0.13 | ) | 1.17 | 1.04 | (6.08 | ) | (6.08 | ) | 17.40 | 5.62 | % | 9,977 | 1.33 | % | N/A | (0.67 | %) | ||||||||||||||||||||||||||||||
| 12/31/13 | 16.09 | (0.13 | ) | 7.68 | 7.55 | (1.20 | ) | (1.20 | ) | 22.44 | 48.17 | % | 7,871 | 1.35 | % | 1.34 | % | (0.69 | %) | |||||||||||||||||||||||||||||
| 12/31/12 | 15.91 | (0.10 | ) | 2.14 | 2.04 | (1.86 | ) | (1.86 | ) | 16.09 | 13.07 | % | 5,837 | 1.38 | % | 1.37 | % | (0.63 | %) | |||||||||||||||||||||||||||||
| Year ended December 31 | ||||||||||||||||||||
| 2016 | 2015 | 2014 | 2013 | 2012 | ||||||||||||||||
Portfolio turnover rate | 105 | % | 78 | % | 78 | % | 86 | % | 90 | % | ||||||||||
| c | Per share amount calculated on the average shares method. |
| d | Amount is less than $0.005 per share. |
| j | Computed after giving effect to an agreement by MML Advisers and/or MassMutual to waive certain fees and expenses of the Fund. |
| m | Total return does not reflect expenses that apply at the separate account level or to related insurance products. Inclusion of these charges would reduce the total return figures for all periods shown. |
The accompanying notes are an integral part of the financial statements.
176
Table of Contents
MML Series Investment Fund – Financial Statements (Continued)
Financial Highlights (For a share outstanding throughout each period)
MML Small Company Value Fund
| Income (loss) from investment operations | Less distributions to shareholders | Ratios / Supplemental Data | ||||||||||||||||||||||||||||||||||||||||||||||||||
| Net asset value, beginning of the period | Net investment income (loss)c,j | Net realized and unrealized gain (loss) on investments | Total income (loss) from investment operations | From net investment income | From net realized gains | Total distributions | Net asset value, end of the period | Total returnm | Net assets, end of the period (000’s) | Ratio of expenses to average daily net assets before expense waivers | Ratio of expenses to average daily net assets after expense waiversj | Net investment income (loss) to average daily net assets | ||||||||||||||||||||||||||||||||||||||||
Class II |
| |||||||||||||||||||||||||||||||||||||||||||||||||||
| 12/31/16 | $ | 14.88 | $ | 0.10 | $ | 4.44 | $ | 4.54 | $ | (0.10 | ) | $ | (2.09 | ) | $ | (2.19 | ) | $ | 17.23 | 32.46% | $ | 88,729 | 1.02% | 0.97% | 0.66% | |||||||||||||||||||||||||||
| 12/31/15 | 17.59 | 0.10 | (1.06 | ) | (0.96 | ) | (0.06 | ) | (1.69 | ) | (1.75 | ) | 14.88 | (5.36% | ) | 88,068 | 1.09% | 1.05% | 0.62% | |||||||||||||||||||||||||||||||||
| 12/31/14 | 23.88 | 0.05 | (0.01 | ) | 0.04 | - | (6.33 | ) | (6.33 | ) | 17.59 | 0.47% | 95,788 | 1.17% | 1.15% | 0.26% | ||||||||||||||||||||||||||||||||||||
| 12/31/13 | 18.86 | (0.01 | ) | 5.87 | 5.86 | (0.26 | ) | (0.58 | ) | (0.84 | ) | 23.88 | 31.71% | 97,840 | 1.16% | 1.15% | (0.04% | ) | ||||||||||||||||||||||||||||||||||
| 12/31/12 | 16.83 | 0.19 | 2.34 | 2.53 | (0.00 | )d | (0.50 | ) | (0.50 | ) | 18.86 | 15.20% | 114,274 | 1.17% | 1.15% | 1.05% | ||||||||||||||||||||||||||||||||||||
Service Class I |
| |||||||||||||||||||||||||||||||||||||||||||||||||||
| 12/31/16 | $ | 14.58 | $ | 0.07 | $ | 4.34 | $ | 4.41 | $ | (0.07 | ) | $ | (2.09 | ) | $ | (2.16 | ) | $ | 16.83 | 32.16% | $ | 15,465 | 1.27% | 1.22% | 0.44% | |||||||||||||||||||||||||||
| 12/31/15 | 17.29 | 0.06 | (1.06 | ) | (1.00 | ) | (0.02 | ) | (1.69 | ) | (1.71 | ) | 14.58 | (5.65% | ) | 10,829 | 1.33% | 1.30% | 0.37% | |||||||||||||||||||||||||||||||||
| 12/31/14 | 23.63 | 0.00 | d | (0.01 | ) | (0.01 | ) | - | (6.33 | ) | (6.33 | ) | 17.29 | 0.24% | 10,726 | 1.42% | 1.40% | 0.02% | ||||||||||||||||||||||||||||||||||
| 12/31/13 | 18.70 | (0.05 | ) | 5.79 | 5.74 | (0.23 | ) | (0.58 | ) | (0.81 | ) | 23.63 | 31.34% | 9,944 | 1.41% | 1.40% | (0.23% | ) | ||||||||||||||||||||||||||||||||||
| 12/31/12 | 16.73 | 0.15 | 2.32 | 2.47 | - | (0.50 | ) | (0.50 | ) | 18.70 | 14.99% | 6,354 | 1.42% | 1.40% | 0.86% | |||||||||||||||||||||||||||||||||||||
| Year ended December 31 | ||||||||||||||||||||
| 2016 | 2015 | 2014 | 2013 | 2012 | ||||||||||||||||
Portfolio turnover rate | 23 | % | 44 | % | 22 | % | 12 | % | 14 | % | ||||||||||
| c | Per share amount calculated on the average shares method. |
| d | Amount is less than $0.005 per share. |
| j | Computed after giving effect to an agreement by MML Advisers and/or MassMutual to waive certain fees and expenses of the Fund. |
| m | Total return does not reflect expenses that apply at the separate account level or to related insurance products. Inclusion of these charges would reduce the total return figures for all periods shown. |
The accompanying notes are an integral part of the financial statements.
177
Table of Contents
MML Series Investment Fund – Financial Statements (Continued)
Financial Highlights (For a share outstanding throughout each period)
MML Small/Mid Cap Value Fund
| | Income (loss) from investment operations | | | Less distributions to shareholders | | Ratios / Supplemental Data | ||||||||||||||||||||||||||||||||||||||||||
| Net asset value, beginning of the period | Net investment income (loss)c | Net realized and unrealized gain (loss) on investments | Total income (loss) from investment operations | From net investment income | From net realized gains | Total distributions | Net asset value, end of the period | Total returnm | Net assets, end of the period (000’s) | Ratio of expenses to average daily net assets | Net investment income (loss) to average daily net assets | |||||||||||||||||||||||||||||||||||||
Initial Class |
| |||||||||||||||||||||||||||||||||||||||||||||||
| 12/31/16 | $ | 11.34 | $ | 0.06 | $ | 2.70 | $ | 2.76 | $ | (0.07 | ) | $ | (0.80 | ) | $ | (0.87 | ) | $ | 13.23 | 25.10% | $ | 211,849 | 0.79% | 0.51% | ||||||||||||||||||||||||
| 12/31/15 | 14.69 | 0.07 | (0.89 | ) | (0.82 | ) | (0.11 | ) | (2.42 | ) | (2.53 | ) | 11.34 | (5.53% | ) | 197,297 | 0.79% | 0.50% | ||||||||||||||||||||||||||||||
| 12/31/14 | 13.80 | 0.11 | 1.19 | 1.30 | (0.09 | ) | (0.32 | ) | (0.41 | ) | 14.69 | 9.45% | 236,399 | 0.79% | 0.80% | |||||||||||||||||||||||||||||||||
| 12/31/13 | 10.06 | 0.09 | 3.74 | 3.83 | (0.09 | ) | - | (0.09 | ) | 13.80 | 38.18% | 257,210 | 0.80% | 0.74% | ||||||||||||||||||||||||||||||||||
| 12/31/12 | 8.51 | 0.08 | 1.54 | 1.62 | (0.07 | ) | - | (0.07 | ) | 10.06 | 19.06% | 168,248 | 0.81% | 0.82% | ||||||||||||||||||||||||||||||||||
Service Class |
| |||||||||||||||||||||||||||||||||||||||||||||||
| 12/31/16 | $ | 11.25 | $ | 0.03 | $ | 2.68 | $ | 2.71 | $ | (0.04 | ) | $ | (0.80 | ) | $ | (0.84 | ) | $ | 13.12 | 24.83% | $ | 19,563 | 1.04% | 0.26% | ||||||||||||||||||||||||
| 12/31/15 | 14.59 | 0.04 | (0.89 | ) | (0.85 | ) | (0.07 | ) | (2.42 | ) | (2.49 | ) | 11.25 | (5.74% | ) | 15,919 | 1.04% | 0.27% | ||||||||||||||||||||||||||||||
| 12/31/14 | 13.72 | 0.08 | 1.18 | 1.26 | (0.07 | ) | (0.32 | ) | (0.39 | ) | 14.59 | 9.16% | 15,484 | 1.04% | 0.56% | |||||||||||||||||||||||||||||||||
| 12/31/13 | 10.01 | 0.06 | 3.72 | 3.78 | (0.07 | ) | - | (0.07 | ) | 13.72 | 37.82% | 12,729 | 1.05% | 0.47% | ||||||||||||||||||||||||||||||||||
| 12/31/12 | 8.47 | 0.06 | 1.53 | 1.59 | (0.05 | ) | - | (0.05 | ) | 10.01 | 18.78% | 8,717 | 1.06% | 0.60% | ||||||||||||||||||||||||||||||||||
| Year ended December 31 | ||||||||||||||||||||
| 2016 | 2015 | 2014 | 2013 | 2012 | ||||||||||||||||
Portfolio turnover rate | 58 | % | 42 | % | 46 | % | 67 | % | 49 | % | ||||||||||
| c | Per share amount calculated on the average shares method. |
| m | Total return does not reflect expenses that apply at the separate account level or to related insurance products. Inclusion of these charges would reduce the total return figures for all periods shown. |
The accompanying notes are an integral part of the financial statements.
178
Table of Contents
MML Series Investment Fund – Financial Statements (Continued)
Financial Highlights (For a share outstanding throughout each period)
MML Total Return Bond Fund
| | Income (loss) from investment operations | | | Less distributions to shareholders | | Ratios / Supplemental Data | ||||||||||||||||||||||||||||||||||||||||||||||||||
| Net asset value, beginning of the period | Net investment income (loss)c,j | Net realized and unrealized gain (loss) on investments | Total income (loss) from investment operations | From net investment income | From net realized gains | Total distributions | Net asset value, end of the period | Total returnm | Net assets, end of the period (000’s) | Ratio of expenses to average daily net assets before expense waiversn | Ratio of expenses to average daily net assets after expense waiversj,n | Interest expense to average daily net assetsp | Net investment income (loss) to average daily net assetsn | |||||||||||||||||||||||||||||||||||||||||||
Class II |
| |||||||||||||||||||||||||||||||||||||||||||||||||||||||
| 12/31/16 | $ | 10.19 | $ | 0.17 | $ | 0.09 | $ | 0.26 | $ | (0.18 | ) | $ | - | $ | (0.18 | ) | $ | 10.27 | 2.52% | $ | 393,276 | 0.62% | 0.60% | N/A | 1.67% | |||||||||||||||||||||||||||||||
| 12/31/15 | 10.64 | 0.14 | (0.11 | ) | 0.03 | (0.36 | ) | (0.12 | ) | (0.48 | ) | 10.19 | 0.24% | 328,928 | 0.66% | 0.60% | N/A | 1.32% | ||||||||||||||||||||||||||||||||||||||
| 12/31/14 | 10.34 | 0.13 | 0.36 | 0.49 | (0.19 | ) | - | (0.19 | ) | 10.64 | 4.75% | 403,732 | 0.70% | 0.65% | 0.00% | e | 1.27% | |||||||||||||||||||||||||||||||||||||||
| 12/31/13 | 10.82 | 0.13 | (0.31 | ) | (0.18 | ) | (0.21 | ) | (0.09 | ) | (0.30 | ) | 10.34 | (1.63% | ) | 401,127 | 0.69% | 0.65% | 0.00% | e | 1.23% | |||||||||||||||||||||||||||||||||||
| 12/31/12 | 10.13 | 0.20 | 0.70 | 0.90 | (0.21 | ) | - | (0.21 | ) | 10.82 | 8.93% | 306,746 | 0.72% | 0.65% | 0.00% | e | 1.84% | |||||||||||||||||||||||||||||||||||||||
Service Class I |
| |||||||||||||||||||||||||||||||||||||||||||||||||||||||
| 12/31/16 | $ | 10.11 | $ | 0.15 | $ | 0.09 | $ | 0.24 | $ | (0.17 | ) | $ | - | $ | (0.17 | ) | $ | 10.18 | 2.30% | $ | 19,079 | 0.87% | 0.85% | N/A | 1.43% | |||||||||||||||||||||||||||||||
| 12/31/15 | 10.57 | 0.11 | (0.11 | ) | (0.00 | )d | (0.34 | ) | (0.12 | ) | (0.46 | ) | 10.11 | (0.05% | ) | 17,161 | 0.90% | 0.85% | N/A | 1.09% | ||||||||||||||||||||||||||||||||||||
| 12/31/14 | 10.29 | 0.10 | 0.35 | 0.45 | (0.17 | ) | - | (0.17 | ) | 10.57 | 4.43% | 14,435 | 0.95% | 0.90% | 0.00% | e | 1.00% | |||||||||||||||||||||||||||||||||||||||
| 12/31/13 | 10.79 | 0.10 | (0.30 | ) | (0.20 | ) | (0.21 | ) | (0.09 | ) | (0.30 | ) | 10.29 | (1.85% | ) | 11,404 | 0.94% | 0.90% | 0.00% | e | 1.00% | |||||||||||||||||||||||||||||||||||
| 12/31/12h | 10.49 | 0.10 | 0.41 | 0.51 | (0.21 | ) | - | (0.21 | ) | 10.79 | 4.94% | b | 5,730 | 0.97% | a | 0.90% | a | 0.00% | a,e | 1.45% | a | |||||||||||||||||||||||||||||||||||
| Year ended December 31 | ||||||||||||||||||||
| 2016 | 2015 | 2014 | 2013 | 2012 | ||||||||||||||||
Portfolio turnover rate | 278 | % | 322 | % | 447 | %u | 550 | %u | 583 | %u | ||||||||||
| a | Annualized. |
| b | Percentage represents the results for the period and is not annualized. |
| c | Per share amount calculated on the average shares method. |
| d | Amount is less than $0.005 per share. |
| e | Amount is less than 0.005%. |
| h | For the period May 1, 2012 (commencement of operations) through December 31, 2012. |
| j | Computed after giving effect to an agreement by MML Advisers and/or MassMutual to waive certain fees and expenses of the Fund. |
| m | Total return does not reflect expenses that apply at the separate account level or to related insurance products. Inclusion of these charges would reduce the total return figures for all periods shown. |
| n | Includes interest expense. |
| p | Interest expense incurred as a result of entering into reverse repurchase agreements is included in the Fund’s net expenses in the Statements of Operations. Income earned on investing proceeds from reverse repurchase agreements is included in interest income in the Statements of Operations. |
| u | Excludes Treasury roll transactions. Including these transactions, the portfolio turnover would have been 479%, 574% and 618%, respectively, for the years ended December 31, 2014, December 31, 2013 and December 31, 2012. |
The accompanying notes are an integral part of the financial statements.
179
Table of Contents
| 1. | The Funds |
MML Series Investment Fund (the “Trust”) is registered under the Investment Company Act of 1940, as amended (the “1940 Act”), as a no-load, open-end, management investment company. The Trust is organized under the laws of the Commonwealth of Massachusetts as a Massachusetts business trust pursuant to an Agreement and Declaration of Trust dated December 19, 1984, as restated May 14, 1993, and further amended and restated as of December 15, 2011, as it may be further amended from time to time. The following are 19 series of the Trust (each individually referred to as a “Fund” or collectively as the “Funds”):
MML Blue Chip Growth Fund (“Blue Chip Growth Fund”)
MML Equity Income Fund (“Equity Income Fund”)
MML Equity Index Fund (“Equity Index Fund”)
MML Focused Equity Fund (“Focused Equity Fund”)
MML Foreign Fund (“Foreign Fund”)
MML Fundamental Growth Fund (“Fundamental Growth Fund”)
MML Fundamental Value Fund (“Fundamental Value Fund”)
MML Global Fund (“Global Fund”)
MML Growth & Income Fund (“Growth & Income Fund”)
MML Income & Growth Fund (“Income & Growth Fund”)
MML International Equity Fund (“International Equity Fund”)
MML Large Cap Growth Fund (“Large Cap Growth Fund”)
MML Managed Volatility Fund (“Managed Volatility Fund”)
MML Mid Cap Growth Fund (“Mid Cap Growth Fund”)
MML Mid Cap Value Fund (“Mid Cap Value Fund”)
MML Small Cap Growth Equity Fund (“Small Cap Growth Equity Fund”)
MML Small Company Value Fund (“Small Company Value Fund”)
MML Small/Mid Cap Value Fund (“Small/Mid Cap Value Fund”)
MML Total Return Bond Fund (“Total Return Bond Fund”)
The Trust makes shares of the Funds available for the investment of assets of various separate investment accounts established by Massachusetts Mutual Life Insurance Company (“MassMutual”) and by life insurance companies which are subsidiaries of MassMutual. Shares of the Trust are not offered to the general public. MassMutual, MML Bay State Life Insurance Company, C.M. Life Insurance Company, and the MML Allocation Funds, which are “funds of funds” series of the Trust, are the record owners of all of the outstanding shares of the Funds.
Each share class of a Fund represents an interest in the same portfolio of assets. The principal difference among the classes is the level of service and administration fees, and shareholder and distribution service expenses borne by the classes. Because each class will have different fees and expenses, performance and share prices will vary between the classes. The classes of shares are offered to different types of investors, as outlined in the Funds’ Prospectus.
| 2. | Significant Accounting Policies |
The following is a summary of significant accounting policies followed consistently by each Fund in the preparation of the financial statements in conformity with accounting principles generally accepted in the United States of America (“generally accepted accounting principles”). The preparation of the financial statements in accordance with generally accepted accounting principles requires management to make estimates and assumptions that affect the reported amounts and disclosures in the financial statements. Actual results could differ from those estimates.
Investment Valuation
The net asset value of each Fund’s shares is determined once daily as of the close of regular trading on the New York Stock Exchange (“NYSE”), on each day the NYSE is open for trading (a “business day”). The NYSE normally closes at 4:00 p.m. Eastern Time, but may close earlier on some days.
180
Table of Contents
Notes to Financial Statements (Continued)
Equity securities and derivative contracts that are actively traded on a national securities exchange or contract market are valued on the basis of information furnished by a pricing service, which provides the last reported sale price, or, in the case of futures contracts, the settlement price, for securities or derivatives listed on the exchange or contract market or the official closing price on the NASDAQ National Market System (“NASDAQ System”), or in the case of over-the-counter (“OTC”) securities for which an official closing price is unavailable or not reported on the NASDAQ System, the last reported bid price. Portfolio securities traded on more than one national securities exchange are valued at the last price at the close of the exchange representing the principal market for such securities. Debt securities are valued on the basis of valuations furnished by a pricing service, which generally determines valuations taking into account factors such as institutional-size trading in similar securities, yield, quality, coupon rate, maturity, type of issue, trading characteristics, and other market data. Shares of other open-end mutual funds are valued at their closing net asset values as reported on each business day.
Investments for which market quotations are readily available are marked to market daily based on those quotations. Market quotations may be provided by third-party vendors or market makers, and may be determined on the basis of a variety of factors, such as broker quotations, financial modeling, and other market data, such as market indexes and yield curves, counterparty information, and foreign exchange rates. U.S. Government and agency securities may be valued on the basis of market quotations or using a model that may incorporate market observable data such as reported sales of similar securities, broker quotes, yields, bids, offers, quoted market prices, and reference data. The fair values of OTC derivative contracts, including forward, swap, and option contracts related to interest rates, foreign currencies, credit standing of reference entities, equity prices, or commodity prices, may be based on market quotations or may be modeled using a series of techniques, including simulation models, depending on the contract and the terms of the transaction. The fair values of asset-backed securities and mortgage-backed securities are estimated based on models that consider the estimated cash flows of each debt tranche of the issuer, established benchmark yield, and estimated tranche-specific spread to the benchmark yield based on the unique attributes of the tranche, including, but not limited to, prepayment speed assumptions and attributes of the collateral. Restricted securities are generally valued at a discount to similar publicly traded securities.
Investments for which market quotations are not available or for which a pricing service or vendor does not provide a value, or for which such market quotations or values are considered by the investment adviser or subadviser to be unreliable (including, for example, certain foreign securities, thinly-traded securities, certain restricted securities, certain initial public offerings, or securities whose values may have been affected by a significant event) are stated at fair valuations determined in good faith by the Funds’ Valuation Committee1 in accordance with procedures approved annually by the Board of Trustees (“Trustees”), and under the general oversight of the Trustees. The Funds’ Valuation Committee employs various methods to determine fair valuations including a regular review of significant inputs and assumptions and review of any related market activity. The Funds’ Valuation Committee reports to the Trustees at their regularly scheduled meetings. It is possible that fair value prices will be used by the Funds to a significant extent. The value determined for an investment using the Funds’ fair value procedures may differ from recent market prices for the investment and may be significantly different from the value realized upon the sale of such investment.
The Funds may invest in securities that are traded principally in foreign markets and that trade on weekends and other days when the Funds do not price their shares. As a result, the values of the Funds’ portfolio securities may change on days when the prices of the Funds’ shares are not calculated. The prices of the Funds’ shares will reflect any such changes when the prices of the Funds’ shares are next calculated, which is the next business day. The Funds may use fair value pricing more frequently for securities primarily traded in foreign markets because, among other things, most foreign markets close well before the Funds value their securities. The earlier close of these foreign markets gives rise to the possibility that significant events, including broad market moves, may have occurred in the interim. The Funds’ investments may be priced based on fair values provided by a third-party vendor, based on certain factors and methodologies applied by such vendor, in the event that there is movement in the U.S. market, between the close of the foreign market and the time the Funds calculate their net asset values. All assets and liabilities expressed in foreign currencies are converted into U.S. dollars at the mean between the buying and selling rates of such currencies against the U.S. dollar at the end of each business day.
| 1 | The Valuation Committee consists of the President, Treasurer, Assistant Treasurers, Vice Presidents (except for the CCO), Assistant Vice Presidents, Secretary, and Assistant Secretaries of the Trust, as well as such alternate members as the Trustees may from time to time designate. The Valuation Committee reviews and determines the fair valuation of portfolio securities and the Funds’ pricing procedures in general. |
181
Table of Contents
Notes to Financial Statements (Continued)
Fair value is defined as the price that would be received to sell an asset or paid to transfer a liability in an orderly transaction between market participants at the measurement date. A three-tier hierarchy is utilized to maximize the use of observable market data inputs and minimize the use of unobservable inputs and to establish classification of fair value measurements for disclosure purposes. Inputs refer broadly to the assumptions that market participants would use in pricing the asset or liability, including assumptions about risk, for example, the risk inherent in a particular valuation technique used to measure fair value (such as a pricing model) and/or the risk inherent in the inputs to the valuation technique. Inputs may be observable or unobservable. Observable inputs are inputs that reflect the assumptions market participants would use in pricing the asset or liability and are developed based on market data obtained from sources independent of the reporting entity. Unobservable inputs are inputs that reflect the reporting entity’s own assumptions about the assumptions market participants would use in pricing the asset or liability and are developed based on the best information available in the circumstances. The three-tier hierarchy of inputs is summarized in the three broad Levels listed below. The inputs or methodology used for valuing investments are not necessarily an indication of the risk associated with investing in those investments and the determination of the significance of a particular input to the fair value measurement in its entirety requires judgment and consideration of factors specific to each security.
Level 1 – quoted prices (unadjusted) in active markets for identical investments that the Funds can access at the measurement date
The types of assets and liabilities categorized in Level 1 generally include actively traded domestic and certain foreign equity securities, derivatives actively traded on a national securities exchange (such as some warrants, rights, futures, and options), and shares of open-end mutual funds.
Level 2 – other significant observable inputs (including quoted prices for similar investments, interest rates, prepayment speeds, credit risk, etc.)
The types of assets and liabilities categorized in Level 2 generally include debt securities such as U.S. Government and agency securities, mortgage-backed securities, asset-backed securities, municipal obligations, sovereign debt obligations, bank loans, corporate bonds, and those securities valued at amortized cost; OTC derivatives such as swaps, options, swaptions, and forward foreign currency exchange contracts; certain restricted securities; and non-exchange traded equity securities and certain foreign equity securities traded on particular foreign exchanges that close before the Funds determine their net asset values.
Level 3 – significant unobservable inputs (including the Funds’ own assumptions in determining the fair value of investments)
The types of assets and liabilities categorized in Level 3 generally include securities for which prices, spreads, or any of the other aforementioned significant inputs are unobservable. Generally, securities whose trading has been suspended or that have been de-listed from their current primary trading exchange; securities in default or bankruptcy proceedings for which there is no current market quotation; securities and certain derivatives valued by broker quotes which may include brokers’ assumptions; and any illiquid Rule 144A securities or restricted securities issued by non-public entities are categorized in Level 3.
The availability of observable inputs can vary from security to security and is affected by a wide variety of factors, including, for example, the type of security, whether the security is new and not yet established in the marketplace, the liquidity of markets, and other characteristics particular to the security. To the extent that valuation is based on models or inputs that are less observable or unobservable in the market, the determination of fair value requires more judgment. Accordingly, the degree of judgment exercised in determining fair value is greatest for instruments categorized in Level 3.
Changes in valuation techniques may result in transfers in or out of an investment’s assigned Level within the hierarchy. In addition, in periods of market dislocation, the observability of prices and inputs may be reduced for many instruments. This condition, as well as changes related to liquidity of investments, could cause a security to be reclassified between Level 1, Level 2, or Level 3.
In certain cases, the inputs used to measure fair value may fall into different levels of the fair value hierarchy. In such cases, for disclosure purposes the level in the fair value hierarchy within which the fair value measurement falls is determined based on the lowest level input that is significant to the overall fair value measurement.
The Focused Equity Fund, Small Company Value Fund, and Small/Mid Cap Value Fund characterized all long-term investments at Level 1, and all short-term investments at Level 2, as of December 31, 2016. For each Fund noted in the preceding sentence, the level classification by major category of investments is the same as the category presentation in the Portfolio of Investments.
182
Table of Contents
Notes to Financial Statements (Continued)
The following is the aggregate value by input level, as of December 31, 2016, for the remaining Funds’ investments:
| Level 1 | Level 2 | Level 3 | Total | |||||||||||||
Blue Chip Growth Fund | ||||||||||||||||
Asset Investments | ||||||||||||||||
Common Stock | $ | 372,168,127 | $ | 5,875,810 | * | $ | - | $ | 378,043,937 | |||||||
Mutual Funds | 1,005 | - | - | 1,005 | ||||||||||||
Short-Term Investments | - | 3,657,524 | - | 3,657,524 | ||||||||||||
|
|
|
|
|
|
|
| |||||||||
| Total Investments | $ | 372,169,132 | $ | 9,533,334 | $ | - | $ | 381,702,466 | ||||||||
|
|
|
|
|
|
|
| |||||||||
Equity Income Fund | ||||||||||||||||
Asset Investments | ||||||||||||||||
Common Stock | $ | 455,502,180 | $ | 18,814,225 | * | $ | - | $ | 474,316,405 | |||||||
Preferred Stock | 3,993,367 | 1,281,850 | - | 5,275,217 | ||||||||||||
Corporate Debt | - | 868,227 | - | 868,227 | ||||||||||||
Mutual Funds | 1,006 | - | - | 1,006 | ||||||||||||
Short-Term Investments | - | 9,958,555 | - | 9,958,555 | ||||||||||||
|
|
|
|
|
|
|
| |||||||||
| Total Investments | $ | 459,496,553 | $ | 30,922,857 | $ | - | $ | 490,419,410 | ||||||||
|
|
|
|
|
|
|
| |||||||||
Equity Index Fund | ||||||||||||||||
Asset Investments | ||||||||||||||||
Common Stock | $ | 544,030,340 | $ | - | $ | - | $ | 544,030,340 | ||||||||
Short-Term Investments | - | 19,626,305 | - | 19,626,305 | ||||||||||||
|
|
|
|
|
|
|
| |||||||||
| Total Investments | $ | 544,030,340 | $ | 19,626,305 | $ | - | $ | 563,656,645 | ||||||||
|
|
|
|
|
|
|
| |||||||||
Liability Derivatives | ||||||||||||||||
Futures Contracts | $ | (124,118 | ) | $ | - | $ | - | $ | (124,118 | ) | ||||||
|
|
|
|
|
|
|
| |||||||||
Foreign Fund | ||||||||||||||||
Asset Investments | ||||||||||||||||
Common Stock* | ||||||||||||||||
Bermuda | $ | - | $ | 1,269,101 | $ | - | $ | 1,269,101 | ||||||||
Brazil | 1,629,301 | - | - | 1,629,301 | ||||||||||||
Canada | 1,848,924 | - | - | 1,848,924 | ||||||||||||
Cayman Islands | 3,299,709 | 5,486,863 | - | 8,786,572 | ||||||||||||
China | - | 12,517,544 | - | 12,517,544 | ||||||||||||
France | - | 36,267,934 | - | 36,267,934 | ||||||||||||
Germany | 3,525,307 | 43,325,382 | - | 46,850,689 | ||||||||||||
Hong Kong | - | 6,726,115 | - | 6,726,115 | ||||||||||||
Ireland | - | 5,557,675 | - | 5,557,675 | ||||||||||||
Israel | 6,227,714 | - | - | 6,227,714 | ||||||||||||
Italy | - | 6,972,061 | - | 6,972,061 | ||||||||||||
Japan | 1,748,507 | 40,397,649 | - | 42,146,156 | ||||||||||||
Luxembourg | - | 2,133,713 | - | 2,133,713 | ||||||||||||
Netherlands | - | 17,579,457 | - | 17,579,457 | ||||||||||||
Norway | - | 6,475,815 | - | 6,475,815 | ||||||||||||
Portugal | - | 3,602,107 | - | 3,602,107 | ||||||||||||
Republic of Korea | 2,855,526 | 18,420,133 | - | 21,275,659 | ||||||||||||
Singapore | - | 11,963,255 | - | 11,963,255 | ||||||||||||
Spain | 3,975,679 | - | - | 3,975,679 | ||||||||||||
Sweden | - | 2,052,481 | - | 2,052,481 | ||||||||||||
Switzerland | - | 21,187,486 | - | 21,187,486 | ||||||||||||
Taiwan | - | 3,591,164 | - | 3,591,164 | ||||||||||||
183
Table of Contents
Notes to Financial Statements (Continued)
| Level 1 | Level 2 | Level 3 | Total | |||||||||||||
Foreign Fund (Continued) | ||||||||||||||||
Asset Investments (Continued) | ||||||||||||||||
Common Stock* (Continued) | ||||||||||||||||
Thailand | $ | - | $ | 3,559,625 | $ | - | $ | 3,559,625 | ||||||||
United Kingdom | 7,061,696 | 68,200,562 | - | 75,262,258 | ||||||||||||
Mutual Funds | 2,095,368 | - | - | 2,095,368 | ||||||||||||
Short-Term Investments | - | 9,225,651 | - | 9,225,651 | ||||||||||||
|
|
|
|
|
|
|
| |||||||||
| Total Investments | $ | 34,267,731 | $ | 326,511,773 | $ | - | $ | 360,779,504 | ||||||||
|
|
|
|
|
|
|
| |||||||||
Fundamental Growth Fund | ||||||||||||||||
Asset Investments | ||||||||||||||||
Common Stock | $ | 168,532,745 | $ | 825,387 | * | $ | - | $ | 169,358,132 | |||||||
Short-Term Investments | - | 129,588 | - | 129,588 | ||||||||||||
|
|
|
|
|
|
|
| |||||||||
| Total Investments | $ | 168,532,745 | $ | 954,975 | $ | - | $ | 169,487,720 | ||||||||
|
|
|
|
|
|
|
| |||||||||
Fundamental Value Fund | ||||||||||||||||
Asset Investments | ||||||||||||||||
Common Stock | $ | 227,068,563 | $ | 5,434,261 | * | $ | - | $ | 232,502,824 | |||||||
Short-Term Investments | - | 1,169,642 | - | 1,169,642 | ||||||||||||
|
|
|
|
|
|
|
| |||||||||
| Total Investments | $ | 227,068,563 | $ | 6,603,903 | $ | - | $ | 233,672,466 | ||||||||
|
|
|
|
|
|
|
| |||||||||
Global Fund | ||||||||||||||||
Asset Investments | ||||||||||||||||
Common Stock* | ||||||||||||||||
Austria | $ | - | $ | 1,037,021 | $ | - | $ | 1,037,021 | ||||||||
Brazil | - | 1,284,753 | - | 1,284,753 | ||||||||||||
Canada | 4,269,790 | - | - | 4,269,790 | ||||||||||||
Cayman Islands | - | 524,695 | - | 524,695 | ||||||||||||
Czech Republic | - | 316,486 | - | 316,486 | ||||||||||||
Denmark | - | 1,996,744 | - | 1,996,744 | ||||||||||||
France | - | 19,184,670 | - | 19,184,670 | ||||||||||||
Germany | - | 15,915,622 | - | 15,915,622 | ||||||||||||
Ireland | 10,589,123 | - | - | 10,589,123 | ||||||||||||
Israel | 2,304,660 | - | - | 2,304,660 | ||||||||||||
Japan | - | 2,947,190 | - | 2,947,190 | ||||||||||||
Mexico | 779,938 | - | - | 779,938 | ||||||||||||
Netherlands | 2,298,467 | 4,856,604 | - | 7,155,071 | ||||||||||||
Republic of Korea | - | 1,895,707 | - | 1,895,707 | ||||||||||||
Spain | - | 1,410,302 | - | 1,410,302 | ||||||||||||
Sweden | - | 4,491,288 | - | 4,491,288 | ||||||||||||
Switzerland | - | 21,493,028 | - | 21,493,028 | ||||||||||||
Thailand | - | 534,017 | - | 534,017 | ||||||||||||
United Kingdom | 1,383,032 | 22,603,843 | - | 23,986,875 | ||||||||||||
United States | 122,983,083 | - | - | 122,983,083 | ||||||||||||
Mutual Funds | 3,209,958 | - | - | 3,209,958 | ||||||||||||
Short-Term Investments | - | 1,236,054 | - | 1,236,054 | ||||||||||||
|
|
|
|
|
|
|
| |||||||||
| Total Investments | $ | 147,818,051 | $ | 101,728,024 | $ | - | $ | 249,546,075 | ||||||||
|
|
|
|
|
|
|
| |||||||||
184
Table of Contents
Notes to Financial Statements (Continued)
| Level 1 | Level 2 | Level 3 | Total | |||||||||||||
Growth & Income Fund | ||||||||||||||||
Asset Investments | ||||||||||||||||
Common Stock | $ | 119,243,781 | $ | 5,854,629 | * | $ | - | $ | 125,098,410 | |||||||
Short-Term Investments | - | 913,481 | - | 913,481 | ||||||||||||
|
|
|
|
|
|
|
| |||||||||
| Total Investments | $ | 119,243,781 | $ | 6,768,110 | $ | - | $ | 126,011,891 | ||||||||
|
|
|
|
|
|
|
| |||||||||
Income & Growth Fund | ||||||||||||||||
Asset Investments | ||||||||||||||||
Common Stock | $ | 252,728,368 | $ | 14,170,380 | * | $ | - | $ | 266,898,748 | |||||||
Short-Term Investments | - | 11,374,171 | - | 11,374,171 | ||||||||||||
|
|
|
|
|
|
|
| |||||||||
| Total Investments | $ | 252,728,368 | $ | 25,544,551 | $ | - | $ | 278,272,919 | ||||||||
|
|
|
|
|
|
|
| |||||||||
International Equity Fund | ||||||||||||||||
Asset Investments | ||||||||||||||||
Common Stock* | ||||||||||||||||
Australia | $ | - | $ | 5,899,094 | $ | - | $ | 5,899,094 | ||||||||
Cayman Islands | 5,182,893 | - | - | 5,182,893 | ||||||||||||
France | - | 22,450,181 | - | 22,450,181 | ||||||||||||
Germany | - | 15,208,230 | - | 15,208,230 | ||||||||||||
India | 949,120 | - | - | 949,120 | ||||||||||||
Indonesia | - | 2,795,216 | - | 2,795,216 | ||||||||||||
Ireland | 2,871,012 | 1,606,564 | - | 4,477,576 | ||||||||||||
Israel | 118,244 | - | - | 118,244 | ||||||||||||
Italy | - | 7,495,487 | - | 7,495,487 | ||||||||||||
Japan | - | 13,824,452 | - | 13,824,452 | ||||||||||||
Mexico | 2,713,611 | - | - | 2,713,611 | ||||||||||||
Netherlands | - | 11,674,908 | - | 11,674,908 | ||||||||||||
Republic of Korea | - | 1,787,845 | - | 1,787,845 | ||||||||||||
Sweden | - | 6,538,269 | - | 6,538,269 | ||||||||||||
Switzerland | - | 18,336,579 | - | 18,336,579 | ||||||||||||
Taiwan | - | 408,803 | - | 408,803 | ||||||||||||
United Kingdom | - | 28,371,813 | - | 28,371,813 | ||||||||||||
Mutual Funds | 145,010 | - | - | 145,010 | ||||||||||||
Short-Term Investments | - | 3,166,695 | - | 3,166,695 | ||||||||||||
|
|
|
|
|
|
|
| |||||||||
| Total Investments | $ | 11,979,890 | $ | 139,564,136 | $ | - | $ | 151,544,026 | ||||||||
|
|
|
|
|
|
|
| |||||||||
Asset Derivatives | ||||||||||||||||
Forward Contracts | $ | - | $ | 294,394 | $ | - | $ | 294,394 | ||||||||
|
|
|
|
|
|
|
| |||||||||
Liability Derivatives | ||||||||||||||||
Forward Contracts | $ | - | $ | (370 | ) | $ | - | $ | (370 | ) | ||||||
|
|
|
|
|
|
|
| |||||||||
Large Cap Growth Fund | ||||||||||||||||
Asset Investments | ||||||||||||||||
Common Stock | $ | 102,372,477 | $ | 3,384,020 | $ | - | $ | 105,756,497 | ||||||||
Short-Term Investments | - | 1,202,159 | - | 1,202,159 | ||||||||||||
|
|
|
|
|
|
|
| |||||||||
| Total Investments | $ | 102,372,477 | $ | 4,586,179 | $ | - | $ | 106,958,656 | ||||||||
|
|
|
|
|
|
|
| |||||||||
Managed Volatility Fund | ||||||||||||||||
Asset Investments | ||||||||||||||||
Common Stock | $ | 181,760,804 | $ | - | $ | - | $ | 181,760,804 | ||||||||
Corporate Debt | - | - | - | †,** | - | |||||||||||
Purchased Options | 696,970 | - | - | 696,970 | ||||||||||||
Short-Term Investments | - | 5,165,123 | - | 5,165,123 | ||||||||||||
|
|
|
|
|
|
|
| |||||||||
| Total Investments | $ | 182,457,774 | $ | 5,165,123 | $ | - | $ | 187,622,897 | ||||||||
|
|
|
|
|
|
|
| |||||||||
185
Table of Contents
Notes to Financial Statements (Continued)
| Level 1 | Level 2 | Level 3 | Total | |||||||||||||
Managed Volatility Fund (Continued) | ||||||||||||||||
Liability Derivatives | ||||||||||||||||
Written Options | $ | (3,424,740 | ) | $ | - | $ | - | $ | (3,424,740 | ) | ||||||
|
|
|
|
|
|
|
| |||||||||
Mid Cap Growth Fund | ||||||||||||||||
Asset Investments | ||||||||||||||||
Common Stock | $ | 405,952,535 | $ | - | $ | 827,917 | ** | $ | 406,780,452 | |||||||
Preferred Stock | - | - | 1,921,312 | ** | 1,921,312 | |||||||||||
Mutual Funds | 12,445,422 | - | - | 12,445,422 | ||||||||||||
Short-Term Investments | - | 15,573,326 | - | 15,573,326 | ||||||||||||
|
|
|
|
|
|
|
| |||||||||
| Total Investments | $ | 418,397,957 | $ | 15,573,326 | $ | 2,749,229 | $ | 436,720,512 | ||||||||
|
|
|
|
|
|
|
| |||||||||
Mid Cap Value Fund | ||||||||||||||||
Asset Investments | ||||||||||||||||
Common Stock | $ | 450,915,712 | $ | 5,536,114 | * | $ | - | $ | 456,451,826 | |||||||
Mutual Funds | 13,125,050 | - | - | 13,125,050 | ||||||||||||
Short-Term Investments | - | 8,039,212 | - | 8,039,212 | ||||||||||||
|
|
|
|
|
|
|
| |||||||||
| Total Investments | $ | 464,040,762 | $ | 13,575,326 | $ | - | $ | 477,616,088 | ||||||||
|
|
|
|
|
|
|
| |||||||||
Asset Derivatives | ||||||||||||||||
Forward Contracts | $ | - | $ | 20,842 | $ | - | $ | 20,842 | ||||||||
|
|
|
|
|
|
|
| |||||||||
Liability Derivatives | ||||||||||||||||
Forward Contracts | $ | - | $ | (95,156 | ) | $ | - | $ | (95,156 | ) | ||||||
|
|
|
|
|
|
|
| |||||||||
Small Cap Growth Equity Fund | ||||||||||||||||
Asset Investments | ||||||||||||||||
Common Stock | $ | 196,937,969 | $ | 1,515,900 | * | $ | 431,128 | $ | 198,884,997 | |||||||
Preferred Stock | - | - | 1,879,253 | 1,879,253 | ||||||||||||
Mutual Funds | 17,418,567 | - | - | 17,418,567 | ||||||||||||
Short-Term Investments | - | 3,046,873 | - | 3,046,873 | ||||||||||||
|
|
|
|
|
|
|
| |||||||||
| Total Investments | $ | 214,356,536 | $ | 4,562,773 | $ | 2,310,381 | $ | 221,229,690 | ||||||||
|
|
|
|
|
|
|
| |||||||||
Total Return Bond Fund | ||||||||||||||||
Asset Investments | ||||||||||||||||
Bank Loans | $ | - | $ | 845,401 | $ | - | $ | 845,401 | ||||||||
Corporate Debt | - | 95,480,276 | - | 95,480,276 | ||||||||||||
Municipal Obligations | - | 4,445,102 | - | 4,445,102 | ||||||||||||
Non-U.S. Government Agency Obligations | - | 58,299,482 | - | 58,299,482 | ||||||||||||
U.S. Government Agency Obligations and Instrumentalities | - | 112,228,885 | - | 112,228,885 | ||||||||||||
U.S. Treasury Obligations | - | 143,944,595 | - | 143,944,595 | ||||||||||||
Short-Term Investments | - | 43,352,589 | - | 43,352,589 | ||||||||||||
|
|
|
|
|
|
|
| |||||||||
| Total Investments | $ | - | $ | 458,596,330 | $ | - | $ | 458,596,330 | ||||||||
|
|
|
|
|
|
|
| |||||||||
Asset Derivatives | ||||||||||||||||
Forward Contracts | $ | - | $ | 364,683 | $ | - | $ | 364,683 | ||||||||
|
|
|
|
|
|
|
| |||||||||
Liability Derivatives | ||||||||||||||||
Futures Contracts | $ | (61,067 | ) | $ | - | $ | - | $ | (61,067 | ) | ||||||
|
|
|
|
|
|
|
| |||||||||
| * | Includes foreign equity securities whose values were adjusted to reflect market trading of comparable securities or other correlated instruments after the close of trading in their applicable foreign markets. |
| ** | None of the unobservable inputs for Level 3 assets, individually or collectively, had a material impact on the Fund(s). Level 3 investments at the beginning and/or end of the period in relation to net assets were not significant and accordingly, a reconciliation of Level 3 assets for the year ended December 31, 2016 is not presented. |
| † | Represents a security at $0 value as of December 31, 2016. |
186
Table of Contents
Notes to Financial Statements (Continued)
The following tables show Fund(s) with certain assets and liabilities, which approximate fair value and would be categorized at Level 2 as of December 31, 2016.
Statements of Assets and Liabilities location: | Total | |
Receivables from: | X | |
Investments sold on a when-issued basis | ||
Payables for: | X | |
Investments purchased on a when-issued basis | ||
Statements of Assets and Liabilities location: | Foreign | Global | International | Mid Cap | Small Cap Growth | Small Company | ||||||
Securities on loan | X | X | X | X | X | X |
The Fund(s) had no transfers between Level 1 and Level 2 of the fair value hierarchy during the year ended December 31, 2016. The Fund(s) recognize transfers between the Levels as of the beginning of the year.
Following is a reconciliation of investments for which significant unobservable inputs (Level 3) were used in determining value:
Asset Valuation Inputs
| Investments in Securities | ||||||||||||||||||||||||||||||||||||||||
| Balance as of 12/31/15 | Accrued Discounts (Premiums) | Realized Gain (Loss) | Change in Unrealized Appreciation (Depreciation) | Purchases | (Sales) | Transfers into Level 3* | Transfers (out) of Level 3* | Balance as of 12/31/16 | Net Change in Unrealized Appreciation (Depreciation) from Investments Still Held as of 12/31/16 | |||||||||||||||||||||||||||||||
Small Cap Growth Equity Fund |
| |||||||||||||||||||||||||||||||||||||||
Common Stock | $ | 311,026 | $ | - | $ | - | $ | 60,329 | $ | 59,773 | $ | - | $ | - | $ | - | $ | 431,128 | $ | 60,329 | ||||||||||||||||||||
Preferred Stock | 2,419,091 | - | (2,439 | ) | (267,418 | ) | - | (39,015 | ) | - | (230,966 | )** | 1,879,253 | (267,434 | ) | |||||||||||||||||||||||||
|
|
|
|
|
|
|
|
|
|
|
|
|
|
|
|
|
|
|
| |||||||||||||||||||||
| $ | 2,730,117 | $ | - | $ | (2,439 | ) | $ | (207,089 | ) | $ | 59,773 | $ | (39,015 | ) | $ | - | $ | (230,966 | ) | $ | 2,310,381 | $ | (207,105 | ) | ||||||||||||||||
|
|
|
|
|
|
|
|
|
|
|
|
|
|
|
|
|
|
|
| |||||||||||||||||||||
| * | The Fund(s) recognize transfers between the Levels as of the beginning of the year. |
| ** | Transfers occurred as inputs were more observable. |
187
Table of Contents
Notes to Financial Statements (Continued)
The Small Cap Growth Equity Fund fair values certain of its Level 3 investments using acquisition cost, although the transaction may not have occurred during the current reporting period. These investments are generally privately held investments, but may include defaulted securities and new debt issuances. There may not be a secondary market, and/or there are a limited number of investors. The determination to fair value such investments at cost is based upon factors consistent with the principles of fair value measurement that are reasonably available to the Valuation Committee. Valuations are reviewed utilizing available market information to determine if the carrying value should be adjusted. Such market data may include, but is not limited to, observations of the trading multiples of public companies considered comparable to the private companies being valued, financial or operational information released by the company, and/or news or corporate events that affect the investment, also referred to as enterprise value (EV) to earnings before interest, taxes, depreciation and amortization (EBITDA) ratios. Valuations may be adjusted to account for company-specific issues, the lack of liquidity inherent in a nonpublic investment, and the fact that comparable public companies are not identical to the investments being fair valued by the Small Cap Growth Equity Fund. All market variables are assessed on a regular frequency and calibrated as necessary.
| Fair Value Amount | Valuation | Unobservable Input Description | Value/ Weighted Average Range | |||||||||
| Small Cap Growth Equity | ||||||||||||
| Common stock — $431,128 | ||||||||||||
Dropbox, Inc. | $ | 100,816 | Market Approach | EV/Multiple | 5.40x | |||||||
| Discount for Lack of Marketability | 10% | |||||||||||
Telogis | 255,573 | Market Approach | Future Cash Distribution | $ | 3.18 | |||||||
Cenntenial Resource Development | 74,739 | Market Approach | Discount for Lack of Marketability | 10% | ||||||||
Docusign, Series E Escrow Shares | - | Worthless | Worthless | - | ||||||||
| Preferred stock — $1,879,253 | ||||||||||||
Cloudera, Inc. Series F | 207,932 | Market Approach | EV/Multiple | 6.10x | ||||||||
| Discount for Lack of Marketability | 10% | |||||||||||
Docusign, Series E | 114,390 | Market Approach | EV/Multiple | 7.20x | ||||||||
Docusign, Series D | 5,281 | Discount for Lack of Marketability | 10% | |||||||||
Docusign, Series B | 7,364 | |||||||||||
Docusign, Series B1 | 2,196 | |||||||||||
Draftkings, Series D | 59,472 | Market Approach | Probability Expected Weighted Return Model — 2019 EV/Multiple | 12.2x | ||||||||
Draftkings, Series D1 | 146,307 | Merger Probability | 50% | |||||||||
Probability Expected Weighted Return Model — 2020 EV/Multiple | 10.9x | |||||||||||
| No Merger Probability | 50% | |||||||||||
| Discount for Lack of Marketability | 10% | |||||||||||
MarkLogic Corp. Series F | 236,779 | Market Approach | EV/Multiple | 3.00x | ||||||||
| Discount for Lack of Marketability | 10% | |||||||||||
Telogis | 481,843 | Market Approach | Future Cash Distribution | $ | 4.40 | |||||||
The Honest Co. Series D | 139,012 | Market Approach | EV/Multiple | 3.74x | ||||||||
| Discount for Lack of Marketability | 10% | |||||||||||
Veracode, Inc. Series 8 | 219,211 | Market Approach | EV/Multiple | 4.40x | ||||||||
| Discount for Lack of Marketability | 10% | |||||||||||
Zuora, Inc. Series F | 259,466 | Market Approach | EV/Multiple | 6.20x | ||||||||
| Discount for Lack of Marketability | 10% | |||||||||||
|
| |||||||||||
Total | $ | 2,310,381 | ||||||||||
|
| |||||||||||
188
Table of Contents
Notes to Financial Statements (Continued)
Derivative Instruments
Derivatives are financial instruments whose values are based on the values of one or more indicators, such as a security, asset, currency, interest rate, or index. Derivative transactions can create investment leverage and may be highly volatile. Gains or losses from derivatives can be substantially greater than their original cost and can sometimes be unlimited. A Fund may not be able to close out a derivative transaction at a favorable time or price. For those Funds that held derivatives during the year ended December 31, 2016, the following table shows how the Fund used these types of derivatives during the period (marked with an “A”), as well as additional uses, if any, it may have for them in the future (marked with an “M”).
Type of Derivative and Objective for Use | Equity | International | Managed Volatility Fund | Mid Cap Value | Total Return Bond Fund | |||||
Foreign Currency Transactions* | ||||||||||
Hedging/Risk Management | A | A | A | |||||||
Futures Contracts** | ||||||||||
Hedging/Risk Management | A | |||||||||
Duration/Credit Quality Management | A | |||||||||
Substitution for Direct Investment | A | M | ||||||||
Options (Purchased) | ||||||||||
Hedging/Risk Management | A | |||||||||
Options (Written) | ||||||||||
Hedging/Risk Management | A | |||||||||
Income | A | |||||||||
| * | Includes any options purchased or written, futures contracts, and forward contracts, if applicable. |
| ** | Includes any options purchased or written on futures contracts, if applicable. |
At December 31, 2016, and during the year then ended, the Fund(s) had the following derivatives and transactions in derivatives, grouped into the indicated risk categories:
| Equity Risk | Foreign Exchange Risk | Interest Rate Risk | Total | |||||||||||||
| Equity Index Fund | ||||||||||||||||
| Liability Derivatives | ||||||||||||||||
Futures Contracts^^ | $ | (124,118 | ) | $ | - | $ | - | $ | (124,118 | ) | ||||||
|
|
|
|
|
|
|
| |||||||||
| Realized Gain (Loss)# | ||||||||||||||||
Futures Contracts | $ | 1,109,313 | $ | - | $ | - | $ | 1,109,313 | ||||||||
|
|
|
|
|
|
|
| |||||||||
| Change in Appreciation (Depreciation)## | ||||||||||||||||
Futures Contracts | $ | (127,367 | ) | $ | - | $ | - | $ | (127,367 | ) | ||||||
|
|
|
|
|
|
|
| |||||||||
189
Table of Contents
Notes to Financial Statements (Continued)
| Equity Risk | Foreign Exchange Risk | Interest Rate Risk | Total | |||||||||||||
| International Equity Fund | ||||||||||||||||
| Asset Derivatives | ||||||||||||||||
Forward Contracts* | $ | - | $ | 294,394 | $ | - | $ | 294,394 | ||||||||
|
|
|
|
|
|
|
| |||||||||
| Liability Derivatives | ||||||||||||||||
Forward Contracts^ | $ | - | $ | (370 | ) | $ | - | $ | (370 | ) | ||||||
|
|
|
|
|
|
|
| |||||||||
| Realized Gain (Loss)# | ||||||||||||||||
Forward Contracts | $ | - | $ | 106,675 | $ | - | $ | 106,675 | ||||||||
|
|
|
|
|
|
|
| |||||||||
| Change in Appreciation (Depreciation)## | ||||||||||||||||
Forward Contracts | $ | - | $ | 90,321 | $ | - | $ | 90,321 | ||||||||
|
|
|
|
|
|
|
| |||||||||
| Managed Volatility Fund | ||||||||||||||||
| Asset Derivatives | ||||||||||||||||
Purchased Options* | $ | 696,970 | $ | - | $ | - | $ | 696,970 | ||||||||
|
|
|
|
|
|
|
| |||||||||
| Liability Derivatives | ||||||||||||||||
Written Options^ | $ | (3,424,740 | ) | $ | - | $ | - | $ | (3,424,740 | ) | ||||||
|
|
|
|
|
|
|
| |||||||||
| Realized Gain (Loss)# | ||||||||||||||||
Purchased Options | $ | (6,429,163 | ) | $ | - | $ | - | $ | (6,429,163 | ) | ||||||
Written Options | (4,271,668 | ) | - | - | (4,271,668 | ) | ||||||||||
|
|
|
|
|
|
|
| |||||||||
Total Realized Gain (Loss) | $ | (10,700,831 | ) | $ | - | $ | - | $ | (10,700,831 | ) | ||||||
|
|
|
|
|
|
|
| |||||||||
| Change in Appreciation (Depreciation)## | ||||||||||||||||
Purchased Options | $ | 299,218 | $ | - | $ | - | $ | 299,218 | ||||||||
Written Options | (2,611,425 | ) | - | - | (2,611,425 | ) | ||||||||||
|
|
|
|
|
|
|
| |||||||||
Total Change in Appreciation (Depreciation) | $ | (2,312,207 | ) | $ | - | $ | - | $ | (2,312,207 | ) | ||||||
|
|
|
|
|
|
|
| |||||||||
| Mid Cap Value Fund | ||||||||||||||||
| Asset Derivatives | ||||||||||||||||
Forward Contracts* | $ | - | $ | 20,842 | $ | - | $ | 20,842 | ||||||||
|
|
|
|
|
|
|
| |||||||||
| Liability Derivatives | ||||||||||||||||
Forward Contracts^ | $ | - | $ | (95,156 | ) | $ | - | $ | (95,156 | ) | ||||||
|
|
|
|
|
|
|
| |||||||||
| Realized Gain (Loss)# | ||||||||||||||||
Forward Contracts | $ | - | $ | 233,382 | $ | - | $ | 233,382 | ||||||||
|
|
|
|
|
|
|
| |||||||||
| Change in Appreciation (Depreciation)## | ||||||||||||||||
Forward Contracts | $ | - | $ | (44,271 | ) | $ | - | $ | (44,271 | ) | ||||||
|
|
|
|
|
|
|
| |||||||||
190
Table of Contents
Notes to Financial Statements (Continued)
| Equity Risk | Foreign Exchange Risk | Interest Rate Risk | Total | |||||||||||||
| Total Return Bond Fund | ||||||||||||||||
| Asset Derivatives | ||||||||||||||||
Forward Contracts* | $ | - | $ | 364,683 | $ | - | $ | 364,683 | ||||||||
|
|
|
|
|
|
|
| |||||||||
| Liability Derivatives | ||||||||||||||||
Futures Contracts^^ | $ | - | $ | - | $ | (61,067 | ) | $ | (61,067 | ) | ||||||
|
|
|
|
|
|
|
| |||||||||
| Realized Gain (Loss)# | ||||||||||||||||
Forward Contracts | $ | - | $ | 1,351,855 | $ | - | $ | 1,351,855 | ||||||||
Futures Contracts | - | - | (212,505 | ) | (212,505 | ) | ||||||||||
|
|
|
|
|
|
|
| |||||||||
Total Realized Gain (Loss) | $ | - | $ | 1,351,855 | $ | (212,505 | ) | $ | 1,139,350 | |||||||
|
|
|
|
|
|
|
| |||||||||
| Change in Appreciation (Depreciation)## | ||||||||||||||||
Forward Contracts | $ | - | $ | 364,683 | $ | - | $ | 364,683 | ||||||||
Futures Contracts | - | - | (34,055 | ) | (34,055 | ) | ||||||||||
|
|
|
|
|
|
|
| |||||||||
Total Change in Appreciation (Depreciation) | $ | - | $ | 364,683 | $ | (34,055 | ) | $ | 330,628 | |||||||
|
|
|
|
|
|
|
| |||||||||
| * | Statements of Assets and Liabilities location: Investments, at value, Receivables from: open forward foreign currency contracts. |
| ^ | Statements of Assets and Liabilities location: Payables for: written options, or open forward foreign currency contracts outstanding, at value, as applicable. |
| ^^ | Cumulative appreciation (depreciation) on futures contracts is reported in “Futures Contracts” below. Only current day’s variation margin, if any, is reported within the Statements of Assets and Liabilities. |
| # | Statements of Operations location: Amounts are included in net realized gain (loss) on: investment transactions, futures contracts, written options, or foreign currency transactions, as applicable. |
| ## | Statements of Operations location: Amounts are included in net change in unrealized appreciation (depreciation) on: investment transactions, futures contracts, written options, or translation of assets and liabilities in foreign currencies, as applicable. |
For the year ended December 31, 2016, the number of contracts, notional amounts, or shares/units for each derivative type was as follows:
| Number of Contracts, Notional Amounts, or Shares/Units† | ||||||||||||||||
| Futures Contracts | Forward Contracts | Purchased Options | Written Options | |||||||||||||
Equity Index Fund | 65 | $ | - | - | - | |||||||||||
International Equity Fund | - | 5,894,634 | - | - | ||||||||||||
Managed Volatility Fund | - | - | 873 | 880 | ||||||||||||
Mid Cap Value Fund | - | 16,962,574 | - | - | ||||||||||||
Total Return Bond Fund | 200 | 12,800,897 | - | - | ||||||||||||
| † | Amount(s) disclosed represent average number of contracts for futures contracts, notional amounts for forward contracts, and shares/units outstanding for purchased options and written options, which is indicative of volume of this derivative type, for the months that the Fund held such derivatives during the year ended December 31, 2016. |
191
Table of Contents
Notes to Financial Statements (Continued)
The following table presents derivative assets by counterparty net of amounts available for offset under a master netting agreement (“MNA”), or similar agreement, and net of the related collateral received by the Fund(s) as of December 31, 2016.
Counterparty | Derivative Assets Subject to an MNA by Counterparty† | Financial Instruments Available for Offset | Collateral Received*** | Net Amount* | ||||||||||||
| International Equity Fund | ||||||||||||||||
State Street Bank and Trust | $ | 294,394 | $ | (370 | ) | $ | - | $ | 294,024 | |||||||
|
|
|
|
|
|
|
| |||||||||
The following table presents derivative liabilities by counterparty net of amounts available for offset under an MNA, or similar agreement, and net of the related collateral pledged by the Fund(s) as of December 31, 2016.
Counterparty | Derivative��Liabilities Subject to an MNA by Counterparty† | Financial Instruments Available for Offset | Collateral Pledged*** | Net Amount** | ||||||||||||
| International Equity Fund | ||||||||||||||||
State Street Bank and Trust | $ | (370 | ) | $ | 370 | $ | - | $ | - | |||||||
|
|
|
|
|
|
|
| |||||||||
| * | Represents the net amount receivable from the counterparty in the event of default. |
| ** | Represents the net amount payable to the counterparty in the event of default. |
| *** | The amount presented here may be less than the total amount of collateral received/pledged as the net amount of derivative assets and liabilities for a counterparty cannot be less than $0. |
| † | The amount presented here may be less than the total amount shown in the Statements of Assets and Liabilities as some derivatives held by the counterparty are not covered within the master netting agreements. |
Such agreements typically permit a single net payment in the event of default, including the bankruptcy or insolvency of the counterparty. Typically, the Fund(s) and counterparties are not permitted to sell, re-pledge, or use the collateral they receive.
Further details regarding the derivatives and other investments held by the Fund(s) during the year ended December 31, 2016, are discussed below.
Foreign Currency Exchange Transactions
A Fund may engage in foreign currency exchange transactions for hedging purposes in order to protect against uncertainty in the level of future foreign currency exchange rates, or for other, non-hedging purposes.
A Fund may enter into foreign currency exchange transactions, including foreign currency forward contracts. These contracts call for the Fund to deliver in the future an amount of one currency in return for an amount of another currency, at an exchange rate determined at the time the contract is entered into. Forward contracts are private contractual arrangements and a Fund is subject to the risk that its counterparty will not, or will not be able to, perform its obligations. This type of arrangement may require the Fund to post margin. A Fund may enter into foreign currency exchange transactions in order to hedge against changes in the values of the assets or liabilities denominated in one or more foreign currencies, or otherwise to increase or reduce a Fund’s exposure to various foreign currencies. The use of foreign currency exchange transactions may create investment leverage.
Whenever a Fund enters into a foreign currency exchange transaction, it is subject to the risk that the value of the transaction will move in a direction unfavorable to it. When the Fund uses the transactions for hedging purposes, it is likely that the Fund will have an asset or liability that will offset any loss (or gain) on the transactions, at least in part. If a Fund enters into foreign currency exchange transactions other than for hedging purposes (for example, seeking to profit from an anticipated change in the values of currencies by creating directional exposures in the portfolio with respect to one or more currencies), it will generally be subject to the same risks, but is less likely to have assets or liabilities that will offset any losses on the transactions. There can be no assurance that a Fund will be able to terminate any foreign currency exchange transaction prior to its maturity in order to limit its loss on the transaction.
192
Table of Contents
Notes to Financial Statements (Continued)
Forward foreign currency contracts are marked to market daily and the change in their value is recorded by the Funds as an unrealized gain or loss. Forward foreign currency contracts are valued at the settlement price established through dealers or other market sources on the day which they are traded. When a forward foreign currency contract is extinguished, through delivery or offset by entering into another forward foreign currency contract, the Funds record a realized gain or loss equal to the difference between the value of the contract at the time it was opened and the value of the contract at the time it was extinguished or offset. The notional or contractual amounts of these instruments do not necessarily represent the amounts potentially subject to risk. The measurement of the risk associated with these instruments is meaningful only when all related and offsetting transactions and counterparty risks are considered.
The Fund(s) listed in the following table had open forward foreign currency contracts at December 31, 2016. A Fund’s current exposure to a counterparty is the unrealized appreciation on the contract.
Counterparty | Settlement | In Exchange for | Unrealized Appreciation/ (Depreciation) | |||||||||||||
| International Equity Fund | ||||||||||||||||
| Contract to Buy | ||||||||||||||||
| CHF | 1,031,000 | State Street Bank and Trust* | 03/15/17 | $ | 1,006,957 | $ | 9,958 | |||||||||
|
|
|
| |||||||||||||
| Contracts to Deliver | ||||||||||||||||
| AUD | 790,000 | State Street Bank and Trust* | 06/21/17 | 577,556 | 9,724 | |||||||||||
| CHF | 5,361,000 | State Street Bank and Trust* | 03/15/17 | 5,562,415 | 274,656 | |||||||||||
| JPY | 8,300,724 | State Street Bank and Trust* | 01/04/17 | 70,652 | (370 | ) | ||||||||||
| JPY | 1,449,452 | State Street Bank and Trust* | 01/05/17 | 12,457 | 56 | |||||||||||
|
|
|
| |||||||||||||
| $ | 6,223,080 | $ | 284,066 | |||||||||||||
|
|
|
| |||||||||||||
| Mid Cap Value Fund | ||||||||||||||||
| Contract to Buy | ||||||||||||||||
| CAD | 649,448 | Morgan Stanley & Co. | 03/31/17 | $ | 485,766 | $ | (1,552 | ) | ||||||||
|
|
|
| |||||||||||||
| Contracts to Deliver | ||||||||||||||||
| JPY | 291,704,099 | Credit Suisse International | 03/31/17 | 2,477,040 | (29,700 | ) | ||||||||||
| CAD | 10,328,548 | Morgan Stanley & Co. | 03/31/17 | 7,721,586 | 20,842 | |||||||||||
| EUR | 4,443,864 | UBS AG | 03/31/17 | 4,634,787 | (63,904 | ) | ||||||||||
|
|
|
| |||||||||||||
| $ | 14,833,413 | $ | (72,762 | ) | ||||||||||||
|
|
|
| |||||||||||||
| Total Return Bond Fund | ||||||||||||||||
| Contracts to Deliver | ||||||||||||||||
| JPY | 1,200,000,000 | Citibank N.A. | 01/10/17 | $ | 10,513,220 | $ | 241,377 | |||||||||
| JPY | 630,000,000 | JP Morgan Chase Bank N.A. | 01/13/17 | 5,517,218 | 123,306 | |||||||||||
|
|
|
| |||||||||||||
| $ | 16,030,438 | $ | 364,683 | |||||||||||||
|
|
|
| |||||||||||||
| AUD | Australian Dollar |
| CAD | Canadian Dollar |
| CHF | Swiss Franc |
| * | Contracts are subject to an MNA. |
| EUR | Euro |
| JPY | Japanese Yen |
193
Table of Contents
Notes to Financial Statements (Continued)
Futures Contracts
A Fund may seek to manage a variety of different risks, such as interest rate risk, equity price risk, and currency risk, through the use of futures contracts. A Fund may use interest rate futures contracts to adjust the interest rate sensitivity (duration) of its portfolio or the credit exposure of the portfolio. Interest rate futures contracts obligate the long or short holder to take or make delivery of a specified quantity of a financial instrument, such as a specific fixed-income security, during a specified future period at a specified price. A Fund may use index futures to hedge against broad market risks to its portfolio or to gain broad market exposure when it holds uninvested cash or as an inexpensive substitute for cash investments directly in securities or other assets. Securities index futures contracts are contracts to buy or sell units of a securities index at a specified future date at a price agreed upon when the contract is made and are settled in cash. Positions in futures may be closed out only on an exchange or board of trade which provides a secondary market for such futures. Because futures contracts are exchange-traded, they typically have minimal exposure to counterparty risk.
Parties to a futures contract are not required to post the entire notional amount of the contract, but rather a small percentage of that amount (by way of margin), both at the time they enter into futures transactions, and then on a daily basis if their positions decline in value; as a result, futures contracts are highly leveraged. Such payments are known as variation margin and are recorded by the Funds as unrealized gains or losses. Because futures markets are highly leveraged, they can be extremely volatile, and there can be no assurance that the pricing of a futures contract will correlate precisely with the pricing of the asset or index underlying it or the asset or liability of the Fund that is the subject of the hedge. It may not always be possible for a Fund to enter into a closing transaction with respect to a futures contract it has entered into, at a favorable time or price. When a Fund enters into a futures transaction, it is subject to the risk that the value of the futures contract will move in a direction unfavorable to it. When a Fund uses futures contracts for hedging purposes, it is likely that the Fund will have an asset or liability that will offset any loss (or gain) on the transactions, at least in part.
When a futures contract is closed, the Fund records a realized gain or loss equal to the difference between the value of the contract at the time it was opened and the value at the time it was closed. Futures contracts are valued at the settlement price established each day by the board of trade or exchange on which they are traded.
The Fund(s) listed in the following table had open futures contracts at December 31, 2016:
| Expiration Date | Number of Contracts | Notional Amount | Net Unrealized Appreciation/ (Depreciation) | |||||||||||||
Equity Index Fund |
| |||||||||||||||
Futures Contracts — Long |
| |||||||||||||||
S&P 500 E Mini Index | 03/17/17 | 180 | $ | 20,125,800 | $ | (124,118 | ) | |||||||||
|
| |||||||||||||||
Total Return Bond Fund |
| |||||||||||||||
Futures Contracts — Long |
| |||||||||||||||
U.S. Treasury Note 2 Year | 03/31/17 | 46 | $ | 9,967,625 | $ | (3,325 | ) | |||||||||
U.S. Treasury Note 5 Year | 03/31/17 | 212 | 24,944,781 | (57,742 | ) | |||||||||||
|
| |||||||||||||||
| $ | (61,067 | ) | ||||||||||||||
|
| |||||||||||||||
Options
A Fund may purchase and sell put and call options on securities or an index of securities to enhance investment performance or to protect against changes in market prices. A Fund that invests in debt securities may also purchase and sell put and call options to adjust the interest rate sensitivity of its portfolio or the credit exposure of the portfolio.
Call Options. A call option gives the holder the right to purchase, and obligates the writer to sell, a security at the strike price at any time before the expiration date.
194
Table of Contents
Notes to Financial Statements (Continued)
Put Options. A put option gives the holder the right to sell, and obligates the writer to buy, a security at the exercise price at any time before the expiration date.
Writing put and call options. A Fund may write call options on a security it owns, in a “directional” strategy hoping to realize a greater current return through the receipt of premiums. In return for the option premium, the Fund takes the risk that it will have to forego any increase in the value of the security over the strike price. When a Fund has written a call option on a security it does not own, its exposure on such an option is theoretically unlimited. A Fund may enter into closing purchase transactions in order to realize a profit or limit a loss on a previously written call option or, in the case of a call option on a security it owns, to free itself to sell the underlying security or to write another call on the security, or protect a security from being called in an unexpected market rise. Any profits from a closing purchase transaction in the case of a call option on a security a Fund owns may be offset by a decline in the value of the underlying security. Conversely, because increases in the market price of a call option will generally reflect increases in the market price of the underlying security, any loss resulting from a closing purchase transaction relating to a call option on a security a Fund owns is likely to be offset in whole or in part by unrealized appreciation of the underlying security owned by the Fund. A Fund may not be able to close out a call option that it has previously written. A Fund may write put options in order to enhance its current return by taking a long directional position as to a security or index of securities. By writing a put option, a Fund assumes the risk that it may be required to purchase the underlying security for an exercise price higher than its then current market value, resulting in a potential capital loss unless the security later appreciates in value. A Fund may terminate a put option that it has written before it expires by entering into a closing purchase transaction. Any loss from this transaction may be partially or entirely offset by the premium received on the terminated option. A Fund may not be able to close out a put option that it has previously written.
When a Fund writes a call or put option, an amount equal to the premium received is recorded as a liability. Premiums received from writing options which expire are treated as realized gains. Premiums received from writing options which are exercised or closed are added to the proceeds or offset against the amount paid on the underlying investment to determine the realized gain or loss.
Purchasing put and call options. A Fund may purchase put options to protect portfolio holdings against a decline in market value of a security or securities held by it. A Fund may also purchase a put option hoping to profit from an anticipated decline in the value of the underlying security. If the Fund holds the security underlying the option, the option premium and any transaction costs will reduce any profit the Fund might have realized had it sold the underlying security instead of buying the put option. A Fund may purchase call options to hedge against an increase in the price of securities that the Fund wants ultimately to buy. A Fund may also purchase a call option as a long directional investment hoping to profit from an anticipated increase in the value of the underlying security. In order for a call option to be profitable, the market price of the underlying security must rise sufficiently above the exercise price to cover the premium and transaction costs. These costs will reduce any profit the Fund might have realized had it bought the underlying security at the time it purchased the call option.
When a Fund purchases an option, it runs the risk that it will lose its entire investment in the option in a relatively short period of time, unless the Fund exercises the option or enters into a closing sale transaction before the option’s expiration. If the price of the underlying security does not rise (in the case of a call) or fall (in the case of a put) to an extent sufficient to cover the option premium and transaction costs, the Fund will lose part or all of its investment in the option. This contrasts with an investment by a Fund in the underlying security, since the Fund will not realize a loss if the security’s price does not change. Premiums paid for purchasing options that expire are treated as realized losses.
Exchange Traded Options. Exchange traded options purchased or sold by a Fund may be traded on a securities or options exchange or market. Such options typically have minimal exposure to counterparty risk. However, an exchange or market may at times find it necessary to impose restrictions on particular types of options transactions, such as opening transactions. If an underlying security ceases to meet qualifications imposed by the market or the Options Clearing Corporation, new series of options on that security will no longer be opened to replace expiring series, and opening transactions in existing series may be prohibited. Exchange traded options are valued at the last sale price, or if no sales are reported, the last bid price.
195
Table of Contents
Notes to Financial Statements (Continued)
The Fund(s) listed in the following table had open written option contracts at December 31, 2016
| Units | Expiration Date | Description | Premiums Received | Value | ||||||||||||
| Managed Volatility Fund | ||||||||||||||||
| 85 | 1/06/17 | S&P 500 Index Call, Strike 2,200.00 | $ | 301,537 | $ | 344,760 | ||||||||||
| 79 | 1/13/17 | S&P 500 Index Call, Strike 2,260.00 | 193,236 | 76,077 | ||||||||||||
| 94 | 1/20/17 | S&P 500 Index Call, Strike 2,175.00 | 413,365 | 667,400 | ||||||||||||
| 86 | 1/20/17 | S&P 500 Index Call, Strike 2,200.00 | 249,185 | 453,048 | ||||||||||||
| 95 | 1/20/17 | S&P 500 Index Call, Strike 2,250.00 | 313,263 | 174,990 | ||||||||||||
| 91 | 2/17/17 | S&P 500 Index Call, Strike 2,200.00 | 488,261 | 590,590 | ||||||||||||
| 93 | 2/17/17 | S&P 500 Index Call, Strike 2,225.00 | 334,568 | 419,430 | ||||||||||||
| 95 | 3/17/17 | S&P 500 Index Call, Strike 2,250.00 | 493,762 | 427,975 | ||||||||||||
| 86 | 3/17/17 | S&P 500 Index Call, Strike 2,275.00 | 412,584 | 270,470 | ||||||||||||
|
|
|
| |||||||||||||
| $ | 3,199,761 | $ | 3,424,740 | |||||||||||||
|
|
|
| |||||||||||||
Transactions in written option contracts during the year ended December 31, 2016, were as follows:
| Number of Contracts | Premiums Received | |||||||
| Managed Volatility Fund | ||||||||
Options outstanding at December 31, 2015 | 938 | $ | 4,774,926 | |||||
Options written | 9,611 | 34,699,267 | ||||||
Options terminated in closing purchase transactions | (9,619 | ) | (36,093,618 | ) | ||||
Options expired | (126 | ) | (180,814 | ) | ||||
|
|
|
| |||||
Options outstanding at December 31, 2016 | 804 | $ | 3,199,761 | |||||
|
|
|
| |||||
Inflation-Indexed Bonds
The Funds may invest in inflation-indexed bonds, which are fixed income securities whose principal value or coupon is periodically adjusted according to the rate of inflation, as measured by the Consumer Price Index for All Urban Consumers (“CPI-U”) (for U.S. Treasury inflation-indexed bonds) or, generally, by a comparable inflation index calculated by the foreign government issuing the inflation-indexed bonds.
If the periodic adjustment rate measuring inflation falls, the principal value of inflation-indexed bonds will be adjusted downward, and consequently the interest payable on these securities (calculated with respect to a smaller principal amount) will be reduced. Repayment of the original bond principal upon maturity (as adjusted for inflation) is guaranteed in the case of U.S. Treasury inflation-indexed bonds, even during a period of deflation. However, the current market value of the bonds is not guaranteed, and will fluctuate. The Funds may also invest in other inflation related bonds which may or may not provide a similar guarantee. If a guarantee of principal is not provided, the adjusted principal value of the bond repaid at maturity may be less than the original principal. Any adjustments to the principal amount of an inflation-indexed bond due to inflation will be reflected as increases or decreases to interest income. Such adjustments may have a significant impact on the Fund’s distributions.
The value of inflation-indexed bonds is generally based on changes in real interest rates, which in turn are tied to the relationship between nominal interest rates and the rate of inflation. Therefore, if nominal interest rates increased at a faster rate than inflation, real interest rates might rise, leading to a decrease in value of inflation-indexed bonds. While the values of these securities are expected to be protected from long-term inflationary trends, short-term increases in inflation may lead to a decline in value. There can be no assurance that the CPI-U or any foreign inflation index will accurately measure the real rate of inflation, or that the rate of inflation in a foreign country will correlate to the rate of inflation in the United States. Additionally, if interest rates rise due to reasons other than inflation, investors in these securities may not be protected to the extent that the increase is not reflected in the bond’s inflation measure.
196
Table of Contents
Notes to Financial Statements (Continued)
Bank Loans
Certain of the Funds may invest in bank loans including, for example, corporate loans, loan participations, direct debt, bank debt, and bridge debt. A Fund may invest in a loan by lending money to a borrower directly as part of a syndicate of lenders. In a syndicated loan, the agent that originated and structured the loan typically administers and enforces the loan on behalf of the syndicate. Failure by the agent to fulfill its obligations may delay or adversely affect receipt of payment by a Fund. A Fund may also invest in loans through novations, assignments, and participation interests. In a novation, a Fund typically assumes all of the rights of a lending institution in a loan, including the right to receive payments of principal and interest and other amounts directly from the borrower and to enforce its rights as a lender directly against the borrower. When a Fund takes an assignment of a loan, the Fund acquires some or all of the interest of another lender (or assignee) in the loan. In such cases, the Fund may be required generally to rely upon the assignor to demand payment and enforce rights under the loan. If a Fund acquires a participation in the loan, the Fund purchases an indirect interest in a loan held by a third party and the Fund typically will have a contractual relationship only with the third party loan investor, not with the borrower. As a result, a Fund may have the right to receive payments of principal, interest, and any fees to which it is entitled only from the loan investor selling the participation and only upon receipt by such loan investor of such payments from the borrower. In such cases, a Fund assumes the credit risk of both the borrower and the loan investor selling the participation, and the Fund may be unable to realize some or all of the value of its interest in the loan in the event of the insolvency of the third party.
Changes in the financial condition of the borrower or economic conditions or other circumstances may reduce the capacity of the borrower to make principal and interest payments on such instruments and may lead to defaults. The value of any collateral securing a bank loan may decline after the Fund invests, and there is a risk that the value of the collateral may not be sufficient to cover the amount owed to the Fund.
At December 31, 2016, the Funds had no unfunded loan commitments.
Repurchase Agreements
Each Fund may enter into repurchase agreements with certain banks and broker-dealers whereby a Fund acquires a security for cash and obtains a simultaneous commitment from the seller to repurchase the security at an agreed upon price and date. A Fund, through its custodian, takes possession of the securities collateralizing the repurchase agreement in a segregated account. Repurchase agreements must be fully collateralized at all times, but involve some risk to a Fund if the other party should default on its obligation and the Fund is delayed or prevented from recovering the collateral, or if the Fund is required to return collateral to a borrower at a time when it may realize a loss on the investment of that collateral.
When-Issued, Delayed-Delivery, Forward Commitment, and To-Be-Announced Transactions
A Fund may enter into when-issued, delayed-delivery, forward commitment, or to-be-announced (“TBA”) transactions (collectively, the “Forward Transactions”) in order to lock in the purchase price of the underlying security, or in order to adjust the interest rate exposure of the Fund’s existing portfolio. In Forward Transactions, a Fund commits to purchase or sell particular securities, with payment and delivery to take place at a future date. In the case of TBA purchase commitments, the unit price and the estimated principal amount are established when the Fund enters into a commitment, with the actual principal amount being within a specified range of the estimate. Although a Fund does not typically pay for the securities in these types of transactions until they are delivered, it immediately assumes the risks of ownership, including the risk of price fluctuation. As a result, each of these types of transactions may create investment leverage in a Fund’s portfolio and increase the volatility of the Fund. If a Fund’s counterparty fails to deliver a security purchased in a Forward Transaction, there may be a loss, and the Fund may have missed an opportunity to make an alternative investment.
These securities are valued on the basis of valuations furnished by a pricing service, selected pursuant to procedures approved by the Trustees, which determines valuations taking into account appropriate factors such as institutional-size trading in similar groups of securities, yield, quality, coupon rate, maturity, type of issue, trading characteristics, and other market data. Securities for which no market quotation is available are valued at fair value in accordance with procedures approved by the Trustees. The Funds record on a daily basis the unrealized appreciation (depreciation) based upon changes in the values of these securities. When a
197
Table of Contents
Notes to Financial Statements (Continued)
Forward Transaction is closed, the Funds record a realized gain or loss equal to the difference between the value of the transaction at the time it was opened and the value of the transaction at the time it was closed.
Dollar Roll Transactions
A Fund may enter into dollar roll transactions, in which the Fund sells mortgage-backed securities for delivery in the current month and simultaneously contracts to purchase substantially similar securities on a specified future date from the same party. A Fund may invest in dollar rolls in order to benefit from anticipated changes in pricing for the mortgage-backed securities during the term of the transaction, or for the purpose of creating investment leverage. In a dollar roll, the securities that are to be purchased will be of the same type as the securities sold, but will be supported by different pools of mortgages.
Dollar rolls involve the risk that the Fund’s counterparty will be unable to deliver the mortgage-backed securities underlying the dollar roll at the fixed time. If the counterparty files for bankruptcy or becomes insolvent, a Fund’s use of the transaction proceeds may be restricted pending a determination by the counterparty or its representative, whether to enforce the Fund’s obligation to repurchase the securities. A Fund can incur a loss on a dollar roll transaction (either because its counterparty fails to perform or because the value of the mortgages subject to the transaction declines) and on the investments made by the Fund with the proceeds of the dollar roll transaction.
A Fund accounts for a dollar roll transaction as a purchase and sale whereby the difference in the sales price and purchase price of the security sold is recorded as a realized gain (loss). If certain criteria are met, these dollar roll transactions may be considered financing transactions, whereby the difference in the sales price and the future purchase price is recorded as an adjustment to interest income. Dollar roll transactions generally have the effect of creating leverage in a Fund’s portfolio.
Securities Lending
Each Fund may lend its securities; however, lending cannot exceed 33% of the total assets of the Fund taken at current value. The Funds’ securities lending activities are governed by a Securities Lending Agency Agreement (“Lending Agreement”) between each Fund and the lending agent (“agent”). The Lending Agreement authorizes the agent to lend qualifying U.S. and foreign securities held by a Fund to approved borrowers (each, a “Borrower”).
Each Fund expects that in connection with any securities on loan, the loan will be secured continuously by collateral consisting of cash or securities adjusted daily to have market value at least equal to the current market value of the securities loaned. The market value of the loaned securities is determined at the close of business of a Fund and any additional collateral is delivered to the Fund the next business day. The Funds bear the risk of loss with respect to the investment of cash collateral. As with other extensions of credit, the Funds may bear the risk of delay in recovery of the loaned securities or even loss of rights in the collateral should the Borrower of the securities fail financially. Pursuant to the Lending Agreement, the agent has provided indemnification to the Funds in the event of default by a borrower with respect to a loan. The Funds receive compensation for lending their securities in the form of a securities loan fee paid by the Borrower, as well as a share of the income earned on investment of the cash collateral received for the loaned securities. At December 31, 2016, the Funds’ collateral was equal to or greater than 100% of the market value of securities on loan.
Security loans can be terminated at the discretion of either the lending agent or the Fund and the related securities must be returned within the earlier of the standard trade settlement period for such securities or within three business days. For all Funds, all securities on loan are classified as common stock in the Fund’s Portfolio of Investments at December 31, 2016.
The Funds employ the agent to implement their securities lending program and the agent receives a fee from the Funds for its services. In addition, the Funds may be required to pay a rebate to the Borrower. Accordingly, a Fund’s compensation for lending its securities is reduced by any such fees or rebate paid to the securities lending agent or Borrower, respectively. For the year ended December 31, 2016, the Fund(s) earned securities lending net income as follows:
| Securities Lending Gross Income | Securities Lending Fees and Expenses | Securities Lending Net Income | ||||||||||
Foreign Fund | $ | 303,992 | $ | 61,470 | $ | 242,522 | ||||||
Global Fund | 48,760 | 10,107 | 38,653 | |||||||||
198
Table of Contents
Notes to Financial Statements (Continued)
| Securities Lending Gross Income | Securities Lending Fees and Expenses | Securities Lending Net Income | ||||||||||
International Equity Fund | $ | 48,618 | $ | 9,939 | $ | 38,679 | ||||||
Mid Cap Growth Fund | 294,101 | 59,327 | 234,774 | |||||||||
Small Cap Growth Equity Fund | 161,580 | 32,728 | 128,852 | |||||||||
Small Company Value Fund | 10,911 | 2,265 | 8,646 | |||||||||
Accounting for Investment Transactions
Investment transactions are accounted for on the trade date. Realized gains and losses on sales of investments and unrealized appreciation and depreciation of investments are computed by the specific identification cost method. Proceeds received from litigation, if any, are included in realized gains on investment transactions for any investments that are no longer held in the portfolio and as a reduction in cost for investments that continue to be held in the portfolio. Interest income, adjusted for amortization of discounts and premiums on debt securities, is earned from the settlement date and is recorded on the accrual basis. Dividend income and realized capital gain distributions are recorded on the ex-dividend date. Withholding taxes on foreign interest, dividends, and capital gains have been provided for in accordance with the applicable country’s tax rules and rates. Foreign dividend income is recorded on the ex-dividend date or as soon as practicable after the Fund determines the existence of a dividend declaration after exercising reasonable due diligence. Distributions received on securities that represent a return of capital or capital gain are recorded as a reduction of cost of investments and/or as a realized gain. The Funds determine the classification of distributions received as return of capital distributions or capital gain distributions.
Foreign Currency Translation
The books and records of the Funds are maintained in U.S. dollars. The market values of foreign currencies, foreign securities, and other assets and liabilities denominated in foreign currencies are translated into U.S. dollars at the mean of the buying and selling rates of such currencies against the U.S. dollar at the end of each business day. Purchases and sales of foreign securities and income and expense items are translated at the rates of exchange prevailing on the respective dates of such transactions. The Funds do not isolate that portion of the results of operations arising from changes in the exchange rates from that portion arising from changes in the market prices of securities. Net realized foreign currency gains and losses resulting from changes in exchange rates include foreign currency gains and losses between trade date and settlement date on investment securities transactions, foreign currency transactions, and the difference between the amounts of dividends or interest recorded on the books of the Funds and the amount actually received.
Allocation of Operating Activity
In maintaining the records for the Funds, the income and expense accounts are allocated daily to each class of shares. Investment income and loss, and unrealized and realized gains or losses are prorated among the classes of shares based on the relative net assets of each. Expenses are allocated to each class of shares depending on the nature of the expenditures. Administration and service fees, if any, which are directly attributable to a class of shares, are charged to that class’s operations. Expenses of a Fund not directly attributable to the operations of any specific class of shares of the Fund are prorated among the classes to which the expense relates based on relative net assets.
Foreign Securities
Each of the Foreign Fund and the International Equity Fund invests substantially all of its assets and the Global Fund invests a significant amount of its assets in foreign securities. The other Funds may also invest in foreign securities. Foreign securities, including American Depositary Receipts, are subject to additional risks compared to securities of U.S. issuers, including international trade, currency, political, regulatory, and diplomatic risks. In addition, fluctuations in currency exchange rates may adversely affect the values of foreign securities and the price of a Fund’s shares. Emerging markets securities are subject to greater risks than securities issued in developed foreign markets, including less liquidity, greater price volatility, higher relative rates of inflation, greater political, economic, and social instability, greater custody and operational risks, and greater volatility in currency exchange rates.
199
Table of Contents
Notes to Financial Statements (Continued)
Federal Income Tax
It is each Fund’s intent to continue to comply with the provisions of subchapter M of the Internal Revenue Code of 1986, as amended, applicable to a regulated investment company. Under such provisions, the Funds would not be subject to federal income taxes on their ordinary income and net realized capital gains to the extent they are distributed or deemed to have been distributed to their shareholders. Therefore, the Funds have not made any provision for federal income tax.
Dividends and Distributions to Shareholders
Dividends from net investment income and distributions of any net realized capital gains of each Fund are declared and paid annually and at other times as may be required to satisfy tax or regulatory requirements.
Distributions to shareholders are recorded on the ex-dividend date. Income and capital gain distributions are determined in accordance with income tax regulations, which may differ from generally accepted accounting principles. As a result, net investment income and net realized capital gains on investment transactions for a reporting period may differ significantly from distributions during such period.
| 3. | Advisory Fees and Other Transactions |
Investment Advisory Fees and Investment Subadvisers
MML Investment Advisers, LLC (“MML Advisers”), a wholly-owned subsidiary of MassMutual, serves as investment adviser to each Fund. Under the investment advisory agreements between MML Advisers and the Trust on behalf of each Fund, MML Advisers is responsible for providing investment management services for each Fund. In return for these services, MML Advisers receives advisory fees, based upon each Fund’s average daily net assets, at the annual rates shown in the following table.
MML Advisers has also entered into investment subadvisory agreements for each Fund with the unaffiliated investment subadviser(s) shown in the following table. MML Advisers pays a subadvisory fee to each of these subadvisers based upon the aggregate net assets under management which include (1) the average daily net assets of the specified Fund which it manages, and, if applicable, (2) the average daily net assets of all other Funds or accounts of MML Advisers or its affiliates for which the subadviser provides subadvisory services and which have substantially the same investment objective, policies, and investment strategies.
The Funds’ subadvisory fees are paid by MML Advisers out of the advisory fees.
Fund | Investment Advisory Fee | Investment Subadviser(s) | ||
Blue Chip Growth Fund | 0.75% on the first $400 million; and | T. Rowe Price Associates, Inc. | ||
| 0.70% on any excess over $400 million | ||||
Equity Income Fund | 0.75% on the first $500 million; and | T. Rowe Price Associates, Inc. | ||
| 0.70% on any excess over $500 million | ||||
Equity Index Fund | 0.10% on the first $500 million; and | Northern Trust Investments, Inc. | ||
| 0.08% on any excess over $500 million | ||||
Focused Equity Fund | 0.70% on the first $250 million; and | Harris Associates L.P. | ||
| 0.60% on any excess over $250 million | ||||
Foreign Fund | 0.89% on the first $500 million; and | Templeton Investment Counsel, LLC | ||
| 0.85% on any excess over $500 million | ||||
Fundamental Growth Fund | 0.62% on the first $250 million; and | Wellington Management Company LLP | ||
| 0.60% on any excess over $250 million | ||||
Fundamental Value Fund | 0.60% on the first $500 million; and | Wellington Management Company LLP | ||
| 0.575% on any excess over $500 million | ||||
Global Fund | 0.60% on the first $500 million; and | Massachusetts Financial Services Company | ||
| 0.55% on any excess over $500 million |
200
Table of Contents
Notes to Financial Statements (Continued)
Fund | Investment Advisory Fee | Investment Subadviser(s) | ||
Growth & Income Fund | 0.50% on the first $500 million; and | Massachusetts Financial Services Company | ||
| 0.475% on any excess over $500 million | ||||
Income & Growth Fund | 0.65% on the first $500 million; and | BlackRock Investment Management, LLC | ||
| 0.60% on any excess over $500 million | ||||
International Equity Fund | 0.80% on the first $250 million; and | Harris Associates L.P. | ||
| 0.75% on any excess over $250 million | ||||
Large Cap Growth Fund# | 0.65% on the first $500 million; and | Loomis, Sayles & Company, L.P. | ||
| 0.60% on any excess over $500 million | ||||
Managed Volatility Fund | 0.75% on the first $500 million; and | Gateway Investment Advisers, LLC | ||
| 0.70% on any excess over $500 million | ||||
Mid Cap Growth Fund | 0.77% on the first $500 million; and | T. Rowe Price Associates, Inc. | ||
| 0.75% on any excess over $500 million | ||||
Mid Cap Value Fund | 0.84% on the first $500 million; and | American Century Investment Management, Inc. | ||
| 0.80% on any excess over $500 million | ||||
Small Cap Growth Equity Fund* | 1.04% on the first $200 million; and | Wellington Management Company LLP | ||
| 1.00% on any excess over $200 million | ||||
Small Company Value Fund | 0.80% on the first $150 million; and | T. Rowe Price Associates, Inc. | ||
| 0.70% on any excess over $150 million | ||||
Small/Mid Cap Value Fund | 0.75% on the first $500 million; and | AllianceBernstein L.P. | ||
| 0.70% on any excess over $500 million | ||||
Total Return Bond Fund** | 0.40% on the first $500 million; and | Metropolitan West Asset Management, LLC | ||
| 0.38% on any excess over $500 million |
| # | Effective December 7, 2016, Loomis, Sayles & Company, L.P. replaced Rainier Investment Management, LLC as subadviser to the Fund. |
| * | Waddell & Reed Investment Management Company acted as co-subadviser to the Fund through April 24, 2016. |
| ** | Prior to June 1, 2016, the investment advisory fees were as follows: |
Fund | Investment Advisory Fee | |||
Total Return Bond Fund | 0.45% on the first $500 million; and | |||
| 0.43% on any excess over $500 million |
Administration Fees
For the Equity Index Fund, Focused Equity Fund, Fundamental Growth Fund, Fundamental Value Fund, Global Fund, International Equity Fund, Small Company Value Fund, and Total Return Bond Fund, under a separate Administrative and Shareholder Services Agreement between the Funds and MML Advisers, MML Advisers is obligated to provide all necessary administrative and shareholder services and bear some of the Fund specific administrative expenses. In return for these services, MML Advisers receives an administrative services fee based upon the average daily net assets of the applicable class of shares of the Funds, at the following annual rates:
| Class I | Class II | Class III | Service Class I | |||||||||||||
Equity Index Fund | 0.30% | 0.15% | None | 0.30% | ||||||||||||
Focused Equity Fund | N/A | 0.15% | N/A | 0.15% | ||||||||||||
Fundamental Growth Fund | N/A | 0.15% | N/A | 0.15% | ||||||||||||
Fundamental Value Fund | N/A | 0.15% | N/A | 0.15% | ||||||||||||
Global Fund | 0.15% | 0.15% | N/A | 0.15% | ||||||||||||
201
Table of Contents
Notes to Financial Statements (Continued)
| Class I | Class II | Class III | Service Class I | |||||||||
International Equity Fund | N/A | 0.15% | N/A | 0.15% | ||||||||
Small Company Value Fund | N/A | 0.15% | N/A | 0.15% | ||||||||
Total Return Bond Fund | N/A | 0.15% | N/A | 0.15% | ||||||||
Distribution and Service Fees
MML Distributors, LLC (the “Distributor”) acts as distributor to the Funds. Pursuant to a Distribution and Services Plan adopted by the Funds pursuant to Rule 12b-1 under the 1940 Act, Service Class shares and Service Class I shares of the Funds pay an annual fee of 0.25% of the average daily net asset value of Service Class shares and Service Class I shares. This fee, or a portion thereof, is paid to: (i) the Distributor for services provided and expenses incurred by it in connection with the distribution of Service Class shares or Service Class I shares, as applicable, of each Fund; and/or (ii) MassMutual for services provided and expenses incurred by it for purposes of maintaining or providing personal services to Service Class and Service Class I shareholders. The Distributor is a wholly-owned subsidiary of MassMutual.
Expense Caps and Waivers
MML Advisers agreed to cap the fees and expenses of the Funds noted below (other than extraordinary litigation and legal expenses, Acquired Fund Fees and Expenses#, interest expense, short sale dividend and loan expense, or other non-recurring or unusual expenses such as organizational expenses and shareholder meeting expenses) based upon the average daily net assets of the applicable class of shares of the Funds, as follows:
| Class II | Service Class I | |||||||
Fundamental Growth Fund* | 0.85% | 1.10% | ||||||
International Equity Fund* | 1.00% | 1.25% | ||||||
Total Return Bond Fund* | 0.60% | 0.85% | ||||||
| # | Acquired Fund Fees and Expenses are expenses borne indirectly by a Fund through investments in other pooled investment vehicles. |
| * | Expense caps in effect through April 30, 2017. |
MML Advisers contractually agreed to waive 0.05% of the advisory fee of the Total Return Bond Fund through May 31, 2016.
MML Advisers has agreed to voluntarily waive 0.05% of the advisory fee of the Small Company Value Fund. MML Advisers may amend or discontinue this waiver at any time without advance notice.
Effective June 1, 2016, MML Advisers has agreed to voluntarily waive 0.03% of the advisory fee of the Equity Income Fund through April 30, 2017. MML Advisers may amend or discontinue this waiver at any time without advance notice.
Expense caps and waiver amounts are reflected as a reduction of expenses on the Statements of Operations.
202
Table of Contents
Notes to Financial Statements (Continued)
Rebated Brokerage Commissions
The Funds listed below have entered into agreements with certain brokers whereby the brokers will rebate to the Funds, in cash, a portion of brokerage commissions. Rebated brokerage commissions are amounts earned by the Funds and are included with realized gain or loss on investment transactions presented in the Statements of Operations. For the year ended December 31, 2016, brokerage commissions rebated under these agreements were as follows:
| Rebated Commissions | ||||
Blue Chip Growth Fund | $ | 3,395 | ||
Equity Income Fund | 4,520 | |||
Foreign Fund | 810 | |||
Fundamental Growth Fund | 37 | |||
Fundamental Value Fund | 1,237 | |||
Global Fund | 1,200 | |||
Growth & Income Fund | 4,908 | |||
Income & Growth Fund | 441 | |||
Large Cap Growth Fund | 4,210 | |||
Managed Volatility Fund | 2,169 | |||
Mid Cap Growth Fund | 4,647 | |||
Small Cap Growth Equity Fund | 13,130 | |||
Small Company Value Fund | 1,904 | |||
Small/Mid Cap Value Fund | 34,470 | |||
Deferred Compensation
Trustees of the Funds who are not officers or employees of MassMutual may elect to defer receipt of their annual fees in accordance with terms of a Non-Qualified Deferred Compensation Plan. Amounts deferred shall accrue interest or earnings and shall be recorded on the Funds’ books as other liabilities. Deferred compensation is included within Trustees’ fees and expenses in the Statements of Assets and Liabilities.
Other
Certain officers and trustees of the Funds may also be employees of MassMutual. The compensation of a trustee who is not an employee of MassMutual is borne by the Funds.
| 4. | Purchases and Sales of Investments |
Cost of purchases and proceeds from sales of investment securities (excluding short-term investments) for the year ended December 31, 2016, were as follows:
| Purchases | Sales | |||||||||||||||
| Long-Term U.S. Government Securities | Other Long-Term Securities | Long-Term U.S. Government Securities | Other Long-Term Securities | |||||||||||||
Blue Chip Growth Fund | $ | - | $ | 114,861,086 | $ | - | $ | 170,174,457 | ||||||||
Equity Income Fund | - | 99,058,427 | - | 148,305,545 | ||||||||||||
Equity Index Fund | - | 96,825,859 | - | 38,227,805 | ||||||||||||
Focused Equity Fund | - | 51,059,676 | - | 79,860,282 | ||||||||||||
Foreign Fund | - | 73,418,363 | - | 64,740,946 | ||||||||||||
Fundamental Growth Fund | - | 86,098,225 | - | 105,532,141 | ||||||||||||
203
Table of Contents
Notes to Financial Statements (Continued)
| Purchases | Sales | |||||||||||||||
| Long-Term U.S. Government Securities | Other Long-Term Securities | Long-Term U.S. Government Securities | Other Long-Term Securities | |||||||||||||
Fundamental Value Fund | $ | - | $ | 46,256,524 | $ | - | $ | 60,480,783 | ||||||||
Global Fund | - | 36,007,405 | - | 53,467,152 | ||||||||||||
Growth & Income Fund | - | 21,107,276 | - | 29,637,011 | ||||||||||||
Income & Growth Fund | - | 73,826,061 | - | 73,970,560 | ||||||||||||
International Equity Fund | - | 77,759,119 | - | 99,410,419 | ||||||||||||
Large Cap Growth Fund | - | 235,855,866 | - | 343,535,078 | ||||||||||||
Managed Volatility Fund | - | 8,172,698 | - | 34,534,311 | ||||||||||||
Mid Cap Growth Fund | - | 117,300,174 | - | 155,610,303 | ||||||||||||
Mid Cap Value Fund | - | 243,850,682 | - | 315,681,152 | ||||||||||||
Small Cap Growth Equity Fund | - | 204,349,515 | - | 224,453,638 | ||||||||||||
Small Company Value Fund | - | 22,701,890 | - | 45,830,544 | ||||||||||||
Small/Mid Cap Value Fund | - | 124,538,408 | - | 155,260,234 | ||||||||||||
Total Return Bond Fund | 1,008,171,947 | 57,589,211 | 945,939,973 | 61,870,703 | ||||||||||||
| 5. | Capital Share Transactions |
Changes in shares outstanding for each Fund were as follows:
| Year Ended December 31, 2016 | Year Ended December 31, 2015 | |||||||||||||||
| Shares | Amount | Shares | Amount | |||||||||||||
Blue Chip Growth Fund Initial Class |
| |||||||||||||||
Sold | 1,829,690 | $ | 26,464,359 | 2,050,627 | $ | 35,000,186 | ||||||||||
Issued as reinvestment of dividends | 3,178,098 | 44,016,658 | 4,217,280 | 62,289,222 | ||||||||||||
Redeemed | (5,822,807 | ) | (84,697,374 | ) | (4,490,729 | ) | (78,848,927 | ) | ||||||||
|
|
|
|
|
|
|
| |||||||||
Net increase (decrease) | (815,019 | ) | $ | (14,216,357 | ) | 1,777,178 | $ | 18,440,481 | ||||||||
|
|
|
|
|
|
|
| |||||||||
Blue Chip Growth Fund Service Class |
| |||||||||||||||
Sold | 843,322 | $ | 11,915,061 | 700,855 | $ | 11,542,611 | ||||||||||
Issued as reinvestment of dividends | 408,070 | 5,513,029 | 425,902 | 6,171,321 | ||||||||||||
Redeemed | (516,842 | ) | (7,327,640 | ) | (264,136 | ) | (4,401,398 | ) | ||||||||
|
|
|
|
|
|
|
| |||||||||
Net increase (decrease) | 734,550 | $ | 10,100,450 | 862,621 | $ | 13,312,534 | ||||||||||
|
|
|
|
|
|
|
| |||||||||
Equity Income Fund Initial Class |
| |||||||||||||||
Sold | 1,822,027 | $ | 20,681,583 | 3,349,391 | $ | 43,038,102 | ||||||||||
Issued as reinvestment of dividends | 4,457,802 | 48,991,248 | 4,798,391 | 51,918,590 | ||||||||||||
Redeemed | (7,467,353 | ) | (84,435,481 | ) | (5,851,519 | ) | (76,038,084 | ) | ||||||||
|
|
|
|
|
|
|
| |||||||||
Net increase (decrease) | (1,187,524 | ) | $ | (14,762,650 | ) | 2,296,263 | $ | 18,918,608 | ||||||||
|
|
|
|
|
|
|
| |||||||||
Equity Income Fund Service Class |
| |||||||||||||||
Sold | 823,658 | $ | 9,374,307 | 801,621 | $ | 9,912,506 | ||||||||||
Issued as reinvestment of dividends | 746,940 | 8,141,646 | 699,148 | 7,508,847 | ||||||||||||
Redeemed | (570,439 | ) | (6,484,581 | ) | (461,419 | ) | (5,866,477 | ) | ||||||||
|
|
|
|
|
|
|
| |||||||||
Net increase (decrease) | 1,000,159 | $ | 11,031,372 | 1,039,350 | $ | 11,554,876 | ||||||||||
|
|
|
|
|
|
|
| |||||||||
Equity Index Fund Class I |
| |||||||||||||||
Sold | 195,781 | $ | 5,000,396 | 131,076 | $ | 3,326,839 | ||||||||||
Issued as reinvestment of dividends | 107,635 | 2,760,846 | 123,159 | 2,876,982 | ||||||||||||
Redeemed | (816,790 | ) | (20,848,027 | ) | (549,858 | ) | (13,987,453 | ) | ||||||||
|
|
|
|
|
|
|
| |||||||||
Net increase (decrease) | (513,374 | ) | $ | (13,086,785 | ) | (295,623 | ) | $ | (7,783,632 | ) | ||||||
|
|
|
|
|
|
|
| |||||||||
204
Table of Contents
Notes to Financial Statements (Continued)
| Year Ended December 31, 2016 | Year Ended December 31, 2015 | |||||||||||||||
| Shares | Amount | Shares | Amount | |||||||||||||
Equity Index Fund Class II |
| |||||||||||||||
Sold | 530,976 | $ | 13,600,841 | 1,052,550 | $ | 26,566,026 | ||||||||||
Issued as reinvestment of dividends | 273,077 | 7,004,425 | 241,782 | 5,652,856 | ||||||||||||
Redeemed | (828,193 | ) | (20,989,328 | ) | (691,685 | ) | (17,492,168 | ) | ||||||||
|
|
|
|
|
|
|
| |||||||||
Net increase (decrease) | (24,140 | ) | $ | (384,062 | ) | 602,647 | $ | 14,726,714 | ||||||||
|
|
|
|
|
|
|
| |||||||||
Equity Index Fund Class III |
| |||||||||||||||
Sold | 3,454,116 | $ | 91,463,486 | 866 | $ | 22,459 | ||||||||||
Issued as reinvestment of dividends | 302,119 | 7,740,287 | 298,056 | 6,959,599 | ||||||||||||
Redeemed | (178,330 | ) | (4,513,366 | ) | (106,824 | ) | (2,703,109 | ) | ||||||||
|
|
|
|
|
|
|
| |||||||||
Net increase (decrease) | 3,577,905 | $ | 94,690,407 | 192,098 | $ | 4,278,949 | ||||||||||
|
|
|
|
|
|
|
| |||||||||
Equity Index Fund Service Class I |
| |||||||||||||||
Sold | 171,504 | $ | 4,242,101 | 367,151 | $ | 9,082,505 | ||||||||||
Issued as reinvestment of dividends | 63,228 | 1,580,076 | 61,289 | 1,398,611 | ||||||||||||
Redeemed | (203,834 | ) | (4,947,697 | ) | (111,382 | ) | (2,742,801 | ) | ||||||||
|
|
|
|
|
|
|
| |||||||||
Net increase (decrease) | 30,898 | $ | 874,480 | 317,058 | $ | 7,738,315 | ||||||||||
|
|
|
|
|
|
|
| |||||||||
Focused Equity Fund Class II |
| |||||||||||||||
Sold | 842,595 | $ | 10,160,682 | 1,950,228 | $ | 29,160,625 | ||||||||||
Issued as reinvestment of dividends | 974,312 | 11,808,665 | 2,006,738 | 23,639,379 | ||||||||||||
Redeemed | (4,185,139 | ) | (52,228,414 | ) | (1,850,790 | ) | (27,653,542 | ) | ||||||||
|
|
|
|
|
|
|
| |||||||||
Net increase (decrease) | (2,368,232 | ) | $ | (30,259,067 | ) | 2,106,176 | $ | 25,146,462 | ||||||||
|
|
|
|
|
|
|
| |||||||||
Focused Equity Fund Service Class I |
| |||||||||||||||
Sold | 85,127 | $ | 1,035,236 | 152,134 | $ | 2,134,769 | ||||||||||
Issued as reinvestment of dividends | 40,044 | 482,130 | 86,342 | 1,010,197 | ||||||||||||
Redeemed | (186,584 | ) | (2,232,873 | ) | (115,281 | ) | (1,736,595 | ) | ||||||||
|
|
|
|
|
|
|
| |||||||||
Net increase (decrease) | (61,413 | ) | $ | (715,507 | ) | 123,195 | $ | 1,408,371 | ||||||||
|
|
|
|
|
|
|
| |||||||||
Foreign Fund Initial Class |
| |||||||||||||||
Sold | 4,766,959 | $ | 44,140,856 | 7,768,376 | $ | 81,258,787 | ||||||||||
Issued as reinvestment of dividends | 721,750 | 6,733,929 | 1,099,581 | 10,665,933 | ||||||||||||
Redeemed | (5,117,276 | ) | (47,134,979 | ) | (4,394,039 | ) | (46,071,249 | ) | ||||||||
|
|
|
|
|
|
|
| |||||||||
Net increase (decrease) | 371,433 | $ | 3,739,806 | 4,473,918 | $ | 45,853,471 | ||||||||||
|
|
|
|
|
|
|
| |||||||||
Foreign Fund Service Class |
| |||||||||||||||
Sold | 113,772 | $ | 1,038,692 | 224,140 | $ | 2,317,484 | ||||||||||
Issued as reinvestment of dividends | 20,806 | 193,084 | 33,446 | 322,750 | ||||||||||||
Redeemed | (252,633 | ) | (2,300,078 | ) | (140,636 | ) | (1,433,225 | ) | ||||||||
|
|
|
|
|
|
|
| |||||||||
Net increase (decrease) | (118,055 | ) | $ | (1,068,302 | ) | 116,950 | $ | 1,207,009 | ||||||||
|
|
|
|
|
|
|
| |||||||||
Fundamental Growth Fund Class II |
| |||||||||||||||
Sold | 1,199,321 | $ | 14,211,982 | 1,328,385 | $ | 18,826,700 | ||||||||||
Issued as reinvestment of dividends | 1,903,133 | 21,600,562 | 3,138,822 | 36,975,319 | ||||||||||||
Redeemed | (3,258,560 | ) | (38,379,284 | ) | (3,753,642 | ) | (54,749,345 | ) | ||||||||
|
|
|
|
|
|
|
| |||||||||
Net increase (decrease) | (156,106 | ) | $ | (2,566,740 | ) | 713,565 | $ | 1,052,674 | ||||||||
|
|
|
|
|
|
|
| |||||||||
Fundamental Growth Fund Service Class I |
| |||||||||||||||
Sold | 134,103 | $ | 1,564,543 | 81,440 | $ | 1,149,694 | ||||||||||
Issued as reinvestment of dividends | 38,353 | 430,695 | 48,130 | 562,161 | ||||||||||||
Redeemed | (32,918 | ) | (388,876 | ) | (41,054 | ) | (547,246 | ) | ||||||||
|
|
|
|
|
|
|
| |||||||||
Net increase (decrease) | 139,538 | $ | 1,606,362 | 88,516 | $ | 1,164,609 | ||||||||||
|
|
|
|
|
|
|
| |||||||||
205
Table of Contents
Notes to Financial Statements (Continued)
| Year Ended December 31, 2016 | Year Ended December 31, 2015 | |||||||||||||||
| Shares | Amount | Shares | Amount | |||||||||||||
Fundamental Value Fund Class II |
| |||||||||||||||
Sold | 2,062,479 | $ | 27,882,168 | 1,885,056 | $ | 29,843,976 | ||||||||||
Issued as reinvestment of dividends | 1,391,644 | 19,608,258 | 1,499,241 | 20,434,654 | ||||||||||||
Redeemed | (3,561,951 | ) | (51,188,268 | ) | (1,653,877 | ) | (25,697,093 | ) | ||||||||
|
|
|
|
|
|
|
| |||||||||
Net increase (decrease) | (107,828 | ) | $ | (3,697,842 | ) | 1,730,420 | $ | 24,581,537 | ||||||||
|
|
|
|
|
|
|
| |||||||||
Fundamental Value Fund Service Class I |
| |||||||||||||||
Sold | 171,789 | $ | 2,410,217 | 267,094 | $ | 3,957,337 | ||||||||||
Issued as reinvestment of dividends | 48,204 | 671,970 | 39,989 | 539,857 | ||||||||||||
Redeemed | (132,120 | ) | (1,868,524 | ) | (104,355 | ) | (1,613,745 | ) | ||||||||
|
|
|
|
|
|
|
| |||||||||
Net increase (decrease) | 87,873 | $ | 1,213,663 | 202,728 | $ | 2,883,449 | ||||||||||
|
|
|
|
|
|
|
| |||||||||
Global Fund Class I |
| |||||||||||||||
Sold | 2,598,743 | $ | 29,871,905 | 4,496,635 | $ | 57,265,309 | ||||||||||
Issued as reinvestment of dividends | 1,719,683 | 20,068,702 | 1,081,244 | 12,434,307 | ||||||||||||
Redeemed | (4,521,059 | ) | (53,115,062 | ) | (3,111,843 | ) | (40,045,880 | ) | ||||||||
|
|
|
|
|
|
|
| |||||||||
Net increase (decrease) | (202,633 | ) | $ | (3,174,455 | ) | 2,466,036 | $ | 29,653,736 | ||||||||
|
|
|
|
|
|
|
| |||||||||
Global Fund Class II |
| |||||||||||||||
Sold | 83,397 | $ | 996,780 | 47,470 | $ | 614,645 | ||||||||||
Issued as reinvestment of dividends | 115,847 | 1,376,262 | 77,044 | 900,642 | ||||||||||||
Redeemed | (188,416 | ) | (2,259,699 | ) | (158,619 | ) | (2,031,358 | ) | ||||||||
|
|
|
|
|
|
|
| |||||||||
Net increase (decrease) | 10,828 | $ | 113,343 | (34,105 | ) | $ | (516,071 | ) | ||||||||
|
|
|
|
|
|
|
| |||||||||
Global Fund Service Class I |
| |||||||||||||||
Sold | 288,887 | $ | 3,365,358 | 240,960 | $ | 2,974,186 | ||||||||||
Issued as reinvestment of dividends | 91,432 | 1,058,779 | 46,172 | 527,285 | ||||||||||||
Redeemed | (233,534 | ) | (2,653,374 | ) | (109,180 | ) | (1,373,250 | ) | ||||||||
|
|
|
|
|
|
|
| |||||||||
Net increase (decrease) | 146,785 | $ | 1,770,763 | 177,952 | $ | 2,128,221 | ||||||||||
|
|
|
|
|
|
|
| |||||||||
Growth & Income Fund Initial Class |
| |||||||||||||||
Sold | 83,218 | $ | 1,108,925 | 107,989 | $ | 1,438,084 | ||||||||||
Issued as reinvestment of dividends | 77,520 | 1,079,085 | 104,134 | 1,325,627 | ||||||||||||
Redeemed | (998,028 | ) | (13,418,679 | ) | (1,283,961 | ) | (17,198,074 | ) | ||||||||
|
|
|
|
|
|
|
| |||||||||
Net increase (decrease) | (837,290 | ) | $ | (11,230,669 | ) | (1,071,838 | ) | $ | (14,434,363 | ) | ||||||
|
|
|
|
|
|
|
| |||||||||
Growth & Income Fund Service Class |
| |||||||||||||||
Sold | 331,928 | $ | 4,463,523 | 179,282 | $ | 2,384,744 | ||||||||||
Issued as reinvestment of dividends | 12,363 | 171,221 | 15,067 | 190,746 | ||||||||||||
Redeemed | (133,828 | ) | (1,798,978 | ) | (192,689 | ) | (2,544,358 | ) | ||||||||
|
|
|
|
|
|
|
| |||||||||
Net increase (decrease) | 210,463 | $ | 2,835,766 | 1,660 | $ | 31,132 | ||||||||||
|
|
|
|
|
|
|
| |||||||||
Income & Growth Fund Initial Class |
| |||||||||||||||
Sold | 3,182,082 | $ | 34,660,334 | 2,092,475 | $ | 25,180,057 | ||||||||||
Issued as reinvestment of dividends | 2,288,205 | 25,307,549 | 1,736,757 | 18,426,994 | ||||||||||||
Redeemed | (3,264,374 | ) | (37,162,575 | ) | (2,959,410 | ) | (35,488,006 | ) | ||||||||
|
|
|
|
|
|
|
| |||||||||
Net increase (decrease) | 2,205,913 | $ | 22,805,308 | 869,822 | $ | 8,119,045 | ||||||||||
|
|
|
|
|
|
|
| |||||||||
206
Table of Contents
Notes to Financial Statements (Continued)
| Year Ended December 31, 2016 | Year Ended December 31, 2015 | |||||||||||||||
| Shares | Amount | Shares | Amount | |||||||||||||
Income & Growth Fund Service Class |
| |||||||||||||||
Sold | 371,022 | $ | 4,206,923 | 238,369 | $ | 2,815,280 | ||||||||||
Issued as reinvestment of dividends | 168,049 | 1,841,818 | 124,932 | 1,315,531 | ||||||||||||
Redeemed | (285,123 | ) | (3,271,760 | ) | (168,232 | ) | (1,986,854 | ) | ||||||||
|
|
|
|
|
|
|
| |||||||||
Net increase (decrease) | 253,948 | $ | 2,776,981 | 195,069 | $ | 2,143,957 | ||||||||||
|
|
|
|
|
|
|
| |||||||||
International Equity Fund Class II |
| |||||||||||||||
Sold | 1,971,894 | $ | 17,061,558 | 6,490,052 | $ | 62,903,390 | ||||||||||
Issued as reinvestment of dividends | 419,628 | 3,642,368 | 37,164 | 332,992 | ||||||||||||
Redeemed | (4,857,377 | ) | (43,062,552 | ) | (1,267,813 | ) | (12,071,785 | ) | ||||||||
|
|
|
|
|
|
|
| |||||||||
Net increase (decrease) | (2,465,855 | ) | $ | (22,358,626 | ) | 5,259,403 | $ | 51,164,597 | ||||||||
|
|
|
|
|
|
|
| |||||||||
International Equity Fund Service Class I |
| |||||||||||||||
Sold | 48,207 | $ | 424,819 | 149,566 | $ | 1,425,758 | ||||||||||
Issued as reinvestment of dividends | 2,580 | 22,321 | 258 | 2,305 | ||||||||||||
Redeemed | (108,685 | ) | (935,487 | ) | (9,716 | ) | (92,301 | ) | ||||||||
|
|
|
|
|
|
|
| |||||||||
Net increase (decrease) | (57,898 | ) | $ | (488,347 | ) | 140,108 | $ | 1,335,762 | ||||||||
|
|
|
|
|
|
|
| |||||||||
Large Cap Growth Fund Initial Class |
| |||||||||||||||
Sold | 1,278,788 | $ | 14,028,042 | 1,489,752 | $ | 20,105,961 | ||||||||||
Issued as reinvestment of dividends | 1,498,948 | 16,278,575 | 3,877,235 | 43,425,029 | ||||||||||||
Redeemed | (11,384,877 | ) | (123,856,300 | ) | (4,271,474 | ) | (60,263,375 | ) | ||||||||
|
|
|
|
|
|
|
| |||||||||
Net increase (decrease) | (8,607,141 | ) | $ | (93,549,683 | ) | 1,095,513 | $ | 3,267,615 | ||||||||
|
|
|
|
|
|
|
| |||||||||
Large Cap Growth Fund Service Class |
| |||||||||||||||
Sold | 81,402 | $ | 891,887 | 94,721 | $ | 1,212,549 | ||||||||||
Issued as reinvestment of dividends | 29,777 | 316,827 | 59,374 | 653,118 | ||||||||||||
Redeemed | (69,781 | ) | (749,495 | ) | (45,443 | ) | (561,141 | ) | ||||||||
|
|
|
|
|
|
|
| |||||||||
Net increase (decrease) | 41,398 | $ | 459,219 | 108,652 | $ | 1,304,526 | ||||||||||
|
|
|
|
|
|
|
| |||||||||
Managed Volatility Fund Initial Class |
| |||||||||||||||
Sold | 611,322 | $ | 7,531,963 | 490,598 | $ | 7,007,282 | ||||||||||
Issued as reinvestment of dividends | 2,741,867 | 31,583,234 | 223,684 | 3,096,226 | ||||||||||||
Redeemed | (1,816,708 | ) | (23,703,734 | ) | (13,214,384 | ) | (188,949,041 | ) | ||||||||
|
|
|
|
|
|
|
| |||||||||
Net increase (decrease) | 1,536,481 | $ | 15,411,463 | (12,500,102 | ) | $ | (178,845,533 | ) | ||||||||
|
|
|
|
|
|
|
| |||||||||
Managed Volatility Fund Service Class |
| |||||||||||||||
Sold | 205,968 | $ | 2,692,032 | 342,915 | $ | 4,861,141 | ||||||||||
Issued as reinvestment of dividends | 585,189 | 6,691,391 | 37,132 | 511,045 | ||||||||||||
Redeemed | (333,962 | ) | (4,391,787 | ) | (308,184 | ) | (4,368,659 | ) | ||||||||
|
|
|
|
|
|
|
| |||||||||
Net increase (decrease) | 457,195 | $ | 4,991,636 | 71,863 | $ | 1,003,527 | ||||||||||
|
|
|
|
|
|
|
| |||||||||
Mid Cap Growth Fund Initial Class |
| |||||||||||||||
Sold | 1,110,396 | $ | 16,404,679 | 1,563,833 | $ | 26,333,144 | ||||||||||
Issued as reinvestment of dividends | 3,283,291 | 47,049,556 | 2,842,206 | 42,547,818 | ||||||||||||
Redeemed | (4,029,757 | ) | (60,608,550 | ) | (3,176,630 | ) | (53,193,017 | ) | ||||||||
|
|
|
|
|
|
|
| |||||||||
Net increase (decrease) | 363,930 | $ | 2,845,685 | 1,229,409 | $ | 15,687,945 | ||||||||||
|
|
|
|
|
|
|
| |||||||||
207
Table of Contents
Notes to Financial Statements (Continued)
| Year Ended December 31, 2016 | Year Ended December 31, 2015 | |||||||||||||||
| Shares | Amount | Shares | Amount | |||||||||||||
Mid Cap Growth Fund Service Class |
| |||||||||||||||
Sold | 556,668 | $ | 8,058,126 | 735,303 | $ | 11,926,952 | ||||||||||
Issued as reinvestment of dividends | 666,919 | 9,296,846 | 494,271 | 7,241,068 | ||||||||||||
Redeemed | (533,707 | ) | (7,680,021 | ) | (315,754 | ) | (5,180,003 | ) | ||||||||
|
|
|
|
|
|
|
| |||||||||
Net increase (decrease) | 689,880 | $ | 9,674,951 | 913,820 | $ | 13,988,017 | ||||||||||
|
|
|
|
|
|
|
| |||||||||
Mid Cap Value Fund Initial Class |
| |||||||||||||||
Sold | 1,763,938 | $ | 19,370,422 | 2,446,808 | $ | 31,047,996 | ||||||||||
Issued as reinvestment of dividends | 4,436,936 | 48,717,562 | 6,996,182 | 72,480,445 | ||||||||||||
Redeemed | (9,309,783 | ) | (105,641,591 | ) | (5,101,145 | ) | (62,354,659 | ) | ||||||||
|
|
|
|
|
|
|
| |||||||||
Net increase (decrease) | (3,108,909 | ) | $ | (37,553,607 | ) | 4,341,845 | $ | 41,173,782 | ||||||||
|
|
|
|
|
|
|
| |||||||||
Mid Cap Value Fund Service Class |
| |||||||||||||||
Sold | 736,023 | $ | 8,348,539 | 468,251 | $ | 5,612,473 | ||||||||||
Issued as reinvestment of dividends | 400,965 | 4,346,455 | 503,193 | 5,152,695 | ||||||||||||
Redeemed | (444,687 | ) | (4,956,685 | ) | (178,011 | ) | (2,138,681 | ) | ||||||||
|
|
|
|
|
|
|
| |||||||||
Net increase (decrease) | 692,301 | $ | 7,738,309 | 793,433 | $ | 8,626,487 | ||||||||||
|
|
|
|
|
|
|
| |||||||||
Small Cap Growth Equity Fund Initial Class |
| |||||||||||||||
Sold | 816,707 | $ | 10,463,524 | 1,154,116 | $ | 17,387,574 | ||||||||||
Issued as reinvestment of dividends | 2,665,580 | 32,147,623 | 2,896,528 | 40,634,083 | ||||||||||||
Redeemed | (2,841,442 | ) | (36,327,899 | ) | (3,805,914 | ) | (68,130,431 | ) | ||||||||
|
|
|
|
|
|
|
| |||||||||
Net increase (decrease) | 640,845 | $ | 6,283,248 | 244,730 | $ | (10,108,774 | ) | |||||||||
|
|
|
|
|
|
|
| |||||||||
Small Cap Growth Equity Fund Service Class |
| |||||||||||||||
Sold | 125,182 | $ | 1,542,294 | 205,576 | $ | 3,075,237 | ||||||||||
Issued as reinvestment of dividends | 190,406 | 2,198,947 | 156,435 | 2,122,311 | ||||||||||||
Redeemed | (119,127 | ) | (1,432,928 | ) | (63,729 | ) | (1,060,919 | ) | ||||||||
|
|
|
|
|
|
|
| |||||||||
Net increase (decrease) | 196,461 | $ | 2,308,313 | 298,282 | $ | 4,136,629 | ||||||||||
|
|
|
|
|
|
|
| |||||||||
Small Company Value Fund Class II |
| |||||||||||||||
Sold | 314,449 | $ | 4,852,846 | 423,909 | $ | 7,077,697 | ||||||||||
Issued as reinvestment of dividends | 799,296 | 12,181,265 | 630,971 | 9,281,588 | ||||||||||||
Redeemed | (1,883,020 | ) | (29,995,687 | ) | (580,385 | ) | (9,810,197 | ) | ||||||||
|
|
|
|
|
|
|
| |||||||||
Net increase (decrease) | (769,275 | ) | $ | (12,961,576 | ) | 474,495 | $ | 6,549,088 | ||||||||
|
|
|
|
|
|
|
| |||||||||
Small Company Value Fund Service Class I |
| |||||||||||||||
Sold | 193,177 | $ | 2,982,699 | 135,867 | $ | 2,235,487 | ||||||||||
Issued as reinvestment of dividends | 107,235 | 1,597,806 | 78,252 | 1,129,172 | ||||||||||||
Redeemed | (124,129 | ) | (1,919,145 | ) | (91,945 | ) | (1,485,389 | ) | ||||||||
|
|
|
|
|
|
|
| |||||||||
Net increase (decrease) | 176,283 | $ | 2,661,360 | 122,174 | $ | 1,879,270 | ||||||||||
|
|
|
|
|
|
|
| |||||||||
Small/Mid Cap Value Fund Initial Class |
| |||||||||||||||
Sold | 1,016,666 | $ | 11,162,219 | 948,363 | $ | 12,302,868 | ||||||||||
Issued as reinvestment of dividends | 1,182,234 | 14,151,337 | 3,225,764 | 36,451,132 | ||||||||||||
Redeemed | (3,593,861 | ) | (43,329,832 | ) | (2,865,346 | ) | (40,334,518 | ) | ||||||||
|
|
|
|
|
|
|
| |||||||||
Net increase (decrease) | (1,394,961 | ) | $ | (18,016,276 | ) | 1,308,781 | $ | 8,419,482 | ||||||||
|
|
|
|
|
|
|
| |||||||||
208
Table of Contents
Notes to Financial Statements (Continued)
| Year Ended December 31, 2016 | Year Ended December 31, 2015 | |||||||||||||||
| Shares | Amount | Shares | Amount | |||||||||||||
Small/Mid Cap Value Fund Service Class |
| |||||||||||||||
Sold | 174,099 | $ | 2,111,665 | 208,211 | $ | 2,741,062 | ||||||||||
Issued as reinvestment of dividends | 95,585 | 1,135,556 | 247,494 | 2,776,882 | ||||||||||||
Redeemed | (193,927 | ) | (2,306,575 | ) | (101,380 | ) | (1,345,538 | ) | ||||||||
|
|
|
|
|
|
|
| |||||||||
Net increase (decrease) | 75,757 | $ | 940,646 | 354,325 | $ | 4,172,406 | ||||||||||
|
|
|
|
|
|
|
| |||||||||
Total Return Bond Fund Class II |
| |||||||||||||||
Sold | 9,918,042 | $ | 103,634,335 | 3,363,333 | $ | 35,396,133 | ||||||||||
Issued as reinvestment of dividends | 557,268 | 5,873,606 | 1,437,031 | 14,643,347 | ||||||||||||
Redeemed | (4,445,964 | ) | (46,473,766 | ) | (10,454,425 | ) | (110,926,318 | ) | ||||||||
|
|
|
|
|
|
|
| |||||||||
Net increase (decrease) | 6,029,346 | $ | 63,034,175 | (5,654,061 | ) | $ | (60,886,838 | ) | ||||||||
|
|
|
|
|
|
|
| |||||||||
Total Return Bond Fund Service Class I |
| |||||||||||||||
Sold | 723,394 | $ | 7,489,748 | 452,786 | $ | 4,709,307 | ||||||||||
Issued as reinvestment of dividends | 31,915 | 333,516 | 66,792 | 675,933 | ||||||||||||
Redeemed | (577,333 | ) | (5,957,325 | ) | (188,061 | ) | (1,968,965 | ) | ||||||||
|
|
|
|
|
|
|
| |||||||||
Net increase (decrease) | 177,976 | $ | 1,865,939 | 331,517 | $ | 3,416,275 | ||||||||||
|
|
|
|
|
|
|
| |||||||||
| 6. | Federal Income Tax Information |
At December 31, 2016, the cost of securities and the unrealized appreciation (depreciation) in the value of investments owned by the Fund(s), as computed on a federal income tax basis, were as follows:
| Federal Income Tax Cost | Tax Basis Unrealized Appreciation | Tax Basis Unrealized (Depreciation) | Net Unrealized Appreciation (Depreciation) | |||||||||||||
Blue Chip Growth Fund | $ | 266,169,755 | $ | 122,852,237 | $ | (7,319,526 | ) | $ | 115,532,711 | |||||||
Equity Income Fund | 386,546,006 | 114,957,581 | (11,084,177 | ) | 103,873,404 | |||||||||||
Equity Index Fund | 361,008,285 | 209,282,277 | (6,633,917 | ) | 202,648,360 | |||||||||||
Focused Equity Fund | 109,752,688 | 29,365,970 | (3,186,428 | ) | 26,179,542 | |||||||||||
Foreign Fund | 359,349,903 | 38,686,523 | (37,256,922 | ) | 1,429,601 | |||||||||||
Fundamental Growth Fund | 147,042,968 | 24,165,006 | (1,720,254 | ) | 22,444,752 | |||||||||||
Fundamental Value Fund | 182,058,361 | 59,524,172 | (7,910,067 | ) | 51,614,105 | |||||||||||
Global Fund | 217,540,168 | 38,522,113 | (6,516,206 | ) | 32,005,907 | |||||||||||
Growth & Income Fund | 90,795,389 | 37,105,896 | (1,889,394 | ) | 35,216,502 | |||||||||||
Income & Growth Fund | 225,982,773 | 55,818,953 | (3,528,807 | ) | 52,290,146 | |||||||||||
International Equity Fund | 153,580,122 | 6,425,712 | (8,461,808 | ) | (2,036,096 | ) | ||||||||||
Large Cap Growth Fund | 98,893,063 | 9,033,933 | (968,340 | ) | 8,065,593 | |||||||||||
Managed Volatility Fund | 159,153,379 | 35,868,344 | (7,398,826 | ) | 28,469,518 | |||||||||||
Mid Cap Growth Fund | 333,008,603 | 111,396,019 | (7,684,110 | ) | 103,711,909 | |||||||||||
Mid Cap Value Fund | 414,834,109 | 68,472,644 | (5,690,665 | ) | 62,781,979 | |||||||||||
Small Cap Growth Equity Fund | 203,131,845 | 26,282,633 | (8,184,788 | ) | 18,097,845 | |||||||||||
Small Company Value Fund | 78,314,853 | 30,361,967 | (1,204,093 | ) | 29,157,874 | |||||||||||
Small/Mid Cap Value Fund | 190,897,531 | 46,160,708 | (5,317,242 | ) | 40,843,466 | |||||||||||
Total Return Bond Fund | 464,203,288 | 3,909,898 | (9,516,856 | ) | (5,606,958 | ) | ||||||||||
Net capital loss carryforwards may be applied against any net realized taxable gains in succeeding years, subject to the carryforward period limitations, where applicable. On December 22, 2010, the Regulated Investment Company Modernization Act of 2010 (the “Modernization Act”) was signed by the President. The Modernization Act changed the capital loss carryforward rules as they relate to regulated investment companies. Capital losses generated in tax years beginning after the date of enactment may
209
Table of Contents
Notes to Financial Statements (Continued)
now be carried forward indefinitely, and retain the character of the original loss. Under pre-enactment law, capital losses could be carried forward for up to eight tax years as short-term capital losses. The provisions affecting the utilization of capital loss carryforwards under the Modernization Act also require the utilization of post-enactment losses prior to the utilization of pre-enactment losses.
At December 31, 2016, the following Fund(s) had available, for federal income tax purposes, pre-enactment unused capital losses:
| Expiring 2017 | Expiring 2018 | |||||||
Foreign Fund | $ | 5,029,961 | $ | 4,482,917 | ||||
Growth & Income Fund | 14,247,716 | - | ||||||
Net capital loss carryforwards for the Fund(s) shown in the table above are from pre-enactment years and are, therefore, subject to the eight-year carryforward period and possible expiration.
At December 31, 2016, the following Fund(s) had post-enactment accumulated capital loss carryforwards:
| Short Term Capital Loss Carryforward | Long term Capital Loss Carryforward | |||||||
Foreign Fund | $ | 419,005 | $ | 10,106,869 | ||||
Managed Volatility Fund | 4,898,382 | - | ||||||
International Equity Fund | 1,598,914 | 11,040,436 | ||||||
Total Return Bond Fund | 847,048 | - | ||||||
Net capital loss carryforwards for the Fund(s) shown in the above table are from post-enactment years and are, therefore, not subject to the eight-year carryforward period and possible expiration.
Generally accepted accounting principles in the United States of America require that only distributions in excess of tax basis earnings and profits be reported in the financial statements as a return of capital.
The tax character of distributions (including capital gain dividends, if any, designated pursuant to Section 852 of the Code) paid during the year ended December 31, 2016, was as follows:
| Ordinary Income | Long Term Capital Gain | Return of Capital | ||||||||||
Blue Chip Growth Fund | $ | 694,802 | $ | 48,834,885 | $ | - | ||||||
Equity Income Fund | 9,291,436 | 47,841,458 | - | |||||||||
Equity Index Fund | 8,411,169 | 10,674,465 | - | |||||||||
Focused Equity Fund | 2,825,171 | 9,465,624 | - | |||||||||
Foreign Fund | 6,927,013 | - | - | |||||||||
Fundamental Growth Fund | 1,183,093 | 20,848,164 | - | |||||||||
Fundamental Value Fund | 4,256,760 | 16,023,468 | - | |||||||||
Global Fund | 3,088,772 | 19,414,971 | - | |||||||||
Growth & Income Fund | 1,250,306 | - | - | |||||||||
Income & Growth Fund | 5,016,926 | 22,132,441 | - | |||||||||
International Equity Fund | 3,664,689 | - | - | |||||||||
Large Cap Growth Fund | 231,013 | 16,364,389 | - | |||||||||
Managed Volatility Fund | 3,180,298 | 35,094,327 | - | |||||||||
Mid Cap Growth Fund | 1,790,170 | 54,556,232 | - | |||||||||
Mid Cap Value Fund | 18,837,469 | 34,226,548 | - | |||||||||
Small Cap Growth Equity Fund | - | 34,346,570 | - | |||||||||
Small Company Value Fund | 604,802 | 13,174,269 | - | |||||||||
Small/Mid Cap Value Fund | 1,871,211 | 13,415,682 | - | |||||||||
Total Return Bond Fund | 6,207,122 | - | - | |||||||||
210
Table of Contents
Notes to Financial Statements (Continued)
The tax character of distributions (including capital gain dividends, if any, designated pursuant to Section 852 of the Code) paid during the year ended December 31, 2015, was as follows:
| Ordinary Income | Long Term Capital Gain | Return of Capital | ||||||||||
Blue Chip Growth Fund | $ | 127,622 | $ | 68,332,921 | $ | - | ||||||
Equity Income Fund | 10,497,374 | 48,930,063 | - | |||||||||
Equity Index Fund | 7,613,210 | 9,274,838 | - | |||||||||
Focused Equity Fund | 3,008,185 | 21,641,391 | - | |||||||||
Foreign Fund | 10,988,683 | - | - | |||||||||
Fundamental Growth Fund | 4,952,300 | 32,585,180 | - | |||||||||
Fundamental Value Fund | 3,558,038 | 17,416,473 | - | |||||||||
Global Fund | 3,587,393 | 10,274,841 | - | |||||||||
Growth & Income Fund | 1,516,373 | - | - | |||||||||
Income & Growth Fund | 4,599,970 | 15,142,555 | - | |||||||||
International Equity Fund | 335,297 | - | - | |||||||||
Large Cap Growth Fund | 8,119,837 | 35,958,310 | - | |||||||||
Managed Volatility Fund | 3,607,271 | - | - | |||||||||
Mid Cap Growth Fund | 1,921,136 | 47,867,750 | - | |||||||||
Mid Cap Value Fund | 27,961,974 | 49,671,166 | - | |||||||||
Small Cap Growth Equity Fund | 4,560,467 | 38,195,927 | - | |||||||||
Small Company Value Fund | 307,773 | 10,102,987 | - | |||||||||
Small/Mid Cap Value Fund | 6,813,552 | 32,414,462 | - | |||||||||
Total Return Bond Fund | 11,545,091 | 3,774,189 | - | |||||||||
The following Fund(s) have elected to pass through the foreign tax credit for the year ended December 31, 2016:
| Amount | ||||
Foreign Fund | $ | 632,455 | ||
International Equity Fund | 317,487 | |||
Capital accounts within the financial statements are periodically adjusted for permanent differences between book and tax accounting. These adjustments have no impact on net assets or the results of operations. Temporary book and tax accounting differences will reverse in subsequent periods. At December 31, 2016, temporary book and tax accounting differences were primarily attributable to investments in forward contracts, futures contracts, options contracts, premium amortization accruals, passive foreign investment companies, non-taxable dividends basis adjustments, the deferral of wash sale losses, and deferred Trustee compensation.
At December 31, 2016, the components of distributable earnings on a tax basis were as follows:
| Undistributed Ordinary Income | Undistributed Long Term Capital Gain (Capital Loss Carryover) | Other Temporary Differences | Unrealized Appreciation (Depreciation) | |||||||||||||
Blue Chip Growth Fund | $ | 17,808 | $ | 31,249,799 | $ | (50,979 | ) | $ | 115,532,743 | |||||||
Equity Income Fund | 11,628,514 | 32,345,971 | (78,673 | ) | 103,873,724 | |||||||||||
Equity Index Fund | 9,164,474 | 18,152,735 | (99,387 | ) | 202,648,360 | |||||||||||
Focused Equity Fund | 3,204,744 | 11,024,918 | (15,264 | ) | 26,179,542 | |||||||||||
Foreign Fund | 8,049,996 | (20,038,752 | ) | (56,235 | ) | 1,394,673 | ||||||||||
Fundamental Growth Fund | 1,392,041 | 14,042,026 | (19,751 | ) | 22,444,752 | |||||||||||
Fundamental Value Fund | 4,677,306 | 15,548,054 | (24,073 | ) | 51,610,103 | |||||||||||
211
Table of Contents
Notes to Financial Statements (Continued)
| Undistributed Ordinary Income | Undistributed Long Term Capital Gain (Capital Loss Carryover) | Other Temporary Differences | Unrealized Appreciation (Depreciation) | |||||||||||||
Global Fund | $ | 2,924,147 | $ | 18,100,319 | $ | (23,015 | ) | $ | 31,984,018 | |||||||
Growth & Income Fund | 1,301,691 | (14,247,716 | ) | (28,088 | ) | 35,216,502 | ||||||||||
Income & Growth Fund | 5,928,691 | 19,941,135 | (31,256 | ) | 52,289,972 | |||||||||||
International Equity Fund | 2,912,997 | (12,639,350 | ) | (8,547 | ) | (2,082,920 | ) | |||||||||
Large Cap Growth Fund | 5,221,196 | 22,755,665 | (25,374 | ) | 8,065,593 | |||||||||||
Managed Volatility Fund | 2,352,607 | (4,898,382 | ) | 650,323 | 28,244,010 | |||||||||||
Mid Cap Growth Fund | 2,177,025 | 41,973,718 | (58,260 | ) | 103,711,923 | |||||||||||
Mid Cap Value Fund | 12,221,631 | 23,631,517 | (71,527 | ) | 62,782,503 | |||||||||||
Small Cap Growth Equity Fund | 75,028 | 7,965,966 | (47,473 | ) | 18,097,559 | |||||||||||
Small Company Value Fund | 646,518 | 11,796,107 | (13,060 | ) | 29,157,874 | |||||||||||
Small/Mid Cap Value Fund | 1,443,012 | 12,912,946 | (34,434 | ) | 40,843,466 | |||||||||||
Total Return Bond Fund | 8,677,152 | (847,048 | ) | (39,946 | ) | (5,606,958 | ) | |||||||||
During the year ended December 31, 2016, the following amounts were reclassified due to permanent differences between book and tax accounting:
| Paid-in Capital | Accumulated Net Realized Gain (Loss) on Investments | Undistributed Net Investment Income (Loss) | ||||||||||
Blue Chip Growth Fund | $ | 232,757 | $ | (271,849 | ) | $ | 39,092 | |||||
Equity Income Fund | (67,020 | ) | 242,416 | (175,396 | ) | |||||||
Equity Index Fund | 409,777 | (890,682 | ) | 480,905 | ||||||||
Focused Equity Fund | 7 | - | (7 | ) | ||||||||
Foreign Fund | 17 | 218,339 | (218,356 | ) | ||||||||
Fundamental Growth Fund | 194,325 | (139,988 | ) | (54,337 | ) | |||||||
Fundamental Value Fund | 10 | 155,538 | (155,548 | ) | ||||||||
Global Fund | 9 | 119,553 | (119,562 | ) | ||||||||
Growth & Income Fund | 6 | 54,238 | (54,244 | ) | ||||||||
Income & Growth Fund | 13 | 3,484 | (3,497 | ) | ||||||||
International Equity Fund | 3 | (120,516 | ) | 120,513 | ||||||||
Large Cap Growth Fund | 10 | - | (10 | ) | ||||||||
Managed Volatility Fund | 199,007 | (593,766 | ) | 394,759 | ||||||||
Mid Cap Growth Fund | 19 | (775,251 | ) | 775,232 | ||||||||
Mid Cap Value Fund | (77 | ) | 635,370 | (635,293 | ) | |||||||
Small Cap Growth Equity Fund | (62,104 | ) | (46,315 | ) | 108,419 | |||||||
Small Company Value Fund | 5 | 11,217 | (11,222 | ) | ||||||||
Small/Mid Cap Value Fund | 10 | 44,696 | (44,706 | ) | ||||||||
Total Return Bond Fund | 17 | (2,213,205 | ) | 2,213,188 | ||||||||
212
Table of Contents
Notes to Financial Statements (Continued)
The Funds did not have any unrecognized tax benefits at December 31, 2016, nor were there any increases or decreases in unrecognized tax benefits for the year then ended. The Funds recognize interest and penalties, if any, related to unrecognized tax benefits as an income tax expense in the Statements of Operations. During the year ended December 31, 2016, the Funds did not incur any such interest or penalties. The Funds are subject to examination by U.S. federal and state tax authorities for returns filed for the prior three fiscal years, or the returns filed to date for Funds in existence for less than three years. Foreign taxes are provided for based on the Funds’ understanding of the tax rules and rates that exist in the foreign markets in which they invest.
| 7. | Indemnifications |
Under the Funds’ organizational documents, current and former Trustees and Officers are provided with specified rights to indemnification against liabilities arising in connection with the performance of their duties to the Funds, and shareholders are indemnified against personal liability for obligations of the Funds. In the normal course of business, the Funds may also enter into contracts that provide general indemnifications. The Funds’ maximum exposure under these arrangements is unknown as this would be dependent on future claims that may be made against the Funds. The risk of material loss from such claims is considered remote.
| 8. | Legal Proceedings |
On December 7, 2010, the Trust was named as a defendant and putative member of the proposed defendant class of shareholders named in an adversary proceeding brought by The Official Committee of Unsecured Creditors of Tribune Company (the “Official Committee”) in the U.S. Bankruptcy Court for the District of Delaware, in connection with Tribune Company’s Chapter 11 bankruptcy proceeding (In re Tribune Company). The proceeding relates to a leveraged buyout (“LBO”) transaction by which Tribune Company converted to a privately-held company in 2007, and the putative defendant class is comprised of beneficial owners of shares of Tribune Company who received proceeds (the “Proceeds”) of the LBO. The Official Committee seeks to recover payments of those Proceeds.
The potential amounts sought to be recovered from the Equity Income Fund and Equity Index Fund, plus interest and the Official Committee’s court costs, are approximately $4,562,800 and $207,706, respectively.
In addition, on June 2, 2011, the Equity Income Fund was named as a defendant in two closely related, parallel adversary proceedings brought in connection with the Tribune Company’s LBO by Deutsche Bank Trust Company Americas, in its capacity as successor indenture trustee for a certain series of Senior Notes, Law Debenture Trust Company of New York, in its capacity as successor indenture trustee for a certain series of Senior Notes, and Wilmington Trust Company, in its capacity as successor indenture trustee for the PHONES Notes (together, the “Plaintiffs”), one in the United States District Court for the District of Massachusetts and one in the United States District Court for the District of Connecticut. The Plaintiffs also seek to recover payments of the Proceeds.
The Funds cannot predict the outcome of these proceedings. Accordingly, the Funds have not accrued any amounts related to these proceedings. If the proceedings were to be decided in a manner adverse to the Funds, or if the Funds were to enter into a settlement agreement with the Official Committee or the Plaintiffs, as applicable, the payment of such judgment or settlement could potentially have a material adverse effect on the Funds’ net asset values depending on the net assets of each applicable Fund at the time of such judgment or settlement.
| 9. | Subsequent Events |
In preparation of these financial statements, management has evaluated the events and transactions subsequent to December 31, 2016, through the date when the financial statements were issued, and determined that there are no subsequent events or transactions that would require adjustments to or disclosures in the Funds’ financial statements other than those disclosed below.
Elaine A. Sarsynski resigned as a Trustee of the Trust effective as of February 1, 2017.
213
Table of Contents
Report of Independent Registered Public Accounting Firm
To the Board of Trustees of MML Series Investment Fund and Shareholders of MML Blue Chip Growth Fund, MML Equity Income Fund, MML Equity Index Fund, MML Focused Equity Fund, MML Foreign Fund, MML Fundamental Growth Fund, MML Fundamental Value Fund, MML Global Fund, MML Growth & Income Fund, MML Income & Growth Fund, MML International Equity Fund, MML Large Cap Growth Fund, MML Managed Volatility Fund, MML Mid Cap Growth Fund, MML Mid Cap Value Fund, MML Small Cap Growth Equity Fund, MML Small Company Value Fund, MML Small/Mid Cap Value Fund, and MML Total Return Bond Fund (collectively, the “Funds”):
We have audited the accompanying statements of assets and liabilities of the Funds, including the portfolios of investments, as of December 31, 2016, and the related statements of operations for the year then ended, the statements of changes in net assets for each of the two years in the period then ended, and the financial highlights for each of the periods presented. These financial statements and financial highlights are the responsibility of the Funds’ management. Our responsibility is to express an opinion on these financial statements and financial highlights based on our audits.
We conducted our audits in accordance with the standards of the Public Company Accounting Oversight Board (United States). Those standards require that we plan and perform the audit to obtain reasonable assurance about whether the financial statements and financial highlights are free of material misstatement. The Funds are not required to have, nor were we engaged to perform, an audit of their internal control over financial reporting. Our audits included consideration of internal control over financial reporting as a basis for designing audit procedures that are appropriate in the circumstances, but not for the purpose of expressing an opinion on the effectiveness of the Funds’ internal control over financial reporting. Accordingly, we express no such opinion. An audit also includes examining, on a test basis, evidence supporting the amounts and disclosures in the financial statements, assessing the accounting principles used and significant estimates made by management, as well as evaluating the overall financial statement presentation. Our procedures included confirmation of securities owned as of December 31, 2016, by correspondence with the custodian and brokers; when replies were not received from brokers, we performed other auditing procedures. We believe that our audits provide a reasonable basis for our opinion.
In our opinion, such financial statements and financial highlights referred to above present fairly, in all material respects, the financial position of each of the Funds as of December 31, 2016, the results of their operations for the year then ended, the changes in their net assets for each of the two years in the period then ended, and the financial highlights for each of the periods presented, in conformity with accounting principles generally accepted in the United States of America.
Deloitte & Touche LLP
Boston, Massachusetts
February 17, 2017
214
Table of Contents
Trustees and Officers (Unaudited)
The following table lists the Trust’s Trustees and Officers; their address and age; their position with the Trust; the length of time holding that position with the Trust; their principal occupation(s) during the past five years; the number of portfolios in the fund complex they oversee; and other directorships they hold in companies subject to registration or reporting requirements of the Securities Exchange Act of 1934 (generally called “public companies”) or in registered investment companies. The Trust’s Statements of Additional Information include additional information about the Trust’s Trustees and are available, without charge, upon request by calling 1-888-309-3539 or by writing MML Series Investment Fund, c/o Massachusetts Mutual Life Insurance Company, 100 Bright Meadow Blvd., Enfield, Connecticut 06082-1981, Attention: MassMutual U.S. Product and Marketing.
Disinterested Trustees
Name, Address*, and Age | Position(s) | Term of | Principal Occupation(s) | Number of Portfolios in Fund Complex Overseen by Trustee | Other Directorships Held by Trustee | |||||
Allan W. Blair Age: 68 | Trustee | Since 2003 | Retired; President and Chief Executive Officer (1996-2014), Economic Development Council of Western Massachusetts (non-profit development company); President and Chief Executive Officer (1984-2014), Westover Metropolitan Development Corporation (quasi-public development company). | 94 | Trustee (since 2003), MassMutual Select Funds (open-end investment company); Trustee (since 2012), MML Series Investment Fund II (open-end investment company); Trustee (since 2012), MassMutual Premier Funds (open-end investment company). | |||||
| Nabil N. El-Hage Age: 58 | Trustee | Since 2012
| Founder and sole member of PR Academy of Executive Education, LLC (since 2016); Chairman (2011-2016), Academy of Executive Education, LLC (predecessor to PR Academy of Executive Education, LLC). | 94 | Director (2011-2015), Argo Group International Holdings, Ltd. (underwriter of specialty insurance and reinsurance products); Trustee (since 2012), MassMutual Select Funds (open-end investment company); Trustee (since 2005), Chairman (2006-2012), MML Series Investment Fund II (open-end investment company); Trustee (since 2003), Chairman (2006-2012), MassMutual Premier Funds (open-end investment company). | |||||
| Maria D. Furman Age: 62 | Trustee | Since 2012 | Retired. | 94 | Trustee (since 2011), GMO Series Trust (open-end investment company); Trustee (since 2012), MassMutual Select Funds (open-end investment company); Trustee (since 2005), MML Series Investment Fund II (open-end investment company); Trustee (since 2004), MassMutual Premier Funds (open-end investment company). | |||||
R. Alan Hunter, Jr. Age: 70 | Chairperson
Trustee | Since 2016
Since 2003 | Retired. | 94 | Director (since 2007), Actuant Corporation (diversified industrial company); Chairperson (since 2016), Trustee (since 2003), MassMutual Select Funds (open-end investment company); Chairperson (since 2016), Trustee (since 2012), MML Series Investment Fund II (open-end investment company); Chairperson (since 2016), Trustee (since 2012), MassMutual Premier Funds (open-end investment company). | |||||
215
Table of Contents
Trustees and Officers (Unaudited) (Continued)
Name, Address*, and Age | Position(s) | Term of | Principal Occupation(s) | Number of Portfolios in Fund Complex Overseen by Trustee | Other Directorships | |||||
| C. Ann Merrifield Age: 65 | Trustee | Since 2012 | Retired; President and Chief Executive Officer (2012-2014), PathoGenetix (genomics company). | 94 | Director (since 2015), Juniper Pharmaceuticals Inc. (specialty pharmaceutical company); Director (since 2014), Flexion Therapeutics (specialty pharmaceutical company); Director (since 2014), InVivo Therapeutics (research and clinical-stage biomaterials and biotechnology company); Trustee (since 2012), MassMutual Select Funds (open-end investment company); Trustee (since 2005), MML Series Investment Fund II (open-end investment company); Trustee (since 2004), MassMutual Premier Funds (open-end investment company). | |||||
Susan B. Sweeney Age: 64 | Trustee | Since 2009 | Retired; Senior Vice President and Chief Investment Officer (2010-2014), Selective Insurance Group (property and casualty company). | 96^ | Trustee (since 2012), Barings Corporate Investors (closed-end investment company); Trustee (since 2012), Barings Participation Investors (closed-end investment company); Trustee (since 2009), MassMutual Select Funds (open-end investment company); Trustee (since 2012), MML Series Investment Fund II (open-end investment company); Trustee (since 2012), MassMutual Premier Funds (open-end investment company). | |||||
216
Table of Contents
Trustees and Officers (Unaudited) (Continued)
Interested Trustee
Name, Address*, and Age | Position(s) | Term of | Principal Occupation(s) | Number of Portfolios in Fund Complex Overseen by Trustee | Other Directorships | |||||
Robert E. Joyal^^ Age: 71 | Trustee | Since 2003 | Retired. | 96^ | Director (since 2013), Leucadia National Corporation (holding company); Director (since 2012), Ormat Technologies, Inc. (provider of alternative and renewable energy technology); Director (2006-2014), Jefferies Group LLC (investment bank); Trustee (since 2003), Barings Corporate Investors (closed-end investment company); Trustee (since 2003), Barings Participation Investors (closed-end investment company); Trustee (since 2003), MassMutual Select Funds (open-end investment company); Trustee (since 2012), MML Series Investment Fund II (open-end investment company); Trustee (since 2012), MassMutual Premier Funds (open-end investment company). |
Principal Officers who are Not Trustees
Name, Address*, and Age | Position(s) Held | Term of Office# and Length of Time Served | Principal Occupation(s) During Past 5 Years | Number of Portfolios in Fund Complex Overseen by Officer | ||||
| Michael C. Eldredge Age: 52 | Vice President | Since 2009 | Head of Asset Allocation Funds (since 2016), portfolio manager (2014-2016), Head of Investments (2014-2016), MML Advisers; Vice President (since 2008), MassMutual; Vice President (since 2009), MassMutual Select Funds (open-end investment company); Vice President (since 2009), MML Series Investment Fund II (open-end investment company); Vice President (since 2009), MassMutual Premier Funds (open-end investment company). | 94 | ||||
Andrew M. Goldberg Age: 50 | Vice President, Secretary, and Chief Legal Officer
Assistant Secretary
| Since 2008
(2001- | Assistant Vice President and Counsel (since 2004), MassMutual; Secretary (since 2015), Assistant Secretary (2013-2015), MML Advisers; Vice President, Secretary, and Chief Legal Officer (since 2008), Assistant Secretary (2001-2008), MassMutual Select Funds (open-end investment company); Vice President, Secretary, (formerly known as “Clerk”), and Chief Legal Officer (since 2008), Assistant Clerk (2005-2008), MML Series Investment Fund II (open-end investment company); Vice President, Secretary, (formerly known as “Clerk”), and Chief Legal Officer (since 2008), Assistant Clerk (2004-2008), MassMutual Premier Funds (open-end investment company). | 94 | ||||
Brian K. Haendiges Age: 56 | President Vice President
| Since 2016 (2014- | Vice President (since 2014), MML Advisers; Senior Vice President (since 2014), Vice President (2010-2014), MassMutual; Vice President (since 2014), MassMutual Select Funds (open-end investment company); President (since 2016), Vice President (2014-2016), MML Series Investment Fund II (open-end investment company); Vice President (since 2014), MassMutual Premier Funds (open-end investment company). | 94 | ||||
Renee Hitchcock Age: 46 | Chief Financial Officer and Treasurer
Assistant Treasurer | Since 2016
2007- | Assistant Vice President (since 2015), Director (2007-2015), MassMutual; Chief Financial Officer and Treasurer (since 2016), Assistant Treasurer (2007-2016), MassMutual Select Funds (open-end investment company); Chief Financial Officer and Treasurer (since 2016), Assistant Treasurer (2007-2016), MML Series Investment Fund II (open-end investment company); Chief Financial Officer and Treasurer (since 2016), Assistant Treasurer (2007-2016), MassMutual Premier Funds (open-end investment company). | 94 | ||||
217
Table of Contents
Trustees and Officers (Unaudited) (Continued)
Name, Address*, and Age | Position(s) Held | Term of Office# and Length of Time Served | Principal Occupation(s) During Past 5 Years | Number of Portfolios in Fund Complex Overseen by Officer | ||||
Douglas Steele Age: 41 | Vice President | Since 2016 | Head of Investment Due Diligence (since 2016), MML Advisers; Assistant Vice President (since 2013), Investment Director (2005-2013), MassMutual; Vice President (since 2016), MassMutual Select Funds (open-end investment company); Vice President (since 2016), MML Series Investment Fund II (open-end investment company); Vice President (since 2016), MassMutual Premier Funds (open-end investment company). | 94 | ||||
Philip S. Wellman Age: 52 | Vice President and Chief Compliance Officer | Since 2007 | Vice President and Chief Compliance Officer (since 2013), MML Advisers; Vice President, Associate General Counsel, and Chief Compliance Officer (Mutual Funds) (since 2014), Vice President, Associate General Counsel, and Chief Compliance Officer (Mutual Funds and Investment Advisory) (2008-2014), MassMutual; Vice President and Chief Compliance Officer (since 2007), MassMutual Select Funds (open-end investment company); Vice President and Chief Compliance Officer (since 2007), MML Series Investment Fund II (open-end investment company); Vice President and Chief Compliance Officer (since 2007), MassMutual Premier Funds (open-end investment company). | 94 | ||||
Eric H. Wietsma Age: 50 | Vice President | Since 2006 | Director and President (since 2013), MML Advisers; Senior Vice President (since 2010), MassMutual; President (since 2008), Vice President (2006-2008), MassMutual Select Funds (open-end investment company); Vice President (since 2006), MML Series Investment Fund II (open-end investment company); President (since 2008) Vice President (2006-2008), MassMutual Premier Funds (open-end investment company). | 94 | ||||
Tina Wilson Age: 46 | Vice President | Since 2016 | Vice President and Head of Investments (since 2016), MML Advisers; Senior Vice President (since 2014), Vice President (2009-2014), MassMutual; Vice President (since 2016), MassMutual Select Funds (open-end investment company); Vice President (since 2016), MML Series Investment Fund II (open-end investment company); Vice President (since 2016), MassMutual Premier Funds (open-end investment company). | 94 | ||||
| * | The address of each Trustee and Principal Officer is the same as that for the Trust; 100 Bright Meadow Blvd., Enfield, CT 06082-1981. |
| ** | Each Trustee of the Trust serves until the next meeting of shareholders called for the purpose of electing Trustees and until the election and qualification of his or her successor or until he or she dies, resigns, or is removed. Notwithstanding the foregoing, unless the Trustees determine that it is desirable and in the best interest of the Trust that an exception to the retirement policy of the Trust be made, a Trustee shall retire and cease to serve as a Trustee upon the conclusion of the calendar year in which such Trustee attains the age of seventy-two years. |
| The Chairperson is elected to hold such office for a term of three years or until their successor is elected and qualified to carry out the duties and responsibilities of their office, or until he or she retires, dies, resigns, is removed, or becomes disqualified. The Chairperson shall hold office at the pleasure of the Trustees. |
| ^ | Barings Participation Investors and Barings Corporate Investors are deemed to be a part of the Fund Complex, because they are managed by Barings LLC (formerly known as Babson Capital Management LLC), an affiliate of MML Advisers. |
| ^^ | Mr. Joyal is an “Interested Person,” as that term is defined in the 1940 Act, through his position as a director of Leucadia National Corporation, which controls Jefferies Group LLC, a broker-dealer that may execute portfolio transactions and/or engage in principal transactions with the Funds, other investment companies advised by MML Advisers or holding themselves out to investors as related companies for purposes of investment or investor services, or any other advisory accounts over which MML Advisers has brokerage placement discretion. |
| # | The President, Treasurer, and Secretary and such other officers as the Trustees may in their discretion from time to time elect are elected to hold such office until their successor is elected and qualified to carry out the duties and responsibilities of their office, or until he or she dies, resigns, is removed, or becomes disqualified. Each officer shall hold office at the pleasure of the Trustees. |
218
Table of Contents
Federal Tax Information (Unaudited)
For corporate shareholders, a portion of the ordinary dividends paid during the Fund(s)’ year ended December 31, 2016, qualified for the dividends received deduction, as follows:
| Dividends Received Deductions | ||||
Blue Chip Growth Fund | 100.00 | % | ||
Equity Income Fund | 100.00 | % | ||
Equity Index Fund | 100.00 | % | ||
Focused Equity Fund | 100.00 | % | ||
Fundamental Growth Fund | 100.00 | % | ||
Fundamental Value Fund | 100.00 | % | ||
Global Fund | 67.40 | % | ||
Growth & Income Fund | 100.00 | % | ||
Income & Growth Fund | 100.00 | % | ||
Large Cap Growth Fund | 100.00 | % | ||
Managed Volatility Fund | 100.00 | % | ||
Mid Cap Growth Fund | 100.00 | % | ||
Mid Cap Value Fund | 47.02 | % | ||
Small Company Value Fund | 100.00 | % | ||
Small/Mid Cap Value Fund | 100.00 | % | ||
Total Return Bond Fund | 0.36 | % | ||
For the year ended December 31, 2016, the following Fund(s) earned the following foreign sources of income:
| Amount | ||||
Foreign Fund | $ | 8,244,613 | ||
International Equity Fund | $ | 3,917,910 | ||
219
Table of Contents
A description of the policies and procedures that each Fund’s investment adviser and subadvisers use to vote proxies relating to the Fund’s portfolio securities is available, without charge, upon request, by calling 1-888-309-3539, and on the Securities and Exchange Commission’s (“SEC”) EDGAR database on its website at http://www.sec.gov.
Information regarding how the Funds voted proxies relating to portfolio securities during the most recent 12-month period ended June 30 is available, without charge, upon request, on the MassMutual website at http://www.massmutual.com/funds and on the SEC’s EDGAR database on its website at http://www.sec.gov.
The Funds file their complete schedule of portfolio holdings with the SEC for the first and third quarters of each fiscal year on Form N-Q. The Funds’ Forms N-Q are available on the SEC’s EDGAR database on its website at http://www.sec.gov and may be reviewed and copied at the SEC’s Public Reference Room in Washington D.C. Information on the operation of the SEC’s Public Reference Room may be obtained by calling 1-800-SEC-0330.
Trustees’ Approval of Investment Advisory Contracts
At their meeting in November 2016, the Trustees, including the Trustees who are not “interested persons” (as such term is defined in the 1940 Act) of the Trust, MML Advisers, or the subadvisers (the “Independent Trustees”), approved a new subadvisory agreement (“New Subadvisory Agreement”) with Loomis, Sayles & Company, L.P. (“Loomis Sayles”) for the Large Cap Growth Fund. In preparation for the meeting, the Trustees requested, and MML Advisers provided in advance, certain materials relevant to the consideration of the New Subadvisory Agreement. In all of their deliberations, the Trustees were advised by independent counsel.
In reviewing the New Subadvisory Agreement, the Independent Trustees discussed with MML Advisers and considered a wide range of information about, among other things: (i) Loomis Sayles and its respective personnel with responsibilities for providing services to the Large Cap Growth Fund; (ii) the terms of the New Subadvisory Agreement; (iii) the scope and quality of services that Loomis Sayles will provide under the New Subadvisory Agreement; (iv) the historical investment performance track record of Loomis Sayles; and (v) the fees payable to Looms Sayles by MML Advisers for the Large Cap Growth Fund and the effect of such fees on the profitability to MML Advisers.
Prior to the votes being taken to approve the New Subadvisory Agreement, the Independent Trustees met separately in executive session to discuss the appropriateness of such contract. The Independent Trustees weighed the foregoing matters in light of the advice given to them by their independent legal counsel as to the law applicable to the review of investment advisory contracts. In arriving at a decision, the Trustees, including the Independent Trustees, did not identify any single matter as all-important or controlling. The foregoing summary does not detail all of the matters considered.
Based on the foregoing, the Trustees concluded that: (i) overall, they were satisfied with the nature, extent, and quality of services expected to be provided under the New Subadvisory Agreement; (ii) MML Advisers’ projected level of profitability due to the New Subadvisory Agreement was not excessive and the subadvisory fee amount under the New Subadvisory Agreement is fair and reasonable; (iii) the investment processes, research capabilities, and philosophies of Loomis Sayles appear well suited to the Large Cap Growth Fund, given its investment objectives and policies; and (iv) the terms of the New Subadvisory Agreement are fair and reasonable with respect to the Large Cap Growth Fund and are in the best interests of the Large Cap Growth Fund’s shareholders. After carefully considering the information summarized above, the Trustees, including the Independent Trustees voting separately, unanimously voted to approve the New Subadvisory Agreement.
The New Subadvisory Agreement became effective on December 7, 2016.
At their meeting in November 2016, the Trustees, including the Independent Trustees, also approved renegotiated subadvisory agreements with T. Rowe Price Associates, Inc. (“T. Rowe Price”) for the Blue Chip Growth Fund, Equity Income Fund, Mid Cap Growth Fund, and Small Company Value Fund, each of which is based on the new form of subadvisory agreement previously
220
Table of Contents
Other Information (Unaudited) (Continued)
presented to the Trustees (“Renegotiated Subadvisory Agreements”). In preparation for the meeting, the Trustees requested, and MML Advisers provided in advance, certain materials relevant to the consideration of the Renegotiated Subadvisory Agreements. In all of their deliberations, the Trustees were advised by independent counsel.
In reviewing the Renegotiated Subadvisory Agreements, the Trustees discussed with MML Advisers and considered a wide range of information about, among other things: (i) T. Rowe Price and its personnel with responsibilities for providing services to the Blue Chip Growth Fund, Equity Income Fund, Mid Cap Growth Fund, and Small Company Value Fund; (ii) the terms of the Renegotiated Subadvisory Agreements; and (iii) the scope and quality of services that T. Rowe Price will provide under the Renegotiated Subadvisory Agreements.
Prior to the votes being taken to approve the Renegotiated Subadvisory Agreements, the Independent Trustees met separately in executive session to discuss the appropriateness of such contracts. The Independent Trustees weighed the foregoing matters in light of the advice given to them by their independent legal counsel as to the law applicable to the review of investment advisory contracts. In arriving at a decision, the Trustees, including the Independent Trustees, did not identify any single matter as all-important or controlling. The foregoing summary does not detail all of the matters considered.
Based on the foregoing, the Trustees concluded that: (i) overall, they were satisfied with the nature, extent, and quality of services expected to be provided under the Renegotiated Subadvisory Agreements, including the anticipated level of MML Advisers’ oversight of the Blue Chip Growth Fund, Equity Income Fund, Mid Cap Growth Fund, and Small Company Value Fund and the subadvisory process; and (ii) the terms of the Renegotiated Subadvisory Agreement are fair and reasonable with respect to the Blue Chip Growth Fund, Equity Income Fund, Mid Cap Growth Fund, and Small Company Value Fund and are in the best interest of the Funds’ shareholders. After carefully considering the information summarized above, the Trustees, including the Independent Trustees voting separately, unanimously voted to approve the Renegotiated Subadvisory Agreements.
221
Table of Contents
Other Information (Unaudited) (Continued)
Fund Expenses December 31, 2016
Expense Examples:
The following information is in regards to expenses for the six months ended December 31, 2016:
As a shareholder of the Funds, you incur ongoing costs, including advisory fees, distribution and/or service (12b-1) fees, and other Fund expenses. These examples are intended to help you understand your ongoing costs (in dollars) of investing in the Funds and to compare these costs with the ongoing costs of investing in other mutual funds. These examples are based on an investment of $1,000 invested for the six months ended December 31, 2016.
Actual Expenses:
The first four columns of the table below provide information about actual account values and actual expenses. You may use this information, together with the amount you invested, to estimate the expenses that you paid over the period. Simply divide your account value by $1,000 (for example, an $8,600 account value divided by $1,000 = 8.6), then multiply the result by the number under the heading entitled “Operating Expenses Incurred” to estimate the expenses you paid on your account during this period.
Hypothetical Example for Comparison Purposes:
The last two columns of the table below provide information about hypothetical account values and hypothetical expenses based on the Fund’s actual expense ratio and an assumed rate of return of 5% per year before expenses, which is not the Fund’s actual return. The hypothetical account values and expenses may not be used to estimate the actual ending account balance or expenses you paid for the period. You may use this information to compare the ongoing costs of investing in the Fund and other funds. To do so, compare this 5% hypothetical example with the 5% hypothetical examples that appear in the shareholder reports of the other funds.
Please note that the expenses shown in the table are meant to highlight your ongoing costs only and do not reflect any transactional costs. Therefore, the last two columns of the table are useful in comparing ongoing costs only, and will not help you determine the relative total costs of owning different funds. In addition, if these transactional costs were included, your costs would have been higher.
| Beginning Value | Annualized Expense Ratio | Ending Value (Based on Actual Returns and Expenses) | Operating Expenses Incurred* | Ending Value (Based on Hypothetical Returns and Expenses) | Operating Expenses Incurred* | |||||||||||||||||||
| Blue Chip Growth Fund | ||||||||||||||||||||||||
Initial Class | $ | 1,000 | 0.79 | % | $ | 1,071.50 | $ | 4.11 | $ | 1,021.20 | $ | 4.01 | ||||||||||||
Service Class | 1,000 | 1.04 | % | 1,069.40 | 5.41 | 1,019.90 | 5.28 | |||||||||||||||||
| Equity Income Fund | ||||||||||||||||||||||||
Initial Class | 1,000 | 0.75 | % | 1,116.60 | 3.99 | 1,021.40 | 3.81 | |||||||||||||||||
Service Class | 1,000 | 1.00 | % | 1,115.90 | 5.32 | 1,020.10 | 5.08 | |||||||||||||||||
| Equity Index Fund | ||||||||||||||||||||||||
Class I | 1,000 | 0.43 | % | 1,075.70 | 2.24 | 1,023.00 | 2.19 | |||||||||||||||||
Class II | 1,000 | 0.28 | % | 1,076.70 | 1.46 | 1,023.70 | 1.42 | |||||||||||||||||
Class III | 1,000 | 0.13 | % | 1,076.50 | 0.68 | 1,024.50 | 0.66 | |||||||||||||||||
Service Class I | 1,000 | 0.68 | % | 1,074.10 | 3.55 | 1,021.70 | 3.46 | |||||||||||||||||
| Focused Equity Fund | ||||||||||||||||||||||||
Class II | 1,000 | 0.90 | % | 1,198.40 | 4.97 | 1,020.60 | 4.57 | |||||||||||||||||
Service Class I | 1,000 | 1.15 | % | 1,197.30 | 6.35 | 1,019.40 | 5.84 | |||||||||||||||||
222
Table of Contents
Other Information (Unaudited) (Continued)
| Beginning Value | Annualized Expense Ratio | Ending Value (Based on Actual Returns and Expenses) | Operating Expenses Incurred* | Ending Value (Based on Hypothetical Returns and Expenses) | Operating Expenses Incurred* | |||||||||||||||||||
Foreign Fund | ||||||||||||||||||||||||
Initial Class | $ | 1,000 | 0.97 | % | $ | 1,075.60 | $ | 5.06 | $ | 1,020.30 | $ | 4.93 | ||||||||||||
Service Class | 1,000 | 1.22 | % | 1,074.50 | 6.36 | 1,019.00 | 6.19 | |||||||||||||||||
Fundamental Growth Fund | ||||||||||||||||||||||||
Class II | 1,000 | 0.83 | % | 1,039.00 | 4.25 | 1,021.00 | 4.22 | |||||||||||||||||
Service Class I | 1,000 | 1.08 | % | 1,037.90 | 5.53 | 1,019.70 | 5.48 | |||||||||||||||||
Fundamental Value Fund | ||||||||||||||||||||||||
Class II | 1,000 | 0.79 | % | 1,090.30 | 4.15 | 1,021.20 | 4.01 | |||||||||||||||||
Service Class I | 1,000 | 1.04 | % | 1,089.40 | 5.46 | 1,019.90 | 5.28 | |||||||||||||||||
Global Fund | ||||||||||||||||||||||||
Class I | 1,000 | 0.82 | % | 1,046.10 | 4.22 | 1,021.00 | 4.17 | |||||||||||||||||
Class II | 1,000 | 0.82 | % | 1,045.60 | 4.22 | 1,021.00 | 4.17 | |||||||||||||||||
Service Class I | 1,000 | 1.07 | % | 1,044.70 | 5.50 | 1,019.80 | 5.43 | |||||||||||||||||
Growth & Income Fund | ||||||||||||||||||||||||
Initial Class | 1,000 | 0.55 | % | 1,069.10 | 2.86 | 1,022.40 | 2.80 | |||||||||||||||||
Service Class | 1,000 | 0.80 | % | 1,067.90 | 4.16 | 1,021.10 | 4.06 | |||||||||||||||||
Income & Growth Fund | ||||||||||||||||||||||||
Initial Class | 1,000 | 0.69 | % | 1,109.30 | 3.66 | 1,021.70 | 3.51 | |||||||||||||||||
Service Class | 1,000 | 0.94 | % | 1,107.80 | 4.98 | 1,020.40 | 4.77 | |||||||||||||||||
International Equity Fund | ||||||||||||||||||||||||
Class II | 1,000 | 1.00 | % | 1,198.30 | 5.53 | 1,020.10 | 5.08 | |||||||||||||||||
Service Class I | 1,000 | 1.25 | % | 1,196.90 | 6.90 | 1,018.90 | 6.34 | |||||||||||||||||
Large Cap Growth Fund | ||||||||||||||||||||||||
Initial Class | 1,000 | 0.69 | % | 1,029.60 | 3.52 | 1,021.70 | 3.51 | |||||||||||||||||
Service Class | 1,000 | 0.95 | % | 1,028.90 | 4.84 | 1,020.40 | 4.82 | |||||||||||||||||
Managed Volatility Fund | ||||||||||||||||||||||||
Initial Class | 1,000 | 0.91 | % | 1,031.90 | 4.65 | 1,020.60 | 4.62 | |||||||||||||||||
Service Class | 1,000 | 1.16 | % | 1,030.60 | 5.92 | 1,019.30 | 5.89 | |||||||||||||||||
Mid Cap Growth Fund | ||||||||||||||||||||||||
Initial Class | 1,000 | 0.81 | % | 1,047.30 | 4.17 | 1,021.10 | 4.12 | |||||||||||||||||
Service Class | 1,000 | 1.06 | % | 1,046.40 | 5.45 | 1,019.80 | 5.38 | |||||||||||||||||
Mid Cap Value Fund | ||||||||||||||||||||||||
Initial Class | 1,000 | 0.88 | % | 1,112.20 | 4.67 | 1,020.70 | 4.47 | |||||||||||||||||
Service Class | 1,000 | 1.13 | % | 1,110.40 | 5.99 | 1,019.50 | 5.74 | |||||||||||||||||
Small Cap Growth Equity Fund | ||||||||||||||||||||||||
Initial Class | 1,000 | 1.10 | % | 1,128.80 | 5.89 | 1,019.60 | 5.58 | |||||||||||||||||
Service Class | 1,000 | 1.35 | % | 1,127.40 | 7.22 | 1,018.30 | 6.85 | |||||||||||||||||
Small Company Value Fund | ||||||||||||||||||||||||
Class II | 1,000 | 0.96 | % | 1,214.40 | 5.34 | 1,020.30 | 4.88 | |||||||||||||||||
Service Class I | 1,000 | 1.21 | % | 1,212.70 | 6.73 | 1,019.10 | 6.14 | |||||||||||||||||
Small/Mid Cap Value Fund | ||||||||||||||||||||||||
Initial Class | 1,000 | 0.79 | % | 1,187.10 | 4.34 | 1,021.20 | 4.01 | |||||||||||||||||
Service Class | 1,000 | 1.04 | % | 1,186.10 | 5.71 | 1,019.90 | 5.28 | |||||||||||||||||
Total Return Bond Fund | ||||||||||||||||||||||||
Class II | 1,000 | 0.60 | % | 981.00 | 2.99 | 1,022.10 | 3.05 | |||||||||||||||||
Service Class I | 1,000 | 0.85 | % | 979.40 | 4.23 | 1,020.90 | 4.32 | |||||||||||||||||
| * | Expenses are calculated using the annualized expense ratio for the six months ended December 31, 2016, multiplied by the average account value over the period, multiplied by 184 days in the period, divided by 366 days in the year, unless stated otherwise. The annualized expense ratio does not reflect expenses deducted under the variable life insurance or variable annuity contract through which the Funds are invested in. Inclusion of these expenses would increase the annualized expense ratios shown. |
223
Table of Contents
Underwriter: MML Distributors, LLC 100 Bright Meadow Blvd. Enfield, CT 06082-1981 |  |
![]()
© 2017 Massachusetts Mutual Life Insurance Company, Springfield, MA. All rights reserved. www.massmutual.com. MassMutual Financial Group is a marketing name for Massachusetts Mutual Life Insurance Company (MassMutual) and its affiliated companies and sales representatives. Investment Adviser: MML Investment Advisers, LLC | RS-41633-01 |
Table of Contents
Item 2. Code of Ethics.
As of December 31, 2016, the Registrant adopted a Code of Ethics that applies to the Principal Executive Officer and Principal Financial Officer pursuant to the Sarbanes-Oxley Act of 2002. For the year ended December 31, 2016, there were no reportable amendments to a provision of the Code of Ethics. A copy of its Code of Ethics is filed with this Form N-CSR under Item 12(a)(1).
Item 3. Audit Committee Financial Expert.
The Registrant’s Board of Trustees has determined that Susan B. Sweeney and Nabil N. El-Hage, both members of the Audit Committee, are audit committee financial experts as defined by the Securities and Exchange Commission (the “SEC”). Ms. Sweeney and Mr. El-Hage are both “independent” as defined by the SEC for purposes of audit committee financial expert determinations.
Item 4. Principal Accountant Fees and Services.
References below to Deloitte & Touche LLP include its affiliates where applicable.
| (a) | AUDIT FEES: The aggregate fees billed to the Registrant for professional services rendered by its independent auditors, Deloitte & Touche LLP, for the audit of the Registrant’s annual financial statements for the fiscal years ended 2016 and 2015 were $796,850.64 and $1,038,764, respectively. |
| (b) | AUDIT RELATED FEES: No such fees were billed to the Registrant by Deloitte & Touche LLP for the fiscal years ended 2016 and 2015. No such fees were billed to the Registrant’s adviser and any entity controlling, controlled by, or under common control with the adviser that provides ongoing services to the Registrant by Deloitte & Touche LLP* for the fiscal years ended 2016 and 2015. |
| (c) | TAX FEES: The aggregate fees billed to the Registrant for professional services rendered by Deloitte & Touche LLP for the review of Form 1120-RIC, Form 8613, excise distribution projections, distribution calculation and reasonable out of pocket expenses for the fiscal years ended 2016 and 2015 were $128,347 and $126,364, respectively. No such fees were billed to the Registrant’s adviser and any entity controlling, controlled by, or under common control with the adviser that provides ongoing services to the Registrant by Deloitte & Touche LLP* for the fiscal years ended 2016 and 2015. |
| (d) | ALL OTHER FEES: No such fees were billed to the Registrant by Deloitte & Touche LLP for the fiscal years ended 2016 and 2015. No such fees were billed to the Registrant’s adviser and any entity controlling, controlled by, or under common control with the adviser that provides ongoing services to the Registrant by Deloitte & Touche LLP* for the fiscal years ended 2016 and 2015. |
| (e) | (1) AUDIT COMMITTEE PRE-APPOVAL POLICY: All services to be performed for the Registrant by Deloitte & Touche LLP must be pre-approved by the audit committee. All services performed during the fiscal years ended 2016 and 2015 were pre-approved by the committee. |
(2) Not applicable.
| (f) | Not applicable. |
| (g) | The aggregate non-audit fees billed by Deloitte & Touche LLP for services rendered to the Registrant, the Registrant’s adviser and any entity controlling, controlled by, or under common control with the adviser that provides ongoing services to the Registrant, for the fiscal years ended 2016 and 2015 were $7,296,695 and $732,859, respectively. |
| (h) | The audit committee considers whether the provision of non-audit services by Deloitte & Touche LLP to the Registrant’s adviser and any entity controlling, controlled by, or under common control with the adviser that provides ongoing services to the Registrant that were not pre-approved pursuant to paragraph (c)(7)(ii) of Rule 2-01 of Regulation S-X is compatible with maintaining Deloitte & Touche LLP’s independence. |
| * | Refers to fees that were required to be approved by the audit committee for services that relate directly to the operations and financial reporting of the Registrant. |
Table of Contents
Item 5. Audit Committee of Listed Registrants.
Not applicable to this filing.
Item 6. Investments.
Please see portfolio of investments contained in the Reports to Stockholders included under Item 1 of this form N-CSR.
Item 7. Disclosure of Proxy Voting Policies and Procedures for Closed-End Management Investment Companies.
Not applicable to this filing.
Item 8. Portfolio Managers of Closed-End Management Investment Companies.
Not applicable to this filing.
Item 9. Purchases of Equity Securities by Closed-End Management Investment Company and Affiliated Purchasers.
Not applicable to this filing.
Item 10. Submission of Matters to a Vote of Security Holders.
Not applicable to this filing.
Item 11. Controls and Procedures.
(a) The Registrant’s Principal Executive Officer and Principal Financial Officer have concluded that the Registrant’s disclosure controls and procedures (as defined in Rule 30a-3(c) under the Investment Company Act of 1940, as amended (the “1940 Act”) (17 CFR 270.30a-3(c))) are effective, as of a date within 90 days of the filing date of this Form N-CSR, to provide reasonable assurance that the information required to be disclosed by the Registrant on Form N-CSR is recorded, processed, summarized, and reported within the time periods specified in the SEC’s rules and forms, based on their evaluation of these disclosure controls and procedures required by Rule 30a-3(b) under the 1940 Act (17 CFR 270.30a-3(b)) and Rules 13a-15(b) or 15d-15(b) under the Securities Exchange Act of 1934 (17 CFR 240.13a-15(b) or 240.15d-15(b)).
(b) There were no changes in the Registrant’s internal control over financial reporting (as defined in Rule 30a-3(d) under the 1940 Act (17 CFR 270.30a-3(d))) that occurred during the Registrant’s most recent fiscal quarter that has materially affected, or is reasonably likely to materially affect, the Registrant’s internal control over financial reporting.
Item 12. Exhibits.
(a)(1) Code of Ethics (Item 2) is attached.
(a)(2) Certifications of the Principal Executive Officer and Principal Financial Officer of the Registrant as required by Rule 30a-2(a) under the 1940 Act (17 CFR 270.30a-2(a)) are attached hereto as Exhibit 99CERT.
(a)(3) Not applicable to this filing.
(b) Certifications pursuant to Section 906 of the Sarbanes-Oxley Act of 2002 as required by Rule 30a-2(b), under the 1940 Act (17 CFR 270.30a-2(b)), Rule 15d-14(b) under the Securities Exchange Act of 1934 (17 CFR 240.15d-14(b)) and Section 1350 of Chapter 63 of Title 18 of the United States Code (18 U.S.C. 1350) are attached hereto as Exhibit 99.906CERT.
Table of Contents
SIGNATURES
Pursuant to the requirements of the Securities Exchange Act of 1934 and the Investment Company Act of 1940, the registrant has duly caused this report to be signed on its behalf by the undersigned, thereunto duly authorized.
(Registrant) | MML Series Investment Fund |
By (Signature and Title) | /s/ Brian Haendiges | |
| Brian Haendiges, President and Principal Executive Officer |
Date | 2/21/17 |
Pursuant to the requirements of the Securities Exchange Act of 1934 and the Investment Company Act of 1940, this report has been signed below by the following persons on behalf of the registrant and in the capacities and on the dates indicated.
By (Signature and Title) | /s/ Brian Haendiges | |
| Brian Haendiges, President and Principal Executive Officer |
Date | 2/21/17 |
By (Signature and Title) | /s/ Renee Hitchcock | |
| Renee Hitchcock, Treasurer and Principal Financial Officer |
Date | 2/21/17 |